Embed Size (px)
Citation preview

www.premier-oil.comPremier Oil plc23 Lower Belgrave StreetLondon SW1W 0NR
Telephone: +44 (0)20 7730 1111Facsimile: +44 (0)20 7730 4696
ANNUAL REPORT AND FINANCIAL STATEMENTSYear to 31 December 2014
Premier O
il plc2014 A
nnual Report and
Financial Statements
DELIVERING
OPERATING
EFFICIENCY

PREMIER IS A LEADING FTSE 250 INDEPENDENT EXPLORATION ANDPRODUCTION COMPANY WITH OIL AND GAS INTERESTS IN THE NORTH SEA,SOUTH EAST ASIA, PAKISTAN AND THE FALKLAND ISLANDS. OUR STRATEGY ISTO GROW SHAREHOLDER VALUE BY LEVERAGING OUR DEVELOPMENTCAPABILITIES AND BALANCE SHEET TO DELIVER HIGH QUALITY PROJECTSWHILE MAINTAINING EXPOSURE TO UPSIDE FROM SUCCESSFUL EXPLORATION.

Premier Oil plc 2014 Annual Report and Financial Statements / 01
Stra
teg
ic R
epor
t
Section 1: STRATEGIC REPORT02 2014 Highlights02 Financial Position and Outlook03 Where We Operate04 Chairman’s Statement08 Chief Executive’s Review12 Vision12 Our Strategy13 Our Business Model16 Vietnam – Business Model from First Principles18 Key Performance Indicators20 Our Markets22 Company Risk Factors26 Business Unit Reviews48 Financial Review53 Corporate Responsibility Review
Section 2: GOVERNANCE66 Board of Directors68 Corporate Governance Report76 Audit and Risk Committee Report81 Nomination Committee Report83 Directors’ Remuneration Report120 Directors’ Report123 Statement of Directors’ Responsibilities
Section 3: FINANCIAL STATEMENTS124 Accounting Policies132 Independent Auditor’s Report138 Consolidated Income Statement139 Consolidated Statement of Comprehensive Income140 Consolidated Balance Sheet141 Consolidated Statement of Changes in Equity142 Consolidated Cash Flow Statement143 Notes to the Consolidated Financial Statements169 Company Financial Statements170 Notes to the Company Financial Statements
Section 4: ADDITIONAL INFORMATION180 Five Year Summary181 Oil and Gas Reserves182 Significant Worldwide Licence Interests183 Shareholder Information184 Glossaryibc Contacts
DELIVERING
OPERATING
EFFICIENCY
OUR VISION IS TO BE A WORLD-CLASS UPSTREAM INDEPENDENT.
02 / Premier Oil plc 2014 Annual Report and Financial Statements
2014 HIGHLIGHTS OPTIMISING OUR STABLE
PRODUCTION BASE
WELL-FINANCEDLOW COST PRODUCER
1,6291,540
10 11 12 13 140
500
1,000
1,500
2,000 63.658.2
10 11 12 13 140
10
20
30
40
50
60
70 924.3
802.5
10 11 12 13 140
100200300400500600700800900
1,000
Sales and otheroperating revenues(2010-2014)($ million)
Working interestproduction(2010-2014)(kboepd)
Operating cash flow(2010-2014)($ million)
1.9
1.6
10 11 12 13 140.0
0.5
1.0
1.5
2.0
Cash & undrawnfacilities(2010-2014)($ billion)
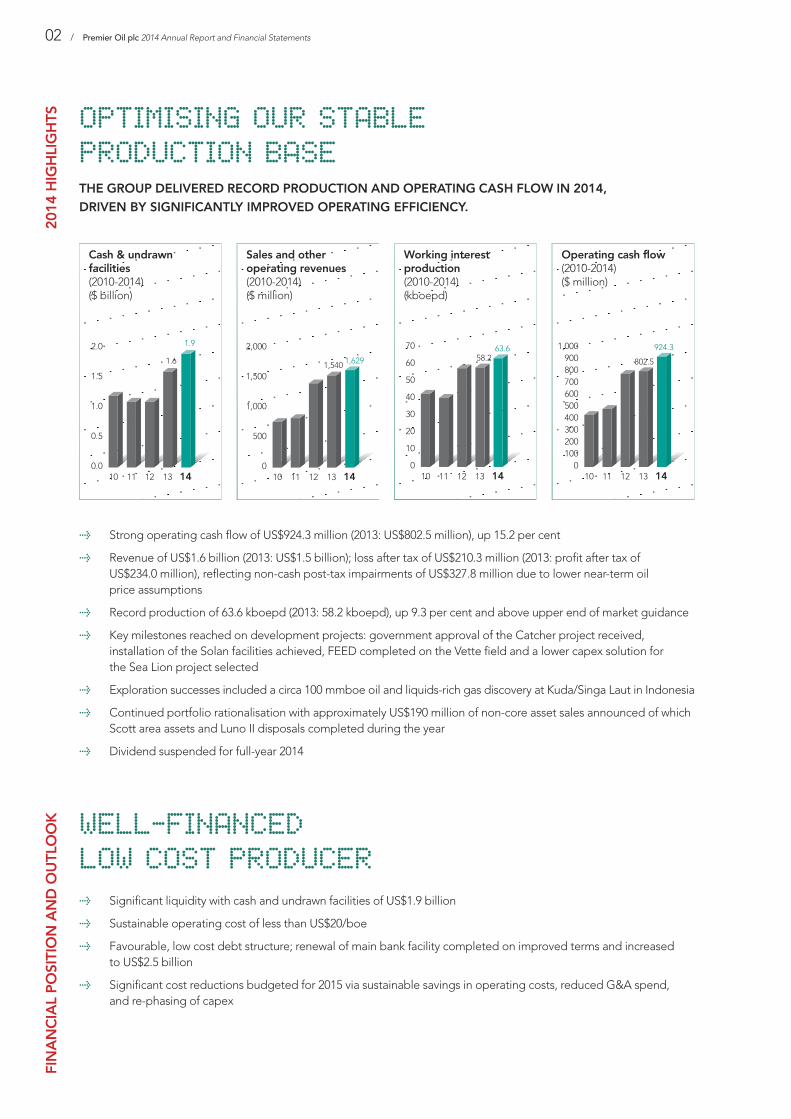
> Strong operating cash flow of US$924.3 million (2013: US$802.5 million), up 15.2 per cent
> Revenue of US$1.6 billion (2013: US$1.5 billion); loss after tax of US$210.3 million (2013: profit after tax ofUS$234.0 million), reflecting non-cash post-tax impairments of US$327.8 million due to lower near-term oilprice assumptions
> Record production of 63.6 kboepd (2013: 58.2 kboepd), up 9.3 per cent and above upper end of market guidance
> Key milestones reached on development projects: government approval of the Catcher project received,installation of the Solan facilities achieved, FEED completed on the Vette field and a lower capex solution forthe Sea Lion project selected
> Exploration successes included a circa 100 mmboe oil and liquids-rich gas discovery at Kuda/Singa Laut in Indonesia
> Continued portfolio rationalisation with approximately US$190 million of non-core asset sales announced of whichScott area assets and Luno II disposals completed during the year
> Dividend suspended for full-year 2014
> Significant liquidity with cash and undrawn facilities of US$1.9 billion
> Sustainable operating cost of less than US$20/boe
> Favourable, low cost debt structure; renewal of main bank facility completed on improved terms and increasedto US$2.5 billion
> Significant cost reductions budgeted for 2015 via sustainable savings in operating costs, reduced G&A spend,and re-phasing of capex
FINANCIAL POSITION AND OUTLOOK
THE GROUP DELIVERED RECORD PRODUCTION AND OPERATING CASH FLOW IN 2014,DRIVEN BY SIGNIFICANTLY IMPROVED OPERATING EFFICIENCY.

Premier Oil plc 2014 Annual Report and Financial Statements / 03
WHERE WE OPERATESTRONG
BUSINESS UNITSPREMIER HAS 11 OFFICES WORLD-WIDE WITH OVER 900 EMPLOYEES AND ISORGANISED INTO SIX KEY BUSINESS UNITS – UK, NORWAY, PAKISTAN, INDONESIA,VIETNAM AND FALKLAND ISLANDS – WITH FUNCTIONAL SUPPORT PROVIDED BYTHE CORPORATE OFFICE IN LONDON. PREMIER IS ACTIVE BOTH OFFSHORE ANDONSHORE, BUT ALL OF THE COMPANY’S OPERATED INTERESTS ARE OFFSHORE.
INDONESIA
NorwayVette progressed topoint of sanction
VietnamOptimising Chim Sáo production
PakistanNear-field exploration success
Falkland IslandsHigh return project
KENYA
Exploration
UKTax advantagedoperator
IndonesiaBuilding on our strong share of the Singapore gas market
VIETNAM
UNITEDKINGDOM
MAURITANIA IRAQ
Exploration
PAKISTAN
NORWAY
BRAZIL
Exploration
// United Kingdom
// Norway
// Indonesia
// Vietnam
// Pakistan
// Falkland Islands
In 2014, the group delivered recordproduction of 63.6 kboepd from itsassets in the UK, Indonesia, Vietnam,Pakistan and Mauritania. The group hasdevelopment and exploration assets inNorway and the Falkland Islands withexploration assets in Brazil, Iraq andKenya. In total, the group manages areserve and contingent resource base of794 mmboe at year-end.
RECORD PRODUCTIONOF 63.6 KBOEPD IN 2014,ABOVE UPPER END OFMARKET GUIDANCE

Mike WeltonChairman
CHAIRMAN’S STATEMENT The industry contextFrom a macro perspective, 2014 was a year of two halves: oil pricesremained steady above US$100 per barrel (bbl) in the first half, asthey have done broadly for the last four years, before fallingsignificantly, to close the year at less than US$60/bbl. The fall wasdriven by strong global supply, particularly the growth inunconventional resources in North America.
One direct consequence of lower oil prices is a fall in the cost ofservices to the industry and this is already evident across thesupply chain. The fall in prices should also lead to a supplycorrection as more marginal projects are cancelled and free cashflow for near-term investment across the industry is reduced.However, it will take time for oil prices to reach a mid-cycleequilibrium and, as a company, we must and we are taking stepsto ensure we are well positioned to withstand a prolonged periodof weak commodity prices.
The sector has seen these price cycles before and few believe thatthe oil price will not eventually recover from current levels. This viewis supported by the forward curve which shows rising oil prices. Weare highly leveraged to such a recovery with a low cost, stableproduction base and an improving portfolio mix. Beyond this year,we have little committed expenditure. Our unsanctioned projects,however, offer future growth at a lower cost base.

Premier Oil plc 2014 Annual Report and Financial Statements / 05
Premier’s performancePremier delivered a strong operational performance in 2014. Weachieved a record annual average production rate of 63.6 thousandbarrels of oil equivalent per day (kboepd), exceeding ourexpectations due to significantly improved uptime across themajority of our assets. This performance was delivered despite thecontinuing supply disruptions at Huntington (due to circumstancesoutside the joint venture’s control) and is testament to the hard workand successful efforts of our operated production teams.
In the UK North Sea, installation of the facilities at our Solandevelopment West of Shetland was completed in September andwhile it is disappointing that commissioning has progressed slowlyduring the winter and costs have increased on the project, theSolan field will be a material contributor to Premier’s cash flowsonce on-stream.
Significant progress was also made on our other operated NorthSea projects, namely Catcher which received development sanctionand Vette in Norway where front end engineering and design (FEED)work was completed, while the scope and size of the initial phaseof the Sea Lion development in the Falkland Islands has beenscaled-back. This project is now much more manageable for acompany of Premier’s size in the current environment and thefocus in 2015 will be on progressing the project to the point ofinvestment decision.
Our exploration team continued to bring new, material projects intothe portfolio with notable success at Kuda/Singa Laut on the TunaBlock in the Natuna Sea, Indonesia. This oil and liquids-rich gasdiscovery is strategically located in a core area for Premier andappraisal activity is planned for 2016.
A key tenet of our strategy is to realise value from our non-coreassets and to reallocate our financial and human resources to ourkey projects. This continued in 2014 with the announced sale ofundeveloped resources in Indonesia and Norway and the disposalof our non-operated stake in the Scott area assets in the UK NorthSea. In total, these asset sales will raise around US$190 million indisposal proceeds.
Our long-term, unsecured debt structure and supportive bankingrelationships leave us well placed, although we will need to continueto manage our covenant headroom if current oil prices persist.
Health, safety and environmental matters continue to be ofparamount importance to us and, while cost cutting is clearly a focusin the current climate, we will not compromise on the integrity andsafety of our operations. Our safety performance in 2014 saw asubstantial reduction in our TRIR (Total Recordable Injury Rate) whichreached a five-year low of 1.5 per million man-hours. Our productionoperations management systems at Balmoral in the UK, and atAnoa and Gajah Baru in Indonesia, retained their OHSAS 18001 andISO 14001 certifications, as did our worldwide Drilling ManagementSystems. We are particularly proud of our track record on ouroperated Anoa platform in Indonesia which, by year-end 2014, hadreached 1.6 million man-hours without a lost time injury.
DELIVERINGOUR VISION
WE CONTINUE TO PROGRESS OUR PIPELINE OF DEVELOPMENT PROJECTS AND WEREDELIGHTED TO ACHIEVE NEW PRODUCTION FROM TWO OPERATED FIELDS IN ASIA OVERTHE COURSE OF THE YEAR.
DURING THE YEAR, WE ENHANCED THE GROUP’S FINANCIAL LIQUIDITY POSITION WITHTHE SUCCESSFUL REFINANCING OF OUR PRINCIPAL DEBT FACILITY ON IMPROVED TERMS.

Despite our much improved occupational health and safety performance in2014, I regret to report two fatalities in South East Asia: one contractor fatalityas a result of an offshore vessel collision and a third party fatality as a resultof a road traffic accident on a public highway. No blame was attached toPremier in either case but we have taken steps to reduce the risk of theseincidents recurring. We are all saddened by the tragic outcomes for thefamilies involved.
Our annual reporting on corporate responsibility performance is aligned withIPIECA Guidance and the Global Reporting Initiative’s SustainabilityReporting. We are also a long-standing member of the FTSE4Good Indexand the UN Global Compact and in 2014 were accepted as a member of theCorporate Pillar of the Voluntary Principles on Security and Human Rights.We remain committed to protecting our people, our assets, our environmentand our reputation by maintaining the highest possible standards.
Future plansIn 2015 a key priority is to progress our sanctioned projects – Solan andCatcher – through the execution phases and to deliver safely the major fourwell exploration campaign on our Falkland Islands acreage.
Our substantial 2015 hedging programme has ensured that our near-termcash flows are well protected and our debt position of US$2.1 billion at year-end is manageable at this point in our investment cycle. We are also takingfurther steps to dispose of, or monetise, assets to reduce our debt position.We have significant liquidity if the weak macro environment offers newopportunities, as it has done in the past, although management remainfocused on ensuring that debt levels are kept under control.
Board changesI was pleased to announce that Tony Durrant, our former Finance Director,accepted the role of Chief Executive during the year replacing Simon Lockett.During Tony’s tenure as Finance Director, the company has maintainedexcellent relationships with our capital providers and the Board believes hehas all the right qualities to take the company forward in the next stage of itsevolution. We also welcomed Richard Rose onto the Board as the newFinance Director, bringing with him a broad range of experience fromaccounting, industry and capital markets. I would like to pay tribute to SimonLockett who guided the company through a substantial growth period andwho ensured a smooth transition to the new management team.
Andrew Lodge, our Exploration Director, has indicated that he will retireeffective 30 June this year and will therefore not seek re-election as a boarddirector at our forthcoming Annual General Meeting (AGM). A new head ofexploration will be appointed in due course. Stephen Huddle, who has beenGeneral Counsel and Company Secretary for 14 years, will also retire on31 May. Rachel Benjamin, currently Deputy Company Secretary, will becomeCompany Secretary on Stephen’s retirement.
We wish all our leavers well in their future endeavours. These changes,together with other senior management changes, refresh the leadership ofthe company and, in addition, will contribute to a reduced cost base as weadapt to a new oil price environment.
FINANCIALLY, WE WILL MINIMISE OUR COST BASE AND TAILOR OUR CAPITALALLOCATION TO ENSURE THAT WE ARE WELL POSITIONED THROUGH THECURRENT COMMODITY PRICE CYCLE.
06 / Premier Oil plc 2014 Annual Report and Financial Statements
CHAIRMAN’S STATEMENT
cont
inue
d

Shareholder returns and share price performanceAs we have stated in the past, our goal remains to deliver consistent,measurable capital growth to our shareholders. Implied within this strategyis a commitment to return cash to our shareholders via distributions, afterbalancing the capital needs of the business, when the performance of thecompany has not been materially reflected in the share price.
Over the course of 2014, our share price fell by 47 per cent, although this wasnot out of line with the rest of the sector which also suffered with the fall incommodity prices. During the year, we paid a dividend of 5 pence per shareand returned a further US$93 million of capital to shareholders through ashare buyback programme. This was in acknowledgment of the significant gapbetween our share price and underlying net asset value (NAV). It also reflectedsurplus cash flow generated by our production base in the first half of the year,above the level expected using our long-term oil price planning assumption.
As we enter 2015 with a significantly lower oil price than in recent years, theBoard believes it is not prudent to propose a dividend payment for the fullyear or, as previously announced, to continue with the share buybackprogramme. Our focus in the near-term is on preserving cash, maintainingaccess to liquidity and reducing gearing levels while continuing to invest inour sanctioned development projects. We would expect to revisit ourdecisions around shareholder distributions should the oil price recover aboveour long-term planning assumption.
On behalf of the Board as well as myself, I would like once again to expressmy appreciation for the hard work and effort put into the business byPremier’s staff. Their continued dedication and enthusiasm in what are tryingtimes for the industry should see us well placed amongst our peers to prosperin the future.
Mike WeltonChairman
Premier Oil plc 2014 Annual Report and Financial Statements / 07

CHIEF EXECUTIVE’S REVIEW We are all only too aware of the sharp fall in the oil price thatoccurred in the second half of 2014 after several years of oil pricestability at historically high levels. While it is not clear at this stagewhen the oil price will find a floor, or how long it may take to recover,it offers the industry the chance to re-set its cost base and will presentnew opportunities for the better funded companies in the sector.
For our part, we have been quick to respond to the falling oil priceand, by the end of 2014, we had already taken steps to reducesignificantly the costs of running our business without compromisingthe safety or performance of our operations. We will continue tolook to cut or defer our expenditure to ensure that we are able tomanage the business successfully through a potentially prolongedperiod of low oil prices.
Despite the backdrop of falling oil prices in the second half of theyear, Premier remained focused on operational delivery andachieving the near-term priorities that we set ourselves. In thisrespect, 2014 was a strong year for us.
Tony DurrantChief Executive
WITH A LOW COST, STABLE PRODUCTION BASE, PREMIER IS HIGHLY LEVERAGEDTO A FUTURE RECOVERY IN THE OIL PRICE.
FOCUSED ONOPERATIONALDELIVERY

Premier Oil plc 2014 Annual Report and Financial Statements / 09
Beating our production guidance2014 saw Premier deliver record production of 63.6 kboepd, above the upperend of market guidance, assisted by improved operating efficiency acrossthe majority of the group’s assets.
Working interest Entitlement
Production (kboepd) 2014 2013 2014 2013
Indonesia 14.4 13.7 10.3 8.8Pakistan/Mauritania 12.9 15.5 12.9 15.3UK 19.4 14.9 19.4 14.9Vietnam 16.9 14.1 15.2 13.4
Total 63.6 58.2 57.8 52.4
Significantly higher production in the UK was driven by improved uptimefrom the operated Balmoral area, flush production from the redevelopmentof the Kyle field and increased contributions from the Huntington andRochelle fields. Frustratingly, Huntington continued to disappoint in 2014as it suffered from poor uptime, primarily due to restrictions on gas exportfrom the field imposed by the CATS pipeline operator BP.
In Asia, our operated Chim Sáo asset in Vietnam performed well, benefittingfrom a series of projects we had undertaken aimed at maximising operatingefficiency. As a result, record production rates were achieved. Singaporedemand for our Indonesian gas remained strong and our operated NatunaSea Block A again captured a market share well in excess of its contractualshare. Deliverability from the block was increased with first gas from Naga inNovember, while Pelikan is planned to be on-stream in the first quarter of 2015.
As at 31 December 2014 proven and probable (2P) reserves, on a workinginterest basis, were 243 million barrels of oil equivalent (mmboe) (2013:259 mmboe) with the impact of production and disposals on our reserve basepartially offset by the booking of the Vette field as 2P reserves. This, togetherwith the discovery at Kuda/Singa Laut in Indonesia, means that we haveended the year with 2P reserves and 2C contingent resources of 794 mmboe,in line with the previous year.
Proven and probable 2P reserves and 2C 2P reserves contingent resources (mmboe) (mmboe)
1 January 2014 259 794Production (23) (23)Net additions, revisions 22 50Disposals (15) (27)
31 December 2014 243 794
AS WELL AS BACKFILLING OUR GAS CONTRACTS INTO SINGAPORE WHICH GENERATELONG-TERM, STABLE CASH FLOWS FOR THE GROUP, THE ADDITIONAL DELIVERABILITYFROM PELIKAN AND NAGA WILL ENABLE US TO EXPLOIT ANY CONTRACTUAL SUPPLYSHORTFALL OR SHORT-TERM STRENGTHENING OF SINGAPORE DEMAND FOR OUR GAS.

10 / Premier Oil plc 2014 Annual Report and Financial Statements
CHIEF EXECUTIVE’S REVIEW
cont
inue
d Progressing our developments – deliver Solan, sanction Catcher andright-size Sea LionInstallation of the facilities on the Premier-operated Solan field West ofShetland at the end of the summer was a significant milestone on the project,only two and a half years after receiving government approval. However, thesubsequent commissioning programme has taken longer than anticipateddue to poor weather conditions and low productivity over the winter period.As a result, costs have increased and first oil is now expected to be later thanthe previous guidance of the second quarter although we continue to targetplateau rates of production from the field of 20-25 thousand barrels of oil perday (kbopd) (gross) by year-end.
Our operated Catcher project received government approval in June and isnow into the execution phase. Construction of the floating production,storage and offtake (FPSO) hull started in January 2015 and the projectcontinues to progress on schedule and to budget. Once on-stream, both theSolan and Catcher projects will contribute materially to our cash flows, givenour tax advantaged position in the UK.
Turning to our operated pre-sanction projects, FEED work on the Vette FPSOdevelopment in Norway was successfully completed during 2014 and wewere in a position to submit development approval documentation to thegovernment early in 2015. However, following the sharp reduction in the oilprice, we have chosen to defer the final investment decision until the end of2015, enabling us to re-engage with the supply chain with the aim ofnegotiating lower costs for the project. Given the falling oil price and ourdesire to maintain a strong funding position, we decided to opt for a lowercapex solution for our Sea Lion development, which will now utilise a leasedFPSO. We plan to progress the project to sanction over the course of 2015which we anticipate will allow us to secure further cost reductions. It remainsour intention to seek a partner ahead of final investment decision.

Premier Oil plc 2014 Annual Report and Financial Statements / 11
Exploration discoveriesIn 2014, Premier delivered a notable exploration success, with the 100 mmboeoil and liquids-rich gas discovery at Kuda/Singa Laut on the Tuna Block inIndonesia. While we have deferred appraisal of this discovery to 2016, thisproject will likely play an important role in the long-term future of Premier’sIndonesian business. We also enjoyed exploration success in Pakistan with theKadanwari K-36 exploration well which discovered gas in a separate step-outcompartment. The well was successfully tied-in to production in April 2014.During the year, unsuccessful wells were drilled on other acreage offshoreMauritania, Indonesia and onshore Pakistan and, subsequent to year-end,onshore Kenya.
A successful disposal programmeDuring 2014, we announced approximately US$190 million of non-coreasset sales which have all subsequently completed. Of particular note wasthe sale of the high cost Scott area assets for US$130 million which, as wellas reducing the group’s operating costs, has significantly decreased ourfuture abandonment liabilities.
Further disposals are planned. Notably, our partner in the Solan field is indiscussions with banks about refinancing a portion of our loan to them, whilediscussions with third parties over selling a royalty interest over the Solanfield’s cash flows are on-going. In addition, we have received a number ofenquiries about our Sea Lion development since rescaling the project inNovember and active discussions with potential partners continue.
Financial performance and liquidityThe group is reporting a loss after tax of US$210.3 million in 2014 (2013:US$234.0 million profit after tax) largely as a result of impairment charges ofUS$327.8 million (post-tax) on the carrying value of several of our oil and gasassets. These were due to the impact of the lower near-term oil priceassumptions used in balance sheet tests at the year-end and should notdetract from the record operating cash flows generated during 2014 ofUS$924.3 million (2013: US$802.5 million).
The collapse in the oil price has served to highlight the importance ofmaintaining a strong funding position and a conservative financingapproach. In July, our finance team did an excellent job of taking advantageof a relatively strong bank market to refinance and increase our principal bankfacility on improved terms with extended maturities. As a result, we do nothave any significant debt maturities until late 2017. It is also reassuring thatall of our facilities are on a corporate unsecured basis and are not subject toany reserve base redeterminations. Consequently, we have ample liquiditywith US$1.9 billion of cash and undrawn facilities as at year-end, althoughwe recognise the need to manage our covenant headroom in the near-term.
2015 is anticipated to be a significantly lower capex year. This coupled withour hedging programme, planned cost reductions and further potentialdisposals means that we are well placed to meet the challenges presentedby the current oil price environment.
Tony DurrantChief Executive
TO PROTECT OUR INVESTMENT PROGRAMME IN 2015 WE HAVE HEDGEDAPPROXIMATELY 50 PER CENT OF OUR LIQUIDS ENTITLEMENT PRODUCTION AT ANAVERAGE PRICE OF JUST UNDER US$98/BBL.

12 / Premier Oil plc 2014 Annual Report and Financial Statements
VISION
OUR STRATEGY
The key elements of our strategy are:
OUR VISION IS TO BE A WORLD-CLASS
UPSTREAM INDEPENDENT
PREMIER IS A FULL CYCLE EXPLORATION AND PRODUCTION COMPANY. OUR STRATEGY IS TOGROW SHAREHOLDER VALUE BY LEVERAGING OUR DEVELOPMENT CAPABILITIES AND BALANCESHEET TO DELIVER HIGH QUALITY PROJECTS WHILE MAINTAINING EXPOSURE TO UPSIDE FROMSUCCESSFUL EXPLORATION.
High quality asset base with commerciallyadvantaged positions
• Key player in Asian gas marketsunderpinning long-term cash flows
• Tax advantaged production anddevelopment operator in the UKNorth Sea
• The dominant player in the NorthFalklands basin with access to apotentially world-class resource base
Operating capabilities
Proven track record of operating across the cyclefrom exploration through development toproduction with particular focus on offshore projects
People
Strong in-house operating teams at anasset and country level supported byfunctional experts with a significant trackrecord of project delivery
Access to financing and debt liquidity
Favourable, low cost debt structure withsignificant liquidity underpinning ourcapital investment programme and abilityto access new opportunities

Acquisitions
Exploration
Development Production Cash Return toShareholders
Disposal of non-core assets
Premier Oil plc 2014 Annual Report and Financial Statements / 13
OUR BUSINESS MODEL
Premier aims to increase net asset value per share by investing in and executing thedevelopment of high quality oil and gas projects. Premier accesses the oil and gasreserves and resources to do this through successful exploration and by selectivelyacquiring assets. Premier also actively manages its portfolio through disposals and, byplanning its business on a conservative basis, looks to maintain significant liquiditythroughout the cycle. The cash flow generated from these activities continue to supportinvestment in high quality projects, a high impact but capital disciplined explorationprogramme and, where appropriate, cash returns to shareholders.
PREMIER AIMS TO DELIVER INCREASING NET ASSET VALUE BY INVESTING IN AND EXECUTINGTHE DEVELOPMENT OF HIGH QUALITY OIL AND GAS PROJECTS.
PREMIER SEEKS TO REPLENISH ITS RESERVE AND RESOURCE BASE THROUGHSUCCESSFUL EXPLORATION WITHIN A STRICT CAPITAL DISCIPLINED FRAMEWORK.
Premier targets near-field, value accretive opportunities which can be tied-in to ourexisting infrastructure as well as emergent plays which have the potential to transformthe resource base of the company. Premier also continually high-grades its explorationportfolio through divestment and relinquishment of licences that do not meet thegroup’s internal metrics on a risk reward basis. Premier is primarily a production anddevelopment company and, whilst these activities are the focus of capital investment,the group typically allocates up to one third of its cash flow to exploration.
> 100 mmboe oil and liquids-rich gas discovery made in Indonesia in 2014
> 2014 near-field exploration success in Pakistan
> More than 20 exploration licenses relinquished over the course of 2014
> Four well high impact programme in North Falklands basin planned for 2015
EXPLORATION

14 / Premier Oil plc 2014 Annual Report and Financial Statements
OUR BUSINESS MODEL
cont
inue
d
Premier focuses on projects where it can utilise its operating capabilities and, in particular,leverage the group’s strong track record in developing medium-sized offshore oil fieldsutilising floating production systems. Premier has been involved in a number of FPSOprojects across the cycle from FEED and the contracting processes through constructionand development to production. Premier also aims to leverage its developmentcapabilities to build on its dominant position in the Singaporean and Indonesian gasmarkets and to position itself to take advantage of future opportunities.
> The Premier-operated Dua field in Vietnam was successfully brought on-streamin July 2014
> The UK North Sea Kyle field was successfully reinstated in July 2014
> First gas achieved from the Premier-operated Naga field in Indonesia in November 2014
> Solan jacket and topsides successfully installed in September 2014
> Government approval of the Catcher project in the Central North Sea received inJune 2014
> FEED work on the Vette project in Norway completed by year-end
> FPSO solution for the Sea Lion project in the Falkland Islands progressed
ACQUISITIONS
DEVELOPMENT
This includes increasing its equity in assets in whichPremier already has an interest and acquiring key assetswhich fit within Premier’s core areas of expertise. Premieralso looks to leverage its operating capabilities andsignificant funding position to take advantage ofopportunities arising as a result of oil price or capitalmarket weakness. Historically, such periods of weaknesshave been when Premier has been most active in theacquisition market.
> Premier will continue to assess new opportunities in2015, particularly those that arise as a result of currentmarket dislocations; we will focus on areas whereour position is commercially advantaged such as inthe UK where we have circa US$2.7 billion of UK taxlosses and allowances
PREMIER LOOKS TO ADD HIGH QUALITY ASSETS TO ITS PORTFOLIO THROUGHSELECTIVE ACQUISITIONS WHERE ITS POSITION IS COMMERCIALLY ADVANTAGED.
WHILE PREMIER IS A FULL CYCLE EXPLORATION AND PRODUCTION COMPANY,WE HAVE AN ESTABLISHED AND SUCCESSFUL HISTORY OF ASSET DEVELOPMENT.

Premier’s production base is focused around operated floating production systems,such as the Chim Sáo field in Vietnam and the Balmoral area in the UK North Sea,and the group’s dominant position in the South East Asia gas market. Premier’sportfolio mix is changing as the weighting of our production assets shifts from taxedgas production in Pakistan to untaxed UK oil production. As a result, at flat oil prices,Premier’s production base becomes increasingly cash flow generative.
> Achieved record production of 63.6 kboepd in 2014, above upper end ofmarket guidance
> Significantly improved operating efficiency of 84 per cent realised in 2014(2013: 75 per cent)
> 2014 and forecast 2015 operating cost of less than US$20/boe
Premier Oil plc 2014 Annual Report and Financial Statements / 15
Premier aims to deliver consistent, measurable capital growth to shareholders byinvesting in high quality projects, while offering investors the potential for higherreturns through our exploration activities. However, the company recognises thatits share price does not always reflect the value of the underlying assets of thebusiness. In these instances, and after balancing the capital needs of the business,Premier will look to return surplus cash flows to shareholders.
> Dividend of 5 pence per share paid to shareholders in 2014
> US$93 million share buyback programme undertaken in 2014
PORTFOLIOMANAGEMENT/ DISPOSALS OF NON-CORE ASSETS
Premier actively manages its portfolio across the cycle to ensure the group’s capital and people are focused onits highest return assets and where the company is best placed to add value. Premier seeks to dispose ofnon-operated, non-core assets including mature producing assets where operating and future expectedabandonment costs have been rising. In addition, Premier looks to divest non-operated discoveries which havebeen slow to progress forward and therefore erode the return on capital. In particular, this includes pre-developmentprojects that do not meet our internal hurdle rates, fit our financial profile or sit within our core area of expertise.
> Premier announced the sale of approximately US$190 million of non-core asset sales in 2014, including thesale of the high cost Scott area assets in the UK North Sea, the Luno II discovery offshore Norway and thepre-development Aceh gas project onshore Indonesia
> Premier also continued to high-grade its exploration portfolio during 2014, divesting or relinquishing morethan 20 exploration licences across its portfolio
PRODUCTION
RETURNS TO SHAREHOLDERS
PREMIER SEEKS TO MAXIMISE VALUE FROM ITS LOW COST, STABLE PRODUCTIONBASE TO GENERATE LONG-TERM CASH FLOWS.

EXPLORATION //
In 2004, Premier undertook a regional geological evaluation that applied theknowledge from its activities in the West Natuna Sea in Indonesia to theNam Con Son basin in Vietnam. This work culminated in the acquisition of twoblocks in the Nam Con Son basin: Block 07/03 (where Premier made a smalloil and gas discovery and subsequently sold its equity for US$45 million) andBlock 12. Both were large, under-explored blocks in an area widely consideredto be gas prone and with little oil potential.
Block 12 contained the dormant Dua discovery and some unsuccessful wellsdrilled by earlier operators, which had discovered non-commercial quantities ofgas. Premier, however, recognised the potential for oil and, in June 2006, Premierdrilled its first operated well in Vietnam, appraising the Dua discovery inpartnership with Santos. This was followed by a step-out well that discovered anew oil accumulation, the southern extension to the Dua field. By applying itsregional technical knowledge, Premier has been able to target oil in newreservoirs. Further, it also provided the impetus to drill the Chim Sáo prospect,a tilted fault block, 21 kilometres south west of the Dua field.
Premier discovered the Chim Sáo oil field in November 2006. The discovery wellwas tested and immediately side-tracked to identify the oil/water contact toprovide robust reserves definition in the south of the field. The discovery wassubsequently appraised in 2008 to confirm the extent of the field to the north.By late 2008 sufficient knowledge had been gained from the four wellpenetrations (discovery, side-track, appraisal plus a nearby dry well drilled by aprevious operator) to enable Premier to proceed to a sanction decision.
While Premier was in a position to sanction the Chim Sáo project in late 2008,the global financial crisis at that time resulted in a significant fall in the oil priceand weakening of capital markets. Premier selected to defer final approval forthe development of the Chim Sáo field for nine months in order to re-engagewith the supply chain to negotiate improved terms, taking advantage of the morefavourable conditions. Premier also took the opportunity in the interveningperiod to re-engineer the basis of design for the field. In particular, a second wellhead platform was removed in response to high steel prices and instead a planwas adopted to drill long reach wells from one well head platform, capitalisingon low rig day rates at the time. The combination of these activities meant grosssavings of circa US$130 million were achieved when final approval fordevelopment of the Chim Sáo field was given in November 2009.
Chim Sáo
- Strategy in action
PREMIER’S ACTIVITIES IN VIETNAM DEMONSTRATE THE SUCCESS OF THE COMPANY’SSTRATEGY AND THE SIGNIFICANT VALUE IT CAN CREATE FOR ITS SHAREHOLDERS.
16 / Premier Oil plc 2014 Annual Report and Financial Statements
VIETNAM – BUSINESS MODEL FROM FIRST PRINCIPLES

ACQUISITION //
In July 2009, Premier successfully acquired anadditional 25 per cent interest in Block 12W fromDelek Energy for US$72 million. At the same time,PetroVietnam (PVEP) confirmed that it wouldexercise its back in right to acquire a 15 per centinterest in the Production Sharing Contract (PSC).The resultant interests in the PSC were: Premier53.125 per cent (operator), Santos 31.875 per centand PVEP 15 per cent.
DEVELOPMENT //
The Chim Sáo jacket and topsides were constructedby PTSC M&C in Vietnam. Weighing 4,000 tonnes and106.6 metres high, the jacket was the largest ever builtin Vietnam. Construction of the jacket and topsidestook 2.8 million man-hours and was completed ontime, on budget and with no lost time injuries, with thefacilities installed in mid-2010.
The Chim Sáo FPSO was constructed by Keppel inSingapore. PVKEEZ, one of four shortlisted contractorsin the design competition, was selected to provide theFPSO. PVKEEZ was selected based on a competitiveday rate and their ability to tailor the conversion of theLewek EMAS, a 30-year old oil tanker, to Chim Sáo’srequirements. Despite the challenging project fundingenvironment, conversion commenced in September2008 and was completed safely in June 2011 after5.7 million man-hours. The completed FPSO, which is290 metres long, is capable of storing 680,000 barrelsof oil, equivalent to around two days of Vietnam’s totaloil production.
Premier brought on-stream safely the US$800 millionChim Sáo development on schedule and to budgetin October 2011, less than six years after theinitial discovery.
In 2012, Premier sanctioned the Dua development,a three well subsea tie-back to Chim Sáo. In 2013, thesubsea equipment was installed at Dua and tied-backto the FPSO via flow lines and umbilicals. Drilling ofthe three Dua development wells commenced inFebruary 2014 with first oil achieved from the field inJuly 2014. The field, which is capable of producing8-10 kboepd gross, will extend plateau productionfrom Block 12W.
PRODUCTION //
When sanctioned it was anticipated that Chim Sáowould reach plateau production rates of 25 kboepd.However, field performance has exceeded expectationsand Chim Sáo has sustained production rates inexcess of 35 kboepd (gross). During the first 18 months,production was constrained by unreliable powergeneration on the FPSO, preventing the Chim Sáofield from realising its full potential. Premiersubsequently upgraded the FPSO to deliver reliablepower generation which resulted in significantlyimproved uptime from the Chim Sáo facility and, inlate 2014, the field achieved record production ratesof around 40 kboepd (gross).
In January 2015 Block 12W surpassed the 30 millionbarrels (mmbbls) (gross) milestone and is currentlyproducing over 35 kboepd (gross). The field isanticipated to come off plateau in 2015 although, todate, there has been no evidence of decline in theChim Sáo wells. Nonetheless, plans are already welladvanced to optimise production beyond the end ofthe decade through a programme of infill drilling, wellworkovers and effective contract management.
Premier Oil plc 2014 Annual Report and Financial Statements / 17

18 / Premier Oil plc 2014 Annual Report and Financial Statements
KEY PERFORMANCE INDICATORS
MONITORINGPERFORMANCE
OPERATING SAFELY //
Premier believes that all accidents are preventable. Premierrecognises that its operations by their very nature have thepotential to cause major accidents and is committedto managing them in order to provide a high level ofprotection to its employees, contractors, visitors,neighbours and the environment.
In 2014 Premier completed its new health, safety andenvironment (HSE) management system, bringing it in linewith the ten elements system under the revised InternationalAssociation of Oil & Gas Producers (IOGP) framework. A newaccident and incident reporting system was also introducedacross the company which, once fully implemented, willprovide an improved centralised reporting function.
Health and safety performance is measured using a numberof metrics including total recordable injury rate (TRIR) permillion man-hours. Safety performance data includes bothPremier employees and contractors. In 2014, Premierachieved a TRIR performance of 1.5 per million man-hours(2013: 3.4), a 57 per cent decrease on 2013. Despite a periodof intense construction activity, the UK Business Unit’s TRIRfell to a historical low of 2.0 and both the global productionoperations and drilling functions achieved a TRIR in line withthe 2013 IOGP average1.
1 2013 IOGP Safety Performance Indicators Report.
BUILDING A STRONG PRODUCTION BASE //
Premier aims to maximise production from its existing assetbase and, over time, to deliver production growth. This ismeasured using daily average production and the numberof development projects being brought through to sanction.Average daily production in 2014 was 63.6 kboepd, up9.3 per cent on 2013 and a record for the group.
Premier’s production growth is underpinned by a pipelineof development projects being progressed through theportfolio, and the ability to commercialise and bringon-stream these projects is key to the company’s success.In 2014, Premier achieved first oil from the UK North Seafield Kyle, following the completion of the reinstatementproject, from the Dua oil field in Vietnam and from the Nagagas field in Indonesia. We also sold gas for the first time intoIndonesia under the new Domestic Swap Agreement.In addition, the Solan and Pelikan projects were progressedtowards first oil and gas in 2015 while the Catcher projectreceived government approval and is now in the executionphase. Decisions on the development of the next phaseof growth projects, including the Vette and Sea Lion fields,are expected to be taken over the next 12 months.
PREMIER MEASURES ITS PERFORMANCE IN LINE WITH ITS STRATEGIC OBJECTIVES OFGROWING THE VALUE OF THE UNDERLYING ASSETS OF THE BUSINESS AND CREATINGSIGNIFICANT RETURNS FOR SHAREHOLDERS IN A SAFE AND RESPONSIBLE MANNER.DESPITE THE CHALLENGING CONDITIONS FACED BY THE SECTOR IN 2014 PREMIERCONTINUED TO DELIVER ON A NUMBER OF ITS KEY METRICS.
0
2
3
4
1
1.5
3.4
Actual
09 10 11 12 13 14
Total recordable injuries rate (TRIR)per million man-hours
AVERAGE DAILY PRODUCTIONIN 2014
64kboepd

Premier Oil plc 2014 Annual Report and Financial Statements / 19
SHAREHOLDER RETURNS //
A key metric by which Premier’s growth performance is measured is the compound annualgrowth rate in NAV per share. Premier targets a 10 per cent growth in NAV per share peryear. Average NAV per share growth since 2005 fell in 2014, the first recorded reduction sincethe target has been introduced. This was primarily driven by opting for a lower capex solutionfor the Sea Lion project. The new concept will aim to develop over half of the original reservesfor less than half the cost. Despite improving the internal rate of return of the project theconsequence of a smaller development (and indeed the effect of phasing a second stage ofdevelopment) is a natural reduction in the NAV of the Sea Lion project.
Premier, however, recognises that its share price does not always reflect the value of theunderlying assets of the business. In these instances, and after balancing the capital needsof the business, Premier will look to return surplus cash flows to shareholders via distributions.In 2014 Premier paid a dividend of 5 pence per share and completed a US$93 million sharebuyback programme.
DELIVERING GROWTH //
Premier looks to access projects that will create future growth through successful explorationand selective acquisitions. This ambition is measured by reserve replacement, riskedprospective resource added and finding costs.
Reserves and resources at the end of 2014 were 794 mmboe (2013: 794 mmboe). The impactof production and the 2014 disposal programme (the Scott area assets in the UK North Seaand the Luno II discovery offshore Norway) on Premier’s reserve and resource base was offsetby the booking of the Vette field as 2P reserves and the Kuda/Singa Laut discovery inIndonesia. The sale of Block A Aceh in Indonesia was completed in 2015 and the adjustmentwill therefore be made in the current year.
2014 was a successful year for Premier’s exploration teams with two discoveries adding morethan 100 mmboe of resource at a pre-tax finding cost of less than US$2/boe.
MAINTAINING FINANCIAL STRENGTH //
A key strategic objective of the group is to maintain financial strength in order to invest inthe future of the business and deliver significant returns to shareholders. Despite the difficultmacro environment and declining oil price the company registered a strong operating cashflow in 2014 of US$924.3 million (2013: US$802.5 million).
Premier’s portfolio of crudes was sold at an average of US$98.2/bbl (2013: US$109.0/bbl).Realised average gas prices, a significant portion of which tracks oil price movement,achieved US$8.4 per thousand standard cubic feet (mscf) in 2014 (2013: US$8.3/mscf).Operating costs per barrel of oil equivalent (boe) reduced to US$18.8 in 2014 (2013:US$19.7/boe). This reflects higher operating efficiency as well as one-off credits in Vietnamand Indonesia totalling US$20 million.
Premier’s cash flows, which are protected by a rolling forward hedging programme, togetherwith the refinancing of the company’s principal credit facility in 2014, ensure that the grouphas significant liquidity to fund its capital investment programme going forward.
794794
10 11 12 13 14
Proven and probable reservesContingent resources
0
100
200
300
400
500
600
700
800
Reserves and resources(mmboe)
63.658.2
10 11 12 13 140
10
20
30
40
50
60
70
Working interestproduction(kboepd)
924.3
802.5
10 11 12 13 140
100200300400500600700800900
1,000
Operating cash flow($ million)
18.819.7
10 11 12 13 1402468
101214161820
Operating costs($/boe)
DIVIDEND PAID TOSHAREHOLDERS IN 2014
5pence per share
SHARE BUYBACK PROGRAMMEUNDERTAKEN IN 2014
US$
93million

20 / Premier Oil plc 2014 Annual Report and Financial Statements
OUR MARKETS AS A FULL CYCLE EXPLORATION AND PRODUCTION COMPANY, PREMIER ISINVARIABLY IMPACTED BY VOLATILITY IN THE OIL PRICE. PREMIER LOOKS TOMANAGE THIS THROUGH A SUBSTANTIAL HEDGING PROGRAMME AND BYPLANNING ITS BUSINESS ON A CONSERVATIVE BASIS. WHILST A STRONGFUNDING POSITION REMAINS A PRIORITY, ANY OPPORTUNITIES WHICHHAVE THE POTENTIAL TO INCREASE INVESTOR RETURNS ARE GIVENCAREFUL CONSIDERATION.
EQUITY MARKETS //
2014 was a mixed year for equity markets across both developed and emerging markets asinvestors grappled with strong US economic data offset by concerns over deflation in Europeand slower growth from China. Geopolitics – Russia’s intervention in Ukraine, military actionagainst Islamic insurgents in Iraq and Syria and unrest in Gaza to name but a few – also playeda part in market volatility. Against this backdrop, the FTSE 350 Oil & Gas Producer sectorunderperformed the wider markets, driven by falling commodity prices, to close the year down10 per cent. This masks a very mixed performance with the larger, integrated companiessignificantly outperforming the smaller exploration and production companies.
Premier’s share price tracked commodity prices lower to close the year at 167 pence, reflectingboth the group’s leverage to commodity prices and the market’s lack of appetite for mid-capE&P investments.
COMMODITY PRICES //
Crude oil benchmarks Brent and West Texas Intermediate (WTI) peaked at US$112/bbl andUS$105/bbl respectively in June 2014, before falling to close the year at US$62/bbl andUS$59/bbl. The downward trend continued into early 2015 with both Brent and WTI falling belowUS$50/bbl in January. This sharp fall resulted from an over supplied market, driven primarily bythe growth in unconventional output in North America, together with weakening industrialactivity in emerging markets and a strong US dollar. Energy Information Administration analysisstates that supply exceeded consumption in each of the four quarters in 2014.
Consensus around the outlook for the oil price remains relatively bearish in the short-term,although the long-term view is more positive with the majority of the financial institutionsresearching the sector continuing to forecast a recovery to US$85/bbl or above. The correlationbetween the price of Brent and the high sulphur fuel oil (HSFO) benchmark Sing180 (whichdrives our Singapore gas pricing) persisted in 2014, with Sing180 also peaking in June atUS$634.1 per metric tonne (mt) before falling sharply in the second half of the year to close2014 at US$301.11/mt.
With a significant amount of the group’s production either directly or indirectly linked to Brent,a fall in the commodity price affects Premier’s revenues, cash flows and the value of itsunderlying assets. To manage this and to protect our capital investment programme, Premier looksto sell forward up to 50 per cent of its entitlement production, on a rolling forward 12-18 monthstime frame.
1 Jan
2010
1 Jan
2011
1 Jan
2012
1 Jan
2013
1 Jan
2014
1 Dec 2
014
0
20
40
60
80
100
120
140
5 year Brent oil price$/bbl
Source: Bloomberg

Premier Oil plc 2014 Annual Report and Financial Statements / 21
INVESTMENT AND COSTS //
Global upstream capital investment in 2014 was broadly flatyear-on-year. Significantly increased capital spending by theexploration and production companies was offset by lowerexpenditure from the majors who placed a renewed focus oncapital discipline after a strong spending increase in 2013 sawcapital returns eroded.
The sharp fall in the oil price in the second half of the yearaccelerated the cost reduction programmes already beingimplemented across the sector, a trend that has continuedinto 2015: independent oil companies and national oilcompanies have already announced capex budget cuts ofover 20 per cent for 2015.
Significantly reduced capital expenditure by the upstream sectorinvariably impacts the service sector and the consequences ofthis are already being felt across the supply chain. This isaccentuated where, during recent periods of high oil prices,capacity has been expanded and is particularly true of thedrilling rig market, where rig rates have already fallendramatically. However, costs take longer to respond in certainsegments of the supply chain, especially where there are only asmall number of key players, such as the heavy lift vessel market.
Premier has implemented measures generating 10 per centcost savings on its operating costs for 2015. Further costreductions are targeted. This has been achieved primarily byrenegotiating rates with existing service providers, includingin-house contractors.
On the yet unsanctioned projects, the market weakness hasprovided an opportunity to review cost estimates and to re-bidinto a weak supply market. Both the Sea Lion and Vette projectsare likely to benefit from the weaker FPSO and drilling marketswhile a lack of backlog for construction yards beyond 2016 shouldprovide a competitive bidding landscape for these new projects.
EXPLORATION //
2014 was a poor year for exploration for the industry. Whilespending on conventional exploration and appraisalcontinued to rise, the global volume of barrels added fromnew field discoveries was one of the lowest since the early1990s. As a result, 2014 discovery cost per barrel for theindustry was estimated to be at a 10-year high of overUS$4/boe. Despite the poor industry record generally, 2014was a successful year for Premier’s exploration teams with twodiscoveries and a finding cost of less than US$2/boe. Ofparticular note was the 100 mmboe oil and liquids-rich gasdiscovery at Kuda/Singa Laut on the Tuna Block, one of only36 discoveries of more than 100 mmboe worldwide in 2014.
The lack of exploration success in 2014 for the industry andan increased focus on capital preservation as a result of therecent sharp fall in the oil price have caused many upstreamcompanies to cut their 2015 exploration budgets significantly.The knock-on effect has been weakness in the rig market, withboth rig utilisation and day rates falling. As drilling rates alignwith the new low oil price environment, the number ofexploration wells is expected to pick up with companieslooking to take advantage of substantially reduced costs.
Although seismic vessel day rates have fallen, they have faredbetter due to some capacity reductions in 2014. With newvessels expected onto the market in 2015 and uncertaintiesover some of the high profile bidding rounds, rates for theseismic industry are also likely to come under pressure.
Premier took advantage of the weakness in the seismic vesselmarket in 2014 to award multi-client seismic contracts over our three licences in Brazil at competitive rates. Premierremains committed to drilling the best quality prospectswithin its exploration portfolio. The group’s 2015 explorationprogramme includes a four well campaign in the FalklandIslands, which has the potential to transform the resource baseof the company.
ACQUISITIONS AND DISPOSAL ACTIVITY //
Despite significant volatility in the oil markets, 2014 wasanother busy year for upstream acquisitions and divestments.Private Chinese financial and industrial conglomeratesemerged as active buyers along with Chinese and MiddleEastern national oil companies. Meanwhile integrated oilcompanies continued to progress their disposal programmesand were once again the most active sellers in the market.
Buyers continued to favour North American shale plays overthe more mature, high cost regions such as the UK North Sea.However, Premier was successful in completing the sale of the Scott area assets for a cash consideration ofUS$130 million, the ninth largest UK North Sea deal in 2014.
The number of corporate transactions in the sectorincreased in 2014. However, the commodity price volatilitythat ensued in the second half of the year caused a shift inactivity and, in November and December, deal flow in thesector fell to the lowest consecutive two month total sincethe recession in early 2009. The result was a well-suppliedmarket at year-end with a global pipeline of assets for saleof around US$300 billion.
In addition to the sale of the Scott area assets, Premierannounced the sale of two further non-core assets in 2014:Luno II, a discovery offshore Norway, and Block A Aceh,a pre-development asset onshore Indonesia. The combinedvalue of the three transactions was approximatelyUS$190 million.
150
200
250
300
350
400
450
1 Jan
2006
1 Jan
2007
1 Jan
2008
1 Jan
2009
1 Jan
2010
1 Jan
2011
1 Jan
2012
1 Jan
2013
1 Jan
2014
1 Jan
2015
UK semi-submersible rig rates (6 month average)US$’000/day
Source: Industry data

22 / Premier Oil plc 2014 Annual Report and Financial Statements
COMPANY RISK FACTORS
PREMIER’S BUSINESS MAY BE IMPACTED BY VARIOUS RISKS LEADING TO FAILURE TO ACHIEVE STRATEGICTARGETS FOR GROWTH, LOSS OF FINANCIAL STANDING, CASH FLOW AND EARNINGS, ANDREPUTATION. NOT ALL OF THESE RISKS ARE WHOLLY WITHIN THE COMPANY’S CONTROL AND THECOMPANY MAY BE AFFECTED BY RISKS WHICH ARE NOT YET MANIFEST OR REASONABLY FORESEEABLE.
Effective risk management is critical to achieving our strategic objectives and protecting ourpersonnel, assets, the communities where we operate and with whom we interact and our reputation.Premier therefore has a comprehensive approach to risk management as set out in more detail inthe Corporate Governance Report.
A critical part of the risk management process is to assess the impact and likelihood of risks occurringso that appropriate mitigation plans can be developed and implemented. Risk severity matrices aredeveloped across Premier’s business to facilitate assessment of risk. The specific risks identified byproject and asset teams, business units and corporate functions are consolidated and amalgamatedto provide an oversight of key risk factors at each level from operations through business unitmanagement to Executive Committee and Board level.
For all the known risks facing the business, Premier attempts to minimise the likelihood and mitigatethe impact. According to the nature of the risk, Premier may elect to take or tolerate risk, treat riskwith controls and mitigating actions, transfer risk to third parties or terminate risk by ceasing particularactivities or operations. Premier has a zero tolerance to financial fraud or ethics non-compliance, andensures that health, safety, environment and security (HSES) risks are managed to levels that are aslow as reasonably practicable, whilst managing exploration and development risks on a portfolio basis.
SIGNIFICANT RISK FACTORS DURING 2014 //
• Oil price weakness at year-end (weak share price and North Sea impairments);
• Project delivery challenges (schedule and cost);
• Negative market sentiment.
SIGNIFICANT RISK FACTORS FOR 2015 //
• Continued oil price weakness
• Cash flow and ability to fund existing and planned projects, thereby deliverbusiness strategy
• Ability to maintain core competencies
• Political and security instability in countries of current and planned activity
• ‘Alignment’ with JV partners (in particular their ability to fulfil commitments)
• Negative market sentiment
• Potentially accelerated decommissioning liabilities
• Reputational impact if we defer projects

Premier Oil plc 2014 Annual Report and Financial Statements / 23
Key risk factor Risk detail How is it managed? Key steps to mitigate in 2014/15
Health, safety,environment andsecurity (HSES)
• Major process safety incidentor operational accident,natural disasters, pandemics,social unrest, civil war.
• Consequences may includeaccidents resulting in loss oflife, injury and/or significantpollution of the localenvironment, destructionof facilities and disruptionto business activities.
• Comprehensive HSES andoperations managementsystems including emergencyresponse and oil spillresponse capability andasset integrity.
• Active security monitoringand management andregular testing of businesscontinuity plans.
• Learning from company andthird-party incidents.
• Improved reporting andresponse throughimplementation across thegroup of new electronicincident–recording andaction-tracking system.
• Improved asset integritymaintenance throughimplementation of newscorecard methodology(covering people, plant andprocess lead indicators) at alloperated production assets.
Production anddevelopmentdelivery
(Of particularsignificanceduring 2014– Solan,Huntington –and into 2015)
• Uncertain geology andreservoir performanceleading to lower productionand reserves recovery.
• Availability of servicesincluding FPSOs and rigs,availability of technologyand engineering capacity,availability of skilled resources,maintaining project schedulesand costs as well as fiscal,regulatory, political andother conditions leadingto operational problemsand production loss ordevelopment delay.
• Consequences may include,lower production, lowerrecovery of reserves,production delays, costoverruns and/or failure to fulfilcontractual commitments.
• Geoscience and reservoirengineering managementsystems, including rigorousproduction forecastingand independent reservesauditing processes.
• Operations, developmentand project executionmanagement systems andcost controls together withcapable project teams.
• Long-term developmentplanning to ensure timelyaccess to FPSOs, rigs andother essential services.
• Improved productionforecasting, enhancedreporting and monitoringthrough in-housedevelopment andintroduction of near-real-timeproduction analytics platform.
• Improved project planningand delivery through betterco-ordination and executionof cross-functional reviewprior to decision gates.
• Independent ‘lessonslearned’ review of Solanproject planned forearly 2015.
• Increased ExCo engagementon contractor selection/management.
Explorationsuccess andreserves addition
• Failure to identify and captureacreage and resourceopportunities to providea portfolio of drillableexploration prospects andsufficient developmentprojects to achieve reservesaddition targets.
• Specific explorationprogrammes may fail to addreserves and hence value.Failure to negotiate accessrights or close transactionscould slow growth ofreserves and productionand lead to loss ofcompetitive advantage.
• Strong portfolio managementand alignment with strategicgrowth targets. Appropriatebalance between growth byexploration and acquisition.
• Exploration managementsystems includingcomprehensive peer reviewwith focus on geologiesin core areas we know welland in which we can builda competitive advantage.
• M&A effort focusing ongeographical and technicalareas aligned with ourstrategy. Diligence inacquisition process andpost- acquisition integrationto ensure targeted returns.
• Re-organised Explorationteam to improve deliveryfrom existing portfolio andnew ventures.
• Corporate Exploration teamstrengthened to ensuregreater focus on prospectiveresource and risk assessment(with associated enhancementof Exploration managementsystem content).
• Near-field exploration movedto business unit managementbut with Exploration functionendorsement retained.
• Majority of low-impact,high-risk North Seaopportunities removedfrom portfolio.

24 / Premier Oil plc 2014 Annual Report and Financial Statements
COMPANY RISK FACTORS
cont
inue
dKey risk factor Risk detail How is it managed? Key steps to mitigate in 2014/15
Host government– political andfiscal risks
• Premier operates in somecountries where political,economic and social transitionis taking place or there arecurrent sovereignty disputes.Developments in politics, lawsand regulations can affect ouroperations and earnings.
• Consequences may includeforced divestment of assets;limits on production or costrecovery; import and exportrestrictions; internationalconflicts, including war, civilunrest and local securityconcerns that threaten thesafe operation of companyfacilities; price controls, taxincreases and other retroactivetax claims; expropriation ofproperty; cancellation ofcontract rights; and increasein regulatory burden. It isdifficult to predict the timing orseverity of these occurrencesor their potential impact.
• Premier’s portfolio includesoperations in both low andhigher risk environments.Premier actively monitorsthe local situation and hasbusiness continuity plansin each area which can beactivated depending onpredefined levels of alert.
• Premier strives to be a goodcorporate citizen globally, andfosters reputation by strongand positive relationships withgovernment and communitieswhere we do business. Premierengages in respectful industry-wide lobby and sustainablecorporate responsibilityand community investmentprogrammes. Rigorousadherence to Premier’sbusiness ethics policy andcode of conduct.
• Continuous monitoring ofthe external environment foremerging risks to the business.
• Improved provision ofpolitico-economic/ security/societal risk assessmentinforming investmentdecisions.
• Strengthened CorporateResponsibility managementsystem and improvedCorporate Responsibilityreporting.
• Assessing cost/ benefitof political risk insurance.
Commodity pricevolatility
(Of particularsignificancein late 2014and into 2015)
• Oil and gas prices are affectedby global supply and demandand price can be subject tosignificant fluctuations. Factorsthat influence these includeoperational issues, naturaldisasters, weather, politicalinstability, or conflicts andeconomic conditions oractions by major oil-exportingcountries. Price fluctuationscan affect our businessassumptions and can effectinvestment decisions andfinancial capability.
• Oil and gas price hedgingprogrammes to underpinour financial strength andto protect our capacity tofund our future developmentsand operations.
• Premier investmentguidelines ensure that ourdevelopment programmesare robust to downsidesensitivity price scenarios.
• Hedging programme(continued into 2015).
• Economics of developmentprogrammes re-workedto reflect low oil priceenvironment.
• Discretionary spend curtailed.
• Contingency planningfor accelerateddecommissioning ofidentified production assets.
Organisationalcapability
• Risk that the capability of theorganisation is not adequateto deliver plans for strategicgrowth. The capability of theorganisation is a function ofboth the strength of itshuman resources and itsbusiness managementsystems. Inadequate systemsor lack of compliance maylead to loss of value andfailure to achieve growthtargets. Loss of personnel tocompetitors, inability to attractand retain quality humanresources and competencygaps could affect ouroperational performance anddelivery of growth strategy.
• Premier has created acompetitive remunerationand retention packageincluding bonus andlong-term incentive plans toincentivise loyalty and goodperformance from the existing,highly skilled workforce.
• Premier is continuing tostrengthen its organisationalcapability to achieve strategicobjectives. This includesresource planning, competencydevelopment, training anddevelopment programmes,succession planning includingleadership development.
• Continuous strengthening ofbusiness management systemsand controls as appropriate tothe size and market positionof the company.
• Continuous improvementof human resourcesmanagement systemsand controls.
• Review of long-termincentive package.
• Phased function roll-out ofcompetency managementsystem commenced.

Premier Oil plc 2014 Annual Report and Financial Statements / 25
Key risk factor Risk detail How is it managed? Key steps to mitigate in 2014/15
Joint venturepartner alignment
• Global operations in theoil and gas industry areconducted in a joint ventureenvironment. There is a riskthat joint venture partnersare not aligned in theirobjectives and drivers andthis may lead to inefficienciesand/or delays. Several of ourmajor projects are operatedby our joint venture partnersand our ability to influenceour partners is sometimeslimited due to our smallinterest in such ventures.
• Due diligence and continuousand regular engagementwith partners in jointventures in both operatedand non-operated projects.Premier takes strategicacquisition opportunitieswhere appropriate to gain agreater degree of influenceand control.
• Heightened engagementwith joint venture partnerswith regard to their abilityto fulfil commitments.
• Implementation of newnon-operated venturesmanagement system.
Financialdiscipline andGovernance
(Of particularsignificancein late 2014into 2015)
• Risk that sufficient fundsare not available to financethe business. Risk offinancial fraud.
• Strong financial disciplineand balance sheet. Premierhas an established financialmanagement system toensure that it is able tomaintain an appropriate levelof liquidity and financialcapacity and to managethe level of assessed riskassociated with the financialinstruments. Premiermaintains access to capitalmarkets through the cycle.The management systemincludes policies and adelegation of authoritymanual to reasonably protectagainst risk of financial fraudin the group.
• An insurance programmeis put in place to reducethe potential impact of thephysical risks associated withexploration and productionactivities. In addition, businessinterruption cover ispurchased for a proportionof the cash flow fromproducing fields. Cashbalances are invested inshort-term deposits withminimum A credit ratingbanks, AAA managedliquidity funds and A1/P1commercial paper, subjectto Board approved limits.
• Economics of investmentdecisions and developmentprojects re-worked to reflectlow oil price environment.
• Deferred discretionaryexploration spend.
• Contingency planning ifdevelopment projectsdeferred (Vette, Sea Lion).
• Reduction of contractor spend.
• Contingency planningfor right-sizing andre-structuring of groupto deliver business goals.
• Careful management ofcovenant headroom onthe group’s debt facilities.

26 / Premier Oil plc 2014 Annual Report and Financial Statements
BUSINESS UNIT REVIEWS IN NOVEMBER, PREMIER OPTED TO PROGRESS A SMALLER, SCALED-BACK SEA LION DEVELOPMENT
SCHEME IN ORDER TO REDUCE THE CAPEX REQUIRED PRIOR TO FIRST CASH FLOWS FROM THE FIELD. THEINITIAL PHASE OF DEVELOPMENT AIMS TO RECOVER 160 MMBBLS OF OIL FROM THE NORTH EAST PARTOF THE FIELD FOR LESS THAN US$2 BILLION OF PRE-FIRST OIL CAPEX.
FINAL PREPARATIONS FOR THE FOUR WELL EXPLORATION CAMPAIGN ARE UNDER WAY WITH THE FIRSTWELL, ZEBEDEE, EXPECTED TO SPUD IN EARLY MARCH. THE OUTCOME OF THIS CAMPAIGN, WHICH HASTHE POTENTIAL TO MORE THAN DOUBLE THE DISCOVERED RESOURCE IN THE NORTH FALKLANDS BASIN,WILL DETERMINE THE SHAPE OF SUBSEQUENT DEVELOPMENT PHASES IN THE AREA.
Highlights and achievements /
• Sea Lion development re-sized with an estimated capex of less than US$2 billion to first oil
• Carry arrangement renegotiated with Rockhopper
• Rig contract and rig sharing agreement for exploration campaign signed
THE FALKLAND ISLANDS

Premier Oil plc 2014 Annual Report and Financial Statements / 27
DEVELOPMENT //
Good progress was made in planning the Sea Liondevelopment scheme utilising a Tension Leg Platform (TLP)during 2014. However, the oil price environment andPremier’s commitment to maintaining a strong financialposition caused the group to re-examine the scheme witha view to reducing capex. As a result, in November,Premier opted to progress a smaller initial developmentof just the north east part of the Sea Lion field with asingle subsea drill centre, utilising a leased FPSO.
It is anticipated that this smaller scheme will recover around160 mmbbls of oil over 15 years from 14 wells. Total capitalexpenditure prior to first oil was expected to be less thanUS$2 billion in November when first estimated. Premierplans to take advantage of weaker market conditions in thesecond half of 2015 to capture lower costs for the project.
Work has commenced on assessing the FPSO designoptions for the first phase of the development. The existingTLP topsides design and equipment lists are beingmodified for use with a smaller capacity FPSO and theconclusions of various metocean studies are being fed intothe FPSO design process. A project sanction for the firstphase of development is targeted for the first half of 2016,although the exact timing of this will ultimately dependupon the contracting strategy employed for the FPSO.Sanction of the project will depend on the cost reductionsthat are achieved and the oil price outlook at that time.
Rockhopper will fund their share of the pre-sanction costsand a letter of agreement has been concluded such thatthe remaining development carry will be split equallybetween the initial development and the next phase(US$337 million to each). A guarantee fee mechanismwhich applies to capex guarantees given by Premier inrespect of the development has been extended to includethe FPSO lease.
While it is likely that Premier would be able to fund aproject of this size from existing facilities and cash flows,the company will continue to seek a partner for the SeaLion development. Plans for subsequent phases ofdevelopment, which could involve either further FPSOs ora TLP, will target a further 235 mmbbls of existingdiscovered resources plus any new discoveries arisingfrom the 2015 exploration programme.
28 / Premier Oil plc 2014 Annual Report and Financial Statements
BUSINESS UNIT REVIEWS
cont
inue
d EXPLORATION //
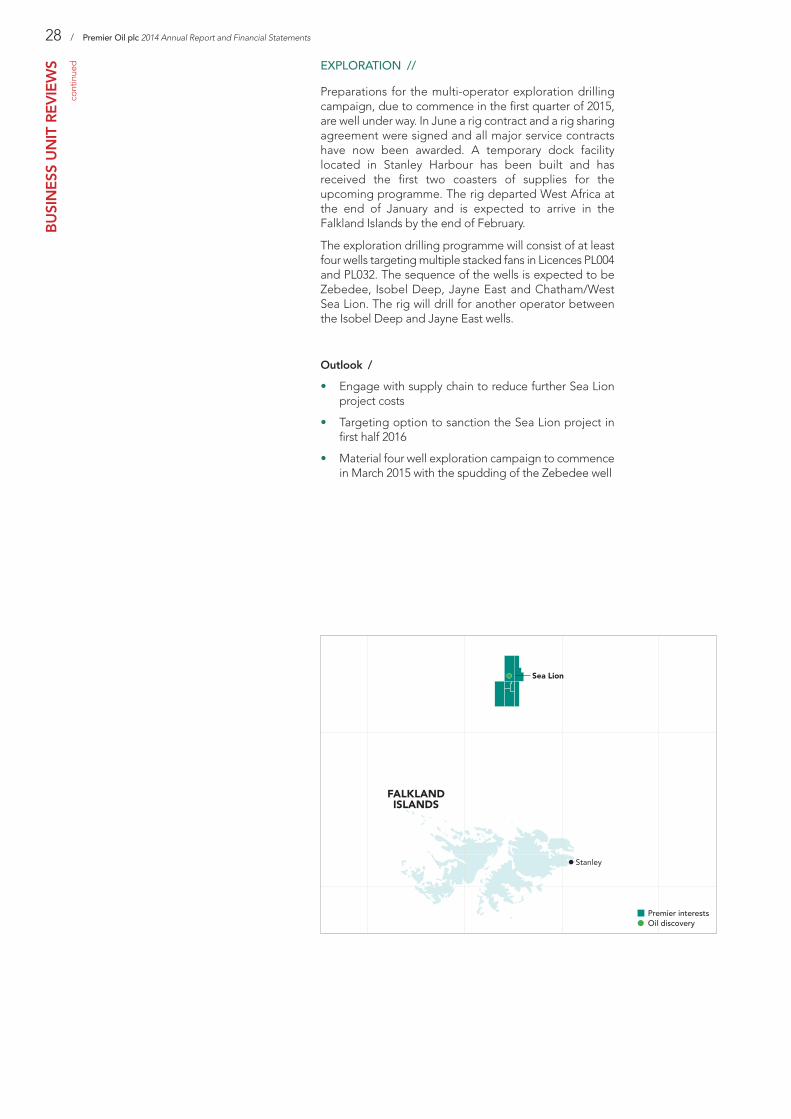
Preparations for the multi-operator exploration drillingcampaign, due to commence in the first quarter of 2015,are well under way. In June a rig contract and a rig sharingagreement were signed and all major service contractshave now been awarded. A temporary dock facilitylocated in Stanley Harbour has been built and hasreceived the first two coasters of supplies for theupcoming programme. The rig departed West Africa atthe end of January and is expected to arrive in theFalkland Islands by the end of February.
The exploration drilling programme will consist of at leastfour wells targeting multiple stacked fans in Licences PL004and PL032. The sequence of the wells is expected to beZebedee, Isobel Deep, Jayne East and Chatham/WestSea Lion. The rig will drill for another operator betweenthe Isobel Deep and Jayne East wells.
Outlook /
• Engage with supply chain to reduce further Sea Lionproject costs
• Targeting option to sanction the Sea Lion project infirst half 2016
• Material four well exploration campaign to commencein March 2015 with the spudding of the Zebedee well

/ 29
INDONESIA2014 SAW STRONG PRODUCTION AND CASH FLOWS FROM PREMIER’S OPERATED NATUNA SEABLOCK A, WHICH INCREASED ITS MARKET SHARE OF THE GSA1 CONTRACT AND ACHIEVEDRECORD PRODUCTION RATES. DELIVERABILITY FROM NATUNA SEA BLOCK A WAS FURTHERENHANCED WITH FIRST GAS FROM THE NAGA FIELD IN NOVEMBER. PREMIER ALSO ENJOYEDEXPLORATION SUCCESS IN INDONESIA WITH A SIGNIFICANT OIL AND LIQUIDS-RICH GASDISCOVERY ON THE OPERATED TUNA BLOCK FURTHER STRENGTHENING THE PORTFOLIO ANDPROVIDING THE GROUP WITH FUTURE GROWTH OPPORTUNITIES.
Highlights and achievements /
• Natuna Sea Block A captured 45 per cent of Gas Sales Agreement (GSA) 1, significantly above contractual share
• Naga on-stream in November
• Gas sales from Natuna Sea Block A to the domestic market commenced
• Significant discovery of 100 mmboe on the Tuna Block
• Record cash flow
30 / Premier Oil plc 2014 Annual Report and Financial Statements
BUSINESS UNIT REVIEWS
cont
inue
d PRODUCTION AND DEVELOPMENT //
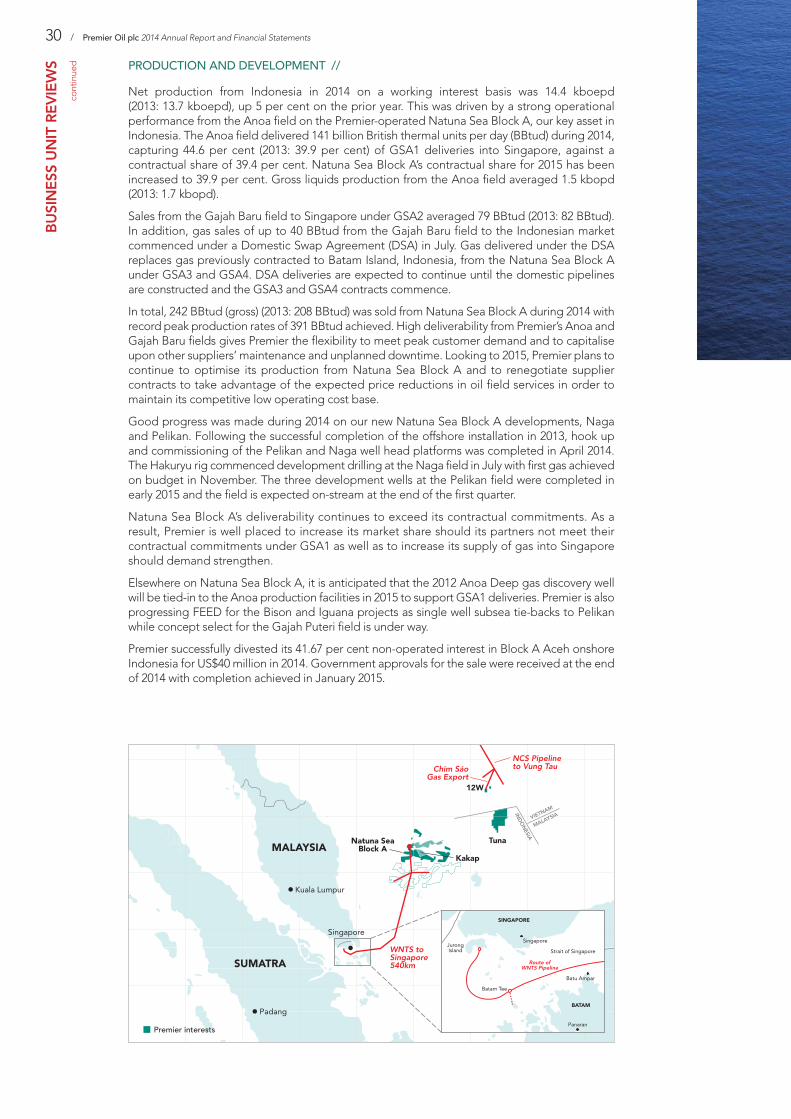
Net production from Indonesia in 2014 on a working interest basis was 14.4 kboepd(2013: 13.7 kboepd), up 5 per cent on the prior year. This was driven by a strong operationalperformance from the Anoa field on the Premier-operated Natuna Sea Block A, our key asset inIndonesia. The Anoa field delivered 141 billion British thermal units per day (BBtud) during 2014,capturing 44.6 per cent (2013: 39.9 per cent) of GSA1 deliveries into Singapore, against acontractual share of 39.4 per cent. Natuna Sea Block A’s contractual share for 2015 has beenincreased to 39.9 per cent. Gross liquids production from the Anoa field averaged 1.5 kbopd(2013: 1.7 kbopd).
Sales from the Gajah Baru field to Singapore under GSA2 averaged 79 BBtud (2013: 82 BBtud).In addition, gas sales of up to 40 BBtud from the Gajah Baru field to the Indonesian marketcommenced under a Domestic Swap Agreement (DSA) in July. Gas delivered under the DSAreplaces gas previously contracted to Batam Island, Indonesia, from the Natuna Sea Block Aunder GSA3 and GSA4. DSA deliveries are expected to continue until the domestic pipelinesare constructed and the GSA3 and GSA4 contracts commence.
In total, 242 BBtud (gross) (2013: 208 BBtud) was sold from Natuna Sea Block A during 2014 withrecord peak production rates of 391 BBtud achieved. High deliverability from Premier’s Anoa andGajah Baru fields gives Premier the flexibility to meet peak customer demand and to capitaliseupon other suppliers’ maintenance and unplanned downtime. Looking to 2015, Premier plans tocontinue to optimise its production from Natuna Sea Block A and to renegotiate suppliercontracts to take advantage of the expected price reductions in oil field services in order tomaintain its competitive low operating cost base.
Good progress was made during 2014 on our new Natuna Sea Block A developments, Nagaand Pelikan. Following the successful completion of the offshore installation in 2013, hook upand commissioning of the Pelikan and Naga well head platforms was completed in April 2014.The Hakuryu rig commenced development drilling at the Naga field in July with first gas achievedon budget in November. The three development wells at the Pelikan field were completed inearly 2015 and the field is expected on-stream at the end of the first quarter.
Natuna Sea Block A’s deliverability continues to exceed its contractual commitments. As aresult, Premier is well placed to increase its market share should its partners not meet theircontractual commitments under GSA1 as well as to increase its supply of gas into Singaporeshould demand strengthen.
Elsewhere on Natuna Sea Block A, it is anticipated that the 2012 Anoa Deep gas discovery wellwill be tied-in to the Anoa production facilities in 2015 to support GSA1 deliveries. Premier is alsoprogressing FEED for the Bison and Iguana projects as single well subsea tie-backs to Pelikanwhile concept select for the Gajah Puteri field is under way.
Premier successfully divested its 41.67 per cent non-operated interest in Block A Aceh onshoreIndonesia for US$40 million in 2014. Government approvals for the sale were received at the endof 2014 with completion achieved in January 2015.

/ 31
EXPLORATION AND APPRAISAL //
Premier drilled three exploration wells in Indonesia during2014: the Kuda Laut-1 and Singa Laut-1 wells on thePremier-operated Tuna Block and the Ratu Gajah-1 well onthe Premier-operated Natuna Sea Block A.
The Kuda Laut-1 well, which targeted Miocene sands withina four-way dip closed structure, and the Singa Laut-1side-track, which targeted the Oligocene sequence inthe adjoining three-way dip closure, discovered 100 mmboe.Gas gradients have been measured and liquids-rich gassamples were recovered suggesting that the discovery hasa high natural liquid content. Planning for a 2016 appraisalcampaign is now under way. Premier has 65 per cent equityin the block and will assess the appropriate workinginterest level to hold as appraisal advances.
Premier also drilled the Ratu Gajah-1 well on Natuna SeaBlock A during 2014. While the well flowed gas to surfaceduring testing, less sandstone reservoir than expected wasencountered and the discovery is sub-commercial. Theresults of this well, however, have been integrated into thegroup’s broader understanding of the Lama play andthicker sands have been identified at the basin margin. Thenext well in our portfolio to test the Lama play will be theappraisal of the Anoa Deep discovery, which is scheduledfor the second quarter of 2015.
Outlook /
• Premier’s contractual share of GSA1 increased to 39.9 per cent, underpinning long-term cash flows
• Pelikan due on-stream in 2015; portfolio of growth options
• Anoa Deep appraisal well to be drilled in 2015

32 / Premier Oil plc 2014 Annual Report and Financial Statements
BUSINESS UNIT REVIEWS
cont
inue
d FOLLOWING CONCEPT SELECT IN FEBRUARY, PREMIER SUCCESSFULLY COMPLETED FEED ON THE VETTEDEVELOPMENT AND PROGRESSED THE PROJECT TO THE POINT OF SANCTION. HOWEVER, PREMIER HASAGREED WITH THE NORWEGIAN PETROLEUM DIRECTORATE TO DEFER THE SUBMISSION OF THE PLANFOR DEVELOPMENT AND OPERATION (PDO) TO ENABLE PREMIER TO RE-ENGAGE WITH THE SUPPLY CHAINTO CAPTURE LOWER COSTS. PREMIER SUCCESSFULLY CONCLUDED THE SALE OF ITS INTEREST IN LUNO IIIN 2014 WHILE PREPARATIONS FOR OUR FIRST TEST OF THE EMERGING MANDAL HIGH PLAY ARE WELLADVANCED WITH THE MYRHAUK WELL EXPECTED TO SPUD MID-2015.
Highlights and achievements /
• FEED on the Vette project completed
• Sale of Luno II discovery successfully concluded
• Successful licence application in the APA 2014 Licensing Round
NORWAY

Premier Oil plc 2014 Annual Report and Financial Statements / 33
DEVELOPMENT //
Premier acquired operatorship of the Vette development in 2013. Since then,significant progress has been made in commercialising the field and, at the endof 2014, Premier booked the reserves for the development.
The development will focus on recovering 45 mmbbls of reserves from the fieldusing four producers and two injectors tied-back to a FPSO. The Mackereldiscovery in the adjacent PL406 licence will be incorporated into a possiblesecond phase of development.
FEED engineering work and supply chain engagement on the developmentconcept for Vette was completed and the project was brought to sanctiondecision by the end of 2014. As part of that process, Premier also continuedwith the development of its organisation in Norway in preparation fordevelopment operator status and successfully completed a number of auditsundertaken by the Petroleum Safety Authority.
In light of the sharp fall in the oil price in the second half of 2014, Premier agreedwith the Norwegian Petroleum Directorate to defer the submission of the PDOby a year. Premier will use the intervening period to re-engage with the supplychain to negotiate better rates which are more reflective of the current climate.
MANDAL HIGH

34 / Premier Oil plc 2014 Annual Report and Financial Statements
BUSINESS UNIT REVIEWS
cont
inue
d Assuming that appropriate cost savings are achieved, Premier will considermaking a final investment decision at the end of 2015 targeting first oil in 2019.
Work continued during 2014 on the non-operated Frøy field to identify a viabledevelopment concept. Following acquisition and interpretation of new seismicdata, a reassessment of subsurface resources was completed in 2014 andscreening of development concepts is under way, including both standaloneoptions as well as a tie-back solution to nearby infrastructure.
EXPLORATION //
Premier continued to high grade its Norwegian explorationportfolio during 2014. This included the profitable sale ofthe group’s non-operated interest in PL359, which includedthe Luno II discovery, to Lundin Petroleum for aconsideration of US$17.5 million. In addition, followingtechnical evaluations, Premier relinquished a number of itsexploration licences in Norway.
Premier’s immediate exploration focus in Norway is on theMyrhauk well which is expected to spud mid-2015 and willbe the company’s first test of the emerging Mandal Highplay. Premier has built an extensive acreage position overthe Mandal High, both organically and through acquisition,and has identified significant follow-on potential to theMyrhauk well in the success case.
Premier was successful in the APA 2014 Licensing Roundwith the award of a 20 per cent non-operated interest inPL782s which is located in the Norwegian North Sea andwill be operated by ConocoPhillips. There are no firm wellcommitments with the award.
Outlook /
• Re-engage with the supply chain during 2015 tocapture lower costs for the Vette project
• Final investment decision of Vette targeted forend 2015, depending on cost savings achieved
• The potentially play opening Myrhauk explorationwell to be drilled in 2015

/ 35
PAKISTAN2014 SAW ANOTHER STRONG PERFORMANCE FROM PREMIER’S PAKISTANBUSINESS UNIT. PRODUCTION FROM OUR SIX NON-OPERATED ONSHOREPAKISTAN GAS FIELDS EXCEEDED EXPECTATIONS AND EXPLORATION SUCCESSWAS ACHIEVED WITH THE KADANWARI K-36 WELL.
Highlights and achievements /
• Average production of 12.4 kboepd with 96 per cent uptime achieved
• New development wells tied-in to production
• Exploration success with the K-36 exploration well
PRODUCTION AND DEVELOPMENT //
Average production in Pakistan during 2014 was 12.4 kboepd (net to Premier), around 16 per centlower than in 2013 (14.9 kboepd). This reflects natural decline in the Bhit, Qadirpur and Zamzamagas fields only partially offset by higher production from the Kadanwari and Badhra fields.
The Kadanwari gas field, in which Premier has a 15.8 per cent non-operated interest, performedstrongly in 2014 and delivered production of 3.2 kboepd (net to Premier) (2013: 2.9 kboepd),a new record for the field. This was driven by new production from the K-33 and K-35 wells whichcame on-stream in December 2013 and February 2014 respectively, and the successful explorationwell K-36, which was tied-in to production in April 2014.

36 / Premier Oil plc 2014 Annual Report and Financial Statements
BUSINESS UNIT REVIEWS
cont
inue
d Average production from the Bhit and Badhra gas fields in2014 was 3.0 kboepd (net to Premier) (2013: 3.3 kboepd).Higher production was achieved from the Badhra gas fieldwhich benefitted from two new wells being broughton-stream in the first quarter of 2014. An additional twodevelopment wells were tied-in at Badhra at the end of theyear partially offsetting natural decline from existing wells.Good progress has also been made on the compressorreconfiguration project at Bhit, which was initiated in thefirst half of 2014, to improve ultimate recovery by around54 billion cubic feet (bcf) (gross). Five of the 10 compressorshave been commissioned and the project is on track tocomplete in April 2015.
Production from the Qadirpur gas field averaged3.2 kboepd (2013: 3.6 kboepd). Production fell over theyear, in part due to natural decline in the field, but also dueto an unplanned shutdown at the power plants into whichgas is delivered.
Production from the Zamzama field was lower in 2014averaging 3.1 kboepd (2013: 5.1 kboepd). This markeddecrease in production was due to faster decliningreservoir pressures than initially anticipated and Premierhas updated its remaining reserves estimate for the fieldaccordingly. However, this decline was partially mitigatedby intervention work carried out at the Zam-4 productionwell in May and the re-start of gas production from theZam-8 well in October. The joint venture is also consideringfurther infill drilling and additional wellhead compressionto mitigate the natural decline seen in the existing wells.
First gas was achieved from the Zarghun South gas fieldin August and the field is currently producing at around13 million standard cubic feet per day (mmscfd) (gross).All costs pertaining to Premier’s 3.75 per cent workinginterest in the field continue to be carried by the operator.
EXPLORATION AND APPRAISAL //
Premier drilled the successful K-36 exploration well onKadanwari in Pakistan in the first half of 2014. The welldiscovered gas in a separate step-out compartment andwas tied-in to the Kadanwari facilities during April 2014.
Outlook /
• Bhit compressor reconfiguration project to becompleted in 2015
• Further infill development drilling and compressionprojects under consideration

/ 37
MAURITANIAPRODUCTION AND DEVELOPMENT //
Production from the Chinguetti field averaged 447 barrels of oil per day (bopd) (2013: 507 bopd)net to Premier during the year. The fall in production was driven by natural decline from the existingwells as well as a shutdown of the facilities in January for a mooring chain replacement. The FPSOcontract has now been extended to December 2017.
Elsewhere in Mauritania, Premier relinquished its non-operated interest in PSC-A, which containsthe Banda gas development and PSC-B, which contains the Tiof and Tevet discoveries.
EXPLORATION AND APPRAISAL //
The Tapendar-1 exploration well was drilled on PSC C-10 in the first half of 2014 and was pluggedand abandoned as a dry hole. Subsequently, the joint venture partners agreed to exit the licenceon 30 November 2014.

38 / Premier Oil plc 2014 Annual Report and Financial Statements
BUSINESS UNIT REVIEWS
cont
inue
d HIGHER UK PRODUCTION, DRIVEN BY IMPROVED OPERATING EFFICIENCY AT THE BALMORAL AREA,INCREASED CONTRIBUTIONS FROM HUNTINGTON AND ROCHELLE AND FLUSH PRODUCTION FROM KYLE,RESULTED IN A STRONG RISE IN UK CASH FLOWS IN 2014, DESPITE THE SHARP FALL IN THE OIL PRICE INTHE SECOND HALF OF THE YEAR. KEY MILESTONES WERE REACHED ON PREMIER’S OPERATED SOLANAND CATCHER PROJECTS. IN ADDITION, THE SALE OF THE HIGH COST SCOTT AREA ASSETS FORUS$130 MILLION WAS SUCCESSFULLY COMPLETED IN DECEMBER.
Highlights and achievements /
• Average production of 19.4 kboepd, up 30.3 per cent on 2014
• Government approval and partner sanction of the Catcher development
• Solan facilities installed West of Shetland
• Sale of the high cost Scott area assets completed
UNITED KINGDOM

Premier Oil plc 2014 Annual Report and Financial Statements / 39
PRODUCTION //
In 2014, UK production averaged 19.4 kboepd, anincrease of 30.3 per cent on the corresponding period(2013: 14.9 kboepd).
Production from the Premier-operated Balmoral areaexceeded expectations, averaging 3.2 kboepd during 2014(2013: 2.5 kboepd), as the asset benefitted from improvedoperating efficiency and the reinstatement of five wells,four at the end of 2013 and one in 2014. Production fromthe non-operated Wytch Farm asset was also strong,averaging 5.6 kboepd (2013: 5.5 kboepd) again drivenby high operating efficiency as well as a successfulprogramme of infill drilling which saw four new wellsbrought on-stream in the first half of 2014.
Production from Scott, Telford and Rochelle averaged3.8 kboepd, broadly in line with expectations. Whileproduction from the fields was impacted by severalunplanned shutdowns, reservoir productivity was strongwhen unconstrained by facilities, with Rochelle, for example,achieving rates of up to 100 mmscfd (gross). In DecemberPremier successfully completed the sale of the Scott areaassets for a consideration of US$130 million. As part ofthe transaction, all associated decommissioning costsliabilities were transferred to the buyer.
Average production from the non-operated Huntingtonfield was 5.7 kboepd (2013: 3.5 kboepd). Although thegroup benefitted from a full year of production from theasset, production performance from the field wassignificantly below expectations due to lower operatingefficiency as a result of downtime on the productionfacilities and restrictions on exporting the gas throughthe CATS pipeline system. Most recently, productionfrom the field has been restricted while repairs areundertaken to a topsides valve on the CATS riser platformwhich failed to re-start in early December following aplanned outage. The field is now expected to re-start fullproduction in mid-March.
Since December 2011, the non-operated Kyle fieldunderwent redevelopment following storm damage to theBanff FPSO to which the field ties-back. That work wassuccessfully completed in 2014 and Kyle was brought backon-stream in July. The field benefited from early flushproduction with peak rates in excess of 7 kbopd (gross).While flush production has continued into 2015 with thefield currently averaging around 5 kbopd, this is expectedto decline during the year.
DEVELOPMENTS //
Further progress was made on the Premier-operated Solanproject West of Shetland during 2014. The onshoreconstruction of the subsea oil storage tank, jacket andtopsides were completed and the facilities weresuccessfully installed at the end of the summer using theHeerema Thialf heavy lift vessel. The first producer andinjector wells also successfully completed in Septemberwith good flow rates achieved.

40 / Premier Oil plc 2014 Annual Report and Financial Statements
BUSINESS UNIT REVIEWS
cont
inue
d Commissioning commenced in November with thearrival of the Safe Scandinavia flotel which is able toaccommodate up to 400 people. This programme,however, has taken longer than anticipated due to poorweather conditions and low productivity over the winterperiod. Whilst productivity has improved in recent weeks,additional accommodation modules will be required toachieve habitation on the platform. Further flotel slots havebeen identified whilst conversion of the drilling rigcontracted to arrive in April is also being considered. As aresult, first oil will be later than the previous guidance ofthe second quarter of 2015 and Premier will provide furtherupdates to the market as the work progresses. Premiercontinues to target plateau production rates from the fieldof 20-25 kbopd (gross) by year-end.
Cash spend to 31 December 2014 stood at US$1.4 billion.Premier agreed to extend its loan to Chrysaor to ensurethe project remains fully funded to first oil. In return,Premier will take 100 per cent of the project’s cash flow(after certain deductions) until the loan and interest hasbeen repaid. As at 31 December, the loan and interestoutstanding stood at US$547 million. However, Premiercontinues to work with Chrysaor and potential providersof debt finance on a partial sale or refinancing of theChrysaor loan.
The Premier-operated Catcher area project is progressingon budget and on schedule. The development achievedpartner approval and government sanction in 2014 and theproject is now well into the execution phase. Engineeringprocurement and construction of key subsea equipment,including the drilling templates, gas export line, pipelinemanifolds and subsea trees and control systems are underway. Fabrication of the FPSO hull has also commenced,with first steel cut in Japan in early January 2015.
Offshore construction activity is planned to commence inmid-2015 with the installation of the subsea facilities,including the gas export line and drilling templates.Preparations for development drilling with the Ensco-100jack up rig are well advanced and the campaign is on trackto commence mid-year.

Outlook /
• Solan field targeted to be at plateau production rates of 20-25 kbopd by year-end
• Development drilling scheduled to commence at Catcher mid-2015
• Exploration focus on near-field exploration opportunities
• US$2.7 billion of UK corporate tax losses and allowances
EXPLORATION //
Premier’s UK North Sea exploration efforts are focused on near-field exploration opportunitiesclose to its existing developments and producing assets. In particular, preparation is under wayto drill an exploration well at the Laverda prospect to the north of the Catcher area hub in 2016.
Work also continues on the Bagpuss and Blofeld heavy oil prospects, located on the Halibut Horst,a well-defined basement high within the Moray Firth. The joint venture partners are targeting thefirst half of 2016 for the drilling of the Bagpuss well.
2014 saw Premier continue to high grade and rationalise its UK North Sea exploration portfoliowith a number of licences either relinquished or sold over the course of the year.
/ 41

42 / Premier Oil plc 2014 Annual Report and Financial Statements
BUSINESS UNIT REVIEWS
cont
inue
d
VIETNAM
THE PREMIER-OPERATED CHIM SÁO FIELD OUT-PERFORMEDEXPECTATIONS IN 2014 AS WE CONTINUED TO MAXIMISEPRODUCTION DELIVERY AND TO IMPROVE THE RELIABILITY OFTHE FACILITIES. THE SUBSEA TIE-BACK OF THE DUA FIELD WASCOMPLETED SUCCESSFULLY IN JULY, EXTENDING PLATEAUPRODUCTION AND THE FIELD LIFE OF CHIM SÁO.
Highlights and achievements /
• Record production and cash flow achieved from Chim Sáo
• Oil sold at a premium to Brent
• Operating efficiency from the Chim Sáo facility of 84 per cent, up 20 per centon 2013
• Dua on-stream

Premier Oil plc 2014 Annual Report and Financial Statements / 43
PRODUCTION AND DEVELOPMENT //
In 2014, production from Block 12W, which contains the Chim Sáo and Duafields, exceeded expectations averaging 16.9 kboepd (13.7 kbopd of oil and15.4 mmscfd of gas) net to Premier, up 19.9 per cent on 2013.
During 2014, Premier completed significant upgrades to the Chim Sáo FPSOaimed at maximising production deliverability and operating efficiency. Thisincluded upgrades to the boilers and gas compressors as well as the installationof an additional diesel generator to improve the reliability of power generation.As a result, operating efficiency from the Chim Sáo facility increased to84 per cent during 2014, up 20 per cent on 2013. Record production rates of19.2 kboepd (net) were achieved in November and December and the field iscurrently producing over 20 kboepd (net).

44 /
BUSINESS UNIT REVIEWS
cont
inue
d
The three well subsea tie-back of the Dua oil field to the Chim Sáofacilities was completed, with first oil from the field achieved in July2014. Following the completion of the Dua drilling programme, theWest Telesto rig drilled two further water injector wells at Chim Sáoto provide pressure support to the field’s oil production. This,together with new production from Dua, will extend plateauproduction and the field life of Chim Sáo.
In January 2015, Premier surpassed the milestone of 30 mmbbls(gross) of production from Chim Sáo. This strong performance fromBlock 12W has generated significant cash flows for the group andthe costs incurred to bring both Chim Sáo and Dua on-stream havenow been fully recovered.
Outlook /
• Continued optimisation of Chim Sáo production
• Maintain strong operating efficiency performance
• Growth opportunities to sustain production under consideration
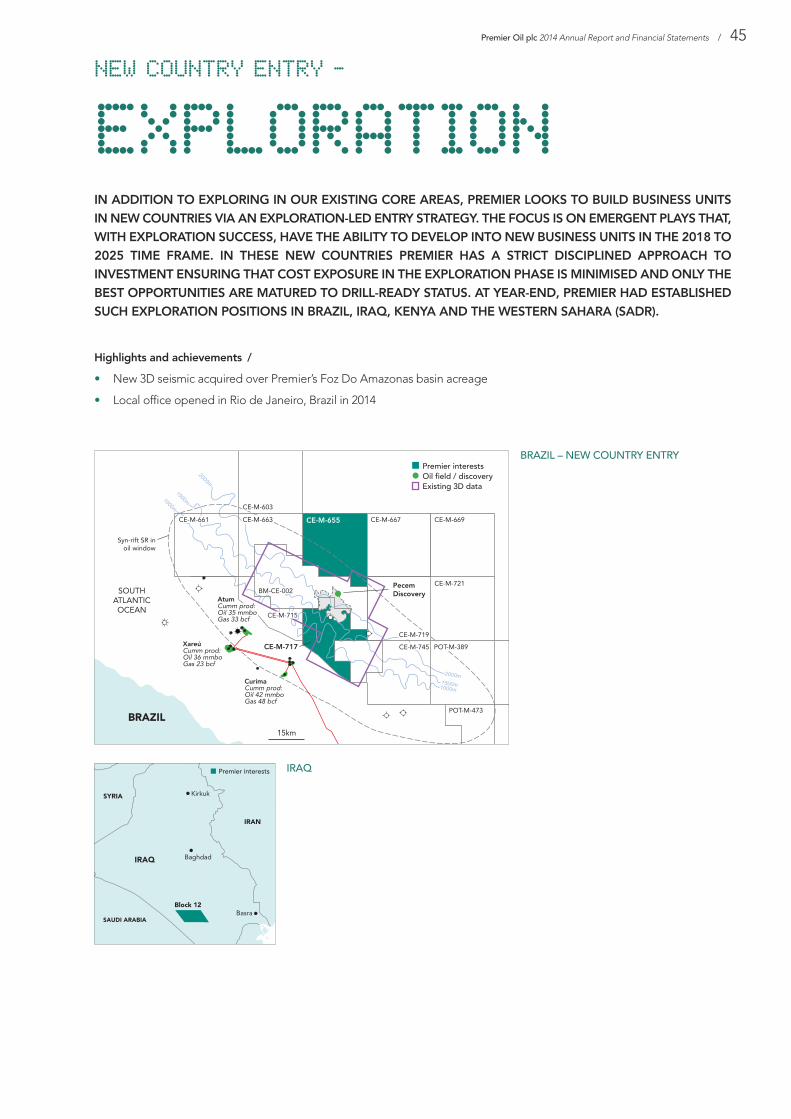
Premier Oil plc 2014 Annual Report and Financial Statements / 45
NEW COUNTRY ENTRY -
EXPLORATIONIN ADDITION TO EXPLORING IN OUR EXISTING CORE AREAS, PREMIER LOOKS TO BUILD BUSINESS UNITSIN NEW COUNTRIES VIA AN EXPLORATION-LED ENTRY STRATEGY. THE FOCUS IS ON EMERGENT PLAYS THAT,WITH EXPLORATION SUCCESS, HAVE THE ABILITY TO DEVELOP INTO NEW BUSINESS UNITS IN THE 2018 TO2025 TIME FRAME. IN THESE NEW COUNTRIES PREMIER HAS A STRICT DISCIPLINED APPROACH TOINVESTMENT ENSURING THAT COST EXPOSURE IN THE EXPLORATION PHASE IS MINIMISED AND ONLY THEBEST OPPORTUNITIES ARE MATURED TO DRILL-READY STATUS. AT YEAR-END, PREMIER HAD ESTABLISHEDSUCH EXPLORATION POSITIONS IN BRAZIL, IRAQ, KENYA AND THE WESTERN SAHARA (SADR).
Highlights and achievements /
• New 3D seismic acquired over Premier’s Foz Do Amazonas basin acreage
• Local office opened in Rio de Janeiro, Brazil in 2014
BRAZIL – NEW COUNTRY ENTRY
IRAQ

46 / Premier Oil plc 2014 Annual Report and Financial Statements
BUSINESS UNIT REVIEWS
cont
inue
d Premier entered Brazil in 2013 securing three licenses in the under-explored offshore regions of the proven Foz Do Amazonas andCeará basins. In 2014, a small representative office was establishedand new 3D seismic data was acquired over Premier’s Foz DoAmazonas basin acreage. The full processed products are expectedto be available in the first half of 2015. Acquisition of new 3D dataover the Ceará basin acreage is expected to commence in July2015. The earliest exploration well on Premier’s acreage in Brazil willnot be until 2017.
Premier holds a 30 per cent non-operated interest in Block 12,onshore Iraq, in the under-explored western part of one of theworld’s most prolific oil basins. At year-end a 3D seismic surveyacquisition programme was 75 per cent complete and it isanticipated that processed products will be available in the thirdquarter of 2015. There is one commitment well on this licence whichis planned to be drilled in late 2016 or early 2017.

Premier Oil plc 2014 Annual Report and Financial Statements / 47
Premier entered Kenya in 2012 and, following the withdrawal fromour offshore acreage in 2014, the company focussed on oneonshore licence (Block 2B). This licence covers a Tertiary sub-basinwithin the Anza Graben and was assessed as a potential look-a-liketo the successful plays drilled recently both in Uganda and furtherwest in Kenya. The first well on the block (Badada-1), drilled in early2015, did not find hydrocarbons. Premier has no furthercommitments in Kenya beyond the drilling of this well.
Offshore SADR, Premier holds 45,000 square kilometres (net) ofacreage across five licences. At present, all SADR licences are inabeyance pending the country’s admission to the United Nations.
Premier maintains two small new venture groups, one in Londonand one in Singapore, tasked with evaluating exploration-led entryoptions in new countries. Any new entry will be dependent on thequality of the opportunity and its ability to create value at ourconservative oil price assumptions at the time.
Outlook /
• Acquisition of new 3D data over the Ceará basin acreageplanned for 2015
• Continue to look for opportunities in new countries whichcan deliver either high impact prospects or play openingopportunities with significant follow-on potential

FINANCIAL REVIEW
Richard RoseFinance Director
Economic backgroundAfter three and a half years in which the price of oil averagedabove US$100/bbl, crude oil experienced a sharp fall in the secondhalf of 2014. The average for 2014 was US$98.9/bbl againstUS$108.7/bbl for the prior year. In the first half of 2014 the Brent oilprice ranged between US$104/bbl and US$115/bbl, before fallingto US$55/bbl by the end of the year.
Premier’s portfolio of crudes traded at a weighted average ofUS$2.0/bbl premium to Brent (2013: US$2.6/bbl), as we continuedto realise favourable prices, particularly for our Chim Sáo crude.Premier’s average realisations for the year were US$98.2/bbl(2013: US$109.0/bbl) after taking into account timings of actualliftings and export duties paid in Vietnam. Post hedging, realisedprices increased to US$101.0/bbl (2013: US$109.1/bbl).
Average gas prices for the group were US$8.4/mscf (2013:US$8.3/mscf). Gas prices in Singapore, linked to HSFO pricing andin turn, therefore, linked to crude oil pricing, averaged US$16.8/mscf(2013: US$17.1/mscf). The average price for Pakistan gas (where onlya portion of the contract formulae is linked to energy prices) wasUS$4.6/mscf (2013: US$4.4/mscf).

Premier Oil plc 2014 Annual Report and Financial Statements / 49
Effect of steep decline of the oil priceThe fall in both spot and forward oil prices has inevitably had animpact on our reported financial results in respect of the carryingvalue of certain of our oil and gas assets. An impairment charge hasbeen booked in the income statement relating to several of ourfields in the UK North Sea, Indonesia, Vietnam and Mauritania. Thetotal amount for the impairment (pre-tax) is US$784.4 million(US$327.8 million, post-tax). Impairment charges for the year,relating to UK fields, amounted to US$732.3 million (pre-tax)(2013: US$178.7 million), and were recognised for the Solan,Balmoral area and Huntington fields, while the remainingimpairment charge of US$52.1 million was recognised in respect ofthe Chim Sáo field in Vietnam, the Chinguetti field in Mauritania andthe Kakap field in Indonesia. The principal cause of the impairmentcharge is a reduction in the short to medium-term oil priceassumption used in estimating the future discounted cash flows foreach field. In addition to the impact of the reduced oil priceassumptions, a review of the expected decommissioning costs forthe Balmoral area in the first half of 2014 has also driven part of theimpairment charge, whilst the Solan impairment has in part beencaused by an increase in the costs incurred to date and expectedcosts to completion.
Income statementProduction in 2014 averaged 63.6 kboepd (2013: 58.2 kboepd) up9.3 per cent on a working interest basis. On an entitlement basis,which under the terms of our Production Sharing Contracts (PSCs)allows for additional government take at higher oil prices,production was 57.8 kboepd (2013: 52.4 kboepd). Working interestgas production averaged 177 mmscfd (2013: 174 mmscfd) orapproximately 49 per cent of total production. The increase inthe group’s production can be partially attributed to an increase inoperating efficiency across a number of assets in the portfolio.The group’s operating efficiency was 84 per cent in 2014(2013: 75 per cent).
Total sales revenue from all operations reached a new record levelof US$1.6 billion (2013: US$1.5 billion), due to higher productionpartially offset by lower average oil prices. Cost of sales, excludingimpairment charges, were US$986.6 million (2013: US$856.1 million).Operating costs were stable at US$436.1 million (2013:US$418.9 million). Unit operating costs were US$18.8 per barrel ofoil equivalent (boe) (2013: US$19.7/boe), lower than the prior yeardue to higher production, improved operating efficiency acrossseveral of the company’s assets and one-off insurance claimsreceived in the year. Underlying unit amortisation rose to US$19.2/boe(2013: US$17.7/boe) mainly reflecting higher production from fieldsin the UK and Vietnam, which carry a higher amortisation charge perboe compared to the group average.
Exploration expense and pre-licence expenditure costs amountedto US$58.5 million (2013: US$106.2 million) and US$25.3 million(2013: US$30.1 million) respectively. This includes the write-offsrelating to Block L10B in Kenya and the Ratu Gajah well in Indonesia,exiting our exploration licences in Mauritania and therelinquishment of various exploration licences in the UK as part ofPremier’s portfolio management programme. Net administrativecosts were US$25.4 million (2013: US$20.2 million).
RECORDSALESREVENUEANDOPERATINGCASH FLOW
PRODUCTION
64kboepd

50 / Premier Oil plc 2014 Annual Report and Financial Statements
FINANCIAL REVIEW
cont
inue
d Operating loss was US$248.1 million (2013: operating profit of US$352.0 million), mainlyattributable to the impairment charges described above. Finance costs and other charges,net of interest revenue and other gains, were US$137.8 million (2013: US$65.4 million).The interest revenue from the loan to our partner on the Solan field development hasincreased to US$36.8 million (2013: US$6.3 million), however, we have recognised aprovision of US$61.2 million against this long-term receivable, reflecting a reduction inthe total returns expected on the Solan field in a lower oil price environment. The chargefor the unwinding of the discounted decommissioning provision increased toUS$46.9 million (2013: US$36.4 million) reflecting increased provisions for futuredecommissioning as industry cost estimates rise.
Pre-tax losses were US$384.0 million (2013: pre-tax profits US$285.4 million). The grouptax credit for 2014 was US$173.7 million (2013: tax charge of US$51.4 million), an effectivetax rate of 45.2 per cent of the pre-tax loss. The group’s theoretical tax rate is close to50 per cent, which includes a higher taxation rate in the UK being offset by lower ratesin Vietnam and Pakistan. The 2014 group tax credit arises as a result of a deferred taxcredit in the UK, mainly arising from the tax effect of the impairment charges recognisedin the year and recognition of the UK Small Fields allowance for the Catcher field. Thegroup has an estimated US$2.7 billion of carried forward UK corporation tax allowancesand losses, the majority of which are forecast to be utilised against UK ring fence profitsover time, and are therefore reflected in the deferred tax asset position at the year-end.The group did not pay any corporation tax or supplementary charge in the UK in 2014due to these brought forward losses.
Loss after tax was US$210.3 million (2013: profit after tax US$234.0 million) resulting in abasic earnings per share loss of 40.3 cents (2013: profit 44.2 cents).
Dividend and buybackDuring 2014, Premier purchased 18.4 million shares at a volume weighted average priceof 302 pence and paid a dividend of 5 pence per share. In December, a decision wastaken by the Board to postpone the buyback programme pending a recovery in the oilprice. The Board has also decided to suspend the dividend and therefore no dividendis proposed.
Cash flowCash flow from operating activities was US$924.3 million (2013: US$802.5 million) afteraccounting for tax payments of US$208.5 million (2013: US$228.3 million). Cashmovements in working capital have improved to US$74.7 million (2013: US$1.3 million).
Capital expenditure in 2014 totalled US$1,195.5 million (2013: US$878.0 million).
Capital expenditure (US$ million) 2014 2013
Fields/development projects 887.5 603.7Exploration and evaluation 294.1 260.5Other 13.9 13.8
Total 1,195.5 878.0
The principal development projects were the Solan and Catcher fields in the UK, andthe Dua field in Vietnam. In addition, US$318.4 million (2013: US$185.9 million) fundingsupport was provided to our partner in the Solan project.
Exploration and evaluation spend includes costs principally related to the explorationdrilling and pre-development activities in Norway, Indonesia, the Falkland Islandsand Kenya.
Disposals and assets held for saleDuring the first half of 2014, Premier announced the proposed sale of the non-operatedScott area assets in the UK North Sea for US$130 million, the sale of Block A Acehonshore Indonesia for US$40 million, and the sale of PL359, which contains the Luno IIdiscovery offshore Norway, for US$17.5 million prior to working capital adjustments. TheScott area assets and Luno II transactions were completed during the second half of2014, whilst a US$76.9 million loss has been recognised as the anticipated loss on thesale of Block A Aceh, which was completed in January 2015. These disposals, combinedwith the write-off of deferred consideration of US$7.0 million held for the Block 07/03disposal in 2013, resulted in a gain on disposal of non-current assets of US$2.7 million(2013: US$3.6 million).
OPERATING CASH FLOWUS$
924million
CAPITAL INVESTMENTUS$
1,196million

Premier Oil plc 2014 Annual Report and Financial Statements / 51
RESOURCES
551mmboe
Balance sheet positionNet debt at 31 December 2014 amounted to US$2,122.2 million (2013: US$1,452.9 million),with cash resources of US$291.8 million (2013: US$448.9 million).
Net debt (US$ million) 2014 2013
Cash and cash equivalents 291.8 448.9Convertible bonds2 (228.5) (224.2)Other debt1,2 (2,185.5) (1,677.6)
Total net debt (2,122.2) (1,452.9)
1 Other debt includes €120.0 million of long-term senior notes, which are valued at year-end US$1.13:€ spot rate.These will be redeemed at an average of US$1.39:€ due to cross currency swap arrangements. It also includes£250.0 million of UK retail bonds and long-term bank financing which are valued at year-end US$1.56:£ spotrate. These will be redeemed at an average of US$1.64:£ due to cross currency swap arrangements.
2 The carrying amounts of the convertible bonds and the other long-term debt on the balance sheet arestated net of the unamortised portion of the issue costs of US$0.4 million (2013: US$0.4 million) and debtarrangement fees of US$27.4 million (2013: US$12.2 million) respectively.
Long-term borrowings consist of convertible bonds, UK retail bonds, senior loan notesand bank debt. Premier took advantage of the strength of the banking markets in thefirst half of 2014 to refinance its principal US$1.2 billion facility with a new, increased facilityof US$2.5 billion on improved terms with extended maturity to July 2019. The grouprepaid a US$300 million term loan in January 2015 which was due to mature in April 2015.
Premier does not have any significant debt maturities until late 2017 and all debt isunsecured. As at 31 December, cash and undrawn facilities stood at US$1.9 billion.
Financial risk managementCommodity pricesThe Board’s commodity pricing and hedging policy continues to be to lock in oil andgas prices for a proportion of expected future production at a level which ensures thatinvestment programmes for sanctioned projects are adequately funded. Whereinvestment requirements are well covered by cash flows without hedging, it is recognisedthat there may be an advantage, in periods of strong commodity prices, in locking in aportion of forward production at favourable prices on a rolling forward 12-18 month basis.
At year-end, 5.4 mmbbls of Dated Brent oil were hedged through forward sales for 2015at an average price of US$98.3/bbl. This volume represents approximately 50 per cent ofthe group’s expected liquids entitlement production in 2015. 84,000 mt of HSFO, whichdrives our gas contract pricing in Singapore, has been sold forward for 2015 at anaverage price of US$614.4/mt. These hedges cover approximately 13 per cent of ourexpected Indonesian gas entitlement production for 2015.
The year-end fair value on the commodity hedges was US$250.1 million (2013: lossUS$24.2 million), which is expected to be released to the income statement during 2015,as the related barrels are lifted.
During 2014, forward oil sales of 5.6 mmbbls, and forward fuel oil sales of 222,000 mtexpired resulting in a net credit of US$46.0 million (2013: US$0.8 million) which has beenincluded within sales revenue for the year.
Foreign exchangePremier’s functional and reporting currency is US dollars. Exchange rate exposures relateonly to local currency receipts and expenditures within individual business units. Localcurrency needs are acquired on a short-term basis. At the year-end, the group recordeda mark-to-market loss of US$6.0 million on its outstanding foreign exchange contracts(2013: gain of US$13.1 million). The group currently has £150.0 million retail bonds,€120.0 million long-term senior loan notes and £100.0 million term loan in issuance whichhave been hedged under cross currency swaps in US dollars at average fixed rates ofUS$1.64:£ and US$1.34:€.
Interest ratesThe group has various financing instruments including senior loan notes, convertiblebonds, UK retail bonds, term loans and revolving credit facilities. As at year-end, 56 percent of total borrowings is fixed using the interest rate swap markets. On average, thecost of drawn funds for the year was 4.4 per cent. Mark-to-market credits on interest rateswaps amounted to US$6.8 million (2013: credit of US$6.4 million), which are recordedas movements in other comprehensive income.
Cash balances are invested in short-term bank deposits and AAA rated liquidity funds,subject to Board approved limits and with a view to spreading counterparty risks.
CASH ANDUNDRAWN FACILITIESUS$
1.9billion
RESERVES
243mmboe

52 / Premier Oil plc 2014 Annual Report and Financial Statements
FINANCIAL REVIEW
cont
inue
d InsuranceThe group undertakes a significant insurance programme to reduce the potentialimpact of physical risks associated with its exploration, development and productionactivities. Business interruption cover is purchased for a proportion of the cash flowfrom producing fields for a maximum period of 18 months. During 2014, claimsamounting to US$20.5 million were agreed in relation to property damage and businessinterruption on the Chim Sáo gas export pipeline damage in 2013.
Going concernThe group monitors its funding position and its liquidity risk throughout the year toensure it has access to sufficient funds to meet forecast cash requirements. Cashforecasts are regularly produced based on, inter alia, the group’s latest life of fieldproduction and expenditure forecasts, management’s best estimate of future commodityprices (based on recent forward curves, adjusted for the group’s hedging programme)and the group’s borrowing facilities. Sensitivities are run to reflect different scenariosincluding, but not limited to, changes in oil and gas production rates, possible reductionsin commodity prices and delays or cost overruns on major development projects. Thisis done to identify risks to liquidity and covenant compliance and enable managementto formulate appropriate and timely mitigation strategies.
Due to the current weakness in oil and gas prices, the directors have reduced planneddevelopment and exploration expenditure for 2015, are implementing a series of costsaving initiatives to reduce both operating costs and general and administration spendand have identified a range of portfolio management opportunities to monetise certainof the group’s current development and exploration assets and to source additionalsources of financing.
At year-end, the group had significant headroom on its borrowing facilities and relatedfinancial covenants. The group’s forecasts and projections, which take into account theactions described in the preceding paragraph, also indicate that the company will beable to operate within the requirements of its existing borrowing facilities for 12 monthsfrom the date of approval of the Annual Report and Accounts. However, if there werefurther sustained falls in the oil price or if certain of the identified portfolio managementopportunities are delayed or cancelled, whilst forecasts indicate that the group’s liquiditywill remain strong, it is possible that management will need to request a temporaryamendment to the terms of one of its financial covenants. If the group’s on-going forecastswere to suggest that this would be required, management would take appropriate actionwith the support of its long-term banking relationships well in advance of such requirement,and management have no reason to believe that such support would not be forthcoming.The directors therefore continue to adopt the going concern basis in preparing thefinancial statements.
Business risksPremier’s business may be impacted by various risks leading to failure to achievestrategic targets for growth, loss of financial standing, cash flow and earnings, andreputation. Not all of these risks are wholly within the company’s control and thecompany may be affected by risks which are not yet manifest or reasonably foreseeable.
Premier’s risk management process and identified principal risks for the next 12 months aredescribed on pages 22-25.

Premier Oil plc 2014 Annual Report and Financial Statements / 53
CORPORATE RESPONSIBILITY REVIEW
A. PRINCIPLES AND STANDARDSAS AN INTERNATIONAL UPSTREAM OIL AND GAS COMPANY, PREMIERRECOGNISES THAT OUR SOCIAL, LEGAL AND POLITICAL LICENCE TOOPERATE HAS TO BE EARNED THROUGH A CONSISTENT TRACK RECORDOF RESPONSIBLE AND EFFECTIVE PERFORMANCE. WE ARE GUIDED INTHIS RESPECT BY A RANGE OF INTERNAL AND EXTERNAL PRINCIPLES ANDSTANDARDS, WHICH ARE SET OUT BELOW:
INTERNAL //
ValuesOur core values are the guiding principles that underly our behaviours and activities,and are reflected in our policies and procedures. They are:
Premier Oil Values
Vision and strategyOur vision is to be a world-class upstream independent.
Our strategy is to grow shareholder value by leveraging our development capabilitiesand balance sheet to deliver high quality projects while maintaining exposure to upsidefrom successful exploration. A responsible approach to our workforce, local communities,business partners, host governments and wider society underpins the achievement ofour strategy in the medium and long-term.
Our approach to these stakeholders is summarised in our overarching CorporateResponsibility Policy, which is supported by the following policies on specific aspects:
• Global Code of Conduct
• Health, Safety, Environment and Security Policy
• Community Investment Policy
• Human Rights Policy
In addition corporate responsibility-related risks are subject to our Risk ManagementPolicy and associated risk management system. This includes our newly developed andintegrated ARROW1 risk management tool.
Spirit
Heart
Foundation
Tenacity
Creativity
Dynamism
Professionalism Respect
1 Analysis and Reporting – Risk Online Workbench.
54 / Premier Oil plc 2014 Annual Report and Financial Statements
CORPORATE RESPONSIBILITY REVIEW
cont
inue
d
B. MATERIALITY
EXTERNAL //
Premier is an active participant in the following initiatives:
• United Nations Global Compact (UNGC) – an initiative for business that aims to align theiroperations and strategies with 10 key principles relating to human rights, labour, the environmentand anti-corruption: www.unglobalcompact.org
• International Association of Oil & Gas Producers (IOGP) – which promotes safe, responsible andsustainable operations in the oil and gas industry and supports the identification and sharing ofbest practice across a range of areas, including health, safety, the environment, security, socialresponsibility, engineering and operations: www.iogp.org
• International Petroleum Industry Environmental Conservation Association (IPIECA) – whichsupports the oil and gas industry to continuously improve its operations and products, to meetsociety’s expectations for environmental and social performance: www.ipieca.org
Premier Oil also applies the following external standards:
• The OHSAS 18001 occupational health and safety management system standard and ISO 14001environmental management system standard. These are applied to all Premier operatedproduction assets (Balmoral, Anoa, Gajah Baru and Chim Sáo) and our global drillingoperations. Chim Sáo is currently going through the assessment phase for these standards:www.bsigroup.com and www.iso.org
• Voluntary Principles on Security and Human Rights (Voluntary Principles), which Premier joinedin May 2014: www.voluntaryprinciples.org
• Global Reporting Initiative (GRI) G4 Sustainability Reporting Guidelines (G4 Guidelines), whichwe are applying for the first time in 2014/2015: www.g4.globalreporting.org
In addition, we are in the process of implementing the UN Guiding Principles on Business andHuman Rights, including relevant due diligence requirements.
Materiality ProcessOur formal, systematic Materiality Process is based on a series of iterative assessments using acommon, quantitative scoring framework. It draws on a range of internal and external documentarysources as well as internal and external engagement with relevant discipline experts, managers andother stakeholders. The criteria applied in this process include:
• The actual or potential ability of Premier to impact on stakeholders; and
• The actual or potential ability of stakeholders to impact upon Premier’s business.
IN LINE WITH THE G4 GUIDELINES, PREMIER HAS CARRIED OUT AN EXTENSIVEEXERCISE TO ASSESS AND PRIORITISE ITS MATERIAL CORPORATE RESPONSIBILITYISSUES. THIS PROCESS AND ITS OUTCOMES HAVE DIRECTLY INFORMED THEDEVELOPMENT OF OUR 2014 CORPORATE RESPONSIBILITY REPORT.

Premier Oil plc 2014 Annual Report and Financial Statements / 55
2. Engagement withdiscipline expertsand functionalmanagers tounderstandoperatingcontexts andapplicable issues
3. Prioritisation of allGRI G4 Aspectsapplicable toPremier
4. Refinement of theprioritisation of allGRI G4 Aspects in light of: (a) Internal
feedback,includingbusiness unitperceptions of localstakeholderissues
(b) Externalfeedback from a dedicatedStakeholderForum
5. Development of the finalMaterialityAssessment,including theconsolidation of individual GRI G4 Aspectsinto higher-levelcorporateresponsibility‘Issues’
MATERIAL ISSUES
Governance and ethics
Occupational healthand safety
Asset integrity andprocess safety
Emergencypreparedness
Environment (General)
Climate change andGHGs
Pollution prevention
Workforce
Training anddevelopment
Employee engagement
Generating valuefor communities
Human rights
Public policy andgovernment relations
Economic contributions
NON-MATERIAL ISSUES
Supply chainmanagement
Market behaviour
Customer impacts
General grievancemechanisms
Product responsibility
Resource use
Biodiversity
Community impacts
Child/forced labour
1
2
3
4
5
6
7
8
9
10
11
12
13
14
16
17
18
19
20
21
22
23
15
2
3 4
8
7
9
1311
14
16
17
12
19
20
21
22
23
1. Initial analysisincluding:(a) Internal review
of Premier’sprevious and currentcorporateresponsibilityissues
(b) External reviewof issues facingthe oil and gas sector and Premier’shost societies
Impact on Premier Oil
Impa
ct o
n st
akeh
olde
rs
Hig
hLo
w
High Low
16
110
18
5
Each step of this process is illustrated below:
Materiality Process
Materiality resultsThe overall results of the Materiality Process can be seen in the matrix below. We use materiality as a basis forour annual corporate responsibility reporting. Presentation of an issue as ‘non-material’ on this matrix doesnot mean it is irrelevant or that it is not managed by Premier.
Premier Oil corporate responsibility materiality matrix
Although this process demonstrated that many of Premier’s most material issues have already been integratedinto previous rounds of corporate responsibility reporting and assurance, it will result in increased emphasisbeing given to a range of issues, including (for example):
• Governance and ethics, including internal and external corruption risks
• Social impacts, including our overall economic impacts on the societies in which we operate
• Supply chain risks and impacts, including around human rights
• Strategic, long-term carbon emissions targets, including anticipated regulatory and economic pressures
• Public policy and government relations, including key policy issues such as resource nationalism and areasof disputed sovereignty
In addition, the process has highlighted the non-material nature of community impacts for Premier, given theoffshore nature of its operated assets. Nonetheless, we are determined to have a positive impact in thesocieties in which we operate and supplementary details around some of our new and on-going communityinvestment initiatives are set out below.
15

56 / Premier Oil plc 2014 Annual Report and Financial Statements
C. HIGH-LEVEL MATERIAL ISSUESAN EXAMINATION OF OUR HIGH-LEVEL MATERIAL SUSTAINABILITY ISSUES, INCLUDINGAN EXPLANATION OF WHY THEY ARE MATERIAL, HOW WE MANAGE THEM AND OURKEY PERFORMANCE INDICATORS, ARE SET OUT BELOW (FURTHER DETAIL WILL BEFOUND IN OUR 2014 CORPORATE RESPONSIBILITY REPORT):
MATERIAL ISSUE: GOVERNANCE• Why this issue is material: Good governance
provides a framework that allows the rightdecisions to be taken by the right people atthe right time. Good governance underpinsthe entire scope of our business and ourability to act in a way that is not only legallycompliant but which is also responsible. Weare committed to transparency, responsibilityand compliance in all of our business activities.
• How we manage this issue: Our CorporateResponsibility Policy is owned and promulgatedby our Board whilst its supporting policies areowned and implemented by our ExecutiveCommittee. These supporting policies includePremier’s Business Ethics Policy and ouractivities in this respect are governed by ourGlobal Code of Conduct (the Code), whichapplies to all Premier employees and thoseassociated with Premier (such as consultants).The Code is available in both English andBahasa Indonesia for those employees andcontractors based at our operations inIndonesia, and supplementary explanatorymaterial is available in Vietnamese for ourstaff in Vietnam. The Code is compliant withthe United Kingdom Bribery Act and covers:
• anti-corruption• facilitation payments• gifts and hospitality (given and received)• charitable and political donations• appointment of intermediaries
Prospective key contractors are evaluated toensure that they have similar policies andprocedures. The Code requires all transactionsrelating to Premier to be recorded in properdetail with appropriate supporting evidenceand in accordance with applicable accountingand reporting standards. Any breach of theCode will result in disciplinary action and, inextreme cases, will result in instant dismissal.The Audit and Risk Committee assists theBoard in monitoring adherence to the Code,which is supported by a comprehensive,company-wide training programme.
Training and monitoringEach of our business units is analysed forrisks relating to corruption, some being moreexposed than others depending on geographyand area of activities. We aim to provide allemployees with training on the Code within onemonth of their induction and thereafter on anannual basis. Training (which takes account oflocal nuances and cultural norms) is deliveredthrough interactive workshops and onlinemodules. In 2013, all employees receivedinduction or refresher training on the Code.In 2014, all new employees went throughthe induction training, but a number of dataprocessing and procedural issues resulted inreduced uptake of refresher training. We areimplementing remedial measures to addressthese challenges. We are confident (followingreviews at our major business units) that allemployees directly exposed to significantbusiness ethics risks are appropriately trainedand compliant with the Code. In addition,we give embedded consultants access to theonline training modules.
Whistle-blowing hotlinePremier encourages employees, contractors andagency workers to voice their concerns to linemanagers if they think the company or anyoneworking on behalf of the company has not actedin accordance with the Global Code of Conduct.Premier provides a confidential and wellpublicised independent third party reportinghotline for employees who feel unable to raiseconcerns via other procedures. This hotline isavailable 24 hours a day, seven days a week.One report was made through this service in2014. A full independent investigation resultedin no material adverse findings. No materialincidents of corruption or non-compliance withthe Code were identified in 2014.
>
CORPORATE RESPONSIBILITY REVIEW
cont
inue
d

Premier Oil plc 2014 Annual Report and Financial Statements / 57
• Why this issue is material: As an offshore oiland gas operator, health and safety isparamount given the risks associated withand involvement in potentially hazardousactivities and operating environments. This isnot only due to the potential human impactson employees and contractors, but alsothe importance we attach to operationalcontinuity, environmental performance andreputation amongst our employees, businesspartners, government partners and investors.
• How we manage this issue: Premier iscommitted to operating responsibly in orderto ensure the safety of everyone involved in our operations and to protect theenvironment. We will never knowinglycompromise our health and safety standardsto meet operational objectives.
• Premier’s HSES Policy sets out ourcommitment to operating responsibly and issupported by our HSES ManagementSystem which contains a comprehensive setof procedures and standards. These includeour Golden Rules designed to help addressthe most common causes of serious incidentsat oil and gas facilities. The overall HSESManagement System is subjected to internaland external review, including externalcertification to OHSAS 18001 for productionand drilling.
MATERIAL ISSUE: OCCUPATIONAL HEALTH AND SAFETY• We recognise that our business activities
have the potential to cause major accidentsand we are committed to managing ouroperations to prevent them. We seek toprovide a high level of protection to ouremployees, contractors, visitors, neighboursand the environment and believe that allmajor accidents are preventable. We carryout regular reviews of our operations toidentify major accident potential and to driveimprovements to achieve this objective.
• HSES performance targets are monitored,measured and reported on an on-going basisto the Executive Committee and to the Board.
Safety by design: Premier has integratedprocess safety protocols into the projectsafety reviews (PSRs) of all projects. Thesereviews, carried out at each project phase,provide assurance that material HSE issueshave been identified and are being effectivelymanaged throughout the project. A typicalproject will require six strategic reviews as it moves from concept to construction and then to operation. PSRs are aligned withour project approval gates, at which timestrategic decisions are made either toprogress a project further towards theoperations stage, or to delay or divest. SafetyCases are in place at all our operatedinstallations. Our Safety Case regime isconsistent with UK regulatory standards. Ouroperating assets are reviewed every 5 yearsto ensure continued compliance. SafetyCases are reviewed either by the localregulatory authority or by a competentindependent third party.
>
Key indicators – Health and Safety
Material Safety Parameters and Indicators 2012 2013 2014
Fatalities – – 2Lost Work Day Cases 5 18 7Restricted Work Day Cases 2 5 2Medical Treatment Cases 4 17 5Total Recordable Injury Rate (per million man-hours) 1.8 3.4 1.5High Potential Incidents (HiPo) Rate (per million man-hours) 1.3 0.7 1.0
2012 2013 2014
Total man-hours (million) 6.1 11.7 10.8

58 / Premier Oil plc 2014 Annual Report and Financial Statements
CORPORATE RESPONSIBILITY REVIEW
cont
inue
d
MATERIAL ISSUE: ENVIRONMENT• Why this issue is material: As with health and
safety, the environmental risks associatedwith offshore oil and gas operations arecontinuously assessed and managed.Furthermore, they pose a material risk forPremier itself due to both the potentialimpacts that environmental incidents mayhave on our corporate reputation and the riskof non-compliance with our contractual andregulatory environmental obligations.
• How we manage this issue: This issue is managed through Premier’s HSESManagement System which defines thesystematic approach to environmentalmanagement throughout the lifecycle of our operations and projects. The ISO 14001environmental management system standardis applied to and independently audited atall of Premier’s operated production assets(Balmoral, Anoa, Gajah Baru and Chim Sáo)and our global drilling operations. Chim Sáois currently going through the assessmentphase for this standard.
>
• Total Recordable Injury Rate (TRIR): Our TRIRperformance included one contractor fatalitywhich occurred as a result of an offshorevessel collision and one third party fatalityas a result of a road traffic accident on apublic highway. Both incidents occurred inSouth East Asia. No blame was attached toPremier in either case but we have takenadditional steps to reduce the risk of theseincidents recurring. Despite these regrettableincidents, the overall improvement in TRIRperformance reflect continued managementfocus on occupational health and safety,particularly in our core operated assets, anda reduction in typically higher-risk contractedconstruction work, as well as a transfer toless hazardous forms of construction work onkey projects.
• High Potential Incidents (HiPos) are a leadingindicator of potential major accidents andserious injuries. The recording and reportingof HiPos allow us to learn how to prevent ormitigate future significant incidents. Thisinvolves addressing the root causes ofthese incidents. The assessment of HiPoscomplements the proactive testing of assetintegrity safety systems and managementunder our Safety Case regime (see above).
• There was a slight increase in the HiPo rate(per million man-hours) during the reportingcycle. A total of 11 HiPos were recorded in2014 compared to the nine reported in 2013.This increase can at least partly be attributedto improvements in our reporting processand quality of investigations.
• All 11 HiPos identified in 2014 were investigatedin depth. Corrective actions were identified and implemented. Any lessons learnt werecommunicated across the organisation throughour safety alerts programme.
• Process Safety performance: One way ofrecording process safety events is throughthe measurement of loss of primarycontainment (LOPC). Premier has continuedto work with IOGP to harmonise processsafety performance measurement across the industry. There were no Tier 1 (gas over500 kg, oil over 1000 kg per hour) or Tier 2(gas over 50 kg, oil over 100 kg per hour)LOPC incidents recorded for 2014, reflectingthe further development and group-wideimplementation of the Process SafetyManagement System. We record all losses of primary containment irrespective ofvolumes released, however we report onlylosses over a severity threshold as defined inIOGP Guidance Report 456.
2012 2013 2014
LOPC events > 1 kg 20 12 11

Premier Oil plc 2014 Annual Report and Financial Statements / 59
Climate change and greenhouse gas emissions• In 2014, total Scope 1 GHG emissions1
associated with hydrocarbon combustion at Premier-operated facilities amounted to 947,724 tonnes (2013: 958,566 tonnes),a year-on-year decrease of 1.1 per cent.This reflected:
– A substantive reduction in flaring at ChimSáo (following significant investmentin the upgrading of its boilers andother technological interventions todecrease the need for flaring), leading toa 30 per cent reduction in averageemission intensity
– A 224 per cent increase in emissions fromdrilling, largely due to increased projectdevelopment
• Premier’s operated production assets’emissions intensity decreased from 288 tonnesper thousand tonnes of production in 2013 to242 tonnes in 2014. As noted above, thisreduction reflects significant investment inreducing flaring at Chim Sáo.
• As well as monitoring GHG emissions from ouroperated assets, we calculate emissions on anequity basis for production across our globalportfolio. GHG intensity from flaring and fuelgas combustion associated with our full equityportfolio amounted to 212 tonnes per thousandtonnes of production (2013: 214 tonnes).
• In 2014, energy consumption at our key officeswas approximately 2,174,650 kilowatt hours(equivalent to 979 tonnes of CO2 emissions).
Spills and discharges• We maintain oil spill contingency plans for each
of our operations and have on-going contractswith oil spill response specialists to providesupport in the unlikely event of a major incident.
General environmental management(estimated expenditure on goods and servicesthat support the protection of the environment):
In 2014 we spent US$170,385 on communityinvestment programmes focused onenvironmental conservation. Whilst we trackthese costs we don’t separately account forenvironmental expenditure, although as anoperating E&P business, we do spend significantsums on environmental management. Spendingon our operated assets includes emissionscontrol equipment, maintenance, operatingmaterials and services, and related personnel.Across the wider business we spend on areasincluding environmental education and training;exercises to test response procedures suchas those in the event of an oil spill; andexternal costs including those for certificationof environmental management systems. In 2015we will consider the scope for expanding ourcost reporting to more fully track our operationalenvironmental expenditure.
• Under the HSES Management System,on-going environmental and social impactassessment, monitoring and reporting takesplace at all our operations to ensure wereduce our impact to a level that is as lowas reasonably practicable. We report ourenvironmental performance in line with theIPIECA Oil and Gas Industry Guidance onVoluntary Sustainability Reporting (2010) andthe GRI Sustainability Reporting Guidelines.Our greenhouse gas (GHG) emissionsperformance is benchmarked against an
industry database compiled and publishedby the IOGP. As an oil and gas company withproduction facilities in the North Sea, wecomply with the European Union EmissionTrading Scheme and submit an annual,externally-verified report on our emissionsprofile to the United Kingdom Departmentof Energy and Climate Change. We alsoparticipate in the Carbon Disclosure Projectand comply with requirements of the recentlyintroduced UK Energy Saving OpportunityScheme (ESOS).
Key indicators – Environment
Material Environmental Indicator 2012 2013 2014
GHG intensity (tonnes/1000 tonnes of production) 242 288 242Oil spills (tonnes) 0.8 0.1 0.2Oil in produced water (ppm-wt) 10.0 11.3 9.0Energy consumption (GJ/tonne of production) 2.0 1.9 2.2
1 i.e. combustion emissions; flaring and venting; significant stationary sources; and significant mobile sources.

60 / Premier Oil plc 2014 Annual Report and Financial Statements
CORPORATE RESPONSIBILITY REVIEW
cont
inue
dMATERIAL ISSUE: EMPLOYEES• Why this issue is material: Like any company,
our ability to recruit, retain, develop andmotivate high-quality, skilled employees andcontractors is vital to the on-going success ofour business. This is particularly the case inthe highly mobile, international oil and gasemployment market where competition forthe right kinds of technical and managementskills is strong. Premier seeks to treat thosewho work for the company fairly, to encourageprofessional development and to appropriatelyreward high calibre performance.
• How we manage this issue:Human Resourcesissues are addressed by a number of Premier’spolicies. As well as those contained in theHuman Resources Management System,these include the overarching CorporateResponsibility Policy, the Human Rights Policyand the Global Code of Conduct.
• Premier is committed to providing staff withfair and competitive terms of employmentand safe working conditions. We are an equalopportunities employer. This entails respectingindividuals regardless of race, creed, colour,nationality, ethnic origin, age, religion orbelief, gender, sexual orientation, maritalstatus or disability.
• When recruiting, developing and dealingwith employees and service providers, we willtreat people fairly, equally and withoutprejudice. This sentiment is embedded in ouremployment policies, which apply to allpermanent, contractual and temporary staff,and job applicants. We also respect the rightof individual employees to join a legitimatetrade union. Through training (both internaland external) and appraisal, we encouragestaff to develop their own professional skillsto the advantage of both the individual andthe company. During 2014, we continued toimplement a suite of updated HR tools,policies and processes to facilitate employeerecruitment, development and retention.
• There were no reported violations of ouremployment policies in 2014. There were alsono reported incidents of discrimination. Oneformal grievance was received and actioned.
>
Company demography
Gender Age
Country Male Female 18-30 31 – 50 >50 Total
Falkland Islands 39 17 9 29 18 56Indonesia 407 67 48 357 69 474Norway 22 10 4 19 9 32Brazil 3 3 4 2 6Pakistan 13 1 1 11 2 14Singapore 6 9 1 9 5 15United Kingdom 163 86 49 129 71 249Vietnam 35 46 14 61 6 81
Total 688 239 126 619 182 927(13.6%) (66.8%) (19.6%) (100%)
Composition of seniormanagement (definedas Gd5 and above) 94% 6%

Premier Oil plc 2014 Annual Report and Financial Statements / 61
Key indicators – Employees
ChangeMaterial issue Premier Oil metric 2012 2013 2014 in 2014 Comments
Workforce Number of 816 / 42 8801 / 67 927 / 91 +0.05% The slight increase inemployees at end / +36% employee numbers of year / turnover reflects existing and new during the year project activity, partly
staffed by employees butsignificantly supported byspecialist contractors ona term basis. Employeeturnover trend isincreasing but will havebeen impacted bynegative job marketconditions in late 2014.
Employee Diversity of Upward Growing and engagement communications trend predominantly positive
channels on feedback from staff topics of across the group.employeeinterest
Training and Average hours 48 25 30 +20% Induction of new development of training employees, HSE and
per employee emergency responsetraining, continuousprofessional development.
Workforce Annual graduate n/a 5 6 +20% An important componententry programme of refreshing our workforce.intake
1 Restatement: Effective 3 December 2013, 73 contractors in our Indonesia BU were retrospectively re-classified asfixed-term employees.
• Why this issue is material: The offshore natureof our operations means that communityrelations are not as critical an issue for Premieras for onshore extractive companies.Nonetheless, it remains important due to:
(a) The impact of our activities on local fishingcommunities as well as our reliance oncertain onshore communities as transit andlogistics points for our offshore operations;
(b) The important role that our communityinvestment activities play in terms of ourwider reputation and social licence tooperate with key stakeholders includinglocal employees and host governments;
(c) The impact of our onshore exploration anddevelopment activities in countries such asIraq, Kenya and Pakistan and the potentialfor our future establishment of onshoreoperations in socially-sensitive areas.
MATERIAL ISSUE: COMMUNITY RELATIONS• How we manage this issue: This issue is
addressed by Premier’s Community InvestmentPolicy, which is applied through the broaderCommunity Investment Management System.Amongst other things, the CommunityInvestment Policy commits Premier toengaging transparently with all stakeholders,treating neighbours with respect and workingto have a positive socio-economic impact onlocal communities. In this context, theCommunity Investment Management Systemsupports the systematic identification,management, evaluation and budgeting ofdisbursements and interactions in hostcountries. In order to more accurately reflectthe financial contribution Premier makes tolocal communities, we are analysing theproportion by value of key contracts withlocal suppliers and plan to make appropriatedisclosures in future reports.
>
Increasing activity overgrowing variety of channels– weekly team meetings,corporate intranet, ExComember VLogs, BU TownHall meetings.

62 / Premier Oil plc 2014 Annual Report and Financial Statements
MATERIAL ISSUE: SOCIETY• Why this issue is material: Premier’s activities
and relationships have the potential toimpact a wide set of stakeholders. Likewise,these stakeholders have the potential toimpact Premier’s business. Such impactsincluding those relating to human rights,government policy and economic valuecreation can take place not only at a locallevel, but also at a national level. In this context,it is important for Premier to minimise anyadverse impact it could otherwise have onthe rights and wellbeing of its host societies,to work constructively with government andto demonstrate its value to the societies itoperates in.
• How we manage this issue:Our interactionswith society are managed through a numberof policies (and associated managementsystems) including our overarching CorporateResponsibility Policy, Code of Conduct,Human Rights Policy and Risk ManagementPolicy. They are also guided by broadersocietal norms and standards, including the Universal Declaration of Human Rights,the UN Guiding Principles on Business and Human Rights, international law andgeneral societal expectations, all of which aretaken into consideration in our planning anddecision making.
Human RightsPremier’s Human Rights Policy explicitly recognisesthe moral, reputational and operational value ofrespecting and promoting human rights, bothinside and outside our company. The Policyaddresses the rights of our employees as well asour external stakeholders, in particular the localcommunities where we work.
Our Human Rights Policy commits us to:
• engage with stakeholders in our efforts torespect and promote these rights
• recognise the development and cultural rightsof local communities as basic human rights
• recognise our responsibility to respect therights of indigenous peoples in all countrieswhere we operate
• help prevent, manage and resolve conflictwhere we are in a position to do so
• ensure we are in no way involved or associatedwith the issue of forced, involuntary orchild labour
• ensure our security practices do not underminethe human rights of local communities
• encourage joint venture partners to adoptthe principles in this policy
• consider withdrawal from relationships withbusiness partners where there is no evidencethat they are moving towards the applicationof international human rights standards
• use our legitimate influence to promotehuman rights outside our areas of operation
There were no reported violations of our HumanRights Policy in 2014.
>
CORPORATE RESPONSIBILITY REVIEW
cont
inue
d Key indicators – Community relations
ChangeMaterial issue Premier Oil metric 2012 2013 2014 in 2014 Comments
Generating Community 0.67 1.15 1.06 (8%) Performance reflects value for investment spend general fluctuations in communities (US$ million) project spending with
more material reductionsexpected in 2015.Please note, communityinvestment spend isalso included withinthe ‘Economic valuedistributed’ indicatorin the ‘Key indicators– Society’ table below.

Premier Oil plc 2014 Annual Report and Financial Statements / 63
Public policy and government relationsManaging our relations with governmentOur host country governments represent someof our most important stakeholders, in terms ofpolicy, legislation and the awarding of newlicences. Public policy and government relationsare key areas of focus for our stakeholderengagement activities.
Each of our Business Units is responsible atfunctional level for regular operational engagementwith host governments and regulators. For morestrategic issues, local engagement will take placethrough our corporate Business Unit Managers.All engagement is carried out in line withPremier’s applicable policies, including itsCorporate Responsibility Policy, Code ofConduct and Human Rights Policy. Licence bidsare directly made to governments by ourExploration Business Unit, with appropriatesupport from our corporate office.
In 2014, Premier did not:
• Make any party political donations orcontributions
• Receive any significant financial assistancefrom government1
• Have any direct government shareholders
Premier is a member of a number of bodiesthat use their legitimate influence to lobbygovernments on issues affecting the oil and gassector. These include the following organisations:
• Association of British Independent Oil andGas Exploration Companies
• Falkland Islands Petroleum LicenceesAssociation
• Indonesian Petroleum Association
• IOGP
• Oil & Gas UK
• Pakistan Petroleum Exploration and ProductionCompanies Association
Economic contributionsOur strategy and legal obligation is to generatevalue for our shareholders. We believe we canbest achieve this is by operating in a way thatdelivers tangible mutual benefits both toPremier’s shareholders and its broaderstakeholders, including:
• Host governments who give us access tooil and gas licences and regulate ouroperational activities
• Host societies who give us our sociallicence to operate as we extract nationalhydrocarbon resources and responsiblyundertake activities that have the potential toimpact on the environment
• Employees who ultimately underpin our abilityto operate and create value
Any failure to deliver value to these keyactors would ultimately undermine our corebusiness objectives.
Managing our economic contributionsWe believe our host societies should benefitfrom the extraction of finite natural resources andwe are proud of our role in generating sharedvalue from national oil and gas reservoirs.Much of this value stays in our host societies,directly supporting long-term socio-economicdevelopment and helping ensure our long-termsocial licence to operate.
Our most important means of distributingeconomic value are through:
• Payments to other businesses, includinglocally-based service contractors and suppliers
• Payments to our workforce, includingwages and benefits for employees from ourhost countries
• Payments to our providers of capital, includingshareholder dividends and interest on debt
• Payments to government, including cashtaxes, royalties and other payments to ourhost governments2
• Community investment spending
In 2014, our total economic value distributionamounted to US$1,035.1 million.
As part of its efforts to maximise the amount ofvalue staying with host societies, and in line withrelevant local content requirements, Premierseeks to:
• Employ nationals where they are suitablyqualified and support the build-up ofsustainable local skills-bases in all ouroperating locations
• Use host country service contractors andsuppliers where they are able to meet ouroperational and economic requirements
1 This includes (notwithstanding the application of general national fiscal frameworks) any exceptional and significant taxrelief/credits, subsidies, investment grants, awards, royalty holidays, financial support from export credit agencies and otherfinancial benefits from any government.
2 Currently, only Norway is a member of the Extractive Industries Transparency Initiative (EITI) – whilst the United Kingdom is acandidate and Indonesia’s membership has been suspended, Premier is not currently a member of the EITI.

IN 2014, PREMIER UNDERTOOK A RANGE OF COMMUNITY INVESTMENTPROJECTS, BOTH NEW AND ON-GOING. SOME EXAMPLES OF THESE PROJECTSARE SET OUT BELOW.
ContextOperation Wallacea is an organisation whichoversees biological and conservationmanagement research programmes in a rangeof international locations. It brings togethermulti-disciplinary academic teams at targetstudy sites giving them the opportunityto establish best practice managementmodels and to establish biodiversity andsocio-economic data sets to support effectiveconservation management programmes.
Actions in 2014Premier received a number of newundergraduate enquiries following our 2013sponsorship of two Operation Wallaceaparticipants to undertake field research inthe Wakatobi Marine Park in Indonesia.In response, Premier established an annualbursary to provide financial support to upto 10 United Kingdom based undergraduatestudents participating in Operation Wallacea’sprogramme in Indonesia. The bursary isintended to support beneficiaries as they seekadditional sources of funding rather thanpaying for their participation in its entirety. In2014, Premier also responded to a request fromthe Fortismere School in London to providefinancial support for its sixth-form students toparticipate in the Operation Wallacea fieldresearch programme in Indonesia.
ImpactsIn 2014, 10 undergraduate participants fromacross the United Kingdom were given£1,000 bursaries to carry out both land basedresearch in the Lambusango jungle reserve ofButon and marine research on the island ofHoga in the Wakatobi National Park in Sulawesi(which is particularly rich in coral life). Thisincluded participation in scuba diving training,a coral reef ecology course, coral reefmonitoring, biodiversity measurement and birdresearch. Data gathered by the participants wasmade available to both the IndonesianGovernment and Wakatobi National Parkofficials. This will help the authorities focus theirconservation efforts on the most vulnerableand/or worst affected areas both at land andsea. In addition to the undergraduateprogramme, a total of 32 sixth form studentsfrom the Fortismere School joined theprogramme for two weeks: www.opwall.com
PROJECT: OPERATION WALLACEA – UNITED KINGDOM/INDONESIA
STUDIES
64 / Premier Oil plc 2014 Annual Report and Financial Statements
D. KEY COMMUNITY PROJECTS
IN 2014
CORPORATE RESPONSIBILITY REVIEW
cont
inue
d

ContextPremier has been involved in a majorconservation project in the Margalla HillsNational Park to the north of Islamabad since2010 (known as Phase 1). The park, which sits inthe foothills of the Himalayas, covers 67 squaremiles and is run as a public-private partnershipinvolving the Himalayan Wildlife Foundationand the Capital Development Authority (CDA).Since 2010, the project has enhanced the park’seco-tourism facilities (through the constructionof hiking trails, a bike trail and a visitor centre),provided local vegetation management,supported research into (and the protection of)endangered species and provided water accessfor local people.
Actions in 2014In 2014, Premier contributed US$80,000 to thepartnership. This money was used to helpinitiate a major new phase in the developmentof the park. This phase focuses on five keyprojects, including: (1) the construction of anartificial wetland to naturally process localsewage; (2) the creation of a bird sanctuary onRawal Dam to protect migratory and otherwater birds; (3) awareness-raising and educationfor schoolchildren; (4) capacity building at theCDA; and (5) the management and maintenanceof existing trails.
ImpactsThe Margalla Hills National Park developmentproject achieves two major environmentalbenefits. The first is the conservation of thefauna and flora of this biodiversity rich area,which includes subtropical pine forest, tropicaldeciduous and thorn forest, as well as indigenousspecies that migrate from snowbound areas tothe north to take shelter in the park’s vegetatedslopes and gorges during winter. The second isto open up the area – the only national parkwithin access of Islamabad – to local people,ensuring they can enjoy the recreational andeducational opportunities offered by the facilityin a sustainable way. As such, the project willhelp preserve local biodiversity and ecosystemswhilst also providing the whole of Islamabadwith a much loved escape from the city formany years to come: www.cda.gov.pk
PROJECT: PHASE 2 OF THE MARGALLA HILLS NATIONAL
PARK DEVELOPMENT PROJECT, PAKISTAN
ContextSoc Trang province in the Mekong Delta playsan important role in national agricultural andaquaculture production, both of which providelivelihoods for local communities. A narrowmangrove belt helps protect inshore landsfrom flooding and storm damage, whilstsequestering carbon emissions and enrichingthe natural ecology of the intertidal zone. Themangroves face a number of threats, includingrising sea levels as a result of climate change,flooding and economically driven deforestation.
Actions in 2014Premier built on its existing partnership with theVietnam Red Cross to plant and cultivate newmangroves in the province by contributingUS$75,000 and providing management support.
ImpactsPremier’s 2014 contributions supported theplanting of an additional 20 hectares ofmangroves (equivalent to around 120,000trees), adding to the 20 hectares of plantingthat Premier supported in 2013. Theseadditional mangroves will help ensure the localcoastline is protected from future erosion andwill enhance aquaculture harvests for localcommunities. Furthermore, they are contributingto a wider multi-stakeholder programmeinvolving local and national governmentagencies, including the Deutsche Gesellschaftfür Internationale Zusammenarbeit (GIZ)development agency, to promote integratedcoastal zone management. The programme isultimately aimed at balancing the need for localeconomic development with the sustainablemanagement of local natural resources:www.czm-soctrang.org.vn
PROJECT: EXPANSION OF THE SOC TRANG MANGROVE PROJECT, VIETNAM
Premier Oil plc 2014 Annual Report and Financial Statements / 65
The Strategic Report was approved by the board of directors on 25 February 2015 and signed on its behalf by:
Tony DurrantChief Executive

66 / Premier Oil plc 2014 Annual Report and Financial Statements
BOARD OF DIRECTORS
Robin AllanDirector, Business UnitsAge: 55Board tenure: 11 years 2 months
> Joined Premier in July 1986> Joined the board in 2003 as Director
of Business Development before beingappointed Director – Asia in 2009
> Returned to London in 2012 to takeup role as Director, Business Units
> Currently chairman of The Associationof British Independent Oil ExplorationCompanies (BRINDEX)
Independent = I
Committee MembershipAudit and Risk = ARemuneration = RNomination = N
Ages and board tenure are as at25 February 2015
David Bamford I, R, N
Non-executive directorAge: 68Board tenure: 9 months
> Joined Premier’s board as anon-executive director in May 2014
> Spent 23 years at BP in a variety oftechnical and exploration rolesincluding chief geophysicist, generalmanager for West Africa, and actedas vice president, exploration,directing BP’s global explorationprogramme from 2000 to 2003
> Joined Tullow Oil’s board as anon-executive director in June 2004and was senior independentdirector from 2012 to 2014, as wellas chairman of the remunerationcommittee, retiring at the end ofApril 2014
> He is currently a director ofPetroMall Ltd and Future EnergyPublishing Ltd
Anne Marie Cannon I, A, N
Non-executive directorAge: 57Board tenure: 1 year
> Joined Premier’s board as a non-executivedirector in February 2014
> 30 years’ experience in the energy andbanking sectors, including roles atThomson North Sea, Shell Exploration andProduction and J Henry Schroder Wagg
> Previously a senior advisor to the naturalresources group at Morgan Stanley focusingon upstream mergers and acquisitions
> Currently deputy chair of the boardof Det Norske Oljeselskap and anon-executive director of STV plc
> Previously held executive director roleson the boards of Hardy Oil and Gasand British Borneo and served as anon-executive director on the boardof Aker ASA
Jane Hinkley I, R, N
Non-executive directorAge: 64Board tenure: 4 years 5 months
> Joined Premier’s boardin September 2010 as anon-executive director
> Chairman of Premier’sRemuneration Committee
> Qualified charteredaccountant with executiveexperience primarily ininternational shipping
> Previously held roles withNavion Shipping AS,Gotaas-Larsen ShippingCorporation and RevusEnergy ASA
> Currently a non-executivedirector of Vesuvius plc, andan independent director onthe board of Teekay GP LLC
David Lindsell I, A, R, NNon-executive directorAge: 67Board tenure: 7 years 1 month
> Joined Premier’s board in January2008 as a non-executive director
> Chairman of Premier’s Auditand Risk Committee
> Partner at Ernst & Young LLPfor nearly 30 years, deputychairman of the FinancialReporting Review Panel,2008 to 2012
> Currently senior independentdirector of Drax Group plc andnon-executive director ofHellermannTyton Group plc
> Trustee and chairman of theaudit committee of CancerResearch UK and deputy chairof governors of the Universityof the Arts London
Andrew LodgeExploration DirectorAge: 58Board tenure: 5 years 10 months
> Joined Premier in April 2009as Exploration Director
> Previously vice president– exploration at Hess,responsible for Europe, NorthAfrica, Asia and Australasia
> Prior to Hess, worked atBHP Petroleum and BP
> Currently a non-executivedirector of Egdon Resources plc

Premier Oil plc 2013 Annual Report and Financial Statements / 67
Joe Darby I, A, R, N
Senior independentnon-executive directorAge: 66Board tenure: 7 years 5 months
> Joined Premier’s board asnon-executive director in 2007and is the senior independentnon-executive director
> 40 years of experience in energysector, including chief executiveof LASMO plc, non-executivedirectorships at Nordaq Energyplc, British Nuclear Fuels plc,Mowlem plc, Faroe Petroleumplc and Centurion Energy, Inc
> Currently non-executive directorof Alkane Energy plc andGulfsands Petroleum plc
Tony Durrant NChief Executive OfficerAge: 56Board tenure: 9 years 7 months
> Joined Premier in June 2005,becoming Finance Director inJuly 2005 and Chief ExecutiveOfficer in June 2014
> Qualified as a charteredaccountant with Arthur Andersen,joining the investment bankingdivision of Lehman Brothers in1987, going on to become amanaging director and headof the European NaturalResources Group
> Non-executive director andchairman of the audit & riskcommittee of GreenergyFuels Holdings Ltd
> Member of the advisorycommittee of FlowstreamCommodities
Neil HawkingsDirector, Falkland IslandsAge: 53Board tenure: 8 years 11 months
> Joined Premier in May 2005,after more than 20 years withConocoPhillips, working in avariety of engineering,commercial and managementroles around the world
> Joined Premier’s board inMarch 2006 as OperationsDirector, and appointedDirector, Falkland Islandsin January 2014
Michel Romieu I, A, N
Non-executive directorAge: 75Board tenure: 7 years 1 month
> Joined Premier’s board asnon-executive director inJanuary 2008
> Over 35 years of experiencein the international energysector, including 25 years withthe Elf Group
> Established own consultancyspecialising in providingadvice to gas industry andis a lecturer at the FrenchPetroleum Institute
> Currently president of Uprigaz
Richard RoseFinance DirectorAge: 42Board tenure: 5 months
> Joined Premier in September2014 as Finance Director
> Qualified as a charteredaccountant with Ernst & Youngand has spent over 20 years inthe energy sector, including13 years working with a rangeof international banks andbrokers in equity capitalmarkets and corporate finance
> Joined Premier from OphirEnergy where his roleencompassed strategy andhead of corporatecommunications
Mike Welton Independent on appointment, N
ChairmanAge: 68Board tenure: 5 years 8 months
> Joined Premier’s board in June 2009 asa non-executive director and becamechairman in October 2009
> Chairman of the Nomination Committee> Currently a director of Morrison
Utility Services> Sits on the advisory board of Montrose
Associates and Alexander Proudfoot> Previously chief executive of Balfour
Beatty plc, and chairman of SouthernWater Services Limited, Hanson plc,the Turkish/British Business Council andthe UK Government’s Railway SectorAdvisory Group
Gov
erna
nce

Compliance statementThis report, together with the Nomination Committee Report, the Audit and Risk Committee Report and the Directors’Remuneration Report, describes the manner in which the company has applied the main principles of governance set out in theFinancial Reporting Council’s (FRC) UK Corporate Governance Code of September 2012 (the Code) and complied with theindividual Code provisions. It is the Board’s view that the company has fully complied with the Code throughout 2014 save forthe following provision:
• B.1.2 which stipulates that at least half the Board, excluding the Chairman, should comprise non-executive directorsdetermined by the Board to be independent. Subsequent to the unexpected death of Professor David Roberts in July 2013,the balance of non-executive directors did not comprise half of the Board. Compliance with B.1.2 recommenced with theappointment of Anne Marie Cannon to the Board on 1 February 2014 and was further strengthened with the appointment ofDavid Bamford on 1 May 2014.
The UK Corporate Governance Code was updated by the FRC in September 2014 (the 2014 Code); it takes effect for accountingperiods beginning on or after 1 October 2014. The Board conducted a review of the company’s compliance with the 2014 Codein December 2014 and we will report our compliance against the 2014 Code in next year’s annual report.
Introduction from the Chairman
Dear Shareholder
Your Board is committed to the highest standards of stewardship and governance and aims to create a culture which demandsthe same commitment and performance in all our business activities.
Good governance provides a framework that allows the right decisions to be taken by the right people at the right time. Theinformation provided in this report, and in conjunction with the reports from each of the Board committees, will help you tounderstand how the company has been run, risks managed, controls monitored, and how key decisions have been taken overthe past year. This report also includes information regarding the Board and committee effectiveness review undertaken duringthe year and I am pleased to report on the outcomes and actions arising from the review below.
Mike Welton, Chairman
LeadershipThe Board, Board committees and management structure within the group is set out in the following diagram and explained infurther detail below:
68 / Premier Oil plc 2014 Annual Report and Financial Statements
CORPORATE GOVERNANCE REPORT
Chief Executive Nomination Committee
Considers Board andcommittee structure,
composition and successionplanning as well as oversightof succession planning and
development of seniormanagement.
Audit and Risk CommitteeMonitors the integrity ofthe company’s financial
statements and the overallfairness of the Annual Report
and Financial Statements,oversees the company’s
relationship with the auditorand assesses the effectivenessof the audit, and keeps underreview the effectiveness of thegroup’s risk management andinternal control systems andthe programme of reviews
coordinated by GroupAudit and Risk.
Remuneration CommitteeEnsures that there is an
appropriate reward strategyin place for executive
directors with the intentionof aligning their interests
with those of shareholders.This committee also
oversees reward strategyfor senior management.
Executive CommitteeSupports the Chief Executive
with the development andimplementation of group
strategy, management of theoperations of the group
including successionplanning, financial planning,risk management, internal
control, HSES and corporate responsibility.
Board of DirectorsThe Board provides leadership to the group with a view to delivering long-term valueto shareholders and other stakeholders. It sets the strategy and oversees its execution
within an agreed financial framework, ensuring that risk is appropriately managed.
Business Units
Projects
FunctionalOversight(London)
Board committee
Full reports from each of the Board committees areincluded in this Annual Report on pages 76 to 119.

Premier Oil plc 2014 Annual Report and Financial Statements / 69
The BoardThe role of the BoardThe Board is collectively responsible and accountable to our shareholders for the long-term success of the group. The Boardsets the company’s strategic objectives and ensures that they are properly pursued within a sound financial framework with majorrisks actively monitored and managed and with health, safety, environment and security (HSES) borne in mind at all times. Thisgoes beyond regulatory compliance and puts the interests of our shareholders at the heart of the Board’s decision-making.
As at 31 December 2014 the Board of Directors comprised the Chairman, Chief Executive Officer, four other executive directorsand six independent non-executive directors. On 1 February 2014 Anne Marie Cannon joined the Board as an independentnon-executive director. David Bamford joined the Board as an independent non-executive director on 1 May 2014.Biographical details of each director in service as at 25 February 2015, including membership of Board committees, are set outon pages 66 and 67 as well as in the notice of Annual General Meeting. In accordance with the Code, all directors stand forannual re-election by shareholders at each AGM. Details of the executive directors’ service contracts and the non-executivedirectors’ letters of appointment are laid out in the Policy Report of the Directors’ Remuneration Report.
Chairman and Chief ExecutiveThere is a clear division of responsibilities between the roles of the Chairman and Chief Executive, which has been agreed bythe Board and is set out in writing.
The Chairman’s role is part-time and he is a non-executive director. His key responsibility is the leadership of the Board,ensuring its effectiveness in all aspects of its role including maintaining effective communications with our shareholders.Between Board meetings the Chairman is responsible for ensuring the integrity and effectiveness of the Board/Executiverelationship. This is effected through meetings, as well as contact with other Board members, shareholders, joint venturepartners and host governments.
The Chief Executive is responsible for the day-to-day running of the group’s operations, for applying group policies includingHSES and for implementing the strategy agreed by the Board. He plays a pivotal role in developing and reviewing the strategyin consultation with the Board and in executing it with the support of the Executive Committee.
Non-executive directorsThe non-executive directors bring independent judgement to bear on issues of strategy and resource, including keyappointments and standards of conduct. The non-executive directors have a particular responsibility to challengeindependently and constructively the performance of executive management and to monitor the performance of themanagement team in the delivery of the agreed objectives and targets. In meeting this responsibility, the Chairman and thenon-executive directors meet periodically without the executive directors present, and the non-executive directors meet once ayear without the Chairman. The non-executive directors must also be satisfied with the integrity of the group’s financialinformation and with the robustness of internal control and risk management systems. The non-executive directors are alsoresponsible for determining appropriate levels of remuneration for the executive directors and have a key role in successionplanning, the appointment of and, where necessary, removal of executive directors.
We require that our non-executive directors are free from any relationship or circumstances that could materially interfere withthe exercise of their independent judgement. The Board considers each of the non-executive directors to be independent incharacter and judgement.
Non-executive directors are appointed for a specified term of three years subject to annual re-election and to Companies Actprovisions relating to the removal of a director. The terms and conditions of their appointment are made available forinspection. Letters of appointment set out an expected time commitment, and all non-executive directors undertake that theywill have sufficient time to discharge their responsibilities effectively and any significant other business commitments aredisclosed to the Board prior to appointment. Changes to such commitments are disclosed to the Board on an on-going basis.Where necessary to discharge their responsibilities as directors, directors have access to independent professional advice atthe company’s expense.

70 / Premier Oil plc 2014 Annual Report and Financial Statements
The Board (continued)Senior independent directorJoe Darby is the company’s senior independent non-executive director. He is available to shareholders who have concerns thatcannot be resolved through discussion with the Chairman, Chief Executive or other executive directors. The senior independentdirector is responsible for leading the annual appraisal of the Chairman’s performance and this is discussed further on page 72.
Company SecretaryThe Company Secretary is responsible for advising the Board, through the Chairman, on all governance matters. The CompanySecretary, under the direction of the Chairman, is responsible for ensuring good information flows within the Board and itscommittees and between senior management and the non-executive directors. The Company Secretary also plays a pivotal rolein facilitating the induction of new directors and assisting with the on-going training and development needs of Board membersas required. All directors have access to the advice and services of the Company Secretary, who is responsible for ensuring thatBoard procedures are complied with. The appointment and removal of the Company Secretary is a matter reserved for theBoard as a whole.
How the Board operatesThe Board has a structured programme of agendas for the year, ensuring all matters are considered during the year withsufficient time for discussion. The programme is structured to include: strategic issues, including setting the strategy andperformance in executing the strategy; finance matters; investor relations and corporate reporting; Board committee relatedactivity including matters requiring Board sanction; and corporate governance matters.
The Board meets at least six times each year and in addition an update conference call takes place in the months when noformal meeting is scheduled. The agenda for each Board meeting is set by the Chairman in consultation with the ChiefExecutive and the Company Secretary based on the annual programme with any additional matters included as and when theyarise. Board members receive a monthly report of the company’s activities which incorporates an update on progress againstobjectives and the management of business risks including HSES matters. During the year the Board held one of its meetingsoverseas to combine site visits with our operations in Singapore and Jakarta.
CORPORATE GOVERNANCE REPORT (continued)
Board composition**Board composition*
8%
50%42%
Non-executive chairman
Executive directors
Non-executive directors
*as at 25 February 2015
Length of tenure*
< 3 years
3 - 6 years
7 - 10 years
yea
6 ye
0 y
Length of tenure*
< 3 y
3 - 6
7 - 10 y
25%
50%
25%
Board experience*
Oil & Gas / Energy
Finance
Other industry
& Grgy
anc
er in
Board experience*
Oil & Ene
Fina
Othe
8%
33%
59%

Premier Oil plc 2014 Annual Report and Financial Statements / 71
How the Board operates (continued)A formal schedule of Matters Reserved for the Board can be found on the company’s website (www.premier-oil.com). The schedule is reviewed by the Board regularly. Key matters reserved for the Board are the consideration and approval of:
Corporate strategy • Overall direction and strategy of the business• New country and/or business entry• Acquisition or disposal of interests
Finance • Group debt and equity structure• Budget
Expenditure • Major capital expenditure and budgets• Development plans and projects• Major acquisitions
Risk management • Recognising high impact business risks and risk mitigating strategies• Internal control systems in respect of finance, operations and HSES
Corporate governance • The group’s corporate governance and compliance arrangements
Succession planning and appointments • Appointment and removal of directors and officers of the Board• Appointment and removal of external auditor, brokers and advisers to the company
Board committeesThe Board has established Audit and Risk, Remuneration and Nomination Committees. Each committee has formal terms ofreference approved by the Board which can be found on the company’s website (www.premier-oil.com). The Company Secretaryprovides advice and support to the Board and all Board committees. Board committees are authorised to engage the servicesof external advisers as they deem necessary.
The number of meetings of the Board and its committees during 2014, and individual attendance by directors, is shown below:
Audit and Risk Remuneration NominationBoard Committee Committee Committee
Scheduled Ad hoc Scheduled Scheduled Ad hoc Scheduled Ad hoc
Number of meetings held 6 4 4 4 1 1 1
Current directors
Robin Allan 6 (6) 2 (4) – – – – –David Bamford 2 4 (4) 1 (1) – 1 (1) 1 (1) 1 (1) 1 (1)Anne Marie Cannon 3 6 (6) 2 (2) 1 (1) – – 1 (1) 1 (1)Joe Darby 5 (6) 3 (4) 4 (4) 4 (4) 0 (1) 1 (1) 0 (1)Tony Durrant 4 6 (6) 3 (4) – – – 1 (1) 0 (0)Neil Hawkings 6 (6) 4 (4) – – – – –Jane Hinkley 6 (6) 4 (4) – 4 (4) 1 (1) 0 (1) 1 (1)David Lindsell 5 (6) 3 (4) 4 (4) 4 (4) 1 (1) 0 (1) 1 (1)Andrew Lodge 6 (6) 4 (4) – – – – –Michel Romieu 6 (6) 3 (4) 4 (4) – – 1 (1) 0 (1)Richard Rose 5 2 (2) 0 (0) – – – – –Mike Welton 6 (6) 4 (4) – – – 1 (1) 1 (1)
Former director
Simon Lockett 6 3 (3) 4 (4) – – – 0 (0) 0 (0)
Notes:
1 ( ) indicates the number of meetings the member was entitled to attend.
2 David Bamford was appointed to the Board and the Nomination Committee on 1 May 2014 and to the Remuneration Committee on 14 November 2014.
3 Anne Marie Cannon was appointed to the Board and the Nomination Committee on 1 February 2014 and to the Audit and Risk Committee on14 November 2014.
4 Tony Durrant was appointed to the Nomination Committee on 25 June 2014 upon being appointed Chief Executive.
5 Richard Rose was appointed Finance Director on 8 September 2014.
6 Simon Lockett resigned as a director of the company on 15 August 2014.

72 / Premier Oil plc 2014 Annual Report and Financial Statements
Board committees (continued)Executive Committee and management structureThe Board delegates the day-to-day running of the group to the Chief Executive who is supported by the Executive Committeeto assist him in this role. The Executive Committee (ExCo) meets formally once a month and its membership comprises each of the executive directors, the Group Development and Operations Manager, Garry Stoker, the Group Strategy Manager (now BU Manager – Norway), Nic Braley and the Corporate Services Director, Nigel Wilson. In addition to formal monthly ExComeetings, the ExCo holds fortnightly meetings with the Country Managers and in the alternate weeks, there is a fortnightlymeeting with functional heads which includes, in addition to ExCo members, the Head of Business Development and additionalmembers of the exploration team. Quarterly Performance Review meetings are also held between ExCo members and thesenior management team from within each of the business units and include risk management and HSES reviews as part of theoverall review of each quarter and look ahead.
Delegation of authorityResponsibility levels are communicated throughout the group as part of the business management system and through anauthorisation manual which sets out, inter alia, delegated authority levels, segregation of duties and other control procedures.The manual was updated in 2014 to reflect any changes to the organisational structure.
Board performance evaluationThe Board last undertook an externally facilitated performance evaluation exercise in 2013. Key outcomes from the evaluationincluded a desire to increase the number of informal meetings of directors throughout the year. Succession planning for Boardand senior executive positions and talent management and capability initiatives were also identified as areas for increased focusgoing forward.
In 2014 it was agreed that an internal exercise would be carried out. A timeline and process were agreed between the Chairman,committee chairmen and the Company Secretary, with the remit of the review agreed to include the Board, a project-based review,each of the Board committees, individual director performance reviews including a review of the Chairman’s performance whichwas evaluated by the senior independent director, who conducted interviews with all the directors. One-to-one interviews werealso held between each director and the Chairman to complete the process.
Detailed surveys were compiled for each review topic with input from all relevant internal stakeholders as to the key issues to beconsidered. The questionnaires and interviews covered a number of key areas including strategy, succession planning, Boardsize and composition, risk management, Board support and the relationship between Board and management. Although therewas no explicit corporate responsibility component to the evaluation process, there were opportunities for directors to raise anyconcerns in this regard through the survey or interview process. The project-based review was used to focus on the Board’s rolethroughout a specific project during the year as well as the quality and timeliness of information flows to and from the Board inrelation to that project. The results of the evaluation were condensed into a report by the Chairman and discussed by the Boardas a whole.
Key outcomes from the 2014 evaluation and actions taken are set out below:
Outcome Action
Following satisfactory performance effectiveness reviews, it was agreed that each of the directors be put forward for election orre-election at the 2015 AGM. For any directors serving beyond six years, the performance review was particularly rigorous. It wasagreed that Joe Darby, David Lindsell and Michel Romieu, each having served over six years, continue to provide sound,independent judgement and make a significant contribution to the Board and its committees. Andrew Lodge, ExplorationDirector, will be retiring with effect from 30 June 2015 and will not therefore be standing for re-election at the 2015 AGM.
Board members agreed that it would be beneficialto have further opportunities to meet, and haveinformal presentations on specific subjects from,middle management.
The Board and committee calendars for 2015 and 2016 have been revisedto make additional space for a rolling programme of presentations bymiddle management alongside additional Board dinners, one of which willbe held with only non-executive directors present.
Succession planning should be a matter ofincreased focus during 2015.
A review of the current state of succession planning and talent managementwas undertaken by the Nomination Committee in November 2014 withactions agreed for 2015. Further detail is provided in the NominationCommittee report. Internally, work is on-going to review short and longer-termsuccession arrangements for each senior role in the company, alongside areview of development needs for potential successors.
Board members agreed that the balance betweenstrategic and operational issues at Board meetingsshould be reviewed.
The balance of agenda items will be kept under review throughout theyear and non-executive directors are requested to provide on-goingfeedback on this matter.
Board members requested more detailed updateson shareholder meetings.
Additional reporting on shareholder meetings is now included in themonthly Board reports.
CORPORATE GOVERNANCE REPORT (continued)

Premier Oil plc 2014 Annual Report and Financial Statements / 73
Board appointments and developmentPremier is an international business that has to manage a variety of political, technical and commercial risks. It is thereforeimportant that the Board has the appropriate mix of skills and experience to meet these challenges. To this end, theNomination Committee reviews the structure, size and composition of the Board and makes recommendations to the Boardwith regard to any adjustments that are deemed necessary with due regard for the benefits of diversity on the Board, includinggender. In selecting new directors, the Committee prepares a description of the role and capabilities required for a particularappointment. Full detail regarding the Board appointment process including for appointments made during the year iscontained within the Nomination Committee report and the Directors’ Report.
Induction, information and supportNew directors receive a full, formal and tailored induction to the company. The induction process and material used was fullyrefreshed in 2014 for the new directors who joined in the year. The induction programme consists of: a comprehensive briefingpack including our corporate governance manual which details the structure of the group, decision making processes and bodiesand policies and procedures; an introduction to our resource centre for all directors (including all external communications suchas investor presentations, reports and corporate responsibility reports); and, a schedule of one-to-one meetings with each of theexecutive directors, members of senior management and external advisers. Specific questions on induction and on-going Boardtraining were included in the 2014 Board effectiveness evaluation survey. Responses from new Board members regarding theinduction process were very encouraging, with the rating of the programme being classed “excellent” by all new directors andpositive feedback on the process and opportunity to meet one-to-one with all of senior management.
All non-executives have access to the company’s senior management between Board meetings and the Board aims to hold atleast one meeting each year in one of the business units to allow non-executives to meet and engage with local staff. Inaddition, the continuing development of Board members is supported through deep dives into specific business areas as wellas regular updates on changes to the legal and regulatory landscape. Directors are also offered the opportunity to attendexternal training courses to further complement their skills and knowledge. Formal procedures are in place to enable individualBoard members to take independent advice at the company’s expense where appropriate. Shareholders are given theopportunity to meet with new directors upon request or at the next Annual General Meeting following their appointment.
Conflicts of interestA director has a duty to avoid a situation in which he or she has, or can have, a direct or indirect interest that conflicts, orpossibly may conflict, with the interests of the company. Formal procedures are in place to ensure the Board’s powers ofauthorisation of conflicts or potential conflicts of interest of directors are operated effectively. The Board is satisfied that during2014 these procedures were enforced and adhered to appropriately.
Powers of directors and process for amending articles of associationDetail regarding the company’s articles of association and any amendment thereto, including powers of directors under thearticles, is included within the Directors’ Report.
Risk management and internal controls in PremierThe corporate governance process in Premier is designed to determine the nature and level of risk that the company is willingto take in pursuit of its strategy and to provide an appropriate level of assurance that any risks taken are soundly managed andthat the system of internal controls is effective. Risk management processes and systems of internal control are designed tomanage rather than eliminate the risk of failure to achieve business objectives and can provide only reasonable, and notabsolute, assurance that material financial irregularities will be detected.
Business management systemInternal controls within Premier are governed by the Business Management System (BMS). This system is composed of thepolicies, standards, procedures, processes and guidelines for every function involved in carrying out Premier’s business includingExploration, Development and Operations, Business Development, Finance, Health, Safety, Environment and Security (HSES),Corporate Responsibility, Risk and other business support services. Group corporate function management systems arecomplemented by local management systems within the business units which contain additional content specifically required inorder to operate and manage the business under local conditions and in compliance with local laws and regulations. Followingsignificant technical upgrade to the system during 2013, there was active focus on content review during 2014.
The effectiveness of the BMS is a function of both the adequacy of the system and compliance with the system. Premier’s reviewprogramme includes reviews of the adequacy of and compliance with component business unit and functional managementsystems at appropriate regular intervals.
The annual cycle of monitoring in Premier culminates in the completion of the Corporate Governance Return which containsdeclarations by business unit and functional management confirming compliance with the group’s BMS as well as identifyingenhancements as part of a continuous process for improving the effectiveness of management systems.
Risk managementPremier believes that risk management is just part of good management which leads to quality decision making andachievement of targets for growth of the business. The risk management process is central to Premier’s BMS and the group’smanagement system has been developed in accordance with the risk management principles and guidelines of ISO 31000 (Risk Management – Principles and Guidelines). The processes developed by the company cover all key elements of ISO 31000:

Continuousimprovement
cycle
74 / Premier Oil plc 2014 Annual Report and Financial Statements
CORPORATE GOVERNANCE REPORT (continued)
Risk management (continued)
The core process for risk management lies at the heart of the system framework:
This core process is used to manage the spectrum of risks which Premier faces from strategic, geopolitical and other externalrisks to operational, financial and organisational risk.
The context for risk management is established by development and communication of strategy, growth targets, teamperformance deliverables and KPIs.
A systematic process for identification and assessment of risk is undertaken across the company business units and functions.Regular workshops are undertaken with input from independent consultants with specialist knowledge and from dialogue withour partners to assist with risk identification and assessment, and risks are reviewed on a regular basis to ensure that new risks orexposures as a result of changes in the business or the business environment are captured.
A standard matrix of impact versus likelihood is used to assess risks at all levels in the organisation. Appropriate consideration isgiven to risk dependency and amalgamation of similar specific risks across the organisation. Risks are categorised according toa scale of Major, Medium and Minor and escalated to the appropriate level.
Risk treatment includes risk acceptance or tolerance and active risk reduction measures. Risk appetite objectives are definedand action plans are implemented. Particular attention is given to safety and environmental factors to ensure that residual risksare at a level that is as low as reasonably practicable.
The status of risks and progress with risk treatment plans are monitored continuously and reviewed periodically via performancereviews, workshops, audits and risk assessments.
The architecture of the organisation provides the framework for defining the accountability and responsibility for riskidentification and management. It links the Board and Audit and Risk Committee to the Executive Committee and functionaland business unit management structure, and enables risks to be escalated and managed at the appropriate level. The GroupAudit, Risk and Public Affairs Manager is responsible for the risk management system and the overall running of the process.
The risk protocols are the policy, procedures and processes documented as part of the risk management system and key toolsused in the process. Since 2010 the Corporate Risk Register has been the primary tool for risk management in Premier. TheRegister is a web-based tool which is updated at regular intervals. The Register facilitates recording of functional, business unitand asset/project risks, together with their assessment, definition of existing and new treatment plans for control and mitigationand assignment of responsibility at the appropriate level in the organisation.
A cycle of continuous improvement to the risk management system within the organisation is applied and regularly reviewedwith both the Executive Committee (via regional and functional performance reviews) and the Audit and Risk Committee.
Establishcontext
Risktreatment
Riskassessment
Monitorand review
Strategy
Architecture
Risk protocols
Core process

Premier Oil plc 2014 Annual Report and Financial Statements / 75
Risk management (continued)A new risk workbench (ARROW) based on ISO 31000 guidelines was developed in-house during 2014 to replace the CorporateRisk Register and will be implemented across the group in 2015. ARROW’s integration with Premier’s BMS will enable risks andtheir controls and mitigating processes to be described and managed in a more complete and consistent manner and will alsoenable the programme of financial and operational control reviews to be prioritised further against the principal group businessrisks as ranked in ARROW.
ReviewThe effective operation of internal control procedures is reviewed by planned management system and business controlreviews. An annual programme of review is agreed between functional and business unit management and approved by theAudit and Risk Committee. The programme adopts a risk based focus and includes a review of management systemeffectiveness and control as well as targeting key operational, financial and organisational delivery milestones. This process isdesigned, inter alia, to provide assurance to the Board that Premier is embedding effective risk management into its operations.Significant findings from these reviews are presented to the Audit and Risk Committee which monitors the implementation ofrecommendations for control improvements. A rolling three-year plan to cover all operations is in place.
In addition, where we are the operator, audits of joint venture operations are carried out by our joint venture partners. Where oneof our partners is the operator, we seek visibility of the most significant risks identified and managed by the joint venture partners.
The BMS, risk management processes and programme of reviews form the on-going process for identifying, evaluating andmanaging the significant risks faced by the company. This process has been in place for the year under review and up to thedate of approval of the Annual Report and Financial Statements. It is regularly reviewed by the Audit and Risk Committee andprovides the Board with reasonable assurance that appropriate controls are in place to provide effective management ofbusiness risks and to safeguard the group’s assets against inappropriate use or loss and fraud.
Communication with shareholdersCommunication with shareholders is given significant attention. Extensive information about the group’s activities is provided inthe Annual Report and Financial Statements, the Half-Yearly Report and other trading statements, all of which are available toshareholders. There is regular dialogue with institutional investors through meetings, presentations and conferences, generalpresentations to analysts and investors for the full-year and half-yearly results (which are broadcast live via the company’swebsite) as well as other ad hoc investor events. The Chairman, Chief Executive and Finance Director, who are the directorsprimarily responsible for dealing with shareholders, ensure that other members of the Board receive full reports of thesediscussions as well as analysts’ and brokers’ briefings, and shareholder sentiment reports prepared by the Investor Relationsteam. The senior independent director is available to shareholders in the event that they have concerns which contact with theChairman, Chief Executive or Finance Director has failed to resolve, or where such contact would be inappropriate. Non-executive directors are expected to attend meetings if requested by major shareholders. The company’s website (www.premier-oil.com) also provides detailed information on the group’s activities. Information regarding the company’s share capital,including detail of significant shareholders, is included within the Directors’ Report.
In accordance with current regulations, the company uses its website as its default method of publication for statutorydocuments to reduce printing costs and help benefit the environment. All shareholders are offered the choice of receivingshareholder documentation, including the Annual Report, electronically or in paper format, as well as the choice of submittingproxy votes either electronically or by post.
The company promotes the use of online shareholder services at www.premier-oil-shares.com. On this website, shareholders areable to access their shareholding and to update their address or submit queries on their account directly to the company’sRegistrar. Shareholders also have the ability to vote online prior to the 2015 AGM. The share portal also encouragesshareholders to register to receive communications by email, rather than by post, thus further reducing the number ofdocuments printed and distributed. Shareholders who have actively registered receive an email notifying them when thecompany has added a statutory document to its website. For each new registration processed, the company will donate £1 toPure Leapfrog’s carbon offsetting programme which supports carbon reduction projects in Africa, India and other developingcountries (further information can be found at www.pureleapfrog.org).
The company has posted guidelines on its website, advising shareholders of how to recognise and deal with potential sharescams. Shareholders are advised to be extremely wary of any unsolicited advice or offers and to only deal with financial servicesfirms that are authorised by the Financial Conduct Authority. More information can be found in the Shareholder Informationsection of the Investors area of the company’s website: www.premier-oil.com
Enquiries from individuals on matters relating to their shareholding and the business of the group are welcomed andshareholders are encouraged to attend the AGM to discuss the progress of the group.
By order of the Board
Stephen HuddleCompany Secretary
25 February 2015

76 / Premier Oil plc 2014 Annual Report and Financial Statements
As Chairman of the Audit and Risk Committee it is my responsibility to ensure that theCommittee is rigorous and effective in its role of monitoring:
• the integrity of the company’s financial statements, and other formal announcementsrelating to the company’s financial performance and the significant financial reportingjudgements they contain;
• the effectiveness of the risk management and internal control systems, including inparticular the identification of emerging risks and the effectiveness of actions taken tomitigate them, together with the results of the programme of reviews of these systemsand management’s response to the review findings;
• the effectiveness and objectivity of the company’s Group Audit and Risk function, theappropriateness of its work plan, the results of reviews undertaken, and the adequacyof management’s response to matters raised;
• the appropriateness of the company’s relationship with the auditors, the effectivenessand objectivity of the audit process and the application of the Committee’s policy onthe provision of non-audit services by the auditors; and
• the enforcement of the company’s code of conduct and the adequacy and security ofits whistleblowing procedure.
The terms of reference of the Committee are reviewed annually by the Committee and then by the Board, and are available onthe company’s website at www.premier-oil.com
The members of the Committee are myself, Anne Marie Cannon, Joe Darby and Michel Romieu, all of whom are independentnon-executive directors. All have been members throughout 2014 except for Annie Marie Cannon who was appointed inNovember 2014. The Board is satisfied that the membership of the Committee meets the requirement for recent and relevantfinancial experience.
The meetings of the Committee are normally attended by the Finance Director, the Group Financial Controller, the CorporateServices Director, the Group Audit, Risk and Public Affairs Manager and representatives of the auditors. Other executivedirectors or senior managers are required to attend when significant risk management or control issues relating to their area ofresponsibility are considered by the Committee. During the year, the Committee meets privately with the Group Audit, Risk andPublic Affairs manager and with the company’s auditors. The Company Secretary acts as secretary to the Committee.
The Committee is required to report its findings to the Board, identifying any matters on which it considers that action orimprovement is needed, and to make recommendations on the steps to be taken.
MeetingsThe Committee is required to meet at least three times per year and has an agenda linked to events in the company’s financialcalendar.
Activities during the yearThe Committee met four times in 2014 and has met once in 2015 to date.
In February 2014 the Committee reviewed the 2013 full-year results and the Annual Report and Financial Statements, discussedwith the auditors their audit findings, and completed its annual review of the effectiveness of internal controls so as to be able toapprove the statements on internal control and the management of risk in the Corporate Governance Report. As part of thisreview, the Committee reviewed with management the hydrocarbon reserves reporting process. In completing its review of theeffectiveness of risk management and internal controls the Committee discussed the specific operational issues that had arisenin 2013 and significant risks foreseen for 2014. The Committee also reviewed the effectiveness of the audit process and theindependence of the auditors as a basis for considering their reappointment, and reviewed its own effectiveness.
At its June meeting the Committee discussed the implications of changes in the group’s risk profile since its previous meeting,the status of the programme of risk management and business control reviews, and proposals to replace the Corporate RiskRegister with a more powerful and fit-for-purpose risk management system. This new system, ARROW, (see below) integrateswith technology architecture components that have been developed in-house and deployed at Premier over the past two yearsincluding the group human resources and Business Management Systems. The Committee also discussed significant health andsafety incidents including a fatality on a contracted support vessel in Indonesia resulting from a collision with a tanker, and theoutcome of the fatal accident enquiry relating to the death of a diver in 2011 in the course of a diving operation being carriedout from the Balmoral platform. The status of information security in the group was reviewed and the Committee requested thatit be kept updated on this subject.
In August the Committee reviewed the half-year results and discussed the auditors’ report on their review of the half-year report.The Committee also discussed the Financial Review Council’s findings from its inspection of the audit practice of Deloitte LLP,the company’s auditors, and noted the actions taken by Deloitte in response to the findings. Staffing plans for the financefunction during the 2014 financial reporting process, the appointment of the new Finance Director and the recruitment processfor the new Group Financial Controller were discussed. The Committee also received an update on major business risks, riskmanagement and business controls reviews, and the new risk analysis and reporting system.
David LindsellChairman of the Audit and Risk Committee
AUDIT AND RISK COMMITTEE REPORT

Premier Oil plc 2014 Annual Report and Financial Statements / 77
Activities during the year (continued)In December the Committee considered accounting and reporting issues relating to the full-year results and the auditors’ workplan, reviewed and approved the proposed audit fee, reviewed the status of the 2014 risk management and internal controlreviews, focusing on the significant findings and actions, and reviewed and approved the scope of the outline 2015 plan for suchreviews (steered by the principal business risks faced by the group). The Committee took note of a number of geopolitical andexternal economic uncertainties, notably oil and gas prices, with the potential to impact group business objectives during 2015.In addition, the Committee reviewed the company’s policies on provision of non-audit services by the auditors, employment offormer employees of the auditors, and share dealing and inside information.
At its February 2015 meeting the Committee reviewed the 2014 full-year results and the Annual Report and FinancialStatements, discussed with the auditors their audit findings, and completed its annual review of the effectiveness of the group’srisk management and internal control systems so as to be able to approve the statements on risk management and internalcontrol in the Corporate Governance Report and to report to the Board that, in the Committee’s view, the Annual Report andFinancial Statements, taken as a whole, is fair, balanced and understandable and provides the information necessary forshareholders to assess the group’s position and performance, business model and strategy.
In completing its annual review of the effectiveness of the risk management and internal control systems, the Committeereviewed the close-out of the 2014 risk management and internal control reviews and was briefed on the corporate governancereturns for 2014. Non-compliance with certain budgetary control procedures in the North Sea business unit was reported in thereturns. Remedial action, including increased monitoring of compliance, has been taken.
The Committee also reviewed the effectiveness of the audit process and the independence of the auditors as a basis forconsidering their reappointment, and reviewed its own effectiveness.
Risk management and internal controlThe Committee continues to be responsible for reviewing the adequacy and effectiveness of the group’s risk managementprocess designed to identify and mitigate the principal risks facing the group. There is an on-going process of refinement andembedding of risk management best practice through the group in accordance with the principles and guidelines set out in ISO 31000. Risk management and internal control in the group is discussed more fully in the Corporate Governance Report onpages 73 to 75. Since 2010 the Corporate Risk Register has been the principal record of information about identified risks andthe controls and mitigations in place to manage them, at departmental, asset/project, business unit and corporate functionlevels. During 2014 a new risk workbench, ARROW, was developed in-house for group roll-out, replacing the Corporate RiskRegister, in 2015. ARROW’s integration with Premier’s other management systems will enable risks and their controls andmitigating processes to be described and managed in a more complete and consistent manner and the programme of financialand operational control reviews to be prioritised further against principal group business risks as ranked in ARROW. ARROWallows risks assessed to have a significant potential impact (which can be measured in terms of effect on net present value orother severity of consequence) and a higher likelihood of occurrence to be flagged and referred automatically up to the nextlevel(s) of management, enabling more effective top-down monitoring of risk.
Group Audit and RiskAn annual risk-based programme of reviews is proposed to the Committee following discussion by Group Audit and Risk withfunctional and business unit management. There are three levels of review as follows:
Level 1: local internal management team review e.g. business unit manager site safety review
Level 2: group function review of business unit or asset/project e.g. drilling preparedness review, project safety review
Level 3: external third party certification e.g. oil and gas reserves certification, ISO/OHSAS certification.
The Committee considers and approves the programme, and monitors and reviews the scope and results of the reviews carriedout at each meeting, receiving reports covering progress against plan, significant findings and the action plans in place toaddress them.
48 reviews of aspects of risk management and internal controls in operations and corporate functions were carried out duringthe year. Of these, six reviews were carried out at Level 3 (external, independent assessors), 40 were at Level 2 (group functionalmanagers or their proxies reviewing activity at business unit or asset/project level), and two were at Level 1. In reviewing thefindings from these reviews, the Committee noted that the work carried out had been increasingly directed towards the group’sprincipal risks, thereby providing assurance to the Committee on key issues and challenges facing the group. Recommendationsto improve internal controls and/or to mitigate risks were agreed with the relevant business unit or corporate function after eachreview and progress in implementing the recommendations was monitored by Group Audit and Risk.

78 / Premier Oil plc 2014 Annual Report and Financial Statements
AUDIT AND RISK COMMITTEE REPORT (continued)
Financial reportingThe Committee reviewed the 2014 half-year and full-year financial results announcements and 2014 Annual Report and FinancialStatements with the Finance Director and Group Financial Controller and considered the findings from the auditors’ review ofthe interim results and their audit of the 2014 financial statements. The areas of focus for the Committee included consistency ofapplication of accounting practices and policies; compliance with financial reporting standards and stock exchange and legalrequirements; the appropriateness of assumptions and judgements in items subject to estimation; the going concernassumption; the clarity and completeness of disclosures in the financial statements; and, in relation to the Annual Report andFinancial Statements, whether, taken as a whole, it is fair, balanced and understandable and provides the information necessaryfor shareholders to assess the group’s position and performance, business model and strategy.
The Committee considered in particular the following major items that require significant judgement and estimation inpreparing the 2014 financial statements:
Going concernIn view of the current weakness in oil and gas prices, the Committee reviewed in detail management’s projections of the group’sliquidity position and compliance with its financial covenants within its borrowing facilities for the next 12 months. Key assumptionsin the projections include those related to oil and gas prices during the period, cost saving initiatives and portfolio managementoptions. The key assumptions were assessed and challenged by the Committee.
At 31 December 2014 the group had significant headroom on all its financial covenants and the projections indicate that thegroup will be able to operate within the requirements of its existing borrowing facilities and will have sufficient financialheadroom throughout the forecast period, although the Committee noted that in the event of further sustained falls in oil andgas prices and/or delays in realising certain of the portfolio management opportunities, a breach of covenants might occurtowards the end of the 12 month period that would require appropriate action to be taken with the support of the company’slong-term banking relationships. The Committee was satisfied that an appropriate degree of caution had been applied inexercising the judgements needed in making the assumptions and estimates, and concluded that the statement on-goingconcern in the Financial Review on page 52 was fair and balanced. The Committee was therefore satisfied that it is appropriatefor the group to continue to adopt the going concern basis in preparing the 2014 financial statements.
Recoverability of Intangible Exploration and Evaluation (E&E) assetsThe Committee satisfied itself by reference to the group’s business plan and discussion with management that, in respect of allexploration and evaluation assets, either commercially viable resources have been discovered or substantive expenditure onfurther exploration and evaluation activities in the specific area is budgeted or planned. Details of the group’s E&E assets areprovided in note 8 on page 148.
Oil and gas reservesUnit-of-production depreciation, depletion and amortisation charges are principally measured based on management’s estimatesof proved and probable oil and gas reserves. Estimates of proved and probable reserves are also used in the determination ofimpairment charges. Proved and probable reserves estimates are based on a number of underlying assumptions including futureoil and gas prices, future costs, oil and gas in place and reservoir performance, all of which are inherently uncertain.
The Committee considered reports from management on the process applied to calculate the reserves estimates, addressingin particular the extent to which the methodology and techniques applied by the company were generally accepted industrypractice, whether the methodology and techniques applied were consistent with those applied in prior years, and theexperience and expertise of the managers who prepared and reviewed the estimates. The Committee noted that estimatesof the group’s oil and gas reserves prepared by independent reservoir engineers were marginally higher than management’sestimates. The Committee discussed with management the main reasons for the difference between the two estimates and wassatisfied that it was appropriate to apply management’s estimates for the purpose of preparing the financial statements.
Impairment of oil and gas propertiesAs explained in note 9 to the financial statements, an impairment charge of US$784.4 million has been made in respect ofseveral producing fields in the UK North Sea, Indonesia, Vietnam and Mauritania. In order to determine whether an asset isimpaired, management assess whether indicators for impairment exist for the group’s producing and development oil and gasproperties. Where such an indicator exists, the future discounted net cash flows the company expects to derive from the assetmust be estimated. Such estimates are based on a number of assumptions including future oil and gas prices, the latestestimates of costs to be incurred in bringing fields under development into production, oil and gas reserves estimates,production rates and the associated cost profiles, and discount rates that reflect risks specific to individual assets.
In view of the current weakness in oil and gas prices, management prepared a detailed impairment report for the Committeesetting out the key assumptions for each of the oil and gas properties. The Committee challenged these assumptions andjudgements to ensure that:
• they were consistent with those that were used by management for budgeting and capital investment appraisal purposes;
• production volumes were derived from the oil and gas reserves estimates discussed above, applying the same assumptionsregarding future costs; and,
• they were reasonable within the context of the observed field performance and the wider economic environment currentlybeing observed.

Premier Oil plc 2014 Annual Report and Financial Statements / 79
Impairment of oil and gas properties (continued)The Committee noted in particular that, consistent with the practice followed in prior years and also with the long-term planningassumptions used by the company, assumed future oil and gas prices were based on forward price curves for two years and anoil price of US$85/bbl in ‘real’ terms thereafter (as explained in more detail in note 9 to the financial statements). The Committeealso noted that forecast field development costs and decommissioning costs were based on detailed and carefully reviewedcurrent estimates.
The Committee discussed with management the review that was carried out of the longer-term plans for the life of those fieldsagainst which an impairment charge has been recognised and the factors giving rise to the impairment losses and was satisfiedthat the impairment charge recognised in the year was appropriate.
The Committee was satisfied that the rates used to discount future cash flows appropriately reflect current market assessmentsof the time value of money and the risks associated with the specific assets concerned.
Provisions for decommissioning costsEstimates of the cost of future decommissioning and restoration of hydrocarbon facilities are based on current legal andconstructive requirements, technology and price levels, while estimates of when decommissioning will occur depend onassumptions made regarding the economic life of fields which in turn depend on such factors as oil prices and operating costs.The Committee therefore discussed with management the estimation process and the basis for the principal assumptionsunderlying the cost estimates, noting in particular the reasons for any major changes in estimates as compared with the previousyear. The Committee was satisfied that the approach applied was fair and reasonable. The Committee was also satisfied that thediscount rate used to calculate the provision was appropriate. Further details on decommissioning provisions are provided innote 16 on page 154.
TaxationThe group currently produces oil and/or gas in five countries and is subject to complex hydrocarbon and corporate tax regimesin each of them. Judgements must be applied in order to make provision for the amounts of tax that are expected to be settled.Also, in order to continue to recognise the substantial deferred tax asset relating to tax losses in the UK, it must be probablethat sufficient taxable profits will be available against which the tax losses can be utilised. This in turn requires assumptionsabout future profitability. The Committee discussed with management the status of discussions with relevant tax authorities andconsidered management’s views on open issues, together with any related professional advice from external tax advisers. Basedon this discussion the Committee concluded that management’s judgements regarding uncertain tax positions were appropriate.
The Committee also discussed with management their projections of probable UK taxable profits and noted that theseprojections, which were based on the same assumptions as those used in the asset impairment review and to assess whetherthe going concern assumption is appropriate, support the recognition of a deferred tax asset of US$971.7 million. Furtherdetails of the deferred tax asset and the assumptions used to estimate the amount of tax recoverable in respect of tax lossesand allowances are provided in notes 6 and 18.
External auditAudit effectivenessThe Committee reviewed the auditors’ work plan at the start of the audit cycle, considering in particular the auditors’assessment of the significant areas of risk in the group’s financial statements, which for 2014 corresponded with the major areasof judgement identified by the Committee discussed above, and the scope of their work. At the conclusion of the audit, theCommittee discussed with the auditors the findings of the audit, including key accounting and audit judgements, the level oferrors identified during the audit, the recommendations made to management by the auditors and management’s response.The Committee met privately with the auditors twice in 2014 and in February 2015 at the conclusion of the 2014 audit.
The Committee also assessed the effectiveness of the audit process, based on its own experience and on feedback from thecorporate and business unit finance teams, and considered in particular:
• the experience and expertise of the audit team;
• the auditor’s fulfilment of the agreed audit plan and any variations from the plan;
• the robustness and perceptiveness of the auditors in their handling of the key accounting and audit judgements; and
• the quality of the auditors’ recommendations for financial reporting process and control improvements.
80 / Premier Oil plc 2014 Annual Report and Financial Statements
AUDIT AND RISK COMMITTEE REPORT (continued)
External audit (continued)Auditor independence and objectivityThe Committee regularly reviews the independence and objectivity of the auditors. This review considers the overallrelationship between the auditors and the company, based on feedback from the company’s finance team and from theauditors, and the nature and extent of non-audit services provided by the auditors, and takes account of the safeguardsestablished by the auditors against loss of audit independence, including rotation of the audit engagement partner.
The Committee believes that certain non-audit work may be carried out by the auditors without compromising theirindependence and objectivity. The allocation of non-audit work is considered by reference to the company’s policy on theprovision of non-audit services by the auditors, which can be found on the company’s website. The use of the auditors forservices relating to accounting systems or the preparation of financial statements is not permitted, and neither are various otherservices, such as valuation work, which could give rise to conflicts of interest or other threats to the auditors’ objectivity thatcannot be reduced to an acceptable level by applying safeguards. The Committee believes that there is non-audit work suchas certain assurance and advisory services that may be best performed by the auditors as a result of their unique knowledgeof the company. Any material non-audit work of this nature requires approval by the Committee.
The Committee approves the fees for the audit and half-yearly review after reviewing the scope of work to be performed, andreviews the scope and fees for non-audit assignments awarded to the auditors to satisfy itself that the assignments concerneddid not give rise to threats to the auditors’ independence and objectivity. Details of audit and non-audit fees in the current yearare provided in note 3 to the financial statements.
Deloitte are required to confirm to the Committee that they have both the appropriate independence and objectivity to allowthem to continue to serve the members of the company. The Committee also requires the auditors to confirm that in providingnon-audit services, they comply with the Ethical Standards for Auditors issued by the UK Auditing Practices Board. This confirmationwas received for 2014.
In accordance with the Ethical Standards for auditors, the audit engagement partner rotates at least every five years. The currentaudit engagement partner has been in the role for three years.
Audit appointmentThe Committee considers the reappointment of the auditors each year. Based on its review of the effectiveness of the 2014audit and of the independence and objectivity of the auditors, the Committee concluded that the auditors’ effectiveness andindependence has not been impaired in any way. The Committee has reported accordingly to the Board and recommendedthat the reappointment of Deloitte LLP be proposed to shareholders for the year ending 31 December 2015.
Deloitte were initially appointed auditors of the company in 2004 and the audit has not been put out to tender since that date.The UK Corporate Governance Code 2012 introduced a provision requiring FTSE 350 companies to put the external audit contractout to tender at least every ten years, or to explain why they have not done so, although with transitional provisions that allow thecompany to defer a tender for a number of years. The Competition and Markets Authority has subsequently made mandatoryfrom 2016 onwards the requirement to put the external audit contract out to tender at least every ten years and the associatedtransitional provisions require us to have conducted an audit tender process no later than for the year ending 31 December 2017.The Audit and Risk Committee is currently planning to conduct an audit tender process in late-2016/early-2017.
Committee evaluationThe performance and effectiveness of the Committee was reviewed as part of the Board performance evaluation process andthe Committee also carried out a detailed self-assessment. The Committee was considered to be operating effectively and inaccordance with the Financial Reporting Council’s Guidance on Audit Committees.
On behalf of the Audit and Risk Committee
David LindsellChairman of the Audit and Risk Committee
25 February 2015

Premier Oil plc 2014 Annual Report and Financial Statements / 81
Dear Shareholder
The Nomination Committee considers the structure, size, composition and successionneeds for the Board and its Committees. It also has oversight of succession planningand training and development programmes for senior management. The Committeecomprises each of the non-executive directors, the Chief Executive and is chaired byme. David Bamford and Anne Marie Cannon, our newest non-executive directors, joinedthe Nomination Committee with effect from their respective start dates during 2014.
It has been a busy year for the Committee, with activity – particularly in the successionplanning and development arena – expected to develop further during 2015. TheCommittee held two formal meetings in 2014 and I also kept Committee membersupdated between meetings throughout the process leading to the appointment of TonyDurrant as Chief Executive and Richard Rose as Finance Director. More detail regardingthe work of the Committee during the year is set out below.
Executive Director SuccessionChief ExecutiveSimon Lockett confirmed his intention to step down as Chief Executive in February 2014 and agreed to continue in the role untila suitable successor had been appointed. The Committee agreed a specification for the role of Chief Executive, identifying thekey skills and experience required to lead the organisation forward. The Committee considered whether there were any suitableinternal candidates for the role; three internal candidates were agreed upon for interview alongside external candidates. Korn Ferry,an external search consultancy which is a signatory to the Voluntary Code of Conduct for Executive Search Firms, was appointedto conduct the external search element of the recruitment process. (Korn Ferry has no other connection with the company.)Korn Ferry conducted an extensive external search process and then compiled a list of external candidates matched against thespecification and against which the internal candidates could be benchmarked. The shortlist was agreed, and each candidateinterviewed, by the Committee. The Committee then held a formal meeting at which it was agreed that Tony Durrant, the thenFinance Director, be proposed to the Board for election as Chief Executive, a proposal which was fully endorsed by the Board.This then left a vacancy for the role of Finance Director.
Finance DirectorThe Committee considered the results of prior internal succession planning processes from which both an internal and externalcandidate had been identified as possible candidates for the role of Finance Director. Richard Rose, an external candidate whohad been identified in earlier succession planning reviews, and was known by the Board, was invited to interview withCommittee members. The Committee unanimously agreed that Richard Rose would be an excellent candidate for the role ofFinance Director and proposed his appointment as Finance Director to the Board to which the Board agreed.
Executive succession planning and leadership developmentDuring the year the Committee conducted a review of the current Executive Committee membership and structure anddiscussed future possible changes and successors. The Committee also reviewed the approach to development of employeesidentified both within succession plans for key roles and wider high potential employees. In view of the change in ChiefExecutive during the year and at his recommendation, the Committee agreed that a refreshed succession planning exercisewould be undertaken in 2015, to include the Executive Committee and business unit and country managers. In conjunction withthis succession planning work, an assessment of skills gaps will be completed and a programme for the development ofselected individuals will be agreed and implemented.
Non-executive succession planningThe Committee reviewed a skills matrix for the Board, to assist in mapping the spread and strength of skills and experience ofcurrent members; the skills were then mapped against the desired balance in view of the strategic objectives of the companyand anticipated skills required. Further work will continue on this in 2015 so that as and when a new appointment is made, theanalysis can assist in drawing up role and capability descriptions for any vacancy that arises.
Board and Committee compositionThe Committee reviewed the composition of the Board and its committees during the year, taking into account the need tobalance continued membership alongside a desire to keep the membership of committees refreshed. In view of the experienceof our most recently appointed non-executive directors, David Bamford and Anne Marie Cannon, the Committee unanimouslyproposed to the Board the appointment of David Bamford to the Remuneration Committee and of Anne Marie Cannon to theAudit and Risk Committee. The Board approved the appointments.
Mike WeltonChairman and Chairmanof the Nomination Committee
NOMINATION COMMITTEE REPORT

82 / Premier Oil plc 2014 Annual Report and Financial Statements
DiversityThe Board fully embraces a culture based upon equal opportunities in the workplace. Further detail regarding our commitmentto providing staff with fair and competitive terms of employment and safe working conditions is included in the CorporateResponsibility section on page 60.
At the Board level, we are committed to ensuring that the process for all Board appointments is conducted, and appointmentsmade, on merit, against objective criteria and with due regard for the benefits of diversity on the Board, including gender.When preparing for a new Board appointment, external search companies are requested to prepare a short list which takes intoaccount the capabilities, skills and experience required for the role, as well as diversity of the Board in its widest sense, includinggender diversity. The Board considers the proportion of women on the Board as part of its assessment when selecting acandidate for a Board position. We currently have two female non-executive directors, Jane Hinkley and Anne Marie Cannon,on a Board of 12 which equates to 17 per cent. The Committee reviewed its approach to gender diversity on the Board duringthe year and chose to maintain its practice of embracing diversity in all its forms without setting any measurable objectivesrelating to gender diversity.
The Board fully supports the development of female talent in the same way that we encourage all employees to embracedevelopment opportunities. During the year, two female members of our senior management team attended an event hostedby the Department for Business, Innovation & Skills, intended to introduce female senior management to the chairmen anddirectors of other FTSE 350 boards to increase the number of females in the pipeline for non-executive positions.
Committee terms of reference reviewThe Committee reviewed its terms of reference in 2014 and minor amendments were proposed to the Board for adoption,largely reflecting a best practice approach for board appointments and reporting duties of the Committee. The terms ofreference for the Nomination Committee are available at www.premier-oil.com
As we look forward to the year ahead, the Committee will continue to focus its efforts on succession planning and thedevelopment of our employees, making sure that our workforce is best positioned to take the company forward and deliverthe company’s strategic objectives.
On behalf of the Nomination Committee
Mike WeltonChairman and Chairman of the Nomination Committee
25 February 2015
NOMINATION COMMITTEE REPORT (continued)

Premier Oil plc 2014 Annual Report and Financial Statements / 83
CHAIRMAN’S STATEMENT
Dear fellow shareholder
On behalf of the Remuneration Committee I am pleased to present the Directors’Remuneration Report (DRR) for 2014.
As part of the new reporting arrangements introduced in 2013, the 2013 DRR was subjectto two votes at our 2014 AGM. Our Remuneration Policy, as approved at the 2014 AGM,is geared towards performance-related pay to support direct alignment with shareholders.The Policy remains unchanged for 2015 and therefore will not be put to a vote at the2015 AGM. It is, however, included in this year’s DRR in full for ease of reference and toprovide context to the work of the Committee during the year. The Annual Report onRemuneration, which is subject to an advisory vote at our 2015 AGM, details how thisPolicy was applied in 2014 and how it will be applied in 2015.
As detailed elsewhere in the Annual Report, despite the challenging macroeconomiccircumstances, the group delivered record production and operating cash flow in 2014.In the second half of the year, overall market conditions became increasingly
challenging, requiring the Board to respond rapidly to the decline in oil price, implementing a broad programme of costreductions and the postponement of discretionary spend. The fall in the short to medium-term oil price has impacted on ourreported financial results in respect of the carrying value of certain oil and gas assets, with impairment charges booked in theincome statement as set out in the Financial Review. The Committee fully recognises the impact the overall decline in marketconditions has had on our shareholders, with the share buyback programme being postponed and the decision taken not topropose a final dividend for FY 2014; decisions relating to directors’ remuneration were made in the context of the worseningoil sector environment and impact on our shareholders.
Our Long Term Incentive Plan (LTIP) is based on absolute and relative total shareholder returns (TSR) over a period of up to sixyears, with any vesting subject to the Committee’s assessment of various performance underpins, including HSES. For the LTIPawards granted in 2012, the three-year TSR period ended in December 2014; with the fall in our share price and the company’sperformance relative to our peer group, none of the 2012 awards vested, demonstrating the link between directors’remuneration and share price performance.
The performance targets for the 2014 annual bonus and achievement against these targets are set out on page 102. Whilst threeof the corporate targets were not met, the performance achieved on other corporate measures exceeded the stretch targets,indicating a bonus outcome for the corporate element of 40 per cent of salary. The Committee sought to strike a balancebetween the achievement of the 2014 targets set at the beginning of the year and the impact of the fall in oil price on yourcompany. As a result the Committee decided to award only 24 per cent of salary for corporate targets in 2014, against theformulaic bonus outcome of 40 per cent. After taking into account achievement of personal performance objectives, totalbonus awards range from 35 per cent to 40 per cent of salary.
The Committee considers that the incentive outcomes for 2014 outlined above are fair given the performance delivered by theExecutive and the changed market conditions in which the oil industry now operates.
As indicated in last year’s DRR, work began in 2014 to review the effectiveness of the LTIP both for the wider employeepopulation as well as for the executive directors. Although the Committee reviewed the LTIP in detail during the year, withalternative approaches considered, the disruption in the oil markets has resulted in the Committee deciding to postpone anydecision. Discussions will continue in 2015; should any changes be proposed which impact the LTIP structure for executivedirectors, shareholders will be consulted and approval sought, as appropriate.
Premier also continues to consider updates to corporate governance guidelines in its decision-making and is satisfied that thecompany’s clawback and malus provisions – which extend to annual bonus and LTIP awards granted to all employees – are inalignment with the 2014 UK Corporate Governance Code.
During the course of the year the Committee considered remuneration arrangements, in line with the Policy, for Simon Lockettwho stepped down as Chief Executive and for the appointments of Tony Durrant as Chief Executive and of Richard Rose asFinance Director. The company determined that Simon Lockett’s 2014 annual bonus opportunity and outstanding LTIP awardswould remain, subject to satisfaction of performance conditions, and be pro-rated to reflect the period worked. On appointment,Tony Durrant and Richard Rose were awarded Performance Shares and Equity Pool Award points under the on-going cycles ofthe LTIP. For Richard Rose, the buy-out of awards forfeited on resignation from his former employer reflects the expected valueof those awards; the award granted will vest only if he remains employed by the company at 31 December 2016. The Committeealso considered salary levels in appointing the Chief Executive and Finance Director. For the Chief Executive, a salary of£569,000 was determined appropriate to reflect the responsibilities of the role and his experience within the business; this salaryis in line with the previous Chief Executive’s salary. For the Finance Director, a salary of £300,000 was considered appropriate,which is approximately 20 per cent below his predecessor’s salary and reflects the opportunity for development in the role.
Jane HinkleyChairman of the Remuneration Committee
DIRECTORS’ REMUNERATION REPORT

84 / Premier Oil plc 2014 Annual Report and Financial Statements
DIRECTORS’ REMUNERATION REPORT (continued)
In consideration of the challenges posed by the changed market conditions the Committee determined that there would be nosalary increases for the executive directors for 2015. In addition, the bi-annual review of the Chairman’s and non-executive directors’fees has been postponed for a year; hence there are also no increases in fees for the Chairman and non-executive directors.
In the current climate the Committee will consider carefully the oil market outlook, the company’s position and the outcome for2015 in deciding whether and at what level to award bonuses for that year. Any bonus paid will be based on the achievement ofthe 2015 performance targets set out in general terms on page 110. For reasons of commercial sensitivity detailed figures are notgiven. Our intention is to publish these, together with the outcome, in the Annual Report on Remuneration for 2015. As referredto above, we have disclosed the performance targets and achievement against these targets for the 2014 annual bonus onpage 102 (and for the 2013 annual bonus on page 104).
The Committee encourages dialogue with its major shareholders and remains keen to hear shareholders’ views onremuneration matters.
On behalf of the Committee, I would like to thank shareholders for their continuing support.
Jane HinkleyChairman of the Remuneration Committee
25 February 2015

Premier Oil plc 2014 Annual Report and Financial Statements / 85
DIRECTORS’ REMUNERATION REPORT (continued)
POLICY REPORT
This section of the Remuneration Report sets out the Remuneration Policy which wasapproved by shareholders at the Annual General Meeting held on 14 May 2014 and hasbeen effective since that date. The Policy remains unchanged and will therefore not beput to a shareholder vote at the 2015 AGM. Shareholder approval will next be soughtno later than at the Annual General Meeting to be held in 2017. The RemunerationPolicy has been included in this annual report in full (using updated data in the scenariocharts) to provide the context within which the Committee has conducted its workduring the year and has been updated for:
• the clarification statement issued by the company on 1 May 2014 followingengagement with shareholder representatives1;
• clarification regarding the company’s approach to the operation of malus and/orclawback, which can be used in relation to the company’s annual bonus plan andLong Term Incentive Plan;
• consideration of shareholder views; this section has been updated to reflect activitysince the last report to shareholders.
The Annual Report on Remuneration on pages 98 to 119 sets out how the Policy hasbeen applied during 2014 and how it will be applied throughout the remainder of 2015and will be put to an advisory vote at the 2015 AGM.
The Committee regularly reviews the Policy to ensure it supports shareholder interestsand closely reflects business strategy. Remuneration packages are intended to besufficiently competitive to attract, retain and motivate individuals of the quality requiredto achieve the group’s objectives and thereby enhance shareholder value. TheCommittee aims to ensure that pay rewards all employees fairly and responsibly fortheir contributions. In addition, the Committee aims to ensure that the Policy does notraise environmental, operational, social or governance risks by inadvertently motivatingirresponsible behaviours.
Specifically, remuneration packages are designed with the following objectives in mind:
• To gear remuneration significantly towards performance-related pay to support direct alignment with shareholders and ahighly performance-oriented culture;
• To provide annual incentives that reward achievement of short-term objectives key to delivering the long-term strategy,encompassing financial, operational and strategic measures;
• To ensure a particular emphasis on long-term performance, to encourage direct alignment with shareholders, retention andlong-term motivation;
• To incorporate significant deferral requirements to support staff retention and lengthen the incentive time horizon; and
• To ensure incentive payments are commensurate with the company’s underlying performance.
1 The clarification statement confirmed the boundaries within which any discretionexercised by the Committee would be contained in relation to LTIP awards.
Compliance Statement
This report has been preparedin accordance with Schedule 8of the Large and Mediumsized Companies and GroupsRegulations 2013. TheCompanies Act 2006 requiresthe auditor to report to theshareholders on certain partsof the Directors’ RemunerationReport and to state whether,in the auditor’s opinion, thoseparts of the report have beenproperly prepared in accordancewith the regulations. TheChairman’s Annual Statementand the Policy Report are notsubject to audit. The sectionsof the Annual Report onRemuneration that are subject toaudit are indicated accordingly.

86 / Premier Oil plc 2014 Annual Report and Financial Statements
DIRECTORS’ REMUNERATION REPORT (continued)
Executive director policy
A summary of the Policy for executive directors is set out below:
Salary
Purpose and link to strategy • To provide an appropriate level of salary to support recruitment and retention, and withdue regard to the role and the individual’s responsibilities and experience
Operation • Typically reviewed annually with reference to company and individual performance,each executive’s responsibilities and experience, the external market for talent, andsalary increases across the group
• Salaries are benchmarked against three relevant comparator groups, comprising:(i) international oil & gas sector companies, (ii) the constituents of the LTIP TSRcomparator group, and (iii) UK-listed companies of a similar market capitalisationand revenue to Premier
• Adjustments are normally effective 1 January• Salaries are paid monthly in arrears
Opportunity • Salary increases are awarded taking into account the outcome of the review and alsobroader circumstances (including, but not limited to, a material increase in jobcomplexity and inflation)
• Salary increases will normally be in line with increases awarded to other employees.However, the Committee may make additional adjustments in certain circumstances toreflect, for example, an increase in scope or responsibility, to address a gap in marketpositioning and/or to reward performance of an individual
• The executive director salaries for the financial year under review are disclosed in theAnnual Report on Remuneration
Performance metrics • Not applicable
Pension
Purpose and link to strategy • To help provide a competitive pension provision
Operation • Executive directors who join Premier on or after 20 August 2013 are eligible toparticipate in the company’s defined contribution personal pension plan and/orreceive an equivalent cash supplement
• For executive directors who joined prior to 20 August 2013, the company provides apension substantially as if they are contributing members of the company’s final salaryRetirement and Death Benefits Plan (the ‘Scheme’), which was closed to new membersin 1997
• The only pensionable element of pay is salary

Premier Oil plc 2014 Annual Report and Financial Statements / 87
Executive director policy (continued)
Pension (continued)
Opportunity • Executive directors who join Premier on or after 20 August 2013 receive pensioncontributions and/or an equivalent cash supplement equal to 20 per cent of salary
• For executive directors who joined prior to 20 August 2013 the Scheme provides apayment on broadly a fiftieths accrual basis up to two-thirds of salary at age 60, withbenefits actuarially reduced on early retirement and pensions in payment increased inline with the lower of inflation, or five per cent per annum. The Scheme is subject to aninternal earnings cap which is reviewed annually but for executive directors, the companyprovides for pension benefits above the earnings cap through a ‘pension promise’,based on the cash equivalent transfer value of benefits accrued within the definedbenefit scheme for earnings above the earnings cap. The way that this promise iscurrently administered is as follows:1. Executive directors are given a pension allowance equal to 20 per cent of uncapped
salary. This may either be paid into a pension scheme and/or as a salary supplement2. Executive directors accrue notional defined benefits entitlement within the defined
benefits scheme3. To the extent that payments made under 1 above are not paid into the Scheme, they
are deemed to have been invested into a Life fund4. At the point that a director departs or retires, a comparison is undertaken between
the value of the notional defined contribution pot outlined in 3 above and the cashequivalent transfer value of the notional defined benefits. Subject to appropriatedeductions, the differential is available either as a contribution into their pension planor a cash payment
5. Regular reviews are carried out to assess the extent to which the payments alreadymade to each director are projected to be sufficient to provide the accruedcomponent of their target pension; where such reviews indicate a shortfall, thecompany may provide an additional payment
Performance metrics • Not applicable
Benefits
Purpose and link to strategy • To provide a benefits package competitive in the market for talent
Operation • Executive directors receive a competitive benefits package, which may include medicaland dental insurance, car allowance, life assurance and critical illness cover, expatriatebenefits, relocation allowance, health checks and a subsidised gym membership
• Other benefits may be introduced from time to time to ensure the benefits packageis appropriately competitive and reflects the circumstances of the individual director
Opportunity • Set at a level which the Committee considers appropriate for the role and individualcircumstances
• The benefits payable to the executive directors during the financial year under revieware disclosed in the Annual Report on Remuneration
Performance metrics • Not applicable

88 / Premier Oil plc 2014 Annual Report and Financial Statements
DIRECTORS’ REMUNERATION REPORT (continued)
Executive director policy (continued)
Share Incentive Plan (SIP)
Purpose and link to strategy • To encourage share ownership in Premier
Operation • An HMRC approved scheme under which employees (including executive directors)are invited to make contributions to buy partnership shares using gross pay. If anemployee agrees to buy partnership shares the company currently matches thenumber of partnership shares with ‘matching shares’ which are subject to continuedemployment for a minimum of three years
• Dividends accrue on both partnership shares and matching shares, and any historical freeshares (no longer awarded), and are automatically reinvested
Opportunity • Employees may spend up to the HMRC permitted allowance to buy partnership shares• Matching shares are granted based on investment in partnership shares and up to the
HMRC permitted match
Performance metrics • Not applicable
Save As You Earn (SAYE)
Purpose and link to strategy • To encourage share ownership in Premier
Operation • An HMRC approved scheme under which employees (including executive directors) areinvited to make regular monthly contributions over three or five years to purchase sharesthrough options which are granted at a 20 per cent discount to the mid-market closingprice on the day prior to the date of grant
Opportunity • Employees may save up to the HMRC permitted allowance
Performance metrics • Not applicable
Annual Bonus
Purpose and link to strategy • To reinforce the delivery of key short-term financial and operational objectives and,through the deferred share element, help ensure alignment with shareholders andsupport retention
Operation • Performance is measured on an annual basis for each financial year measured againststretching but achievable financial and non-financial targets, comprising KeyPerformance Indicators (KPIs), other corporate objectives and personal performance
• Performance measures, weightings and targets are set at the beginning of the yearand weighted to reflect business priorities
• Each performance measure has Threshold and Stretch targets. The final bonusoutcome is determined by the Committee, having assessed achievement againstcorporate as well as personal targets, taking into account the Committee’s broaderassessment of overall company performance
• Annual bonus awards up to 50 per cent of salary are paid in cash. Any annual bonusearned above 50 per cent of salary is deferred in shares for three years
• Dividend equivalents accrue on deferred share awards and are paid on vesting, inaccordance with the rules of the bonus plan
• Annual bonus payouts and deferred shares are also subject to malus and clawback inthe event of material misstatement of the company’s financial results, grossmisconduct, or material error in the calculation of performance conditions
• The Committee may exercise malus and clawback until the later of: (i) one year from thepayment of the bonus or the vesting of the shares, or (ii) the completion of the next auditafter payment/vesting
Opportunity • The annual bonus provides for awards of between 0 per cent and 100 per cent of salaryfor executive directors

Premier Oil plc 2014 Annual Report and Financial Statements / 89
Executive director policy (continued)
Annual Bonus (continued)
Performance metrics • Performance is assessed against a scorecard encompassing several performancecategories, which may include some or all of: production, exploration, Health, Safety, Environment and Security, finance, business development, and personal and strategic objectives
• Normally, the Committee would not expect the weighting for any performancecategory to be higher than 50 per cent. However, it retains discretion to adjustweightings to align with the business plan for each year
• The Committee uses its judgment to determine the overall scorecard outcome basedon the achievement of the targets and the Committee’s broad assessment ofcompany performance
• Further details of the measures, weightings and targets applicable for the financial yearunder review are provided in the Annual Report on Remuneration on page 102
Long Term Incentive Plan (LTIP)
Purpose and link to strategy • To support alignment with shareholders by reinforcing the delivery of absolute andrelative returns to shareholders, through the delivery of strong share price growth andrelative stock market out-performance over the long-term, and with due regard for theunderlying financial and operational performance of the company
Operation • The LTIP comprises three elements: Equity Pool Awards, Performance Share Awardsand Matching Share Awards
• Equity Pool Awards are based on an allocation of units in the Equity Pool. The EquityPool is funded by a percentage share of the growth in the company’s equity value pershare over a performance period, if growth above the threshold level has beenachieved. At the end of a performance period, Equity Pool Awards are awarded asshares calculated on the mid-market closing share price on the day prior to the dateof award
• Performance Share Awards are conditional share awards granted annually, with thegrant value defined as a percentage of salary at the date of grant
• Equity Pool Awards and Performance Share Awards are measured over three years.50 per cent of the shares vesting from the Equity Pool and Performance Shares aresubject to compulsory deferral for a further three years and are eligible for adiscretionary Matching Share Award, which is granted as shares and is subject to afurther three-year performance period
• For Performance Share Awards and Matching Share Awards, dividend equivalents mayaccrue and be paid on vesting in proportion to performance achieved, in accordancewith the rules of the Plan
• Award levels are reviewed before each award cycle to ensure they remain appropriate• All LTIP awards are subject to malus and clawback in the event of a material
misstatement of the company’s financial results, gross misconduct, or material error inthe calculation of performance conditions
• The Committee may exercise malus and clawback until the later of: (i) one year fromvesting, or (ii) the completion of the next audit after vesting

90 / Premier Oil plc 2014 Annual Report and Financial Statements
DIRECTORS’ REMUNERATION REPORT (continued)
Executive director policy (continued)
Long Term Incentive Plan (LTIP) (continued)
Opportunity • Executive directors may be awarded a share of the Equity Pool. The Committee intendsto continue with the existing approach of awarding not more than 6 per cent of theEquity Pool to any one individual, though it retains the discretion under the Plan toaward more than 6 per cent in exceptional circumstances, such as recruitment but not inrelation to the retention of an existing executive director. In any other exceptionalcircumstances where the Committee decides to exercise its discretion to make anEquity Pool award, it shall not exceed 10 per cent of the Equity Pool
• The value of vested awards is subject to a limit of 100 per cent of salary, but which maybe exceeded, at the discretion of the Committee, up to the full value warranted by thesize of the Equity Pool provided the Committee is satisfied with the underlyingperformance of the company. The Committee also has discretion to reduce the size of the Equity Pool if the formulaic outcome is not reflective of the company’sunderlying performance
• Performance Share Awards may be granted up to 150 per cent of salary• Matching Share Awards may be granted up to 2.5 times the number of shares deferred
Performance metrics • The funding of the Equity Pool is based on three-year annualised compound growthin the company’s equity value per share. Threshold performance requires compoundgrowth in the company’s equity value per share of at least 10 per cent per annum atwhich 1 per cent of the compound growth is credited to the Equity Pool. A maximumof 2.5 per cent of the compound growth is credited to the Equity Pool when growthin equity value per share is 20 per cent per annum. The funding rate is based onstraight-line interpolation between these points
• Performance Share Awards vest on three-year TSR relative to a comparator groupof international oil and gas sector peers. 25 per cent vests for median performance,with full vesting for upper quartile performance and straight-line vesting in between
• Matching Share Awards vest on three-year TSR relative to a comparator group ofinternational oil and gas sector peers. 25 per cent vests for median performance,with full vesting for upper decile performance and straight-line vesting in between
• Before finalising long-term incentive payouts, the Committee assesses the underlyingfinancial and operational performance of the company, and if appropriate, may reducethe level of vesting. In assessing the underlying performance of the company, theCommittee may consider Net Asset Value per share, finding and development costsper barrel, delivery of the strategy, relative TSR, returns on invested capital, reservesreplacement, operating cash flow, earnings per share (EPS) growth, health and safetyrecord, and other measures as the Committee deems appropriate
• Ahead of each performance cycle, the Committee may review and adjust the TSRcomparator group for future cycles to ensure relevance to Premier. The Committeemay adjust the TSR comparator group of outstanding cycles in the event that a TSRcomparator ceases to exist, de-lists or is acquired or the Committee deems it to beno longer a suitable comparator

Premier Oil plc 2014 Annual Report and Financial Statements / 91
Further details on the policyPerformance measure selectionAnnual bonusThe annual bonus is based on a corporate scorecard capturing financial, operational and strategic objectives that are key toachieving our long-term strategy. Performance measures, weightings and targets are set at the beginning of the year to reflectKPIs, business priorities and other corporate objectives, and encompassing both financial and non-financial criteria.
Performance targets are set at such a level as to be stretching but achievable, with regard to the particular strategic prioritiesand economic environment in a given performance period.
Long Term Incentive PlanThe LTIP ensures alignment with shareholders, being based on both absolute and relative TSR. The chart below illustrates howthe three elements of the LTIP operate. A single cycle of the LTIP covers a total of six years:
2015 2016 2017 2018 2019 2020 2021
1. LTIP Equity Pool cycle
2. LTIP Performance Share cycle
Performance period Deferral period
Award 50% of vested Remainingaward is released; 50% is50% is deferred released
3. LTIP Matching Share cycle
Performance period
Award Vested awardis released
The Committee believes TSR appropriately rewards the delivery of the company’s strategy and also aligns management’sinterests with those of shareholders. Absolute TSR captures the absolute return delivered to shareholders and relative TSRmeasures performance on a relative basis, thereby helping to negate the impact of uncontrollable forces such as oil pricemovements on the reward delivered through the LTIP. The review of the company’s underlying performance before LTIP payoutsare finalised ensures the impact of external factors are taken into account where appropriate. The performance measuresapplied to LTIP awards are reviewed periodically to ensure they continue to support shareholders’ interests and areappropriately aligned to Premier’s long-term strategy.
Targets are geared to provide the opportunity to achieve above market levels of pay only through exceptional sustained relativeTSR performance over six years.
Remuneration policy for other employeesThe company’s policy for all employees is to provide remuneration packages which reward them fairly and responsibly for theircontributions.
All employees participate in the company’s incentive structures and, like the remuneration package for executive directors,remuneration is structured such that a proportion of total remuneration is potentially delivered through long-term share-basedincentives to ensure maximum alignment with shareholders. Similarly, all employees are eligible to receive an annual bonus, withmeasures and targets tailored to individual business units and responsibilities as appropriate. The specific bonus frameworkvaries by job level and scope to ensure annual incentives support motivation and retention accordingly. These schemes providea clear link between pay and performance, ensuring that superior remuneration is paid only if superior performance is delivered.
Share ownership requirementsThe Committee aims to ensure that our Remuneration Policy serves shareholder interests and closely reflects the group’sbusiness strategy. Further, the company recognises the importance of aligning the interests of executive directors withshareholders through the building up of a significant shareholding in the company. Accordingly, the company requires theexecutive directors to retain no less than 50 per cent of the net value of shares vesting under the company’s long-term incentiveplans until such a time that they have reached a holding worth 100 per cent of salary (200 per cent for the Chief Executive).Details of the current shareholdings of the executive directors are in the Annual Report on Remuneration on page 111.

92 / Premier Oil plc 2014 Annual Report and Financial Statements
DIRECTORS’ REMUNERATION REPORT (continued)
Payments from existing awardsAny commitment made prior to, but due to be fulfilled after, 14 May 2014 (being the date on which the current Policy wasapproved by shareholders) will be honoured. Such commitments are as follows:
• The Asset and Equity Plan (AEP) preceded the LTIP as the company’s main long-term incentive and expired in 2009. MessrsAllan, Durrant, Hawkings, Lockett and Lodge held awards under this plan, the last of which vested during 2014 as detailed inthe Annual Report on Remuneration on page 118.
• Robin Allan was employed by the company between September 1986 and November 1999 and is entitled to a deferredpension under the Scheme in respect of this period of employment. The pension he had accrued as at November 1999 was£25,409. Further information on Robin Allan’s pension arrangements is provided in the Annual Report on Remuneration onpage 107.
Illustration of application of the executive director remuneration policyRemuneration is significantly geared towards performance-orientated pay, with particular emphasis on long-term performance. Forexample, at ‘on-target’ performance, approximately 59 per cent of the CEO’s remuneration package is delivered through variablecomponents, rising to approximately 90 per cent at ‘maximum’ performance. The maximum value is delivered only if upper quartileTSR is delivered against sector peers over six years, with a requirement for upper decile performance in the last three years.
The performance scenario charts below show the estimated remuneration that could be received by the current executivedirectors for FY 2015, both in absolute terms and as a proportion of the total package under different performance scenarios.The assumptions underlying each performance scenario are detailed in the table below:
Remuneration receivable for different performance scenarios
Minimum On-Target Maximum
Fixed pay • 2015 salary, as disclosed in the Annual Report on Remuneration on page 109• 2015 estimated taxable benefits • Pension contribution of 20 per cent of salary for the Finance Director and 2014 pension benefits for other
EDs as provided in the single figure table in the Annual Report on Remuneration on page 99
Annual bonus Nil payout Payout of 60 per cent of salary Payout of 100 per cent of salary
• Equity Pool equity value per sharegrowth based on 2.5 per cent of thechange in market value and equity valueper share appreciation of 20 per centper annum compound growth
• All Performance Shares vest in full• All Matching Share Awards (matched
over deferred Equity Pool Awards andPerformance Share Awards) vest in full
• Equity Pool based on 1 per centof the change in market valueand equity value per shareappreciation of 10 per cent perannum compound growth
• Performance Shares vesting at25 per cent of award
• Matching Share Awards (matchedover deferred Equity Pool Awardsand Performance Share Awards)vesting at 25 per cent of award
Nil payoutLTIP

Premier Oil plc 2014 Annual Report and Financial Statements / 93
Illustration of application of the executive director remuneration policy (continued)The charts below illustrate the potential reward opportunities for each of the current executive directors for the three performance scenarios.
0 1,000 2,000 3,000 4,000 5,000 6,000 7,000 8,000
Fixed
On-Target
Maximum 730 / 569 / 1,357 / 4,751
730 / 341 / 276 / 448
730
10 / 8 / 18 / 64
41 / 19 / 15 / 25
100
0 10 20 30 40 50 60 70 80 90 100
Fixed
On-Target
Maximum
Tony Durrant, Chief Executive(£000s)
0
Fixed
On-Target
Maximum
1,000 2,000 3,000 4,000 5,000
381 / 300 / 847 / 2,963
381 / 180 / 167 / 271
381
8 / 7 / 19 / 66
38 / 18 / 17 / 27
100
0 10 20 30 40 50 60 70 80 90 100
Fixed
On-Target
Maximum
Richard Rose, Finance Director(£000s)
0
Fixed
On-Target
Maximum
1,000 2,000 3,000 4,000 5,000
506 / 354 / 880 / 3,081
506 / 212 / 175 / 285
506
11 / 7 / 18 / 64
43 / 18 / 15 / 24
100
0 10 20 30 40 50 60 70 80 90 100
Fixed
On-Target
Maximum
Robin Allan, Director, Business Units(£000s)
(%)
(%)
(%)
LTIP earned after 6 yearsAnnual BonusFixed LTIP earned after 3 years
Charts for Richard Rose do not include the Conditional Share Award made to him to “buy-out” the share awards forfeited on
resignation from his former employer.

94 / Premier Oil plc 2014 Annual Report and Financial Statements
Note:
The valuation of Deferred Bonus Shares, Performance Share Awards and Matching Share Awards excludes share price appreciation. However, Equity Pool Awardsassume equity value per share compound growth of 10 per cent per annum at on-target performance and equity value per share growth of 20 per cent per annumat maximum performance. It should also be noted that the LTIP is subject to a performance period of up to six years: EPA and PSA awards are assessed on three-year performance and MSA awards, which are based on the number of EPA and PSA shares deferred, are subject to a further three-yearperformance period.
Illustration of application of the executive director remuneration policy (continued)
Fixed
On-Target
Maximum 502 / 354 / 880 / 3,081
502 / 212 / 175 / 285
502
0 1,000 2,000 3,000 4,000 5,000 6,000
10.4 / 7.3 / 18.3 / 64
43 / 18 / 15 / 24
100
0 10 20 30 40 50 60 70 80 90 100
Fixed
On-Target
Maximum
Neil Hawkings, Director, Falkland Islands(£000s)
Fixed
On-Target
Maximum 497 / 354 / 880 / 3,081
497 / 212 / 175 / 285
497
0 1,000 2,000 3,000 4,000 5,000 6,000
10.3 / 7.4 / 18.3 / 64
43 / 18 / 15 / 24
100
0 10 20 30 40 50 60 70 80 90 100
Fixed
On-Target
Maximum
Andrew Lodge, Exploration Director(£000s)
(%)
(%)
LTIP earned after 6 yearsAnnual BonusFixed LTIP earned after 3 years
DIRECTORS’ REMUNERATION REPORT (continued)

Premier Oil plc 2014 Annual Report and Financial Statements / 95
Approach to remuneration of executive directors on recruitmentIn the cases of hiring or appointing a new executive director, the Committee may make use of all the existing componentsof remuneration.
The salaries of new appointees will be determined by reference to the experience and skills of the individual, relevant marketdata, internal relativities and their current salary. New appointees will be eligible to receive a personal pension, benefits and toparticipate in the company’s HMRC approved all-employee share schemes, in line with the Policy. The approach to variable payon recruitment is summarised in the table below:
Component Approach Maximum annual opportunity
When determining appropriate remuneration for a new executive director, the Committee will take into consideration allrelevant factors (including quantum, nature of remuneration and the jurisdiction from which the candidate was recruited) toensure that the pay arrangements are in the best interests of both Premier and its shareholders. The Committee may consider itappropriate to ‘buy out’ incentive arrangements forfeited on leaving a previous employer. In doing so, the Committee will usethe existing Policy where possible or, in exceptional circumstances, the Committee may exercise the discretion available underListing Rule 9.4.2R. The value of any such award will not be higher than the expected value of the outstanding equity awardsand, in determining the expected value, the Committee will use a Black-Scholes, or equivalent, valuation and, where applicable,discount for any performance conditions attached to these awards.
In cases of appointing a new executive director by way of internal promotion, the Committee will apply the Policy for externalappointees detailed above. However, the Committee will not use its discretion to award in excess of 6 per cent of the EquityPool in relation to the retention of an existing executive director. Where an individual has contractual commitments that varyfrom our Policy for executive directors, but made prior to his or her promotion to executive director level, the company willcontinue to honour these arrangements.
Service contracts and exit payments and change of control provisionsExecutive director service contracts, including arrangements for early termination, are carefully considered by the Committeeand are designed to recruit, retain and motivate directors of the quality required to manage the company. The service contractof each executive director may be terminated on 12 months’ notice in writing by either party. Executive directors’ contracts areavailable to view at the company’s registered office.
Details of the service contracts of the current executive directors are as follows:
Director Contract date Unexpired term of contract
Robin Allan 09.12.03 Rolling contractTony Durrant 01.07.05 Rolling contractNeil Hawkings 23.03.06 Rolling contractAndrew Lodge 20.04.09 Rolling contractRichard Rose 25.07.14 Rolling contract
The company will consider termination payments in light of the circumstances on a case-by-case basis, taking into account therelevant contractual terms, the circumstances of the termination and any applicable duty to mitigate. In such an event, theremuneration commitments in respect of the executive director contracts could amount to one year’s remuneration based on salaryand benefits in kind and pension rights during the notice period, together with payment in lieu of any accrued but untaken holidayleave, if applicable. There are provisions for termination with less than 12 months’ notice by the company in certain circumstances.
100 per cent of salaryThe annual bonus described in the PolicyTable will apply to new appointees with therelevant maximum being pro-rated to reflectthe proportion of employment over the year.Targets for the individual element will betailored towards the executive
Annual Bonus
Equity Pool Awards: up to 6 per cent of the EquityPool, which may be exceeded in exceptionalcircumstances (in which case awards shall not exceed10 per cent of the Equity Pool)
Performance Share Awards: up to 150 per centof salary
Matching Share Awards: up to 2.5 times the numberof deferred Equity Pool Awards and deferredPerformance Shares
New appointees will be granted awards underthe LTIP on the same terms as other executivedirectors, as described in the Policy Table
LTIP
96 / Premier Oil plc 2014 Annual Report and Financial Statements
Service contracts and exit payments and change of control provisions (continued)If such circumstances were to arise, the executive director concerned would have no claim against the company for damages orany other remedy in respect of the termination. The Committee would apply general principles of mitigation to any paymentmade to a departing executive director and will honour previous commitments as appropriate, considering each case on anindividual basis.
The table below summarises how the awards under the annual bonus and LTIP are typically treated in different leaver scenariosand on a change of control. Whilst the Committee retains overall discretion on determining ‘good leaver’ status, it typicallydefines a ‘good leaver’ in circumstances such as retirement with agreement of the company, ill health, disability, death, redundancy,or part of the business in which the individual is employed or engaged ceasing to be a member of the group. Final treatment issubject to the Committee’s discretion.
Event Timing of vesting/award Calculation of vesting/payment
Annual bonus
LTIP
Note:
1 In certain circumstances, the Committee may determine that deferred share awards under the annual bonus and both unvested and deferred awardsunder the LTIP will not vest on a change of control and instead be replaced by an equivalent grant of a new award, as determined by the Committee,in the new company.
Upon exit or change of control, SAYE and SIP awards will be treated in line with the approved plan rules.
If employment is terminated by the company, the departing executive director may have a legal entitlement (under statute orotherwise) to additional amounts, which would need to be met. In addition, the Committee retains discretion to settle otheramounts reasonably due to the executive director, for example to meet the legal fees incurred by the executive director inconnection with the termination of employment, where the company wishes to enter into a settlement agreement (as providedfor below) and, in which case, the individual is required to seek independent legal advice.
In certain circumstances, the Committee may approve new contractual arrangements with departing executive directorsincluding (but not limited to) settlement, confidentiality, restrictive covenants and/or consultancy arrangements. These will beused sparingly and only entered into where the Committee believes that it is in the best interests of the company and itsshareholders to do so.
• Annual bonus is paid only to the extent that anyperformance conditions have been satisfied andis pro-rated for the proportion of the financialyear worked before cessation of employment
• Annual bonuses are paid at the sametime as to continuing employees
• Unvested deferred share awards vest oncessation of employment
‘Good leaver’
• Individuals lose the right to their annual bonusand unvested deferred share awards
• Not applicable‘Bad leaver’
• Annual bonus is paid only to the extent that anyperformance conditions have been satisfied andis pro-rated for the proportion of the financialyear worked to the effective date of change ofcontrol
• Annual bonuses are paid and unvesteddeferred share awards vest on effectivedate of change of control
Change of control 1
• Unvested awards vest to the extent that anyperformance conditions have been satisfied anda pro-rata reduction applies to the value of theawards to take into account the proportion ofvesting period not served
• Deferred shares vest in full
• On normal vesting date (or earlier at theCommittee’s discretion)
‘Good leaver’
• Unvested awards lapse on cessation ofemployment
• Outstanding deferred shares vest on cessationof employment
• Unvested awards lapse‘Bad leaver’
• Unvested awards vest to the extent that anyperformance conditions have been satisfied anda pro-rata reduction applies for the proportionof the vesting period not served
• Outstanding deferred shares vest in full
• On the date of the eventChange of control 1
DIRECTORS’ REMUNERATION REPORT (continued)

Premier Oil plc 2014 Annual Report and Financial Statements / 97
External appointmentsExecutive directors are entitled to accept non-executive director appointments outside the company and retain any feesreceived providing that the Board’s prior approval is obtained. Details of external directorships held by executive directors alongwith fees retained are provided in the Annual Report on Remuneration on page 112.
Consideration of employment conditions elsewhere in the companyThe Committee does not specifically consult with employees over the effectiveness and appropriateness of the Policy. However,the Committee does consider the pay and conditions elsewhere in the company, including how company-wide pay tracksagainst the market. When awarding salary increases to executive directors, the Committee takes account of salary increasesacross the group, particularly for those employees based in the UK. Further, the company seeks to promote and maintain goodrelationships with employee representative bodies – including trade unions – as part of its employee engagement strategy andconsults on matters affecting employees and business performance as required in each case by law and regulation in thejurisdictions in which the company operates.
Consideration of shareholder viewsThe Committee aims to ensure that the Policy serves shareholder interests and is aligned with the group’s business strategy,market practice and evolving best practice. The Committee Chairman consults major shareholders and proxy advisers fromtime-to-time to discuss the Remuneration Policy. The Committee considers all feedback received from such consultations, aswell as guidance from shareholder representative bodies more generally, to help to ensure the Policy is aligned with shareholderviews. Earlier this year the Committee Chairman contacted Premier’s major shareholders offering to discuss remunerationmatters. Premier is mindful of the views it receives in its consultations.
Non-executive director Remuneration PolicyNon-executive directors have letters of appointment effective for a period of three years, subject to annual re-election byshareholders at each Annual General Meeting in accordance with the UK Corporate Governance Code. All letters ofappointment have a notice period of three months and provide for no arrangements under which any non-executive director isentitled to receive remuneration upon the early termination of his or her appointment. Non-executive directors’ letters ofappointment are available to view at the company’s registered office.
Year appointed Date of current Director director appointment letter
Mike Welton 2009 16.10.2012David Bamford 2014 07.04.2014Anne Marie Cannon 2014 24.01.2014Joe Darby 2007 17.10.2013Jane Hinkley 2010 17.10.2013David Lindsell 2008 16.01.2014Michel Romieu 2008 16.01.2014
The company’s Articles of Association provide that the remuneration paid to non-executive directors is to be determined by theBoard within limits set by the shareholders. The Policy for the Chairman and non-executive directors is as follows:
Fees
Purpose and link to strategy • To provide fees that allow Premier to attract and retain non-executive directors of the highest calibre
Operation • Fees for non-executive directors are reviewed at least every two years• Fees are set with reference to three relevant comparator groups, comprising: (i) international
oil & gas sector companies, (ii) the constituents of the LTIP TSR comparator group, and(iii) UK-listed companies of a similar market cap and revenue to Premier. The fees also takeinto account the time commitments of the non-executive directors
• Fees paid to the Chairman are determined by the Committee, while the fees of the othernon-executive directors are determined by the Board
• Additional fees are payable for acting as senior independent director, and as Chairman of anyof the Board’s committees
• Adjustments are normally effective 1 January• The non-executive director fees for the financial year under review are disclosed in the Annual
Report on Remuneration
Opportunity • Non-executive director fees are set at a level that is considered appropriate in the light ofrelevant market practice and the size/complexity of the role
Performance metrics • Not applicable
Approach to non-executive director recruitment remunerationIn the case of hiring or appointing a new non-executive director, the Committee will follow the Policy as set out in the table above.

98 / Premier Oil plc 2014 Annual Report and Financial Statements
ANNUAL REPORT ON REMUNERATION
Remuneration Committee membership and considerations during 2014Jane Hinkley is Chairman of the Remuneration Committee and there are three other members who are also independentnon-executive directors. Joe Darby and David Lindsell served as members throughout the year; David Bamford was appointeda member of the Committee on 14 November 2014. Members of the Committee meet without any executives present for partof each meeting. From time to time, the Chief Executive attended meetings of the Committee by invitation. During the year,Stephen Huddle, Company Secretary, acted as Secretary to the Committee and Nigel Wilson, Corporate Services Director,attended meetings as appropriate. Members of the Board and any other employees attending Committee meetings leave themeeting where their own remuneration is being discussed.
The Committee acts within its agreed written terms of reference, which are reviewed regularly and published on the company’swebsite (www.premier-oil.com). The main responsibilities of the Committee include:• Determining the Remuneration Policy for executive directors and senior management;• Determining the individual remuneration packages for each executive director and any changes thereto;• Considering the design of, and determining targets for, the annual bonus plan;• Determining the quantum and performance conditions for long-term incentive awards;• Reviewing the Policy for pension arrangements, service agreements and termination payments to executive directors;• Approving the Directors’ Remuneration Report, ensuring compliance with related governance provisions and legislation;• Reviewing bonus outcomes; and• Considering the remuneration policies and practices across the organisation.
During 2014, the Committee met five times. Key activities of the Committee during the year included:• Determining remuneration packages and termination arrangements for executive directors joining and leaving the Board;• Determining the remuneration package for Tony Durrant on being promoted from Finance Director to Chief Executive;• Review of the current Long Term Incentive Plan and discussion of alternative arrangements;• Determining the 2013 bonus outcome;• Making awards under the Long Term Incentive Plan; and• Oversight of grading and salary review for all employees.
AdvisersKepler Associates (Kepler) is the independent adviser to the Committee. Kepler was appointed by the Committee in 2011through a competitive tender process and was retained during the year. The Committee is of the view that Kepler providesindependent remuneration advice to the Committee and does not have any connections with Premier that may impair theirindependence. Kepler is a founding member and signatory to the UK Remuneration Consultants’ Code of Conduct whichgoverns standards in the areas of transparency, integrity, objectivity, confidentiality, competence and due care, details of whichcan be found at www.remunerationconsultantsgroup.com. In 2014, Kepler provided advice on remuneration for executives,market and best practice guidance, assisted with drafting the Directors’ Remuneration Report and attended Committeemeetings. Kepler reports directly to the Committee and provides no other services to the company. Their total fee for theprovision of remuneration services in 2014 was £129,682 on the basis of time and materials.
During the year the Committee also took advice from PwC to provide performance updates on outstanding LTIP awards,including the vesting of the 2012 Equity Pool, Performance Share and Matching Share Awards. Total fees for PwC for theprovision of remuneration services in 2014 were £35,000 on a fixed fee basis. The Committee also sought advice from Berwin,Leighton & Paisner LLP in relation to service and settlement agreements as well as a review of executive director pensionarrangements. Total fees for Berwin, Leighton & Paisner LLP were £221,373.
The Committee evaluates the support provided by its advisers annually and is satisfied that the advice it received in 2014 wasobjective and independent.
DIRECTORS’ REMUNERATION REPORT (continued)

Premier Oil plc 2014 Annual Report and Financial Statements / 99
Voting on remuneration mattersAt the AGM held in May 2014, two resolutions were put to shareholders relating to directors’ remuneration. The first resolutionrelated to the Remuneration Policy and was subject to a binding vote. The second resolution related to the Directors’ AnnualReport on Remuneration and was subject to an advisory vote. The votes received were as follows:
Votes FOR Votes AGAINST VotesResolution and % of votes cast and % of votes cast WITHHELD
Directors’ Remuneration Policy 289,525,378 86.12% 46,648,769 13.88% 2,542,395Directors’ Annual Report on Remuneration 331,325,251 98.56% 4,850,298 1.44% 2,540,993
At the 2015 AGM, the Directors’ Annual Report on Remuneration will be put to shareholders for approval by way of an advisoryvote. No changes are proposed to the Remuneration Policy and this will not be put to shareholders at the 2015 AGM.
Single total figure of remuneration for executive and non-executive directors (audited)Single total figure of remuneration for executive directorsThe table below reports a single figure for total remuneration for each executive director, calculated in accordance with theLarge and Medium-sized Companies and Groups Regulations 2013.
Taxable Annual Long-term OtherSalary1 benefits2 bonus3 incentives4 Pension5 Payments6 Total£000s £000s £000s £000s £000s £000s £000s
Director 2014 2013 2014 2013 2014 2013 2014 2013 2014 2013 2014 2013 2014 2013
Robin Allan 353.8 345.0 20.6 20.8 123.8 82.8 0 0 132.1 134.6 5.3 1.5 635.6 584.7Tony Durrant 480.6 377.0 21.4 22.5 192.3 98.0 0 0 140.1 150.7 3.7 1.5 838.1 649.7Neil Hawkings 353.8 345.0 20.5 21.1 134.4 82.8 0 0 128.1 126.6 3.8 1.5 640.6 577.0Andrew Lodge 353.8 345.0 23.0 21.6 127.4 86.3 0 0 120.1 116.6 3.9 3.8 628.2 573.3Richard Rose 7 94.3 – 6.2 – 34.0 – 0 – 19.6 – 89.6 – 243.7 –
Former director
Simon Lockett 8 356.8 555.0 14.5 24.7 139.1 133.2 0 0 376.9 286.0 1.0 3.8 888.3 1,002.7
Notes to 2014 figures (unless stated):
1 Salary is shown on a gross basis.
2 Taxable benefits include medical and dental insurance, car allowance, life assurance and critical illness cover, health insurance and a subsidised gymmembership. In particular, in 2014, all executive directors received a car allowance of £15,000.
3 Annual bonus awarded for performance in the relevant financial year. See page 102 of the Annual Report on Remuneration for further details of the 2014annual bonus awards to each executive director, including performance criteria, achievement and resulting awards.
4 For 2014 the LTIP consists of 2012 Equity Pool Awards, 2012 Performance Share Awards, and 2012 Matching Share Awards (matched over deferredawards under the 2009 LTIP) for which the performance period completed on 31 December 2014 and no awards vested. See page 105 of the AnnualReport on Remuneration for further details on performance criteria. For 2013, the LTIP consisted of 2011 Equity Pool Awards, 2011 Performance ShareAwards, and 2011 Matching Share Awards (matched over deferred shares under the 2008 AEP) for which the performance period completed on31 December 2013 and no awards vested.
5 Richard Rose’s pension figure includes a combination of pension contributions to the defined contribution scheme and a salary supplement. For otherexecutive directors, pension figures are accrued pension entitlements and exclude director contributions. See page 107 of the Annual Report onRemuneration for further details on total pension entitlements for each executive director.
6 Includes SIP awards and SAYE options granted in line with the Policy on page 88. Each executive director was awarded SIP matching awards during theyear as detailed on page 119; SIP awards are valued as the number of matching awards granted multiplied by the share price at date of award. MessrsDurrant, Hawkings and Lodge were each awarded a three-year SAYE option over 3,660 shares on 7 May 2014; Robin Allan was awarded a five-year SAYEoption over 6,101 shares on the same date. The value of SAYE options is the embedded value at grant (20 per cent discount multiplied by the number ofoptions granted). Full details of executive director SAYE options and SIP share awards are available on page 119 of the Annual Report on Remuneration.
7 Richard Rose joined the company on 8 September 2014. Details shown are for the period 8 September to 31 December 2014. The ‘other payments’figure includes the value of Richard Rose’s Conditional Share Award to “buy-out” the share awards he forfeited on resignation from his former employer.
8 Simon Lockett left the company on 15 August 2014. Details shown above are for the period 1 January to 15 August 2014. For further detail regardingSimon Lockett’s leaving arrangements, including any payments made to him after his leaving date, please see page 101. The 2014 pension figure forSimon Lockett was calculated at 31 December 2014 using a statutory factor of 20 (£468.1k as at 15 August 2014).

100 / Premier Oil plc 2014 Annual Report and Financial Statements
DIRECTORS’ REMUNERATION REPORT (continued)
Single total figure of remuneration for executive and non-executive directors (audited) (continued)Single total figure of remuneration for non-executive directors
Base fee Additional fees1 Total£000s £000s £000s
Director 2014 2013 2014 2013 2014 2013
Mike Welton (Chairman) 169.6 169.6 – – 169.6 169.6David Bamford 35.32 – – – 35.32 –Anne Marie Cannon 48.63 – – – 48.63 –Joe Darby 53.0 53.0 10.6 10.6 63.6 63.6Jane Hinkley 53.0 53.0 10.6 10.6 63.6 63.6David Lindsell 53.0 53.0 10.6 10.6 63.6 63.6Michel Romieu 53.0 53.0 – – 53.0 53.0
Notes:
1 During the year, Joe Darby acted as senior independent director, David Lindsell was Chairman of the Audit and Risk Committee, and Jane Hinkley wasChairman of the Remuneration Committee; Mike Welton was the Company Chairman and was also Chairman of the Nomination Committee.
2 David Bamford joined the company on 1 May 2014. His annual fee is £53,000 per annum in line with the other non-executive directors. The total figureshown reflects the fee paid to him for service from 1 May to 31 December 2014.
3 Anne Marie Cannon joined the company on 1 February 2014. Her annual fee is £53,000 per annum in line with the other non-executive directors.The total figure shown reflects the fee paid to her for service from 1 February to 31 December 2014.
No fees were paid to non-executive directors for membership of a committee or for attending committee meetings. Additionalfees were payable of £10,600 (2013: £10,600) for acting as senior independent director, as Chairman of the Audit and RiskCommittee or as Chairman of the Remuneration Committee. The Company Chairman is also the Chairman of the NominationCommittee and currently waives any fee for this role. Fees for the Chairman and the non-executive directors were last increasedeffective from 1 January 2013 following review in 2012. Fees for the Chairman and non-executive directors were scheduled to bereviewed again in December 2014. However, the Chairman and non-executive directors agreed unanimously that in view of thecurrent market environment it would be inappropriate to be in receipt of any increase in fee at this point in time. The next reviewof fees for non-executive directors will be conducted during 2015 with any change proposed to take effect from 1 January 2016.
Executive director changes (audited)During the course of the year the Committee considered remuneration arrangements, in line with the Policy, for Simon Lockettwho stepped down as Chief Executive and for the appointments of Tony Durrant as Chief Executive and of Richard Rose asFinance Director.
With effect from 25 June 2014 Tony Durrant, having been Finance Director prior to that date, succeeded Simon Lockett as ChiefExecutive. The Committee approved an increase of Tony Durrant’s base salary to £569,000 per annum, a level which the Committeedetermined appropriate to reflect the responsibilities of the role and his experience within the business; this salary is in line withthe previous Chief Executive’s salary. Tony Durrant also received additional awards under the on-going cycles of the LTIP toreflect his new responsibilities as Chief Executive, pro-rated to reflect the period of the performance cycle for which he servesas Chief Executive (see pages 105 and 106 for full details of the awards made).
Richard Rose joined the company as Finance Director on 8 September 2014. On joining the company, Richard Rose receiveda Conditional Share Award to “buy-out” the share awards he forfeited on resignation from his former employer (full details areprovided on page 111). The Conditional Share Award reflects the expected value of his forfeited awards and the award will vestonly if he remains employed by the company at 31 December 2016. Richard Rose also received awards under the on-going cyclesof the LTIP, pro-rated to reflect the period of each performance cycle for which he serves as a Board member (full details areprovided on pages 105 and 106). The Committee determined that a salary of £300,000 was appropriate for Richard Rose as Finance Director, which is approximately 20 per cent below his predecessor’s salary and reflects the opportunity for developmentin the role.
Neither Tony Durrant’s nor Richard Rose’s salary will be increased in 2015, and both individuals’ bonus opportunities remain inline with the Policy, that is a maximum opportunity of up to 100 per cent of salary with any amount over and above 50 per centof salary being awarded in deferred shares under the Deferred Bonus Share Plan. Pension arrangements and benefits for Tony Durrant remain unchanged save for being linked to his new salary. Richard Rose receives a combination of pensioncontributions (to the defined contribution scheme) and a salary supplement totalling 20 per cent of salary. Richard Rose’sbenefits package is in accordance with the Policy and in line with that received by other executive directors.

Premier Oil plc 2014 Annual Report and Financial Statements / 101
Executive director changes (audited) (continued)Simon Lockett stepped down as Chief Executive on 25 June 2014 and as an Executive Director on 15 August 2014. TheCommittee determined Simon Lockett’s exit arrangements in accordance with his service agreement and the RemunerationPolicy. The Committee also determined Simon Lockett would receive good leaver status in relation to outstanding incentiveawards. The following arrangements were agreed:
• A payment of 12 months’ salary and benefits of £683,996 gross calculated as (a) base salary of £569,000 and (b) payment inlieu of benefits of £114,996 comprising car allowance and pension, subject to mitigation if Simon Lockett were to start a newexecutive or non-executive director role for another organisation during the 12 month period ending 15 August 2015.
• Simon Lockett is permitted to accept fees of up to £100,000 per annum gross without an obligation to mitigate in respect ofnon-executive director appointments (excluding chairman appointments).
• The company will continue to provide life assurance cover (plus up to £3,000 for tax payable by Simon Lockett on this cover)and private medical insurance for the period of Simon Lockett’s notice on the same basis as currently provided.
2014 Annual Bonus Payment*• Under the terms of his contract, Simon Lockett was entitled to receive his annual bonus payment for 2014 which has been
reduced on a time worked basis to reflect his departure date of 15 August 2014. In addition, all unvested Deferred BonusShare Plan awards held by Simon Lockett vested on 15 August 2014. Full details are set out on pages 103 and 113.
Long Term Incentive Plan Awards• Simon Lockett’s existing LTIP awards will vest, subject to performance, having been pro-rated on a time worked basis, at their
normal vesting date, in accordance with the good leaver provisions in the company’s LTIP rules.
Pension–related benefits*• In relation to the company’s contractual obligations to Simon Lockett to provide a pension substantially as if he was a member
of the defined benefit pension scheme without the earnings cap, the company’s obligations were settled by a lump sumpayment of £468,100 gross.
Legal fees• Simon Lockett received a contribution of £25,000 plus VAT towards legal fees incurred in connection with his departure.
Payment for loss of employment in settlement of potential claims• Simon Lockett was paid £50,000 gross by way of payment for loss of employment in settlement of potential claims arising in
connection with his employment and its termination.
*These items are included within the Single total figure of remuneration table on page 99.

Annual bonus in respect of 2014 performance (audited)In line with the Policy, during 2014 executive directors participated in non-pensionable annual bonus arrangements. The 2014annual bonus provided for awards of between 0 per cent and 100 per cent of salary for executive directors. Annual performancewas assessed against a performance scorecard encompassing health, safety, environment and security (HSES), production,development, exploration and finance as well as personal performance.
In assessing the 2014 bonus payout, the Committee reviewed performance against each measure and applied judgement todetermine the overall bonus level, taking into account other aspects of performance including overall company performanceand the oil sector environment.
The 2014 annual bonus scorecard was based 80 per cent on financial and operational targets and 20 per cent on personalobjectives. The table below details the financial and operational performance categories, their relative weightings andachievement against specific targets. Each executive director’s achievement against the personal targets is also summarised below.
102 / Premier Oil plc 2014 Annual Report and Financial Statements
DIRECTORS’ REMUNERATION REPORT (continued)
KPI category Subcategory Measure
Performance target rangesActual
PerformanceWeighting
Formulaicoutcome for theyear (% of bonusopportunity)Threshold Stretch
2014 Targets
Operating Safely
HSESGroup TRIR(frequency)
2.5 2.0 1.4 8% 8%
Building the strongproductionbase
ProductionAnnual averagerate of production(kboepd)
60.2 63.0 63.6 12% 12%
Development
Solan Solan on-streamSolan on-stream for less than Gross Budget
Below threshold 30% 0%
Sea Lion
Ready to submit a draft FieldDevelopment Plan (FDP) for SeaLion by end 2014
Progress farmdown of Sea Lion
Below threshold 6% 0%
Catcher & VetteCatcher FDPapproval byDECC
In addition, bring Vette tosanction point
Stretch fullydelivered
4% 4%
Deliveringgrowth
ExplorationFinding costs for2C + 2P resourceadds ($/boe)
11 5 2 8% 8%
Maintainingfinancialstrength
Finance
Covenantheadroom($ million)
357 600 706 8% 8%
Asset disposalprogramme($ million)
300 450 Below threshold 4% 0%
Sub-total: Corporate KPIs 80% 40%
Sub-total: Corporate KPIs (following exercise of Committee discretion) 80% 24%
Personal
Tony DurrantA selection of targets supporting the corporate KPIs including maintainingfinancial strength and HSES
20%
16%
Robin AllanA combination of production and development targets supporting thecorporate KPIs as well as succession planning for key reporting roles
11%
Neil HawkingsA selection of targets supporting execution of Sea Lion including financing,HSES and systems
14%
Andrew LodgeA combination of exploration targets supporting the corporate KPIs andsuccession planning for key reporting roles
12%
Richard RoseA combination of targets inherited from the former Finance Director,supporting the corporate KPIs and including maintaining financial strength
12%
Total 100%Between35% and 40%

Premier Oil plc 2014 Annual Report and Financial Statements / 103
Annual bonus in respect of 2014 performance (audited) (continued)The formulaic outcome for corporate targets was 40 per cent of a possible 80 per cent, with targets being achieved at abovestretch level save for Solan, Sea Lion and the asset disposal programme. However, in view of the change in the oil and gasmarket environment and the impact on shareholders both in terms of ceasing dividend payments and the share buybackprogramme, the Committee felt it appropriate to exercise its discretion in reducing the payment in respect of corporate targetsby 40 per cent, from 40 per cent to 24 per cent.
Bonus award in respect of 2014 performance (audited)Based on its assessment on the company’s and the individual performance of the executive directors, the Committee awardedbonuses of 35 to 40 per cent of salary to the executive directors. Annual bonuses were paid as cash and are summarised in thetable below:
Bonus as % CashDirector of salary £
Robin Allan 35% 123,813Tony Durrant 40% 192,2581
Neil Hawkings 38% 134,425Andrew Lodge 36% 127,350Richard Rose2 36% (and pro-rated) 33,954
Former director
Simon Lockett3 39% (and pro-rated) 139,134
Notes:
1 Determined by calculating 40 per cent of Tony Durrant’s salary during 2014 which consisted of a pro-rata treatment of his annual base salary as FinanceDirector of £386,500 between 1 January and 24 June 2014, and a pro-rata treatment of his annual base salary as Chief Executive of £569,000 from 25 Juneto 31 December 2014.
2 Richard Rose joined the company on 8 September 2014. The cash payment shown above is the pro-rated value awarded to Richard Rose to reflect theperiod of 2014 for which he was employed by the company.
3 Simon Lockett left the company on 15 August 2014. As announced at that time the Committee agreed that Simon Lockett’s annual bonus would include,in respect of the corporate target element of the bonus, the same percentage awarded to the other executive directors. In respect of the individualtarget element of the bonus, it was agreed that Simon Lockett would receive 15 per cent of annual salary as at 15 August 2014 based on a selection oftargets supporting the corporate KPIs including maintaining financial strength and HSES. Both elements were pro-rated to reflect Simon Lockett’stermination date.

104 / Premier Oil plc 2014 Annual Report and Financial Statements
Annual bonus in respect of 2013 performanceIn last year’s report, in relation to the 2013 annual bonus, target ranges were not disclosed as they were considered to becommercially sensitive. We confirmed in the 2013 report that retrospective disclosure of those targets would be given and thisinformation has been set out below:
Notes:
1 In the 2013 report, due to a typographical error, performance of ‘between threshold and stretch’ was selected for Production – Exit rate, rather than FIDs.This has been corrected in the table above.
2 Judged by the Committee, with the performance outcome based on successful disposals, on-going sales processes and strengthening of the portfolio.
DIRECTORS’ REMUNERATION REPORT (continued)
Operating Safely
HSESGroup TRIR(frequency)
2.5 1.3 Below threshold 8% 0%
Building the strongproductionbase
Production
Daily average rateof production(kboepd)
65 70 Below threshold
24%
0%
Exit rate(kboepd)
70 80 Below threshold1 0%
Final InvestmentDecisions (FIDs)approved by year-end1
1 3 1 4%
Deliveringgrowth
Exploration
Riskedprospectiveresources added(mmboe)
30 60 207
24%
8%
Finding costs for2C + 2P resourceadds (US$/boe)
11 3 4.5 4%
ReservesReplacement (%)
60% 200% Below threshold 0%
Maintainingfinancialstrength
FinanceNet OperatingCash flow (US$ million)
773 885 Below threshold 4% 0%
Group strategyDelivery ofstrategy
NAV growth per Share
10% 15% Below threshold
20%
0%
Businessdevelopment
Subject to Committee judgementBelow threshold
and stretch2 4%
Sub-total: Corporate KPIs 80% 20%
Personal
Simon Lockett(former CEO)
A selection of targets supporting the corporate KPIs
20%
4%
Tony Durrant(former FD)
Targets including structuring and execution of non-core asset disposalprogramme, marketing objectives and finance related targets
6%
Robin AllanA combination of production and development targets supporting thecorporate KPIs
4%
Neil HawkingsA combination of targets supporting execution of the corporate strategy,asset related objectives and systems development
4%
Andrew LodgeA selection of exploration targets supporting the corporate KPIs andsuccession planning for key reporting roles
5%
Total 100% 24% to 26%
2013 Targets
KPI category Subcategory Measure
Performance target rangesActual
PerformanceWeighting
Formulaicoutcome for theyear (% of bonusopportunity)Threshold Stretch

Premier Oil plc 2014 Annual Report and Financial Statements / 105
LTIP vesting outcomes in 2014 (audited)LTIP awards were granted in 2012 as Equity Pool Awards, Performance Share Awards and Matching Share Awards (matched overdeferred awards under the LTIP 2009 award; see page 90 for further detail on the LTIP). The 2012 LTIP award cycles completedtheir three-year performance periods on 31 December 2014. The vesting conditions of these awards are the same as thatdescribed in the Policy Table on pages 90 to 91.
The constituents of the comparator group for the 2012 Performance Share Award and 2012 Matching Share Award cycles aredetailed on page 117 of the Annual Report on Remuneration.
The outcomes of the 2012 LTIP awards are as follows:
• Equity Pool Awards: over the performance period, the threshold of 10 per cent per annum growth was not met, and, as aresult, awards under the 2012 Equity Pool will not vest.
• Performance Share Awards: over the performance period the company’s TSR was below the median of the comparator group.As a result, the 2012 Performance Share Awards will not vest as the threshold was not met.
• Matching Share Awards: over the performance period the company’s TSR was below the median of the comparator group.As a result, 2012 Matching Share Awards will not vest as the threshold was not met.
LTIP awards granted in 2014 (audited)The table below summarises the LTIP awards granted to executive directors in 2014 under the 2014-16 cycle, in line with thePolicy on page 90. Performance for these awards is measured between 1 January 2014 and 31 December 2016, and is basedon equity value per share and relative TSR as detailed in the Policy Table. As the 2011 LTIP awards did not vest in 2014, nocorresponding Matching Share Awards were granted during 2014. Awards granted to Tony Durrant and Richard Rose onappointment were pro-rated to take into account tenure as Chief Executive and Finance Director, respectively, in each of theoutstanding LTIP cycles. The awards made to Tony Durrant bring the total face value of any Performance Share Awards to nomore than 150 per cent of salary during 2014 and no more than 6 per cent of the Equity Pool. The LTIP awards made to RichardRose reflect a face value of no more than 125 per cent of current base salary for Performance Share Awards during 2014 and nomore than 4.25 per cent of the Equity Pool.
2014-2016 cycle
Equity Pool Award Performance Share Award1
Number ofEquity Pool Face value2 Shares Face value3
Director Award Date % of Pool Award points £000s awarded £000s
Robin Allan 27.02.14 4.25% 637.50 1,318.4 145,888 442.2Tony Durrant 27.02.14 4.25% 637.50 1,318.4 159,394 483.1
21.08.144 1.75% 220.55 456.1 92,974 311.2(pro-rated
to 1.47%)Neil Hawkings 27.02.14 4.25% 637.50 1,318.4 145,888 442.2Andrew Lodge 27.02.14 4.25% 637.50 1,318.4 145,888 442.2Richard Rose5 09.09.14 4.25% 491.95 1,017.4 84,788 289.4
(pro-ratedto 3.28%)
Former director
Simon Lockett6 27.02.14 6.00% 900.00 1,861.3 281,590 853.5
Notes:
1 Any dividends paid accrue on Performance Share Awards and will be paid on vesting as cash or shares, in proportion to performance achieved.
2 For Equity Pool Awards, the face value represents the full vesting value (at growth in equity value per share of 20 per cent per annum) assuming theCommittee exercises its discretion to allow vesting at higher than 100 per cent of salary.
3 For Performance Share Awards, face value is calculated as the maximum number of shares that would vest if targets were met in full, multiplied by theclosing mid-market price on the dates of award: £3.031 on 27 February 2014; £3.347 on 21 August 2014; £3.413 on 8 September 2014.
4 On 21 August 2014 Tony Durrant received additional awards in each of the on-going cycles of the LTIP to reflect his promotion from Finance Director toChief Executive, pro-rated to reflect the period of each cycle for which he serves as Chief Executive. The additional award is presented above for the2014-16 cycle; awards for 2012-14 and 2013-15 are shown below.
5 Richard Rose joined on 8 September 2014 and received awards under each of the on-going cycles of the LTIP, pro-rated to reflect his Board tenure ineach of the cycles. The award for the 2014-16 cycle is presented above; awards for 2012-14 and 2013-15 are shown below.
6 Simon Lockett left the company on 15 August 2014. His LTIP awards will be treated in accordance with the good leaver provisions in the LTIP rules suchthat the awards will be pro-rated on a time worked basis and any remaining awards will vest at their normal vesting date. The award shown aboverepresents the total amount awarded on 27.02.14 prior to any pro-rata adjustment.

106 / Premier Oil plc 2014 Annual Report and Financial Statements
DIRECTORS’ REMUNERATION REPORT (continued)
LTIP awards granted in 2014 (audited) (continued)The following LTIP awards were made to Tony Durrant and Richard Rose during 2014, under the 2012-14 and 2013-15 LTIP cycles,in line with the Policy and in line with the company’s remuneration policy for all employees. These awards were pro-rated to takeinto account tenure as Chief Executive and Finance Director, respectively, in each of the outstanding LTIP cycles. The awards made toTony Durrant bring the total face value of any Performance Share Awards during 2014 to no more than 150 per cent of salary and nomore than 6 per cent of the Equity Pool. The LTIP awards made to Richard Rose reflect a face value of no more than 125 per centof current base salary for Performance Share Awards during 2014 and no more than 4.25 per cent of the Equity Pool.
2012-2014 cycle and 2013-2015 cycle
Equity Pool Award Performance Share Award1
Number ofEquity Pool Face value2 Shares Face value3
Director Award Date LTIP cycle % of Pool Award points £000s awarded £000s
Tony Durrant 21.08.144 01.01.12 – 31.12.14 1.75% 45.31 126.2 4,679 15.6(pro-ratedto 0.30%)
01.01.13 – 31.12.15 1.75% 132.93 294.0 13,005 43.5(pro-ratedto 0.89%)
Richard Rose 09.09.145 01.01.12 – 31.12.14 4.25% 66.37 184.9 4,818 16.4(pro-ratedto 0.44%)
01.01.13 – 31.12.15 4.25% 279.12 617.3 20,266 69.2(pro-ratedto 1.86%)
Notes:
1 Any dividends paid accrue on Performance Share Awards and will be paid on vesting as cash or shares, in proportion to performance achieved.
2 For Equity Pool Awards, the face value represents the full vesting value (at growth in equity value per share of 20 per cent per annum) assuming theCommittee exercises its discretion to allow vesting at higher than 100 per cent of salary.
3 For Performance Share Awards, face value is calculated as the maximum number of shares that would vest if targets were met in full, multiplied by theclosing mid-market price on the dates of award: £3.347 on 21 August 2014; £3.413 on 8 September 2014.
4 On 21 August 2014 Tony Durrant received additional awards in each of the on-going cycles of the LTIP to reflect his promotion from Finance Director toChief Executive, pro-rated to reflect the period of each cycle for which he serves as Chief Executive. The above table includes awards under the 2012-14and 2013-15 cycles.
5 Richard Rose joined on 8 September 2014 and received awards under each of the on-going cycles of the LTIP, pro-rated to reflect his Board tenure ineach of the cycles. The above table includes awards under the 2012-14 and 2013-15 cycles.
The constituents of the comparator group for outstanding Performance Share Award and Matching Share Award cycles aredetailed on page 117 of the Annual Report on Remuneration.
Total pension entitlements (audited)In line with the Policy, as directors who joined the company prior to 20 August 2013, Robin Allan, Tony Durrant, Neil Hawkingsand Andrew Lodge receive a pension substantially as if they were contributing members of the company’s final salaryRetirement and Death Benefits Plan (the Scheme) and, in regard to service completed subsequent to their appointment asdirectors, not subject to the Scheme’s cap on pensionable earnings (£145,800 for 2015).
As a director who joined the company after 20 August 2013, Richard Rose is entitled to receive a pension contribution equal to20 per cent of his salary.

Premier Oil plc 2014 Annual Report and Financial Statements / 107
Total pension entitlements (audited) (continued)The accrued pension entitlements of the directors who were members (or deemed members) of the Scheme during 2014are as follows:
(f)(d) Value of growth in
(a) (b) (c) Value (e) accrued pensionAccrued Accrued Accrued of growth Deduction above inflation
pension as at pension in (a) pension as at in accrued for deemed less deemed31 December after allowing 31 December pension above contributions contributions
2013 for inflation 2014 inflation by director by directorDirector £000s pa £000s pa £000s pa £000s £000s £000s
Robin Allan 4 62.1 63.8 71.4 152.0 19.9 132.1Tony Durrant 58.0 59.6 67.7 162.0 21.9 140.1Neil Hawkings 48.1 49.4 56.8 148.0 19.9 128.1Andrew Lodge 29.0 29.8 36.8 140.0 19.9 120.1
Former director
Simon Lockett 6 125.9 129.3 149.1 396.0 19.1 376.9
Notes:
1 The amounts of accrued pension under (a) and (c) represent the accrued pension entitlements of the director as at the stated dates.
2 The values under (d) have been calculated by applying a capitalisation factor of 20 to the difference between amounts shown in (c) and (b) and areprincipally due to the additional pension accrued over the year.
3 The values stated above correspond with the target level of final salary pension provision; in practice, the pension benefits for these directors areprincipally established through individual money purchase arrangements and salary supplements.
4 In addition to the current provision noted above, Robin Allan is entitled to a deferred pension under the Scheme in respect of service with the companybetween September 1986 and November 1999.
5 Members of the Scheme have the option to pay additional voluntary contributions; none of the directors have elected to do so.
6 Simon Lockett left service on 15 August 2014; the accrued pension under (c) relates to service completed up to that date together with the award of12 months’ additional service credit. The value of growth in accrued pension under (f) was calculated at 31 December 2014 using a statutory factor of 20(£468.1k as at Simon Lockett’s leaving date of 15 August 2014).
In respect of 2014, Tony Durrant and Neil Hawkings elected to receive a salary supplement, whilst Robin Allan, Simon Lockettand Andrew Lodge elected to receive a combination of pension contributions and a salary supplement. During the year areview was carried out for the directors who were members (or deemed members) of the Scheme to assess the extent to whichthe payments already made to each director are projected to be sufficient to provide the accrued component of their targetpension; no additional non-pensionable target funding payments were made by the company in relation to FY2014.
Richard Rose receives a combination of pension contributions (to the defined contribution scheme) and a salary supplementtotalling 20 per cent of salary.
Payments made by the company in respect of pension benefits in relation to 2014 are summarised below:
Target Total pensionSalary Pension funding benefits paid
supplements contributions payments by companyDirector £000s £000s £000s £000s
Robin Allan 24.8 42.5 – 67.3Tony Durrant 84.0 – – 84.0Neil Hawkings 62.2 – – 62.2Andrew Lodge 24.8 42.5 – 67.3Richard Rose 2.8 16.8 n/a 19.6
Former director
Simon Lockett 1 56.5 10.6 577.8 644.9
Notes:
1 The target funding payments for Simon Lockett include all pension related payments made in respect of his pension during FY2014 including the paymentof £468.1k as at 15 August 2014 referenced on page 101, and an additional 12 months’ pension accrual in accordance with his leaving arrangements.

108 / Premier Oil plc 2014 Annual Report and Financial Statements
DIRECTORS’ REMUNERATION REPORT (continued)
Percentage change in CEO remunerationThe table below shows the percentage change in CEO remuneration, comprising salary, taxable benefits and annual bonus, andcomparable data for the average of all UK-based employees within the company. The figures for 2014 reflect a combination ofremuneration for Simon Lockett, Chief Executive from 1 January to 24 June 2014, and Tony Durrant who was appointed ChiefExecutive on 25 June 2014. The company has chosen UK-based employees as the comparator group for the company as awhole, due to countries outside the UK having significantly different inflation rates.
UK-basedemployees1
(averageCEO per capita)
2014 2013£000s £000s % change % change
Salary 569.0 555.0 2.5% 5.3%Taxable benefits 25.4 24.7 2.8% 10.2%Annual bonus 163.1 133.2 22.4% 12.1%
Total 757.5 712.9 6.3% 6.4%
Notes:
1 UK-based employees who were employed for the full year in both 2013 and 2014.
Relative importance of spend on payThe table below shows the company’s actual expenditure on shareholder distributions and total employee pay expenditure for thefinancial years ending 31 December 2013 and ending 31 December 2014. Total shareholder distribution expenditure is comprisedof dividends and share buybacks. The company paid a dividend on 21 May 2014 of five pence per share. 18,455,248 shares werere-purchased during the year and cancelled at a total cost to the company of $93.0m (2013: nil).
Comparison of company performanceThe chart below compares the value of £100 invested in Premier shares, including re-invested dividends, on 31 December 2008compared to the equivalent investment in the FTSE All Share Oil & Gas Producers Index, over the last six financial years. TheFTSE All-Share Oil & Gas Producers Index has been chosen as it comprises companies who are exposed to broadly similar risksand opportunities as Premier.
6-year TSR performanceValue of £100 invested on 31 December 2008
0
20
40
60
80
100
120
140
160
180
200
BuybackDividendTotal Wagesand salaries
2014
2013
$171.6m$165.8m
$43.3m$40.2m
$0m
$93m
Mill
ions
$
£86
FTSE All-Share Oil & Gas Producers Index Premier Oil plc
£126
0
50
100
150
200
250
300
31 Dec 1431 Dec 1331 Dec 1231 Dec 1131 Dec 1031 Dec 0931 Dec 08

Premier Oil plc 2014 Annual Report and Financial Statements / 109
Comparison of company performance (continued)The table below shows the CEO single figure for the past six years and corresponding performance under the annual andlong-term incentives, as a percentage of maximum.
CEO single Equity Pool Asset Pool Performance Matching figure of Annual bonus funding rate funding rate Share Award Share Award
remuneration payout as % as % of as % of vesting as % vesting as % £000s of maximum maximum maximum1 of maximum of maximum
2009 2,884.6 85% 0% 100% n/a 63%2010 4,041.4 60% 100% 55% n/a 100%2011 3,827.3 55% 100% n/a 100% 100%2012 2,728.2 45% 0% n/a 90% 66%2013 1,002.7 24% 0% n/a 0% 0%
Simon Lockett 680.3 39% 0% n/a 0% 0%2014 2 (and pro-rated)
Tony Durrant 428.7 40% 0% n/a 0% 0%
Notes:
1 Following the introduction of the LTIP in 2009, the Asset Pool was replaced by Performance Share Awards. The last award under the Asset Pool had aperformance period of 1 January 2008 to 31 December 2010. The introduction of the LTIP was disclosed in the Remuneration Report of the 2009 AnnualReport and Financial Statements.
2 Figures shown for Tony Durrant relate to the period during 2014 that he served as Chief Executive: 25 June to 31 December 2014. Figures shown forSimon Lockett relate to the period during 2014 that he served as Chief Executive: 1 January to 25 June 2014.
Implementation of executive director Remuneration Policy for 2015Remuneration in 2015 will be consistent with the Policy described on pages 85 to 97.
SalaryThe salaries of the executive directors are reviewed annually to ensure they remain appropriate. In consideration of thechallenges posed by the changed market conditions, no salary increases have been awarded to executive directors for 2015.The average salary increase across the group’s UK operations is 2.2 per cent.
Salary from1 January 2014 Salary from
or if later from appointment date 1 January 2015 PercentageDirector Position £ £ increase
Robin Allan Director, Business Units 353,750 353,750 0%Tony Durrant 1 Chief Executive 569,000 569,000 0%Neil Hawkings Director, Falkland Islands 353,750 353,750 0%Andrew Lodge Exploration Director 353,750 353,750 0%Richard Rose 2 Finance Director 300,000 300,000 0%
Notes:
1 Tony Durrant was appointed Chief Executive with effect from 25 June 2014. His salary was increased to £569,000 at that point in time (full detailsregarding the increase are provided on page 100).
2 Richard Rose was appointed Finance Director on 8 September 2014.
Pension, benefits and all-employee share plansThe company will offer executive directors pension, taxable benefits and tax-advantaged all-employee share plans for 2015 inline with the Policy on pages 86 to 88.

110 / Premier Oil plc 2014 Annual Report and Financial Statements
DIRECTORS’ REMUNERATION REPORT (continued)
Implementation of executive director Remuneration Policy for 2015 (continued)Annual bonusFor 2015, the executive director annual bonus opportunity is up to 100 per cent of salary. Annual performance will be assessedagainst a performance scorecard of which 80 per cent will be based on financial and operational measures (see table below) and20 per cent on personal objectives. The 2015 corporate and personal objectives, along with threshold and stretch target values,will be disclosed, to the extent that they are not commercially sensitive, in the 2015 Remuneration Report. In the current climatethe Committee will consider carefully the oil market outlook, the company’s position and the outcome for 2015 in decidingwhether and at what level to award bonuses for that year. Any bonus paid will be assessed against the achievement of the 2015performance targets. The table below summarises the criteria used to assess each measure and the relative weighting of each:
KPI Subcategory Target Weighting
Operating Safely HSES Group TRIR 5%
Building the strong Production Daily average kboepd 10%production base
Development Near-term project milestones Catcher 5%
Sea Lion 5%
Solan 12.5%
Delivering growth Exploration Make at least one material discovery (measured via commercial volumes) 10%
Maintaining financial Finance Covenant headroom 10%strength
Group strategy Delivery of strategy Organisation – plan the business for a low oil price environment 12.5%
Business development – subject to Committee discretion 10%
Sub-total Corporate KPIs 80%
Personal targets 20%
Total 100%
Long-term incentive planAs referenced previously, the Committee began reviewing the effectiveness of the LTIP both for the wider employee populationas well as for the executive directors during the year, with alternative approaches considered, the disruption in the oil marketshas resulted in the Committee deciding to postpone any decision. Discussions will continue in 2015; should any changes beproposed which impact the LTIP structure for executive directors, shareholders will be consulted and approval sought, asappropriate. The Committee intends to grant LTIP awards in 2015 in line with the Policy on pages 89 to 90. The company willprovide details of the LTIP awards granted to executive directors and the TSR comparator group against which TSR will beassessed for the 2015 Performance Share Awards in the Remuneration Report for the year ending 31 December 2015.
Implementation of non-executive director Remuneration Policy for 2015Non-executive director fees were last increased with effect from 1 January 2013 with the next review due to be effective1 January 2015. The next review of fees for non-executive directors will be conducted at the end of 2015 with any changeproposed to take effect from 1 January 2016. Non-executive director fees for 2015 are as follows:
From From1 January 2014 1 January 2015 Percentage
Role Fee type £ £ increase
Chairman Total fee 169,600 169,600 0%
Other non-executive directors Basic fee 53,000 53,000 0%
Committee Chairmanship 10,600 10,600 0%
Senior Independent Director 10,600 10,600 0%

Premier Oil plc 2014 Annual Report and Financial Statements / 111
Statement of directors’ shareholding and scheme interests (audited)Formal shareholding guidelines exist which require the executive directors to retain no less than 50 per cent of the net value ofshares vesting under the company's long-term incentive arrangements until such time as they have achieved a holding worth 100 per cent of salary (200 per cent for the CEO). As the graph below shows, all the current executive directors who servedthroughout 2014 hold shares with a value substantially higher than these threshold shareholding requirements. Richard Rose joinedthe Board on 8 September 2014 and purchased shares shortly after that date. Richard Rose has not yet had the opportunity toretain any shares from the vesting of LTIP or joining awards but will also be required to adhere to the shareholding guidelines asand when any of his share awards vest. Simon Lockett’s shareholding is shown as at his leaving date of 15 August 2014.
Notes:
1 Shareholding includes deferred awards under the LTIP (where performance conditions have been achieved and awards are subject to a holding period).
2 The valuation of shareholdings has been calculated using an average of the mid-market closing price between 1 October and 31 December 2014 (£2.2947).
The table below summarises the directors’ interests in shares, including those held under outstanding LTIP, SAYE and SIPawards, as at 31 December 2014. Further details of all outstanding awards are disclosed on pages 113 to 119.
Deferredshares Unvested
subject to sharesOwned continued Deferred subject to Unvestedoutright employment shares performance SAYE Total shareat 31 at 31 at 31 at 31 options at 31 interests at 31
December December December December December December20141 20142 20143 20144 2014 2014
(or date (or date (or date (or date (or date (or dateDirector of leaving) of leaving) of leaving) of leaving) of leaving) of leaving)
Robin Allan 390,270 3,749 218,865 899,567 10,886 1,523,337David Bamford 1,514 – – – – 1,514Anne Marie Cannon 0 – – – – 0Joe Darby 23,108 – – – – 23,108Tony Durrant 1,102,650 4,113 226,783 1,062,503 8,445 2,404,494Neil Hawkings 492,347 3,749 218,865 899,567 6,531 1,621,059Jane Hinkley 13,234 – – – – 13,234David Lindsell 17,332 – – – – 17,332Andrew Lodge 202,891 3,749 213,959 887,302 6,525 1,314,426Michel Romieu 20,000 – – – – 20,000Richard Rose 16,364 26,135 – 109,872 – 152,371Mike Welton 22,531 – – – – 22,531
Former director
Simon Lockett 5 462,377 6,048 331,771 1,509,381 2,865 2,312,442
Notes:
1 Owned outright includes shares held by the director and/or connected persons. This figure also includes shares held in the tax-advantaged ShareIncentive Plan (SIP) which may be subject to forfeiture on leaving the company, dependent upon the time for which they have been held.
2 Deferred shares subject to continued employment for Richard Rose comprise of his Conditional Share Award (CSA) received on joining the company to “buy-out” the share awards he forfeited on resignation from his former employer. The CSA reflects the expected value of his forfeited awards and consists of26,125 shares valued using the mid-market closing share price on 8 September 2014 of £3.413. The CSA will vest only if Richard Rose remains employed bythe company on 31 December 2016. Deferred shares for the other executive directors are interests under the Deferred Bonus Share Plan and are subject tomalus and clawback in the event of a material misstatement of the company’s financial results, gross misconduct or material error in the calculation ofperformance conditions. The Committee may exercise clawback until the later of: (i) one year from vesting, or (ii) the completion of the next audit after vesting.
3 Deferred shares under the Long Term Incentive Plan subject to a three-year holding period but which would vest in full on cessation of employment in allcircumstances save for summary dismissal.
4 Unvested shares subject to performance include 2012 Performance Share Awards and 2012 Matching Share Awards, for which the performance period completedon 31 December 2014 and no awards vested. See page 105 of the Annual Report on Remuneration for further details on performance criteria and achievement.
5 Interests reported as at 15 August 2014, the date on which Simon Lockett’s directorship ceased.
Simon Lockett Richard RoseAndrew Lodge Neil HawkingsTony Durrant Robin Allan
Shareholding requirement
% shareholding against salary
100%
13%
200%
320%
100%
270%
100%
461%
200%
536%
100%
395%
0
100
200
300
400
500
600
% o
f sal
ary

112 / Premier Oil plc 2014 Annual Report and Financial Statements
DIRECTORS’ REMUNERATION REPORT (continued)
Sourcing of shares and dilution limitsAwards under all the company’s share schemes may be met using a combination of market purchases, financed by the companythrough the Premier Oil plc Employee Benefit Trust, and newly-issued shares. The company complies with the InvestmentManagement Association’s recommended guidelines on shareholder dilution through employee share schemes: awards underthe group’s discretionary schemes which may be satisfied by new issue shares must not exceed 5 per cent of the company’sissued share capital in any rolling 10-year period, and the total of all awards satisfied via new issue shares under all plans mustnot exceed 10 per cent of the company’s issued share capital in any rolling 10-year period.
As of 31 December 2014, 2,690,319 shares were held by the Employee Benefit Trust (2013: 2,964,541) and the commitments toissue new shares are summarised below:
Percentage Percentageof issued Dilution of dilution
Number of shares issued or committed to be issued in the 10-year period to 31 December 2014 share capital limit limit used
New issue shares under AEP, LTIP and historical ExecutiveShare Option Schemes within 5 per cent limit 11,956,616 2.34% 25,540,553 46.81%As above plus SAYE within 10 per cent limit 14,325,653 2.80% 51,081,106 28.04%
Share price movements during 2014The mid-market closing price of the company’s shares at 31 December 2014 was £1.672 (31 December 2013: £3.136). The intra-daytrading price of the company’s shares during 2014 was between £1.518 and £3.554.
Executive director external appointmentsExecutive directors are entitled to accept non-executive appointments outside the company providing that the Board’s approvalis sought. During the year, Tony Durrant was a non-executive director of Greenergy Fuels Holdings Limited for which hereceived a fee of £40,000 in 2014. Tony also served as an Advisory Committee Member of FlowStream Commodities Ltd(appointed with effect from 13 August 2013) for which he receives an annual fee of US$20,000. Robin Allan was appointedChairman of the Association of British Independent Oil Exploration Companies (BRINDEX) on 1 January 2014 and receives nofee for this role.
As a result of the acquisition of EnCore, the company has a 17.71 per cent interest in Egdon Resources plc (Egdon) and isentitled to board representation. Mr Lodge was appointed to the board of Egdon as a non-executive director on 9 March 2012and has elected to donate his fees to several charities (2014: £20,000; 2013: £15,000). External directorship fees have not beenincluded in the single total figure of remuneration for executive directors, on page 99.

Premier Oil plc 2014 Annual Report and Financial Statements / 113
Outstanding share awards under the annual bonus, LTIP and previous long-term incentive awards, and share option schemesAnnual bonus schemeDetails of outstanding share awards held in respect of the deferred element of previous annual bonus awards for directors areshown below. Shares awarded in 2013 and 2014 are dividend equivalent share awards made in accordance with the rules of theDeferred Bonus Share Plan.
Number ofNumber of shares held at
Number of shares made Market 31 Decembershares held subject to Event and price of 2014 Earliest
Date of at 1 January award during number of shares on (or at date vesting Director grant 2014 2014 shares date of award of leaving) date
Robin Allan 25.03.11 18,108 – (18,108) 499.75p 0 25.03.1419.01.12 3,643 – – 425.40p 3,643 19.01.1514.06.13 238 – (238) 348.10p 0 25.03.1414.06.13 47 – – 348.10p 47 19.01.1521.05.14 – 59 – 307.00p 59 19.01.15
22,036 59 (18,346) 3,749
Tony Durrant 25.03.11 19,312 – (19,312) 499.75p 0 25.03.1419.01.12 3,996 – – 425.40p 3,996 19.01.1514.06.13 254 – (254) 348.10p 0 25.03.1414.06.13 52 – – 348.10p 52 19.01.1521.05.14 – 65 – 307.00p 65 19.01.15
23,614 65 (19,566) 4,113
Neil Hawkings 25.03.11 18,108 – (18,108) 499.75p 0 25.03.1419.01.12 3,643 – – 425.40p 3,643 19.01.1514.06.13 238 – (238) 348.10p 0 25.03.1414.06.13 47 – – 348.10p 47 19.01.1521.05.14 – 59 – 307.00p 59 19.01.15
22,036 59 (18,346) 3,749
Andrew Lodge 25.03.11 18,108 – (18,108) 499.75p 0 25.03.1419.01.12 3,643 – – 425.40p 3,643 19.01.1514.06.13 238 – (238) 348.10p 0 25.03.1414.06.13 47 – – 348.10p 47 19.01.1521.05.14 – 59 – 307.00p 59 19.01.15
22,036 59 (18,346) 3,749
Former director
Simon Lockett 2 25.03.11 26,256 – (26,256) 499.75p 0 25.03.1419.01.12 5,876 – – 425.40p 5,876 19.01.1514.06.13 345 – (345) 348.10p 0 25.03.1414.06.13 77 – – 348.10p 77 19.01.1521.05.14 – 95 – 307.00p 95 19.01.15
32,554 95 (26,601) 6,048
Notes:
1 The 2011 awards and dividend equivalent share awards vested on 24 March 2014. The mid-market closing price on 24 March 2014 was £2.8795.
2 Simon Lockett’s awards shown above were released in full following his departure, using the closing mid-market share price for 15 August 2014 of£3.368 per share.

114 / Premier Oil plc 2014 Annual Report and Financial Statements
DIRECTORS’ REMUNERATION REPORT (continued)
Outstanding share awards under the annual bonus, LTIP and previous long-term incentive awards, and share option schemes(continued)LTIP Equity Pool AwardsAs at 31 December 2014, three Equity Pools were outstanding, as follows:
Outstanding Equity Pool allocation (% of Pool)
Starting market Tony Robin Neil Andrew RichardCycle Performance period capitalisation Durrant2 Allan Hawkings Lodge Rose3
20121 01.01.12 – 31.12.14 £1,703m 6.00% 4.25% 4.25% 4.25% 4.25%(pro-rated) (pro-rated)
2013 01.01.13 – 31.12.15 £1,823m 6.00% 4.25% 4.25% 4.25% 4.25%(pro-rated) (pro-rated)
2014 01.01.14 – 31.12.16 £1,660m 6.00% 4.25% 4.25% 4.25% 4.25%(pro-rated) (pro-rated)
Notes:
1 The Committee determined in January 2015 that the 2012 Equity Pool Awards will not vest. For further details see page 105.
2 Tony Durrant was awarded 4.25 per cent of each Equity Pool cycle when serving as Finance Director. Additional Equity Pool points were awarded on 22 August 2014 in recognition of his appointment as Chief Executive, bringing his share of the Equity Pool to 6 per cent per cycle but with the additional1.75 per cent pro-rated to reflect the period for which he served as Chief Executive during each cycle.
3 Richard Rose joined as Finance Director on 8 September 2014. On 9 September 2014 he was awarded an equivalent of 4.25 per cent of each of the threeEquity Pools pro-rated to reflect the time served by him on the Board within each cycle.
LTIP Performance SharesIn each of 2012, 2013 and 2014, the executive directors were granted LTIP Performance Share Awards over shares with a value of150 per cent of salary for the CEO and 125 per cent of salary for the other executive directors, with adjustments made for TonyDurrant and new joiner Richard Rose during 2014 as detailed above. As at 31 December 2014, the executive directors had thefollowing allocations under the outstanding Performance Share Awards:
Awardsheld at 31December Market
Awards 2014 or at price ofheld at date of shares on Earliest
Date of 1 January leaving date of vestingDirector grant 2014 Granted Lapsed Vested if earlier award Performance period date
Robin 28.06.11 90,074 – (90,074) – 0 428.60p 01.01.11 – 31.12.13 01.01.14Allan 22.03.12 96,785 – – – 96,7851 426.20p 01.01.12 – 31.12.14 01.01.15
14.05.13 109,732 – – – 109,732 393.30p 01.01.13 – 31.12.15 01.01.1628.02.14 – 145,8882 – – 145,888 303.10p 01.01.14 – 31.12.16 01.01.17
296,591 145,888 (90,074) – 352,405
Tony 28.06.11 98,791 – (98,791) – 0 428.60p 01.01.11 – 31.12.13 01.01.14Durrant 22.08.14 – 4,6793 – – 4,679 334.70p 01.01.12 – 31.12.14 01.01.15
22.03.12 105,584 – – – 105,5841 426.20p 01.01.12 – 31.12.14 01.01.1522.08.14 – 13,0053 – – 13,005 334.70p 01.01.13 – 31.12.15 01.01.1614.05.13 119,910 – – – 119,910 393.30p 01.01.13 – 31.12.15 01.01.1628.02.14 – 159,3942 – – 159,394 303.10p 01.01.14 – 31.12.16 01.01.1722.08.14 – 92,9743 – – 92,974 334.70p 01.01.14 – 31.12.16 01.01.17
324,285 270,052 (98,791) – 495,546
Neil 28.06.11 90,074 – (90,074) – 0 428.60p 01.01.11 – 31.12.13 01.01.14Hawkings 22.03.12 96,785 – – – 96,7851 426.20p 01.01.12 – 31.12.14 01.01.15
14.05.13 109,732 – – – 109,732 393.30p 01.01.13 – 31.12.15 01.01.1628.02.14 – 145,8882 – – 145,888 303.10p 01.01.14 – 31.12.16 01.01.17
296,591 145,888 (90,074) – 352,405
Andrew 28.06.11 90,074 – (90,074) – 0 428.60p 01.01.11 – 31.12.13 01.01.14Lodge 22.03.12 96,785 – – – 96,7851 426.20p 01.01.12 – 31.12.14 01.01.15
14.05.13 109,732 – – – 109,732 393.30p 01.01.13 – 31.12.15 01.01.1628.02.14 – 145,8882 – – 145,888 303.10p 01.01.14 – 31.12.16 01.01.17
296,591 145,888 (90,074) – 352,405
Richard 09.09.14 – 4,8184 – – 4,818 341.30p 01.01.12 – 31.12.14 01.01.15Rose 09.09.14 – 20,2664 – – 20,266 341.30p 01.01.13 – 31.12.15 01.01.16
09.09.14 – 84,7884 – – 84,788 341.30p 01.01.14 – 31.12.16 01.01.17
– 109,872 – – 109,872

Premier Oil plc 2014 Annual Report and Financial Statements / 115
LTIP Performance Shares (continued)
Awardsheld at 31December Market
Awards 2014 or at price ofheld at date of shares on Earliest
Former Date of 1 January leaving date of Performance vestingDirector grant 2014 Granted Lapsed Vested if earlier award period date
Simon 28.06.11 174,337 – (174,337) – 0 428.60p 01.01.11 – 31.12.13 01.01.14Lockett 5 22.03.12 186,532 – – – 186,5321 426.20p 01.01.12 – 31.12.14 01.01.15
14.05.13 211,832 – – – 211,832 393.30p 01.01.13 – 31.12.15 01.01.1628.02.14 – 281,5902 – – 281,590 303.10p 01.01.14 – 31.12.16 01.01.17
572,701 281,590 (174,337) – 679,954
Notes:
1 The Committee determined in January 2015 that the 2012 Performance Share Awards will not vest. For further details see page 105.
2 Performance Share Awards were granted on 28 February 2014 using the closing mid-market price of 27 February 2014 (303.10p) to calculate the numberof shares under award.
3 Additional Performance Share Awards were granted to Tony Durrant on 22 August 2014 using the closing mid-market price of 21 August 2014 (334.70p)to calculate the number of shares under award.
4 Performance Share Awards were granted to Richard Rose on 9 September 2014 using the closing mid-market price of 8 September 2014 (341.30p) tocalculate the number of shares under award.
5 Simon Lockett left the company on 15 August 2014; awards in the above table reflect activity between 1 January 2014 and 15 August 2014. Following hisdeparture, outstanding awards were pro-rated to reflect his leaving date and will vest at the same time as other awards subject to performanceconditions being met.

116 / Premier Oil plc 2014 Annual Report and Financial Statements
DIRECTORS’ REMUNERATION REPORT (continued)
LTIP Performance Shares (continued)LTIP Deferred Shares and Matching SharesAt 31 December 2014, the executive directors held outstanding awards of Deferred Shares and Matching Awards granted underthe LTIP as set out below. No awards were made during FY2014.
Number of Number ofshares made Matching Number Market
Awards subject to Awards of shares price ofheld at award granted Event and held at 31 shares on Earliest
Date of Type of 1 January during during number of December date of Performance vestingDirector grant award 2014 2014 2014 shares 2014 award period date
Robin 20.01.12 Deferred 158,987 – – – 158,987 430.10p – 01.01.15Allan Share
22.03.12 Matching 397,467 – – – 397,467 426.20p 01.01.12 – 01.01.15Award 31.12.14
14.05.13 Deferred 59,878 – – – 59,878 393.30p – 01.01.16Share
24.06.13 Matching 149,695 – – – 149,695 336.80p 01.01.13 – 01.01.16Award 31.12.15
766,027 – – – 766,027
Tony 20.01.12 Deferred 162,913 – – – 162,913 430.10p – 01.01.15Durrant Share
22.03.12 Matching 407,282 – – – 407,282 426.20p 01.01.12 – 01.01.15Award 31.12.14
14.05.13 Deferred 63,870 – – – 63,870 393.30p – 01.01.16Share
24.06.13 Matching 159,675 – – – 159,675 336.80p 01.01.13 – 01.01.16Award 31.12.15
793,740 – – – 793,740
Neil 20.01.12 Deferred 158,987 – – – 158,987 430.10p – 01.01.15Hawkings Share
22.03.12 Matching 397,467 – – – 397,467 426.20p 01.01.12 – 01.01.15Award 31.12.14
14.05.13 Deferred 59,878 – – – 59,878 393.30p – 01.01.16Share
24.06.13 Matching 149,695 – – – 149,695 336.80p 01.01.13 – 01.01.16Award 31.12.15
766,027 – – – 766,027
Andrew 20.01.12 Deferred 154,081 – – – 154,081 430.10p – 01.01.15Lodge Share
22.03.12 Matching 385,202 – – – 385,202 426.20p 01.01.12 – 01.01.15Award 31.12.14
14.05.13 Deferred 59,878 – – – 59,878 393.30p – 01.01.16Share
24.06.13 Matching 149,695 – – – 149,695 336.80p 01.01.13 – 01.01.16Award 31.12.15
748,856 – – – 748,856
Former directorSimon 20.01.12 Deferred 227,581 – – – 227,581 430.10p – 01.01.15Lockett Share
22.03.12 Matching 568,952 – – – 568,952 426.20p 01.01.12 – 01.01.15Award 31.12.14
14.05.13 Deferred 104,190 – – – 104,190 393.30p – 01.01.16Share
24.06.13 Matching 260,475 – – – 260,475 336.80p 01.01.13 – 01.01.16Award 31.12.15
1,161,198 – – – 1,161,198
Notes:
1 There are no performance criteria for the Deferred Shares.
2 Matching Awards granted are the maximum award possible under the Matching Award scheme, subject to performance criteria based on TSR against acomparator group of listed companies in the oil and gas sector (see table below for constituents). Full vesting requires upper decile performance.
3 The Committee determined in January 2015 that the 2012 Matching Awards will not vest. For further details see page 105.

Premier Oil plc 2014 Annual Report and Financial Statements / 117
LTIP Performance Shares (continued)TSR comparator group constituents, by Performance Share Award/Matching Share Award cycle.
Company 2012 2013 2014 Company 2012 2013 2014
Afren 3 3 3 Indus Gas 3 3
Africa Oil 3 3 Ithaca Energy 3
Anadarko Petroleum 3 3 JKX Oil & Gas 3
Apache 3 3 Lundin Petroleum 3 3 3
Bankers Petroleum 3 3 3 Medco Energi Internasional 3
Beach Energy 3 3 3 Nautical Petroleum 1 3
Cairn Energy 3 3 3 Newfield Exploration 3 3
Cairn India 3 3 3 Nexen 2 3
Carrizo Oil & Gas 3 3 Noble Energy 3 3 3
Coastal Energy 3 3 3 Oil Search 3 3 3
Det Norske Oljeselskap 3 3 3 Ophir Energy 3 3 3
Devon Energy 3 3 3 Origin Energy 3 3 3
DNO International 3 3 3 Oryx Petroleum 3
Dragon Oil 3 3 3 PTT EP 3 3 3
Energen 3 3 Rockhopper Exploration 3 3 3
EnQuest 3 3 3 Salamander Energy 3 3 3
Etab. Maurel et Prom 3 3 3 Santos 3 3 3
Faroe Petroleum 3 Slavneft-Megionneftegaz 3
Gas Malaysia 3 SOCO International 3 3 3
Genel Energy 3 3 Talisman Energy 3 3 3
Gulf Keystone 3 3 3 TransGlobe Energy 3 3
Gulfport Energy 3 Tullow Oil 3 3 3
Heritage Oil 4 3 3 Woodside Petroleum 3 3 3
Note:
1 Nautical Petroleum was acquired by Cairn Energy in July 2012 and was therefore removed from the 2012 comparator group.
2 Nexen was acquired by CNOOC Limited in February 2013 and was therefore removed from the 2012 comparator group.
3 Coastal Energy was acquired in January 2014 and was therefore removed from the 2012 and 2013 comparator groups.
4 Heritage Oil was acquired in July 2014 and was therefore removed from the 2012 and 2013 comparator groups.

118 / Premier Oil plc 2014 Annual Report and Financial Statements
DIRECTORS’ REMUNERATION REPORT (continued)
Asset and Equity Plan (AEP)Final outstanding awards under the AEP vested or lapsed during 2014. Transactions during the year for the executive directorsunder the AEP are set out below:
Number MarketAwards of shares price ofheld at held at 31 shares on Earliest
Date of Type of 1 January December date of Performance vestingDirector grant award1 2014 Granted Lapsed Vested2 2014 award period date
Robin 25.03.11 Deferred 73,340 – – (73,340) 0 499.75p – 01.01.14 Allan Share
28.06.11 Matching 183,350 – (183,350) – 0 428.60p 01.01.11 – 01.01.14Award 31.12.13
256,690 – (183,350) (73,340) 0
Tony 25.03.11 Deferred 78,228 – – (78,228) 0 499.75p – 01.01.14Durrant Share
28.06.11 Matching 195,570 – (195,570) – 0 428.60p 01.01.11 – 01.01.14Award 31.12.13
273,798 – (195,570) (78,228) 0
Neil 25.03.11 Deferred 73,340 – – (73,340) 0 499.75p – 01.01.14Hawkings Share
28.06.11 Matching 183,350 – (183,350) – 0 428.60p 01.01.11 – 01.01.14Award 31.12.13
256,690 – (183,350) (73,340) 0
Andrew 25.03.11 Deferred 46,516 – – (46,516) 0 499.75p – 01.01.14Lodge Share
28.06.11 Matching 116,290 – (116,290) – 0 428.60p 01.01.11 – 01.01.14Award 31.12.13
162,806 – (116,290) (46,516) 0
Former directorSimon 25.03.11 Deferred 106,344 – – (106,344) 0 499.75p – 01.01.14Lockett Share
28.06.11 Matching 265,860 – (265,860) – 0 428.60p 01.01.11 – 01.01.14Award 31.12.13
372,204 – (265,860) (106,344) 0
Notes:
1 There are no performance criteria for the Deferred Shares. Matching Awards granted were the maximum award possible under the Matching Awardscheme, subject to performance criteria based on TSR against a comparator group of approximately 35 listed companies in the oil and gas sector. Fullvesting requires upper decile performance.
2 Deferred Shares vested on 27 February 2014. The mid-market closing price on 27 February 2014 was 303.10p. See the 2013 Directors’ RemunerationReport for further details of these awards, including Premier’s performance against the performance targets.

Premier Oil plc 2014 Annual Report and Financial Statements / 119
Share Options and Share Incentive PlanThe executive directors may also participate, on the same terms as all other eligible employees, in a Share Incentive Plan (SIP)and a Savings related Share Option Scheme (Save As You Earn (SAYE)) scheme.
SAYE 2009Directors’ interests under this scheme are shown below:
Optionsheld at 31
Acquisition Options Decemberprice per held at 2014
Date of share 1 January (*or dateDirector grant Exercisable dates (£) 2014 Granted Exercised Lapsed of leaving)
Robin Allan 03.05.12 01.06.17 – 30.11.17 3.1344 4,785 – – – 4,78507.05.14 01.06.19 – 30.11.19 2.4584 – 6,101 – – 6,101
10,886
Tony Durrant 03.05.12 01.06.17 – 30.11.17 3.1344 4,785 – – – 4,78507.05.14 01.06.17 – 30.11.17 2.4584 – 3,660 – – 3,660
8,445
Neil Hawkings 03.05.12 01.06.15 – 30.11.15 3.1344 2,871 – – – 2,87107.05.14 01.06.17 – 30.11.17 2.4584 – 3,660 – – 3,660
6,531
Andrew Lodge 10.05.13 01.06.16 – 30.11.16 3.1408 2,865 – – – 2,86507.05.14 01.06.17 – 30.11.17 2.4584 – 3,660 – – 3,660
6,525
Former director
Simon Lockett 10.05.13 01.06.16 – 30.11.16 3.1408 2,865 – – – 2,865*
Share Incentive PlanShares held beneficially in this plan by the directors during the financial year were as follows:
Total Total Total Partnership Matching Shares Dividend Partnership and
Shares awarded in Shares Matching Sharespurchased in 2014 at prices purchased Shares acquired
Shares held 2014 at prices between £1.9010 in 2014 at a held on betweenon 1 January between £1.9010 and £3.5436, price of 31 December 1 January and
Director 2014 and £3.54361 vesting from 2017 £3.4570 2014 25 February 2015
Robin Allan 18,890 506 506 278 20,180 312Tony Durrant 8,592 504 504 129 9,729 314Neil Hawkings 8,592 542 542 129 9,805 374Andrew Lodge 3,895 564 564 62 5,085 374Richard Rose 0 182 182 – 364 376
Former director
Simon Lockett 18,927 3161 316 278 19,837 –
1 Simon Lockett participated in the plan until his leaving date of 15 August 2014. Partnership and Matching Share Award prices ranged between £2.7260and £3.5436 per share during this period.
For and on behalf of the Remuneration Committee
Jane HinkleyChairman of the Remuneration Committee
25 February 2015

120 / Premier Oil plc 2014 Annual Report and Financial Statements
The directors present their annual report on the affairs of the group, together with the audited group financial statements andauditor’s report for the year ended 31 December 2014. There are certain disclosure requirements which form part of theDirectors’ Report and are included elsewhere in this annual report. Details regarding the location of information incorporated byreference into this Directors’ Report is set out on page 122.
DividendNo dividend is proposed in respect of the year ended 31 December 2014. (2013: 5 pence per share).
Annual General MeetingThe company’s next AGM will be held on Wednesday 13 May 2015 at 11.00am. The Notice of the AGM, together with details ofall resolutions which will be placed before the meeting, accompanies this report and is also available online at www.premier-oil.com
DirectorsThe directors of the company as at 25 February 2015 are shown on pages 66 and 67. Anne Marie Cannon and David Bamfordwere appointed as non-executive directors on 1 February 2014 and 1 May 2014 respectively and were both elected byshareholders at the 2014 AGM. Simon Lockett resigned as a director on 15 August 2014 and Richard Rose was appointed asFinance Director on 8 September 2014 and will stand for election by shareholders at the 2015 AGM. Tony Durrant, formerFinance Director, was appointed Chief Executive on 25 June 2014.
Articles of AssociationThe company’s Articles of Association may only be amended by special resolution at a General Meeting of shareholders. Thecompany’s Articles of Association contain provisions regarding the appointment, retirement and removal of directors. A directormay be appointed by an ordinary resolution of shareholders in a General Meeting following nomination by the Board or amember (or members) entitled to vote at such a meeting. The directors may appoint a director during any year provided thatthe individual stands for re-election by shareholders at the next AGM. Further detail regarding the appointment andreplacement of directors is included in the Corporate Governance Report.
Subject to applicable law and the company’s Articles of Association the directors may exercise all powers of the company.Details of the matters reserved for the board are set out on the company’s website.
Indemnification of directors and insuranceThe company has granted an indemnity to all of its directors under which the company will, to the fullest extent permitted bylaw and to the extent provided by the Articles of Association, indemnify them against all costs, charges, losses and liabilitiesincurred by them in the execution of their duties. The company also has directors’ and officers’ liability insurance in place, anddetails of the policy are given to new directors on appointment.
Share capitalDetails of the company’s issued share capital, together with details of the movements in the issued share capital during the yearare shown in note 19 to the consolidated financial statements. The company has one class of Ordinary Share which carries noright to fixed income. Each share carries the right to one vote at General Meetings of the company.
Subject to applicable law and the company’s Articles of Association the directors may exercise all powers of the company,including the power to authorise the issue and/or market purchase of the company’s shares, subject to an appropriate authoritybeing given to the directors by shareholders in a General Meeting and any conditions attaching to such authority. Detailregarding shares bought back in the year is provided below. The current authority, approved at the 2014 AGM, for the allotmentof relevant securities is for a nominal amount of up to (i) £22,001,825 and (ii) equity securities up to a nominal amount of£44,003,651 less the nominal amount of any shares issued under part (i) of the authority. These standard authorities arerenewable annually and the directors will seek to renew the authority to issue and buyback its own shares at the 2015 AGM.
There are no specific restrictions on the size of a holding nor on the transfer of shares, both of which are governed by thegeneral provisions of the Articles of Association and prevailing legislation. The directors are not aware of any agreementsbetween holders of the company’s shares that may result in restrictions on the transfer of securities or on voting rights. Detailsof employee share schemes are set out in note 19. The voting rights in relation to the shares held within the Employee BenefitTrust are exercisable by the Trustee but it has no obligation to do so. Details of the number of shares held by the EmployeeBenefit Trust are set out in the Annual Report on Remuneration on page 112. No person has any special rights of control overthe company’s share capital and all issued shares are fully-paid.
American Depositary Receipt programmePremier Oil plc has a sponsored Level 1 American Depositary Receipt (ADR) programme which BNY Mellon administers and forwhich it acts as Depositary. Each ADR represents one ordinary share of the company. The ADRs trade on the US over-the-countermarket under the symbol PMOIY. When dividends are paid to shareholders, the Depositary converts such dividends into US dollars,net of fees and expenses, and distributes the net amount to ADR holders. Contact details for BNY Mellon are set out in theShareholder Information section of this report.
DIRECTORS’ REPORT

Premier Oil plc 2014 Annual Report and Financial Statements / 121
Share buybackSubject to applicable law and appropriate authority being granted by shareholders in a General Meeting, the directors have thepower to authorise the market purchase of the company’s shares.
At the 2014 AGM, shareholders authorised the directors to make market purchases up to a maximum of approximately 15 per centof the company’s issued share capital (being £9,900,821 in nominal value) excluding treasury shares. Any shares purchased underthis authority may either be cancelled or may be held as treasury shares provided that the number of shares held does notexceed 10 per cent of issued share capital.
The minimum price, exclusive of expenses, which may be paid for an ordinary share is an amount equal to the nominal value ofan ordinary share. The maximum price, exclusive of expenses, which may be paid for an ordinary share is the higher of (i) anamount equal to 5 per cent above the average of the closing mid-market price of an ordinary share for the five business daysimmediately preceding the date of the purchase, and (ii) that stipulated by Article 5(1) of the Buy-back and StabilisationRegulation, Commission Regulation (EC) of 22 December 2003.
On 27 February 2014, the company announced its intention to initiate a share buyback programme of an amount up to £75.0m,to be reviewed by the Board on a quarterly basis. The rationale for the programme was that the excess capital available, overand above the long-run model assumption based at US$85/bbl, should be returned to shareholders by way of a buybackprogramme, and should be continued whilst shares in the company continued to trade at a discount to Net Asset Value. By theend of the third quarter of the buyback programme, the oil price had decreased significantly such that model assumptions werere-visited and scaled downwards. In light of the uncertainty of the oil price near-term direction and impact on expenditure, theBoard agreed that the programme should be put on hold with the situation to be revisited later in 2015.
During 2014, 18,455,248 ordinary shares were repurchased by the company and cancelled, representing 3.61 per cent of thecompany’s issued share capital as at 31 December 2014. The nominal value of the shares purchased as at 31 December 2014was £2,306,906 and the aggregate amount of consideration paid by the company for those shares was £55,730,484. InDecember, a decision was taken by the Board to postpone the buyback programme pending a recovery in the oil price. As at31 December 2014, the remaining authority outstanding for the company to make market purchases of its own shares, underthe shareholders’ resolution of 14 May 2014, stood at an aggregate nominal value of up to £7,593,915.
Significant shareholdingsAs at 25 February 2015 the company had received notification from the institutions below, in accordance with Chapter 5 of theDisclosure and Transparency Rules, of their significant holdings of voting rights (3 per cent or more) in its ordinary shares:
Date of notification Notified Notifiedto the stock number of percentage of Nature of
Name of shareholder exchange voting rights voting rights1 holding
AXA Investment Managers SA1 24/10/2011 40,173,814 8.58% IndirectSchroders plc 02/02/2012 27,072,247 5.12% IndirectBlackRock, Inc. 12/02/2015 25,838,377 5.06% IndirectArtemis Investment Management LLP 27/11/2013 26,509,959 5.01% Direct & indirectAviva plc and its subsidiaries1 27/04/2009 3,933,529 4.95% Direct & indirectAmeriprise Financial Inc 20/01/2012 24,666,346 4.66% Direct & indirectNorges Bank 22/01/2015 20,761,229 4.06% DirectRoyal London Asset Management Limited 22/04/2014 16,106,042 3.06% DirectLegal & General Group Plc 20/12/2013 16,089,316 3.04% Direct
Notes:
1 Interests shown for AXA Investment Managers SA pre-date the EnCore transaction and related share issue in 2012; interests shown for Aviva plc and itssubsidiaries pre-date the Share Split in 2011.

122 / Premier Oil plc 2014 Annual Report and Financial Statements
Hedging and risk managementDetails of the group’s policy on hedging and risk management are provided in the Financial Review. A further disclosure hasbeen made in note 17 of the notes to the consolidated financial statements related to various financial instruments andexposure of the group to price, credit, liquidity and cash flow risk.
Political donationsNo political contributions were made during the year (2013: US$nil).
Important events since 31 December 2014Details of significant events since the balance sheet date are contained in note 26 to the financial statements.
Information set out in the Strategic ReportThe Strategic Report set out on pages 2 to 65 provides a comprehensive review of the performance of the company’soperations for the year ended 31 December 2014 and the potential future developments of those operations. The StrategicReport also includes details of the company’s principal risks and uncertainties and research and development activities duringthe year. Information regarding the company’s policy applied during the year relating to the recruitment, employment, training,career development and promotion of staff including employment of disabled persons is included within the CorporateResponsibility section of the Strategic Report on page 60. In addition, information regarding the company’s greenhouse gasemissions is also included in the Corporate Responsibility section of the Strategic Report on page 59. In accordance withs414C(11) of the Companies Act 2006, the directors have chosen to set out the information outlined above, required to beincluded in the Directors’ Report, in the Strategic Report.
The Strategic Report and the Directors’ Report together include the ‘management report’ for the purposes of the FCA’sDisclosure & Transparency Rules (DTR 4.1.8R).
Information set out elsewhere in this Annual ReportInformation regarding the company’s governance arrangements is included in the Corporate Governance Report and relatedBoard committee reports on pages 68 to 119.
For the purposes of Listing Rule 9.8.4C R, the information required to be disclosed by Listing Rule 9.8.4 R can be found in thefollowing locations:
Listing Rule sub-section Item Location
9.8.4 (1) Interest capitalised Financial statements, note 5, page 146
AuditorEach of the persons who is a director at the date of approval of this Annual Report and Financial Statements confirms that:
• so far as the director is aware, there is no relevant audit information of which the company’s auditor is unaware; and
• the director has taken all reasonable steps that he/she ought to have taken as a director in order to make himself/herselfaware of any relevant audit information and to establish that the company’s auditor is aware of that information.
This confirmation is given and should be interpreted in accordance with the provisions of s418 of the Companies Act 2006.
On the recommendation of the Audit and Risk Committee, resolutions to reappoint Deloitte LLP as the company’s auditor andto authorise the directors to determine the auditor’s remuneration will be put to shareholders at the forthcoming AGM.
By order of the Board
Stephen HuddleCompany Secretary
25 February 2015
9.8.4 (5) Waiver of emoluments by a director Directors’ Remuneration Report, page 100
9.8.4 (4) Details of long-term incentive schemesestablished to facilitate the recruitmentof a director
Directors’ Remuneration Report, page 111
DIRECTORS’ REPORT (continued)

Premier Oil plc 2014 Annual Report and Financial Statements / 123
STATEMENT OF DIRECTORS’ RESPONSIBILITIES
The directors are responsible for preparing the Annual Report and Financial Statements in accordance with applicable law andregulations.
Group financial statementsCompany law requires the directors to prepare financial statements for each financial year. Under that law the directors arerequired to prepare the group financial statements in accordance with International Financial Reporting Standards (IFRSs) asadopted by the European Union (EU) and Article 4 of the International Accounting Standards (IAS) Regulation and have electedto prepare the parent company financial statements in accordance with United Kingdom Generally Accepted AccountingPractice (United Kingdom Accounting Standards and applicable law). Under company law the directors must not approve thefinancial statements unless they are satisfied that they give a true and fair view of the state of affairs of the company and of theprofit or loss of the company for that period.
In preparing the parent company financial statements, the directors are required to:
• select suitable accounting policies and then apply them consistently;
• make judgements and accounting estimates that are reasonable and prudent;
• state whether applicable UK Accounting Standards have been followed, subject to any material departures disclosed andexplained in the financial statements; and
• prepare the financial statements on the going concern basis unless it is inappropriate to presume that the company willcontinue in business.
In preparing the group financial statements, International Accounting Standard 1 – ‘Presentation of Financial Statements’ –requires that directors:
• properly select and apply accounting policies;
• present information, including accounting policies, in a manner that provides relevant, reliable, comparable andunderstandable information;
• provide additional disclosures when compliance with the specific requirements in IFRSs are insufficient to enable users tounderstand the impact of particular transactions, other events and conditions on the entity’s financial position and financialperformance; and
• make an assessment of the company’s and group’s ability to continue as a going concern.
The directors are responsible for keeping adequate accounting records that are sufficient to show and explain the company’stransactions and disclose with reasonable accuracy at any time the financial position of the company and group and enablethem to ensure that the financial statements comply with the Companies Act 2006. They are also responsible for safeguardingthe assets of the company and hence for taking reasonable steps for the prevention and detection of fraud and otherirregularities.
The directors are responsible for the maintenance and integrity of the corporate and financial information included on thecompany’s website (www.premier-oil.com). Legislation in the United Kingdom governing the preparation and dissemination offinancial statements may differ from legislation in other jurisdictions.
Directors’ responsibility statementWe confirm to the best of our knowledge:
1 the group financial statements, prepared in accordance with International Financial Reporting Standards, as adopted by theEU, give a true and fair view of the assets, liabilities, financial position and profit or loss of the company and the undertakingsincluded in the consolidation taken as a whole;
2 the Strategic Report includes a fair review of the development and performance of the business and the position of thecompany and the undertakings included in the consolidation taken as a whole, together with a description of the principalrisks and uncertainties that they face; and
3 the Annual Report and Financial Statements, taken as a whole, are fair, balanced and understandable and provide theinformation necessary for shareholders to assess the company’s performance, business model and strategy.
Tony Durrant Richard RoseChief Executive Officer Finance Director
25 February 2015 25 February 2015
124 / Premier Oil plc 2014 Annual Report and Financial Statements
ACCOUNTING POLICIES
General informationPremier Oil plc is a limited company incorporated in Scotland and listed on the London Stock Exchange. The address of theregistered office is Premier Oil plc, 4th Floor, Saltire Court, 20 Castle Terrace, Edinburgh, EH1 2EN. The principal activities of thecompany and its subsidiaries (the group) are oil and gas exploration and production in the Falkland Islands, Indonesia, Norway,Pakistan, the United Kingdom, Vietnam and Rest of the World.
These financial statements are presented in US dollars since that is the currency in which the majority of the group’s transactionsare denominated.
Adoption of new and revised standardsIn the current year the following new and revised Standards and Interpretations have been adopted, - none of which have amaterial impact on the group’s annual results.
• New and revised Standards on consolidation, joint arrangements, associates and disclosure: In May 2011, a package of fivestandards on consolidation, joint arrangements, associates and disclosures was issued comprising IFRS 10 ConsolidatedFinancial Statements, IFRS 11 Joint Arrangements, IFRS 12 Disclosure of Interests in Other Entities, IAS 27 (as revised in 2011)Separate Financial Statements and IAS 28 (as revised in 2011) Investments in Associates and Joint Ventures. Subsequent tothe issue of these standards, amendments to IFRS 10, IFRS 11 and IFRS 12 were issued to clarify certain transitional guidanceon the first-time application of the standards. In the current year, the group has applied for the first time IFRS 10, IFRS 11, IFRS12 and IAS 28 (as revised in 2011) together with the amendments to IFRS 10, IFRS 11 and IFRS 12 regarding the transitionalguidance. IAS 27 (as revised in 2011) has also been applied and it deals only with separate financial statements.
• Amendments to IFRS 10, IFRS 12 and IAS 27 Investment Entities
• Amendments to IAS 36 Recoverable Amount Disclosures for Non-Financial Assets
• Amendments to IAS 39 Novation of Derivatives and Continuation of Hedge Accounting
• IFRIC 21 Levies
• Amendments to IAS 32 Offsetting financial assets and financial liabilities
At the date of approval of these financial statements, the following standards and interpretations which have not been applied inthese financial statements were in issue but not yet effective (and in some cases had not yet been adopted by the European Union):
• IFRS 9 Financial Instruments
• IFRS 15 Revenue from Contracts with Customers
• IFRS 11 (amendments) Accounting for Acquisitions of Interests in Joint Operations
• IAS 16 and IAS 38 (amendments) Clarification of Acceptable Methods of Depreciation and Amortisation
• IAS 16 and IAS 41 (amendments) Agriculture: Bearer Plants
• IAS 19 (amendments) Defined Benefit Plans: Employee Contributions
• IAS 27 (amendments) Equity Method in Separate Financial Statements
• IFRS 10 and IAS 28 (amendments) Sale or Contribution of Assets between an Investor and its Associate or Joint Venture
• Annual Improvements to IFRSs: 2010-2012 Amendments to: IFRS 2 Share-based Payment, IFRS 3 Business Combinations,IFRS 8 Operating Segments, IFRS 13 Fair Value Measurement, IAS 16 Property, Plant and Equipment, IAS 24 Related PartyDisclosures and IAS 38 Intangible Assets
• Annual Improvements to IFRSs: 2011-2013 Amendments to: IFRS 1 First-time Adoption of International Financial ReportingStandards, IFRS 3 Business Combinations, IFRS 13 Fair Value Measurement and IAS 40 Investment Property
• Annual Improvements to IFRSs: 2012-2014 Cycle Amendments to: IFRS 5 Non-current Assets Held for Sale and DiscontinuedOperations, IFRS 7 Financial Instruments: Disclosures, IAS 19 Employee Benefits and IAS 34 Interim Financial Reporting
The directors do not expect that the adoption of the Standards listed above will have a material impact on the financial statementsof the group in future periods, except that IFRS 9 will impact both the measurement and disclosures of financial instruments andIFRS 15 may have an impact on revenue recognition and related disclosures. Beyond the information above, it is not practicableto provide a reasonable estimate of the effect of IFRS 9 and IFRS 15 until a detailed review has been completed.

Premier Oil plc 2014 Annual Report and Financial Statements / 125
Basis of preparationThe financial statements have been prepared in accordance with International Financial Reporting Standards (IFRSs) as adoptedby the European Union.
The financial statements are prepared under the historical cost convention except for the revaluation of financial instrumentsand certain oil and gas properties at the transition date to IFRS.
The financial statements have been prepared on the going concern basis. Further information relating to the going concernassumption is provided in the Financial Review.
The principal accounting policies adopted are set out below.
Basis of consolidationThe consolidated financial statements incorporate the financial statements of the company and entities controlled by thecompany (its subsidiaries) made up to 31 December each year. Control is achieved when a company is exposed, or has rights,to variable returns from its involvement with the entity and has the ability to affect those returns through its power over the entity.
The results of subsidiaries acquired or disposed of during the year are included in the income statement from the effective dateof acquisition or up to the effective date of disposal, as appropriate.
Where necessary, adjustments are made to the financial statements of subsidiaries to bring the accounting policies used intoline with those used by other members of the group.
All significant inter-company transactions and balances between group entities are eliminated on consolidation.
Business combinationsAcquisitions of subsidiaries and businesses are accounted for using the acquisition method. The consideration for eachacquisition is measured at the aggregate of the fair values (at the date of exchange) of assets given, liabilities incurred orassumed, and equity instruments issued by the group in exchange for control of the acquiree. Acquisition-related costs arerecognised in profit or loss as incurred.
Where applicable, the consideration for the acquisition includes any asset or liability resulting from a contingent considerationarrangement, measured at its acquisition-date fair value. Subsequent changes in such fair values are adjusted against the cost ofacquisition where they qualify as measurement period adjustments (see below). All other subsequent changes in the fair valueof contingent consideration classified as an asset or liability are accounted for in accordance with relevant IFRSs. Changes in thefair value of contingent consideration classified as equity are not recognised.
The acquiree’s identifiable assets, liabilities and contingent liabilities that meet the conditions for recognition under IFRS 3 (2008)are recognised at their fair value at the acquisition date, except that:
• deferred tax assets or liabilities and liabilities or assets related to employee benefit arrangements are recognised andmeasured in accordance with IAS 12 Income Taxes and IAS 19 Employee Benefits respectively;
• liabilities or equity instruments related to the replacement by the group of an acquiree’s share-based payment awards aremeasured in accordance with IFRS 2 Share-based Payment; and
• assets (or disposal groups) that are classified as held for sale in accordance with IFRS 5 Non-current Assets Held for Sale andDiscontinued Operations are measured in accordance with that Standard.
If the initial accounting for a business combination is incomplete by the end of the reporting period in which the combinationoccurs, the group reports provisional amounts for the items for which the accounting is incomplete. Those provisional amountsare adjusted during the measurement period (see below), or additional assets or liabilities are recognised to reflect newinformation obtained about facts and circumstances that existed as of the acquisition date that, if known, would have affectedthe amounts recognised as of that date.
The measurement period is the period from the date of acquisition to the date the group obtains complete information aboutfacts and circumstances that existed as of the acquisition date, and is subject to a maximum of one year.
Fina
ncia
l Sta
tem
ents
126 / Premier Oil plc 2014 Annual Report and Financial Statements
ACCOUNTING POLICIES (continued)
GoodwillGoodwill arising in a business combination is recognised as an asset at the date that control is acquired (the acquisition date).Goodwill is measured as the excess of the sum of the consideration transferred over the net of the acquisition-date amountsof the identifiable assets acquired and the liabilities assumed.
If, after reassessment, the group’s interest in the fair value of the acquiree’s identifiable net assets exceeds the sum of theconsideration transferred, the excess is recognised immediately in profit or loss as a bargain purchase gain.
Goodwill is not amortised but is reviewed for impairment at least annually. For the purpose of impairment testing, goodwill isallocated to each of the group’s cash-generating units expected to benefit from the synergies of the combination. Cash-generatingunits to which goodwill has been allocated are tested for impairment annually, or more frequently when there is an indicationthe unit may be impaired. If the recoverable amount of the cash-generating unit is less than the carrying amount of the unit,the impairment loss is allocated first to reduce the carrying amount of any goodwill allocated to the unit and then to the otherassets of the unit pro-rata on the basis of the carrying amount of each asset in the unit. An impairment loss recognised forgoodwill is not reversed in a subsequent period.
On disposal of a subsidiary, the attributable amount of goodwill is included in the determination of the profit or loss on disposal.
Interest in joint arrangementsA joint arrangement is one in which two or more parties have joint control. Joint control is the contractually agreed sharing ofcontrol of an arrangement, which exists only when decisions about the relevant activities require the unanimous consent of theparties sharing control.
Most of the group’s activities are conducted through joint operations, whereby the parties that have joint control of thearrangement have the rights to the assets, and obligations for the liabilities, relating to the arrangement. The group reports itsinterests in joint operations using proportionate consolidation – the group’s share of the assets, liabilities, income and expensesof the joint operation are combined with the equivalent items in the consolidated financial statements on a line-by-line basis.
A joint venture, which normally involves the establishment of a separate legal entity, is a contractual arrangement whereby theparties that have joint control of the arrangement have the rights to the arrangement’s net assets. The results, assets andliabilities of a joint venture are incorporated in the consolidated financial statements using the equity method of accounting.During 2014, the group did not have any material interests in joint ventures.
Where the group transacts with its joint operations, unrealised profits and losses are eliminated to the extent of the group’sinterest in the joint operation.
Interests in associatesAn associate is an entity over which the group has significant influence, through the power to participate in the financial andoperating policy decisions of the investee, but which is not a subsidiary or a joint arrangement. The results, assets and liabilitiesof an associate are incorporated in these financial statements using the equity method of accounting.
Assets held for saleNon-current assets (and disposal groups) classified as held for sale are measured at the lower of carrying amount and fair valueless costs to sell. Non-current assets and disposal groups are classified as held for sale if their carrying amount will be recoveredthrough a sales transaction rather than through continuing use. This condition is regarded as met only when the sale is highlyprobable and the asset (or disposal group) is available for immediate sale in its present condition. Management must becommitted to the sale which should be expected to qualify for recognition as a completed sale within one year from the dateof classification.
Sales revenue and other incomeSales of petroleum production are recognised when goods are delivered or the title has passed to the customer.
Interest income is accrued on a time basis, by reference to the principal outstanding and at the effective interest rate applicable.
Dividend income from investments is recognised when the shareholders’ rights to receive payment have been established.

Premier Oil plc 2014 Annual Report and Financial Statements / 127
Oil and gas assetsThe company applies the successful efforts method of accounting for exploration and evaluation (E&E) costs, having regard tothe requirements of IFRS 6 –‘Exploration for and Evaluation of Mineral Resources’.
(a) Exploration and evaluation assetsUnder the successful efforts method of accounting, all licence acquisition, exploration and appraisal costs are initiallycapitalised in well, field or specific exploration cost centres as appropriate, pending determination. Expenditure incurredduring the various exploration and appraisal phases is then written off unless commercial reserves have been established orthe determination process has not been completed.
Pre-licence costsCosts incurred prior to having obtained the legal rights to explore an area are expensed directly to the income statementas they are incurred.
Exploration and evaluation costsCosts of E&E are initially capitalised as E&E assets. Payments to acquire the legal right to explore, costs of technicalservices and studies, seismic acquisition, exploratory drilling and testing are capitalised as intangible E&E assets.
Tangible assets used in E&E activities (such as the group’s vehicles, drilling rigs, seismic equipment and other property,plant and equipment used by the company’s exploration function) are classified as property, plant and equipment.However, to the extent that such a tangible asset is consumed in developing an intangible E&E asset, the amount reflectingthat consumption is recorded as part of the cost of the intangible asset. Such intangible costs include directly attributableoverhead, including the depreciation of property, plant and equipment utilised in E&E activities, together with the cost ofother materials consumed during the exploration and evaluation phases.
E&E costs are not amortised prior to the conclusion of appraisal activities.
Treatment of E&E assets at conclusion of appraisal activitiesIntangible E&E assets related to each exploration licence/prospect are carried forward, until the existence (or otherwise)of commercial reserves has been determined subject to certain limitations including review for indications of impairment.If commercial reserves have been discovered, the carrying value, after any impairment loss, of the relevant E&E assets,is then reclassified as development and production assets. If, however, commercial reserves have not been found, thecapitalised costs are charged to expense after conclusion of appraisal activities.
(b) Development and production assetsDevelopment and production assets are accumulated generally on a field-by-field basis and represent the cost ofdeveloping the commercial reserves discovered and bringing them into production, together with the E&E expendituresincurred in finding commercial reserves transferred from intangible E&E assets, as outlined in accounting policy (a) above.
The cost of development and production assets also includes the cost of acquisitions and purchases of such assets, directlyattributable overheads, finance costs capitalised, and the cost of recognising provisions for future restoration anddecommissioning.
Depreciation of producing assetsThe net book values of producing assets are depreciated generally on a field-by-field basis using the unit-of-productionmethod by reference to the ratio of production in the year and the related commercial (proved and probable) reserves ofthe field, taking into account future development expenditures necessary to bring those reserves into production.
Producing assets are generally grouped with other assets that are dedicated to serving the same reserves for depreciationpurposes, but are depreciated separately from producing assets that serve other reserves.
Pipelines are depreciated on a unit-of-throughput basis.
(c) Impairment of development and production assetsAn impairment test is performed whenever events and circumstances arising during the development or production phaseindicate that the carrying value of a development or production asset may exceed its recoverable amount.
The carrying value is compared against the expected recoverable amount of the asset, generally by reference to the presentvalue of the future net cash flows expected to be derived from production of commercial reserves. The cash generatingunit applied for impairment test purposes is generally the field, except that a number of field interests may be grouped asa single cash generating unit where the cash inflows of each field are interdependent.
Any impairment identified is charged to the income statement as additional depreciation. Where conditions giving rise toimpairment subsequently reverse, the effect of the impairment charge is also reversed as a credit to the income statement,net of any depreciation that would have been charged since the impairment.
128 / Premier Oil plc 2014 Annual Report and Financial Statements
ACCOUNTING POLICIES (continued)
Oil and gas assets (continued)(d) Acquisitions, asset purchases and disposals
Acquisitions of oil and gas properties are accounted for under the acquisition method when the assets acquired andliabilities assumed constitute a business.
Transactions involving the purchase of an individual field interest, or a group of field interests, that do not constitute abusiness, are treated as asset purchases irrespective of whether the specific transactions involve the transfer of the fieldinterests directly or the transfer of an incorporated entity. Accordingly, no goodwill and no deferred tax gross up arises, andthe consideration is allocated to the assets and liabilities purchased on an appropriate basis.
Proceeds on disposal are applied to the carrying amount of the specific intangible asset or development and productionassets disposed of and any surplus is recorded as a gain on disposal in the income statement.
(e) DecommissioningProvision for decommissioning is recognised in full when the related facilities are installed. The amount recognised is thepresent value of the estimated future expenditure. A corresponding amount equivalent to the provision is also recognisedas part of the cost of the related oil and gas property. This is subsequently depreciated as part of the capital costs of theproduction facilities. Any change in the present value of the estimated expenditure is dealt with prospectively as anadjustment to the provision and the oil and gas property. The unwinding of the discount is included as a finance cost.
InventoriesInventories, except for petroleum products, are valued at the lower of cost and net realisable value. Petroleum products andunder and over lifts of crude oil are recorded at net realisable value, under inventories and other debtors or creditors respectively.
TaxThe tax expense/credit represents the sum of the tax currently payable/recoverable and deferred tax movements during the year.
The tax currently payable is based on taxable profit for the year. Taxable profit differs from net profit as reported in the incomestatement because it excludes items of income or expense that are taxable or deductible in other years and it further excludesitems that are never taxable or deductible. The group’s liability for current tax is calculated using tax rates that have beenenacted or substantively enacted by the balance sheet date.
Deferred tax is the tax expected to be payable or recoverable on differences between the carrying amounts of assets andliabilities in the financial statements and the corresponding tax bases used in the computation of taxable profit, and isaccounted for using the balance sheet liability method. Deferred tax liabilities are generally recognised for all taxable temporarydifferences and deferred tax assets are recognised to the extent that it is probable that taxable profits will be available againstwhich deductible temporary differences can be utilised. Such assets and liabilities are not recognised if the temporary differencearises from goodwill/excess of fair value over cost or from the initial recognition (other than in a business combination) of otherassets and liabilities in a transaction that affects neither the taxable profit nor the accounting profit.
Deferred tax liabilities are recognised for taxable temporary differences arising on investments in subsidiaries and associates,and interests in joint ventures, except where the group is able to control the reversal of the temporary difference and it isprobable that the temporary difference will not reverse in the foreseeable future.
The carrying amount of deferred tax assets is reviewed at each balance sheet date and reduced to the extent that it is no longerprobable that sufficient taxable profits will be available to allow all or part of the asset to be recovered. The group reassesses itsunrecognised deferred tax asset each year taking into account changes in oil and gas prices, the group’s proven and probablereserve profile and forecast capital and operating expenditures.
Deferred tax is calculated at the tax rates that are expected to apply in the period when the liability is settled or the asset isrealised based on tax laws and rates that have been enacted or substantially enacted at the balance sheet date. Deferred tax ischarged or credited in the income statement, except when it relates to items charged or credited in other comprehensiveincome, in which case the deferred tax is also dealt with in other comprehensive income.
Deferred tax assets and liabilities are offset when there is a legally enforceable right to set off current tax assets against currenttax liabilities and when they relate to income taxes levied by the same tax authority and the group intends to settle its currenttax assets and liabilities on a net basis.

Premier Oil plc 2014 Annual Report and Financial Statements / 129
Translation of foreign currenciesIn the accounts of individual companies, transactions denominated in foreign currencies, being currencies other than thefunctional currency, are recorded in the local currency at actual exchange rates as of the dates of the transactions. Monetaryassets and liabilities denominated in foreign currencies at the balance sheet date are reported at the rates of exchangeprevailing at the balance sheet date. Non-monetary assets and liabilities carried at fair value that are denominated in foreigncurrencies are translated at the rates prevailing at the date when the fair value was determined. Any gain or loss arising from achange in exchange rate subsequent to the dates of the transactions is included as an exchange gain or loss in the incomestatement. Non-monetary assets held at historic cost are translated at the date of purchase and are not retranslated.
On consolidation, the assets and liabilities of the group’s overseas operations are translated at exchange rates prevailing on thebalance sheet date. Income and expense items are generally translated at the average exchange rates for the year. Exchangedifferences arising, if any, are classified as equity and transferred to the group’s translation reserve. Such translation differencesare recognised as income or as expenses in the year in which the operation is disposed of.
Group retirement benefitsPayments to defined contribution retirement benefit plans are charged as an expense as they fall due. Payments made to state-managed retirement benefit schemes are dealt with as payments to defined contribution plans where the group’sobligations under the schemes are equivalent to those arising in a defined contribution retirement benefit plan.
The group operates a defined benefit pension scheme, which requires contributions to be made to a separately administeredfund. The cost of providing benefits is determined using the projected unit credit method, with actuarial valuations beingcarried out at each balance sheet date. Actuarial gains and losses are recognised immediately in the statement ofcomprehensive income. Past service cost is also recognised immediately to the extent that the benefits are already vested, andotherwise is amortised on a straight-line basis over the average period until the benefits become vested.
The retirement benefit obligation recognised in the balance sheet represents the present value of the defined benefitobligation as adjusted for unrecognised past service cost, and as reduced by the fair value of plan assets. Any asset resultingfrom this calculation is limited to unrecognised past service cost, plus the present value of available refunds and reductions infuture contributions to the plan.
RoyaltiesRoyalties are charged as production costs to the income statement in the year in which the related production is recognised as income.
LeasingRentals payable for assets under operating leases are charged to the income statement on a straight-line basis over the lease term.
Financial instrumentsFinancial assets and financial liabilities are recognised in the group’s balance sheet when the group becomes a party to thecontractual provisions of the instrument.
Trade receivablesTrade receivables are stated at their nominal value as reduced by appropriate allowances for estimated irrecoverable amounts.
Bank borrowingsInterest-bearing bank loans and overdrafts are recorded at the proceeds received, net of direct issue costs. Finance charges,including premiums payable on settlement or redemption and direct issue costs, are accounted for on an accrual basis to theincome statement using the effective interest method and are added to the carrying amount of the instrument to the extent thatthey are not settled in the year in which they arise.
Borrowing costsBorrowing costs directly relating to the construction or production of a qualifying capital project under construction are capitalisedand added to the project cost during construction until such time as the assets are substantially ready for their intended use,i.e. when they are capable of commercial production. Where the funds used to finance a project form part of general borrowings,the amount capitalised is calculated using a weighted average of rates applicable to relevant general borrowings of the groupduring the period. All other borrowing costs are recognised in the income statement in the period in which they are incurred.
Trade payablesTrade payables are stated at their nominal value.

130 / Premier Oil plc 2014 Annual Report and Financial Statements
ACCOUNTING POLICIES (continued)
Derivative financial instrumentsThe group uses derivative financial instruments (derivatives) to manage its exposure to changes in foreign currency exchangerates, interest rates and oil price fluctuations.
All derivative financial instruments are initially recorded at cost, including transaction costs. Derivatives are subsequently carriedat fair value. Apart from those derivatives designated as qualifying cash flow hedging instruments, all changes in fair value arerecorded as financial income or expense in the year in which they arise.
For the purposes of hedge accounting, hedging relationships may be of three types: fair value hedges are hedges of particularrisks that may change the fair value of a recognised asset or liability; cash flow hedges are hedges of particular risks that maychange the amount or timing of future cash flows; and hedges of net investment in a foreign entity are hedges of particular risksthat may change the carrying value of the net assets of a foreign entity. Currently the group only has cash flow hedge relationships.
To qualify for hedge accounting the hedging relationship must meet several strict conditions on documentation, probability ofoccurrence, hedge effectiveness and reliability of measurement. If these conditions are not met, then the relationship does notqualify for hedge accounting. In this case the hedging instrument and the hedged item are reported independently as if therewere no hedging relationship. In particular any derivatives are reported at fair value, with changes in fair value included infinancial income or expense.
For qualifying cash flow hedges, the hedging instrument is recorded at fair value. The portion of any change in fair value thatis an effective hedge is included in equity, and any remaining ineffective portion is reported in financial income. If the hedgingrelationship is the hedge of a firm commitment or highly probable forecasted transaction, the cumulative changes of fair valueof the hedging instrument that have been recorded in equity are included in the initial carrying value of the asset or liability atthe time it is recognised. For all other qualifying cash flow hedges, the cumulative changes of fair value of the hedginginstrument that have been recorded in equity are included in financial income at the time when the forecasted transactionaffects net income.
Derivatives embedded in other financial instruments or non-derivative host contracts are treated as separate derivatives whentheir risks and characteristics are not closely related to those of host contracts and the host contracts are not carried at fair valuewith unrealised gains or losses reported in the income statement. Embedded derivatives which are closely related to hostcontracts, including in particular price caps and floors within the group’s oil sales contracts, are not separated and are notcarried at fair value.
Fair value is defined as the price that would be received to sell an asset or paid to transfer a liability in an orderly transactionbetween market participants at the measurement date. It is determined by reference to quoted market prices adjusted forestimated transaction costs that would be incurred in an actual transaction, or by the use of established estimation techniquessuch as option pricing models and estimated discounted values of cash flows.
Cash and cash equivalentsCash comprises cash in hand and short-term deposits, less overdrafts.
Cash equivalents comprise funds held in term deposit accounts with an original maturity not exceeding three months.
Share-based paymentsThe group issues equity-settled share-based payments to certain employees. Equity-settled share-based payments are measuredat fair value (excluding the effect of non market-based vesting conditions) at the date of grant. The fair value determined at thegrant date of the equity-settled share-based payments is expensed on a straight-line basis over the vesting period, based onthe group’s estimate of shares that will eventually vest and adjusted for the effect of non market-based vesting conditions.
Fair value is measured by use of a Monte Carlo simulation. The main assumptions are provided in note 19.

Premier Oil plc 2014 Annual Report and Financial Statements / 131
Convertible bondsThe net proceeds received from the issue of convertible bonds are split between a liability and an equity component at the dateof issue. The fair value of the liability component is estimated using the prevailing market interest rate for similar non-convertibledebt. The difference between the proceeds of issue of the convertible bonds and the fair value assigned to the liability component,representing the embedded option to convert the liability into equity of the group, is included in equity and is not re-measured.The liability component is carried at amortised cost.
Issue costs are apportioned between the liability and equity components of the convertible bonds based on their relativecarrying amounts at the date of issue. The portion relating to the equity component is charged directly against equity.
The interest expense on the liability component is calculated by applying the prevailing market interest rate, at the time of issue,for similar non-convertible debt to the liability component of the instrument. The difference between this amount and theinterest paid is added to the carrying amount of the convertible bonds.
Critical accounting judgements and key sources of estimation uncertaintyDetails of the group’s significant accounting judgements and critical accounting estimates are set out in these financialstatements and include:
• carrying value of intangible exploration and evaluation assets (note 8);
• carrying value of property, plant and equipment (note 9);
• proved and probable reserves estimates (note 9);
• decommissioning costs (note 16);
• tax and recognition of deferred tax assets (note 18).
132 / Premier Oil plc 2014 Annual Report and Financial Statements
Opinion on financial statements of Premier Oil plcIn our opinion:
• the financial statements give a true and fair view of the state of the group’s and of the parent company’s affairs as at31 December 2014 and of the group’s loss for the year then ended;
• the group financial statements have been properly prepared in accordance with International Financial Reporting Standards(IFRSs) as adopted by the European Union;
• the parent company financial statements have been properly prepared in accordance with United Kingdom GenerallyAccepted Accounting Practice; and
• the financial statements have been prepared in accordance with the requirements of the Companies Act 2006 and, as regardsthe group financial statements, Article 4 of the IAS Regulation.
The financial statements comprise the consolidated income statement, the consolidated statement of comprehensive income,the consolidated and parent company balance sheets, the consolidated cash flow statement, the consolidated statement ofchanges in equity, the parent company statement of total recognised gains and losses, the accounting policies and the relatednotes 1 to 26 in respect of the group financial statements and 1 to 13 in respect of the parent company financial statements.The financial reporting framework that has been applied in the preparation of the group financial statements is applicable lawand IFRSs as adopted by the European Union. The financial reporting framework that has been applied in the preparation ofthe parent company financial statements is applicable law and United Kingdom Accounting Standards (United KingdomGenerally Accepted Accounting Practice).
Going concernAs required by the Listing Rules we have reviewed the directors’ statement contained within the going concern section of theFinancial Review that the group is a going concern. Our audit work in response to going concern risk is summarised in thefollowing section of this report.
We confirm that:
• we have concluded that the directors’ use of the going concern basis of accounting in the preparation of the financialstatements is appropriate; and
• we have not identified any material uncertainties that may cast significant doubt on the group’s ability to continue as a going concern.
However, because not all future events or conditions can be predicted, this statement is not a guarantee as to the group’s abilityto continue as a going concern.
Our assessment of risks of material misstatementThe assessed risks of material misstatement described below are those that had the greatest effect on our audit strategy, theallocation of resources in the audit and directing the efforts of the engagement team. These risks are the same as those discussedin 2013 but with the addition of going concern on the grounds that there has been a significant drop in the oil price.
INDEPENDENT AUDITOR’S REPORT TO THE MEMBERS OF PREMIER OIL PLC

Premier Oil plc 2014 Annual Report and Financial Statements / 133
Going concern
Risk description How the scope of our audit responded to the risk
Following the significant recent decline in the oilprice, and on-going oil price volatility, there is aheightened degree of judgement as to the group’sability to comply with certain of the covenants withinits loan agreements throughout the going concernassessment period. Accordingly, we considered theappropriateness of the going concern assumption,the question as to whether there is a materialuncertainty and the adequacy of management’sdisclosure to be a key risk.
We have challenged the key assumptions in management’sforecast cash flows for the next 12 months (base case anddownside scenarios) by:
• comparing the cash flow forecasts with the Board approvedbudget, and obtaining explanations for any significantdifferences;
• ensuring consistency between the forecasts in the groupgoing concern model and those used in the asset value-in-usecalculations for impairment assessment purposes;
• assessing the historical accuracy of forecasts prepared bymanagement;
• comparing the oil price assumptions used in these forecaststo third party forecasts and publicly available forward curves;
• testing the mechanical accuracy of the model used;
• agreeing the group’s committed debt facilities and hedgingarrangements to supporting documentation;
• performing stress tests for a range of reasonably possiblescenarios (including oil price) on management’s cash flow andcovenant compliance forecasts for the going concern period;
• challenging management’s plans for mitigating any identifiedexposures, including their ability to amend the terms of theirexisting financing arrangements, obtain additional sources offinancing or undertake additional asset disposals;
• assessing the quality of the group’s relationships with thebanks providing the debt facilities; and
• considering whether the disclosures relating to going concernreferred to in the basis of preparation section of theaccounting policies are balanced, proportionate and clear.
We have concluded above that we agree with management’sadoption of the going concern basis of accounting and weagree with their conclusion that there are no materialuncertainties that may cast significant doubt on the group’sability to continue as a going concern.
Recoverability of intangible exploration and evaluation (E&E) assets
Risk description How the scope of our audit responded to the risk
In accordance with the relevant accounting standards,E&E costs are written off unless commercial reserveshave been established or the appraisal process is notcompleted. This was considered a key risk due to thesignificant judgements and estimates that are requiredto be assessed and the highly material nature of therelated balances in the financial statements.
We have considered the process by which management reviewtheir E&E assets to assess if there were any indicators ofimpairments for any of the group’s material field interests.We challenged the outcome of this review by participating inmeetings with key operational and finance staff to understandthe current status and future intention for each asset, confirmingthat all assets which remain capitalised are included in futurebudgets and are considered to contain potentially commercialvolumes of hydrocarbons and identifying any fields where thegroup’s right to explore is either at, or close to, expiry. Where anasset has been impaired we have obtained supporting evidencefor the events that led to the impairment. Note 8 of the financialstatements includes details of the group’s exploration assets andthe impairments of US$58.5 million which arose during the year.

134 / Premier Oil plc 2014 Annual Report and Financial Statements
INDEPENDENT AUDITOR’S REPORT TO THE MEMBERS OF PREMIER OIL PLC (continued)
Risk description How the scope of our audit responded to the risk
These are considered key risks due to the significantjudgements and estimates that need to be made inassessing both whether costs initially qualify forcapitalisation and whether any impairments have arisenat year-end. This is a particular area of focus for 2014given the fall in the oil price during the year.
The risk of impairment is greater where there arepotential impairment triggers such as reservesdowngrades or upward revisions to future cost estimates,or where assets have been recently impaired.
We have performed a review of the producing and developmentasset portfolio for indicators of impairment. Where indicatorsof impairment have been identified, we have ensured thatappropriate impairment calculations have been prepared.These are based on key assumptions which include:
• Commodity price;
• Reserves/production;
• Discount rate;
• Operating costs; and
• Capital costs.
We have assessed these assumptions by reference to publiclyavailable information, third party information, our knowledgeof the group and industry and also budgeted and forecastperformance. Where impairments were identified, we confirmedthat an appropriate provision has been recorded.
During the year, a total impairment charge was recorded ofUS$784.4 million, which primarily related to the Balmoral area,Solan, and Huntington in the UK and Chim Sáo in Vietnam.Further details are provided in note 9 to the financial statements.
We have also tested capitalised expenditure during the year ona sample basis to assess whether the related costs qualify forcapitalisation under the relevant accounting standards.
Capitalisation and impairment of oil and gas properties within property, plant and equipment
Risk description How the scope of our audit responded to the risk
Provisions for decommissioning are a judgemental areaas they include assumptions around estimateddecommissioning costs, discount rates and theeconomic life of a field, which in turn will depend onfactors such as oil price and operating costs.
We have assessed for appropriateness the key assumptionsunderlying the decommissioning calculation through:
• agreeing gross cost estimates to third party support orinternal engineer estimates;
• obtaining supporting evidence for any material revisions incost estimates during the year;
• confirming the decommissioning dates are consistent with thegroup’s latest internal economic models;
• comparing the discount rate to available market information;and
• testing the mechanical accuracy of management’sdecommissioning provision calculation.
The total provision at the end of 2014 was US$871 million (2013: US$838 million) and further details are provided in note 16to the financial statements.
Decommissioning provisions

Premier Oil plc 2014 Annual Report and Financial Statements / 135
The description of risks above should be read in conjunction with the significant issues considered by the Audit Committeediscussed on pages 78 to 79.
Our audit procedures relating to these matters were designed in the context of our audit of the financial statements as a whole,and not to express an opinion on individual accounts or disclosures. Our opinion on the financial statements is not modifiedwith respect to any of the risks described above, and we do not express an opinion on these individual matters.
Our application of materialityWe define materiality as the magnitude of misstatement in the financial statements that makes it probable that the economicdecisions of a reasonably knowledgeable person would be changed or influenced. We use materiality both in planning thescope of our audit work and in evaluating the results of our work.
We determined planning materiality for the group to be US$23 million (2013: US$30 million), which is below 5 per cent(2013: 7.5 per cent) of normalised pre-tax profit. Pre-tax profit has been normalised through the exclusion of one-off items,including impairment charges, that are audited separately and would, if included, significantly distort the materiality calculationyear-on-year. We have reduced the percentage applied to pre-tax profit in response to recent market and regulatory trendsin this area.
In order to ensure that we gain sufficient assurance and oversight of misstatements throughout the group, materiality for eachof the reporting components has been set at between US$12 million and US$15 million, depending on the relative size ofthe component.
We agreed with the Audit Committee that we would report to the Committee all audit differences in excess of US$0.5 million(2013: US$0.6 million), as well as differences below that threshold that, in our view, warranted reporting on qualitative grounds.We also report to the Audit Committee on disclosure matters that we identified when assessing the overall presentation of thefinancial statements.
An overview of the scope of our auditOur group audit was scoped by obtaining an understanding of the group and its environment, including group-wide controls,and assessing the risks of material misstatement at the group level.
Based on that assessment, we focused our group audit scope primarily on the audit work at five key locations, being London,Aberdeen, Vietnam, Indonesia and Pakistan. These locations were subject to a full scope audit, whilst a further two were subjectto an audit of specified account balances where the extent of our testing was based on our assessment of the risks of materialmisstatement and of the materiality of the group’s operations at those locations. These seven locations represent the principalbusiness units and account for materially all of the group’s net assets, revenue and profit before tax.
They were also selected to provide an appropriate basis for undertaking audit work to address the risks of materialmisstatement identified above.
At the parent entity level we also tested the consolidation process and carried out analytical procedures to confirm ourconclusion that there were no significant risks of material misstatement of the aggregated financial information of the remainingcomponents not subject to audit or audit of specified account balances.
The group audit team performs the audit work in London and Aberdeen and is also involved in the work of the componentauditor that have been engaged in Vietnam, Indonesia and Pakistan at all stages of the audit process. This includes aprogramme of planned visits that has been designed so that the Senior Statutory Auditor or senior members of the group auditteam visit key locations and review the work performed on the significant risks by the component auditor. During the year, visitswere made to all three overseas locations.
Accounting for income taxes
Risk description How the scope of our audit responded to the risk
This is considered a key risk due to the diversegeographical nature of the group, the different taxlegislation in place in the jurisdictions in which thegroup operates and the judgements applied in therecognition of deferred tax assets and provisions forpotential tax exposures.
We worked with tax specialists in the relevant locations tounderstand the tax legislation governing the group’s operationsin each of the jurisdictions in which the group operated duringthe year; we obtained the group’s taxation computations inrespect of current and deferred tax and assessed the computationsfor compliance with local tax legislation and IAS 12 IncomeTaxes; and we evaluated judgmental tax exposures and provisions,assessing the position taken by management in respect of theprobability and amount of potential exposures. This included anassessment of the recoverability of the group’s deferred taxassets, which totalled US$972 million at the year-end, andconsidering whether the supporting calculations are inaccordance with enacted tax legislation and are consistent withthe models used for the group’s IAS 36 impairment tests.

136 / Premier Oil plc 2014 Annual Report and Financial Statements
INDEPENDENT AUDITOR’S REPORT TO THE MEMBERS OF PREMIER OIL PLC (continued)
Opinion on other matters prescribed by the Companies Act 2006In our opinion:
• the part of the Directors’ Remuneration Report to be audited has been properly prepared in accordance with the CompaniesAct 2006; and
• the information given in the Strategic Report and the Directors’ Report for the financial year for which the financial statementsare prepared is consistent with the financial statements.
Matters on which we are required to report by exceptionAdequacy of explanations received and accounting recordsUnder the Companies Act 2006 we are required to report to you if, in our opinion:
• we have not received all the information and explanations we require for our audit; or
• adequate accounting records have not been kept by the parent company, or returns adequate for our audit have not beenreceived from branches not visited by us; or
• the parent company financial statements are not in agreement with the accounting records and returns.
We have nothing to report in respect of these matters.
Directors’ remunerationUnder the Companies Act 2006 we are also required to report if, in our opinion, certain disclosures of directors’ remunerationhave not been made or the part of the Directors’ Remuneration Report to be audited is not in agreement with the accountingrecords and returns. We have nothing to report arising from these matters.
Corporate Governance StatementUnder the Listing Rules we are also required to review the part of the Corporate Governance Statement relating to thecompany’s compliance with ten provisions of the UK Corporate Governance Code. We have nothing to report arising from ourreview.
Our duty to read other information in the Annual ReportUnder International Standards on Auditing (UK and Ireland), we are required to report to you if, in our opinion, information in theannual report is:
• materially inconsistent with the information in the audited financial statements; or
• apparently materially incorrect based on, or materially inconsistent with, our knowledge of the group acquired in the courseof performing our audit; or
• otherwise misleading.
In particular, we are required to consider whether we have identified any inconsistencies between our knowledge acquiredduring the audit and the directors’ statement that they consider the annual report is fair, balanced and understandable andwhether the annual report appropriately discloses those matters that we communicated to the Audit Committee which weconsider should have been disclosed. We confirm that we have not identified any such inconsistencies or misleadingstatements.
Respective responsibilities of directors and auditorAs explained more fully in the Directors’ Responsibilities Statement, the directors are responsible for the preparation of thefinancial statements and for being satisfied that they give a true and fair view. Our responsibility is to audit and express anopinion on the financial statements in accordance with applicable law and International Standards on Auditing (UK and Ireland).Those standards require us to comply with the Auditing Practices Board’s Ethical Standards for Auditors. We also comply withInternational Standard on Quality Control 1 (UK and Ireland). Our audit methodology and tools aim to ensure that our qualitycontrol procedures are effective, understood and applied. Our quality controls and systems include our dedicated professionalstandards review team and independent partner reviews.
This report is made solely to the company’s members, as a body, in accordance with Chapter 3 of Part 16 of the Companies Act2006. Our audit work has been undertaken so that we might state to the company’s members those matters we are required tostate to them in an auditor’s report and for no other purpose. To the fullest extent permitted by law, we do not accept or assumeresponsibility to anyone other than the company and the company’s members as a body, for our audit work, for this report, orfor the opinions we have formed.

Premier Oil plc 2014 Annual Report and Financial Statements / 137
Scope of the audit of the financial statementsAn audit involves obtaining evidence about the amounts and disclosures in the financial statements sufficient to give reasonableassurance that the financial statements are free from material misstatement, whether caused by fraud or error. This includes anassessment of: whether the accounting policies are appropriate to the group’s and the parent company’s circumstances andhave been consistently applied and adequately disclosed; the reasonableness of significant accounting estimates made bythe directors; and the overall presentation of the financial statements. In addition, we read all the financial and non-financialinformation in the annual report to identify material inconsistencies with the audited financial statements and to identify anyinformation that is apparently materially incorrect based on, or materially inconsistent with, the knowledge acquired by us inthe course of performing the audit. If we become aware of any apparent material misstatements or inconsistencies we considerthe implications for our report.
David Paterson ACA (Senior statutory auditor)For and on behalf of Deloitte LLPChartered Accountants and Statutory AuditorLondon, United Kingdom
25 February 2015

138 / Premier Oil plc 2014 Annual Report and Financial Statements
2014 2013Note $ million $ million
Sales revenues 1 1,629.4 1,501.0Other operating income – 38.7Cost of sales 2 (986.6) (856.1)Impairment charge on oil and gas properties* 9 (784.4) (178.7)Exploration expense 8 (58.5) (106.2)Pre-licence exploration costs (25.3) (30.1)Profit on disposal of non-current assets 8, 9 2.7 3.6 General and administration costs (25.4) (20.2)
Operating (loss)/profit (248.1) 352.0Share of profit in associate 10 1.9 –Interest revenue, finance and other gains 5 58.5 33.0Finance costs, other finance expenses and losses 5 (196.3) (98.4)Loss on commodity derivative financial instruments 17 – (1.2)
(Loss)/profit before tax (384.0) 285.4 Tax 6 173.7 (51.4)
(Loss)/profit after tax (210.3) 234.0
(Loss)/earnings per share (cents):Basic 7 (40.3) 44.2 Diluted 7 (40.3) 43.2
* The 2013 income statement has been restated to disclose separately the impairment charge on oil and gas properties.
The results relate entirely to continuing operations.
CONSOLIDATED INCOME STATEMENTFor the year ended 31 December 2014

Premier Oil plc 2014 Annual Report and Financial Statements / 139
2014 2013Note $ million $ million
(Loss)/profit for the year (210.3) 234.0
Cash flow hedges on commodity swaps:Gains/(losses) arising during the year 296.1 (25.0)Less: reclassification adjustments for (gains)/losses in the year (46.0) 0.8
17 250.1 (24.2)Tax relating to components of other comprehensive income (139.0) 13.9Cash flow hedges on interest rate and foreign exchange swaps 17 15.5 (0.8)Exchange differences on translation of foreign operations (48.3) (17.5)Losses on long-term employee benefit plans* 23 (0.2) (6.5)
Other comprehensive income/(expense) 78.1 (35.1)
Total comprehensive (expense)/income for the year (132.2) 198.9
* Not expected to be reclassified subsequently to profit and loss account.
All comprehensive income is attributable to the equity holders of the parent.
CONSOLIDATED STATEMENT OF COMPREHENSIVE INCOMEFor the year ended 31 December 2014

140 / Premier Oil plc 2014 Annual Report and Financial Statements
2014 2013Note $ million $ million
Non-current assets:Intangible exploration and evaluation assets 8 825.7 701.0Property, plant and equipment 9 2,430.0 2,885.9Goodwill 9 240.8 240.8Investment in associate 10 7.6 6.2Long-term employee benefit plan surplus 23 0.8 1.0Long-term receivables 11 494.1 198.1Deferred tax assets 18 971.7 762.4
4,970.7 4,795.4
Current assets:Inventories 26.1 49.5Trade and other receivables 11 411.0 421.8Tax recoverable 57.9 82.4Derivative financial instruments 17 273.4 15.9Cash and cash equivalents 12 291.8 448.9Asset held for sale 9 56.7 –
1,116.9 1,018.5
Total assets 6,087.6 5,813.9
Current liabilities:Trade and other payables 13 (544.5) (512.4)Current tax payable (84.2) (92.0)Provisions 16 (14.1) (13.1)Derivative financial instruments 17 (48.1) (38.3)Short-term debt 14 (300.0) –Liabilities directly associated with asset held for sale 9 (1.8) –
(992.7) (655.8)
Net current assets 124.2 362.7
Non-current liabilities:Convertible bonds 14 (228.1) (223.8)Other long-term debt 14 (1,858.1) (1,665.4)Deferred tax liabilities 18 (254.2) (306.8)Long-term provisions 16 (864.0) (824.6)Long-term employee benefit plan deficit 23 (18.3) (13.1)
(3,222.7) (3,033.7)
Total liabilities (4,215.4) (3,689.5)
Net assets 1,872.2 2,124.4
Equity and reserves:Share capital 19 106.7 110.5Share premium account 275.4 275.3Merger Reserve 374.3 374.3Retained earnings 1,142.3 1,342.1Other reserves (26.5) 22.2
1,872.2 2,124.4
The financial statements were approved by the Board of Directors and authorised for issue on 25 February 2015.
They were signed on its behalf by:
Tony Durrant Richard RoseChief Executive Finance Director
CONSOLIDATED BALANCE SHEETAs at 31 December 2014

Premier Oil plc 2014 Annual Report and Financial Statements / 141
Attributable to the equity holders of the parent
Other reserves
Share CapitalShare premium Retained Merger redemption Translation Equitycapital account earnings Reserve reserve reserves reserve Total
Note $ million $ million $ million $ million $ million $ million $ million $ million
At 1 January 2013 110.5 274.9 1,150.1 374.3 4.3 17.1 22.3 1,953.5Issue of Ordinary Shares – 0.4 – – – – – 0.4Purchase of ESOP Trust shares – – (12.8) – – – – (12.8)Provision for share-based 19 – – 24.6 – – – – 24.6paymentsTransfer between reserves* – – 4.0 – – – (4.0) –Dividends paid 25 – – (40.2) – – – – (40.2)Total comprehensive income – – 216.4 – – (17.5) – 198.9
At 1 January 2014 110.5 275.3 1,342.1 374.3 4.3 (0.4) 18.3 2,124.4Issue of Ordinary Shares – 0.1 – – – – – 0.1Purchase and cancellation (3.8) – (93.0) – 3.8 – – (93.0)of own sharesPurchase of ESOP Trust shares – – (6.4) – – – – (6.4)Provision for share-based 19 – – 23.3 – – – – 23.3paymentsTransfer between reserves* – – 4.2 – – – (4.2) –Dividends paid 25 – – (44.0) – – – – (44.0)Total comprehensive expense – – (83.9) – – (48.3) – (132.2)
At 31 December 2014 106.7 275.4 1,142.3 374.3 8.1 (48.7) 14.1 1,872.2
* The transfer between reserves relates to the non-cash interest on the convertible bonds, less the amortisation of the issue costs that were charged directlyagainst equity.
CONSOLIDATED STATEMENT OF CHANGES IN EQUITYFor the year ended 31 December 2014

142 / Premier Oil plc 2014 Annual Report and Financial Statements
2014 2013Note $ million $ million
Net cash from operating activities 21 924.3 802.5
Investing activities:Capital expenditure (1,195.5) (878.0)Disposal of oil and gas properties 130.7 61.0Loan to joint venture partner (318.4) (185.9)
Net cash used in investing activities (1,383.2) (1,002.9)
Financing activities:Proceeds from issuance of Ordinary Shares 0.1 0.4Purchase and cancellation of own shares (93.0) –Purchase of ESOP Trust shares (6.4) (12.8)Proceeds from drawdown of long-term bank loans 655.0 384.1Proceeds from issuance of senior loan notes – 156.7Proceeds from issuance of retail bonds – 245.8Debt arrangement fees (22.1) (7.1)Repayment of long-term bank loans (100.0) (200.0)Dividends paid (44.0) (40.2)Interest paid (98.1) (71.1)
Net cash from financing activities 291.5 455.8
Currency translation differences relating to cash and cash equivalents 10.3 6.1
Net (decrease)/increase in cash and cash equivalents (157.1) 261.5Cash and cash equivalents at the beginning of the year 448.9 187.4
Cash and cash equivalents at the end of the year 21 291.8 448.9
CONSOLIDATED CASH FLOW STATEMENTFor the year ended 31 December 2014

Premier Oil plc 2014 Annual Report and Financial Statements / 143
1. Operating segmentsThe group’s operations are located and managed in seven business units; namely the Falkland Islands, Indonesia, Norway,Pakistan (including Mauritania), the United Kingdom, Vietnam and the Rest of the World.
Some of the business units currently do not generate revenue or have any material operating income.
The group is only engaged in one business of upstream oil and gas exploration and production, therefore all information isbeing presented for geographical segments.
2014 2013$ million $ million
Revenue:Indonesia 325.7 295.9Pakistan (including Mauritania) 141.6 165.4Vietnam 473.3 468.2United Kingdom 688.8 571.5
Total group sales revenue 1,629.4 1,501.0Other operating income – United Kingdom – 38.7Interest and other finance revenue 39.4 10.9
Total group revenue 1,668.8 1,550.6
Group operating (loss)/profit:Indonesia 104.5 187.0Norway (17.4) (26.5)Pakistan (including Mauritania) 32.4 84.0Vietnam 153.5 195.9United Kingdom (446.6) (31.5)Rest of the World (23.6) (8.7)Unallocated* (50.9) (48.2)
Group operating (loss)/profit (248.1) 352.0Share of profit in associate 1.9 –Interest revenue, finance and other gains 58.5 33.0Finance costs and other finance expenses (196.3) (98.4)Loss on derivative financial instruments – (1.2)
(Loss)/profit before tax (384.0) 285.4Tax 173.7 (51.4)
(Loss)/profit after tax (210.3) 234.0
Balance sheetSegment assets:Falkland Islands 430.6 297.2Indonesia 702.0 731.5 Norway 197.9 231.3 Pakistan (including Mauritania) 101.7 117.4 Vietnam 569.9 648.5 United Kingdom 3,428.2 3,260.4 Rest of the World 92.1 62.8Unallocated* 565.2 464.8
Total assets 6,087.6 5,813.9
* Unallocated expenditure, assets and liabilities include amounts of a corporate nature and not specifically attributable to a geographical segment.These items include corporate general and administration costs, pre-licence exploration costs, cash and cash equivalents, mark-to-market valuationsof commodity contracts and interest rate swaps, convertible bonds and other short-term and long-term debt.
NOTES TO THE CONSOLIDATED FINANCIAL STATEMENTSFor the year ended 31 December 2014

144 / Premier Oil plc 2014 Annual Report and Financial Statements
NOTES TO THE CONSOLIDATED FINANCIAL STATEMENTS (continued)For the year ended 31 December 2014
1. Operating segments (continued)
2014 2013$ million $ million
Liabilities:Falkland Islands (28.5) (14.6)Indonesia (326.4) (296.3)Norway (60.3) (83.9)Pakistan (including Mauritania) (103.0) (88.4)Vietnam (322.7) (316.9)United Kingdom (913.9) (948.1)Rest of the World (26.2) (14.0)Unallocated* (2,434.4) (1,927.3)
Total liabilities (4,215.4) (3,689.5)
Other informationCapital additions and acquisitions:Falkland Islands 112.9 54.0Indonesia 149.2 101.0Norway 68.1 49.9Pakistan (including Mauritania) 33.4 33.8Vietnam 156.7 121.9United Kingdom 654.3 615.4Rest of the World 36.8 47.5
Total capital additions and acquisitions 1,211.4 1,023.5
Depreciation, depletion, amortisation and impairment:Indonesia 73.7 57.1Pakistan (including Mauritania) 41.8 42.5Vietnam 185.6 117.1United Kingdom 938.2 344.8Rest of the World 1.5 1.0
Total depreciation, depletion, amortisation and impairment 1,240.8 562.5
* Unallocated expenditure, assets and liabilities include amounts of a corporate nature and not specifically attributable to a geographical segment.These items include corporate general and administration costs, pre-licence exploration costs, cash and cash equivalents, mark-to-market valuationsof commodity contracts and interest rate swaps, convertible bonds and other short-term and long-term debt.
Out of the total group worldwide sales revenues of US$1,629.4 million (2013: US$1,501.0 million), revenues of US$688.8 million(2013:US$571.5 million) arose from sales of oil and gas to customers located in the UK.
Included in assets arising from the United Kingdom segment are non-current assets (excluding deferred tax assets) ofUS$2,246.7 million (2013: US$2,282.2 million) located in the UK. Included in depreciation, depletion, amortisation andimpairment are impairment charges in relation to the UK (US$732.3 million), Vietnam (US$41.8 million), Pakistan (includingMauritania) (US$5.3 million) and Indonesia (US$5.0 million).
Revenue from four customers (2013: four customers) each exceeded 10 per cent of the group’s consolidated revenue and amounted respectively to US$436.1 million, US$157.2 million and US$204.5 million arising from sales of crude oil (2013: US$468.9 million, US$199.1 million and US$234.4 million) and US$284.3 million arising from sales of gas (2013: US$302.8 million) across all operating segments.

Premier Oil plc 2014 Annual Report and Financial Statements / 145
2. Cost of sales
2014 2013Note $ million $ million
Operating costs 436.1 418.9Stock overlift/underlift movement 48.5 9.8Royalties 45.6 43.6Amortisation and depreciation of property, plant and equipment:Oil and gas properties 9 446.1 375.0Other fixed assets 9 10.3 8.8
986.6 856.1
3. Auditor’s remuneration
2014 2013$ million $ million
Audit fees:Fees payable to the company’s auditor for the company’s annual report 0.8 0.8Audit of the company’s subsidiaries pursuant to legislation 0.2 0.1
1.0 0.9
Non-audit fees:Other services pursuant to legislation – interim review 0.1 0.1Corporate finance services* – 0.1Tax services 0.3 0.2Information technology subscription fees for upstream data 0.2 0.1Other services** 0.1 0.1
0.7 0.6
* In 2013 work was performed on the issuance of senior loan notes and other long-term debt.
** Other services relate to fees payable to the company’s auditors for the audit of company’s joint operations and other assurance services.
The Audit and Risk Committee has a policy on the use of auditors in a non-audit capacity which is aimed at ensuring theircontinued independence. This policy is available on the group’s website. The use of the external auditors for servicesrelating to accounting systems or financial statement preparations is not permitted, as are various other services that couldgive rise to conflicts of interest or other threats to the auditor’s objectivity that cannot be reduced to an acceptable level byapplying safeguards.

146 / Premier Oil plc 2014 Annual Report and Financial Statements
NOTES TO THE CONSOLIDATED FINANCIAL STATEMENTS (continued)For the year ended 31 December 2014
4. Staff costs
2014 2013$ million $ million
Staff costs, including executive directors:Wages and salaries 148.9 144.6Social security costs 10.8 9.7Pension costs:Defined contribution 9.6 4.1Defined benefit 2.3 7.4
171.6 165.8
Staff costs above are recharged to joint venture partners or capitalised to the extent that they are directly attributable tocapital projects. The above costs include share-based payments to employees as disclosed in note 19.
2014 2013
Average number of employees during the year*:Technical and operations 657 612Management and administration 283 270
940 882
* Staff numbers include executive directors.
5. Interest revenue and finance costs
2014 2013Note $ million $ million
Interest revenue, finance and other gains:Short-term deposits 2.1 1.5Gain on forward contracts – 12.3Loan to joint venture partner 11 36.8 6.3Exchange differences and others 19.6 12.9
58.5 33.0
Finance costs:Bank loans, overdrafts and bonds (62.1) (37.8)Payable in respect of convertible bonds 14 (10.5) (10.3)Payable in respect of senior loan notes (31.3) (31.4)Long-term debt arrangement fees (7.0) (8.0)Loss on forward contracts (18.9) –Exchange differences and others (0.6) (0.1)
(130.4) (87.6)
Other finance expenses:Unwinding of discount on decommissioning provision 16 (46.9) (36.4)Provision for doubtful loan to joint venture partner 11 (61.2) –
(108.1) (36.4)
Gross finance costs and other finance expenses (238.5) (124.0)Finance costs capitalised during the year 9 42.2 25.6
(196.3) (98.4)
The amount of finance costs capitalised was determined by applying the weighted average rate of finance costs applicableto the borrowings of the group of 4.4 per cent (2013: 4.7 per cent) to the expenditures on the qualifying assets.
During the year a currency exchange gain of US$19.1 million was credited to income (2013: US$8.5 million). This excludedexchange gains and losses arising on financial instruments measured at fair value through profit or loss.

Premier Oil plc 2014 Annual Report and Financial Statements / 147
6. Tax
2014 2013Note $ million $ million
Current tax:UK corporation tax on profits* (1.5) (12.1)UK petroleum revenue tax 65.4 100.9Overseas tax 154.1 122.7Adjustments in respect of prior years 1.9 (22.3)
Total current tax 219.9 189.2
Deferred tax:UK corporation tax (382.2) (180.5)UK petroleum revenue tax 33.7 (6.4)Overseas tax (45.1) 49.1
Total deferred tax 18 (393.6) (137.8)
Tax (credit)/charge on (loss)/profit on ordinary activities (173.7) 51.4
* The UK corporation current tax credit of US$1.5 million consists of a UK tax refund relating to decommissioning costs incurred in 2014 and carriedback to prior periods.
The tax credit for the year can be reconciled to the loss per the consolidated income statement as follows:
2014 2013$ million $ million
Group (loss)/profit on ordinary activities before tax (384.0) 285.4
Group (loss)/profit on ordinary activities before tax at 64.0% weighted average rate (2013: 30.5%) (245.7) 87.2Tax effects of:Income/expenses that are not taxable/deductible in determining taxable profit 21.1 31.8Tax and tax credits not related to profit before tax (50.4) (70.2)Unrecognised tax losses 23.8 17.8Utilisation and recognition of tax losses not previously recognised (11.2) (0.2)Adjustments in respect of prior years 1.9 (22.3)Write down of deferred tax asset previously recognised 86.8 7.3
Tax (credit)/charge for the year (173.7) 51.4
Effective tax rate for the year 45.2% 18.0%
The weighted average rate is calculated based on the tax rates weighted according to the profit or loss before tax earnedby the group in each jurisdiction. The change in the weighted average rate year-on-year relates to the mix of profit and lossin each jurisdiction. The standard tax rate on UK ring fence profits is 62 per cent (2013: 62 per cent).
In the Autumn Statement, the UK Chancellor announced a two per cent reduction in the supplementary tax charge onprofits from 32 to 30 per cent, however, as at 31 December 2014 this was not substantively enacted.
Tax not related to profit before tax includes the impact of ring fence expenditure supplement (US$141.9 million), partially offset by the impact of the UK PRT charge.

148 / Premier Oil plc 2014 Annual Report and Financial Statements
NOTES TO THE CONSOLIDATED FINANCIAL STATEMENTS (continued)For the year ended 31 December 2014
7. (Loss)/earnings per shareThe calculation of basic (loss)/earnings per share is based on the (loss)/profit after tax and on the weighted average numberof Ordinary Shares in issue during the year. Basic and diluted (loss)/earnings per share are calculated as follows:
2014 2013$ million $ million
(Loss)/earnings(Loss)/earnings for the purposes of basic earnings per share being net profit attributable to owners of the company (210.3) 234.0Effect of dilutive potential Ordinary Shares:Interest on convertible bonds – 2014 anti-dilutive – 10.3
(Loss)/earnings for the purposes of diluted earnings per share (210.3) 244.3
Number of sharesWeighted average number of Ordinary Shares for the purposes of basic (loss)/earnings per share 521.9 529.2Effects of dilutive potential Ordinary Shares:Contingently issuable shares – 2014 anti-dilutive – 36.0
Weighted average number of Ordinary Shares for the purposes of diluted (loss)/earnings per share 521.9 565.2
(Loss)/earnings per share
Basic (40.3) 44.2
Diluted (40.3) 43.2
There were 37.1 million anti-dilutive potential Ordinary Shares in 2014 mainly comprising of shares to be issued onconversion of convertible bonds.
8. Intangible exploration and evaluation (E&E) assets
Oil and gas properties
TotalNote $ million
Cost:At 1 January 2013 658.0Exchange movements (17.3)Additions during the year 266.9Disposals* (101.3)Transfer from property, plant and equipment 0.9Exploration expense (106.2)
At 31 December 2013 701.0Exchange movements (37.1)Additions during the year 294.0Disposals (46.5)Transfer to property, plant and equipment (1.7)Exploration expense (58.5)Transfer to asset held for sale 9 (25.5)
At 31 December 2014 825.7
* Disposals in the prior year were for the group’s interests in the Grosbeak field in Norway and Block 07/03 in Vietnam.
The amounts for intangible E&E assets represent costs incurred on active exploration projects. These amounts are writtenoff to the income statement as exploration expense unless commercial reserves are established or the determinationprocess is not completed and there are no indications of impairment. The outcome of on-going exploration, and thereforewhether the carrying value of E&E assets will ultimately be recovered, is inherently uncertain.
During the year, the group sold its interest in the PL359 licence in Norway, which contained the Luno II discovery, for US$38.2 million cash consideration, recognising a loss before tax of US$9.7 million.

Premier Oil plc 2014 Annual Report and Financial Statements / 149
9. Property, plant and equipment
Oil and gas Otherproperties fixed assets Total$ million $ million $ million
Cost:At 1 January 2013 4,183.2 38.5 4,221.7Additions during the year 742.8 13.8 756.6Transfer from/(to) intangible E&E assets 3.3 (4.3) (1.0)
At 31 December 2013 4,929.3 48.0 4,977.3Exchange movements – (2.0) (2.0)Additions during the year 903.5 13.9 917.4Disposals (211.4) – (211.4)Transfer to asset held for sale (124.5) – (124.5)Transfer from intangible E&E assets 1.7 – 1.7
At 31 December 2014 5,498.6 59.9 5,558.5
Amortisation and depreciation:At 1 January 2013 1,509.0 19.8 1,528.8Exchange movements – 0.1 0.1Charge for the year 375.0 8.8 383.8Impairment charge 178.7 – 178.7
At 31 December 2013 2,062.7 28.7 2,091.4Exchange movements – (1.8) (1.8)Charge for the year 446.1 10.3 456.4Impairment charge 784.4 – 784.4Disposals (179.9) – (179.9)Transfer to asset held for sale (22.0) – (22.0)
At 31 December 2014 3,091.3 37.2 3,128.5
Net book value:At 31 December 2013 2,866.6 19.3 2,885.9
At 31 December 2014 2,407.3 22.7 2,430.0
* Finance costs that have been capitalised within oil and gas properties during the year total US$42.2 million (2013: US$25.6 million), at a weightedaverage interest rate of 4.4 per cent (2013: 4.7 per cent).
Other fixed assets include items such as leasehold improvements, motor vehicles and office equipment.
Amortisation and depreciation of oil and gas properties is calculated on a unit-of-production basis, using the ratio of oiland gas production in the period to the estimated quantities of proved and probable reserves on an entitlement basis atthe end of the period plus production in the period, on a field-by-field basis. Proved and probable reserve estimates arebased on a number of underlying assumptions including oil and gas prices, future costs, oil and gas in place and reservoirperformance, which are inherently uncertain. Management uses established industry techniques to generate its estimatesand regularly references its estimates against those of joint venture partners or external consultants. However, the amountof reserves that will ultimately be recovered from any field cannot be known with certainty until the end of the field’s life.
ImpairmentThe impairment charge in the current year relates to the Balmoral area (US$159.0 million), Huntington (US$186.0 million)and Solan (US$387.3 million) fields in the UK, the Chim Sáo field in Vietnam (US$41.8 million), the Kakap field in Indonesia (US$5.0 million) and the Chinguetti field in Mauritania (US$5.3 million). The impairment charge of US$784.4 million wascalculated by comparing the future discounted pre-tax cash flows expected to be derived from production of commercialreserves (the value-in-use) against the carrying value of the asset. The future cash flows were estimated using an oil priceassumption equal to the Dated Brent forward curve in 2015 and 2016, and US$85/bbl in ‘real’ terms thereafter and werediscounted using a pre-tax discount rate of 10 per cent for the UK assets (2013: 10 per cent) and 12.5 per cent for thenon-UK assets (2013: 12.5 per cent). Assumptions involved in impairment measurement include estimates of commercialreserves and production volumes, future oil and gas prices and the level and timing of expenditures, all of which areinherently uncertain. The principal cause of the impairment charge being recognised in the year is a reduction in the shortto medium term oil price assumption being used when determining the future discounted cash flows for each field. In addition to the impact of the reduced oil price assumption, a review of the expected decommissioning costs for theBalmoral area in the first half of 2014 has also driven part of the impairment charge, whilst the Solan impairment has in partbeen caused by an increase in the costs incurred to date and expected costs to complete the project.

150 / Premier Oil plc 2014 Annual Report and Financial Statements
9. Property, plant and equipment (continued)Impairment (continued)The recoverable amount of the assets that have been impaired in the year, based on the value-in-use assumptions set outabove are: Balmoral area US$34.5 million, Solan US$759.0 million, Huntington US$91.4 million, Chim Sáo US$484.2 millionand Kakap US$27.6 million. The Chinguetti field has no remaining net book value at 31 December 2014.
During the year, the group disposed of its interest in the Scott area assets in the UK North Sea for US$130 million, resultingin a pre-tax profit of US$96.3 million. In addition, the group announced its intention to sell its interests in Block A Aceh inIndonesia, resulting in the asset being reclassified as held for sale at 31 December 2014. An anticipated loss of US$76.9 millionhas been recognised for the sale of Block A Aceh, which was completed in early January 2015. At 31 December 2014,the assets separately held on the balance sheet for Block A Aceh are US$56.7 million (being principally US$25.5 millionof intangible E&E assets and US$102.5 million of PP&E, prior to a loss of US$76.9 million) and associated liabilities ofUS$1.8 million. The overall gain on disposal of non-current assets of US$2.7 million also includes the loss recognised inrelation to PL359 in Norway (see note 8) and the write-off of deferred consideration of US$7.0 million previously held forthe disposal of Block 07/03 in Vietnam during 2013.
GoodwillGoodwill of US$ 240.8 million has been specifically assigned to the Catcher field in the UK, which is considered the cash generating unit for the purposes of any impairment testing of this goodwill. The group tests goodwill annually forimpairment, or more frequently if there are indications that goodwill might be impaired. The recoverable amounts aredetermined from value-in-use calculations with the same key assumptions as noted for the impairment calculations above. The discount rate used is 10 per cent (2013: 10 per cent). The value-in-use forecast, which is formally approved bymanagement, takes into consideration cash flows which are expected to arise during the life of the Catcher field as a whole, currently expected to be around 2027. This period exceeds five years but is believed to be appropriate as it isunderpinned by estimates of commercial reserves provided by our in-house reservoir engineers using industry standardreservoir estimation techniques. The headroom between the recoverable amount and the carrying amount, including thegoodwill, is US$23.9 million. If the long-term oil price assumption used to determine the value-in-use of the Catcher fieldreduced by US$1.1/bbl from 2017 onwards, the recoverable amount of the Catcher field would be equal to its carryingvalue, including the goodwill.
10. InvestmentsPrincipal subsidiary undertakingsAt 31 December 2014, the company had investments in the following 100 per cent owned subsidiaries which principallyaffected the profits or net assets of the group. To avoid a statement of excessive length, details of investments which arenot significant have been omitted.
Country of incorporation Name of company Business and area of operation or registration
Premier Oil Group Ltd* Intermediate holding company, UK ScotlandPremier Oil Finance (Jersey) Ltd* Convertible bond issuing company, Jersey JerseyPremier Oil Holdings Ltd Intermediate holding company, UK England and WalesPremier Oil Overseas BV Intermediate holding company, Netherlands NetherlandsPremier Oil UK Ltd Exploration, production and development, UK ScotlandPremier Oil Natuna Sea BV Exploration, production and development, Indonesia NetherlandsPremier Oil Kakap BV Exploration, production and development, Indonesia NetherlandsPremier Oil Pakistan Holdings BV Intermediate holding company, Netherlands NetherlandsPremier Oil Pakistan Exploration Ltd Exploration, production and development, Pakistan England and WalesPremier Oil Pakistan Kadanwari Ltd Exploration, production and development, Pakistan Cayman IslandsPremier Oil Pakistan Kirthar BV Exploration, production and development, Pakistan NetherlandsPremier Oil Vietnam Offshore BV Exploration, production and development, Vietnam NetherlandsPremier Oil (Vietnam) Ltd Exploration, production and development, Vietnam British Virgin IslandsPremier Oil Norge AS Exploration, production and development, Norway NorwayPremier Oil Exploration and Production Ltd Exploration, production and development, Falkland Islands England and WalesPremier Oil do Brasil Petróleo e Gás Ltda Exploration, production and development, Brazil Brazil
* Held directly by Premier Oil plc. All other companies are held through subsidiary undertakings.
NOTES TO THE CONSOLIDATED FINANCIAL STATEMENTS (continued)For the year ended 31 December 2014
Premier Oil plc 2014 Annual Report and Financial Statements / 151
10. Investments (continued)Joint venturesThe group has a 49 per cent interest in Premco Energy Projects Company LLC, a company registered in the United ArabEmirates and a 50 per cent interest in Premco Energy Projects BV, a company registered in The Netherlands. The results ofthese two joint ventures, which are indirectly held through subsidiary undertakings and which are involved in businessdevelopment opportunities across the Middle East and North Africa region, were immaterial to the group in 2014 and 2013.
Associate CompanyThe group has a 17.71 per cent interest in Egdon Resources plc, a company registered in the United Kingdom, acquired aspart of the acquisition of EnCore. The results of Egdon Resources plc are accounted for using the equity method. EgdonResources plc prepare financial statements to 31 July, in 2014 a gain of US$1.9 million was included in the group’s incomestatement to represent the expected share of associate company results (2013: US$ nil).
11. ReceivablesTrade and other receivables
2014 2013$ million $ million
Trade receivables 274.9 309.1Other receivables 121.0 101.0Prepayments 15.1 11.7
411.0 421.8
The carrying values of the trade and other receivables are equal to their fair value as at the balance sheet date.
Long-term receivables
2014 2013$ million $ million
Other long-term receivables 7.9 5.9Loan to joint venture partner 486.2 192.2
494.1 198.1
The loan to joint venture partner comprises of a loan facility extended to a non operating partner for the purpose offinancing development costs of the Solan project. The loan carries fixed interest and is repayable through receipts from oilproduction of the field. The carrying value of the loan as at 31 December 2014 is net of a provision for doubtful debt ofUS$61.2 million (2013: US$ nil).
12. Cash and cash equivalents
2014 2013Note $ million $ million
Cash at bank and in hand 85.0 93.1Short-term deposits 206.8 355.8
21 291.8 448.9
13. Trade and other payables
2014 2013$ million $ million
Trade payables 93.7 83.1Accrued expenses 426.7 396.0Other payables 24.1 33.3
544.5 512.4
The carrying values of the trade and other payables approximate to their fair value as at the balance sheet date.

152 / Premier Oil plc 2014 Annual Report and Financial Statements
NOTES TO THE CONSOLIDATED FINANCIAL STATEMENTS (continued)For the year ended 31 December 2014
14. Borrowings
2014 2013Note $ million $ million
Convertible bonds* 228.5 224.2Other long-term debt – bank loans* 17 931.0 686.0Other short-term debt – bank loans* 17 300.0 –Other long-term debt – senior loan notes* 17 720.5 742.6Other long-term debt – retail bonds* 17 234.0 249.0
Total borrowings 2,414.0 1,901.8
* The carrying values of the convertible bonds and the other long-term debt on the balance sheet are stated net of the unamortised portion of the issue costs of US$0.4 million (2013: US$0.4 million) and debt arrangement fees of US$27.4 million (2013: US$12.2 million) respectively.US$300.0 million is also classified as falling due within one year.
A maturity analysis showing the ageing profile of the total borrowings is shown in note 17.
In the second quarter of the year, the group took advantage of favourable bank debt market conditions and low interestrates environment to refinance its US$695.0 million revolving credit and £316.4 million letters of credit facility. The refinancingcompleted on 7 July and the new facility of US$2.5 billion was put in place. The new facility has better economic terms,a lower coupon and flexibility to carve-out up to US$1 billion, for the issue of letters of credit. The group has the ability toborrow in all major currencies and the maturity of the facility can be extended at the bank’s option for a further two years,after the initial five year maturity period.
At the year-end, the group’s principal credit facilities comprised of:
• US$300.0 million term loan maturing in 2015, which was repaid in January 2015;
• US$150.0 million and £100.0 million term loans maturing in 2017;
• US$2.5 billion revolving and letters of credit facility maturing in 2019;
• US$576.0 million and €120.0 million senior loan notes maturing from 2018 to 2024; and
• £150.0 million of retail bonds maturing in 2020.
Financial CovenantsFinancial covenants are the same across all the group’s borrowings except for £150.0 million retail bonds and US$245.3 millionconvertible bonds which have no financial covenants. These financial covenants are tested on half-year (annualised) andfull-year basis.
The financial covenants are as follows:
Net debt up to 3 X EBITDAXInterest cover at least 4 X EBITDAX
The company has financing in US$, £ and €. The £ and € loans have been swapped into US$ at the transaction dates. In total,£250.0 million and €120.0 million have been swapped into US$ using cross currency swap markets at an average exchangerate of US$1.64:£ and US$1.34:€ respectively. However, all liabilities in currencies other than US$ have been translated at theexchange rate prevailing at the year-end.
Convertible bonds The bonds were issued on 1 November 2012, with a par value of US$245.3 million, exchange price of £4.34 (US$7.00 atfixed exchange rate) per share and a coupon of 2.5 per cent. These are convertible into Ordinary Shares of the company atany time from 11 August 2016 until six days before their maturity date of 27 July 2018. Under the terms, the exchange priceis to be adjusted on the occurrence of certain events, including any payment of dividends by the company. During the year,the company declared a dividend of 5 pence per Ordinary Share and consequently the exchange price was adjusted to£4.21, (US$6.79) per share. The total number of Ordinary Shares to be issued, if all bonds are converted at this adjustedexchange price is 36,117,351. If the bonds have not been previously purchased and cancelled, redeemed or converted,they will be redeemed at par value on 27 July 2018. Interest of 2.50 per cent per annum will be paid semi-annually in arrearsup to that date.

Premier Oil plc 2014 Annual Report and Financial Statements / 153
14. Borrowings (continued)Convertible bonds (continued)Issue costs were apportioned between the liability and equity components of the convertible bonds based on their relativecarrying amounts at the date of issue. The portion relating to the equity component was charged directly against equity.
$ million
Bonds – netTotal liability component at 1 January 2013 219.6Interest charged 10.3Interest paid (6.1)
Total liability component at 1 January 2014 223.8Interest charged 10.5Interest paid (6.2)
Total liability component at 31 December 2014 228.1
The total interest charged on the new bonds has been calculated by applying an effective annual interest rate of 4.55 per centto the liability component for the period. The non-cash accrual of interest will increase the liability component (as the cashinterest is only paid at 2.5 per cent, to US$245.3 million to maturity).
Retail bondsIn December 2013, the company put in place a £500.0 million Retail eligible Euro Medium Term Notes (EMTN) programunder which it has issued £150.0 million UK retail bonds (the bonds). The bonds have been listed on the Official List of theUK Listings Authority and admitted to trading on the London Stock Exchange’s regulated market and the electronic OrderBook of Retail Bonds (ORB). The bonds have a fixed coupon of 5 per cent and maturity of seven years.
Capital managementThe primary objective of the group’s capital management policy is to ensure that it maintains healthy capital ratios in orderto support its business and increase shareholder value. The group manages its capital structure and makes adjustments toit in light of changes in economic conditions. No changes were made in the objectives, policies or processes during theyears ended 31 December 2014 and 31 December 2013.
The group monitors capital using a gearing ratio, which is net debt divided by net assets plus net debt. The group’s policyis to keep the long-term gearing ratio below 50 per cent. Net debt comprises interest-bearing bank loans, senior loannotes, retail bonds and convertible bonds, less cash and short-term deposits.
Note 2014 2013
Net debt ($ million) 21 (2,122.2) (1,452.9)Net assets ($ million) 1,872.2 2,124.4Net assets plus net debt ($ million) 3,994.4 3,577.3
Gearing ratio (%) 53.1 40.6
15. Obligations under leases
2014 2013$ million $ million
Minimum lease payments under operating leases recognised as an expense in the year 87.1 63.3
Outstanding commitments for future minimum lease payments under non-cancellableoperating leases, which fall due as follows:Within one year 50.3 79.5In two to five years 233.8 231.3Over five years 721.8 37.2
1,005.9 348.0
Operating lease payments represent the group’s share of lease costs payable by the group for FPSOs and for certainrentals of its office properties, office equipment and motor vehicles.

154 / Premier Oil plc 2014 Annual Report and Financial Statements
16. Provisions
2014 2013$ million $ million
Decommissioning 871.3 837.7Onerous contract 6.8 –
878.1 837.7
2014 2013Note $ million $ million
Decommissioning costs:Total provisions at 1 January 837.7 682.1Revision arising from:
New provisions and changes in estimates 225.3 132.4Payments (4.3) (31.8)Disposals (181.1) –Exchange differences (53.2) 18.6
Unwinding of discount on decommissioning provision 5 46.9 36.4
Total provisions at 31 December 871.3 837.7Reclassification of short-term provisions to current liabilities (11.4) (13.1)
Long-term provisions at 31 December 859.9 824.6
The decommissioning provision represents the present value of decommissioning costs relating to oil and gas interests in the UK, Indonesia, Vietnam, Pakistan and Mauritania which are expected to be incurred up to 2038. These provisionshave been created based on Premier’s internal estimates and, where available, operators estimates. Based on the currenteconomic environment, assumptions have been made which are believed to be a reasonable basis upon which to estimatethe future liability. These estimates are reviewed regularly to take into account any material changes to the assumptions.However, actual decommissioning costs will ultimately depend upon future market prices for the necessary decommissioningworks required, which will reflect market conditions at the relevant time. Furthermore, the timing of decommissioning islikely to depend on when the fields cease to produce at economically viable rates. This in turn will depend upon future oiland gas prices, which are inherently uncertain.
New provisions and changes in estimates result from an increase in decommissioning estimates for operated fields in theUK, Indonesia and Vietnam. The disposal relates predominantly to the sale of the group’s interest in the Scott area assets inthe UK North Sea.
2014 2013$ million $ million
Onerous contract 6.8 –
Total provisions at 31 December 6.8 –Reclassification of short-term provisions to current liabilities (2.7) –
Long-term provisions at 31 December 4.1 –
The onerous contract relates to the on-going FPSO lease commitments for the group’s interest in the Chinguetti field inMauritania, following the decision to fully impair the related field interest in the current year (see note 9).
17. Financial instrumentsFinancial risk management objectives and policiesThe group’s principal financial liabilities, other than derivative financial instruments (derivatives), comprise accounts payable,bank loans, convertible bonds, retail bonds and senior loan notes. The main purpose of these financial instruments is tomanage short-term cash flow and to raise finance for the group’s capital expenditure programme. The group has variousfinancial assets such as accounts receivable, loan to joint venture partner and cash and short-term deposits, which arisedirectly from its operations.
It is group policy that all transactions involving derivatives must be directly related to the underlying business of the group.The group does not use derivative financial instruments for speculative exposures.
NOTES TO THE CONSOLIDATED FINANCIAL STATEMENTS (continued)For the year ended 31 December 2014

Premier Oil plc 2014 Annual Report and Financial Statements / 155
17. Financial instruments (continued)Financial risk management objectives and policies (continued)The main risks that could adversely affect the group’s financial assets, liabilities or future cash flows are commodity price risk,cash flow interest rate risk, foreign currency exchange risk, credit risk and liquidity risk. The group uses derivative financialinstruments to hedge these risk exposures. The use of financial derivatives is governed by the group’s policies and approvedby the Board of Directors, which provide written principles on the use of financial derivatives.
Derivative financial instrumentsThe group uses derivatives to manage its exposure to oil and gas price fluctuations and to changes in interest rates andforeign currency.
Oil and gas hedging is undertaken with swaps, collar options, reverse collars and hedges embedded in long-term crudeofftake agreements. Oil is hedged using Dated Brent oil price options. Indonesian gas is hedged using HSFO Singapore180cst which is the variable component of the gas price.
The group’s exposure to interest rates is managed by maintaining an appropriate mix of both fixed and floating interestrate borrowings within its debt portfolio. However, given the very low level of fixed interest rates available relative tohistorical rates, a substantial portion of the current drawings have been converted to fixed interest rates using the interestrate swap markets.
The group has £ and € currency exposure as a result of the financial instruments. These are managed through crosscurrency swap arrangements.
As the group reports in US dollars, since that is the currency in which the majority of the group’s transactions aredenominated, significant exchange rate exposures currently relate only to certain local currency (such as Pound Sterling,Norwegian Kroner) receipts and expenditures within individual business units. Exchange rate exposures are managedwithin approved policy parameters utilising forward foreign exchange contracts.
Fair value hierarchyIn line with IAS 39 – ‘Financial Instruments: Recognition and Measurement’ the group uses the following hierarchy fordetermining the fair value of financial instruments by valuation technique:
Level 1: quoted (unadjusted) prices in active markets for identical assets or liabilities;
Level 2: other techniques for which all inputs which have a significant effect on the recorded fair value are observable, eitherdirectly or indirectly; and
Level 3: techniques which use inputs which have a significant effect on the recorded value that are not based on observablemarket data.
As at 31 December 2014, the group held the following financial instruments measured at fair value (excluding any primaryfinancial instruments such as cash and bank loans):
Assets measured at fair valueFinancial assets at fair value through profit and loss:
At 31 December Level 1 Level 2 Level 3$ million $ million $ million $ million
2014:Oil forward sale contracts 241.0 – 241.0 –Gas forward sale contracts 32.4 – 32.4 –
Total 273.4 – 273.4 –
2013:Gas forward sale contracts 0.4 – 0.4 –Cross currency swap 2.6 – 2.6 –Forward foreign exchange contracts 12.9 – 12.9 –
Total 15.9 – 15.9 –
The above includes US$45.8 million in respect of oil and gas forward sale contracts which had expired by 31 December buthad not yet cash settled.

156 / Premier Oil plc 2014 Annual Report and Financial Statements
17. Financial instruments (continued)Liabilities measured at fair valueFinancial liabilities at fair value through profit and loss:
At 31 December Level 1 Level 2 Level 3$ million $ million $ million $ million
2014:Cross currency swap 38.6 – 38.6 –Interest rate swaps 3.6 – 3.6 –Forward foreign exchange contracts 5.9 – 5.9 –
Total 48.1 – 48.1 –
2013:Oil forward sale contracts 25.1 – 25.1 –Interest rate swaps 10.4 – 10.4 –Cross currency swap 2.8 – 2.8 –
Total 38.3 – 38.3 –
Commodity price riskOilAt 31 December 2014, the group had 5.4 million barrels of Dated Brent oil hedged through forward sales for 2015 at anaverage floor price of US$98.3/bbl. The forward sales have been designated as cash flow hedges and were assessed to beeffective, with a fair value movement of US$224.1 million credit (2013: US$27.2 million charge) in retained earnings.
During the year, forward oil sales contracts for 5.6 million barrels matured generating an income of US$30.8 million (2013: US$1.3 million). This income is an addition to sales revenues.
Indonesian gasAt the year-end date, 84,000 mt of HSFO, which drives the groups gas pricing in Singapore, is subject to monthly forwardsales contracts for 2015 at an average price of US$614.4/mt.
During the year, Singapore 180 HSFO contracts for 222,000 mt expired, generating an income of US$15.2 million (2013: cash cost of US$2.2 million) which has been included in the sales revenue. All contracts have been designated ascash flow hedges and were assessed to be effective. In the current year there was no movement in the fair value of thesecontracts which was credited to the income statement (2013: US$0.2 million), relating to the time-value portion of hedgesunder IAS 39. The remaining movement, being a credit of US$26.0 million (2013: US$3.0 million), related to the intrinsicvalue of such instruments and was recognised directly in retained earnings.
Movement in commodity collar and swap contracts
Oil Gas TotalAsset/(liability) $ million $ million $ million
At 1 January 2013 (7.5) (3.9) (11.4)Cash settlement for swaps 9.6 3.4 13.0Addition/(deduction) to sales revenues 1.3 (2.2) (0.9)(Charge)/credit to income statement for the year (1.4) 0.2 (1.2)(Charge)/credit to retained earnings for the year (27.2) 3.0 (24.2)
At 31 December 2013 (25.2) 0.5 (24.7)Cash settlement for swaps 11.2 (9.2) 2.0Addition to sales revenues 30.8 15.2 46.0Credit to retained earnings for the year 224.1 26.0 250.1
At 31 December 2014 240.9 32.5 273.4
NOTES TO THE CONSOLIDATED FINANCIAL STATEMENTS (continued)For the year ended 31 December 2014

Premier Oil plc 2014 Annual Report and Financial Statements / 157
17. Financial instruments (continued)Commodity contract sensitivity analysisThe key variable which affects the fair value of the group’s hedging instruments is market expectations about future commodityprices. The following illustrates the sensitivity of net income and equity to a 10 per cent increase and a 10 per cent decreasein this variable:
Oil Gas TotalIncrease/(decrease) in mark-to-market value $ million $ million $ million
Ten per cent increase (31.4) (1.9) (33.3)Ten per cent decrease 31.4 1.9 33.3
Interest rate riskAt 31 December 2014, US$300.0 million and €20.0 million of the group’s long-term bank borrowings have been swappedfrom floating rate to fixed rate. Under these interest rate swap contracts, the group has agreed to exchange the differencebetween fixed and floating interest amounts calculated on agreed notional principal amounts. Such contracts enable thegroup to mitigate the risk of changing interest rates and the cash flow exposure on the issued variable rate debt held.
These contracts have been designated as cash flow hedges and are assessed as effective. The fair value of interest rateswaps at the reporting date is determined by discounting the future cash flows using the forward curves at this date. The movement in fair values is shown in the table below:
Total Asset/(liability) $ million
At 1 January 2013 (16.8)Cash settlement for swaps 7.1Charge to income statement for the year recorded within finance costs and other finance expenses (7.1)Credit to retained earnings for the year 6.4
At 31 December 2013 (10.4)Cash settlement for swaps 7.3Charge to income statement for the year recorded within finance costs and other finance expenses (7.3)Credit to retained earnings for the year 6.8
At 31 December 2014 (3.6)
Interest rate swaps sensitivity analysisThe key variable which affects the fair value of the group’s hedging instruments is market expectations about future interestrates. The following illustrates the sensitivity of comprehensive income to an increase of 50 basis points in this variable:
Total Increase/(decrease) in mark-to-market value $ million
Increase of fifty basis points (0.9)
A decrease of 50 basis points in this variable has not been considered appropriate due to the current very low level offloating interest rates.

158 / Premier Oil plc 2014 Annual Report and Financial Statements
17. Financial instruments (continued)Foreign currency exchange riskThe group has issued £150.0 million retail bonds and £100.0 million term loan at a fixed exchange rate of US$1.64:£, €25.0 million at fixed rate of US$1.328:€, €75.0 million at a fixed rate of US$1.423:€ and €20.0 million at a fixed rate ofUS$1.34:€. All the above have been hedged under cross currency swaps into US dollars.
The fair value of these cross currency swaps at the reporting date is shown below:
Total Asset/(liability) $ million
At 1 January 2013 (6.4)Credit to retained earnings for the year 6.2
At 31 December 2013 (0.2)Charge to retained earnings for the year (38.4)
At 31 December 2014 (38.6)
To cover sterling exposures an amount of £777.2 million was purchased and matured with spot and forward contractsduring the year (2013: £619.2 million) to cater for its North Sea developments and operations. The group’s activities arelargely conducted in US dollars. The majority of borrowings at year-end were denominated in US dollars to match thecurrency of the assets.
The impact of any reasonably possible variation in foreign exchange rates on the group’s results would be immaterial.
Other financial instrumentsCredit riskThe group’s credit risk is attributable to its trade receivables and its bank deposits together with its long-term loan to thejoint venture partner (note 11). The amount of receivables presented in the balance sheet is net of allowances for doubtfulreceivables, which were immaterial in 2014 and 2013, with the exception of a US$61.2 million joint venture loan allowancein 2014 (note 11). The group does not require collateral or other security to support receivables from customers or relatedparties. The credit risk on liquid funds and derivative financial instruments is limited because the counterparties are bankswith at least single A credit ratings assigned by international credit rating agencies.
An indication of the concentration of credit risk is shown in note 1, whereby the revenue from four customers eachexceeded 10 per cent of the group’s consolidated revenue in 2014 (2013: four).
The ageing profile of the group’s trade and other receivables and trade and other payables as at 31 December, includingthe related undiscounted interest amounts, was:
Less than 2 to 3 3 months 1 to 5 Over 51 month months to 1 year years years Total$ million $ million $ million $ million $ million $ million
2014:Long-term receivables – – – 486.2 7.9 494.1Trade and other receivables 298.6 48.9 48.4 – – 395.9Trade and other payables (50.4) (42.6) (24.8) – – (117.8)Bank loans (1.1) (1.9) (319.7) (993.6) – (1,316.3)Convertible bonds – – (6.1) (261.3) – (267.4)Senior loan notes (0.1) (7.5) (28.5) (577.9) (323.3) (937.3)Retail bonds – – (12.6) (309.2) – (321.8)
Total 247.0 (3.1) (343.3) (1,655.8) (315.4) (2,070.6)
2013:Long-term receivables – – – 192.2 5.9 198.1Trade and other receivables 363.1 27.0 20.0 – – 410.1Trade and other payables (90.4) (14.1) (11.9) – – (116.4)Bank loans (70.2) (3.9) (17.5) (660.9) – (752.5)Convertible bonds – – (6.1) (267.4) – (273.5)Senior loan notes (0.1) (7.5) (29.4) (369.8) (582.6) (989.4)Retail bonds – – (12.6) (50.6) (271.3) (334.5)
Total 202.4 1.5 (57.5) (1,156.5) (848.0) (1,858.1)
NOTES TO THE CONSOLIDATED FINANCIAL STATEMENTS (continued)For the year ended 31 December 2014

Premier Oil plc 2014 Annual Report and Financial Statements / 159
17. Financial instruments (continued)Liquidity riskUltimate responsibility for liquidity risk management rests with the Board of Directors, which has built an appropriateliquidity risk management framework for the management of the group’s short, medium and long-term funding andliquidity management requirements. The group manages liquidity risk by maintaining adequate reserves, banking andborrowing facilities and by continuously monitoring forecast and actual cash flows and matching the maturity profiles offinancial assets and liabilities and future capital and operating commitments.
Borrowing facilitiesThe group has committed borrowing facilities of US$2,655.8 million (2013: US$1,661.0) and letter of credit facilities ofUS$450.0 million (2013: £316.4 million (US$525.2 million)), in addition to the convertible bonds, retail bonds and senior loan notes. The undrawn cash balance from the committed borrowing facilities as at 31 December was:
2014 2013$ million $ million
Expiring in more than one year, but not more than two years – 695.0Expiring in more than two years, but not more than five years 1,425.0 280.0
The undrawn balance on the letter of credit facilities as at 31 December 2014 was US$242.0 million (2013: £118.6 million(US$196.9 million)) which expires between one to five years.
Interest rate risk profile of financial liabilitiesThe interest rate profile of the financial liabilities of the group as at 31 December (excluding trade and other payableswhich are interest free) was:
Fixed rateweighted
Fixed Floating averagerate rate Total interest rate
$ million $ million $ million %
2014:Bank loans* 300.0 931.0 1,231.0 5.200Convertible bonds 245.3 – 245.3 2.500Senior loan notes 590.5 130.0 720.5 5.400Retail bond 234.0 – 234.0 5.140
Total 1,369.8 1,061.0 2,430.8 –
2013:Bank loans* 300.0 386.0 686.0 5.200Convertible bonds 245.3 – 245.3 2.500Senior loan notes 612.6 130.0 742.6 5.400Retail bonds 249.0 – 249.0 5.140
Total 1,406.9 516.0 1,922.9 –
* At 31 December 2014, US$300.0 million of the group’s short-term bank borrowings and €20.0 million senior loan notes have been swapped from floating interest rates to fixed interest rates and are therefore included as a fixed rate liability in the table above (2013: US$300.0 million and €20.0 million).
The carrying values on the balance sheet of the bank loans and the convertible bonds, which are stated net of debtarrangement fees and issue costs, are as follows:
2014 2013$ million $ million
Bank loans 1,209.0 679.8Senior loan notes 717.7 739.5Retail bonds 231.4 246.1Convertible bonds:Liability component 228.1 223.8Equity component 16.9 21.0
The floating rate financial liabilities at 31 December 2014 comprised bank borrowings bearing interest at rates set byreference to US$ and £ LIBOR, exposing the group to a cash flow interest rate risk.

160 / Premier Oil plc 2014 Annual Report and Financial Statements
NOTES TO THE CONSOLIDATED FINANCIAL STATEMENTS (continued)For the year ended 31 December 2014
17. Financial instruments (continued)Interest rate risk profile of financial assetsThe interest rate profile of the financial assets of the group as at 31 December (excluding trade and other receivables whichare interest free) was:
Floating rate Interest free Total$ million $ million $ million
2014:Cash and short-term deposits:Sterling 0.1 3.9 4.0US dollar 186.7 64.5 251.2Other 19.9 16.7 36.6
Total 206.7 85.1 291.8
2013:Cash and short-term deposits:Sterling 8.4 21.7 30.1US dollar 314.0 54.5 368.5Other 48.4 1.9 50.3
Total 370.8 78.1 448.9
The floating rate cash and short-term deposits consist of cash held in interest-bearing current accounts and depositsplaced on the money markets for periods ranging from overnight to three months.
Fair value of financial assets and financial liabilitiesThe carrying values and fair values of the group’s non derivative financial assets and financial liabilities (excluding currentassets and current liabilities for which carrying values approximate to fair values due to their short-term nature).
2014 2014 2013 2013Fair value Carrying Fair value Carryingamount amount amount amount$ million $ million $ million $ million
Primary financial instruments held or issued to finance thegroup’s operations:Joint venture partner loan 486.2 486.2 192.2 192.2Bank loans 1,231.0 1,231.0 686.0 686.0Senior loan notes 720.5 720.5 742.6 742.6Retail bonds 204.7 234.0 252.9 249.0Convertible bonds 224.4 228.5 271.7 224.2
Fair value is defined as the price that would be received to sell an asset or paid to transfer a liability in an orderly transactionbetween market participants at the measurement date. Where available, market values have been used to determine fairvalues. The estimated fair values have been determined using market information and appropriate valuationmethodologies. Values recorded are as at the balance sheet date, and will not necessarily be realised. Non-interest bearingfinancial instruments, which include amounts receivable from customers and accounts payable are also recorded materiallyat fair value reflecting their short-term maturity.
18. Deferred tax
2014 2013$ million $ million
Deferred tax assets 971.7 762.4Deferred tax liabilities (254.2) (306.8)
717.5 455.6

Premier Oil plc 2014 Annual Report and Financial Statements / 161
18. Deferred tax (continued)
(Charged)/At credited to Charged to At 31
1 January Exchange Disposal income retained December2014 movements of asset statement earnings 2014
$ million $ million $ million $ million $ million $ million
UK deferred corporation tax:Fixed assets and allowances (828.2) – – 72.2 – (756.0)Decommissioning 321.7 – – 8.1 – 329.8Deferred petroleum revenue tax (5.4) – – 20.9 – 15.5Tax losses and allowances 1,203.8 – – 171.6 – 1,375.4Small field allowance 47.8 – – 109.4 – 157.2Derivative financial instruments 13.9 – – – (139.0) (125.1)
Total UK deferred corporation tax 753.6 – – 382.2 (139.0) 996.8
UK deferred petroleum revenue tax1 8.7 – – (33.7) – (25.0)
Overseas deferred tax2 (306.7) 7.4 22.2 22.9 – (254.2)
Total 455.6 7.4 22.2 371.4 (139.0) 717.5
(Charged)/At credited to Credited to At 31
1 January Exchange Disposal income retained December2013 movements of assets statement earnings 2013
$ million $ million $ million $ million $ million $ million
UK deferred corporation tax:Fixed assets and allowances (601.6) – – (226.6) – (828.2)Decommissioning 252.8 – – 68.9 – 321.7Deferred petroleum revenue tax (1.5) – – (3.9) – (5.4)Tax losses and allowances 861.7 – – 342.1 – 1,203.8Unrecognised tax losses and allowances 45.8 – – 2.0 – 47.8Deferred revenue 2.0 – – (2.0) – –Derivative financial instruments – – – – 13.9 13.9
Total UK deferred corporation tax 559.2 – – 180.5 13.9 753.6
UK deferred petroleum revenue tax1 2.3 – – 6.4 – 8.7
Overseas deferred tax2 (289.7) 8.1 24.0 (49.1) – (306.7)
Total 271.8 8.1 24.0 137.8 13.9 455.6
1 The UK deferred petroleum revenue tax relates mainly to temporary differences associated with decommissioning provisions.
2 The overseas deferred tax relates mainly to temporary differences associated with fixed asset balances.
The group’s unutilised tax losses and allowances at 31 December 2014 are recognised to the extent that taxable profits areexpected to arise in the future against which the tax losses and allowances can be utilised. In accordance with paragraph 37of IAS 12 – ‘Income Taxes’ the group re-assessed its unrecognised deferred tax assets at 31 December 2014 with respect toring fence tax losses and allowances. The corporate model used to determine the recognition of deferred tax assets wasre-run, using an oil price assumption of Dated Brent forward curve in 2015 and 2016, and US$85/bbl in ‘real’ terms thereafter.The results of the corporate model demonstrated that it was no longer appropriate to recognise an amount of US$86.8 millionin respect of the group’s UK ring fence deferred tax assets relating to tax losses and allowances, principally due to fall innear term oil price assumptions.
In addition to the above, there are non-ring fence UK tax losses of approximately US$263.1 million (2013: US$321.1 million)and current year non-UK tax losses of US$40.8 million (2013: US$14.3 million) for which a deferred tax asset has not been recognised.
None of the UK tax losses (ring fence and non-ring fence) have a fixed expiry date for tax purposes.
No deferred tax has been provided on unremitted earnings of overseas subsidiaries, following a change in UK taxlegislation in 2009 which exempted foreign dividends from the scope of UK corporation tax where certain conditions are satisfied.

162 / Premier Oil plc 2014 Annual Report and Financial Statements
19. Share capital
2014 2014 2013 201312.5p shares £ 12.5p shares £
Ordinary Shares:Called-up, issued and fully-paid 510,811,061 63,851,383 529,220,964 66,152,621
2014 2013$ million $ million
At 1 January 110.5 110.5Purchase and cancellation of own shares (3.8) –
At 31 December 106.7 110.5
Ordinary SharesThe rights and restrictions attached to the Ordinary Shares are as follows:
Dividend rights: the rights of the holders of Ordinary Shares shall rank pari passu in all respects with each other in relationto dividends.
Winding up or reduction of capital: on a return of capital on a winding up or otherwise (other than on conversion,redemption or purchase of shares) the rights of the holders of Ordinary Shares to participate in the distribution of the assetsof the company available for distribution shall rank pari passu in all respects with each other.
Voting rights: the holders of Ordinary Shares shall be entitled to receive notice of, attend, vote and speak at any General Meeting of the company.
Purchase and cancellation of own sharesDuring 2014, 18,455,248 Ordinary Shares have been repurchased and cancelled, representing 3.61 per cent of thecompany’s issued share capital as at 31 December 2014. The nominal value of the shares purchased and cancelled during the year is £2.3 million (US$3.8 million) and the aggregate amount of consideration paid by the company for thoseshares is £55.7 million (US$93.0 million).
Share-based payments and share incentive plansThe group currently operates a Long Term Incentive Plan (LTIP) for all employees and a Share Incentive Plan and a Save AsYou Earn Scheme for UK-based and expatriate employees only.
For the year ended 31 December 2014, the total cost recognised by the company for equity-settled share-based paymenttransactions is US$23.3 million (2013: US$24.6 million). A credit of US$23.3 million has been recorded in retained earnings(2013: US$24.6 million) for all equity-settled payments of the group. Like other elements of remuneration, this charge isprocessed through the time-writing system which allocates cost, based on time spent by individuals, to various entitieswithin the Premier Oil plc group. Part of this cost is therefore recharged to the relevant subsidiary undertaking where it iscapitalised as directly attributable to capital projects, or is charged to the income statement as operating costs, pre-licenceexploration costs or general and administration costs.
Details of the different share incentive plans currently in operation are set out below:
(i) Long Term Incentive PlanThe Long Term Incentive Plan (LTIP) was introduced in 2009 to provide a long-term all employee scheme which motivatesall employees and provides a longer-term perspective to the total remuneration package. Awards under the LTIPcomprise three elements: Equity Pool Awards and Performance Share Awards that vest after the expiry of a three-yearperformance period, and a potential Matching Award that vests at the expiry of a further three-year performanceperiod, commencing at the end of the three-year performance period for Equity Pool and Performance Share Awards.
Full details about this plan have been provided in the Remuneration Report.
The company uses a Monte Carlo simulation model to calculate the value of the Equity bonus pool of the plan and ofthe Performance Share Awards. The main assumptions used for the calculations are as follows:
Volatility: 31.0% to 42.0% Risk free rate of interest: 1.0% to 2.9% Correlation factor with comparator group: 0.32 to 0.35
NOTES TO THE CONSOLIDATED FINANCIAL STATEMENTS (continued)For the year ended 31 December 2014

Premier Oil plc 2014 Annual Report and Financial Statements / 163
19. Share capital (continued)(ii) Share Incentive Plan
Under the Share Incentive Plan employees are invited to make contributions to buy partnership shares. If an employeeagrees to buy partnership shares the company currently matches the number of partnership shares bought with anaward of shares (matching shares), on a one-for-one basis.
(iii) Savings Related Share Option SchemeUnder the Savings Related Share Option Scheme, eligible employees with six months or more continuous service canjoin the scheme. Employees can save to a maximum of £500 per month through payroll deductions for a period ofthree or five years, after which time they can acquire shares at up to a 20 per cent discount.
2014 2013
Weighted Weightedaverage averageexercise exercise
Options price Options price
Outstanding at the beginning of the year 483,932 £3.06 402,664 £2.89Granted during the year 748,465 £2.46 233,176 £3.14Lapsed during the year (221,963) £3.18 (41,861) £3.20Exercised during the year* (45,345) £3.55 (110,047) £3.54
Outstanding at the end of the year (exercisable nil) 965,089 £2.62 483,932 £3.06
*45,345 Ordinary Shares with a nominal value of £5,668 (US$9,545) were issued under the group’s share option schemes during the year(2013: 110,047 Ordinary Shares with a nominal value of £13,756 (US$21,459)).
The weighted average share price at the date of exercise for share options exercised during the year was £3.55. The options outstanding at 31 December 2014 had a weighted average exercise price of £2.62 and a weightedaverage remaining contractual life of 3.33 years.
The fair value of the options granted during the year was determined using the Black-Scholes valuation model and isnot material.
20. Own shares
Total$ million
At 1 January 2013 44.6Purchase of ESOP Trust shares 12.8Release of shares for long-term incentive arrangements (39.6)
At 31 December 2013 17.8Purchase of ESOP Trust shares 6.4Release of shares for long-term incentive arrangements (8.5)
At 31 December 2014 15.7
The own shares reserve represents the net cost of shares in Premier Oil plc purchased in the market or issued by thecompany into the Premier Oil plc Employee Benefit Trust. This ESOP Trust holds shares to satisfy awards under the group’sshare incentive plans. At 31 December 2014, the number of Ordinary Shares of 12.5 pence each held by the Trust was2,690,319 (2013: 3,046,621 Ordinary Shares of 12.5 pence each).

164 / Premier Oil plc 2014 Annual Report and Financial Statements
NOTES TO THE CONSOLIDATED FINANCIAL STATEMENTS (continued)For the year ended 31 December 2014
21. Notes to the cash flow statement
2014 2013$ million $ million
(Loss) /profit before tax for the year (384.0) 285.4Adjustments for:Depreciation, depletion, amortisation and impairment 1,240.8 562.5 Exploration expense 58.5 106.2Provision for share-based payments 6.9 7.9Share of gain in associate (1.9) –Interest revenue and finance gains (58.5) (33.0)Finance costs and other finance expenses 196.3 98.4Other gains and losses (2.7) (3.6)Loss on derivative financial instruments – 1.2
Operating cash flows before movements in working capital 1,055.4 1,025.0Decrease/ (increase) in inventories 23.0 (14.9)Decrease in receivables 105.3 45.1Decrease in payables (53.6) (28.9)
Cash generated by operations 1,130.1 1,026.3Income taxes paid (208.5) (228.3)Interest income received 2.7 4.5
Net cash from operating activities 924.3 802.5
Analysis of changes in net debt:
2014 2013Note $ million $ million
a) Reconciliation of net cash flow to movement in net debt:Movement in cash and cash equivalents (157.1) 261.5Proceeds from drawdown of long-term bank loans (655.0) (384.1)Proceeds from issuance of senior loan notes – (156.7)Proceeds from issuance of retail bonds – (245.8)Repayment of long-term bank loans 100.0 200.0Non-cash movements on debt and cash balances 42.8 (17.4)
Increase in net debt in the year (669.3) (342.5)Opening net debt (1,452.9) (1,110.4)
Closing net debt (2,122.2) (1,452.9)
b) Analysis of net debt:Cash and cash equivalents 12 291.8 448.9Borrowings* 14 (2,414.0) (1,901.8)
Total net debt (2,122.2) (1,452.9)
* Borrowings consist of the short-term borrowings, the convertible bonds and the other long-term debt. The carrying values of the convertible bondsand the other long-term debt on the balance sheet are stated net of the unamortised portion of the issue costs of US$0.4 million (2013: US$0.4 million)and debt arrangement fees of US$27.4 million (2013: US$12.2 million) respectively.
22. Capital commitments and guaranteesAt 31 December 2014, the group had capital commitments on exploration and development licences totalling US$608.9 million(2013: US$417.0 million) and financial performance guarantees of US$2.9 million (2013: US$78.7 million). In addition,the group had issued letters of credit for future decommissioning liabilities totalling £169.8 million (US$264.4 million)(2013: £254.8 million (US$422.9 million)).

Premier Oil plc 2014 Annual Report and Financial Statements / 165
23. Group pension schemesBalance sheet
2014 2013$ million $ million
UK funded pension scheme 0.8 1.0
Total surplus in balance sheet 0.8 1.0
2014 2013$ million $ million
UK unfunded pension scheme 0.9 0.9Indonesia unfunded termination benefit scheme 17.4 12.2
Total liability in balance sheet 18.3 13.1
Funded pensionsThe group operates a defined benefit pension scheme in the UK – The Premier Oil plc Retirement and Death Benefits Plan(the Scheme). The Scheme was closed to new members (aside from the provision of insured death in service benefits) in1997 and a new scheme, providing benefits on a defined contribution basis, was started. Both schemes are funded by thepayment of contributions to separately administered trust funds.
The disclosures set out below are based on calculations carried out as at 31 December 2014 by a qualified independentactuary. The figures have been prepared in compliance with IAS 19 – ‘Employee Benefits’.
The Scheme’s assets are held in a separate trustee-administered fund to meet long-term pension liabilities to past andpresent employees. The Trustee of the Scheme is required to act in the best interest of the Scheme’s beneficiaries. The appointment of members of the Trustee Board is determined by the trust documentation.
The liabilities of the defined benefit Scheme are measured by discounting the best estimate of future cash flows to be paidout of the Scheme using the projected unit credit method. This amount is reflected in the surplus or the deficit in thebalance sheet.
The projected unit credit method is an accrued benefits valuation method in which the Scheme liabilities make allowancefor the projected earnings. The liabilities set out in this note have been calculated using membership data current as at31 December 2014. The results of the calculations and the assumptions adopted are shown below.
As at 31 December 2014, contributions are payable to the Scheme by the group at the rates set out in the schedule ofcontributions dated 24 July 2012. Under this schedule, the company contributes on a monthly basis at the rate of 30 per cent of the aggregate of members’ pensionable salaries.

166 / Premier Oil plc 2014 Annual Report and Financial Statements
NOTES TO THE CONSOLIDATED FINANCIAL STATEMENTS (continued)For the year ended 31 December 2014
23. Group pension schemes (continued)Principal assumptionsThe principal actuarial assumptions at the balance sheet date were:
At 31 At 31December December
2014 2013
Discount rate 3.5% pa 4.5% paRPI inflation 3.1% pa 3.5% paCPI inflation 2.3% pa 2.8% paRate of increase in salaries 5.1% pa 5.5% paRate of increase in pensions in payment: LPI (max 5.0%) 3.0% pa 3.5% paPre and post-retirement mortality S2PA Light CMI_2014 1% S1PA Light CMI_2013 1%
Long Term Long TermWithdrawals No allowance No allowanceCash commutation 2.0 x pre-commutation 2.0 x pre-commutation
pension pensionLife expectancy of male aged 65 now 22.3 22.7Life expectancy of male aged 65 in 20 years 23.5 24.0Life expectancy of female aged 65 now 23.4 23.9Life expectancy of female aged 65 in 20 years 24.8 25.4
Asset breakdownThe major categories of Scheme assets as a percentage of total Scheme assets are:
At 31 At 31December December
2014 2013
Equities 50.2% 50.8%Gilts 24.2% 24.6%Corporate bonds 25.6% 24.5%Cash – 0.1%
Total 100.0% 100.0%
Reconciliation of funded status and amount recognised in balance sheet:
At 31 At 31December December
2014 2013$ million $ million
Fair value of Scheme assets 46.6 44.5Present value of defined benefit obligation (39.1) (38.9)Unrecognised amount due to effect of IFRC14 (6.7) (4.6)
Surplus 0.8 1.0
Statement of amount recognised in profit and loss
2014 2013$ million $ million
Current service cost 0.2 0.2Net Interest on the net defined benefit liability (asset) (0.2) (0.3)
Total – (0.1)

Premier Oil plc 2014 Annual Report and Financial Statements / 167
23. Group pension schemes (continued)Changes in the present value of the defined benefit obligation:
2014 2013$ million $ million
Present value of defined benefit obligation at 1 January 38.9 34.0Service cost 0.2 0.2Interest cost 1.7 1.4Actuarial losses 1.7 3.2Benefits paid (1.0) (0.9)Currency translation effects (2.4) 1.0
Present value of defined benefit obligation at 31 December 39.1 38.9
Changes in the fair value of Scheme assets:
2014 2013$ million $ million
Fair value of Scheme assets at 1 January 44.5 38.2Return on assets less interest income 3.9 1.2Interest income 1.9 1.7Contributions by employer 0.2 3.2Benefits paid (1.0) (0.9)Currency translation effects (2.9) 1.1
Fair value of Scheme assets at 31 December 46.6 44.5
Actual return on Scheme assets 5.8 2.9
Statement of amount recognised in other comprehensive income
2014 2013$ million $ million
(Gains)/loss from changes in the financial assumptions for value of Scheme liabilities 3.4 2.8(Gains)/loss from changes in the demographic assumptions for value of scheme liabilities (0.8) 0.3Changes due to experience adjustments (0.9) 0.1Return on assets less interest income (3.9) (1.2)Change in the effect of the asset ceiling excluding amounts included in net interest on the net defined liability 1.9 (2.7)Prior year adjustment – (5.7)Currency Translation effect 0.5 (0.1)
At 31 December 0.2 (6.5)
Projected components of pension expense for year to 31 December 2015The significant volatility in investment markets means that it is difficult to project forward the IAS 19 figures for the next yearwith confidence. The following projections should therefore be treated with caution. Assumptions implicit in the followingprojections are:
• the return on assets from 31 December 2014 is 3.5 per cent per annum;
• contributions to the Scheme will continue throughout 2015 in accordance with the current schedule of contributions inplace at the date of signing this report; and
• there will be no changes to the terms of the Scheme.

168 / Premier Oil plc 2014 Annual Report and Financial Statements
23. Group pension schemes (continued)The amounts recognised in the components of pension expense are:
2015$ million
Current service cost 0.2Interest cost –Expected return on Scheme assets –
Total 0.2
Unfunded pensionsIn Indonesia, the group operates a Service, Severance and Compensation pay scheme under a Collective Labour Agreementwith the local workforce for which the charge in the year was US$1.9 million. This is an unfunded post-employment definedbenefit scheme in nature.
In addition, the group is paying an unfunded pension to a former director in the UK in regard to which annual increases anda reversionary spouse’s pension apply on the same basis as to pensions paid under the Scheme. On the same actuarialbasis as used to assess the Scheme’s pension costs, the present value as at 31 December 2014 of the future paymentsprojected to be made in respect of UK unfunded pensions is US$0.9 million (2013: US$0.9 million).
Defined contribution benefit schemeThe group operates a defined contribution retirement benefit scheme. The only obligation of the group with respect to theretirement benefit scheme is to make specified contributions. Payments to the defined contribution scheme are chargedas an expense as they fall due. The total cost charged to income of US$9.6 million (2013: US$4.1 million) representscontributions payable to these schemes by the group at rates specified in the rules of the scheme.
24. Related party transactionsTransactions between the company and its subsidiaries, which are related parties, have been eliminated on consolidationand are not disclosed in this note.
Directors and executive remunerationThe remuneration of directors and other key members of management during the year is highlighted below.
Further information regarding the remuneration of individual directors is provided in the audited part of theRemuneration Report.
2014 2013$ million $ million
Short-term employee benefits 9.1 6.0Post-employment benefits 0.3 0.9Other long-term benefits: share-based payments 2.2 9.3
11.6 16.2
During early 2014, Egdon Resources plc, an associate company repaid it outstanding loan of £1.0 million payable to the company.
25. Dividends
2014 2013$ million $ million
Amounts recognised as distributions to shareholders in the year:Final dividend for the year ended 31 December 2013 of 5p (2012: 5p) 44.0 40.2
Proposed final dividend for the year ended 31 December 2014 of nil (2013: 5p) – 43.9
26. Events after the balance sheet dateOn 23 February, Premier announced that the Badada-1 exploration well (Premier 55 per cent) drilled on Block 2B, onshoreKenya, had reached a total depth of 3,500 metres and was plugged and abandoned as a dry hole.
NOTES TO THE CONSOLIDATED FINANCIAL STATEMENTS (continued)For the year ended 31 December 2014

Premier Oil plc 2014 Annual Report and Financial Statements / 169
COMPANY FINANCIAL STATEMENTS: BALANCE SHEETAs at 31 December 2014
2014 2013Note $ million $ million
Investments in subsidiaries 3 563.4 563.5Long-term employee benefit plan surplus 7 2.1 3.7
Total fixed assets 565.5 567.2
Current assets:Debtors: amounts falling due after more than one year 4 779.9 901.5
Total current assets 779.9 901.5Creditors: amounts falling due within one year 5 (13.2) (21.0)
Net current assets 766.7 880.5
Total assets less current liabilities 1,332.2 1,447.7Retail bonds 6 (231.4) (246.1)Pension liability 7 (0.9) (0.9)
Net assets 1,099.9 1,200.7
Capital and reserves:Called-up share capital 9 106.7 110.5Share premium account 10 275.4 275.3Profit and loss account 10 273.3 374.2Merger reserve account 10 374.3 374.3Capital redemption reserve 10 8.1 4.3Equity reserve 10 62.1 62.1
Total equity shareholders' funds 11 1,099.9 1,200.7
The financial statements of Premier Oil plc (registered number SC234781) were approved by the Board of Directors andauthorised for issue on 25 February 2015.
They were signed on its behalf by:
Tony Durrant Richard RoseChief Executive Finance Director
STATEMENT OF TOTAL RECOGNISED GAINS AND LOSSESFor the year ended 31 December 2014
2014 2013Note $ million $ million
Profit for the financial year 2 14.6 162.0Movement in cash flow hedges 6.4 –Pension costs – losses 7 (1.8) (3.8)
Total recognised gains relating to the year 19.2 158.2

170 / Premier Oil plc 2014 Annual Report and Financial Statements
NOTES TO THE COMPANY FINANCIAL STATEMENTSAs at 31 December 2014
1. Significant accounting policiesBasis of accountingThe separate financial statements of the company are presented as required by the Companies Act 2006. They have beenprepared under the historical cost convention and in accordance with applicable United Kingdom Accounting Standardsand law. The results relate entirely to continuing operations.
The financial statements have been prepared on the going concern basis. Further information relating to the goingconcern assumption is provided in the Financial Review.
New accounting standards, amendments and interpretations not yet adoptedPremier Oil plc intends to apply FRS 101 in its separate financial statements for the financial year ended 31 December 2015.Any objections should be notified to the Company Secretary by the AGM date of 13 May 2015.
The principal accounting policies are summarised below. They have all been applied consistently throughout the year andthe preceding year.
InvestmentsFixed asset investments in subsidiaries are shown at cost less provision for impairment.
Pension costsThe company operates a defined benefit pension scheme, which requires contributions to be made to a separatelyadministered fund. The Scheme was closed to new members (aside from the provision of insured death in service benefits)in 1997. The company accounts for pension costs in line with Financial Reporting Standard (FRS) 17 – ‘Retirement Benefits’.
The amounts charged to operating profit regarding the defined benefit scheme are the current service costs and gains andlosses on settlements and curtailments. Past service costs are recognised immediately in the profit and loss account if thebenefits have vested. If the benefits do not vest immediately, the costs are recognised over the period until vesting occurs.The interest costs and the expected return on the assets are shown as a net amount of other financial costs or credits adjacentto interest. Actuarial gains and losses are recognised immediately in the statement of total recognised gains and losses.
Pension scheme assets are measured at fair value and liabilities are measured on an actuarial basis using the projected unitcredit method, and discounted at a rate equivalent to the current rate of return on a high quality corporate bond ofequivalent currency and term to the scheme liabilities.
The actuarial valuations are obtained at least triennially and are updated at each balance sheet date. The resulting definedbenefit asset or liability, net of related deferred tax, is presented separately after other net assets on the face of the balance sheet.
Foreign exchangeThe local currency of the company is US dollars. All transactions denominated in foreign currencies, being currencies otherthan the local currency, are recorded in the local currency at actual exchange rates as of the dates of the transactions.Monetary assets and liabilities denominated in foreign currencies at the year-end are reported at the rates of exchangeprevailing at the year-end. Any gain or loss arising from a change in exchange rate subsequent to the dates of thetransactions is included as an exchange gain or loss in the profit and loss account.
Cash flow statementNo cash flow statement is prepared for the company under FRS 1 – ‘Cash Flow Statements’ as the cash flows of thecompany have been included in the group cash flow statement of Premier Oil plc.
Related party transactionsThe company has taken advantage of the exemption available under FRS 8 – ‘Related Party Disclosures’ with regard to thenon-disclosure of transactions between group companies.
Share-based paymentsThe company issues equity-settled share-based payments to certain employees. Equity-settled share-based payments aremeasured at fair value at the date of grant. The fair value determined at the grant date of the equity-settled share-basedpayments is expensed on a straight-line basis over the vesting period, based on the company's estimate of shares that willeventually vest.
Fair value is measured by use of a Monte Carlo simulation. The main assumptions are provided in note 9.

Premier Oil plc 2014 Annual Report and Financial Statements / 171
1. Significant accounting policies (continued)TaxCurrent tax, including UK corporation tax and foreign tax, is provided at amounts expected to be paid (or recovered) usingthe tax rates and laws that have been enacted or substantively enacted by the balance sheet date.
Deferred taxDeferred tax is recognised in respect of all timing differences that have originated but not reversed at the balance sheetdate where transactions or events have occurred at that date that will result in an obligation to pay more, or a right to payless or to receive more tax. The exception to this is that deferred tax assets are recognised only to the extent that thedirectors consider that it is more likely than not that there will be suitable taxable profits from which the future reversal ofthe underlying timing differences can be deducted.
Deferred tax is measured on an undiscounted basis at the tax rates that are expected to apply in the periods in whichtiming differences reverse, based on tax rates and laws enacted or substantively enacted at the balance sheet date.
2. Profit for the yearAs permitted by section 408 of the Companies Act 2006, the company has elected not to present its own profit and lossaccount for the year. The company reported a profit for the financial year ended 31 December 2014 of US$14.6 million(2013: US$162.0 million).
The auditor's remuneration for audit and other services is disclosed in note 3 to the consolidated financial statements.
3. Fixed asset investments
2014 2013$ million $ million
Cost and net book value:Subsidiary undertakings 563.5 563.5Cancellation of preference shares (0.1) –
563.4 563.5
A list of the significant investments in subsidiaries held at 31 December 2014, including the name and type of business, the country of operation and the country of incorporation or registration, is given in note 10 to the consolidated financial statements.
4. Debtors: amounts falling due after more than one year
2014 2013$ million $ million
Amounts owed by subsidiary undertakings 779.9 901.5
The amounts owed by subsidiary undertakings comprise a loan which bears interest based on LIBOR and which is notsecured. This loan is denominated in US dollars and falls due for repayment in 2020.
The carrying values of the company's debtors approximate their fair value.
5. Creditors: amounts falling due within one year
2014 2013$ million $ million
Accruals and other creditors 13.2 21.0
The carrying values of the company's creditors approximate their fair value.

172 / Premier Oil plc 2014 Annual Report and Financial Statements
NOTES TO THE COMPANY FINANCIAL STATEMENTS (continued)As at 31 December 2014
6. Borrowings
2014 2014 2013 2013Fair value Carrying Fair value Carrying
amount amount amount amount$ million $ million $ million $ million
Retail bonds 204.7 234.0 252.9 249.0
In December 2013, the company put in place a £500.0 million Retail eligible Euro Medium Term Notes (EMTN) programunder which it has issued £150.0 million UK retail bonds (the bonds). The bonds have been listed on the Official List of theUK Listings Authority and admitted to trading on the London Stock Exchange's regulated market and the electronic OrderBook of Retail Bonds (ORB). The bonds have a fixed coupon of 5 per cent and maturity of seven years.
The carrying value of the retail bonds are stated net of the unamortised portion of the debt arrangement fees of US$2.6 million (2013: US$2.9 million) and the liability translated at the exchange rate prevailing at the year-end.
7. Pension schemesBalance sheet
2014 2013$ million $ million
UK funded pension scheme 2.1 3.7
Total surplus in balance sheet 2.1 3.7
2014 2013$ million $ million
UK unfunded pension scheme 0.9 0.9
Total liability in balance sheet 0.9 0.9
Statement of total recognised gains and losses (STRGL)
At 31 At 31December December
2014 2013$ million $ million
Actuarial gains/(losses) including currency translation effects 1.7 (3.8)Adjustment resulting from the limit on the amount that can be recognised as an asset (3.5) –
Cumulative amount of actuarial lossesrecognised in the STRGL including currency translation effects (16.4) (14.6)

Premier Oil plc 2014 Annual Report and Financial Statements / 173
7. Pension Schemes (continued)Funded pensionsThe company operates a defined benefit pension scheme in the UK – The Premier Oil plc Retirement and Death BenefitsPlan (the Scheme). The Scheme was closed to new members (aside from the provision of insured death in service benefits)in 1997 and a new scheme, providing benefits on a defined contribution basis, was started. Both schemes are funded bythe payment of contributions to separately administered trust funds.
The disclosures set out below are based on calculations carried out as at 31 December 2014 by a qualified independentactuary. The figures have been prepared in compliance with FRS 17 – 'Retirement Benefits' (incorporating the amendmentannounced in December 2006).
The Scheme's assets are held in a separate trustee-administered fund to meet long-term pension liabilities to past andpresent employees. The Trustee of the Scheme is required to act in the best interest of the Scheme's beneficiaries.The appointment of members of the Trustee Board is determined by the trust documentation.
The liabilities of the defined benefit Scheme are measured by discounting the best estimate of future cash flows to be paidout of the Scheme using the projected unit method. This amount is reflected in the surplus or the deficit in the balancesheet. The projected unit method is an accrued benefits valuation method in which the Scheme liabilities make allowancefor the projected earnings.
The liabilities set out in this note have been calculated using membership data current as at 31 December 2014. The resultsof the calculations and the assumptions adopted are shown below.
As at 31 December 2014, contributions are payable to the Scheme by the company at the rates set out in the schedule ofcontributions dated 24 July 2012. Under this schedule, the company contributes on a monthly basis at the rate of 30 per centof the aggregate of the members' pensionable salaries.
Principal assumptionsThe principal actuarial assumptions at the balance sheet date were:
At 31 At 31December December
2014 2013
Discount rate 3.5% pa 4.5% paExpected return on Scheme assets 4.4% pa 5.5% paRPI inflation 3.1% pa 3.5% paCPI inflation 2.3% pa 2.8% paRate of increase in salaries 5.1% pa 5.5% paRate of increase in pensions in payment LPI: (max 5.0%) 3.0% pa 3.5% paPre and post-retirement mortality S2PA Light CMI_2014 1% long-term S1PA Light CMI_2013 1% long-termWithdrawals No allowance No allowanceCash commutation 2.0 x pre-commutation pension 2.0 x pre-commutation pensionLife expectancy of male aged 65 now 22.3 22.7Life expectancy of male aged 65 in 20 years 23.5 24.0Life expectancy of female aged 65 now 23.4 23.9Life expectancy of female aged 65 in 20 years 24.8 25.4
Asset breakdownThe major categories of Scheme assets as a percentage of total Scheme assets are:
At 31 At 31December December
2014 2013
Equities 50.2% 50.8%Gilts 24.2% 24.6%Corporate bonds 25.6% 24.5%Cash – 0.1%
Total 100.0% 100.0%
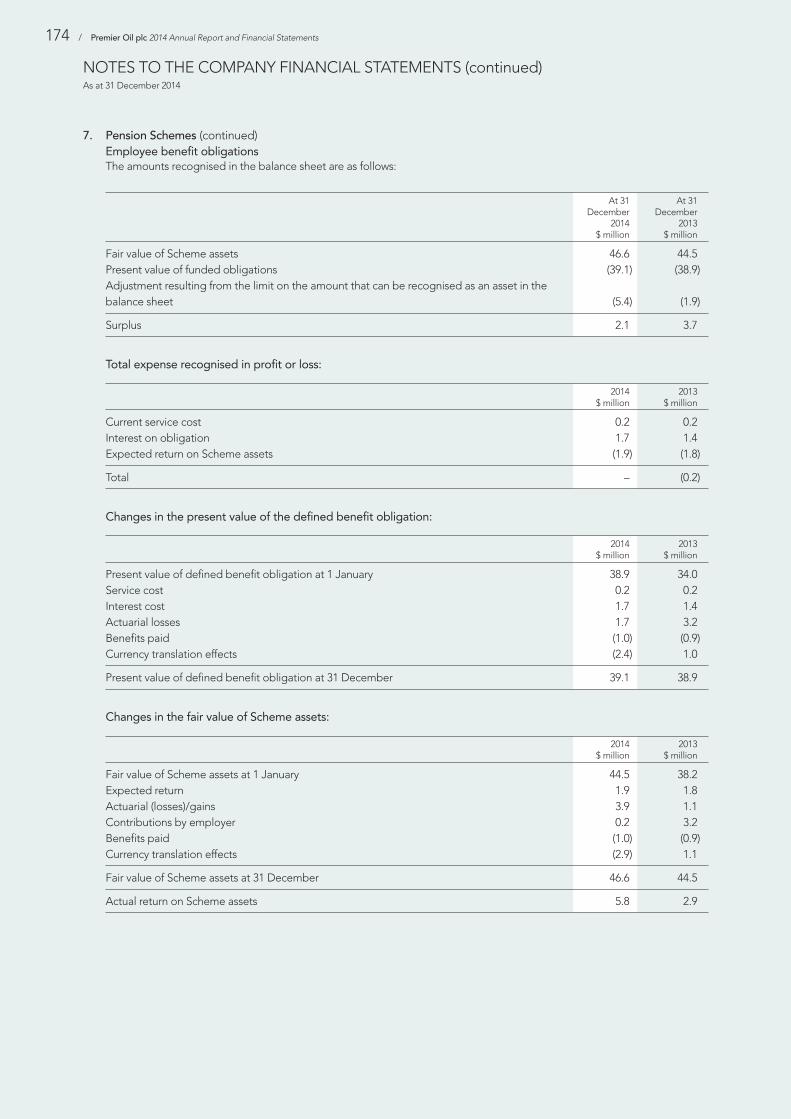
174 / Premier Oil plc 2014 Annual Report and Financial Statements
NOTES TO THE COMPANY FINANCIAL STATEMENTS (continued)As at 31 December 2014
7. Pension Schemes (continued)Employee benefit obligationsThe amounts recognised in the balance sheet are as follows:
At 31 At 31December December
2014 2013$ million $ million
Fair value of Scheme assets 46.6 44.5Present value of funded obligations (39.1) (38.9)Adjustment resulting from the limit on the amount that can be recognised as an asset in the balance sheet (5.4) (1.9)
Surplus 2.1 3.7
Total expense recognised in profit or loss:
2014 2013$ million $ million
Current service cost 0.2 0.2Interest on obligation 1.7 1.4Expected return on Scheme assets (1.9) (1.8)
Total – (0.2)
Changes in the present value of the defined benefit obligation:
2014 2013$ million $ million
Present value of defined benefit obligation at 1 January 38.9 34.0Service cost 0.2 0.2Interest cost 1.7 1.4Actuarial losses 1.7 3.2Benefits paid (1.0) (0.9)Currency translation effects (2.4) 1.0
Present value of defined benefit obligation at 31 December 39.1 38.9
Changes in the fair value of Scheme assets:
2014 2013$ million $ million
Fair value of Scheme assets at 1 January 44.5 38.2Expected return 1.9 1.8Actuarial (losses)/gains 3.9 1.1Contributions by employer 0.2 3.2Benefits paid (1.0) (0.9)Currency translation effects (2.9) 1.1
Fair value of Scheme assets at 31 December 46.6 44.5
Actual return on Scheme assets 5.8 2.9

Premier Oil plc 2014 Annual Report and Financial Statements / 175
7. Pension Schemes (continued)Movements over previous five year period:
2014 2013 2012 2011 2010$ million $ million $ million $ million $ million
Defined benefit obligation (39.1) (38.9) (34.0) (31.3) (32.3)Scheme assets 46.6 44.5 38.2 28.4 28.2Surplus/(deficit) 7.5 5.6 4.2 (2.9) (4.1)Experience (gain)/loss on Scheme liabilities (0.9) 0.1 (0.1) 0.9 0.6(Gain)/loss from changes in the assumptionsfor value of Scheme liabilities 2.6 3.1 0.3 (2.9) 0.6Experience gain/(loss) on Scheme assets 3.9 1.1 1.4 (0.7) 1.5
Projected components of pension expense for year to 31 December 2015The significant volatility in investment markets means that it is difficult to project forward the FRS 17 figures for the next yearwith confidence. The following projections should therefore be treated with caution. Assumptions implicit in the followingprojections are:
• the return on assets from 31 December 2014 is 4.4 per cent per annum;
• contributions to the Scheme will continue throughout the period in accordance with the current schedule of contributions inplace at the date of signing this report; and
• there will be no changes to the terms of the Scheme.
The amounts forecast to be recognised in the components of pension expense are:
2015$ million
Current service cost 0.2Interest cost 1.4Expected return on Scheme assets (1.6)
Total –
Sensitivity and riskThe results of the calculations are sensitive to the assumptions used. The balance sheet position revealed by FRS 17calculations must be expected to be volatile, principally because the market value of assets (with a significant exposure toequities) is being compared with a liability assessment derived from corporate bond yields.
The table below illustrates the sensitivity of the FRS 17 balance sheet position to small changes in some of the assumptions.Where one assumption has been changed all the other assumptions are kept the same as disclosed.
Change from Revised disclosedSurplus/ Surplus/(deficit) (deficit)
US$ million US$ million
Discount rate less 0.1% pa 6.7 (0.8)RPI inflation and linked assumptions plus 0.1% pa 6.8 (0.7)Members living one year longer than expected 6.5 (1.0)
The key risks which could significantly impact the balance sheet, and to a lesser extent the profit and loss account, are as follows:
• a reduction in the discount rate, which will increase the value placed on the Scheme's liabilities;
• an increase in price inflation and/or salary inflation; and
• improving life expectancy (lower mortality rates) resulting in benefits being paid for longer.
Unfunded pensionsThe company is paying an unfunded pension to a former director in regard to which annual increases and a reversionaryspouse's pension apply on the same basis as to pensions paid under the Scheme. On the same actuarial basis as used toassess the Scheme's pension costs, the present value as at 31 December 2014 of the future payments projected to bemade in respect of UK unfunded pensions is US$0.9 million (2013: US$0.9 million).
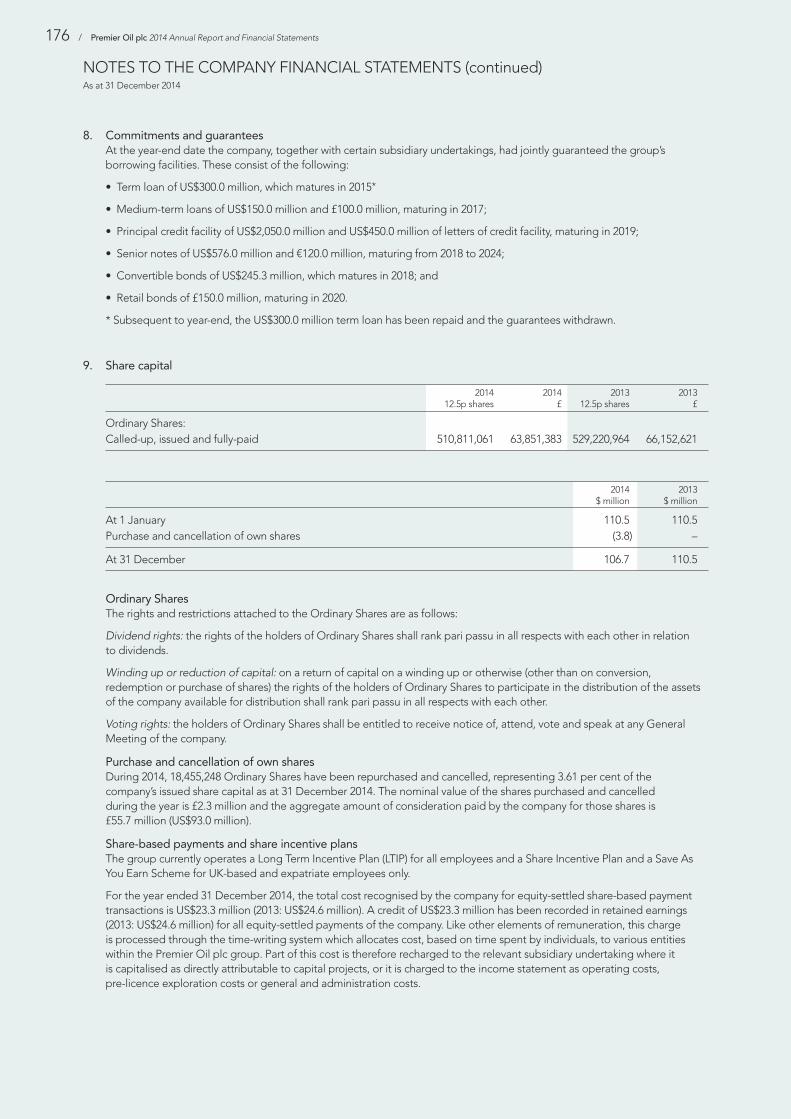
176 / Premier Oil plc 2014 Annual Report and Financial Statements
NOTES TO THE COMPANY FINANCIAL STATEMENTS (continued)As at 31 December 2014
8. Commitments and guaranteesAt the year-end date the company, together with certain subsidiary undertakings, had jointly guaranteed the group’sborrowing facilities. These consist of the following:
• Term loan of US$300.0 million, which matures in 2015*
• Medium-term loans of US$150.0 million and £100.0 million, maturing in 2017;
• Principal credit facility of US$2,050.0 million and US$450.0 million of letters of credit facility, maturing in 2019;
• Senior notes of US$576.0 million and €120.0 million, maturing from 2018 to 2024;
• Convertible bonds of US$245.3 million, which matures in 2018; and
• Retail bonds of £150.0 million, maturing in 2020.
* Subsequent to year-end, the US$300.0 million term loan has been repaid and the guarantees withdrawn.
9. Share capital
2014 2014 2013 201312.5p shares £ 12.5p shares £
Ordinary Shares:Called-up, issued and fully-paid 510,811,061 63,851,383 529,220,964 66,152,621
2014 2013$ million $ million
At 1 January 110.5 110.5Purchase and cancellation of own shares (3.8) –
At 31 December 106.7 110.5
Ordinary SharesThe rights and restrictions attached to the Ordinary Shares are as follows:
Dividend rights: the rights of the holders of Ordinary Shares shall rank pari passu in all respects with each other in relationto dividends.
Winding up or reduction of capital: on a return of capital on a winding up or otherwise (other than on conversion,redemption or purchase of shares) the rights of the holders of Ordinary Shares to participate in the distribution of the assetsof the company available for distribution shall rank pari passu in all respects with each other.
Voting rights: the holders of Ordinary Shares shall be entitled to receive notice of, attend, vote and speak at any GeneralMeeting of the company.
Purchase and cancellation of own sharesDuring 2014, 18,455,248 Ordinary Shares have been repurchased and cancelled, representing 3.61 per cent of thecompany’s issued share capital as at 31 December 2014. The nominal value of the shares purchased and cancelled during the year is £2.3 million and the aggregate amount of consideration paid by the company for those shares is £55.7 million (US$93.0 million).
Share-based payments and share incentive plansThe group currently operates a Long Term Incentive Plan (LTIP) for all employees and a Share Incentive Plan and a Save AsYou Earn Scheme for UK-based and expatriate employees only.
For the year ended 31 December 2014, the total cost recognised by the company for equity-settled share-based paymenttransactions is US$23.3 million (2013: US$24.6 million). A credit of US$23.3 million has been recorded in retained earnings(2013: US$24.6 million) for all equity-settled payments of the company. Like other elements of remuneration, this chargeis processed through the time-writing system which allocates cost, based on time spent by individuals, to various entitieswithin the Premier Oil plc group. Part of this cost is therefore recharged to the relevant subsidiary undertaking where itis capitalised as directly attributable to capital projects, or it is charged to the income statement as operating costs,pre-licence exploration costs or general and administration costs.

Premier Oil plc 2014 Annual Report and Financial Statements / 177
9. Share capital (continued)Details of the different share incentive plans currently in operation are set out below:
(i) Long Term Incentive PlanThe Long Term Incentive Plan (LTIP) was introduced in 2009 to provide a long-term all employee scheme which motivatesall employees and provides a longer-term perspective to the total remuneration package. Awards under the LTIPcomprise three elements: Equity Pool Awards and Performance Share Awards that vest after the expiry of a three-yearperformance period, and a potential Matching Award that vests at the expiry of a further three-year performanceperiod, commencing at the end of the three-year performance period for Equity Pool and Performance Share Awards.
Full details about this plan have been provided in the Remuneration Report.
The company uses a Monte Carlo simulation model to calculate the value of the Equity bonus pool of the plan and ofthe Performance Share Awards. The main assumptions used for the calculations are as follows:
Volatility: 31.0% to 42.0% Risk free rate of interest: 1.0% to 2.9% Correlation factor with comparator group: 0.32 to 0.35
(ii) Share Incentive PlanUnder the Share Incentive Plan employees are invited to make contributions to buy partnership shares. If an employeeagrees to buy partnership shares the company currently matches the number of partnership shares bought with anaward of shares (matching shares), on a one-for-one basis.
(iii) Savings Related Share Option SchemeUnder the Savings Related Share Option Scheme, eligible employees with six months or more continuous service canjoin the scheme. Employees can save to a maximum of £500 per month through payroll deductions for a period ofthree or five years, after which time they can acquire shares at up to a 20 per cent discount.
2014 2013
Weighted Weightedaverage averageexercise exercise
Options price Options price
Outstanding at the beginning of the year 483,932 £3.06 402,664 £2.89Granted during the year 748,465 £2.46 233,176 £3.14Lapsed during the year (221,963) £3.18 (41,861) £3.20Exercised during the year* (45,345) £3.55 (110,047) £3.54
Outstanding at the end of the year (exercisable nil) 965,089 £2.62 483,932 £3.06
* 45,345 Ordinary Shares with a nominal value of £5,668 (US$9,545) were issued under the group's share option schemes during the year (2013: 110,047 Ordinary Shares with a nominal value of £13,756 (US$21,459)).
The weighted average share price at the date of exercise for share options exercised during the year was £3.55. The options outstanding at 31 December 2014 had a weighted average exercise price of £2.62 and a weightedaverage remaining contractual life of 3.33 years.
The fair value of the options granted during the year was determined using the Black-Scholes valuation model and isnot material.

178 / Premier Oil plc 2014 Annual Report and Financial Statements
NOTES TO THE COMPANY FINANCIAL STATEMENTS (continued)As at 31 December 2014
10. Share capital and reserves
Share Merger CapitalShare premium Profit and reserve redemption Equity
capital account loss account account reserve reserve Total$ million $ million $ million $ million $ million $ million $ million
At 1 January 2013 110.5 274.9 244.4 374.3 4.3 62.1 1,070.5Issue of Ordinary Shares – 0.4 – – – – 0.4Purchase of ESOP Trust shares – – (12.8) – – – (12.8)Profit for the year – – 162.0 – – – 162.0Provision for share-based payments – – 24.6 – – – 24.6Dividends paid – – (40.2) – – – (40.2)Pension costs – actuarial losses – – (3.8) – – – (3.8)
At 1 January 2014 110.5 275.3 374.2 374.3 4.3 62.1 1,200.7Issue of Ordinary Shares – 0.1 – – – – 0.1Purchase and cancellation of own shares (3.8) – (93.0) – 3.8 – (93.0)Purchase of ESOP Trust shares – – (6.4) – – – (6.4)Profit for the year – – 14.6 – – – 14.6Provision for share-basedpayments – – 23.3 – – – 23.3Dividends paid – – (44.0) – – – (44.0)Movement in cash flow hedges 6.4 6.4Pension costs – actuarial losses – – (1.8) – – – (1.8)
At 31 December 2014 106.7 275.4 273.3 374.3 8.1 62.1 1,099.9
11. Reconciliation of movements in shareholders' funds
2014 2013$ million $ million
Opening shareholders’ funds 1,200.7 1,070.5
Issue of Ordinary Shares 0.1 0.4Purchase of ESOP Trust shares (6.4) (12.8)Profit for the year 14.6 162.0Provision for share-based payments 23.3 24.6Purchase and cancellation of own shares (93.0) –Dividends paid (44.0) (40.2)Movement in cash flow hedges 6.4 –Net pension movement (1.8) (3.8)
Net (deduction from)/addition to shareholders’ funds (100.8) 130.2
Closing shareholders' funds 1,099.9 1,200.7

Premier Oil plc 2014 Annual Report and Financial Statements / 179
12. Own shares
Total$ million
At 1 January 2013 44.6Purchase of ESOP Trust shares 12.8Release of shares for long-term incentive arrangements (39.6)
At 31 December 2013 17.8Purchase of ESOP Trust shares 6.4Release of shares for long-term incentive arrangements (8.5)
At 31 December 2014 15.7
The own shares reserve represents the net cost of shares in Premier Oil plc purchased in the market or issued by thecompany into the Premier Oil plc Employee Benefit Trust. This ESOP Trust holds shares to satisfy awards under the group'sshare incentive plans. At 31 December 2014, the number of Ordinary Shares of 12.5 pence each held by the Trust was2,690,319 (2013: 3,046,621 Ordinary Shares of 12.5 pence each).
13. Dividends
2014 2013$ million $ million
Amounts recognised as distributions to shareholders in the year:Final dividend for the year ended 31 December 2013 of 5p (2012: 5p) 44.0 40.2
Proposed final dividend for the year ended 31 December 2014 of nil (2013: 5p) – 43.9
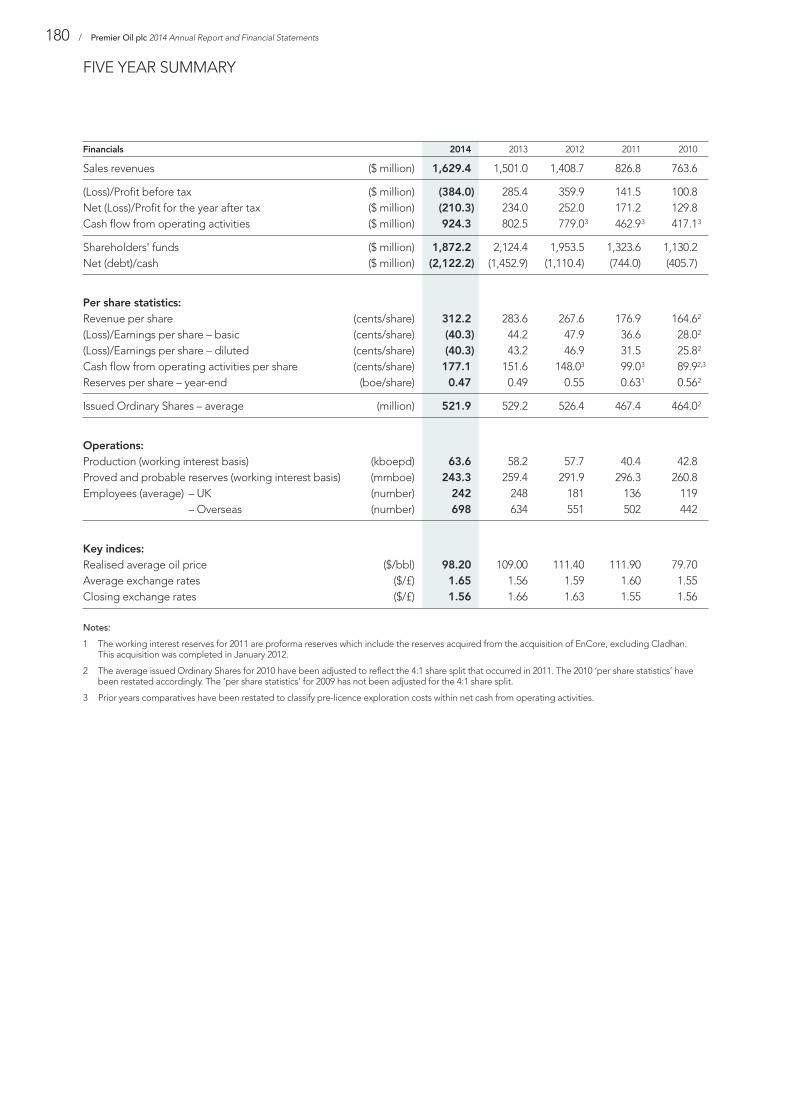
FIVE YEAR SUMMARY
180 / Premier Oil plc 2014 Annual Report and Financial Statements
Financials 2014 2013 2012 2011 2010
Sales revenues ($ million) 1,629.4 1,501.0 1,408.7 826.8 763.6
(Loss)/Profit before tax ($ million) (384.0) 285.4 359.9 141.5 100.8Net (Loss)/Profit for the year after tax ($ million) (210.3) 234.0 252.0 171.2 129.8Cash flow from operating activities ($ million) 924.3 802.5 779.03 462.93 417.13
Shareholders' funds ($ million) 1,872.2 2,124.4 1,953.5 1,323.6 1,130.2Net (debt)/cash ($ million) (2,122.2) (1,452.9) (1,110.4) (744.0) (405.7)
Per share statistics:Revenue per share (cents/share) 312.2 283.6 267.6 176.9 164.62
(Loss)/Earnings per share – basic (cents/share) (40.3) 44.2 47.9 36.6 28.02
(Loss)/Earnings per share – diluted (cents/share) (40.3) 43.2 46.9 31.5 25.82
Cash flow from operating activities per share (cents/share) 177.1 151.6 148.03 99.03 89.92,3
Reserves per share – year-end (boe/share) 0.47 0.49 0.55 0.631 0.562
Issued Ordinary Shares – average (million) 521.9 529.2 526.4 467.4 464.02
Operations:Production (working interest basis) (kboepd) 63.6 58.2 57.7 40.4 42.8Proved and probable reserves (working interest basis) (mmboe) 243.3 259.4 291.9 296.3 260.8Employees (average) – UK (number) 242 248 181 136 119
– Overseas (number) 698 634 551 502 442
Key indices:Realised average oil price ($/bbl) 98.20 109.00 111.40 111.90 79.70Average exchange rates ($/£) 1.65 1.56 1.59 1.60 1.55Closing exchange rates ($/£) 1.56 1.66 1.63 1.55 1.56
Notes:
1 The working interest reserves for 2011 are proforma reserves which include the reserves acquired from the acquisition of EnCore, excluding Cladhan.This acquisition was completed in January 2012.
2 The average issued Ordinary Shares for 2010 have been adjusted to reflect the 4:1 share split that occurred in 2011. The 2010 ‘per share statistics’ havebeen restated accordingly. The ‘per share statistics’ for 2009 has not been adjusted for the 4:1 share split.
3 Prior years comparatives have been restated to classify pre-licence exploration costs within net cash from operating activities.

OIL AND GAS RESERVESWorking interest reserves at 31 December 2014
Premier Oil plc 2014 Annual Report and Financial Statements / 181
Working interest basis
Indonesia Mauritania Norway Pakistan UK Vietnam TOTAL
Oil,Oil Oil Oil Oil Oil Oil Oil NGLs
and and and and and and and andNGLs Gas NGLs Gas NGLs Gas NGLs Gas NGLs Gas NGLs Gas NGLs Gas4 gas
mmbbls bcf mmbbls bcf mmbbls bcf mmbbls bcf mmbbls bcf mmbbls bcf mmbbls bcf mmboe
Group proved plus probable reserves:
At 1 January 2014 5.7 435.4 0.4 – – – 0.3 144.3 110.3 59.1 25.2 39.6 141.9 678.4 259.4
Revisions1 (0.5) (12.9) 0.2 – 22.6 3.3 – (17.2) (2.0) 0.6 0.1 0.4 20.3 (25.9) 15.8
Discoveries and extensions2 – – – – – – – 3.3 – – – – – 3.3 0.6
Acquisitions and divestments3 – – – – – – – – (5.8) (20.0) – – (5.8) (20.0) (9.4)
Production (0.3) (25.0) (0.2) – – – (0.1) (28.2) (6.0) (5.1) (5.0) (5.8) (11.5) (64.0) (23.1)
At 31 December 2014 4.9 397.6 0.4 – 22.6 3.3 0.2 102.2 96.5 34.6 20.3 34.2 144.9 571.8 243.3
Total group developed and undeveloped reserves:
Proved on production 0.9 107.7 0.2 – – – 0.2 86.3 14.8 4.8 13.6 25.6 29.6 224.4 69.6
Proved approved/justified
for development 2.3 175.2 – – 15.4 2.7 – – 40.2 18.8 1.4 – 59.3 196.6 90.2
Probable on production 0.9 61.7 0.2 – – – – 15.9 9.9 4.9 5.3 8.6 16.4 91.0 33.3
Probable approved/justified
for development 0.8 53.0 – – 7.2 0.6 – – 31.6 6.1 – – 39.6 59.8 50.2
At 31 December 2014 4.9 397.6 0.4 – 22.6 3.3 0.2 102.2 96.5 34.6 20.3 34.2 144.9 571.8 243.3
Notes:
1 Includes re-evaluation of reserves at Anoa, Gajah Puteri, Iguana, Bison, Kakap (Indonesia); Kadanwari, Bhit, Badhra, Zamzama (Pakistan); Balmoral,Wytch Farm and Catcher area (UK). Reserves from Beacon Field have been re-classified as contingent resources. Contingent resource in Vette (formerlyBream) has been reclassified as reserves – ‘Justified for Development’.
2 Includes reserves added at Kadanwari (Pakistan) through new K-36 well. Discoveries at Kuda Laut & Singa Laut (Indonesia) are classified as contingentresources and do not appear in this table.
3 Divestment of Scott, Telford and Rochelle (UK) was completed on 19 December 2014.
4 Proved plus probable gas reserves include 66 bcf fuel gas.
Premier Oil plc categorises petroleum resources in accordance with the 2007 SPE/WPC/AAPG/SPEE Petroleum ResourceManagement System (SPE PRMS).
Proved and probable reserves are based on operator, third party reports and internal estimates and are defined in accordance withthe Statement of Recommended Practice (SORP) issued by the Oil Industry Accounting Committee (OIAC), dated July 2001.
The group provides for amortisation of costs relating to evaluated properties based on direct interests on an entitlement basis,which incorporates the terms of the PSCs in Indonesia, Vietnam and Mauritania. On an entitlement basis reserves were 218.1mmboe as at 31 December 2014 (2013: 230.9 mmboe). This was calculated at year-end 2014 using an oil price assumption equalto US$61.5/bbl in 2015, US$69/bbl in 2016 and US$85/bbl in ‘real’ terms thereafter (2013: Dated Brent forward curve in 2014 and2015 and US$85/bbl in ‘real’ terms thereafter).
Ad
diti
onal
Info
rmat
ion

Licence Block Operator PO Equity % Field/Discovery
Brazil CE-M-665 Premier 50.00CE-M-717 Premier 50.00FZA-M-90 QGEP 35.00
Falkland Islands PL032 14/5, 14/10 Premier 60.00 Sea LionPL004a 14/15 (part), 14/20, 15/11 (part) 36.00PL004b 14/15 (part) 36.00PL004c 14/15 (part) 36.00
Indonesia Kakap Block Star Energy 18.75 KakapNatuna Sea Block A Premier 28.67 Anoa, Gajah Baru,
Pelikan, NagaTuna Block Premier 65.00 Kuda Laut/Singa Laut
Iraq Block 12 JSOC Bashneft 30.00
Mauritania PSC B (Chinguetti EEA) Petronas 8.12 Chinguetti
Norway PL407 17/9 (part) & 17/12 Premier 50.00 Vette (formerly Bream)PL539 3/7 (part) Premier 40.00
Pakistan Tajjal ENI 15.79 KadanwariQadirpur OGDCL 4.75 QadirpurKirthar ENI 6.00 BhitDadu BHP 9.38 ZamzamaKirthar ENI 6.00 BadhraBolan Mari Gas 3.75 Zarghun South
United Kingdom P164 205/26a Premier 60.00 SolanP201 16/21a Premier 85.00 Balmoral, Stirling & Glamis1
P344 16/21b, 16/21c Premier 44.20 Balmoral & Stirling2
P1042 15/25b Premier 100.00 BrendaP201 16/21a (Brenda Field area, Premier 100.00 Brenda
Above 7500 feet) (above 7500 feet)P233 15/25a Premier 70.00 NicolP1114 22/14b E.ON 40.00 HuntingtonPL089 SY87b, SY88b, SY89b, SY97b, Perenco 30.39 Wytch Farm3
SY98a, SY99a, SZ/7 & SZ/8aP534 98/6a & 98/7a Perenco 30.39 Wytch Farm (offshore)4
P748 29/2c CNR 40.00 KyleP077 22/12a Shell 50.00 Nelson5
P087 22/7a Premier 46.50 Nelson6
P1430 28/9a & 28/10c Premier 50.00 CatcherP1943 13/24c & 13/25 Premier 37.50 Bagpuss/Blofeld
Vietnam Block 12W Premier 53.13 Chim Sáo & Dua
A full list of Premier's global licence interests is available on the website at www.premier-oil.com (Operations section)
Notes:
1 Unitised share of 78.11542% (Balmoral), Unitised share of 68.68% (Stirling).
2 Unitised share of 78.11542% (Balmoral), Unitised share of 68.68% (Stirling).
3 Unitised share of 30.09625%.
4 Unitised share of 30.09625%.
5 Unitised share of 1.31404%.
6 Unitised share of 0.348750%.
SIGNIFICANT WORLDWIDE LICENCE INTERESTSAs at 25 February 2015
182 / Premier Oil plc 2014 Annual Report and Financial Statements

SHAREHOLDER INFORMATION
Premier Oil plc 2014 Annual Report and Financial Statements / 183
RegistrarAll enquiries concerning your shareholding should be directed to Capita Asset Services:
Capita Asset ServicesThe Registry34 Beckenham Road BeckenhamKentBR3 4TU
Telephone:UK: 0871 664 0300 (calls cost 10p per minute including VAT plus network extras, lines are open 8.30am – 5.30pm Monday to Friday)Overseas: +44 (0)20 8639 3399
Email: [email protected]
Share portalAs a shareholder you have direct access to an online share portal operated by Capita Asset Services at www.premier-oil-shares.com.You can access the share portal with your Investor Code (IVC) which can be found on your share certificate. The portal providesa range of services, free of charge, to help you to administer your shareholding quickly and efficiently by allowing you to:
• Check your share balance;
• Change your address details;
• Choose to receive electronic shareholder communications;
• Set up or amend a dividend mandate so dividends can be paid directly to your bank account; and
• Buy and sell Premier Oil plc shares using the dealing service operated by Capita Deal.
Dividends Dividend historyDetails of dividend payments made are included within the shareholder information section of the Investors area of the Premierwebsite: www.premier-oil.com
Dividend mandatesShareholders who have a UK bank or building society account may complete a dividend bank mandate in order to receive anyfuture dividends on the payment date. When a dividend is paid, tax vouchers will be sent directly to a shareholder’s registeredaddress. You can complete a dividend mandate form via the share portal at www.premier-oil-shares.com. If you have not usedthe share portal before you will be asked to register your account. Alternatively, you can telephone Capita Asset Services orapply in writing to their address above.
International dividend payment serviceOverseas shareholders who wish to have any future dividends paid in a local currency can use the International Payment Serviceoffered by Capita. The International Payment Service is available to holders who receive individual dividend or interest paymentsof £10 or more (payments of less than £10 or more than £100,000 will be paid by sterling cheque, unless otherwise agreed). Furtherinformation, including the terms and conditions of the International Payment Service, is available on Capita’s International PaymentService website: http://international.capitaregistrars.com. Please note this service may not be available to all overseas shareholders.
E-communications Shareholders have the option to receive communications including annual reports and notices of meetings electronically. For everyshareholder that actively registers their email address online Premier Oil plc has pledged to donate £1 to Pure Leapfrog’s carbonoffsetting programme which supports carbon reduction projects in Africa, India and other developing countries (www.pureleapfrog.org).To register for this service, please visit the share portal: www.premier-oil-shares.com. You will need your Investor Code (IVC) whichcan be found on your share certificate. Once registered, Premier Oil plc will communicate with you via email rather than post.
Shareholder security Shareholders are advised to be cautious about any unsolicited financial advice, including offers to buy Premier shares at inflatedprices, or offers of free reports about Premier. More information can be found at www.fca.org.uk/consumers/scams and in theShareholder Information section of the Investors area of the Premier website: www.premier-oil.com
American Depositary Receipt programmePremier Oil plc has a sponsored Level 1 American Depositary Receipt (ADR) programme which BNY Mellon administers and forwhich it acts as Depositary. Each ADR represents one ordinary share of the company. The ADRs trade on the US over-the-counter market under the symbol PMOIY. When dividends are paid to shareholders, the Depositary converts such dividendsinto US dollars, net of fees and expenses, and distributes the net amount to ADR holders.
Registered Depositary Receipt holders can trade, access account balances and transaction history, find answers to frequently askedquestions and download commonly needed forms online at www.adrbnymellon.com. To speak directly to a BNY Mellon representative,please call 1-888-BNY-ADRS (1-888-269-2377) if you are calling from within the United States. If you are calling from outside theUnited States, please call 201-680-6825. You may also send an email inquiry to [email protected] or visitthe website at www.computershare-na.com/bnym_adr

GLOSSARY
184 / Premier Oil plc 2014 Annual Report and Financial Statements
AEP Asset and Equity Plan
AGM Annual General Meeting
APA Awards in Predefined areas (Norway)
bbl barrel
BBtud billion British thermal units per day
bcf billion cubic feet
BMS Business Management System
boe barrels of oil equivalent
bopd barrel(s) of oil per day
DECC Department of Energy and Climate Change
DSA Domestic Swap Agreement
EBITDAX Earnings before interest, taxes, depreciation, amortisation and exploration expenses
ExCo Executive Committee
FDP field development plan
FEED front end engineering and design
FPSO floating production, storage and offtake vessel
GHG Greenhouse gases
GRI Global Reporting Initiative
HiPos high potential incidents
HSE health, safety and environment
HSES health, safety, environment and security
HSFO High Sulphur Fuel Oil
IAS International Accounting Standard
IFRS International Financial Reporting Standard
IPIECA International Petroleum Industry Environmental Conservation Association
kbopd thousand barrels of oil per day
kboepd thousand barrels of oil equivalent per day
KPI key performance indicator
LOPC loss of primary containment
LTIP Long Term Incentive Plan
mmbbls million barrels
mmboe million barrels of oil equivalent
mmscfd million standard cubic feet per day
mscf thousand standard cubic feet
mt metric tonne
NAV net asset value
PDO Plan for Development and Operation
PSA Performance Share Awards
PSC production sharing contract
PSR Project Safety Reviews
TLP Tension Leg Platform
TRIR total recordable injury rate
TSR total shareholder return

CONTACTS
Registered OfficePremier Oil plc4th FloorSaltire Court20 Castle TerraceEdinburghEH1 2ENRegistered No. 234781 Scotland
Head OfficePremier Oil plc23 Lower Belgrave StreetLondonSW1W 0NRTel: +44 (0)20 7730 1111Fax: +44 (0)20 7730 4696www.premier-oil.com
AuditorDeloitte LLP2 New Street SquareLondonEC4A 3BZ
SolicitorSlaughter and MayOne Bunhill RowLondonEC1Y 8YY
StockbrokersDeutsche Bank AGWinchester House1 Great Winchester StreetLondonEC2N 2DB
and
RBC Capital MarketsThames Court One QueenhitheLondon EC4V 3DQ
RegistrarCapita Asset ServicesThe Registry34 Beckenham Road BeckenhamKentBR3 4TU
Designed and produced by MAGEEwww.magee.co.uk
Printed by Pureprint Ltd
Pureprint Ltd is FSC® certified, ISO 14001 certified showing that it is committed to all round excellence andimproving environmental performance is an important part of this strategy. We aim to reduce at source the effectour operations have on the environment, and are committed to continual improvement, prevention of pollutionand compliance with any legislation or industry standards.
Pureprint Ltd is a CarbonNeutral® Printing Company.
The paper used for the front cover and pages 1-68 of this report contains material sourced from responsiblymanaged forests, certified in accordance with the FSC® (Forest Stewardship Council) and is manufactured toISO 14001 and EMAS (Eco-Management and Audit Scheme) international standards, minimising negative impactson the environment.
The paper used for pages 69-184 of this report is produced using FSC® mix pulp which is fully recyclable,biodegradable, pH Neutral, heavy metal absence and acid-free. It is manufactured within a mill which complieswith the international environmental ISO 14001 standard.

www.premier-oil.comPremier Oil plc23 Lower Belgrave StreetLondon SW1W 0NR
Telephone: +44 (0)20 7730 1111Facsimile: +44 (0)20 7730 4696
ANNUAL REPORT AND FINANCIAL STATEMENTSYear to 31 December 2014
Premier O
il plc2014 A
nnual Report and
Financial Statements
DELIVERING
OPERATING
EFFICIENCY