Embed Size (px)
Citation preview

Premier, Inc.
Company Overview
July 2021
1

Forward-looking Statements and Non-GAAP Financial Measures
2
Forward-looking statements – Statements made in this presentation that are not statements of historical or current facts, such as those
related to expected growth opportunities in each of Premier’s business segments and the ability to realize such opportunities, strategic
priorities to advance Premier’s business, Premier's unique positioning to deliver stockholder value and long-term sustainable growth, the
expected financial and operational impacts of the COVID-19 pandemic, targeted multi-year revenue growth rate in Premier’s Performance
Services segment, the expected multi-year compound annual growth rate for consolidated net revenue, adjusted EBITDA and adjusted
EPS beginning in fiscal 2022, capital deployment, the payment of future dividends, free cash flow generation, and the matters discussed
on the “Our Value Proposition” slide are “forward-looking statements” within the meaning of the Private Securities Litigation Reform Act of
1995. Forward-looking statements may involve known and unknown risks, uncertainties and other factors that may cause the actual
results, performance or achievements of Premier to be materially different from historical results or from any future results or projections
expressed or implied by such forward-looking statements. Accordingly, readers should not place undue reliance on any forward-looking
statements. In addition to statements that explicitly describe such risks and uncertainties, readers are urged to consider statements in the
conditional or future tenses or that include terms such as “believes,” “belief,” “expects,” “estimates,” “intends,” “anticipates” or “plans” to be
uncertain and forward-looking. Forward-looking statements may include comments as to Premier’s beliefs and expectations as to future
events and trends affecting its business and are necessarily subject to uncertainties, many of which are outside Premier’s control. More
information on potential factors that could affect Premier’s financial results is included from time to time in the “Cautionary Note Regarding
Forward-Looking Statements,” “Risk Factors” and “Management’s Discussion and Analysis of Financial Condition and Results of
Operations” sections of Premier’s periodic and current filings with the SEC, including those discussed under the “Risk Factors” and
“Cautionary Note Regarding Forward-Looking Statements” sections of Premier’s Form 10-K for the fiscal year ended June 30, 2020 and
Form 10-Q for the quarter ended March 31, 2021, each filed with the SEC and available on Premier’s website at investors.premierinc.com.
Forward-looking statements speak only as of the date they are made, and Premier undertakes no obligation to publicly update or revise
any forward-looking statements, whether as a result of new information or future events that occur after that date, or otherwise.
Non-GAAP financial measures – This presentation includes certain “adjusted” or “non-GAAP financial measures” as defined in
Regulation G under the Securities Exchange Act of 1934. You should carefully read Premier’s periodic and current filings with the SEC for
definitions and further explanation and disclosure regarding our use of non-GAAP financial measures and such filings should be read in
conjunction with this presentation.

3
Today’s Agenda
Business Overview
1
Positioned to Deliver Shareholder Value
2
Engaged Board with Strong Governance Practices
3
ESG Leadership Core to Business
4
Financial Profile
5

Business Overview
4

Collaborate through unique member alignment to innovate and drive meaningful change
Anticipate change and well-positioned to respond to market trends
Provide innovative, comprehensive solutions using technology, including AI and machine
learning, services and market-leading analytics to drive clinical and financial improvement
Maintain strong balance sheet with financial flexibility to support capital deployment priorities
Well-positioned to capitalize on growth opportunities and maintain market-leading position
through further penetration of supply chain and enterprise analytics markets
5
Uniquely Positioned to Deliver Value
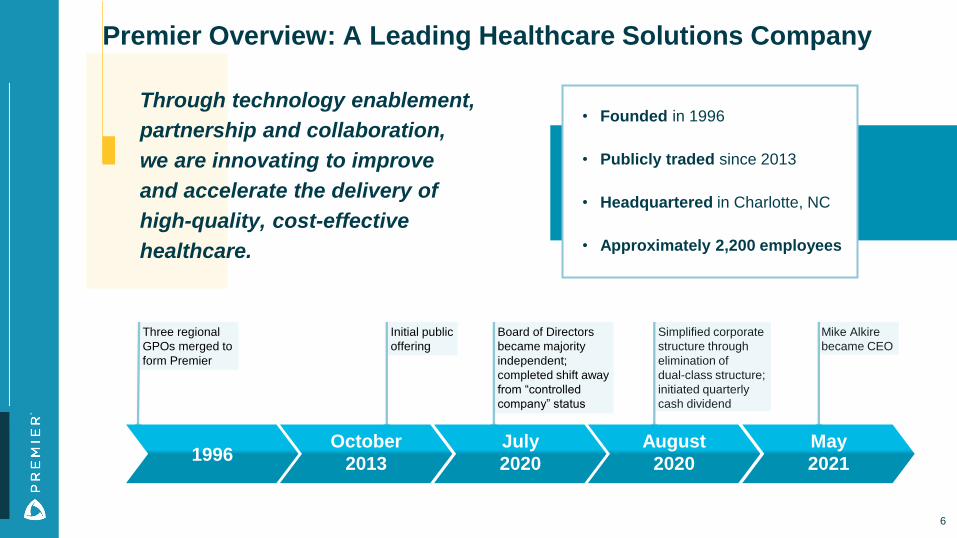
Three regional
GPOs merged to
form Premier
6
Premier Overview: A Leading Healthcare Solutions Company
• Founded in 1996
• Publicly traded since 2013
• Headquartered in Charlotte, NC
• Approximately 2,200 employees
Through technology enablement,
partnership and collaboration,
we are innovating to improve
and accelerate the delivery of
high-quality, cost-effective
healthcare.
Initial public
offering
Board of Directors
became majority
independent;
completed shift away
from “controlled
company” status
Simplified corporate
structure through
elimination of
dual-class structure;
initiated quarterly
cash dividend
Mike Alkire
became CEO
1996October
2013
July
2020
August
2020
May
2021

7
Provide Comprehensive Technology-Enabled SolutionsThrough Integrated Platform
7
Member Network,
Data & Technology, Embedded Field Force
Enable and support
members to safely reduce
costs, gain transparency
and ensure resiliency
Provide actionable intelligence
to achieve improved outcomes,
sustainable financial
performance and success in
new payment models
Direct Sourcing(contract manufactured
product sales)
Technology & Analytics(SaaS subscriptions and license fees)
Consulting & Collaboratives(fee-for-service and service subscriptions)
Group Purchasing(supplier-paid administrative fees)
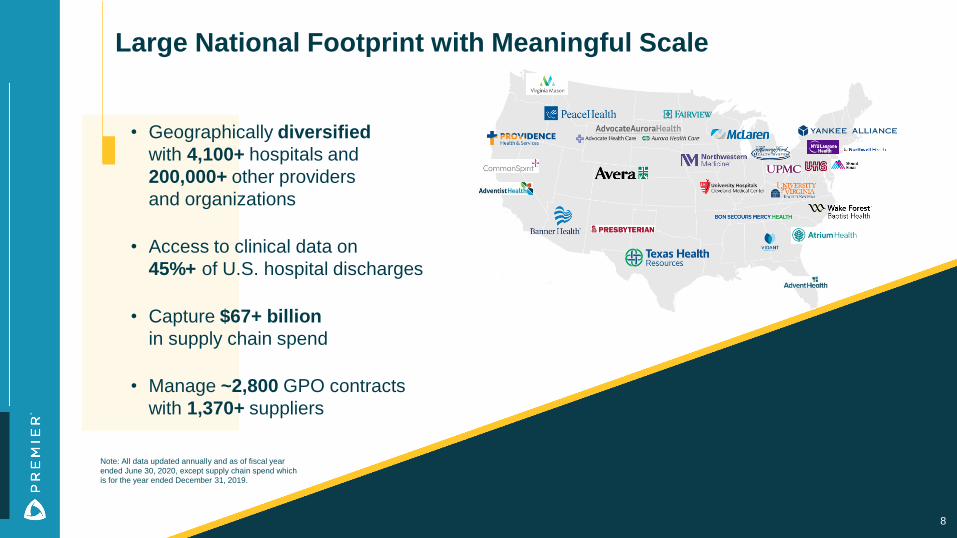
Large National Footprint with Meaningful Scale
8
• Geographically diversified
with 4,100+ hospitals and
200,000+ other providers
and organizations
• Access to clinical data on
45%+ of U.S. hospital discharges
• Capture $67+ billion
in supply chain spend
• Manage ~2,800 GPO contracts
with 1,370+ suppliers
Note: All data updated annually and as of fiscal year
ended June 30, 2020, except supply chain spend which
is for the year ended December 31, 2019.

9
Unique Member Alignment and Collaboration
• Viewed by ~90% of members
as a strategic partner or extension
of their organization
• Three-year average GPO retention
rate of 98% and SaaS institutional
renewal rate of 96%
• Achieved Net Promoter Score
of 70+
• Advisory committees with
~140 participating hospital
and health system members
• Co-develop and co-invest alongside
members in creating solutions to
transform healthcare delivery
Note: Data updated annually and as of fiscal year ended June 30, 2020
9

Our Customers
Integrated Platform and Technology CapabilitiesDeliver Actionable Insights and Meaningful Solutions
10
Purchasing
Billing
Financial
Clinical
Claims
Other Data
Solutions Delivered
Data
Sources
Device
Manufacturers
Providers and
Their Health Plans
Employers & Payors
Pharma
Supply Chain
Cost Management
Population Health
Clinical Intelligence
Pharmacy
Consulting
Proprietary
Technology/AI
and
Wrap-around
Services

Mike AlkirePresident and CEO
16 years Premier, 16 years healthcare
Cap Gemini Ernst & Young
Leigh AndersonPresident, Performance Services
8 years Premier, 24 years healthcare informatics
Hospital Corporation of America, HealthTrust, GHX
David HargravesSenior Vice President, Supply Chain Services
6 years Premier, 18 years supply chain
University of Pittsburgh Medical Center (UPMC)
David KlatskyGeneral Counsel
5 years Premier, 30 years healthcare
McDermott, Will & Emery
Joe MachicoteChief Diversity and Inclusion Officer
30 years DEI&B and human resources
Erickson Living, Snyder’s-Lance, Compass Group
Craig McKassonChief Administrative and Financial Officer
24 years Premier, 27 years healthcare
Ernst & Young
Lindsay PowersSenior Vice President, People
5 years Premier, 17 years human resources
Ettain Group, Family Dollar Stores
11
Experienced Leadership Team

Positioned to Deliver Stockholder Value
12

Well-Positioned for Emerging Healthcare Trends
13
Substantially improving provider IT infrastructure and performance with predictive analytics, actionable data and enhanced workflow solutions
Continued focus on overall healthcare cost management
Increasing employer, payer and life sciences interaction with providers for cost and quality outcomes improvement
Advancing the shift to value-based care and risk assumption by providers
1 2 3
4 5
Increased focus on creating a more geographically diverse and transparent healthcare supply chain

Strategic Priorities to Advance Our Business
Grow GPO portfolio and expand high-
compliance purchasing programs
Technology-enable all aspects
of healthcare supply chain
Co-own and co-manage member
supply chain outcomes to drive further
efficiencies and savings
Continue to provide integrated analytics,
workflow technology and advisory services
Expand data and technology platform
alongside machine-learning capabilities
Further expand into new markets
through Contigo Health and applied
sciences businesses
Accelerate and support transition to
value-based payment models
Enable Clinical Improvement
Through Data Analytics and
Wrap-Around Services
Extend End-to-End
Supply Chain Capabilities
14

• Medical-surgical portfolio
• Pharmacy program
• Non-acute portfolio
• Contract compliance
• Physician preference
• Regional contracts
• Specialty portfolios
• Leverage member
GPO relationships
Expanding Supply Chain Services Capabilitiesfor Visibility to Total Spend
Me
mb
er
Va
lue
SCS Growth Opportunities
• Purchased Services
• Technology to manage full supply chain
spend, including transaction fee potential
• Visibility to, and processing of, all spend
• Co-management
(1) Total GPO (Group Purchasing Organization) purchasing volume by all members participating in GPO for calendar year 2019.
(2) Premier estimate of member GPO spend that could potentially be managed if Premier expanded capabilities in certain areas. Refer to “Forward-Looking Statements” on slide 2 of this presentation. 15
Core GPO Today
Supply Chain
Spend Coverage &
Market Expansion
Purchased Services
/ Shared Services
$67B(1)
$120B`
$200B(2)
To
day
Fu
ture

Today
16
• Data management
• Performance analytics
• Benchmarking
• Clinical decision support
• Consulting services
• Front office automation
• Integration into
physician workflow
• Real-time claims
adjudication
• Applied research and
analytics
• Provider and patient
engagement
• Clinical trials services
Healthcare
Data, Analytics
& Consulting
Payor / Prior
Authorization
Market
Life Sciences
Analytics Market
Direct-to-Employer
/ Benefits Design
• TPA services
• Health plan
administration services
• Centers of Excellence
$347M
Fiscal 2020
Revenue
Targeting multi-year, mid-to-high single-digit
revenue CAGR*
Performance Services Expanding intoAdjacent Markets to Drive Long-Term Growth
*Beginning in fiscal 2022 and excluding impact of COVID-19 pandemic on business
Future

Engaged Board with Strong Governance Practices
17

18
Corporate Governance Highlights
✓ Board comprised of 15 directors, eight are independent
✓ Separate CEO and Board Chair positions; bylaws provide for Lead Independent Director
✓ Majority independent board since July 31, 2020; key board committees all independent
✓ ~27% of the board are comprised of women and/or are racially diverse
✓ Hired Chief Diversity & Inclusion Officer as member of executive team
✓ Board refreshed to bring in new perspectives
✓ Since 2019, three additional independent directors, of which one is female
✓ Three member directors resigned in July 2020
✓ Michael Alkire promoted to CEO effective May 1, 2021 and serves as a Board director
✓ Completed shift away from “controlled-company” status in 2020
✓ Eliminated dual-class share structure and meaningfully simplified ownership structure and
financial reporting with single, equal class of shares
✓ Terminated tax receivable agreements; paying out related obligations over a 5-year period;
expected to enhance financial and balance sheet flexibility
✓ No poison pill in place
Majority
Independent
Leadership
and Oversight
Continued
Focus on
Board
Refreshment
Simplified
Corporate
Structure

Photo Board Member AgeBoard
TenurePrimary Occupation Key Skills / Qualifications Outside Director
Michael J. Alkire 58 < 1 President and CEO
Nearly 30 years of operational, technology and
business development leadership experience; joined
Premier in 2003--
Terry Shaw 58 8 Board Chair; President &
Chief Executive Officer, AdventHealth
36 years of healthcare industry experience with finance
background; leadership experience at a large
healthcare system
✓
William E. Mayer 81 8 Lead Independent Director;
Founder, Park Avenue Equity Partners
35 years of experience in financial and senior executive
positions and public company board experience ✓
Barclay E. Berdan 68 5 CEO, Texas Health Resources 44 years of healthcare industry experience; served in
executive positions at large healthcare systems ✓
John Bigalke 66 2 CEO of Second Half Healthcare Advisors
Financial, corporate accounting, business development
and leadership experience; serving on audit committees
at other public and private companies✓
Helen M. Boudreau 55 1 Former COO of Bill & Melinda Gates
Medical Research Institute
Financial background more than 20 years in the
healthcare industry; serves as chair of audit committees
and on compensation committees for other public and
private companies; NACD Directorship Certified
✓
Stephen R. D'Arcy 66 8 Partner, Quantum Group
Financial, corporate accounting, business development
and leadership experience; serving on audit committees
at other public/private companies✓
Jody R. Davids 65 6 Retired; former SVP and
Chief Information Officer at PepsiCo
Information technology, cybersecurity risk management,
supply chain, logistics and distribution and executive
leadership experience ✓
19
A “Fit-for-Purpose” Board of Directors

Photo Board Member AgeBoard
TenurePrimary Occupation Key Skills / Qualifications Outside Director
Peter S. Fine 69 8 President & CEO, Banner Health 43 years healthcare industry experience and executive
leadership experience at large healthcare system ✓
David Langstaff 67 5 EVP, Leadership,
The Aspen Institute
Former CEO of technology company; prior board and
committee service with other publicly traded companies ✓
Marc D. Miller 51 6 President and CEO, Universal Health
Services
25 years healthcare industry experience and public company
leadership experience ✓
Marvin R. O'Quinn 69 6 President and COO,
CommonSpirit Health
41 years healthcare industry experience and
leadership experience serving in executive positions
at large healthcare systems✓
Scott Reiner 57 5 CEO, Adventist Health
32 years healthcare industry experience including leadership
experience at large healthcare systems as well as a nursing
background and leading clinical functions✓
Richard J. Statuto 64 8 Former President and CEO
of Bon Secours Health System
35 years healthcare industry experience and leadership
experience at large healthcare systems ✓
Ellen C. Wolf 67 8 Former SVP and CFO
of American Water Works Company
Financial, corporate accounting, business development and
leadership experience; served on audit and compensation
committees of other company boards✓
20
… Each Director Bringing Highly Relevant Skills & Experience

21
Diversity of Background and Expertiseto Drive Stakeholder Value
Director Independent
Executive
Leadership
Healthcare
Industry
Digital
Technology Operations Treasury
Capital
Allocation
Finance /
Accounting /
Auditing
M&A /
Corporate
Development
Corporate
Governance
Supply Chain /
Logistics
Risk
Assessment
and
Management
Michael J. Alkire ✓ ✓ ✓ ✓ ✓ ✓
Terry Shaw ✓ ✓ ✓ ✓ ✓ ✓ ✓
William E. Mayer ✓ ✓ ✓ ✓ ✓ ✓ ✓
Barclay E. Berdan ✓ ✓ ✓
John Bigalke ✓ ✓ ✓ ✓ ✓ ✓ ✓ ✓
Helen M. Boudreau ✓ ✓ ✓ ✓ ✓ ✓
Stephen R. D'Arcy ✓ ✓ ✓ ✓ ✓ ✓ ✓
Jody R. Davids ✓ ✓ ✓ ✓ ✓
Peter S. Fine ✓ ✓ ✓
David Langstaff ✓ ✓ ✓ ✓ ✓ ✓ ✓
Marc D. Miller ✓ ✓ ✓
Marvin R. O'Quinn ✓ ✓ ✓
Scott Reiner ✓ ✓ ✓
Richard J. Statuto ✓ ✓ ✓ ✓ ✓
Ellen C. Wolf ✓ ✓ ✓ ✓ ✓ ✓ ✓ ✓

22
Compensation Plan Designed to Deliver Long-term Stockholder Value
• Executive compensation program designed to attract and retain exceptional and diverse talent and drive sustainable
financial and operational performance to achieve short- and long-term goals
• Compensation Committee engages with independent third-party compensation advisor to determine most effective ways
to motivate and incentivize management to accomplish specific short- and long-term objectives
• Objective, tailored metrics with challenging performance targets chosen annually to align compensation program with
strategic priorities
• Compensation Committee selected revenue, adjusted EBITDA, member quality and cost, and key strategic milestones
as fiscal 2021 performance metrics in annual incentive plan to drive top- and bottom-line financial growth, quality
of care and cost performance of member hospital systems, and key operational and strategic milestones
• Equity incentive plan for fiscal 2021 includes 60% performance shares and 40% time-based restricted stock units (RSUs)
‒ Performance shares awarded based on three-year adjusted EPS performance
‒ RSUs intended to drive retention and vest on the third anniversary of the grant date
• Stock ownership requirements for Board directors and executive officers to better align interests with stockholders
‒ Directors and executive officers beneficially own ~1.3 million shares, or ~1.0% of shares outstanding, of PINC
common stock on combined basis*
* As of May 31, 2021; according to the rules adopted by the SEC, a person is a beneficial owner of securities if the person or entity has or shares the power to vote them or to direct their
investment or has the right to acquire beneficial ownership of such securities within 60 days through the exercise of an option, warrant or right, conversion of a security or otherwise.

ESG Practices Core to
Sustainable, Long-term Success
23

24
Sustainable Business Practices to Drive Success
• Promote sound governance
• Enhanced Diversity, Equity, Inclusion and
Belonging program for all Premier employees
• Long-standing, robust Supplier Diversity program
• Maintain income equality and enhance diversity
in recruiting and promoting exceptional talent
• Collaborate with members to incorporate environmentally
preferred purchasing and energy efficiency initiatives into
products selection process
• Named one of World’s Most Ethical Companies*
for 13 consecutive years
*The Ethisphere Institute®, 2020
Furthering our mission to improve
the health of our communities
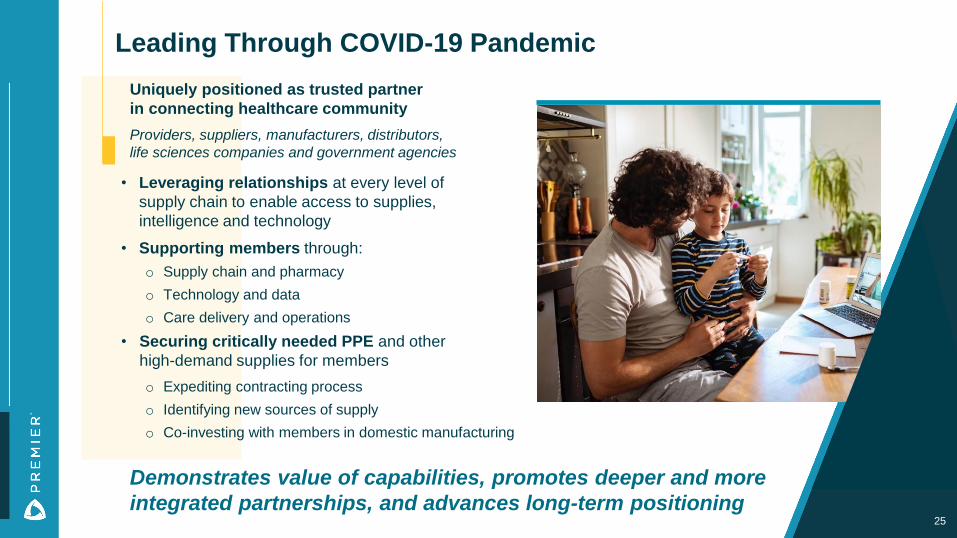
Leading Through COVID-19 Pandemic
• Leveraging relationships at every level of
supply chain to enable access to supplies,
intelligence and technology
• Supporting members through:
o Supply chain and pharmacy
o Technology and data
o Care delivery and operations
• Securing critically needed PPE and other
high-demand supplies for members
o Expediting contracting process
o Identifying new sources of supply
o Co-investing with members in domestic manufacturing
25
Uniquely positioned as trusted partner
in connecting healthcare community
Providers, suppliers, manufacturers, distributors,
life sciences companies and government agencies
Demonstrates value of capabilities, promotes deeper and more
integrated partnerships, and advances long-term positioning

26
Driving Success Through Strong Employee Engagement
Outperformed global benchmarks
related to diversity, equity, inclusion and belonging in workplace
Leadership team received high marks
outperforming global benchmarks for response to the pandemic and support of team
Recently hired chief diversity and inclusion officer
as member of executive team
Employee engagement remains strong
with increases in all major drivers of engagement over past year

27
Our Long-Standing Diversity, Equity, Inclusion and Belonging Pillars Central to Our Mission
Diversity, Equity, Inclusion and Belonging strategy based on four foundational pillars designed to accelerate how we provide health and wellness solutions and drive health equity in an increasingly diverse world
1 2 3 4
Leadership and Culture
People andWorkplace
CommunityDevelopment
SupplierDiversity
Our Mission: To improve the health of communities

28
Committed to Supporting DEI&B Inside and Outside Premier
Well-established Diversity, Equity,
Inclusion and Belonging (DEI&B)
strategy for all Premier employees
• Fiscal 2021 enhancements:
‒ Hired Chief Diversity & Inclusion Officer as a
member of executive team
‒ Multiple DEI&B learning and development
programs,10 employee resource groups with
~20% of employees engaged and supported
by DEI&B Leadership Council
‒ Daily activities and open engagement
programs designed to enhance effective and
sensitive communications skills
Implemented robust Supplier Diversity
program more than 20 years ago
• Suppliers help members improve quality of life
in communities where they serve and create
jobs and socio-economic development
• Committed to helping minority, women and
veteran-owned business and small business
enterprises compete, grow and thrive

Financial Profile
29

30
Strong Foundation Positions Premier forLong-Term, Sustainable Growth
$313
$564
FY13 FY20
$1.19
$2.73
FY13 FY20
$633
$1,300
FY13 FY20
Consolidated Net Revenue**(in millions)
Adjusted EBITDA** (in millions)
Adjusted Fully Distributed EPS**
*Premier’s targeted multi-year compound annual growth rate does not include the impact of potential future material capital deployment.
**Reflects continuing operations excluding specialty pharmacy business that was divested in June 2019. Refer to Appendix for a reconciliation of non-GAAP to GAAP equivalents.
Recurring and visible revenue
High customer retention rates Generate strong free cash flow
Maintain strong balance sheet
Multiple growth drivers Built core “chassis”
Beginning in fiscal 2022 and adjusted for anticipated impact of COVID-19 pandemic on business,
expect to target multi-year compound annual growth rate in mid-to-high single-digits for
consolidated net revenue, adjusted EBITDA and adjusted EPS*
FY13 FY20 FY13 FY20 FY13 FY20

31
Ample Capacity to Support Capital Deployment Priorities
* As of March 31, 2021, $1.0B credit facility had an outstanding balance of $200 million; company subsequently repaid $75 million of balance in April 2021.
**Non-GAAP adjusted EBITDA and free cash flow figures are for fiscal years ended June 30. Refer to Appendix for reconciliations of non-GAAP to GAAP metrics.
Current and Available Debt*
Current Debt Available Debt
$125M
$875M
(in millions)
Capital Deployment Priorities
• Reinvestment in organic growth
• Disciplined acquisitions and investments to support strategic goals
• Returning capital to stockholders through quarterly cash dividend payment
Expect to generate
free cash flow of
~35% to 45% of
adjusted EBITDA
going forward

Summary
32

Our Value Proposition
33
Executing on strategy to
provide differentiated
value to healthcare
providers and other
customers by delivering
innovative solutions to
improve healthcare
quality and reduce
overall costs
Generate strong free
cash flow and maintain
flexible balance sheet
to support balanced
approach to capital
deployment priorities
Well-positioned for
long-term growth
through further
penetration of supply
chain and enterprise
analytics markets and
acquisitions to enhance
capabilities and
maintain market
leadership position
2 31
33

Appendix
34

35
2020 (a) 2013 (a) (b)
Net Revenue:
Supply Chain Services:
Net administrative fees $ 670,593 $ 414,207
Other services and support 12,225 471
Services 682,818 414,678
Products 269,945 13,028
Total Supply Chain Services 952,763 427,706
Performance Services 346,829 205,214
Total $ 1,299,592 $ 632,920
Supplemental Financial Information
Consolidated Revenue
(b) Results for f iscal year 2013 are presented on a pro forma basis for purposes of comparability. See slide 41 in this
presentation for a description of the pro forma adjustments.
(a) Revenue for the periods presented have been retrospectively adjusted to reflect continuing operations.
(Unaudited)
(In thousands)
Year Ended June 30,

36Table continues on slides 37-38.
2020 (a) 2013 (a) (c)
Net income from continuing operations $ 291,126 $ 247,785
Interest and investment loss (income), net 11,313 (965)
Income tax expense 92,561 32,539
Depreciation and amortization 97,297 26,474
Amortization of purchased intangible assets 55,530 1,539
EBITDA 547,827 307,372
Stock-based compensation 21,132 -
Acquisition and disposition related expenses 19,319 -
Remeasurement of tax receivable agreement liabilities (24,584) -
Gain on FFF put and call rights (4,690) -
Other expense 5,036 5,958
Adjusted EBITDA $ 564,040 $ 313,330
(a) Amounts for the periods presented have been retrospectively adjusted to reflect continuing operations.
(b) Reflects income tax expense at our estimated income tax rate of 26% of adjusted income before income taxes for the year ended June 30,
2020 and 40% of adjusted income before income taxes for the year ended June 30, 2013.
(c) Results for f iscal year 2013 are presented on a pro forma basis for purposes of comparability. See slide 41 in this
presentation for a description of the pro forma adjustments.
Year Ended June 30,
Supplemental Financial Information
Reconciliation of Net Income from Continuing Operations to Adjusted EBITDA
Reconciliation of Operating Income to Segment Adjusted EBITDA
Reconciliation of Net Income Attributable to Stockholders to Non-GAAP Adjusted Net Income
(In thousands)
(Unaudited)

37Table continues on slide 38.
2020 (a) 2013 (a) (c)
Income before income taxes $ 383,687 $ 280,324
Equity in net income of unconsolidated aff iliates (12,537) (11,968)
Interest and investment loss (income), net 11,313 (965)
Gain on FFF put and call rights (4,690) -
Other (income) expense (4,153) 788
Operating income 373,620 268,179
Depreciation and amortization 97,297 26,474
Amortization of purchased intangible assets 55,530 1,539
Stock-based compensation 21,132 -
Acquisition and disposition related expenses 19,319 -
Remeasurement of tax receivable agreement liabilities (24,584) -
Equity in net income of unconsolidated aff iliates 12,537 11,968
Deferred compensation plan expense 3,904 -
Other expense, net 5,285 5,170
Adjusted EBITDA $ 564,040 $ 313,330
SEGMENT ADJUSTED EBITDA
Supply Chain Services $ 570,298 $ 325,933
Performance Services 111,282 56,456
Corporate (117,540) (69,059)
Adjusted EBITDA $ 564,040 $ 313,330
(a) Amounts for the periods presented have been retrospectively adjusted to reflect continuing operations.
(b) Reflects income tax expense at our estimated income tax rate of 26% of adjusted income before income taxes for the year ended June 30,
2020 and 40% of adjusted income before income taxes for the year ended June 30, 2013.
(c) Results for f iscal year 2013 are presented on a pro forma basis for purposes of comparability. See slide 41 in this
presentation for a description of the pro forma adjustments.
Supplemental Financial Information
Reconciliation of Net Income from Continuing Operations to Adjusted EBITDA
Reconciliation of Operating Income to Segment Adjusted EBITDA
Reconciliation of Net Income Attributable to Stockholders to Non-GAAP Adjusted Net Income
(Unaudited)
(In thousands)
Year Ended June 30,

38
2020 (a) 2013 (a) (c)
Net income attributable to stockholders $ 598,675 $ 30,277
Adjustment of redeemable limited partners' capital to redemption amount (468,311) -
Net income attributable to non-controlling interest in Premier LP 161,816 218,463
(Income) loss from discontinued operations, net of tax (1,054) 524
Income tax expense 92,561 32,539
Amortization of purchased intangible assets 55,530 1,539
Stock-based compensation 21,132 -
Acquisition and disposition related expenses 19,319 -
Remeasurement of tax receivable agreement liabilities (24,584) -
Gain on FFF put and call rights (4,690) -
Other expense 5,036 5,170
Adjusted income before income taxes 455,430 288,512
Income tax expense on adjusted income before income taxes (b) 118,412 115,405
Adjusted Net Income $ 337,018 $ 173,107
Supplemental Financial Information
Year Ended June 30,
(c) Results for f iscal year 2013 are presented on a pro forma basis for purposes of comparability. See slide 41 in this
presentation for a description of the pro forma adjustments.
Reconciliation of Net Income from Continuing Operations to Adjusted EBITDA
Reconciliation of Operating Income to Segment Adjusted EBITDA
Reconciliation of Net Income Attributable to Stockholders to Non-GAAP Adjusted Net Income
(Unaudited)
(In thousands)
(a) Amounts for the periods presented have been retrospectively adjusted to reflect continuing operations.
(b) Reflects income tax expense at our estimated income tax rate of 26% of adjusted income before income taxes for the year ended June 30,
2020 and 40% of adjusted income before income taxes for the year ended June 30, 2013.

39Table continues on slide 40.
2020 (a) 2013 (a) (b)
Net income attributable to stockholders $ 598,675 $ 30,277
Adjustment of redeemable limited partners' capital to redemption amount (468,311) -
Net income attributable to non-controlling interest in Premier LP 161,816 218,463
(Income) loss from discontinued operations, net of tax (1,054) 524
Income tax expense 92,561 32,539
Amortization of purchased intangible assets 55,530 1,539
Stock-based compensation 21,132 -
Acquisition and disposition related expenses 19,319 -
Remeasurement of tax receivable agreement liabilities (24,584) -
Gain on FFF put and call rights (4,690) -
Other expense, net 5,036 5,170
Adjusted income before income taxes 455,430 288,512
Income tax expense on adjusted income before income taxes 118,412 115,405
Adjusted Net Income $ 337,018 $ 173,107
(a) Amounts for the periods presented have been retrospectively adjusted to reflect continuing operations.
(b) Results for f iscal year 2013 are presented on a pro forma basis for purposes of comparability. See slide 41 in this
presentation for a description of the pro forma adjustments.
Year Ended June 30,
Supplemental Financial Information
Reconciliation of GAAP EPS to Adjusted EPS
(Unaudited)
(In thousands, except per share data)

40
2020 (a) 2013 (a) (b)
Weighted average:
Common shares used for basic and diluted earnings per share 67,035 5,858
Potentially dilutive shares 645 -
Conversion of Class B common units 55,935 139,125
Weighted average shares outstanding - diluted 123,614 144,983
Earnings per share attributable to stockholders $ 8.93 $ 5.17
Adjustment of redeemable limited partners' capital to redemption amount (6.99) -
Net income attributable to non-controlling interest in Premier LP 2.41 37.29
(Income) loss from discontinued operations, net of tax (0.02) 0.09
Income tax expense 1.38 5.55
Amortization of purchased intangible assets 0.83 0.26
Stock-based compensation 0.32 -
Acquisition and disposition related expenses 0.29 -
Remeasurement of tax receivable agreement liabilities (0.37) -
Gain on FFF put and call rights (0.07) -
Other expense, net 0.08 0.88
Impact of corporation taxes (1.77) (19.70)
Impact of dilutive shares (2.29) (28.36)
Adjusted EPS $ 2.73 $ 1.19
- -
(b) Results for f iscal year 2013 are presented on a pro forma basis for purposes of comparability. See slide 41 in this
presentation for a description of the pro forma adjustments.
(a) Amounts for the periods presented have been retrospectively adjusted to reflect continuing operations.
Reconciliation of GAAP EPS to Adjusted EPS
(Unaudited)
(In thousands, except per share data)
Year Ended June 30,
Supplemental Financial Information

41
Fiscal Year 2013 Pro Forma Adjustments
Fiscal year 2013 results are presented on a pro forma basis to reflect the following to provide a more
indicative comparison between current and prior periods:
• The contractual requirement under the GPO participation agreements to pay each member owner
revenue share from Premier LP equal to 30% of all gross administrative fees collected by Premier LP
based upon purchasing by such member owner's member facilities through Premier LP's GPO supplier
contracts. Historically, Premier LP did not generally have a contractual requirement to pay revenue share
to member owners participating in its GPO programs, but paid semi-annual distributions of partnership
income.
• Additional U.S. federal, state and local income taxes with respect to its additional allocable share of any
taxable income of Premier LP.
• A decrease in noncontrolling interest in Premier LP from 99% to approximately 78%.