Embed Size (px)
DESCRIPTION
SEC preliminary prospectus Century
Citation preview

7/21/2019 PreliminaryProspectus - Century
http://slidepdf.com/reader/full/preliminaryprospectus-century 1/648
The Prospectus is being displayed in the website to make the Prospectus accessible
to more investors. The Philippine Stock Exchange, Inc. (“PSE”) assumes no
responsibility for the correctness of any statements made or opinions or reportsexpressed in the Prospectus. Furthermore, the PSE makes no representation as to
the completeness of the Prospectus and disclaims any liability whatsoever for any
loss arising from or in reliance in whole or in part on the contents of the Prospectus.

7/21/2019 PreliminaryProspectus - Century
http://slidepdf.com/reader/full/preliminaryprospectus-century 2/648
SUBJECT TO COMPLETION
PRELIMINARY PROSPECTUS DATED APRIL 04, 2014
STRICTLY CONFIDENTIAL
Century Pacific Food, Inc.(Incorporated in the Republic of the Philippines)
Primary Offer of 229,654,404 Common Shares
Offer Price of up to ₱14.50 per Offer Share
to be listed and traded on the Main Board of The Philippine Stock Exchange, Inc.
Join t I ssue Managers, Joint L ead Underwr iters and Joint Bookrunners
BDO Capital & Investment
CorporationBPI Capital Corporation First Metro Investment
Corporation
Fi nancial Adviser
Evercore Asia Limited
The date of this Prospectus is []
T h e i n
f o r m a t i o n i n t h i s P r e l i m i n a r y P r o s p e c t u s i s s u b j e c t t o c o m p l e t i o n a n d a m e n d m e n t i n t h e f i n a l p r o s p e c t u s . N o o f f e r o r i n v i t a t i o n s h a l
l b e m a d e o r
r e c e i v e d , a n d n o a g r e e m e n t s h a l l b e m a d e
, o n t h e b a s i s o f t h i s d o c u m e n t , t o p
u r c h a s e o r s u b s c r i b e f o r a n y O f f e r
S h a r e s .
THE PHILIPPINES SECURITIES AND EXCHANGE COMMISSION HAS
NOT APPROVED THESE SECURITIES OR DETERMINED IF THIS
PROSPECTUS IS ACCURATE OR COMPLETE. ANY
REPRESENTATION TO THE CONTRARY IS A CRIMINAL OFFENSE

7/21/2019 PreliminaryProspectus - Century
http://slidepdf.com/reader/full/preliminaryprospectus-century 3/648
Century Pacific Food, Inc.
7th Floor, Centerpoint Building
Julia Vargas corner Garnet Street
Ortigas Center
1605 Pasig City, Metro ManilaPhilippines
Telephone Number: + (632) 633 85 55
Corporate Website: www.centurypacific.com.ph
This Prospectus relates to the offer and sale of 229,654,404 new common shares by way of
primary offer (the ―Offer‖), with a par value of ₱1.00 per share (the ―Offer Shares‖), of
Century Pacif ic Food, Inc., a corporation organized under Philippine law (the ―Company‖,
―CNPF‖, or the ―Issuer‖) to be listed and traded in the Main Board of The Philippine Stock
Exchange, Inc. (the ―PSE‖). The trading symbol of the Company shall be ―CNPF‖. See ― Plan
of Distribution‖.
The Offer Shares shall be offered at a price of up to ₱14.50 per Offer Share (the ―OfferPrice‖). The determination of the Offer Price is further discussed on page 64 of this
Prospectus and was determined through a book-building process, as well as discussions
between the Company and BDO Capital & Investment Corporation (―BDO Capital‖), BPI
Capital Corporation (―BPI Capital‖), and First Metro Investment Corporation (―First Metro‖),
collectively, the ―Joint Issue Managers, Joint Lead Underwriters, and Joint Bookrunners‖ or
simply, the ―Joint Lead Underwriters‖. A total of 2,229,654,404 Common Shares will be
outstanding after the Offer. The Offer Shares will comprise up to 10.30% of the outstanding
Common Shares after the Offer.
Pursuant to its amended articles of incorporation, the Company has an authorized amount of
capital stock of ₱6,000,000,000.00 divided into 6,000,000,000 Common Shares with a par
value of ₱1.00 per share, of which 2,000,000,000 Common Shares are outstanding as of the
date of this Prospectus. The Offer Shares shall be Common Shares of the Company.
The Company will be listed on the Main Board of the PSE. As a newly incorporated
company, CNPF will be relying on the track record of its wholly owned subsidiaries, General
Tuna Corp. (―GTC‖) and Snow Mountain Dairy Corp. (―SMDC‖). In this respect, both GTC
and SMDC, satisfy the requirements of the PSE Revised Listing Rules i.e., that such
subsidiary (i) must have a cumulative consolidated earnings before interest, taxes,
depreciation, and amortization (―EBITDA‖), excluding non-recurring items, of at least ₱50
million for three full fiscal years immediately preceding the application for listing, (ii) a
minimum EBITDA of ₱10 million for each of the three fiscal years , and (iii) must further be
engaged in materially the same businesses and must have a proven track record ofmanagement throughout the last three years prior to the filing of the application. With
SMDC‘s EBITDA of approximately ₱26 million, ₱39 million and ₱67 million for 2011, 2012
and 2013, respectively and GTC‘s EBITDA of approximately ₱196 million, ₱244 million and
₱286 million for 2011, 2012 and 2013, respectively, CNPF‘s subsidiaries are in full
compliance with the financial requirements. Moreover, GTC and SMDC have both been in
existence and operating since 1997 and 2001, respectively and have had a proven track record
of management since then. The PSE Revised Listing Rules prohibit CNPF from divesting its
shareholdings in GTC and SMDC for a period of three years from the date the Offer Shares
are listed on the PSE; provided that the prohibition shall not apply if the divestment is
approved by a majority of CNPF‘s shareholders.
The total proceeds to be raised by the Company from the sale of the Offer Shares will be up to
approximately ₱3,330.0 million. The estimated net proceeds to be raised by the Company

7/21/2019 PreliminaryProspectus - Century
http://slidepdf.com/reader/full/preliminaryprospectus-century 4/648
from the sale of the Offer Shares (after deducting estimated fees and expenses payable by the
Company of approximately ₱278.5 million) will be approximately ₱3,051.5 million. The
Company intends to use the proceeds it receives from the Offer for payment of financial
obligations, capital expenditures to increase production capacity and cost efficiency, working
capital and/or potential acquisitions. For a more detailed discussion on the proceeds from the
Offer and the Company‘s proposed use of proceeds, please see ―Use of Proceeds‖ beginningon page 55 of this Prospectus.
The Joint Lead Underwriters (as defined below) will receive a transaction fee from the
Company equivalent to 1.5% of the gross proceeds from the sale of the Offer Shares. These
are inclusive of the amounts to be paid to other participating underwriters and selling agents
and exclusive of the amounts to be paid to the PSE Trading Participants, where applicable.
For a more detailed discussion on the fees to be received by the Joint Lead Underwriters,
please see ― Plan of Distribution‖ beginning on page 59 of this Prospectus.
Each holder of Common Shares will be entitled to such dividends as may be declared by the
Company‘s Board of Directors (the ―Board‖ or ―Board of Directors‖), provided that any share
dividends declaration requires the approval of shareholders holding at least two-thirds of itstotal ―outstanding capital stock.‖ The Corporation Code of the Philippines, Batas Pambansa
Blg. 68 (the ―Philippine Corporation Code‖), has defined ―outstanding capital stock‖ as the
total shares of stock (―Shares‖) issued to subscribers or stockholders, whether paid in full or
not, except for treasury shares. Dividends may be declared only from the Company‘s
unrestricted retained earnings. The Company has approved a dividend policy of maintaining
an annual cash and/or share dividend pay-out of up to 30% of its net income from the
preceding year, subject to the requirements of applicable laws and regulations, the terms and
conditions of its outstanding bonds and loan facilities, and the absence of circumstances that
may restrict the payment of such dividends, such as where the Company undertakes major
projects and developments. The Company‘s Board may, at any time, modify the Company‘s
dividend policy depending upon the Company‘s capital expenditure plans and/or any terms offinancing facilities entered into to fund its current and future operations and projects. The
Company can give no assurance that it will pay any dividends in the future. See ― Dividends
and Dividend Policy‖.
45,930,800 Offer Shares (or 20% of the Offer Shares) are being offered to all of the trading
participants of the PSE (the ―PSE Trading Participants‖) and 22,965,400 Offer Shares (or
10% of the Offer Shares) are being offered to local small investors (the ―Local Small
Investors‖ or ―LSIs‖) in the Philippines. The remaining 160,758,204 Offer Shares (or 70% of
the Offer Shares) are being offered by the Joint Lead Underwriters to the Qualified
Institutional Buyers (the ―QIBs‖) and to the general public. Prior to the closing of the Offer,
any Offer Shares not taken up by the PSE Trading Participants and Local Small Investors
shall be distributed by the Joint Lead Underwriters to their clients or to the general public.The Joint Lead Underwriters firmly underwrite any shares left unsubscribed after the Offer.
For a more detailed discussion of the underwriting commitment of the Joint Lead
Underwriters, see ― Plan of Distribution‖ on page 59 of this Prospectus.
All of the Common Shares to be sold pursuant to the Offer have identical rights and
privileges. The Common Shares may be owned by any person or entity regardless of
citizenship or nationality, subject to the nationality limits under Philippine law. The
Philippine Constitution and related statutes set forth restrictions on foreign ownership for
companies engaged in certain activities. The Company currently does not own any land in the
Philippines but if the Company acquires land in the future, its foreign shareholdings may not
exceed 40% of its issued and outstanding voting capital shares. See ― Philippine Foreign Exchange and Foreign Ownership Controls‖.

7/21/2019 PreliminaryProspectus - Century
http://slidepdf.com/reader/full/preliminaryprospectus-century 5/648
Before making an investment decision, investors should carefully consider the risks
associated with an investment in the Common Shares. These risks include:
1. Risks relating to the Company’s business
CNPF‘s financial performance may be materially and adversely affected byfluctuations in prices or disruption in the supply of key raw materials;
CNPF‘s sales growth depends on successful introduction of new products and new product extensions, which is subject to consumer preference and other market factorsat the time of introduction;
Actual or alleged contamination or deterioration of, or safety concerns about, CNPF‘sfood products or similar products produced by third parties could give rise to productliability claims and harm CNPF‘s reputation;
Competition in CNPF‘s businesses may adversely affect its financial condition andresults of operations;
CNPF relies on the strength of its brands;
Consolidation of distribution channels in the Philippines may adversely affect
CNPF‘s financial condition and results of operations; CNPF relies on key suppliers for certain raw materials and the failure by such
suppliers to adhere to and perform contractual obligations may adversely affectCNPF‘s business and results of operations;
CNPF has a limited history as a separate entity;
CNPF generally does not have long-term contracts with its customers, and it issubject to uncertainties and variability in demand and product mix;
CNPF is exposed to the credit risks of its customers, and delays or defaults in payment by its customers could have a material adverse effect on CNPF‘s financialcondition, results of operations and liquidity;
Any infringement or failure to protect CNPF‘s trademarks and proprietary rights
could materially and adversely affects its business; CNPF‘s strategy of growth, including acquisitions, entering new product categories
and international expansion, may not always be successful or may entail significantcosts, which could adversely affect its business, financial condition and results ofoperations;
CNPF may be subject to labor unrest, slowdowns and increased wage costs;
CNPF is effectively controlled by the Po family and their interests may differ fromthe interests of other shareholders;
CNPF‘s international operations may present operating, financial and legalchallenges, particularly in countries where CNPF has little or no experience;
CNPF‘s existing insurance policies and self -insurance measures may not be sufficientto cover the full extent of any losses;
CNPF‘s businesses and operations are substantially dependent upon key executives;and
Problems may develop among partners of joint ventures operated by CNPF, whichmay result in disruptions to these businesses.
2. Risks relating to the Philippines
The substantial majority of CNPF‘s income is derived from sales in the Philippinesand, therefore, a slowdown in economic growth in the Philippines could materiallyadversely affect CNPF‘s financial condition and results of operation;
A decline in the value of the Peso against the U.S. dollar and other currencies would
increase many of CNPF‘s costs; and

7/21/2019 PreliminaryProspectus - Century
http://slidepdf.com/reader/full/preliminaryprospectus-century 6/648
Any political instability or acts of terrorism in the Philippines may adversely affectCNPF.
3. Risks relating to the Offer and the Offer Shares
The Offer Shares may not be suitable investments for all investors; There can be no guarantee that the Offer Shares will be listed on the PSE;
There has been no prior market for the Common Shares, so there may be no liquidityin the market for the Offer Shares and the price of the Offer Shares may fall;
The market price of the Common Shares may be volatile, which could cause the valueof investors‘ investments in the Company to decline;
Future sales of Common Shares in the public market could adversely affect the prevailing market price of the Common Shares and Shareholders may experiencedilution in their holdings;
Investors may incur immediate and substantial dilution as a result of purchasing OfferShares; and
The Company may be unable to pay dividends on the Common Shares.
4. Risks relating to certain statistical information in this Prospectus
The Prospectus contains forward-looking statements that are, by their nature, subjectto significant risks and uncertainties.
The pro forma financial information included herein may not be indicative of actualresults;
Certain information contained herein is derived from unofficial publications; and
The section of this Prospectus entitled ― Industry‖ was not independently verified bythe Company or the Joint Lead Underwriters, and the sources therein may not becompletely independent or independent at all.
Please refer to the section entitled ― Risk Factors‖ beginning on page 35 of this Prospectus,
which, while not intended to be an exhaustive enumeration of all risks, must be considered in
connection with a purchase of the Offer Shares.
The information contained in this Prospectus relating to the Company and its operations has
been supplied by the Company, unless otherwise stated herein. To the best of its knowledge
and belief, the Company, which has taken reasonable care to ensure that such is the case,
confirms that the information contained in this Prospectus relating to it and its operations is
correct, and that there is no material misstatement or omission of fact which would make any
statement in this Prospectus misleading in any material respect and that the Company hereby
accepts full and sole responsibility for the accuracy of the information contained in this
Prospectus with respect to the same.
An application for listing of the Common Shares was approved on March 26, 2014 by the
board of directors of the PSE, subject to the fulfillment of certain listing conditions. The PSE
assumes no responsibility for the correctness of any statements made or opinions expressed in
this Prospectus. The PSE makes no representation as to its completeness and expressly
disclaims any liability whatsoever for any loss arising from reliance on the entire or any part
of this Prospectus. Such approval for listing is permissive only and does not constitute a
recommendation or endorsement of the Common Shares by the PSE or the Securities and
Exchange Commission of the Philippines (the ―SEC‖).
Prior to the Offer, there has been no public market for the Common Shares. Accordingly,there has been no market price for the Common Shares derived from day-to-day trading.
7/21/2019 PreliminaryProspectus - Century
http://slidepdf.com/reader/full/preliminaryprospectus-century 7/648
An application has been made to the SEC to register the Offer Shares under the provisions of
the Securities Regulation Code of the Philippines (Republic Act (―R.A.‖) No. 8799) (the
―SRC‖).
A REGISTRATION STATEMENT RELATING TO THE OFFER SHARES HAS
BEEN FILED WITH THE SEC BUT HAS NOT YET BEEN DECLAREDEFFECTIVE. NO OFFER TO BUY THE OFFER SHARES CAN BE ACCEPTED
AND NO PART OF THE PURCHASE PRICE CAN BE ACCEPTED OR RECEIVED
UNTIL THE REGISTRATION STATEMENT HAS BECOME EFFECTIVE, AND
ANY SUCH OFFER MAY BE WITHDRAWN OR REVOKED, WITHOUT
OBLIGATION OR COMMITMENT OF ANY KIND, AT ANY TIME PRIOR TO
NOTICE OF ITS ACCEPTANCE GIVEN AFTER THE EFFECTIVE DATE. AN
INDICATION OF INTEREST IN RESPONSE HERETO INVOLVES NO
OBLIGATION OR COMMITMENT OF ANY KIND. THIS PROSPECTUS SHALL
NOT CONSTITUTE AN OFFER TO SELL OR THE SOLICITATION OF AN OFFER
TO BUY ANY OFFER SHARES.
The Offer Shares are offered subject to receipt and acceptance of any order by the Companyand subject to its right to reject any order in whole or in part. It is expected that the Offer
Shares will be delivered in book-entry form against payment to the Philippine Depository and
Trust Corporation (the ―PDTC‖) on or about [], 2014.
By:
Christopher T. Po President and Chief Executive Officer

7/21/2019 PreliminaryProspectus - Century
http://slidepdf.com/reader/full/preliminaryprospectus-century 8/648
No representation or warranty, express or implied, is made by the Company or the Joint LeadUnderwriters, regarding the legality of an investment in the Offer Shares under any legal,investment or similar laws or regulations. No representation or warranty, express or implied,is made by the Joint Lead Underwriters as to the accuracy or completeness of the informationherein and nothing contained in this Prospectus is, or shall be relied upon as, a promise orrepresentation by the Joint Lead Underwriters. The contents of this Prospectus are notinvestment, legal or tax advice. Prospective investors should consult their own counsel,accountant and other advisors as to legal, tax, business, financial and related aspects of a
purchase of the Offer Shares. In making any investment decision regarding the Offer Shares, prospective investors must rely on their own examination of the Company and the terms ofthe Offer, including the merits and risks involved. Any reproduction or distribution of thisProspectus, in whole or in part, and any disclosure of its contents or use of any informationherein for any purpose other than considering an investment in the Offer Shares is prohibited.
No person has been authorized to give any information or to make any representations other
than those contained in this Prospectus and, if given or made, such information or
representations must not be relied upon as having been authorized by the Company or the
Joint Lead Underwriters. This Prospectus does not constitute an offer to sell or the solicitationof an offer to purchase any securities other than the Offer Shares or an offer to sell or the
solicitation of an offer to purchase such securities by any person in any circumstances in
which such offer or solicitation is unlawful. Neither the delivery of this Prospectus nor any
sale of the Offer Shares offered hereby shall, under any circumstances, create any implication
that there has been no change in the affairs of the Company since the date hereof or that the
information contained herein is correct as of any time subsequent to the date hereof.
Certain statistical information and forecasts in this Prospectus relating to the Philippines and
other data used in this Prospectus were obtained or derived from internal surveys, industry
forecasts, market research, governmental data, publicly available information and/or industry
publications. Industry publications generally state that the information they contain has been
obtained from sources believed to be reliable. However, there is no assurance that suchinformation is accurate or complete. Similarly, internal surveys, industry forecasts, market
research, governmental data, publicly available information and/or industry publications have
not been independently verified by the Company or the Joint Lead Underwriters and may not
be accurate, complete, up-to-date, balanced or consistent with other information compiled
within or outside the Philippines.
The Company reserves the right to withdraw the offer and sale of Offer Shares at any time,
and Joint Lead Underwriters reserve the right to reject any commitment to subscribe for the
Offer Shares in whole or in part and to allot to any prospective purchaser less than the full
amount of the Offer Shares sought by such purchaser. If the Offer is withdrawn or
discontinued, the Company shall subsequently notify the SEC and the PSE. The Joint LeadUnderwriters and certain related entities may acquire for their own account a portion of the
Offer Shares.
Each offeree of the Offer Shares, by accepting delivery of this Prospectus, agrees to the
foregoing.
Forward-Looking Statements
This Prospectus contains forward-looking statements that are, by their nature, subject to
significant risks and uncertainties. These forward-looking statements include, without
limitation, statements relating to:
known and unknown risks;

7/21/2019 PreliminaryProspectus - Century
http://slidepdf.com/reader/full/preliminaryprospectus-century 9/648
uncertainties and other factors that may cause the Company‘s actual results,
performance or achievements to be materially different from expected future results;
and
performance or achievements expressed or implied by forward-looking statements.
Such forward-looking statements are based on numerous assumptions regarding the
Company‘s present and future business strategies and the environment in which the Company
will operate in the future. Important factors that could cause some or all of the assumptions
not to occur or cause actual results, performance or achievements to differ materially from
those in the forward-looking statements include, among other things:
the Company‘s ability to successfully implement its current and future strategies;
the Company‘s ability to anticipate and respond to local and regional trends,
including demand for canned and processed fish, meat and dairy products or other
future products the Company may offer;
the Company‘s ability to successfully manage its future business, financial condition,
results of operations and cash flow;
the Company‘s ability to secure additional financing and manage its capital structure
and dividend policy;
the condition of, and changes in, the relationship of the Company with the Philippine
Food and Drug Administration (―Philippine FDA‖), the Philippine Bureau of Internal
Revenue (―BIR‖) or other Philippine regulatory authorities or licensors;
general political, social and economic conditions in the Philippines;
regional geopolitical dynamics involving the Philippines and/or its neighbors;
the condition of and changes in the Philippine, Asian or global economies;
changes in interest rates, inflation rates and the value of the Peso against the U.S.
dollar and other currencies;
changes to the laws, regulations and policies applicable to or affecting the Company;
competition in the Philippine food processing and food distribution industries;
legal or regulatory proceedings in which the Company is or may become involved;
and
uncontrollable events, such as war, civil unrest or acts of international or domestic
terrorism, the outbreak of contagious diseases, accidents and natural disasters.
Additional factors that could cause the Company‘s actual results, performance or
achievements to differ materially from forward-looking statements include, but are not
limited to, those disclosed under ― Risk Factors‖ and elsewhere in this Prospectus. These
forward-looking statements speak only as of the date of this Prospectus. The Company and
Joint Lead Underwriters expressly disclaim any obligation or undertaking to release, publicly
or otherwise, any updates or revisions to any forward-looking statement contained herein to

7/21/2019 PreliminaryProspectus - Century
http://slidepdf.com/reader/full/preliminaryprospectus-century 10/648
reflect any change in the Company‘s expectations with regard thereto or any change in events,
conditions, assumptions or circumstances on which any statement is based.
This Prospectus includes statements regarding the Company‘s expectations and projections
for future operating performance and business prospects. The words ―believe,‖ ―plan,‖
―expect,‖ ―anticipate,‖ ―estimate,‖ ―project,‖ ―intend,‖ ―seek,‖ ―target,‖ ―aim,‖ ―may,‖ ―will,‖―would,‖ ―could,‖ and similar words identify forward-looking statements. In addition, all
statements other than statements of historical facts included in this Prospectus are forward-
looking statements. Statements in this Prospectus as to the opinions, beliefs and intentions of
the Company accurately reflect in all material respects the opinions, beliefs and intentions of
its management as to such matters as of the date of this Prospectus, although the Company
gives no assurance that such opinions or beliefs will prove to be correct or that such intentions
will not change. This Prospectus discloses, under the section ― Risk Factors‖ and elsewhere,
important factors that could cause actual results to differ materially from the Company‘s
expectations. All subsequent written and oral forward-looking statements attributable to the
Company or persons acting on behalf of the Company are expressly qualified in their entirety
by the above cautionary statements.
The Joint Lead Underwriters have exercised due diligence in ascertaining that all material
representations contained in this Prospectus, including its amendments and supplements, are
true and correct and that no material information was omitted, which was necessary in order
to make the statements contained in said documents not misleading.

7/21/2019 PreliminaryProspectus - Century
http://slidepdf.com/reader/full/preliminaryprospectus-century 11/648
TABLE OF CONTENTS
Page
GLOSSARY OF TERMS........................................................................................................3
SUMMARY ............................................................................................................................7
SUMMARY OF THE OFFER .............................................................................................. 21
SUMMARY PRO FORMA CONSOLIDATED FINANCIAL INFORMATION................. 28
SUMMARY COMBINED FINANCIAL INFORMATION.................................................. 31
SUMMARY PARENT FINANCIAL INFORMATION OF CNPF ...................................... 35
SUMMARY CONSOLIDATED FINANCIAL INFORMATION OF CNPF ....................... 38
RISK FACTORS ................................................................................................................... 41
USE OF PROCEEDS ............................................................................................................ 55
PLAN OF DISTRIBUTION .................................................................................................. 59
DIVIDENDS AND DIVIDEND POLICY ............................................................................ 63
DETERMINATION OF THE OFFER PRICE ...................................................................... 64
DILUTION ............................................................................................................................ 66
SELECTED PRO FORMA CONSOLIDATED FINANCIAL INFORMATION ................. 68
SELECTED COMBINED FINANCIAL INFORMATION .................................................. 72
SELECTED PARENT FINANCIAL INFORMATION OF CNPF ....................................... 76
SELECTED CONSOLIDATED FINANCIAL INFORMATION OF CNPF ........................ 79
MANAGEMENT‘S DISCUSSION AND ANALYSIS OF FINANCIAL CONDITIONAND RESULTS OF OPERATIONS OF THE PRO FORMA CONSOLIDATEDFINANCIAL INFORMATION OF CNPF ....................................................................... 82
MANAGEMENT‘S DISCUSSION AND ANALYSIS OF FINANCIAL CONDITIONAND RESULTS OF OPERATIONS OF THE COMBINED FINANCIALINFORMATION FOR GTC AND SMDC ....................................................................... 98
MANAGEMENT‘S DISCUSSION AND ANALYSIS OF FINANCIAL CONDITION
OF CNPF (PARENT)..................................................................................................... 113
MANAGEMENT‘S DISCUSSION AND ANALYSIS OF FINANCIAL CONDITIONAND RESULTS OF OPERATIONS OF THE CONSOLIDATED FINANCIAL
INFORMATION OF CNPF ........................................................................................... 116
BUSINESS .......................................................................................................................... 127
INDUSTRY......................................................................................................................... 158
REGULATORY .................................................................................................................. 174
BOARD OF DIRECTORS AND SENIOR MANAGEMENT ............................................ 183
PRINCIPAL SHAREHOLDERS ........................................................................................ 192

7/21/2019 PreliminaryProspectus - Century
http://slidepdf.com/reader/full/preliminaryprospectus-century 12/648
MATERIAL CONTRACTS ................................................................................................ 195
RELATED PARTY TRANSACTIONS .............................................................................. 196
DESCRIPTION OF THE SHARES .................................................................................... 198
THE PHILIPPINE STOCK MARKET ............................................................................... 206
PHILIPPINE TAXATION .................................................................................................. 212
PHILIPPINE FOREIGN EXCHANGE AND FOREIGN OWNERSHIP CONTROLS ...... 218
LEGAL MATTERS ............................................................................................................ 220
INDEPENDENT AUDITORS ............................................................................................ 221
INDEX TO FINANCIAL STATEMENTS ......................................................................... F-1

7/21/2019 PreliminaryProspectus - Century
http://slidepdf.com/reader/full/preliminaryprospectus-century 13/648
GLOSSARY OF TERMS
In this Prospectus, unless the context otherwise requires, the following terms shall have themeanings set forth below.
BFAR Bureau of Fisheries and Aquatic Resources
BIR The Philippine Bureau of Internal Revenue
Board of Directors or Board The Board of Directors of the Company
BOC The Philippine Bureau of Customs
BSP Bangko Sentral ng Pilipinas, the central bank of thePhilippines
CCC Century Canning Corporation
Century Group Century Canning Corporation, together with its subsidiariesand affiliates
CIO Chief Information Officer of the Company
Common Shares Common shares of the Company with par value of ₱1.00 pershare
Company or CNPF Century Pacific Food, Inc., incorporated on October 25,2013 in the Philippines; references to the Company or CNPFinclude references to its subsidiaries, unless the context
otherwise provides
Corporation Code or
Philippine Corporation
Code
The Corporation Code of the Philippines, Batas PambansaBlg. 68
CSC Columbus Seafoods Corporation
DA Department of Agriculture
Director(s) the Director(s) of the Company
DTI Department of Trade and Industry
DOH Department of Health
EBIT Net operating income before interest and tax as calculated by the Company and as presented in this Prospectus
ECC Environmental Compliance Certificate
EIS Environmental Impact Statement
EMB Environmental Management Bureau
FARMC Fisheries and Aquatic Resources Management Councils

7/21/2019 PreliminaryProspectus - Century
http://slidepdf.com/reader/full/preliminaryprospectus-century 14/648
GDP Gross Domestic Product
GMP Good Manufacturing Practices
GNP Gross National Product
GTC General Tuna Corporation
HACCP Hazard Analysis Critical Control Point
Halal An Arabic term which means allowed, lawful, legal, or permissible under the Shariah (Islamic Law).
HDMF Home Development Mutual Fund
IEE Initial Environmental Examination
IFRS International Financial Reporting Standards
IPO Tax The tax on sale, barter, exchange or other dispositionthrough an IPO of shares of stock in closely heldcorporations as provided under Section 127 of the Tax Code
IRO Investor Relations Officer of the Company
ITH Income Tax Holiday
LGU Local Government Unit
Listing Date the date of listing and when trading of the Common Shares
commences on The Philippine Stock Exchange, Inc.
LSI Local Small Investors
Moody’s Moody‘s Investors Service
MPO Rule on Minimum Public Ownership
MT Metric Ton
Navarro Amper & Co. Member of Deloitte Touche Tohmatsu Limited
NHIP National Health Insurance Program
NMIS National Meat Inspection Service
Offer The offer and issuance of the Offer Shares
Offer Price Up to ₱14.50 per Offer Share
Offer Shares 229,654,404 new Common Shares
Offer Settlement Date On or about 06 May 2014
7/21/2019 PreliminaryProspectus - Century
http://slidepdf.com/reader/full/preliminaryprospectus-century 15/648
OFWs Overseas Filipino Workers
PCD Philippine Central Depository
PHP or P Philippine Peso
PDS Philippine Dealing System
PDTC The Philippine Depository & Trust Corporation
PFRS Philippine Financial Reporting Standards
PHIC Philippine Health Insurance Corporation
Philippine FDA Philippine Food and Drug Administration
Philippine Labor Code Presidential Decree No. 442, as amended.
PMCI The Pacific Meat Company, Inc.
PNP Philippine National Police
PSA Philippine Standards on Auditing
PSE The Philippine Stock Exchange, Inc.
PSE Trading Participants All trading participants of the PSE
QIB or Qualified
Institutional Buyer
Qualified buyers within the meaning of Section 10.1(l) of
the SRC
R.A. Republic Act
ROS Return on Sale
SCCP Securities Clearing Corporation of the Philippines
SEC Securities and Exchange Commission
SKU stock keeping unit; a store‘s or catalog‘s product and service
identification code, often portrayed as a machine-readable
bar code that helps the item to be tracked for inventory
SMDC Snow Mountain Dairy Corporation
SSOP Standard Sanitation Operating Procedure
sq. m. Square meter(s)
SRC Securities Regulation Code of the Philippines
Tax Code National Internal Revenue Code of 1997 of the Philippines

7/21/2019 PreliminaryProspectus - Century
http://slidepdf.com/reader/full/preliminaryprospectus-century 16/648
(Republic Act No. 9337) and its implementing rules, as
amended
US$ United States Dollar
US FDA United States Food and Drug Administration
VAT Value-added tax

7/21/2019 PreliminaryProspectus - Century
http://slidepdf.com/reader/full/preliminaryprospectus-century 17/648
SUMMARY
The following summary is qualified in its entirety by, and is subject to, the more detailed information
presented in this Prospectus, including the Company’s pro forma consolidated financial statements and
related notes included elsewhere in this Prospectus. Capitalized terms not defined in this summary are
defined in the ―Glossary of Terms,‖ ―Risk Factors,‖ ―Business‖ or elsewhere in this Prospectus.
Overview
CNPF traces its history from the Century Group, a leading branded food company primarily
engaged in the development, processing, marketing and distribution of processed fish and
meat, as well as processed dairy products in the Philippines.
In October 2013, the Century Group began to undertake a general corporate reorganization
transaction. Prior to the corporate restructuring, the company‘s businesses were operated by
different companies:
Seafood
Century Canning Corporation (―CCC‖) incorporated on December 12, 1978 handled the
Group‘s sales and distribution for canned and processed tuna, sardines and bangus. Products
are marketed under 555 for sardines, Century Tuna and 555 for tuna. Columbus Seafood
Corporation (―CSC‖), incorporated on December 20, 1994, operated the manufacturing plant
for the sardines. General Tuna Corporation (―GTC‖), incorporated on March 10, 1997,
operated the tuna processing both for local and export sales.
Meat
The Pacific Meat Company, Inc. (―PMCI‖), incorporated on June 28, 1994, manufacturedcanned and frozen processed meat under the brand names Argentina, Swift and 555.
Dairy
Snow Mountain Dairy Corporation (―SMDC‖), incorporated on February 14, 2001, handles
the dairy and sinigang mixes under the brands of Birch Tree, Angel , Home Pride and Kaffe de
Oro.
In order to streamline and rationalize the Group‘s operations, the business operations of CCC,
CSC and PMCI were folded into CNPF, the listing vehicle. The business operations of CCC
and CSC were folded into CNPF under the canned and processed fish segment. The canned
meat business operations of PMCI were folded into CNPF under the canned meat segment.
SMDC, handling the dairy and mixes segment, and GTC, handling the private label canned,
pouched and frozen tuna products for export, were retained as separate corporate entities as
wholly-owned subsidiaries of CNPF.As a result, the pro forma financial statements of CNPF
are a product of the combination of the businesses of CCC, PMCI, CSC, GTC and SMDC.
With this operating history spanning the last 35 years, CNPF has established a strong brand
and product portfolio through, and supported by, continuous product innovation and
acquisition of brands from third parties. Its brands are well-recognized in the Philippines and
include 555 for sardines, Century Tuna and 555 for tuna, Argentina and Swift for canned
meats and Angel and Birch Tree for canned and powdered milk. CNPF was the largest
producer of canned foods in the Philippines in terms of retail value according to Euromonitordata for February 2013. The quality of CNPF‘s products has been recognized by numerous

7/21/2019 PreliminaryProspectus - Century
http://slidepdf.com/reader/full/preliminaryprospectus-century 18/648
consumer and industry association awards. For example, Century Tuna received the Trusted
Brand Award from Reader‘s Digest in 2011, 2012 and 2013 and Argentina Corned Beef
received the same award in 2012 and 2013. As of December 31, 2013, CNPF offered 283
products which can be found in 3,772 modern retail outlets, approximately 225,168 directly
served general trade outlets and 330,749 indirectly served points of sale, totaling over559,689 points of sale throughout the Philippines.
CNPF operates five production facilities and distributes its products through 14 distribution
centers strategically located across the Philippines. CNPF distributes its products directly to
retailers, as well as through third-party distributors. As at December 31, 2013, CNPF
maintained 200 manufacturer direct-to-retail accounts reaching 3,772 retail outlets in the
Philippines. In addition, as at December 31, 2013, CNPF held distribution agreements with 39
distributors, reaching approximately 225,168 retail outlets ranging from supermarkets to sari-
sari stores. Furthermore, as of December 31, 2013, CNPF exports both private label and
branded products, which are distributed across North America, Europe, Asia, Australia, and
the Middle East.
For the year ended December 31, 2013, CNPF‘s net revenue was ₱19,023 million. CNPF‘s
net profit after tax for the same period was ₱743.9 million.
Business Segments
CNPF‘s business operations are divided into four main business segments: canned and
processed fish, canned meat, dairy and mixes and tuna export.
The canned and processed fish segment produces a variety of tuna, sardine and other fish and
seafood- based products. CNPF‘s key brands in the canned and processed fish segment include
Century Tuna, 555, Blue Bay and Fresca.
The canned meat segment produces corned beef, meatloaf and a variety of other meat-based
products. Key brands in this segment include Argentina, Wow and Swift .
The dairy and mixes segment primarily comprises canned milk, powdered milk and other
dairy products, as well as coffee mixes and sinigang mix. Key brands include Angel , Birch
Tree, Kaffe de Oro and Home Pride.
CNPF also produces private label canned, pouched and frozen tuna products for export to
major overseas markets including North America, Europe, Asia, Australia, and the Middle
East. In addition, CNPF‘s branded products are also exported to overseas mark ets and are
distributed across North America, Europe, Asia, Australia, and the Middle East.

7/21/2019 PreliminaryProspectus - Century
http://slidepdf.com/reader/full/preliminaryprospectus-century 19/648
For the year ended December 31, 2013, the contribution of each business segment to CNPF‘s
total revenue, based on CNPF‘s pro forma consolidated financial information as of and for the
year ended December 31, 2013, is as follows:
Year ended December 31, 2013
(in ₱ millions)
Revenue
% of
Total
Net
Income
% of
Total
Canned and Processed Fish 7,014 36.9 137 18.4
Canned Meat 4,598 24.2 360 48.4
Dairy and Mixes 1,548 8.1 45 6.0
Tuna Export 5,863 30.8 210 28.2
Other Segment Income (―CNPF‖) (8) (1)
Total 19,023 100.0 744 100.0
The abovementioned revenue and net income were derived from the historical auditedseparate financial statements of the Company, GTC, SMDC, CCC, PMCI and CSC thenadjusted to give the pro forma effect of the consolidation of the businesses of the saidcompanies as shown in the table below:
Year ended
December 31,
2013 (in ₱
millions)
AcquisitionsTotal before
Pro Forma
Adjustments
Pro forma
Adjustments
Pro forma
ConsolidatedCNPF GTC SMDC CSC PMCI CCC
Net sales - 5,863 1,556 1,633 5,063 5,505 19,620 (597) 19,023
Cost of Sales - 5,623 1,222 1,420 3,932 4,071 16,269 (572) 15,697
Gross profit - 240 334 213 1,130 1,434 3,351 (25) 3,326
Other Income 13 127 0 35 24 859 1,058 (882) 176
Operating
profit 13 367 334 248 1,154 2,293 4,409 (907) 3,502
Operating
expenses 30 148 275 160 763 1,366 2,743 (328) 2,415
Finance cost - 49 2 3 25 52 131 (19) 112
OtherExpense - 3 - 7 4 - 14 - 14
Profit (loss)
before tax (17) 166 57 78 363 875 1,521 (561) 960

7/21/2019 PreliminaryProspectus - Century
http://slidepdf.com/reader/full/preliminaryprospectus-century 20/648
Income tax
expense (5) 28 15 25 105 48 217 (1) 216
Profit after
tax (12) 138 42 52 257 827 1,304 (560) 744
Pro forma adjustments were made to the December 31, 2013 historical consolidated financialinformation of the Company and its subsidiaries (GTC and SMDC), and the acquired
businesses (CSC, PMCI, CCC), which include the following:
Consolidation of the Company and its subsidiaries (GTC and SMDC) and elimination of
investment and equity amounting to ₱1.137 million.
Recognition of identified assets and liabilities of CCC, CSC and PMCI and the related
operations as well as the accumulated earnings as of December 31, 2013. The difference
between the balance of the assets acquired and liabilities assumed was recognized in
retained earnings.
Elimination of frozen processed meat business from PMCI.
Elimination of intercompany and inter-business transactions and account balances.
Elimination of cash dividends from GTC and SMDC amounting to ₱382 million and gain
from the sale of shares of stocks of GTC and SMDC between CCC and the Company
Recognition of rental expense in relation to the land and office spaces that were not sold
to the Company and elimination of depreciation related to aforementioned assets.
Re-computation of income tax to include the effects of the pro forma adjustments.
CCC and CSC (Canned and Processed Fish). Net sales from the canned and processed fish
business segment totaled ₱7,013.8 million, or 37% of total CNPF sales, for the year ended
December 31, 2013. Of these sales, canned tuna and milkfish contributed ₱5,380.8 million
while canned sardine accounted for ₱1,633.0 million. Gross profit for the segment totaled
₱1,659.2 million, or a gross profit rate of 24%. This gross profit consisted of ₱1,383.4 million
from canned tuna and milkfish and ₱275.8 million for canned sardine. Net income for the
segment totaled ₱136.5 million, or an equivalent segment return on sales of 2%. Of this
segment net income, ₱158.8 million was shared by canned tuna and milkfish while ₱161.4
million was from canned sardine.
GTC (Tuna Export). Net sales from the tuna export business segment totaled ₱5,862.7
million. This represented 31% of total CNPF sales and comprised sales of canned tuna,
pouched tuna and frozen loins to the private-label export market. Gross profit was ₱301.6
million, or a segment gross profit rate of 5%. Net income totaled ₱209.6 million for a segment
return on sales of 4%.
PMCI (Canned Meat). Net sales from the canned meat business were ₱4,598.6 million for the
year ended December 31, 2013, which represented 24% share of the total CNPF sales. Net
sales included sales to the modern trade accounts, general trade accounts, food service
accounts and export accounts for canned products including corned beef, meat loaves, ready-
to-eat viands. Gross profit for canned meat was ₱1,040 million, or a segment gross profit rate
of 31%. Net income for canned meat totaled ₱360.1 million, or a return on sales of 8%.
SMDC (Dairy and Mixes). Net sales from the dairy and mixes business was ₱1,548 million
for the year ended December 31, 2013, which represents 8% share of the total CPF sales. Net
sales includes sales of evaporated milk, condensed milk, creamers, full cream powdered milk,
flavour mixes and 3-in-1 coffee products. Gross profit for the segment amounted to ₱ 325.5

7/21/2019 PreliminaryProspectus - Century
http://slidepdf.com/reader/full/preliminaryprospectus-century 21/648
million for an equivalent gross profit rate of 21%. Net income totaled ₱45.5 million, or a 3%
return on sales ratio.
Competitive Strengths
The Company believes that the following are its key business strengths:
Established market leadership positions with iconic, well-recognized and trusted brands
The Company is the largest producer of canned foods in the Philippines in terms of retail
value according to Euromonitor data for February 2013. In addition, the Company‘s brands
have established market-leading positions within each of their respective segments. For
example, based on data from AC Nielsen, in 2012, the Company was the market leader in the
Philippines in domestic canned tuna, with a market share of 87% by sales. In addition, based
on AC Nielsen data as of August 2013, the Company was the market leader in corned beef
with a market share of 42.5% by sales and the market leader in meat loaf with a market share
of 25.6% by sales.
Several of the Company‘s brands have a long heritage and are well-recognized and trusted
brands in the Philippines. The Company believes that customers associate its brands with
health and quality. Such brands include Century Tuna which was launched in 1986, Argentina
Corned Beef which was launched in 1995 and Angel which was launched in 2002. TheCompany has also grown its brand portfolio through brand acquisitions, including the
acquisition of Blue Bay in 2001, Birch Tree in 2003, Kaffe de Oro and Home Pride in 2008
and Swift in 2012. As a result of the heritage and strength of the Company‘s brands as well as
their high standards of quality, the Company has won a number of industry, consumer and
marketing awards including the Agora Awards‘ Marketing Company of the Year Award for
Century Canning Corporation (2011) and the Trusted Brand Award by Reader‘s Digest for
Century Tuna (2011, 2012 and 2013) and Argentina Corned Beef (2012 and 2013).
The Company continues to enhance brand recognition among consumers by consistently
maintaining high product quality, as well as through active and targeted marketing and
promotional campaigns such as using well-recognized celebrities to endorse its products. The
Company believes that its well-recognized brands have allowed it to develop strong customer
loyalty resulting in repeat purchases that provide it with greater pricing power relative to its
competitors.
Furthermore, the Company believes that the established reputations and market-leading
positions of its brands provide a strong platform to maintain and grow its market shares
through new products, product line extensions and expansion of its distribution networks.
Multi-category, multi-brand product portfolio catering to different customer tastes and
price points
The Company has a diverse product portfolio with multiple product lines across fish, meatsand dairy. As of December 31, 2013, the Company had a portfolio comprising 128 SKUs for

7/21/2019 PreliminaryProspectus - Century
http://slidepdf.com/reader/full/preliminaryprospectus-century 22/648
tuna products, 101 SKUs for canned meat products, 25 SKUs for sardine products and 29
SKUs for dairy and mixes products. The Company produces numerous product variants to
cater to different customer tastes. For example, the Company produces chicken, pork and
tuna-based vienna sausages to capture the full range of consumer preferences for this product.
In addition, the Company packages its products in different sizes to target different customer price points. This diverse product portfolio allows it to capture a larger share of the
consumers' wallets and provides broader avenues for future growth, both within and across its
key product categories. In addition, this also reduces its dependence on any single product
category or brand, and makes the Company more resilient to changes in the competitive
landscape or price fluctuations in raw material that may impact one product category more
than another.
In addition, leveraging on the Company's strong reputation and recognition for product
quality, the Company has also developed a multi-brand strategy within each product segment
that allows it to broaden its reach to customers more easily than its competitors. Within each
of its product segments, the Company offers a wide portfolio of brands and products to meet a
diverse range of consumer tastes, preferences and price points allowing for a comprehensivecoverage of the Filipino consumer market. For example, in the canned tuna segment, the
Century Tuna brand targets the up-market canned tuna consumer whereas the 555 Tuna brand
is aimed at the budget or cost-conscious canned tuna consumer. This allows the Company to
broaden its customer base and capture the benefits from growth in disposable income from a
larger proportion of the population. In addition, this segmentation allows the Company to
target consumers in different regions with different demographics with the right brand, as
well as react quickly and opportunistically to changes in consumer preferences and to act
defensively against any action by competitors.
The Company‘s diverse product portfolio also provides marketing and product synergies
across segments. For example, product recipes and formulations achieved through internalresearch and development are shared across product segments. In addition, international best
practices implemented in the tuna export segment are shared across the Company‘s various
production lines, improving production processes and enhancing product quality.
Strong track record of product innovation and successful introduction of new products
Product innovation and development has been an important element in the Company‘s
business strategy and has been crucial to the Company‘s success. The Company has
demonstrated strong innovative capabilities as shown by its consistent track record of
launching new products to address changing consumer needs and preferences. For example,
the Company differentiates its products from plain canned tuna/meat by developing new
flavors and dishes that are designed and packaged as ready-to-eat meals. In particular, theCompany‘s ready-to-eat dishes use tuna as the main ingredient in traditionally beef, pork and

7/21/2019 PreliminaryProspectus - Century
http://slidepdf.com/reader/full/preliminaryprospectus-century 23/648
chicken- based dishes such as kaldereta, adobo and afritada to increase consumers‘ acceptance
of the product while providing consumers with a healthier alternative. In the dairy segment,
the Company has successfully introduced two-in-one products such as Angel Kremdensada (a
combination of all-purpose cream and condensed milk) and Angel KremQueso (a combination
of all-purpose cream and cheese) to provide convenient and cost-effective options forconsumers. In addition to innovative products, the Company has noticed a shift in preference
from canned products to flexible packaging or products sealed in pouches. In response, the
Company has started to produce pouched tuna products.
Furthermore, the Company has a strong ability to bring its products to the market using
innovative marketing strategies. The Company‘s marketing campaigns are jointly developed
between its highly experienced in-house marketing team and independent creative agencies.
The Company employs the use of celebrity endorsements in its marketing strategies to link
each product to the intended branding message. Over the years the Company has launched
numerous successful marketing campaigns, including a focused marketing campaign for
Argentina Corned Beef , which became the leading brand in its segment. The Company viewsits ability to market its products as a critical success factor and invests heavily in advertising
and endorsements. The Company‘s ability to develop new products and successfully bring
them to the market allows the Company to further segment each product category and tailor it
to consumers‘ tastes and preferences, preventing product commoditization.
Extensive market penetration through multi-channel distribution network
The Company operates and manages one of the most extensive distribution networks across
the Philippines, with its products available in every major city, creating a significant
competitive advantage.

7/21/2019 PreliminaryProspectus - Century
http://slidepdf.com/reader/full/preliminaryprospectus-century 24/648
The Company has developed strong relationships directly with retailers, including modern
and general trade stores, as well as through third-party distributors. Approximately 58% of the
Company‘s distribution is through modern trade and approximately 42% is through general
trade. As of December 31, 2013, the Company‘s modern trade coverage holds 200 direct
accounts and 3,772 outlets, comprising national retail chains with outlets across the
Philippines, such as Robinsons Supermarkets, SM Supermarkets, Metro department stores,
Puregold and 7-Eleven, as well as regional retailers. The Company‘s general trade coverage
has grown significantly from approximately 70,000 outlets in 2010 to approximately 225,168
outlets including sari-sari stores, wet markets, wholesalers and regional supermarkets in
2013. The Company operates 14 distribution centers, allowing the Company to respond
quickly to changes in customer demand.
In addition, the Company employs its own sales and distribution force consisting of
approximately 159 personnel, including sales administration and support functions. The
Company believes that employing a majority of its sales force in-house has resulted in a
relatively higher level of motivation and incentivization among its employees that hascontributed to the strong growth in the sales of the Company‘s products. This arrangement

7/21/2019 PreliminaryProspectus - Century
http://slidepdf.com/reader/full/preliminaryprospectus-century 25/648
also enables the Company to work closely with its customers and develop strong relationships
with them. The Company continually seeks ways to expand the reach of its distribution
network, especially in the Mindanao and Visayas regions. The Company believes that its
multi-channel distribution network and its strong relationships with customers has allowed it
to maximize customer reach and has been one of the key factors to its success in building anddeveloping its market-leading positions.
CNPF‘s extensive distribution network is supported by its strategically located production
facilities. The Company‘s tuna processing facility, with an installed capacity of 360 MT per
day as of December 31, 2013, is located in General Santos, Mindanao, which is the heart of
the Philippine tuna industry as it is geographically adjacent to two large tuna fishing grounds,
the Western Pacific Ocean and the waters between Southern Philippines and Indonesia. In
addition, one of the Company‘s sardine processing facilities, with an installed capacity of 200
MT per day as of December 31, 2013, is located in Zamboanga, which is the center of the
Philippine sardine industry. The proximity to the source of supply ensures the availability of
fresh fish, a critical element in maintaining a high quality product and lowering the
Company‘s logistics costs. The Company‘s meat processing plant and milk and mixes plant,located in Laguna and Taguig, respectively, are also strategically located close to major
markets, which reduces the cost of transporting products to customers. The Company‘s meat
processing plant has an installed capacity of 194 MT per day as of December 31, 2013 while
the Company‘s milk and mixes plant has an installed capacity of 11,000 cases per day as of
December 31, 2013.
Highly scalable export business that supplies processed tuna to leading international
companies and distributes branded products to high growth markets
The Company‘s export business, comprising private label processed tuna as well as branded
products, is complementary to its domestic business as it helps increase scale and reduce
costs, increasing the Company‘s competitiveness. An additional benefit of the scalability of
the export business is that it allows the export business to focus on quality and achieve higher
margins.
The Company has developed a reputation in the international food manufacturing community
as a reliable and trusted partner. It has supplied some of the largest food manufacturers
globally, including Chicken of the Sea, Bumblebee Foods LLC, Subway, Princes, Rio Mare,
Hagoromo, Hoko and California Garden. The Company is constantly looking to enter into
additional agreements with potential partners. The Company believes that supplying leading
global food manufacturers in some of the most stringently regulated markets in the world
represents an endorsement of the quality of the Company‘s products.
The Company currently supplies to brands and retailers in five continents and covers major
markets including North America, Europe, Asia and Australia, and the Middle East, broken
down as follows:
2013 2012 2011
% of total exports
North America 7% 12% 38%
Europe 44% 16% 16%
Asia and Australia 49% 67% 40%
Middle East 0% 5% 6%

7/21/2019 PreliminaryProspectus - Century
http://slidepdf.com/reader/full/preliminaryprospectus-century 26/648
The Company was the leading Philippine exporter of canned tuna and frozen tuna loin
products for the year ended December 31, 2013, with a market share of 34% according to data
from the Philippine Bureau of Customs (the ―BOC‖).
The Company also distributes its branded products internationally, particularly to China and
Vietnam, through its affiliates. Century International (China) Company Limited and Century
Shanghai Trading Company, joint ventures between CCC and Thai Union Manufacturing
Company, Ltd., as well as Century Pacific Vietnam Company, a wholly owned subsidiary of
CCC, have headquarters in Beijing, Shanghai, and Vietnam, respectively. These offices
distribute the Company‘s branded products to major cities in the region. The Company‘s
products are carried by retailers such as Carrefour, Walmart, Tesco Hymall, Metro and
Auchan, among others. As of December 31, 2013, the Company‘s private label and branded
products are distributed across North America, Europe, Asia, Australia, and the Middle East.
CNPF has earned a number of international accreditations for food safety and quality. CNPF
has been accredited by the US FDA, the Canadian Food Inspection Agency, the British Retail
Consortium, the European Union, the Orthodox Union and the Islamic Dawah Council. Inaddition, all of CNPF‘s processing facilities apply the Hazard Analysis and Critical Control
Points (the ―HACCP‖) plan, a management system which addresses food safety through the
analysis and control of biological, chemical and physical hazards from raw material
production, procurement and handling to manufacturing, distribution and consumption of the
finished product
Experienced and dedicated management team
The Company is led by an experienced and dedicated management team with a proven track
record of success. Members of the senior management team have an average of over 25 years
of industry experience, including experience working in large, multinational corporations in
the food industry. The management team is well accustomed to the Philippine operating
environment and has effectively managed the Company both in times of strong economic
growth as well as through periods of economic downturn and political instability. The
strength and depth of the experience of the Company‘s management team have been
demonstrated by their successful implementation of a range of efficiency programs and
product innovations, which has resulted in continued profitability and market leadership for
the Company over the years. In addition, management team has a proven track record of
turning previously under-promoted and neglected brands, such as Birch Tree and Blue Bay,
into successful brands by applying the Company‘s strategies, such as proper branding and
extensive national distribution coverage.
The Company believes that members of its management team are highly regarded in theindustry, and they hold a variety of leadership positions in food industry organizations, such
as the Sardine Association of the Philippines, the Philippine Association of Meat Processors
Inc., the Tuna Canners‘ Association of the Philippines. The management team‘s industry
leadership positions also create a valuable local business network for the Company.
Strategies
The Company seeks to strengthen its leading market position in the Philippines and expand its
business operations by implementing the following business strategies:

7/21/2019 PreliminaryProspectus - Century
http://slidepdf.com/reader/full/preliminaryprospectus-century 27/648
Actively develop and manage product and brand portfolios to target different price
points and respond to emerging market trends
The Company has a history of driving growth through new and innovative products,
capitalizing on emerging market trends and introducing extensions of successful product
lines. The Company will continue growing its existing product categories and deliver
innovative products under trusted brands and the Company is committed to developing and
expanding its product categories to meet evolving consumer tastes and preferences. In
addition, the Company will continue to market different brands to target different consumer
price points. For example, the Company believes that there are growth opportunities in the
canned meat market and plans to target the premium segment through the development of the
Swift brand.
The Company also intends to continuously review its product offerings to rationalize
unprofitable products from its portfolio. To enhance the stability of its revenue stream and
profit margins, the Company plans to increase the percentage of sales of products that have
performed well and which the Company believes will continue to do so. For example, asPhilippine consumers have become more health conscious, the Company‘s marketing strategy
has evolved to highlight the health benefits of Century Tuna and to present the Company‘s
ready-to-eat tuna viands as healthier alternatives to traditional beef, pork and chicken-based
dishes. The Company has also noticed a shift in consumer preference from canned products to
products in sealed pouches or flexible packaging. The Company has pre-empted this shift in
preference and has developed the capability to produce pouched products. The Company
intends to increase its product offerings in pouched or flexible packaging, which the
Company believes will develop new product segments and further penetrate the ready-to-eat
meal segment.
In addition, the Company is ranked second in the Philippine condensed/evaporated milk
market and third in the Philippine all-purpose cream segment, according to AC Nielsen. The
Company sees a strong growth opportunity for the dairy market and has developed various
initiatives to grow its dairy business. For example, the Company has responded to changing
consumer preferences and plans to develop ready-to-drink products. The Company also plans
to continue aggressively promoting the Angel and Birch Tree brands through marketing
campaigns within the next two years. In particular, the Company plans to grow the Angel
brand through improved formulations, smaller packaging sizes for more budget-conscious
consumers and achieving a market leading position in the two-in-one product platform for
canned milk and cream. For the Birch Tree brand, the Company intends to expand into adult
and children‘s milk segments through powdered milk, flavored milk drinks and other product
formats.
Expand distribution network to capitalize on growing retail segments and target
customers in high growth segments
The Company plans to capitalize on rapidly growing retail segments such as 24-hour
convenience trade and modern trade channels, and to expand its distribution network,
targeting to reach 250,000 directly served points of sale in 2014. In particular, the Company
plans to expand its distribution network in the Philippines by increasing the number of retail
outlets that its regional sales force services directly. At the same time, the Company is
working with its distributors to increase its penetration of general trade outlets, particularly in
more remote areas such as Mindanao and the Visayas. In addition, there are regions in the
Philippines such as Central Visayas where the Company is not the market leader due the
incumbency of regional market leaders. However, the Company believes that with sustained
presence through a well-developed distribution network in those regions, the Company will

7/21/2019 PreliminaryProspectus - Century
http://slidepdf.com/reader/full/preliminaryprospectus-century 28/648
be able to gain market share in those areas. The Company believes that the Philippine market
is still underserved in certain product categories and there are growth opportunities to
improve its distribution network. The Company plans to penetrate these underserved areas by
reaching out to a greater number of smaller informal retailers such as sari-sari stores and wet
markets.
Another area the Company has identified as a growth avenue is the food service segment.
While sales to food service customers, such as, but not limited to, Jollibee, KFC, Starbucks
and 7-Eleven, contributed less than 3% of the Company‘s total revenue for the year ended
December 31, 2013, the Company believes there are significant opportunities to work closely
with customers and expand existing relationships, as well as establish relationships with a
wider range of customers in this segment. The Company understands the needs of its food
service customers and proactively suggests new products or recipes suited for such
customers‘ business. As its food service customers continue to expand their business, the
Company intends to further collaborate with such customers and increase its sales in this
segment.
Enter into new product categories
In addition to growing and developing its existing product and brand portfolio, the Company
plans to enter into new product categories. The Company believes its competitive strengths
and deep understanding of the Philippine market provide significant advantages when
entering into new product categories. In 2014, the Company plans to start marketing and
distributing beverage products, such as coconut water, by leveraging on the Company‘s
extensive distribution network and experienced sales and marketing personnel. The
Company‘s marketing strategy will highlight the health benef its of these beverage products in
line with the Company‘s health and wellness theme and will enable the Company to penetrate
new product categories.
The Company also entered into a distribution agreement with Kapal Api of Indonesia in
November 16, 2012 to distribute Kapal Api‘s coffee products in the Philippines. Kapal Api is
an Indonesian company engaged in, among others, the operation of a coffee plantation, the
production of non-dairy creamer, the production of espresso machines, and the distribution of
coffee and coffee products.
Optimize export business to further penetrate the private label export market and
increase presence of branded products in overseas markets
As the current leading tuna exporter in the Philippines, the Company is well positioned to
increase its market share in the export business. The Company intends to increase the numberof partners for its private label export business in order to gain greater scale and better
capitalize on economies of scale. The Company believes this should further improve profit
margins of its export business.
The Company currently distributes its branded products across North America, Europe, Asia,
Australia, and the Middle East. The Company has noticed increasing brand awareness among
Filipino communities around the world and similar demands from Latino communities. While
overseas Filipino communities were the initial target customer base for its branded exports,
the Company has seen growing demand for its products in mainstream markets as the
Company continues to build the presence of its branded products in overseas markets. The
Company intends to capitalize on this trend and has started to sell its branded products to
Walmart, Albertsons and Kroger in the US, as well as negotiate with other retailers to have its
products sold in Asian food sections of their stores. The Company plans to enter into
7/21/2019 PreliminaryProspectus - Century
http://slidepdf.com/reader/full/preliminaryprospectus-century 29/648
distribution agreements with several other large retailers in North America likely within the
next 12 months.
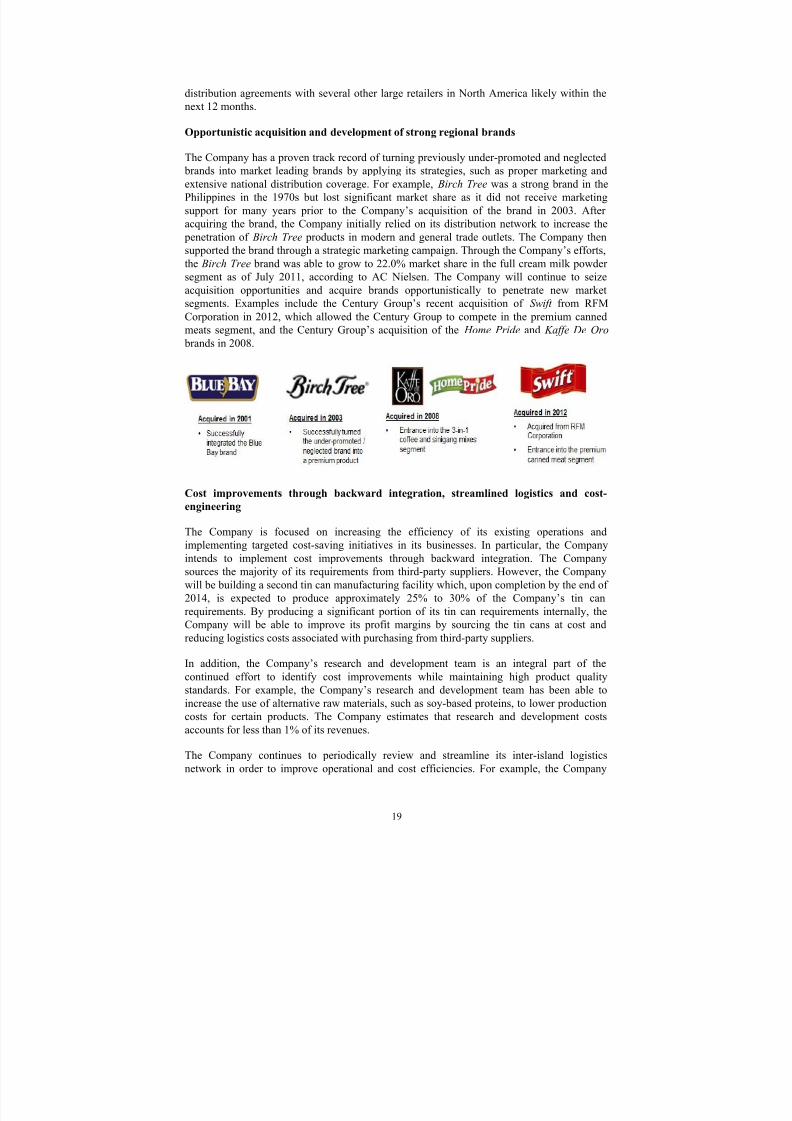
Opportunistic acquisition and development of strong regional brands
The Company has a proven track record of turning previously under-promoted and neglected
brands into market leading brands by applying its strategies, such as proper marketing and
extensive national distribution coverage. For example, Birch Tree was a strong brand in the
Philippines in the 1970s but lost significant market share as it did not receive marketing
support for many years prior to the Company‘s acquisition of the brand in 2003. After
acquiring the brand, the Company initially relied on its distribution network to increase the
penetration of Birch Tree products in modern and general trade outlets. The Company then
supported the brand through a strategic marketing campaign. Through the Company‘s efforts,
the Birch Tree brand was able to grow to 22.0% market share in the full cream milk powder
segment as of July 2011, according to AC Nielsen. The Company will continue to seize
acquisition opportunities and acquire brands opportunistically to penetrate new market
segments. Examples include the Century Group‘s recent acquisition of Swift from RFMCorporation in 2012, which allowed the Century Group to compete in the premium canned
meats segment, and the Century Group‘s acquisition of the Home Pride and Kaffe De Oro
brands in 2008.
Cost improvements through backward integration, streamlined logistics and cost-
engineering
The Company is focused on increasing the efficiency of its existing operations and
implementing targeted cost-saving initiatives in its businesses. In particular, the Company
intends to implement cost improvements through backward integration. The Company
sources the majority of its requirements from third-party suppliers. However, the Company
will be building a second tin can manufacturing facility which, upon completion by the end of
2014, is expected to produce approximately 25% to 30% of the Company‘s tin can
requirements. By producing a significant portion of its tin can requirements internally, the
Company will be able to improve its profit margins by sourcing the tin cans at cost and
reducing logistics costs associated with purchasing from third-party suppliers.
In addition, the Company‘s research and development team is an integral part of the
continued effort to identify cost improvements while maintaining high product quality
standards. For example, the Company‘s research and development team has been able to
increase the use of alternative raw materials, such as soy-based proteins, to lower production
costs for certain products. The Company estimates that research and development costs
accounts for less than 1% of its revenues.
The Company continues to periodically review and streamline its inter-island logisticsnetwork in order to improve operational and cost efficiencies. For example, the Company
7/21/2019 PreliminaryProspectus - Century
http://slidepdf.com/reader/full/preliminaryprospectus-century 30/648
plans to curtail the operations of or consolidate under-utilized depots and warehouses thereby
reducing costs while maintaining appropriate service coverage. The Company is also able to
leverage on its economies of scale to further rationalize its production and distribution costs.
Realizing savings through cost reduction initiatives will improve the Company‘s profit
margins and enable the Company to continue growing its portfolios of brands and products.
Risks of Investing
Before making an investment decision, investors should carefully consider the risks
associated with an investment in the Offer Shares. These risks include:
risks relating to the Company‘s business;
risks relating to the Philippines;
risks relating to the Offer and the Offer Shares; and
risks relating to certain statistical information in this Prospectus.
Please refer to the section entitled ― Risk Factors‖ which, while not intended to be anexhaustive enumeration of all risks, must be considered in connection with a purchase of the
Offer Shares.
Corporate Information
The Company is a Philippine corporation with its registered office and principal executive
offices located at 7th Floor, Centerpoint Building, Julia Vargas corner Garnet Street, Ortigas
Center, 1605 Pasig City, Metro Manila, Philippines. The Company‘s telephone number is +
(632) 633 8855 and its fax number is + (632) 637 2499. Its corporate website is
www.centurypacific.com.ph. The information on the Company‘s website is not incorporated
by reference into, and does not constitute part of, this Prospectus.
Investor Relations Office
The Investor Relations Office will be tasked with (a) the creation and implementation of an
investor relations program that reaches out to all shareholders and informs them of corporate
activities and (b) the formulation of a clear policy for accurately, effectively and sufficiently
communicating and relating relevant information to the Company‘s stakeholders as well as to
the broader investor community.
Giovanna M. Vera, heads the Company‘s Investor Relations Office and serves as the
Company‘s designated Investor Relations Officer (―IRO‖). The Company‘s Chief
Information Officer (―CIO‖) is Oscar A. Pobre, who is also the Chief Financial Officer. TheIRO will also be responsible for ensuring that the Company‘s shareho lders have timely and
uniform access to official announcements, disclosures and market-sensitive information
relating to the Company. As the Company‘s officially designated spokesperson, the IRO will
be responsible for receiving and responding to investor and shareholder queries. In addition,
the IRO will oversee most aspects of the Company‘s shareholder meetings, press conferences,
investor briefings, management of the investor relations portion of the Company‘s website
and the preparation of its annual reports. The IRO will also be responsible for conveying
information such as the Company‘s policy on corporate governance and corporate social
responsibility, as well as other qualitative aspects of the Company‘s operations and
performance. The Company‘s Investor Relations Office will be located in 7th Floor,
Centerpoint Building, Julia Vargas corner Garnet Street, Ortigas Center, 1605 Pasig City,
Metro Manila, Philippines. The Company‘s Investor Relations Officer, may be contacted at
[email protected] or + (632) 633 8855.

7/21/2019 PreliminaryProspectus - Century
http://slidepdf.com/reader/full/preliminaryprospectus-century 31/648
SUMMARY OF THE OFFER
Issuer ................................................. Century Pacific Food, Inc., a corporation organized
under Philippine law. The trading symbol shall be
CNPF
Joint Issue Managers, Joint Lead
Underwriters, and Joint
Bookrunners .....................................
BDO Capital & Investment Corporation
BPI Capital Corporation
First Metro Investment Corporation
The Offer ........................................... Offer of 229,654,404 new Common Shares to be
issued and offered by the Company
45,930,800 Offer Shares (or 20% of the OfferShares) are being allocated to all of the PSE Trading
Participants at the Offer Price and 22,965,400 Offer
Shares (or 10% of the Offer Shares) are being
allocated at the Offer Price to LSIs. The remaining
160,758,204 Offer Shares (or 70% of the Offer
Shares) are being allocated to the QIBs and the
general public through the Joint Lead Underwriters.
Offer Price......................................... Up to ₱14.50 per Offer Share.
Offer Period ...................................... The Offer Period shall commence at 9:00 a.m.,
Manila time, on April 23, 2014 and end at 12:00noon, Manila time, on April 29, 2014. The
Company and the Joint Lead Underwriters reserve
the right to extend or terminate the Offer Period
with the approval of the SEC and the PSE.
Applications must be received by the receiving
agent by 12:00 noon Manila time on April 29, 2014.
Applications received thereafter or without the
required documents will be rejected. Applications
shall be considered irrevocable upon submission to
a participating PSE Trading Participant or the JointLead Underwriters, and shall be subject to the terms
and conditions of the Offer as stated in this
Prospectus and in the application. The actual
purchase of the Offer Shares shall become effective
only upon the actual listing of the Offer Shares on
the PSE and upon the obligations of the Joint Lead
Underwriters under the Underwriting Agreement
becoming unconditional and not being suspended,
terminated or cancelled on or before the Listing
Date in accordance with the provisions of such
agreement.
Eligible Investors .............................. The Offer Shares may be purchased by any natural
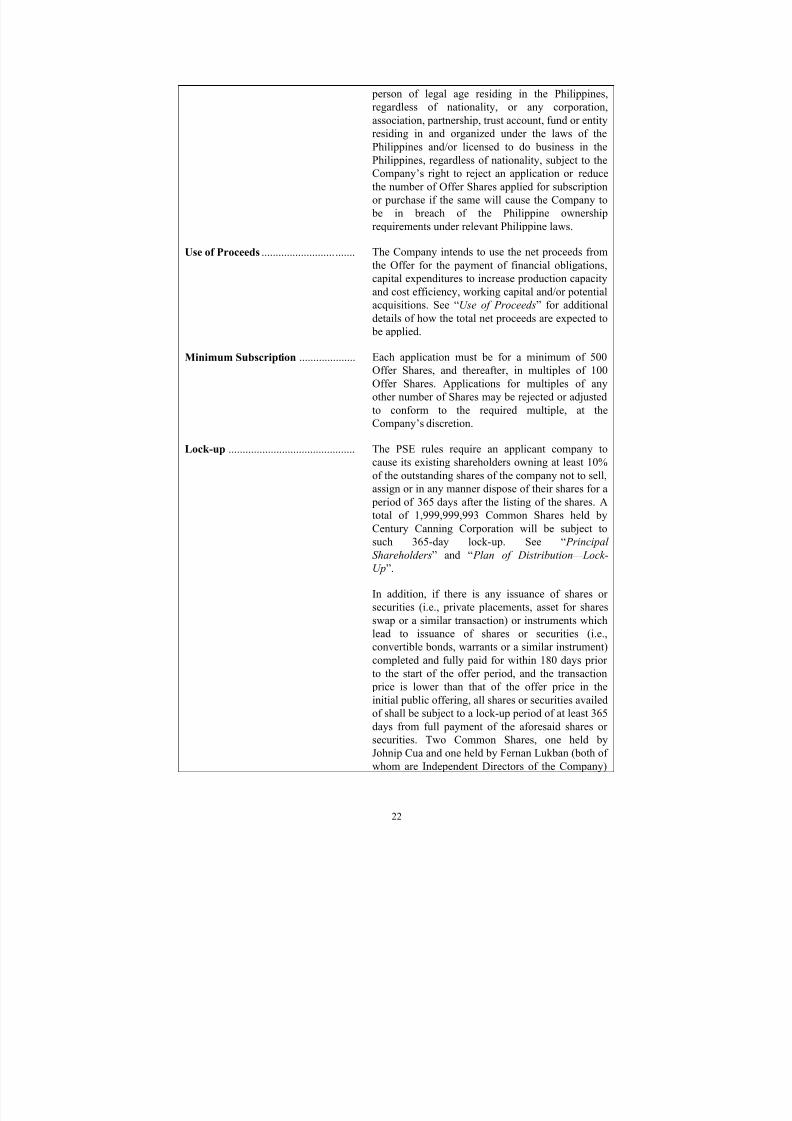
7/21/2019 PreliminaryProspectus - Century
http://slidepdf.com/reader/full/preliminaryprospectus-century 32/648
person of legal age residing in the Philippines,
regardless of nationality, or any corporation,
association, partnership, trust account, fund or entity
residing in and organized under the laws of the
Philippines and/or licensed to do business in thePhilippines, regardless of nationality, subject to the
Company‘s right to reject an application or reduce
the number of Offer Shares applied for subscription
or purchase if the same will cause the Company to
be in breach of the Philippine ownership
requirements under relevant Philippine laws.
Use of Proceeds ................................. The Company intends to use the net proceeds from
the Offer for the payment of financial obligations,
capital expenditures to increase production capacity
and cost efficiency, working capital and/or potential
acquisitions. See ―Use of Proceeds‖ for additionaldetails of how the total net proceeds are expected to
be applied.
Minimum Subscription .................... Each application must be for a minimum of 500
Offer Shares, and thereafter, in multiples of 100
Offer Shares. Applications for multiples of any
other number of Shares may be rejected or adjusted
to conform to the required multiple, at the
Company‘s discretion.
Lock-up ............................................. The PSE rules require an applicant company tocause its existing shareholders owning at least 10%
of the outstanding shares of the company not to sell,
assign or in any manner dispose of their shares for a
period of 365 days after the listing of the shares. A
total of 1,999,999,993 Common Shares held by
Century Canning Corporation will be subject to
such 365-day lock-up. See ― Principal
Shareholders‖ and ― Plan of Distribution — Lock-
Up‖.
In addition, if there is any issuance of shares or
securities (i.e., private placements, asset for sharesswap or a similar transaction) or instruments which
lead to issuance of shares or securities (i.e.,
convertible bonds, warrants or a similar instrument)
completed and fully paid for within 180 days prior
to the start of the offer period, and the transaction
price is lower than that of the offer price in the
initial public offering, all shares or securities availed
of shall be subject to a lock-up period of at least 365
days from full payment of the aforesaid shares or
securities. Two Common Shares, one held by
Johnip Cua and one held by Fernan Lukban (both ofwhom are Independent Directors of the Company)

7/21/2019 PreliminaryProspectus - Century
http://slidepdf.com/reader/full/preliminaryprospectus-century 33/648
will be subject to such 365-day lock-up.
To implement this lock-up requirement, the PSE
requires the applicant company to lodge the shares
with the PDTC through a Philippine CentralDepository (―PCD‖) participant for the electronic
lock-up of the shares or to enter into an escrow
agreement with the trust department or custodian
unit of an independent and reputable financial
institution. See ― Principal Shareholders‖ and ― Plan
of Distribution — Lock-Up‖.
Listing and Trading.......................... The Company‘s application for the listing of the
Common Shares was approved by the PSE on
March 26, 2014. All of the Common Shares in issue
or to be issued, including the Offer Shares, are
expected to be listed on the PSE on or about May 6,2014 under the symbol and company alias ―CNPF‖.
Trading of the Shares that are not subject to lock-up
is expected to commence on the same date. See
― Description of the Shares‖ on page 198 of this
Prospectus.
Dividends ........................................... The Company has approved a dividend policy of
maintaining an annual cash and/or share dividend
pay-out of up to 30% of its net income from the
preceding year, subject to the requirements of
applicable laws and regulations, the terms andconditions of its outstanding bonds and loan
facilities, and the absence of circumstances that may
restrict the payment of such dividends, such as
where the Company undertakes major projects and
developments. Dividends must be approved by the
Board (and shareholders in case of a share dividend
declaration) and may be declared only from
unrestricted retained earnings of the Company. The
Company‘s Board may, at any time, modify the
Company‘s dividend policy depending upon the
Company‘s capital expenditure plans and/or any
terms of financing facilities entered into to fund itscurrent and future operations and projects. The
Company can give no assurance that it will pay any
dividends in the future. See ― Dividends and
Dividend Policy‖.
Refunds for the Offer ....................... In the event that the number of Offer Shares to be
received by an applicant, as confirmed by the Joint
Lead Underwriters, is less than the number covered
by its application, or if an application is rejected by
the Company, then the Joint Lead Underwriters
shall refund, without interest, within five bankingdays from the end of the offer period, all or a

7/21/2019 PreliminaryProspectus - Century
http://slidepdf.com/reader/full/preliminaryprospectus-century 34/648
portion of the payment corresponding to the number
of Offer Shares wholly or partially rejected. All
refunds shall be made through the receiving agent
with whom the applicant has filed the application, at
the applicant‘s risk.
Registration and Lodgment of
Shares with PDTC......................
The Offer Shares are required to be lodged with the
PDTC. The applicant must provide the information
required for the PDTC lodgment of the Offer
Shares. The Offer Shares will be lodged with the
PDTC at least two days prior to the Listing Date.
The applicant may request to receive share
certificates evidencing such applicant‘s investment
in the Offer Shares through his/her broker after the
Listing Date. Any expense to be incurred by such
issuance of certificates shall be borne by the
applicant.
Registration of Foreign Investments The BSP requires that investments in shares of stock
funded by inward remittance of foreign currency be
registered with the BSP if the foreign exchange
needed to service capital repatriation or dividend
remittance will be sourced from the Philippine
banking system. The registration with the BSP of all
foreign investments in the Offer Shares shall be the
responsibility of the foreign investor. See
― Philippine Foreign Exchange and Foreign
Ownership Controls‖.
Restriction on Issuance and
Disposal of Shares ......................
Existing shareholders who own an equivalent of at
least 10% of the Company‘s issued and outstanding
Common Shares after the Offer are required under
the revised listing rules of the PSE applicable to
companies applying for listing on the PSE Main
Board, not to sell, assign or otherwise dispose of
their Common Shares for a minimum of 365 days
after the Listing Date. See ―— Lock-up‖ above,
― Principal Shareholders‖, and ― Plan of
Distribution — Lock-Up‖.
Except for the issuance of Offer Shares pursuant to
the Offer or Common Shares for distribution by way
of stock dividends and certain option grants and
issuances under employee incentive schemes, the
PSE is expected to require the Company, as a
condition to the listing of the Common Shares, not
to issue new shares in capital or grant any rights to
or issue any securities convertible into or
exchangeable for, or otherwise carrying rights to
acquire or subscribe to, any shares in its capital or
enter into any arrangement or agreement wherebyany new shares or any such securities may be issued

7/21/2019 PreliminaryProspectus - Century
http://slidepdf.com/reader/full/preliminaryprospectus-century 35/648
for a period of 180 days after the Listing Date.
Procedure for Application ............... Application forms and signature cards may be
obtained from the Joint Lead Underwriters or from
any participating PSE Trading Participants.Applicants shall complete the application form,
indicating all pertinent information such as the
applicant‘s name, address, taxpayer‘s identification
number, citizenship and all other information as
may be required in the application form. Applicants
shall undertake to sign all documents and to do all
necessary acts to enable them to be registered as
holders of Offer Shares. Failure to complete the
application form may result in the rejection of the
application.
If the applicant is a corporation, partnership or trustaccount, the application must be accompanied by
the following documents:
a certified true copy of the applicant‘s latest
articles of incorporation and by-laws (or
articles of partnership in the case of a
partnership) and other constitutive
documents (each as amended to date) duly
certified by its corporate secretary (or
managing partner in the case of a
partnership);
a certified true copy of the applicant‘s SEC
certificate of registration or certificate of
filing amended articles of incorporation or
by-laws, as the case may be, duly certified
by its corporate secretary (or managing
partner in the case of a partnership); and
a duly notarized corporate secretary‘s
certificate (or certificate of the managing
partner in the case of a partnership) setting
forth the resolution of the applicant‘s boardof directors or equivalent body authorizing
the purchase of the Offer Shares indicated
in the application, identifying the
designated signatories authorized for the
purpose, including his or her specimen
signature, and certifying the percentage of
the applicant‘s capital or capital stock held
by Philippine Nationals. Foreign corporate
and institutional applicants who qualify as
Eligible Investors, in addition to the
documents listed above, are required tosubmit in quadruplicate, a representation

7/21/2019 PreliminaryProspectus - Century
http://slidepdf.com/reader/full/preliminaryprospectus-century 36/648
and warranty stating that their purchase of
the Offer Shares to which their application
relates will not violate the laws of their
jurisdictions of incorporation or
organization, and that they are allowed,under such laws, to acquire, purchase and
hold the Offer Shares.
Payment Terms for the Offer .......... The purchase price must be paid in full in Pesos
upon the submission of the duly completed and
signed application form and signature card together
with the requisite attachments. Payment for the
Offer Shares shall be made either by: (i) a personal
or corporate check drawn against an account with a
BSP authorized bank at any of its branches located
in Metro Manila; or (ii) a manager‘s or cashier‘s
check issued by an authorized bank. All checksshould be made payable to ―Century Pacific IPO,‖
crossed ―Payee‘s Account Only,‖ and dated the
same date as the application. The applications and
the related payments will be received at any of the
offices of the Joint Lead Underwriters, the receiving
agent, or the selling agents.
Acceptance or Rejection of
Applications for the Offer ................
―Application to Subscribe‖ forms are subject to
confirmation by the Joint Lead Underwriters and the
final approval of the Company. The Company and
the Joint Lead Underwriters reserve the right toaccept, reject or scale down the number and amount
of Offer Shares covered by any application. The
Company and the Joint Lead Underwriters have the
right to reallocate available Offer Shares in the
event that the Offer Shares are insufficient to satisfy
the total applications received. The Offer Shares
will be allotted in such a manner as the Company
and the Joint Lead Underwriters may, in their sole
discretion, deem appropriate, subject to distribution
guidelines of the PSE. Applications with checks
dishonored upon first presentation and ―Application
to Subscribe‖ forms which do not comply withterms of the Offer will be automatically rejected.
Notwithstanding the acceptance of any ―Application
to Subscr ibe‖ forms, the actual subscription of the
Offer Shares by the applicant will be effective only
upon the listing of the Offer Shares at the PSE.
Expected Timetable .......................... The timetable of the Offer is expected to be as
follows:
Notice of final Offer Price to the
SEC and PSE ...................................
April 21, 2014
PSE Trading Participants‘ April 23 to

7/21/2019 PreliminaryProspectus - Century
http://slidepdf.com/reader/full/preliminaryprospectus-century 37/648
Commitment Period ......................... April 25, 2014
Local Small Investor Offer Period ... April 23 to
April 29, 2014
Joint Lead Underwriters‘ Offer
Period...............................................
April 23 to
April 29, 2014
Listing Date and commencement
of trading on the PSE .......................
May 6, 2014

7/21/2019 PreliminaryProspectus - Century
http://slidepdf.com/reader/full/preliminaryprospectus-century 38/648
SUMMARY PRO FORMA CONSOLIDATED FINANCIAL INFORMATION
The following tables set forth the summary pro forma consolidated financial information for the
Company and should be read in conjunction with the auditors’ reports and the Company’s pro forma
consolidated financial statements, including the notes thereto, included elsewhere in this Prospectus
and the section entitled ―Management’s Discussion and Analysis of Financial Condition and Results of
Operations‖. The summary pro forma consolidated financial information presented below as of and for
the year ended December 31, 2013 was derived from the historical audited separate financial
statements of the Company, GTC, SMDC, CCC, PMCI and CSC, adjusted to give pro forma effect to (i)
the consolidation of GTC and SMDC into the Company and (ii) the Company’s acquisition of certain
assets of CCC, PMCI and CSC, as if such acquisitions occurred prior to January 1, 2013. The pro
forma consolidated financial infor mation was prepared in accordance with the Company’s
assumptions which are described in the pro forma consolidated financial statements and reviewed by
Navarro Amper & Co. in accordance with PSA.
The pro forma adjustments are based upon available information and certain assumptions that the
Company believes are reasonable under the circumstances. The summary pro forma financialinformation does not purport to represent what the results of operations of the Company and its
subsidiaries would actually have been had the acquisitions in fact occurred prior to January 1, 2013,
nor do they purport to project the results of operations of the Company and its subsidiaries for any
future period or date. For additional information regarding financial information presented in this
Prospectus, see ―Presentation of Financial Information‖.
CONSOLIDATED STATEMENT OF COMPREHENSIVE INCOME
(unaudited)
For the year ended
December 31,2013
₱
Net Sales P 19,023,053,067
Cost of Sales 15,696,776,711
Gross Profit 3,326,276,356
Other income 175,816,427
Operating Profit 3,502,092,783
Operating Expenses 2,415,239,219
Finance Costs 112,450,206
Other Expenses 14,054,392
Profit Before Tax960,348,966
Income Tax Expense 216,431,762
Profit for the Year 743,917,203
Earnings per share
Basic and Diluted Earnings per Share 0.50

7/21/2019 PreliminaryProspectus - Century
http://slidepdf.com/reader/full/preliminaryprospectus-century 39/648
CONSOLIDATED STATEMENT OF FINANCIAL POSITION
For the year ended
December 31,2013
₱
ASSETS
Current Assets
Cash and cash equivalents 804,394,733Trade and other receivables 2,330,891,620Inventories - net 3,714,229,160
Prepayments and other current assets 176,749,347
Total Current Assets 7,026,264,859
Non-current Assets
Property and equipment - net 1,046,775,177Intangible asset 40,000,000
Deferred tax assets 21,747,988
Other non-current asset 23,856,636
Total Non-current Assets 1,132,379,800
TOTAL ASSETS 8,158,644,659
LIABILITIES AND EQUITY
Current Liabilities
Loans payable - current portion 2,717,300,002
Trade and other payables 2,535,491,858Income tax payable 51,835,544
Total Current Liabilities 5,304,627,404
Non-current Liabilities
Retirement benefit obligation 13,948,453
Deferred tax liability 1,418,347
Total Non-current Liabilities 15,366,800
Total Liabilities 5,319,994,203
EquityShare capital 1,500,000,000
Retained earnings 1,319,302,557
Currency translation adjustment 19,347,898
Total Equity 2,838,650,455
TOTAL LIABILITIES AND EQUITY 8,158,644,659
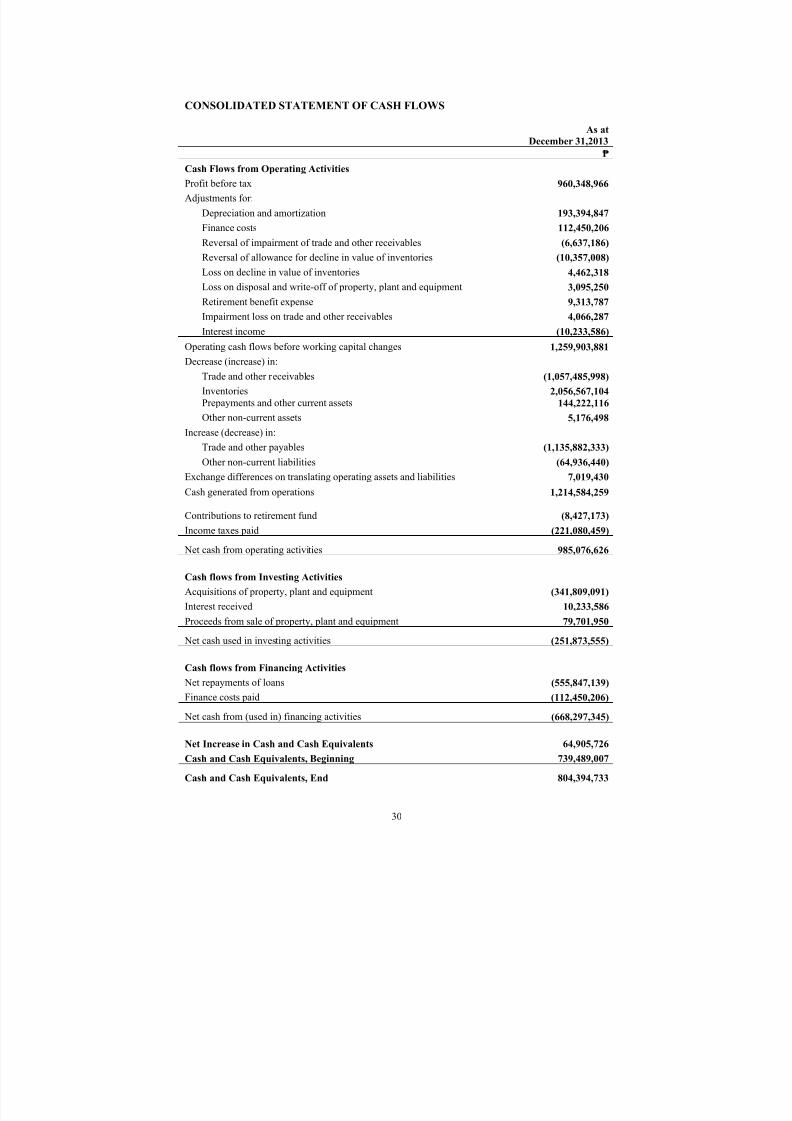
7/21/2019 PreliminaryProspectus - Century
http://slidepdf.com/reader/full/preliminaryprospectus-century 40/648
CONSOLIDATED STATEMENT OF CASH FLOWS
As at
December 31,2013
₱
Cash Flows from Operating Activities
Profit before tax 960,348,966
Adjustments for:
Depreciation and amortization 193,394,847
Finance costs 112,450,206
Reversal of impairment of trade and other receivables (6,637,186)
Reversal of allowance for decline in value of inventories (10,357,008)
Loss on decline in value of inventories 4,462,318
Loss on disposal and write-off of property, plant and equipment 3,095,250
Retirement benefit expense 9,313,787Impairment loss on trade and other receivables 4,066,287
Interest income (10,233,586)
Operating cash flows before working capital changes 1,259,903,881
Decrease (increase) in:
Trade and other receivables (1,057,485,998)
Inventories 2,056,567,104
Prepayments and other current assets 144,222,116
Other non-current assets 5,176,498
Increase (decrease) in:
Trade and other payables (1,135,882,333)
Other non-current liabilities (64,936,440)
Exchange differences on translating operating assets and liabilities 7,019,430
Cash generated from operations 1,214,584,259
Contributions to retirement fund (8,427,173)
Income taxes paid (221,080,459)
Net cash from operating activities 985,076,626
Cash flows from Investing Activities
Acquisitions of property, plant and equipment (341,809,091)
Interest received 10,233,586Proceeds from sale of property, plant and equipment 79,701,950
Net cash used in investing activities (251,873,555)
Cash flows from Financing Activities
Net repayments of loans (555,847,139)
Finance costs paid (112,450,206)
Net cash from (used in) financing activities (668,297,345)
Net Increase in Cash and Cash Equivalents 64,905,726
Cash and Cash Equivalents, Beginning 739,489,007
Cash and Cash Equivalents, End 804,394,733

7/21/2019 PreliminaryProspectus - Century
http://slidepdf.com/reader/full/preliminaryprospectus-century 41/648
SUMMARY COMBINED FINANCIAL INFORMATION
The following tables set forth the summary combined financial information for GTC and SMDC and
should be read in conjunction with the auditors’ reports and GTC’s and SMDC’s combined financial
statements, including the notes thereto, included elsewhere in this Prospectus and the section entitled
―Management’s Discussion and Analysis of Financial Condition and Results of Operations‖. The
combined financial information presented below as of and for the years ended December 31, 2011,
2012 and 2013 was derived from the audited financial statements of GTC and SMDC prepared in
accordance with PFRS. Our independent auditor for the years ended December 31, 2011, 2012 and
2013 was Punongbayan & Araullo. The summary financial information below should not be
considered indicative of the results of future operations.
COMBINED STATEMENTS OF COMPREHENSIVE INCOME
For the Years Ended December 31
2013 2012 2011₱
Net Sales 7,419,053,435 5,524,019,169 4,750,208,315
Cost of Sales 6,845,193,581 4,932,025,037 4,319,887,738
Gross Profit 573,859,854 591,994,132 430,320,577
Other income (Expense) (123,791,507) (47,624,275) (30,825,991)
697,651,361 639,618,407 461,146,568
Operating Expenses 423,708,762 428,936,981 286,067,972
Finance Costs 51,022,887 54,969,013 73,111,252
474,717,978 483,905,994 359,179,224
Profit Before Tax 222,919,712 155,712,413 101,967,344
Income Tax Expense 43,630,444 44,365,573 35,490,963
Profit for the Year 179,289,268 111,346,840 66,476,381

7/21/2019 PreliminaryProspectus - Century
http://slidepdf.com/reader/full/preliminaryprospectus-century 42/648
COMBINED STATEMENTS OF FINANCIAL POSITION
For the Years Ended December 31
2013 2012 2011
₱
ASSETS
Current Assets
Cash and cash equivalents 413,666,069 127,701,664 115,870,640
Trade and other receivables 1,237,379,984 470,734,174 475,292,082
Inventories - net 1,602,019,351 2,278,202,558 2,258,999,999
Prepayments and other current assets 93,714,160 105,358,317 93,385,763
Total Current Assets 3,346,779,564 2,981,996,713 2,943,548,484
Non-current Assets
Property and equipment - net 813,489,320 705,451,217 804,683,273Intangible asset 40,000,000 40,000,000 40,000,000
Deferred tax asset - net 13,412,011 5,893,298 3,356,275
Retirement benefit asset 23,643 0 0
Other non-current assets 17,491,130 30,291,475 32,851,701
Total Non-current Assets 884,416,104 781,635,990 880,891,249
4,231,195,668 3,763,632,703 3,824,439,733
LIABILITIES AND EQUITY
Current Liabilities
Loans payable - current portion 2,214,600,002 1,380,700,025 1,057,000,017
Trade and other payables 524,500,261 781,997,088 729,640,474Income tax payable 735,451 14,391,579 10,596,444
Dividends payable 0 0 76,086,020
Due to a related party 240,632,032 447,157,151 855,038,566
Total Current Liabilities 2,980,467,746 2,624,245,843 2,728,361,521
Non-current Liabilities
Loans payable - net of current portion 0 14,999,984 74,999,988
Deposits for future stock subscription 0 0 150,383,200
Other non-current liabilities 0 99,336 536,100
Total Non-current Liabilities 0 15,099,320 225,919,288
2,980,467,746 2,639,345,163 2,954,280,809
Equity
Share capital 1,000,000,000 540,625,000 540,625,000
Share Premium 137,298,180 137,298,180 137,298,180
Deposit on future stock subscription 0 195,883,200 0
Currency translation adjustments 32,291,024 (34,952,774) 18,420,279
Retained earnings 81,138,718 285,433,934 173,815,465
Total equity 1,250,727,922 1,124,287,540 870,158,924
4,231,195,668 3,763,632,703 3,824,439,733

7/21/2019 PreliminaryProspectus - Century
http://slidepdf.com/reader/full/preliminaryprospectus-century 43/648
COMBINED STATEMENTS OF CASH FLOWS
For the Years Ended December 31
2013 2012 2011
₱
Cash flows from Operating Activities
Profit before tax 222,919,712 155,712,413 101,967,344
Adjustments for:
Depreciation and amortization 129,957,909 127,172,487 120,786,676
Finance costs 51,022,887 54,969,013 73,111,252
Reversal of impairment of trade and otherreceivables (6,408,185) 0 0
Loss on decline in value of inventories 4,462,318 0 0
Loss on disposal and write-off of property, plantand equipment 3,095,250 0 1,184,961
Retirement benefit expense 2,094,690 2,078,420 2,391,146
Impairment loss on trade and other receivables 941,848 3,701,034 3,299,076
Interest income (9,272,387) (3,081,186) (996,688)
Operating cash flows before working capital changes 398,814,042 340,552,181 301,743,767
Decrease (increase) in:
Trade and other receivables (761,179,473) 1,365,409 62,847,331
Inventories 671,720,889 (19,202,559) (21,643,946)
Prepayments and other current assets 11,644,156 (11,972,554) (6,236,403)
Other non-current assets 12,800,346 2,560,227 (2,669,466)
Increase (decrease) in trade and other payables (257,496,827) 52,356,614 204,566,019
Exchange differences on translating operatingassets and liabilities 31,863,679 (36,892,013) 3,966,858
Cash generated from operations 108,166,812 328,767,305 542,574,160
Contributions to retirement fund (1,753,543) (2,022,250) (3,861,603)
Income taxes paid (64,182,843) (43,468,263) (18,448,070)
Net cash from operating activities 42,230,426 283,276,792 520,264,487
Cash flows from Investing Activities
Net additions to property and equipment (272,921,095) (73,254,775) (109,620,285)
Interest received 9,272,387 3,081,186 996,688
Proceeds from sale of property, plant and equipment 79,701,949 0 4,639,040
Net cash used in investing activities (183,946,759) (70,173,589) (103,984,557)
Cash flows from Financing Activities
Net proceeds from (repayments of) loans 818,900,000 263,700,000 (26,500,011)
Net repayments of due to related parties (219,688,175) (380,503,166) (310,665,962)
Receipt of deposits for future stock subscription 0 45,500,000 0
Proceeds from issuance of shares 263,491,800 0 0
Payment of dividends (384,000,000) (75,000,000) 0

7/21/2019 PreliminaryProspectus - Century
http://slidepdf.com/reader/full/preliminaryprospectus-century 44/648
Finance costs paid (51,022,887) (54,969,013) (73,111,252)
Net cash from (used in) financing activities 427,680,738 (201,272,179) (410,277,225)
Net Increase in Cash and Cash Equivalents 285,964,405 11,831,024 6,002,706
Cash and Cash Equivalents, Beginning 127,701,664 115,870,640 109,867,934
Cash and Cash Equivalents, End 413,666,069 127,701,664 115,870,640

7/21/2019 PreliminaryProspectus - Century
http://slidepdf.com/reader/full/preliminaryprospectus-century 45/648
SUMMARY PARENT FINANCIAL INFORMATION OF CNPF
The following table sets forth the summary financial information for the Company and should be read
in conjunction with the auditors’ reports and the Company’s financial statements, including the notes
thereto, included elsewhere in this Prospectus and the section entitled ―Management’s Discussion and
Analysis of Financial Condition of CNPF ‖. The summary financial information presented below for
the period October 25, 2013 to December 31, 2013 was derived from the audited financial statements
of the Company prepared in accordance with PFRS. Our independent auditor for the years ended
December 31, 2013 was Navarro Amper & Co. The Company’s summary financial information
below should not be considered indicative of the results of future operations.
STATEMENT OF COMPREHENSIVE INCOME
For the period
October 25, 2013 to
December 2013
₱
Other Income
Rental income 13,112,333
Interest income 73,295
13,185,628
Other Operating Expenses
Taxes and licenses 19,727,899
Depreciation expense 7,129,783
Professional fees 3,360,000
Supplies 189,062
30,406,744
Loss Before Tax (17,221,116)
Income tax benefit 5,188,323
Net Loss After Tax (12,032,793)

7/21/2019 PreliminaryProspectus - Century
http://slidepdf.com/reader/full/preliminaryprospectus-century 46/648
STATEMENTS OF FINANCIAL POSITION
As of December 31, 2013
₱
ASSETS
Current assets
Cash ..................................................... 24,298,838
Due from related parties ......... ........ ...... 14,685,813
Input value-added tax - net ........ ........ ... 26,436,975
Total current assets ............................... 65,421,627
Non-current assets
Investment in subsidiaries ......... ........ ... 1,194,615,640
Property and equipment - net ......... ....... 222,930,679
Deferred tax assets ........ ......... ........ ....... 5,188,323
Total non-current assets 1,422,734,642
1,488,156,269
LIABILITIES AND EQUITY
Current liabilities
Other current liabilities ......................... 189,062
Equity
Capital stock ........ ......... ......... ........ ....... 1,500,000,000Deficit ......... ........ ......... ........ ......... ....... (12,032,793)
1,487,967,207
1,488,156,269

7/21/2019 PreliminaryProspectus - Century
http://slidepdf.com/reader/full/preliminaryprospectus-century 47/648
STATEMENT OF CASH FLOWS
For the period October 25, 2013 to
December 2013
₱
Cash Flows from Operating Activities
Loss before tax (17,221,116)
Adjustments for:
Depreciation expense 7,129,783
Interest income (73,295)
Operating cash flow before working capital changes (10,164,628)
Increase in:
Due from related parties (14,685,814)
Input value-added tax - net (26,436,975)
Other payables 189,062
Net cash used in operating activities (51,098,355)
Cash Flows from Investing Activities
Acquisition of investments in subsidiaries (1,194,615,640)
Acquisition of property and equipment (230,060,462)
Interest received 73,295
Net cash used in investing activities (1,424,602,807)
Cash Flows from a Financing Activity
Issuance of capital stock 1,500,000,000
Cash, End 24,298,838

7/21/2019 PreliminaryProspectus - Century
http://slidepdf.com/reader/full/preliminaryprospectus-century 48/648
SUMMARY CONSOLIDATED FINANCIAL INFORMATION OF CNPF
The following table sets forth the summary financial information for the Company and should be read
in conjunction with the auditors’ reports and the Company’s financial statements, including the notes
thereto, included elsewhere in this Prospectus and the section entitled ―Management’s Discussion and
Analysis of Financial Condition and Results of Operations of the Consolidated Financial Information
of CNPF‖. The summary financial information presented below as of and for the year ended December
31, 2013 was derived from the audited consolidated financial statements of the Company prepared in
accordance with PFRS. Our independent auditor for the years ended December 31, 2013 was Navarro
Amper & Co. The Company’s summary financial information below should not be considered
indicative of the results of future operations.
STATEMENTS OF FINANCIAL POSITION
As of December 31, 2013
₱
AssetsCurrent Assets
Cash and cash equivalents 437,964,907
Trade and other receivables – net 1,034,062,591
Due from related parties 218,003,202
Inventories – net 1,602,019,351
Prepayments and other current assets 120,151,134
Total Current Assets 3,412,201,185
Non-Current Assets
Trademarks 40,000,000
Property, plant and equipment – net 1,036,419,999Deferred tax assets 18,726,312
Retirement benefit asset 23,643
Other non-current assets 17,491,128
Total Non-current Assets 1,112,661,082
4,524,862,267
Liabilities and Equity
Current Liabilities
Loans payable 2,214,600,002
Trade and other payables 524,689,323
Income tax payable 735,451Due to related parties 240,632,032
Total Current Liabilities 2,980,656,808
Equity
Share capital 1,500,000,000
Currency translation adjustment 14,308,241
Other reserves 30,628,942
Deficit (731,724)
1,544,205,459
4,524,862,267

7/21/2019 PreliminaryProspectus - Century
http://slidepdf.com/reader/full/preliminaryprospectus-century 49/648
STATEMENT OF COMPREHENSIVE INCOME
For the period October 25, 2013 to December 31, 2013
in ₱
Revenue 1,421,621,604
Cost of Goods Sold 1,306,758,259
Gross Profit 114,863,345
Other Income 29,417,788
144,281,133
Operating Expenses 136,423,625
Other Expenses 2,189,825
Finance Costs 11,332,127
149,945,577
Loss Before Tax (5,664,444)
Income Tax Benefit 4,517,204
Loss for the Period (1,147,240)
Other comprehensive income
Item that will be reclassified subsequently to profit or loss
Currency translation adjustments 14,308,241
Item that will not be reclassified subsequently to profit orloss
Effect of remeasurement of retirement benefit obligation 415,516
14,723,757
Total comprehensive income 13,576,517
Basic and Diluted Earnings Per Share (0,0008)

7/21/2019 PreliminaryProspectus - Century
http://slidepdf.com/reader/full/preliminaryprospectus-century 50/648
STATEMENT OF CASH FLOWS
For the period October 25, 2013 to December 31, 2013
in ₱
Cash Flows from Operating Activities (5,664,444)
Loss before tax
Adjustments for:
Depreciation and amortization 8,217,174
Finance costs 11,,332,127
Loss on inventory obsolescence 4,462,318
Loss on disposal of land 1,816,723
Retirement benefit expense 2,094,690
Interest income 495,102
Operating cash flow before working capital changes 22,753,690
Decrease (Increase) in:Trade and other receivables 3,925,763
Due from related parties (213,678,171)
Inventories 787,768,399
Prepayments and other current assets 5,313,290
Other non-current assets 1,838,164
Decrease in trade and other payables (545,989,226)
Exchange differences on translating operating assets andliabilities (21,415,425)
Cash generated from operations 40,516,484
Contribution to the retirement fund (1,753,543)
Income tax paid (22,608,962)
Net cash from operating activities 16,153,979
Cash Flows from Investing Activities
Acquisitions of property, plant and equipment (344,877,181)
Proceeds from sale of land 79,701,949
Interest income received (495,102)
Net cash used in investing activities (265,670,334)
Cash Flows from Financing Activities
Proceeds from issuance of share capital 1,500,000,000
Net receipts from related parties 129,865,038 Net repayment of loans (195,999,998)
Finance costs paid (11,332,127)
Net cash from financing activities 1,422,532,913
Acquisition of subsidiaries (net of cash acquired) (735,051,651)
Cash and Cash Equivalents, End 437,964,907
7/21/2019 PreliminaryProspectus - Century
http://slidepdf.com/reader/full/preliminaryprospectus-century 51/648
RISK FACTORS
An investment in the Offer Shares involves a number of risks. The price of securities can and does
fluctuate, and any individual security is likely to experience upward or downward movements and may
even become valueless. There is an inherent risk that losses may be incurred rather than profit made as
a result of buying and selling securities. Past performance is not indicative of future performance and
results, and there may be a large difference between the buying price and the selling price of the Offer
Shares. Investors should carefully consider all the information contained in this Prospectus, including
the risk factors described below, before deciding to invest in the Offer Shares. The occurrence of any of
the following events, or other events not currently anticipated, could have a material adverse effect on
the Company’s business, financial condition and results of operations and cause the market price of
the Offer Shares to decline. All or part of an investment in the Offer Shares could be lost.
The means by which the Company intends to address the risk factors discussed herein are principally
presented in this section and under the captions ―Business,‖ ―Management’s Discussion and Analysis
of Financial Condition and Results of Operations,‖ ―Industry,‖ and ―Board of Directors and Se nior
Management —Corporate Governance‖ of this Prospectus. This risk factor discussion does not purport to disclose all of the risks and other significant aspects of investing in the Offer Shares. Investors
should undertake independent research and study the trading of securities before commencing any
trading activity. Investors should seek professional advice regarding any aspect of the securities such
as the nature of risks involved in the trading of securities, and specifically those of high-risk securities.
Investors may request publicly available information on the Common Shares and the Company from
the SEC.
The risk factors discussed in this section are of equal importance and are only separated into
categories for ease of reference.
RISKS RELATING TO THE COMPANY’S BUSINESS
CNPF’s financial performance may be materially and adversely affected by fluctuations
in prices or disruption in the supply of key raw materials.
CNPF‘s production operations depend upon adequate supplies of raw materials which are
procured both within and outside of the Philippines. Raw material prices are affected by a
number of factors, including but not limited to changes in the global or regional levels of
supply and demand, weather conditions, customs and import duties and government controls.
In particular, CNPF‘s primary tuna production operations are affected by the availability and
price of tuna, which is a key raw material for its canned and processed fish segment and its
tuna export segment. To ensure the sustainability of the global tuna population, various
government authorities worldwide have implemented a number of regulations, includingrestrictions on fishing capacity and prohibiting the use of certain fishing methods during
certain times of the year. Such governmental regulations have impacted the global supply of
tuna, which in turn impacts tuna prices. Tuna prices have increased in recent years from an
average price of US$1,526 per ton in 2011 to US$1,954 per ton in 2012. Similarly, the
Philippine Bureau of Fisheries and Aquatic Resources imposes a three month ban on sardines
fishing from the beginning of December to the end of February as part of an effort to ensure a
sustainable domestic sardines population and to encourage responsible production of canned
sardines. The sardines fishing ban limits domestic sardines supply during the three-month
period and domestic canned sardines producers resort to alternative sources such as higher
cost imported sardines. The prices of other raw materials used in CNPF‘s principal
businesses, including tin cans, meat and milk powder, have also fluctuated from time to time.

7/21/2019 PreliminaryProspectus - Century
http://slidepdf.com/reader/full/preliminaryprospectus-century 52/648
Although CNPF actively monitors the availability and prices of raw materials, there can be no
assurance that raw materials will be supplied in adequate quantities or at the required quality
to meet CNPF‘s production requirements, or that these raw materials will not be subject to
significant price fluctuations in the future. CNPF may only have a limited ability to hedge
against commodity prices and any hedging activities may not be as effective as planned.Moreover, market prices of raw materials could increase significantly and there is no
assurance that such increases can be passed on to the consumers. Any significant shortages or
material increase in the market price of key raw materials could have a material adverse effect
on CNPF‘s business, financial condition and results of operations.
Aside from actively monitoring raw materials availability and prices, it has been CNPF‘s
policy to maintain a network of specialty ingredient suppliers that develop new ingredient
substitutes to mitigate raw materials disruption of supply.
CNPF’s sales growth depends on successful introduction of new products and new
product extensions, which is subject to consumer preference and other market factors at
the time of introduction.
Competitive pressure requires CNPF to regularly introduce new products and product
extensions in order to maintain its market share. CNPF may suffer a decrease in sales if its
product portfolio does not track new dietary trends and other consumer sentiments, or
compete effectively with the pricing and product offerings of its competitors. However,
launching new products and product extensions requires significant capital expenditures to
cover advertising and promotional costs, research and development initiatives, and other
operating costs associated with the production and introduction of such products. CNPF‘s
financial condition and results of operation may be materially and adversely affected if any
product launches are unsuccessful.
The success of new products and product extensions depend on various factors, including the
availability of discretionary income, which may be tied to prices of other consumer goods, as
well as varying consumption preferences in different geographic regions. In addition, the
success of CNPF‘s new products and new product extensions may be affected by competitors‘
activities. The timing of product launches, pricing and advertising efforts of competitors may
also impact CNPF‘s sales of new products. In the past, CNPF has introduced new products
and product extensions which were unsuccessful and there can be no guarantee that CNPF
will be able to introduce new products successfully in the future. If CNPF cannot successfully
introduce new products and new product extensions, its business, financial condition and
results of operations may be materially and adversely affected.
CNPF, its independent advisers, and experienced marketers continuously conduct extensiveconsumer and product research to increase the likelihood of successful product launches.
Actual or alleged contamination or deterioration of, or safety concerns about, CNPF’s
food products or similar products produced by third parties could give rise to product
liability claims and harm CNPF’s reputation.
CNPF‘s success depends largely upon consumers‘ perception of the quality of its products,
and CNPF‘s business could be adversely affected by the actual or alleged contamination or
deterioration of its products, or of similar products produced by third parties. A risk of
contamination or deterioration of CNPF‘s food products exists at each stage of the production
cycle, including the purchase and delivery of perishable raw materials, the processing and
packaging of food products, the stocking and delivery of the finished products to customers,
and the storage and display of finished products at the points of final sale. In particular, CNPF

7/21/2019 PreliminaryProspectus - Century
http://slidepdf.com/reader/full/preliminaryprospectus-century 53/648
has little, if any, control over handling procedures once its products have been dispatched for
distribution and is, therefore, particularly vulnerable to problems in this phase. Even an
inadvertent distribution of contaminated products may constitute a violation of law and may
lead to increased risk of exposure to product liability claims, product recalls, increased
scrutiny and penalties, including injunctive relief and plant closures by regulatory authorities,as well as adverse publicity, which could exacerbate the associated negative consumer
reaction. In addition, reports or allegations of inadequate quality control with respect to
similar food products produced by other manufacturers may negatively affect the sales of
CNPF‘s products.
If CNPF‘s food products are found, or alleged, to have suffered contamination or
deterioration, regardless of whether such products were under its control, such problems
could harm the reputation of CNPF‘s products and/or increase regulatory scrutiny, and could
have a significant impact on the sales of CNPF‘s products. While no material product liability
claim has been filed against CNPF, any such product liability claim, whether or not
successful, could damage the reputation of CNPF and its products, which may have a material
adverse effect on CNPF‘s business, financial condition and results of operations.
CNPF invests in quality control systems, procedures and organization that span the entire
supply chain to ensure product safety. All of CNPF‘s manufacturing facilities comply with
BFAD regulations and a significant majority of CNPF‘s products are manufactured from
factories that are compliant with HACCP regulations. HACCP is an internationally
recognized system of food safety and contamination prevention.
Competition in CNPF’s businesses may adversely affect its financial condition and
results of operations.
CNPF faces competition in all segments of its businesses, both in the Philippine market and in
the international markets in which it operates. The Philippine food industry in general is
highly competitive. Although the degree of competition and principal competitive factors
vary among the different product categories in which CNPF participates, CNPF believes that
key competitive factors include price, product quality, brand awareness and loyalty,
distribution network, foreign competition, proximity of distribution outlets to customers,
product extensions (such as different flavors and packaging) and the introduction of new
products.
In the Philippines, CNPF‘s competitors consist primarily of other large domestic corporations
and, in certain cases, large multinational corporations. Competition in the Philippines is
expected to increase due to the emergence of new domestic food companies and the potential
entry of major foreign food companies. Certain of CNPF‘s international and domesticcompetitors may have substantially greater financial resources than CNPF. CNPF‘s tuna
export segment also faces competition overseas from both domestic and international
companies. CNPF may not be able to compete effectively against its competitors, which could
have a material adverse impact on its business, financial condition and results of operations.
Despite being the leading player in their respective product categories, CNPF works toward
continuously improving its products and processes to stay competitive.
CNPF relies on the strength of its brands.
CNPF is dependent on the strength of its brands and the continued success and growth of its
business depend upon CNPF‘s ability to protect and promote its brands through marketingand promotional efforts. If its marketing or advertising campaigns failed or were deemed to

7/21/2019 PreliminaryProspectus - Century
http://slidepdf.com/reader/full/preliminaryprospectus-century 54/648
be inappropriate, the goodwill built over the years by its respective brands, as well as its
business reputation, may be negatively affected. If CNPF fails to successfully protect and
promote its brands, the market perception of its products may deteriorate which may have a
material adverse effect on CNPF‘s business, financial condition, results of operations and
prospects.
CNPF has a dedicated team of marketing professionals working closely with highly
competent advertising and research agencies to safeguard and enhance the Company‘s brands.
This team follows established guidelines to ensure consistency and effectiveness of
positioning and message. CNPF has received numerous marketing awards and industry
citations.
Consolidation of distribution channels in the Philippines may adversely affect CNPF’s
financial condition and results of operations.
The Philippine retail market has historically been highly fragmented among numerous small
neighborhood stores, groceries and traditional wet markets. Small neighborhood storesservice limited geographical areas and purchase relatively small quantities of CNPF‘s
products from distributors and larger supermarkets. In recent years, larger supermarket chains
and wholesale retailers have begun to gain significant market share in the Philippines.
In 2012, based on data from AC Nielsen, supermarkets were a significant distribution channel
for CNPF products, accounting for aggregate distribution of approximately 50% of canned
tuna, 32% of canned sardines, 54% of canned corned meat, 58% of canned luncheon meat,
48% of condensed and evaporated milk and 79% of full cream powdered milk sold by CNPF
during the year. See ― Business – Marketing and Distribution‖. There is a risk that CNPF‘s
business may become concentrated in fewer, larger customers, which could increase the
relative bargaining power of these customers. There is no assurance that supermarkets or one
of these larger customers will not exert downward pressure on wholesale prices of CNPF‘s
products, which could have a material adverse effect CNPF‘s business, financial condition
and results of operations.
CNPF fosters collaborative relationships with trade partners. The Company‘s scale, portfolio
of strong brands and years of relationship building allow it to have constructive and fair
agreements with customers on levels of trade investments.
CNPF relies on key suppliers for certain raw materials and the failure by such suppliers
to adhere to and perform contractual obligations may adversely affect CNPF’s business
and results of operations.
CNPF relies on key suppliers for certain raw materials. For example, CNPF purchases a
significant portion of its tin can requirements from third-party suppliers. In particular, for the
period ended December 31, 2013, CNPF sourced approximately 65% of its total tin can
requirements from a single supplier. If one or more of CNPF‘s suppliers fail to provide raw
materials in sufficient quantities or at satisfactory quality levels, CNPF‘s raw materi al supply
and production process could be negatively impacted. CNPF would be required to meet any
consequent supply shortfall through other suppliers whose prices may be higher than those of
CNPF‘s original suppliers. In addition, there can be no guarantee that CNPF would be able to
obtain the services of alternative suppliers or otherwise meet any consequent supply shortfall
in a timely manner or at all, which could have a material adverse impact on CNPF‘s business,
financial condition and results of operations.

7/21/2019 PreliminaryProspectus - Century
http://slidepdf.com/reader/full/preliminaryprospectus-century 55/648
CNPF has a policy of maintaining a sufficient inventory of key materials. In addition, the
Company maintains a network of suppliers for most critical materials to allow for sourcing
flexibility.
CNPF has a limited history as a separate entity.
Although CNPF‘s businesses have been established for some time, CNPF was incorporated
only on October 25, 2013. CNPF acquired its subsidiaries and businesses as part of the
corporate restructuring of certain of the Century Group‘s business interests. In this r egard,
CNPF faces a number of risks, uncertainties and challenges relating to its ability to integrate
its various operations, develop and successfully execute its overall business strategy, retain
qualified senior management and employees and develop its own administrative and other
supporting infrastructure to replace some of the services which CCC currently provides to
CNPF‘s business segments. Failure to successfully integrate its various business operations or
develop its administrative infrastructure could have a material adverse impact on CNPF‘s
business, financial condition and results of operations.
In addition, the pro forma consolidated financial information of CNPF for the year 2013
included elsewhere in this Prospectus are not necessarily indicative of the operating results or
financial position that would have been achieved had the corporate restructuring been
completed prior to such periods. See ― – Risks relating to presentation of information in this
Prospectus – The pro forma financial information included herein may not be indicative of
actual results‖ for further information.
Although CNPF is a new entity, it has been fully operational as an ongoing business effective
January 1, 2014 as CNPF merely took over existing facilities, employees and operations;
hence, there was no disruption in operations.
CNPF generally does not have long-term contracts with its customers, and it is subject
to uncertainties and variability in demand and product mix.
As is common in the consumer goods business, CNPF does not have long-term contracts with
its customers and, consequently, its revenues are subject to short-term variability resulting
from the seasonality of, and other fluctuations in, demand for its products. CNPF‘s customers
have no obligation to place new orders with it following the expiration of their current
obligations, and may cancel, reduce or delay orders for a variety of reasons. The level and
timing of orders placed by CNPF‘s customers may vary due to a number of factors including:
seasonality and other fluctuations in demand for CNPF‘s products;
the competitiveness of CNPF‘s selling prices in the industry; customer satisfaction with the level of service CNPF provides; and
customers‘ inventory management.
CNPF has not experienced significant cancellations of, and reductions and delays in, its
customers‘ orders in the past.
CNPF maintains good and mutually beneficial relationships with its customers by providing
reasonable terms of sale and payment and ensuring that customers‘ needs are addressed in a
timely manner.
CNPF is exposed to the credit risks of its customers, and delays or defaults in payment
by its customers could have a material adverse effect on CNPF’s financial condition,
results of operations and liquidity.
7/21/2019 PreliminaryProspectus - Century
http://slidepdf.com/reader/full/preliminaryprospectus-century 56/648
CNPF is exposed to the credit risk of its customers, and defaults on material payments owed
to CNPF by customers could significantly reduce CNPF‘s operating cash flows and liquidity,
as well as have a material adverse effect on its financial condition and results of operations.
Some of CNPF‘s customers could also experience cash flow difficulties or become subject toliquidation, which could in turn lead to CNPF being unable to collect payments or
experiencing long delays in collection.
CNPF‘s account receivables are typically non-interest bearing and are generally on 30-day
terms. As at December 31, 2013, over 83% of the account receivables of CNPF were due
within 30 days. There is no assurance that CNPF‘s exposure to the risk of delayed payments
from its customers or defaults in payment by its customers will not increase, or that it will not
experience losses or cash flow constraints as a result, which could have a material adverse
impact on its business, financial condition and results of operations.
Before extending credit, CNPF conducts a systematic credit investigation of its customers.
The Company also has a policy of requiring security or collateral, in the form of bankguarantees and letters of credit, from certain customers.
Any infringement or failure to protect CNPF’s trademarks and proprietary rights could
materially and adversely affect its business.
CNPF is a licensee of various brand names, related trademarks and other intellectual property
rights to prepare, package, advertise, distribute and sell its products, including Century Tuna,
555 Sardines, Century Quality, Blue Bay Tuna, Fresca, Argentina, 555 Carne Norte, Swift ,
Wow, Lucky 7 , Shanghai, Angel , Kaffe de Oro, Birch Tree and Home Pride. Maintaining the
licenses for and protection of these brands and intellectual property rights is important to
maintaining CNPF‘s distinctive corporate and market identities. If third parties sell productsthat use counterfeit versions of CNPF‘s brands or otherwise look like CNPF brands,
consumers may confuse CNPF products with products that are inferior. This could negatively
impact CNPF‘s brand image and sales. Any failure to protect CNPF‘s proprietary rights may
significantly harm CNPF‘s competitive position, which, in turn, could materially and
adversely affect CNPF‘s business, financial condition, results of operations and prospects, as
well as CNPF‘s reputation.
CNPF‘s licensed brands are registered and kept current in all applicable jurisdictions. While
instances of trademark infringement have been immaterial in the past, the Company will not
hesitate to prosecute any cases of trademark infringement in the future.
CNPF’s strategy of growth, including acquisitions, entering new product categories andinternational expansion, may not always be successful or may entail significant costs,
which could adversely affect its business, financial condition and results of operations.
As part of its expansion plans, CNPF intends to evaluate acquisition opportunities in the
Philippines and internationally and may make any such acquisitions in the future if suitable
opportunities arise. This may require significant investments which may not result in
favorable returns. Acquisitions involve risks associated with unforeseen contingent risks or
latent liabilities relating to these businesses that may only become apparent after the
acquisition is finalized, such as difficulties associated with integration and management of
operations and systems, integration and retention of key personnel, co-ordination of sales and
marketing efforts and diversion of management‘s attention from other ongoing business
concerns. CNPF‘s growth will depend on its ability to manage successfully the expansion of
its operations and integrate the operations of acquired businesses. There can be no assurance

7/21/2019 PreliminaryProspectus - Century
http://slidepdf.com/reader/full/preliminaryprospectus-century 57/648
that any such expansion or acquisition will be a success, or that it would not present any of
the challenges described in ― — CNPF’s international operations may present operating,
financial and legal challenges, particularly in countries where CNPF has little or no
experience‖ below. If CNPF‘s growth strategy, including any third party acquisitions, is
unsuccessful, its business, financial condition and results of operations may be materially andadversely affected.
Over the past 15 years, CNPF has acquired and successfully integrated brands such as Blue
Bay, Birch Tree, Swift , Home Pride and Kaffe de Oro into its businesses. CNPF‘s acquisition
process involves extensive due diligence, assessment of the Company‘s ability to profitably
operate and generate a return on the price paid, as well as an evaluation of the Company‘s
ability to fund the acquisition.
CNPF also intends to expand production and distribution of its product categories
internationally. CNPF may experience losses in the expansion of its international operations if
it is unable to successfully introduce products which appeal to local customers‘ preferences
and establish relationships with reliable distributors, sales agents and wholesalers. In addition,CNPF may be subject to higher operating costs and price constraints in overseas markets such
as China and Vietnam where CNPF has affiliate offices, which may have an adverse effect on
its operating income and profitability.
To minimize exposure and capital outlay for international expansion, CNPF initially appoints
distributors in newly entered markets. Where no suitable distributor can be appointed, the
Company may establish a sales office. Production facilities in a new territory will be
established only when a critical mass of business is already reasonably assured.
CNPF may be subject to labor unrest, slowdowns and increased wage costs.
CNPF is subject to a variety of national and local laws and regulations, including those
relating to labor. CNPF has in the past, and may in the future, be required to defend against
labor claims. While CNPF has not experienced significant labor disruptions or disputes in the
past and CNPF generally considers its labor relations to be good, there can be no assurance
that it will not experience future disruptions to its operations due to disputes or other issues
with its employees. In addition, any changes in labor laws and regulations could result in
CNPF having to incur substantial additional costs to comply with increased minimum wage
and other labor laws. Any of these events may materially and adversely affect CNPF‘s
business, financial condition and results of operations.
CNPF manages these risks by adopting policies to ensure a healthy working environment for
its employees that are at minimum in compliance with national and local laws and regulations.
CNPF is effectively controlled by the Po family and their interests may differ from the
interests of other shareholders.
As of the date of this Prospectus, the Po family beneficially owns approximately 100% of the
issued share capital of CCC, which beneficially owns approximately 100% of the issued share
capital of CNPF. CCC‘s ownership of the issued share capital of CNPF would decrease to
89.7% upon consummation of the Offer. Members of the Po family also serve as CNPF‘s
directors and executive officers. As a result, the Po family effectively controls CNPF,
including CNPF‘s management, policies and business, through its ability to control actions
that require majority shareholder approval and through its representatives on CNPF‘s Board.
Furthermore, this concentration of voting power may discourage or prevent a change in

7/21/2019 PreliminaryProspectus - Century
http://slidepdf.com/reader/full/preliminaryprospectus-century 58/648
control or other business combinations, which could deprive investors of an opportunity to
receive a premium for the Common Shares as part of a sale of CNPF.
Members of the Po family, who either individually or collectively have controlled CNPF
since its inception, have private interests in a number of companies either alone or together
with other family members. The respective businesses or activities of these companies and of
companies that are part of the Century Group engage in certain business activities which
compete with those of CNPF. There is nothing to prevent companies that are controlled by the
Po family from engaging in activities that compete directly with CNPF‘s businesses. There
can also be no assurance that the Po family will not take advantage of business opportunities
that may otherwise be attractive to CNPF. The interests of the Po family and CCC, as CNPF‘s
controlling shareholders, may differ significantly from CNPF‘s interests or the interests of
other shareholders, and there can be no assurance that the Po family and CCC will exercise
influence over CNPF in a manner that is in the best interests of CNPF‘s other shareholders.
CNPF has significant commercial transactions with certain companies in the Century Group.
See ― Related Party Transactions‖. CNPF expects that it will continue to enter intotransactions with companies directly or indirectly controlled by or associated with CCC and
the Po family. These transactions may involve potential conflicts of interest which could be
detrimental to CNPF and/or its shareholders. There can be no assurance that CNPF‘s related
party transactions will not have a material adverse impact on its business, financial condition
and results of operations.
CNPF has adopted a Manual of Corporate Governance that to ensure that its business,
including related party transactions, are conducted with transparency and to protect minority
investors.
CNPF’s international sales may present operating, financial and legal challenges,
particularly in countries where CNPF has little or no experience.
CNPF currently sells its products through affiliate offices in China and Vietnam, and it
intends to further expand sales in these regions. These international operations, particularly in
countries where CNPF has little or no experience, may be subject to inherent risks including
uncertain legal environments, different consumer preferences, unexpected or difficult
regulatory, licensing or administration requirements, tariffs and other trade barriers,
difficulties in training and retraining staff and managing foreign operations, potentially
adverse tax consequences and difficulties in transferring earnings to CNPF‘s operations in t he
Philippines.
In addition, CNPF‘s international sales of products will be influenced, to a significant degree, by political, economic and social developments in the countries in which it operates. CNPF is
subject to the risks inherent in conducting business across national boundaries, any one of
which could adversely affect its business. These risks include but are not limited to:
general economic downturns;
currency exchange rate fluctuations or imposition of foreign exchange
controls;
governmental policies, laws or regulations, including increased protectionism
affecting import and export duties and quotas or customs and tariffs;
uncertainty regarding, or different levels of, protection of CNPF‘s intellectual
property;

7/21/2019 PreliminaryProspectus - Century
http://slidepdf.com/reader/full/preliminaryprospectus-century 59/648
international incidents, including war or acts of terrorism;
government instability; and
nationalization of assets.
Any adverse economic, political or social developments in the countries in which CNPF sells
its products could adversely affect its business, financial condition and results of operations.
While the Company has customers across North America, Europe, Asia, Australia, and the
Middle East, the Company‘s largest customers by volume are in developed and stable
economies of these regions.
CNPF’s existing insurance policies and self -insurance measures may not be sufficient to
cover the full extent of any losses.
CNPF may not be fully insured against, and insurance may not be available for, losses caused
by accidents, natural disasters, breakdowns or other events that could affect the facilities and processes used by its businesses. For example, CNPF does not carry business interruption
insurance and self-insures against this risk. Any losses caused by events against which it is
not fully insured could result in a decline in production, adverse publicity, and significant
expenditure of resources to address such losses, and would have a material and adverse effect
on its business, financial condition and results of operations.
Any accident at CNPF‘s operations and facilities could result in significant losses. It could
suffer a decline in production, receive adverse publicity and be forced to invest significant
resources in addressing such losses, both in terms of time and money. There is no assurance
that there will not be work-related or other accidents in the future. Furthermore, there is no
assurance that amicable settlements will be secured in the event of accidents or that accidents
will not result in litigation or regulatory action against CNPF. Such events could materially
and adversely affect its financial condition and results of operations.
CNPF conducts a quarterly review to ensure that all insurable assets of the Company are
adequately covered at the right valuation.
CNPF’s businesses and operations are substantially dependent upon key executives.
CNPF has relied and will continue to rely significantly on the continued individual and
collective contributions of its senior management team. Some members of CNPF‘s
management are leaders or members of certain key industry associations in the Philippines,
and CNPF believes it benefits from those relationships and expertise. If any of CNPF‘s seniormanagement are unable or unwilling to continue in their present positions, or if they join a
competitor or form a competing business, CNPF may not be able to replace them easily, and
its business, financial condition, results of operations and prospects could be materially and
adversely affected.
To mitigate the risk of departing key managers, the Company‘s succession planning process
has identified members of management that can temporarily assume additional
responsibilities arising from departing managers until suitable successors can be recruited.
Problems may develop among partners of joint ventures operated by CNPF, which may
result in disruptions to these businesses.

7/21/2019 PreliminaryProspectus - Century
http://slidepdf.com/reader/full/preliminaryprospectus-century 60/648
The businesses of some of CNPF‘s subsidiaries and associates are conducted through joint
ventures of CCC, such as Century International (China) Company Limited and Century
Shanghai Trading Company, joint ventures between CCC and Thai Union Manufacturing
Company, Ltd.
Cooperation among the joint venture partners on business decisions is crucial to the sound
operation and financial success of these joint venture companies. Although CNPF believes it
good relationships are maintained with joint venture partners and there have been no instance
of major disagreements or defaults by either party on their obligations, there is no assurance
that these relationships will be sustained in the future or that problems will not develop.
CNPF hopes to mitigate this risk by conducting extensive due diligence on all prospective
business partners, fostering collaborative relationships, and ensuring that these business
partners have the same values and objectives as the Company‘s.
RISKS RELATING TO THE PHILIPPINES
The substantial majority of CNPF’s income is derived from sales in the Philippines and,
therefore, a slowdown in economic growth in the Philippines could materially adversely
affect CNPF’s financial condition and results of operation.
In the year ended December 31, 2013, CNPF‘s operations in the Philippines accounted for
69% of its net sales. Historically, results of operations have been influenced, and will
continue to be influenced, to a significant degree by the general state of the Philippine
economy. Much of the demand for CNPF‘s core product categories are directly linked to the
purchasing power of Filipino consumers and demand for these products tends to decline
during economic downturns when consumers‘ disposable incomes decline. As a result,
CNPF‘s income and results of operations depend, to a significant extent, on the performance
of the Philippine economy. In the past, the Philippines has experienced periods of slow or
negative growth, high inflation, significant devaluation of the peso and the imposition of
exchange controls.
For the year ended December 31, 2013, Philippine GDP growth rate accelerated to 7.2%,
compared to growth rate of 6.8% in the year ended December 31, 2012, and GNP growth rate
accelerated to 7.5% in the year ended December 31, 2013, from 6.5% in year ended
December 31, 2012. Any deterioration in the economic conditions in the Philippines may
adversely affect consumer sentiment and lead to a reduction in demand for CNPF‘s products.
There can be no assurance that current or future Governments will adopt economic policies
conducive to sustaining economic growth.
A decline in the value of the Peso against the U.S. dollar and other currencies would
increase many of CNPF’s costs.
CNPF has foreign exchange exposure primarily associated with fluctuations in the value of
the Peso against the U.S. dollar and other foreign currencies. The substantial majority of
CNPF‘s revenues are denominated in Pesos, while certain of its expenses, particularly its raw
material costs, are denominated in U.S. dollars or based on prices determined in U.S. dollars.
On the other hand,
Any future depreciation of the Peso against the U.S. dollar could adversely affect CNPF‘s
business, financial condition and results of operations.

7/21/2019 PreliminaryProspectus - Century
http://slidepdf.com/reader/full/preliminaryprospectus-century 61/648
While Peso devaluation has a negative impact on imported materials, it positively impacts the
Company‘s export business and increases the purchasing power of Overseas Filipino Workers
(―OFW‖) families.
Any political instability or acts of terrorism in the Philippines may adversely affect
CNPF.
The Philippines has from time to time experienced political and military instability and acts of
terrorism. In the last few years, there has been political instability in the Philippines, including
impeachment proceedings against two former presidents and the chief justice of the Supreme
Court of the Philippines, public and military protests arising from alleged misconduct by
previous administrations. In addition, there is no guarantee that acts of election-related
violence will not occur in the future and such events could negatively impact the Philippine
economy. The Philippines has also been subject to a number of terrorist attacks since 2000.
The Philippine army has been in conflict with the Abu Sayyaf organization which has been
identified as being responsible for kidnapping and terrorist activities in the Philippines. An
unstable political environment, whether due to the imposition of emergency executive rule,martial law or widespread popular demonstrations or rioting, could negatively affect the
general economic conditions and operating environment in the Philippines, which could have
a material adverse effect on CNPF‘s business, financial condition and results of operations.
RISKS RELATING TO THE OFFER AND THE OFFER SHARES
The Offer Shares may not be a suitable investment for all investors.
Each prospective investor in the Offer Shares must determine the suitability of that
investment in light of its own circumstances. In particular, each prospective investor should:
have sufficient knowledge and experience to make a meaningful evaluation of theCompany and its businesses, the merits and risks of investing in the Offer Shares and
the information contained in this Prospectus;
have access to, and knowledge of, appropriate analytical tools to evaluate, in the
context of its particular financial situation, an investment in the Offer Shares and the
impact the Offer Shares will have on its overall investment portfolio;
have sufficient financial resources and liquidity to bear all the risks of an investment
in the Offer Shares, including where the currency for purchasing and receiving
dividends on the Offer Shares is different from the potential investor‘s currency;
understand and be familiar with the behavior of any relevant financial markets; and
be able to evaluate (either alone or with the help of a financial advisor) possible
scenarios for economic, interest rate and other factors that may affect its investment
in the Offer Shares and its ability to bear the applicable risks.
There can be no guarantee that the Offer Shares will be listed on the PSE.
Purchasers of Offer Shares will be required to pay for such Offer Shares on the Offer
Settlement Date, which is expected to be on or about May 6, 2014. Because the Listing Date
is scheduled to occur after both the Offer Settlement Date, there can be no guarantee that
listing will occur on the anticipated Listing Date or at all. Delays in the admission and thecommencement of trading in shares on the PSE have occurred in the past. If the PSE does not

7/21/2019 PreliminaryProspectus - Century
http://slidepdf.com/reader/full/preliminaryprospectus-century 62/648
admit the Offer Shares onto the PSE, the market for the Offer Shares will be illiquid and
shareholders may not be able to trade the Offer Shares. This may materially and adversely
affect the value of the Offer Shares.
There has been no prior market for the Common Shares, so there may be no liquidity in
the market for the Offer Shares and the price of the Offer Shares may fall.
As there has been no prior trading in the Common Shares, there can be no assurance that an
active market for the Offer Shares will develop following the Offer or, if developed, that such
market will be sustained.
The Offer Price has been determined after taking into consideration a number of factors
including, but not limited to, the Company‘s prospects, the market prices for shares of
companies engaged in related businesses similar to the Company‘s and prevailing market
conditions. The price at which the Common Shares will trade on the PSE at any point in time
after the Offer may vary significantly from the Offer Price.
The market price of the Common Shares may be volatile, which could cause the value of
investors’ investments in the Company to decline.
The market price of securities can and does fluctuate, and it is impossible to predict whether
the price of the Common Shares will rise or fall or even lose all of its value. The market price
of Common Shares could be affected by several factors, including:
general market, political and economic conditions;
changes in earnings estimates and recommendations by financial analysts;
changes in market valuations of listed shares in general and other retail shares in
particular;
the market value of the assets of the Company;
changes to Government policy, legislation or regulations; and
general operational and business risks.
In addition, many of the risks described elsewhere in this Prospectus could materially and
adversely affect the market price of the Common Shares.
In part as a result of the global economic downturn, the global equity markets have
experienced price and volume volatility that has affected the share prices of many companies.
Share prices for many companies have experienced wide fluctuations that have often beenunrelated to the operating performance of those companies. Fluctuations such as these may
adversely affect the market price of the Common Shares.
Future sales of Common Shares in the public market could adversely affect the
prevailing market price of the Common Shares and Shareholders may experience
dilution in their holdings.
In order to finance the ex pansion of the Company‘s business and operations, the Board will
consider the funding options available to them at the time, which may include the sale of
additional Common Shares from the treasury or the issuance of new Common Shares. If
additional funds are raised through the sale or issuance of new equity or equity-linked
securities by the Company other than on a pro rata basis to existing shareholders, the
percentage ownership of the shareholders may be reduced, shareholders may experience

7/21/2019 PreliminaryProspectus - Century
http://slidepdf.com/reader/full/preliminaryprospectus-century 63/648
subsequent dilution and/or such securities may have rights, preferences and privileges senior
to those of the Offer Shares. Further, the market price of the Common Shares could decline as
a result of future sales of substantial amounts of Common Shares in the public market or the
issuance of new Common Shares, or the perception that such sales, transfers or issuances may
occur. This could also materially and adversely affect the prevailing market price of theCommon Shares or the Company‘s ability to raise capital in the future at a time and at a price
it deems appropriate.
Investors may incur immediate and substantial dilution as a result of purchasing Offer
Shares.
The issue price of the Common Shares in the Offer may be substantially higher than the net
tangible book value of net assets per share of the Company‘s outstanding Common Shares.
Therefore, purchasers of Offer Shares may experience immediate and substantial dilution and
the Company‘s existing shareholders may experience a material increase in the net tangib le
book value of net assets per share of the Common Shares they own. See ― Dilution‖.
The Company may be unable to pay dividends on the Common Shares.
There is no assurance that the Company can or will declare dividends on the Common Shares
in the future. Future dividends, if any, will be at the discretion of the Board and will depend
upon the Company‘s future results of operations and general financial condition, capital
requirements, its ability to receive dividends and other distributions and payments from its
subsidiaries, foreign exchange rates, legal, regulatory and contractual restrictions, loan
obligations and loan covenants, including loan obligations and loan covenants of its
subsidiaries, and other factors the Board may deem relevant. See ― Dividends and Dividend
Policy‖.
RISKS RELATING TO THE PRESENTATION OF INFORMATION IN THIS
PROSPECTUS
The Prospectus contains forward-looking statements that are, by their nature, subject to
significant risks and uncertainties.
These forward-looking statements include, without limitation, statements relating to known
and unknown risks; uncertainties and other factors that may cause the Company‘s actual
results, performance or achievements to be materially different from expected future results;
and performance or achievements expressed or implied by forward-looking statements.
Such forward-looking statements are based on numerous assumptions regarding theCompany‘s present and future business strategies and the environment in which the Company
will operate in the future. Important factors that could cause actual results, performance or
achievements to differ materially from those in the forward-looking statements include,
among other things, the Company‘s ability to successfully implement its current and future
strategies, the Company‘s ability to anticipate and respond to local and regional trends, and
the Company‘s ability to successfully manage its future business, financial condition, results
of operations and cash flow.
The pro forma financial information included herein may not be indicative of actual
results.
The Company has included, examined and reviewed pro forma consolidated financial
information elsewhere in this Prospectus because it believes that such information is

7/21/2019 PreliminaryProspectus - Century
http://slidepdf.com/reader/full/preliminaryprospectus-century 64/648
important to an investor‘s understanding of the Company‘s expected presentation of its results
of operations after the consolidation of GTC and SMDC and the Company‘s acquisition of
certain assets of CCC, PMCI and CSC. The pro forma consolidated results of operations
included herein are necessarily based on certain assumptions, including those identified in the
notes to the pro forma consolidated financial statements, and such information is notnecessarily indicative of the operating results that would have been achieved had the
acquisition of these assets been completed prior to such periods, nor is it indicative of future
operating results, and should not be relied upon as being so indicative. The Company‘s pro
forma statements should also be read in conjunction with the historical performance of its
wholly owned subsidiaries, GTC and SMDC, as well as information on the Company‘s track
record of building brands into household names, solid management experience, and dominant
market shares – all of which can be found in other parts of this Prospectus.
Certain information contained herein is derived from unofficial publications.
Certain information in this Prospectus relating to the Philippines and the industries in which
the Company competes, including statistics relating to market size, is derived from variousGovernment and private publications. This Prospectus also contains industry information
based on publicly available third-party sources. Industry publications generally state that theinformation they contain has been obtained from sources believed to be reliable but that theaccuracy and completeness of that information is not guaranteed. Similarly, industry forecastsand market research, including those contained or extracted herein, have not beenindependently verified by the Company and may not be accurate, complete, up-to-date orconsistent with other information compiled within or outside the Philippines. Prospectiveinvestors are cautioned accordingly.
The section of this Prospectus entitled “Industry ” was not independently verified by the
Company or the Joint Lead Underwriters, and the sources therein may not be
completely independent or independent at all.
The section of this Prospectus entitled ― Industry‖ was prepared from available public sourcesto provide an overview of the industries in which the Company‘s businesses operate, in
particular the canned and processed fish and meat industries and the dairy industry. Thereports cited in this section were not prepared nor independently verified by the Company orthe Joint Lead Underwriters, or any of their respective affiliates or advisors. The informationcontained in this section may not be consistent with other information regarding thePhilippine canned and processed fish and meat industries and the dairy industry. This sectiondoes not present the opinions of the Company, the Joint Lead Underwriters or any of theirrespective affiliates. Much of the information set out in this section is based on estimates,
judgments, opinions and beliefs of the named sources therein and should be regarded asindicative only and treated with the appropriate caution.

7/21/2019 PreliminaryProspectus - Century
http://slidepdf.com/reader/full/preliminaryprospectus-century 65/648
USE OF PROCEEDS
The Company intends to use the net proceeds from the Offer for the payment of financialobligations, capital expenditures to increase production capacity and cost efficiency, workingcapital and/or potential acquisitions. Further details on the proposed use of proceeds are setforth below:
Use of Proceeds
Estimated
Amounts Percentage Estimated Timing
(₱ millions)
Payment of Financial Obligations 1,290 42.3% 2nd Quarter 2014
Capital Expenditures to Increase
Production Capacity and Cost Efficiency
729 23.9% 2nd Quarter 2014
Tin Can Manufacturing Factory 457.6
Dairy and Mix Factory 132.0
Plant Improvement and Maintenance 106.5
Upgrade of IT Systems 32.9
Working Capital and/or Potential
Acquisitions
1,032.5 33.8% 2014 to 1st Quarter 2015
Estimated Net Proceeds ........ ........ ......... .... 3,051.5 100.0%
Working Capital Requirements and/or Potential Acquisitions
The Company expects a need for additional Working Capital as more investments in accountsreceivable – trade and inventory assets are seen necessary as a result of an anticipatedupswing in sales and market share, given the Company‘s intensified marketing and salesinitiatives for its canned tuna, canned sardine, canned meat, and dairy and mixes businesses.
The Company also has a strong track record of expanding product offerings throughsuccessful acquisitions of strong but undervalued local brands. The Company remains open tosimilar opportunistic brand acquisitions, including entering into new segments and unlockingmarket potentials of regional brands. The Company likewise expects to use a portion of thenet proceeds from the Offer for the potential acquisition of new brands and/or branded food
companies to penetrate new market segments. However, as of date, the Company has neitherdefinitively identified the targeted brands and/or branded food companies nor negotiated anyterms for acquisition with anybody.
Capital Expenditures
The Company will use a portion the net proceeds to fund capital expenditures that willimprove cost efficiencies and achieve higher profitability in the future. A major project in thelist of capital expenditure projects is the establishment of a tin can factory in General SantosCity that will effectively reduce the tin can costs for the Company‘s domestic canned tuna
production. The tin can factory's building costs ₱98 million, machinery and major equipmentcost ₱303.6 million, and lab and other miscellaneous equipment ₱56 million. The new facility
is planned to have an output capacity of at least two million tin cans a year, supplying
7/21/2019 PreliminaryProspectus - Century
http://slidepdf.com/reader/full/preliminaryprospectus-century 66/648
between 25% to 30% of the company‘s tin can requirements, and is expected to be completed
and commercially operational by end of 2014.
The funds will also be used to complete the Company‘s new dairy and mixes plant facilitylocated in Taguig City. The completion of building will cost ₱52 million. Various equipmentsuch as mixing tanks, homogenizer, quality assurance and laboratory equipment will cost ₱80million. The completion of this new facility is expected to further increase dairy productionfrom 5,500 cases per day to 11,000 cases per day.
The third major capital expenditure project would be the enhancement of the Company‘s ITsystem. The Company plans to invest in (i) a demand planning software to improve theCompany‘s demand planning and forecasting and supply replenishment ca pabilities and (ii)cloud hosting, disaster recovery and application management services to save on hardwareinvestments and maintenance expenses, ensure business continuity, and enhance IT datasecurity. These IT projects would enable the Company‘s management to focus on furthergrowing the business.
The rest of the Company‘s capital expenditures consist of various equipment replacementsand maintenance projects needed by the Company‘s business units to sustain their respective
plant capacities, efficiencies in manufacturing operations, and product quality standards.Examples of these projects are coal-fired boiler equipment overhaul, steamer equipmentoverhaul, fishmeal building and warehouse repair, and fishmeal decanter equipmentreplacement, labeling and packaging equipment replacement, and replacement of sludge
pump for waste water treatment, among others.
Payments of Financial Obligations
During 2013, the Company‘s principal sources of liquidity were internally generated cash
from operations and short – term bank loans. Requirements funded by short-term bank loanswere for purchases of raw materials and inventory, working capital requirements, includingaccount receivables.
The Company intends to use majority of the net proceeds to settle short-term financialobligations with Metropolitan Bank & Trust Company, Bank of the Philippine Islands, BDOUnibank, Inc., ANZ Bank, and Security Bank Corporation. These borrowings consist ofvarious revolving bank promissory notes with maturity dates varying from 60 to 90 days withinterest rate of approximately 2.5% to 3.5% per annum which were incurred primarily to fundgrowth in accounts receivable-trade given expanding sales revenues.
None of the proceeds shall be used to reimburse any officer, director, employee or
shareholder for services rendered, assets previously transferred, or money loaned oradvanced.
The proposed use of proceeds described above represents a best estimate of the use of the net proceeds of the Offer based on the Company‘s current plans and expenditures. The actualamount and timing of disbursement of the net proceeds from the Offer for the uses statedabove will depend on various factors which include, among others, changing marketconditions or new information regarding the cost or feasi bility of the Company‘s expansion
plans. The Company‘s cost estimates may change as it develops its plans, and actual costsmay be different from its budgeted costs, including due to changes in the exchange rate
between the Philippine Peso and the U.S. dollar. To the extent that the net proceeds from theOffer are not immediately applied to the above purposes, the Company will invest the net
proceeds in interest-bearing short-term demand deposits and/or money market instruments,
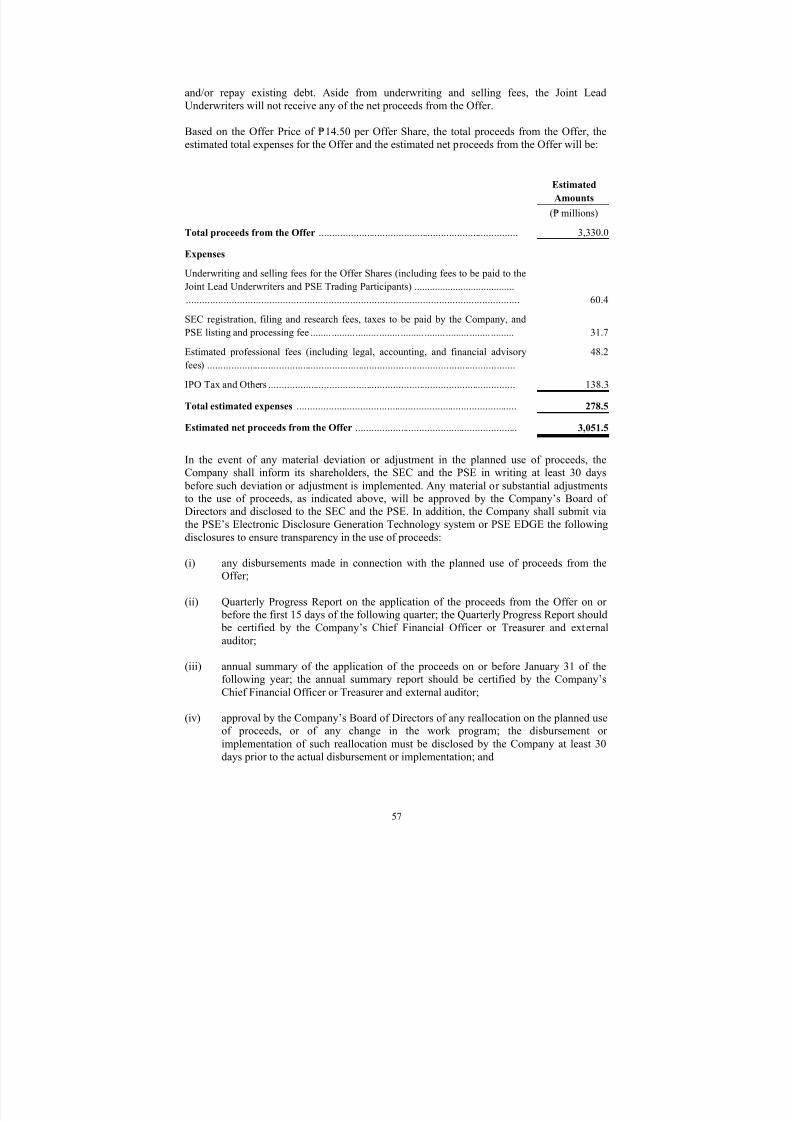
7/21/2019 PreliminaryProspectus - Century
http://slidepdf.com/reader/full/preliminaryprospectus-century 67/648
and/or repay existing debt. Aside from underwriting and selling fees, the Joint LeadUnderwriters will not receive any of the net proceeds from the Offer.
Based on the Offer Price of ₱14.50 per Offer Share, the total proceeds from the Offer, theestimated total expenses for the Offer and the estimated net proceeds from the Offer will be:
Estimated
Amounts
(₱ millions)
Total proceeds from the Offer ........................................................................... 3,330.0
Expenses
Underwriting and selling fees for the Offer Shares (including fees to be paid to the
Joint Lead Underwriters and PSE Trading Participants) .......................................
............................................................................................................................ 60.4
SEC registration, filing and research fees, taxes to be paid by the Company, and
PSE listing and processing fee ........ ......... ......... ........ ......... ........ ......... ........ ......... 31.7
Estimated professional fees (including legal, accounting, and financial advisory
fees) ....................................................................................................................
48.2
IPO Tax and Others ............................................................................................. 138.3
Total estimated expenses ................................................................................... 278.5
Estimated net proceeds from the Offer ............................................................. 3,051.5
In the event of any material deviation or adjustment in the planned use of proceeds, theCompany shall inform its shareholders, the SEC and the PSE in writing at least 30 days
before such deviation or adjustment is implemented. Any material or substantial adjustmentsto the use of proceeds, as indicated above, will be approved by the Company‘s Board ofDirectors and disclosed to the SEC and the PSE. In addition, the Company shall submit viathe PSE‘s Electronic Disclosure Generation Technology system or PSE EDGE the followingdisclosures to ensure transparency in the use of proceeds:
(i) any disbursements made in connection with the planned use of proceeds from theOffer;
(ii)
Quarterly Progress Report on the application of the proceeds from the Offer on or before the first 15 days of the following quarter; the Quarterly Progress Report should be certified by the Company‘s Chief Financial Officer or Treasurer and externalauditor;
(iii) annual summary of the application of the proceeds on or before January 31 of thefollowing year; the annual summary report should be certified by the Company‘sChief Financial Officer or Treasurer and external auditor;
(iv) approval by the Com pany‘s Board of Directors of any reallocation on the planned useof proceeds, or of any change in the work program; the disbursement orimplementation of such reallocation must be disclosed by the Company at least 30
days prior to the actual disbursement or implementation; and

7/21/2019 PreliminaryProspectus - Century
http://slidepdf.com/reader/full/preliminaryprospectus-century 68/648
(v)
a comprehensive report on the progress of its business plans on or before the first 15days of the following quarter.
The quarterly and annual reports required in items (ii) and (iii) above must include a detailedexplanation of any material variances between the actual disbursements and the planned useof proceeds in the work program or the Prospectus, if any. The detailed explanation must alsostate that the Company‘s Board of Directors has given its approval as required in item (i v)above.
The Company shall submit an external auditor‘s certification on the accuracy of theinformation reported by the Company to the PSE in the Company‘s quarterly and annualreports as required in items (ii) and (iii) above.

7/21/2019 PreliminaryProspectus - Century
http://slidepdf.com/reader/full/preliminaryprospectus-century 69/648
PLAN OF DISTRIBUTION
The 229,654,404 Offer Shares shall be offered by the Company to investors, through the Joint
Lead Underwriters. The 45,930,800 Offer Shares (or 20% of the Offer Shares) are being
offered to all of the PSE Trading Participants and 22,965,400 Offer Shares (or 10% of the
Offer Shares) are being offered to the LSIs in the Philippines. The remaining 160,758,204
Offer Shares (or 70% of the Offer Shares) are being offered by the Joint Lead Underwriters to
the QIBs and to the general public. Prior to the closing of the Offer, any Offer Shares not
taken up by the PSE Trading Participants and LSIs shall be distributed by the Joint Lead
Underwriters to their clients or to the general public. In the event that there are Offer Shares
that remain unsubscribed at the end of the Offer, the Joint Lead Underwriters shall subscribe
to the balance pursuant to the terms and conditions of the Underwriting Agreement between
the Company and the Joint Lead Underwriters.
Underwriting Commitments
The Offer will be underwritten at the Offer Price and in connection therewith, anUnderwriting Agreement will be entered into on or before the commencement of the Offer,
between the Company and the Joint Lead Underwriters, whereby the Joint Lead Underwritersagree to underwrite the 229,654,404 Offer Shares to be offered, subject to agreement betweenthe Joint Lead Underwriters on any clawback, clawforward or other such mechanism, on afirm commitment basis.
The Joint Lead Underwriters have committed to underwrite the entire Offer. The amountallocated to each Joint Lead Underwriter is as follows:
Bank Amount
(in ₱ millions )
%
BDO Capital & Investment Corp. [1,110.0] 33.33
BPI Capital Corp. [1,110.0] 33.33
First Metro Investment Corp. [1,110.0] 33.33
Total [3,330.0] 100.00
The underwriting fee is based on the final nominal amount of the Offer Shares to be issued.
There is no arrangement for the Joint Lead Underwriters to return to the Company any unsold
Offer Shares. The Underwriting Agreement may be terminated in certain circumstances prior
to payment of the net proceeds of the Offer Shares being made to the Company. There is no
arrangement as well giving the Joint Lead Underwriters the right to designate or nominate
member(s) to the Board of Directors of the Company.
The Joint Lead Underwriters are all duly licensed by the SEC to engage in underwriting or
distribution of the Offer Shares. The Joint Lead Underwriters may, from time to time, engage
in transactions with and perform services in the ordinary course of its business for the
Company or other members of the Century Pacific Group of which the Company forms a
part.

7/21/2019 PreliminaryProspectus - Century
http://slidepdf.com/reader/full/preliminaryprospectus-century 70/648
Allocation to the Trading Participants of the PSE and Local Small Investor Program
Pursuant to the rules of the PSE, the Company will make available 45,930,800 Offer Shares
comprising 20% of the Offer for distribution to PSE Trading Participants. The total number of
Offer Shares allocated to the 135 PSE Trading Participants will be distributed following the procedures indicated in the implementing guidelines for the Offer Shares to be distributed by
the PSE. Each PSE Trading Participant will be allocated a total of 340,200 Offer Shares. The
balance of 3,800 Offer Shares will be allocated by the PSE to the PSE Trading Participants.
PSE Trading Participants who take up the Offer Shares shall be entitled to a selling fee of 1%
of the Offer Shares taken up and purchased by the relevant trading participant. The selling
fee, less a withholding tax of 10%, will be paid to the PSE Trading Participants within ten
(10) banking days after the Listing Date.
The PSE Trading Participants may be allowed to subscribe for their dealer accounts provided
that, if they opt to sell the Offer Shares to the clients during the Offer period, it must be at a
price not higher than the Offer Price per share. Likewise, the trading participants are prohibited from selling the Offer Shares during the period after the Offer period and prior to
the Listing Date.
The balance of the Offer Shares allocated but not taken up by the PSE Trading Participants
will be distributed among the Joint Lead Underwriters to their clients or to the general public.
A total of 22,965,400 Offer Shares, or 10% of the Offer, shall be made available to Local
Small Investors. Local Small Investors is defined as a subscriber to the Offer who is willing to
subscribe to a maximum of 1,700 Offer Shares under the LSI program. Should the total
demand for the Offer Shares in the LSI program exceed the maximum allocation, the Joint
Lead Underwriters shall allocate the Offer Shares by balloting.
The balance of the Offer Shares allocated but not taken up by the Local Small Investors will
be distributed by the Joint Lead Underwriters to their clients or to the general public.
The Joint Lead Underwriters
BDO Capital is the wholly-owned investment bank subsidiary of BDO Unibank, Inc. BDO
Capital is a full-service investment house primarily involved in securities underwriting and
trading, loan syndication, financial advisory, private placement of debt and equity securities,
project finance, and direct equity investment. Incorporated in December 1998, BDO Capital
commenced operations in March 1999.
BPI Capital is a wholly-owned subsidiary of Bank of the Philippine Islands. BPI Capital is a
licensed investment house focused on corporate finance and securities distribution business. It
began operations in December 1994. BPI Capital Corporation has an investment house
license.
Founded in 1972, First Metro Investment Corporation is a leading investment bank in the
country with over 40 years of service in the development of the Philippine capital markets. It
is the investment banking arm of the Metrobank Group, one of the largest financial
conglomerates in the country. It provides high-quality investment banking and financial
services through its strategic business units – Investment Banking, Financial Markets,
Investment Advisory and Trust. With assets of around ₱85 billion as of November 30, 2013,it is the largest investment bank in the country today. First Metro has been ranked among the

7/21/2019 PreliminaryProspectus - Century
http://slidepdf.com/reader/full/preliminaryprospectus-century 71/648
Top 11 Philippine Companies and among the Best ASEAN 100 Companies based on Relative
Wealth Added Index by New York-based management consulting firm, Stern Stewart & Co.
In 2009, 2011 and 2013, First Metro was awarded the Best Bond House in the Philippines by
Finance Asia. In the last five years, First Metro was also awarded the Best Bond House by
The Asset Magazine of Hong Kong. In 2012, it was recognized by Finance Asia as the BestEquity House in the Philippines. In 2013, it was awarded as one of the Top 10 Best Managed
Companies and Top 10 Best Investor Relations by Finance Asia.
Underwriters’ Compensation
The Joint Lead Underwriters shall receive from the Company a fee equivalent to 1.5% of the
gross proceeds of the Offer, which shall be inclusive of the amounts to be paid to other
participating underwriters and selling agents and exclusive of the amounts to be paid to the
PSE Trading Participants, where applicable. The underwriting fees shall be withheld by the
Joint Lead Underwriters from the proceeds of the Offer.
None of the Joint Lead Underwriters have any other business relationships with Company. None of BDO Capital, BPI Capital or First Metro is represented in the Company‘s Board of
Directors. Neither is there a provision in the Underwriting Agreement, which would entitle
the Joint Lead Underwriters to representation in the Company‘s Board of Directors as part of
their compensation for underwriting services. However, the Company has existing credit lines
with BDO Unibank, Inc., Bank of the Philippine Islands, and Metrobank, which are the parent
companies of BDO Capital, BPI Capital and First Metro, respectively.
Subscription Procedures
On or before April 25, 2014, the PSE Trading Participants shall submit to the designated
representative of the PSE Listing Department their respective firm orders and commitments to
purchase Offer Shares. Offer Shares not taken up by PSE Trading Participants will be
distributed by the Joint Lead Underwriters directly to their clients and the general public and
whatever remains will be purchased by the Joint Lead Underwriters.
With respect to the Local Small Investors (―LSI‖), all applications to purchase or subscribe
for the Offer Shares must be evidenced by a duly accomplished and completed application
form. An application to purchase Offer Shares shall not be deemed as a duly accomplished
and completed application unless submitted with all required relevant information and
applicable supporting documents to the Joint Lead Underwriters or such other financial
institutions that may be invited to manage the LSI program. Payment for the Offer Shares
must be made upon submission of the duly completed application form.
Lodgement of Shares
All of the Offer Shares are or shall be lodged with the PDTC and shall be issued to the
investors in scripless form. They may maintain the Offer Shares in scripless form or opt to
have the stock certificates issued to them by requesting an upliftment of the relevant Offer
Shares from the PDTC‘s electronic system after the closing of the Offer.
7/21/2019 PreliminaryProspectus - Century
http://slidepdf.com/reader/full/preliminaryprospectus-century 72/648
Lock-up
The PSE rules require an applicant company to cause its existing shareholders owning at least
10% of the outstanding shares of the Company not to sell, assign or in any manner dispose of
their shares for a period of 365 days after the listing of the shares. A total of 1,999,999,993Common Shares held by Century Canning Corporation will be subject to such 365-day lock-
up.
In addition, if there is any issuance of shares or securities (i.e., private placements, asset for
shares swap or a similar transaction) or instruments which leads to issuance of shares or
securities (i.e., convertible bonds, warrants or a similar instrument) done and fully paid for
within 180 days prior to the start of the offer period, and the transaction price is lower than
that of the offer price in the initial public offering, all shares or securities availed of shall be
subject to a lock-up period of at least 365 days from full payment of the aforesaid shares or
securities. Two Common Shares, one held by Johnip Cua and one held by Fernan Lukban
(both of whom are Independent Directors of the Company) will be subject to such 365-day
lock-up.
To implement this lock-up requirement, the PSE requires the applicant company to lodge the
shares with the PDTC through a PCD participant for the electronic lock-up of the shares or to
enter into an escrow agreement with the trust department or custodian unit of an independent
and reputable financial institution. Under the PSE rules, the lock-up requirement shall be
stated in the articles of incorporation of the Company.
Selling Restrictions
No securities, except of a class exempt under Section 9 of the SRC or unless sold in any
transaction exempt under Section 10 thereof, shall be sold or distributed by any person withinthe Philippines, unless such securities shall have been registered with the SEC on Form 12-1
and the registration statement has been declared effective by the SEC.

7/21/2019 PreliminaryProspectus - Century
http://slidepdf.com/reader/full/preliminaryprospectus-century 73/648
DIVIDENDS AND DIVIDEND POLICY
CNPF
The Company is authorized under Philippine law to declare dividends, subject to certainrequirements. The payment of dividends, either in the form of cash or shares, will dependupon the Company‘s earnings, cash flow and financial condition, among other factors. TheCompany may declare dividends only out of its unrestricted retained earnings. Theserepresent the net accumulated earnings of the Company with its unimpaired capital, which arenot appropriated for any other purpose. The Company may pay dividends in cash, by thedistribution of property, or by the issue of shares. Dividends paid in cash or property aresubject to the approval by the Board of Directors. Dividends paid in the form of additionalshares are subject to approval by both the Board of Directors and at least two-thirds of theoutstanding share capital of the shareholders at a shareholders‘ meeting called for such
purpose.
The Company has approved a dividend policy of maintaining an annual cash and/or sharedividend pay-out of up to 30% of its net profit from the preceding year, subject to therequirements of applicable laws and regulations, the terms and conditions of its outstanding
bonds and loan facilities, and the absence of circumstances that may restrict the payment ofsuch dividends, such as where the Company undertakes major projects and developments.Dividends must be approved by the Board (and shareholders in case of a share dividenddeclaration) and may be declared only from the unrestricted retained earnings of theCompany. The Company‘s Board of Directors may, at any time, modify the Company‘sdividend policy, depending upon the Company‘s capital expenditure plans and/or any termsof financing facilities entered into to fund its current and future operations and projects. TheCompany can give no assurance that it will pay any dividends in the future.
GTC and SMDC
The Board of Directors and the shareholders of GTC and SMDC approved a dividend policy
of maintaining an annual cash and/or share dividend pay-out of up to 70% of its net profitfrom the preceding year, subject to the requirements of applicable laws and regulations, theterms and conditions of its outstanding bonds and loan facilities, and the absence ofcircumstances that may restrict the payment of such dividends. Dividends must be approved
by GTC and SMDC‘s respective boards (and shareholders in case of a share dividenddeclaration) and shall be declared and paid out only from GTC and SMDC‘s respectiveunrestricted retained earnings. The Board of Directors of GTC and SMDC may, at any time,modify the dividend policy depending on its evaluation of following factors:
The level of GTC and SMDC‘s cash earnings, return on equity and retained earnings The results of business operations and financial conditions at the end of the year in
respect of which the dividends is to be paid
The expected future financial performance of GTC and SMDC
The projected level of GTC and SMDC‘s capital expenditures and other investmentand development plans
Restrictions of payment of dividends that may be imposed by any of GTC andSMDC‘s respective financing arrangements and current and prospective debt servicerequirements
Such other factors as the Board deems appropriate

7/21/2019 PreliminaryProspectus - Century
http://slidepdf.com/reader/full/preliminaryprospectus-century 74/648
DETERMINATION OF THE OFFER PRICE
The Offer Price has been set at up to ₱14.50 per Offer Share. The Offer Price was determinedthrough a book-building process and discussions between the Company and the Joint LeadUnderwriters. Since the Company and the Common Shares have not been listed on any stockexchange, there is no market information for the Common Shares and there has been nomarket price for the Common Shares derived from day-to-day trading.
The factors considered in determining the Offer Price are, among others, the Company‘sability to generate earnings and cash flow, its short and long-term prospects, the level ofdemand from institutional investors, overall market conditions at the time of launch and themarket price of listed comparable companies. The Offer Price may not have any correlation tothe actual book value of the Offer Shares.

7/21/2019 PreliminaryProspectus - Century
http://slidepdf.com/reader/full/preliminaryprospectus-century 75/648
CAPITALIZATION AND INDEBTEDNESS
The following table sets out the Company‘s debt, shareholders‘ equity and capitalization as atDecember 31, 2013, and as adjusted to reflect (i) the subscription by CCC to an additional500,000,000 Common Shares on February 8, 2014 and (ii) the sale of 229,654,404 OfferShares at the Offer Price of up to ₱14.50 per Offer Share. The table should be read inconjunction with the Company‘s pro forma financial statements and the notes thereto,included in this Prospectus beginning on page F-1. Other than as described below, there has
been no material change in the Company‘s capitalization since December 31, 2013.
Pro Forma as
of December
31, 2013(1)
Pre-Offer
Adjustments(2)
IPO
Adjustments(2)
Pro Forma
Post Offer
(₱ in millions)
Total debt(3)
..................................... 2,717.3 2,717.3
Equity:
Share Capital .................................... 1,500.0 500.0 229.7 2,229.7
Share premium ................................. 2,821.9 2,821.9
Retained earnings ............................. 1,319.3 1,319.3
Balancing figures ..............................
Currency translation adjustment........ 19.3 19.3
Deposit for future stock
subscription ......................................
-
Total equity .................................... 2,838.7 500.0 3,051.5 6,390.2
Total capitalization and
indebtedness ...................................
5,556.0 500.0 3,051.5 9,107.5
Notes:
(1) Based on pro forma consolidated financial statements as of December 31, 2013.
(2) Various equity transactions subsequent to December 31, 2013 consist of (i) the subscription by CCC to an additional
500,000,000 Common Shares on February 8, 2014 and (ii) the sale of the Offer Shares.
(3) Total debt comprises of loans payable.

7/21/2019 PreliminaryProspectus - Century
http://slidepdf.com/reader/full/preliminaryprospectus-century 76/648
DILUTION
The Company will offer 229,654,404 Offer Shares to the public at the Offer Price, which will
be substantially higher than the adjusted book value per share of the outstanding Common
Shares, which will result in an immediate material dilution of the new investors‘ equity
interest in the Company. The net book value attri butable to the Company‘s Common Shares,
based on the Company‘s pro forma financial statements as of December 31, 2013 was
₱2,838.7 million. After giving effect to the issuance of 500,000,000 new common shares to
CCC as disclosed in Note 31, starting on page 39 of the pro forma consolidated financial
statements, the pro forma net book value pre-Offer will be ₱3,338.7 million,1 while the net
book value per Common Share will be ₱1.67. The net book value attributable to the
Company‘s Common Shares represents the amount of the Company‘s total equity attributable
to equity holders of the Company. The Company‘s net book value per Common Share is
computed by dividing the pro forma net book value attributable to the Company‘s Common
Shares by the 2,000,000,000 pre-Offer issued and outstanding shares.2
Dilution in pro forma book value per share to investors of the Offer Shares represents the
difference between the Offer Price and the pro forma book value per share immediately
following the completion of the Offer.
After taking into account the issuance of 500,000,000 new common shares and the sale of
229,654,404 Offer Shares at the Offer Price of up to ₱14.50 per Offer Share and after
deduction of the underwriting discounts and commissions and estimated offering expenses of
the Offer payable by the Company, the Company‘s pro forma book value after the Offer
would approximate ₱6,390.2 million, or ₱2.87 per Common Share. This represents an
immediate increase in net book value of ₱1.20 per Common Share to existing shareholders,
and an immediate dilution of ₱11.63 per Common Share to investors of the Offer Shares atthe Offer Price of ₱14.50.
The following table illustrates dilution on a per share basis based on an Offer of 229,654,404
Offer Shares at an Offer Price of up to ₱14.50 per Offer Share:
Offer Price per Offer Share (up to) ₱14.50
Pro forma net book value per Common Share as of December 31, 2013 (pre-
Offer)3
₱1.67
Increase in net book value per Common Share ₱1.20
Pro forma net book value per Common Share after the Offer ₱2.87
Dilution to investors of the Offer Shares ₱11.63
The following table sets forth the shareholdings and percentage of Common Shares
outstanding of existing and new shareholders of the Company immediately after completion
of an Offer of 229,654,404 Offer Shares:
Common Shares
Number %
Existing shareholders ...................................................... 2,000,000,000 89.7%
New investors .................................................................. 229,654,404 10.3%
Total ................................................................................ 2,229,654,404 100.0%

7/21/2019 PreliminaryProspectus - Century
http://slidepdf.com/reader/full/preliminaryprospectus-century 77/648
Notes:
(1) The pro forma net book value is derived from the sum of the net book value of the
Company as of December 31, 2013 and the effect of the issuance of 500,000,000 new
common shares to CCC at a par value of ₱1.00 per share.
(2) Total number of issued and outstanding common shares used to compute per share
values (pre-Offer) is 2,000,000,000, at a par value of ₱1.00 per share, composed of
1,500,000,000 issued and outstanding shares as of December 31, 2013 and the
issuance of 500,000,000 new common shares to CCC as disclosed in Note 31,
starting on page 40 of the pro forma consolidated financial statements.
(3) Pro forma net book value per share takes into account the number of issued and
outstanding shares pre-Offer on account of the issuance of 500,000,000 new common
shares to CCC.

7/21/2019 PreliminaryProspectus - Century
http://slidepdf.com/reader/full/preliminaryprospectus-century 78/648
SELECTED PRO FORMA CONSOLIDATED FINANCIAL INFORMATION
The following tables set forth selected pro forma consolidated financial information for the Company
and should be read in conjunction with the auditors’ reports and the Company’s pro forma
consolidated financial statements, including the notes thereto, included elsewhere in this Prospectus
and the section entitled ―Management’s Discussion and Analysis of Financial C ondition and Results of
Operations of the Pro Forma Consolidated Financial Information of CNPF ‖. The selected pro forma
consolidated financial information presented below as of and for the year ended December 31, 2013
was derived from the historical audited separate financial statements of the Company, GTC, SMDC,
CCC, PMCI and CSC, adjusted to give pro forma effect to (i) the consolidation of GTC and SMDC into
the Company and (ii) the Company’s acquisition of certain assets of CCC, PMCI and CSC, as if such
acquisitions occurred prior to January 1, 2013. The pro forma consolidated financial information was
prepared in accordance with the Company’s assumptions which are described in the pro forma
consolidated financial statements and reviewed by Navarro Amper & Co. in accordance with PSA.
The pro forma adjustments are based upon available information and certain assumptions that the
Company believes are reasonable under the circumstances. The summary pro forma financialinformation does not purport to represent what the results of operations of the Company and its
subsidiaries would actually have been had the acquisitions in fact occurred prior to January 1, 2013,
nor do they purport to project the results of operations of the Company and its subsidiaries for any
future period or date. For additional information regarding financial information presented in this
Prospectus, see ―Presentation of Financial Information‖.
CONSOLIDATED STATEMENT OF COMPREHENSIVE INCOME
(unaudited)
For the year ended
December 31,2013
₱
Net Sales P 19,023,053,067
Cost of Sales 15,696,776,711
Gross Profit 3,326,276,356
Other income 175,816,427
Operating Profit 3,502,092,783
Operating Expenses 2,415,239,219
Finance Costs 112,450,206
Other Expenses 14,054,392
Profit Before Tax 960,348,966
Income Tax Expense 216,431,762
Profit for the Year 743,917,203
Earnings per share
Basic and Diluted Earnings per Share 0.50
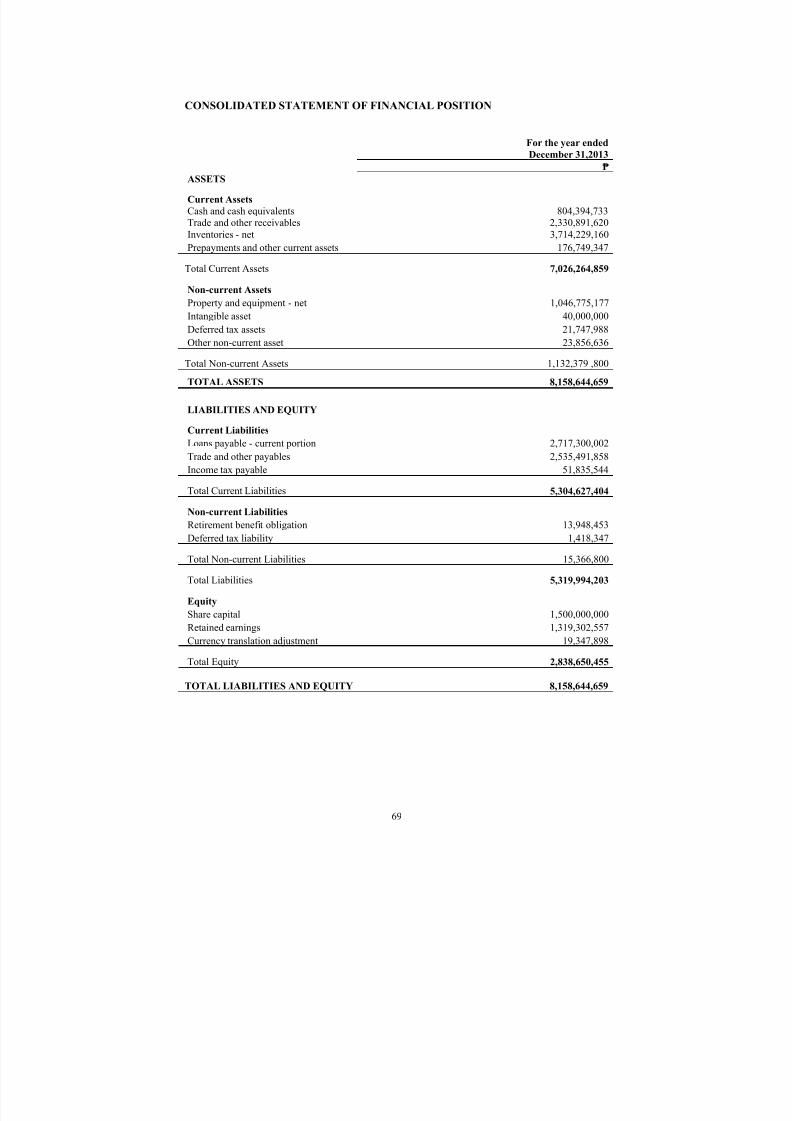
7/21/2019 PreliminaryProspectus - Century
http://slidepdf.com/reader/full/preliminaryprospectus-century 79/648
CONSOLIDATED STATEMENT OF FINANCIAL POSITION
For the year ended
December 31,2013
₱
ASSETS
Current Assets
Cash and cash equivalents 804,394,733Trade and other receivables 2,330,891,620Inventories - net 3,714,229,160
Prepayments and other current assets 176,749,347
Total Current Assets 7,026,264,859
Non-current Assets
Property and equipment - net 1,046,775,177Intangible asset 40,000,000
Deferred tax assets 21,747,988
Other non-current asset 23,856,636
Total Non-current Assets 1,132,379 ,800
TOTAL ASSETS 8,158,644,659
LIABILITIES AND EQUITY
Current Liabilities
Loans payable - current portion 2,717,300,002
Trade and other payables 2,535,491,858Income tax payable 51,835,544
Total Current Liabilities 5,304,627,404
Non-current Liabilities
Retirement benefit obligation 13,948,453
Deferred tax liability 1,418,347
Total Non-current Liabilities 15,366,800
Total Liabilities 5,319,994,203
EquityShare capital 1,500,000,000
Retained earnings 1,319,302,557
Currency translation adjustment 19,347,898
Total Equity 2,838,650,455
TOTAL LIABILITIES AND EQUITY 8,158,644,659

7/21/2019 PreliminaryProspectus - Century
http://slidepdf.com/reader/full/preliminaryprospectus-century 80/648
CONSOLIDATED STATEMENT OF CASH FLOWS
As at
December 31,2013
₱
Cash Flows from Operating Activities
Profit before tax 960,348,966
Adjustments for:
Depreciation and amortization 193,394,847
Finance costs 112,450,206
Reversal of impairment of trade and other receivables (6,637,186)
Reversal of allowance for decline in value of inventories (10,357,008)
Loss on decline in value of inventories 4,462,318
Loss on disposal and write-off of property, plant and equipment 3,095,250
Retirement benefit expense 9,313,787Impairment loss on trade and other receivables 4,066,287
Interest income (10,233,586)
Operating cash flows before working capital changes 1,259,903,881
Decrease (increase) in:
Trade and other receivables (1,057,485,998)
Inventories 2,056,567,104
Prepayments and other current assets 144,222,116
Other non-current assets 5,176,498
Increase (decrease) in:
Trade and other payables (1,135,882,333)
Other non-current liabilities (64,936,440)
Exchange differences on translating operating assets and liabilities 7,019,430
Cash generated from operations 1,214,584,259
Contributions to retirement fund (8,427,173)
Income taxes paid (221,080,459)
Net cash from operating activities 985,076,626
Cash flows from Investing Activities
Acquisitions of property, plant and equipment (341,809,091)
Interest received 10,233,586Proceeds from sale of property, plant and equipment 79,701,950
Net cash used in investing activities (251,873,555)
Cash flows from Financing Activities
Net repayments of loans (555,847,139)
Finance costs paid (112,450,206)
Net cash from (used in) financing activities (668,297,345)
Net Increase in Cash and Cash Equivalents 64,905,726
Cash and Cash Equivalents, Beginning 739,489,007
Cash and Cash Equivalents, End 804,394,733

7/21/2019 PreliminaryProspectus - Century
http://slidepdf.com/reader/full/preliminaryprospectus-century 81/648
CONSOLIDATED STATEMENT OF CHANGES IN EQUITY
For the Year Ended
December 31, 2013
Share
Currency
Translation Retained
Capital Adjustments Earnings Total
Balance, January 1,2013 ₱1,500,000,000 ₱(41,721,477) ₱ 581,576,206 ₱2,039,854,728
Profit for the year - - 743,917,203 743,917,203Other comprehensiveincome - 61,069,376 (6,190,852) 54,878,524
Balance, December
31, 2013 ₱1,500,000,000 ₱ 19,347,898 ₱ 1,319,302,557 ₱2,838,650,455

7/21/2019 PreliminaryProspectus - Century
http://slidepdf.com/reader/full/preliminaryprospectus-century 82/648
SELECTED COMBINED FINANCIAL INFORMATION
The following tables set forth the summary combined financial information for GTC and SMDC and
should be read in conjunction with the auditors’ reports and GTC’s and SMDC’s combined financial
statements, including the notes thereto, included elsewhere in this Prospectus and the section entitled
―Management’s Discussion and Analysis of Financial Condition and Results of Operations of the
Combined Financial Information for GTC and SMDC‖. The combined financial information presented
below as of and for the years ended December 31, 2011, 2012 and 2013 was derived from the audited
financial statements of GTC and SMDC prepared in accordance with PFRS. Our independent auditor
for the years ended December 31, 2011, 2012 and 2013 was Punongbayan & Araullo. The summary
financial information below should not be considered indicative of the results of future operations.
COMBINED STATEMENTS OF COMPREHENSIVE INCOME
For the Years Ended December 31
2013 2012 2011₱
Net Sales 7,419,053,435 5,524,019,169 4,750,208,315
Cost of Sales 6,845,193,581 4,932,025,037 4,319,887,738
Gross Profit 573,859,854 591,994,132 430,320,577
Other income (Expense) (123,791,507) (47,624,275) (30,825,991)
697,651,361 639,618,407 461,146,568
Operating Expenses 423,708,762 428,936,981 286,067,972
Finance Costs 51,022,887 54,969,013 73,111,252
474,717,978 483,905,994 359,179,224
Profit Before Tax 222,919,712 155,712,413 101,967,344
Income Tax Expense 43,630,444 44,365,573 35,490,963
Profit for the Year 179,289,268 111,346,840 66,476,381
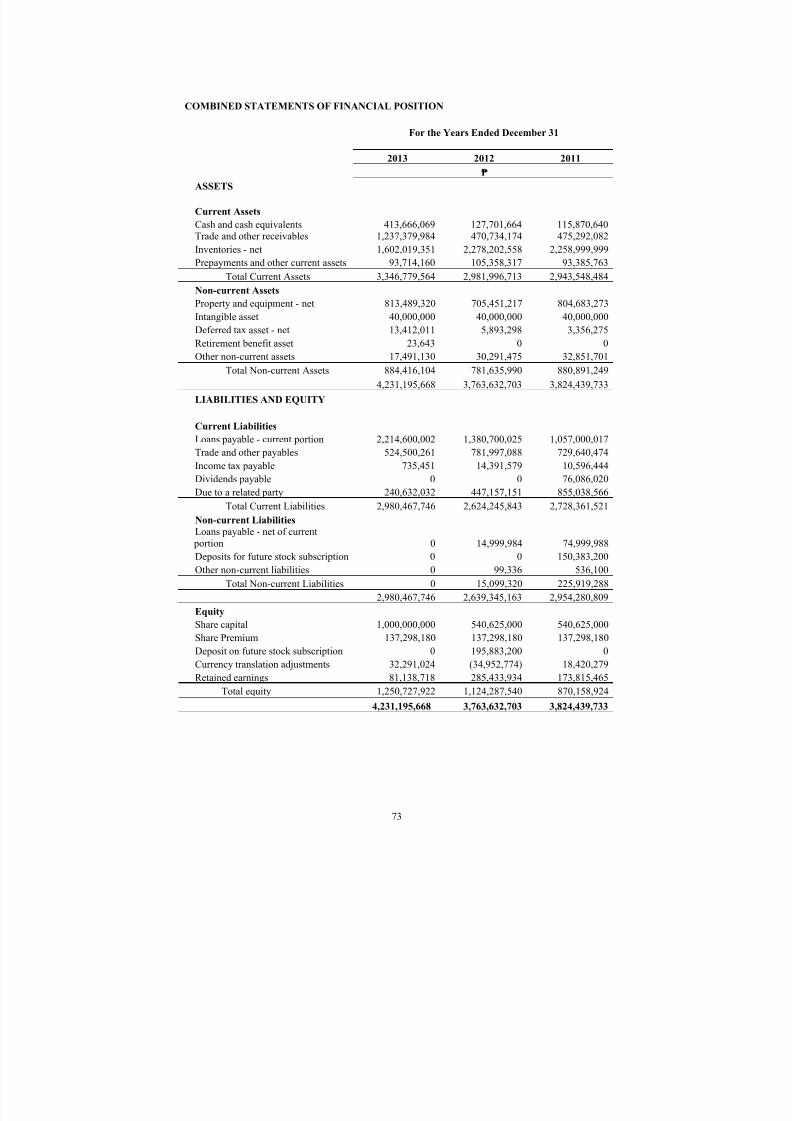
7/21/2019 PreliminaryProspectus - Century
http://slidepdf.com/reader/full/preliminaryprospectus-century 83/648
COMBINED STATEMENTS OF FINANCIAL POSITION
For the Years Ended December 31
2013 2012 2011
₱
ASSETS
Current Assets
Cash and cash equivalents 413,666,069 127,701,664 115,870,640Trade and other receivables 1,237,379,984 470,734,174 475,292,082
Inventories - net 1,602,019,351 2,278,202,558 2,258,999,999
Prepayments and other current assets 93,714,160 105,358,317 93,385,763
Total Current Assets 3,346,779,564 2,981,996,713 2,943,548,484
Non-current Assets
Property and equipment - net 813,489,320 705,451,217 804,683,273Intangible asset 40,000,000 40,000,000 40,000,000
Deferred tax asset - net 13,412,011 5,893,298 3,356,275
Retirement benefit asset 23,643 0 0
Other non-current assets 17,491,130 30,291,475 32,851,701
Total Non-current Assets 884,416,104 781,635,990 880,891,249
4,231,195,668 3,763,632,703 3,824,439,733
LIABILITIES AND EQUITY
Current Liabilities
Loans payable - current portion 2,214,600,002 1,380,700,025 1,057,000,017
Trade and other payables 524,500,261 781,997,088 729,640,474Income tax payable 735,451 14,391,579 10,596,444
Dividends payable 0 0 76,086,020
Due to a related party 240,632,032 447,157,151 855,038,566
Total Current Liabilities 2,980,467,746 2,624,245,843 2,728,361,521
Non-current Liabilities
Loans payable - net of current portion 0 14,999,984 74,999,988
Deposits for future stock subscription 0 0 150,383,200
Other non-current liabilities 0 99,336 536,100
Total Non-current Liabilities 0 15,099,320 225,919,288
2,980,467,746 2,639,345,163 2,954,280,809
Equity
Share capital 1,000,000,000 540,625,000 540,625,000
Share Premium 137,298,180 137,298,180 137,298,180
Deposit on future stock subscription 0 195,883,200 0
Currency translation adjustments 32,291,024 (34,952,774) 18,420,279
Retained earnings 81,138,718 285,433,934 173,815,465
Total equity 1,250,727,922 1,124,287,540 870,158,924
4,231,195,668 3,763,632,703 3,824,439,733

7/21/2019 PreliminaryProspectus - Century
http://slidepdf.com/reader/full/preliminaryprospectus-century 84/648
COMBINED STATEMENTS OF CASH FLOWSFor the Years Ended December 31
2013 2012 2011
₱
Cash flows from Operating Activities
Profit before tax 222,919,712 155,712,413 101,967,344
Adjustments for:
Depreciation and amortization 129,957,909 127,172,487 120,786,676
Finance costs 51,022,887 54,969,013 73,111,252
Reversal of impairment of trade and other receivables (6,408,185) 0 0
Loss on decline in value of inventories 4,462,318 0 0
Loss on disposal and write-off of property, plant andequipment 3,095,250 0 1,184,961
Retirement benefit expense 2,094,690 2,078,420 2,391,146
Impairment loss on trade and other receivables 941,848 3,701,034 3,299,076
Interest income (9,272,387) (3,081,186) (996,688)
Operating cash flows before working capital changes 398,814,042 340,552,181 301,743,767
Decrease (increase) in:
Trade and other receivables (761,179,473) 1,365,409 62,847,331
Inventories 671,720,889 (19,202,559) (21,643,946)
Prepayments and other current assets 11,644,156 (11,972,554) (6,236,403)
Other non-current assets 12,800,346 2,560,227 (2,669,466)Increase (decrease) in trade and other payables (257,496,827) 52,356,614 204,566,019
Exchange differences on translating operating assets andliabilities 31,863,679 (36,892,013) 3,966,858
Cash generated from operations 108,166,812 328,767,305 542,574,160
Contributions to retirement fund (1,753,543) (2,022,250) (3,861,603)
Income taxes paid (64,182,843) (43,468,263) (18,448,070)
Net cash from operating activities 42,230,426 283,276,792 520,264,487
Cash flows from Investing Activities
Net additions to property and equipment (272,921,095) (73,254,775) (109,620,285)
Interest received 9,272,387 3,081,186 996,688Proceeds from sale of property, plant and equipment 79,701,949 0 4,639,040
Net cash used in investing activities (183,946,759) (70,173,589) (103,984,557)
Cash flows from Financing Activities
Net proceeds from (repayments of) loans 818,900,000 263,700,000 (26,500,011)
Net repayments of due to related parties (219,688,175) (380,503,166) (310,665,962)
Receipt of deposits for future stock subscription 0 45,500,000 0
Proceeds from issuance of shares 263,491,800 0 0
Payment of dividends (384,000,000) (75,000,000) 0
Finance costs paid (51,022,887) (54,969,013) (73,111,252)
Net cash from (used in) financing activities 427,680,738 (201,272,179) (410,277,225)

7/21/2019 PreliminaryProspectus - Century
http://slidepdf.com/reader/full/preliminaryprospectus-century 85/648
Net Increase in Cash and Cash Equivalents 285,964,405 11,831,024 6,002,706
Cash and Cash Equivalents, Beginning 127,701,664 115,870,640 109,867,934
Cash and Cash Equivalents, End 413,666,069 127,701,664 115,870,640
COMBINED STATEMENTS OF CHANGES IN EQUITY
Share
Capital
Share
Premium
Deposits for
Future stock
Subscription
Currency
Translation
Adjustments
Retained
Earnings Total
Balance, January 1, 2011 327,896,060 137,298,180 – 17,866,631 357,568,024 840,628,895
Issuance of shares duringthe year
37,500,000 – – – – 37,500,000
Cash dividends – – – – (75,000,000) (75,000,000)
Stock dividends 175,228,940 – – – (175,228,940) – Profit for the year – – – – 66,476,381 66,476,381
Other comprehensiveincome
– – – 553,648 – 553,648
Balance, December 31,
2011
540,625,000 137,298,180 – 18,420,279 173,815,465 870,158,924
Reclassification from debtto equity
– – 150,383,200 – – 150,383,200
Additional deposits forfuture stock subscription
– – 45,500,000 – – 45,500,000
Profit for the year – – – – 111,346,840 111,346,840
Other comprehensiveincome
– – – (53,373,052) 271,629 (53,101,423)
Balance, December 31,
2012
540,625,000 137,298,180 195,883,200 (34,952,773) 285,433,933 1,124,287,540
Issuance of shares duringthe year
459,375,000 – (195,883,200) – – 263,491,800
Cash dividends – – – – (384,000,000) (384,000,000)
Profit for the year – – – – 179,289,268 179,289,268
Other comprehensiveincome
– – – 67,243,798 415,516 67,659,314
Balance, December 31,
2013
1,000,000,000 137,298,180 – 32,291,025 81,138,718 1,250,727,922

7/21/2019 PreliminaryProspectus - Century
http://slidepdf.com/reader/full/preliminaryprospectus-century 86/648
SELECTED PARENT FINANCIAL INFORMATION OF CNPF
The following table sets forth the selected financial information for the Company and should be read in
conjunction with the auditors’ reports and the Company’s financial stat ements, including the notes
thereto, included elsewhere in this Prospectus and the section entitled ―Management’s Discussion and
Analysis of Financial Condition of CNPF ‖. The selected financial information presented below for the
period October 25, 2013 to December 31, 2013 was derived from the audited financial statements of
the Company prepared in accordance with PFRS. Our independent auditor for the years ended
December 31, 2013 was Navarro Amper & Co. The Company’s summary financial information
below should not be considered indicative of the results of future operations.
STATEMENT OF COMPREHENSIVE INCOME
For the period
October 25, 2013 to
December 2013
₱
Other Income
Rental income 13,112,333
Interest income 73,295
13,185,628
Other Operating Expenses
Taxes and licenses 19,727,899
Depreciation expense 7,129,783
Professional fees 3,360,000
Supplies 189,062
30,406,744
Loss Before Tax (17,221,116)
Income tax benefit 5,188,323
Net Loss After Tax (12,032,793)

7/21/2019 PreliminaryProspectus - Century
http://slidepdf.com/reader/full/preliminaryprospectus-century 87/648
STATEMENTS OF FINANCIAL POSITION
As of December 31, 2013
₱
ASSETS
Current assets
Cash ..................................................... 24,298,838
Due from related parties ......... ........ ...... 14,685,814
Input value-added tax - net ........ ........ ... 26,436,975
Total current assets ............................... 65,421,627
Non-current assets
Investment in subsidiaries ......... ........ ... 1,194,615,640
Property and equipment - net ......... ....... 222,930,679
Deferred tax assets ........ ......... ........ ....... 5,188,323
Total non-current assets 1,422,734,642
1,488,156,269
LIABILITIES AND EQUITY
Current liabilities
Other current liabilities ......................... 189,062
Equity
Capital stock ........ ......... ......... ........ ....... 1,500,000,000Deficit ......... ........ ......... ........ ......... ....... (12,032,793)
1,487,967,207
1,488,156,269
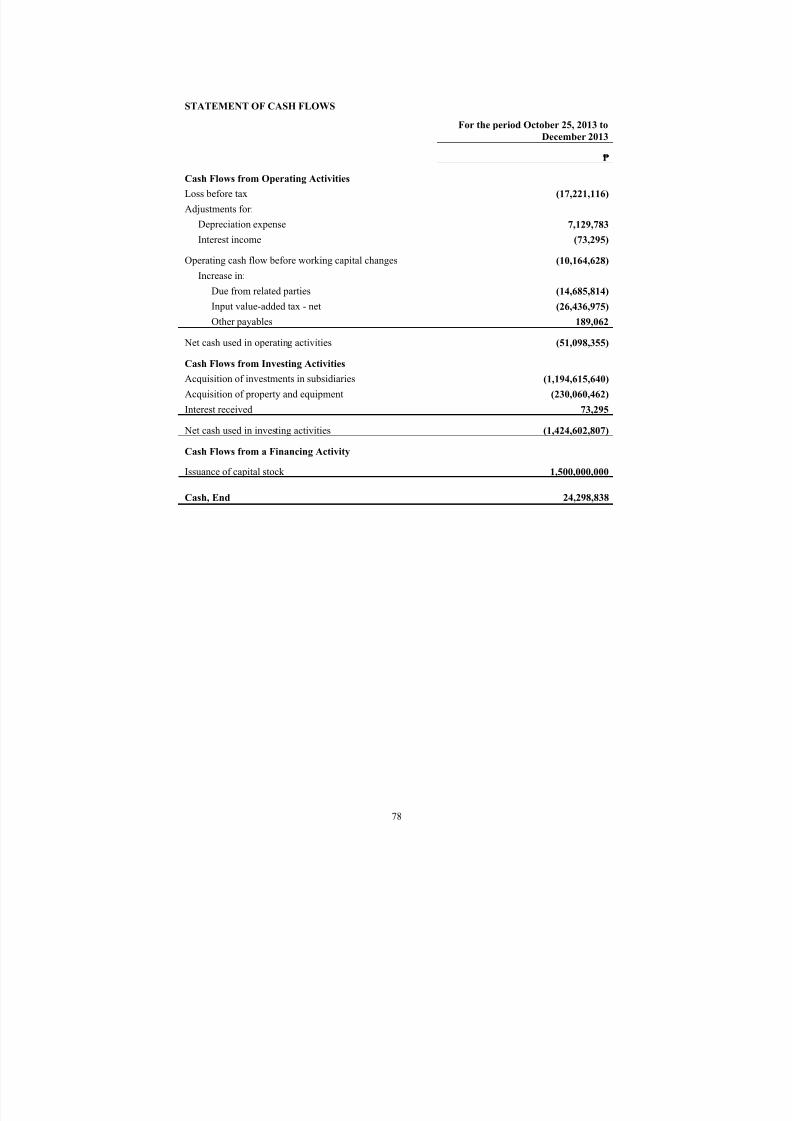
7/21/2019 PreliminaryProspectus - Century
http://slidepdf.com/reader/full/preliminaryprospectus-century 88/648
STATEMENT OF CASH FLOWS
For the period October 25, 2013 to
December 2013
₱
Cash Flows from Operating Activities
Loss before tax (17,221,116)
Adjustments for:
Depreciation expense 7,129,783
Interest income (73,295)
Operating cash flow before working capital changes (10,164,628)
Increase in:
Due from related parties (14,685,814)
Input value-added tax - net (26,436,975)
Other payables 189,062
Net cash used in operating activities (51,098,355)
Cash Flows from Investing Activities
Acquisition of investments in subsidiaries (1,194,615,640)
Acquisition of property and equipment (230,060,462)
Interest received 73,295
Net cash used in investing activities (1,424,602,807)
Cash Flows from a Financing Activity
Issuance of capital stock 1,500,000,000
Cash, End 24,298,838

7/21/2019 PreliminaryProspectus - Century
http://slidepdf.com/reader/full/preliminaryprospectus-century 89/648
SELECTED CONSOLIDATED FINANCIAL INFORMATION OF CNPF
The following table sets forth the selected financial information for the Company and should be read in
conjunction with the auditors’ reports and the Company’s financial statements, including the notes
thereto, included elsewhere in this Prospectus and the section entitled ―Management’s Discussion and
Analysis of Financial Condition and Results of Operations of the Consolidated Financial Information
of CNPF‖. The selected financial information presented below as of and for the year ended December
31, 2013 was derived from the audited consolidated financial statements of the Company prepared in
accordance with PFRS. Our independent auditor for the years ended December 31, 2013 was Navarro
Amper & Co. The Company’s summary financial information below should not be considered
indicative of the results of future operations.
STATEMENTS OF FINANCIAL POSITION
As of December 31, 2013
₱
AssetsCurrent Assets
Cash and cash equivalents 437,964,907
Trade and other receivables – net 1,034,062,591
Due from related parties 218,003,202
Inventories – net 1,602,019,351
Prepayments and other current assets 120,151,134
Total Current Assets 3,412,201,185
Non-Current Assets
Trademarks 40,000,000
Property, plant and equipment – net 1,036,419,999Deferred tax assets 18,726,312
Retirement benefit asset 23,643
Other non-current assets 17,491,128
Total Non-current Assets 1,112,661,082
4,524,862,267
Liabilities and Equity
Current Liabilities
Loans payable 2,214,600,002
Trade and other payables 524,689,323
Income tax payable 735,451Due to related parties 240,632,032
Total Current Liabilities 2,980,656,808
Equity
Share capital 1,500,000,000
Currency translation adjustment 14,308,241
Other reserves 30,628,942
Deficit (731,724)
1,544,205,459
4,524,862,267

7/21/2019 PreliminaryProspectus - Century
http://slidepdf.com/reader/full/preliminaryprospectus-century 90/648
STATEMENT OF COMPREHENSIVE INCOME
For the period October 25, 2013 to December 31, 2013
in ₱
Revenue 1,421,621,604
Cost of Goods Sold 1,306,758,259
Gross Profit 114,863,345
Other Income 29,417,788
144,281,133
Operating Expenses 136,423,625
Other Expenses 2,189,825
Finance Costs 11,332,127
149,945,577
Loss Before Tax (5,664,444)
Income Tax Benefit 4,517,204
Loss for the Period (1,147,240)
Other comprehensive income
Item that will be reclassified subsequently to profit or loss
Currency translation adjustments 14,308,241
Item that will not be reclassified subsequently to profit orloss
Effect of remeasurement of retirement benefit obligation 415,516
14,723,757
Total comprehensive income 13,576,517
Basic and Diluted Earnings Per Share (0,0008)

7/21/2019 PreliminaryProspectus - Century
http://slidepdf.com/reader/full/preliminaryprospectus-century 91/648
STATEMENT OF CASH FLOWS
For the period October 25, 2013 to December 31, 2013
₱
Cash Flows from Operating Activities (5,664,444)
Loss before tax
Adjustments for:
Depreciation and amortization 8,217,174
Finance costs 11,,332,127
Loss on inventory obsolescence 4,462,318
Loss on disposal of land 1,816,723
Retirement benefit expense 2,094,690
Interest income 495,102
Operating cash flow before working capital changes 22,753,690
Decrease (Increase) in:
Trade and other receivables 3,925,763
Due from related parties (213,678,171)
Inventories 787,768,399
Prepayments and other current assets 5,313,290
Other non-current assets 1,838,164
Decrease in trade and other payables (545,989,226)
Exchange differences on translating operating assets andliabilities (21,415,425)
Cash generated from operations 40,516,484
Contribution to the retirement fund (1,753,543)
Income tax paid (22,608,962)
Net cash from operating activities 16,153,979
Cash Flows from Investing Activities
Acquisitions of property, plant and equipment (344,877,181)
Proceeds from sale of land 79,701,949
Interest income received (495,102)
Net cash used in investing activities (265,670,334)
Cash Flows from Financing Activities
Proceeds from issuance of share capital 1,500,000,000
Net receipts from related parties 129,865,038
Net repayment of loans (195,999,998)
Finance costs paid (11,332,127)
Net cash from financing activities 1,422,532,913
Acquisition of subsidiaries (net of cash acquired) (735,051,651)
Cash and Cash Equivalents, End 437,964,907

7/21/2019 PreliminaryProspectus - Century
http://slidepdf.com/reader/full/preliminaryprospectus-century 92/648
MANAGEMENT’S DISCUSSION AND ANALYSIS OF FINANCIAL CONDITION
AND RESULTS OF OPERATIONS OF THE PRO FORMA CONSOLIDATED
FINANCIAL INFORMATION OF CNPF
The following discussion of CNPF’s recent financial results should be read in conjunction with
CNPF’s pro forma consolidated financial statements and notes thereto contained in this Prospectus
and the section entitled ―Selected Pro Forma Financial Information‖. The Company’s pro forma
consolidated financial statements are in part supported by the historical performance of its wholly
owned subsidiaries, GTC and SMDC, as presented in their 2011-2013 audited combined financial
statements. The Company believes that the presentation of the 2013 pro forma consolidated financial
statements, taken together with the rest of this Prospectus, would provide prospective investors with
sufficient insight into the growth potential of the Company.
CNPF’s pro forma consolidated financial information as of and for the year ended December 31, 2013
was derived from the historical audited separate financial statements of the Company, GTC, SMDC,
CCC, PMCI and CSC, adjusted to give pro forma effect to (i) the consolidation of GTC and SMDC into
the Company and (ii) the Company’s acquisition of certain assets of CCC, PMCI and CSC, as if suchacquisitions occurred prior to January 1, 2013. The pro forma consolidated financial information was
prepared in accordance with the Company’s assumptions which are described in the pro forma
consolidated financial statements and reviewed by Navarro Amper & Co. in accordance with PSA.
This discussion contains forward-looking statements and reflects the current views of CNPF with
respect to future events and financial performance. Actual results may differ materially from those
anticipated in these forward-looking statements as a result of certain factors such as those set forth in
the section entitled ―Risk Factors‖ and elsewhere in this Prospectus.
The pro forma financial statements included in this Prospectus and on which the discussions in this
section are based should not be considered indicative of actual results. See ―Risk Factors – Risks
relating to the presentation of information in this Prospectus – The pro forma financial information
included herein may not be indicative of actual results‖.
OVERVIEW
CNPF traces its history from the Century Group, a leading branded food company primarily
engaged in the development, processing, marketing and distribution of processed fish and
meat, as well as processed dairy products in the Philippines.
In October 2013, the Century Group began to undertake a general corporate reorganization
transaction. Prior to the corporate restructuring, the company‘s businesses were operated by
different companies:
Seafood
Century Canning Corporation (―CCC‖), incorporated on December 12, 1978, handled the
Group‘s sales and distribution for canned and processed tuna, sardines and bangus. Products
are marketed under 555 for sardines, Century Tuna and 555 for tuna. Columbus Seafood
Corporation (―CSC‖), incorporated on December 20, 1994, operated the manufacturing plant
for the sardines. General Tuna Corporation (―GTC‖), incorporated on March 10, 1997,
operated the tuna processing both for local and export sales.

7/21/2019 PreliminaryProspectus - Century
http://slidepdf.com/reader/full/preliminaryprospectus-century 93/648
Meat
The Pacific Meat Company, Inc. (―PMCI‖), incorporated on June 28, 1 994, manufactured
canned and processed meat under the brand names Argentina, Swift and 555.
Dairy
Snow Mountain Dairy Corporation (―SMDC‖) incorporated on February 14, 2001, handles
the dairy and sinigang mixes under the brands of Birch Tree, Angel , Home Pride and Kaffe de
Oro.
In order to streamline and rationalize the Group‘s operations, the business operations of CCC,
CSC and PMCI were folded into CNPF, the listing vehicle. The business operations of CCC
and CSC were folded into CNPF under the canned and processed fish segment. The canned
meat business operations of PMCI were folded into CNPF under the canned meat segment.
SMDC, handling the dairy and mixes segment, and GTC, handling the private label canned,
pouched and frozen tuna products for export, were retained as separate corporate entities aswholly-owned subsidiaries of CNPF. As a result, the pro forma financial statements of CNPF
are a product of the combination of the businesses of CCC, PMCI, CSC, GTC and SMDC.
With this operating history spanning the last 35 years, CNPF has established a strong brandand product portfolio through, and supported by, continuous product innovation andacquisition of brands from third parties. Its brands are well-recognized in the Philippines andinclude 555 for sardines, Century Tuna and 555 for tuna, Argentina and Swift for cannedmeats and Angel and Birch Tree for canned and powdered milk. CNPF was the largest
producer of canned foods in the Philippines in terms of retail value according to Euromonitordata for February 2013.The quality of CNPF‘s products has been recognized by numerousconsumer and industry association awards. For example, Century Tuna received the Trusted
Brand Award from Reader‘s Digest in 2011, 2012 and 2013 and Argentina Corned Beef received the same award in 2012 and 2013.
As of December 31, 2013, CNPF offered 283 products which can be found in 3,772 modernretail outlets, approximately 225,168 directly served general trade outlets and 330,749indirectly served points of sale, totalling over 559,689 points of sale throughout thePhilippines. CNPF operates five production facilities and distributes its products through 14distribution centers strategically located across the Philippines. CNPF distributes its productsdirectly to retailers, as well as through third-party distributors. As at December 31, 2013,CNPF maintained 200 manufacturer direct-to-retail accounts reaching 3,772 retail outlets inthe Philippines. In addition, as at December 31, 2013, CNPF held distribution agreementswith 39 distributors, reaching approximately 225,168 retail outlets ranging from supermarketsto sari-sari stores. Furthermore, as of December 31, 2013, CNPF exports both private labeland branded products, which are distributed across North America, Europe, Asia, Australia,and the Middle East.
For the year ended December 31, 2013, CNPF‘s net revenue was ₱19,023 million. CNPF‘snet profit for the same periods was ₱743.9 million.
Business Segments
CNPF‘s business operations are divided into four main business segments: canned and processed fish, canned meat, dairy and mixes and tuna export.

7/21/2019 PreliminaryProspectus - Century
http://slidepdf.com/reader/full/preliminaryprospectus-century 94/648
The canned and processed fish segment produces a variety of tuna, sardine and other fish andseafood- based products. CNPF‘s key brands in the canned and processed fish segment includeCentury Tuna, 555, Blue Bay and Fresca.
The canned meat segment produces corned beef, meatloaf and a variety of other meat-based products. Key brands in this segment include Argentina, Wow and Swift .
The dairy and mixes segment primarily comprises canned milk, powdered milk and otherdairy products, as well as coffee mixes and sinigang mix. Key brands include Angel , Birch
Tree, Kaffe de Oro and Home Pride.
CNPF also produces private label canned, pouched and frozen tuna products for export tomajor overseas markets including North America, Europe, Asia, Australia, and the MiddleEast. In addition, CNPF‘s branded products are also exported to overseas markets and areacross North America, Europe, Asia, Australia, and the Middle East.
For the year ended December 31, 2013, the contribution of each business segment to CNPF‘stotal revenue and net income is as follows:
Year ended December 31, 2013
(in ₱ millions)
Revenue
% of
Total
Net
Income
% of
Total
Canned and Processed Fish 7,014 36.9 137 18.4
Canned Meat 4,598 24.2 360 48.4
Dairy and Mixes 1,548 8.1 45 6.0
Tuna Export 5,863 30.8 210 28.2
Other Segment Income (―C NPF‖) (8) (1)
Total 19,023 100.0 744 100.0
The abovementioned revenue and net income were derived from the historical auditedseparate financial statements of the Company, GTC, SMDC, CCC, PMCI and CSC andadjusted to give the pro forma effect of the consolidation of the businesses of the saidcompanies as shown in the table below:
Year ended
December 31,
2013 (in ₱millions)
AcquisitionsTotal before
Pro FormaAdjustments
Pro formaAdjustments
Pro formaConsolidatedCNPF GTC SMDC CSC PMCI CCC
Net sales - 5,863 1,556 1,633 5,063 5,505 19,620 (597) 19,023
Cost of Sales - 5,623 1,222 1,420 3,932 4,071 16,269 (572) 15,697
Gross profit - 240 334 213 1,130 1,434 3,351 (25) 3,326
Other Income 13 127 0 35 24 859 1,058 (882) 176
Operating
profit 13 367 334 248 1,154 2,293 4,409 (907) 3,502Operating
expenses 30 148 275 160 763 1,366 2,743 (328) 2,415
Finance cost - 49 2 3 25 52 131 (19) 112
OtherExpense - 3 - 7 4 - 14 - 14
Profit (loss) (17) 166 57 78 363 875 1,521 (561) 960

7/21/2019 PreliminaryProspectus - Century
http://slidepdf.com/reader/full/preliminaryprospectus-century 95/648
before tax
Income tax
expense (5) 28 15 25 105 48 217 (1) 216
Profit after
tax (12) 138 42 52 257 827 1,304 (560) 744
Pro forma adjustments were made to the December 31, 2013 historical consolidated financialinformation of the Company and its subsidiaries (GTC and SMDC), and the acquired
businesses (CSC, PMCI, CCC) which include the following:
Consolidation of the Company and its subsidiaries (GTC and SMDC) and elimination ofinvestment and equity amounting to ₱1.137 million.
Recognition of identified assets and liabilities of CCC, CSC and PMCI and the relatedoperations as well as the accumulated earnings as of December 31, 2013. The difference
between the balance of the assets acquired and liabilities assumed was recognized inretained earnings.
Elimination of frozen processed meat business from PMCI.
Elimination of intercompany and inter-business transactions and account balances.
Elimination of cash dividends from GTC and SMDC amounting to ₱382 million and gainfrom the sale of shares of stocks of GTC and SMDC between CCC and the Company
Recognition of rental expense in relation to the land and office spaces that were not soldto the Company and elimination of depreciation related to aforementioned assets.
Re-computation of income tax to include the effects of the pro forma adjustments.
CCC and CSC (Canned and Processed Fish). Net sales from the canned and processed fish
business segment totaled ₱7,013.8 million, or 37% of total CNPF sales, for the year ended
December 31, 2013. Of these sales, canned tuna and milkfish contributed ₱5,380.8 million
while canned sardine accounted for ₱1,633.0 million. Gross profit for the segment totaled
₱1,659.2 million, or a gross profit rate of 24%. This gross profit consisted of ₱1,383.4 million
from canned tuna and milkfish and ₱275.8 million for canned sardine. Net income for the
segment totaled ₱136.5 million, or an equivalent segment return on sales of 3%. Of this
segment net income, ₱158.8 million was shared by canned tuna and milkfish while ₱161.4
million was from canned sardine.
GTC (Tuna Export). Net sales from the tuna export business segment totaled ₱5,862.7
million. This represented 31% of total CNPF sales and comprised sales of canned tuna,
pouched tuna and frozen loins to the private-label export market. Gross profit was ₱301.6
million, or a segment gross profit rate of 4%. Net income totaled ₱209.6 million for a segmentreturn on sales of 2%.
PMCI (Canned Meat). Net sales from the canned meat business were ₱4,598.6 million for the
year ended December 31, 2013, which represented 24% share of the total CNPF sales. Net
sales included sales to the modern trade accounts, general trade accounts, food service
accounts and export accounts for canned products including corned beef, meat loaves, ready-
to-eat viands. Gross profit for canned meat was ₱1,0405 million, or a segment gross profit
rate of 23%. Net income for canned meat totaled ₱360.1 million, or a return on sales of 8%.
SMDC (Dairy and Mixes). Net sales from the dairy and mixes business was ₱1,548 million
for the year ended December 31, 2013, which represents 8% share of the total CPF sales. Net
sales includes sales of evaporated milk, condensed milk, creamers, full cream powdered milk,
flavour mixes and 3-in-1 coffee products. Gross profit for the segment amounted to ₱ 325.5

7/21/2019 PreliminaryProspectus - Century
http://slidepdf.com/reader/full/preliminaryprospectus-century 96/648
million for an equivalent gross profit rate of 21%. Net income totaled ₱41.8 million, or a 3%
return on sales ratio.
FACTORS AFFECTING RESULTS OF OPERATIONS
CNPF’s results of operations are affected by a variety of factors. Set out below is a discussion
of the most significant fact ors that have affected CNPF’s results in the past and which CNPF
expects to affect its financial results in the future. Factors other than those set out below
could also have a significant impact on CNPF’s results of operations and financial condition
in t he future. See ―Risk Factors‖.
Raw Materials Costs and Product Prices
CNPF depends on raw materials, including certain critical raw materials such as tuna, meat,tin cans and powdered milk, most of which are procured from third parties from both withinand outside the Philippines. These materials are subject to price volatility caused by a number
of factors, including changes in global supply and demand, foreign exchange rate fluctuations,weather conditions and government regulations and controls. In addition, CNPF‘s ability toobtain raw materials is affected by a number of factors beyond its control, including naturaldisasters, governmental laws and policies, and interruptions in production by suppliers.
Changes in the prices of raw materials will necessarily affect CNPF‘s cost of sales and mayaffect the pricing of CNPF‘s products. Changes in prices may also affect consumer demand,as CNPF‘s consumers are generally price sensitive. While CNPF believes it has been able tosuccessfully pass on price increases historically to its customers, there is no assurance thatany future increases in cost of sales can be fully passed on to consumers. As a result, anymaterial increase in the market price of raw materials could have a material adverse effect onCNPF‘s operating margins, which may affect its financial position and operating
performance.
Economic, Social and Political Conditions in the Philippines
While CNPF has operations outside the Philippines, all of CNPF‘s assets as of December 31,2013 were located in the Philippines, and approximately 69% of its revenues for the yearended December 31, 2013, were derived from its operations in the Philippines. As a result,CNPF‘s business, financial condition, results of operations and prospects are substantiall yinfluenced by economic and political conditions in the Philippines. Although the Philippineeconomy has experienced stable growth in recent years, the Philippine economy has in the
past experienced periods of slow or negative growth, high inflation, significant devaluation ofthe Peso, and has been significantly affected by economic volatilities in the Asia-Pacific
region. Also, in the past, there have been periods of political instability in the Philippines,including impeachment proceedings against two former presidents and the chief justice of theSupreme Court of the Philippines, and public and military protests arising from allegedmisconduct by previous administrations. Sales of most of CNPF‘s products are directlyrelated to the strength of the Philippine economy (including overall growth levels and interestrates) and tend to decline during economic downturns. Any deterioration in the Philippineeconomy, including a significant deterioration in the value of the Peso, may adversely affectconsumer sentiment and lead to a reduction in demand for CNPF‘s products.
Competition
CNPF faces competition in the Philippines as well as in the other countries in which itdistributes its products. It competes with a number of multi-national, national, regional andlocal competitors. Although certain of CNPF‘s products have significant market shares in the

7/21/2019 PreliminaryProspectus - Century
http://slidepdf.com/reader/full/preliminaryprospectus-century 97/648
Philippines and in many cases are market leaders in their respective product categories, CNPFexpects to face increasing competition as it continues to grow its business. Competitivefactors generally affecting CNPF‘s businesses include price, product quality, brand awarenessand customer loyalty, distribution coverage, customer service and the ability to effectivelyrespond to shifting consumer tastes and preferences. For a more detailed discussion oncompetition, please see ― Business‖ beginning on page 127 of this Prospectus, and ― Industry‖
beginning on page 158 of this Prospectus
Seasonality
CNPF‘s sales are affected by seasonality in customer purchase patterns. In the Philippines,
most food products, including those produced by CNPF, experience increased sales during the
Christmas season. As a result, seasonality could affect CNPF‘s financial cond ition and results
of operations from one quarter to another, particularly in relation to the fourth quarter of each
year.
Introduction of New Products and Marketing Initiatives
CNPF believes that many consumer food products are impulse and discretionary purchases,which are particularly sensitive to competitive pressures. A key element in maintaining itsmarket share in the highly competitive Philippine food market has been for CNPF tocontinuously introduce new products and product extensions.
In addition to introducing new products, CNPF has undertaken marketing initiatives usingorganized advertising campaigns to differentiate its products and further expand market share.CNPF devotes significant expenditures to support advertising and branding, including fundingfor advertising campaigns, such as television commercials and radio and print advertisements.CNPF‘s advertising and promotion costs accounted for a significant proportion of total
revenue, comprising 3% for the year ended December 31, 2013.
The development and introduction of new products and the use of marketing initiatives can
substantially increase CNPF‘s operating costs. Although CNPF believes that these higher
costs are justified by increased sales from new and existing products, there is typically a delay
between the incurrence of these costs and any such sales. Furthermore, CNPF cannot be
assured of when, if ever, these expenditures will result in increased revenues.
CRITICAL ACCOUNTING POLICIES
Critical accounting policies are those that are both (i) relevant to the presentation of CNPF’s
financial condition and results of operations and (ii) require management’s most difficult,
subjective or complex judgments, often as a result of the need to make estimates about the
effect of matters that are inherently uncertain. As the number of variables and assumptions
affecting the possible future resolution of the uncertainties increase, those judgments become
even more subjective and complex.
For information on CNPF‘s significant accounting policies and significant accounting
judgments and estimates, see Note 6, starting on Page 9 of the audited financial statements of
CNPF as parent included elsewhere in this Prospectus.

7/21/2019 PreliminaryProspectus - Century
http://slidepdf.com/reader/full/preliminaryprospectus-century 98/648
DESCRIPTION OF KEY LINE ITEMS
Sale of Goods
CNPF, GTC and SMDC derive their net sales from sale of goods to their customers less value
added tax (―VAT‖) and sales returns and allowances. GTC customers consist of importer -
brand owners, food producers and retailers, traders and agents in the international tuna
market. CNPF and SMDC customers include largely customer accounts serving the modern
trade, general trade and food service channels of the domestic market. In addition, CNPF and
SMDC have customers that serve the export market.
Cost of goods sold
CNPF‘s, GTC‘s and SMDC‘s cost of goods sold consists primarily of cost of goods available
for sale (i.e. inventory at the beginning of the year plus additional stocks from production and
purchases during the year) less inventory at the end of the year. The cost elements comprising
cost of goods sold include raw materials and packaging materials cost plus conversion costs.Conversion costs consist of direct labor cost, utilities expense, and manufacturing overhead
expense.
Operating Expenses (Income)
CNPF‘s, GTC‘s and SMDC‘s operating expenses comprise primarily of salaries and wages
and other staff costs, advertising and promotions cost, freight and distribution expenses, other
selling and market expenses, depreciation, repairs and maintenance expenses, and other
administrative expenses.
Other I ncome (Expense)
Other income (expense) consists primarily of interest expense and other financing charges,
investment income, foreign exchange gain (loss), inventory loss, and other miscellaneous
income and expenses.
I ncome Tax Expense
Income tax expense comprises current income tax expense and deferred income tax expense.
Tr ade Receivables
Trade receivables are recorded at fair value plus transaction less provisions for impairmentloss, and are primarily from sales with an average credit term of 30 to 45 days. Impairment
loss is provided when there is objective evidence that the Company will not be able to collect
from specific customers certain amounts due to it in accordance with the original terms of the
receivables. The amount of the impairment loss is determined based on evaluation of
available facts and circumstances, including but not limited to, the length of the Company‘s
relationship with the customers, the customers‘ current credit status based on known market
forces, average age of the accounts, collection experience and historical loss perspective.
I nventories
Inventories comprise primarily of raw materials, work-in-process goods and finished goods.
These are booked at the lower of cost and net realizable value. Cost is determined using thefirst-in, first-out method. Finished goods and work-in process include the cost of raw

7/21/2019 PreliminaryProspectus - Century
http://slidepdf.com/reader/full/preliminaryprospectus-century 99/648
materials, direct labor and a proportion of manufacturing overhead based on normal operatingcapacity. Raw material costs include all costs attributable to acquisition such as the purchase
price, import duties and other taxes that are not subsequently recoverable from taxingauthorities.
Inventories are derecognized when sold or otherwise disposed of.
Tr ade Payable
Trade payables comprise of obligations to suppliers incurred in the ordinary course of business. These are recognized at fair value and subsequently measured at amortized costduring the period when the goods or services are received or rendered.
Canned and Processed Fish. Net sales from the canned and processed fish business
segment totaled ₱7,013.8 million, or 37% of total CNPF sales, for the year ended
December 31, 2013. Of these sales, canned tuna and milkfish contributed ₱5,380.8
million while canned sardine accounted for ₱1,633.0 million. This included sales of branded products under the Century, 555, Blue Bay, Fresca and Lucky 7 labels to
both the domestic and export market.
Tuna Export. Net sales from the tuna export business segment totaled ₱5,862.7
million. This represented 31% of total CNPF sales and comprised canned tuna,
pouched tuna and frozen loins to the private-label export market.
Canned Meat. Net sales from the canned meat business were ₱4,598.6 million for the
year ended December 31, 2013, which represents 24% of total CNPF sales. Net sales
represents sales to the modern trade accounts, general trade accounts, food service
accounts and export accounts for canned products including corned beef, meat loaves,
and ready-to-eat viands under the Argentina, Swift , 555, Wow, Lucky 7 , and Shanghai
labels.
Dairy and Mixes. Net sales from the dairy and mixes business were ₱1,548.0 million
for the year ended December 31, 2013, which represents 8% of the total CNPF sales.
Net sales includes sales of evaporated milk, condensed milk, creamers, full cream
powdered milk, flavour mixes and 3-in-1 coffee products under the Angel , Birch
Tree, Home Pride and Kaffe de Oro brands.
Cost of sales
The Company‘s cost of sales was ₱15,696.8 million for the year ended December 31, 2013,which represents 82.5% of net sales, primarily comprised of: (1) cost of raw materials; (2)
cost of packaging; and (3) conversion costs.
The breakdown for each business segment is as follows:
Canned and Processed Fish. The canned and processed fish business recorded a cost
of sales of ₱5,354.6 million for the year ended December 31, 2013, which represents
a 34% share of the total CNPF cost of sales and a 76% cost ratio to total canned and
processed fish segment net sales.
Tuna Export. The tuna export business registered a cost of sales of ₱5,561.1 million
for the year ended December 31, 2013, which represents a 35% share of total CNPF
cost of sales and a 95% cost ratio to total tuna export net sales.

7/21/2019 PreliminaryProspectus - Century
http://slidepdf.com/reader/full/preliminaryprospectus-century 100/648
Canned Meat. The cost of sales for the canned meat business amounted to ₱3,558.6
million for the year ended December 31, 2013, which represents a 23% share of
CNPF‘s total cost of sales and a 77% cost ratio to total canned meat segment net
sales.
Dairy and Mixes. The dairy and mixes business recorded a cost of sales ₱1,222.5
million for the year ended December 31, 2013, which represents an 8% share of
CNPF‘s total cost of sales and a 79% cost ratio to total dairy and mixes net sales.
Gross prof it
As a result of the foregoing, the Company‘s total gross profit was ₱3,326.3 million for the
year ended December 31, 2013, which translates to 17% of net sales. The following table
summarizes the breakdown of the Company‘s revenues, cost of sales, and gross profit
between its three business segments:
Canned and
Processed FishTuna Export Canned Meat Dairy and Mixes Total CNPF
₱ Mill % ofSales
₱ Mill % ofSales
₱ Mill % ofSales
₱ Mill % ofSales
₱ Mill % ofSale
s Net 7,013.8 100% 5,862.7 100% 4,598.6 100% 1,547.98 100
%19,023.0
5100%
Sales
Cost ofSales
5,354.6 77% 5,561.1 95% 3,558.6 77% 1,222.45 79% 15,696.78
83%
Gross
Profit
1,659.22 23% 301.58 5% 1,039.95 28% 325.53 21% 3,326.28 17%
Other I ncome
For the year ended December 31, 2013, the Company‘s other income totaled ₱175.8 million,
which translates to 0.9% ratio to total net sales. The breakdown of other income by business
segment includes ₱47.3 million or 0.7% ratio to sales for the canned and processed fish
business, ₱106.1 million or 1.8% ratio to sales for the tuna export business, ₱22.3 million or
0.5% ratio to sales for the canned meat business, and ₱0.1 million or a negligible ratio to sales
for the dairy and mixes business.
Operating expenses
CNPF operating expenses were ₱2,415.2 million for the year ended December 31, 2013,
which represents 13% of total net sales. Operating expenses consists of selling and
distribution expenses, marketing expenses such as advertising and promotions, and general
and administrative expenses. The breakdown of operating expenses by business segment is set
forth below:

7/21/2019 PreliminaryProspectus - Century
http://slidepdf.com/reader/full/preliminaryprospectus-century 101/648
Canned and
Processed Fish Tuna Export Canned MeatDairy and
MixesTotal CNPF
₱ Mill
% of
Sales ₱ Mill
% of
Sales ₱ Mill
% of
Sales ₱ Mill
% of
Sales ₱ Mill
% of
Sales Net
7,013.8 100 5,862.7 100 4,598.6 100 1,548 10019,023.05
100Sales
OperatingExpenses
1,334.0 19% 148.4 3% 657.50 14%275.31
78318%
2,415.24
13%
F inance Costs
The Company‘s finance cost totaled ₱112.4 million, or 0.6% of total net sales for the year
ended December 31, 2013. The breakdown of this finance cost by business segment reflects
canned/processed fish at ₱55.6 million, or 0.8% of segment sales; export tuna at ₱49.4 million
or 0.8%; canned meat at ₱5.8 million or 0.1% of segment sales; and dairy and mixes at ₱1.6
million or 0.1% of segment sales.
Other Expense
The Company‘s other expense account totaled ₱14.0 million, representing 0.1% of total
CNPF sales for the year ended December 31, 2013. The breakdown of other expense by
business segment would include canned/processed fish – at ₱6.9 million, or 0.1% of segments
sales; tuna export – at ₱3.2 million, or 0.1% of segment sales; and canned meat – at ₱3.9
million, or 0.1% of segment sales.
I ncome Tax Expense
Income tax expense totaled ₱216.4 million or 1.1% of total CNPF sales for year ended
December 31, 2013. The effective tax was 23% compared to the standard corporate tax rate of
30%, primarily due to the difference between taxable profit and net profit where the former
reflects adjustments to exclude items of income or expense that are taxable or deductible in
other years, or are subjected to lower income tax rate or income tax holiday (―ITH‖), or are
never taxable or deductible. Canned and processed fish incurred income tax expense of ₱90.7
million for a tax rate of 30%. Tuna export incurred income tax expense of ₱28.3 million for a
tax rate of 17%. Canned meat had an income tax expense of ₱81.3 million for a tax rate of
19%. Dairy and mixes business incurred an income tax expense of ₱15.3 million for a tax rateof 27%.
Net Profit for the Peri od
As a result of the foregoing, the Company‘s total net profit for the year ended December 31,
2013 was ₱743.9 million, or a return on sales (―ROS‖) ratio of 3.9%. Canned and preserved
fish business registered ₱136.5 million, or 1.9% ROS. Tuna exports registered ₱209.6
million, or 3.0% ROS. Canned meat registered ₱360.0 million, or 7.8% ROS. Finally, dairy
and mixes registered ₱45.5 million, or 2.9% ROS.

7/21/2019 PreliminaryProspectus - Century
http://slidepdf.com/reader/full/preliminaryprospectus-century 102/648
LIQUIDITY AND CAPITAL RESOURCES
The Company‘s principal liquidity requirements are for purchases of raw materials and
inventory, working capital requirements, and capital expenditures for plant maintenance and
production efficiency.
The Company‘s principal sources of liquidity are from internally generated cash from
operations and short-term bank loans. For the year ended December 31, 2013, the Company
had, on a pro forma consolidated basis, total cur rent assets of ₱7,026 million, of which cash
and cash equivalents accounted for 11% or ₱804 million. This was against the Company‘s
total current liabilities of ₱5,305 million, 48% of which (or ₱2,535 million) were non -interest
bearing trade payables.
The Company expects a growth in its working capital due to increased sales and market shareexpansion. Moving forward, the Company expects to fund these requirements from itsoperating cash flows, borrowings and proceeds of the Offer. The Company intends to use a
portion of the proceeds from the Offer to partially pay off short-term debt financingarrangements and to support working capital requirements. See ―Use of Proceeds‖ beginningon page 55 of this Prospectus.
The Company may also, from time to time, seek other sources of funding, which may include
debt or equity financing, depending on its financing needs and market conditions. In the
course of conducting its business, the Company has, and will continue, to incur short-term 60-
90 days revolving credit lines from several banking institutions at an average interest rate of
2.5% to 3.5% per annum. CNPF expects that its principal uses of cash for fiscal year 2014
will be for payment of financial obligations, capital expenditures to increase production
capacity and cost efficiency, working capital and/or potential acquisitions.
The following table sets forth the selected information from the Company‘s pro formaconsolidated statement of cash flows for the period indicated:
For the year ended
December 31, 2013
(in ₱ millions)
Cash from operating activities .............................................................. 985
Cash used in investing activities ........................................................... (252)
Cash used in financing activities .......................................................... (668)
Net increase in cash and cash equivalents ....... 65
Cash and cash equivalents
Beginning of year ......................................................................... 739
End of year ................................................................................... 804
Net Cash f low from operating activiti es
CNPF‘s pro forma net cash from operating activities was ₱985.1 million for the year ended
December 31, 2013. The primary source of cash was ₱1,259.9 million from operating cash
flows before working capital changes, ₱2,056.6 million decrease in inventories, ₱144.2
million decrease in prepayment and other current assets, ₱5.2 million decrease in other non-
current assets, and ₱7.0 million from translating operating assets and liabilities. Cash used in
operations included ₱1,057.5 million increase in trade and other receivables, ₱1,135.9 million
decrease in trade and other payables, and ₱64.9 million decrease in other non -current
liabilities, ₱8.4 million for retirement fund contributions, and income tax payments o f ₱221million.

7/21/2019 PreliminaryProspectus - Century
http://slidepdf.com/reader/full/preliminaryprospectus-century 103/648
Cash fl ows used in investing activiti es
Cash flow used in investing activities for the year ended December 31, 2013 was ₱251.9million. This was primarily attributable to additions in property, plant and equipment ₱341.8million, offset by ₱10.2 million interest received and ₱79.7 million proceeds from the sale of
property, plant and equipment.
Cash f low used in f inancing activiti es
Cash flow used in financing activities for the year ended December 31, 2013 was ₱668.3
million. This was primarily attributable payments of borrowings and interest expense of
₱555.8 million and ₱112.5 million, respectively.
Capital Expenditures
The Company regularly invests in capital expenditures to support on-going maintenance andcapacity utilization of its property, plant and equipment.
CNPF‘s pro forma capital expenditures for the year ended December 31, 2013 were ₱342
million. The table below sets forth the components of the pro forma capital expenditures of
CNPF for 2013, together with its budgeted capital expenditures for 2014. This is a forward-
looking statement. See ― Forward-Looking Statements‖ beginning on page vi. Additional
factors that could cause the Company‘s actual results, performance or achievements to differ
materially from forward-looking statements include, but are not limited to, those disclosed
under ― Risk Factors‖ and elsewhere in this Prospectus.
For the years ended December
31(in ₱ millions)
2013 2014
Buildings/Land /Leasehold improvements ....... 3 162
Machineries & equipment ............................... 120 487
Construction in progress .................................. 188
Other fixed assets ............................................ 30 80
Total capital expenditures.............................. 342 729
CNPF (pro forma) has historically sourced funding for capital expenditures through internal
cash generation and provisions for working capital.
The Company will use the net proceeds as well to fund capital expenditures that will improve
cost efficiencies and achieve higher profitability in the future. CNPF (pro forma) has
budgeted ₱729 million for capital expenditures for 2014. See ―Use of Proceeds‖ beginning on
page 55 of this Prospectus.
The figures in CNPF‘s capital expenditure plans are based on management‘s estimates and
have not been appraised by an independent organization. In addition, CNPF‘s capital
expenditure plans are subject to a number of variables, including availability of financing on
acceptable terms, the identification of new projects and potential acquisitions, and
macroeconomic factors such as the Philippine‘s economic performance and interest rates.
There can be no assurance that GTC and SMDC will execute their capital expenditure plansas contemplated at or below estimated costs.

7/21/2019 PreliminaryProspectus - Century
http://slidepdf.com/reader/full/preliminaryprospectus-century 104/648
Contractual Obligations and Commitments
The following table sets forth the Company‘s contractual obligations and commitments as of
December 31, 2013:
Contractual Obligations and Commitments
Principal Payments Due by Period
(in ₱ millions)
Total 2014
2015-
2018
After
2018
Interest-bearing loans and borrowings ........ 2,717 2,717
Trade and other payables ............................ 2,535 2,535
Dividends payable .....................................
Advances from related parties ...................
Other long-term liabilities .......................... 0 0
Total ..........................................................
5,252 5,252
The discussion above contains forward-looking statements. See ― Forward-Looking
Statements‖ beginning on page vi. Additional factors that could cause the Company‘s actual
results, performance or achievements to differ materially from forward-looking statements
include, but are not limited to, those disclosed under ― Risk Factors‖ and elsewhere in this
Prospectus.
Debt Obligations and Facilities
CNPF‘s total amount of pro forma short-term debt as of December 31, 2013 was ₱2,717
million which was comprised of notes payable. There is no the pro-forma long-term debt.
The following table sets forth CNPF‘s pro forma total consolidated indebtedness as of the
periods indicated:
As of
December 31,
2013
(in ₱ millions)
Short-term debt .................................................................................................... 2,717.3
Long-term debt ..............................................................................................…. 0.0
Total ................................................................................................................... 2,717.3
CNPF intends to repay, with proceeds from the Offer, existing indebtedness of up to ₱1,290million relating to loans with terms of 60 to 90 days with annual interest rate average 2.5% to3.5% per annum which were incurred primarily to fund growth in accounts receivable-tradegiven expanding sales revenues. See ―Use of Proceeds‖ beginning on page 55 of thisProspectus.

7/21/2019 PreliminaryProspectus - Century
http://slidepdf.com/reader/full/preliminaryprospectus-century 105/648
Off-Balance Sheet Arrangements
As of December 31, 2013, CNPF did not have any off-balance sheet arrangements.
KEY PERFORMANCE INDICATORS
The following are the major performance measures used by CNPF as a whole and its business
segments for 2013:
Total Sales
This represents total revenues generated from sales of the Company‘s three business
segments: canned and processed fish (including tuna export), canned meat, and dairy and
mixes. Sale of goods to customers are less VAT and sales returns and allowances. The
Company considers this to be a measure of volume and growth.
Gross Profit Margin (%)
This represents the portion of revenues remaining after deducting cost of sales. The Company
considers this to be a measure of its pricing strategy and financial health.
.
Before Tax Return on Sales (%)
This represents the ratio of net income before interest and tax against total sales. The
Company considers this to be a measure of its operational efficiency and profit for every unit
sold.
Return on Equity (%)
This represents the ratio of net income and shareholder equity. The Company considers this to
be a measure of the its bottom line profitability.
Current Ratio (x)
This represents the amount of total current assets as a multiple of total current liabilities. The
Company considers this to be a measure of its liquidity and ability to pay short-term
obligations.
Total CNPF For the yearended
December 31,
2013
Total SalesGross Profit Margin (%) ............................................................................
₱ 19,02317%
Before Tax Return on Sales (%) ................................................................ 5%
Return on Equity (%) ................................................................................ 26%
Current Ratio (x) ....................................................................................... 1.32

7/21/2019 PreliminaryProspectus - Century
http://slidepdf.com/reader/full/preliminaryprospectus-century 106/648
Canned and Processed Fish
For the year
ended
December 31,
2013
Total SalesGross Profit Margin (%) ............................................................................
₱ 7,01424%
Before Tax Return on Sales (%) ................................................................ 3%
Current Ratio (x) ....................................................................................... 1.56
Canned MeatFor the years
ended
December 31,
2013
Total SalesGross Profit Margin (%) ............................................................................
₱ 4,59923%
Before Tax Return on Sales (%) ................................................................ 10%
Current Ratio (x) ....................................................................................... 1.33
Dairy and MixesFor the years
ended
December 31,
2013
Total SalesGross Profit Margin (%) ............................................................................
₱ 1,54821%
Before Tax Return on Sales (%) ................................................................ 4%
Current Ratio (x) ....................................................................................... 1.85
Export TunaFor the years
ended
December 31,
2013
Total Sales
Gross Profit Margin (%) ............................................................................
₱ 5,863
5%Before Tax Return on Sales (%) ................................................................ 4%
Current Ratio (x) ....................................................................................... 1.07

7/21/2019 PreliminaryProspectus - Century
http://slidepdf.com/reader/full/preliminaryprospectus-century 107/648
QUALITATIVE AND QUANTITATIVE DISCLOSURE OF MARKET RISKS
CNPF is exposed to various types of market risks in the ordinary course of business,
including foreign exchange rate risk, commodity price risk, credit risk and liquidity risk.
Commodity Price Risk
CNPF‘s commodity price risk exposure primarily results from the use of commodities as raw
materials in its production processes. In particular, the supply and prices of fish are subject to
seasonality and there is limited fish-catching activity from November to March of the
following year. To reduce its exposure to increased fish prices during this time, CNPF
typically builds up sufficient inventories of finished products by October of each year to
minimize the need to purchase fish at increased prices. CNPF currently does not have a
commodity price hedging policy.
Foreign Exchange Rate Risk
CNPF‘s foreign exchange rate risk arises primarily from the fluctuations in exchange rate that
arise between the Philippine Peso and the U.S. dollar. The substantial majority of CNPF‘s
revenues are denominated in Pesos, while certain of its expenses, particularly its raw material
costs, are denominated in U.S. dollars or based on prices determined in U.S. dollars. In
addition, CNPF is exposed to foreign exchange risk through its export of private label tuna
and its branded products. To hedge its exposure to exchange rate fluctuations, CNPF enters
into a forward contract for each export order to secure the expected profit at time of delivery.
See ― Risk Factors – Risks Relating to the Company’s Business – CNPF is exposed to foreign
exchange risk ‖, ― Risk Factors – Risks Relating to the Philippines – Volatility in the value of
the Peso against the U.S. dollar and other currencies could adversely affect CNPF’s
business‖ and ― Exchange Rates‖.
Credit Risk
CNPF‘s exposure to credit risk relates primarily to its trade and other receivables. Generally,
CNPF‘s maximum credit exposure in the event of customers‘ and counterparties‘ failure to
perform their obligations is the total carrying amount of the financial asset as shown on the
statement of financial position. To minimize its credit risk, CNPF evaluates customer credit,
receivables and payment habits for all major customers on a quarterly basis.
Liquidity Risk
CNPF is exposed to the possibility that adverse changes in the business environment or its
operations could result in substantially higher working capital requirements and consequently,
a difficulty in financing additional working capital. CNPF manages its liquidity risk by
monitoring its cash position and maintaining credit lines from financial institutions that
exceed projected financing requirements for working capital.

7/21/2019 PreliminaryProspectus - Century
http://slidepdf.com/reader/full/preliminaryprospectus-century 108/648
MANAGEMENT’S DISCUSSION AND ANALYSIS OF FINANCIAL CONDITION
AND RESULTS OF OPERATIONS OF THE COMBINED FINANCIAL
INFORMATION FOR GTC AND SMDC
The following discussion of the combined GTC and SMDC’s recent financial results should be read in
conjunction with the auditors’ reports, the selected combined financial information for GTC and
SMDC, and the corresponding notes thereto, contained in this Prospectus and the section entitled
―Selected Combined Financial Information for GTC and SMDC‖.
The combined financial information of GTC and SMDC as of and for the years ended December 31,
2011, 2012 and 2013 was derived from the audited financial statements of GTC and SMDC prepared
in accordance with PFRS and audited by Punongbayan & Araullo.
This discussion contains forward-looking statements and reflects the current views of GTC and SMDC
with respect to future events and financial performance. Actual results may differ materially from those
anticipated in these forward-looking statements as a result of certain factors such as those set forth in
the section entitled ―Risk Factors‖ and elsewhere in this Prospectus.
OVERVIEW
GTC and SMDC are wholly-owned subsidiaries of CNPF. GTC is engaged in themanufacture and export of private label canned, pouched and frozen tuna products for exportsto markets in North America, Europe, Africa and Asia. SMDC is in the dairy and mixes
business, and produces and markets liquid milk products, powdered milk products, coffee mixand sinigang mix largely for the domestic market.
GTC was incorporated in 1997, and currently operates a 360-metric ton capacity state-of-the-art tuna processing facility in General Santos City. GTC is the Philippines‘ largest exporter of
processed tuna products with 34% share of total Philippines tuna exports, based on thePhilippine Bureau of Customs data for full year 2013. With operational strategy targetedtoward product competitiveness and international standards and building strong customerrelationships, GTC has increasingly grown its exports for products like canned tuna, pouchedtuna and vacuum-packed frozen loin products. These tuna products, which are made fromchoice premium quality skipjack and yellow fin fish materials, are offered by GTC in variousretail and institutional pack styles with the tuna material processed into flakes, chunks or solidform using either oil or brine as packing medium. GTC has supply arrangements with leadingglobal manufacturers including Chicken of the Sea, Bumblebee Foods LLC, Subway, Princes,Hagoromo, Hoko, Califor nia Garden and Rio Mare. GTC‘s tuna processing facility conformsto global standards for food production through its accreditations with the International FoodStandard, U.S. Food and Drug Administration, British Retail Consortium, European Unionand Canadian Food Inspection Agency.
SMDC has been in the dairy business since 2001, and through the years, has continuallyexpanded its product portfolio using the Angel and Birch Tree brands in product segmentssuch as evaporated milk, condensed milk, full cream milk powder and all-purpose cream. In2008, SMDC diversified into the coffee mix line through the Kaffe de Oro brand and sinigangflavoring mixes line through the Home Pride brand. Sustained brand equity, productinnovation, value for money pricing, marketing niching strategy, and distribution investmentshave made the SMDC brands own the third largest milk market share in the domestic marketamidst the traditional approach of its competitors. SMDC operates a newly-built canned milkand cream processing plant with an installed capacity of 11,000 cases per day in Taguig,
Metro Manila.

7/21/2019 PreliminaryProspectus - Century
http://slidepdf.com/reader/full/preliminaryprospectus-century 109/648
For the years ended December 31, 2011, 2012 and 2013, the respective contributions of GTCand SMDC to the combined total revenue and net income are as follows:
For the years ended December 31,
(in ₱ millions)
2011 2012 2013
Revenue % of
Total Revenue % of
Total Revenue % of
Total
GTC 3,470.7 73 3,803.6 69 5,862.7 79
SMDC 1,279.5 27 1,720.4 31 1,548 21
Total 4,750.2 100 5,524.0 100 7,410.7 100
For the years ended December 31,(in ₱ millions)
2011 2012 2013
Net
Income % of
Total Net
Income % of
Total Net Income % of
Total
GTC 58.2 88 92.1 83 136.5 75
SMDC 8.3 12 19.3 17 45.5 25
Total 66.5 100 111.3 100 182.0 100
Note: GTC’s Statement of Income expressed in US Dollar is translated to Peso using BSP’s average USD to Peso
exchange rate for the period.
FACTORS AFFECTING RESULTS OF OPERATIONS
GTC’s and SMDC’s combined results of operations are affected by a variety of factors. Set
out below is a discussion of the most significant factors that have affected GTC’s and
SMDC’s combined results in the past and which GTC and SMDC expect to affect its
combined financial results in the future. Factors other than those set out below could also
have a significant impact on GTC and SMDC’s combined results of operations and financial
condition in the future. See ―Risk Factors‖.
Raw Materials Costs and Product Prices
GTC uses skipjack and yellow fin tuna as main raw materials for production. These fishmaterials, which are procured from both local and foreign fish catcher suppliers operating inthe Western Pacific Ocean, are processed into finished products using customized packingmedium ingredient materials such as soya oil, sunflower oil, olive oil, brine and sauces.Packaging materials include tin cans, pouches, frozen loin PE nylon shrinkable vacuum bags,and cartons.
SMDC‘s principal production materials are instant full cream milk powder, skimmed milk
powder, buttermilk powder, non-dairy creamer, vegetable oil, sugar and tin cans. Milk

7/21/2019 PreliminaryProspectus - Century
http://slidepdf.com/reader/full/preliminaryprospectus-century 110/648
materials are sourced mostly through direct importation from Europe, the United States,Australia and New Zealand.
As experienced by GTC and SMDC, these materials are subject to price volatility caused by anumber of factors, including changes in global supply and demand, foreign exchange ratefluctuations, weather conditions and government regulations and controls. In addition, GTC‘sand SMDC‘s ability to obtain raw materials is affected by a number of factors beyond theircontrol, including natural disasters, governmental laws and policies, and interruptions in
production by suppliers.
Changes in the prices of raw materials have necessarily affected GTC‘s and SMDC‘s cost ofsales and management‘s decision in the pricing of GTC and SMDC products. Change s in
prices have also affected consumer demand, as both GTC and SMDC consumers andcustomers are generally price sensitive. For the last three years, 2011 to 2013, GTC andSMDC have been able to successfully pass on some or all cost increases to their customersvia selling price increases, particularly in product segments where GTC and SMDC have
relatively strong market positions. However, GTC and SMDC believe there is no assurancethat any future increases in cost of sales can always be fully passed on to consumers. As aresult, any material increase in the market price of raw materials could have a materialadverse effect on GTC‘s and SMDC‘s operating margins and sales volumes, which mayaffect overall financial position and operating performance.
Competition
GTC faces competition from tuna exporters not only from the Philippines but also from othertuna exporting countries such as Thailand, Indonesia, Ecuador, Spain and Seychelles. Giventhe commodity-like nature of tuna products, selling prices and raw material tuna fish costgenerally move in similar patterns. In 2011, 2012 and 2013, tuna fish prices have continually
risen due to declining catches, and, as a result, canned tuna prices have moved on an upwardtrend as well, adversely causing a slowdown in consumer demand in major tuna importingcountries. In an increasingly competitive tuna export market, an important element inmaintaining export market share for GTC has been GTC‘s ability to sustain its strong imageof reliability and consistency in supplying to its customers premium quality tuna products atcompetitive prices and building a long lasting customer relationship.
SMDC competes with a number of multi-national, national, regional and local competitors inthe Philippine market. In terms of market share, SMDC is in a market challenger positionagainst two large multinational dairy companies. The competitive factors generally affectingSMDC‘s business include price, product quality and innovation, brand awareness andcustomer loyalty, distribution coverage and customer service. A major factor to sustain
business growth for SMDC in 2011, 2012 and 2013 was SMDC‘s ability to spot and tapmarket opportunities amidst changing consumer tastes and preferences. Through a marketingniching strategy, SMDC has continued the market development of its Kremdensada product,which is a first-in-the-market 2-in-1 cream product launched in 2010. The 2-in-1 cream
product is a product that combines the goodness of all-purpose cream and condensed milk inone can and offers its consumers savings in cost, high quality taste and convenience in
preparation.
Seasonality
GTC‘s and SMDC‘s sales are affected by seasonality in customer purchase patterns. In the
Philippines, most food products, including those produced by SMDC, experience increased
sales during the Christmas season and summer months as consumers use the milk products for
creaming beverages, desserts, cooking and baking applications. In European export tuna

7/21/2019 PreliminaryProspectus - Century
http://slidepdf.com/reader/full/preliminaryprospectus-century 111/648
markets, the highest consumption period is the summer months while in North America, tuna
sales are year-round. As a result, seasonality could affect GTC and SMDC‘s net sales and
operating results and cause them to continue to vary from quarter to quarter during the
operating year.
Introduction of New Products and Marketing Initiatives
GTC and SMDC believe that many consumer food products are impulse and discretionary
purchases, and therefore particularly sensitive to competitive pressures. A key element in
maintaining their market share in the highly competitive markets in which they operate has
been for GTC and SMDC to continuously introduce new products and product extensions.
In years 2011 to 2103, the rising cost of tuna fish material caused canned tuna prices to rise in
a similar pattern, affecting export market demand and creating greater competitive pressures
among tuna exporters. In response to changing market conditions, GTC shifted a portion of its
manufacturing capability into frozen loin production to enter the tuna loin market where there
was growing demand for frozen tuna loins among tuna canneries operating in high-labor costcountries.
SMDC introduced new products like the KremQueso 370 ml product in 2012, Angel All
Purpose Creamer 370 ml, and Angel Evaporated Liquid Creamer 145 ml in 2013 as part of
its continuing strategy to satisfy consumer needs and preferences, increase product
differentiation, and maximize market shares and plant capacity utilization.
The development and introduction of new products and the use of marketing initiatives can
substantially increase not just the revenue but also operating costs. SMDC believes that these
higher costs are justified by increased sales from new and existing products, although there is
typically a delay between the incurrence of these costs and any such sales; and that it cannot be assured of when, if ever, these expenditures will result in increased revenues.
Economic, Social and Political Conditions in the Philippines
GTC‘s and SMDC‗s business, financial condition, results of operations and pros pects are
substantially influenced by economic and political conditions in the Philippines. Sales of most
of GTC and SMDC products are directly related to the strength of the Philippine economy
(including overall growth levels, foreign exchange rates, fuel oil prices, and interest rates) and
tend to decline during economic downturns. Any deterioration in the Philippine economy,
including a significant appreciation in the value of the Peso relative to the U.S. dollar
overseas Filipino worker remittances, may adversely affect consumer sentiment and lead to a
reduction in demand for SMDC products. A significant devaluation or appreciation of thePeso similarly affects the export demand for GTC products.
CRITICAL ACCOUNTING POLICIES
Critical accounting policies are those that are both (i) relevant to the presentation of GTC
and SMDC’s combined financial condition and results of operations and (ii) require
management’s most difficult, subjective or complex judgments, often as a result of the need to
make estimates about the effect of matters that are inherently uncertain. As the number of
variables and assumptions affecting the possible future resolution of the uncertainties
increase, those judgments become even more subjective and complex.

7/21/2019 PreliminaryProspectus - Century
http://slidepdf.com/reader/full/preliminaryprospectus-century 112/648
For information on GTC and SMDC‘s significant accounting policies and significant
accounting judgments and estimates, see Notes 4 & 5 of the combined audited financial
statements of GTC and SMDC included elsewhere in this Prospectus.
DESCRIPTION OF KEY LINE ITEMS
Sale of Goods
Each of GTC and SMDC derives its net sales from sale of goods to its customers less VAT
and sales returns and allowances. GTC customers consist of importer-brand owners, food
producers and retailers, traders and agents. SMDC customers include modern trade accounts
such as supermarkets, groceries, and convenience stores; general trade accounts such as
company distributors and large wholesalers distributing to sari-sari store and wet market
stores; food service accounts such as hotels, restaurants, caterers, bakeshops, and food
commissaries; and export accounts such as direct importers and exporter-distributors, and
exporter consolidators.
Cost of goods sold
GTC‘s and SMDC‘s cost of goods sold consists primarily of cost of goods available for sale
(i.e. inventory at the beginning of the year plus additional stocks from production and
purchases during the year) less inventory at the end of the year. The cost elements comprising
cost of goods sold include raw materials and packaging materials cost plus conversion costs
consisting of direct labor cost, utilities expense, and manufacturing overhead expense.
Operating Expenses (Income)
GTC‘s and SMDC‘s operating expenses comprise primarily of salaries and wages and other
staff costs, advertising and promotions cost, freight and other selling expenses, depreciation,repairs and maintenance expenses, foreign currency losses related to conversion of
transactional to functional currency, and other administrative expenses.
Other I ncome (Expense)
Other income (expense) consists primarily of interest expense and other financing charges,
investment income, foreign exchange gain (loss), and other miscellaneous income and
expenses.
I ncome Tax Expense
Income tax expense comprises current income tax expense and deferred income tax expense.
RESULTS OF OPERATIONS
Year ended December 31, 2013 compared to year ended December 31, 2012
Sale of Goods
GTC and SMDC registered a combined net sale of goods of ₱7,419 million for the year ended
December 31, 2013, an increase of 34% from the ₱5,524 million recorded for the year ended
December 31, 2012. The principal reasons for this increase were as follows:
GTC’s Tuna Export

7/21/2019 PreliminaryProspectus - Century
http://slidepdf.com/reader/full/preliminaryprospectus-century 113/648
Net sales in tuna export business were ₱5,863 million in fiscal year 2013, representing a 54%
increase from the ₱3,804 million recorded in fiscal year 2012. This increase in net sales
primarily reflected the effect of higher volumes and higher selling prices in fiscal year 2013,
arising from strong export shipments for tuna products to Europe and parts of Asia. The Peso
depreciation against the U.S. dollar likewise boosted export competitiveness and Peso selling prices during the year.
SMDC’s Dairy and Mixes
Net sales in the dairy and mixes business were ₱1,5 million in fiscal year 2013, which
represented a 9.5% decrease from the ₱1,720 million net sales recorded in fiscal year 2012.
This decrease is due to lower sales volume. Fiscal year 2012 had higher than average sales
performance due to export orders from Thailand, whose market supply for evaporated milk
products was operationally disrupted by the flood calamity that hit Bangkok, Thailand. In
2013, this export sales opportunity ended as the Thai milk market supply returned to normal
conditions. Another key factor slowing down sales in 2013 was the short term transitional
effect of changes made in CNPF‘s sales distributor program. CNPF‘s distributor programcalled for a correction of the distributors‘ excessive trade inventory levels via improvements
in warehouse stock management, and required the distributors to re-channel freed up working
capital resources for use instead in expanding and deepening distribution activities.
Cost of goods sold
GTC and SMDC‘s combined cost of goods sold increased by 39% to ₱6,845 million for the
year ended December 31, 2013 from ₱4,932 million for the year ended December 31, 2012,
primarily due to higher volume and higher costs of raw materials used.
GTC’s Tuna Export
The cost of goods sold for the tuna export business amounted to ₱5,561.1 million for fiscal
year 2013, which represented a 60% increase from cost of goods sold of ₱3,512 million for
fiscal year 2012. The increase in cost of goods sold principally reflected the higher share of
fish cost to total production cost from 63% in 2012 to 76% in 2013. Share of total materials
cost to total product cost was 84% in 2013 versus 77% in 2012 .
SMDC’s Dairy and Mixes
The cost of goods sold for the dairy and mixes business amounted to ₱1,222 million for the
year ended December 31, 2013, which represented a 14% decrease from cost of goods sold of
₱1,420 million for the year ended December 31, 2012. The decrease in cost of goods sold primarily reflected the impact of lower purchase prices for key raw materials namely – milk
powder, ingredients and packaging materials. Reduction in variable overhead cost cushioned
cost inflation of raw materials. Share of total materials cost to total product cost was 91.8% in
2013 versus 91.2% in 2012.
Gross prof it
As a result of the foregoing, the combined GTC and SMDC gross profit decreased by 3% to
₱574 million for the year ended December 31, 2013 from ₱592 million for the year ended
December 31, 2012. Of this gross profit for fiscal year 2013, GTC contributed ₱ 301.6 million
while SMDC contributed ₱325.5 million versus ₱291 million and ₱301 million, respectively,
in fiscal year 2012.
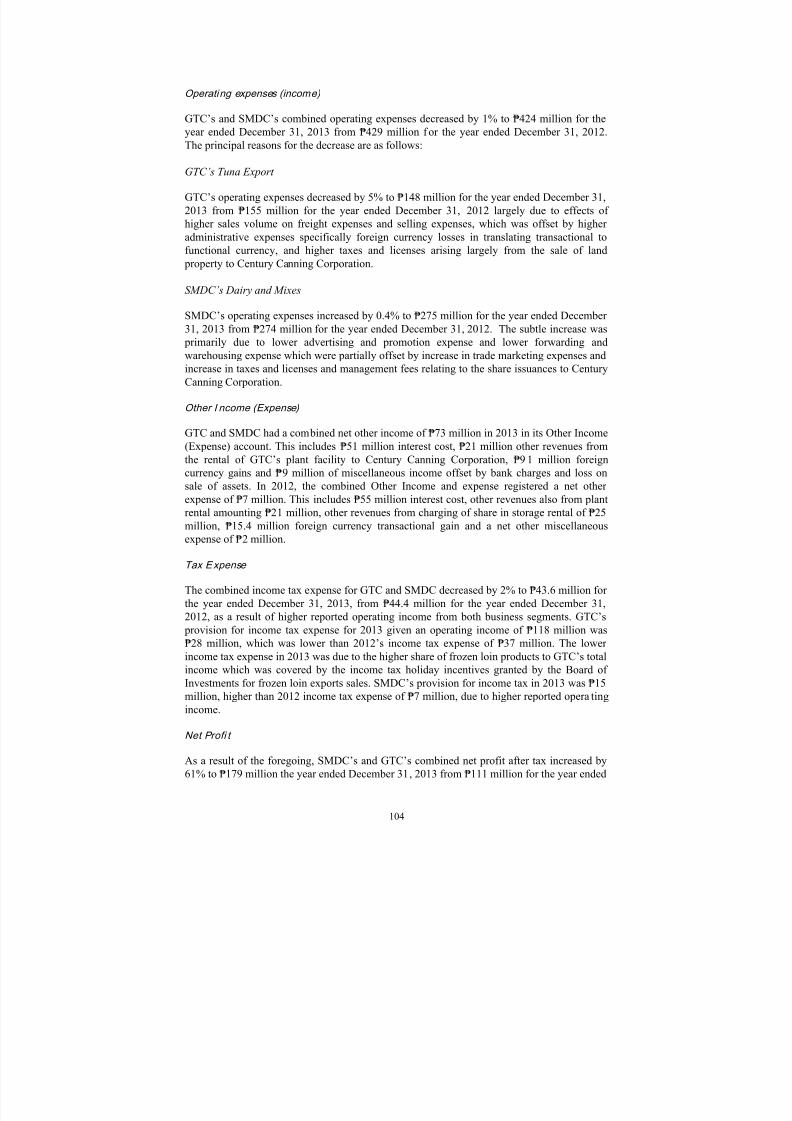
7/21/2019 PreliminaryProspectus - Century
http://slidepdf.com/reader/full/preliminaryprospectus-century 114/648
Operating expenses (income)
GTC‘s and SMDC‘s combined operating expenses decreased by 1% to ₱424 million for the
year ended December 31, 2013 from ₱429 million f or the year ended December 31, 2012.
The principal reasons for the decrease are as follows:
GTC’s Tuna Export
GTC‘s operating expenses decreased by 5% to ₱148 million for the year ended December 31,
2013 from ₱155 million for the year ended December 31, 2012 largely due to effects of
higher sales volume on freight expenses and selling expenses, which was offset by higher
administrative expenses specifically foreign currency losses in translating transactional to
functional currency, and higher taxes and licenses arising largely from the sale of land
property to Century Canning Corporation.
SMDC’s Dairy and Mixes
SMDC‘s operating expenses increased by 0.4% to ₱275 million for the year ended December
31, 2013 from ₱274 million for the year ended December 31, 2012. The subtle increase was
primarily due to lower advertising and promotion expense and lower forwarding and
warehousing expense which were partially offset by increase in trade marketing expenses and
increase in taxes and licenses and management fees relating to the share issuances to Century
Canning Corporation.
Other I ncome (Expense)
GTC and SMDC had a com bined net other income of ₱73 million in 2013 in its Other Income
(Expense) account. This includes ₱51 million interest cost, ₱21 million other revenues from
the rental of GTC‘s plant facility to Century Canning Corporation, ₱91 million foreign
currency gains and ₱9 million of miscellaneous income offset by bank charges and loss on
sale of assets. In 2012, the combined Other Income and expense registered a net other
expense of ₱7 million. This includes ₱55 million interest cost, other revenues also from plant
rental amounting ₱21 million, other revenues from charging of share in storage rental of ₱25
million, ₱15.4 million foreign currency transactional gain and a net other miscellaneous
expense of ₱2 million.
Tax Expense
The combined income tax expense for GTC and SMDC decreased by 2% to ₱43.6 million for
the year ended December 31, 2013, from ₱44.4 million for the year ended December 31,2012, as a result of higher reported operating income from both business segments. GTC‘s
provision for income tax expense for 2013 given an operating income of ₱118 million was
₱28 million, which was lower than 2012‘s income tax expense of ₱37 million. The lower
income tax expense in 2013 was due to the higher share of frozen loin products to GTC‘s total
income which was covered by the income tax holiday incentives granted by the Board of
Investments for frozen loin exports sales. SMDC‘s provision for income tax in 2013 was ₱15
million, higher than 2012 income tax expense of ₱7 million, due to higher reported operating
income.
Net Profi t
As a result of the foregoing, SMDC‘s and GTC‘s combined net profit after tax increased by61% to ₱179 million the year ended December 31, 2013 from ₱111 million for the year ended

7/21/2019 PreliminaryProspectus - Century
http://slidepdf.com/reader/full/preliminaryprospectus-century 115/648
December 31, 2012. Of this 2013 combined net income after tax, GTC contributed ₱138
million while SMDC shared ₱42 million. This compared with 2012 net income after of ₱92
million for GTC and ₱19 million for SMDC.
Year ended December 31, 2012 compared to year ended December 31, 2011
Sale of Goods
GTC and SMDC registered a combined net sale of goods of ₱5,524 million for fiscal year
2012, an increase of ₱774 million, or 16%, from the ₱4,750 million net sales recorded in
fiscal year 2011. Of this increase in net sales, GTC accounted for ₱333 million while SMDC
accounted for ₱441 million. The principal reasons for this increase in net sales for GTC and
SMDC were as follows:
GTC’s Tuna Export
Net sales in tuna export business were ₱3,804 million in fiscal year 2012, representing anincrease of 10% from the ₱3,471 million recorded in fiscal year 2011. This increase in net
sales reflected the higher sales volumes and higher selling prices of tuna products exported.
Fiscal year 2012 marked GTC‘s move to shift portions of its production capacities toward the
higher value, higher margin products. A further boost to GTC‘s 2012 net sales was fishmeal
product, which increased its net sales to ₱254 million from ₱121 million in 2011 largely due
to improved fishmeal production output.
SMDC’s Dairy and Mixes
Net sales in dairy and mixes business were ₱1,720 million in fiscal year 2012, an increase of
₱441 million, or 34%, over fiscal year 2011. Two contributing factors to sales growth in 2012
over 2011 were the (1) increased domestic sales of SMDC‘s newly-launched 2-in-1 creamer products and evaporated liquid creamer products and (2) export of evaporated milk products
to the Thai market which experienced supply disruptions for the product due to the huge flood
calamity that hit the city of Bangkok.
Cost of goods sold
The combined cost of goods sold for GTC and SMDC totaled ₱4,932 million in fiscal year
2012, or an increase of ₱612 million, or 14%, over the ₱4,320 million recorded in 2011. The
principal reasons for this increase were as follows:
GTC’s Tuna Export
GTC‘s cost of goods sold totaled ₱3,512 million in fiscal year 2012, representing a 9%
increase from the ₱3,232 million recorded in fiscal year 2011. Higher sales volume and high
unit production cost per case were key factors to the increase in cost of goods sold. High fish
cost, ingredients materials cost and direct labor cost associated with frozen tuna loin
production were key factors to higher unit cost of sales in 2012.
SMDC’s Dairy and Mixes
SMDC‘s cost of goods sold amounted ₱1,420 million in fiscal year 2012, or 30%, increase
from the ₱1,088 million recorded in fiscal year 2011. This increase reflected the cost of sales
effect of higher sales volume as well as the lower product cost in 2012 attributable to lower purchase prices for milk powder materials.

7/21/2019 PreliminaryProspectus - Century
http://slidepdf.com/reader/full/preliminaryprospectus-century 116/648
Gross prof it
As a result of the foregoing, the combined gross profit for GTC and SMDC was ₱592 million
for the year ended December 31, 2012, an increase of ₱162 million, or 38%, from ₱430
million for the year ended December 31, 2011. Of this gross profit for fiscal year 2012, GTC
contributed ₱291 million while SMDC contributed ₱301 million.
Operating expenses
GTC‘s and SMDC‘s combined operating expenses increased by ₱143 million, or 50%, to
₱429 million for the year ended December 31, 2012 from the ₱286 million recorded for the
year ended December 31, 2011. Of this increase, GTC accounted for ₱49 million while
SMDC contributed ₱94 million. The principal reasons for these increases in operating
expenses of GTC and SMDC are as follows:
GTC‘s operating expenses for fiscal year 2012 totaled ₱155 million, a 46% increase from the
₱106 million recorded for fiscal year 2011. The increase in GTC‘s operating expenses isattributed to a ₱10 million decrease in selling expenses which was fully offset by the foreign
currency loss (from transactional to functional) of ₱42 million
SMDC‘s operating expenses for fiscal year 2012 totaled ₱274 million, a ₱94 million, or 52%,
increase from the ₱180 million recorded for fiscal year 2011. The increase in SMDC‘s
operating expenses is largely due to a ₱46 million increase in spending on a dvertising and
promotions and trade marketing activities in order to boost sales revenues and consumer
brand awareness. Contributing as well to higher operating expenses is an increase of ₱34
million on freight and delivery expenses as a result of servicing higher volume of customer
orders. Fixed administrative expenses in 2012 increased by ₱2 million as compared to 2011.
Other Expense (Income)
GTC‘s and SMDC‘s combined net other expense was ₱7 million in 2012 consisting of ₱34
million interest cost, ₱4 million of bank charges, ₱15 million of foreign currency loss, and
₱46 million other revenues from the rental of a portion of GTC‘s plant facility to Century
Canning Corporation. In 2011, GTC and SMDC had a combined net other expense of ₱42
million, the composition of which was ₱26 million interest cost, ₱37 million foreign currency
loss, ₱7 million bank charges, ₱2 million other financing charges, ₱18 million of rental
revenues and ₱ 12 million of miscellaneous income.
Tax Expense
Income tax in 2012 was ₱44 million, an increase of ₱9 million from ₱35 million in 2011. Of
total income tax expense in 2012, GTC accounted for ₱37 million or an increase of ₱5 million
from ₱32 million in 2011. SDMC on the other hand accounted for ₱7 million of total income
tax expense in 2012, or ₱3 million higher than 2011.
Net Profi t
As a result of the factors discussed above, the combined net profit after tax for GTC and
SMDC was ₱111 million in 2012, which was ₱45 million higher than 2011. Of this combined
net profit after tax in 2012, GTC contributed ₱92 million, or an increase of ₱34 million from
2011, while SMDC shared ₱19 million, or an increase of ₱11 million from 2011.

7/21/2019 PreliminaryProspectus - Century
http://slidepdf.com/reader/full/preliminaryprospectus-century 117/648
LIQUIDITY AND CAPITAL RESOURCES
For the years ended December 31, 2011, 2012 and 2013, GTC‘s and SMDC‘s principal
sources of liquidity were internally generated funds from operations and bank loans which
were sufficient to meet requirements for working capital and additions to property, plant and
equipment. As at December 31, 2011, 2012 and 2013, GTC and SMDC reported combined
cash and cash equivalents of ₱115.9 million, ₱127.7 million and ₱413.7 million, respectively.
Collectively, GTC and SMDC expect that their principal uses of cash for fiscal year 2014 will
be ₱1,671.0 million for payment of short term loans, ₱176.0 million for capital expenditures,
and ₱423.8 million to improve working capital position. Their source of cash will primarily
be operating cash flows and proceeds of the Offer. GTC and SMDC may also from time to
time seek other sources of funding, which may include debt or equity financing, depending on
their financing needs and market conditions.
The following table sets forth selected information from the combined financial informationfor GTC and SMDC, particularly, the statements of cash flows for the periods indicated:
For the year ended December 31,
(in ₱ millions)
2011 2012 2013
Cash from (used in) operating activities ......... ........ 520.3 283.3 42.2
Cash from (used in) investing activities ................. (104.0) (70.2) (183.9)
Cash from (used in) financing activities ......... ........ (410.3) (201.3) 427.7
Net increase (decrease) in cash and cash
equivalents ............................................................ 6.0 11.8 285.9
Cash and cash equivalentsBeginning of year .......................................... 109.9 115.9 127.7
End of year .................................................... 115.9 127.7 413.7
Cash Flow
Cash f low fr om (used in) operating activiti es
Net cash from operating activities is primarily affected by net cash generated from operations
and changes in net working capital requirements. GTC‘s and SMDC‘s combined net cash
from (used in) operating activities were ₱520.3 million, ₱283.3 million, and ₱42.2 million for
the years ended December 31, 2011, 2012, and 2013, respectively.
In 2011, the primary source of cash was ₱301.7 million from operating cash flows before
working capital changes, ₱62.8 million from decrease in trade and other receivables, ₱2.7
million from increase in other non-current assets, and ₱204.7 million from increase in trade
and other payables. Cash used in operations included ₱21.6 million for additional inventories,
₱6.2 million for increase in prepayments to suppliers and other current assets, an addition of
₱3.9 million from translating operating assets and liabilities, ₱3.9 million for retirement fund
contributions, and income tax payments of ₱18.4 million.
In 2012, the primary source of cash was ₱340.5 million from operating cash flows before
working capital changes plus reduction of ₱1.4 million in trade and other receivables,
decrease of ₱2.6 million in other non-current assets, and increase in trade and other payablesof ₱52.4 million. Cash used in operations also includes ₱19.2 million for additional

7/21/2019 PreliminaryProspectus - Century
http://slidepdf.com/reader/full/preliminaryprospectus-century 118/648
inventories, ₱12 million for increase in prepayments to suppliers and other current assets, a
reduction of ₱36.9 million from translating operating assets and liabilities, ₱2.0 million for
retirement fund contributions, and ₱43.5 million on income tax payments.
In 2013, the primary source of cash was ₱398.8 million from operating cash flow, ₱671.7million from decrease in inventories and a decrease in other non-current assets of ₱12.8
million. Cash used in operations included ₱761.2 million for increases in trade and other
receivables (largely GTC export receivables) and ₱11.6 million from decrease in prepayment
and other current assets. Other operating uses of cash were ₱257.5 million for reduction of
trade and other payables, an addition of ₱31.9 million from translating operating assets and
liabilities, ₱1.8 million for retirement fund contributions, and ₱64.2 million for income taxes.
Cash f lows from (used in) in vesting activities
Cash flow from (used in) investing activities for the years ended December 31, 2011, 2012
and 2013 were (₱104 million), (₱70.2 million) and (₱183.9 million), respectively. In 2011,
cash flow used in investing activities was primarily due to ₱109.6 million worth of additionsto property, plant and equipment, mostly in GTC, and ₱4.6 million proceeds from sales of
property. In 2012, cash flow used in investing activities was ₱73.3 million for additional plant
and equipment largely for GTC‘s frozen loin operations and ₱3.1 million of interest received
from temporary investment and regular cash in bank balances. In 2013, cash flow used in
investing activities was ₱272.9 million additions to property, plant, and equipment primarily
due to SMDC transfer of plant location, ₱9.3 million of interest received from temporary
investment and ₱79.7 million proceeds of sale of property.
Cash flow from (used in ) fi nancing activities
Cash flow from (used in) financing activities for the years ended December 31, 2011, 2012and 2013 were (₱410.3 million), (₱201.3 million) and ₱427.7 million, respectively. In 2011,
cash flow used in financing activities was primarily for repayment of related party payables of
₱310.7 million, ₱26.5 million reductions of loan, and ₱73.1 million for interest payments. In
2012, cash flow used in financing activities consisted of a repayment of ₱380.5 million for
related party payable, ₱263.7 million net proceeds, ₱45.5 million receipt of deposits for future
stock subscription, ₱75.0 million payment of dividends and ₱55 million for interest payments.
In 2013, cash flow provided by financing activities consisted of ₱818.9 million in loans,
₱263.5 million from proceeds of issuance of shares, ₱219.7 million used for repayment of
related party payable, ₱384.0 million for payment of dividends and ₱51.0 million for interest
payment.
Capital Expenditures
GTC‘s and SMDC‘s combined capital expenditures for the years ended December 31, 2011,
2012 and 2013 were ₱109.6 million, ₱73.3 million, and ₱272.9 million, respectively. The
table below sets forth the components of the combined capital expenditures of GTC and
SMDC in 2011, 2012, and 2013, together with their budgeted capital expenditures for 2014.
The discussion involves forward-looking statements. See " Forward-Looking Statements"
beginning on page vi. Additional factors that could cause the Company‘s actual results,
performance or achievements to differ materially from forward-looking statements include,
but are not limited to, those disclosed under ― Risk Factors‖ and elsewhere in this Prospectus.

7/21/2019 PreliminaryProspectus - Century
http://slidepdf.com/reader/full/preliminaryprospectus-century 119/648
For the years ended December 31,
(in ₱ millions)
2011 2012 2013
2014
(budgeted)Leasehold, Bldg., Bldg., and Land
improvements ...............................................
14.0
8.2
3.0 64.7
Machineries, equipment, furniture and
fixtures ........................................................
68.0
37.0
95.2 98.1
Construction in progress .............................. 27.6
27.6
171.5 0
Other equipment .......................................... 0.0
0.4
3.2 13.2
Total capital expenditures .......................... 109.6 73.2 272.9 176.0
GTC accounted the majority of the aforementioned capital expenditures. During the fiscalyears 2011, 2012 and 2013, where its capital expenditures totaled ₱109.6 million, ₱76.6
million, and ₱121.1 million, respectively, GTC upgraded its manufacturing plant in General
Santos City, investing in frozen loin production equipment, steam boiler machinery, and
labelling-casing equipment, to expand and diversify output capacity to meet growing demand
volumes. GTC also invested in a tin can manufacturing plant, also in General Santos City, to
vertically integrate its production requirements for 307 tin cans and lower its tin can cost.
SMDC‘s capital expenditure in 2013 amounted to ₱151.8 million, mainly for its relocation
and expansion of its milk and mixes plant facility in Taguig City, Metro Manila.
GTC and SMDC have historically sourced funding for capital expenditures through internally
generated cash from operations.
GTC and SMDC have budgeted ₱43.3 million and ₱132.7 million, respectively, or a
combined total of ₱176.0 million, for capital expenditures for 2014. The planned capital
expenditures for 2014 are essentially a part of the continuing strategic programs to optimize
cost and capacities. GTC and SMDC expect to fund their budgeted capital expenditures
principally through a portion of the proceeds of the Offer.
The figures in GTC‘s and SMDC‘s capital expenditure plans are based on management‘s
estimates and have not been appraised by an independent organization. In addition, GTC and
SMDC‘s capital expenditure plans are subject to a number of variables depending on the
overall macro-economic and business conditions, identification of potential new projects andacquisitions, and management‘s view of GTC and SMDC‘s liquidity, financial condition and
results of operations. There can be no assurance that GTC and SMDC will execute their
capital expenditures program as planned.

7/21/2019 PreliminaryProspectus - Century
http://slidepdf.com/reader/full/preliminaryprospectus-century 120/648
Contractual Obligations and Commitments
The following table sets forth GTC‘s and SMDC‘s combined contractual obligations andcommitments as of December 31, 2013:
Contractual Obligations and Commitments
Principal Payments Due by Period
(in ₱ millions)
Total 2014 2015-18 After
2018
Interest-bearing loans and borrowings....... 2,214.6 2,214.6
Trade and other payables ... .. ... ... .. .. ... ... ... .. 524.5 525.2
Income tax payable ................................... 0.7 0.0
Dividends payable ... ... .. .. ... ... .. .. ... ... ... .. .. ..
Advances from related parties ... ... .. .. ... ... .. 240.6 240.6
Other long-term liabilities .... ... ... .. .. ... ... ... .. 0 0
Total . .. .. ... ... ... .. .. ... ... ... .. .. .. .. ... ... .. .. ... ... ... .. 2,980.4 2,980.5
The discussion above involves forward-looking statements. See " Forward-Looking
Statements" beginning on page vi. Additional factors that could cause the Company‘s actual
results, performance or achievements to differ materially from forward-looking statements
include, but are not limited to, those disclosed under ― Risk Factors‖ and elsewhere in this
Prospectus.
Debt Obligations and Facilities
GTC‘s and SMDC‘s combined shor t-term debt and no long-term debt as of December 31,2013 was ₱2,214.6 million. The short-term debt was comprised of revolving 90-day
promissory notes with various commercial banks, namely – Bank of Philippine Islands,
Banco de Oro, ANZ Bank, Security Bank & Trust Company, and Metropolitan Bank & Trust
Company. On the other hand, the long-term debt was the remaining portion of a five-year
long term loan facility with the Metropolitan Bank & Trust Co. that fully matures on February
27, 2014.
The following table sets forth GTC and SMDC‘s combined total indebtedness as of the
periods indicated:
As of December 31,
(₱ millions)
2011 2012 2013
Short-term debt ...................................................................... 1,057.0 1,380.7 2,214.6
Long-term debt ......... ......... ........ ......... ........ ......... ......... ...... 75.0 15.0 0.0
Total ..................................................................................... 1,132.0 1,395.7 2,214.6
Collectively, GTC and SMDC intend to repay existing indebtedness of up to ₱1,671.0
million relating to the short term loans and long term loan which bear interest rates of 2.5%
and 4.5%, respectively, with the proceeds from the Offer.
Off-Balance Sheet Arrangements
As of December 31, 2013, GTC and SMDC did not have any off-balance sheet arrangements.

7/21/2019 PreliminaryProspectus - Century
http://slidepdf.com/reader/full/preliminaryprospectus-century 121/648
KEY PERFORMANCE INDICATORS
The following are the major performance measures used by GTC and SMDC for 2011, 2012 and 2013.
For the years ended December 31,
2011 2012 2013
Gross Profit Margin (%) ...................................................... 9.1% 10.7% 7.7%
Return on Sales (%) ............................................................. 1.4% 2.0% 2.4%
Debt-to-Equity Ratio (x) ...................................................... 3.40x 2.34x 2.38x
Current Ratio (x) ................................................................. 1.08x 1.14x 1.12x
Return on Equity (%) ........................................................... 7.6% 9.9% 14.3%
Notes:
1 Gross Profit Margin = Gross Profit / Net Sales2 Return on Sales = Net Income After Tax / Net Sales3 Debt-to-Equity = Total Liabilities /Shareholders’ Equity 4 Current Ratio = Current Assets / Current Liabilities5 Return on equity = Net Income After Tax / Shareholders’ Equity
QUALITATIVE AND QUANTITATIVE DISCLOSURE OF MARKET RISKS
GTC and SMDC are exposed to certain types of market risks in the ordinary course of
business, including commodity price risk, foreign exchange rate risk, interest rate risk, credit
risk and liquidity risk.
Commodity Price Risk
GTC‘s and SMDC‘s commodity price risk exposure primarily results from the us e of
commodities such as fish and milk as raw materials in their production processes. In
particular, the supply and prices of fish and milk are subject to seasonality changes due to
weather and climate changes, global supply and demand, fishing and environmental
regulatory controls. To reduce commodity price risk, GTC and SMDC typically build up
sufficient inventories of finished products and raw materials to minimize the pressure to
purchase the raw material at increased prices or to avoid market supply disruptions.
Whenever management deems justifiable, GTC and SMDC enter into short term forward
supply arrangements with suppliers to lock in purchase price and supply.
Foreign Exchange Rate Risk
GTC‘s and SMDC‘s foreign exchange rate risk arises primarily f rom the fluctuations in
exchange rate that arise between the Peso and the U.S. dollar. A substantial majority of
GTC‘s revenues are mainly denominated in U.S. dollars given the export nature of GTC‘s
business. SMDC on the other hand focuses mainly on the domestic market and, as such,
SMDC revenues are mainly Peso denominated. Certain expenses of GTC and SMDC are
denominated in U.S. dollars, or based on prices determined in U.S. dollars. GTC and SMDC
maintain and prepare their accounting records and financial statements in Pesos, although for
statutory reporting purposes, GTC‘s financial statements are converted to U.S. dollars. To
mitigate the impact of foreign exchange risk, GTC tries to match its U.S. dollar revenue
inflows with its U.S. dollar expense outflows when possible and appropriate. GTC enters intoa forward contract for each export order to secure the expected profit at time of delivery.
SMDC on the other hand enters into forward contracts for its forward importation purchases

7/21/2019 PreliminaryProspectus - Century
http://slidepdf.com/reader/full/preliminaryprospectus-century 122/648
when management deems appropriate. See ― Risk Factors – Risks Relating to the Company’s
Business – CNPF is exposed to foreign exchange risk ‖, ― Risk Factors – Risks Relating to the
Philippines – Volatility in the value of the Peso against the U.S. dollar and other currencies
could adversely affect CNPF’s business‖ and ― Exchange Rates‖.
Credit Risk
GTC‘s and SMDC‘s exposure to credit risk primarily relates to their trade and other
receivables. Generally, GTC‘s and SMDC‘s maximum credit exposure in the event of
customers‘ and counterparties‘ failure to perform their obligations is the total carrying amount
of the financial asset as shown on the statement of financial position. To minimize their credit
risk, credit exposures to customers are evaluated on an ongoing basis. Customer receivables
and payment habits for all customers are monitored and evaluated to ensure customer
creditworthiness is maintained at all times and the credit limits set is appropriate to the
expected business volumes to be generated. To the huge distributor-customers, bank
guarantees are required for the credit amounts to be extended.
Liquidity Risk
GTC and SMDC are exposed to the possibility that adverse changes in the business
environment or their operations could result in substantially higher working capital
requirements and consequently, a difficulty in financing additional working capital. GTC and
SMDC manage their liquidity risk by monitoring and forecasting their cash position and
maintaining credit lines from financial institutions that exceed projected financing
requirements for working capital.
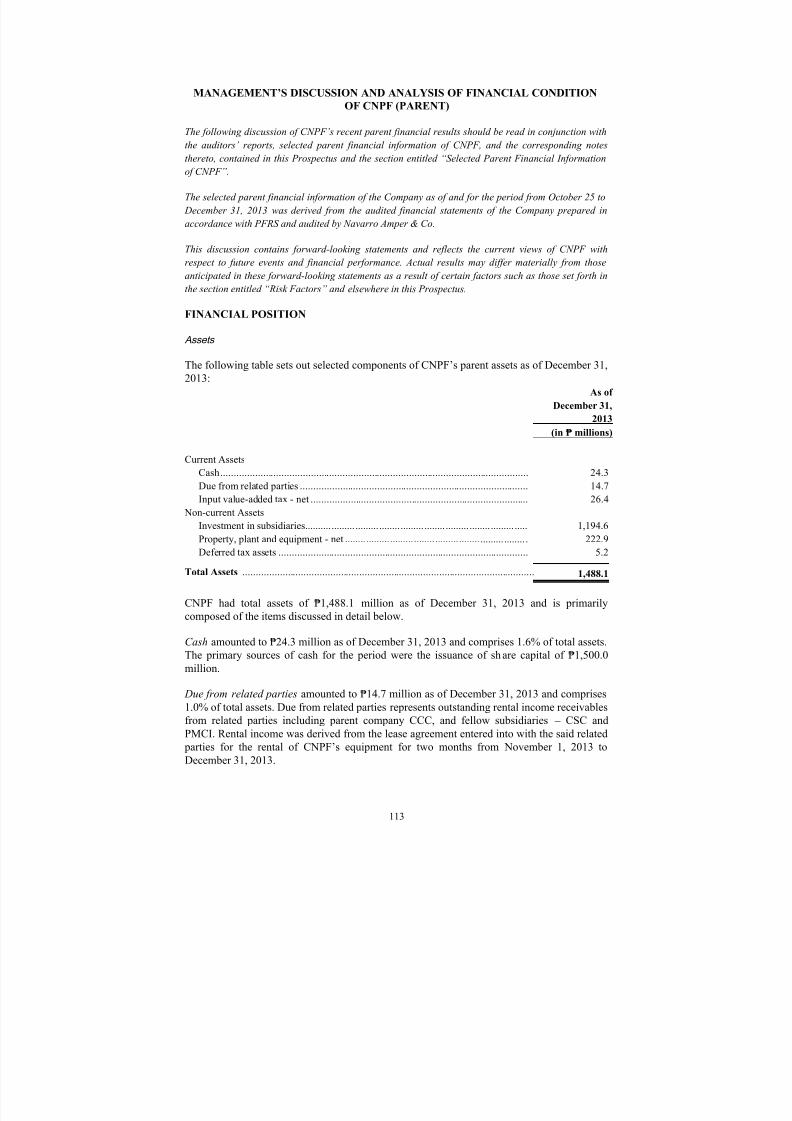
7/21/2019 PreliminaryProspectus - Century
http://slidepdf.com/reader/full/preliminaryprospectus-century 123/648
MANAGEMENT’S DISCUSSION AND ANALYSIS OF FINANCIAL CONDITION
OF CNPF (PARENT)
The following discussion of CNPF’s recent parent financial results should be read in conjunction with
the auditors’ reports, selected parent financial information of CNPF, and the corresponding notes
thereto, contained in this Prospectus and the section entitled ―Selected Parent Financial Information
of CNPF‖.
The selected parent financial information of the Company as of and for the period from October 25 to
December 31, 2013 was derived from the audited financial statements of the Company prepared in
accordance with PFRS and audited by Navarro Amper & Co.
This discussion contains forward-looking statements and reflects the current views of CNPF with
respect to future events and financial performance. Actual results may differ materially from those
anticipated in these forward-looking statements as a result of certain factors such as those set forth in
the section entitled ―Risk Factors‖ and elsewhere in this Prospectus.
FINANCIAL POSITION
Assets
The following table sets out selected components of CNPF‘s parent assets as of December 31,
2013:
As of
December 31,
2013
(in ₱ millions)
Current Assets
Cash .................................................................................................................... 24.3
Due from related parties ...................................................................................... 14.7
Input value-added tax - net .................................................................................. 26.4
Non-current Assets
Investment in subsidiaries.......... ......... ......... ........ ......... ........ ......... ........ ......... ..... 1,194.6
Property, plant and equipment - net ........ ......... ......... ........ ......... ........ ......... ........ . 222.9
Deferred tax assets .............................................................................................. 5.2
Total Assets .............................................................................................................. 1,488.1
CNPF had total assets of ₱1,488.1 million as of December 31, 2013 and is primarilycomposed of the items discussed in detail below.
Cash amounted to ₱24.3 million as of December 31, 2013 and comprises 1.6% of total assets.
The primary sources of cash for the period were the issuance of share capital of ₱1,500.0
million.
Due from related parties amounted to ₱14.7 million as of December 31, 2013 and comprises
1.0% of total assets. Due from related parties represents outstanding rental income receivables
from related parties including parent company CCC, and fellow subsidiaries – CSC and
PMCI. Rental income was derived from the lease agreement entered into with the said related
parties for the rental of CNPF‘s equipment for two months from November 1, 2013 to
December 31, 2013.

7/21/2019 PreliminaryProspectus - Century
http://slidepdf.com/reader/full/preliminaryprospectus-century 124/648
Input value added tax amounted to ₱26.4 million as of December 31, 2013 and comprises
1.8% of total assets. Input value added tax (VAT) is presented net of Output VAT of ₱1.6
million, and consists of Input VAT of ₱24.9 million arising from acquisition of depreciable
assets in 2013 which will be claimed against Output VAT over five years.
Investment in subsidiaries amounted to ₱1,194.6 million as of December 31, 2013 and is
comprised of investments in GTC and SMDC. These investments make up 80.3% of total
assets. On October 31, 2013, CNPF acquired from CCC all the rights, title and interest of
CCC in GTC and SMDC.
Property, plant and equipment amounted to ₱222.9 million as of December 31, 2013 and is
comprised of assets such as office, furniture, machinery, equipment and software,
transportation and delivery equipment that were purchased from related parties including
CCC, PMCI and CCC on October 31, 2013. The assets have useful lives ranging from two to
15 years depending on asset type. Property, plant and equipment comprise 15% of total assets.
Deferred tax assets amounted to ₱5.2 million as of December 31, 2013 and comprise 0.3% oftotal assets. Deferred tax assets represent the tax benefits arising from the CNPF‘s net
operating loss for the period ended December 31, 2013.
L iabili ties and Equity
The following table sets out selected components of CNPF‘s parent liabilities and equity as of
December 31, 2013:
As of
December 31, 2013
(in ₱ millions)
Current Liabilities
Accrued and other payables ........................................................................... 0.2
Equity
Capital stock.................................................................................................. 1,500.0
Deficit ........................................................................................................... (12.0)
Total Liabilities and Equity.............................................................................. 1,488.2
Accrued and other payables amounted to ₱0.2 million as of December 31, 2013, and pertain
to supplies and other miscellaneous liabilities. Accrued and other payables comprise 100% of
total liabilities and 0.01% of total liabilities and equity.
Capital stock amounted to ₱1,500.0 million as of December 31, 2013, which is equivalent to1,500.0 million shares at a par value of ₱1.00 per share. Capital stock represents one class of
common shares with voting rights and a right to dividends.
Deficit amounted to ₱12.0 million as of December 31, 2013 and represents the excess of
organizational expenses over revenue income based on accrual accounting.
LIQUIDITY AND CAPITAL RESOURCES
For the year ended December 31, 2013, CNPF‘s principal sources of liquidity were from
internal funds from issuance of share capital. As at December 31, 2013, CNPF had cash of
₱24.3 million. CNPF expects that its principal uses of cash for fiscal year 2014 will be for its
operating assets and liabilities, capital expenditure, dividend payment and investmentrequirements. As such, CNPF expects to source its funding needs for the next twelve months

7/21/2019 PreliminaryProspectus - Century
http://slidepdf.com/reader/full/preliminaryprospectus-century 125/648
from its operating cash flows, borrowings, additional share subscription from its parent
company shareholder, and proceeds of the Offer. It may also seek other sources of funding,
which may include debt or equity financings, depending on its financing needs and market
conditions.

7/21/2019 PreliminaryProspectus - Century
http://slidepdf.com/reader/full/preliminaryprospectus-century 126/648
MANAGEMENT’S DISCUSSION AND ANALYSIS OF FINANCIAL CONDITION
AND RESULTS OF OPERATIONS OF THE CONSOLIDATED FINANCIAL
INFORMATION OF CNPF
The following discussion of CNPF’s recent consolidated financial results should be read in
conjunction with the auditors’ reports, selected consolidated financial information of CNPF,
and the corresponding notes thereto, contained in this Prospectus and the section entitled
―Selected Consolidated Financial Information of CNPF‖.
The selected parent financial information of the Company as of and for the period from
October 25 to December 31, 2013 was derived from the audited financial statements of the
Company prepared in accordance with PFRS and audited by Navarro Amper & Co.
This discussion contains forward-looking statements and reflects the current views of CNPF
with respect to future events and financial performance. Actual results may differ materially
from those anticipated in these forward-looking statements as a result of certain factors such
as those set forth in the section entitled ―Risk Factors‖ and elsewhere in this Prospectus.
OVERVIEW
CNPF is a wholly-owned subsidiary of Century Canning Corporation. It was incorporated on
October 25, 2013 and organized to own and operate the canned and processed fish, canned
meat, dairy and mixes and tuna export businesses of the Century Group.
On October 31, 2013, CNPF acquired from CCC all rights, title and interest of CCC in GTC
and SMDC. At the same time, CNPF likewise purchased the property, plant and equipment
assets of the canned tuna business of CCC, canned sardines business of CSC, and canned
meat business of PMCI with the purpose of eventually assuming the said business operations
of CCC, CSC and PMCI. On January 1, 2014, CNPF acquired the inventories of CCC andCSC and canned meat business of PMCI, absorbed the organizational workforce and business
operating systems of CCC, CSC and PMCI, and hereon assumed the operations of the
businesses.
CNPF traces its historical track record of business performance from the Century Group. It
looks back to 1978 when Ricardo S. Po established CCC to venture into the canned tuna
export business, and in the subsequent years, continued to expand and diversify into other
businesses. CCC then entered the canned sardine business in 1983, the domestic canned tuna
business in 1987, the canned meat business under PMCI in 1994, and the dairy and mixes
business under SMDC in 2001. Amidst these growth initiatives, CCC saw the benefits of
strategic business unit focus. Hence, CCC spun off its canned sardine business into a separate business entity, CSC, in 1994 and similarly, its canned tuna export business into GTC in
1997.
CNPF prides itself with these businesses whose performances are highlighted by strong multi-
brand and multi-product portfolio, dominant market shares and loyal consumer following,
strong trade distribution infrastructure, and stably growing and profitable operations.
For the period ended October 25, 2013 to December 31, 2013, as CNPF transitioned with its
general corporate re-structuring transaction, CNPF‘s revenue and net income performance,
representing the consolidated results of operations for its subsidiaries, GTC and SMDC,
including CNPF operations as stand-alone parent company, is as follows:

7/21/2019 PreliminaryProspectus - Century
http://slidepdf.com/reader/full/preliminaryprospectus-century 127/648
For the Period October 25, 2013 to December 31, 2013
(in ₱ millions)
Revenue % of Total Net Income % of Total
GTC 1,044.2 73% 11.5 1,045%
SMDC 377.4 27% 2.5 227%
CNPF -15.1 -1,372%
Total 1,421.6 100% -1.1 -100%
N ote: GTC’s Statement of Income expressed in US Dollar is translated to Peso using BSP’s
average USD to Peso exchange rate for the period.
FACTORS AFFECTING RESULTS OF OPERATIONS
CNPF’s consolidated results of operations are affected by a variety of factors. Set out below
is a discussion of the most significant factors that have affected CNPF’s consolidated results
in the past and which CNPF expects to affect its consolidated financial results in the future.
Factors other than those set out below could also have a significant impact on CNPF’s
consolidated results of operations and financial condition in the future. S ee ―Risk Factors‖.
Raw Materials Costs and Product Prices
CNPF relies on supply of critical raw materials such as tuna, milk, and tin cans, most ofwhich are procured from third parties from both within and outside the Philippines. As
experienced, these materials are subject to price volatility caused by a number of factors,including changes in global supply and demand, foreign exchange rate fluctuations, weatherconditions and government regulations and controls. In addition, CNPF‘s ability to obtain rawmaterials is affected by a number of factors beyond its control, including natural disasters,governmental laws and policies, and interruptions in production by suppliers.Changes in the prices of raw materials will necessarily affect CNPF‘s cost of sale s and mayaffect the pricing of CNPF‘s products. Changes in prices may also affect consumer demand,as CNPF‘s consumers are generally price sensitive. While CNPF believes it has been able tosuccessfully pass on price increases historically to its customers, there is no assurance thatany future increases in cost of sales can be fully passed on to consumers. As a result, anymaterial increase in the market price of raw materials could have a material adverse effect onCNPF‘s operating margins, which may aff ect its financial position and operating
performance.
Economic, Social and Political Conditions in the Philippines
While CNPF has operations outside the Philippines with 79% of its revenues derived fromexports operations for the two month period ending December 31, 2013 , all of CNPF‘s assetsare located in the Philippines. As a result, CNPF‘s business, financial condition, results ofoperations and prospects are substantially influenced by Philippine macro-economic and
political conditions. Although the Philippine economy has experienced stable growth inrecent years, the Philippine economy has in the past experienced periods of slow or negativegrowth, high inflation, significant devaluation of the Peso, and has been significantly affected
by economic volatilities in the Asia-Pacific region. Sales of most of CNPF‘s products aredirectly related to the strength of the Philippine economy (including overall growth levels,

7/21/2019 PreliminaryProspectus - Century
http://slidepdf.com/reader/full/preliminaryprospectus-century 128/648
foreign currency exchange rates, and interest rates) and tend to decline or rise duringeconomic downturns. For example, any significant deterioration in the value of the Peso may
benefit export sales for CNPF‘s tuna products as Peso deterioration effectively lowersCNPF‘s export prices in comparison to competitors from other countries. On the other hand,however, the Peso deterioration may adversely affect the dairy and mixes business as the costof its products‘ imported milk raw material increases with the deterioration of the Peso valueand creates undue pressure on selling prices and margins.
Competition
CNPF faces competition in the Philippines as well as in the other countries in which itdistributes its products. It competes with a number of multi-national, national, regional andlocal competitors. Although certain of CNPF‘s products have significant market shares in thePhilippines and in many cases are market leaders in their respective product categories, CNPFexpects to face increasing competition as it continues to grow its business. Competitive
factors generally affecting CNPF‘s businesses include price, product quality, brand awarenessand customer loyalty, distribution coverage, customer service and the ability to effectivelyrespond to shifting consumer tastes and preferences. For a more detailed discussion oncompetition, please see ― Business‖ beginning on page 127 of this Prospectus, and ― Industry‖
beginning on page 158 of this Prospectus.
Seasonality
CNPF‘s sales are affected by seasonality in customer purchase patterns. In the Philippines,
most food products, including those produced by CNPF, experience increased sales during the
Christmas season. As a result, seasonality could affect CNPF‘s financial condition and results
of operations from one quarter to another, particularly in relation to the fourth quarter of each
year.
Introduction of New Products and Marketing Initiatives
CNPF believes that many consumer food products are impulse and discretionary purchases,which are particularly sensitive to competitive pressures. A key element in maintaining itsmarket share in the highly competitive Philippine food market has been for CNPF tocontinuously introduce new products and product extensions.
In addition to introducing new products, CNPF has undertaken marketing initiatives usingorganized advertising campaigns to differentiate its products and further expand market share.CNPF devotes significant expenditures to support advertising and branding, including funding
for advertising campaigns, such as television commercials and radio and print advertisements.CNPF‘s subsidiary, SMDC, spent 6% of its total revenue for advertising and promotion costsfor the year ended December 31, 2013.
The development and introduction of new products and the use of marketing initiatives can
substantially increase CNPF‘s operating costs. Although CNPF believes that these higher
costs are justified by increased sales from new and existing products, there is typically a delay
between the incurrence of these costs and any such sales. Furthermore, CNPF cannot be
assured of when, if ever, these expenditures will result in increased revenues.
CRITICAL ACCOUNTING POLICIES
Critical accounting policies are those that are both (i) relevant to the presentation of CNPF’s
financial condition and results of operations and (ii) require management’s most difficult,

7/21/2019 PreliminaryProspectus - Century
http://slidepdf.com/reader/full/preliminaryprospectus-century 129/648
subjective or complex judgments, often as a result of the need to make estimates about the
effect of matters that are inherently uncertain. As the number of variables and assumptions
affecting the possible future resolution of the uncertainties increase, those judgments become
even more subjective and complex.
For information on CNPF‘s significant accounting policies and significant accounting
judgments and estimates, see Note 6 starting on Page 21 of the consolidated audited financial
statements of included elsewhere in this Prospectus.
DESCRIPTION OF KEY LINE ITEMS
Sale of Goods
CNPF‘s subsidiary, SMDC, derives its sales from the sale of dairy and mixes products to
domestic customers while GTC derives its sales from exports of canned tuna, pouch tuna and
some frozen loins products to international markets. Such sales of SMDC and GTC are net ofvalue added tax (―VAT‖) and sales returns and allowances.
Cost of goods sold
CNPF‘s, GTC‘s and SMDC‘s cost of goods sold consists primarily of cost of goods available
for sale (i.e. inventory at the beginning of the year plus additional stocks from production and
purchases during the year) less inventory at the end of the year. The cost elements comprising
cost of goods sold include raw materials and packaging materials cost plus conversion costs.
Conversion costs consist of direct labour cost, utilities expense, and manufacturing overhead
expense.
Operating Expenses
CNPF‘s, GTC‘s and SMDC‘s operating expenses comprise primarily of salaries and wages
and other staff costs, advertising and promotions cost, freight and distribution expenses, other
selling and market expenses, depreciation, repairs and maintenance expenses, and other
administrative expenses.
Other I ncome (Expense)
Other income (expense) would comprise rental income, interest income, foreign currency
gains (loss), inventory loss, and other miscellaneous income and expenses. Specifically on
rental income, CNPF derived rental revenues from the lease back of property, plant and
equipment to where CNPF acquired the said assets from, that is, its parent CCC and fellow
subsidiaries PMCI and CSC. This lease back arrangement is specifically only for the duration
of the corporate re-structuring period, October 25, 2013 to December 31, 2013. Other income
and expenses are income and expenses generated outside the normal course of business.
F inance Costs
CNPF‘s f inance costs consist of interest expense, bank charges and other financing related
charges.
I ncome Tax Expense
Income tax expense comprises current income tax expense and deferred income tax expense.

7/21/2019 PreliminaryProspectus - Century
http://slidepdf.com/reader/full/preliminaryprospectus-century 130/648
Tr ade Receivables
Trade receivables are recorded at fair value plus transaction less provisions for impairment
loss, and are primarily from sales with an average credit term of 30 to 45 days. Impairment
loss is provided when there is objective evidence that the Company will not be able to collect
from specific customers certain amounts due to it in accordance with the original terms of thereceivables. The amount of the impairment loss is determined based on evaluation of
available facts and circumstances, including but not limited to, the length of the Company‘s
relationship with the customers, the customer s‘ current credit status based on known market
forces, average age of the accounts, collection experience and historical loss perspective.
I nventories
Inventories comprise primarily of raw materials, work-in-process goods and finished goods.These are booked at the lower of cost and net realizable value. Cost is determined using thefirst-in, first-out method. Finished goods and work-in process include the cost of rawmaterials, direct labour and a proportion of manufacturing overhead based on normal
operating capacity. Raw material costs include all costs attributable to acquisition such as the purchase price, import duties and other taxes that are not subsequently recoverable fromtaxing authorities. Inventories are derecognized when sold or otherwise disposed of.
Tr ade Payable
Trade payables comprise of obligations to suppliers incurred in the ordinary course of business. These are recognized at fair value and subsequently measured at amortized costduring the period when the goods or services are received or rendered.
RESULTS OF OPERATIONS
Sale of Goods
CNPF consolidated sales for the period October 25, 2013 to December 31, 2013 totaled
₱1,421.6 million. This comprised the combined sales of ₱1,044.2 million from GTC and
₱377.4 million from SMDC. GTC sales comprised of ₱953.9 million export s ales of private-
label tuna and Century branded products purchased from related party parent CCC plus ₱90.4
million fishmeal sales to the domestic market.. SMDC sales consisted of sales of products
under the Angel, Birch Tree, Home Pride and Kaffe de Oro labels to the domestic market.
Cost of goods sold
CPFI‘s consolidated cost of goods sold was ₱1,306.8 million, or 92% of consolidated sales,for the period October 25 to December 31, 2013. Cost of goods included raw materials cost of
₱490.4 million, direct labor cost of ₱39.3 million, factory overhead of ₱109.0 million, and net
changes in finished goods inventory of ₱668.1 million. Raw materials consisted of fish, milk,
ingredients and packaging materials.
Gross prof it
As a result of the foregoing, CNPF consolidated financial statements showed the consolidated
gross profit of ₱114.9 million for the period October 25 to December 31, 2013.
7/21/2019 PreliminaryProspectus - Century
http://slidepdf.com/reader/full/preliminaryprospectus-century 131/648
Other income
CNPF consolidated other income totaled ₱29.5 million for the period October 25, 2013 to
December 31, 2013. It is comprised largely of rental earnings of ₱16.6 million which came
from revenues earned from 1) GTC‘s lease arrangement with CCC‘s domestic tuna business
for the use of a portion of GTC‘s tuna production facility in General Santos City and 2)
CNPF‘s property, plant and equipment lease to fellow subsidiaries, PMCI and CSC. The lease
arrangement which CNPF had with CSC and PMCI was only for the corporate re-structuring
period prior to the full assumption of the canned sardine business of CSC and canned meat
business of PMCI on January 1, 2014. The other components of other income included
foreign currency gain of ₱6.2 million, interest income of ₱0.5 million, and other
miscellaneous income of ₱6.2 million.
Operating Expenses
CNPF‘s consolidated operating expenses were ₱136.4 million for the period October 25 to
December 31, 2013. The top five operating expenses, which accounted for 77% of totalconsolidated operating expenses, included freight and handling cost at ₱47.1 million, taxes
and licenses at ₱21.5 million, management fees at ₱17.1 million, advertising expenses at
₱11.8 million, and merchandiser expenses at ₱8.0 million. The rest of operating expenses
included depreciation, rent, inventory losses, legal and professional fees, salaries and wages,
and various other operating expenses.
Other Expense
CNPF‘s other expenses totaled ₱2.2 million largely representing ₱1.9 million loss on disposal
of land for the period October 25, 2013 to December 31, 2013.
F inance Cost
CNPF‘s consolidated finance cost amounted to ₱11.3 million. It consisted of ₱10.0 million in
interest expense and ₱1.3 million in bank charges and other finance cost related expenses.
Net Profi t
CNPF‘s consolidated net loss for the period October 25, 2013 to December 31, 2013 was ₱1.1
million. GTC and SMDC contributed net profits of ₱11.4 million and ₱2.5 million,
respectively. These profits from GTC and SMDC were offset by CNPF‘s net loss of ₱12.0
million. CNPF recorded a deferred tax benefit of ₱4.5 million.
FINANCIAL POSITION
Assets
CNPF‘s consolidated financial statements, net of eliminations, showed total assets of
₱4,524.9 million as of December 31, 2013. GTC and SMDC accounted for ₱3,342.1 million
and ₱889.7 million, respectively, of these total assets while CNPF shared the balance of
₱293.1 million.
Total consolidated assets were comprised of ₱3,412.2 million current assets and ₱1,112.7
million non-current assets. By major asset classification, GTC shared ₱2,667.5 million in
current assets and ₱674.6 million in non-current assets while SMDC contributed ₱679.3million in current assets and ₱210.4 million in non-current assets. CNPF had ₱65.4 million in

7/21/2019 PreliminaryProspectus - Century
http://slidepdf.com/reader/full/preliminaryprospectus-century 132/648
current assets and ₱227.7 million in non-current assets. CNPF‘s non-current asset is net of
elimination of investments in subsidiaries and is comprised of property, plant and equipment
assets acquired from the canned tuna business of CCC, canned sardine business of CSC and
canned meat business of PMCI on October 31, 2013.
Ninety percent, or ₱3,074.1 million, of CNPF‘s consolidated total current assets as of
December 31, 2013 consisted of ₱438.0 million cash, ₱1,034.1 million trade and other
receivables, and ₱1,602.0 million inventories. The balance of ten percent of is comprised of
receivables from related parties and other current assets.
Ninety three (93%), or ₱1,036.4 million, of CNPF‘s total consolidated non-current assets as
of December 31, 2013 is made up of property, plant and equipment assets which is broken
down as follows: 53% plant, machinery and equipment, 21% buildings and building
improvements, 17% construction in progress, and 9% consisting of office furniture, fixtures
and equipment, laboratory tools and equipment and transportation and delivery equipment.
Other non-current assets as of December 31, 2013 would consist of trademarks, deferred taxassets, and other non-current assets with a total value of ₱76.2 million.
L iabili ties and Equity
Total consolidated liabilities amounted to ₱2,980.7 million. Its main components were loans
payable of ₱2,214.6 million, or a 74% share of the total liabilities and trade and other payable
of ₱524.7 million, or a share of 18%. The balance of 8% of total liabilities were due to related
parties payables and income tax payable amounting ₱241.4 million.
Total liabilities by business segment reflected GTC accounting for ₱2,59 7.8 million, SMDC
for ₱382.7 million, and parent CNPF for ₱0.2 million.
Total consolidated equity amounted to ₱1,544.2 million as of December 31, 2013. This split
up into ₱1,500.0 million in share capital, ₱14.3 million in currency translation adjustment,
other reserves of ₱30.6 million, and deficit of ₱0.7 million. Share capital is all ordinary
shares. CNPF has a total authorized capital of 6,000,000 ordinary shares at ₱1 par value.
LIQUIDITY AND CAPITAL RESOURCES
For the period October 25, 2013 to December 31, 2013, CNPF‘s principal sources of liquidity
were largely cash generated from financing activities and partly cash flow from operating
activities. The table below sets forth the cash movement for period:
For the Period
October 25, 2013 to December 31,
2013 (in ₱ million)
Cash from (used in) operating activities 16.2
Cash from (used in) investing activities -265.7
Cash used for acquisition of subsidiaries -735.1
Cash from (used in) financing activities 1,422.5 Net increase (decrease) in cash and cash 437.9
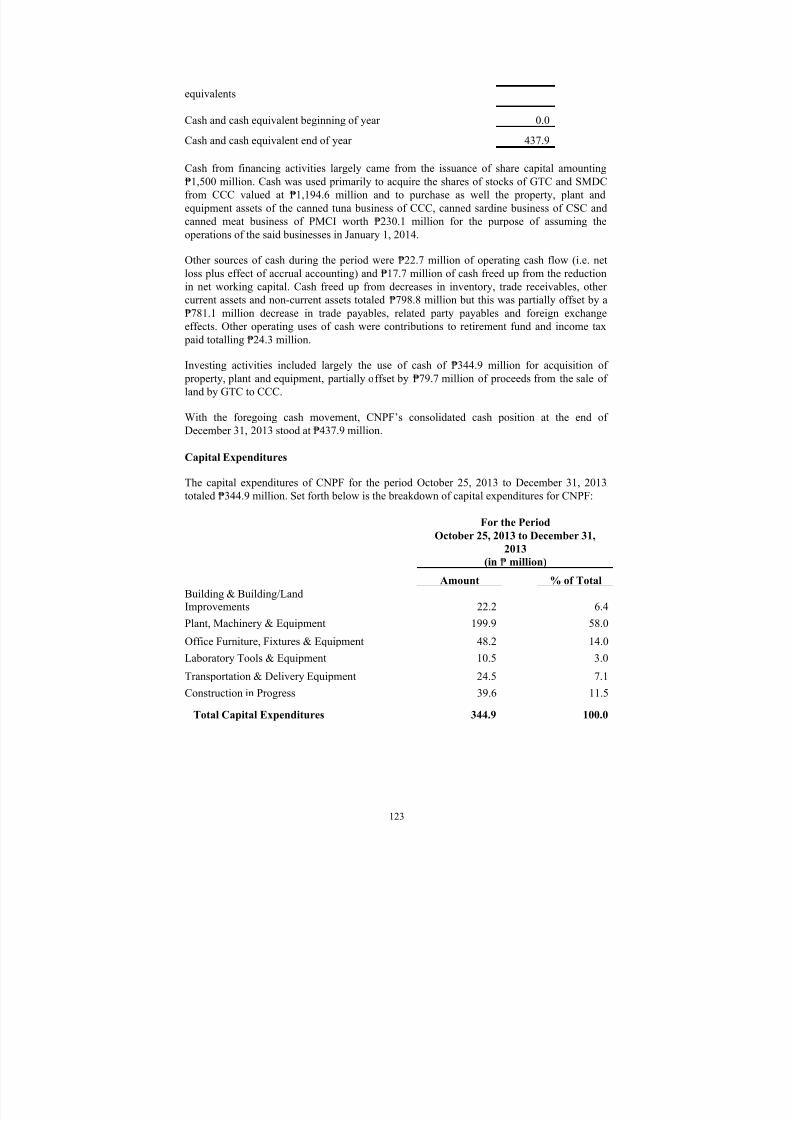
7/21/2019 PreliminaryProspectus - Century
http://slidepdf.com/reader/full/preliminaryprospectus-century 133/648
equivalents
Cash and cash equivalent beginning of year 0.0
Cash and cash equivalent end of year 437.9
Cash from financing activities largely came from the issuance of share capital amounting
₱1,500 million. Cash was used primarily to acquire the shares of stocks of GTC and SMDC
from CCC valued at ₱1,194.6 million and to purchase as well the property, plant and
equipment assets of the canned tuna business of CCC, canned sardine business of CSC and
canned meat business of PMCI worth ₱230.1 million for the purpose of assuming the
operations of the said businesses in January 1, 2014.
Other sources of cash during the period were ₱22.7 million of operating cash flow (i.e. net
loss plus effect of accrual accounting) and ₱17.7 million of cash freed up from the reduction
in net working capital. Cash freed up from decreases in inventory, trade receivables, other
current assets and non-current assets totaled ₱798.8 million but this was partially offset by a₱781.1 million decrease in trade payables, related party payables and foreign exchange
effects. Other operating uses of cash were contributions to retirement fund and income tax
paid totalling ₱24.3 million.
Investing activities included largely the use of cash of ₱344.9 million for acquisition of
property, plant and equipment, partially offset by ₱79.7 million of proceeds from the sale of
land by GTC to CCC.
With the foregoing cash movement, CNPF‘s consolidated cash position at the end of
December 31, 2013 stood at ₱437.9 million.
Capital Expenditures
The capital expenditures of CNPF for the period October 25, 2013 to December 31, 2013
totaled ₱344.9 million. Set forth below is the breakdown of capital expenditures for CNPF:
For the Period
October 25, 2013 to December 31,
2013
(in ₱ million)
Amount % of Total
Building & Building/Land
Improvements 22.2 6.4Plant, Machinery & Equipment 199.9 58.0
Office Furniture, Fixtures & Equipment 48.2 14.0
Laboratory Tools & Equipment 10.5 3.0
Transportation & Delivery Equipment 24.5 7.1
Construction in Progress 39.6 11.5
Total Capital Expenditures 344.9 100.0

7/21/2019 PreliminaryProspectus - Century
http://slidepdf.com/reader/full/preliminaryprospectus-century 134/648
Contractual Obligations and Commitments
The following table sets forth CNPF‘s consolidated contractual obligations and commitments
as of December 31, 2013:
The aforementioned contractual obligations and commitments will all mature in 2014.
The interest-bearing loans and borrowings, totaling ₱2,214.6 million, consist mostly 60 to 90
days term revolving promissory notes and unsecured borrowings obtained from local banks
with annual interest rates averaging 2.5% to 3.5%. Included in this loan balance is a ₱15.0
million remaining portion of a five year term loan under GTC which will mature on February
27, 2014. The breakdown of the loan by business segment is GTC at ₱1,999.6 million andSMDC at ₱215.0 million.
Trade and other non-trade payables are generally on a 30 to 90 days term and bear no interest
charges. Due to related parties payables are basically inter-company advances and
transactions considered part of the normal course of business and settled within the year.
CNPF, GTC and SMDC have a combined total available credit lines of least ₱6,000 million.
These credit lines can be drawn for working capital and capital expenditure needs.
Subsequent events after December 31, 2013 included the acquisition by CNPF of the
inventories of the canned tuna operations of CCC, canned meat business of PMCI and cannedsardine business of CSC on January 1, 2014. Further on February 6, 2014, CNPF received
additional subscription from CCC for 500,000,000 shares at ₱1 per share or ₱500 million.
Said subscription was paid on the same date and the shares were issued on February 8, 2014.
CNPF believes that its existing cash and credit lines, together with cash generated from
operations and the proceeds of the Offer, will be sufficient to finance its working capital and
capital expenditure needs for 2014.
Off-Balance Sheet Arrangements
As of December 31, 2013, CNPF did not have any off-balance sheet arrangements.
Contractual Obligations and Commitments
Principal Payments Due by Period
(in ₱ millions)
Total 2014 2015-
18
After
2018
Interest-bearing loans and
borrowings 2,214.6 2,214.6
Trade and other payables 524.7 524.7
Income tax payable 0.7 0.7
Dividends payable
Due to related parties 240.6 240.6Other long-term liabilities
Total 2,980.6 2,980.6

7/21/2019 PreliminaryProspectus - Century
http://slidepdf.com/reader/full/preliminaryprospectus-century 135/648
KEY PERFORMANCE INDICATORS
The following are the major performance measures used by CNPF for the period October 25
to December 31, 2013.
For the period
October 25 to December 31, 2013
Gross Profit Margin (%) ............................................... 8.1%
Return on Sales (%) ...................................................... 0.0%
Debt-to-Equity Ratio (x)............................................... 1.93x
Current Ratio (x) .......................................................... 1.14xReturn on Equity (%) ................................................... 0.0%
Notes:
1 Gross Profit Margin = Gross Profit / Net Sales
2 Return on Sales = Net Income After Tax / Net Sales
3 Debt-to- Equity = Total Liabilities /Shareholders’ Equity
4 Current Ratio = Current Assets / Current Liabilities
5 Return on equity = Net Income After Tax / Shareholders’ Equity
QUALITATIVE AND QUANTITATIVE DISCLOSURE OF MARKET RISKS
CNPF is exposed to various types of market risks in the ordinary course of business,
including foreign exchange rate risk, commodity price risk, credit risk and liquidity risk.
Commodity Price Risk
CNPF‘s commodity price risk exposure primarily results from the use of commodities as raw
materials in its production processes. In particular, the supply and prices of fish are subject to
seasonality and there is limited fish-catching activity from November to March of the
following year. To reduce its exposure to increased fish prices during this time, CNPF
typically builds up sufficient inventories of finished products by October of each year to
minimize the need to purchase fish at increased prices. CNPF currently does not have a
commodity price hedging policy.
Foreign Exchange Rate Risk
CNPF‘s foreign exchange rate risk arises primarily from the fluctuations in exchange rate thatarise between the Philippine Peso and the U.S. dollar. The substantial majority of CNPF‘s
revenues are denominated in Pesos, while certain of its expenses, particularly its raw material
costs, are denominated in U.S. dollars or based on prices determined in U.S. dollars. In
addition, CNPF is exposed to foreign exchange risk through its export of private label tuna
and its branded products. To hedge its exposure to exchange rate fluctuations, CNPF enters
into a forward contract for each export order to secure the expected profit at time of delivery.
See ― Risk Factors – Risks Relating to the Company’s Business – CNPF is exposed to foreign
exchange risk ‖, ― Risk Factors – Risks Relating to the Philippines – Volatility in the value of
the Peso against the U.S. d ollar and other currencies could adversely affect CNPF’s
business‖ and ― Exchange Rates‖.

7/21/2019 PreliminaryProspectus - Century
http://slidepdf.com/reader/full/preliminaryprospectus-century 136/648
Credit Risk
CNPF‘s exposure to credit risk relates primarily to its trade and other receivables. Generally,
CNPF‘s maximum credit exposure in the event of customers‘ and counterparties‘ failure to
perform their obligations is the total carrying amount of the financial asset as shown on the
statement of financial position. To minimize its credit risk, CNPF ensure it transacts only with
creditworthy customers. CNPF continuously monitors and evaluates customer credit,
receivables and payment habits for all major customers to mitigate credit risk..
Liquidity Risk
CNPF is exposed to the possibility that adverse changes in the business environment or its
operations could result in substantially higher working capital requirements and consequently,
a difficulty in financing additional working capital. CNPF manages its liquidity risk by
monitoring its cash position and maintaining credit lines from financial institutions that
exceed projected financing requirements for working capital.

7/21/2019 PreliminaryProspectus - Century
http://slidepdf.com/reader/full/preliminaryprospectus-century 137/648
BUSINESS
OVERVIEW
CNPF traces its history to the Century Group, a leading branded food company primarily
engaged in the development, processing, marketing and distribution of processed fish and
meat, as well as processed dairy products in the Philippines.
With the Century Group‘s operating history spanning the last 35 years, CNPF has establisheda strong brand and product portfolio through, and supported by, continuous productinnovation and acquisition of brands from third parties. Its brands are well-recognized in thePhilippines and include 555 for sardines, Century Tuna and 555 for tuna, Argentina and Swift
for canned meats and Angel and Birch Tree for canned and powdered milk. CNPF was thelargest producer of canned foods in the Philippines in terms of retail value according toEuromonitor data for February 2013.
The quality of CNPF‘s products has been recognized by numerous consumer and industryassociation awards. For example, Century Tuna received the Trusted Brand Award from
Reader‘s Digest in 2011, 2012 and 2013 and Argentina Corned Beef received the same award
in 2012 and 2013. As of December 31, 2013, CNPF offered 283 products which can be found
in 3,772 modern retail outlets, approximately 225,168 directly served general trade outlets
and 330,749 indirectly served points of sale, totaling over 559,689 points of sale throughout
the Philippines.
CNPF operates five production facilities and distributes its products through 14 distribution
centers strategically located across the Philippines. CNPF distributes its products directly to
retailers, as well as through third-party distributors. As at December 31, 2013, CNPF
maintained 200 manufacturer direct-to-retail accounts reaching 3,772 retail outlets in the
Philippines. In addition, as at December 31, 2013, CNPF held distribution agreements with 39distributors, reaching approximately 225,168 retail outlets ranging from supermarkets to sari-
sari stores. Furthermore, as of December 31, 2013, CNPF exports both private label and
branded products which are distributed across North America, Europe, Asia, Australia, and
the Middle East.
For the years ended December 31, 2013, CNPF‘s net revenue was ₱19,023 million. CNPF‘s
net profit for the same periods was ₱743.9 million.
Business Segments
CNPF‘s business operations are divided into four main business segments: canned and
processed fish, canned meat, dairy and mixes and tuna export.
The canned and processed fish segment produces a variety of tuna, sardine and other fish and
seafood- based products. CNPF‘s key brands in the canned and processed fish segment include
Century Tuna, 555, Blue Bay and Fresca.
The canned meat segment produces corned beef, meatloaf and a variety of other meat-based
products. Key brands in this segment include Argentina, Wow and Swift .
The dairy and mixes segment primarily comprises canned milk, powdered milk and other
dairy products, as well as coffee mixes and sinigang mix. Key brands include Angel , Birch
Tree, Kaffe de Oro and Home Pride.

7/21/2019 PreliminaryProspectus - Century
http://slidepdf.com/reader/full/preliminaryprospectus-century 138/648
CNPF also produces private label canned, pouched and frozen tuna products for export to
major overseas markets including North America, Europe, Asia, Australia, and the Middle
East. In addition, CNPF‘s branded products are also exported to overseas markets and are
distributed across North America, Europe, Asia, Australia, and the Middle East. For the years
ended December 31, 2013, the contribution of each business segment to CNPF‘s total revenueis as follows:
Year ended December 31, 2013
(in ₱ millions)
Revenue
% of
Total
Net
Income
% of
Total
Canned and Processed Fish 7,014 36.9 137 18.4
Canned Meat 4,598 24.2 360 48.4
Dairy and Mixes 1,548 8.1 45 6.0
Tuna Export 5,863 30.8 210 28.2
Other Segment Income (―CNPF‖) (8) (1)
Total 19,023 100.0 744 100.0
The abovementioned revenue and net income were derived from the historical auditedseparate financial statements of the Company, GTC, SMDC, CCC, PMCI and CSC thenadjusted to give the pro forma effect of the consolidation of the businesses of the saidcompanies as shown in the table below:
Year ended
December 31,
2013 (in ₱millions)
AcquisitionsTotal before
Pro FormaAdjustments
Pro formaAdjustments
Pro formaConsolidatedCNPF GTC SMDC CSC PMCI CCC
Net sales - 5,863 1,556 1,633 5,063 5,505 19,620 (597) 19,023
Cost of Sales - 5,623 1,222 1,420 3,932 4,071 16,269 (572) 15,697
Gross profit - 240 334 213 1,130 1,434 3,351 (25) 3,326
Other Income 13 127 0 35 24 859 1,058 (882) 176
Operating
profit 13 367 334 248 1,154 2,293 4,409 (907) 3,502
Operating
expenses 30 148 275 160 763 1,366 2,743 (328) 2,415
Finance cost - 49 2 3 25 52 131 (19) 112
OtherExpense - 3 - 7 4 - 14 - 14
Profit (loss)
before tax (17) 166 57 78 363 875 1,521 (561) 960
Income tax
expense (5) 28 15 25 105 48 217 (1) 216
Profit after
tax (12) 138 42 52 257 827 1,304 (560) 744
Pro forma adjustments were made to the December 31, 2013 historical consolidated financialinformation of the Company and its subsidiaries (GTC and SMDC), and the acquired
businesses (CSC, PMCI, CCC) which include the following:
Consolidation of the Company and its subsidiaries (GTC and SMDC) and elimination of
investment and equity amounting to ₱1.137 million.

7/21/2019 PreliminaryProspectus - Century
http://slidepdf.com/reader/full/preliminaryprospectus-century 139/648
Recognition of identified assets and liabilities of CCC, CSC and PMCI and the relatedoperations as well as the accumulated earnings as of December 31, 2013. The difference
between the balance of the assets acquired and liabilities assumed was recognized inretained earnings.
Elimination of frozen processed meat business from PMCI.
Elimination of intercompany and inter-business transactions and account balances.
Elimination of cash dividends from GTC and SMDC amounting to ₱382 million and gainfrom the sale of shares of stocks of GTC and SMDC between CCC and the Company
Recognition of rental expense in relation to the land and office spaces that were not soldto the Company and elimination of depreciation related to aforementioned assets.
Re-computation of income tax to include the effects of the pro forma adjustments.
CCC and CSC (Canned and Processed Fish). Net sales from the canned and processed fish
business segment totaled ₱7,013.8 million, or 37% of total CNPF sales, for the year ended
December 31, 2013. Of these sales, canned tuna and milkfish contributed ₱5,380.8 million
while canned sardine accounted for ₱1,633.0 million. Gross profit for the segment totaled
₱1,659.2 million, or a gross profit rate of 24%. This gross profit consisted of ₱1,383.4 million
from canned tuna and milkfish and ₱275.8 million for canned sardine. Net income for the
segment totaled ₱136.5 million, or an equivalent segment return on sales of 3%. Of this
segment net income, ₱(24.8) million was shared by canned tuna and milkfish while ₱161.4
million was from canned sardine.
GTC (Tuna Export). Net sales from the tuna export business segment totaled ₱5,862.7
million. This represented 31% of total CNPF sales and comprised sales of canned tuna,
pouched tuna and frozen loins to the private-label export market. Gross profit was ₱301.6
million, or a segment gross profit rate of 5%. Net income totaled ₱209.6 million for a segmentreturn on sales of 4%.
PMCI (Canned Meat). Net sales from the canned meat business were ₱4,598.6 million for the
year ended December 31, 2013, which represented 24% share of the total CNPF sales. Net
sales included sales to the modern trade accounts, general trade accounts, food service
accounts and export accounts for canned products including corned beef, meat loaves, ready-
to-eat viands. Gross profit for canned meat was ₱1,040 million, or a segment gross profit rate
of 23%. Net income for canned meat totaled ₱360.1 million, or a return on sales of 8%.
SMDC (Dairy and Mixes). Net sales from the dairy and mixes business was ₱1,548 million
for the year ended December 31, 2013, which represents 8% share of the total CPF sales. Net
sales includes sales of evaporated milk, condensed milk, creamers, full cream powdered milk,
flavour mixes and 3-in-1 coffee products. Gross profit for the segment amounted to ₱ 325.5
million for an equivalent gross profit rate of 21%. Net income totaled ₱45.4 million, or a 3%
return on sales ratio.
HISTORY AND CORPORATE STRUCTURE
CNPF was incorporated on October 25, 2013 to own and operate the canned and processed
fish, canned meat, dairy and mixes and tuna export businesses of the Century Group. The
history of these businesses and CNPF‘s recent corporate restructuring is described below.

7/21/2019 PreliminaryProspectus - Century
http://slidepdf.com/reader/full/preliminaryprospectus-century 140/648
Corporate History
Richard S. Po, the founder of the Century Group, started a canned tuna export business
through the establishment of CCC in 1978. By 1983, CCC had become the leading canned
tuna exporter in the Philippines. That same year, the Century Group entered the canned
sardine business with the launch of 555 Sardines. In 1986, the Century Group launched
Century Tuna, developing the canned tuna market in the Philippines. The Century Group then
entered the canned meat industry with the launch of Argentina Corned Beef in 1995 and
Argentina Beef Loaf in 1996. The Century Group continued to expand its product offerings
with the acquisition of Blue Bay in 2001. The Century Group entered the milk business with
the launch of Angel in 2002 and the acquisition of Birch Tree in 2003. The Century Group has
continued to diversify its product and brand portfolio, with the acquisition of the Home Pride
and Kaffe de Oro brands in 2008, launch of Angel coffee creamer in 2009, launch of Angel
Kremdensada and Wow in 2010 and the acquisition of the Swift brand and related assets in
2012.
Corporate Restructuring
CNPF traces its history from the Century Group, a leading branded food company primarily
engaged in the development, processing, marketing and distribution of processed fish and
meat, as well as processed dairy products in the Philippines.
In October 2013, the Century Group began to undertake a general corporate reorganization
transaction. Prior to the corporate restructuring, the company‘s businesses were operated by
different companies:
Seafood
Century Canning Corporation (―CCC‖) incorporated on December 12, 1978 handled theGroup‘s sales and distribution for canned and processed tuna, sardines and bangus. Products
are marketed under 555 for sardines, Century Tuna and 555 for tuna. Columbus Seafood
Corporation (―CSC‖), incorporated on December 20, 1994, operated the manufacturing plant
f or the sardines. General Tuna Corporation (―GTC‖), incorporated on March 10, 1997,
operated the tuna processing both for local and export sales.
Meat
The Pacific Meat Company, Inc. (―PMCI‖), incorporated on June 28, 1994, manufactured
canned and frozen processed meat under the brand names Argentina, Swift and 555.
Dairy
Snow Mountain Dairy Corporation (―SMDC‖), incorporated on February 14, 2001, handles
the dairy and sinigang mixes under the brands of Birch Tree, Angel , Home Pride and Kaffe de
Oro.
In order to streamline and rationalize the Group‘s operations, the business operations of CCC,
CSC and PMCI were folded into CNPF, the listing vehicle. The business operations of CCC
and CSC were folded into CNPF under the canned and processed fish segment. The canned
meat business operations of PMCI were folded into CNPF under the canned meat segment.
SMDC, handling the dairy and mixes segment, and GTC, handling the private label canned,
pouched and frozen tuna products for export, were retained as separate corporate entities as

7/21/2019 PreliminaryProspectus - Century
http://slidepdf.com/reader/full/preliminaryprospectus-century 141/648
wholly-owned subsidiaries of CNPF.As a result, the pro forma financial statements of CNPF
are a product of the combination of the businesses of CCC, PMCI, CSC, GTC and SMDC.
On October 31, 2013, CNPF acquired all of the outstanding shares of GTC and SMDC, as
well as certain fixed assets of CCC, PMCI and CSC. All applicable taxes relating to the
transfer of assets and shares of GTC and SMDC have been paid and the Company is currently
awaiting BIR issuance of the Certificate Authorizing Registration for the purchase of the
shares. A number of additional transactions are being undertaken as part of the restructuring
plan, including the following:
CNPF entered into separate agreements with each of CCC, PMCI and CSC to effect
the transfer of employees associated with the business segments being restructured.
Pursuant to such agreements, CNPF assumed the obligations of CCC, PMCI and CSC
with respect to retirement and other benefits which have accrued to the employees
based on their seniority or years of service. The employees were transferred to CNPF
with effect from January 1, 2014.
CNPF entered into an inventory purchase agreement pursuant to which CNPF
acquired the inventories of CCC, PMCI and CSC as at December 31, 2013.
Certain permits and licenses, which have been granted by the Philippine FDA
(formerly the Bureau of Food and Drug) to CCC, PMCI and CSC and which are
relevant to the business segments being restructured, are being transferred or assigned
to CNPF in accordance with Philippine FDA regulations.
Certain material contracts, including contracts for the supply of raw materials, are
being assigned or novated by CCC, PMCI or CSC, as applicable, to CNPF. For
suppliers who do not have formal supply contracts with CCC, PMCI or CSC, a notice
was sent informing all such suppliers that with effect from January 1, 2014, CNPF
will take over the operation of the various business segments being restructured.
CNPF entered into licensing agreements with certain companies owned and
controlled by the Po family for the use of certain trademarks and brand names which
are currently licensed to CCC, PMCI and CSC. See ― Intellectual Property‖ below for
further details.
As of the date of this Prospectus, apart from securing issuance of some of the above permits
and licenses, all material transactions relative to the corporate reorganizing have been
completed.
As a result of the foregoing corporate restructuring, CNPF now has two subsidiaries; namely,
SMDC and GTC. SMDC was incorporated on February 14, 2001 to engage in the business of
manufacture, sale and distribution of all kinds of milk and dairy products, fruits and vegetable
juices and other milk or dairy preparations, among others. On the other hand, GTC was
incorporated on March 10, 1997 to engage in the business of trading, manufacturing,
preserving, processing, canning, packing, importing and exporting all kinds of food and food
products, including fish, seafood, and other marine products. SMDC and GTC are each
currently capitalized at ₱500,000,000.
As a newly incorporated company, CNPF will also be relying on the track record of its wholly
owned subsidiaries, GTC and SMDC. In this respect, both GTC and SMDC, satisfy the
requirements of the PSE Revised Listing Rules i.e., that such subsidiary (i) must have a
cumulative consolidated earnings before interest, taxes, depreciation, and amortization

7/21/2019 PreliminaryProspectus - Century
http://slidepdf.com/reader/full/preliminaryprospectus-century 142/648
(EBITDA), excluding non-recurring items, of at least ₱50 million for three full fiscal years
immediately preceding the application for listing, (ii) a minimum EBITDA of ₱10 million for
each of the three fiscal years, and (iii) must further be engaged in materially the same
businesses and must have a proven track record of management throughout the last three
years prior to the filing of the application. With SMDC‘s EBITDA of approximately ₱26million, ₱38 million and ₱38 million for 2011, 2012 and 2013, respectively and GTC‘s
EBITDA of approximately ₱268 million, ₱299 million and ₱355 million for 2011, 2012 and
2013, respectively, CNPF‘s subsidiaries are in full compliance with the financial
requirements. Moreover, GTC and SMDC have been in existence since 1997 and 2001
respectively and have had a proven track record of management since then. The PSE Revised
Listing Rules prohibit CNPF from divesting its shareholdings in GTC and SMDC for a period
of three years from the date the Offer Shares are listed on the PSE; provided that the
prohibition shall not apply if the divestment is approved by a majority of CNPF‘s
shareholders.
The corporate reorganization has brought about operational and administrative efficiencies,
such as reduction in administrative overhead and headcount reduction.
CNPF and its subsidiaries, GTC and SMDC, have not been subject to: (i) any bankruptcy,
receivership or similar proceedings or (ii) ay material reclassification, merger, consolidation
or purchase or sale of a significant amount of assets.
The following chart provides an overview of the relevant business segments of the Century
Group prior to the completion of corporate restructuring:

7/21/2019 PreliminaryProspectus - Century
http://slidepdf.com/reader/full/preliminaryprospectus-century 143/648
The chart below provides an overview of CNPF‘s corporate structure including its major
operating subsidiaries as at December 31, 2013, after the corporate restructuring:
COMPETITIVE STRENGTHS
CNPF believes its principal competitive strengths comprise the following:
Established market leadership positions with iconic, well-recognized and trusted brands
The Company is the largest producer of canned foods in the Philippines in terms of retail
value according to Euromonitor data for February 2013. In addition, the Company‘s brands
have established market-leading positions within each of their respective segments. For
example, based on data from AC Nielsen, in 2012, the Company was the market leader in the
Philippines in domestic canned tuna, with a market share of 87% by sales. In addition, based
on AC Nielsen data as of August 2013, the Company was the market leader in corned beefwith a market share of 42.5% by sales and the market leader in meat loaf with a market share
of 25.6% by sales.
Several of the Company‘s brands have a long heritage and are well-recognized and trusted
brands in the Philippines. The Company believes that customers associate its brands with
health and quality. Such brands include Century Tuna which was launched in 1986, Argentina
Corned Beef which was launched in 1995 and Angel which was launched in 2002. The
Company has also grown its brand portfolio through brand acquisitions, including the
acquisition of Blue Bay in 2001, Birch Tree in 2003, Kaffe de Oro and Home Pride in 2008
and Swift in 2012. As a result of the heritage and strength of the Company‘s brands as well as
their high standards of quality, the Company has won a number of industry, consumer and
marketing awards including the Agora Awards‘ Marketing Company of the Year Award for

7/21/2019 PreliminaryProspectus - Century
http://slidepdf.com/reader/full/preliminaryprospectus-century 144/648
Century Canning Corporation (2011) and the Trusted Brand Award by Reader‘s Digest for
Century Tuna (2011, 2012 and 2013) and Argentina Corned Beef (2012 and 2013).
The Company continues to enhance brand recognition among consumers by consistently
maintaining high product quality, as well as through active and targeted marketing and
promotional campaigns such as using well-recognized celebrities to endorse its products. The
Company believes that its well-recognized brands have allowed it to develop strong customer
loyalty resulting in repeat purchases that provide it with greater pricing power relative to its
competitors.
Furthermore, the Company believes that the established reputations and market-leading
positions of its brands provide a strong platform to maintain and grow its market shares
through new products, product line extensions and expansion of its distribution networks.
Multi-category, multi-brand product portfolio catering to different customer tastes and
price points
The Company has a diverse product portfolio with multiple product lines across fish, meats
and dairy. As of December 31, 2013, the Company had a portfolio comprising 128 SKUs for
tuna products, 101 SKUs for canned meat products, 25 SKUs for sardine products and 29
SKUs for dairy and mixes products. The Company produces numerous product variants to
cater to different customer tastes. For example, the Company produces chicken, pork and
tuna-based vienna sausages to capture the full range of consumer preferences for this product.
In addition, the Company packages its products in different sizes to target different customer
price points. This diverse product portfolio allows it to capture a larger share of the
consumers' wallets and provides broader avenues for future growth, both within and across its
key product categories. In addition, this also reduces its dependence on any single product
category or brand, and makes the Company more resilient to changes in the competitive
landscape or price fluctuations in raw material that may impact one product category more
than another.
In addition, leveraging on the Company's strong reputation and recognition for product
quality, the Company has also developed a multi-brand strategy within each product segment
that allows it to broaden its reach to customers more easily than its competitors. Within each
of its product segments, the Company offers a wide portfolio of brands and products to meet a
diverse range of consumer tastes, preferences and price points allowing for a comprehensive
coverage of the Filipino consumer market. For example, in the canned tuna segment, the
Century Tuna brand targets the up-market canned tuna consumer whereas the 555 Tuna brand
is aimed at the budget or cost-conscious canned tuna consumer. This allows the Company to
broaden its customer base and capture the benefits from growth in disposable income from alarger proportion of the population. In addition, this segmentation allows the Company to
target consumers in different regions with different demographics with the right brand, as
well as react quickly and opportunistically to changes in consumer preferences and to act
defensively against any action by competitors.
The Company‘s diverse product portfolio also provides marketing and product synergies
across segments. For example, product recipes and formulations achieved through internal
research and development are shared across product segments. In addition, international best
practices implemented in the tuna export segment are shared across the Company‘s various
production lines, improving production processes and enhancing product quality.
7/21/2019 PreliminaryProspectus - Century
http://slidepdf.com/reader/full/preliminaryprospectus-century 145/648
Strong track record of product innovation and successful introduction of new products
Product innovation and development has been an important element in the Company‘s
business strategy and has been crucial to the Company‘s success. The Company has
demonstrated strong innovative capabilities as shown by its consistent track record of
launching new products to address changing consumer needs and preferences. For example,
the Company differentiates its products from plain canned tuna/meat by developing new
flavors and dishes that are designed and packaged as ready-to-eat meals. In particular, the
Company‘s ready-to-eat dishes use tuna as the main ingredient in traditionally beef, pork and
chicken- based dishes such as kaldereta, adobo and afritada to increase consumers‘ acceptance
of the product while providing consumers with a healthier alternative. In the dairy segment,
the Company has successfully introduced two-in-one products such as Angel Kremdensada (a
combination of all-purpose cream and condensed milk) and Angel KremQueso (a combination
of all-purpose cream and cheese) to provide convenient and cost-effective options for
consumers. In addition to innovative products, the Company has noticed a shift in preference
from canned products to flexible packaging or products sealed in pouches. In response, the
Company has started to produce pouched tuna products.
Furthermore, the Company has a strong ability to bring its products to market using
innovative marketing strategies. The Company‘s marketing campaigns are jointly d eveloped
between its highly experienced in-house marketing team and independent creative agencies.
The Company employs the use of celebrity endorsements in its marketing strategies to link
each product to the intended branding message. Over the years the Company has launched
numerous successful marketing campaigns, including a focused marketing campaign for
Argentina Corned Beef , which became the leading brand in its segment. The Company views
its ability to market its products as a critical success factor and invests heavily in advertising
and endorsements. The Company‘s ability to develop new products and successfully bring
them to market allows the Company to further segment each product category and tailor it toconsumers‘ tastes and preferences, preventing product commoditization.
Extensive market penetration through multi-channel distribution network
The Company operates and manages one of the most extensive distribution networks across
the Philippines, with its products available in every major city, creating a significant
competitive advantage. The Company has developed strong relationships directly with
retailers, including modern and general trade stores, as well as through third-party
distributors. Approximately 58% of the Company‘s distribution is through modern trade and
approximately 42% is through general trade. As of December 31, 2013, the Company‘s
modern trade coverage holds 200 direct accounts and 3,772 outlets, comprising national retail
chains with outlets across the Philippines, such as Robinsons Supermarkets, SMSupermarkets, Metro department stores, Puregold and 7-Eleven, as well as regional retailers.
The Company‘s general trade coverage has grown significantly from approximately 70,000
outlets in 2010 to approximately 225,168 outlets including sari-sari stores, wet markets,
wholesalers and regional supermarkets in 2013. The Company operates 14 distribution
centers, allowing the Company to respond quickly to changes in customer demand.
In addition, the Company employs its own sales and distribution force consisting of
approximately 159 personnel, including sales administration and support functions, starting
from January 1, 2014 upon completion of the corporate restructuring. The Company believes
that employing a majority of its sales force in-house has resulted in a relatively higher level of
motivation and incentivization among its employees that has contributed to the strong growth
in the sales of the Company‘s products. This arrangement also enables the Company to work
closely with its customers and develop strong relationships with them. The Company

7/21/2019 PreliminaryProspectus - Century
http://slidepdf.com/reader/full/preliminaryprospectus-century 146/648
continually seeks ways to expand the reach of its distribution network, especially in the
Mindanao and Visayas regions. The Company believes that its multi-channel distribution
network and its strong relationships with customers has allowed it to maximize customer
reach and has been one of the key factors to its success in building and developing its market-
leading positions.
CNPF‘s extensive distribution network is supported by its strategically located production
facilities. The Company‘s tuna processing facility is located in General Santos, Mindanao,
which is the heart of the Philippine tuna industry as it is geographically adjacent to two large
tuna fishing grounds, the Western Pacific Ocean and the waters between Southern Philippines
and Indonesia. In addition, one of the Company‘s sardine processing facilities, with an
installed capacity of 200 MT per day as of December 31, 2013, is located in Zamboanga,
which is the center of the Philippine sardine industry. The proximity to the source of supply
ensures the availability of fresh fish, a critical element in maintaining a high quality product
and lowering the Company‘s logistics costs. The Company‘s meat processing plant and milk
and mixes plant, located in Laguna and Taguig, respectively, are also strategically located
close to major markets, which reduces the cost of transporting products to customers.
Highly scalable export business that supplies processed tuna to leading international
companies and distributes branded products to high growth markets
The Company‘s export business, comprising private label processed tuna as well as branded
products, is complementary to its domestic business as it helps increase scale and reduce
costs, increasing the Company‘s competitiveness. An additional benefit of the scalability of
the export business is that it allows the export business to focus on quality and achieve higher
margins.
The Company has developed a reputation in the international food manufacturing community
as a reliable and trusted partner. It has supplied some of the largest food manufacturers
globally, including Chicken of the Sea, Bumblebee Foods LLC, Subway, Princes, Rio Mare,
Hagoromo, Hoko and California Garden. The Company is constantly looking to enter into
additional agreements with potential partners. The Company believes that supplying leading
global food manufacturers in some of the most stringently regulated markets in the world
represents an endorsement of the quality of the Company‘s products.
The Company‘s export business operates an efficient and competitive business model with
growing revenue and profitability due to penetration of new markets and signing of new co-
partners. The Company currently supplies to brands and retailers in five continents and covers
major markets including North America, Europe, Asia and Australia, and the Middle East,
broken down as follows:
2013 2012 2011
% of total exports
North America 7% 12% 38%
Europe 44% 16% 16%
Asia and Australia 49% 67% 40%
Middle East 0% 5% 6%

7/21/2019 PreliminaryProspectus - Century
http://slidepdf.com/reader/full/preliminaryprospectus-century 147/648
The Company was the leading Philippine exporter of canned tuna and frozen tuna loin
products for the year ended December 31, 2013, with a market share of 34% according to data
from the Philippine Bureau of Customs.
The Company also distributes its branded products internationally, particularly to China and
Vietnam, through its affiliates. Century International (China) Company Limited and Century
Shanghai Trading Company, joint ventures between the Company and Thai Union
Manufacturing Company, Ltd., as well as Century Pacific Vietnam Company, a wholly
owned subsidiary of CCC, have headquarters in Beijing, Shanghai, and Vietnam,
respectively. These offices distribute the Company‘s branded products to major cities in the
region. The Company‘s products are carried by retailers such as Carrefour, Walmart, Tesco
Hymall, Metro and Auchan, among others. As of December 31, 2013, the Company‘s private
label and branded products are distributed across North America, Europe, Asia, Australia, and
the Middle East.
Experienced and dedicated management team
The Company is led by an experienced and dedicated management team with a proven track
record of success. Members of the senior management team have an average of over 25 years
of industry experience, including experience working in large, multinational corporations in
the food industry. The management team is well accustomed to the Philippine operating
environment and has effectively managed the Company both in times of strong economic
growth as well as through periods of economic downturn and political instability. The
strength and depth of the experience of the Company‘s management team have been
demonstrated by their successful implementation of a range of efficiency programs and
product innovations, which has resulted in continued profitability and market leadership for
the Company over the years. In addition, management team has a proven track record of
turning previously under-promoted and neglected brands, such as Birch Tree and Blue Bay,
into successful brands by applying the Company‘s strategies, such as proper branding and
national distribution coverage.
The Company believes that the members of its management team are highly regarded in the
industry, and they hold a variety of leadership positions in food industry organizations, such
as the Sardine Association of the Philippines, the Philippine Association of Meat Processors
Inc., the Tuna Canners‘ Association of the Philippines. The management team‘s industry
leadership positions also create a valuable local business network for the Company.
BUSINESS STRATEGIES
The Company seeks to strengthen its leading market position in the Philippines and expand its business operations by implementing the following business strategies:
Actively develop and manage product and brand portfolios to target different price
points and respond to emerging market trends
The Company has a history of driving growth through new and innovative products,
capitalizing on emerging market trends and introducing extensions of successful product
lines. The Company will continue growing its existing product categories and deliver
innovative products under trusted brands and the Company is committed to developing and
expanding its product categories to meet evolving consumer tastes and preferences. In
addition, the Company will continue to market different brands to target different consumer
price points. For example, the Company believes that there are growth opportunities in the

7/21/2019 PreliminaryProspectus - Century
http://slidepdf.com/reader/full/preliminaryprospectus-century 148/648
canned meat market and plans to target the premium segment through the development of the
Swift brand.
The Company also intends to continuously review its product offerings to rationalize
unprofitable products from its portfolio. To enhance the stability of its revenue stream and
profit margins, the Company plans to increase the percentage of sales of products that have
performed well and which the Company believes will continue to do so. For example, as
Philippine consumers have become more health conscious, the Company‘s marketing strategy
has evolved to highlight the health benefits of Century Tuna and to present the Company‘s
ready-to-eat tuna viands as healthier alternatives to traditional beef, pork and chicken-based
dishes. The Company has also noticed a shift in consumer preference from canned products to
products in sealed pouches or flexible packaging. The Company has pre-empted this shift in
preference and has developed the capability to produce pouched products. The Company
intends to increase its product offerings in pouched or flexible packaging, which the
Company believes will develop new product segments and further penetrate the ready-to-eat
meal segment.
In addition, the Company is ranked second in the Philippine condensed/evaporated milk
market and third in the Philippine all-purpose cream segment, according to AC Nielsen. The
Company views the dairy market as a strong growth opportunity and has developed various
initiatives to grow its dairy business. For example, the Company has responded to changing
consumer preferences and plans to develop ready-to-drink products. The Company also plans
to continue aggressively promoting the Angel and Birch Tree brands through marketing
campaigns within the next two years. In particular, the Company plans to grow the Angel
brand through improved formulations, smaller packaging sizes for more budget-conscious
consumers and achieving a market leading position in the two-in-one product platform for
canned milk and cream. For the Birch Tree brand, the Company intends to expand into adult
and children‘s milk segments through powdered milk, flavored milk drinks and other productformats.
Expand distribution network to capitalize on growing retail segments and target
customers in high growth segments
The Company plans to capitalize on rapidly growing retail segments such as 24-hour
convenience trade and modern trade channels, and to expand its distribution network,
targeting to reach 250,000 directly served points of sale in 2014. In particular, the Company
plans to expand its distribution network in the Philippines by increasing the number of retail
outlets that its regional sales force services directly. At the same time, the Company is
working with its distributors to increase its penetration of general trade outlets, particularly in
more remote areas such as Mindanao and the Visayas. In addition, there are regions in thePhilippines such as Central Visayas where the Company is not the market leader due the
incumbency of regional market leaders. However, the Company believes that with sustained
presence through a well-developed distribution network in those regions, the Company will
be able to gain market share in those areas. The Company believes that the Philippine market
is still underserved in certain product categories and there are growth opportunities to
improve its distribution network. The Company plans to penetrate these underserved areas by
reaching out to a greater number of smaller informal retailers such as sari-sari stores and wet
markets.
Another area the Company has identified as a growth avenue is the food service segment.
While sales to food service customers, such as, but not limited to, Jollibee, KFC, Starbucks
and 7-Eleven, contributed less than 3% of the Company‘s total revenue for the year ended
December 31, 2013, the Company believes there are significant opportunities to work closely

7/21/2019 PreliminaryProspectus - Century
http://slidepdf.com/reader/full/preliminaryprospectus-century 149/648
with customers and expand existing relationships, as well as establish relationships with a
wider range of customers in this segment. The Company understands the needs of its food
service customers and proactively suggests new products or recipes suited for such
customers‘ business. As its food service customers continue to expand their business, the
Company intends to further collaborate with such customers and increase its sales in thissegment.
Enter into new product categories
In addition to growing and developing its existing product and brand portfolio, the Company
plans to enter into new product categories. The Company believes its competitive strengths
and deep understanding of the Philippine market provide significant advantages when
entering into new product categories. In 2014, the Company plans to start marketing and
distributing beverage products, such as coconut water, by leveraging on the Company‘s
extensive distribution network and experienced sales and marketing personnel. The
Company‘s marketing strategy will highlight the health benefits of these beverage products in
line with the Company‘s health and wellness theme, thus enabling the Company to penetratenew product categories.
The Company also entered into a distribution agreement with Kapal Api of Indonesia on
November 16, 2012 to distribute Kapal Api‘s coffee products in the Philippines. Kapal Api is
an Indonesian company engaged in, among others, the operation of a coffee plantation, the
production of non-dairy creamer, the production of espresso machines, and the distribution of
coffee and coffee products.
Optimize export business to further penetrate the private label export market and
increase presence of branded products in overseas markets
As the current leading tuna exporter in the Philippines, the Company is well positioned to
increase its market share in the export business. The Company intends to increase the number
of partners for its private label export business in order to gain greater scale and better
capitalize on economies of scale. The Company believes this should further improve profit
margins of its export business.
The Company currently distributes its branded products across North America, Europe, Asia,
Australia, and the Middle East. The Company has noticed increasing brand awareness among
Filipino communities around the world and similar demands from Latino communities. While
overseas Filipino communities were the initial target customer base for its branded exports,
the Company has seen growing demand for its products in mainstream markets as the
Company continues to build the presence of its branded products in overseas markets. TheCompany intends to capitalize on this trend and has started to sell its branded products to
Walmart, Albertsons and Kroger in the US, as well as negotiate with other retailers to have its
products sold in Asian food sections of their stores. The Company plans to enter into
distribution agreements with several other large retailers in North America in the near future
and likely within the next 12 months.
Opportunistic acquisition and development of strong regional brands
The Company has a proven track record of turning previously under-promoted and neglected
brands into market leading brands by applying its strategies, such as proper marketing and
extensive national distribution coverage. For example, Birch Tree was a strong brand in the
Philippines in the 1970s but lost significant market share as it did not receive marketingsup port for many years prior to the Company‘s acquisition of the brand in 2003. After

7/21/2019 PreliminaryProspectus - Century
http://slidepdf.com/reader/full/preliminaryprospectus-century 150/648
acquiring the brand, the Company initially relied on its distribution network to increase the
penetration of Birch Tree products in modern and general trade outlets. The Company then
supported the brand through a strategic marketing campaign. Through the Company‘s efforts,
the Birch Tree brand was able to grow to 22.0% market share in the full cream milk powder
segment as of July 2011, according to AC Nielsen. The Company will continue to seizeacquisition opportunities and acquire brands opportunistically to penetrate new market
segments. Examples include the Century Group‘s recent acquisition of Swift from RFM
Corporation in 2012 which allowed the Century Group to compete in the premium canned
meats segment, and the Century Group‘s acquisition of the Home Pride and Kaffe De Oro
brands in 2008.
Cost improvements through backward integration, streamline logistics and cost-
engineering
The Company is focused on increasing the efficiency of its existing operations and
implementing targeted cost-saving initiatives in its businesses. In particular, the Company
intends to implement cost improvements through backward integration. The Companysources the majority of its requirements from third-party suppliers. However, the Company
will be building a second tin can manufacturing facility which, upon completion by the end of
2014, is expected to produce approximately 25% to 30% of the Company‘s tin can
requirements. By producing a significant portion of its tin cans requirements internally, the
Company will be able to improve its profit margins by sourcing tin cans at cost and reducing
logistics costs associated with purchasing from third-party suppliers.
In addition, the Company‘s research and development team is an integral part of the
continued effort to identify cost improvements while maintaining high product quality
standards. For example, the Company‘s research and development team has been able to
increase the use of alternative raw materials, such as soy-based proteins, to lower production
costs for certain products. The Company estimates that research and development costs
accounts for less than 1% of its revenues.
The Company is also able to leverage its economies of scale to further rationalize its
production and distribution costs. Realizing savings through cost reduction initiatives will
improve the Company‘s profit margins and enable the Company to continue growing its
portfolios of brands and products.
PRODUCTS
CNPF produces and distributes a wide range of food products including canned and processed
fish, canned meat and dairy and mixes for the domestic market, as well as processed tuna forthe export market. CNPF‘s brand portfolio includes some of the most well -known brands in
the Philippines, such as Argentina for corned beef, Century Tuna for canned tuna, 555 for
canned sardines and Birch Tree and Angel for milk and dairy products.
Canned and Processed Fish
Prior to the corporate restructuring, the company‘s businesses we re operated by different
companies. CCC, incorporated on December 12, 1978, handled the Group‘s sales and
distribution for canned and processed tuna, sardines and bangus. Products are marketed under
555 for sardines, Century Tuna and 555 for tuna. Columbus Seafood Corporation (―CSC‖),
incorporated on December 20, 1994 operated the manufacturing plant for the sardines.

7/21/2019 PreliminaryProspectus - Century
http://slidepdf.com/reader/full/preliminaryprospectus-century 151/648
In order to streamline and rationalize the Group‘s operations, CNPF was incorporated and the
business operations of CCC and CSC were folded into CNPF under the canned and processed
fish segment.
Brands and Products
The 555 brand for canned sardines was introduced in the Philippines in 1983. Since then,
CNPF‘s canned and processed fish product offerings have expanded to include canned tuna,
canned sardines, canned mackerel, frozen milkfish, gourmet milkfish, pouched tuna, corned
tuna and other packaged fish and seafood products. The table below sets forth information
regarding the product lines in CNPF‘s canned and processed fish segment
Brand Products
Indicative
retail price
(P/tin) Target market
Century Quality
Bangus (milkfish) in a variety of flavors,fried sardines, bangus sisig, boneless
bangus, bangus tocino and canned
salmon
₱183.00(450g); ₱48.30
(184g)
AB
Century Tuna
Tuna in a variety of flavors, tuna loaf,
tuna mayo spread, corned tuna,
₱26.00 (155g);
₱32.50 (180g)
ABC
Blue Bay
Tuna in a variety of flavors and sardines ₱23.00 (155gtuna); ₱15.10
(155g sardine)
DE
555
Sardines, tuna, mackerel and squid in a
variety of flavors
₱23.00 (155g
tuna); ₱14.00
(155g sardine)
DE
Fresca
Tuna in a variety of flavors ₱21.23 (175g) DE
Lucky 7
Sardines ₱13.75 (155g
sardine)
DE
According to AC Nielsen, in 2012, CNPF had market shares of 87% in canned tuna and
15.3% in canned sardines, and was the largest producer of canned fish products in the
Philippines in terms of retail value. For the year ended December 31, 2013, the canned and
processed fish segment was the largest contributor to CNPF‘s revenue, with segment revenueof ₱7,014 million, representing 37% of total combined revenue of the company.

7/21/2019 PreliminaryProspectus - Century
http://slidepdf.com/reader/full/preliminaryprospectus-century 152/648
CNPF‘s canned and processed fish products are distributed in the Philippines to both retail
and food service outlets. Sales of CNPF‘s canned and processed fish products to retai l outlets
accounted for approximately 96% of total segment sales for the year ended December 31,
2013, while sales to food service outlets accounted for approximately 4% of total segment
sales for the same period.
Tuna products are CNPF‘s most significant products, accounting for 59%of total revenue for
the year ended December 31, 2013. CNPF‘s tuna products are primarily sold under the
Century Tuna, 555 Tuna, Fresca and Blue Bay brands. The Century Tuna brand was the
leading canned tuna brand in terms of both retail value and sales volume in the Philippines in
2012 according to AC Nielsen. The 555 Tuna brand targets budget conscious consumers
looking for affordable and high quality canned and processed fish products. Blue Bay is
positioned as a regional brand and its products primarily comprise traditional canned tuna.
Fresca is a regional value brand which offers a mix of traditional canned tuna and ready-to-
eat tuna viands, as well as pouched tuna products. In addition to traditional canned tuna and
tuna viands, CNPF also offers processed tuna products such as corned tuna, tuna loaf, tuna
sausage and tuna mayo spread.
CNPF also offers packaged seafood based on farmed and cultured species under the Century
Quality brand. Products include canned bangus (milkfish), fried sardines, canned salmon, and
bangus tocino. For the year ended December 31, 2013, revenues of the Company‘s canned
and processed fish products were ₱7,014 million.
CNPF‘s top brands in the canned and processed fish segment are Century Tuna and 555,
which collectively accounted for 84% of CNPF‘s total canned and processed fish revenue for
the year ended December 31, 2013.
Production and Raw Materi als
Raw materials used in the canned and processed fish segment include tuna, sardines, tin cans,
soya oil and vegetables. CNPF primarily sources such raw materials from third-party
suppliers. In particular, CNPF sources tuna and sardines from major domestic and
international fishing operators with whom CNPF has had a long history of cooperation.
Tin cans are used across all of CNPF‘s business segments. For the year ended December 31,
2013, usage of packaging materials, of which tin cans constitute the majority, accounted for
13% of CNPF‘s total production cost. While the majority of CNPF‘s tin can requirement is
purchased from third-party suppliers, CNPF currently owns and operates one tin can
manufacturing facility with installed capacity of 4.5 million cans per month as of December
31, 2013. Through this facility, CNPF is able to produce approximately 5% of its total tin canrequirements. The Company plans on constructing an additional tin can manufacturing
facility, which will be located directly adjacent to the current facility. The new facility is
expected to have an installed capacity of 700 cans per minute. Upon completion of the second
tin can manufacturing facility by the end of 2014, CNPF expects to provide approximately
25% to 30% of its tin can requirements through its own facilities.
As of the date of this Prospectus, CNPF owns one tuna processing plant in General Santos
City, one sardine processing plant with an installed capacity of 200 MT per day as of
December 31, 2013 in Zamboanga City and a second sardine processing plant with an
installed capacity of 45 MT per day as of December 31, 2013 in Cavite province. The table
below sets out key operating information for CNPF‘s fish processing facilities as of the date
of this Prospectus.

7/21/2019 PreliminaryProspectus - Century
http://slidepdf.com/reader/full/preliminaryprospectus-century 153/648
Facility Type Location Size
Tuna Processing Plant General Santos City 52,626 sq. m.
Sardine Processing Plant Zamboanga City 38,000 sq. m.
Sardine Processing Plant Cavite 2,500 sq. m.
The facilities operate six days per week, with two 12-hour shifts (inclusive of a one-hour
break per shift) per day.
The typical process for producing CNPF‘s tuna products begins with the loading and
receiving of tuna, which is then sorted, weighed and washed. The tuna is then steamed and
cooled before being further cleaned and de-boned. Once this steaming and cleaning process is
completed, the tuna is packaged into cans or pouches before being steamed a second time.
Then the product is cooled, labeled, packaged and prepared for shipment. The production process for CNPF‘s sardine products is similar, except that the products are only steamed
once after they have already been packaged into cans. The production workflows for tuna and
sardines, respectively, are illustrated below.
Tuna Process Workflow

7/21/2019 PreliminaryProspectus - Century
http://slidepdf.com/reader/full/preliminaryprospectus-century 154/648
Sardines Process Workflow
CNPF‘s tuna and sardine processing plants follow strict quality control standards. The quality
control system incorporates the HACCP plan, which is a regulatory requirement for all food
manufacturing businesses. CNPF also implements additional quality control programs
including GMP, SSOP, and pest control management. Quality standards and parameters are
established for each step of the production process to ensure the safety and quality of the
products. In addition, all finished products pass through an x-ray, which is able to detect any
foreign contaminants.
CNPF engages third-party contractors for certain aspects of its production processes. In the
canned and processed fish segment, CNPF typically outsources the production of new
products, particularly when CNPF believes there is a market opportunity for the new product
but the expected initial demand and production volume is relatively low. CNPF moves the
production of new products in-house once production volume reaches a certain scale.
Competition
Based on data from Euromonitor and certain internal assumptions and calculations, CNPF
believes that it is the largest producer of canned and processed fish products in the
Philippines, with an estimated market share of approximately 54% as at end 2012. According
to data from AC Nielsen, in 2012, CNPF had approximately 87% market share in canned tuna
and approximately 15.3% market share in canned sardines in the Philippines in terms of retail
value.
In the canned and processed fish segment, CNPF competes on quality, customer service,
distribution network and price. CNPF is the leading company in the canned tuna segment. In
the canned sardines segment, CNPF competes with major domestic canned and processed fish
producers such as Liberty Gold, Maunlad Canning Corporation, Universal Canning,
Incorporated and Mega Fishing Corporation, as well as numerous regional and local canned
foods processors. To maintain its leading market position, CNPF intends to, among other
measures, continue emphasizing the healthy image associated with Century Tuna whileintroducing different product sizes targeted towards more budget-conscious consumers.

7/21/2019 PreliminaryProspectus - Century
http://slidepdf.com/reader/full/preliminaryprospectus-century 155/648
Canned Meat
Prior to the corporate restructuring, PMCI, which was incorporated on June 28, 1994,
manufactured canned and frozen processed meat under the brand names Argentina, Swift and
555.
In order to streamline and rationalize the Group‘s operations, CNPF was incorporated and the
canned meat business operations of PMCI were folded into CNPF under the canned meat
segment.
Brands and Products
The Argentina brand corned beef was launched in 1995. CNPF‘s canned meat product
offerings have since expanded to include corned meat, meat loaf, beef loaf and sausages,
among others. The table below sets forth information regarding the product lines in CNPF‘s
canned meat segment.
Brand Products
Indicative
retail price
(P/tin) Target market
Swift
Corned beef, meat loaf, beef loaf andvienna sausages
₱62.00
(210g)
ABC
Argentina
Corned beef, meat loaf, beef loaf,Chinese style luncheon meat, liver
spread, vienna sausages and spaghettisauce
₱33.30
(175g CB)
C
Shanghai
Chinese style luncheon meat ₱28.00
(165g)
C
555
Canned meat in a variety of flavors; meatloaf and beef loaf
₱24.00
(150g CN)
DE
Wow
Ready-to-eat viands in a variety offlavors
₱21.60
(150g)
DE
Lucky 7
Corned beef, meat loaf, beef loaf ₱13.25
(150g)
DE
According to AC Nielsen, as at December 31, 2012, CNPF had market shares of 41.6% in thecorned beef segment and 25.5% in the meat/beef loaf segment, and was the largest producer

7/21/2019 PreliminaryProspectus - Century
http://slidepdf.com/reader/full/preliminaryprospectus-century 156/648
of canned meat products in the Philippines. For the year ended December 31, 2013, the
canned meat segment was the third largest contributor to CNPF‘s revenue, generating
segment revenue of ₱4,598.6 million, representing 24% of the total CNPF combined revenue.
CNPF‘s canned meat products are distributed in the Philippines to both retail and food service
outlets. CNPF
The main product line in the canned meat segment is the Argentina line of products, which
includes canned corned beef, canned meat loaf, canned beef loaf, canned chicken loaf, canned
luncheon meat, canned sausages, canned spaghetti meat sauce, canned liver spreads, hotdogs
and canned sisig . As at August 2013, CNPF‘s Argentina brand is the leading brand in the
Philippine canned meat market in terms of sales volume (in kilograms) according to AC
Nielsen. According to CNPF‘s internal data, during the year ended December 31, 2012,
Philippine consumers consumed 2.1 tins per capita annually of the Argentina brand making it
the second best selling product among all of CNPF‘s product lines based on an annual tins per
capita basis.
As a part of CNPF‘s business strategy to leverage its brand recognition and target consumers
across various income levels, it offers affordable and high quality canned meat products under
its Lucky 7 brand to budget conscious consumers. In addition, CNPF offers its Chinese
luncheon meat products under the Shanghai label. In 2008, CNPF launched the Wow brand,
which is the newest brand in the canned meat segment, primarily offers ready-to-eat viands in
a variety of flavors. In 2012, the Company acquired the Swift brand and selected assets from
RFM Corporation.
For the year ended December 31, 2013, sales volume, by cases, of the Company‘s canned
meat products was 5.4 million, which amounted to revenue of ₱4,599million.
The top brand in CNPF‘s canned meat segment is Argentina, which accounted for more than
50% of total segment revenues for the year ended December 31, 2013.
Production and Raw Materi als
Raw materials used in the canned meat segment include beef, pork, chicken, protein and
spices. CNPF primarily sources such raw materials from a network of domestic and
international suppliers.
CNPF leases and operates one meat processing plant located in Laguna. The facility has an
area of 14,500 sq. m. and an installed capacity of 194 MT per day as of December 31, 2013.
The production process of CNPF‘s corned beef and meat loaf products typically starts with
frozen meat being cut, weighed and cured. For the corned beef products, the meat is parboiled
before being hashed and mixed with other ingredients. Meat loaf products are directly
chopped with curing salts and other ingredients without being parboiled. Then, the meat
mixtures are canned and heated to commercial sterility before being cooled and packed. The
finished products typically have an incubation period of 14 days. Then, the products are
labeled, packed and sealed before being shipped or warehoused for distribution. The
production workflow for corned beef and meat loaf, respectively, are illustrated below.

7/21/2019 PreliminaryProspectus - Century
http://slidepdf.com/reader/full/preliminaryprospectus-century 157/648
Corned Beef Process Workflow
Meat Loaf Process Workflow
CNPF‘s canned meat segment has implemented quality control procedures which comply
with relevant legislation and industry best practices. The meat processing plant has been
certified by the Philippine National Meat Inspection Service for GMP and HACCP
compliance. The plant has also received HALAL certification from the Islamic Dawah of the
Philippines.
CNPF engages third-party contractors for certain aspects of its production processes. In the
canned meat segment, CNPF typically outsources production of certain products when
CNPF‘s internal production capacity is insufficient to meet customer demand.

7/21/2019 PreliminaryProspectus - Century
http://slidepdf.com/reader/full/preliminaryprospectus-century 158/648
Competition
Based on data from Euromonitor, CNPF is the largest producer of canned meat products in
the Philippines, with an estimated market share of approximately 37% as at December 31,
2012. According to data from AC Nielsen, as of August 2013, CNPF had approximately
42.5% market share in corned beef market and approximately 25.6% market share in meat
loaf and beef loaf in the Philippines.
In the canned meat segment, CNPF competes on quality, customer service, distribution
network and price. CNPF competes with major domestic producers such as San Miguel
PureFoods Company, Inc. and CDO Foodsphere, Inc., as well as numerous regional and local
meat processors. To maintain its leading market position, CNPF intends to, among other
measures, promote the Swift brand to participate in the premium canned meat segment and
increase the market share of its canned meat products regionally in areas such as Mindanao
and the Visayas.
Dairy and Mixes
Brands and Products
CNPF‘s dairy and mixes business is operated through SMDC, a wholly-owned subsidiary
incorporated in 2001. CNPF‘s dairy line includes liquid milk products and powdered milk
products such as evaporated milk, evaporated condensed milk, all-purpose cream, coffee
creamer and full cream milk powder. All of CNPF‘s dairy products are marketed under t he
Angel brand except for full cream milk powder, which is marketed under the Birch Tree
brand. CNPF also produces coffee mix under the Kaffe de Oro brand and sinigang mix under
the Home Pride brand. The table below sets forth information regarding the product lines in
CNPF‘s dairy and mixes segment.
Brand Products
Indicative
retail price
(P/tin) Target market
Dairy
Angel
Evaporated liquid creamer, evaporated
filled milk, Kremdensada, sweetened
condensed filled milk, condensada and
coffee creamer
₱24.30
(410mL evap)
BCD
Birch Tree
Full cream milk powder ₱104.70
(300g)
BC
Mixes
Home Pride
Sinigang Mix ₱3.80 (10g) CDE

7/21/2019 PreliminaryProspectus - Century
http://slidepdf.com/reader/full/preliminaryprospectus-century 159/648
Kaffe de Oro
Kaffe De Oro 3-in-1 Stick (regular and
sugar-free)
₱4.00 (18g) CD
According to AC Nielsen, as of 2012, CNPF had market shares of 8.5% in
evaporated/condensed milk and 9.3% in all-purpose cream, and was the third largest producer
of canned milk products in the Philippines. According to AC Nielsen, as of July 2011, CNPF
also had 22.0% market share in full cream milk. For the year ended December 31, 2013, the
dairy and mixes segment generated segment revenue of ₱1,548 million, representing 8% of
the total CNPF combined revenue.
CNPF‘s dairy and mixes products are distributed in the Philippines to both retail and food
service outlets. CNPF
The primary brand for CNPF‘s canned milk products is Angel , whose product lines includefilled milk, liquid creamer, sweetened condensed milk, coffee creamer, and Angel
Kremdensada, which is a combination of all-purpose cream and condensed milk. As of 2013,
Angel was the second best-selling milk brand in terms of volume in the Philippines according
to AC Nielsen data. In 2003, CNPF acquired the Birch Tree brand whose sole product is
powdered milk made from 100% cow‘s milk with no added sugar and no added vegetable oil.
In line with CNPF‘s strategy of diversifying its product lines to offer consumers a wide range
of product choices, CNPF acquired the Home Pride and Kaffe de Oro brands in 2008, which
expanded CNPF‘s product mix to include sinigang mixes through the Home Pride brand and
Kaffe de Oro Stick 3-in-1 coffee mixes through the Kaffe de Oro brand.
Production and Raw Materi als
Raw materials used in the dairy and mixes segment include powdered milk, tin cans,
vegetable oil, sugar and emulsifiers. CNPF primarily sources powdered milk from
international third-party suppliers and traders such as Fonterra Co-operative Group Limited
and DanAsia, Inc.
CNPF owns and operates one dairy processing plant located in Taguig, Metro Manila. The
facility has an area of 10,000 sq. m. and has an installed capacity of 11,000 cases per day as
of December 31, 2013.
The production process for CNPF‘s canned dairy products begins with preparation of raw
materials, followed by the combination of milk powders, stabilizers and other dry ingredientsin a mixing tank. The mixture is then pasteurized, homogenized and cooled before being
standardized with water and buffering salt. Once this process is completed, the milk products
are filled into cans and re-heated to commercial sterility. The cans are finally labeled and
packaged. Typically, packaged products have an incubation period of 14 days before being
shipped or warehoused for distribution.
An internal quality control system is implemented at CNPF‘s dairy processing plant to ensure
compliance with industry best practices. The dairy processing plant is in compliance with
HACCP and GMP standards. In addition, the plant‘s internal quality control system has
adopted the principles of ISO 2000.
CNPF engages third-party contractors for certain aspects of its production processes. In the
dairy and mixes segment, CNPF outsources the production of condensada to toll

7/21/2019 PreliminaryProspectus - Century
http://slidepdf.com/reader/full/preliminaryprospectus-century 160/648
manufacturers. In addition, CNPF purchases its mixes in bulk and engages third-party
manufacturers to package the products for distribution. CNPF also outsources the packaging
of powdered milk for Birch Tree products.
Canned Dair y Process Workf low
Competition
According to AC Nielsen, as of December 31, 2012, CNPF had market shares of 8.5% and
9.3% in evaporated/condensed milk, and all-purpose cream, respectively. As of July 2011, the
latest period data was available, CNPF‘s market share in full-cream milk powder was 22%.
In CNPF‘s dairy and mixes business, CNPF competes on quality, customer service,
distribution network and price. Major competitors include domestic dairy companies such as
Alaska and Nestle. In addition, Kaffe de Oro products compete with domestic and
international brands such as Nestlé‘s Nescafé, San Miguel Corporation‘s San Mig Coffee and
Universal Robina Corporation‘s Blend 45. Home Pride sinigang mix competes with domestic
and international brands such as Unilever N.V.‘s Knorr and Mama Sita's Holding Co. Inc.‘s
Mama Sita.
To increase its market share in the dairy segment, CNPF plans to build the Angel and Birch
Tree brands through sustained investment in advertising and promotion and distribution. In
addition, CNPF plans to grow the Angel brand through improved formulations, smaller
packaging sizes for more budget-conscious consumers and achieving a market leading
position in the two-in-one product platform for canned milk and cream. Furthermore, CNPF
plans to grow the Birch Tree brand by expanding into the adult and children‘s milk segments
through powdered milk, flavored milk drinks and other product formats.
Tuna Export
Brands and Products
Through its wholly-owned subsidiary, GTC, CNPF manufactures private label canned,
pouched and frozen tuna products for export to markets in North America, Europe, Africa andAsia. Canned tuna is the primary export product, accounting for approximately 75% of

7/21/2019 PreliminaryProspectus - Century
http://slidepdf.com/reader/full/preliminaryprospectus-century 161/648
CNPF‘s total tuna exports as at December 31, 2013. Major customers for CNPF‘s private
label tuna exports include Chicken of the Sea, Bumble Bee Foods, LLC and Subway in North
America, Princes, Rio Mare and Carrefour in Europe, and Hagoromo, Hoko and California
Garden in Japan and the Middle East.
Exported tuna products are produced in General Santos City in the same fully accredited
processing facilities that produce CNPF‘s tuna products for the Philippine market. For the
year ended December 31, 2013, the tuna export segment generated segment revenue of
₱5,862.7 million, or 31% of total CNPF combined revenue.
Competition
In CNPF‘s tuna export business, CNPF competes primarily on product quality. CNPF has
established long-term relationships with customers in this segment, in some cases spanning
decades, and believes that the goodwill and loyalty of its customers enhances its competitive
position in the tuna export market. According to data from the Philippine Bureau of Customs
(―BOC‖), as at December 31, 2013, CNPF held a 34% market share of the Philipp ine tunaexport business, making it the market leader. CNPF‘s biggest canned and processed fish
export competitor is PhilBest Canning Corporation, which held a 30% market share as at
December 31, 2013, according to the BOC. The remaining market shares are divided among
Alliance Select Foods International Inc., Ocean Canning Corporation, Seatrade Canning
Corporation and Celebes Canning Corporation, each of which held 10% or less of the market
share during the same period. CNPF also faces increasing competition from foreign tuna
processors such as Thai Union Group.
MARKETING, SALES AND DISTRIBUTION
Marketing
CNPF advertises through various media outlets in the Philippines, including television, radio,
newspaper, magazines and billboards to promote brand awareness for its various product
lines. CNPF‘s brand portfolio includes some of the most recognized brands in the Philippine
food industry, including Century, Argentina, 555, Angel and Birch Tree. Employing celebrity
spokespersons, CNPF‘s advertising team has delivered a series of intuitive and appealing ad-
campaigns to enhance brand recognition. CNPF supplements these initiatives with
promotional activities such as product bundling and sampling, and through its presence in
social media networks.
In addition, C NPF makes certain that its brands and products are under a general ‗health &
wellness‘ theme in order to fully promote its products‘ benefits and attract health consciousconsumers. For example, CNPF builds brand awareness through sponsorships and events such
as the Century Tuna Superbods competition, highlighting the health and wellness benefits of
their tuna products.
CNPF has tailored marketing plans for each one of its product lines across all of its product
categories. Based on micro-level and macro-level research of consumer habits and purchasing
trends conducted in-house and by third-party research agencies, CNPF identifies the target
consumer segment for each product and develops a marketing campaign to best reach the
target consumer. For example, in the all-purpose cream category, Angel Kremdensada is
marketed on a platform of value for money, convenience and taste, and the marketing
message positions the brand as a trusted product which offers taste, savings and convenience
for inexperienced cooks. Angel All-Purpose Creamer , on the other hand, is marketed on a platform of superior taste and the marketing message positions the brand as a trusted product

7/21/2019 PreliminaryProspectus - Century
http://slidepdf.com/reader/full/preliminaryprospectus-century 162/648
which delivers superior taste and texture for experienced cooks at an affordable price.
Customized marketing strategies for each product enable CNPF to optimize brand positioning
and effectively convey its marketing messages to consumers.
CNPF has established dedicated business unit marketing teams across its various product
segments. CNPF also engages third-party advertising agencies for some of its marketing
campaigns.
Distribution
Domestic D istribution
Modern trade channels such as supermarkets and grocery stores account for more than 50% of
total sales for nearly all of CNPF‘s domestic product categories. CNPF‘s products are also
sold through general trade channels, including wet markets and sari-sari stores. CNPF
generally distributes its products directly to modern retail outlets and relies on third-party
distributors to distribute its products to wet markets and sari-sari stores. CNPF works closelywith its third-party distributors to increase penetration of general trade outlets, including
ensuring that distributors have access to the full range of CNPF products and are able to offer
the optimal product mix to general trade retailers. As the majority of domestic retail sales and
food services sales are made directly by the manufacturer, CNPF is able to reduce its
distribution costs and establish long-term relationships directly with retail customers. In
addition, CNPF is able to limit exposure to common risks associated with third-party
distributors by not being overly reliant on third-party distributors for its sales.
As at December 31, 2013, CNPF maintained 200 manufacturer direct-to-retail accounts
reaching 3,772 retail outlets ranging from hypermarkets to convenience stores. In addition, as
at December 31, 2013, CNPF held distribution agreements with 39 distributors reaching
approximately 225,168 retail outlets ranging from supermarkets to sari-sari stores. With
respect to its food services sales, CNPF served approximately 1,000 food outlets, maintained
100 manufacturer direct-to-customer accounts and 950 distributor-to-customer agreements as
at December 31, 2013.
As at December 31, 2013, CNPF leased 14 distribution depots and warehouses strategically
located throughout the Philippines. The map below shows the location of CNPF‘s distribution
depots and warehouses.
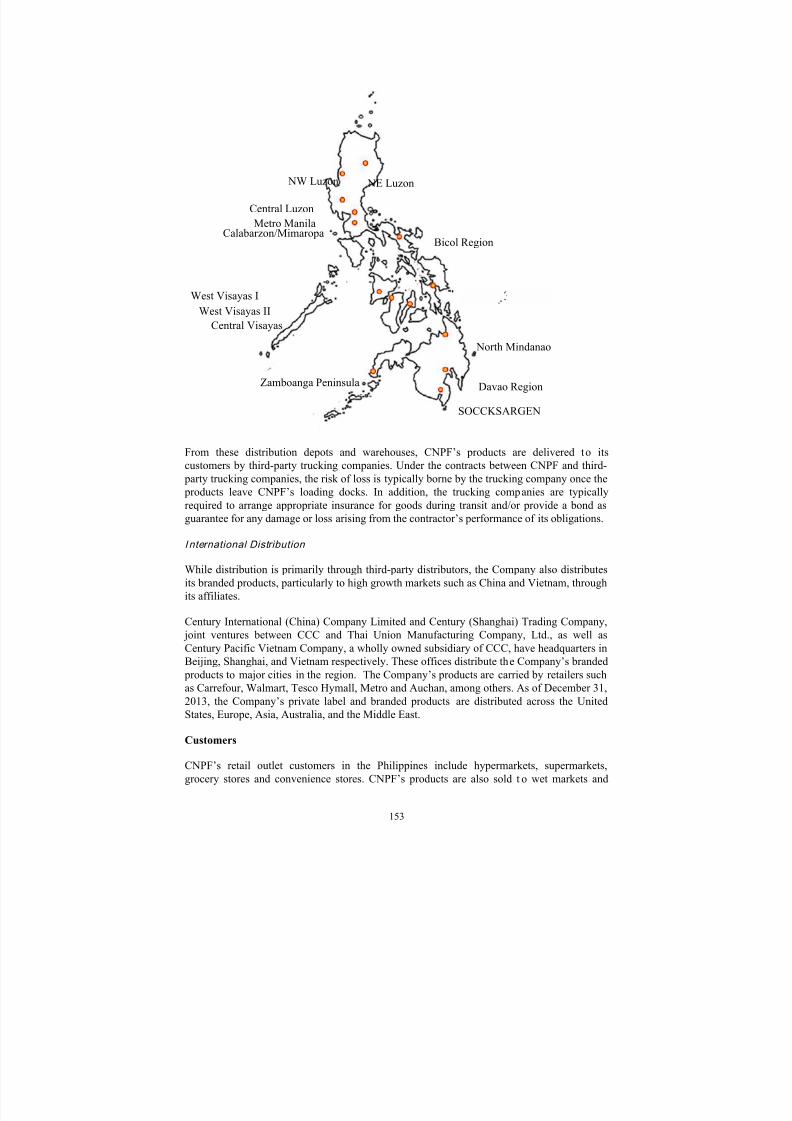
7/21/2019 PreliminaryProspectus - Century
http://slidepdf.com/reader/full/preliminaryprospectus-century 163/648
From these distribution depots and warehouses, CNPF‘s products are delivered to itscustomers by third-party trucking companies. Under the contracts between CNPF and third-
party trucking companies, the risk of loss is typically borne by the trucking company once the
products leave CNPF‘s loading docks. In addition, the trucking companies are typically
required to arrange appropriate insurance for goods during transit and/or provide a bond as
guarantee for any damage or loss arising from the contractor‘s performance of its obligations.
I nternational Distribution
While distribution is primarily through third-party distributors, the Company also distributes
its branded products, particularly to high growth markets such as China and Vietnam, through
its affiliates.
Century International (China) Company Limited and Century (Shanghai) Trading Company,
joint ventures between CCC and Thai Union Manufacturing Company, Ltd., as well as
Century Pacific Vietnam Company, a wholly owned subsidiary of CCC, have headquarters in
Beijing, Shanghai, and Vietnam respectively. These offices distribute the Company‘s branded
products to major cities in the region. The Company‘s products are carried by retailers such
as Carrefour, Walmart, Tesco Hymall, Metro and Auchan, among others. As of December 31,
2013, the Company‘s private label and branded products are distributed across the United
States, Europe, Asia, Australia, and the Middle East.
Customers
CNPF‘s retail outlet customers in the Philippines include hypermarkets, supermarkets,
grocery stores and convenience stores. CNPF‘s products are also sold t o wet markets and
SOCCKSARGEN
Bicol RegionCalabarzon/Mimaropa
Metro Manila
Central Luzon
NE Luzon NW Luzon
North Mindanao
West Visayas I
Zamboanga Peninsula Davao Region
West Visayas II
Central Visayas
7/21/2019 PreliminaryProspectus - Century
http://slidepdf.com/reader/full/preliminaryprospectus-century 164/648
sari-sari stores through distributors. CNPF also sells its products to various food service
customers in the Philippines directly and through distributors. CNPF‘s food service customers
include quick service and full service restaurants, pizza chains, industrial and institutional
accounts. CNPF also provides customized products to various national and local chain
accounts in the food service segment.
QUALITY CONTROL, HEALTH, SAFETY AND ENVIRONMENTAL MATTERS
CNPF is subject to a number of laws and regulations relating to the protection of the
environment and human health and safety, including those governing food safety, air
emissions, water and wastewater discharges, and odor emissions and the management and
disposal of hazardous materials.
CNPF applies its quality standards uniformly across all of its production facilities and quality
assurance personnel conduct periodic operational audits. CNPF seeks to reduce the risk of
contamination of its products through strict sanitation procedures and constant monitoring and
response. CNPF conducts quality analysis and quality control on each batch of products.CNPF also conducts can-cutting, or opening of cans at random for product quality control, on
a monthly basis.
CNPF has earned a number of international accreditations for food safety and quality. CNPF
has been accredited by the US FDA, the Canadian Food Inspection Agency, the British Retail
Consortium, the European Union, the Orthodox Union and the Islamic Dawah Council. In
addition, all of C NPF‘s processing facilities apply the HACCP plan, a management system
which addresses food safety through the analysis and control of biological, chemical and
physical hazards from raw material production, procurement and handling to manufacturing,
distribution and consumption of the finished product. CNPF‘s HACCP accreditation is
renewed on an annual basis and CNPF is subject to periodic safety audits. Furthermore,
CNPF‘s tuna processing facility has been certified by International Featured Standard (Food),
a globally recognized standard for auditing retailer and wholesaler branded food product
suppliers.
As at December 31, 2013, CNPF is in material compliance with applicable health, safety and
environmental laws. Expenses incurred by the Company for purposes of complying with
environmental laws consist primarily of investments in waste treatment and payments for
government regulatory fees that are standard in the industry. See ― Regulatory‖ for a more
detailed discussion of applicable health, safety and environmental laws.
Sustainability Efforts and Marine Wildlife Protection
CNPF is committed to the improved conservation and management of all tuna species. CNPF
sources tuna only from companies or fishing vessels that conform to the regulations
implemented by their respective regional fisheries management organizations. CNPF‘s tuna
suppliers have adopted bycatch (i.e. fish or other animals unintentionally caught in a fishery
while intending to catch other fish) avoidance and mitigation measures that conform to
international best practices. CNPF also supports and invests in tuna fishery improvement and
conservation initiatives to sustain livelihoods while minimizing environmental impact.
In addition, CNPF has implemented a documentation system which enables CNPF to trace the
fishing vessels, the fishing grounds and fishing gear associated with its fish supplies. This
system ensures that CNPF does not purchase tuna caught by vessels known or listed for
illegal, unregulated or unreported practices endangering marine mammals such as dolphins. Inaddition, CNPF has been accredited as ―Dolphin Safe‖ by the Earth Island Institute, an

7/21/2019 PreliminaryProspectus - Century
http://slidepdf.com/reader/full/preliminaryprospectus-century 165/648
independent company that monitors tuna catchers and processing companies globally to
ensure that catching methods do not harm any dolphins and protect the ecosystem and
inspects processing plants to ensure that only tuna caught using dolphin-friendly methods are
processed in CNPF‘s facilities. CNPF also refrains from doing business with companies or
fishing vessels associated with shark fishing.
CNPF‘s tuna business has received a number of environmental awards in recognition of
CNPF‘s commitment to environmental protection and sustainability efforts. Recent awards
include WWF Environmental Leadership awards for 2012 and 2013.
EMPLOYEES
After the completion of the corporate restructuring on January 1, 2014, CNPF has 9,664
employees. The table below presents a breakdown of CNPF employees by function:
No. of Employees
Executive 23
Managerial 123
Supervisory 302
Rank and File 9,216(1)
Total 9,664
(1) includes contractual and cooperative workers.
CNPF has no plans of hiring any significant number of employees in the next 12-month
period.
CNPF is not unionized and believes that it has a good relationship with its employees. CNPF
complies with minimum compensation and benefits standards as well as all other applicable
labor and employment regulations. In accordance with Philippine retirement pay law under
R.A. No. 7641, the Company also provides estimated minimum retirement benefits. The
Company has in place internal control system and risk management procedures to monitor its
continued compliance with labor, employment and other applicable regulations.
PROPERTY
As at December 31, 2013, CNPF does not own land. CNPF leases several properties,
including the Company‘s head office in Pasig City, Metro Manila and its meat processingfacility in Laguna, among others. The relevant lease agreements are typically for a term of 10
years at the prevailing market rates in their respective areas, renewable upon mutual
agreement of the parties.
None of the leased premises is mortgaged or encumbered. The Company does not plan to
acquire any property in the next 12 months.
INTELLECTUAL PROPERTY
Brands, trademarks, patents and other related intellectual property rights relating to CNPF‘s
principal product are either registered or pending registration in the Philippines and the
foreign countries in which CNPF sells, or intends to sell, its products. Trademarks and other
7/21/2019 PreliminaryProspectus - Century
http://slidepdf.com/reader/full/preliminaryprospectus-century 166/648
intellectual property rights are important in the aggregate because brand name recognition is a
key factor in the success of many of CNPF‘s product lines.
CNPF uses its other brand names and trademarks under licenses from the Century Group and
other companies owned and controlled by the Po family. These licensing agreements are
generally for ten-year terms and are renewable based on mutual agreement. The agreements
typically provide for re-negotiation of terms between the parties every five years. CNPF pays
a nominal fee for the use of such brand names and trademarks
As of the date of this Prospectus, CNPF has not had any significant disputes with respect to
any of its trademarks or other intellectual property rights.
RESEARCH AND DEVELOPMENT
CNPF believes that its continued success depends in part on its ability to be innovative and
responsive to consumer preferences and local and international market conditions. CNPF
continuously expands its existing product lines through the development, reformulation andtesting of new products. The research team collaborates with CNPF‘s marketing personnel to
develop new products based on micro-level and macro-level research of consumer
preferences and spending habits, as well as consumer feedback on existing products.
To enhance productivity, efficiency, reduce costs and strengthen its competitiveness, CNPF
engages in research and development to identify cost improvements that can be made to its
production processes. For example, research and development efforts have enabled CNPF
enhance the flavor of its products without increasing cost. CNPF has also been able to lower
the production costs and sales price of certain products through the use of alternative raw
materials such as soy- based proteins while maintaining the products‘ taste and quality. In
addition, CNPF is able to reduce costs through labor-saving enhancements to its production
process and through adjustments to packaging, such as optimizing the thickness of tin cans.
CNPF researches new processes and tests new equipment on a regular basis to maintain and
improve the quality of its food products and enhance the efficiency of its production
processes. Although new products and production processes are primarily developed
internally, CNPF has also purchased new technologies and processes from independent
research and development facilities.
INFORMATION TECHNOLOGY
The Company believes that its current management information systems streamline its
operations and enhance the overall organizational efficiency. CNPF utilizes ERPLN software, by Infor, for enterprise resource planning and reporting. ERPLN is comprised of multiple
modules enhancing various operational functionalities including maintaining centralized
charts of accounts and financial balances, generating and monitoring sales invoices and credit
notes, managing all cash related transactions such as payments to and receipts from business
partners, registering and monitoring of fixed assets, handling and replenishing goods for
warehouses.
In addition, CNPF uses Cognos, by IBM, to consolidate ERPLN data from across its business
divisions. ERPLN data is uploaded to the Cognos financial database on a daily basis to
generate financial reports to enhance management‘s business analytics capabilities.

7/21/2019 PreliminaryProspectus - Century
http://slidepdf.com/reader/full/preliminaryprospectus-century 167/648
INSURANCE
CNPF carries insurance of the types and in amounts that are customary in the food processing
and distribution industry and that it believes will reasonably protect its interests, including
earthquake and flood insurance. CNPF‘s facilities and inventories are insured with Charter
Ping An Insurance Corporation, New India Assurance Company. PNB General Insurance
Corporation, UCPB General Insurance Company, MAA General Insurance Company,
Philippine British and Stronghold Insurance Company with a total insured value of
approximately ₱10 Billion. CNPF does not carry business interruption insurance and self-
insures against this risk.
LEGAL PROCEEDINGS
From time to time, CNPF and its subsidiaries may be involved in litigation or proceedings
arising in the ordinary course of business. As of the date of this Prospectus, neither CNPF nor
any of its subsidiaries are involved in, or the subject of, any legal proceedings which, if
determined adversely to CNPF or the relevant subsidiary‘s interests, would have a materialadverse effect on the business or financial position of CNPF or any of its subsidiaries.
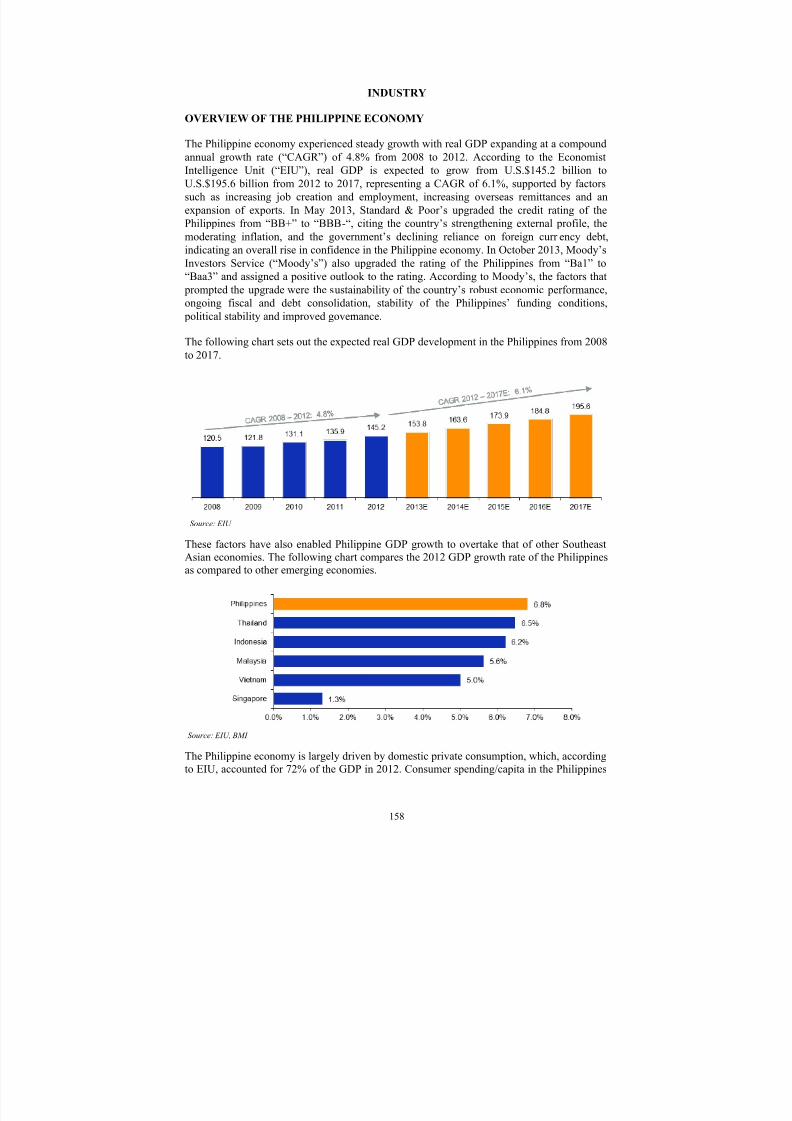
7/21/2019 PreliminaryProspectus - Century
http://slidepdf.com/reader/full/preliminaryprospectus-century 168/648
INDUSTRY
OVERVIEW OF THE PHILIPPINE ECONOMY
The Philippine economy experienced steady growth with real GDP expanding at a compound
annual growth rate (―CAGR‖) of 4.8% from 2008 to 2012. According to the Economist
Intelligence Unit (―EIU‖), real GDP is expected to grow from U.S.$145.2 billion to
U.S.$195.6 billion from 2012 to 2017, representing a CAGR of 6.1%, supported by factors
such as increasing job creation and employment, increasing overseas remittances and an
expansion of exports. In May 2013, Standard & Poor‘s upgraded the credit rating of the
Philippines from ―BB+‖ to ―BBB-―, citing the country‘s strengthening external profile, the
moderating inflation, and the government‘s declining reliance on foreign curr ency debt,
indicating an overall rise in confidence in the Philippine economy. In October 2013, Moody‘s
Investors Service (―Moody‘s‖) also upgraded the rating of the Philippines from ―Ba1‖ to
―Baa3‖ and assigned a positive outlook to the rating. According to Moody‘s, the factors that
prompted the upgrade were the sustainability of the country‘s robust economic performance,
ongoing fiscal and debt consolidation, stability of the Philippines‘ funding conditions, political stability and improved governance.
The following chart sets out the expected real GDP development in the Philippines from 2008
to 2017.
Source: EIU
These factors have also enabled Philippine GDP growth to overtake that of other SoutheastAsian economies. The following chart compares the 2012 GDP growth rate of the Philippinesas compared to other emerging economies.
Source: EIU, BMI
The Philippine economy is largely driven by domestic private consumption, which, accordingto EIU, accounted for 72% of the GDP in 2012. Consumer spending/capita in the Philippines

7/21/2019 PreliminaryProspectus - Century
http://slidepdf.com/reader/full/preliminaryprospectus-century 169/648
grew at a CAGR of 7.6% between 2008 and 2012. This growth was even stronger between2010 and 2012 with a CAGR of 12.1%.
The following chart sets out the expected growth in consumer spending/capita (U.S.$) in thePhilippines from 2008 to 2016.
Source: EIU
Further, the Philippine private consumption as a percentage of GDP for 2012 has surpassedthat of other Southeast Asian economies.
The following chart sets out the private consumption as a percentage of GDP for thePhilippines as compared to other Southeast Asian countries in 2012.
Source: Global Insight
Key drivers of the Philippine domestic consumption have been rising personal disposalincome, a burgeoning middle-income class and a young demographic composition.
Rising personal disposable income and burgeoning middle-income class in the
Philippines
One of the key drivers for strong domestic consumption growth has been the rapid growth of
personal disposable income and the continually expanding middle-income class, defined as
households with annual disposable income of between US5,000 and US$50,000. According
to EIU, per capita personal disposable income in the Philippines grew at a CAGR of 4.8%
between 2008 and 2012 and is expected to expand at a CAGR of 5.4% between 2012 and
2017. As a direct result of rising disposable income, the percentage of middle-income
households increased from 45% in 2008 to 53% in 2012 and is expected to increase to 64%
by 2017. The growth in personal disposable income and emergence of a burgeoning midd le-
income class is expected to provide a strong foundation for the future consumption growth in
the Philippines.
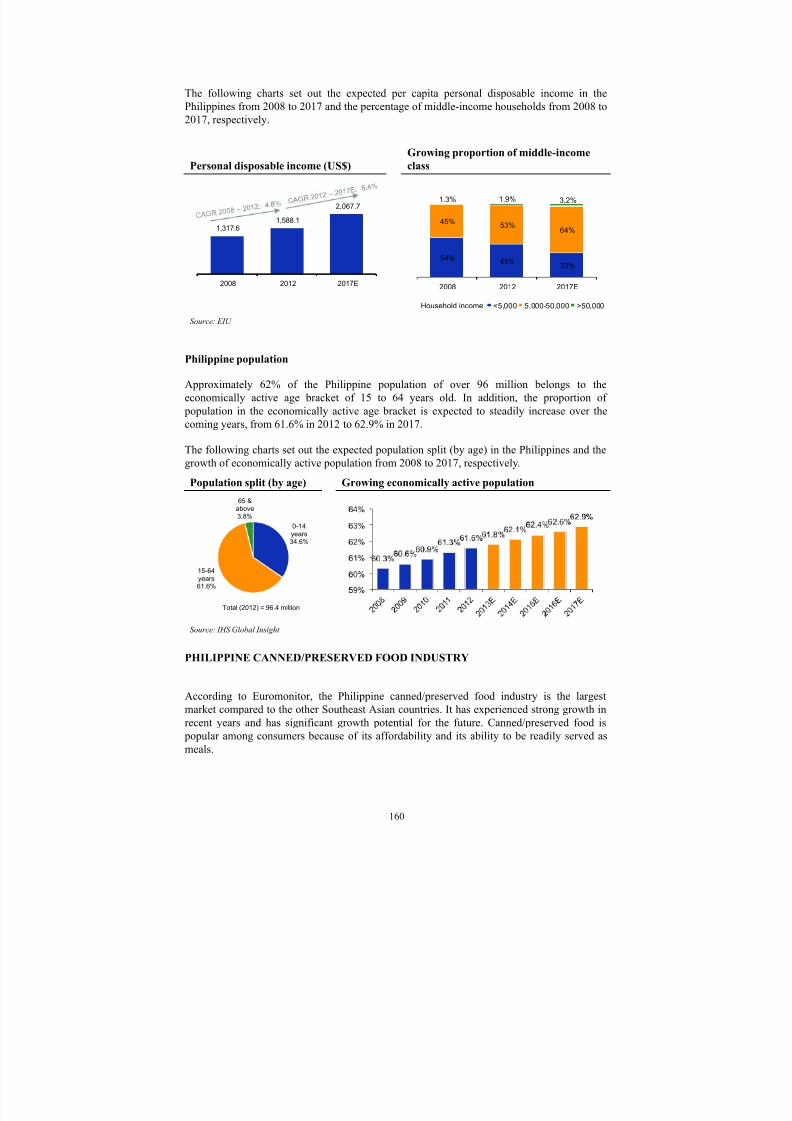
7/21/2019 PreliminaryProspectus - Century
http://slidepdf.com/reader/full/preliminaryprospectus-century 170/648
The following charts set out the expected per capita personal disposable income in the
Philippines from 2008 to 2017 and the percentage of middle-income households from 2008 to
2017, respectively.
Personal disposable income (US$)Growing proportion of middle-incomeclass
1,317.61,588.1
2,067.7
2008 2012 2017E
54% 45%33%
45%53%
64%
1.3% 1.9% 3.2%
2008 2012 2017E
<5,000 5,000-50,000 >50,000Household income
Source: EIU
Philippine population
Approximately 62% of the Philippine population of over 96 million belongs to the
economically active age bracket of 15 to 64 years old. In addition, the proportion of
population in the economically active age bracket is expected to steadily increase over the
coming years, from 61.6% in 2012 to 62.9% in 2017.
The following charts set out the expected population split (by age) in the Philippines and thegrowth of economically active population from 2008 to 2017, respectively.
Population split (by age) Growing economically active population
0-14years34.6%
15-64years61.6%
65 &above3.8%
Total (2012) = 96.4 million
Source: IHS Global Insight
PHILIPPINE CANNED/PRESERVED FOOD INDUSTRY
According to Euromonitor, the Philippine canned/preserved food industry is the largest
market compared to the other Southeast Asian countries. It has experienced strong growth in
recent years and has significant growth potential for the future. Canned/preserved food is
popular among consumers because of its affordability and its ability to be readily served as
meals.

7/21/2019 PreliminaryProspectus - Century
http://slidepdf.com/reader/full/preliminaryprospectus-century 171/648
The following chart shows the Philippine canned/preserved food consumption per capita(US$ in millions) versus that of other Southeast Asian economies in 2012.
Source: Euromonitor
The following chart shows the Philippine canned/preserved food consumption per capita(US$) versus that of other countries in 2012.
Source: Euromonitor
According to Euromonitor, canned/preserved food sales in the Philippines increased from₱25.1 billion in 2008 to ₱33.3 billion in 2012, representing a CAGR of 7.3%. This is expectedto grow to ₱43.6 billion in 2016 at a CAGR of 7.0% from 2012 to 2016.
The following chart shows the expected sales value of Philippine canned/preserved food from2008 to 2016.
25.126.9
28.831.0
33.335.5
38.040.7
43.6
0.0
5.0
10.0
15.0
20.0
25.0
30.0
35.0
40.0
45.0
50.0
2008 2009 2010 2011 2012 2013E 2014E 2015E 2016E
S a l e s i n b i l l i o n s P s
Source: Euromonitor
Significant growth
potential

7/21/2019 PreliminaryProspectus - Century
http://slidepdf.com/reader/full/preliminaryprospectus-century 172/648
Canned/preserved fish/seafood dominates the market, comprising 42% of the sales value in
2012 and 47% by the total volume sold. This is followed by the canned/preserved meat/meat
products category, comprising of 30% of total sales value and 22% of total sales volume in
2012.
2012 breakdown of sales by value 2012 breakdown of sales by volume
Source: Euromonitor
Canned/preserved fish/seafood
The Philippine canned/preserved fish/seafood segment has demonstrated strong growth due to
the growing health consciousness of Filipinos. Fish/seafood is perceived as healthy due to its
Omega-3 content, lower calorie content and low, or zero, cholesterol. According to
Euromonitor, canned/preserved fish/seafood sales in the Philippines increased from ₱10.5
billion in 2008 to ₱14.0 billion in 2012, representing a CAGR of 7.5%. This is expected to
grow to ₱18.2 billion in 2016 at a CAGR of 6.8% from 2012 to 2016.
The following chart shows the expected sales value of Philippine canned/preserved
fish/seafood from 2008 to 2016.
Source: Euromonitor

7/21/2019 PreliminaryProspectus - Century
http://slidepdf.com/reader/full/preliminaryprospectus-century 173/648
According to Euromonitor, CNPF, Liberty Gold Fruit and Maunlad Canning are the topthree canned/preserved fish/seafood market players in the Philippines accounting for 86% ofthe retail sales in 2012.
The ranking of the top players in the Philippines canned/preserved fish/sea food market bysales in 2012 is as follows.
Ranking Company Market share
1 CNPF 54%
2 Liberty Gold Fruit Company, Inc. 19%
3 Maunlad Canning Corporation 13%Source: Euromonitor
The sizes of Philippine domestic canned sardines and canned tuna markets in 2012 are as
follows:
17.2
6.5
-
5.0
10.0
15.0
20.0
Canned sardines Canned tuna
P s b i l l i o n
Source: AC Nielsen
Domestic canned tuna
The Philippines ranks 5th in tuna catch and 3rd in canned tuna production worldwide.
According to AC Nielsen, the Philippine domestic canned tuna market is segmented into three
basic products:
Traditional: Basic Tuna flakes in either oil or water. Century Tuna leads this sub-segment.
Viands: Tuna is used as protein source of ready-to-eat meals such as Afritada, Mechado,
Adobo, etc. 555 Tuna is the leading brand in Viands.
Corned tuna: This format is tuna and soy protein extenders made similar to corned beef.
Because it is a fish, it is perceived to be a healthier alternative to corned beef and corned meat
products. San Marino is the leader in corned tuna.
According to AC Nielsen, Viands are the most popular form of tuna, however, corned tuna is
gaining importance due to its health benefits. Viands contributed 57% to the domestic canned
tuna category, traditional tuna contributed 26% and corned tuna had a contribution of 16% in
2012. CNPF dominates the domestic canned tuna market with its brands accounting for 87%
of the market.
The ranking of the top players in the Philippine domestic canned tuna market in 2012 by salesis as follows:

7/21/2019 PreliminaryProspectus - Century
http://slidepdf.com/reader/full/preliminaryprospectus-century 174/648
Ranking Company Market share
1 CNPF 87%
2 CDO Foodsphere, Inc. 13%
Source: AC Nielsen
Domestic canned sardines
According to AC Nielsen, the Philippine domestic canned sardine market is the most popular
amongst the other canned/preserved fish/seafood categories, mainly because of its
affordability as a protein-rich food and is popular among the lower socio-economic classes.
Apart from being low priced, it is readily available from modern retail grocery stores to the
neighborhood sari-sari stores. The Zamboanga Peninsula is considered as the country‘s
sardine capital. The harvesting and processing of this fish has contributed substantially to the
regional economy.
Maunlad, with its Youngstown brand dominates this market with its sales accounting for 26%
of the market share, followed by Goldfish with 18% and CNPF with 15%.
The ranking of the top players in the Philippine domestic canned sardine market in 2012 by
sales is as follows:
Ranking Company Market share
1 Maunlad Canning Corporation 26%
2 Goldfish 18%
3 CNPF 15%
Source: AC Nielsen
Canned/preserved meat and meat products
The Philippine canned/preserved meat and meat products segment has experienced strong
growth in recent years and is expected to continue to do so going forward. The sales size of
canned/preserved meat and meat products is smaller than that of canned/preserved
fish/seafood although growth rates are expected to be slightly higher, in part due to faster
development of new products. According to Euromonitor, canned/preserved meat/meat
products sales in the Philippines increased from ₱7.5 billion in 2008 to ₱9.8 billion in 2012,
representing a CAGR of 6.9%. This is expected to grow to ₱13.0 billion in 2016 at a CAGR
of 7.3% from 2012 to 2016.
The following chart shows the sales value of Philippine canned/preserved meat and meat
products from 2008 to 2016.

7/21/2019 PreliminaryProspectus - Century
http://slidepdf.com/reader/full/preliminaryprospectus-century 175/648
Source: Euromonitor
According to Euromonitor, CNPF, PureFoods-Hormel, Company, Inc. and CDO Foodsphere,Inc. are the top three canned/preserved meat and meat products market players in thePhilippines accounting for 80% of the retail sales during 2012.
The ranking of the top players in the Philippines by sales in 2012 is as follows.
Ranking Company Market share
1 CNPF 37%
2 PureFoods-Hormel Company, Inc 30%
3 CDO Foodsphere, Inc. 13%
Source: Euromonitor
The respective sizes of the Philippine domestic corned meat, luncheon meat and viennasausage markets in 2012 are as follows:
Source: AC Nielsen
Corned meat
Corned meat has been a staple for years in the Philippines and continues to generate demand.
According to AC Nielsen, this is the most popular segment in the canned/preserved meat and
meat products category. According to Euromonitor, the new variants of corned meat are also
set to stimulate demand among the middle-income households in the future. CNPF dominates
this market with its sales accounting for 43% of the market driven by the market leader
Argentina corned meat. Argentina has been the market leader for the last 16 years.

7/21/2019 PreliminaryProspectus - Century
http://slidepdf.com/reader/full/preliminaryprospectus-century 176/648
The ranking of the top players in the Philippine domestic corned meat market as at August
2013 by sales is as follows:
Ranking Company Market share
1 CNPF 43%2 CDO Foodsphere, Inc. 22%
3 PureFoods-Hormel Company, Inc 13%Source: AC Nielsen
Luncheon meat
The Philippine luncheon meat segment is expected to experience high growth in the coming
years. This is mainly due to the growing business process outsourcing industry. Convenience
is a major market driver as more working adults are likely to demand luncheon meat products
such as emulsified loaves that they could quickly prepare at home.
According to AC Nielsen, CNPF dominates the emulsified loaves market with 26% market
share. The ranking of the top players in the Philippine emulsified loaves market as at August
2013 by sales is as follows:
Ranking Company Market share
1 CNPF 26%
2 Hormel 10%
3 CDO Foodsphere, Inc. 10%
Source: AC Nielsen
Vienna sausage
The Philippine Vienna sausage segment is also set to achieve high growth in the coming years
due to its convenience in preparation.
According to AC Nielsen, CNPF dominates the vienna sausage market with 28% market
share.
The ranking of the top players in the Philippine vienna sausage market as of June 2012 is as
follows:
Ranking Company Market share1 CNPF 28%
2 Libby‘s 25%
3 PureFoods-Hormel Company, Inc 13.9%
Source: AC Nielsen
Distribution channels
The distribution of canned/preserved food is primarily through supermarkets, which
accounted for a 52% share of retail value sales in 2012, followed by ―other‖ grocery retailers
(traditional neighborhood stores) with a 23% share. Another important channel, independent
small grocers, often located in wet markets, accounted for a 18% share. Hypermarkets make
up the balance, with a 7% share.

7/21/2019 PreliminaryProspectus - Century
http://slidepdf.com/reader/full/preliminaryprospectus-century 177/648
The following chart sets forth the relative percentages of different distribution channels for
canned/preserved food industry in the Philippines, based on retail sales in 2012.
Retail sales in 2012 by distribution channel (as % of total retail sales)
Source: Euromonitor
Key trends
Economy brands gaini ng momentum
Economy brands, which are priced lower than the major competitors, are gaining importancein the Philippines as value for money is an important consideration when purchasing
products. Further, canned/processed food‘s affordability and ease of storage allow it to bedistributed effortlessly in sari-sari stores. This makes it a popular choice for lower- andmiddle-income households.
I nnovative products
Manufacturers have started to introduce more innovative products, in order to appeal to a
wider base of middle- and high-income consumers. Evolving from simple canned sardines,tuna and corned beef, they have widened their lines through the addition of variants such ascorned tuna, tuna paella, mackerel steaks and milkfish. These new products are instrumentalin generating demand from middle- and high-income consumers, who are searching for new
products to try. The wide variety of products available in the local market encourages morefrequent consumption. More innovative variants also appeal to younger and more adventurousconsumers, who demand on-the-go meals.
Domestic vs. impor ted brands
Domestic manufacturers dominate canned/preserved food due to their long-standing presencein the market and understanding of the tastes and preferences of local consumers. In 2011,local companies held more than 70% of the retail value sales of canned/preserved food. On
the other hand, imported brands like Spam and Campbell‘s are also popular, though they caterto a smaller consumer base, consisting of people who are willing to pay a higher price for
perceived higher-quality products.
Marketing and promotional strategies
Manufacturers are adopting aggressive marketing and promotional strategies to generate moredemand. Generally, Filipinos are willing to try brands which are endorsed by high-profilecelebrities. Thus manufacturers continue to invest in and benefit from celebrity endorsements.Advertisements via the printed media, radio and television remain important in the promotionof canned/preserved food. Blog sites and social media are quickly becoming a key toadvertise products and influence consumers. As such, bloggers are usually invited to productlaunches. With an increasing level of internet penetration in the Philippines, consumers areincreasingly looking to bloggers for reviews and recommendations.

7/21/2019 PreliminaryProspectus - Century
http://slidepdf.com/reader/full/preliminaryprospectus-century 178/648
Brand diff erentiation
Brand differentiation has been a key strategy in the local competitive landscape, creatingdifferent brand images to suit the profile of the target audience. For instance, CNPF‘s Century
Tuna is intended to appeal to people who are conscious about their physical appearance, while555 is promoted as an ―affordable dish‖. Differentiation through advertising campaignsallowed companies to set themselves apart and, at the same time, prevent productcommoditization.
Packaging
Packaging is also very important in the Philippine canned/preserved food industry, as it oftendictates the pricing scheme used by manufacturers. Small packaging, such as 100g packages,has gained wider importance as consumers have shown a preference for affordable brands.Other important packaging developments are the use of pouches instead of metal food cansand easy-open cans for convenience.
TUNA EXPORTS
According to Euromonitor, the global fish/seafood export market has continued to growovertime. Health and wellness is the primary driver of seafood consumption as seafood is ahealthier alternative to meat.
The following chart shows the CAGR in expenditure of fish and seafood from 2008 to 2012.
Source: Euromonitor
According to the Food and Agriculture Organization, moderate demand, low supplies andrising prices have been the features of the global tuna market in 2013. Tuna prices haveincreased further for delivery to Asian canners, indicating lower supplies than currentdemand. Following this trend, canned tuna prices are also increasing. With the high skipjack
prices, many tuna packers have started adjusting their selling prices or reducing the productcontent to absorb increasing production costs.
The canned tuna consumption has been declining in the United States over the years, which isapparent in the declining imports, which dropped by 14.3% in volume in 2012. The importvalue (U.S.$761.3 million), however, went up by 5.8% as a result of increasing tuna pricesworldwide.

7/21/2019 PreliminaryProspectus - Century
http://slidepdf.com/reader/full/preliminaryprospectus-century 179/648
Rising canned tuna prices have prompted EU importers to look for cheaper alternatives,including products from African, Caribbean, and Pacific countries that have 0% import duty.Thus, in 2012, canned tuna supplies from Côte d‘Ivoire and Papua New Guinea to the EUincreased by 31% and 38.5% respectively, which somewhat offset lower imports fromThailand (-44.3%) and the Philippines (-7.8%). The overall imports of canned/preserved tunainto the EU in 2012 were only down by 3.5% in quantity, but the value went up by more than14.4% over that of 2011, amounting to 447,579 tons valued at U.S.$2.5 billion.
In early 2003, the EU agreed to increase the annual import quota for pre-cooked tuna loins to22,000 tons from 15,000 tons at zero duty for three years. European canners, mainly in Spain,quickly took almost all the allotted duty-free quota within the first quarter of the year, mainlyfrom Thailand, Vietnam, China, Indonesia and the Philippines.
Philippine tuna export industry
According to the BOC, the total market size of the Philippine tuna export producers market
had reached U.S.$330 million in December 2013. Out of this, EU is the biggest importer ofPhilippine tuna.
The following chart sets out the export share by country destination as of year-end 2013.
Source: BOC
According to BOC, canned tuna is the highest sub-category of tuna that is exported. EU is thecountry‘s biggest export market for canned tuna. Philippine canned tuna exports to the EU areestimated to increase by about 64% by 2014, once it gains duty-free access to the 28-nationtrade bloc under the enhanced Generalized Scheme of Preferences (GSP Plus Program).
The following chart sets out the export share by product mix as of year-end 2013.

7/21/2019 PreliminaryProspectus - Century
http://slidepdf.com/reader/full/preliminaryprospectus-century 180/648
Source: BOC
According to BOC, CNPF and Philbest are the top two exporters of tuna in the Philippinesaccounting for 64.4% of tuna exports.
The ranking of the top players in the Philippines by tuna export share in 2013 is as given below.
Ranking Company Market share
1 CNPF 34.2%
2 Philbest Canning Corporation 30.2%
4 Ocean Canning Corporation 10.2%
3 Alliance Select Foods International, Inc. 9.3%
5 Seatrade Development Canning Corporation 8.7%
6 Celebes Canning Corporation 7.4%
Source: BOC

7/21/2019 PreliminaryProspectus - Century
http://slidepdf.com/reader/full/preliminaryprospectus-century 181/648
PHILIPPINE OTHER DAIRY PRODUCTS INDUSTRY
According to Euromonitor, the sales of dairy products in the Philippines increased from ₱43.6
billion in 2008 to ₱55.6 billion in 2012, representing a CAGR of 6.3%. This is expected to
grow to ₱67.1 billion in 2016 at a CAGR of 4.8% from 2012 to 2016.
The following chart shows the expected sales value of Philippine dairy segment from 2008 to2016.
Source: Euromonitor
Powder milk dominates the dairy market comprising 53% of the sales value and 28% by the
sales volume in 2012. The breakdown of the dairy market in the Philippines by products is
given below.
2012 breakdown of sales by value
Powder milk53%
Flavoredpowder milk
drinks17%
Condensed/evaporated
milk15%
Flavoredmilk drinks
6%
Milk5%
Cream4%
Others0%
2012 breakdown of sales by volume
Powdermilk28%
Condensed/evaporated
milk27%
Flavoredpowder milk
drinks14%
Flavoredmilk drinks
13%
Milk12%
Cream6%
Others0%
Source: Euromonitor
The Philippine other dairy products segment includes condensed/evaporated milk, coffee
whiteners and cream. According to Euromonitor, cheaper brands have started gaining
momentum in the market since 2012. High inflation rates coupled with increasing prices of
dairy in the global market are encouraging more consumers to purchase cheaper products
such as Krem-Top, Carnation Condensada and Angel Evaporada. The other dairy products
sales in the Philippines increased from ₱8.5 billion in 2008 to ₱10.9 billion in 2012,
representing a CAGR of 6.4%. This is expected to grow to ₱13.5 billion in 2016 at a CAGR
of 5.5% from 2012 to 2016.
The following chart shows the expected sales value of Philippine other dairy products from
2008 to 2016.

7/21/2019 PreliminaryProspectus - Century
http://slidepdf.com/reader/full/preliminaryprospectus-century 182/648
Source: Euromonitor
Supermarkets and hypermarkets are the key distribution channels for the Philippine otherdairy products. Manufactures, however, are adapting to smaller-sized packaging to encouragemore sales through sari-sari stores.
The following chart sets forth the relative percentages of different distribution channels forthe other dairy products segment in the Philippines, based on retail sales in 2012.
Retail sales in 2012 by distribution channel (as % of total retail sales)
Source: Euromonitor
According to AC Nielsen, the condensed/evaporated milk segment is led by Alaska with 60%market share by sales and the all-purpose cream segment is led by Nestlé with 70% marketshare by sales.
The following table gives the ranking of the top players in the condensed/evaporated milk
market by retail value for 2012.
Ranking Company Market share
1 Alaska Milk Corporation 72%
2 CNPF 8%
Source: AC Nielsen
The following table gives a breakdown of the all-purpose cream segment brand share by retailvalue for 2012.
Ranking Company Market share1 Nestlé S.A. 70%

7/21/2019 PreliminaryProspectus - Century
http://slidepdf.com/reader/full/preliminaryprospectus-century 183/648
2 Alaska Milk Corporation 18%
3 CNPF 9%Source: AC Nielsen
The following table gives a breakdown of the all-purpose cream segment brand share by retailvalue as of July 2011.
Ranking Company Market share
1 Nestlé S.A. 65%
2 CNPF 22%
3 Fonterra Brands Philippines 12%Source: AC Nielsen; July 2011 is latest period data was made available

7/21/2019 PreliminaryProspectus - Century
http://slidepdf.com/reader/full/preliminaryprospectus-century 184/648
REGULATORY
HEALTH AND CONSUMER PROTECTION
The Food, Drug and Cosmetics Act
The Food, Drug and Cosmetics Act (R.A. No. 3720), as amended by E.O. 175 and the Foodand Drug Administration Act of 2009 (R.A. No. 9711), seeks to ensure that safe and qualityfood is available in the Philippines, and regulates the production, sale, and trade of food to
protect the health of the citizens. The Food and Drug Administration (―Philippine FDA‖) isthe governmental agency tasked to implement the Food, Drug and Cosmetics Act.
Under the Food, Drug and Cosmetics Act, the following acts, among others, are prohibited:
the manufacture, importation, exportation, sale, offering for sale, distribution,
transfer, non-consumer use, promotion, advertising, or sponsorship of any ―health product‖ that is adulterated, unregistered or misbranded. (―Health product‖ meansfood, drugs, cosmetics, devices, biologicals, vaccines, in-vitro diagnostic reagents,and household/urban hazardous substances. On the other hand, ―Food‖ means any
processed substance which is intended for human consumption and includes drink forman, beverages, chewing gum and any substances which have been used as aningredient in the manufacture, preparation or treatment of food.);
the adulteration or misbranding of any health product;
the refusal to permit entry to or inspection of premises or vehicles or to allow samplesto be collected for the purposes authorized under the Food, Drug and Cosmetics Act;
the alteration, mutilation, destruction, obliteration, or removal of the whole or any part of the labeling of, or the doing of any other act with respect to health products if
such act is done while the article is held for sale (whether or not the first sale) andresults in the article being adulterated or misbranded;
the manufacture, importation, exportation, sale, offering for sale, distribution,transfer, non-consumer use, promotion, advertisement, or sponsorship of any health
product which, although requiring registration, is not registered with the PhilippineFDA;
the manufacture, importation, exportation, transfer or distribution of any food,cosmetic or household/urban hazardous substance by any natural or juridical personwithout the license to operate from the Philippine FDA; and
the sale, offering for sale, importation, exportation, distribution, or transfer of anyhealth product beyond its expiration or expiry date, if applicable.
Any person who commits any of the prohibited acts stated above shall, upon conviction,suffer the penalty of imprisonment ranging from one (1) year but not more than ten (10) yearsor a fine of not less than ₱50,000.00 but not more than ₱500,000.00, or both, at the discretionof the court. If the offender is a manufacturer, importer or distributor of any health product,the penalty of at least five (5) years imprisonment but not more than ten (10) years and a fineof at least ₱500,000.00 but not more than ₱5,000,000.00 shall be imposed. Further, anadditional fine of 1% of the economic value/cost of the violative product or violation, or₱1,000.00, whichever is higher, shall be imposed for each day of continuing violation.
Furthermore, health products found in violation of the provisions of the Food, Drug andCosmetics Act and other relevant laws, rules and regulations may be seized and held in
custody pending proceedings, without a hearing or court order, when the director general ofthe Philippine FDA has reasonable cause to believe from facts found by him or an authorized

7/21/2019 PreliminaryProspectus - Century
http://slidepdf.com/reader/full/preliminaryprospectus-century 185/648
officer or employee of the Philippine FDA that such health products may cause injury or
prejudice to the consuming public.
Designated officers or employees of the Department of Health (―DOH‖), for purposes ofenforcing of the Food, Drug and Cosmetics Act, are authorized to enter, at reasonable hours,any factory, warehouse, or establishment in which food, drugs, devices, or cosmetics aremanufactured, processed, packed, or held for introduction into domestic commerce and toinspect, in a reasonable manner, such factory, warehouse, establishment, or vehicle and all
pertinent equipment, finished or unfinished materials, containers, and labeling therein.
When there is a finding of prohibited actions and determination of the persons liable thereto,after notice and hearing, the director-general may impose one or more of the followingadministrative penalties: (1) the cancellation of any authorization which may have beengranted by the Philippine FDA, or suspension of the validity thereof which shall not exceed 1year, (2) a fine of not less than ₱50,000.00 but not more than ₱500,000.00, and (c) thedestruction and/or appropriate disposition of the subject health product and/or closure of the
establishment for any violation of the Food, Drug and Cosmetics Act.
The Company has no pending material case in relation to the Food, Drug and Cosmetics Act,as amended by E.O. 175 and the Food and Drug Administration Act of 2009.
The Consumer Act
The Consumer Act (R.A. No. 7394) establishes quality and safety standards with respect tothe composition, contents, packaging, and advertisement of food products. It is directed toachieve the following objectives: (1) to protect consumers against hazards to health andsafety, (2) to protect consumers against deceptive, unfair, and unconscionable sales acts and
practices, (3) to provide consumers information and education to facilitate sound choice and
the proper exercise of rights, (4) to provide consumers with adequate rights and means ofredress, and (5) to involve consumer representatives in the formulation of social andeconomic policies.
The Consumer Act, in furtherance of its objectives, regulates the use of weights andmeasures, advertisements and sales promotions, labeling and packaging, credit transactions,and product and service warranties of food products. It prohibits, among other acts, theadulteration and misbranding of food products and the manufacture, importation, exportation,sale, offering for sale, distribution, and transfer of food products that are adulterated ormisbranded or do not conform to applicable consumer product quality or safety standards. Afood is deemed adulterated if, among others, it contains any poisonous or deleterioussubstance, it is prepared, packed, or held under unsanitary conditions, it contains substances
to increase its bulk or weight, reduce its quality or strength, or make it appear better or ofgreater value than it is, or its damage or inferiority is concealed in any manner.
The Consumer Act imposes a penalty of imprisonment of not less than one year but not morethan five years, or a fine of not less than ₱5,000.00 but not more than ₱10,000.00, or both, atthe discretion of the court. The chairman of the board of directors, president, generalmanager, partners, and persons directly responsible for the offense, if committed by a
juridical person, shall be penalized.
The implementing agencies tasked to enforce the Consumer Act are the DOH, the Departmentof Agriculture (―DA‖), and the Department of Trade and Industry (―DTI‖).
The Company has no pending material case in relation to the Consumer Act.

7/21/2019 PreliminaryProspectus - Century
http://slidepdf.com/reader/full/preliminaryprospectus-century 186/648
The Food Safety Act
The Food Safety Act of 2013 (R.A. No. 10611) seeks to strengthen the food safety regulatorysystem in the Philippines by principally delineating the mandates and responsibilities of theconcerned government agencies. The National Dairy Authority, National Meat InspectionService (―NMIS‖), and Bureau of Fisheries and Aquatic Resources under the DA are thegovernment agencies responsible for the development and enforcement of food safetystandards and regulations in the primary production and post harvest stages for milk, meats,and fish, respectively, while the Philippine FDA under the DOH is responsible for the safetyof processed and pre-packaged foods. The Food Safety Act created the Food SafetyRegulation Coordinating Board to monitor and coordinate the performance andimplementation of the mandates of the government agencies under the law.
Under the Food Safety Act, food business operators or those who undertake to carry out anyof the stages of the food supply chain are held principally responsible in ensuring that their
products satisfy the requirements of the law and that control systems are in place to prevent,eliminate, or reduce risks to consumers.
For the enforcement of the Food Safety Act, the food safety regulatory agencies areauthorized to perform regular inspection of food business operators taking into considerationthe (1) compliance with mandatory safety standards, (2) implementation of the HACCP or thescience-based system that identifies, evaluates, and controls hazards for food safety at critical
points, (3) good manufacturing practices, and (4) other requirements of regulations.
The Food Safety Act prohibits, among others, the following acts:
refusal of access to pertinent records or entry of inspection officers of the food safety
regulatory agencies; production, handling or manufacturing for sale, offering for sale, distribution in
commerce, or importation of any food or food product, which is declared as bannedor is not in conformity with applicable quality or safety standard;
Adulteration, misbranding, mislabeling, false advertisement of any food productwhich misleads the consumers and carry out any other acts contrary to goodmanufacturing practices;
Operation of a food business without the appropriate authorization
For the first conviction of any of the prohibited acts under the Food Safety Act, a fine of notless than ₱50,000.00 but not more than ₱100,000.00 and suspension of appropriateauthorization for one month shall be imposed. For the second conviction, a fine of not lessthan ₱100,000.00 but not more than ₱200,000.00 and suspension for three months shall beimposed. For the third conviction, a fine of not less than ₱200,000.00 but not more than₱300,000.00 and suspension for six months shall be imposed. The penalties shall be also beimposed when the violation results in the physical injuries or death of a person.
The Company has no pending material case in relation to the Food Safety Act.
The Philippine Fisheries Code
The Philippine Fisheries Code (R.A. No. 8550) declares food security as the overridingconsideration in the utilization, management, development, conservation, and protection of
fishery resources in order to provide the food needs of the population. It regulates the conductof fishery activities for the conservation, protection, and sustained management of the

7/21/2019 PreliminaryProspectus - Century
http://slidepdf.com/reader/full/preliminaryprospectus-century 187/648
country‘s fishery and aquatic resources, poverty alleviation and the provision ofsupplementary livelihood among municipal fisherfolk, improvement of productivity ofaquaculture, optimal utilization of off-shore and deep-sea resources, and upgrading of post-harvest technology.
Under the Fisheries Code, all post-harvest facilities such as fish processing plants, ice plantsand cold storages, fish ports/landings and other fishery business establishments must registerwith and be licensed by the LGUs which shall prescribe minimum standards for suchfacilities.
The Fisheries Code regulates the exportation of fishery products whenever such exportationaffects domestic food security and production. The exportation of live fish shall be prohibitedexcept those which are hatched or propagated in accredited hatcheries and ponds. Fishery
products may be imported only upon certification by the DA that the importation is necessaryand all the requirements of the Fisheries Code and existing rules and regulations have beencomplied with. Importation for canning or processing purposes may be allowed without the
certification, provided, a permit is secured from the DA. No person shall import and/or exportfishery products of whatever size, stage or form for any purpose without securing a permitfrom the DA.
Any importation or exportation of fish or fisheries species in violation of the Fisheries Codeshall be punished by eight years of imprisonment, a fine of ₱80,000.00 and destruction of livefishery species or forfeiture of non-lived fishery species. Any violator shall be banned from
being members or stockholders of companies engaged in fisheries.
The Bureau of Fisheries and Aquatic Resources (―BFAR‖) under the DA sets policies andformulates standards for the effective, efficient, and economical operation of the fishingindustry and exercises overall supervision over functions and activities of all offices and
instrumentalities and other offices related to fisheries. The BFAR is responsible for theestablishment and implementation of an inspection system for the import and export of fishand fishery or aquatic products and fish processing establishments in order to ensure productquality and safety.
The Fisheries and Aquatic Resources Management Councils (―FARMCs‖) formed in thenational and local levels by fisherfolk organizations, cooperatives, and non-governmentorganizations in localities assist in the preparation of fishery development plans andenforcement of fishery laws, rules, and regulations.
For the purposes of enforcement of the Philippine Fisheries Code, the law enforcementofficers of the DENR, the Philippine Navy, Philippine Coast Guard, Philippine National
Police (―PNP‖), PNP-Maritime Command, law enforcement officers of the local governmentunits, and other government enforcement agencies, are authorized to enforce the Code andother fishery laws, rules and regulations
The Company has no pending material case in relation to the Philippine Fisheries Code.
The Meat Inspection Code
The Meat Inspection Code (R.A. No. 9296), as amended, applies to all meat establishmentswhere food animals are slaughtered, prepared, processed, handled, packed or stored or sold. Itestablishes safety and quality standards for meats derived from domestic animals slaughteredfor human consumption, including pork, beef, and chicken meat products. The NMIS, aspecialized regulatory service attached to the DA, serves as the national controlling authoritytasked with implementing policies, programs, guidelines, and rules and regulations pertaining

7/21/2019 PreliminaryProspectus - Century
http://slidepdf.com/reader/full/preliminaryprospectus-century 188/648
to meat inspection and meat hygiene to ensure meat safety and quality from farm to table. Onthe other hand, the local government units, in accordance with existing laws, policies, rulesand regulations, and quality and safety standards of the DA, have the authority to regulate theconstruction, management, and operation of slaughterhouses, meat inspection, and meattransport within their respective jurisdictions, and to collect fees and charges in connectiontherewith.
The Meat Inspection Code requires the inspection of food animals and the carcasses and partsthereof that are capable of use as human food. Only meat or meat products that have passedinspection and have been marked may be sold, offered for sale, or transported. The MeatInspection Code also provides for the inspection of slaughterhouses, poultry dressing plants,and meat shops to ensure compliance with existing laws, policies, and safety standards.
All meat establishments are required to adopt good manufacturing practices and sanitationstandard operating procedures programs for the production, storage, and distribution of meat
products and to comply with all pollution control and environmental laws and regulations
relating to the disposal of carcasses and parts thereof.
Any meat or meat products which is placed or packed in any can, pot, tin, canvas, otherreceptacle or covering must be properly labeled, under the supervision of an inspector. Thelabel shall state that the contents thereof have been "Inspected and Passed". No examinationand inspection of sealed meat and meat products shall be deemed to be complete until such
products have been sealed or enclosed. No meat and meat products shall be sold or offered forsale by any person, firm or corporation, under any name or other marking or labeling which isfalse or misleading, or in any container of a misleading form or size. Established trade namesand other marking and labeling and containers which are not false or misleading andapproved by the secretary of the DA are permitted.
Under the Meat and Inspection Code, the following acts, among others, are prohibited:
slaughter any food animal or prepare meat or meat product in any meat establishmentexcept in compliance with the requirements of the Meat and Inspection Code;
slaughter or handle in connection with slaughter, any food animal in a manner notconsidered humane;
sell, transport, offer or receive for sale or transportation in commerce carcasses or parts thereof, meat or meat product required to be inspected, unless they have been soinspected and passed;
do any act while they are being transported in commerce or held for sale, which isintended to cause or has the effect of causing such articles to be adulterated or
misbranded.
Any person, who commits any of the prohibited acts or violates any of the Meat InspectionCode, shall be punished by imprisonment of not less than six (6) years and one (1) day but notmore than twelve (12) years or a fine of not less than ₱100,000.00 but not more than₱1,000,000.00 or both such fine and imprisonment. The offender is obliged to pay to theconcerned consumer whatever damage may have been suffered by the latter as a consequenceof the unlawful act. In addition, the NMIS and the LGUs imposes administrative fines and
penalties.
Further, a cease and desist order may be issued by the secretary of the DA to any person, firm,or corporation engaged, in the business of slaughtering food animals, or preparing, freezing,
packaging, storing, or labeling any carcasses or parts or products of carcasses for use ashuman food, found to be in violation of any of the provisions of the Meat and Inspection

7/21/2019 PreliminaryProspectus - Century
http://slidepdf.com/reader/full/preliminaryprospectus-century 189/648
Code, should the continued operation of the said entity, pose risks to public health andendanger the animal population.
The Company has no pending material case in relation to the Meat Inspection Code.
The Price Act
The Price Act (R.A. No. 7581) provides for price controls for basic necessities and primecommodities in certain situations. Basic necessities include rice, corn, bread, fish, dried andcanned fish and other marine products, fresh vegetables, pork, beef, poultry, milk, coffee,cooking oil, salt, laundry soap, and detergents while prime commodities include flour, dried,
processed and canned pork, beef and poultry meat, other dairy products, toilet soap, paper,school supplies, electrical supplies, and batteries, among others. Under the Price Act, the
prices of basic commodities are automatically frozen in areas declared as disaster areas, underemergency or martial law or in a state or rebellion or war. Unless lifted by the President of thePhilippines, prices shall remain the same for a maximum of 60 days. The President of the
Philippines may likewise impose a price ceiling on basic necessities and prime commoditiesin cases of calamities, emergencies, price manipulation, or when the prevailing prices haverisen to unreasonable levels.
The Price Act considers it unlawful for any person habitually engaged in the production,manufacture, importation, storage, transport, distribution, sale, or other methods ofdisposition of goods to engage in price manipulation of any basic necessity or primecommodity through cartels, hoarding, or profiteering.
The DA, DENR, DOH, and the DTI are the implementing agencies responsible for theenforcement of the provisions of the Price Act. The implementing government agencies of thePrice Act are granted the authority thereunder to issue suggested retail prices, whenever
necessary, for certain basic necessities and/or prime commodities for the information andguidance of concerned trade, industry, and consumer sectors.
The Company has no pending material case in relation to the Price Act.
ENVIRONMENTAL LAWS
Philippine Environmental Impact Statement System
The Philippine Environmental Impact Statement System was established by virtue ofPresidential Decree 1586. Development projects that are classified by law as environmentallycritical or projects within statutorily defined environmentally critical areas are required to
obtain an Environmental Compliance Certificate (―ECC‖) prior to project construction andoperation. Through its regional offices or through the Environmental Management Bureau(―EMB‖), the DENR determines whether a project is environmentally critical or located in anenvironmentally critical area. As a prerequisite for the issuance of an ECC, anenvironmentally critical project is required to submit an Environmental Impact Statement(―EIS‖) to the EMB while a project in an environmentally critical area is generally required tosubmit an Initial Environmental Examination (―IEE‖) to the proper DENR regional office,without prejudice to the power of the DENR to require a more detailed EIS.
The EIS refers to both the document and the environmental impact assessment of a project,including a discussion of direct and indirect consequences to human welfare and ecology aswell as environmental integrity. The IEE refers to the document and the study describing theenvironmental impact, including mitigation and enhancement measures, for projects inenvironmentally critical areas.
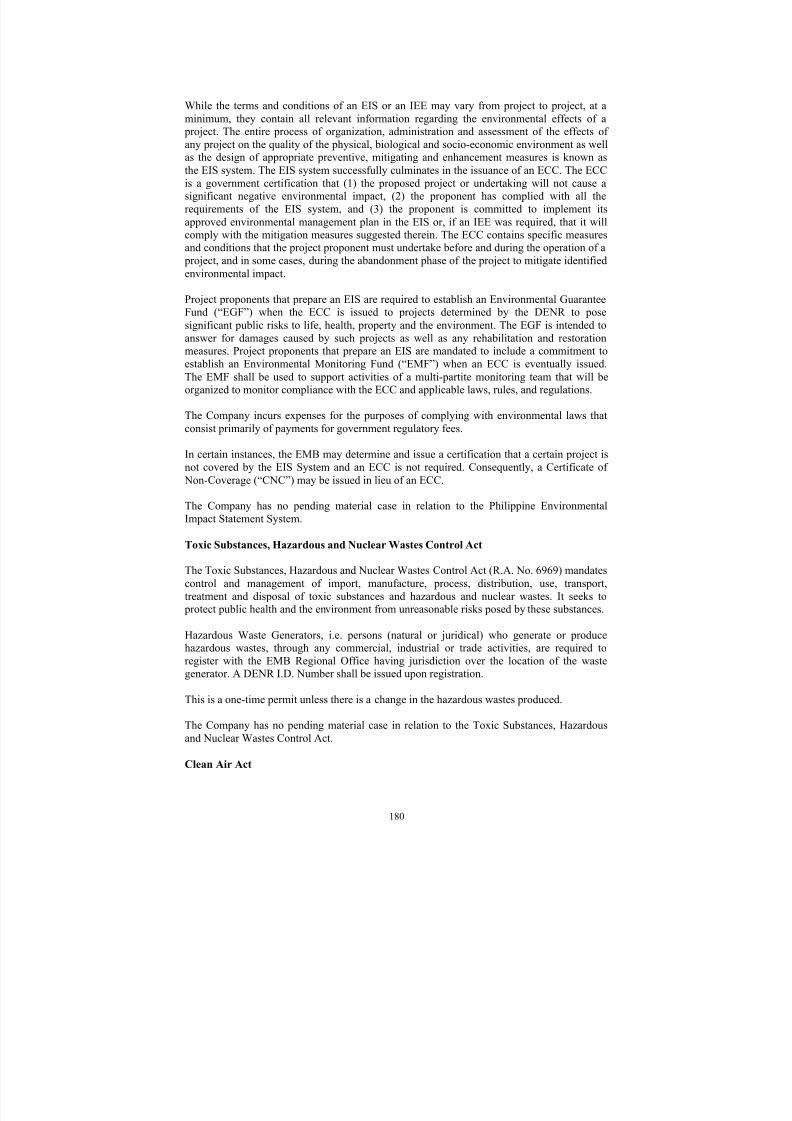
7/21/2019 PreliminaryProspectus - Century
http://slidepdf.com/reader/full/preliminaryprospectus-century 190/648
While the terms and conditions of an EIS or an IEE may vary from project to project, at aminimum, they contain all relevant information regarding the environmental effects of a
project. The entire process of organization, administration and assessment of the effects ofany project on the quality of the physical, biological and socio-economic environment as wellas the design of appropriate preventive, mitigating and enhancement measures is known asthe EIS system. The EIS system successfully culminates in the issuance of an ECC. The ECCis a government certification that (1) the proposed project or undertaking will not cause asignificant negative environmental impact, (2) the proponent has complied with all therequirements of the EIS system, and (3) the proponent is committed to implement itsapproved environmental management plan in the EIS or, if an IEE was required, that it willcomply with the mitigation measures suggested therein. The ECC contains specific measuresand conditions that the project proponent must undertake before and during the operation of a
project, and in some cases, during the abandonment phase of the project to mitigate identifiedenvironmental impact.
Project proponents that prepare an EIS are required to establish an Environmental GuaranteeFund (―EGF‖) when the ECC is issued to projects determined by the DENR to posesignificant public risks to life, health, property and the environment. The EGF is intended toanswer for damages caused by such projects as well as any rehabilitation and restorationmeasures. Project proponents that prepare an EIS are mandated to include a commitment toestablish an Environmental Monitoring Fund (―EMF‖) when an ECC is eventually issued.The EMF shall be used to support activities of a multi-partite monitoring team that will beorganized to monitor compliance with the ECC and applicable laws, rules, and regulations.
The Company incurs expenses for the purposes of complying with environmental laws thatconsist primarily of payments for government regulatory fees.
In certain instances, the EMB may determine and issue a certification that a certain project isnot covered by the EIS System and an ECC is not required. Consequently, a Certificate of
Non-Coverage (―CNC‖) may be issued in lieu of an ECC.
The Company has no pending material case in relation to the Philippine EnvironmentalImpact Statement System.
Toxic Substances, Hazardous and Nuclear Wastes Control Act
The Toxic Substances, Hazardous and Nuclear Wastes Control Act (R.A. No. 6969) mandatescontrol and management of import, manufacture, process, distribution, use, transport,treatment and disposal of toxic substances and hazardous and nuclear wastes. It seeks to
protect public health and the environment from unreasonable risks posed by these substances.
Hazardous Waste Generators, i.e. persons (natural or juridical) who generate or producehazardous wastes, through any commercial, industrial or trade activities, are required toregister with the EMB Regional Office having jurisdiction over the location of the wastegenerator. A DENR I.D. Number shall be issued upon registration.
This is a one-time permit unless there is a change in the hazardous wastes produced.
The Company has no pending material case in relation to the Toxic Substances, Hazardousand Nuclear Wastes Control Act.
Clean Air Act

7/21/2019 PreliminaryProspectus - Century
http://slidepdf.com/reader/full/preliminaryprospectus-century 191/648
The Clean Air Act of 1999 focuses primarily on pollution prevention and provides for acomprehensive management program for air pollution.
Consistent with the policies of the Clean Air Act, all stationary sources of air pollution thathave the potential to emit 100 tons per year or more of any regulated air pollutant, or whenrequired under the ECC, must secure an Authority to Construct and Permit to Operate fromthe EMB prior to commencement of construction or operation.
The Authority to Construct and Permit to Operate is a one-time permit while the permit tooperate must be renewed yearly.
The Company has no pending material case in relation to the Clean Air Act.
LABOR LEGISLATION
The Labor Code
The Philippine Labor Code and other statutory enactments provide the minimum benefits thatemployers must grant to their employees, which include certain social security benefits, suchas benefits mandated by the Social Security Act of 1997 (R.A. No. 8282), the National HealthInsurance Act of 1995 (R.A. No. 7875), as amended, and the Home Development Fund Lawof 2009 (R.A. No. 9679).
Under the Social Security Act of 1997, social security coverage is compulsory for allemployees under 60 years of age. An employer is obligated to deduct and withhold from eachemployee's monthly salary, wage, compensation or earnings, the employee's contribution; andthe employer, for its part, makes a counterpart contribution for the employee, and remits bothamounts to the Social Security System (―SSS‖). This enables the employees to claim their
pension, death benefits, permanent disability benefits, funeral benefits, sickness benefits andmaternity-leave benefits. The Social Security Act of 1997 imposes penal sanctions if anemployer fails to remit the contributions to the SSS. For corporate employers, the penalty isimposed on its president and members of the board of directors.
The National Health Insurance Act created the National Health Insurance Program (―NHIP‖)to provide health insurance coverage and ensure affordable and accessible health care servicesto all Filipino citizens. Under the law, all members of the SSS are automatically members ofthe NHIP. The Philippine Health Insurance Corporation (―PhilHealth‖) administers the NHIP,and an employer is required to deduct and withhold the contributions from the employee‘ssalary, wage or earnings, make a counterpart contribution for the employee, and remit bothamounts to PhilHealth. The NHIP will then subsidize personal health services required by the
employee subject to certain terms and conditions under the law. The National HealthInsurance Act likewise imposes penal sanctions if an employer does not remit thecontributions to PhilHealth. For corporate employers, the penalty is imposed on its presidentand members of the board of directors.
The Home Development Fund Law (R.A. No. 9679) or the Pag-IBIG Fund Law, created theHome Development Mutual Fund (―HDMF‖), a national savings program as well as a fund to
provide for affordable shelter financing to Filipino workers. Coverage under the HDMF iscompulsory for all SSS members and their employers. Under the law, an employer mustdeduct and withhold 2% of the employee's monthly compensation, up to a maximum of₱5,000.00, and likewise make a counterpart contribution of 2% of the employee's monthlycompensation, and remit the contributions to the HDMF. The Pag-IBIG Fund Law alsoimposes penal sanctions if the employer does not remit the contributions to the HDMF.

7/21/2019 PreliminaryProspectus - Century
http://slidepdf.com/reader/full/preliminaryprospectus-century 192/648
The Philippine Labor Code provides that, in the absence of a retirement plan provided bytheir employers, private-sector employees who have reached 60 years of age or more, but not
beyond 65 years of age, the compulsory retirement age for private-sector employees without aretirement plan, and who have rendered at least five years of service in an establishment, mayretire and receive a minimum retirement pay equivalent to one-half month's salary for everyyear of service, with a fraction of at least six months being considered as one whole year. Forthe purpose of computing the retirement pay, "one-half month's salary" shall include all of thefollowing: fifteen days salary based on the latest salary rate; in addition, one-twelfth of thethirteenth month pay and the cash equivalent of five days of service incentive leave pay.Other benefits may be included in the computation of the retirement pay upon agreement ofthe employer and the employee or if provided in a collective bargaining agreement.
The Company has no pending material case in relation to the Labor Code.

7/21/2019 PreliminaryProspectus - Century
http://slidepdf.com/reader/full/preliminaryprospectus-century 193/648
BOARD OF DIRECTORS AND SENIOR MANAGEMENT
The overall management and supervision of the Company is undertaken by the Company‘s
Board of Directors. The Company‘s executive officers and management team cooperate with
its Board by preparing appropriate information and documents concerning the Company ‘s
business operations, financial condition and results of operations for its review. Pursuant to
the Company‘s articles of incorporation, the Board shall consist of seven members, of which
two are independent directors. A majority of the directors were el ected at the Company‘s
annual shareholders meeting on October 28, 2013 and will hold office until their successors
have been duly elected and qualified. The Company‘s annual shareholders‘ meetings are held
in June. The table sets forth each member of the Company‘s Board and its executive officers
as of December 31, 2013.
Name Age Nationality Position
Ricardo S. Po, Sr. 82 Filipino Chairman Emeritus
Ricardo T. Po, Jr. 45 Filipino Vice Chairman
Christopher T. Po 43 Filipino Chairman, President and ChiefExecutive Officer
Teodoro T. Po 44 Filipino Vice Chairman, Executive Vice
President, and Chief Operating Officer
Leonardo T. Po 36 Filipino Director and Treasurer
Oscar A. Pobre 57 Filipino Chief Financial Officer and Chief
Information Officer
Manuel Z. Gonzalez 48 Filipino Corporate Secretary and Compliance
Officer
Johnip Cua 57 Filipino Independent Director
Fernan Lukban 53 Filipino Independent Director
Gregory Banzon 49 Filipino Vice President – General Manager(Canned and Processed Fish, Tuna
Division)
Edwin Africa 43 Filipino Vice President – General Manager
(Dairy and Mixes)
Rex Agarrado 57 Filipino Vice President – General Manager
(Canned Meat)
Teddy Kho 50 Filipino Vice President – General Manager
(Tuna Export)
Ronald Agoncillo 37 Filipino Vice President – Head of Sales, Trade
Marketing and Demand Planning
Cezar Cruz, Jr. 58 Filipino Vice President – General Manager
(Canned and Processed Fish, SardinesDivision)
Emerson Villarante 48 Filipino Vice President – Human Resources
and Corporate Affairs
Ricardo S. Po, Sr., Chairman Emeritus of the Company, is the founder and chairman of
CCC. A self-made entrepreneur, he started his professional career as a journalist, then moved
on to advertising where he started and managed Cathprom Advertising Co., and later became
a stock broker. He founded the Century Group in 1978 when he started CCC and grew it to
become of one of the largest canned food companies in the Philippines. Mr. Po, Sr. was
awarded Masters in Business Administration by the University of Santo Tomas in 2006.

7/21/2019 PreliminaryProspectus - Century
http://slidepdf.com/reader/full/preliminaryprospectus-century 194/648
Ricardo Gabriel T. Po, Jr. was elected Vice Chairman of the Company on October 28,
2013. He served as the Executive Vice President and Chief Operating Officer of CCC from
1990-2006 and became the Vice Chairman of its board of directors in 2006 and continues to
hold that position. He graduated magna cum laude from Boston University with a Bachelor of
Science degree in Business Management in 1990. He also took the Executive Program(Owner-President Management Program) at Harvard Business School in 2000. He is also a
Member of the Board of Directors and serves on the Executive Committee of Arthaland
Corporation, a property developer listed on the PSE as well as the Vice Chairman of IP E-
Game Ventures, Inc, a consumer, new media, and gaming company.
Christopher T. Po was elected Chairman, President, and Chief Executive Officer the
Company on October 28, 2013. He concurrently serves as Chairman and Chief Executive
Officer of CCC. Prior to joining CCC, he was Managing Director for Guggenheim Partners, a
US financial services firm, where he was in charge of the firm's Hong Kong office.
Previously, he was a Management Consultant at McKinsey and Company working with
companies in the Asian region. He also worked as the Head of Corporate Planning for JG
Summit Holdings, a Philippine-based conglomerate with interests in food, real estate,telecom, airlines, and retail. He graduated summa cum laude from Wharton School and
College of Engineering of the University of Pennsylvania with dual degrees in Economics
(finance concentration) and applied science (systems engineering) in 1991. He holds a
Masters degree in Business Administration from the Harvard University Graduate School of
Business Administration. Mr. Christopher Po is a member of the Board of Arthaland
Corporation and Isla Gas and is a member of the Board of Trustees of WWF-Philippines and
is the President of the CPG-RSPo Foundation.
Teodoro T. Po was elected Vice Chairman, Executive Vice President, and Chief Operating
Officer of the Company on October 28, 2013. He is also a Member of the Board of Directors
of CCC. Since 1990, Mr. Teodoro Po has held various positions in CCC. He became theChief Operating Officer in 2006 and continues to hold that position. He graduated summa
cum laude from Boston University with a Bachelor of Science degree in Manufacturing
Engineering in 1990. He also completed the Executive Education Program (Owner/ President
Management Program) at Harvard Business School.
Leonardo Arthur T. Po was elected as the Treasurer of the Company on October 28, 2013.
He also serves as Executive Director of CCC and the General Manager for its Emerging
Business Units. He is also an Independent Director of IPVG Corp. Mr. Leonardo Po
graduated magna cum laude from Boston University with a degree in Business
Administration in 2001 and has since acquired an extensive business experience in the
marketing and operations of quick-serve restaurants, food service and fast moving consumer
goods.
Oscar A. Pobre was elected as Chief Financial Officer of the Company on October 28, 2013.
He is also the Company‘s Chief Information Officer. He also serves as Vice President for
Finance and Chief Financial Officer of CCC and has held this position since August 2000. He
first joined CCC as Director for Finance and Controllership Group in August 1994. Prior to
CCC, Mr. Pobre had 17 years of experience in finance, starting as Assistant Analyst with the
Manila Electric Company. He progressed with his career to be Division Chief for Subsidiary
Operations Comptrollership Group for Human Settlements Development Corporation,
Finance Manager for Commander Drug Corporation, Budget & Cost Department Manager for
Dole Philippines, Inc., Corporate Planning Manager for RFM Corporation, and Corporate
Controller for Cosmos Bottling Corporation. Mr. Pobre graduated from the Ateneo de ManilaUniversity with a Bachelor of Science degree in Business Management and holds a Master in
Business Management degree from the Asian Institute of Management.

7/21/2019 PreliminaryProspectus - Century
http://slidepdf.com/reader/full/preliminaryprospectus-century 195/648
Manuel Z. Gonzalez is the Corporate Secretary and Compliance Officer of the Company. He
is also a Senior Partner in the Martinez Vergara Gonzalez & Serrano Law Office since 2006
up to the present. Atty. Gonzalez was formerly a partner with the Picazo Buyco Tan Fider &
Santos Law Office until 2006. Atty. Gonzalez has been involved in corporate practice and has
extensive experience in securities, banking and finance law. Atty. Gonzalez serves as Directorand Corporate Secretary to many corporations including to companies in the Century Pacific
Group since 1995, Nomura Securities Philippines since 2006 and ADP Philippines, Inc. since
2010. Atty. Gonzalez graduated cum laude with a Bachelor of Arts degree in Political Science
and Economics from New York University and he has also received a Bachelor of Laws from
the University of the Philippines, College of Law.
Johnip Cua is an Independent Director of the Company and has extensive experience in the
consumer goods and marketing industries. Mr. Cua served as the President and General
Manager of Procter & Gamble Philippines from 1995-2006. Prior to that, Mr. Cua held a
number of positions at Procter & Gamble, including Manager of Product Development and
Project Supply at Procter & Gamble Taiwan and Category Manager of Procter & Gamble
Philippines. Mr. Cua currently serves as Chairman and President of Taibrews Corporation andas a member of the boards of directors of various corporations, including BDO Private Bank,
MacroAsia Corporation and STI Education Systems Holdings, Inc., among others. Mr. Cua
has received a number of awards, including Agora Awards‘ Outstanding Achievement in
Marketing Management (1998) and Procter & Gamble Global Marketing Organization‘s
Passionate Leadership Award (2006). Mr. Cua holds a Bachelor of Science degree in
Chemical Engineering from the University of the Philippines.
Fernan Lukban is an Independent Director of the Company. He is a well-recognized
consultant in family business, strategy, entrepreneurship and governance. Mr. Lukban holds
undergraduate degrees in Engineering (Mechanical and Industrial from De La Salle
University, Manila) and graduate degrees in Economics (MSc in Industrial Economics fromthe Center for Research & Communication, now University of Asia & the Pacific) and in
business (MBA from IESE, Barcelona, Spain). He spent much of his early professional years
in academia, helping establish the University of Asia & the Pacific where he currently
participates as a consultant, mentor and guest lecturer. He is a founding fellow of the Institute
of Corporate Directors, an International Fellow of the Australian Institute of Company
Directors and an Independent Director of Pancake House, Inc. and Arthaland Corporation
Gregory Banzon was appointed as the Vice President – General Manager (Canned andProcessed Fish, Tuna Division) of the Company on October 28, 2013. He served three yearsas the General Manager and Business Unit Head at the Century Group. Prior to the CenturyGroup, Mr. Banzon had 22 years of experience in various general management, marketing
and sales roles including Vice President – Marketing of Johnson & Johnson ASEAN, CountryGeneral Manager of Johnson & Johnson Indonesia, and General Manager at RFM. Mr.Banzon graduated from De La Salle University with a Bachelors degree in Commerce(Marketing).
Edwin Raymond Africa recently joined the Company on April 1, 2014 as Vice President – General Manager (Dairy and Mixes). Prior to joining the Company, Mr. Africa had 23 yearsof experience in various marketing, advertising and brand management roles at Pepsico – Malaysia/Singapore from 2006-2012, Pepsico Asia Pacific from 2004 to 2005, Proctor &Gamble Asia from 1998 to 2001, Proctor & Gamble Taiwan from 1996 to 1998 and Proctor &Gamble Philippines from 1991 to 1996. Mr. Africa graduated from Ateneo de ManilaUniversity in 1991 with a degree in Bachelor of Science in Management Engineering.

7/21/2019 PreliminaryProspectus - Century
http://slidepdf.com/reader/full/preliminaryprospectus-century 196/648
Rex Agarrado was appointed as Vice President – General Manager (Canned Meat) of theCompany on October 28, 2013. He joined the Century Group in 1998 and served seven yearsas General Manager of PMCI. Prior to the Century Group, Mr. Agarrado had 18 years ofexperience in various technical and manufacturing roles at San Miguel, RFM, Quaker andCalifornia Manufacturing Corporation. He also serves as Director of the PhilippineAssociation of Meat Processors, Inc., for which he was previously President. Mr. Agarradograduated from the University of Philippines Los Baños with a Bachelor of Science in FoodTechnology and he completed the Management Development Program from the AsianInstitute of Management.
Teddy Kho was appointed as Vice President – General Manager (Tuna Export) of the
Company on October 28, 2013. He served three years as Business Unit Head of GTC. Prior to
GTC, Mr. Kho had 21 years of experience in various management, operations and technical
roles including President and General Manager of San Miguel Foods Vietnam and Plant
Manager of San Miguel Hoecheong. Mr. Kho graduated from Adamson University with a
Bachelor of Science in Chemical Engineering and completed the Management Development
Program from the Asian Institute of Management.
Ronald Agoncillo was appointed as Vice President – Head of Sales, Trade Marketing and
Demand Planning of the Company on October 28, 2013. He joined the Century Group in
2008 and served four years as Head of Sales Division. Prior to the Century Group, he had
eight years of experience in sales management roles at National Sales and Cadbury. He also
has experience in various customer development roles at Unilever Indonesia and Philippines
and engineering and logistics roles at 3M, Shell and San Miguel. Mr. Agoncillo graduated
from De La Salle University with a Bachelor of Science in Industrial Management
Engineering.
Cezar Cruz, Jr. was appointed as Vice President – General Manager (Canned and Processed
Fish, Sardines Division) of the Company on October 28, 2013. He joined the Century Groupin 2006 and served 3 years as Business Unit Head – Sardines Business. Prior to the Century
Group, he had 29 years of experience in various technical, operations and business
development roles at San Miguel and RFM. He currently serves as the President of the
Sardine Association of the Philippines. Mr. Cruz Jr. graduated from the University of the
Philippines with a Bachelor of Science in Electrical Engineering.
Emerson Villarante was appointed as Vice President – Human Resources and Corporate of
Affairs of the Company on October 28, 2013. He served seven years as Head of Human
Resources and Organizational Development at the Century Group. Prior to the Century
Group, he held various roles in human resources management including Vice President of
Human Resources for Bechtel and Alan. Mr. Villarante graduated from the University ofSanto Tomas with a Bachelor of Arts in Behavioral Science and holds a Masters in
Management from the Asian Institute of Management.
INVOLVEMENT IN CERTAIN LEGAL PROCEEDINGS OF DIRECTORS AND
EXECUTIVE OFFICERS
To the best of the Company‘s knowledge and belief and after due inquiry, none of the
Company‘s directors, nominees for election as director, or executive officer have in the five-
year period prior to the date of this Prospectus: (1) had any petition filed by or against any
business of which such person was a general partner or executive officer either at the time of
the bankruptcy or within a two-year period of that time; (2) have been convicted by final
judgment in a criminal proceeding, domestic or foreign, or have been subjected to a pending judicial proceeding of a criminal nature, domestic or foreign, excluding traffic violations and

7/21/2019 PreliminaryProspectus - Century
http://slidepdf.com/reader/full/preliminaryprospectus-century 197/648
other minor offenses; (3) have been the subject of any order, judgment, or decree, not
subsequently reversed, suspended or vacated, of any court of competent jurisdiction, domestic
or foreign, permanently or temporarily enjoining, barring, suspending or otherwise limiting
their involvement in any type of business, securities, commodities or banking activities; or (4)
have been found by a domestic or foreign court of competent jurisdiction (in a civil action),the SEC or comparable foreign body, or a domestic or foreign exchange or other organized
trading market or self-regulatory organization, to have violated a securities or commodities
law or regulation, such judgment having not been reversed, suspended, or vacated.
CORPORATE GOVERNANCE
The Board approved the Company‘s Corporate Governance Manual (the ―Manual‖) during
the meeting of the Board of Directors on November 25, 2013. The Manual assists the
Company in monitoring and assessing its level of compliance with leading practices on good
corporate governance as specified in pertinent SEC circulars. Aside from establishing
specialized committees to aid in complying with the principles of good corporate governance,
the Manual also outlines specific investor‘s rights and protections and enumerates particularduties expected from the Board members, officers and employees. It also features a disclosure
system which highlights adherence to the principles of transparency, accountability and
fairness. A compliance officer is tasked with the formulation of specific measures to
determine the level of compliance with the Manual by the Board members, officers and
employees. There has been no deviation from the Manual‘s standards as of the date of this
Prospectus.
COMMITTEES OF THE BOARD
The Board created and appointed Board members to each of the committees set forth below.
Each member of the respective committees named below holds office as of the date of this
Prospectus and will serve until his successor is elected and qualified.
Audit Committee
The Company‘s Audit Committee is responsible for assisting its Board in its fiduciary
responsibilities by providing an independent and objective assurance to its management and
shareholders of the continuous improvement of its risk management systems, business
operations and the proper safeguarding and use of its resources and assets. The Audit
Committee provides a general evaluation of and assistance in the overall improvement of its
risk management, control and governance processes. The Audit Committee must comprise at
least three members of the Board, who shall preferably have accounting and finance
backgrounds, at least one of whom shall be an independent director and another with auditexperience. The Audit Committee chairman shall be an independent director.
The Audit Committee has the following functions:
(A) provide oversight of management‘s activities in managing credit, market, liquidity,
operational, legal and other risks of the Company. This function shall include regular
receipt from management of information on risk exposures and risk management
activities;
(B) perform oversight functions over the Company‘s internal and external auditors. It
should ensure that the internal and external auditors act independent from each other
and that both auditors are given unrestricted access to all records, properties and personnel to enable them to perform their respective audit functions;

7/21/2019 PreliminaryProspectus - Century
http://slidepdf.com/reader/full/preliminaryprospectus-century 198/648
(C) review the annual internal audit plan to ensure its conformity with the objectives of
the Company. The plan shall include the audit scope, resources and budget necessary
to implement it;
(D) prior to the commencement of an audit, discuss with the external auditor the nature,
scope and expenses of the audit, and ensure proper coordination if more than one
audit firm is involved in the activity to secure proper coverage and minimize
duplication of efforts;
(E) organize an internal audit department, and consider, when necessary and desirable,
the appointment of an independent internal auditor and the terms and conditions of its
engagement and removal;
(F)
monitor and evaluate the adequacy and effectiveness of the Company‘s internal
control system including financial reporting control and information technology
security;
(G) review the reports submitted by the internal and external auditors;
(H) review the quarterly, half-year and annual financial statements before their
submission to the Board, with particular focus on the following matters: any
change(s) in accounting policies and practices; major judgment areas; significant
adjustments resulting from the audit; going concern assumptions; compliance with
accounting standards; and compliance with tax, legal and regulatory requirements;
(I)
coordinate, monitor and facilitate compliance with laws, rules and regulations;
(J) evaluate and determine the non-audit work, if any, of the external auditor, and review
periodically the non-audit fee paid to the external auditor in relation to its significanceto the total annual income of the external auditor and to the Company‘s overall
consultancy expenses. The Audit Committee shall disallow any non-audit work that
will conflict with its duties as an external auditor or may pose a threat to its
independence. The non-audit work, if allowed, should be disclosed in the Company‘s
annual report; and
(K)
establish and identify the reporting line of the Company‘s internal auditor to enable
him to properly fulfill his duties and responsibilities. He shall functionally report
directly to the Audit Committee.
The Audit Committee shall ensure that the Company‘s internal auditor in the performance ofits work shall be free from interference by outside parties.
In addition, the Audit Committee shall be tasked to prepare the Audit Committee Charter (the
―Charter‖) which shall contain, among others, its purpose, membership, structure, operations,
reporting process, resources and other relevant information. The Charter shall specify how the
Audit Committee shall perform its oversight functions as prescribed by the Revised Code of
Corporate Governance (the ―Code‖).
In the preparation of the Charter, the Audit Committee shall strictly observe the requirements
of the Code and other applicable laws and regulations in the Philippines, and shall align the
Charter with the best practices and standards as provided for in any or combination of the
reference guides indicated in SEC Memorandum Circular No. 4, Series of 2012.

7/21/2019 PreliminaryProspectus - Century
http://slidepdf.com/reader/full/preliminaryprospectus-century 199/648
Upon approval by the Audit Committee of the Audit Committee Charter, the same shall be
submitted for the approval of the Board.
Within one year from listing date, the Audit Committee shall assess its performance, as
prescribed by and pursuant to SEC Memorandum Circular No. 4, Series of 2012.
Remuneration and Compensation Committee
The Remuneration and Compensation Committee comprises at least three members, one of
whom shall be an independent director. It ensures that the compensation policies and
practices are consistent with the corporate culture, strategy and business environment under
which the Company operates. It is responsible for objectively recommending a formal and
transparent framework of remuneration and evaluation for the members of the Board and the
Company‘s key executives to enable the directors and officers to run the Company
successfully. It evaluates and recommends to the Board incentives and other equity-based
plans designed to attract and retain qualified and competent individuals.
Nomination Committee
The Company‘s Nomination Committee is responsible for providing its shareholders with an
independent and objective evaluation and assurance that the membership of the Board is
competent and will foster the Company‘s long-term success and secure its competitiveness.
The Nomination Committee must comprise at least three members, one of whom should be an
independent director. The Nomination Committee reports directly to the Board and is required
to meet at least two times a year.
Executive Committee
The Corporate Governance Manual provides for the creation of an executive committee to becomposed of five members appointed by the Board from time to time. Under the Manual, the
Chairman of the Board shall act as ex-officio Chairman of the Executive Committee, the
President as Vice-Chairman, and three other members shall sit as members of the committee.
The Executive Committee shall have the following powers and functions: (i) to advise and
assist the officers of the Company in all matters concerning its interest and the management
of its business, and (ii) whenever the Board is not in session, to exercise all the powers of the
Board which may be delegated to it by the Board.
EVALUATION SYSTEM AND COMPLIANCE
As part of its system for monitoring and assessing compliance with the Manual and the SECCode of Corporate Governance, each committee is required to report regularly to the Board of
Directors and the Manual is subject to quarterly review. The Compliance Officer is
responsible for determining and measuring compliance with the Manual and the SEC Code of
Corporate Governance. Any violation of the Company‘s Corporate Governance Manual shall
subject the responsible officer or employee to the following penalties:
For a first violation, the offender shall be reprimanded.
For a second violation, suspension from office shall be imposed on the offender. The
duration of suspension shall depend on the gravity of the violation. This penalty shall
not apply to the members of the Board of Directors.

7/21/2019 PreliminaryProspectus - Century
http://slidepdf.com/reader/full/preliminaryprospectus-century 200/648
For a third violation, the maximum penalty of removal from office shall be imposed
on the offender. In case the offender is a member of the Board of Directors, the
provisions of Section 28 of the Philippine Corporation Code shall be observed.
EXECUTIVE COMPENSATION SUMMARY
Compensation
As a newly incorporated company, CNPF has not yet paid or accrued compensation during
the last two calendar years. For this calendar year, CNPF estimates that the total
compensation to be paid to its top five highly compensated executive officers and to its
officers and directors as a group unnamed will be as follows:
Name & Position Year
Estimated
Salary Estimated Bonus
₱ millions
Christopher T. Po (President & CEO) 2014 31.8 5.6
Teodoro T. Po (EVP & COO)
Oscar A. Pobre (CFO & CIO)
Rex E. Agarrado (VP & GM)
Gregory H. Banzon (VP & GM)
Aggregate compensation paid to all officers
and directors as a group unnamed 2014 41.8 7.4
Standard Arrangements
Other than payment of reasonable per diem as may be determined by the Board for every
meeting, there are no standard arrangements pursuant to which directors of the Company are
compensated, or were compensated, directly or indirectly, for any services provided as a
director and for their committee participation or special assignments for 2011 up to the
present.
Other Arrangements
There are no other arrangements pursuant to which any director of the Company was
compensated, or to be compensated, directly or indirectly, during 2013 for any service
provided as a director.
FAMILY RELATIONSHIPS
Mr. Ricardo S. Po, Sr., Chairman Emeritus, is the father of Ricardo T. Po, Jr., Vice Chairman;
Christopher T. Po, Chairman, President and Chief Executive Officer; Teodoro T. Po, Vice
Chairman, Executive Vice President, and Chief Operating Officer; and Leonardo T. Po,
Treasurer.
Teodoro T. Po, Vice Chairman, Executive Vice President, and Chief Operating Officer, is the
brother-in-law of Manuel Z. Gonzalez, Corporate Secretary.
Aside from the foregoing, there are no family relationships between any Directors and any
members of the Company‘s senior management as of the date of this Prospectus.

7/21/2019 PreliminaryProspectus - Century
http://slidepdf.com/reader/full/preliminaryprospectus-century 201/648
EMPLOYMENT CONTRACTS
As of the date of this Prospectus, the Company has no special employment contracts with the
named executive officers.
WARRANTS AND OPTIONS OUTSTANDING
As of the date of this Prospectus, there are no outstanding warrants or options held by the
President, the CEO, the named executive officers, and all officers and directors as a group.
SIGNIFICANT EMPLOYEES
There is no one particular employee, not an executive officer, who is expected to make asignificant contribution to the business of the Company on his own.

7/21/2019 PreliminaryProspectus - Century
http://slidepdf.com/reader/full/preliminaryprospectus-century 202/648
PRINCIPAL SHAREHOLDERS
SHAREHOLDERS
The following table sets forth the largest shareholders of the Company as of the date of this
Prospectus.
Name of Shareholder
Number of
Common Shares
held prior to the
Offer
% of total
outstanding
Common Shares
prior to the offer
Century Canning Corporation 1,999,999,993 100%
Ricardo S. Po, Sr. 1 nil
Ricardo T. Po, Jr. 1 nil
Christopher T. Po 1 nil
Teodoro T. Po 1 nil
Leonardo T. Po 1 nilJohnip Cua 1 nil
Fernan Lukban 1 nil
Century Canning Corporation is the Company‘s largest shareholder and, as of the date of this
Prospectus, directly owns 1,999,999,993 Common Shares, or approximately 100% of the
Company‘s issued and outstanding share capital. As of the date of this Prospectus, the
Company has a total of eight shareholders, with the Po family beneficially owning
approximately 100% of the issued common share capital of the Company.
The PSE rules require an applicant company to cause its existing shareholders owning at least
10% of the outstanding shares of the Company not to sell, assign or in any manner dispose of
their shares for a period of 365 days after the listing of the shares on the PSE. In addition, if
there is any issuance of shares or securities (i.e., private placements, asset for shares swap or a
similar transaction) or instruments which lead to issuance of shares or securities (i.e.,
convertible bonds, warrants or a similar instrument) done and fully paid for within 180 days
prior to the start of the offer period, and the transaction price is lower than that of the offer
price in the initial public offering, all shares or securities availed of shall be subject to a lock-
up period of at least 365 days from full payment of the aforesaid shares or securities. To
implement this lock-up requirement, the PSE requires the applicant company to lodge the
shares with the PDTC through a PCD participant for the electronic lock-up of the shares or to
enter into an escrow agreement with the trust department or custodian unit of an independent
and reputable financial institution.
The following shareholder is covered by the 365-day lock-up requirement, from listing of the
Offer Shares:
Name of Shareholder Number of Common Shares held
% of total outstanding Common
Shares prior to the offer
Century Canning Corporation 1,999,999,993 100%
The following shareholders are covered by the 365-day lock-up requirement, from full
payment of their shares:
Name of Shareholder Number of Common Shares held
% of total outstanding Common
Shares prior to the offer Johnip Cua 1 nil

7/21/2019 PreliminaryProspectus - Century
http://slidepdf.com/reader/full/preliminaryprospectus-century 203/648
Fernan Lukban 1 nil
SECURITY OWNERSHIP OF CERTAIN RECORD AND BENEFICIAL OWNERS
The table below sets forth the security ownership of certain record and beneficial owners of
more than 5% of the Company‘s voting securities as of the date of this Prospectus
Name and Address
of Record Owners
Name of Beneficial
Owner and
Relationship with
Record Owner Citizenship
No. of Common
Shares Held
% of Total
Outstanding
Shares
Century Canning
Corporation
Century Canning
Corporation
Filipino 1,999,999,993 100%
As of the date of this Prospectus, the Company does not have any foreign
shareholders.SECURITY OWNERSHIP OF DIRECTORS AND MANAGEMENT
The following table sets forth the ownership of directors and management of the Company‘s
Common Shares as of the date of this Prospectus.
Title of Class
Name of Beneficial
Owner
Amount and Nature of
Beneficial Ownership Citizenship
% of Total
Outstanding
Shares
Common Ricardo S. Po, Sr. 1 qualifying share Filipino Nil
Common Ricardo T. Po, Jr. 1 qualifying share Filipino Nil
Common Christopher T. Po 1 qualifying share Filipino Nil
Common Teodoro T. Po 1 qualifying share Filipino NilCommon Leonardo T. Po 1 qualifying share Filipino Nil
Common Johnip Cua 1 qualifying share Filipino Nil
Common Fernan Lukban 1 qualifying share Filipino Nil
Total: 7 shares
The chart below shows the dilution of the Company‘s principal shareholders as a result of the
Offer.
Name of Shareholder
Number of subscribed
Common Shares
% of total
shareholding before
the Offer
% of total
shareholding after
the Offer
Century Canning Corporation 1,999,999,993 100% 89.7%
Total .......................................................... 1,999,999,993 100% 89.7%
Voting Trust Holders of 5% or more
There were no persons holding more than 5% of a class of shares of the Company under a
voting trust or similar agreement as of the date of this Prospectus.

7/21/2019 PreliminaryProspectus - Century
http://slidepdf.com/reader/full/preliminaryprospectus-century 204/648
CHANGE IN CONTROL
As of the date of this Prospectus, there are no arrangements which may result in a change in
control of the Company.

7/21/2019 PreliminaryProspectus - Century
http://slidepdf.com/reader/full/preliminaryprospectus-century 205/648
MATERIAL CONTRACTS
Trademark Licensing Agreement
The Company licenses the trademarks being used in its business from related parties such asThe Pacific Meat Company, Inc., Centennial Global and Mr. Ricardo S. Po, Sr. TheseTrademark Licensing Agreements are valid for an initial period of 10 years effective fromJanuary 1, 2014, with the terms and conditions being re-negotiable after the fifth year. Underthe agreements, CNPF pays the licensor a nominal fee of US$100 as a licensing fee and anannual minimum royalty fee of US$100 per product sold under the brand.
Distribution Agreements
The Company appoints exclusive distributors to sell its products in designated regionsthroughout the Philippines. Distributorship agreements are entered into with third partydistributors generally for an initial term of one year, which is automatically renewed on a
yearly basis, unless terminated in accordance with the relevant agreement. The distributorsare paid distribution fees in an amount equivalent to 6% to 8% of the list price of the goodssold, depending on the type of products and the distributor involved.
Lease Agreements
The Company leases its 1,610 sq. m. head office in the Centerpoint Building, Ortigas Center,Pasig City from Century Canning Corporation. The lease is for a term of 10 years effectivefrom January 1, 2014, with the Company paying a monthly rental of ₱402,500, subject toescalation at the rate of 5% every two years. An additional 340 sq. m. office space in the same
building is also leased from Rian Realty Corporation with a monthly rental of ₱170,000,subject to escalation at the rate of 5% every two years.
In addition, the Company also leases the following properties for its production facilities:
a 30,644 sq. m. property in Bagumbayan, Taguig City from Century CanningCorporation for its milk processing plant, warehouse and research & development.Monthly rental is ₱1,021,500, subject to a 5% escalation every two years; and
a 30,078 sq. m. property in Talisayan, Zamboanga from Rian Realty for the sardines production. Monthly rental is ₱96,000 with a 5% escalation every two years.
Endorsement and Advertising Contracts
In the course of creating brand awareness for its products, the Company has over the yearsentered into contracts with several talents, including local celebrities, to endorse its products.These contracts have varied terms and different considerations depending on the scope ofwork needed.
Short-term Loans
In the course of conducting its business, the Company has, and will continue, to incur short-term 60-90 days revolving credit lines from several banking institutions at an average interestrate of 2.5% to 3.5% per annum. Proceeds of these loans are used for working capital
purposes.

7/21/2019 PreliminaryProspectus - Century
http://slidepdf.com/reader/full/preliminaryprospectus-century 206/648
RELATED PARTY TRANSACTIONS
The Company and its subsidiaries, in their ordinary course of business, engage in transactions
with affiliates. The Company‘s policy with respect to related party transactions is to ensure
that these transactions are entered into on terms comparable to those available from unrelated
third parties.
The Company has the following major transactions with related parties.
The Company is the licensee of various brand names used in its business and
operations. The licensor are several related companies beneficially owned and
controlled by the Po family.
The Company leases office spaces (the fifth, seventh, eighth and nineteenth floors of
the Centerpoint Building in Pasig City, Metro Manila) from CCC. The Company also
leases a 30,078 sq. m. property in Zamboanga from Rian Realty, a 52,628 sq. m.
property in General Santos City from CCC, and a 30,644 sq. m. property in Taguigfrom CCC. The Company subleases 10,000 sq. m. of this property in Taguig for its
dairy operations.
In the normal course of business, the Company transacts with companies that are consideredrelated parties. A summary of the Company‘s transactions and outstanding balances withrelated parties as at and for the period ended December 31, 2013 is set out below.
Category Notes Amounts
Outstanding
Receivable /
(Payable) Terms Condition
in ₱
Parent
CCC
Acquisition of
assets a 80,521,529 -
Payable on
demand;
Settled in cash
Non-interest
bearing No
impairment
Acquisition of
GTC and
SMDC
Payable on
demand; Non-interest
bearing
b 1,194,615,640 -
Settled in cash No
impairment
Rental income c 5,551,151 6,217,289
Payable ondemand;
Settled in cash
Non-interest bearing
Unsecured
Fellow Subsidiary
CSC
Acquisition of
assets a 73,894,637 -
Payable on
demand;
Settled in cash
Non-interest
bearing No
impairment
Rental income c 4,443,787 3,491,483
Payable on
demand;
Settled in cash
Non-interest
bearing
Unsecured
PMCIAcquisition of a 75,644,296 - Payable on Non-interest

7/21/2019 PreliminaryProspectus - Century
http://slidepdf.com/reader/full/preliminaryprospectus-century 207/648
assets demand;
Settled in cash
bearing No
impairment
Rental income c 2,117,395 4,977,042
Payable on
demand;
Settled in cash
Non-interest
bearing
Unsecured
a. As disclosed in Notes 1 and 9, the Company purchased all rights, title and interest in andto the assets used in the ordinary course of business of CCC, PMCI and CSC such asoffice, furniture, machinery, equipment and software, transportation and deliveryequipment.
b. As disclosed in Notes 1 and 8, the Company acquired from CCC, any and all rights, titleand interest of CCC in GTC and SMDC.
c. On October 31, 2013, the Company entered into a lease agreement with CCC, CSC andPMCI for the rental of the Company‘s equipment for two months from November 1, 2013
to December 31, 2013 with a total rental fee of ₱13,112,333. The Company‘s outstandingreceivables include VAT on the rental income.
The Company or its related parties have no material transaction with parties that fall outsidethe definition ―related parties‖ under SFA/IAS No. 24 that are not available for other, moreclearly independent parties on an arm‘s length basis.

7/21/2019 PreliminaryProspectus - Century
http://slidepdf.com/reader/full/preliminaryprospectus-century 208/648
DESCRIPTION OF THE SHARES
The shares to be offered shall be Common Shares of the Company.
Pursuant to its amended articles of incorporation, the Company has an authorized amount of
capital stock of ₱6,000,000,000 divided into 6,000,000,000 Common Shares with a par value
of ₱1.00 per share, of which 2,000,000,000 Common Shares are outstanding as of the date of
this Prospectus. The Offer Shares shall be Common Shares of the Company.
The Offer Shares shall be offered at a price of up to ₱14.50 per Offer Share (the ―Offer
Price‖). The determination of the Offer Price is further discussed on page 64 of this
Prospectus. A total of 2,229,654,404 Common Shares will be outstanding after the Offer. The
Offer Shares will comprise up to 10.30% of the outstanding Common Shares after the Offer.
Objects and Purposes
The Company has been organized primarily to engage in the business of manufacturing, andits articles of incorporation state that its primary purpose is to buy and sell on a wholesale
basis, process, preserve, can, pack, manufacture, produce, distribute, import and export, and
deal in all kinds of food products, such as but not limited to fish, seafood, and other marine
products, cattle, hog and other animals and animal products, fruits, vegetables and other
agricultural crops and produce of land, including by-products thereof, and for such purpose,
to acquire, construct, own, lease, charter, establish, maintain and operate canneries, factories,
plants, vessels, cold storage, refrigerators, refrigerated vehicles and vessels, warehouses, and
other machineries, equipment, apparatus and appliance as may be required in the conduct of
its business .
Under Philippine law, a corporation may invest its funds in any other corporation or business
or for any purpose other than the primary purpose for which it was organized when approved by a majority of the board of directors of such corporation and ratified by the shareholders
representing at least two-thirds of the outstanding capital shares, at a shareholders‘ meeting
duly called for the purpose. However, where the investment by the corporation is reasonably
necessary to accomplish its primary purpose, the approval of the shareholders shall not be
necessary.
Share Capital
A Philippine corporation may issue common or preferred shares, or such other classes of
shares with such rights, privileges or restrictions as may be provided for in the articles of
incorporation and by-laws of the corporation.
Under Philippine law, the shares of a corporation may either be with or without a par value.
All of the Common Shares currently issued have a par value of ₱1.00 per share. In the case of
par value shares, where a corporation issues shares at a price above par, whether for cash or
otherwise, the amount by which the subscription price exceeds the par value is credited to an
account designated as additional paid-in capital or paid-in surplus.
Subject to approval by the SEC, a corporation may increase or decrease its authorized capital
shares, provided that the change is approved by a majority of the board of directors of such
corporation and shareholders representing at least two-thirds of the issued and outstanding
capital shares of the corporation voting at a shareholders‘ meeting duly called for the purpose.
7/21/2019 PreliminaryProspectus - Century
http://slidepdf.com/reader/full/preliminaryprospectus-century 209/648
A corporation is empowered to acquire its own shares for a legitimate corporate purpose,
provided that the corporation has unrestricted retained earnings or surplus profits sufficient to
pay for the shares to be acquired. Examples of instances in which the corporation is
empowered to purchase its own shares are: when the elimination of fractional shares arising
out of share dividends is necessary or desirable, the purchase of shares of dissentingshareholders exercising their appraisal right (as discussed below) and the collection or
compromise of an indebtedness arising out of an unpaid subscription. When a corporation
repurchases its own shares, the shares become treasury shares, which may be resold at a price
fixed by the board of directors of such corporation.
Voting Rights
Under the Company‘s amended articles of incorporation, the owners or holders of Common
Shares have full voting rights. However, the Philippine Corporation Code provides that voting
rights cannot be exercised with respect to shares declared by the board of directors as
delinquent, treasury shares, or if the shareholder has elected to exercise his right of appraisal
as discussed below.
Pre-Emptive Rights
The Philippine Corporation Code confers pre-emptive rights on the existing shareholders of a
Philippine corporation which entitle such shareholders to subscribe to all issues or other
dispositions of shares of any class by the corporation in proportion to their respective
shareholdings, regardless of whether the shares proposed to be issued or otherwise disposed
of are identical to the shares held. A Philippine corporation may, however, provide for the
denial of these pre-emptive rights in its articles of incorporation. Likewise, shareholders who
are entitled to such pre-emptive rights may waive the same through a written instrument to
that effect.
The amended articles of incorporation of the Company deny the pre-emptive rights of its
shareholders to subscribe to any or all dispositions of any class of shares.
Derivative Rights
Philippine law recognizes the right of a shareholder to institute proceedings on behalf of the
corporation in a derivative action in circumstances where the corporation itself is unable or
unwilling to institute the necessary proceedings to redress wrongs committed against the
corporation or to vindicate corporate rights as, for example, where the directors of the
corporation themselves are the malefactors.
Appraisal Rights
The Philippine Corporation Code grants a shareholder a right of appraisal and demand
payment of the fair value of his shares in certain circumstances where he has dissented and
voted against a proposed corporate action, including:
an amendment of the articles of incorporation which has the effect of adversely
affecting the rights attached to his shares or of authorizing preferences in any respect
superior to those of outstanding shares of any class;
the extension of the term of corporate existence;

7/21/2019 PreliminaryProspectus - Century
http://slidepdf.com/reader/full/preliminaryprospectus-century 210/648
the sale, lease, exchange, transfer, mortgage, pledge or other disposal of all or
substantially all the assets of the corporation;
a merger or consolidation; and
investment by the corporation of funds in any other corporation or business or for any
purpose other than the primary purpose for which it was organized.
In any of these circumstances, the dissenting shareholder may require the corporation to
purchase its shares at a fair value, which, in default of agreement, is determined by three
disinterested persons, one of whom shall be named by the shareholder, one by the
corporation, and the third by the two thus chosen. Regional Trial Courts will, in the event of a
dispute, determine any question about whether a dissenting shareholder is entitled to this right
of appraisal. From the time the shareholder makes a demand for payment until the corporation
purchases such shares, all rights accruing on the shares, including voting and dividend rights,
shall be suspended, except the right of the shareholder to receive the fair value of such shares.
No payment shall be made to any dissenting shareholder unless the corporation hasunrestricted retained earnings sufficient to support the purchase of the shares of the dissenting
shareholders.
Board of Directors
Unless otherwise provided by law or in the articles of incorporation, the corporate powers of
the Company are exercised, its business is conducted, and its property is controlled by the
Board. Pursuant to its articles of incorporation, as amended, the Company shall have seven
Directors, two of whom are independent Directors within the meaning set forth in Section 38
of the SRC. The Board shall be elected during each regular meeting of shareholders, at which
shareholders representing at least a majority of the issued and outstanding capital shares of
the Company are present, either in person or by proxy.
Directors may only act collectively; individual directors have no power as such. Four
directors, which is a majority of the Directors, constitute a quorum for the transaction of
corporate business. In general, every decision of a majority of the quorum duly assembled as
a Board is valid as a corporate act.
Any vacancy created by the death, resignation or removal of a director prior to expiration of
such director‘s term shall be filled by a vote of at least a majority of the remaining members
of the Board, if still constituting a quorum, Otherwise, the vacancy must be filled by the
shareholders at a meeting duly called for the purpose. Any director elected in this manner by
the Board shall serve only for the unexpired term of the director whom such director replacesand until his successor is duly elected and qualified.
Shareholders’ Meetings
Annual or Regular Shareholders ’ Meetings
The Philippine Corporation Code requires all Philippine corporations to hold an annual
meeting of shareholders for corporate purposes including the election of directors. The by-
laws of the Company provide for annual meetings every June 30 of each year to be held at the
principal office of the Company and at such hour as specified in the notice.
7/21/2019 PreliminaryProspectus - Century
http://slidepdf.com/reader/full/preliminaryprospectus-century 211/648
Special Shareholders’ Meeting
Special meetings of shareholders, for any purpose or purposes, may at any time be called by
either the President or a majority of the Board of Directors, whenever he or they shall deem it
necessary.
Notice of Shareholders’ Meeting
Whenever shareholders are required or permitted to take any action at a meeting, a written
notice of the meeting shall be given which shall state the place, date and time of the meeting,
and the purpose or purposes for which the meeting is called. The Company by-laws provide
that notices of the time and place of the annual and special meetings of the shareholders shall
be given either by mailing the same enclosed in a postage-prepaid envelope, addressed to
each shareholder of record at the address left by such shareholder with the Secretary of the
Corporation, or at his last known post-office address, or by delivering the same to him in
person, at least one week before the date set for such meeting. Notice to any special meeting
must state, among others, the matters to be taken up in the said meeting, and no other businessshall be transacted at such meeting except by consent of all the shareholders present, entitled
to vote. No notice of meeting need be published in any newspaper, except when necessary to
comply with the special requirements of the Philippine Corporation Code. Shareholders
entitled to vote may, by written consent, waive notice of the time, place and purpose of any
meeting of shareholders and any action taken at such meeting pursuant to such waiver shall be
valid and binding. When the meeting of the shareholders is adjourned to another time or
place, notice of the adjourned meeting need not be provided so long as the time and place to
which the meeting is adjourned are announced at the meeting at which the adjournment is
taken. At the reconvened meeting, any business may be transacted that might have been
transacted on the original date of the meeting.
Quorum
Unless otherwise provided by an existing shareholders‘ agreement or by law, in all regular or
special meeting of shareholders, a majority of the outstanding capital shares must be present
or represented in order to constitute a quorum, except in those cases where the Philippine
Corporation Code provides a greater percentage vis-à-vis the total outstanding capital shares.
If no quorum is constituted, the meeting shall be adjourned until the requisite amount of
shares shall be presented.
Meetings of the shareholders shall be presided over by the Chairman of the Board, or, in his
absence, by absence chairman to be chosen by the Board of Directors. The Corporate
Secretary, or, in his absence, any person appointed by the chairman of the meeting, shall actas secretary of such meeting.
Voting
At all meetings of shareholders, a holder of Common Shares may vote in person or by proxy,
for each share held by such shareholder. Each Common Share is equal in all respects to every
other Common Share. All the Common Shares have full voting and dividend rights.
F ix ing Record Dates
Under existing SEC rules, cash dividends declared by corporations whose shares are listed on
the PSE shall have a record date which shall not be less than 10 or more than 30 days fromthe date of declaration. With respect to share dividends, the record date shall not be less than

7/21/2019 PreliminaryProspectus - Century
http://slidepdf.com/reader/full/preliminaryprospectus-century 212/648
10 or more than 30 days from the date of shareholder approval; provided, however, that the
record date set shall not be less than 10 trading days from receipt by the PSE of the notice of
declaration of share dividends. In the event that share dividends are declared in connection
with an increase in the authorized capital shares, the corresponding record date shall be fixed
by the SEC.
Matters Per tain ing to Prox ies
Shareholders may vote at all meetings the number of shares registered in their respective
names, either in person or by proxy duly given in writing and duly presented to the Corporate
Secretary at least 10 days before the meeting. Unless otherwise provided in the proxy, it shall
be valid only for the meeting at which it has been presented to the Corporate Secretary.
Proxies should comply with the relevant provisions of the Philippine Corporation Code, the
SRC, the Implementing Rules and Regulations of the SRC (as amended), and regulations
issued by the SEC.
Dividends
The Common Shares have full dividend rights. Dividends on the Company‘s Common
Shares, if any, are paid in accordance with Philippine law. Dividends are payable to all
shareholders on the basis of outstanding Common Shares held by them, each Common Share
being entitled to the same unit of dividend as any other Common Share. Dividends are
payable to shareholders whose names are recorded in the stock and transfer book as of the
record date fixed by the Company‘s Board of Directors. The PSE has an established
mechanism for distribution of dividends to beneficial owners of Common Shares which are
traded through the PSE which are lodged with the PCD Nominee as required for scripless
trading.
Under Philippine law, a corporation can only declare dividends to the extent that it has
unrestricted retained earnings that represent the undistributed earnings of the corporation
which have not been allocated for any managerial, contractual or legal purposes and which
are free for distribution to the shareholders as dividends. A corporation may pay dividends in
cash, by the distribution of property or by the issuance of shares. Dividends may be declared
by the board of directors except for share dividends which may only be declared and paid
with the approval of shareholders representing at least two-thirds of the issued and
outstanding capital shares of the corporation voting at a shareholders‘ meeting duly called for
the purpose.
The Philippine Corporation Code generally requires a Philippine corporation with retainedearnings in excess of 100% of its paid-in capital to declare and distribute as dividends the
amount of such surplus. However, a Philippine corporation may retain all or any portion of
such surplus in the following cases: (1) when justified by definite expansion plans approved
by the board of directors of the corporation; (2) when the required consent of any financing
institution or creditor to such distribution has not been secured; (3) when retention is
necessary under special circumstances, such as when there is a need for special reserves for
probable contingencies; or (4) when the non-distribution of dividends is consistent with the
policy or requirement of a Government office. Philippine corporations whose securities are
listed on any shares exchange are required to maintain and distribute an equitable balance of
cash and share dividends, consistent with the needs of shareholders and the demands for
growth or expansion of the business.

7/21/2019 PreliminaryProspectus - Century
http://slidepdf.com/reader/full/preliminaryprospectus-century 213/648
The Company has approved a dividend policy of maintaining an annual cash and/or share
dividend pay-out of up to 30% of its net profit from the preceding year, subject to the
requirements of applicable laws and regulations, the terms and conditions of its outstanding
bonds and loan facilities, and the absence of circumstances that may restrict the payment of
such dividends, such as where the Company undertakes major projects and developments.Dividends must be approved by the Board and may be declared only from the unrestricted
retained earnings of the Company. The Company‘s Board of Directors may, at any time,
modify the Company‘s dividend policy, depending upon the Company‘s capital expenditure
plans and/or any terms of financing facilities entered into to fund its current and future
operations and projects. The Company can give no assurance that it will pay any dividends in
the future.
Preferred shares may be issued from time to time in one or more series as the Board of
Directors, through a resolution, may determine, and authority has been expressly granted to
the Board of Directors to establish and designate each particular series of preferred shares, to
fix the number of shares to be included in each of such series, and to determine the dividend
rate, price, amount of participation, and other terms and conditions of each such shares, whichresolution(s) shall thereupon be deemed a part of these articles of incorporation.
Transfer of Shares and Share Register
All transfers of shares on the PSE shall be effected by means of a book-entry system. Under
the book-entry system of trading and settlement, a registered shareholder shall transfer legal
title over the shares to a nominee, but retains beneficial ownership over the shares. The
transfer of legal title is done by surrendering the stock certificate representing the shares to
participants of the PDTC System (i.e., brokers and custodian banks) that, in turn, lodge the
same with the PCD Nominee Corporation, a corporation wholly-owned by the PDTC (the
―PCD Nominee‖). A shareholder may request upliftment of the shares from the PDTC, in
which case a stock certificate will be issued to the shareholder and the shares registered in the
shareholder‘s name in the books of the Company. See ―The Philippine Stock Market ‖.
Philippine law does not require transfers of the Common Shares to be effected on the PSE,
but any off-exchange transfers will subject the transferor to a capital gains tax that may be
significantly greater than the share transfer tax applicable to transfers effected on the PSE.
See ― Philippine Taxation‖. All transfers of shares on the PSE must be effected through a
licensed stockbroker in the Philippines.
There is no provision in the Company‘s Articles of Incorporation and By -Laws, as amended,
which may delay, deter, or prevent a change in control in the Company.
Issues of Shares
Subject to otherwise applicable limitations, the Company may issue additional Common
Shares to any person for consideration deemed fair by the Board, provided that such
consideration shall not be less than the par value of the issued Common Shares. No share
certificates shall be issued to a subscriber until the full amount of the subscription together
with interest and expenses (in case of delinquent Common Shares) has been paid and proof of
payment of the applicable taxes shall have been submitted to the Company‘s Corporate
Secretary. Under the PSE Rules, only fully-paid shares may be listed on the PSE.

7/21/2019 PreliminaryProspectus - Century
http://slidepdf.com/reader/full/preliminaryprospectus-century 214/648
Recent sales of unregistered or exempt securities (including recent issuance of securities
constituting an exempt transaction)
On February 8, 2014, Century Canning Corporation subscribed for an additional 500,000,000
Common Shares at the aggregate subscription price of ₱500,000,000.00, thereby increasing
its shareholdings in the Company from 1,499,999,993 Common Shares to 1,999,999,993
Common Shares. No commission or other remuneration was paid or given directly or
indirectly in connection with such subscription. Other than as described herein, there have
been no sales of unregistered or exempt securities, or any issuances of securities constituting
an exempt transaction.
The sale of capital stock of a corporation to its own stockholders exclusively, where no
commission or other remuneration is paid or given directly or indirectly in connection with
the sale of such capital stock is a transaction exempt from registration under Section 10.1(e)
of the SRC, and no notice or confirmation of exemption is required to be filed for such
transaction.
Share Certificates
Certificates representing the Common Shares will be issued in such denominations as
shareholders may request, except that certificates will not be issued for fractional shares.
Shareholders wishing to split their certificates may do so upon application to the Company‘s
share transfer agent, BDO Unibank, Inc. – Trust Banking Group, which will maintain the
share register. Common Shares may also be lodged and maintained under the book-entry
system of the PDTC. See ―The Philippine Stock Market ‖.
Fundamental Matters
The Philippine Corporation Code provides that certain significant acts may only beimplemented with shareholders‘ approval. The following require the approval of shareholders
representing at least two-thirds of the issued and outstanding capital shares (including non-
voting preferred shares) of the corporation in a meeting duly called for the purpose:
amendment of the articles of incorporation;
removal of directors;
sale, lease, exchange, mortgage, pledge or other disposition of all or a substantial part
of the assets of the corporation;
investment of corporate funds in any other corporation or business or for any purpose
other than the primary purpose for which the corporation was organized; declaration or issuance of share dividends;
delegation to the board of directors of the power to amend or repeal by-laws or adopt
new by-laws;
merger or consolidation;
dissolution;
an increase or decrease in capital shares;
ratification of a contract of a directors or officer with the corporation;
extension or shortening of the corporate term;
creation or increase of bonded indebtedness; and

7/21/2019 PreliminaryProspectus - Century
http://slidepdf.com/reader/full/preliminaryprospectus-century 215/648
management contracts with related parties;
The approval of shareholders holding a majority of the outstanding capital shares of a
Philippine corporation, including the non-voting preferred shares, is required for the adoption
or amendment of the by-laws of such corporation.
Accounting and Auditing Requirements
Philippine stock corporations are required to file copies of their annual financial statements
with the SEC. In addition, public corporations are required to file quarterly financial
statements (for the first three quarters) with the SEC. Those corporations whose shares are
listed on the PSE are additionally required to file said quarterly and annual financial
statements with the PSE. Shareholders are entitled to request copies of the most recent
financial statements of the corporation which include a statement of financial position as of
the end of the most recent tax year and a profit and loss statement for that year. Shareholders
are also entitled to inspect and examine the books and records that the corporation is required
by law to maintain.
The Board is required to present to shareholders at every annual meeting a financial report of
the operations of the Company for the preceding year. This report is required to include
audited financial statements.
7/21/2019 PreliminaryProspectus - Century
http://slidepdf.com/reader/full/preliminaryprospectus-century 216/648
THE PHILIPPINE STOCK MARKET
The information presented in this section has been extracted from publicly available
documents which have not been prepared or independently verified by the Company, the Joint
Lead Underwriters or any of their respective subsidiaries, affiliates or advisors in connection
with the offer and sale of the Offer Shares.
Brief History
The Philippines initially had two stock exchanges, the Manila Stock Exchange, which was
organized in 1927, and the Makati Stock Exchange, which began operations in 1963. Each
exchange was self-regulating, governed by its respective Board of Governors elected annually
by its members.
Several steps initiated by the Philippine government have resulted in the unification of the
two bourses into the PSE. The PSE was incorporated in 1992 by officers of both the Makati
and the Manila Stock Exchanges. In March 1994, the licenses of the two exchanges wererevoked. While the PSE maintains two trading floors, one in Makati City and the other in
Pasig City, these floors are linked by an automated trading system, which integrates all bid
and ask quotations from the bourses.
In June 1998, the SEC granted the Self-Regulatory Organization status to the PSE, allowing it
to impose rules as well as implement penalties on erring trading participants and listed
companies. On August 8, 2001, the PSE completed its demutualization, converting from a
non-stock member-governed institution into a stock corporation in compliance with the
requirements of the SRC. The PSE had an authorized capital stock of 97.8 million shares, of
which 61,258,733 shares were subscribed and fully paid-up as of June 30, 2013. Each of the
184 member-brokers was granted 50,000 common shares of the new PSE at a par value of
₱1.00 per share. In addition, a trading right evidenced by a ―Trading Participant Certificate‖
was immediately conferred on each member broker allowing the use of the PSE‘s trading
facilities. As a result of the demutualization, the composition of the PSE Board of Governors
was changed, requiring the inclusion of seven brokers and eight non-brokers, one of whom is
the President.
On December 15, 2003, the PSE listed its shares by way of introduction at its own bourse as
part of a series of reforms aimed at strengthening the securities industry.
Classified into financial, industrial, holding firms, property, services, and mining and oil
sectors, companies are listed either on the PSE‘s Main Board or the Small, Medium and
Emerging Board. Previously, the PSE allowed listing on the First Board, Second Board or theSmall, Medium and Enterprises Board. As a result of the issuance by the PSE of
Memorandum No. CN-No. 2013-0023 dated June 6, 2013, revisions to the PSE Listing Rules
were made. Among such changes are the removal of the Second Board listing and the
requirement that lock-up rules be embodied in the articles of the incorporation of the issuer.
Each index represents the numerical average of the prices of component shares. The PSE has
an index, referred to as the PHISIX, which as at the date thereof reflects the price movements
of selected shares listed on the PSE, based on traded prices of shares from the various sectors.
The PSE shifted from full market capitalization to free float market capitalization effective
April 3, 2006, simultaneous with the migration to the free float index and the renaming of the
PHISIX to PSEi. The PSEi is composed of shares of 30 selected companies listed on the PSE.

7/21/2019 PreliminaryProspectus - Century
http://slidepdf.com/reader/full/preliminaryprospectus-century 217/648
With the increasing calls for good corporate governance, the PSE has adopted an online daily
disclosure system to improve the transparency of listed companies and to protect the investing
public.
The table below sets out movements in the composite index as of the last business day of each
calendar year from 1995 to 2013, and the most recent month end in 2014, and shows the
number of listed companies, market capitalization, and value of shares traded for the same
period:
Year
Composite
Index at
Closing
Number of
Listed
Companies
Aggregate
Market
Capitalization
Combined
Value of
Turnover
(in ₱ billions) (in ₱ billions)
1995 ......... ........ ........ ........ .. 2,594.2 205 1,545.7 379.01996 ......... ........ ........ ........ .. 3,170.6 216 2,121.1 668.8
1997 ......... ........ ........ ........ .. 1,869.2 221 1,251.3 586.2
1998 ......... ........ ........ ........ .. 1,968.8 222 1,373.7 408.7
1999 ......... ........ ........ ........ .. 2,142.9 225 1,936.5 781.0
2000 ......... ........ ........ ........ .. 1,494.5 229 2,576.5 357.7
2001 ......... ........ ........ ........ .. 1,168.1 231 2,141.4 159.6
2002 ......... ........ ........ ........ .. 1,018.4 234 2,083.2 159.7
2003 ......... ........ ........ ........ .. 1,442.4 236 2,973.8 145.4
2004 ......... ........ ........ ........ .. 1,822.8 235 4,766.3 206.6
2005 ......... ........ ........ ........ .. 2,096.0 237 5,948.4 383.5
2006 ......... ........ ........ ........ .. 2,982.5 239 7,173.2 572.6
2007 ......... ........ ........ ........ .. 3,621.6 244 7,977.6 1,338.32008 ......... ........ ........ ........ .. 1,872.9 246 4,069.2 763.9
2009 ......... ........ ........ ........ .. 3,052.7 248 6,029.1 994.2
2010 ......... ........ ........ ........ .. 4,201.1 253 8,866.1 1,207.4
2011 ......... ........ ........ ........ .. 4,372.0 245 8,697.0 1,422.6
2012 ......... ........ ........ ........ .. 5,812.7 254 10,952.7 1,771.7
2013 ......... ........ ........ ........ .. 5,889.83 257 11,931.3 2,546.2
As of February 28, 2014 6,424.99 258 12,682.3 268.6
Source: PSE
Trading
The PSE is a double auction market. Buyers and sellers are each represented by stockbrokers.
To trade, bid or ask prices are posted on the PSE‘s electronic trading system. A buy (or sell)
order that matches the lowest asked (or highest bid) price is automatically executed. Buy and
sell orders received by one broker at the same price are crossed at the PSE at the indicated
price. Payment of purchases of listed securities must be made by the buyer on or before the
third trading day (the settlement date) after the trade.
Beginning January 2, 2012, trading on the PSE starts at 9:30 a.m. until 12:00 p.m., when there
will be a one and a half hour lunch break. In the afternoon, trading resumes at 1:30 p.m. and
ends at 3:30 p.m., with a 10-minute extension during which transactions may be conducted,
provided that they are executed at the last traded price and are only for the purpose of

7/21/2019 PreliminaryProspectus - Century
http://slidepdf.com/reader/full/preliminaryprospectus-century 218/648
completing unfinished orders. Trading days are Monday to Friday, except legal holidays and
days when the BSP clearing house is closed.
Minimum trading lots range from 5 to 1,000,000 shares depending on the price range and
nature of the security traded. Odd-sized lots are traded by brokers on a board specifically
designed for odd-lot trading.
To maintain stability in the stock market, daily price swings are monitored and regulated.
Under current PSE regulations, when the price of a listed security moves up by 50% or down
by 50% in one day (based on the previous closing price or last posted bid price, whichever is
higher), the price of that security is automatically frozen by the PSE, unless there is an
official statement from the company or a government agency justifying such price fluctuation,
in which case the affected security can still be traded but only at the frozen price. If the issuer
fails to submit such explanation, a trading halt is imposed by the PSE on the listed security
the following day. Resumption of trading shall be allowed only when the disclosure of the
company is disseminated, subject again to the trading ban.
Non-Resident Transactions
When the purchase/sale of Philippine shares involves a non-resident, whether the transaction
is effected in the domestic or foreign market, it will be the responsibility of the securities
dealer/broker to register the transaction with the BSP. The local securities dealer/broker shall
file with the BSP, within three business days from the transaction date, an application in the
prescribed registration form. After compliance with other required undertakings, the BSP
shall issue a Certificate of Registration. Inward foreign investments in PSE-listed securities
are registered with the investor‘s designated custodian bank on behalf of the BSP. Under BSP
rules, all registered foreign investments in securities including profits and dividends, net of
taxes and charges, may be repatriated.
Settlement
The Securities Clearing Corporation of the Philippines (―SCCP‖) is a wholly -owned
subsidiary of the PSE, and was organized primarily as a clearance and settlement agency for
SCCP-eligible trades executed through the facilities of the PSE. SCCP received its permanent
license to operate on January 17, 2002. It is responsible for:
synchronizing the settlement of funds and the transfer of securities through Delivery
versus Payment clearing and settlement of transactions of Clearing Members, who
are also Trading Participants of the PSE;
guaranteeing the settlement of trades in the event of a Trading Participant‘s default
through the implementation of its Fails Management System and administration of
the Clearing and Trade Guaranty Fund; and
performance of Risk Management and Monitoring to ensure final and irrevocable
settlement.
SCCP settles PSE trades on a three-day rolling settlement environment, which means that
settlement of trades takes place three trading days after transaction date (―T+3‖). The
deadline for settlement of trades is 12:00 n.n. of T+3. Securities sold should be in scripless
form and lodged under the book-entry system of the PDTC. Each PSE Broker maintains a
Cash Settlement Account with one of the five existing Settlement Banks of SCCP, which areBDO Unibank, Inc., Rizal Commercial Banking Corporation, Metropolitan Bank and Trust

7/21/2019 PreliminaryProspectus - Century
http://slidepdf.com/reader/full/preliminaryprospectus-century 219/648
Company, Deutsche Bank and Unionbank of the Philippines. Payment for securities bought
should be in good, cleared funds and should be final and irrevocable. Settlement is presently
on a broker level.
SCCP implemented its Central Clearing and Central Settlement system on May 29, 2006.
CCCS employs multilateral netting, whereby the system automatically off sets ―buy‖ and
―sell‖ transactions on a per issue and a per flag basis to arrive at a net receipt or a net delivery
security position for each Clearing Member. All cash debits and credits are also netted into a
single net cash position for each Clearing Member. Novation of the original PSE trade
contracts occurs, and SCCP stands between the original trading parties and becomes the
Central Counterparty to each PSE-eligible trade cleared through it.
Scripless Trading
In 1995, the PDTC (formerly the Philippine Central Depository, Inc.), was organized to
establish a central depository in the Philippines and introduce scripless or book-entry trading
in the Philippines. On December 16, 1996, the PDTC was granted a provisional license by theSEC to act as a central securities depository.
All listed securities at the PSE have been converted into book-entry settlement in the PDTC.
The depository service of the PDTC provides the infrastructure for lodgment (deposit) and
upliftment (withdrawal) of securities, pledge of securities, securities lending and borrowing
and corporate actions including shareholders‘ meetings, dividend declarations and rights
offerings. The PDTC also provides depository and settlement services for non-PSE trades of
listed equity securities. For transactions on the PSE, the security element of the trade will be
settled through the book-entry system, while the cash element will be settled through the
current settlement banks, BDO Unibank, Inc., Rizal Commercial Banking Corporation,
Metropolitan Bank and Trust Company, Deutsche Bank and Unionbank of the Philippines.
In order to benefit from the book-entry system, securities must be immobilized into the PDTC
system through a process called lodgment. Lodgment is the process by which shareholders
transfer legal title (but not beneficial title) over their shares in favor of the PCD Nominee
Corporation (―PCD Nominee‖), a corporation wholly-owned by the PDTC, whose sole
purpose is to act as nominee and legal title holder of all shares lodged in the PDTC.
―Immobilization‖ is the process by which the warrant or share certificates of lodging holders
are cancelled by the transfer agent and the corresponding transfer of beneficial ownership of
the immobilized shares in the account of the PCD Nominee through the PDTC participant
will be recorded in the issuing corporation‘s registry. This trust arrangement between the
participants and PDTC through the PCD Nominee is established by and explained in the
PDTC Rules and Operating Procedures approved by the SEC. No consideration is paid for thetransfer of legal title to the PCD Nominee. Once lodged, transfers of beneficial title of the
securities are accomplished via book-entry settlement.
Under the current PDTC system, only participants (e.g. brokers and custodians) will be
recognized by the PDTC as the beneficial owners of the lodged equity securities. Thus, each
beneficial owner of shares, through his participant, will be the beneficial owner to the extent
of the number of shares held by such participant in the records of the PCD Nominee. All
lodgments, trades and uplifts on these shares will have to be coursed through a participant.
Ownership and transfers of beneficial interests in the shares will be reflected, with respect to
the participant‘s aggregate holdings, in the PDTC system, and with respect to each beneficial
owner‘s holdings, in the records of the participants. Beneficial owners are thus advised that in
order to exercise their rights as beneficial owners of the lodged shares, they must rely on their
participant-brokers and/or participant-custodians.

7/21/2019 PreliminaryProspectus - Century
http://slidepdf.com/reader/full/preliminaryprospectus-century 220/648
Any beneficial owner of shares who wishes to trade his interests in the shares must course the
trade through a participant. The participant can execute PSE trades and non-PSE trades of
lodged equity securities through the PDTC system. All matched transactions in the PSE
trading system will be fed through the SCCP, and into the PDTC system. Once it is
determined on the settlement date (T+3) that there are adequate securities in the securitiessettlement account of the participant-seller and adequate cleared funds in the settlement bank
account of the participant-buyer, the PSE trades are automatically settled in the SCCP Central
Clearing and Central Settlement system, in accordance with the SCCP and PDTC Rules and
Operating Procedures. Once settled, the beneficial ownership of the securities is transferred
from the participant-seller to the participant-buyer without the physical transfer of stock
certificates covering the traded securities.
The difference between the depository and the registry would be on the recording of
ownership of the shares in the issuing corporations‘ books. In the depository set -up, shares
are simply immobilized, wherein customers‘ certificates are cancelled and a confirmation
advice is issued in the name of PCD Nominee to confirm new balances of the shares lodged
with the PDTC. Transfers among/between broker and/or custodian accounts, as the case may be, will only be made within the book-entry system of the PDTC. However, as far as the
issuing corporation is concerned, the underlying certificates are in the PCD Nominee‘s name.
In the registry set-up, settlement and recording of ownership of traded securities will already
be directly made in the corresponding issuing company‘s transfer agents‘ books or system.
Likewise, recording will already be at the beneficiary level (whether it be a client or a
registered custodian holding securities for its clients), thereby removing from the broker its
current ―de facto‖ custodianship role.
Amended Rule on Lodgment of Securities
On June 24, 2009, the PSE apprised all listed companies and market participants through
Memorandum No. 2009-0320 that commencing on July 1, 2009, as a condition for the listing
and trading of the securities of an applicant company, the applicant company shall
electronically lodge its registered securities with the PDTC or any other entity duly
authorized by the SEC, without any jumbo or mother certificate in compliance with the
requirements of Section 43 of the SRC. In compliance with the foregoing requirement, actual
listing and trading of securities on the scheduled listing date shall take effect only after
submission by the applicant company of the documentary requirements stated in the amended
rule on Lodgment of Securities of the PSE.
Pursuant to the said amendment, the PDTC issued an implementing procedure in support
thereof to wit:
For a new company to be listed at the PSE as of July 1, 2009, the usual procedure
will be observed but the transfer agent of the company shall no longer issue a
certificate to PCD Nominee but shall issue a Registry Confirmation Advice, which
shall be the basis for the PDTC to credit the holdings of the depository participants on
the listing date.
On the other hand, for an existing listed company, the PDTC shall wait for the advice
of the transfer agent that it is ready to accept surrender of PCD Nominee jumbo
certificates and upon such advice the PDTC shall surrender all PCD Nominee jumbo
certificates to the transfer agent for cancellation. The transfer agent shall issue a
Registry Confirmation Advice to PDTC evidencing the total number of sharesregistered in the name of PCD Nominee in the listed company‘s registry as of
confirmation date.

7/21/2019 PreliminaryProspectus - Century
http://slidepdf.com/reader/full/preliminaryprospectus-century 221/648
Issuance of Stock Certificates for Certificated Shares
On or after the listing of the shares on the PSE, any beneficial owner of the shares may apply
with PDTC through his broker or custodian-participant for a withdrawal from the book-entry
system and return to the conventional paper-based settlement. If a shareholder wishes to
withdraw his shareholdings from the PDTC system, the PDTC has a procedure of upliftment
under which PCD Nominee will transfer back to the shareholder the legal title to the shares
lodged. The uplifting shareholder shall follow the Rules and Operating Procedures of the
PDTC for the uplifting of the shares lodged under the name of the PCD Nominee. The
transfer agent shall prepare and send a Registry Confirmation Advice to the PDTC covering
the new number of shares lodged under PCD Nominee. The expenses for upliftment are on
the account of the uplifting shareholder.
Upon the issuance of stock certificates for the shares in the name of the person applying for
upliftment, such shares shall be deemed to be withdrawn from the PDTC book-entry
settlement system, and trading on such shares will follow the normal process for settlement of
certificated securities. The expenses for upliftment of the shares into certificated securitieswill be charged to the person applying for upliftment. Pending completion of the upliftment
process, the beneficial interest in the shares covered by the application for upliftment is
frozen and no trading and book-entry settlement will be permitted until the relevant stock
certificates in the name of the person applying for upliftment shall have been issued by the
relevant company‘s transfer agent.
7/21/2019 PreliminaryProspectus - Century
http://slidepdf.com/reader/full/preliminaryprospectus-century 222/648
PHILIPPINE TAXATION
The following is a discussion of the material Philippine tax consequences of the acquisition,
ownership and disposition of the Common Shares. This general description does not purport
to be a comprehensive description of the Philippine tax aspects of the Common Shares and no
information is provided regarding the tax aspects of acquiring, owning, holding or disposing
of the Common Shares under applicable tax laws of other applicable jurisdictions and the
specific Philippine tax consequence in light of particular situations of acquiring, owning,
holding and disposing of the Common Shares in such other jurisdictions. This discussion is
based upon laws, regulations, rulings, and income tax conventions (treaties) in effect at the
date of this Prospectus. The tax treatment applicable to a holder of the Common Shares may
vary depending upon such holder‘s particular situation, and certain holders may be subject to
special rules not discussed below. This summary does not purport to address all tax aspects
that may be important to a holder of the Common Shares. Prospective investors of the
Common Shares are urged to consult their own tax advisors as to the particular tax
consequences of the ownership and disposition of the Common Shares, including the
applicability and effect of any local or foreign tax laws.
As used in this section, the term ―resident alien‖ refers to an individual whose residence is
within the Philippines and who is not a citizen of the Philippines; a ―non-resident alien‖ is an
individual whose residence is not within the Philippines and who is not a citizen of the
Philippines. A non-resident alien who is actually within the Philippines for an aggregate
period of mor e than 180 days during any calendar year is considered a ―non-resident alien
doing business in the Philippines.‖ A non-resident alien who is actually within the Philippines
for an aggregate period of 180 days or less during any calendar year is considered a ―non-
resident alien not doing business in the Philippines.‖ A ―resident foreign corporation‖ is a
non-Philippine corporation engaged in trade or business within the Philippines; and a ―non-
resident foreign corporation‖ is a non-Philippine corporation not engaged in trade or businesswithin the Philippines. The term ―dividends‖ under this section refers to cash or property
dividends. ―Tax Code‖ means the Philippine National Internal Revenue Code of 1997, as
amended.
Taxes on Dividends on the Shares
Individual Philippine citizens and resident aliens are subject to a final tax on dividends
derived from the Common Shares at the rate of 10%, which tax shall be withheld by the
Company.
Non-resident alien individuals engaged in trade or business in the Philippines are subject to a
final withholding tax on dividends derived from the Common Shares at the rate of 20% on thegross amount thereof, subject to applicable preferential tax rates under tax treaties in force
between the Philippines and the country of domicile or residence of such non-resident alien
individual. A non-resident alien individual not engaged in trade or business in the Philippines
is subject to a final withholding tax on dividends derived from the Common Shares at the rate
of 25% of the gross amount, subject to applicable preferential tax rates under tax treaties in
force between the Philippines and the country of domicile or residence of such non-resident
alien individual.
The term ―non-resident holder‖ means a holder of the Common Shares:
who is an individual who is neither a citizen nor a resident of the Philippines or an
entity which is a foreign corporation not engaged in trade or business in the
Philippines; and

7/21/2019 PreliminaryProspectus - Century
http://slidepdf.com/reader/full/preliminaryprospectus-century 223/648
should a tax treaty be applicable, whose ownership of the Common Shares is not
effectively connected with a fixed base or a permanent establishment in the
Philippines.
Dividends derived by domestic corporations (i.e. corporations created or organized in thePhilippines or under its laws) and resident foreign corporations from the Common Shares
shall not be subject to tax.
Dividends received from a domestic corporation by a non-resident foreign corporation are
generally subject to final withholding tax at the rate of 30%, subject to applicable preferential
tax rates under tax treaties in force between the Philippines and the country of domicile of
such non-resident foreign corporation. The 30% rate for dividends paid to non-resident
foreign corporations with countries of domicile having no tax treaty with the Philippines may
be reduced to a special 15% rate if:
the country in which the non-resident foreign corporation is domiciled imposes no
taxes on foreign sourced dividends; or
the country in which the non-resident foreign corporation is domiciled allows a credit
against the tax due from the non-resident foreign corporation for taxes deemed to
have been paid in the Philippines equivalent to 15%.
The BIR has prescribed, through an administrative issuance, procedures for the availment of
tax treaty relief. The application for tax treaty relief has to be filed with the BIR by the non-
resident holder of the Common Shares (or its duly authorized representative) prior to the first
taxable event, or prior to the first and only time the income tax payor is required to withhold
the tax thereon or should have withheld taxes thereon had the transaction been subject to tax.
The requirements for a tax treaty relief application in respect of dividends are set out in the
applicable tax treaty and BIR Form No. 0901-D. These include proof of tax residence in the
country that is a party to the tax treaty. Proof of residence consists of a consularized
certification from the tax authority of the country of residence of the non-resident holder of
Common Shares which states that the non-resident holder is a tax resident of such country
under the applicable tax treaty. If the non-resident holder of Common Shares is a juridical
entity, authenticated certified true copies of its articles of incorporation or association issued
by the proper government authority should also be submitted to the BIR in addition to the
certification of its residence from the tax authority of its country of residence.
If tax at the regular rate is withheld by the Company instead of the reduced rates applicable
under a treaty, the non-resident holder of the Common Shares may file a claim for refundfrom the BIR. However, because the refund process in the Philippines requires the filing of an
administrative claim and the submission of supporting information, and may also involve the
filing of a judicial appeal, it may be impractical to pursue obtaining such a refund. Moreover,
in view of the requirement of the BIR that an application for tax treaty relief be filed prior to
the first taxable event as previously stated, the non-resident holder of Common Shares may
not be able to successfully pursue a claim for refund if such an application is not filed before
such deadline.
Stock dividends distributed pro rata to any holder of shares are not subject to Philippine
income tax. However, the sale, exchange or disposition of shares received as share dividends
by the holder is subject to either capital gains tax and documentary stamp tax (if the sale is
made outside the facilities of the PSE) or stock transaction tax (if the sale is made through the
facilities of the PSE).

7/21/2019 PreliminaryProspectus - Century
http://slidepdf.com/reader/full/preliminaryprospectus-century 224/648
Tax Treaties
The following table lists some of the countries with which the Philippines has tax treaties and
the tax rates currently applicable to non-resident holders who are residents of those countries:
Country
Dividends
Capital Gains Tax
Due on
Disposition of
Common Shares
Outside the PSE
(%) (%)
Canada ................................................................... 25(1) Exempt(8)
France .................................................................... 15(2) Exempt(8)
Germany ................................................................ 15(3) 5/10(9)
Japan ..................................................................... 15(4) Exempt(8)
Singapore ............................................................... 25(5) Exempt(8) United Kingdom .................................................... 25(6) Exempt(10)
United States ......................................................... 25(7) Exempt(8)
Notes:
(1) 15% if the recipient company controls at least 10% of the voting power of the company paying the
dividends.
(2) 10% if the recipient company (excluding a partnership) holds directly at least 10% of the voting shares
of the company paying the dividends.
(3) 10% if the recipient company (excluding a partnership) owns directly at least 25% of the capital of the
company paying the dividends.
(4) 10% if the recipient company holds directly at least 10% of either the voting shares of the company paying the dividends or of the total shares issued by that company during the period of six months
immediately preceding the date of payment of the dividends.
(5) 15% if during the part of the paying company’s taxable year which precedes the date of p ayment of
dividends and during the whole of its prior taxable year at least 15% of the outstanding shares of the
voting shares of the paying company were owned by the recipient company.
(6) 15% if the recipient company is a company which controls directly or indirectly at least 10% of the
voting power of the company paying the dividends.
(7) 20% if during the part of the paying corporation’s taxable year which precedes the date of payment of
dividends and during the whole of its prior taxable year, at least 10% of the outstanding shares of the
voting shares of the paying corporation were owned by the recipient corporation. Notwithstanding the
rates provided under the Republic of the Philippines-United States Treaty, residents of the United States
may avail of the 15% withholding tax rate under the tax-sparing clause of the Tax Code provided certain
conditions are met.
(8 Capital gains are taxable only in the country where the seller is a resident, provided the shares are not
those of a corporation, the assets of which consist principally of real property situated in the
Philippines, in which case the sale is subject to Philippine taxes.
(9) Under the tax treaty between the Philippines and Germany, capital gains from the alienation of shares of
a Philippine corporation may be taxed in the Philippines irrespective of the nature of the assets of the
Philippine corporation. Tax rates are 5% on the net capital gains realized during the taxable year not in
excess of ₱ 100,000 and 10% on the net capital gains realized during the taxable year in excess of ₱
100,000.
(10) Under the tax treaty between the Philippines and the United Kingdom, capital gains on the sale of the
shares of Philippine corporations are subject to tax only in the country where the seller is a resident,irrespective of the nature of the assets of the Philippine corporation.

7/21/2019 PreliminaryProspectus - Century
http://slidepdf.com/reader/full/preliminaryprospectus-century 225/648
In order for an exemption under a tax treaty to be recognized, an application for tax treaty
relief on capital gains tax on the sale of shares must be filed by the income recipient before
the deadline for the filing of the documentary stamp tax return, which is the fifth day from the
end of the month when the document transferring ownership was executed.
The requirements for a tax treaty relief application in respect of capital gains tax on the sale of
shares are set out in the applicable tax treaty and BIR Form No. 0901-C. These include proof
of residence in the country that is a party to the tax treaty. Proof of residence consists of a
consularized certification from the tax authority of the country of residence of the seller of
shares which provides that the seller is a resident of such country under the applicable tax
treaty. If the seller is a juridical entity, authenticated certified true copies of its articles of
incorporation or association issued by the proper government authority should also be
submitted to the BIR in addition to the certification of its residence from the tax authority of
its country of residence.
Sale, Exchange or Disposition of Shares through an Initial Public Offering (“IPO”)
The sale, barter, exchange or other disposition through an IPO of shares in closely held
corporations is subject to an IPO Tax at the rates below based on the gross selling price or
gross value in money of the shares sold, bartered, exchanged or otherwise disposed in
accordance with the proportion of shares sold, bartered, exchanged or otherwise disposed to
the total outstanding shares after the listing in the local stock exchange:
Up to 25% .................................................................................................. 4%
Over 25% but not over 33 1⁄3% .................................................................. 2%
Over 33 1⁄3% .............................................................................................. 1%
A ―closely held corporation‖ means any corporation at least 50% in value of outstanding
capital shares or at least 50% of the total combined voting power of all classes of shares
entitled to vote is owned directly or indirectly by or for not more than 20 individuals.
The IPO Tax for the Offer shall be paid by the Company.
Sale, Exchange or Disposition of Shares after the IPO
Capi tal gai ns tax, if sale was made outside the PSE
Net capital gains realized by a resident or non-resident other than a dealer in securities during
each taxable year from the sale, exchange or disposition of shares outside the facilities of thePSE, unless an applicable treaty exempts such gains from tax or provides for preferential
rates, are subject to tax as follows: 5.0% on gains not exceeding ₱100,000 and 10.0% on
gains over ₱100,000. An application for tax treaty relief must be filed (and approved) by the
Philippine tax authorities to obtain an exemption under a tax treaty. Such application must be
filed before the deadline for the filing of the documentary stamp tax return. Otherwise, the tax
treaty exemption cannot be availed of. The transfer of shares shall not be recorded in the
books of the Company unless the BIR certifies that the capital gains and documentary stamp
taxes relating to the sale or transfer have been paid or, where applicable, tax treaty relief has
been confirmed by the International Tax Affairs Division of the BIR in respect of the capital
gains tax or other conditions have been met.

7/21/2019 PreliminaryProspectus - Century
http://slidepdf.com/reader/full/preliminaryprospectus-century 226/648
Taxes on transfer of shar es li sted and traded at the PSE
A sale or other disposition of shares through the facilities of the PSE by a resident or a non-
resident holder, other than a dealer in securities, is subject to a stock transaction tax at the rate
of 0.5% of the gross selling price or gross value in money of the shares sold or otherwise
disposed, unless an applicable treaty exempts such sale from said tax. This tax is required to
be collected by and paid to the Government by the selling stockbroker on behalf of his client.
The stock transaction tax is classified as a percentage tax in lieu of a capital gains tax. Under
certain tax treaties, the exemptions from capital gains tax discussed herein may not be
applicable to stock transaction tax.
In addition, VAT of 12.0% is imposed on the commission earned by the PSE-registered
broker, and is generally passed on to the client.
The PSE issued Memorandum CN-No. 2012-0046 dated August 22, 2012, which provides
that immediately after December 31, 2012, the SEC shall impose a trading suspension for a
period of not more than six months, on shares of a listed company that has not complied withthe Rule on Minimum Public Ownership (―MPO‖) which requires listed companies to
maintain a minimum percentage of listed securities held by the public at 10% of the listed
companies‘ issued and outstanding shares at all times. Consequently, the sale of such listed
company‘s shares during the trading suspension may be effected only outside the trading
system of the PSE and shall be subject to capital gains tax and documentary stamp tax.
Furthermore, if the fair market value of the shares of stock sold is greater than the
consideration or the selling price, the amount by which the fair market value of the shares
exceeds the selling price shall be deemed a gift that is subject to donor‘s tax under Section
100 of the Tax Code.
On November 7, 2012, the BIR issued Revenue Regulations No. 16-2012 which provides that
the sale, barter, transfer, and/or assignment of shares of listed companies that fail to meet the
MPO requirement after December 31, 2012 will be subject to capital gains tax and
documentary stamp tax. It also requires publicly listed companies to submit public ownership
reports to the BIR within 15 days after the end of each quarter.
Prospective purchasers of the Offer Shares should obtain their own tax advice in respect of
their investment in relation to these developments.
Documentary Stamp Taxes on Shares
The original issue of shares is subject to documentary stamp tax of ₱1.00 on each ₱200 par
value, or fraction thereof, of the shares issued. On the other hand, the transfer of shares issubject to a documentary stamp tax at a rate of ₱0.75 on each ₱200, or fractional part thereof,
of the par value of the Common Shares. The documentary stamp tax is imposed on the person
making, signing, issuing, accepting or transferring the document and is thus payable either by
the vendor or the purchaser of the Common Shares.
However, the sale, barter or exchange of Common Shares should they be listed and traded
through the PSE are exempt from documentary stamp tax. In addition, the borrowing and
lending of securities executed under the securities borrowing and lending program of a
registered exchange, or in accordance with regulations prescribed by the appropriate
regulatory authority, are likewise exempt from documentary stamp tax. However, the
securities borrowing and lending agreement should be duly covered by a master securities
borrowing and lending agreement acceptable to the appropriate regulatory authority, andshould be duly registered and approved by the BIR.

7/21/2019 PreliminaryProspectus - Century
http://slidepdf.com/reader/full/preliminaryprospectus-century 227/648
Estate and Gift Taxes
The transfer of the Common Shares upon the death of a registered holder to his heirs by way
of succession, whether such an individual was a citizen of the Philippines or an alien,
regardless of residence, will be subject to Philippine estate tax at progressive rates ranging
from 5% to 20% if the net estate is over ₱200,000.
Individual registered holders, whether or not citizens or residents of the Philippines, who
transfer shares by way of gift or donation, will be liable for Philippine donor‘s tax on such
transfers at progressive rates ranging from 2% to 15% if the total net gifts made during the
calendar year exceed ₱100,000. The rate of tax with respect to net gifts made to a stranger
(one who is not a brother, sister, spouse, ancestor, lineal descendant or relative by
consanguinity within the fourth degree of relationship) is a flat rate of 30%. Corporate
registered holders are also liable for Philippine donor‘s tax on such transfers, but the rate of
tax with respect to net gifts made by corporate registered holders is always at a flat rate of
30%.
Estate and gift taxes will not be collected in respect of intangible personal property, such as
shares, (1) if the deceased at the time of death, or the donor at the time of donation, was a
citizen and resident of a foreign country which at the time of his death or donation did not
impose a transfer tax of any character in respect of intangible personal property of citizens of
the Philippines not residing in that foreign country, or (2) if the laws of the foreign country of
which the deceased or the donor was a citizen and resident at the time of his death or donation
allow a similar exemption from transfer or death taxes of every character or description in
respect of intangible personal property owned by citizens of the Philippines not residing in
that foreign country.
Corporate Income Tax
In general, a tax of 30% is imposed upon the taxable net income of a domestic corporation
from all sources (within and outside the Philippines) pursuant to the Tax Code.

7/21/2019 PreliminaryProspectus - Century
http://slidepdf.com/reader/full/preliminaryprospectus-century 228/648
PHILIPPINE FOREIGN EXCHANGE AND
FOREIGN OWNERSHIP CONTROLS
Under current BSP regulations, an investment in listed securities (such as the Common
Shares) must be registered with the BSP if the foreign exchange needed to service the
repatriation of capital and the remittance of dividends, profits and earnings derived from such
shares is to be sourced from the Philippine banking system. If the foreign exchange required
to service capital repatriation or dividend remittance is sourced outside the Philippine banking
system, registration is not required. Current BSP Circular No. 471 (Series of 2005), as
amended, however, subjects foreign exchange dealers and money changers to R.A. No. 9160
(the Anti-Money Laundering Act of 2001, as amended) and requires these nonbank sources of
foreign exchange to require foreign exchange buyers to submit supporting documents in
connection with their application to purchase foreign exchange for purposes of capital
repatriation and remittance of dividends.
The application for registration may be done directly with the BSP or through a custodian
bank duly designated by the foreign investor. A custodian bank may be an authorized agent bank 1 or an offshore banking unit registered with the BSP to act as such and appointed by the
investor to register the investment, hold shares for the investor, and represent the investor in
all necessary actions in connection with his investments in the Philippines. Applications for
registration must be accompanied by: (i) purchase invoice, subscription agreement and proof
of listing on the PSE (either or both); (ii) credit advice or bank certificate showing the amount
of foreign currency inwardly remitted and converted into Pesos through an authorized agent
bank; and (iii) transfer instructions from the stockbroker or dealer, as the case may be.
Upon registration of the investment, proceeds of divestments, or dividends of registered
investments are repatriable or remittable immediately and in full through the Philippine
banking system, net of applicable tax, without need of BSP approval. Capital repatriation of
investments in listed securities is permitted upon presentation of the BSP registration
document and the broker‘s sales invoice, at the exchange rate prevailing at the time of
purchase of the foreign exchange from the banking system. Remittance of dividends is
permitted upon presentation of: (1) the BSP registration document; (2) the cash dividends
notice from the PSE and the Philippine Central Depository printout of cash dividend payment
or computation of interest earned; (3) copy of secretary‘s sworn statement on the board
resolution covering the dividend declaration and (4) detailed computation of the amount
applied for in the format prescribed by the BSP. Pending reinvestment or repatriation,
divestment proceeds, as well as dividends of registered investments, may be lodged
temporarily in interest-bearing deposit accounts with any authorized agent bank. Interest
earned thereon, net of taxes, may also be remitted in full. Remittance of divestment proceeds
or dividends of registered investments may be reinvested in the Philippines. The re-investments shall be registered with the BSP or the investor‘s custodian bank if the foreign
exchange needed to service the repatriation of capital and the remittance of dividends, profits
and earnings derived from such re-investments is to be sourced from the Philippine banking
system.
The foregoing is subject to the power of the BSP, through the Monetary Board, with the
approval of the President of the Philippines, to suspend temporarily or restrict the availability
of foreign exchange, require licensing of foreign exchange transactions or require delivery of
1
The term ―authorized agent bank‖ refers to all ca tegories of banks, except offshore banking units, dulylicensed by the BSP.

7/21/2019 PreliminaryProspectus - Century
http://slidepdf.com/reader/full/preliminaryprospectus-century 229/648
foreign exchange to the BSP or its designee during an exchange crisis, when an exchange
crisis is imminent, or in times of national emergency.
The registration with the BSP of all foreign investments in any Common Shares received in
exchange for Offer Shares shall be the responsibility of the foreign investor.
Foreign Ownership Controls
The Company does not currently own real estate. However, if the Company acquires real
estate in the future, it would be subject to nationality restrictions found under the Philippine
Constitution and other laws limiting land ownership to Philippine Nationals. The term
―Philippine National‖ as defined under the R.A. No. 7042, as amended, shall mean a citizen
of the Philippines, a domestic partnership or association wholly-owned by citizens of the
Philippines or a corporation organized under the laws of the Philippines of which at least
60.0% of the capital stock outstanding and entitled to vote is owned and held by citizens of
the Philippines, or a corporation organized abroad and registered to do business in the
Philippines under the Philippine Corporation Code of which 60.0% of the capital stockoutstanding and entitled to vote is wholly-owned by Filipinos or a trustee of funds for pension
or other employee retirement or separation benefits, where the trustee is a Philippine National
and at least 60.0% of the fund will accrue to the benefit of Philippine Nationals.
As of the date of this Prospectus, approximately 100% of the total outstanding capital stock of
the Company is held by Philippine Nationals.

7/21/2019 PreliminaryProspectus - Century
http://slidepdf.com/reader/full/preliminaryprospectus-century 230/648
LEGAL MATTERS
Certain legal matters as to Philippine law relating to the Offer will be passed upon by
Martinez Vergara Gonzalez & Serrano, legal counsel to the Company, and Romulo Mabanta
Buenaventura Sayoc & de los Angeles, legal counsel to the Joint Lead Underwriters.
Each of the foregoing legal counsel has neither shareholdings in the Company nor any right,
whether legally enforceable or not, to nominate persons or to subscribe for securities in the
Company. None of the legal counsel will receive any direct or indirect interest in the
Company or in any securities thereof (including options, warrants or rights thereto) pursuant
to or in connection with the Offer.

7/21/2019 PreliminaryProspectus - Century
http://slidepdf.com/reader/full/preliminaryprospectus-century 231/648
INDEPENDENT AUDITORS
The combined historical financial statements of GTC and SMDC as of and for the years
ended December 31, 2011, 2012, and 2013 were audited by Punongbayan & Araullo, a
member firm within Grant Thornton International Ltd., and the pro forma consolidated
financial statements of the Company for the year ended December 31, 2013 were examined
by, Navarro Amper & Co., a member firm within Deloitte Touche Tohmatsu Limited ,
independent auditors, in accordance with PSA, as stated in their reports appearing herein.
Navarro Amper & Co., has acted as the Company‘s external auditor since January 16, 2014
Francis Albalate is the current audit partner for the Company and has served as such since
January 2014. The Company has not had any material disagreements on accounting and
financial disclosures with its current external auditor for the same periods or any subsequent
interim period. Navarro Amper & Co. has neither shareholdings in the Company nor any
right, whether legally enforceable or not, to nominate persons or to subscribe for the securities
of the Company. Navarro Amper & Co. will not receive any direct or indirect interest in the
Company or its securities (including options, warrants or rights thereto) pursuant to or inconnection with the Offer. The foregoing is in accordance with the Code of Ethics for
Professional Accountants in the Philippines set by the Board of Accountancy and approved by
the Professional Regulation Commission.
The following table sets out the aggregate fees for 2013 for professional services rendered by
Navarro Amper & Co. and Punongbayan & Araullo, excluding fees directly related to the
Offer.
2013
₱ in thousands
Audit and Audit-Related Fees(1)
......................... 9,100
Total ................................................................... 9,100
(1) Audit and Audit-Related Fees. This category includes the audit of annual financial statements,
review of interim financial statements and services that are normally provided by the
independent auditor in connection with statutory and regulatory filings or engagements for
those calendar years.
The fees presented above include out-of-pocket expenses incidental to the independent
auditors’ work, the amounts of which do not exceed 15% of the agreed -upon engagement fees.
Except for the abovementioned services, the independent auditors provided no other type of
services.
In relation to the audit of the Company‘s annual financial statements, the Company‘s
Corporate Governance Manual, which was approved by the Board of Directors on November
25, 2013, provides that the audit committee shall, among other activities (i) evaluate
significant issues reported by the external auditors in relation to the adequacy, efficiency and
effectiveness of policies, controls, processes and activities of the Company; (ii) ensure that
other non-audit work provided by the external auditors are not in conflict with their functions
as external auditors; and (iii) ensure the compliance of the Company with acceptable auditing
and accounting standards and regulations.

7/21/2019 PreliminaryProspectus - Century
http://slidepdf.com/reader/full/preliminaryprospectus-century 232/648
The audit committee consists of three members of the Board of Directors, at least one of
whom is an independent director, including the chairman of the committee. The audit
committee, with respect to an external audit:
Reviews the independent auditors audit plan — discusses scope, staffing, relianceupon management and the internal audit department, general audit approach, and
coverage provided to any significant areas of concern that the audit committee may
have.
Reviews and confirms the independence of the external auditors on relationships by
obtaining statements from the auditors on the relationships between the auditors and
the Company, including non-audit services, and discussing the relationships with the
auditors.
Prior to publishing the year-end earnings, discusses the results of the audit with the
independent auditors.
On an annual basis, the audit committee reviews and discusses with the independent
auditors all significant relationships they have with the Company that could impair
the auditors‘ independence.
On a regular basis, the audit committee meets separately with the external auditors to
discuss any matters that the committee or auditors believe should be discussed
privately.

7/21/2019 PreliminaryProspectus - Century
http://slidepdf.com/reader/full/preliminaryprospectus-century 233/648
CENTURY PACIFIC FOOD, INC.
Centerpoint BuildingJulia Vargas Avenue Ortigas Center
1605 Pasig City, Metro Manila
Philippines
JOINT LEAD UNDERWRITERS
BDO Capital & Investment
Corporation20/F South Tower,
BDO Corporate Center
7899 Makati Avenue
Makati City 0726, Philippines
BPI Capital Corporation8th Floor, BPI Building
6768 Ayala Avenue
Makati City 1226, Philippines
First Metro Investment Corporation
45/F GT Tower International
Ayala Avenue, Makati City, Philippines
FINANCIAL ADVISER
Evercore Asia Limited
Suite 1405-1407, 14th Floor
Two Exchange Square
Central
Hong Kong
LEGAL COUNSEL TO CENTURY PACIFIC FOOD, INC.
Martinez Vergara Gonzalez & Serrano
Suite 2401, The Orient Square
F. Ortigas Jr. Road, Ortigas Center
1600 Pasig City, Metro Manila
Philippines
LEGAL COUNSEL TO THE JOINT LEAD UNDERWRITERS
Romulo Mabanta Buenaventura Sayoc & de los Angeles
21st Floor, Philamlife Tower
8767 Paseo de Roxas
1226 Makati City, Philippines
INDEPENDENT AUDITORS
Navarro Amper & Co.
19th Floor, Net Lima Plaza
5th Avenue corner 26th Street
Bonifacio Global City
1634 Taguig City, Philippines

7/21/2019 PreliminaryProspectus - Century
http://slidepdf.com/reader/full/preliminaryprospectus-century 234/648
INDEX TO FINANCIAL STATEMENTS AND INDEPENDENT AUDITORS’ REPORTS
Audited Pro Forma Consolidated Financial Statements of CNPF as of and for the year ended
December 31, 2013
Page
Independent Auditor’s Assurance Report on the Compilation of Pro Forma Financi alInformation included in the Prospectus…………………………………………………………… F-4
Pro Forma Consolidated Statement of Financial Position………………………………………… F-7Pro Forma Consolidated Statement of Comprehensive Income…………………………………... F-8
Pro Forma Consolidated Statement of Changes in Equity………………………………………… F-9
Pro Forma Consolidated Statement of Cash Flows……………………………………………….. F-10
Audited Parent Financial Statements of CNPF as of December 31, 2013 and for the period October
25, 2013 to December 31, 2013
Page
Independent Auditor’s Report……………………………………………………………………... F-51Statement of Financial Position…………………………………………………………………… F-53
Statement of Comprehensive Income……………………………………………………………... F-54Statement of Changes in Equity…………………………………………………………………… F-55
Statement of Cash Flows………………………………………………………………………….. F-56Independent Auditor’s Report on Supplementary Schedule………………………………………. F-87
Supplementary Schedules…………………………………………………………………………. F-88
Audited Consolidated Financial Statements of CNPF as of December 31, 2013 and for the period
October 25, 2013 to December 31, 2013
PageStatement of Management’s Responsibility………………………………………………………. F-97
Independent Auditor’s Report……………………………………………………………………... F-100
Statement of Financial Position…………………………………………………………………… F-102
Statement of Comprehensive Income……………………………………………………………... F-103Statement of Changes in Equity…………………………………………………………………… F-104
Statement of Cash Flows………………………………………………………………………….. F-105
Independent Auditor’s Report on Supplementary Schedule………………………………………. F-159Supplementary Schedules…………………………………………………………………………. F-160
Combined Financial Statements of GTC and SMDC for the years ended December 31, 2013, 2012
and 2011
Page
Practitioner’s Compilation Report………………………………………………………………… F-170Statement of Financial Position…………………………………………………………………… F-172Statement of Comprehensive Income……………………………………………………………... F-173
Statement of Changes in Equity…………………………………………………………………… F-174Statement of Cash Flows………………………………………………………………………….. F-175
Audited Financial Statements of GTC for the years ended December 31, 2013, 2012, and 2011
Page
Statement of Management’s Responsibility………………………………………………………. F-215Independent Auditor’s Report…………………………………………………………………….. F-217Statement of Financial Position as of December 31, 2013 and 2012……………………………... F-220
F-1
7/21/2019 PreliminaryProspectus - Century
http://slidepdf.com/reader/full/preliminaryprospectus-century 235/648
Statement of Comprehensive Income for the years ended December 31, 2013 and 2012………... F-221
Statement of Changes in Equity for the years ended December 31, 2013 and 2012……………… F-222Statement of Cash Flows for the years ended December 31, 2013 and 2012…………………….. F-223
Independent Auditor’s Report…………………………………………………………………….. F-273
Statement of Financial Position as of December 31, 2012 and 2011……………………………... F-276Statement of Com prehensive Income for the years ended December 31, 2012 and 2011………... F-277
Statement of Changes in Equity for the years ended December 31, 2012 and 2011……………… F-278Statement of Cash Flows for the years ended December 31, 2012 and 2011……………………... F-279
Audited Financial Statements of SMDC for the years ended December 31, 2013, 2012, and 2011
Page
Statement of Management’s Responsibility………………………………………………………. F-320Independent Auditor’s Report…………………………………………………………………….. F-322Statement of Financial Position as of December 31, 2013 and 2012……………………………... F-325
Statement of Comprehensive Income for the years ended December 31, 2013 and 2012………... F-326Statement of Changes in Equity for the years ended December 31, 2013 and 2012……………… F-327
Statement of Cash Flows for the years ended December 31, 2013 and 2012…………………….. F-328
Independent Auditor’s Report…………………………………………………………………….. F-377Statement of Financial Position as of December 31, 2012 and 2011……………………………... F-380
Statement of Comprehensive Income for the years ended December 31, 2012 and 2011………... F-381Statement of Changes in Equity for the years ended December 31, 2012 and 2011……………… F-382
Statement of Cash Flows for the years ended December 31, 2012 and 2011……………………... F-383
F-2

7/21/2019 PreliminaryProspectus - Century
http://slidepdf.com/reader/full/preliminaryprospectus-century 236/648
F-3

7/21/2019 PreliminaryProspectus - Century
http://slidepdf.com/reader/full/preliminaryprospectus-century 237/648
F-4

7/21/2019 PreliminaryProspectus - Century
http://slidepdf.com/reader/full/preliminaryprospectus-century 238/648
F-5

7/21/2019 PreliminaryProspectus - Century
http://slidepdf.com/reader/full/preliminaryprospectus-century 239/648
F-6

7/21/2019 PreliminaryProspectus - Century
http://slidepdf.com/reader/full/preliminaryprospectus-century 240/648
F-7

7/21/2019 PreliminaryProspectus - Century
http://slidepdf.com/reader/full/preliminaryprospectus-century 241/648
F-8

7/21/2019 PreliminaryProspectus - Century
http://slidepdf.com/reader/full/preliminaryprospectus-century 242/648
F-9

7/21/2019 PreliminaryProspectus - Century
http://slidepdf.com/reader/full/preliminaryprospectus-century 243/648
F-10

7/21/2019 PreliminaryProspectus - Century
http://slidepdf.com/reader/full/preliminaryprospectus-century 244/648
F-11

7/21/2019 PreliminaryProspectus - Century
http://slidepdf.com/reader/full/preliminaryprospectus-century 245/648
F-12

7/21/2019 PreliminaryProspectus - Century
http://slidepdf.com/reader/full/preliminaryprospectus-century 246/648
F-13

7/21/2019 PreliminaryProspectus - Century
http://slidepdf.com/reader/full/preliminaryprospectus-century 247/648
F-14

7/21/2019 PreliminaryProspectus - Century
http://slidepdf.com/reader/full/preliminaryprospectus-century 248/648
F-15

7/21/2019 PreliminaryProspectus - Century
http://slidepdf.com/reader/full/preliminaryprospectus-century 249/648
F-16
7/21/2019 PreliminaryProspectus - Century
http://slidepdf.com/reader/full/preliminaryprospectus-century 250/648
F-17

7/21/2019 PreliminaryProspectus - Century
http://slidepdf.com/reader/full/preliminaryprospectus-century 251/648
F-18

7/21/2019 PreliminaryProspectus - Century
http://slidepdf.com/reader/full/preliminaryprospectus-century 252/648
F-19

7/21/2019 PreliminaryProspectus - Century
http://slidepdf.com/reader/full/preliminaryprospectus-century 253/648
F-20

7/21/2019 PreliminaryProspectus - Century
http://slidepdf.com/reader/full/preliminaryprospectus-century 254/648
F-21

7/21/2019 PreliminaryProspectus - Century
http://slidepdf.com/reader/full/preliminaryprospectus-century 255/648
F-22

7/21/2019 PreliminaryProspectus - Century
http://slidepdf.com/reader/full/preliminaryprospectus-century 256/648
F-23

7/21/2019 PreliminaryProspectus - Century
http://slidepdf.com/reader/full/preliminaryprospectus-century 257/648
F-24

7/21/2019 PreliminaryProspectus - Century
http://slidepdf.com/reader/full/preliminaryprospectus-century 258/648
F-25

7/21/2019 PreliminaryProspectus - Century
http://slidepdf.com/reader/full/preliminaryprospectus-century 259/648
F-26

7/21/2019 PreliminaryProspectus - Century
http://slidepdf.com/reader/full/preliminaryprospectus-century 260/648
F-27

7/21/2019 PreliminaryProspectus - Century
http://slidepdf.com/reader/full/preliminaryprospectus-century 261/648
F-28

7/21/2019 PreliminaryProspectus - Century
http://slidepdf.com/reader/full/preliminaryprospectus-century 262/648
F-29

7/21/2019 PreliminaryProspectus - Century
http://slidepdf.com/reader/full/preliminaryprospectus-century 263/648
F-30

7/21/2019 PreliminaryProspectus - Century
http://slidepdf.com/reader/full/preliminaryprospectus-century 264/648
F-31

7/21/2019 PreliminaryProspectus - Century
http://slidepdf.com/reader/full/preliminaryprospectus-century 265/648
F-32

7/21/2019 PreliminaryProspectus - Century
http://slidepdf.com/reader/full/preliminaryprospectus-century 266/648
F-33

7/21/2019 PreliminaryProspectus - Century
http://slidepdf.com/reader/full/preliminaryprospectus-century 267/648
F-34

7/21/2019 PreliminaryProspectus - Century
http://slidepdf.com/reader/full/preliminaryprospectus-century 268/648
F-35
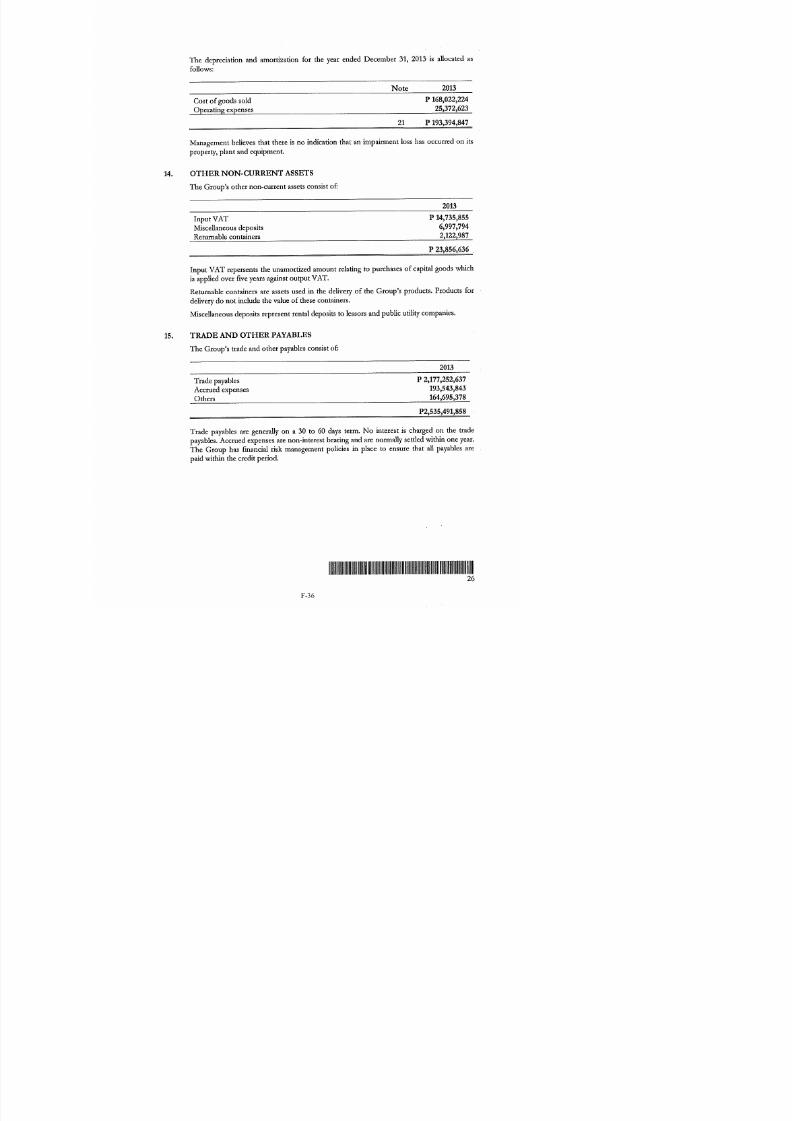
7/21/2019 PreliminaryProspectus - Century
http://slidepdf.com/reader/full/preliminaryprospectus-century 269/648
F-36

7/21/2019 PreliminaryProspectus - Century
http://slidepdf.com/reader/full/preliminaryprospectus-century 270/648
F-37

7/21/2019 PreliminaryProspectus - Century
http://slidepdf.com/reader/full/preliminaryprospectus-century 271/648
F-38

7/21/2019 PreliminaryProspectus - Century
http://slidepdf.com/reader/full/preliminaryprospectus-century 272/648
F-39
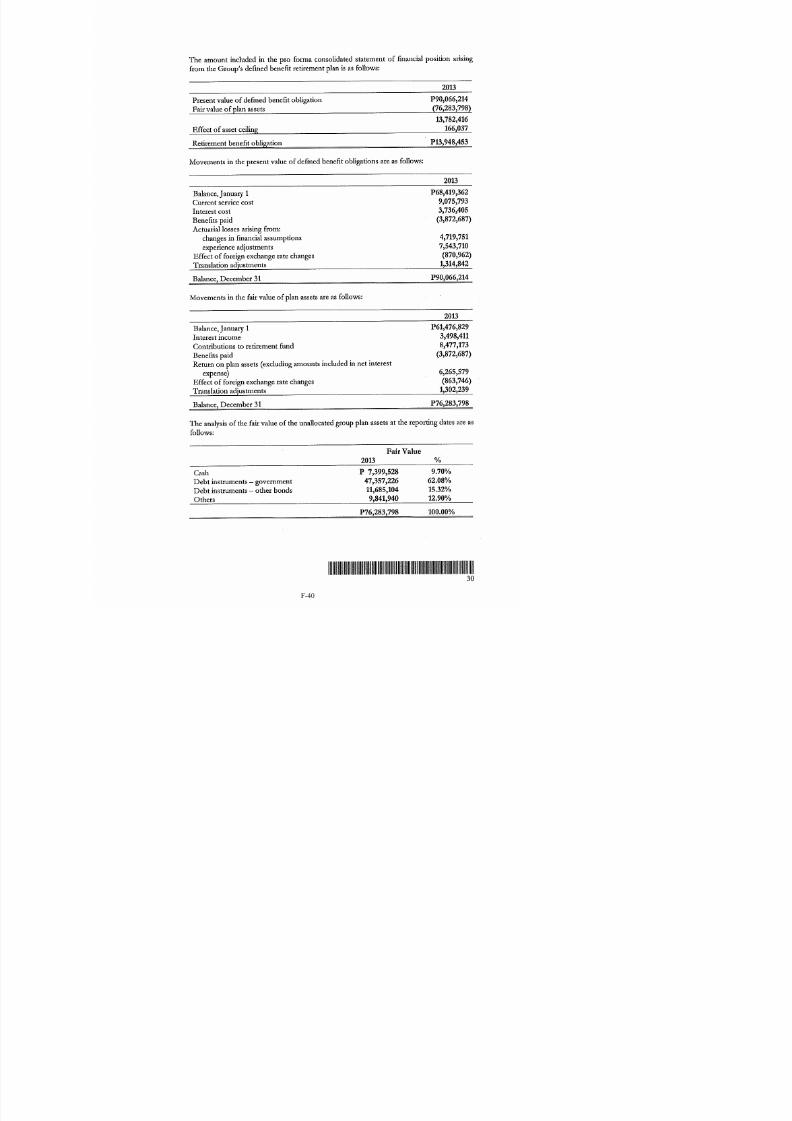
7/21/2019 PreliminaryProspectus - Century
http://slidepdf.com/reader/full/preliminaryprospectus-century 273/648
F-40

7/21/2019 PreliminaryProspectus - Century
http://slidepdf.com/reader/full/preliminaryprospectus-century 274/648
F-41

7/21/2019 PreliminaryProspectus - Century
http://slidepdf.com/reader/full/preliminaryprospectus-century 275/648
F-42

7/21/2019 PreliminaryProspectus - Century
http://slidepdf.com/reader/full/preliminaryprospectus-century 276/648
F-43

7/21/2019 PreliminaryProspectus - Century
http://slidepdf.com/reader/full/preliminaryprospectus-century 277/648
F-44

7/21/2019 PreliminaryProspectus - Century
http://slidepdf.com/reader/full/preliminaryprospectus-century 278/648
F-45

7/21/2019 PreliminaryProspectus - Century
http://slidepdf.com/reader/full/preliminaryprospectus-century 279/648
F-46

7/21/2019 PreliminaryProspectus - Century
http://slidepdf.com/reader/full/preliminaryprospectus-century 280/648
F-47

7/21/2019 PreliminaryProspectus - Century
http://slidepdf.com/reader/full/preliminaryprospectus-century 281/648
F-48

7/21/2019 PreliminaryProspectus - Century
http://slidepdf.com/reader/full/preliminaryprospectus-century 282/648
F-49

7/21/2019 PreliminaryProspectus - Century
http://slidepdf.com/reader/full/preliminaryprospectus-century 283/648
CENTURY PACIFIC FOOD, INC.(A Wholly Owned Subsidiary of Century Canning Corporation)
Financial StatementsDecember 31, 2013
andIndependent Auditors’ Report
Suite 505, Centerpoint Building, Julia Vargas St.,Ortigas Center Pasig City,Metro Manila, Philippines
F-50

7/21/2019 PreliminaryProspectus - Century
http://slidepdf.com/reader/full/preliminaryprospectus-century 284/648
F-51

7/21/2019 PreliminaryProspectus - Century
http://slidepdf.com/reader/full/preliminaryprospectus-century 285/648
F-52
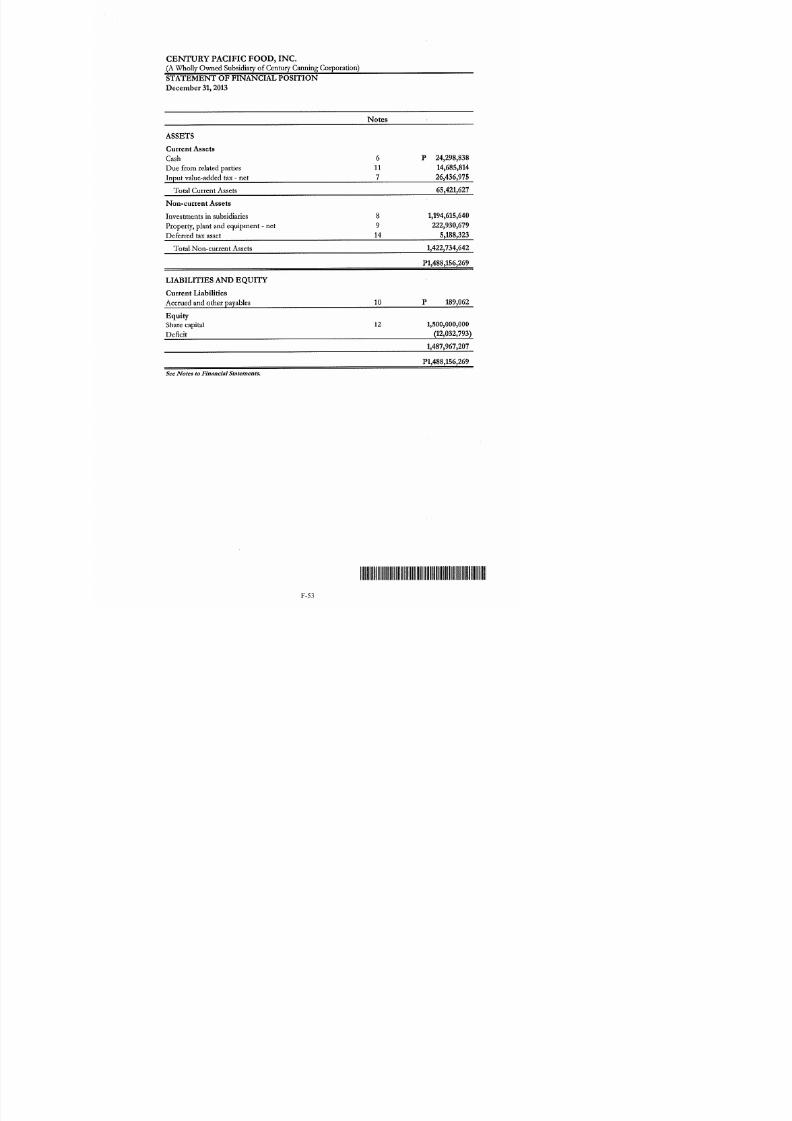
7/21/2019 PreliminaryProspectus - Century
http://slidepdf.com/reader/full/preliminaryprospectus-century 286/648
F-53

7/21/2019 PreliminaryProspectus - Century
http://slidepdf.com/reader/full/preliminaryprospectus-century 287/648
F-54

7/21/2019 PreliminaryProspectus - Century
http://slidepdf.com/reader/full/preliminaryprospectus-century 288/648
F-55

7/21/2019 PreliminaryProspectus - Century
http://slidepdf.com/reader/full/preliminaryprospectus-century 289/648
F-56

7/21/2019 PreliminaryProspectus - Century
http://slidepdf.com/reader/full/preliminaryprospectus-century 290/648
F-57

7/21/2019 PreliminaryProspectus - Century
http://slidepdf.com/reader/full/preliminaryprospectus-century 291/648
F-58

7/21/2019 PreliminaryProspectus - Century
http://slidepdf.com/reader/full/preliminaryprospectus-century 292/648
F-59

7/21/2019 PreliminaryProspectus - Century
http://slidepdf.com/reader/full/preliminaryprospectus-century 293/648
F-60
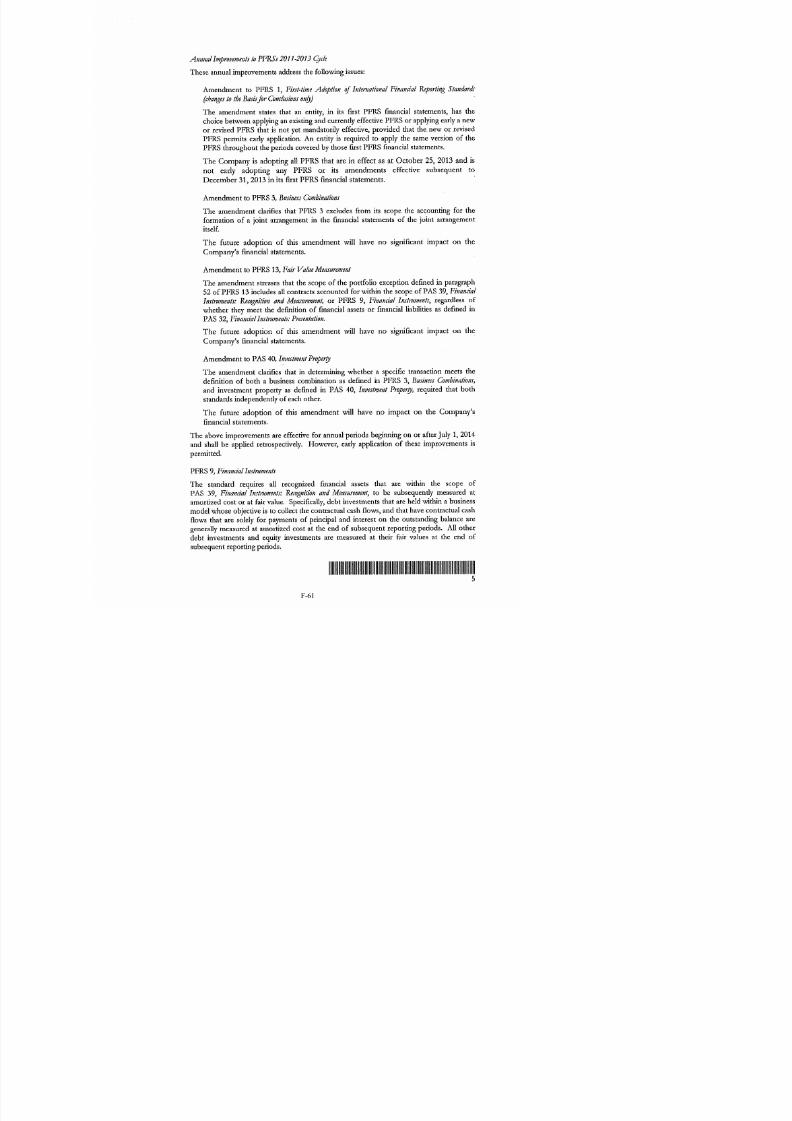
7/21/2019 PreliminaryProspectus - Century
http://slidepdf.com/reader/full/preliminaryprospectus-century 294/648
F-61

7/21/2019 PreliminaryProspectus - Century
http://slidepdf.com/reader/full/preliminaryprospectus-century 295/648
F-62

7/21/2019 PreliminaryProspectus - Century
http://slidepdf.com/reader/full/preliminaryprospectus-century 296/648
F-63
7/21/2019 PreliminaryProspectus - Century
http://slidepdf.com/reader/full/preliminaryprospectus-century 297/648
F-64

7/21/2019 PreliminaryProspectus - Century
http://slidepdf.com/reader/full/preliminaryprospectus-century 298/648
F-65

7/21/2019 PreliminaryProspectus - Century
http://slidepdf.com/reader/full/preliminaryprospectus-century 299/648
F-66

7/21/2019 PreliminaryProspectus - Century
http://slidepdf.com/reader/full/preliminaryprospectus-century 300/648
F-67

7/21/2019 PreliminaryProspectus - Century
http://slidepdf.com/reader/full/preliminaryprospectus-century 301/648
F-68

7/21/2019 PreliminaryProspectus - Century
http://slidepdf.com/reader/full/preliminaryprospectus-century 302/648
F-69

7/21/2019 PreliminaryProspectus - Century
http://slidepdf.com/reader/full/preliminaryprospectus-century 303/648
F-70

7/21/2019 PreliminaryProspectus - Century
http://slidepdf.com/reader/full/preliminaryprospectus-century 304/648
F-71

7/21/2019 PreliminaryProspectus - Century
http://slidepdf.com/reader/full/preliminaryprospectus-century 305/648
F-72

7/21/2019 PreliminaryProspectus - Century
http://slidepdf.com/reader/full/preliminaryprospectus-century 306/648
F-73

7/21/2019 PreliminaryProspectus - Century
http://slidepdf.com/reader/full/preliminaryprospectus-century 307/648
F-74

7/21/2019 PreliminaryProspectus - Century
http://slidepdf.com/reader/full/preliminaryprospectus-century 308/648
F-75
7/21/2019 PreliminaryProspectus - Century
http://slidepdf.com/reader/full/preliminaryprospectus-century 309/648
F-76

7/21/2019 PreliminaryProspectus - Century
http://slidepdf.com/reader/full/preliminaryprospectus-century 310/648
F-77

7/21/2019 PreliminaryProspectus - Century
http://slidepdf.com/reader/full/preliminaryprospectus-century 311/648
F-78

7/21/2019 PreliminaryProspectus - Century
http://slidepdf.com/reader/full/preliminaryprospectus-century 312/648
F-79

7/21/2019 PreliminaryProspectus - Century
http://slidepdf.com/reader/full/preliminaryprospectus-century 313/648
CENTURY PACIFIC FOOD, INC.(A Wholly Owned Subsidiary of Century Canning Corporation)
List of Effective Standards and Interpretations under the Philippine Financial Reporting Standards(PFRS)
PHILIPPINE FINANCIAL REPORTING STANDARDS AND INTERPRETATIONSEffective as of December 31, 2013
Adopted Not Adopted
Not Applicable
Framework for the Preparation and Presentation of FinancialStatementsConceptual Framework Phase A: Objectives and qualitativecharacteristics
PFRSs Practice Statement Management Commentary
Philippine Financial Reporting Standards
PFRS 1(Revised)
First-time Adoption of Philippine Financial ReportingStandards
Amendments to PFRS 1 and PAS 27: Cost of anInvestment in a Subsidiary, Jointly Controlled Entity or Associate
Amendments to PFRS 1: Additional Exemptions forFirst-time Adopters
Amendment to PFRS 1: Limited Exemption fromComparative PFRS 7 Disclosures for First-time Adopters
Amendments to PFRS 1: Severe Hyperinflation andRemoval of Fixed Date for First-time Adopters
Amendments to PFRS 1: Government Loans
Annual Improvements to PFRSs 2009-2011 Cycle -
Amendments to PFRS 1 , First-Time Adoption ofPFRS
Annual Improvements to PFRSs 2011-2013 Cycle - Amendments to PFRS 1 , First-time Adoption ofInternational Financial Reporting Standards (Changes tothe Basis for Conclusions only)*
PFRS 2 Share-based Payment
Amendments to PFRS 2: Vesting Conditions andCancellations
Amendments to PFRS 2: Group Cash-settled Share- based Payment Transactions
Annual Improvements to PFRSs 2010-2012 Cycle - Amendments to PFRS 2:Definition of VestingCondition *
PFRS 3(Revised)
Business Combinations
Annual Improvements to PFRSs 2010-2012 Cycle - Amendments to PFRS 3 , Business Combinations(with consequential amendments to other standards )*
Annual Improvements to PFRSs 2011-2013 Cycle -
F-80

7/21/2019 PreliminaryProspectus - Century
http://slidepdf.com/reader/full/preliminaryprospectus-century 314/648
PHILIPPINE FINANCIAL REPORTING STANDARDS AND INTERPRETATIONSEffective as of December 31, 2013
Adopted Not Adopted
Not Applicable
Amendments to PFRS 3: Scope of Exception for JointVentures *
PFRS 4 Insurance Contracts
Amendments to PAS 39 and PFRS 4: FinancialGuarantee Contracts
PFRS 5 Non-current Assets Held for Sale and DiscontinuedOperations
PFRS 6 Exploration for and Evaluation of Mineral Resources
PFRS 7 Financial Instruments: Disclosures
Amendments to PAS 39 and PFRS 7: Reclassificationof Financial Assets
Amendments to PAS 39 and PFRS 7: Reclassificationof Financial Assets - Effective Date and Transition
Amendments to PFRS 7: Improving Disclosures aboutFinancial Instruments
Amendments to PFRS 7: Disclosures - Transfers ofFinancial Assets
Amendments to PFRS 7: Disclosures – OffsettingFinancial Assets and Financial Liabilities
Amendments to PFRS 7: Mandatory Effective Date ofPFRS 9 and Transition Disclosures *
PFRS 8 Operating Segments
Annual Improvements to PFRSs 2010-2012 Cycle -
Amendments to PFRS 8: Aggregation of OperatingSegments and Reconciliation of the Total of the ReportableSegments' Assets to the Entity's Assets *
PFRS 9* Financial Instruments
Amendments to PFRS 9: Mandatory Effective Date ofPFRS 9 and Transition Disclosures
Amendments to PFRS 9: Hedge accounting andRemoval of Mandatory effective date of IFRS 9
PFRS 10 Consolidated Financial Statements
Amendments to PFRS 10: Consolidated FinancialStatement: Transition Guidance
Amendments to PFRS 10:Transition Guidance andInvestment Entities *
PFRS 11 Joint Arrangements
Amendments to PFRS 1: Joint Arrangements:Transition Guidance
PFRS 12 Disclosure of Interests in Other Entities
F-81

7/21/2019 PreliminaryProspectus - Century
http://slidepdf.com/reader/full/preliminaryprospectus-century 315/648
PHILIPPINE FINANCIAL REPORTING STANDARDS AND INTERPRETATIONSEffective as of December 31, 2013
Adopted Not Adopted
Not Applicable
Amendments to PFRS 12: Disclosure of Interests inOther Entities: Transition Guidance
Amendments to PFRS 12: Transition Guidance andInvestment Entities *
PFRS 13 Fair Value Measurement
Annual Improvements to PFRSs 2010-2012 Cycle - Amendments to PFRS 13: Fair Value Measurement(Amendments to the Basis of Conclusions Only, withConsequential Amendments to the Bases of Conclusions ofOther Standards)*
Annual Improvements to PFRSs 2011-2013 Cycle - Amendments to PFRS 13: Portfolio Exception *
Philippine Accounting Standards
PAS 1(Revised) Presentation of Financial Statements Amendment to PAS 1: Capital Disclosures
Amendments to PAS 32 and PAS 1: PuttableFinancial Instruments and Obligations Arising onLiquidation
Amendments to PAS 1: Presentation of Items of OtherComprehensive Income
Annual Improvements to PFRSs 2009-2011 Cycle - Amendments to PAS 1: Presentation of FinancialStatements
PAS 2 Inventories
PAS 7 Statement of Cash Flows
PAS 8 Accounting Policies, Changes in Accounting Estimates and Errors
PAS 10 Events after the Reporting Period
PAS 11 Construction Contracts
PAS 12 Income Taxes
Amendment to PAS 12 - Deferred Tax: Recovery ofUnderlying Assets
PAS 16 Property, Plant and Equipment
Annual Improvements to PFRSs 2009-2011 Cycle -
Amendments to PAS 16 , Property, Plant and Equipment
Annual Improvements to PFRSs 2010-2012 Cycle - Amendments to PAS 16: Revaluation Method -Proportionate Restatement of Accumulated Depreciation *
PAS 17 Leases
PAS 18 Revenue
PAS 19 Employee Benefits (2011)
F-82
7/21/2019 PreliminaryProspectus - Century
http://slidepdf.com/reader/full/preliminaryprospectus-century 316/648
PHILIPPINE FINANCIAL REPORTING STANDARDS AND INTERPRETATIONSEffective as of December 31, 2013
Adopted Not Adopted
Not Applicable
(Amended)
PAS 20 Accounting for Government Grants and Disclosure ofGovernment Assistance
PAS 21 The Effects of Changes in Foreign Exchange Rates
Amendment: Net Investment in a Foreign Operation
PAS 23(Revised)
Borrowing Costs
PAS 24(Revised)
Related Party Disclosures
Annual Improvements to PFRSs 2010-2012 Cycle - Amendments to PAS 24: Key Management Personnel *
PAS 26 Accounting and Reporting by Retirement Benefit Plans
PAS 27(Amended)
Separate Financial Statements
Amendments to PAS 27: Transition Guidance andInvestment Entities *
PAS 28(Amended)
Investments in Associates and Joint Ventures
PAS 29 Financial Reporting in Hyperinflationary Economies
PAS 31 Interests in Joint Ventures
PAS 32 Financial Instruments: Disclosure and Presentation
Amendments to PAS 32 and PAS 1: PuttableFinancial Instruments and Obligations Arising onLiquidation
Amendment to PAS 32: Classification of Rights Issues
Annual Improvements to PFRSs 2009-2011 Cycle - Amendments to PAS 32 , Financial Instruments:Presentation
Amendments to PAS 32: Offsetting Financial Assetsand Financial Liabilities *
PAS 33 Earnings per Share
PAS 34 Interim Financial Reporting
Annual Improvements to PFRSs 2009-2011 Cycle - Amendments to PAS 34 , Interim Financial Reporting
PAS 36 Impairment of Assets
PAS 37 Provisions, Contingent Liabilities and Contingent Assets
PAS 38 Intangible Assets
Annual Improvements to PFRSs 2010-2012 Cycle - Amendments to PAS 38: Revaluation Method -Proportionate Restatement of Accumulated Amortization *
PAS 39 Financial Instruments: Recognition and Measurement
F-83

7/21/2019 PreliminaryProspectus - Century
http://slidepdf.com/reader/full/preliminaryprospectus-century 317/648
PHILIPPINE FINANCIAL REPORTING STANDARDS AND INTERPRETATIONSEffective as of December 31, 2013
Adopted Not Adopted
Not Applicable
Amendments to PAS 39: Transition and InitialRecognition of Financial Assets and Financial Liabilities
Amendments to PAS 39: Cash Flow Hedge Accountingof Forecast Intragroup Transactions
Amendments to PAS 39: The Fair Value Option
Amendments to PAS 39 and PFRS 4: FinancialGuarantee Contracts
Amendments to PAS 39 and PFRS 7: Reclassificationof Financial Assets
Amendments to PAS 39 and PFRS 7: Reclassificationof Financial Assets – Effective Date and Transition
Amendments to Philippine Interpretation IFRIC–9and PAS 39: Embedded Derivatives
Amendment to PAS 39: Eligible Hedged Items
PAS 40 Investment Property
Annual Improvements to PFRSs 2011-2013 Cycle - Amendments to PAS 40: Clarifying the Interrelationshipof IFRS 3 and IAS 40 When Classifying Property asInvestment Property or Owner-Occupied Property *
PAS 41 Agriculture
Philippine Interpretations
IFRIC 1 Changes in Existing Decommissioning, Restoration andSimilar Liabilities
IFRIC 2 Members' Share in Co-operative Entities and SimilarInstruments
IFRIC 4 Determining Whether an Arrangement Contains a Lease
IFRIC 5 Rights to Interests arising from Decommissioning,Restoration and Environmental Rehabilitation Funds
IFRIC 6 Liabilities arising from Participating in a Specific Market -Waste Electrical and Electronic Equipment
IFRIC 7 Applying the Restatement Approach under PAS 29Financial Reporting in Hyperinflationary Economies
IFRIC 8 Scope of PFRS 2
IFRIC 9 Reassessment of Embedded Derivatives
Amendments to Philippine Interpretation IFRIC–9and PAS 39: Embedded Derivatives
IFRIC 10 Interim Financial Reporting and Impairment
IFRIC 11 PFRS 2- Group and Treasury Share Transactions
IFRIC 12 Service Concession Arrangements
IFRIC 13 Customer Loyalty Programmes
IFRIC 14 The Limit on a Defined Benefit Asset, Minimum Funding
F-84
7/21/2019 PreliminaryProspectus - Century
http://slidepdf.com/reader/full/preliminaryprospectus-century 318/648
PHILIPPINE FINANCIAL REPORTING STANDARDS AND INTERPRETATIONSEffective as of December 31, 2013
Adopted Not Adopted
Not Applicable
Requirements and their Interaction
Amendments to Philippine Interpretations IFRIC- 14,Prepayments of a Minimum Funding Requirement
IFRIC 16 Hedges of a Net Investment in a Foreign Operation
IFRIC 17 Distributions of Non-cash Assets to Owners
IFRIC 18 Transfers of Assets from Customers
IFRIC 19 Extinguishing Financial Liabilities with EquityInstruments
IFRIC 20 Stripping Costs in the Production Phase of a Surface Mine
IFRIC 21* Levies
SIC-7 Introduction of the Euro
SIC-10 Government Assistance - No Specific Relation to Operating
ActivitiesSIC-15 Operating Leases - Incentives
SIC-25 Income Taxes - Changes in the Tax Status of an Entity orits Shareholders
SIC-27 Evaluating the Substance of Transactions Involving theLegal Form of a Lease
SIC-29 Service Concession Arrangements : Disclosures.
SIC-31 Revenue - Barter Transactions Involving AdvertisingServices
SIC-32 Intangible Assets - Web Site Costs
PIC Q&ANo. 2006-01
Revenue Recognition for Sales of Property Units Under Pre- Completion Contracts
PIC Q&ANo. 2007-03
Valuation of Bank Real and Other Properties Acquired(ROPA)
PIC Q&ANo. 2008-02
Accounting for Government Loans with Low Interest Ratesunder the Amendments to PAS 20
PIC Q&ANo. 2010-02
Basis of Preparation of Financial Statements
PIC Q&ANo. 2010-03
Current/non-current Classification of a Callable TermLoan
PIC Q&A
No. 2011-02
Common Control Business Combinations
PIC Q&ANo. 2011-03
Accounting for Inter-company Loans
PIC Q&ANo. 2011-04
Costs of Public Offering of Shares
PIC Q&ANo. 2011-05
Fair Value or Revaluation as Deemed Cost
F-85
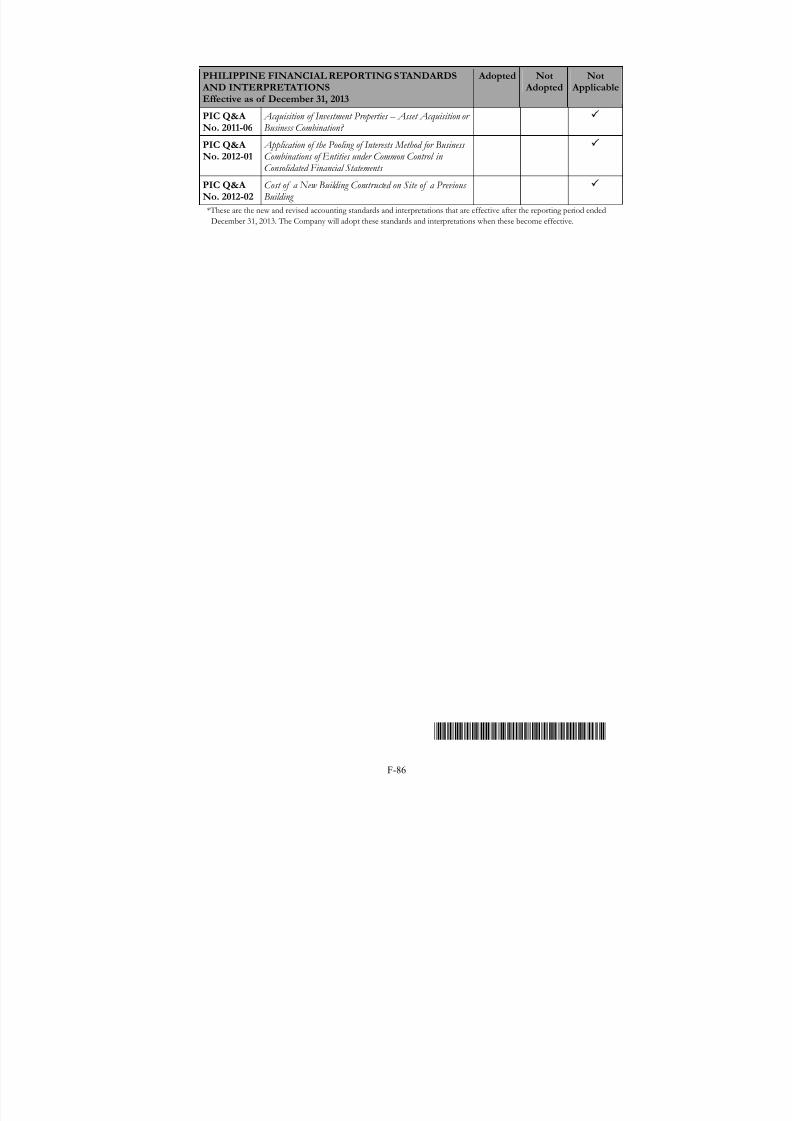
7/21/2019 PreliminaryProspectus - Century
http://slidepdf.com/reader/full/preliminaryprospectus-century 319/648
PHILIPPINE FINANCIAL REPORTING STANDARDS AND INTERPRETATIONSEffective as of December 31, 2013
Adopted Not Adopted
Not Applicable
PIC Q&ANo. 2011-06
Acquisition of Investment Properties – Asset Acquisition orBusiness Combination?
PIC Q&ANo. 2012-01
Application of the Pooling of Interests Method for BusinessCombinations of Entities under Common Control inConsolidated Financial Statements
PIC Q&ANo. 2012-02
Cost of a New Building Constructed on Site of a PreviousBuilding
*These are the new and revised accounting standards and interpretations that are effective after the reporting period ended
December 31, 2013. The Company will adopt these standards and interpretations when these become effective.
F-86

7/21/2019 PreliminaryProspectus - Century
http://slidepdf.com/reader/full/preliminaryprospectus-century 320/648

7/21/2019 PreliminaryProspectus - Century
http://slidepdf.com/reader/full/preliminaryprospectus-century 321/648

7/21/2019 PreliminaryProspectus - Century
http://slidepdf.com/reader/full/preliminaryprospectus-century 322/648

7/21/2019 PreliminaryProspectus - Century
http://slidepdf.com/reader/full/preliminaryprospectus-century 323/648
7/21/2019 PreliminaryProspectus - Century
http://slidepdf.com/reader/full/preliminaryprospectus-century 324/648

7/21/2019 PreliminaryProspectus - Century
http://slidepdf.com/reader/full/preliminaryprospectus-century 325/648

7/21/2019 PreliminaryProspectus - Century
http://slidepdf.com/reader/full/preliminaryprospectus-century 326/648

7/21/2019 PreliminaryProspectus - Century
http://slidepdf.com/reader/full/preliminaryprospectus-century 327/648

7/21/2019 PreliminaryProspectus - Century
http://slidepdf.com/reader/full/preliminaryprospectus-century 328/648

7/21/2019 PreliminaryProspectus - Century
http://slidepdf.com/reader/full/preliminaryprospectus-century 329/648

7/21/2019 PreliminaryProspectus - Century
http://slidepdf.com/reader/full/preliminaryprospectus-century 330/648F-97

7/21/2019 PreliminaryProspectus - Century
http://slidepdf.com/reader/full/preliminaryprospectus-century 331/648F-98

7/21/2019 PreliminaryProspectus - Century
http://slidepdf.com/reader/full/preliminaryprospectus-century 332/648
CENTURY PACIFIC FOOD, INC. AND SUBSIDIARIES
(A Wholly Owned Subsidiary of Century Canning Corporation)
Consolidated Financial StatementsDecember 31, 2013
andIndependent Auditors’ Report
Suite 505, Centerpoint Building, Julia Vargas St.,Ortigas Center Pasig City,Metro Manila, Philippines
F-99

7/21/2019 PreliminaryProspectus - Century
http://slidepdf.com/reader/full/preliminaryprospectus-century 333/648
F-100

7/21/2019 PreliminaryProspectus - Century
http://slidepdf.com/reader/full/preliminaryprospectus-century 334/648
F-101

7/21/2019 PreliminaryProspectus - Century
http://slidepdf.com/reader/full/preliminaryprospectus-century 335/648
F-102

7/21/2019 PreliminaryProspectus - Century
http://slidepdf.com/reader/full/preliminaryprospectus-century 336/648
F-103

7/21/2019 PreliminaryProspectus - Century
http://slidepdf.com/reader/full/preliminaryprospectus-century 337/648
F-104

7/21/2019 PreliminaryProspectus - Century
http://slidepdf.com/reader/full/preliminaryprospectus-century 338/648
F-105

7/21/2019 PreliminaryProspectus - Century
http://slidepdf.com/reader/full/preliminaryprospectus-century 339/648
F-106

7/21/2019 PreliminaryProspectus - Century
http://slidepdf.com/reader/full/preliminaryprospectus-century 340/648
F-107

7/21/2019 PreliminaryProspectus - Century
http://slidepdf.com/reader/full/preliminaryprospectus-century 341/648
F-108

7/21/2019 PreliminaryProspectus - Century
http://slidepdf.com/reader/full/preliminaryprospectus-century 342/648
F-109

7/21/2019 PreliminaryProspectus - Century
http://slidepdf.com/reader/full/preliminaryprospectus-century 343/648
F-110

7/21/2019 PreliminaryProspectus - Century
http://slidepdf.com/reader/full/preliminaryprospectus-century 344/648
F-111

7/21/2019 PreliminaryProspectus - Century
http://slidepdf.com/reader/full/preliminaryprospectus-century 345/648
F-112

7/21/2019 PreliminaryProspectus - Century
http://slidepdf.com/reader/full/preliminaryprospectus-century 346/648
F-113

7/21/2019 PreliminaryProspectus - Century
http://slidepdf.com/reader/full/preliminaryprospectus-century 347/648
F-114

7/21/2019 PreliminaryProspectus - Century
http://slidepdf.com/reader/full/preliminaryprospectus-century 348/648
F-115

7/21/2019 PreliminaryProspectus - Century
http://slidepdf.com/reader/full/preliminaryprospectus-century 349/648
F-116

7/21/2019 PreliminaryProspectus - Century
http://slidepdf.com/reader/full/preliminaryprospectus-century 350/648
F-117

7/21/2019 PreliminaryProspectus - Century
http://slidepdf.com/reader/full/preliminaryprospectus-century 351/648
F-118

7/21/2019 PreliminaryProspectus - Century
http://slidepdf.com/reader/full/preliminaryprospectus-century 352/648
F-119

7/21/2019 PreliminaryProspectus - Century
http://slidepdf.com/reader/full/preliminaryprospectus-century 353/648
F-120

7/21/2019 PreliminaryProspectus - Century
http://slidepdf.com/reader/full/preliminaryprospectus-century 354/648
F-121

7/21/2019 PreliminaryProspectus - Century
http://slidepdf.com/reader/full/preliminaryprospectus-century 355/648
F-122

7/21/2019 PreliminaryProspectus - Century
http://slidepdf.com/reader/full/preliminaryprospectus-century 356/648
F-123

7/21/2019 PreliminaryProspectus - Century
http://slidepdf.com/reader/full/preliminaryprospectus-century 357/648
F-124

7/21/2019 PreliminaryProspectus - Century
http://slidepdf.com/reader/full/preliminaryprospectus-century 358/648
F-125
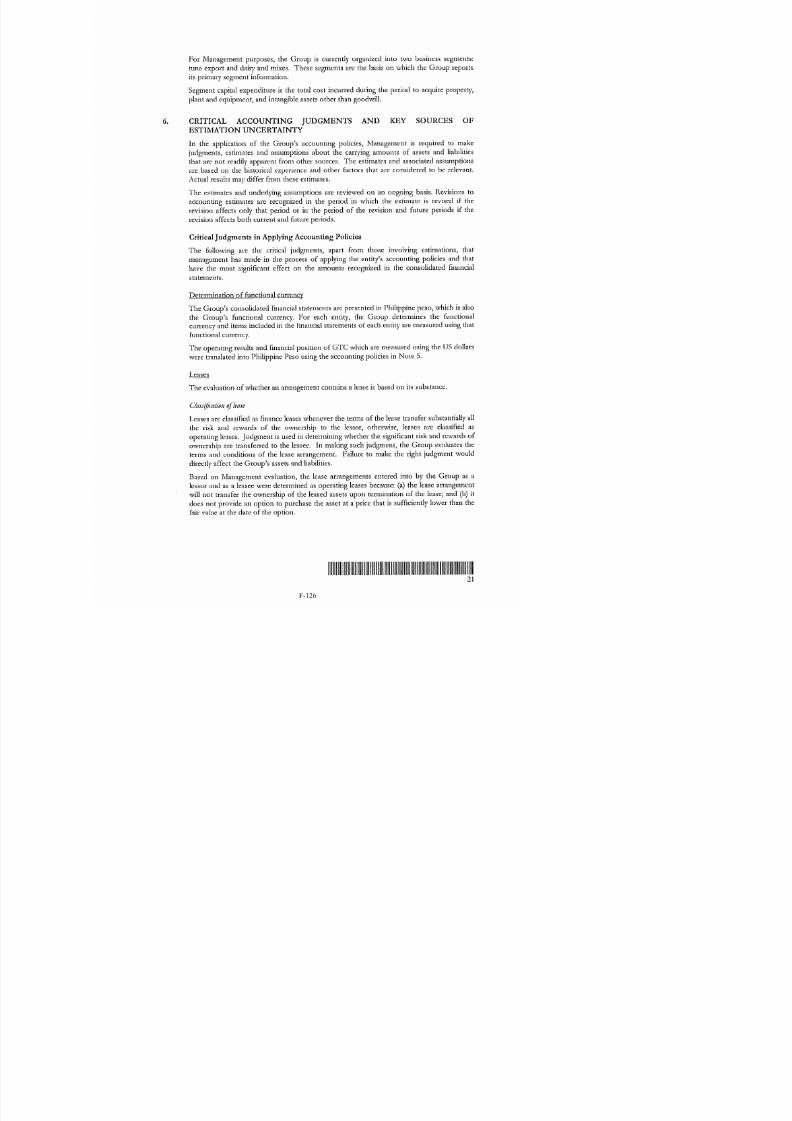
7/21/2019 PreliminaryProspectus - Century
http://slidepdf.com/reader/full/preliminaryprospectus-century 359/648
F-126

7/21/2019 PreliminaryProspectus - Century
http://slidepdf.com/reader/full/preliminaryprospectus-century 360/648
F-127

7/21/2019 PreliminaryProspectus - Century
http://slidepdf.com/reader/full/preliminaryprospectus-century 361/648
F-128
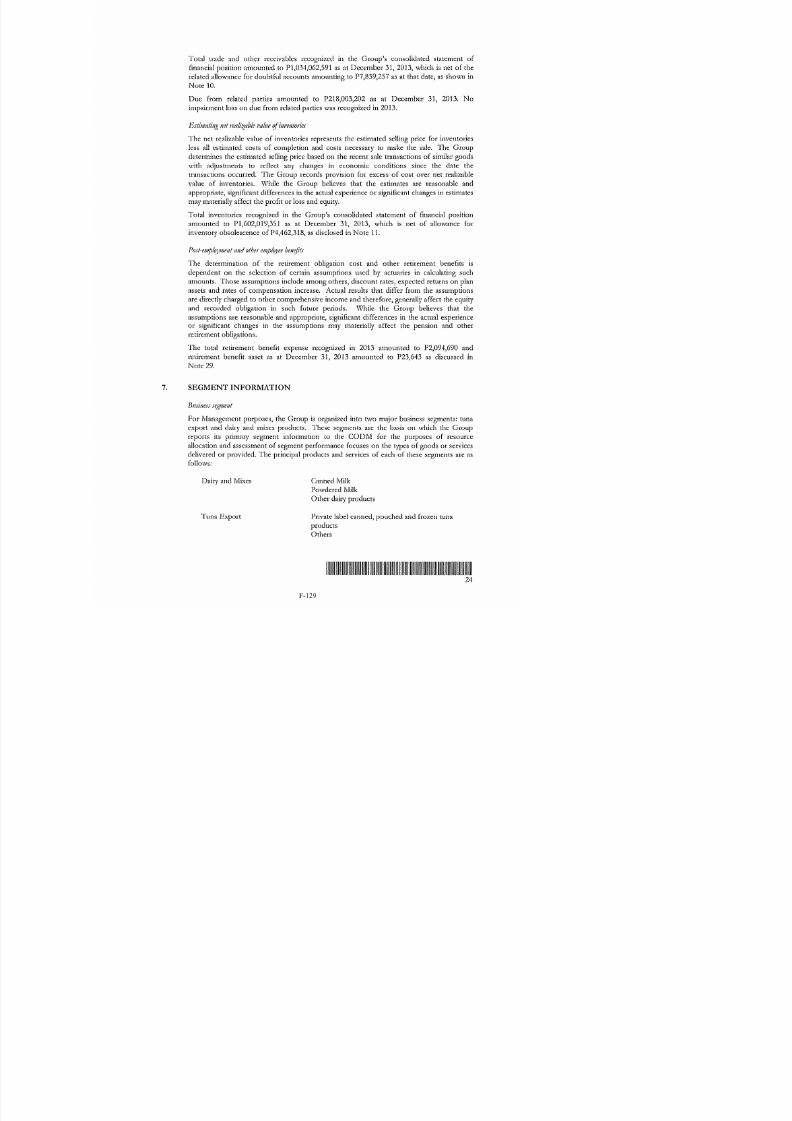
7/21/2019 PreliminaryProspectus - Century
http://slidepdf.com/reader/full/preliminaryprospectus-century 362/648
F-129

7/21/2019 PreliminaryProspectus - Century
http://slidepdf.com/reader/full/preliminaryprospectus-century 363/648
F-130

7/21/2019 PreliminaryProspectus - Century
http://slidepdf.com/reader/full/preliminaryprospectus-century 364/648
F-131
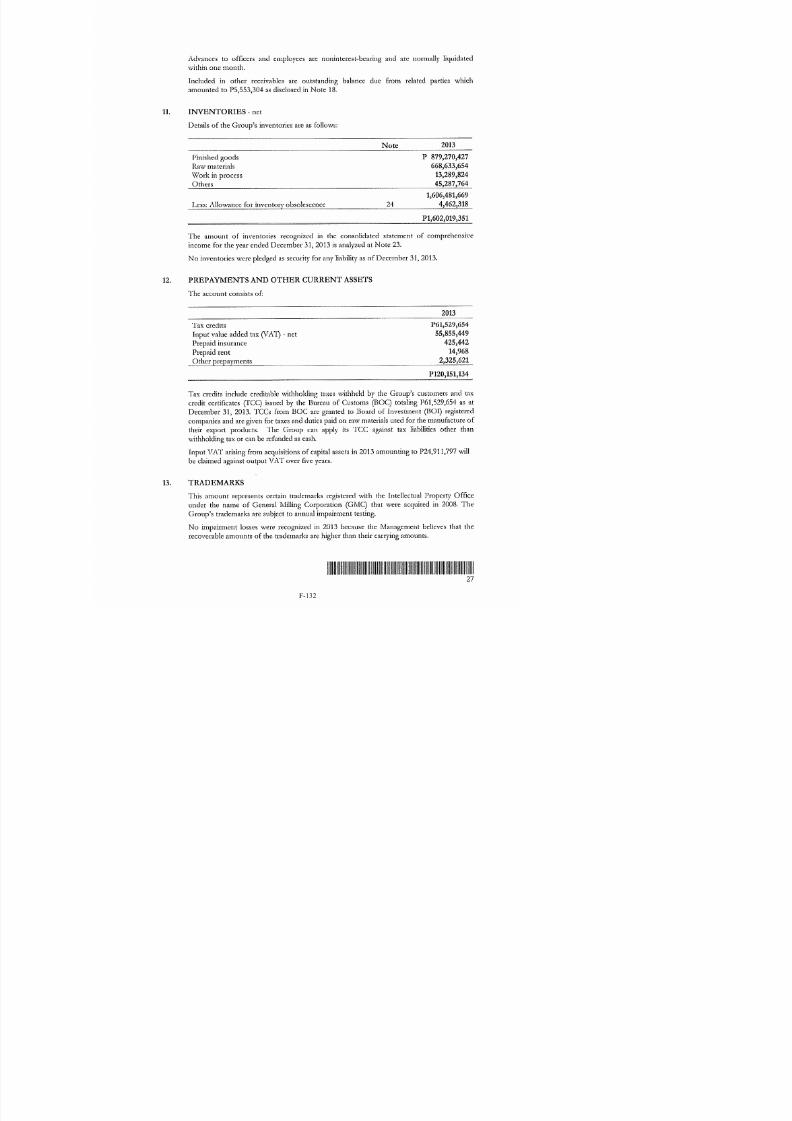
7/21/2019 PreliminaryProspectus - Century
http://slidepdf.com/reader/full/preliminaryprospectus-century 365/648
F-132

7/21/2019 PreliminaryProspectus - Century
http://slidepdf.com/reader/full/preliminaryprospectus-century 366/648
F-133

7/21/2019 PreliminaryProspectus - Century
http://slidepdf.com/reader/full/preliminaryprospectus-century 367/648
F-134

7/21/2019 PreliminaryProspectus - Century
http://slidepdf.com/reader/full/preliminaryprospectus-century 368/648
F-135

7/21/2019 PreliminaryProspectus - Century
http://slidepdf.com/reader/full/preliminaryprospectus-century 369/648
F-136

7/21/2019 PreliminaryProspectus - Century
http://slidepdf.com/reader/full/preliminaryprospectus-century 370/648
F-137

7/21/2019 PreliminaryProspectus - Century
http://slidepdf.com/reader/full/preliminaryprospectus-century 371/648
F-138

7/21/2019 PreliminaryProspectus - Century
http://slidepdf.com/reader/full/preliminaryprospectus-century 372/648
F-139

7/21/2019 PreliminaryProspectus - Century
http://slidepdf.com/reader/full/preliminaryprospectus-century 373/648
F-140

7/21/2019 PreliminaryProspectus - Century
http://slidepdf.com/reader/full/preliminaryprospectus-century 374/648
F-141

7/21/2019 PreliminaryProspectus - Century
http://slidepdf.com/reader/full/preliminaryprospectus-century 375/648
F-142

7/21/2019 PreliminaryProspectus - Century
http://slidepdf.com/reader/full/preliminaryprospectus-century 376/648
F-143

7/21/2019 PreliminaryProspectus - Century
http://slidepdf.com/reader/full/preliminaryprospectus-century 377/648
F-144

7/21/2019 PreliminaryProspectus - Century
http://slidepdf.com/reader/full/preliminaryprospectus-century 378/648
F-145

7/21/2019 PreliminaryProspectus - Century
http://slidepdf.com/reader/full/preliminaryprospectus-century 379/648
F-146
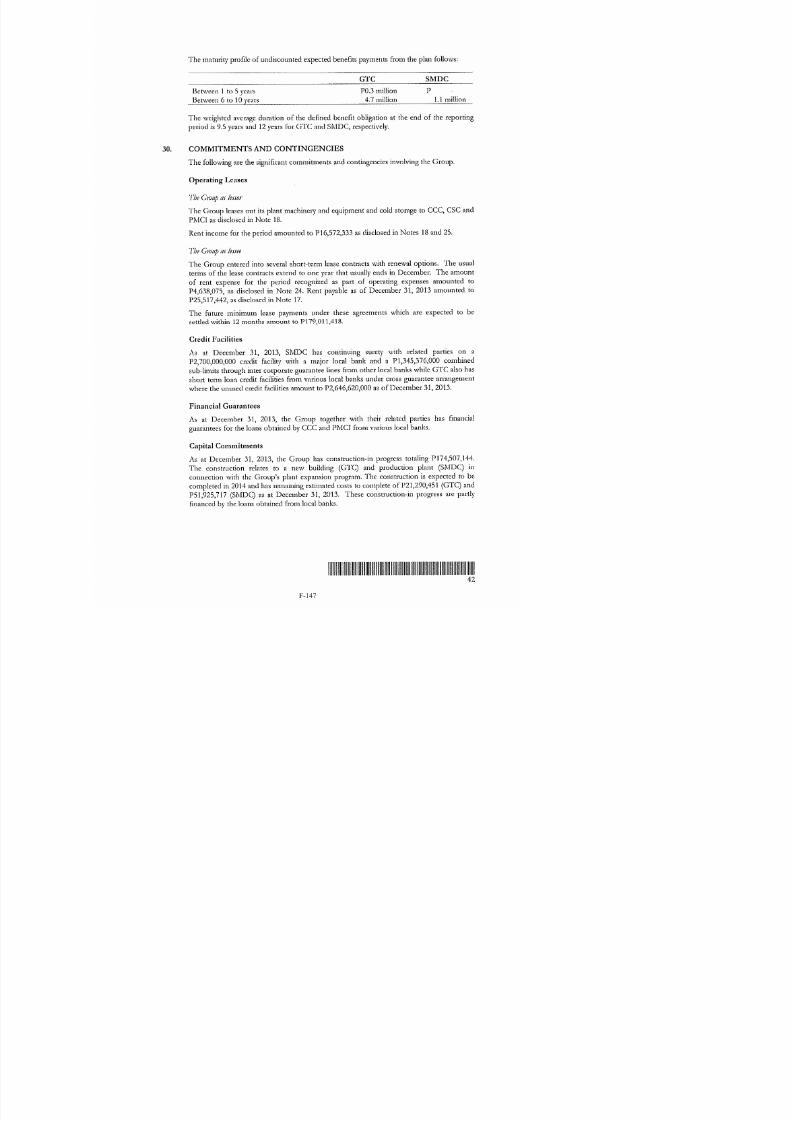
7/21/2019 PreliminaryProspectus - Century
http://slidepdf.com/reader/full/preliminaryprospectus-century 380/648
F-147

7/21/2019 PreliminaryProspectus - Century
http://slidepdf.com/reader/full/preliminaryprospectus-century 381/648
F-148
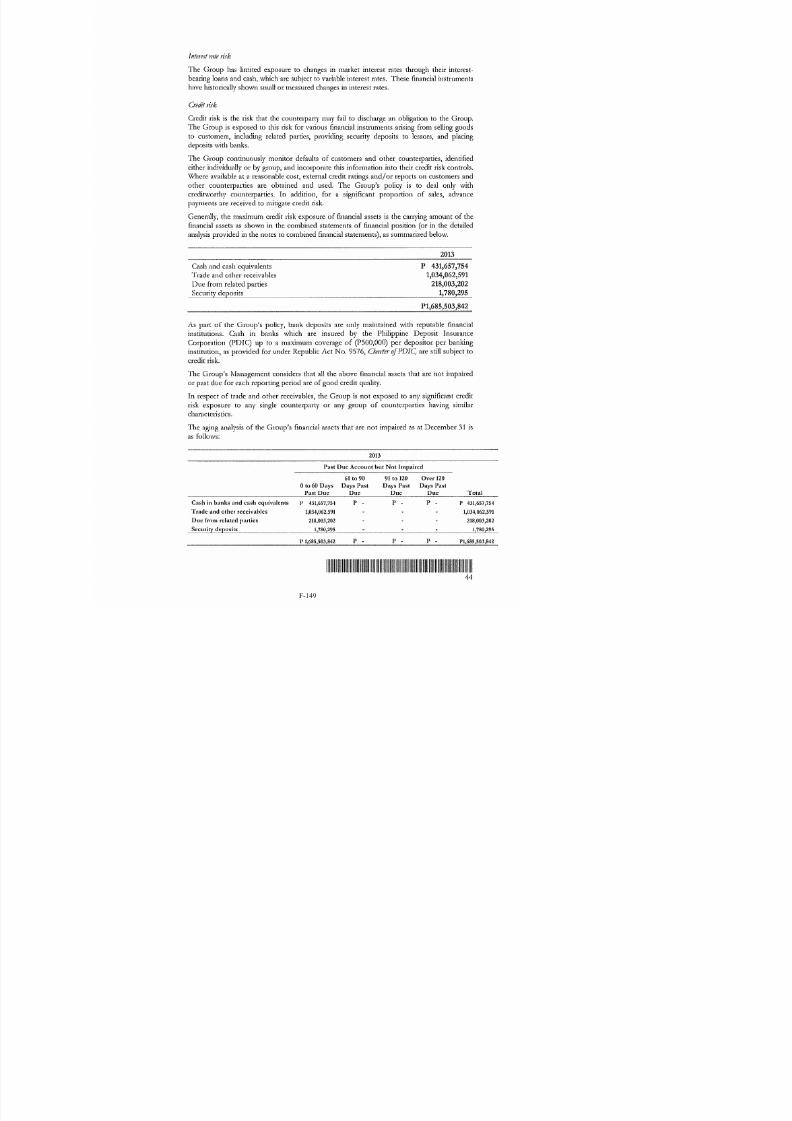
7/21/2019 PreliminaryProspectus - Century
http://slidepdf.com/reader/full/preliminaryprospectus-century 382/648
F-149

7/21/2019 PreliminaryProspectus - Century
http://slidepdf.com/reader/full/preliminaryprospectus-century 383/648
F-150

7/21/2019 PreliminaryProspectus - Century
http://slidepdf.com/reader/full/preliminaryprospectus-century 384/648
F-151

7/21/2019 PreliminaryProspectus - Century
http://slidepdf.com/reader/full/preliminaryprospectus-century 385/648
CENTURY PACIFIC FOOD, INC. AND SUBSIDIARIES
(A Wholly Owned Subsidiary of Century Canning Corporation)
List of Effective Standards and Interpretations under the Philippine Financial Reporting Standards(PFRS)
PHILIPPINE FINANCIAL REPORTING STANDARDS AND INTERPRETATIONSEffective as of December 31, 2013
Adopted Not Adopted
Not Applicable
Framework for the Preparation and Presentation of FinancialStatementsConceptual Framework Phase A: Objectives and qualitativecharacteristics
PFRSs Practice Statement Management Commentary
Philippine Financial Reporting Standards
PFRS 1(Revised)
First-time Adoption of Philippine Financial ReportingStandards
Amendments to PFRS 1 and PAS 27: Cost of anInvestment in a Subsidiary, Jointly Controlled Entity or Associate
Amendments to PFRS 1: Additional Exemptions forFirst-time Adopters
Amendment to PFRS 1: Limited Exemption fromComparative PFRS 7 Disclosures for First-time Adopters
Amendments to PFRS 1: Severe Hyperinflation andRemoval of Fixed Date for First-time Adopters
Amendments to PFRS 1: Government Loans
Annual Improvements to PFRSs 2009-2011 Cycle -
Amendments to PFRS 1 , First-Time Adoption ofPFRS
Annual Improvements to PFRSs 2011-2013 Cycle - Amendments to PFRS 1 , First-time Adoption ofInternational Financial Reporting Standards (Changes tothe Basis for Conclusions only)*
PFRS 2 Share-based Payment
Amendments to PFRS 2: Vesting Conditions andCancellations
Amendments to PFRS 2: Group Cash-settled Share- based Payment Transactions
Annual Improvements to PFRSs 2010-2012 Cycle - Amendments to PFRS 2:Definition of VestingCondition *
PFRS 3(Revised)
Business Combinations
Annual Improvements to PFRSs 2010-2012 Cycle - Amendments to PFRS 3 , Business Combinations(with consequential amendments to other standards )*
Annual Improvements to PFRSs 2011-2013 Cycle -
F-152

7/21/2019 PreliminaryProspectus - Century
http://slidepdf.com/reader/full/preliminaryprospectus-century 386/648
PHILIPPINE FINANCIAL REPORTING STANDARDS AND INTERPRETATIONSEffective as of December 31, 2013
Adopted Not Adopted
Not Applicable
Amendments to PFRS 3: Scope of Exception for JointVentures *
PFRS 4 Insurance Contracts
Amendments to PAS 39 and PFRS 4: FinancialGuarantee Contracts
PFRS 5 Non-current Assets Held for Sale and DiscontinuedOperations
PFRS 6 Exploration for and Evaluation of Mineral Resources
PFRS 7 Financial Instruments: Disclosures
Amendments to PAS 39 and PFRS 7: Reclassificationof Financial Assets
Amendments to PAS 39 and PFRS 7: Reclassificationof Financial Assets - Effective Date and Transition
Amendments to PFRS 7: Improving Disclosures aboutFinancial Instruments
Amendments to PFRS 7: Disclosures - Transfers ofFinancial Assets
Amendments to PFRS 7: Disclosures – OffsettingFinancial Assets and Financial Liabilities
Amendments to PFRS 7: Mandatory Effective Date ofPFRS 9 and Transition Disclosures *
PFRS 8 Operating Segments
Annual Improvements to PFRSs 2010-2012 Cycle -
Amendments to PFRS 8: Aggregation of OperatingSegments and Reconciliation of the Total of the ReportableSegments' Assets to the Entity's Assets *
PFRS 9* Financial Instruments
Amendments to PFRS 9: Mandatory Effective Date ofPFRS 9 and Transition Disclosures
Amendments to PFRS 9: Hedge accounting andRemoval of Mandatory effective date of IFRS 9
PFRS 10 Consolidated Financial Statements
Amendments to PFRS 10: Consolidated FinancialStatement: Transition Guidance
Amendments to PFRS 10:Transition Guidance andInvestment Entities *
PFRS 11 Joint Arrangements
Amendments to PFRS 1: Joint Arrangements:Transition Guidance
PFRS 12 Disclosure of Interests in Other Entities
F-153

7/21/2019 PreliminaryProspectus - Century
http://slidepdf.com/reader/full/preliminaryprospectus-century 387/648
PHILIPPINE FINANCIAL REPORTING STANDARDS AND INTERPRETATIONSEffective as of December 31, 2013
Adopted Not Adopted
Not Applicable
Amendments to PFRS 12: Disclosure of Interests inOther Entities: Transition Guidance
Amendments to PFRS 12: Transition Guidance andInvestment Entities *
PFRS 13 Fair Value Measurement
Annual Improvements to PFRSs 2010-2012 Cycle - Amendments to PFRS 13: Fair Value Measurement(Amendments to the Basis of Conclusions Only, withConsequential Amendments to the Bases of Conclusions ofOther Standards)*
Annual Improvements to PFRSs 2011-2013 Cycle - Amendments to PFRS 13: Portfolio Exception *
Philippine Accounting Standards
PAS 1(Revised)
Presentation of Financial Statements
Amendment to PAS 1: Capital Disclosures
Amendments to PAS 32 and PAS 1: PuttableFinancial Instruments and Obligations Arising onLiquidation
Amendments to PAS 1: Presentation of Items of OtherComprehensive Income
Annual Improvements to PFRSs 2009-2011 Cycle - Amendments to PAS 1: Presentation of FinancialStatements
PAS 2 Inventories
PAS 7 Statement of Cash Flows
PAS 8 Accounting Policies, Changes in Accounting Estimates and Errors
PAS 10 Events after the Reporting Period
PAS 11 Construction Contracts
PAS 12 Income Taxes
Amendment to PAS 12 - Deferred Tax: Recovery ofUnderlying Assets
PAS 16 Property, Plant and Equipment
Annual Improvements to PFRSs 2009-2011 Cycle -
Amendments to PAS 16 , Property, Plant and Equipment
Annual Improvements to PFRSs 2010-2012 Cycle - Amendments to PAS 16: Revaluation Method -Proportionate Restatement of Accumulated Depreciation *
PAS 17 Leases
PAS 18 Revenue
PAS 19 Employee Benefits (2011)
F-154

7/21/2019 PreliminaryProspectus - Century
http://slidepdf.com/reader/full/preliminaryprospectus-century 388/648
PHILIPPINE FINANCIAL REPORTING STANDARDS AND INTERPRETATIONSEffective as of December 31, 2013
Adopted Not Adopted
Not Applicable
(Amended)
PAS 20 Accounting for Government Grants and Disclosure ofGovernment Assistance
PAS 21 The Effects of Changes in Foreign Exchange Rates
Amendment: Net Investment in a Foreign Operation
PAS 23(Revised)
Borrowing Costs
PAS 24(Revised)
Related Party Disclosures
Annual Improvements to PFRSs 2010-2012 Cycle - Amendments to PAS 24: Key Management Personnel *
PAS 26 Accounting and Reporting by Retirement Benefit Plans
PAS 27(Amended)
Separate Financial Statements
Amendments to PAS 27: Transition Guidance andInvestment Entities *
PAS 28(Amended)
Investments in Associates and Joint Ventures
PAS 29 Financial Reporting in Hyperinflationary Economies
PAS 31 Interests in Joint Ventures
PAS 32 Financial Instruments: Disclosure and Presentation
Amendments to PAS 32 and PAS 1: PuttableFinancial Instruments and Obligations Arising onLiquidation
Amendment to PAS 32: Classification of Rights Issues
Annual Improvements to PFRSs 2009-2011 Cycle - Amendments to PAS 32 , Financial Instruments:Presentation
Amendments to PAS 32: Offsetting Financial Assetsand Financial Liabilities *
PAS 33 Earnings per Share
PAS 34 Interim Financial Reporting
Annual Improvements to PFRSs 2009-2011 Cycle - Amendments to PAS 34 , Interim Financial Reporting
PAS 36 Impairment of Assets
PAS 37 Provisions, Contingent Liabilities and Contingent Assets
PAS 38 Intangible Assets
Annual Improvements to PFRSs 2010-2012 Cycle - Amendments to PAS 38: Revaluation Method -Proportionate Restatement of Accumulated Amortization *
PAS 39 Financial Instruments: Recognition and Measurement
F-155

7/21/2019 PreliminaryProspectus - Century
http://slidepdf.com/reader/full/preliminaryprospectus-century 389/648
PHILIPPINE FINANCIAL REPORTING STANDARDS AND INTERPRETATIONSEffective as of December 31, 2013
Adopted Not Adopted
Not Applicable
Amendments to PAS 39: Transition and InitialRecognition of Financial Assets and Financial Liabilities
Amendments to PAS 39: Cash Flow Hedge Accountingof Forecast Intragroup Transactions
Amendments to PAS 39: The Fair Value Option
Amendments to PAS 39 and PFRS 4: FinancialGuarantee Contracts
Amendments to PAS 39 and PFRS 7: Reclassificationof Financial Assets
Amendments to PAS 39 and PFRS 7: Reclassificationof Financial Assets – Effective Date and Transition
Amendments to Philippine Interpretation IFRIC–9and PAS 39: Embedded Derivatives
Amendment to PAS 39: Eligible Hedged Items
PAS 40 Investment Property
Annual Improvements to PFRSs 2011-2013 Cycle - Amendments to PAS 40: Clarifying the Interrelationshipof IFRS 3 and IAS 40 When Classifying Property asInvestment Property or Owner-Occupied Property *
PAS 41 Agriculture
Philippine Interpretations
IFRIC 1 Changes in Existing Decommissioning, Restoration andSimilar Liabilities
IFRIC 2 Members' Share in Co-operative Entities and SimilarInstruments
IFRIC 4 Determining Whether an Arrangement Contains a Lease
IFRIC 5 Rights to Interests arising from Decommissioning,Restoration and Environmental Rehabilitation Funds
IFRIC 6 Liabilities arising from Participating in a Specific Market -Waste Electrical and Electronic Equipment
IFRIC 7 Applying the Restatement Approach under PAS 29Financial Reporting in Hyperinflationary Economies
IFRIC 8 Scope of PFRS 2
IFRIC 9 Reassessment of Embedded Derivatives
Amendments to Philippine Interpretation IFRIC–9and PAS 39: Embedded Derivatives
IFRIC 10 Interim Financial Reporting and Impairment
IFRIC 11 PFRS 2- Group and Treasury Share Transactions
IFRIC 12 Service Concession Arrangements
IFRIC 13 Customer Loyalty Programmes
IFRIC 14 The Limit on a Defined Benefit Asset, Minimum Funding
F-156

7/21/2019 PreliminaryProspectus - Century
http://slidepdf.com/reader/full/preliminaryprospectus-century 390/648
PHILIPPINE FINANCIAL REPORTING STANDARDS AND INTERPRETATIONSEffective as of December 31, 2013
Adopted Not Adopted
Not Applicable
Requirements and their Interaction
Amendments to Philippine Interpretations IFRIC- 14,Prepayments of a Minimum Funding Requirement
IFRIC 16 Hedges of a Net Investment in a Foreign Operation
IFRIC 17 Distributions of Non-cash Assets to Owners
IFRIC 18 Transfers of Assets from Customers
IFRIC 19 Extinguishing Financial Liabilities with EquityInstruments
IFRIC 20 Stripping Costs in the Production Phase of a Surface Mine
IFRIC 21* Levies
SIC-7 Introduction of the Euro
SIC-10 Government Assistance - No Specific Relation to Operating
ActivitiesSIC-15 Operating Leases - Incentives
SIC-25 Income Taxes - Changes in the Tax Status of an Entity orits Shareholders
SIC-27 Evaluating the Substance of Transactions Involving theLegal Form of a Lease
SIC-29 Service Concession Arrangements : Disclosures.
SIC-31 Revenue - Barter Transactions Involving AdvertisingServices
SIC-32 Intangible Assets - Web Site Costs
PIC Q&ANo. 2006-01
Revenue Recognition for Sales of Property Units Under Pre- Completion Contracts
PIC Q&ANo. 2007-03
Valuation of Bank Real and Other Properties Acquired(ROPA)
PIC Q&ANo. 2008-02
Accounting for Government Loans with Low Interest Ratesunder the Amendments to PAS 20
PIC Q&ANo. 2010-02
Basis of Preparation of Financial Statements
PIC Q&ANo. 2010-03
Current/non-current Classification of a Callable TermLoan
PIC Q&A
No. 2011-02
Common Control Business Combinations
PIC Q&ANo. 2011-03
Accounting for Inter-company Loans
PIC Q&ANo. 2011-04
Costs of Public Offering of Shares
PIC Q&ANo. 2011-05
Fair Value or Revaluation as Deemed Cost
F-157

7/21/2019 PreliminaryProspectus - Century
http://slidepdf.com/reader/full/preliminaryprospectus-century 391/648
PHILIPPINE FINANCIAL REPORTING STANDARDS AND INTERPRETATIONSEffective as of December 31, 2013
Adopted Not Adopted
Not Applicable
PIC Q&ANo. 2011-06
Acquisition of Investment Properties – Asset Acquisition orBusiness Combination?
PIC Q&ANo. 2012-01
Application of the Pooling of Interests Method for BusinessCombinations of Entities under Common Control inConsolidated Financial Statements
PIC Q&ANo. 2012-02
Cost of a New Building Constructed on Site of a PreviousBuilding
*These are the new and revised accounting standards and interpretations that are effective after the reporting period ended
December 31, 2013. The company will adopt these standards and interpretations when these become effective.
F-158

7/21/2019 PreliminaryProspectus - Century
http://slidepdf.com/reader/full/preliminaryprospectus-century 392/648

7/21/2019 PreliminaryProspectus - Century
http://slidepdf.com/reader/full/preliminaryprospectus-century 393/648
F-160

7/21/2019 PreliminaryProspectus - Century
http://slidepdf.com/reader/full/preliminaryprospectus-century 394/648

7/21/2019 PreliminaryProspectus - Century
http://slidepdf.com/reader/full/preliminaryprospectus-century 395/648

7/21/2019 PreliminaryProspectus - Century
http://slidepdf.com/reader/full/preliminaryprospectus-century 396/648

7/21/2019 PreliminaryProspectus - Century
http://slidepdf.com/reader/full/preliminaryprospectus-century 397/648

7/21/2019 PreliminaryProspectus - Century
http://slidepdf.com/reader/full/preliminaryprospectus-century 398/648
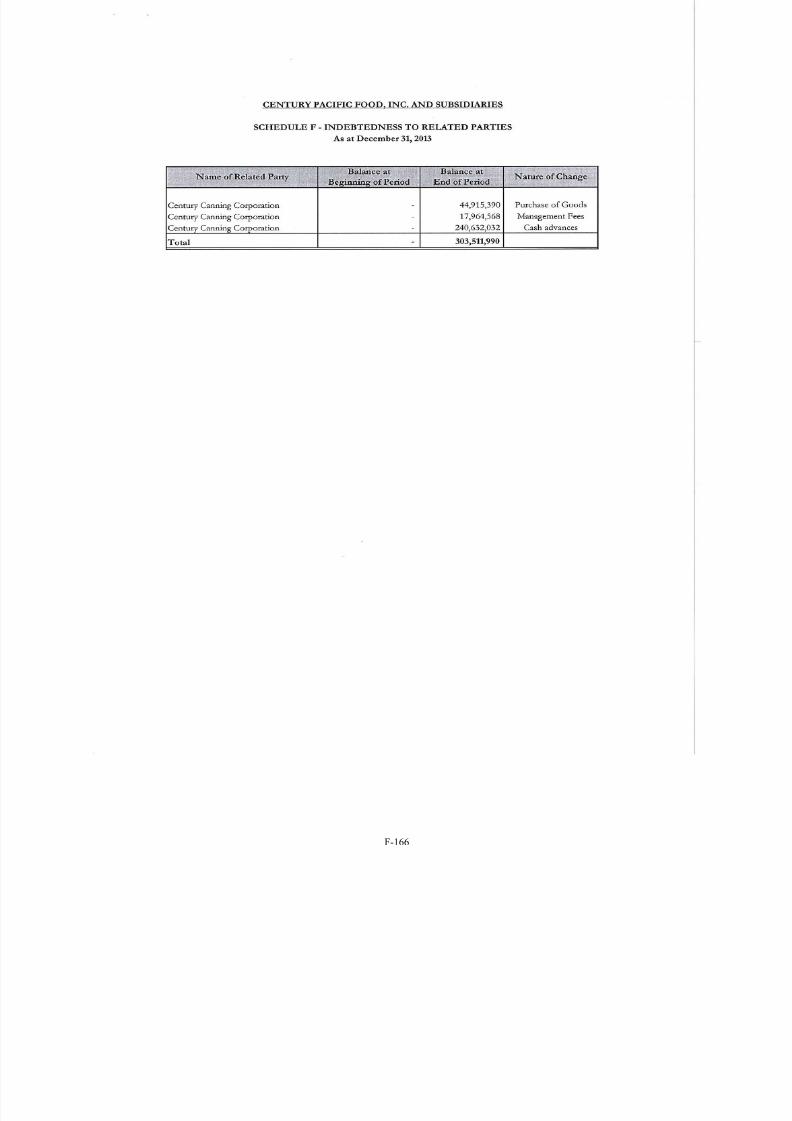
7/21/2019 PreliminaryProspectus - Century
http://slidepdf.com/reader/full/preliminaryprospectus-century 399/648

7/21/2019 PreliminaryProspectus - Century
http://slidepdf.com/reader/full/preliminaryprospectus-century 400/648

7/21/2019 PreliminaryProspectus - Century
http://slidepdf.com/reader/full/preliminaryprospectus-century 401/648

7/21/2019 PreliminaryProspectus - Century
http://slidepdf.com/reader/full/preliminaryprospectus-century 402/648
GENERAL TUNA CORPORATION AND SNOW MOUNTAIN DAIRY
CORPORATION(Wholly Owned Subsidiaries of Century Pacific
Food, Inc.)
Combined Financial StatementsDecember 31, 2013, 2012 and 2011
andPractitioner’s Compilation Report
Suite 505, Centerpoint Building, Julia Vargas St.Ortigas Center Pasig City, Metro Manila, Philippines
F-169

7/21/2019 PreliminaryProspectus - Century
http://slidepdf.com/reader/full/preliminaryprospectus-century 403/648
F-170

7/21/2019 PreliminaryProspectus - Century
http://slidepdf.com/reader/full/preliminaryprospectus-century 404/648
F-171

7/21/2019 PreliminaryProspectus - Century
http://slidepdf.com/reader/full/preliminaryprospectus-century 405/648
F-172

7/21/2019 PreliminaryProspectus - Century
http://slidepdf.com/reader/full/preliminaryprospectus-century 406/648
F-173

7/21/2019 PreliminaryProspectus - Century
http://slidepdf.com/reader/full/preliminaryprospectus-century 407/648
F-174

7/21/2019 PreliminaryProspectus - Century
http://slidepdf.com/reader/full/preliminaryprospectus-century 408/648
F-175

7/21/2019 PreliminaryProspectus - Century
http://slidepdf.com/reader/full/preliminaryprospectus-century 409/648
F-176

7/21/2019 PreliminaryProspectus - Century
http://slidepdf.com/reader/full/preliminaryprospectus-century 410/648
F-177

7/21/2019 PreliminaryProspectus - Century
http://slidepdf.com/reader/full/preliminaryprospectus-century 411/648
F-178

7/21/2019 PreliminaryProspectus - Century
http://slidepdf.com/reader/full/preliminaryprospectus-century 412/648
F-179

7/21/2019 PreliminaryProspectus - Century
http://slidepdf.com/reader/full/preliminaryprospectus-century 413/648
F-180
7/21/2019 PreliminaryProspectus - Century
http://slidepdf.com/reader/full/preliminaryprospectus-century 414/648
F-181

7/21/2019 PreliminaryProspectus - Century
http://slidepdf.com/reader/full/preliminaryprospectus-century 415/648
F-182

7/21/2019 PreliminaryProspectus - Century
http://slidepdf.com/reader/full/preliminaryprospectus-century 416/648
F-183

7/21/2019 PreliminaryProspectus - Century
http://slidepdf.com/reader/full/preliminaryprospectus-century 417/648
F-184

7/21/2019 PreliminaryProspectus - Century
http://slidepdf.com/reader/full/preliminaryprospectus-century 418/648
F-185

7/21/2019 PreliminaryProspectus - Century
http://slidepdf.com/reader/full/preliminaryprospectus-century 419/648
F-186

7/21/2019 PreliminaryProspectus - Century
http://slidepdf.com/reader/full/preliminaryprospectus-century 420/648
F-187

7/21/2019 PreliminaryProspectus - Century
http://slidepdf.com/reader/full/preliminaryprospectus-century 421/648
F-188

7/21/2019 PreliminaryProspectus - Century
http://slidepdf.com/reader/full/preliminaryprospectus-century 422/648
F-189

7/21/2019 PreliminaryProspectus - Century
http://slidepdf.com/reader/full/preliminaryprospectus-century 423/648
F-190

7/21/2019 PreliminaryProspectus - Century
http://slidepdf.com/reader/full/preliminaryprospectus-century 424/648
F-191

7/21/2019 PreliminaryProspectus - Century
http://slidepdf.com/reader/full/preliminaryprospectus-century 425/648
F-192

7/21/2019 PreliminaryProspectus - Century
http://slidepdf.com/reader/full/preliminaryprospectus-century 426/648
F-193

7/21/2019 PreliminaryProspectus - Century
http://slidepdf.com/reader/full/preliminaryprospectus-century 427/648
F-194

7/21/2019 PreliminaryProspectus - Century
http://slidepdf.com/reader/full/preliminaryprospectus-century 428/648
F-195

7/21/2019 PreliminaryProspectus - Century
http://slidepdf.com/reader/full/preliminaryprospectus-century 429/648
F-196

7/21/2019 PreliminaryProspectus - Century
http://slidepdf.com/reader/full/preliminaryprospectus-century 430/648
F-197

7/21/2019 PreliminaryProspectus - Century
http://slidepdf.com/reader/full/preliminaryprospectus-century 431/648
F-198

7/21/2019 PreliminaryProspectus - Century
http://slidepdf.com/reader/full/preliminaryprospectus-century 432/648
F-199

7/21/2019 PreliminaryProspectus - Century
http://slidepdf.com/reader/full/preliminaryprospectus-century 433/648
F-200

7/21/2019 PreliminaryProspectus - Century
http://slidepdf.com/reader/full/preliminaryprospectus-century 434/648
F-201

7/21/2019 PreliminaryProspectus - Century
http://slidepdf.com/reader/full/preliminaryprospectus-century 435/648
F-202

7/21/2019 PreliminaryProspectus - Century
http://slidepdf.com/reader/full/preliminaryprospectus-century 436/648
F-203

7/21/2019 PreliminaryProspectus - Century
http://slidepdf.com/reader/full/preliminaryprospectus-century 437/648
F-204

7/21/2019 PreliminaryProspectus - Century
http://slidepdf.com/reader/full/preliminaryprospectus-century 438/648
F-205

7/21/2019 PreliminaryProspectus - Century
http://slidepdf.com/reader/full/preliminaryprospectus-century 439/648
F-206

7/21/2019 PreliminaryProspectus - Century
http://slidepdf.com/reader/full/preliminaryprospectus-century 440/648
F-207

7/21/2019 PreliminaryProspectus - Century
http://slidepdf.com/reader/full/preliminaryprospectus-century 441/648
F-208

7/21/2019 PreliminaryProspectus - Century
http://slidepdf.com/reader/full/preliminaryprospectus-century 442/648
F-209

7/21/2019 PreliminaryProspectus - Century
http://slidepdf.com/reader/full/preliminaryprospectus-century 443/648
F-210

7/21/2019 PreliminaryProspectus - Century
http://slidepdf.com/reader/full/preliminaryprospectus-century 444/648
F-211

7/21/2019 PreliminaryProspectus - Century
http://slidepdf.com/reader/full/preliminaryprospectus-century 445/648
F-212

7/21/2019 PreliminaryProspectus - Century
http://slidepdf.com/reader/full/preliminaryprospectus-century 446/648
F-213

7/21/2019 PreliminaryProspectus - Century
http://slidepdf.com/reader/full/preliminaryprospectus-century 447/648
F-214

7/21/2019 PreliminaryProspectus - Century
http://slidepdf.com/reader/full/preliminaryprospectus-century 448/648F-215

7/21/2019 PreliminaryProspectus - Century
http://slidepdf.com/reader/full/preliminaryprospectus-century 449/648F-216

7/21/2019 PreliminaryProspectus - Century
http://slidepdf.com/reader/full/preliminaryprospectus-century 450/648

7/21/2019 PreliminaryProspectus - Century
http://slidepdf.com/reader/full/preliminaryprospectus-century 451/648

7/21/2019 PreliminaryProspectus - Century
http://slidepdf.com/reader/full/preliminaryprospectus-century 452/648

7/21/2019 PreliminaryProspectus - Century
http://slidepdf.com/reader/full/preliminaryprospectus-century 453/648
December 31, January 1,
2012 2012
December 31, (As Restated − (As Restated −
Notes 2013 see Note 2) see Note 2)
CURRENT ASSETS
Cash and cash equivalents 5 8,207,080$ 2,203,548$ 2,060,127$
Trade and other receivables - net 6 21,580,586 4,619,685 5,948,373
Inventories - net 7 29,210,571 44,845,549 38,674,777
Prepayments and other current assets 8 1,060,578 973,640 750,169
Total Current Assets 60,058,815 52,642,422 47,433,446
NON-CURRENT ASSETS
Property, plant and equipment - net 9 14,615,741 16,626,268 17,632,274Deferred tax assets - net 16 225,144 143,069 76,404
Post-employment benefit asset 15 - 10,434 2,664
Other non-current assets 10 348,490 665,352 692,415
Total Non-current Assets 15,189,375 17,445,123 18,403,757
TOTAL ASSETS 75,248,190$ 70,087,545$ 65,837,203$
CURRENT LIABILITIES
Interest-bearing loans 11 45,021,840$ 33,518,645$ 24,062,102$
Trade and other payables 12 8,212,842 10,868,961 9,372,685
Income tax payable 16,559 349,378 241,223
Dividends payable 19 - - 1,732,062
Due to related parties 17 5,238,586 4,085,368 10,006,670
Total Current Liabilities 58,489,827 48,822,352 45,414,742
NON-CURRENT LIABILITIES
Post-employment benefit obligation 15 13,479 - -
Interest-bearing loans 11 - 364,148 1,707,339
Total Non-current Liabilities 13,479 364,148 1,707,339
Total Liabilities 58,503,306 49,186,500 47,122,081
EQUITY Capital stock 19 11,333,722 11,333,722 11,333,722
Additional paid-in capital 3,296,386 3,296,386 3,296,386
Revaluation reserves 2 24,336 )( 18,613 13,532
Retained earnings 19 2,139,112 6,252,324 4,071,482
Total Equity 16,744,884 20,901,045 18,715,122
TOTAL LIABILITIES AND EQUITY 75,248,190$ 70,087,545$ 65,837,203$
STATEMENTS OF FINANCIAL POSITION
(A Wholly Owned Subsidiary of Century Pacific Food, Inc.)
GENERAL TUNA CORPORATION
See Notes to Financial Statements.
LIABILITIES AND EQUITY
A S S E T S
DECEMBER 31, 2013 AND 2012
(Amounts in United States Dollars)
(With Corresponding Figures as at January 1, 2012)
DRAFT 03-08-14
(FOR FINALIZATION)
F-220

7/21/2019 PreliminaryProspectus - Century
http://slidepdf.com/reader/full/preliminaryprospectus-century 454/648
2012(As Restated −
Notes 2013 see Note 2)
SALE OF GOODS 138,119,221$ 90,072,393$
COST OF GOODS SOLD 13, 17 132,466,117 83,175,582
GROSS PROFIT 5,653,104 6,896,811
OTHER OPERATING EXPENSES
(INCOME)
Administrative expenses 13 1,844,935 2,500,647Selling expenses 13 1,651,007 1,162,392
Other income 6, 17 706,550 )( 1,100,454 )(
Other expenses 13 75,075 48,306
2,864,467 2,610,891
OPERATING PROFIT 2,788,637 4,285,920
FINANCE COSTS 14 1,163,262 )( 1,298,160 )(
FINANCE INCOME 14 2,281,886 69,038
PROFIT BEFORE TAX 3,907,261 3,056,798
TAX EXPENSE 16 667,482 875,956
NET PROFIT 3,239,779 2,180,842
OTHER COMPREHENSIVE INCOME (LOSS)
Item that will not be reclassified
subsequently to profit or loss
Actuarial gain (loss) on post-employment benefits 10,251 )( 7,259
Tax expense (income) on remeasurements ofpost-employment benefit obligation 3,075 2,178 )(
7,176 )( 5,081
TOTAL COMPREHENSIVE INCOME 3,232,603$ 2,185,923$
See Notes to Financial Statements.
FOR THE YEARS ENDED DECEMBER 31, 2013 AND 2012
STATEMENTS OF COMPREHENSIVE INCOME
(A Wholly Owned Subsidiary of Century Pacific Food, Inc.)
GENERAL TUNA CORPORATION
(Amounts in United States Dollars)
DRAFT 03-08-14
(FOR FINALIZATION)
F-221

7/21/2019 PreliminaryProspectus - Century
http://slidepdf.com/reader/full/preliminaryprospectus-century 455/648

7/21/2019 PreliminaryProspectus - Century
http://slidepdf.com/reader/full/preliminaryprospectus-century 456/648
2012
(As Restated −
Notes 2013 see Note 2)
CASH FLOWS FROM OPERATING ACTIVITIES
Profit before tax 3,907,261$ 3,056,798$
Adjustments for:
Depreciation 9 2,837,514 2,729,259
Unrealized foreign currency loss (gain) 14 2,243,620 )( 371,426
Interest expense 14 1,069,892 816,041
Loss on sale and derecognition of property and equipment 9 72,921 -
Interest income 5 38,266 )( 67,561 )(
Operating profit before working capital changes 5,605,702 6,905,963
Decrease (increase) in trade and other receivables 16,907,952 )( 2,349,988
Decrease (increase) in inventories 15,634,978 6,170,772 )(Increase in prepayments and other current assets 679,299 )( 763,979 )(
Decrease (increase) in post-employment benefit asset 10,434 232 )(
Decrease in other non-current assets 322,695 30,556
Increase (decrease) in trade and other payables 2,026,068 )( 875,219
Increase in post-employment benefit obligation 13,479 -
Cash generated from operations 1,973,969 3,226,743
Income taxes paid 335,243 )( 262,994 )(
Net Cash From Operating Activities 1,638,726 2,963,749
CASH FLOWS USED IN INVESTING ACTIVITIES
Acquisitions of property, plant and equipment 9 2,726,974 )( 1,724,761 )(
Proceeds from sale of land 9 1,827,066 -
Interest received 38,266 67,561
Net Cash Used in Investing Activities 861,642 )( 1,657,200 )(
CASH FLOWS USED IN FINANCING ACTIVITIES
Proceeds from interest-bearing loans 127,040,117 26,946,980
Repayments of interest-bearing loans 114,550,370 )( 19,711,804 )(
Advances from related parties 17 12,669,366 16,616,604
Repayments of advances from related parties 17 11,516,148 )( 22,537,906 )(
Payment of cash dividends 19 7,388,764 )( 1,732,062 )(
Interest paid 1,058,939 )( 763,925 )(
Net Cash From (Used in) Financing Activities 5,195,262 1,182,113 )(
NET INCREASE IN CASH AND CASH EQUIVALENTS 5,972,346 124,436
Effect of Exchange Rate Changes on Cash and Cash Equivalents 31,186 18,985
CASH AND CASH EQUIVALENTS AT BEGINNING OF YEAR 2,203,548 2,060,127
CASH AND CASH EQUIVALENTS AT END OF YEAR 8,207,080$ 2,203,548$
FOR THE YEARS ENDED DECEMBER 31, 2013 AND 2012
STATEMENTS OF CASH FLOWS
(A Wholly Owned Subsidiary of Century Pacific Food, Inc.)
GENERAL TUNA CORPORATION
See Notes to Financial Statements.
(Amounts in United States Dollars)
DRAFT 03-08-14
(FOR FINALIZATION)
F-223
7/21/2019 PreliminaryProspectus - Century
http://slidepdf.com/reader/full/preliminaryprospectus-century 457/648
GENERAL TUNA CORPORATION(A Wholly Owned Subsidiary of Century Pacific Food, Inc.)
NOTES TO FINANCIAL STATEMENTSDECEMBER 31, 2013 AND 2012
(With Corresponding Figures as at January 1, 2012)(Amounts in United States Dollars)
1.
CORPORATE INFORMATION
1.1 Incorporation and Operations
General Tuna Corporation (the Company) was incorporated in the Philippines andregistered with the Securities and Exchange Commission (SEC) on March 10, 1997.It is engaged in manufacturing and exporting private label canned, pouched and frozentuna products.
The Company is a subsidiary of Century Canning Corporation (CCC) untilOctober 31, 2013 when CCC transferred for a consideration its 100% ownership interestin the Company to Century Pacific Food, Inc. (CPFI or the new parent company). Thistransfer of ownership is part of the corporate reorganization undertaken by the CenturyPacific Group (the Group) within which CCC is the parent company. CPFI is the newlyincorporated wholly owned subsidiary of CCC, which is now the Company’s ultimateparent company. It is incorporated and domiciled in the Philippines and will soon beoperating as a food manufacturing company in 2014. CCC is engaged in manufacturingand distribution of canned tuna products for the Philippine Market.
The Company’s registered office is located at 32 Arturo Drive, Bagumbayan, Taguig,Metro Manila and the Company’s processing plant is located at Brgy. Tambler, General
Santos City. The registered office of CPFI is located at Centerpoint Building, Julia VargasStreet, Ortigas Center, Pasig City.
1.2 Approval of Financial Statements
The financial statements of the Company for the year ended December 31, 2013(including the comparative financial statements for the year ended December 31, 2012 andthe corresponding figures as at January 1, 2012) were authorized for issue by theCompany’s Board of Directors (BOD) on March 7, 2014.
F-224
7/21/2019 PreliminaryProspectus - Century
http://slidepdf.com/reader/full/preliminaryprospectus-century 458/648
- 2 -
2. SUMMARY OF SIGNIFICANT ACCOUNTING POLICIES
The significant accounting policies that have been used in the preparation of thesefinancial statements are summarized below and in the succeeding pages. The policies havebeen consistently applied to all the years presented, unless otherwise stated.
2.1
Basis of Preparation of Financial Statements
(a) Statement of Compliance with Philippine Financial Reporting Standards
The financial statements of the Company have been prepared in accordance withPhilippine Financial Reporting Standards (PFRS). PFRS are adopted by the FinancialReporting Standards Council (FRSC) from the pronouncements issued by theInternational Accounting Standards Board (IASB).
The financial statements have been prepared using the measurement bases specified byPFRS for each type of asset, liability, income and expense. The measurement basesare more fully described in the accounting policies in the succeeding pages.
(b)
Presentation of Financial Statements
The financial statements are presented in accordance with Philippine AccountingStandard (PAS) 1, Presentation of Financial Statements . The Company presents all items ofincome and expense in a single statement of comprehensive income.
The Company presents a third statement of financial position as at the beginning ofthe preceding period when it applies an accounting policy retrospectively, or makes aretrospective restatement or reclassification of items that has a material effect on theinformation in the statement of financial position at the beginning of the precedingperiod. The related notes to the third statement of financial position are not
required to be disclosed.
The Company’s adoption of PAS 19 (Revised), Employee Benefits , resulted inretrospective restatements on certain accounts in the comparative financialstatements for December 31, 2012 and in the corresponding figures as at
January 1, 2012 [see Note 2.2(a)(ii)]. Accordingly, the Company presents a thirdstatement of financial position as of January 1, 2012 without the related notes, exceptfor the disclosures required under PAS 8, Accounting Polices, Changes in Accounting
Estimates and Errors .
(c) Functional and Presentation Currency
These financial statements are presented in United States (U.S.) dollars, the Company’sfunctional and presentation currency, and all values represent absolute amounts except when otherwise indicated.
Items included in the financial statements of the Company are measured using itsfunctional currency. Functional currency is the currency of the primary economicenvironment in which the Company operates.
F-225

7/21/2019 PreliminaryProspectus - Century
http://slidepdf.com/reader/full/preliminaryprospectus-century 459/648
- 3 -
2.2 Adoption of New and Amended PFRS
(a)
Effective in 2013 that are Relevant to the Company
In 2013, the Company adopted for the first time the following new PFRS, revisions,amendments and annual improvements thereto that are relevant to the Company and
effective for financial statements for the annual periods beginning on or after July 1, 2012 or January 1, 2013:
PAS 1 (Amendment) : Presentation of Financial Statements -Presentation of Items of OtherComprehensive Income
PAS 19 (Revised) : Employee BenefitsPFRS 7 (Amendment) : Financial Instruments: Disclosures –
Offsetting Financial Assets andFinancial Liabilities
PFRS 13 : Fair Value Measurement Annual Inprovements : Annual Improvements to PFRS
(2009 – 2011 Cycle)
Discussed below are the relevant information about these new, revised and amendedstandards.
(i) PAS 1 (Amendment), Financial Statements Presentation - Presentation of Items of OtherComprehensive Income (effective from July 1, 2012). The amendment requires anentity to group items presented in other comprehensive income into those that,in accordance with other PFRS: (a) will not be reclassified subsequently toprofit or loss, and, (b) will be reclassified subsequently to profit or loss whenspecific conditions are met. Management determined that the amendment didnot significantly affect the financial statements as its comprehensive income is
only comprised of actuarial gains and losses on retirement benefit obligation which are not reclassified to profit or loss.
(ii)
PAS 19 (Revised), Employee Benefits (effective from January 1, 2013). Therevision made a number of changes as part of the improvements throughoutthe standard. The main changes relate to defined benefit plans as follows:
•
eliminates the corridor approach under the existing guidance of PAS 19and requires an entity to recognize all actuarial gains and losses arising inthe reporting period;
• streamlines the presentation of changes in plan assets and liabilities
resulting in the disaggregation of changes into three main components ofservice costs, net interest on net defined benefit obligation or asset, andremeasurement; and,
• enhances disclosure requirements, including information about thecharacteristics of defined benefit plans and the risks that entities, throughparticipation in those plans are exposed to.
F-226

7/21/2019 PreliminaryProspectus - Century
http://slidepdf.com/reader/full/preliminaryprospectus-century 460/648
- 4 -
The Company’s adoption of PAS 19 (Revised) resulted in the retrospectiveadjustment of the post-employment benefit obligation to record the previouslyunrecognized net actuarial losses with the corresponding recognition of reservein equity for such net actuarial losses including those previously recognized inprofit or loss and accumulated in Retained Earnings.
The restatement of certain line items in the statements of financial position asat December 31, 2012 and the corresponding figures as at January 1, 2012 as aresult of the above adjustments are summarized below.
As Previously Prior PeriodNotes Reported Adjustment As Restated
December 31, 2012
Changes in assets:Post-employment
benefit asset 15.2 $ 15,652 ($ 5,218 ) $ 10,434Deferred tax assets - net 16 141,504 1,565 143,069
Net Effect on Assets ($ 3,653 )
Changes in equity:Revaluation reserves $ 35,773 ($ 17,160 ) $ 18,613Retained earnings 6,238,817 13,507 6,252,324
Net Effect on Equity ($ 3,653 )
January 1, 2012
Changes in assets:Post-employment
benefit asset $ 17,692 ($ 15,028 ) $ 2,664Deferred tax assets - net 71,896 4,508 76,404
Net Effect on Assets ($ 10,520 )
Changes in equity:Revaluation reserves $ 35,773 ($ 22,241 ) $ 13,532Retained earnings 4,059,761 ( 11,721 ) 4,071,482
Net Effect on Equity ($ 10,520 )
The adoption of PAS19 (Revised) did not have material impact on theCompany’s statement of comprehensive income and statement of cash flowsfor the year ended December 31, 2012.
F-227

7/21/2019 PreliminaryProspectus - Century
http://slidepdf.com/reader/full/preliminaryprospectus-century 461/648
- 5 -
(iii)
PFRS 7 (Amendment), Financial Instruments: Disclosures – Offsetting Financial Assetsand Financial Liabilities (effective from January 1, 2013). The amendmentrequires qualitative and quantitative disclosures relating to gross and netamounts of recognized financial instruments that are set-off in accordance withPAS 32, Financial Instruments: Presentation . The amendment also requiresdisclosure of information about recognized financial instruments which are
subject to enforceable master netting arrangements or similar agreements, evenif they are not set-off in the statement of financial position, including those
which do not meet some or all of the offsetting criteria under PAS 32 andamounts related to a financial collateral. These disclosures allow financialstatement users to evaluate the effect or potential effect of nettingarrangements, including rights of set-off associated with recognized financialassets and financial liabilities on the entity’s statement of financial position.
The adoption of this amendment did not result in any significant changes inthe Company’s disclosures on its financial statements as it has no masternetting arrangements; however, potential offsetting arrangements are disclosedin Note 21.3.
Other than the additional disclosures presented in Note 21.3, the application ofthis new standard had no significant impact on the amounts recognized in thefinancial statements.
(iv)
PFRS 13, Fair Value Measurement (effective from January 1, 2013). This newstandard clarifies the definition of fair value and provides guidance andenhanced disclosures about fair value measurements. The requirements underthis standard do not extend the use of fair value accounting but provideguidance on how it should be applied to both financial instrument items andnon-financial items for which other PFRS require or permit fair valuemeasurements or disclosures about fair value measurements, except in certaincircumstances. The amendment applies prospectively from annual period
beginning January 1, 2013, hence, disclosure requirements need not bepresented in the comparative information in the first year of application.Nevertheless, other than the additional disclosure presented in Note 21, theapplication of this new standards had no significant effect on the amountrecognized in the financial statements.
F-228
7/21/2019 PreliminaryProspectus - Century
http://slidepdf.com/reader/full/preliminaryprospectus-century 462/648
- 6 -
(v)
2009 - 2011 Annual Improvements to PFRS. Annual improvement to PFRS(2009-2011 Cycle) made minor amendments to a number of PFRS. Amongthose improvements, the following are relevant to the Company:
(a)
PAS 1 (Amendment), Presentation of Financial Statements - Clarification of theRequirements for Comparative Information . The amendment clarifies that a
statement of financial position as at the beginning of the preceding period(third statement of financial position) is required when an entity applies anaccounting policy retrospectively, or makes a retrospective restatement orreclassification of items that has a material effect on the information in thethird statement of financial position. The amendment specifies that otherthan disclosure of certain specified information in accordance with PAS 8related notes to the third statement of financial position are not requiredto be presented.
Consequent to the Company’s adoption of PAS 19 (Revised) in thecurrent year which resulted in retrospective restatement of the prior years’financial statements, the Company has presented a third statement of
financial position as at January 1, 2012 without the related notes, exceptfor the disclosure requirements of PAS 8.
(b) PAS 16 (Amendment), Property, Plant and Equipment - Classification of Servicing Equipment . The amendment addresses a perceived inconsistency in theclassification requirements for servicing equipment which resulted inclassifying servicing equipment as part of inventory when it is used formore than one period. It clarifies that items such as spare parts, stand-byequipment and servicing equipment shall be recognized as property, plantand equipment when they meet the definition of property, plant andequipment, otherwise, these are classified as inventory. This amendmenthad no impact on the Company’s financial statements since it has been
recognizing those servicing equipment in accordance with the recognitioncriteria under PAS 16.
(c)
PAS 32 (Amendment), Financial Instruments – Presentation – Tax Effect ofDistributions to Holders of Equity Instruments . The amendment clarifies thatthe consequences of income tax relating to distributions to holders of anequity instrument and to transaction costs of an equity transaction shall beaccounted for in accordance with PAS 12. Accordingly, income taxrelating to distributions to holders of an equity instrument is recognized inprofit or loss while income tax related to the transaction costs of an equitytransaction is recognized in equity. This amendment had no effect on theCompany’s financial statements as it has been recognizing the effect of
distributions to holders of equity instruments and transaction costs of anequity transaction in accordance with PAS 12.
F-229

7/21/2019 PreliminaryProspectus - Century
http://slidepdf.com/reader/full/preliminaryprospectus-century 463/648
- 7 -
(b)
Effective in 2013 that are not Relevant to the Company
The following amendments became effective for annual periods beginning on or after January 1, 2013 but are not relevant to the Company’s financial statements:
PPRS 1 (Amendment) : First-time Adoption of PFRS –
Government LoansPFRS 10 : Consolidated Financial Statements
PFRS 11 : Joint ArrangementsPFRS 12 : Disclosure of Interests in Other EntitiesPAS 27 (Revised) : Separate Financial StatementsPAS 28 (Revised) : Investments in Associate and Joint VenturePFRS 10, PFRS 11 and
PFRS 12 (Amendment) : Amendments to PFRS 10, 11 and 12 - Transition Guidance toPFRS 10, 11 and 12
Annual ImprovementsPAS 34 (Amendment) : Interim Financial Reporting – Interim
Financial Reporting and SegmentInformation for Total Assets andLiabilities
PPRS 1 (Amendment) : First-time Adoption of PFRS – Repeated Application of PFRS 1 and BorrowingCost
Philippine InterpretationInternational FinancialReporting InterpretationCommittee 20 : Stripping Costs in the Production Phase
of a Surface Mine
(c)
Effective Subsequent to 2013 but not Adopted Early
There are new PFRS, amendments, annual improvements and interpretations toexisting standards that are effective for periods subsequent to 2013. Management hasinitially determined the following pronouncements, which the Company will apply inaccordance with their transitional provisions, to be relevant to its financial statements:
(i)
PAS 19 (Amendment), Employee Benefits - Defined Benefit Plans - EmployeeContributions (effective from January 1, 2014). The amendment clarifies that ifthe amount of the contributions from employees or third parties is dependent onthe number of years of service, an entity shall attribute the contributions toperiods of service using the same attribution method (i.e., either using the plan’s
contribution formula or on a straight-line basis) for the gross benefit.Management has initially determined that this amendment will have no impacton the Company’s financial statements since there are no plans of futurecontribution from third parties.
F-230

7/21/2019 PreliminaryProspectus - Century
http://slidepdf.com/reader/full/preliminaryprospectus-century 464/648
- 8 -
(ii)
PAS 32 (Amendment), Financial Instruments: Presentation - Offsetting Financial Assetsand Financial Liabilities (effective from January 1, 2014). The amendmentprovides guidance to address inconsistencies in applying the criteria foroffsetting financial assets and financial liabilities. It clarifies that a right of set-offis required to be legally enforceable, in the normal course of business; in theevent of default; and in the event of insolvency or bankruptcy of the entity and
all of the counterparties. The amendment also clarifies the principle behind netsettlement and provided characteristics of a gross settlement system that wouldsatisfy the criterion for net settlement. The Company does not expect thisamendment to have a significant impact on its financial statements.
(iii)
PAS 36 (Amendment), Impairment of Assets - Recoverable Amount Disclosures for Non- financial Assets (effective from January 1, 2014). The amendment clarifies thatthe requirements for the disclosure of information about the recoverable amountof assets or cash-generating units is limited only to the recoverable amount ofimpaired assets that is based on fair value less cost of disposal. It alsointroduces an explicit requirement to disclose the discount rate used indetermining impairment (or reversals) where recoverable amount based on fair
value less cost of disposal is determined using a present value technique.Management will reflect in its subsequent years’ financial statements the changesarising from this relief on disclosure requirements.
(iv)
PAS 39 (Amendment), Financial Instruments: Recognition and Measurement – Novationof Derivatives and Continuation of Hedge Accounting (effective January 1, 2014). Theamendment provides some relief from the requirements on hedge accounting byallowing entities to continue the use of hedge accounting when a derivative isnovated to a clearing counterparty resulting in termination or expiration of theoriginal hedging instrument as a consequence of laws and regulations, or theintroduction thereof. As the Company neither enters into transactions involvingderivative instruments nor it applies hedge accounting, the amendment will not
have any impact on the financial statements.
(v)
PFRS 9, Financial Instruments: Classification and Measurement (effective from January 1, 2015). This is the first part of a new standard on financial instrumentsthat will replace PAS 39, Financial Instruments: Recognition and Measurement , in itsentirety. The first phase of the standard was issued on November 2009 andOctober 2010 and contains new requirements and guidance for the classification,measurement and recognition of financial assets and financial liabilities. Itrequires financial assets to be classified into two measurement categories:amortized cost or fair value. Debt instruments that are held within a businessmodel whose objective is to collect the contractual cash flows that representsolely payments of principal and interest on the principal outstanding are
generally measured at amortized cost. All other debt instruments and equityinstruments are measured at fair value. In addition, PFRS 9 allows entities tomake an irrevocable election to present subsequent changes in the fair value ofan equity instrument that is not held for trading in other comprehensive income.
The accounting for embedded derivatives in host contracts that are financialassets is simplified by removing the requirement to consider whether or not theyare closely related, and, in most arrangement, does not require separation fromthe host contract.
F-231

7/21/2019 PreliminaryProspectus - Century
http://slidepdf.com/reader/full/preliminaryprospectus-century 465/648
- 9 -
For liabilities, the standard retains most of the PAS 39 requirements whichinclude amortized cost accounting for most financial liabilities, with bifurcationof embedded derivatives. The main change is that, in case where the fair valueoption is taken for financial liabilities, the part of a fair value change due to theliability’s credit risk is recognized in other comprehensive income rather than inprofit or loss, unless this creates an accounting mismatch.
In November 2013, the IASB has published amendments to InternationalFinancial Reporting Standard (IFRS) 9 that contain new chapter and model onhedge accounting that provides significant improvements principally by aligninghedge accounting more closely with the risk management activities undertakenby entities when hedging their financial and non-financial risk exposures. Theamendment also now requires changes in the fair value of an entity’s own debtinstruments caused by changes in its own credit quality to be recognized in othercomprehensive income rather in profit or loss. It also includes the removal ofthe January 1, 2015 mandatory effective date of IFRS 9.
To date, the remaining chapter of IFRS 9 and PFRS 9 dealing with impairment
methodology is still being completed. Further, the IASB is currently discussingsome limited modifications to address certain application issues regardingclassification of financial assets and to provide other considerations indetermining business model.
The Company does not expect to implement and adopt PFRS 9 until its effectivedate. In addition, management is currently assessing the impact of PFRS 9 on thefinancial statements of the Company and it plans to conduct a comprehensivestudy of the potential impact of this standard prior to its mandatory adoptiondate to assess the impact of all changes.
(vi)
Annual Improvements to PFRS. Annual improvements to PFRS (2010-2012
Cycle) and PFRS (2011-2013 Cycle) made minor amendments to a number ofPFRS, which are effective for annual period beginning on or after July 1, 2014. Among those improvements, the following amendments are relevant to theCompany but management does not expect a material impact on the Company’sfinancial statements:
Annual Improvements to PFRS (2010-2012 Cycle)
(a)
PAS 16 (Amendment), Property, Plant and Equipment – Classification ofServicing Equipment . The amendment addresses a perceived inconsistencyin the classification requirements for servicing equipment which resultedin classifying servicing equipment as part of inventory when it is used for
more than one period. It clarifies that items such as spare parts, stand-byequipment and servicing equipment shall be recognized as property, plantand equipment when they meet the definition of property, plant andequipment, otherwise, these are classified as inventory. This amendmenthad no impact on the Company’s financial statements since it has beenrecognizing those servicing equipment in accordance with the recognitioncriteria under PAS 16.
F-232

7/21/2019 PreliminaryProspectus - Century
http://slidepdf.com/reader/full/preliminaryprospectus-century 466/648
- 10 -
(b)
PAS 24 (Amendment), Related Party Disclosures. The amendment clarifiesthe entity providing key management services to a reporting entity isdeemed to be a related party of the latter. It also requires and clarifies thatthe amounts incurred by the reporting entity for key managementpersonnel services that are provided by a separate management entityshould be disclosed in the financial statements, and not the amounts of
compensation paid or payable by the key management entity to itsemployees or directors.
(c)
PFRS 13 (Amendment), Fair Value Measurement . The amendment, througha revision only in the basis of conclusion of PFRS 13, clarifies that issuingPFRS 13 and amending certain provisions of PFRS 9 and PAS 39 relatedto discounting of financial instruments, did not remove the ability tomeasure short-term receivables and payables with no stated interest rateon an undiscounted basis, when the effect of not discounting isimmaterial.
Annual Improvements to PFRS (2011-2013 Cycle)
PFRS 13 (Amendment), Fair Value Measurement. The amendment clarifies that thescope of the exception for measuring the fair value of a group of financial assetsand financial liabilities on a net basis (the portfolio exception) applies to allcontracts within the scope of, and accounted for in accordance with PAS 39 orPFRS 9, regardless of whether they meet the definitions of financial assets orfinancial liabilities as defined in PAS 32.
2.3 Financial Assets
Financial assets are recognized when the Company becomes a party to the contractualterms of the financial instrument. Financial assets other than those designated and
effective as hedging instruments are classified into the following categories: financialassets at fair value through profit or loss (FVTPL), loans and receivables, held-to-maturityinvestments and available-for-sale (AFS) financial assets. Financial assets are assigned tothe different categories by management on initial recognition, depending on the purposefor which the investments were acquired.
Regular purchases and sales of financial assets are recognized on their trade date. Allfinancial assets that are not classified as at FVTPL are initially recognized at fair value plusany directly attributable transaction costs.
The Company’s financial assets are generally categorized as loans and receivables and arepresented as Cash and Cash Equivalents and Trade and Other Receivables in the
statement of financial position. Cash and cash equivalents are defined as cash on hand,demand deposits and short-term, highly liquid investments readily convertible to knownamounts of cash and which are subject to insignificant risk of changes in value.
Loans and receivables are non-derivative financial assets with fixed or determinablepayments that are not quoted in an active market. They arise when the Company providesmoney, goods or services directly to a debtor with no intention of trading the receivables.
They are included in current assets, except for maturities greater than 12 months after theend of the reporting period which are classified as non-current assets.
F-233

7/21/2019 PreliminaryProspectus - Century
http://slidepdf.com/reader/full/preliminaryprospectus-century 467/648
- 11 -
Loans and receivables are subsequently measured at amortized cost using the effectiveinterest method, less impairment losses, if any. Impairment loss is provided when there isobjective evidence that the Company will not be able to collect all amounts due to it inaccordance with the original terms of the receivables. The amount of the impairment lossis determined as the difference between the assets’ carrying amount and the present valueof estimated future cash flows (excluding future credit losses that have not been incurred),
discounted at the financial asset’s original effective interest rate or current effective interestrate determined under the contract if the loan has a variable interest rate.
All income and expenses, excluding impairment losses and foreign currency exchangelosses or gains and other gains or losses that relate to operating activities, relating tofinancial assets that are recognized in profit or loss are presented as part of Finance Costsor Finance Income in the statement of comprehensive income.
Non-compounding interest and other cash flows resulting from holding financial assetsare recognized in profit or loss when earned, regardless of how the related carryingamount of financial assets is measured.
The financial assets are derecognized when the contractual rights to receive cash flowsfrom the financial instruments expire and substantially all of the risks and rewards ofownership have been transferred to another party.
2.4 Inventories
Inventories are valued at the lower of cost and net realizable value. Cost is determinedusing the weighted-average method. Finished goods and work-in-process include the costof raw materials, direct labor and a proportion of manufacturing overheads based onnormal operating capacity. The cost of raw materials include all costs directly attributableto acquisition, such as the purchase price, import duties and other taxes that are notsubsequently recoverable from taxing authorities.
Net realizable value is the estimated selling price in the ordinary course of business, lessthe estimated costs of completion and the estimated costs necessary to make the sale. Netrealizable value of raw materials is the current replacement cost.
2.5 Property, Plant and Equipment
Property, plant and equipment, except land which is stated at fair value, are stated at costless accumulated depreciation, and any impairment in value.
The cost of an asset comprises its purchase price and directly attributable costs of bringingthe asset to working condition for its intended use. Expenditures for additions, major
improvements and renewals are capitalized; expenditures for repairs and maintenance arecharged to expense as incurred.
Following initial recognition of at cost, land is carried at revalued amounts which are thefair values at the date of the revaluation, as determined by independent appraisers, less andany accumulated impairment losses.
Revalued amounts are fair market values determined based on appraisals by externalprofessional valuer once every two years or more frequently if market factors indicate amaterial change in fair value.
F-234

7/21/2019 PreliminaryProspectus - Century
http://slidepdf.com/reader/full/preliminaryprospectus-century 468/648
- 12 -
Any revaluation surplus is recognized in other comprehensive income and credited to theRevaluation Reserves account in the statement of changes in equity. Any revaluationdeficit directly offsetting a previous surplus in the same asset is charged to othercomprehensive income to the extent of any revaluation surplus in equity relating to thisasset and the remaining deficit, if any, is recognized in profit or loss. Upon disposal ofland, amounts included in Revaluation Reserves relating to them are transferred to
Retained Earnings.
Depreciation is computed on the straight-line basis over the estimated useful lives of theassets as follows:
Buildings 15 yearsMachinery and equipment 10 yearsLand improvements 10 years
Transportation and delivery equipment 5 years
Fully depreciated assets are retained in the accounts until these are no longer in use. Nofurther charge for depreciation is made in respect of those accounts.
Construction-in-progress represents properties under construction and is stated at cost. This includes cost of construction, applicable borrowing cost (see Note 2.15) and otherdirect costs. The account is not depreciated until such time that the assets are completedand available for use.
An asset’s carrying amount is written down immediately to its recoverable amount if theasset’s carrying amount is greater than its estimated recoverable amount (see Note 2.13).
The residual values and estimated useful lives of property, plant and equipment arereviewed, and adjusted if appropriate, at the end of each reporting period.
An item of property, plant and equipment, including the related accumulated depreciationand impairment losses, is derecognized upon disposal or when no future economicbenefits are expected to arise from the continued use of the asset. Any gain or loss arisingon derecognition of the asset (calculated as the difference between the net disposalproceeds and the carrying amount of the item) is included in profit or loss in the year theitem is derecognized.
2.6 Prepayments and Other Assets
Prepayments and other current assets pertain to other resources controlled by theCompany as a result of past events. They are recognized in the financial statements whenit is probable that the future economic benefits will flow to the entity and the asset has a
cost or value that can be measured reliably.
Other recognized assets of similar nature, where future economic benefits are expectedto flow to the Company beyond one year after the end of the reporting period or in thenormal operating cycle of the business, if longer, are classified as non-current assets.
F-235

7/21/2019 PreliminaryProspectus - Century
http://slidepdf.com/reader/full/preliminaryprospectus-century 469/648
- 13 -
2.7 Financial Liabilities
Financial liabilities, which include interest-bearing loans, trade and other payables(except tax related payables), due to related parties and dividends payable, are recognized
when the Company becomes a party to the contractual terms of the instrument. Allinterest-related charges incurred on financial liability that relate to financing activities and
are not capitalized are recognized as an expense in profit or loss under the caption FinanceCosts in the statement of comprehensive income.
Interest-bearing loans are raised for support of short-term or long-term funding ofoperations. Finance charges, including premiums payable on settlement or redemptionand direct issue costs, are charged to profit or loss on an accrual basis using the effectiveinterest method and are added to the carrying amount of the instrument to the extent thatthese are not settled in the period in which they arise.
Trade and other payables, due to related parties and dividends payable are recognizedinitially at their fair values and subsequently measured at amortized cost, using effectiveinterest method for maturities beyond one year, less settlement payments.
Dividends payable to shareholders are recognized as financial liabilities upon declarationby the Company.
Financial liabilities are classified as current liabilities if payment is due to be settled withinone year or less after the end of the reporting period (or in the normal operating cycle ofthe business, if longer), or the Company does not have an unconditional right to defersettlement of the liability for at least 12 months after the end of the reporting period.Otherwise, these are presented as non-current liabilities.
Financial liabilities are derecognized from the statement of financial position only whenthe obligations are extinguished either through discharge, cancellation or expiration. The
difference between the carrying amount of the financial liability derecognized and theconsideration paid or payable is recognized in profit or loss.
2.8 Offsetting Financial Instruments
Financial assets and liabilities are offset and the resulting net amount is reported in thestatement of financial position when there is a legally enforceable right to set-off therecognized amounts and there is an intention to settle on a net basis, or realize the assetand settle the liability simultaneously.
2.9 Provisions and Contingencies
Provisions are recognized when present obligations will probably lead to an outflow ofeconomic resources and they can be estimated reliably even if the timing or amount of theoutflow may still be uncertain. A present obligation arises from the presence of a legal orconstructive obligation that has resulted from past events.
F-236

7/21/2019 PreliminaryProspectus - Century
http://slidepdf.com/reader/full/preliminaryprospectus-century 470/648
- 14 -
Provisions are measured at the estimated expenditure required to settle the presentobligation, based on the most reliable evidence available at the end of the reporting period,including the risks and uncertainties associated with the present obligation. Where thereare a number of similar obligations, the likelihood that an outflow will be required insettlement is determined by considering the class of obligations as a whole. When time
value of money is material, long-term provisions are discounted to their present values
using a pretax rate that reflects market assessments and the risks specific to the obligation. The increase in provision due to passage of time is recognized as interest expense.Provisions are reviewed at the end of each reporting period and adjusted to reflect thecurrent best estimate.
In those cases where the possible outflow of economic resource as a result of presentobligations is considered improbable or remote, or the amount to be provided for cannotbe measured reliably, no liability is recognized in the financial statements. Similarly,possible inflows of economic benefits to the Company that do not yet meet therecognition criteria of an asset are considered contingent assets, hence, are not recognizedin the financial statements. On the other hand, any reimbursement that the Company canbe virtually certain to collect from a third party with respect to the obligation is recognized
as a separate asset not exceeding the amount of the related provision.
2.10 Revenue and Expense Recognition
Revenue comprises revenue from the sale of goods measured by reference to the fair valueof consideration received or receivable by the Company for goods supplied, excluding
value-added tax (VAT) and trade discounts.
Revenue is recognized to the extent that the revenue can be reliably measured; it isprobable that the economic benefits will flow to the Company; and the costs incurred orto be incurred can be measured reliably. The following specific recognition criteria mustalso be met before revenue is recognized:
(a) Sale of goods – Revenue is recognized when the risks and rewards of ownership of thegoods have passed to the buyer. This is generally when the customer has takenundisputed delivery of goods.
(b) Interest income – Revenue is recognized as the interest accrues taking into account theeffective yield on the asset.
Costs and expenses are recognized in the statement of comprehensive income uponreceipt of goods and/or utilization of service or at the date they are incurred. Financecosts are reported on an accrual basis, except capitalized borrowing costs which areincluded as part of the cost of the related qualifying assets (see Notes 2.5 and 2.15).
F-237

7/21/2019 PreliminaryProspectus - Century
http://slidepdf.com/reader/full/preliminaryprospectus-century 471/648
- 15 -
2.11 Leases
The Company accounts for its leases as follows:
(a)
Company as Lessee
Leases which do not transfer to the Company substantially all the risks and benefitsof ownership of the asset are classified as operating leases. Operating lease payments(net of any incentive received from the lessor) are recognized as expense in profit orloss on a straight-line basis over the lease term. Associated costs, such as repairs andmaintenance and insurance, are expensed as incurred.
(b)
Company as Lessor
Leases which do not transfer to the lessee substantially all the risks and benefits ofownership of the assets are classified as operating leases. Lease income from operatingleases is recognized in profit or loss on a straight-line basis over the lease term.
The Company determines whether an arrangement is, or contains, a lease based on thesubstance of the arrangement. It makes an assessment of whether the fulfillment of thearrangement is dependent on the use of a specific asset or assets and the arrangementconveys a right to use the asset.
2.12 Foreign Currency Transactions and Translation
The accounting records of the Company are maintained in U.S. dollars. Foreign currencytransactions during the year are translated into the functional currency at exchange rates
which approximate those prevailing on transaction dates.
Foreign exchange gains and losses resulting from the settlement of such transactions and
from the translation at year-end exchange rates of monetary assets and liabilitiesdenominated in foreign currencies that arise from financing activities are presented as partof Finance Costs in the statement of comprehensive income.
2.13 Impairment of Non-financial Assets
The Company’s property, plant and equipment and other non-financial assets are testedfor impairment whenever events or changes in circumstances indicate that the carryingamount may not be recoverable.
For purposes of assessing impairment, assets are grouped at the lowest levels for whichthere are separately identifiable cash flows (cash-generating units). As a result, some assets
are tested individually for impairment and some are tested at cash-generating unit level.
Impairment loss is recognized for the amount by which the asset’s or cash-generatingunit’s carrying amount exceeds its recoverable amounts which is the higher of its fair valueless costs to sell and its value-in-use. In determining value-in-use, management estimatesthe expected future cash flows from each cash-generating unit and determines the suitableinterest rate in order to calculate the present value of those cash flows.
All assets are subsequently reassessed for indications that an impairment loss previouslyrecognized may no longer exist. An impairment loss is reversed if the asset’s or cashgenerating unit’s recoverable amount exceeds its carrying amount.
F-238

7/21/2019 PreliminaryProspectus - Century
http://slidepdf.com/reader/full/preliminaryprospectus-century 472/648
- 16 -
2.14 Employee Benefits
The Company provides post-employment benefits to employees through a defined benefitplan, as well as a defined contribution plan.
(a) Defined Benefits Plan
A defined benefit plan is a post-employment plan that defines an amount ofpost-employment benefit that an employee will receive on retirement, usuallydependent on one or more factors such as age, years of service and salary. The legalobligation for any benefits from this kind of post-employment plan remains with theCompany, even if plan assets for funding the defined benefit plan have beenacquired. Plan assets may include assets specifically designated to a long-termbenefit fund, as well as qualifying insurance policies. The Company’spost-employment defined benefit pension plan covers all regular full-time employees.
The liability recognized in the statement of financial position for a defined benefitplan is the present value of the defined benefit obligation at the end of the reporting
period less the fair value of plan assets. The defined benefit obligation is calculatedannually by independent actuaries using the projected unit credit method. Thepresent value of the defined benefit obligation is determined by discounting theestimated future cash outflows using a discount rate derived from the interest ratesof a zero coupon government bonds as published by Philippine Dealing andExchange Corporation, that are denominated in the currency in which the benefits
will be paid and that have terms to maturity approximating to the terms of therelated post-employment liability.
Remeasurements, comprising of actuarial gains and losses arising from experienceadjustments and changes in actuarial assumptions and the return on plan assets(excluding amount included in net interest) are reflected immediately in the
statement of financial position with a charge or credit recognized in othercomprehensive income in the period in which they arise. Net interest is calculatedby applying the discount rate at the beginning of the period, taking account of anychanges in the net defined benefit liability or asset during the period as a result ofcontributions and benefit payments. Net interest is reported as part of FinanceCosts or Finance Income account in the statement of profit or loss.
Past-service costs are recognized immediately in profit or loss in the period of a planamendment.
(b) Defined Contribution Plan
A defined contribution plan is a post-employment plan under which the Companypays fixed contributions into an independent entity. The Company has no legal orconstructive obligations to pay further contributions after payment of the fixedcontribution. The contributions recognized in respect of defined contribution plansare expensed as they fall due. Liabilities and assets may be recognized if underpaymentor prepayment has occurred and are included in current liabilities or current assets asthey are normally of a short-term nature.
F-239

7/21/2019 PreliminaryProspectus - Century
http://slidepdf.com/reader/full/preliminaryprospectus-century 473/648
- 17 -
(c)
Termination Benefits
Termination benefits are payable when employment is terminated by the Companybefore the normal retirement date, or whenever an employee accepts voluntaryredundancy in exchange for these benefits. The Company recognizes terminationbenefits at the earlier of when it can no longer withdraw the offer of such benefits and
when it recognizes costs for a restructuring that is within the scope of PAS 37,Provision, Contingent Liabilities and Contingent Assets , and involves the payment oftermination benefits. In the case of an offer made to encourage voluntary redundancy,the termination benefits are measured based on the number of employees expected toaccept the offer. Benefits falling due more than 12 months after the reporting periodare discounted to their present value.
(d) Compensated Absences
Compensated absences are recognized for the number of paid leave days(including holiday entitlement) remaining at the end of the reporting period. Theyare included in the Trade and Other Payables account at the undiscounted amount
that the Company expects to pay as a result of the unused entitlement.
2.15 Borrowing Costs
Borrowing costs are recognized as expenses in the period in which they are incurred,except to the extent that they are capitalized. Borrowing costs that are directly attributableto the acquisition, construction or production of a qualifying asset (i.e., an asset that takes asubstantial period of time to get ready for its intended use or sale) are capitalized as part ofcost of such asset. The capitalization of borrowing costs commences when expendituresfor the asset and borrowing costs are being incurred and activities that are necessary toprepare the asset for its intended use or sale are in progress. Capitalization ceases whensubstantially all such activities are complete.
Investment income earned on the temporary investment of specific borrowings pendingtheir expenditure on qualifying assets is deducted from the borrowing costs eligible forcapitalization.
2.16 Income Taxes
Tax expense recognized in profit or loss comprises the sum of deferred tax and current taxnot recognized in other comprehensive income or directly in equity, if any.
Current tax assets or liabilities comprise those claims from, or obligations to, fiscalauthorities relating to the current or prior reporting period, that are uncollected or unpaid
at the end of the reporting period. They are calculated according to the tax rates and taxlaws applicable to the fiscal periods to which they relate, based on the taxable profit forthe year. All changes to current tax assets or liabilities are recognized as a component oftax expense in profit or loss.
F-240

7/21/2019 PreliminaryProspectus - Century
http://slidepdf.com/reader/full/preliminaryprospectus-century 474/648
- 18 -
Deferred tax is accounted for using the liability method, on temporary differences at theend of the reporting period between the tax base of assets and liabilities and their carryingamounts for financial reporting purposes. Under the liability method, with certainexceptions, deferred tax liabilities are recognized for all taxable temporary differences anddeferred tax assets are recognized for all deductible temporary differences and thecarryforward of unused tax losses and unused tax credits to the extent that it is probable
that taxable profit will be available against which the deductible temporary differences canbe utilized. Unrecognized deferred tax assets are reassessed at the end of each reportingperiod and are recognized to the extent that it has become probable that future taxableprofit will be available to allow such deferred tax assets to be recovered.
Deferred tax assets and liabilities are measured at the tax rates that are expected to applyin the period when the asset is realized or the liability is settled provided such tax rateshave been enacted or substantively enacted at the end of the reporting period.
The carrying amount of deferred tax assets is reviewed at the end of each reporting periodand reduced to the extent that it is probable that sufficient taxable profit will be availableto allow all or part of the deferred tax asset to be utilized.
The measurement of deferred tax liabilities and assets reflects the tax consequences that would follow from the manner in which the Company expects, at the end of the reportingperiod, to recover or settle the carrying amount of its assets and liabilities. For purposesof measuring deferred tax liabilities and deferred tax assets for investment properties thatare measured using the fair value model, the carrying amounts of such properties arepresumed to be recovered entirely through sale, unless the presumption is rebutted, that is,
when the investment property is depreciable and is held within the business model whoseobjective is to consume substantially all of the economic benefits embodied in theinvestment property over time, rather than through sale.
Most changes in deferred tax assets or liabilities are recognized as a component of tax
expense in profit or loss, except to the extent that it relates to items recognized in othercomprehensive income or directly in equity. In this case, the tax is also recognized inother comprehensive income or directly in equity, respectively.
The Company establishes liabilities for probable and estimable assessments by Bureau ofInternal Revenue (BIR) resulting from any known tax exposures. Estimates represent areasonable provision for taxes ultimately expected to be paid and may need to be adjustedover time as more information becomes available.
Deferred tax assets liabilities are offset if the Company has a legally enforceable right to setoff current tax assets against current tax liabilities and the deferred taxes relate to the sameentity and the same taxation authority.
F-241

7/21/2019 PreliminaryProspectus - Century
http://slidepdf.com/reader/full/preliminaryprospectus-century 475/648
- 19 -
2.17 Related Party Relationships and Transactions
Related party transactions are transfers of resources, services or obligations between theCompany and its related parties, regardless whether a price is charged.
Parties are considered to be related if one party has the ability to control the other party or
exercise significant influence over the other party in making financial and operatingdecisions. These parties include: (a) individuals owning, directly or indirectly through oneor more intermediaries, control or are controlled by, or under common control with theCompany; (b) associates; (c) individuals owning, directly or indirectly, an interest in the
voting power of the Company that gives them significant influence over the Company andclose members of the family of any such individual; and, (d) the Company’s retirementplan.
In considering each possible related party relationship, attention is directed to thesubstance of the relationship and not merely on the legal form.
2.18 Equity
Capital stock represents the nominal value of shares that have been issued.
Additional paid-in capital includes any premium received on the issuance of capitalstock. Any transaction costs associated with the issuance of shares are deducted fromadditional paid-in capital, net of any related income tax benefits.
Revaluation reserves comprise gains and losses due to the revaluation of land andremeasurements of post-employment defined benefit obligation or asset, specificallyactuarial gains and losses.
Retained earnings represent all current and prior period results of operations as reported
in the profit or loss section of the statements of comprehensive income, reduced by theamount of dividends declared.
2.19 Events after the End of the Reporting Period
Any post-year-end event that provides additional information about the Company’sfinancial position at the end of the reporting period (adjusting event) is reflected in thefinancial statements. Post-year-end events that are not adjusting events, if any, aredisclosed when material to the financial statements.
F-242

7/21/2019 PreliminaryProspectus - Century
http://slidepdf.com/reader/full/preliminaryprospectus-century 476/648
- 20 -
3. SIGNIFICANT ACCOUNTING JUDGMENTS AND ESTIMATES
The Company’s financial statements prepared in accordance with PFRS requiremanagement to make judgments and estimates that affect amounts reported in thefinancial statements and related notes. Judgments and estimates are continually evaluatedand are based on historical experience and other factors, including expectations of future
events that are believed to be reasonable under the circumstances. Actual results mayultimately vary from these estimates.
3.1 Critical Management Judgments in Applying Accounting Policies
In the process of applying the Company’s accounting policies, management has made thefollowing judgments, apart from those involving estimation, which have the mostsignificant effect on the amounts recognized in the financial statements:
(a)
Distinction between Operating and Finance Leases
The Company has entered into various lease agreements as a lessee. Critical
judgment was exercised by management to distinguish each lease agreement as eitheran operating or finance lease by looking at the transfer or retention of significant riskand rewards of ownership of the properties covered by the agreements. Failure tomake the right judgment will result in either overstatement or understatement of assetand liabilities. Based on management’s judgment such leases were determined to beoperating leases.
(b) Recognition of Provisions and Contingencies
Judgment is exercised by management to distinguish between provisions andcontingencies. Policies on recognition and disclosure of provision and contingenciesare discussed in Note 2.9 and relevant disclosures in contingencies are presented in
Note 20.
3.2 Key Sources of Estimation Uncertainty
The following are the key assumptions concerning the future, and other key sources ofestimation uncertainty at the end of the reporting period, that have a significant risk ofcausing a material adjustment to the carrying amounts of assets and liabilities within thenext financial year:
(a) Impairment of Trade and Other Receivables
Adequate amount of allowance for impairment is provided for specific and group of
accounts, where objective evidence of impairment exists. The Company evaluatesthese accounts based on available facts and circumstances, including, but not limitedto, the length of the Company’s relationship with the customers, the customers’current credit status based on third party credit reports and known market forces, theaverage age of accounts, collection experience and historical loss experience.
Based on the analysis done by management, certain receivables were identified to beimpaired. The carrying value of trade and other receivables and analysis of allowancefor impairment on such financial assets are shown in Note 6.
F-243

7/21/2019 PreliminaryProspectus - Century
http://slidepdf.com/reader/full/preliminaryprospectus-century 477/648
- 21 -
(b)
Determining Net Realizable Value of Inventories
In determining the net realizable value of inventories, management takes into accountthe most reliable evidence available at the dates the estimates are made. The futurerealization of the carrying amounts of inventories as presented in Note 7 is affectedby price changes in different market segments. These are considered key sources of
estimation, especially that such inventories are substantially perishable in nature andhighly affective by temperature and other environmental conditions, uncertainty andmay cause significant adjustments to the Company’s inventories within the nextfinancial year.
(c)
Estimating Useful Lives of Property, Plant and Equipment
The Company estimates the useful lives of property, plant and equipment, exceptland, based on the period over which the assets are expected to be available for use.
The estimated useful lives of property, plant and equipment are reviewed periodicallyand are updated if expectations differ from previous estimates due to physical wearand tear, technical or commercial obsolescence and legal or other limits on the use of
the assets.
The carrying amounts of property, plant and equipment are analyzed in Note 9.Based on management’s assessment as at December 31, 2013, there is no change inestimated useful lives of property, plant and equipment during the year. Actualresults, however, may vary due to changes in estimates brought about by changes infactors mentioned above.
(d)
Determining the Fair Value of Land
The Company’s land is carried at revalued amount at the end of the reporting period.In determining the fair value of the land, the Company engages the services of
professional and independent appraisers. The fair value is determined by reference tomarket-based evidence, which is the amount for which the asset could be exchangedbetween a knowledgeable willing buyer and seller in an arm’s length transaction as atthe valuation date. Such amount is influenced by different factors including thelocation and specific characteristics of the property (e.g., size, features, and capacity),quantity of comparable properties available in the market, and economic conditionand behaviour of the buying parties.
A significant change in these elements may affect prices and the value of the asset. The amounts of revaluation and fair value gain recognized on land are disclosed inNote 9.
(e)
Determining Recoverable Amount of Deferred Tax Assets
The Company reviews its deferred tax assets at the end of the reporting period andreduces the carrying amount to the extent that it is no longer probable that sufficienttaxable profit will be available to allow all or part of the deferred tax asset to beutilized. The carrying value of deferred tax assets as at December 31, 2013 and 2012
which the management assessed to be probable of being fully utilized within the nexttwo to three years is disclosed in Note 16.
F-244

7/21/2019 PreliminaryProspectus - Century
http://slidepdf.com/reader/full/preliminaryprospectus-century 478/648
- 22 -
(f)
Impairment of Non-financial Assets
The Company’s policy on estimating the impairment of non-financial assets isdiscussed in detail in Note 2.13. Though management believes that the assumptionsused in the estimation of fair values reflected in the financial statements areappropriate and reasonable, significant changes in these assumptions may materially
affect the assessment of recoverable values and any resulting impairment loss couldhave a material adverse effect on the results of operations. No impairment loss wasrecognized on the Company’s non-financial assets in 2013 and 2012.
(g) Valuation of Post-employment Benefits
The determination of the Company’s obligation and cost of post-employment definedbenefit are dependent on the selection of certain assumptions used by actuaries incalculating such amounts. Those assumptions include, among others, discount ratesand salary increase rates. In accordance with PFRS, actual results that differ from theassumptions are accumulated and amortized over future periods and, therefore,generally affect the recognized expense and recorded obligation in such future
periods.
The amount of retirement benefit obligation (asset) and expense and an analysis ofthe movements in the estimated present value of post-employment benefit obligationand fair value of plan assets are presented in Note 15.2.
4. RISK MANAGEMENT OBJECTIVES AND POLICIES
The Company is exposed to certain financial risks which result from both its operatingand investing activities. The Company’s risk management is coordinated with its parentcompany, in close cooperation with the BOD, and focuses on actively securing the
Company’s short-to-medium term cash flows by minimizing the exposure to financialmarkets.
The Company does not engage in the trading of financial assets for speculative purposesnor does it write options. The most significant financial risks to which the Company isexposed to are described below.
4.1 Market Risk
The Company is exposed to market risk through its use of financial instruments andspecifically to currency risk and interest risk which result from both its operating andinvesting activities.
(a)
Foreign Currency Risk
Most of the Company’s transactions are carried out in U.S. Dollars, its functionalcurrency. Exposures to currency exchange rates arise from the interest-bearing loansfrom local banks, trade and other payables and due to related parties which areprimarily denominated in Philippine peso. The Company also holds Philippinepeso-denominated cash.
F-245
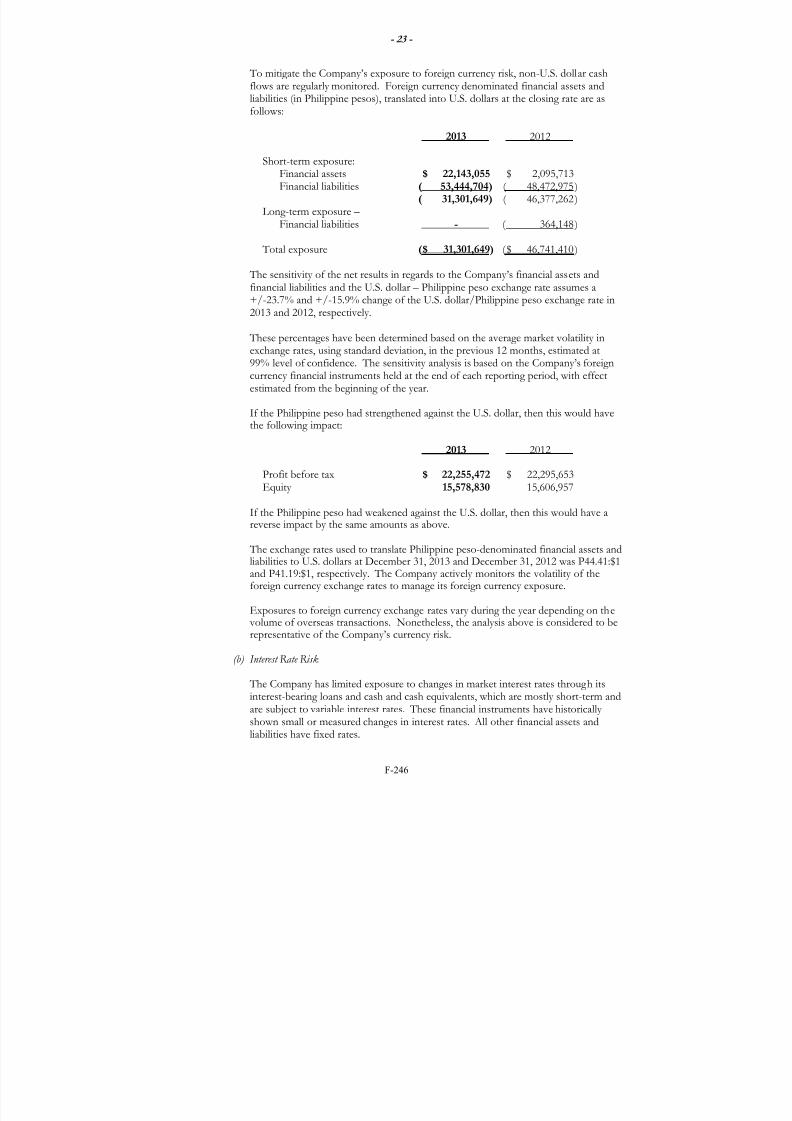
7/21/2019 PreliminaryProspectus - Century
http://slidepdf.com/reader/full/preliminaryprospectus-century 479/648
- 23 -
To mitigate the Company’s exposure to foreign currency risk, non-U.S. dollar cashflows are regularly monitored. Foreign currency denominated financial assets andliabilities (in Philippine pesos), translated into U.S. dollars at the closing rate are asfollows:
2013 2012
Short-term exposure:Financial assets $ 22,143,055 $ 2,095,713Financial liabilities ( 53,444,704) ( 48,472,975 )
( 31,301,649) ( 46,377,262 )Long-term exposure –
Financial liabilities - ( 364,148 )
Total exposure ( $ 31,301,649) ( $ 46,741,410 )
The sensitivity of the net results in regards to the Company’s financial assets andfinancial liabilities and the U.S. dollar – Philippine peso exchange rate assumes a
+/-23.7% and +/-15.9% change of the U.S. dollar/Philippine peso exchange rate in2013 and 2012, respectively.
These percentages have been determined based on the average market volatility inexchange rates, using standard deviation, in the previous 12 months, estimated at99% level of confidence. The sensitivity analysis is based on the Company’s foreigncurrency financial instruments held at the end of each reporting period, with effectestimated from the beginning of the year.
If the Philippine peso had strengthened against the U.S. dollar, then this would havethe following impact:
2013 2012
Profit before tax $ 22,255,472 $ 22,295,653Equity 15,578,830 15,606,957
If the Philippine peso had weakened against the U.S. dollar, then this would have areverse impact by the same amounts as above.
The exchange rates used to translate Philippine peso-denominated financial assets andliabilities to U.S. dollars at December 31, 2013 and December 31, 2012 was P44.41:$1and P41.19:$1, respectively. The Company actively monitors the volatility of theforeign currency exchange rates to manage its foreign currency exposure.
Exposures to foreign currency exchange rates vary during the year depending on the volume of overseas transactions. Nonetheless, the analysis above is considered to berepresentative of the Company’s currency risk.
(b) Interest Rate Risk
The Company has limited exposure to changes in market interest rates through itsinterest-bearing loans and cash and cash equivalents, which are mostly short-term andare subject to variable interest rates. These financial instruments have historicallyshown small or measured changes in interest rates. All other financial assets andliabilities have fixed rates.
F-246

7/21/2019 PreliminaryProspectus - Century
http://slidepdf.com/reader/full/preliminaryprospectus-century 480/648
- 24 -
4.2 Credit Risk
Credit risk is the risk that a counter party may fail to discharge an obligation to aCompany. The Company is exposed to this risk with respect to certain financialinstruments arising from selling goods to customers, including related parties, and placingdeposits and short term placements with banks.
The Company continuously monitors defaults of customers and other counterparties, ifany identified either individually or by group, and incorporate this information into itscredit risk controls. Where available at a reasonable cost, external credit ratings and/orreports on customers and other counterparties are obtained and used. The Company’spolicy is to deal only with creditworthy counterparties. In addition, for a significantproportion of sales, advance payments are received to mitigate credit risk.
Generally, the maximum credit risk exposure of financial assets is the carrying amount ofthe financial assets as shown on the face of the statements of financial position(or in the detailed analysis provided in the notes to the financial statements), assummarized below.
Notes 2013 2012
Cash and cash equivalents 5 $ 8,205,166 $ 2,201,727 Trade and other
Receivables - net 6 20,158,886 4,619,685
$ 28,364,052 $ 6,821,412
The Company’s management considers that all the above financial assets that are notimpaired or past due for each reporting period are of good credit quality.
a.
Cash and Cash Equivalents
As part of Company policy, bank deposits are only maintained with reputable financialinstitutions. Cash in banks which are insured by the Philippine Deposit InsuranceCorporation (PDIC) up to a maximum coverage of P500,000 ( approximately $11,259) perdepositor per banking institution, as provided for under Republic Act No. 9576, Charter ofPDIC, are still subject to credit risk.
b.
Trade and Other Receivables
In respect of trade and other receivables, the Company is exposed to significant credit riskexposure to a single counterparty. As of December 31, 2013, 25% of its trade receivable isfrom a single counterparty. To mitigate the risk, the Company has policies in place toensure that goods are sold to customers with an appropriate credit history. Based onhistorical information about customer default rates, management consider the creditquality of trade receivables that are not past due or impaired to be good. There was nosignificant credit risk exposure to a single counterparty as of December 31, 2012.
F-247
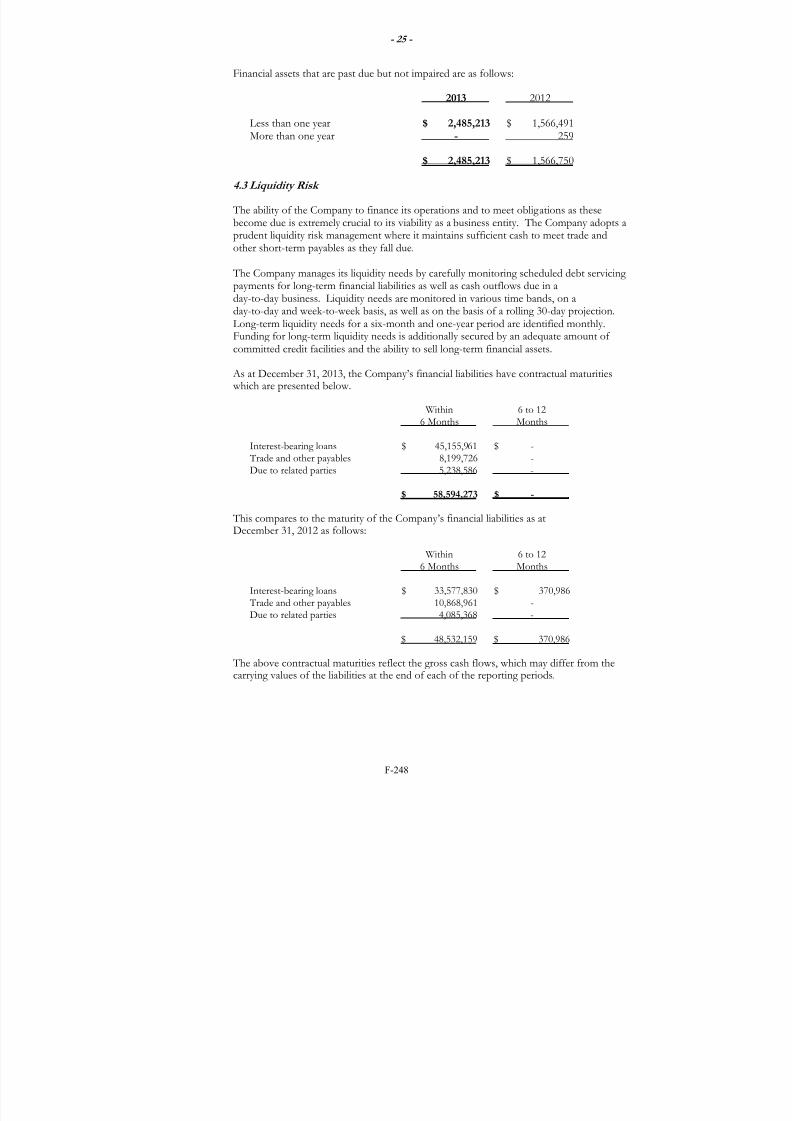
7/21/2019 PreliminaryProspectus - Century
http://slidepdf.com/reader/full/preliminaryprospectus-century 481/648
- 25 -
Financial assets that are past due but not impaired are as follows:
2013 2012
Less than one year $ 2,485,213 $ 1,566,491 More than one year - 259
$ 2,485,213 $ 1,566,750
4.3 Liquidity Risk
The ability of the Company to finance its operations and to meet obligations as thesebecome due is extremely crucial to its viability as a business entity. The Company adopts aprudent liquidity risk management where it maintains sufficient cash to meet trade andother short-term payables as they fall due.
The Company manages its liquidity needs by carefully monitoring scheduled debt servicingpayments for long-term financial liabilities as well as cash outflows due in a
day-to-day business. Liquidity needs are monitored in various time bands, on aday-to-day and week-to-week basis, as well as on the basis of a rolling 30-day projection.Long-term liquidity needs for a six-month and one-year period are identified monthly.Funding for long-term liquidity needs is additionally secured by an adequate amount ofcommitted credit facilities and the ability to sell long-term financial assets.
As at December 31, 2013, the Company’s financial liabilities have contractual maturities which are presented below.
Within 6 to 126 Months Months
Interest-bearing loans $ 45,155,961 $ -
Trade and other payables 8,199,726 -Due to related parties 5,238,586 -
$ 58,594,273 $ -
This compares to the maturity of the Company’s financial liabilities as atDecember 31, 2012 as follows:
Within 6 to 126 Months Months
Interest-bearing loans $ 33,577,830 $ 370,986
Trade and other payables 10,868,961 -Due to related parties 4,085,368 -
$ 48,532,159 $ 370,986
The above contractual maturities reflect the gross cash flows, which may differ from thecarrying values of the liabilities at the end of each of the reporting periods.
F-248

7/21/2019 PreliminaryProspectus - Century
http://slidepdf.com/reader/full/preliminaryprospectus-century 482/648
- 26 -
5. CASH AND CASH EQUIVALENTS
The breakdown of this account is as follows:
2013 2012
Cash on hand $ 1,914 $ 1,821Cash in bank 4,259,113 2,201,727Short term placements 3,946,053 -
$ 8,207,080 $ 2,203,548
Cash in banks generally earn interest at rates based on daily bank deposit rates.Short-term placements are made for varying periods between 30 to 90 days and earneffective interest ranging from 1.63% to 2.25% for both periods.
6. TRADE AND OTHER RECEIVABLES
This account (see also Note 4.2) is composed of the following:
Note 2013 2012
Trade receivables $ 15,367,209 $ 4,737,828Deposits on purchase 1,421,700 - Others 17.2 4,813,866 26,140
21,602,775 4,763,968 Allowance for impairment ( 22,189) ( 144,283 )
$ 21,580,586 $ 4,619,685
Trade receivables are usually due within 30 to 45 days and do not bear any interest. Alltrade and other receivables are subject to credit risk exposure.
Deposit on purchase pertains to the Company’s advance payment to suppliers.
All of the Company’s trade and other receivables have been reviewed for indicators ofimpairment. Certain receivables were identified to be impaired, hence, adequateamounts of allowance for impairment have been recognized. The Company recognizedimpairment losses of $22,189 in 2013 and $75,500 in 2012 and presented them as part ofImpairment loss on trade and other receivables under Administrative Expenses in thestatements of comprehensive income (see Note 13).
F-249

7/21/2019 PreliminaryProspectus - Century
http://slidepdf.com/reader/full/preliminaryprospectus-century 483/648
- 27 -
A reconciliation of the allowance for impairment at the beginning and end of 2013 and2012 is shown below.
Note 2013 2012
Balance at beginning
of year $ 144,283 $ 68,783Reversal of impairment ( 144,283) -Impairment losses 13 22,189 75,500
Balance at end of year $ 22,189 $ 144,283
In 2013, the Company recognized reversal of allowance for impairment on certainaccounts amounting to P144,283 (nil in 2012) and presented it as part of Other incomeunder Other Operating Expenses (Income) in the 2013 statement of comprehensiveincome.
7.
INVENTORIES
Details of inventories are shown below.
Note 2013 2012
Finished goods: At cost $ 13,256,275 $ 10,268,611 At net realizable value 2,570,888 176,170
13 15,827,163 10,444,781Raw and packaging
materials 12,476,580 33,344,561
Spare parts, suppliesand others 906,828 1,056,207
$ 29,210,571 $ 44,845,549
The inventory write-down amounting to $623,851 in 2013 and $291,319 in 2012 areincluded under changes in finished goods inventories and is presented as part of Cost ofGoods Sold in the statements of comprehensive income, as the Company considers the
write-down to be normal in its operations.
Cost of inventories charge to operation in 2013 and 2012 is analyzed in Note 13.
F-250

7/21/2019 PreliminaryProspectus - Century
http://slidepdf.com/reader/full/preliminaryprospectus-century 484/648
- 28 -
8. PREPAYMENTS AND OTHER CURRENT ASSETS
The composition of this account is shown below.
2013 2012
Tax credit certificates (TCC)from the Bureau ofCustoms (BOC) $ 1,004,460 $ 937,542
Prepaid insurance 9,579 12,385 Prepaid rent 337 363 Others 46,202 23,350
$ 1,060,578 $ 973,640
TCC from the BOC are granted to the Bureau of Investment (BOI) registered companiesand are given for taxes and duties paid on raw materials used for the manufacture of theirexport products. The Company can offset their TCC against tax liabilities other than
withholding tax or be converted to a cash refund.
9.
PROPERTY, PLANT AND EQUIPMENT
The gross carrying amounts and accumulated depreciation of property, plant andequipment at the beginning and end of 2013 and 2012 are shown below.
At Fair Value At CostTransportation Machinery Construction-
Land and Delivery and in-Land Buildings Improvements Equipment Equipment Progress Total
December 31, 2013Cost $ - $ 9,098,002 $ 1,418,673 $ 26,955 $ 22,550,974 $ 661,260 $ 33,755,864 Accumulated depreci ation - ( 4,785,580 ) ( 1,228,433 ) ( 26,955 ) ( 13,099,155 ) - ( 19,140,123 )
Carrying amounts $ - $ 4,312,422 $ 190,240 $ - $ 9,451,819 $ 661,260 $ 14,615,741
December 31, 2012Cost $ 1,827,066 $ 8,600,943 $ 1,388,173 $ 26,955 $ 20,344,632 $ 705,335 $ 32,893,104Revaluation increment 35,773 - - - - - 35,773 Accumulated depreci ation - ( 4,209,932 ) ( 1,187,432 ) ( 26,955 ) ( 10,878,290 ) - ( 16,302,609 )
Carrying amounts $ 1,862,839 $ 4,391,011 $ 200,741 $ - $ 9,466,342 $ 705,335 $ 16,626,268
January 1, 2012Cost $ 1,827,066 $ 8,069,346 $ 1,379,635 $ 77,729 $ 19,452,356 $ 426,790 $ 31,232,922Revaluation increment 35,773 - - - - - 35,773 Accumulated depreci ation - ( 3,571,941 ) ( 1,146,789 ) ( 77,729 ) ( 8,839,962 ) - ( 13,636,421 )
Carrying amounts $ 1,862,839 $ 4,497,405 $ 232,864 $ - $ 10,612,394 $ 426,790 $ 17,632,274
A reconciliation of the carrying amounts of property, plant and equipment at thebeginning and end of 2013 and 2012, is shown below.
At Fair Value At CostTransportation Machinery Construction-
Land and Delivery and in-Land Buildings Improvements Equipment Equipment Progress Total
Balance at January 1, 2013,net of accumulated depreciation $ 1,862,839 $ 4,391,011 $ 200,741 $ - $ 9,466,342 $ 705,335 $ 16,626,268
Additions - - 30,500 - 2,101,663 594,811 2,726,974Disposals ( 1,862,839 ) - - - - - ( 1,862,839 )Derecogntion - - - - ( 37,148 ) - ( 37,148 )Reclassifications - 497,059 - - 141,827 ( 638,886 ) -Depreciation charges for the year - ( 575,648 ) ( 41,001 ) - ( 2,220,865 ) - ( 2,837,5 14 )
Carrying amounts $ - $ 4,312,422 $ 190,240 $ - $ 9,451,819 $ 661,260 $ 14,615,741
Balance at January 1, 2012,net of accumulated depreciation $ 1,862,83 9 $ 4,497,405 $ 232,846 $ - $ 10,612,394 $ 426,790 $ 17,632,274
Additions - 184,229 8,538 - 860,486 671,508 1,724,761Disposals - - - - ( 1,508 ) - ( 1,508 )Reclassifications - 347,368 - - 45,595 ( 392,963 ) -Depreciation and charges for the year - ( 637,991 ) ( 40,643 ) - ( 2,050,625 ) - ( 2,729,259 )
Carrying amounts $ 1,862,839 $ 4,391,011 $ 200,741 $ - $ 9,466,342 $ 705,335 $ 16,626,268
F-251
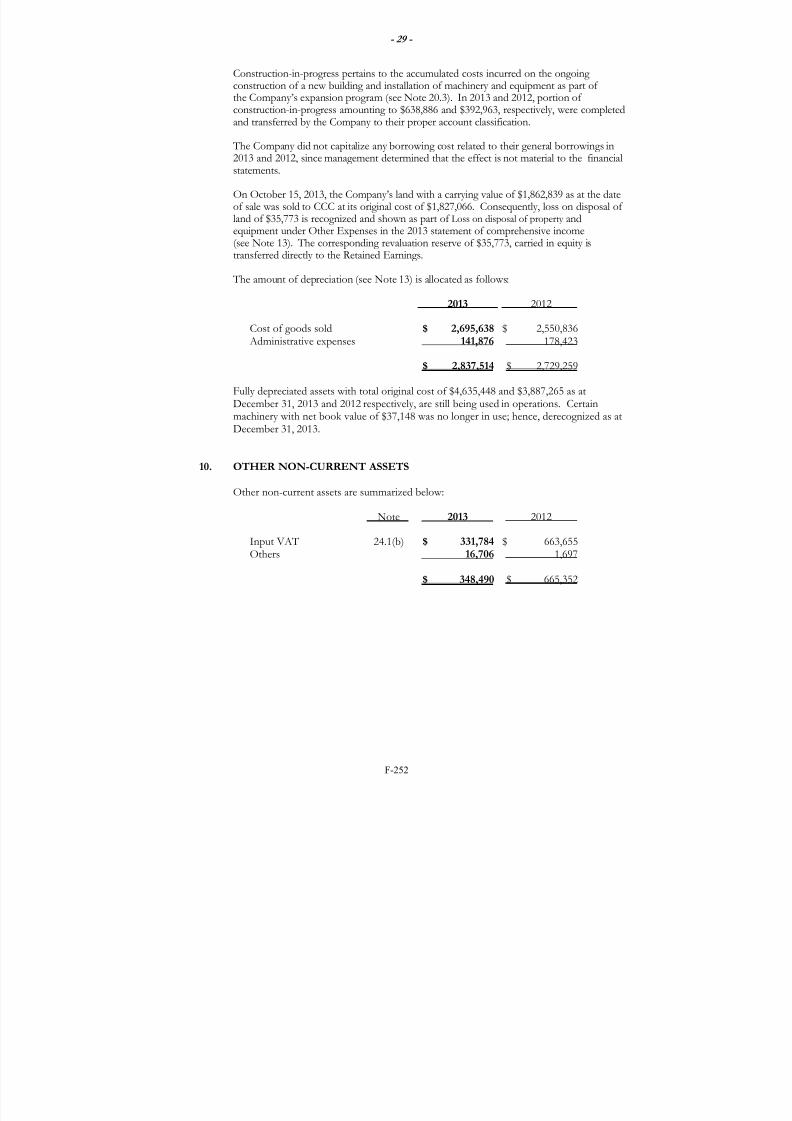
7/21/2019 PreliminaryProspectus - Century
http://slidepdf.com/reader/full/preliminaryprospectus-century 485/648
- 29 -
Construction-in-progress pertains to the accumulated costs incurred on the ongoingconstruction of a new building and installation of machinery and equipment as part ofthe Company’s expansion program (see Note 20.3). In 2013 and 2012, portion ofconstruction-in-progress amounting to $638,886 and $392,963, respectively, were completedand transferred by the Company to their proper account classification.
The Company did not capitalize any borrowing cost related to their general borrowings in2013 and 2012, since management determined that the effect is not material to the financialstatements.
On October 15, 2013, the Company’s land with a carrying value of $1,862,839 as at the dateof sale was sold to CCC at its original cost of $1,827,066. Consequently, loss on disposal ofland of $35,773 is recognized and shown as part of Loss on disposal of property andequipment under Other Expenses in the 2013 statement of comprehensive income(see Note 13). The corresponding revaluation reserve of $35,773, carried in equity istransferred directly to the Retained Earnings.
The amount of depreciation (see Note 13) is allocated as follows:
2013 2012
Cost of goods sold $ 2,695,638 $ 2,550,836 Administrative expenses 141,876 178,423
$ 2,837,514 $ 2,729,259
Fully depreciated assets with total original cost of $4,635,448 and $3,887,265 as atDecember 31, 2013 and 2012 respectively, are still being used in operations. Certainmachinery with net book value of $37,148 was no longer in use; hence, derecognized as atDecember 31, 2013.
10. OTHER NON-CURRENT ASSETS
Other non-current assets are summarized below:
Note 2013 2012
Input VAT 24.1(b) $ 331,784 $ 663,655Others 16,706 1,697
$ 348,490 $ 665,352
F-252

7/21/2019 PreliminaryProspectus - Century
http://slidepdf.com/reader/full/preliminaryprospectus-century 486/648
- 30 -
11. INTEREST-BEARING LOANS
The short-term and long-term interest-bearing loans, which are collateralized by acontinuing joint suretyship of certain stockholders and a corporate guarantee of CCC(see Note 20), are broken down as follows:
2013 2012
in PHP in USD in PHP in USD
Short-term P1,984,600,000 $ 44,684,109 P 1,320,700,000 $ 32,062,051Long-term 15,000,000 337,731 75,000,000 1,820,742
P1,999,600,000 $ 45,021,840 P 1,395,700,000 $ 33,882,793
These loans were originally availed in Philippine peso and are presented in thestatements of financial positions as follows:
2013 2012
Current $ 45,021,840 $ 33,518,645
Non-current - 364,148
$ 45,021,840 $ 33,882,793
Short-term loans consist of several borrowings from local banks which mature within14 to 30 days and bear annual interest rates ranging from 2.50% to 2.65% in 2013 and2.25% to 4.75% in 2012.
Only the Company’s long-term loan is subject to a condition that requires the Companyto meet certain financial ratios such as debt-to-equity ratio (not to exceed 2.5:1) andcurrent ratio (of at least 1.0:1). In the event of default or non-compliance with any ofthe provisions of the loan agreement, the bank-creditor may (by written notice) either
declare the loan terminated or declare the entire unpaid principal amount and interest ofthe loan due and demandable. The loan covenant has been consistently complied withby the Company but not as of December 31, 2013 (see Note 22). However, onFebruary 27, 2014, complying with the long-term loan’s prescribedbank-scheduled-amortization, the Company has fully paid the remaining principalamount, denominated in Philippine peso, and included in current liabilities as atDecember 31, 2013 amounting to P15,000,000 (or approximately $337,731) withoutadditional burden of penalties that the local bank could have imposed had the loancovenant conditions were applied. As such, the Company had foregone obtaining abank loan waiver effective December 31, 2013. The Company’s management assessedthat obtaining such waiver is academic, in the absence of a written notice issued by thebank, as full payment and non-imposition of any bank penalties has cured any breach of
the loan covenant.
Interest expense charged to operations amounted to $1,069,892 in 2013 and $816,041 in2012 and presented as part of Finance Costs in the statements of comprehensive income(see Note 14). The unpaid balance of interest amounting to $64,678 and $52,116 as atDecember 31, 2013 and 2012, respectively, is presented as part of Accrued Expensesunder the Trade and Other Payables account in the statements of financial position(see Note 12).
F-253

7/21/2019 PreliminaryProspectus - Century
http://slidepdf.com/reader/full/preliminaryprospectus-century 487/648
- 31 -
12. TRADE AND OTHER PAYABLES
This account consists of:
Notes 2013 2012
Trade payables $ 4,430,772 $ 9,020,599 Accrued expenses 11 1,407,665 771,418Others 17.1, 17.3
17.5 2,374,405 1,076,944
$ 8,212,842 $ 10,868,961
Accrued expenses include the current portion of the Company’s obligations to itsemployees and service providers that are expected to be settled within 12 months from theend of the reporting period. These liabilities arise mainly from the accrual of variousexpenses such as rent, freight, interest on loans and payroll at the end of the period.
Others payable also include liabilities to various agencies and regulatory bodies.
13. COSTS AND OPERATING EXPENSES BY NATURE
The details of costs and operating expenses by nature are shown below.
Notes 2013 2012
Raw materials used $ 115,802,914 $ 62,956,137Changes in finished goods
inventories 7 ( 5,382,382) 1,531,579
Outside services 17.5 7,376,689 5,852,420Rent 20.1 5,070,682 4,100,160Depreciation 9 2,837,514 2,729,259Gas, fuel and oil 2,382,700 2,156,957Supplies 2,255,899 1,989,322Communication, light and water 1,686,203 1,315,590Freight 1,587,318 1,117,023Salaries and employee benefits 15 1,145,041 1,134,103
Taxes and licenses 24.1(c) 356,812 299,395Insurance 249,003 175,994Repairs and maintenance 213,316 170,374Loss on disposal of property
and equipment 9 72,921 -Commissions 63,689 45,369Impairment losses
on trade and other receivables 6 22,189 75,500Foreign currency losses – net - 989,185Miscellaneous 296,626 248,560
$ 136,037,134 $ 86,886,927
F-254

7/21/2019 PreliminaryProspectus - Century
http://slidepdf.com/reader/full/preliminaryprospectus-century 488/648
- 32 -
These expenses are classified in the statements of comprehensive income as follows:
2013 2012
Cost of goods sold $ 132,466,117 $ 83,175,582 Administrative expenses 1,844,935 2,500,647
Selling expenses 1,651,007 1,162,392Other expenses 75,075 48,306
$ 136,037,134 $ 86,886,927
Cost of goods sold consists of the following:
Note 2013 2012
Finished goods atbeginning of year 7 $ 10,444,781 $ 11,976,360
Cost of goods manufactured:
Raw materials used 115,802,914 62,956,137 Direct labor 5,584,209 4,505,777Manufacturing overhead 16,461,376 14,182,089
137,848,499 81,644,003 Total goods available for sale 148,293,280 93,620,363
Finished goods at end of year 7 ( 15,827,163 ) ( 10,444,781 )
$ 132,466,117 $ 83,175,582
14. FINANCE COSTS AND INCOME
The details of these accounts are presented below.
Notes 2013 2012
14.1 Finance Costs
Interest expense 11 $ 1,069,892 $ 816,041Bank charges 93,370 109,693Foreign currency losses - net - 372,426
$ 1,163,262 $ 1,298,160
14.2 Finance Income
Foreign currency gain - net $ 2,243,620 $ -Interest income 37,612 67,561Net interest income from
plan asset 15.2 654 1,477
$ 2,281,886 $ 69,038
The foreign currency gains and losses are recognized in profit or loss; none are recognizedin other comprehensive income.
F-255

7/21/2019 PreliminaryProspectus - Century
http://slidepdf.com/reader/full/preliminaryprospectus-century 489/648
- 33 -
15. EMPLOYEE BENEFITS
15.1 Salaries and Employee Benefits
Expenses recognized for salaries and employee benefits (see Notes 13 and 17.7) arepresented below.
2013 2012
Short-term benefits $ 1,102,315 $ 1,093,927Post-employment benefits 42,726 40,176
$ 1,145,041 $ 1,134,103
15.2 Post-employment Defined Benefit Plan
(a)
Characteristics of the Defined Benefit Plan
The Company maintains a partially funded, tax-qualified, non-contributorypost-employment benefit plan that is being administered by a trustee bank coveringall regular full-time employees.
The normal retirement age is 60 with a minimum of 5 years of credited service. Theplan also provides for an early retirement at age 50 with a minimum of 10 years ofcredited service and late retirement after age 60, both subject to the approval of theCompany’s BOD. Normal retirement benefit is an amount equivalent to 100% ofthe final monthly covered compensation (average monthly basic salary during thelast 12 months of credited service) for every year of credited service.
(b)
Explanation of Amounts Presented in the Financial Statements
Actuarial valuations are made annually to update the retirement benefit costs and theamount of contributions. All amounts presented below are based on the actuarial
valuation report obtained from an independent actuary in 2013 including thecomparative year which has been restated in line with the adoption ofPAS 19 (Revised), see Note 2.2(a)(ii).
The amounts of post-employment defined benefit obligation recognized in thestatements of financial position are determined as follows:
2013 2012
Present value of the obligation $ 415,197 $ 396,926Fair value of plan assets ( 401,718 ) ( 408,017 )Under (over) funded 13,479 ( 11,091 )Effect of asset ceiling - 657
$ 13,479 ( $ 10,434 )
F-256

7/21/2019 PreliminaryProspectus - Century
http://slidepdf.com/reader/full/preliminaryprospectus-century 490/648
- 34 -
The movements in present value of the post-employment benefit obligation are asfollows:
2013 2012
Balance at beginning of year $ 396,926 $ 314,055
Current service 42,726 40,176Interest costs 24,491 20,346 Remeasurements – actuarial loss (gain):
Changes in financial assumptions 31,307 -Experience adjustments ( 30,796 ) -
Benefits paid by the plan ( 28,898 ) -Effect of foreign currency
exchange rate changes ( 20,559) 22,349
Balance at end of year $ 415,197 $ 396,926
The movement in the fair value of plan assets is presented below.
2013 2012
Balance at beginning of year $ 408,017 $ 316,719Interest income 25,145 21,823Contributions paid into the plan 29,248 35,762Benefits paid by the plan ( 28,898 ) -Remeasurement- return on plan assets ( 11,445 ) 7,430 Effect of foreign currency
exchange rate changes ( 20,349 ) 26,283
Balance at end of year $ 401,718 $ 408,017
Actual return on plan assets amounted to $9,509 in 2013 and $29,335 in 2012.
The composition of the fair value of total plan assets at the end of the reportingperiod by category is shown below.
2013 2012
Cash and cash equivalents $ 38,967 $ 43,209Debt instruments :
Government bonds 244,566 247,340Other bonds 87,333 80,175
Others 30,852 37,293
$ 401,718 $ 408,017
Plan assets do not comprise any of the Company’s own financial instruments or anyof its assets occupied and/or used in its operations.
F-257

7/21/2019 PreliminaryProspectus - Century
http://slidepdf.com/reader/full/preliminaryprospectus-century 491/648
- 35 -
The components of amounts recognized in profit or loss and in othercomprehensive income in respect of the defined benefit post-employment plan areas follows:
2013 2012
Reported in profit or loss:Current service costs $ 42,726 $ 40,176Net interest income ( 654 ) ( 1,477 )
$ 42,072 $ 38,699
Reported in other comprehensive income: Actuarial gains (losses) arising
from changes in:Financial assumptions $ 31,307 $ -Experience adjustments ( 30,796) -Return on plan assets (excluding
amounts included in
net interest expense) ( 11,445) 7,430 Actuarial gain (loss) on change on theeffect of the asset ceiling test 683 ( 171 )
Tax income (expense) 3,075 ( 2,178 )
($ 7,176) $ 5,081
Current service cost is allocated and presented in the statements of profit or lossunder the following accounts:
Note 2013 2012
Cost of goods sold 13 $ 35,024 $ 34,150
Administrative expenses 7,384 6,026
$ 42,726 $ 40,176
The net interest income is included in the caption Finance Income (see Note 14.2)and the amount recognized in other comprehensive income is included under itemthat will not be reclassified subsequently to profit or loss.
In determining the amounts of the defined benefit post-employment obligation, thefollowing significant actuarial assumptions were used:
2013 2012
Discount rates 4.37% 6.29%Expected rate of salary increases 3.00% 4.00%
Assumptions regarding future mortality experience are based on published statisticsand mortality tables. The average remaining working lives of an individual retiring atthe age of 65 is 22 for both males and females.
F-258

7/21/2019 PreliminaryProspectus - Century
http://slidepdf.com/reader/full/preliminaryprospectus-century 492/648
- 36 -
These assumptions were developed by management with the assistance of anindependent actuary. Discount factors are determined close to the end of eachreporting period by reference to the interest rates of a zero coupon governmentbonds with terms to maturity approximating to the terms of the post-employmentobligation. Other assumptions are based on current actuarial benchmarks andmanagement’s historical experience.
(c)
Risks Associated with the Retirement Plan
The plan exposes the Company to actuarial risks such as investment risk, interestrate risk, longevity risk and salary risk.
(i)
Investment and Interest Risks
The present value of the defined benefit obligation is calculated using a discountrate determined by reference to market yields of government bonds. Generally, adecrease in the interest rate of a reference government bonds will increase the planobligation. However, this will be partially offset by an increase in the return on theplan’s investments in debt securities and if the return on plan asset falls below thisrate, it will create a deficit in the plan. Currently, the plan is composed ofinvestment in cash and cash equivalents, corporate and government debt securities.
(ii) Longevity and Salary Risks
The present value of the defined benefit obligation is calculated by reference to thebest estimate of the mortality of the plan participants both during and after theiremployment, and to their future salaries. Consequently, increases in the lifeexpectancy and salary of the plan participants will result in an increase in the planobligation.
(d)
Other Information
The information on the sensitivity analysis for certain significant actuarialassumptions, the Company’s asset-liability matching strategy, and the timing anduncertainty of future cash flows related to the retirement plan are described below.
(i) Sensitivity Analysis
The sensitivity of the defined benefit obligation to changes in the weighted principalassumptions is shown below.
Impact on Defined Benefit ObligationChange in Increase in Decrease in
Assumption Assumption Assumption
Discount rate +/-1% ( $ 29,020 ) $ 32,051Salary increase rate +/-1% 28,153 ( 26,163 )
F-259

7/21/2019 PreliminaryProspectus - Century
http://slidepdf.com/reader/full/preliminaryprospectus-century 493/648
- 37 -
The sensitivity analysis is based on a change in an assumption while holding all otherassumptions constant. This analysis may not be representative of the actual changein the defined benefit obligation as it is unlikely that the change in assumptions
would occur in isolation of one another as some of the assumptions may becorrelated. Furthermore, in presenting the above sensitivity analysis, the present
value of the defined benefit obligation has been calculated using the projected unit
credit method at the end of the reporting period, which is the same as that applied incalculating the defined benefit obligation recognized in the statements of financialposition.
The methods and types of assumptions used in preparing the sensitivity analysis didnot change compared to the previous years.
(ii) Asset-liability Matching Strategies
The Company has no specific matching strategy between the plan assets and the planliabilities. However, concentration on government and corporate debt instruments,are evident to align securing the principal value of plan assets from volatility or high
risk in loss of value.
(iii) Funding Arrangements and Expected Contributions
The plan is currently underfunded by $13,479 based on the latest actuarial valuationbut the Company does not expect any contribution to the retirement benefit plan in2014. While there are no minimum funding requirement in the country, the size ofthe underfunding may pose a cash flow risk in about 6 years’ time when a significantnumber of employees is expected to retire.
The maturity profile of undiscounted expected benefit payments from the planfollows:
Between 1 to 5 years $ 7,530Between 6 to 10 years 111,318
$ 118,848
The weighted average duration of the defined benefit obligation at the end of thereporting period is 9.5 years.
F-260

7/21/2019 PreliminaryProspectus - Century
http://slidepdf.com/reader/full/preliminaryprospectus-century 494/648
- 38 -
16. TAXES
The major components of tax expense as reported in profit or loss:
Note 2013 2012
Reported in profit or loss:Current tax expense:Regular corporate income tax
(RCIT) at 30% 18 $ 742,366 $ 931,329Final taxes at 20% and 7.5% 7,191 13,249
749,557 944,578Deferred tax income relating
to reversal of temporarydifferences ( 82,075 ) ( 68,622)
$ 667,482 $ 875,956
Reported in other comprehensive income –
Deferred tax expense (income)relating to reversal oftemporary differences $ 3,075 ($ 2,178)
The reconciliation of tax on pretax profit computed at the applicable statutory rates to taxexpense reported in the statements of comprehensive income profit is as follows:
2013 2012
Tax on pretax profit at 30% $ 1,172,178 $ 917,039 Adjustment for income subjected
to lower income tax rates ( 3,595 ) ( 7,019)
Tax effects of:Income subjected to
income tax holiday (ITH) ( 462,218 ) -Non-taxable income ( 44,608 ) ( 40,549 )Non-deductible expenses 5,725 6,485
Tax expense $ 667,482 $ 875,956
The net deferred tax assets relate to the following:
Statement of Comprehensive IncomeStatements of Other
Financial Position Profit or loss Comprehensive Income2013 2012 2013 2012 2013 2012
Allowance for inventory write-down $ 178,875 $ 87,396 ( $ 91,479) ( $ 12,273 ) $ - $ -
Unrealized foreign currencyloss (gain) 23,690 ( 108 ) ( 23,797) ( 42,652 ) - -
Past service cost 12,171 15,625 3,454 3,765 Allowance for impairment 6,362 43,285 36,923 ( 22,543 ) - -Post-employment benefit
obligation (asset) 4,046 ( 3,130 ) ( 7,176) 5,081 3,075 ( 2,178 )
Net Deferred Tax Assets $ 225,144 $ 143,069Deferred Tax
Expense (Income) ($ 82,075 ) ( $ 68,622 ) $ 3,075 ( $ 2,178 )
F-261

7/21/2019 PreliminaryProspectus - Century
http://slidepdf.com/reader/full/preliminaryprospectus-century 495/648
- 39 -
The Company is subject to the minimum corporate income tax (MCIT) which iscomputed at 2% of gross income, as defined under the tax regulations, or RCIT,
whichever is higher. No MCIT was reported in 2013 and 2012 as the RCIT was higherthan MCIT in both years.
In 2013 and 2012, the Company opted to claim itemized deductions.
17. RELATED PARTY TRANSACTIONS
The Company’s related parties include its ultimate parent, parent, entities under commonownership, the Company’s key management personnel and others as described inNote 2.17.
A summary of the Company’s transaction with related parties:
December 31, 2013 December 31, 2012Related Party Amount of Receivable Amount of Receivable
Category Notes Transactions (Payable) Transactions (Payable)
Ultimate Parent CompanyPurchase of goods 17.1 $ 1,451,775 ($ 1,011,289) $ 993,893 ($ 700,010 )
Accommodation of purchases 17.2 5,535,725 - 11,702,675 - Advances 17.4 1,153,218 ( 5,238,586 ) ( 5,921,302 ) ( 4,085,368 )Management and consultancy
services 17.5 753,813 ( 210,744 ) 438,395 ( 149,555 )Lease Services 17.3 489,057 125,035 1,092,821 -
Related Parties UnderCommon Ownership
Accommodation of Purchases 17.2 7,856,250 4,577,777 2,242,496 -
Key Management Personnel Compensation 17.7 42,447 - 45,539 -
Details of foregoing transaction are as follows:
17.1 Purchase of Goods
The Company buys frozen and canned fish inventories from CCC which are thenexported at cost. Purchases from CCC amounted to $1,451,775 in 2013 and $993,893 in2012, which are presented as part of Cost of Good Sold in the statement ofcomprehensive income. The outstanding payable to CCC in relation to these purchases ofgoods amounts to $1,011,289 and $700,010 as at December 31, 2013 and 2012,respectively, and presented as part of Others under the Trade and Other Payables accountin the statements of financial position (see Note 12).
17.2 Accommodation of Purchases
In normal course of the Company’s operation, the Company accommodates purchases ofraw material fish inventories and other raw materials for CCC and Columbus SeafoodsCorporation (CSC), a related party under common ownership. The total amount ofpurchases made on behalf of these related parties amounted to $13,391,975 in 2013 and$13,945,171 in 2012. The outstanding balance of such transactions amounts to $4,577,777as at December 31, 2013 (nil as at December 31, 2012), and is presented as part of Othersunder Trade and Other Receivables in the 2013 statement of financial position(see Note 6).
F-262

7/21/2019 PreliminaryProspectus - Century
http://slidepdf.com/reader/full/preliminaryprospectus-century 496/648
- 40 -
The Company did not recognize any allowance for impairment on those receivables inboth years, as these are settled in the normal course of operating cycle and none remainsas long-outstanding in any given year.
17.3 Lease Services
In 2012, the Company entered into a new agreement with CCC to lease a portion of plant,machinery and equipment and cold storage located in Brgy. Tambler, General Santos City.Both leases shall be from January 1, 2012 onwards and will continue to be in effect unlesssooner terminated. Rentals amounted to $489,057 in 2013 and $1,092,821 in 2012. As ofDecember 31, 2013, the outstanding liability arising from this transaction amounts to$125,035 (nil as of December 31, 2012) and is presented as part of part of Others underthe Trade and Other Payable account in the 2013 statement of financial position(see Note 12).
17.4 Advances from Related Parties
In the normal course of business, the Company obtains advances from CCC and Pacific
Meat Company Incorporated (PMCI), a related party under common ownership, for working capital requirements and other purposes. The balance of these advances fromrelated parties as at December 31, 2013 and 2012 is presented as Due to Related Parties inthe statements of financial position. Advances from related parties are unsecured,noninterest-bearing and repayable within 12 months.
2013 2012
Balance at beginning of year $ 4,085,368 $ 10,006,670 Additions 12,669,366 16,616,604Repayments ( 11,516,148) ( 22,537,906)
Balance at end of year $ 5,238,586 $ 4,085,368
17.5 Management and Consultancy Fees
Beginning 2011, in addition to key management personnel compensation incurred, theCompany entered into an agreement to allow CCC to allocate and charge commoncorporate expenses to its subsidiaries. The management and consultancy fees incurred bythe Company amounted to $753,813 in 2013 and $438,395 in 2012. These are presentedas part of Outside Services under Administrative Expenses (see Note 13). The Company’soutstanding liability arising from this agreement amounted to $210,744 and $149,555 as atDecember 31, 2013 and 2012, respectively, and is presented as part of Others under the
Trade and Other Payables account in the statement of financial position and is expected tobe settled in 2014 (see Note 12).
F-263

7/21/2019 PreliminaryProspectus - Century
http://slidepdf.com/reader/full/preliminaryprospectus-century 497/648
- 41 -
17.6 Financial Guarantees
The Company, jointly and severally with its related parties, entered into a cross-corporateguarantee arrangement with various local banks to secure the short-term loan availmentsof its related parties. The total guaranteed outstanding loan balance (denominated inPhilippine peso) amounts to P2,514,700,000 (or approximately $56,619,534) and
P1,447,400,000 (or approximately $35,137,891) as at December 31, 2013 and 2012,respectively. The Company did not record the allocated share in exposure measured at fair
value (or gross cash outflows) of the guarantee liability because the Company’smanagement believes and in coordination with the BOD of the Company’s ultimateparent company that probability of default in paying the Company’s related partiesrespective borrowings is low. There has been no credit default by any related parties norof the Company.
17.7 Key Management Personnel Compensation
The compensation of key management personnel including the members of ExecutiveCommittee and department heads (see Note 15.1), for employee services is shown below:
2013 2012
Short-term benefits $ 38,249 $ 41,136Post-employment benefits 4,198 4,303
$ 42,447 $ 45,539
The key management personnel compensation is in line with the agreement entered intoby the Company with CCC relating to management and consultancy fees (see Note 17.5).
18. REGISTRATION WITH BOI
On September 25, 2012, the BOI approved the Company’s application for registration as anew expanding export producer of frozen tuna loins on a non-pioneer status. TheCompany is entitled to ITH for a period of three years beginning February 1, 2013 usingthe project’s ability to contribute to the economy’s development pursuant to Article 7 ofExecutive Order 226 based on the following parameters: (1) project’s net value added;(2) job generation; (3) multiplier effect; and (4) measured capacity.
19.
EQUITY
19.1 Capital Stock
As at December 31, 2013, the Company has only one stockholder owning 100 or moreshares of the Company’s capital stock.
19.2 Retained Earnings
On September 30, 2013, the BOD approved the declaration of cash dividend amountingto P320,000,000 (or approximately $7,388,764) for distribution to stockholders of recordas of September 30, 2013. The related dividend was paid in full on November 19, 2013.
F-264
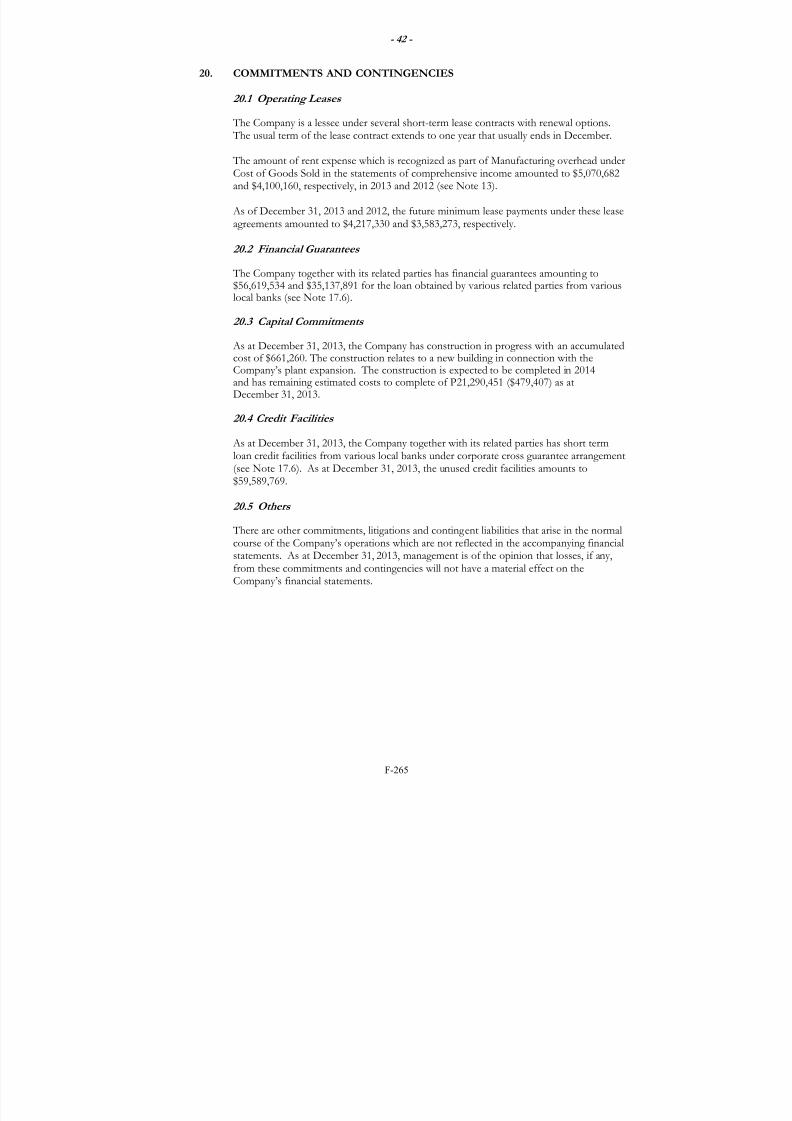
7/21/2019 PreliminaryProspectus - Century
http://slidepdf.com/reader/full/preliminaryprospectus-century 498/648
- 42 -
20. COMMITMENTS AND CONTINGENCIES
20.1 Operating Leases
The Company is a lessee under several short-term lease contracts with renewal options. The usual term of the lease contract extends to one year that usually ends in December.
The amount of rent expense which is recognized as part of Manufacturing overhead underCost of Goods Sold in the statements of comprehensive income amounted to $5,070,682and $4,100,160, respectively, in 2013 and 2012 (see Note 13).
As of December 31, 2013 and 2012, the future minimum lease payments under these leaseagreements amounted to $4,217,330 and $3,583,273, respectively.
20.2 Financial Guarantees
The Company together with its related parties has financial guarantees amounting to$56,619,534 and $35,137,891 for the loan obtained by various related parties from various
local banks (see Note 17.6).
20.3 Capital Commitments
As at December 31, 2013, the Company has construction in progress with an accumulatedcost of $661,260. The construction relates to a new building in connection with theCompany’s plant expansion. The construction is expected to be completed in 2014and has remaining estimated costs to complete of P21,290,451 ($479,407) as atDecember 31, 2013.
20.4 Credit Facilities
As at December 31, 2013, the Company together with its related parties has short term
loan credit facilities from various local banks under corporate cross guarantee arrangement(see Note 17.6). As at December 31, 2013, the unused credit facilities amounts to$59,589,769.
20.5 Others
There are other commitments, litigations and contingent liabilities that arise in the normalcourse of the Company’s operations which are not reflected in the accompanying financialstatements. As at December 31, 2013, management is of the opinion that losses, if any,from these commitments and contingencies will not have a material effect on theCompany’s financial statements.
F-265

7/21/2019 PreliminaryProspectus - Century
http://slidepdf.com/reader/full/preliminaryprospectus-century 499/648
- 43 -
21. CATEGORIES, FAIR VALUE MEASUREMENTS AND OFFSETTING OFFINANCIAL ASSETS AND FINANCIAL LIABILITIES
21.1 Carrying Amounts and Fair Values by Category
The carrying amounts and fair values of the categories of assets and liabilities presented in
the statements of financial position are shown below.
Notes December 31, 2013 December 31, 2012Carrying Fair Carrying Fair Values Values Values Values
Financial AssetsLoans and receivables:Cash 5 $ 8,207,080 $ 8,207,080 $ 2,203,548 $ 2,203,548
Trade and otherreceivables – net 6 20,158,886 20,158,886 4,619,685 4,619,685
$ 28,365,966 $ 28,365,966 $ 6,823,233 $ 6,823,233Financial Liabilities
Financial liabilities atamortized cost:
Current:Interest-bearing loans 11 $ 45,021,840 $ 45,021,840 $ 33,518,645 $ 33,518,645
Trade and other payables 12 8,199,726 8,199,726 7,285,945 7,285,945 Advances from
related parties 17.4 5,238,586 5,238,586 4,085,368 4,085,368Non-current –
Interest-bearing loans 11 - - 364,148 364,148
$ 58,460,152 $ 58,460,152 $ 45,254,106 $ 45,254,106
See Notes 2.3 and 2.7 for a description of the accounting policies for each category offinancial instrument. A description of the Company’s risk management objectives andpolicies for financial instruments is provided in Note 4.
Management considered the carrying amounts of these financial instruments to approximatetheir fair values as at December 31, 2013 and 2012.
21.2 Fair Value Hierarchy
In accordance with PFRS 13, the fair value of financial assets and liabilities andnon-financial assets which are measured at fair value on a recurring or non-recurring basisand those assets and liabilities not measured at fair value but for which fair value is disclosedin accordance with other relevant PFRS, are categorized into three levels based on thesignificance of inputs used to measure the fair value. The fair value hierarchy has thefollowing levels:
a)
Level 1: quoted prices (unadjusted) in active markets for identical assets orliabilities that an entity can access at the measurement date;b)
Level 2: inputs other than quoted prices included within Level 1 that areobservable for the asset or liability, either directly (i.e., as prices) or indirectly(i.e., derived from prices); and,
c)
Level 3: inputs for the asset or liability that are not based on observable marketdata (unobservable inputs).
The level within which the asset or liability is classified is determined based on the lowestlevel of significant input to the fair value measurement.
F-266

7/21/2019 PreliminaryProspectus - Century
http://slidepdf.com/reader/full/preliminaryprospectus-century 500/648
- 44 -
For purposes of determining the market value at Level 1, a market is regarded as active ifquoted prices are readily and regularly available from an exchange, dealer, broker, industrygroup, pricing service, or regulatory agency, and those prices represent actual and regularlyoccurring market transactions on an arm’s length basis.
The Company has no financial assets and financial liabilities measured at fair value or that
are not carried at fair value but are required to be disclosed as at December 31, 2013 and2012. For financial asset and financial liabilities measured at amortized cost managementconsiders that their carrying amounts approximate their fair values (see Note 21.1).
21.3 Offsetting of Financial Assets and Financial Liabilities
The Company has no financial assets and financial liabilities which are presented as net asat December 31, 2013 and 2012. Currently, certain financial assets and financial liabilitiesare settled on a gross basis, except for certain transactions where the customer alsosupplies certain raw materials to the Company and wherein such amounts can be settledon a net basis upon the approval of both parties. As such, the Company’s relatedoutstanding receivables amounting to $5.1 million can be offset by the amount of related
outstanding liabilities of $1.2 million as of December 31, 2013. There was no similartransaction source of potential offsetting in 2012.
22. CAPITAL MANAGEMENT OBJECTIVES, POLICIES AND PROCEDURES
The Company’s capital management objectives are:
• To ensure the Company’s ability to continue as a going concern;
• To meet maturing obligation to creditors; and,
• To provide an adequate return to shareholders by pricing products and servicescommensurately with the level of risk.
The Company monitors capital on the basis of the carrying amount of equity as presentedon the face of the statements of financial position. The Company is required to meet acertain level of debt-to-equity ratio. With the declaration of cash dividend as ofSeptember 30, 2013 (see Note 19) the Company’s equity account as at December 31, 2013significantly declined. As a result, the Company breached the level set forth in thelong-term loan agreement. However, the subsequent full settlement of the loan balance asof February 27, 2014 cured bank imposed penalties, if any (see Note 11).
Capital for the reporting periods under review is summarized as follows:
2013 2012
Total liabilities $ 58,503,306 $ 49,186,500 Total equity 16,744,884 20,901,045
Debt-to-equity ratio 3.49 : 1 2.35 : 1
The Company sets the amount of capital in proportion to its overall financing structure,i.e., equity and financial liabilities. The Company manages the capital structure and makesadjustments to it in the light of changes in economic conditions and the risk characteristicsof the underlying assets.
F-267

7/21/2019 PreliminaryProspectus - Century
http://slidepdf.com/reader/full/preliminaryprospectus-century 501/648
- 45 -
23. SUPPLEMENTARY INFORMATION ON STATEMENT OF FINANCIALPOSITION AND COMPREHENSIVE INCOME
The Company’s financial statements are presented in U.S. dollars, its functional currency. The following information, which shows amounts of the Company’s statements offinancial position and statements of comprehensive income in Philippine pesos, is
presented for purposes of providing supplementary information to certain users and is notintended to be a presentation in accordance with PFRS. Under this supplementalinformation, transactions denominated in Philippines pesos were presented using theamounts at the dates of the transactions, while transactions denominated in U.S. dollars
were translated using appropriate exchange rates. Foreign currency gains and losses arenot translated.
Statements of Financial Position
2013 2012
ASSETS
Current assets P 2,651,407,165 P 2,194,606,531Non-current assets 606,584,984 674,726,869
Total Assets P 3,257,992,149 P 2,869,333,400
LIABILITIES AND EQUITY
Current liabilities P 2,598,351,018 P 2,011,090,293Non-current liabilities - 14,355,250
Total Liabilities 2,598,351,018 2,025,445,543
Equity 659,641,131 843,887,857
Total Liabilities and Equity P 3,257,992,149 P 2,869,333,400
Statements of Comprehensive Income
2013 2012
Revenue – net P 5,923,105,471 P 3,793,036,607Cost of goods sold ( 5,551,720,786) ( 3,575,252,766 )Other operating expenses
and other charges ( 205,169,853) ( 93,713,393 ) Tax expense ( 29,979,210) ( 37,198,563 )
Net profit P 136,235,622 P 86,871,885
The translation into Philippine pesos should not be construed as a representation that theU.S. dollar amounts could be converted into Philippine Peso amounts or at any other ratesof exchange.
F-268

7/21/2019 PreliminaryProspectus - Century
http://slidepdf.com/reader/full/preliminaryprospectus-century 502/648
- 46 -
24. SUPPLEMENTARY INFORMATION REQUIRED BY THE BUREAU OFINTERNAL REVENUE
Presented below is the supplementary information which is required by the Bureau ofInternal Revenue (BIR) under its existing revenue regulations to be disclosed as part ofthe notes to financial statements. This supplementary information is not a required
disclosure under PFRS.
24.1 Requirements under Revenue Regulations (RR) 15-2010
The information on taxes, duties and license fees paid or accrued during the taxable yearrequired under RR 15-2010 issued on November 25, 2010 are as follows:
(a)
Output VAT
In 2013, the Company declared output VAT as follows:
In Philippine Pesos In U.S. Dollars
Output OutputTax Base VAT Tax Base VAT
VATable sales P 204,527,796 P 24,543,336 $ 4,605,030 $ 552,604
Zero-rated sales 5,447,951,376 - 122,662,930 -
Exempt sales 913,078,125 - 20,558,340 -
P 6,565,557,297 P 24,543,336 $ 147,826,300 $ 552,604
The Company’s zero-rated and VAT zero-rated and exempt sales/receipt were determinedpursuant to Section 106(A)(2)(a), Zero-rated VAT on Export Sale of Goods , and Section 109,VAT Exempt Transactions , of the 1997 National Internal Revenue Code, as amended. Thetax bases are included as part of Sales of Goods in the 2013 statement of comprehensive
income.
Total output VAT paid during the year amounting to P13,138,511 ($295,842) net ofallowable input VAT.
(b)
Input Value-added Tax
The movements in Input VAT in 2013 are summarized below.
In Philippine In U.S.Pesos Dollars
Balance at beginning of year P 27,337,273 $ 663,655Goods for resale/manufacture
or further processing 581,015 13,081Capital goods subject to amortization 897,722 20,213Services lodged under cost of goods sold 6,048,961 136,195Claims for tax credit/refund ( 8,725,287 ) ( 196,454 )
Applied against output VAT ( 11,403,825 ) ( 256,762 )Foreign currency adjustment - ( 48,145 )
Balance at end of year P 14,735,859 $ 331,784
F-269

7/21/2019 PreliminaryProspectus - Century
http://slidepdf.com/reader/full/preliminaryprospectus-century 503/648
- 47 -
The balance of Input VAT amounting to P14,735,859 ($331,784) as at December 31, 2013is presented as part of Other Non-current Assets in the 2013 statement of financialposition (see Note 10).
(c) Taxes on Importation
In 2013, the total landed cost of the Company’s imported inventory for the use in businessamounted to P4,485,108,643 ($105,658,759). This amount includes customs’ duties andtariff fees of P539,022 ($12,698).
(d)
Excise Tax
The Company did not have any transactions in 2013 which are subject to excise tax.
(e)
Documentary Stamp Tax (DST)
In 2013, the total DST paid and accrued by the Company on loan instruments amountedto P9,382,081 ($221,020).
(f)
Taxes and Licenses
The details of taxes and licenses for the year 2013 are broken down as follows:
Philippine U.S.Pesos Dollars
DST P 9,382,081 $ 221,020Business tax 2,638,576 62,159Real estate tax 2,092,098 49,285
Miscellaneous 1,033,565 24,348
P 15,146,320 $ 356,812
The amounts of taxes and licenses for the year 2013 are presented as part of Taxes andlicenses under Administrative Expenses in the 2013 statement of comprehensive income(see Note 13).
(g)
Withholding Taxes
The details of total withholding taxes for the year ended December 31, 2013are shown below.
Philippine U.S.Pesos Dollars
Expanded P 25,507,685 $ 574,316Compensation and benefits 3,376,105 76,014Final 537,104 12,093
P 29,420,894 $ 662,423
F-270

7/21/2019 PreliminaryProspectus - Century
http://slidepdf.com/reader/full/preliminaryprospectus-century 504/648
- 48 -
(h)
Deficiency Tax Assessment and Tax Cases
As at December 31, 2013, the Company does not have any deficiency tax assessment withthe BIR or tax cases outstanding or pending in courts or bodies outside of the BIR in anyof the open years.
24.2 Requirements under RR 19-2011
RR 19-2011 requires schedules of taxable revenues and other non-operating income,costs of sales and services, and itemized deductions, to be disclosed in the notes tofinancial statements.
The amounts of taxable revenues and income, and deductible costs and expensespresented below are based on relevant tax regulations issued by the BIR, hence, may notbe the same as the amounts reflected in the 2013 statement of comprehensive income.
(a) Taxable Revenues
The composition of the Company’s taxable revenues arising from sale of goods for theyear ended December 31, 2013 is presented below.
U.S. Dollar Philippine Peso
Exempt $ 69,650,674 P 2,972,532,223Regular rate 68,468,547 2,922,081,741
$ 138,119,221 P 5,894,613,964
Exempt transactions were determined pursuant to the guidelines on the issuance ofcertification to BOI-registered Company per Revenue Memorandum Order 9-2000, TaxTreatment of treatment of Sales of Goods, Properties and Services made by VAT-registered supplier to
BOI-registered Manufacturers-Exporters with 100% Export Sales .
(b)
Deductible Costs of Sale
Deductible costs of sales at regular tax rate for the year ended December 31, 2013comprises the following:
Exempt Regular RateU.S. Dollar Philippine Peso U.S. Dollar Philippine Peso
Finished goodsat beginning of year $ 8,180,447 P 222,375,120 $ 7,646,716 P 207,866,300
Cost of goods
manufactured 61,883,318 2,775,279,130 67,956,287 3,033,202,048
Total goods available
for sale 70,063,765 2,997,654,250 75,603,003 3,241,068,348Finished goods at end
of year 4,053,874 180,048,758 11,773,289 522,898,873
$ 66,009,891 P 2,817,605,493 $ 63,829,714 P 2,718,169,475
F-271

7/21/2019 PreliminaryProspectus - Century
http://slidepdf.com/reader/full/preliminaryprospectus-century 505/648
- 49 -
(c)
Taxable Non-operating and Other Income
The details of taxable non-operating and other income in 2013 which are subject to regulartax rate are shown below.
Philippine U.S.Pesos Dollars
Rental income P 20,760,000 $ 489,057Others 178,585 4,207
P 20,938,585 $ 493,264
(d)
Itemized Deductions
The amounts of itemized deductions at regular tax rate for the year endedDecember 31, 2013 are as follows:
Exempt Regular RateU.S. Dollar Philippine Peso U.S. Dollar Philippine Peso
Freight $ 549,024 P 23,668,348 $ 1,009,306 P 43,711,747Interest 513,748 22,147,618 525,097 22,741,268Outside services 428,937 18,491,416 501,392 21,714,630
Taxes and licenses 161,588 6,966,040 188,883 8,180,280Salaries and employee
benefits 152,526 5,390,358 178,290 6,395,369Depreciation and
amortization 64,251 3,092,741 75,104 3,631,832Bank charges 45,361 1,955,516 46,363 2,007,932Commissions 22,029 949,657 40,497 1,753,867Losses 26,850 1,146,939 23,301 999,903Bad debts 10,048 433,189 11,746 508,698Rent 3,505 151,087 4,097 177,422Supplies 3,180 137,103 3,718 161,001Insurance 2,559 110,336 2,992 129,568
Communication, lightand water 1,888 81,380 2,207 95,566
Miscellaneous 40,929 1,775,192 44,550 1,918,570
$ 2,026,423 P 86,496,920 $ 2,657,543 P 114,127,653
F-272

7/21/2019 PreliminaryProspectus - Century
http://slidepdf.com/reader/full/preliminaryprospectus-century 506/648

7/21/2019 PreliminaryProspectus - Century
http://slidepdf.com/reader/full/preliminaryprospectus-century 507/648

7/21/2019 PreliminaryProspectus - Century
http://slidepdf.com/reader/full/preliminaryprospectus-century 508/648

7/21/2019 PreliminaryProspectus - Century
http://slidepdf.com/reader/full/preliminaryprospectus-century 509/648
DRAFT (For Discussion Purpose O 2011 2010
(As Restated - (As Restated -
Notes 2012 See Notes 2 and 19) See Note 2)
CURRENT ASSETS
Cash and cash equivalents 5 2,203,548$ 2,060,127$ 1,868,391$
Trade and other receivables - net 6 4,619,685 5,948,373 7,538,536
Inventories 7 44,845,549 38,674,777 32,269,026
Other current assets 8 973,640 750,169 833,048
Total Current Assets 52,642,422 47,433,446 42,509,001
NON-CURRENT ASSETS
Property, plant and equipment - net 9 16,626,268 17,632,274 17,714,576
Deferred tax assets - net 16 141,504 71,896 223,373
Retirement benefit asset 15 15,652 17,692 27,096Other non-current assets 10 665,352 692,415 830,171
Total Non-current Assets 17,448,776 18,414,277 18,795,216
TOTAL ASSETS 70,091,198$ 65,847,723$ 61,304,217$
CURRENT LIABILITIES
Interest-bearing loans 11 33,518,645$ 24,062,102$ 23,322,320$
Trade and other payables 12 10,868,961 9,372,685 4,951,619
Income tax payable 349,378 241,223 -
Dividends payable 19 - 1,732,062 - Advances from related parties 17 4,085,368 10,006,670 10,839,318
Total Current Liabilities 48,822,352 45,414,742 39,113,257
NON-CURRENT LIABILITY
Interest-bearing loan 11 364,148 1,707,339 3,076,222
Total Liabilities 49,186,500 47,122,081 42,189,479
EQUITY
Capital stock 19 11,333,722 11,333,722 7,286,958
Additional paid-in capital 3,296,386 3,296,386 3,296,386
Revaluation reserves 35,773 35,773 35,773
Retained earnings 19 6,238,817 4,059,761 8,495,621
Total Equity 20,904,698 18,725,642 19,114,738
TOTAL LIABILITIES AND EQUITY 70,091,198$ 65,847,723$ 61,304,217$
GENERAL TUNA CORPORATION
LIABILITIES AND EQUITY
A S S E T S
See Notes to Financial Statements.
(Amounts in United States Dollars)
DECEMBER 31, 2012, 2011 AND 2010
STATEMENTS OF FINANCIAL POSITION
(A Wholly Owned Subsidiary of Century Canning Corporation)
F-276
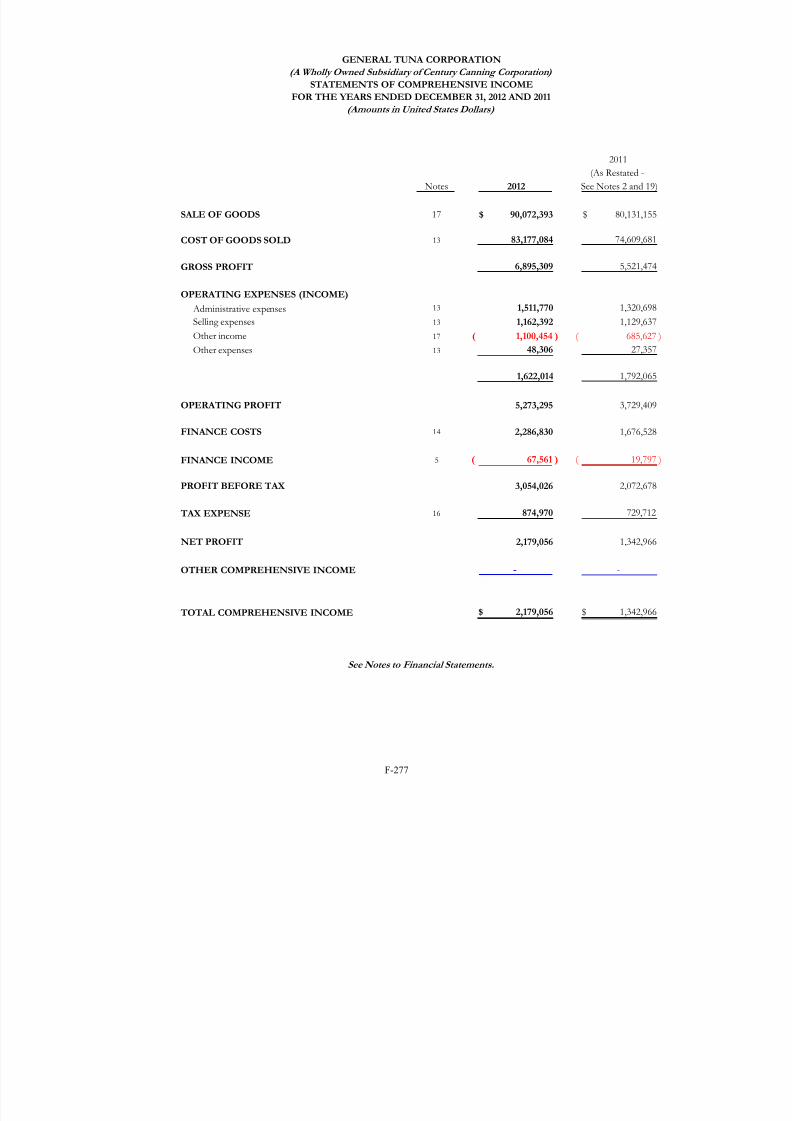
7/21/2019 PreliminaryProspectus - Century
http://slidepdf.com/reader/full/preliminaryprospectus-century 510/648
2011
(As Restated -
Notes 2012 See Notes 2 and 19)
SALE OF GOODS 17 90,072,393$ 80,131,155$
COST OF GOODS SOLD 13 83,177,084 74,609,681
GROSS PROFIT 6,895,309 5,521,474
OPERATING EXPENSES (INCOME)
Administrative expenses 13 1,511,770 1,320,698
Selling expenses 13 1,162,392 1,129,637
Other income 17 1,100,454 )( 685,627 )(
Other expenses 13 48,306 27,357
1,622,014 1,792,065
OPERATING PROFIT 5,273,295 3,729,409
FINANCE COSTS 14 2,286,830 1,676,528
FINANCE INCOME 5 67,561 )( 19,797 )(
PROFIT BEFORE TAX 3,054,026 2,072,678
TAX EXPENSE 16 874,970 729,712
NET PROFIT 2,179,056 1,342,966
OTHER COMPREHENSIVE INCOME - -
TOTAL COMPREHENSIVE INCOME 2,179,056$ 1,342,966$
GENERAL TUNA CORPORATION
See Notes to Financial Statements.
STATEMENTS OF COMPREHENSIVE INCOME
(A Wholly Owned Subsidiary of Century Canning Corporation)
(Amounts in United States Dollars)
FOR THE YEARS ENDED DECEMBER 31, 2012 AND 2011
F-277

7/21/2019 PreliminaryProspectus - Century
http://slidepdf.com/reader/full/preliminaryprospectus-century 511/648
Additional Revaluation Retained
Notes Capital Stock Paid-in Capital Reserves Earnings Total
Balance at January 1, 2012 As previously reported 11,333,722$ 3,296,386$ 35,773$ 4,916,992$ 19,582,87$
Prior period adjustment 2, 19 - - - 857,231 )( 857,23(
As restated 11,333,722 3,296,386 35,773 4,059,761 18,725,64
Net profit for the year - - - 2,179,056 2,179,05
Balance at December 31, 2012 11,333,722$ 3,296,386$ 35,773$ 6,238,817$ 20,904,69$
Balance at January 1, 2011 7,286,958$ 3,296,386$ 35,773$ 8,495,621$ 19,114,73$
Cash dividend 19 - - - 1,732,062 )( 1,732,06(
Stock dividend 19 4,046,764 - - 4,046,764 )( -
Net profit for the year - - - 1,342,966 1,342,96
Balance at December 31, 2011 11,333,722$ 3,296,386$ 35,773$ 4,059,761$ 18,725,64$
GENERAL TUNA CORPORATION
(A Wholly Owned Subsidiary of Century Canning Corporation)
STATEMENTS OF CHANGES IN EQUITY
FOR THE YEARS ENDED DECEMBER 31, 2012 AND 2011
(Amounts in United States Dollars)
DRAFT (For Discussion Purpose Only)
See Notes to Financial Statements.
F-278

7/21/2019 PreliminaryProspectus - Century
http://slidepdf.com/reader/full/preliminaryprospectus-century 512/648
Notes 2012 2011
CASH FLOWS FROM OPERATING ACTIVITIES
Profit before tax 3,054,026$ 2,702,678$
Adjustments for:
Depreciation 9 2,729,259 2,461,014
Unrealized foreign currency loss 1,361,096 867,227
Interest expense 14 816,041 605,044
Finance income 5 67,561 )( 19,797 )(
Loss on retirement of property and equipment 1,508 27,358
Operating profit before working capital changes 7,894,369 6,643,524
Decrease in trade and other receivables 1,360,818 1,584,338
Increase in inventories 6,170,772 )( 7,035,751 )(
Decrease (increase) in other current assets 765,487 )( 47,701
Decrease in retirement benefit asset 2,040 9,404
Decrease in other non-current assets 30,556 136,926
Increase in trade and other payables 875,219 2,859,741
Cash generated from operations 3,226,743 4,245,883
Income taxes paid 262,994 )( 128,421 )(
Net Cash From Operating Activities 2,963,749 4,117,462
CASH FLOWS USED IN INVESTING ACTIVITIES
Acquisitions of property, plant and equipment 9 1,724,761 )( 2,494,151 )(
Interest received 67,561 19,797
Proceeds from sale of property, plant and equipment - 88,081
Net Cash Used in Investing Activities 1,657,200 )( 2,386,273 )(
CASH FLOWS USED IN FINANCING ACTIVITIES
Proceeds from short-term interest-bearing loans 8,691,770 756,164
Repayments of advances from related parties 5,921,302 )( 690,564 )(
Payment of dividends declared in prior year 19 1,732,062 )( -
Repayments of long-term interest-bearing loans 1,456,594 )( 1,385,265 )(
Interest paid 763,925 )( 229,794 )(
Net Cash Used in Financing Activities 1,182,113 )( 1,549,459 )(
NET INCREASE IN CASH AND CASH EQUIVALENTS 124,436 181,730
Effect of Exchange Rate Changes on Cash and Cash Equivalents 18,985 10,006
BEGINNING OF YEAR CASH AND CASH EQUIVALENTS 2,060,127 1,868,391
END OF YEAR CASH AND CASH EQUIVALENTS 2,203,548$ 2,060,127$
Supplemental Information on Non-cash Investing and Financing Activities:
1)
2)
STATEMENTS OF CASH FLOWS
(A Wholly Owned Subsidiary of Century Canning Corporation)
GENERAL TUNA CORPORATION
See Notes to Financial Statements.
DRAFT (For Discussion Purpose On
(Amounts in United States Dollars)
FOR THE YEARS ENDED DECEMBER 31, 2012 AND 2011
In the same year, the Company transferred certain available-for-sale financial assets to its parent company amounting to $185,370
as payment for certain advances from the parent company (see Note 17.2)
In 2011, the Company issued common shares amounting to $4,046,764 as stocks dividends (see Note 19); declared cash dividend
amounting to $1,732,062 which remained unpaid as at December 31, 2011 (see Note 19).
F-279

7/21/2019 PreliminaryProspectus - Century
http://slidepdf.com/reader/full/preliminaryprospectus-century 513/648
DRAFT (For Discussion
Purpose Only)
GENERAL TUNA CORPORATION(A Wholly Owned Subsidiary of Century Canning Corporation)
NOTES TO FINANCIAL STATEMENTSDECEMBER 31, 2012 AND 2011
(Amounts in United States Dollars)
1. CORPORATE INFORMATION
General Tuna Corporation (the Company) was incorporated in the Philippines andregistered with the Securities and Exchange Commission (SEC) on March 10, 1997.It is presently engaged in manufacturing and exporting private label canned, pouched andfrozen tuna products.
The Company is a wholly owned subsidiary of Century Canning Corporation (CCC or theparent company), a company incorporated and domiciled in the Philippines. CCC ispresently engaged in the manufacturing and distribution of canned tuna products for the
Philippine market.
The registered office, which is also the principal place of business, of CCC and theCompany is located at 32 Arturo Drive, Bagumbayan, Taguig, Metro Manila and theCompany’s processing plant is located at Brgy. Tambler, General Santos City.
The financial statements of the Company for the year ended December 31, 2012(including the comparatives for the year ended December 31, 2011) were authorized forissue by the Company’s Vice President for Finance on April 12, 2013.
2. SUMMARY OF SIGNIFICANT ACCOUNTING POLICIES
The significant accounting policies that have been used in the preparation of thesefinancial statements are summarized below and in the succeeding pages. The policies havebeen consistently applied to all the years presented, unless otherwise stated.
2.1 Basis of Preparation of Financial Statements
(a)
Statement of Compliance with Philippine Financial Reporting Standards
The financial statements of the Company have been prepared in accordance withPhilippine Financial Reporting Standards (PFRS). PFRS are adopted by the FinancialReporting Standards Council (FRSC) from the pronouncements issued by the
International Accounting Standards Board (IASB).
The financial statements have been prepared using the measurement bases specified byPFRS for each type of asset, liability, income and expense. The measurement basesare more fully described in the accounting policies in the succeeding pages.
F-280

7/21/2019 PreliminaryProspectus - Century
http://slidepdf.com/reader/full/preliminaryprospectus-century 514/648
- 2 -
DRAFT (For DiscussionPur ose Onl
(b)
Presentation of Financial Statements
The financial statements are presented in accordance with Philippine AccountingStandard (PAS) 1, Presentation of Financial Statements . The Company presents all items ofincome and expense in a single statement of comprehensive income.
Two comparative periods are presented for the statement of financial position whenthe Company applies an accounting policy retrospectively or makes a retrospectiverestatement of items in its financial statements, or reclassifies items in the financialstatements. In 2012, the Company restated its 2011 financial statements to reclassifythe amount of cold storage rentals, which was inadvertently included as part of theCompany’s inventoriable costs in 2011, should be expensed outright as the saidexpense is not directly related to the cost of its inventories.
(c) Functional and Presentation Currency
These financial statements are presented in United States (U.S.) Dollars, theCompany’s functional and presentation currency, and all values represent absolute
amounts except when otherwise indicated.
Items included in the financial statements of the Company are measured using itsfunctional currency. Functional currency is the currency of the primary economicenvironment in which the Company operates.
2.2 Adoption of New and Amended PFRS
(a)
Effective in 2012 that are Relevant to the Company
In 2012, the Company adopted the following amendments to PFRS that are relevantto the Company and effective for financial statements for the annual periods beginning
on or after July 1, 2011 or January 1, 2012:
PFRS 7 (Amendment) : Financial Instruments: Disclosures – Transfers of Financial Assets
PAS 12 (Amendment) : Income Taxes – Deferred Tax:Recovery of Underlying Assets
Discussed below are the relevant information about these amended standards.
(i)
PFRS 7 (Amendment), Financial Instruments: Disclosures – Transfers of Financial Assets . The amendment requires additional disclosures that will allow users offinancial statements to understand the relationship between transferred financial
assets that are not derecognized in their entirety and the associated liabilities;and, to evaluate the nature of, and risk associated with any continuinginvolvement of the reporting entity in financial assets that are derecognized intheir entirety. The Company did not transfer any financial asset involving thistype of arrangement; hence, the amendment did not result in any significantchange in the Company’s disclosures in its financial statements.
F-281
7/21/2019 PreliminaryProspectus - Century
http://slidepdf.com/reader/full/preliminaryprospectus-century 515/648
- 3 -
DRAFT (For DiscussionPur ose Onl
(ii)
PAS 12 (Amendment), Income Taxes – Deferred Tax: Recovery of Underlying Assets . The amendment introduces a rebuttable presumption that the measurement of adeferred tax liability or asset that arises from investment property measured atfair value under PAS 40, Investment Property, should reflect the tax consequence ofrecovering the carrying amount of the asset entirely through sale. Thepresumption is rebutted for depreciable investment property (e.g., building) that
is held within a business model whose objective is to consume substantially all ofthe economic benefits embodied in the asset over time, rather than through sale.Moreover, Standing Interpretation Committee 21, Income Taxes – Recovery ofRevalued Non-Depreciable Assets , is accordingly withdrawn and is incorporatedunder PAS 12 requiring that deferred tax on non-depreciable assets that aremeasured using the revaluation model in PAS 16, Property, Plant and Equipment,should always be measured on a sale basis of the asset. The amendment has nosignificant impact on the Company’s financial statements as the Company has noinvestment property while the Company’s land classified as property, plant andequipment which is measured at fair value is taxable with the same rateregardless of whether these assets will be sold or used in operation.
(b)
Effective in 2012 that is not Relevant to the Company
Of the amendments to PFRS that are effective in 2012 only PFRS 1, First-time Adoptionof PFRS , is not relevant to the Company.
(c)
Early Adoption of Philippine Accounting Standard 1 (Amendment), Presentation of FinancialStatements
In the preparation of the 2012 financial statements, the Company adopted early theamendment made to PAS 1, issued by the IASB and adopted by the FRSC as part ofthe Annual Improvements to PFRS 2009-2011 Cycle, which will be effective for theannual period beginning on or after January 1, 2013. The amendment clarifies that
when an entity applies an accounting policy retrospectively or makes a retrospectiverestatement or reclassification of items in its financial statements that has a materialeffect on the information in the statement of financial position at the beginning of thepreceding period (i.e., opening statement of financial position), it shall present a thirdstatement of financial position as at the beginning of that preceding period. Otherthan disclosures of certain specified information as described below, related notes tothe opening statement of financial position are not required to be presented.
F-282

7/21/2019 PreliminaryProspectus - Century
http://slidepdf.com/reader/full/preliminaryprospectus-century 516/648
- 4 -
DRAFT (For DiscussionPur ose Onl
(d)
Effective Subsequent to 2012 but not Adopted Early
There are new PFRS, amendments, annual improvements and interpretations toexisting standards that are effective for periods subsequent to 2012. Management hasinitially determined the following pronouncements, which the Company will apply inaccordance with their transitional provisions, to be relevant to its financial statements:
(i)
PAS 1 (Amendment), Financial Statements Presentation – Presentation of Items of OtherComprehensive Income (effective from July 1, 2012). The amendment requires anentity to group items presented in other comprehensive income into those that,in accordance with other PFRSs: (a) will not be reclassified subsequently toprofit or loss and (b) will be reclassified subsequently to profit or loss whenspecific conditions are met. The Company’s management does not expect thisamendment to have an impact on the Company’s financial statements as theCompany does not have any transaction recognized in other comprehensiveincome.
(ii) PAS 19 (Revised), Employee Benefits (effective from January 1, 2013). The revision
made a number of changes as part of the improvements throughout thestandard. The main changes relate to defined benefit plans as follows:
• eliminates the corridor approach under the existing guidance of PAS 19and requires an entity to recognize all actuarial gains and losses arising inthe reporting period;
• streamlines the presentation of changes in plan assets and liabilitiesresulting in the disaggregation of changes into three main components ofservice costs, net interest on net defined benefit obligation or asset, andremeasurement; and,
•
enhances disclosure requirements, including information about thecharacteristics of defined benefit plans and the risks that entities areexposed to through participation in those plans.
Currently, the Company is using the corridor approach and its unrecognizedactuarial loss as at December 31, 2012 amounts to $4,450 which will beretrospectively recognized as loss in other comprehensive income in 2013(see Note 15.2).
(iii)
PFRS 7 (Amendment), Financial Instruments: Disclosures – Offsetting Financial Assetsand Financial Liabilities (effective from January 1, 2013). The amendment requiresqualitative and quantitative disclosures relating to gross and net amounts of
recognized financial instruments that are set-off in accordance with PAS 32,Financial Instruments: Presentation . The amendment also requires disclosure ofinformation about recognized financial instruments which are subject toenforceable master netting arrangements or similar agreements, even if they arenot set-off in the statement of financial position, including those which do notmeet some or all of the offsetting criteria under PAS 32 and amounts related to afinancial collateral. These disclosures will allow financial statement users toevaluate the effect or potential effect of netting arrangements, including rights ofset-off associated with recognized financial assets and financial liabilities on theentity’s financial position. The Company has initially assessed that the adoptionof the amendment will not have a significant impact on its financial statements.
F-283

7/21/2019 PreliminaryProspectus - Century
http://slidepdf.com/reader/full/preliminaryprospectus-century 517/648
- 5 -
DRAFT (For DiscussionPur ose Onl
(iv)
PFRS 13, Fair Value Measurement (effective from January 1, 2013). This standardaims to improve consistency and reduce complexity by providing a precisedefinition of fair value and a single source of fair value measurement anddisclosure requirements for use across PFRS. The requirements do not extendthe use of fair value accounting but provide guidance on how it should beapplied where its use is already required or permitted by other standards.
Management is in the process of reviewing its valuation methodologies forconformity with the new requirements and has yet to assess the impact of thenew standard on the Company’s financial statements.
(v)
PAS 32 (Amendment), Financial Instruments: Presentation – Offsetting Financial Assetsand Financial Liabilities (effective from January 1, 2014). The amendmentprovides guidance to address inconsistencies in applying the criteria foroffsetting financial assets and financial liabilities. It clarifies that a right ofset-off is required to be legally enforceable, in the normal course of business; inthe event of default; and in the event of insolvency or bankruptcy of the entityand all of the counterparties. The amendment also clarifies the principle behindnet settlement and provided characteristics of a gross settlement system that
would satisfy the criterion for net settlement. The Company does not expectthis amendment to have a significant impact on its financial statements.
(vi) PFRS 9, Financial Instruments: Classification and Measurement (effective from January 1, 2015). This is the first part of a new standard on financial instrumentsthat will replace PAS 39, Financial Instruments: Recognition and Measurement , in itsentirety. This chapter covers the classification and measurement of financialassets and financial liabilities and it deals with two measurement categories forfinancial assets: amortized cost and fair value. All equity instruments will bemeasured at fair value while debt instruments will be measured at amortized costonly if the entity is holding it to collect contractual cash flows which representpayment of principal and interest.
The accounting for embedded derivatives in host contracts that are financialassets is simplified by removing the requirement to consider whether or not theyare closely related, and, in most arrangement, does not require separation fromthe host contract.
For liabilities, the standard retains most of the PAS 39 requirements whichinclude amortized cost accounting for most financial liabilities, with bifurcationof embedded derivatives. The main change is that, in case where the fair valueoption is taken for financial liabilities, the part of a fair value change due to anentity’s own credit risk is recorded in other comprehensive income rather than inprofit or loss, unless this creates an accounting mismatch.
To date, other chapters of PFRS 9 dealing with impairment methodology andhedge accounting are still being completed.
Further, in November 2011, the IASB tentatively decided to consider makinglimited modifications to International Financial Reporting Standard 9’s financialasset classification model to address certain application issues.
F-284

7/21/2019 PreliminaryProspectus - Century
http://slidepdf.com/reader/full/preliminaryprospectus-century 518/648
- 6 -
DRAFT (For DiscussionPur ose Onl
The Company does not expect to implement and adopt PFRS 9 until its effectivedate. In addition, management is currently assessing the impact of PFRS 9 onthe financial statements of the Company and it plans to conduct acomprehensive study of the potential impact of this standard prior to itsmandatory adoption date to assess the impact of all changes.
(vii)
2009-2011 Annual Improvements to PFRS. Annual improvements to PFRS(2009-2011 Cycle) made minor amendments to a number of PFRS, which areeffective for annual periods beginning on or after January 1, 2013. Among thoseimprovements, the following amendments are relevant to the Company butmanagement does not expect a material impact on the Company’s financialstatements:
(a)
PAS 16 (Amendment), Property, Plant and Equipment – Classification ofServicing Equipment . The amendment addresses a perceived inconsistencyin the classification requirements for servicing equipment which resultedin classifying servicing equipment as part of inventory when it is used formore than one period. It clarifies that items such as spare parts, stand-by
equipment and servicing equipment shall be recognized as property, plantand equipment when they meet the definition of property, plant andequipment, otherwise, these are classified as inventory.
(b)
PAS 32 (Amendment), Financial Instruments – Presentation – Tax Effect ofDistributions to Holders of Equity Instruments . The amendment clarifies thatthe consequences of income tax relating to distributions to holders of anequity instrument and to transaction costs of an equity transaction shall beaccounted for in accordance with PAS 12. Accordingly, income taxrelating to distributions to holders of an equity instrument is recognized inprofit or loss while income tax related to the transaction costs of an equitytransaction is recognized in equity.
2.3 Financial Assets
Financial assets are recognized when the Company becomes a party to the contractualterms of the financial instrument. Financial assets other than those designated andeffective as hedging instruments are classified into the following categories: financialassets at fair value through profit or loss (FVTPL), loans and receivables, held-to-maturityinvestments and available-for-sale (AFS) financial assets. Financial assets are assigned tothe different categories by management on initial recognition, depending on the purposefor which the investments were acquired. Regular purchases and sales of financial assetsare recognized on their trade date. All financial assets that are not classified as at FVTPLare initially recognized at fair value plus any directly attributable transaction costs.
Financial assets carried at FVTPL are initially recorded at fair value and related transactioncosts are recognized in profit or loss.
Loans and receivables are non-derivative financial assets with fixed or determinablepayments that are not quoted in an active market. They arise when the Company providesmoney, goods or services directly to a debtor with no intention of trading the receivables.
They are included in current assets, except for maturities greater than 12 months after theend of the reporting period which are classified as non-current assets.
F-285

7/21/2019 PreliminaryProspectus - Century
http://slidepdf.com/reader/full/preliminaryprospectus-century 519/648
- 7 -
DRAFT (For DiscussionPur ose Onl
Loans and receivables are subsequently measured at amortized cost using the effectiveinterest method for maturities extending beyond one year, less any impairment losses.
Any change in their value is recognized in profit or loss. Impairment loss is provided when there is objective evidence that the Company will not be able to collect all amountsdue to it in accordance with the original terms of the receivables. The amount of theimpairment loss is determined as the difference between the assets’ carrying amount and
the present value of estimated cash flows.
The Company’s financial assets categorized as loans and receivables are presented as Cashand Cash Equivalents and Trade and Other Receivables (except Deposit on purchases) inthe statement of financial position. Cash and cash equivalents are defined as cash onhand, demand deposits and short-term, highly liquid investments readily convertible toknown amounts of cash and which are subject to insignificant risk of changes in value.
All income and expenses, excluding impairment losses and foreign currency exchangelosses related to trade and other receivables, relating to financial assets that are recognizedin profit or loss are presented as part of Finance Costs or Finance Income in thestatement of comprehensive income.
Non-compounding interest and other cash flows resulting from holding financial assetsare recognized in profit or loss when earned, regardless of how the related carryingamount of financial assets is measured.
Derecognition of financial assets occurs when the rights to receive cash flows from thefinancial instruments expire and substantially all of the risks and rewards of ownershiphave been transferred.
2.4 Inventories
Inventories are valued at the lower of cost and net realizable value. Cost is determined
using the weighted-average method. Finished goods and work-in-process include the costof raw materials, direct labor and a proportion of manufacturing overheads based onnormal operating capacity. The cost of raw materials include all costs directly attributableto acquisition, such as the purchase price, import duties and other taxes that are notsubsequently recoverable from taxing authorities.
Net realizable value is the estimated selling price in the ordinary course of business, lessthe estimated costs of completion and the estimated costs necessary to make the sale. Netrealizable value of raw materials is the current replacement cost.
2.5 Property, Plant and Equipment
Property and equipment, except land which is stated at fair value, are stated at cost lessaccumulated depreciation, and any impairment in value.
The cost of an asset comprises its purchase price and directly attributable costs of bringingthe asset to working condition for its intended use. Expenditures for additions, majorimprovements and renewals are capitalized; expenditures for repairs and maintenance arecharged to expense as incurred.
F-286

7/21/2019 PreliminaryProspectus - Century
http://slidepdf.com/reader/full/preliminaryprospectus-century 520/648
- 8 -
DRAFT (For DiscussionPur ose Onl
Depreciation is computed on the straight-line basis over the estimated useful lives of theassets as follows:
Buildings 15 yearsMachinery and equipment 10 yearsLand improvements 10 years
Transportation and delivery equipment 5 years
Fully depreciated assets are retained in the accounts until these are no longer in use. Nofurther charge for depreciation is made in respect of those accounts.
Construction-in-progress represents properties under construction and is stated at cost. This includes cost of construction, applicable borrowing cost and other direct costs(see Note 2.15). The account is not depreciated until such time that the assets arecompleted and available for use.
An asset’s carrying amount is written down immediately to its recoverable amount if theasset’s carrying amount is greater than its estimated recoverable amount
(see Note 2.13).
The residual values and estimated useful lives of property, plant and equipment arereviewed, and adjusted if appropriate, at the end of each reporting period.
An item of property, plant and equipment, including the related accumulated depreciationand any impairment losses, is derecognized upon disposal or when no future economicbenefits are expected to arise from the continued use of the asset. Any gain or loss arisingon derecognition of the asset (calculated as the difference between the net disposalproceeds and the carrying amount of the item) is included in profit or loss in the year theitem is derecognized.
2.6
Other Assets
Other assets pertain to other resources controlled by the Company as a result of pastevents. They are recognized in the financial statements when it is probable that the futureeconomic benefits will flow to the entity and the asset has a cost or value that can bemeasured reliably.
Other recognized assets of similar nature, where future economic benefits are expected toflow to the Company beyond one year after the end of the reporting period (or in thenormal operating cycle of the business, if longer), are classified as non-current assets.
2.7 Financial Liabilities
Financial liabilities, which include interest-bearing loans, trade and other payables[except output value-added tax (VAT) and other taxes payable], advances from astockholder and dividend payable are recognized when the Company becomes a party tothe contractual terms of the instrument. These are recognized initially at their fair valuesand subsequently measured at amortized cost, using the effective interest method formaturities beyond one year, less settlement payments. All interest-related charges incurredon financial liability are recognized as an expense in profit or loss under the captionFinance Costs in the statement of comprehensive income.
F-287

7/21/2019 PreliminaryProspectus - Century
http://slidepdf.com/reader/full/preliminaryprospectus-century 521/648
- 9 -
DRAFT (For DiscussionPur ose Onl
Interest-bearing loans are raised for support of short-term or long-term funding ofoperations. Finance charges, including premiums payable on settlement or redemptionand direct issue costs, are charged to profit or loss on an accrual basis using the effectiveinterest method and are added to the carrying amount of the instrument to the extent thatthese are not settled in the period in which they arise.
Dividend payable to shareholders are recognized as financial liabilities when the dividendsare approved by the Company’s Board of Directors (BOD).
Financial liabilities are derecognized from the statement of financial position only whenthe obligations are extinguished either through discharge, cancellation or expiration.
2.8 Offsetting Financial Instruments
Financial assets and liabilities are offset and the resulting net amount is reported in thestatement of financial position when there is a legally enforceable right to set-off therecognized amounts and there is an intention to settle on a net basis, or realize the assetand settle the liability simultaneously.
2.9 Provisions and Contingencies
Provisions are recognized when present obligations will probably lead to an outflow ofeconomic resources and they can be estimated reliably even if the timing or amount of theoutflow may still be uncertain. A present obligation arises from the presence of a legal orconstructive obligation that has resulted from past events.
Provisions are measured at the estimated expenditure required to settle the presentobligation, based on the most reliable evidence available at the end of the reporting period,including the risks and uncertainties associated with the present obligation. Where thereare a number of similar obligations, the likelihood that an outflow will be required in
settlement is determined by considering the class of obligations as a whole. When time value of money is material, long-term provisions are discounted to their present valuesusing a pretax rate that reflects market assessments and the risks specific to the obligation.
The increase in provision due to passage of time is recognized as interest expense.Provisions are reviewed at the end of each reporting period and adjusted to reflect thecurrent best estimate.
In those cases where the possible outflow of economic resource as a result of presentobligations is considered improbable or remote, or the amount to be provided for cannotbe measured reliably, no liability is recognized in the financial statements. Similarly,possible inflows of economic benefits to the Company that do not yet meet therecognition criteria of an asset are considered contingent assets, hence, are not recognized
in the financial statements. On the other hand, any reimbursement that the Company canbe virtually certain to collect from a third party with respect to the obligation is recognizedas a separate asset not exceeding the amount of the related provision.
F-288

7/21/2019 PreliminaryProspectus - Century
http://slidepdf.com/reader/full/preliminaryprospectus-century 522/648
- 10 -
DRAFT (For DiscussionPur ose Onl
2.10 Revenue and Expense Recognition
Revenue comprises revenue from the sale of goods measured by reference to the fair valueof consideration received or receivable by the Company for goods supplied, excluding
VAT and trade discounts.
Revenue is recognized to the extent that the revenue can be reliably measured; it isprobable that the economic benefits will flow to the Company; and the costs incurred orto be incurred can be measured reliably. The following specific recognition criteria mustalso be met before revenue is recognized:
(a)
Sale of goods – Revenue is recognized when the risks and rewards of ownership of thegoods have passed to the buyer. This is generally when the buyer has takenundisputed delivery of goods.
(b)
Interest Income – Revenue is recognized as the interest accrues taking into account theeffective yield on the asset.
Costs and expenses are recognized in the statement of comprehensive income uponreceipt of goods and/or utilization of service or at the date they are incurred. Financecosts are reported on an accrual basis, except capitalized borrowing costs which areincluded as part of the cost of the related qualifying assets (see Note 2.15).
2.11 Leases
(a) Company as Lessee
Leases which do not transfer to the Company substantially all the risks and benefits ofownership of the asset are classified as operating leases. Operating lease payments(net of any incentive received from the lessor) are recognized as expense in profit orloss on a straight-line basis over the lease term. Associated costs, such as repairs andmaintenance and insurance, are expensed as incurred.
(b) Company as Lessor
Leases which do not transfer to the lessee substantially all the risks and benefits ofownership of the asset are classified as operating leases. Lease income from operatingleases is recognized in profit or loss on a straight-line basis over the lease term.
The Company determines whether an arrangement is, or contains, a lease based onthe substance of the arrangement. It makes an assessment of whether the fulfillmentof the arrangement is dependent on the use of a specific asset or assets and thearrangement conveys a right to use the asset.
2.12 Foreign Currency Transactions and Translation
The accounting records of the Company are maintained in U.S. Dollars. Foreign currencytransactions during the year are translated into the functional currency at exchange rates
which approximate those prevailing on transaction dates.
F-289

7/21/2019 PreliminaryProspectus - Century
http://slidepdf.com/reader/full/preliminaryprospectus-century 523/648
- 11 -
DRAFT (For DiscussionPur ose Onl
Foreign exchange gains and losses resulting from the settlement of such transactions andfrom the translation at year-end exchange rates of monetary assets and liabilitiesdenominated in foreign currencies are presented in the statement of comprehensiveincome as part of Finance Costs in the statement of comprehensive income.
2.13 Impairment of Non-financial Assets
The Company’s property, plant and equipment and other non-financial assets are testedfor impairment whenever events or changes in circumstances indicate that the carryingamount may not be recoverable.
For purposes of assessing impairment, assets are grouped at the lowest levels for whichthere are separately identifiable cash flows (cash-generating units). As a result, some assetsare tested individually for impairment and some are tested at cash-generating unit level.
Impairment loss is recognized for the amount by which the asset’s or cash-generatingunit’s carrying amount exceeds its recoverable amount. The recoverable amount is thehigher of fair value, reflecting market conditions less costs to sell and value in use, based
on an internal discounted cash flows evaluation. Impairment loss is charged pro rata tothe other assets in the cash-generating unit.
All assets are subsequently reassessed for indications that an impairment loss previouslyrecognized may no longer exist and the carrying amount of the asset is adjusted to therecoverable amount resulting in the reversal of the impairment loss.
2.14 Employee Benefits
(a) Defined Benefits Plan
Post-employment benefits are provided to employees through a defined benefit plan.
A defined benefit plan is a post-employment plan that defines an amount ofpost-employment benefit that an employee will receive on retirement, usually dependenton one or more factors such as age, years of service and salary. The legal obligation forany benefits from this kind of post-employment plan remains with the Company, even ifplan assets for funding the defined benefit plan have been acquired. Plan assets mayinclude assets specifically designated to a long-term benefit fund, as well as qualifyinginsurance policies. The Company’s post-employment defined benefit pension plan coversall regular full-time employees.
The liability recognized in the statement of financial position for a defined benefitplan is the present value of the defined benefit obligation (DBO) at the end of the
reporting period less the fair value of plan assets, together with adjustments forunrecognized actuarial gains or losses and past service costs. The DBO is calculatedannually by independent actuaries using the projected unit credit method. The present
value of the DBO is determined by discounting the estimated future cash outflows using adiscount rate derived from the interest rates of a zero coupon government bonds aspublished by Philippine Dealing and Exchange Corporation, that are denominated in thecurrency in which the benefits will be paid and that have terms to maturity approximatingto the terms of the related post-employment liability.
F-290

7/21/2019 PreliminaryProspectus - Century
http://slidepdf.com/reader/full/preliminaryprospectus-century 524/648
- 12 -
DRAFT (For DiscussionPur ose Onl
Actuarial gains and losses are not recognized as an income or expense unless the totalunrecognized gain or loss exceeds 10% of the greater of the obligation and related planassets. The amount exceeding this 10% corridor is charged or credited to profit or lossover the employees’ expected average remaining working lives. Actuarial gains and losses
within the 10% corridor are disclosed separately. Past service costs are recognizedimmediately in profit or loss, unless the changes to the pension plan are conditional on the
employees remaining in service for a specified period of time (the vesting period).In this case, the past service costs are amortized on a straight-line basis over the vestingperiod.
(b) Termination Benefits
Termination benefits are payable when employment is terminated by the Company beforethe normal retirement date, or whenever an employee accepts voluntary redundancy inexchange for these benefits.
The Company recognizes termination benefits when it is demonstrably committed toeither: (a) terminating the employment of current employees according to a detailed formal
plan without possibility of withdrawal; or (b) providing termination benefits as a result ofan offer made to encourage voluntary redundancy. Benefits falling due more than12 months after the end of the reporting period are discounted to present value.
(c) Compensated Absences
Compensated absences are recognized for the number of paid leave days (includingholiday entitlement) remaining at the end of the reporting period. They are included in the
Trade and Other Payables account at the undiscounted amount that the Company expectsto pay as a result of the unused entitlement.
2.15 Borrowing Costs
Borrowing costs are recognized as expenses in the period in which they are incurred,except to the extent that they are capitalized. Borrowing costs that are directly attributableto the acquisition, construction or production of a qualifying asset (i.e., an asset that takes asubstantial period of time to get ready for its intended use or sale) are capitalized as part ofcost of such asset. The capitalization of borrowing costs commences when expendituresfor the asset and borrowing costs are being incurred and activities that are necessary toprepare the asset for its intended use or sale are in progress. Capitalization ceases whensubstantially all such activities are complete.
2.16 Income Taxes
Tax expense recognized in profit or loss comprises the sum of deferred tax and current taxnot recognized in other comprehensive income or directly in equity, if any.
Current tax assets or liabilities comprise those claims from, or obligations to, fiscalauthorities relating to the current or prior reporting period, that are uncollected or unpaidat the end of the reporting period. They are calculated according to the tax rates and taxlaws applicable to the fiscal periods to which they relate, based on the taxable profit forthe year. All changes to current tax assets or liabilities are recognized as a component oftax expense in profit or loss.
F-291

7/21/2019 PreliminaryProspectus - Century
http://slidepdf.com/reader/full/preliminaryprospectus-century 525/648
- 13 -
DRAFT (For DiscussionPur ose Onl
Deferred tax is accounted for using the liability method, on temporary differences at theend of the reporting period between the tax base of assets and liabilities and their carryingamounts for financial reporting purposes. Under the liability method, with certainexceptions, deferred tax liabilities are recognized for all taxable temporary differences anddeferred tax assets are recognized for all deductible temporary differences and thecarryforward of unused tax losses and unused tax credits to the extent that it is probable
that taxable profit will be available against which the deductible temporary differences canbe utilized. Unrecognized deferred tax assets are reassessed at the end of each reportingperiod and are recognized to the extent that it has become probable that future taxableprofit will be available to allow such deferred tax assets to be recovered.
The carrying amount of deferred tax assets is reviewed at the end of each reporting periodand reduced to the extent that it is probable that sufficient taxable profit will be availableto allow all or part of the deferred tax asset to be utilized.
Deferred tax assets and liabilities are measured at the tax rates that are expected to apply inthe period when the asset is realized or the liability is settled provided such tax rates havebeen enacted or substantively enacted at the end of the reporting period.
Most changes in deferred tax assets or liabilities are recognized as a component of taxexpense in profit or loss. Only changes in deferred tax assets or liabilities that relate toitems recognized in other comprehensive income or directly in equity are recognized inother comprehensive income or directly in equity, respectively.
Deferred tax assets and deferred tax liabilities are offset if the Company has a legallyenforceable right to set-off current tax assets against current tax liabilities and the deferredtaxes relate to the same entity and the same taxation authority.
The Company establishes liabilities for probable and estimable assessments by Bureau ofInternal Revenue (BIR) resulting from any known tax exposures. Estimates represent a
reasonable provision for taxes ultimately expected to be paid and may need to be adjustedover time as more information becomes available.
2.17 Related Party Relationships and Transactions
Related party transactions are transfers of resources, services or obligations between theCompany and its related parties, regardless whether a price is charged.
Parties are considered to be related if one party has the ability to control the other party orexercise significant influence over the other party in making financial and operatingdecisions. These parties include: (a) individuals owning, directly or indirectly through oneor more intermediaries, control or are controlled by, or under common control with the
Company; (b) associates; and, (c) individuals owning, directly or indirectly, an interest inthe voting power of the Company that gives them significant influence over the Companyand close members of the family of any such individual.
In considering each possible related party relationship, attention is directed to thesubstance of the relationship and not merely on the legal form.
F-292

7/21/2019 PreliminaryProspectus - Century
http://slidepdf.com/reader/full/preliminaryprospectus-century 526/648
- 14 -
DRAFT (For DiscussionPur ose Onl
2.18 Equity
Capital stock represents the nominal value of shares that have been issued.
Additional paid-in capital includes any premium received on the issuance of capitalstock. Any transaction costs associated with the issuance of shares are deducted from
additional paid-in capital, net of any related income tax benefits.
Revaluation reserves comprise gains and losses due to the revaluation of land.
Retained earnings represent all current and prior period results of operations as reportedin the profit or loss section of the statements of comprehensive income.
2.19 Events After the End of the Reporting Period
Any post-year-end event that provides additional information about the Company’sfinancial position at the end of the reporting period (adjusting event) is reflected in thefinancial statements. Post-year-end events that are not adjusting events, if any, are
disclosed when material to the financial statements.
3. SIGNIFICANT ACCOUNTING JUDGMENTS AND ESTIMATES
The Company’s financial statements prepared in accordance with PFRS requiremanagement to make judgments and estimates that affect amounts reported in thefinancial statements and related notes. Judgments and estimates are continually evaluatedand are based on historical experience and other factors, including expectations of futureevents that are believed to be reasonable under the circumstances. Actual results mayultimately vary from these estimates.
3.1
Critical Management Judgments in Applying Accounting Policies
In the process of applying the Company’s accounting policies, management has made thefollowing judgments, apart from those involving estimation, which have the mostsignificant effect on the amounts recognized in the financial statements:
(a) Distinction between Operating and Finance Leases
The Company has entered into various lease agreements as a lessee. Criticaljudgment was exercised by management to distinguish each lease agreement as eitheran operating or finance lease by looking at the transfer or retention of significant riskand rewards of ownership of the properties covered by the agreements. Failure to
make the right judgment will result in either overstatement or understatement of assetand liabilities. Based on management’s judgment such leases were determined to beoperating leases.
(b)
Recognition of Provisions and Contingencies
Judgment is exercised by management to distinguish between provisions andcontingencies. Policies on recognition and disclosure of provision and contingenciesare discussed in Note 2.9 and relevant disclosures of contingencies are presented inNotes 20.
F-293

7/21/2019 PreliminaryProspectus - Century
http://slidepdf.com/reader/full/preliminaryprospectus-century 527/648
- 15 -
DRAFT (For DiscussionPur ose Onl
(c)
Costing of Inventories
In determining cost, management uses judgment in properly allocating the labor andoverhead between the cost of inventories on hand (finished goods and
work-in-process) and cost of goods sold. The Company currently allocatesproduction overhead on the basis of units produced. However, the amount of costs
charged to finished goods and work-in-process inventories would differ if theCompany utilized a different allocation base. Changes in allocated cost would affectthe carrying cost of inventories and could potentially affect the valuation based onlower of cost and net realizable value.
3.2 Key Sources of Estimation Uncertainty
The following are the key assumptions concerning the future, and other key sources ofestimation uncertainty at the end of the reporting period, that have a significant risk ofcausing a material adjustment to the carrying amounts of assets and liabilities within thenext financial year:
(a)
Impairment of Trade and Other Receivables
Adequate amount of allowance for impairment is provided for specific and group ofaccounts, where objective evidence of impairment exists. The Company evaluatesthese accounts based on available facts and circumstances, including, but not limitedto, the length of the Company’s relationship with the customers, the customers’current credit status based on third party credit reports and known market forces, theaverage age of accounts, collection experience and historical loss experience.
Based on the analysis done by management, certain receivables were identified to beimpaired. The carrying value of trade and other receivables and analysis of allowancefor impairment on such financial assets are shown in Note 6.
(b)
Determining Net Realizable Value of Inventories
In determining the net realizable value of inventories, management takes into accountthe most reliable evidence available at the dates the estimates are made. The futurerealization of the carrying amounts of inventories as presented in Note 7 is affectedby price changes in different market segments. These are considered key sources ofestimation, especially that such inventories are substantially perishable in nature andhighly affective by temperature and other environmental conditions, uncertainty andmay cause significant adjustments to the Company’s inventories within the nextfinancial year.
(c)
Estimating Useful Lives of Property, Plant and Equipment
The Company estimates the useful lives of property, plant and equipment, exceptland, based on the period over which the assets are expected to be available for use.
The estimated useful lives of property, plant and equipment are reviewed periodicallyand are updated if expectations differ from previous estimates due to physical wearand tear, technical or commercial obsolescence and legal or other limits on the use ofthe assets.
F-294

7/21/2019 PreliminaryProspectus - Century
http://slidepdf.com/reader/full/preliminaryprospectus-century 528/648
- 16 -
DRAFT (For DiscussionPur ose Onl
The carrying amounts of property, plant and equipment are analyzed in Note 9.Based on management’s assessment as at December 31, 2012, there is no change inestimated useful lives of property, plant and equipment during the year. Actualresults, however, may vary due to changes in estimates brought about by changes infactors mentioned above.
(d)
Determining the Fair Value of Land
The Company’s land is carried at revalued amount at the end of the reporting period.In determining the fair value of the land, the Company engages the services ofprofessional and independent appraisers. The fair value is determined by reference tomarket-based evidence, which is the amount for which the asset could be exchangedbetween a knowledgeable willing buyer and seller in an arm’s length transaction as atthe valuation date. Such amount is influenced by different factors including thelocation and specific characteristics of the property (e.g., size, features, and capacity),quantity of comparable properties available in the market, and economic conditionand behaviour of the buying parties. A significant change in these elements mayaffect prices and the value of the asset. The amounts of revaluation and fair value
gain recognized on land are disclosed in Note 9.
(e)
Determining Recoverable Amount of Deferred Tax Assets
The Company reviews its deferred tax assets at the end of the reporting period andreduces the carrying amount to the extent that it is no longer probable that sufficienttaxable profit will be available to allow all or part of the deferred tax asset to beutilized. The carrying value of deferred tax assets as at December 31, 2012 and 2011
which the management assessed to be probable of being utilized within the next twoto three years is disclosed in Note 16.
(f) Impairment of Non-financial Assets
The Company’s policy on estimating the impairment of non-financial assets isdiscussed in detail in Note 2.13. Though management believes that the assumptionsused in the estimation of fair values reflected in the financial statements areappropriate and reasonable, significant changes in these assumptions may materiallyaffect the assessment of recoverable values and any resulting impairment loss couldhave a material adverse effect on the results of operations. No impairment loss wasrecognized on the Company’s non-financial assets in 2012 and 2011.
(g)
Valuation of Post-employment Benefits
The determination of the Company’s obligation and cost of post-employment defined
benefit is dependent on the selection of certain assumptions used by actuaries incalculating such amounts. Those assumptions include, among others, discount rates,expected return on plan assets and salary increase rate. In accordance with PFRS,actual results that differ from the assumptions are accumulated and amortized overfuture periods and, therefore, generally affect the recognized expense and recordedobligation in such future periods.
The amount of retirement benefit obligation (asset) and expense and an analysis of themovements in the estimated present value of retirement benefit obligation (asset) arepresented in Note 15.2.
F-295
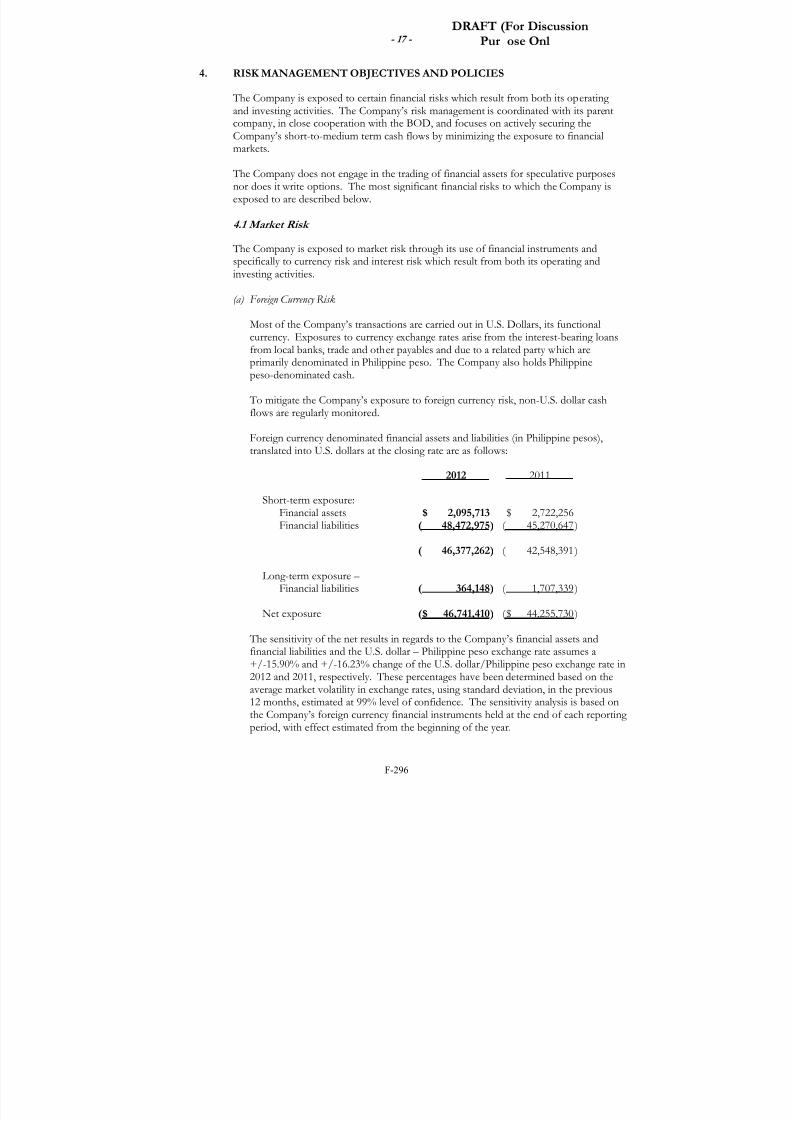
7/21/2019 PreliminaryProspectus - Century
http://slidepdf.com/reader/full/preliminaryprospectus-century 529/648
- 17 -
DRAFT (For DiscussionPur ose Onl
4. RISK MANAGEMENT OBJECTIVES AND POLICIES
The Company is exposed to certain financial risks which result from both its operatingand investing activities. The Company’s risk management is coordinated with its parentcompany, in close cooperation with the BOD, and focuses on actively securing theCompany’s short-to-medium term cash flows by minimizing the exposure to financial
markets.
The Company does not engage in the trading of financial assets for speculative purposesnor does it write options. The most significant financial risks to which the Company isexposed to are described below.
4.1 Market Risk
The Company is exposed to market risk through its use of financial instruments andspecifically to currency risk and interest risk which result from both its operating andinvesting activities.
(a)
Foreign Currency Risk
Most of the Company’s transactions are carried out in U.S. Dollars, its functionalcurrency. Exposures to currency exchange rates arise from the interest-bearing loansfrom local banks, trade and other payables and due to a related party which areprimarily denominated in Philippine peso. The Company also holds Philippinepeso-denominated cash.
To mitigate the Company’s exposure to foreign currency risk, non-U.S. dollar cashflows are regularly monitored.
Foreign currency denominated financial assets and liabilities (in Philippine pesos),
translated into U.S. dollars at the closing rate are as follows:
2012 2011
Short-term exposure:Financial assets $ 2,095,713 $ 2,722,256Financial liabilities ( 48,472,975 ) ( 45,270,647 )
( 46,377,262 ) ( 42,548,391 )
Long-term exposure –Financial liabilities ( 364,148 ) ( 1,707,339 )
Net exposure ( $ 46,741,410 ) ( $ 44,255,730 )
The sensitivity of the net results in regards to the Company’s financial assets andfinancial liabilities and the U.S. dollar – Philippine peso exchange rate assumes a+/-15.90% and +/-16.23% change of the U.S. dollar/Philippine peso exchange rate in2012 and 2011, respectively. These percentages have been determined based on theaverage market volatility in exchange rates, using standard deviation, in the previous12 months, estimated at 99% level of confidence. The sensitivity analysis is based onthe Company’s foreign currency financial instruments held at the end of each reportingperiod, with effect estimated from the beginning of the year.
F-296

7/21/2019 PreliminaryProspectus - Century
http://slidepdf.com/reader/full/preliminaryprospectus-century 530/648
- 18 -
DRAFT (For DiscussionPur ose Onl
If the Philippine peso had strengthened against the U.S. dollar, then this would havethe following impact:
2012 2011
Profit before tax $ 7,431,884 $ 7,182,705
Equity 5,202,319 4,886,443
If the Philippine peso had weakened against the U.S. dollar, then this would have areverse impact by the same amounts as above.
The exchange rates used to translate Philippine peso – denominated financial assetsand liabilities to U.S. dollars at December 31, 2012 and 2011 was P41.19:$1 andP43.93:$1, respectively. The Company actively monitors the volatility of the foreigncurrency exchange rates to manage its foreign currency exposure.
Exposures to foreign currency exchange rates vary during the year depending on the volume of overseas transactions. Nonetheless, the analysis above is considered to berepresentative of the Company’s currency risk.
(b)
Interest Rate Risk
The Company has limited exposure to changes in market interest rates through itsinterest-bearing loans and cash and cash equivalents, which are subject to variableinterest rates. These financial instruments have historically shown small or measuredchanges in interest rates. All other financial assets and liabilities have fixed rates.
4.2 Credit Risk
Generally, the maximum credit risk exposure of financial assets is the carrying amount ofthe financial assets as shown on the face of the statements of financial position
(or in the detailed analysis provided in the notes to the financial statements), assummarized below.
Notes 2012 2011
Cash and cash equivalents 5 $ 2,201,717 $ 2,058,243 Trade and other receivables 6 4,619,685 5,446,965
$ 6,823,233 $ 7,507,092
As part of Company policy, bank deposits are only maintained with reputable financialinstitutions. Cash in banks which are insured by the Philippine Deposit Insurance
Corporation (PDIC) up to a maximum coverage of (P500,000) per depositor per bankinginstitution, as provided for under Republic Act No. 9576, Charter of PDIC, are still subjectto credit risk.
Trade and other receivables, as presented above, exclude deposit on purchases of $501,407as of December 31, 2011. There was no outstanding balance of deposit on purchases asof December 31, 2012.
F-297

7/21/2019 PreliminaryProspectus - Century
http://slidepdf.com/reader/full/preliminaryprospectus-century 531/648
- 19 -
DRAFT (For DiscussionPur ose Onl
The Company continuously monitors defaults of customers and other counterparties,identified either individually or by group, and incorporate this information into its creditrisk controls. Where available at a reasonable cost, external credit ratings and/or reportson customers and other counterparties are obtained and used. The Company’s policy is todeal only with creditworthy counterparties. In addition, for a significant proportion ofsales, advance payments are received to mitigate credit risk.
The Company’s management considers that all the above financial assets that are notimpaired or past due for each reporting period are off good credit quality.
In respect of trade and other receivables, the Company is not exposed to any significantcredit risk exposure to any single counterparty or any group of counterparties havingsimilar characteristics.
Financial assets that are past due but not impaired are as follows:
2012 2011
Less than one year $ 144,024 $ 51,756
More than one year 259 16,065
$ 144,283 $ 67,821
The fair value of these short-term financial assets is not individually determined as thecarrying amount is a reasonable approximation of fair value.
4.3 Liquidity Risk
The ability of the Company to finance its operations and to meet obligations as thesebecome due is extremely crucial to its viability as a business entity. The Company adopts aprudent liquidity risk management where it maintains sufficient cash to meet trade and
other short-term payables as they fall due.
The Company manages its liquidity needs by carefully monitoring scheduled debt servicingpayments for long-term financial liabilities as well as cash outflows due in aday-to-day business. Liquidity needs are monitored in various time bands, on aday-to-day and week-to-week basis, as well as on the basis of a rolling 30-day projection.Long-term liquidity needs for a six-month and one-year period are identified monthly.Funding for long-term liquidity needs is additionally secured by an adequate amount ofcommitted credit facilities and the ability to sell long-term financial assets.
As at December 31, 2012, the Company’s financial liabilities have contractual maturities which are presented below.
Current Non-current Within 6 to 12 1 to 5
6 Months Months Years
Interest-bearing loans $ 33,518,645 $ 364,148 $ - Trade and other payables 10,868,961 - - Advances from related parties 4,085,368 - -
$ 48,769,974 $ 364,148 $ -
F-298

7/21/2019 PreliminaryProspectus - Century
http://slidepdf.com/reader/full/preliminaryprospectus-century 532/648
- 20 -
DRAFT (For DiscussionPur ose Onl
This compares to the maturity of the Company’s financial liabilities as atDecember 31, 2011 as follows:
Current Non-current Within 6 to 12 1 to 5
6 Months Months Years
Interest-bearing loans $ 24,062,102 $ 1,365,871 $ 341,468 Advances from related parties 10,006,670 - - Trade and other payables 9,372,685 - -Dividend payable 1,732,062 - -
$ 45,173,519 $ 1,365,871 $ 341,468
The above contractual maturities reflect the gross cash flows, which may differ from thecarrying values of the liabilities at the end of each of the reporting periods.
5. CASH AND CASH EQUIVALENTS
The breakdown of this account is as follows:
2012 2011
Cash on hand $ 1,821 $ 1,884Cash in bank 2,201,727 1,990,884 Short-term placements - 67,359
$ 2,203,548 $ 2,060,127
Cash in banks generally earn interest at rates based on daily bank deposit rates.
Short-term placements are made for varying periods of between 15 to 30 days and earneffective interest ranging from 2.8% to 4.0% in both years. Interest income earnedamounting to $67,561 and $ 19,797 in 2012 and 2011, respectively and presented asFinance Income in the statement of comprehensive income.
6. TRADE AND OTHER RECEIVABLES
This account (see also Note 4.2) is composed of the following:
2012 2011
Trade receivables $ 4,737,828 $ 4,949,098Deposit on purchases - 501,407Others 26,140 566,651
4,763,968 6,017,156 Allowance for impairment ( 144,283 ) ( 68,783 )
$ 4,619,685 $ 5,948,373
F-299

7/21/2019 PreliminaryProspectus - Century
http://slidepdf.com/reader/full/preliminaryprospectus-century 533/648
- 21 -
DRAFT (For DiscussionPur ose Onl
Trade receivables are usually due within 30 to 45 days and do not bear any interest. Alltrade and other receivables are subject to credit risk exposure. However, the Companydoes not identify specific concentrations of credit risk with regard to trade and otherreceivables as the amounts recognized resemble a large number of receivables from
various customers and counterparties.
Deposit on purchases pertains to advances made to suppliers for goods ordered. This isapplied against billings from the suppliers upon the completion of such order;accordingly, not considered as financed assets (see also Note 4.2).
All of the Company’s trade and other receivables have been reviewed for indicators ofimpairment. Certain receivables were identified to be impaired, hence, adequateamounts of allowance for impairment have been recognized. The Company recognizedimpairment losses on certain trade receivables amounting $75,500 in 2012 and $68,783 in2011 and presented them as part of Impairment Loss on Trade and Other Receivablesunder Administrative Expense in the statements of comprehensive income(see Note 13).
A reconciliation of the allowance for impairment at the beginning and end of 2012 and2011 is shown below.
Note 2012 2011
Balance at beginningof year $ 68,783 $ -
Impairment losses 13 75,500 68,783
Balance at end of year $ 144,283 $ 68,783
7.
INVENTORIES
Details of inventories are shown below.
Note 2012 2011
Finished goods: At cost $ 10,268,611 $ 11,439,866 At net realizable value 176,170 536,494
13 10,444,781 11,976,360
Raw and packagingmaterials 33,344,561 25,674,768Spare parts, supplies
and others 1,056,207 1,023,649
$ 44,845,549 $ 38,674,777
Raw and packaging materials include inventories amounting to $1,557,305 that are intransit as at December 31, 2011 (Nil as at December 31, 2012).
F-300

7/21/2019 PreliminaryProspectus - Century
http://slidepdf.com/reader/full/preliminaryprospectus-century 534/648
- 22 -
DRAFT (For DiscussionPur ose Onl
The inventory write-down amounting to $291,319 in 2012 and 249,395 in 2011,is presented as part of Cost of Goods Sold in the statements comprehensive income.
8. OTHER CURRENT ASSETS
The composition of this account is shown below.
2012 2011
Tax credit certificates fromBureau of Customs $ 937,542 $ 711,973
Prepaid insurance 12,385 14,839Prepaid rent 363 340Others 23,350 23,017
$ 973,640 $ 750,169
9. PROPERTY, PLANT AND EQUIPMENT
The gross carrying amounts and accumulated depreciation of property, plant andequipment at the beginning and end of 2012 and 2011 are shown below.
At Fair Value At CostTransportation Machinery Construction-
Land and Delivery and in-Land Buildings Improvements Equipment Equipment Progress Total
December 31, 2012Cost $ 1,827,066 $ 8,600,943 $ 1,388,173 $ 26,955 $ 20,344,632 $ 705,335 $ 32,893,104Revaluation increment 35,773 - - - - - 35,773 Accumulated depreci ation - ( 4,209,932 ) ( 1,187,432 ) ( 26,955 ) ( 10,878,290 ) - ( 16,302,609 )
Carrying value $ 1,862,839 $ 4,391,011 $ 200,741 $ - $ 9,466,342 $ 705,335 $ 16,626,268
December 31, 2011
Cost $ 1,827,066 $ 8,069,346 $ 1,379,635 $ 77,729 $ 19,452,356 $ 426,790 $ 31,232,922Revaluation increment 35,773 - - - - - 35,773 Accumulated depreci ation - ( 3,571,941 ) ( 1,146,789 ) ( 77,729 ) ( 8,839,962 ) - ( 13,636,421 )
Carrying value $ 1,862,839 $ 4,497,405 $ 232,846 $ - $ 10,612,394 $ 426,79 0 $ 17,632,274
January 1, 2011Cost $ 1,827,066 $ 7,608,630 $ 1,333,668 $ 131,088 $ 18,991,805 $ 192,981 $ 30,085,238Revaluation increment 35,773 - - - - - 35,773 Accumulated depreci ation - ( 3,018,450 ) ( 1,080,559 ) ( 117,840 ) ( 8,189,586 ) - ( 12,406,435 )
Carrying value $ 1,862,839 $ 4,590,180 $ 253,109 $ 13,248 $ 10,802,219 $ 192,981 $ 17,714,576
F-301

7/21/2019 PreliminaryProspectus - Century
http://slidepdf.com/reader/full/preliminaryprospectus-century 535/648
- 23 -
DRAFT (For DiscussionPur ose Onl
A reconciliation of the carrying amounts of property, plant and equipment at thebeginning and end of 2012 and 2011, is shown below.
At Fair Value At CostTransportation Machinery Construction-
Land and Delivery and in-Land Buildings Improvements Equipment Equipment Progress Total
Balance at January 1, 2012,net of accumulated depreciation $ 1,862,8 39 $ 4,497,405 $ 232,846 $ - $ 10,612,394 $ 426,790 $ 17,632,274
Additions - 184,229 8,538 - 860,486 671,508 1,724,761Disposals - - - - ( 1,508 ) - ( 1,508 )Reclassifications - 347,368 - - 45,595 ( 392,963 ) -Depreciation charges for the year - ( 637,991 ) ( 40,643 ) - ( 2,050,625 ) - ( 2,72 9,259 )
Carrying value $ 1,862,839 $ 4,391,011 $ 200,741 $ - $ 9,466,342 $ 705,335 $ 16,626,268
Balance at January 1, 2011,net of accumulated depreciation $ 1,862,839 $ 4,590,180 $ 253,109 $ 13,248 $ 10,802,219 $ 192,981 $ 17,714,576
Additions - 287,626 31,384 - 1,547,647 627,494 2,494,151Disposals - ( 47,505 ) ( 1,006 ) ( 8,313 ) ( 58,615 ) - ( 115,439 )Reclassifications - 231,886 20,785 - 141,014 ( 393,685 ) -Depreciation and charges for the year - ( 564,782 ) ( 71,426 ) ( 4,935 ) ( 1,819,871 ) - ( 2,461,014 )
Carrying value $ 1,862,839 $ 4,497,405 $ 232,846 $ - $ 10,612,394 $ 426,79 0 $ 17,632,274
Construction-in-progress pertains to the accumulated costs incurred on the ongoingconstruction of a new building and installation of machinery and equipment as part ofthe Company’s expansion program (see Note 20.3). In 2012 and 2011, portion of
construction-in-progress amounting to $392,963 and $393,685, respectively, were completedand reclassified by the Company to their proper account classification.
In 2012 and 2011, management’s assessment showed that the fair value of the land, carriedat revalued amount, did not materially change. Accordingly, no fair value gain or loss wasrecognized.
The amount of depreciation (see Note 13) is allocated as follows:
2012 2011
Cost of goods sold $ 2,550,836 $ 2,381,301 Administrative expenses 178,423 79,713
$ 2,729,259 $ 2,461,014
Fully depreciated assets with total original cost of $3,887,265 and $3,047,799 as atDecember 31, 2012 and 2011 are still being used in operations.
10.
OTHER NON-CURRENT ASSETS
Other non-current assets are summarized below:
Note 2012 2011
Input VAT 24.1(b) $ 663,655 $ 685,132Others 1,697 7,283
$ 665,352 $ 692,415
F-302

7/21/2019 PreliminaryProspectus - Century
http://slidepdf.com/reader/full/preliminaryprospectus-century 536/648
- 24 -
DRAFT (For DiscussionPur ose Onl
11. INTEREST-BEARING LOANS
The short-term and long-term interest-bearing loans [denominated in Philippine pesos(PHP)], which are collateralized by a continuing suretyship of certain stockholders and acorporate guarantee of CCC are broken down as follows:
2012 2011
in PHP in USD in PHP in USD
Short-term P1,320,700,000 $ 32,062,051 P 997,000,000 $ 22,696,230Long-term 75,000,000 1,820,742 135,000,000 3,073,211
P1,395,700,000 $ 33,882,793 P 1,132,000,000 $ 25,769,441
Short-term loans consist of several borrowings from local banks which mature within14 to 30 days and bear annual interest rates ranging from 2.25% to 4.75% in 2012 and3.25% to 3.60% in 2011.
Long-term loan pertains to a five year loan with an original principal amount of$6,219,421 (P300,000,000) obtained on February 27, 2009 from a local commercial bank.
The loan is payable quarterly and bears an annual interest of 7.51%. The long-term loanis subject to a condition that requires the Company to meet certain financial ratios suchas debt-to-equity ratio (not to exceed 2.5:1) and current ratio (at least 1.0:1).
In the event of default or non-compliance with any of the provisions of the loanagreement, the bank-creditor may (by written notice) either declare the loan terminatedor declare the entire unpaid principal amount and interest of the loan due anddemandable. As at December 31, 2012, the Company has complied with all thecovenants set forth in the loan agreement (see Note 22).
Interest-bearing loans are presented in the in statements of financial positions as follows:
2012 2011
Current $ 33,518,645 $ 24,062,102Non-current 364,148 1,707,339
$ 33,882,793 $ 25,769,441
Interest expense charged to operations amounted to $816,041 in 2012 and $605,044 in2011 and presented as part of Finance Costs in the statements of comprehensive income(see Note 14). The unpaid balance of interest amounting to $52,116 and $49,307 as atDecember 31, 2012 and 2011, respectively, is presented as part of Accrued Expensesunder the Trade and Other Payables account in the statements of financial position
(see Note 12).
F-303

7/21/2019 PreliminaryProspectus - Century
http://slidepdf.com/reader/full/preliminaryprospectus-century 537/648
- 25 -
DRAFT (For DiscussionPur ose Onl
12. TRADE AND OTHER PAYABLES
This account consists of:
Notes 2012 2011
Trade payables $ 9,020,599 $ 8,127,123 Accrued expenses 11 771,418 542,242Others 17.3 1,076,944 703,320
$ 10,868,961 $ 9,372,685
Accrued expenses include the current portion of the Company’s obligations to itsemployees and service providers that are expected to be settled within 12 months from theend of the reporting period. These liabilities arise mainly from the accrual of variousexpenses such as rent, freight, interest on loans and payroll at the end of the period.
The carrying amount of trade and other payables, which are expected to be settled within
the next 12 months from the end of the reporting period, is a reasonable approximation offair value.
Others payable include liabilities to various agencies and regulatory bodies.
13. COSTS AND OPERATING EXPENSES BY NATURE
The details of costs and operating expenses by nature are shown below.
Notes 2012 2011
Raw materials used $ 62,956,137 $ 54,166,359Outside services 17.3 5,852,420 4,744,437Rent 20.1 4,100,160 2,297,001Depreciation and amortization 9 2,729,259 2,461,014Gas, fuel and oil 2,156,957 2,195,909Supplies 1,989,322 1,568,378Changes in finished goods
inventories 1,531,579 5,388,109Communication, light and water 1,315,590 963,208Salaries and employee benefits 15 1,135,913 1,097,485Freight 1,117,023 1,282,947
Taxes and licenses 24.1 299,395 244,361Insurance 175,994 113,946Repairs and maintenance 170,374 140,078Impairment loss
on trade receivables 6 75,500 68,783Commissions 45,369 84,781Miscellaneous 248,560 270,577
$ 85,899,552 $ 77,087,373
F-304

7/21/2019 PreliminaryProspectus - Century
http://slidepdf.com/reader/full/preliminaryprospectus-century 538/648
- 26 -
DRAFT (For DiscussionPur ose Onl
These expenses are classified in the statements of comprehensive income as follows:
2012 2011
Cost of goods sold $ 83,177,084 $ 74,609,681 Administrative expenses 1,511,770 1,320,698
Selling expenses 1,162,392 1,129,637Other expenses 48,306 27,357
$ 85,899,552 $ 77,087,373
Cost of goods sold for the years ended December 31, 2012 and 2011 consist of thefollowing:
Note 2012 2011
Finished goods atbeginning of year 7 $ 11,976,360 $ 17,412,482
Cost of goods manufactured:Raw materials used 62,956,137 54,166,359
Direct labor 4,505,777 3,475,044
Manufacturing overhead 14,183,591 11,532,156
81,645,505 69,173,559 Total goods available for sale 93,621,865 86,586,041
Finished goods at end of year 7 ( 10,444,781 ) ( 11,976,360 )
$ 83,177,084 $ 74,609,681
14. FINANCE COSTS
The details of finance costs are presented below.
Note 2012 2011
Foreign currency losses $ 1,361,096 $ 858,018Interest expense 11 816,041 605,044Bank charges 109,693 166,205Other finance charges - 47,261
$ 2,286,830 $ 1,676,528
F-305

7/21/2019 PreliminaryProspectus - Century
http://slidepdf.com/reader/full/preliminaryprospectus-century 539/648
- 27 -
DRAFT (For DiscussionPur ose Onl
15. EMPLOYEE BENEFITS
15.1 Salaries and Employee Benefits
Expenses recognized for salaries and employee benefits (see Note 13) are presented below.
2012 2011
Short-term benefits $ 1,093,928 $ 1,016,197Post-employment benefits 41,985 81,288
$ 1,135,913 $ 1,097,485
15.2 Post-employment Defined Benefit
The Company maintains a fully funded, tax qualified, noncontributory retirement plan thatis being administered by a trustee bank covering all regular full-time employees.
The amount of retirement benefit asset recognized in the statements of financial positionis determined as follows:
2012 2011
Present value of the obligation $ 396,926 $ 314,055Fair value of plan assets ( 408,017 ) ( 317,069 )Excess of plan assets ( 11,091 ) ( 3,014 )Unrecognized actuarial losses ( 4,450 ) ( 14,886 )Effect of foreign currency
exchange rate changes ( 111 ) 208
($ 15,652 ) ( $ 17,692 )
The movements in present value of the retirement benefit obligation are as follows:
2012 2011
Balance at beginning of year $ 314,055 $ 185,465Current service and interest costs 60,499 52,953
Actuarial loss - 95,099Benefits paid by the plan - ( 17,453)Effect of foreign currency
exchange rate changes 22,372 ( 2,009 )
Balance at end of year $ 396,926 $ 314,055
F-306

7/21/2019 PreliminaryProspectus - Century
http://slidepdf.com/reader/full/preliminaryprospectus-century 540/648
- 28 -
DRAFT (For DiscussionPur ose Onl
The movement in the fair value of plan assets is presented below.
2012 2011
Balance at beginning of year $ 317,069 $ 251,842Expected return on plan assets 29,335 35,167
Contribution paid into the plan 35,762 71,778Benefits paid by the plan - ( 17,453 ) Actuarial loss - ( 23,089 )
Effect of foreign currency exchange rate changes 25,851 ( 1,176 )
Balance at end of year $ 408,017 $ 317,069
Actual return on plan assets were $29,335 in 2012 and $12,078 in 2011.
The major categories of plan assets as a percentage of the fair value of total plan assets areas follows:
2012 2011
Cash 10.59% 8.34%Government securities 60.62% 46.30%Debt instruments 19.65% 35.73%Others 9.14% 9.63%
Presented below are the historical information related to the present value of theretirement benefit obligation, fair value of plan assets and excess or deficit in the plan.
2012 2011 2010 2009 2008
Present value of the obligation $ 396,926 $ 314,055 $ 185,465 $ 182,218 $ 245,560Fair value of plan assets 408,017 317,069 251,842 169,637 89,119
Deficit (excess) in the plan ($ 11,091) ($ 3,014 ) ( $ 66,377 ) $ 12,581 $ 156,441
Experience adjustmentsarising on plan liabilities $ - $ 8,080 $ - $ 2,738 $ -
Experience adjustmentsarising on plan assets $ - $ 23,089 $ - $ 3,042 $ -
The amounts of retirement benefits expense recognized in the profit or loss are as follows:
2012 2011
Current service costs $ 40,176 $ 37,657Interest costs 20,323 15,296Expected return on plan assets ( 29,335 ) ( 35,167 )Net actuarial loss recognized
during the year 10,821 63,502
$ 41,985 $ 81,288
F-307
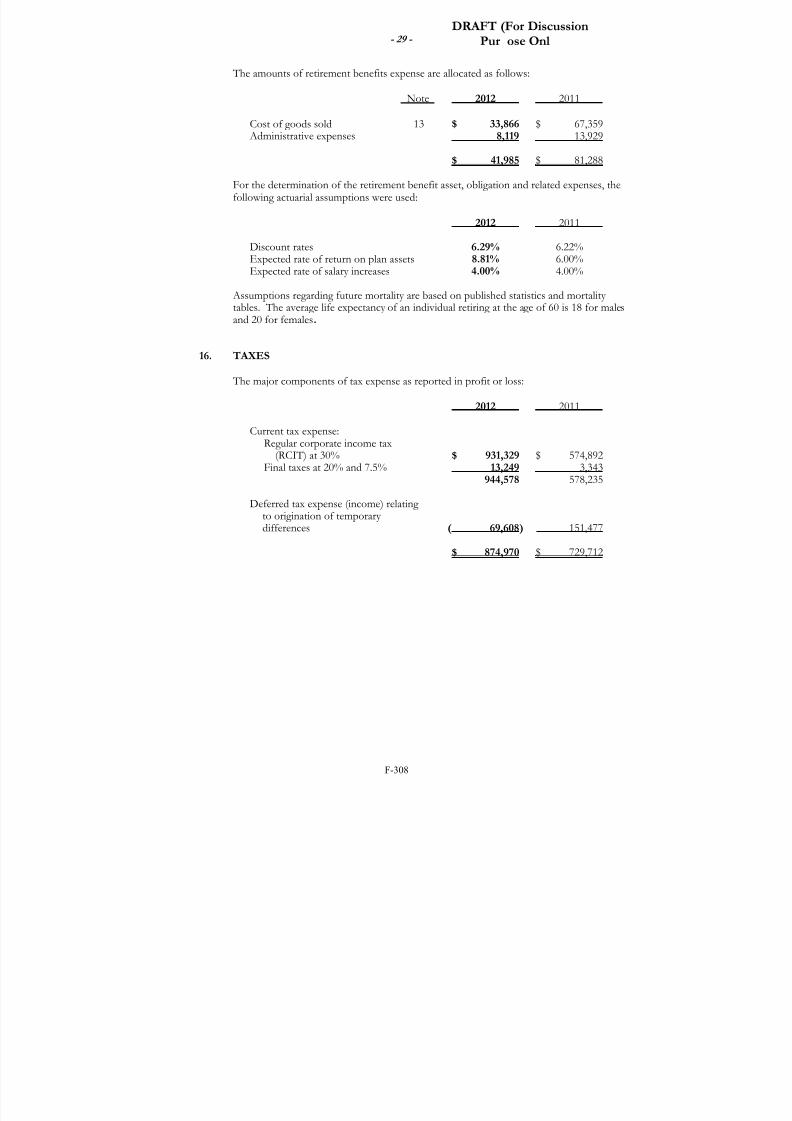
7/21/2019 PreliminaryProspectus - Century
http://slidepdf.com/reader/full/preliminaryprospectus-century 541/648
- 29 -
DRAFT (For DiscussionPur ose Onl
The amounts of retirement benefits expense are allocated as follows:
Note 2012 2011
Cost of goods sold 13 $ 33,866 $ 67,359 Administrative expenses 8,119 13,929
$ 41,985 $ 81,288
For the determination of the retirement benefit asset, obligation and related expenses, thefollowing actuarial assumptions were used:
2012 2011
Discount rates 6.29% 6.22%Expected rate of return on plan assets 8.81% 6.00%Expected rate of salary increases 4.00% 4.00%
Assumptions regarding future mortality are based on published statistics and mortalitytables. The average life expectancy of an individual retiring at the age of 60 is 18 for malesand 20 for females.
16. TAXES
The major components of tax expense as reported in profit or loss:
2012 2011
Current tax expense:Regular corporate income tax
(RCIT) at 30% $ 931,329 $ 574,892Final taxes at 20% and 7.5% 13,249 3,343
944,578 578,235
Deferred tax expense (income) relatingto origination of temporarydifferences ( 69,608 ) 151,477
$ 874,970 $ 729,712
F-308

7/21/2019 PreliminaryProspectus - Century
http://slidepdf.com/reader/full/preliminaryprospectus-century 542/648
- 30 -
DRAFT (For DiscussionPur ose Onl
The reconciliation of tax on pretax profit computed at the applicable statutory rates to taxexpense reported in the statements of comprehensive income profit is as follows:
2012 2011
Tax on pretax profit at 30% $ 916,208 $ 621,804
Adjustment for income subjectedto lower income tax rates ( 7,019 ) ( 2,596) Tax effects of:
Non-taxable income ( 40,704 ) ( 65,504 )Non-deductible expenses 6,485 1,736Reversal of deferred tax asset - 174,272
Tax expense $ 874,970 $ 729,712
The net deferred tax assets relate to the following as at December 31:
Statements of Statements ofFinancial Position Comprehensive Income
2012 2011 2012 2011
Allowance for inventory write-down $ 87,396 $ 75,123 ( $ 12,273) $ 109,574
Allowance for impairment 43,178 20,635 ( 22,543) ( 20,635 )Past service cost 15,626 19,391 3,765 ( 812 )Retirement benefit asset ( 4,696 ) 2,813 7,509 ( 2,813 )Unrealized foreign currency
loss (gain) - ( 46,066 ) ( 46,066) 66,163
Net Deferred Tax Assets $ 141,504 $ 71,896Deferred Tax Expense (Income) ($ 69,608) $ 151,477
The Company is subject to the MCIT which is computed at 2% of gross income, asdefined under the tax regulations, or RCIT, whichever is higher. No MCIT was reportedin 2012 and 2011 as the RCIT was higher than MCIT in both years.
In 2012 and 2011, the Company opted to claim itemized deductions.
F-309

7/21/2019 PreliminaryProspectus - Century
http://slidepdf.com/reader/full/preliminaryprospectus-century 543/648
- 31 -
DRAFT (For DiscussionPur ose Onl
17. RELATED PARTY TRANSACTIONS
The Company’s related parties include its parent, entities under common ownership, theCompany’s key management personnel and others as described below. The following arethe transactions of the Company with related parties:
2012 2011
Outstanding Outstanding Related Party Amount of Receivable Amount of Receivable
Category Notes Transactions (Payable) Transactions (Payable)
ParentSale of goods 17.1 $ 11,702,675 $ 380,231 $ 7,188,460 $ -Management and consultancy
Services 17.3 438,395 149,555 351,142 - Advances 17.2 ( 5,921,302 ) ( 4,085,368 ) ( 832,648 ) ( 10,006,670 )Lease services 17.1 1,092,821 - 415,578 -
Related Parties UnderCommon OwnershipSale of goods 17.1 2,242,496 - 96,606 -
Key Management Personnel Compensation 17.5 45,539 - 42,574 -
17.1 Sale of Goods and Services
The Company sells raw material fish inventories to CCC and Columbus SeafoodsCorporation (CSC), a related party under common ownership. Outstanding balance inrelation to sale of goods amounts to $380,231 as at December 31, 2012 (nil in 2011).
In 2012, the Company entered into a new agreement with CCC to lease a portion of plant,machinery and equipment and cold storage located in Brgy. Tambler, General Santos City.Both leases shall be from January 1, 2012 onwards and will continue to be in effect unlesssooner terminated. Rentals are fully collected by the Company as at December 31, 2012.
Amount ofTransactions
2012 2011Parent company:
Sale of goods $ 11,702,675 $ 7,188,460Rental of facilities 1,092,821 415,578
12,795,496 7,604,038
Columbus Seafoods Corporation –Sale of goods 2,242,496 96,606
$ 15,037,992 $ 7,700,644
F-310

7/21/2019 PreliminaryProspectus - Century
http://slidepdf.com/reader/full/preliminaryprospectus-century 544/648
- 32 -
DRAFT (For DiscussionPur ose Onl
17.2 Advances from Related Parties
In the normal course of business, the Company obtains advances from CCC and PacificMeat Company Incorporated (PMCI), a related party under common ownership, for
working capital requirements and other purposes. The balance of Advances from RelatedParties amounts to $4,085,368 and $10,006,670 as at December 31, 2012 and 2011,
respectively. Advances from related parties are unsecured, noninterest-bearing andrepayable within 12 months.
2012 2011
Balance at beginning of year $ 10,006,670 $ 10,839,318
Net repayments during the year ( 5,921,302) ( 647,278) Transfer of AFS financial assets - ( 185,370)
Balance at end of year $ 4,085,368 $ 10,006,670
In 2011, the Compnay paid certain advances from CCC by transferring all of its AFSfinancial assets to CCC. The AFS financial assets were transferred at their carryingamounts and because there is no available fair value at the time of transfer, no gain or loss
was recognized. There was no similar transaction in 2012.
17.3 Consultancy and Management Fees
Beginning 2011, in addition to key management personnel compensation incurred, theCompany entered into an agreement to allow CCC to allocate and charge commoncorporate expenses to its subsidiaries. The consultancy and management fee incurred bythe Company amounted to $438,395 and $351,142 in 2012 and 2011, respectively. Thisamount is presented as part of Outside Services (see Note 13). As at December 31, 2012,the Company has $149,555 outstanding liability arising from this agreement and ispresented as part of Others under the Trade and Other Payables account in the 2012statement of financial position and is expected to be settled in 2013 (see Note 12).
17.4 Financial Guarantees
The Company, together with its related parties, has entered into a cross-corporateguarantee for the short-term loan obtained by CCC and PMCI from various local banks.
The outstanding balance of loan amounts to P1,447,400,000 ($35,137,891) andP1,910,400,000 ( $43,489,346) as at December 31, 2012 and 2011, respectively. TheCompany did not record the fair value of the guarantee liability because of the lowprobability of CCC and PMCI’s default in paying their respective borrowings.
17.5 Key Management Personnel Compensations
The short-term employee benefits of the key management personnel amounted to $45,539in 2012 and $42,574 in 2011 and are included as part of Employee Benefits in thestatements of comprehensive income. The increase in the key management personnelcompensation was in line with the agreement entered into by the Company with CCCrelating to consultancy and management fees (see Note 17.3).
F-311

7/21/2019 PreliminaryProspectus - Century
http://slidepdf.com/reader/full/preliminaryprospectus-century 545/648
- 33 -
DRAFT (For DiscussionPur ose Onl
18. REGISTRATION WITH THE BOARD OF INVESTMENTS (BOI)
On September 25, 2012, the BOI approved the Company’s registration as a newexpanding export producer of frozen tuna loins on a non-pioneer status. The Company isentitled to ITH for a period of three years beginning February 1, 2013 using the project’sability to contribute to the economy’s development pursuant to Article 7 of Executive
Order 226 based on the following parameters in this order: (1) project’s net value added;(2) job generation; (3) multiplier effect; and (4) measured capacity.
19. EQUITY
19.1 Capital Stock
Capital stock consists of common shares with details as follows:
Shares Amount
2012 2011 2012 2011
Authorized – P10 par value 50,000,000 50,000,000
Issued and outstanding:
Balance at beginning of year 50,000,000 32,477,106 P 500,000,000 P 324,771,060
Issuances during the year - 17,522,894 - 175,228,940
Balance at end of year 50,000,000 50,000,000 P 500,000,000 P 500,000,000
Balance at end of year (in U.S. dollars) $ 11,333,722 $ 11,333,722
As at December 31, 2012, the Company has six stockholders owning 100 or more shareseach of the Company’s capital stock.
19.2 Dividend Declaration
On December 6, 2011, the BOD approved the declaration of cash dividend of $1,732,062(P75,000,000) for distribution to stockholders of record as at the same date. The relateddividend was paid in full in 2012. On the same date, the BOD approved the declarationof stock dividend of $4,046,764 (P175,228,940) which is equivalent to 17,522,894 commonshares in favor of all its existing stockholders of record as at December 31, 2011. TheCompany did not declare any cash or stock dividend in 2012.
19.3 Prior Period Adjustments
In 2012, the Company’s management determined that the amount of cold storage rentals, which was inadvertently included as part of the Company’s inventoriable costs in 2011,should be expensed outright as the said expense is not directly related to the cost of itsinventories. Accordingly, the balance of Retained Earnings as at January 1, 2012 has beenrestated from the amount previously reported to recognize the effects such change.
The restatement resulted in a decrease in the amount of the previously reported RetainedEarnings by $857,231 as of January 1, 2012 and decrease in previously reported net profitby the same amount in 2011.
F-312

7/21/2019 PreliminaryProspectus - Century
http://slidepdf.com/reader/full/preliminaryprospectus-century 546/648
- 34 -
DRAFT (For DiscussionPur ose Onl
This prior period adjustment have the following effects on certain accounts in thestatements of financial position as at December 31, 2011 and statements ofcomprehensive income for the year then ended.
As Previously Prior PeriodReported Adjustment As Restated
Changes in Net Assets -Inventories $ 39,532,008 ( $ 857,231 ) $ 38,674,777
Changes in Profit or Loss:Cost of Goods Sold $ 73,695,228 $ 866,440 $ 74,561,668Finance Costs – net 1,665,940 ( 9,209 ) 1,656,731
Effect on Retained Earnings ( $ 857,231 )
20. COMMITMENTS AND CONTINGENCIES
20.1 Operating Leases
The Company is a lessee under several short-term lease contracts with renewal options. The usual term of the lease contract extends to one year that usually ends in December.
The amount of rent expense which is recognized as part of Manufacturing overhead underCost of Goods Sold in the statements of comprehensive income amounted to $4,100,160and $2,297,001, respectively, in 2012 and 2011 (see Note 13).
As of December 31, 2012 and 2011, the future minimum lease payments under these leaseagreements amounted to $3,583,273 and $3,195,928, respectively.
20.2 Financial Guarantees
As at December 31, 2012, the Company together with its related parties has financialguarantees amounting to $35,137,891 for the loan obtained by CCC and PMCI from
various local banks (see Note 17.4).
20.3 Capital Commitments
As at December 31, 2012, the Company has construction in progress totaling $705,335. The construction relates to a new building in connection with the Company’s plantexpansion. The construction is expected to be completed in 2013 and has remainingestimated costs to complete of P55,648,048 ($1,310,294) as at December 31, 2012.
20.4 Credit Facilities
As at December 31, 2012, the Company has unused credit facilities with two local banksamounting to $207,564,575. Also, the Company has continuing surety with related partieson several credit facilities with a local bank which was fully utilized as atDecember 31, 2012. These credit facilities will expire in 2013.
F-313

7/21/2019 PreliminaryProspectus - Century
http://slidepdf.com/reader/full/preliminaryprospectus-century 547/648
- 35 -
DRAFT (For DiscussionPur ose Onl
20.5 Others
There are other commitments, litigations and contingent liabilities that arise in the normalcourse of the Company’s operations which are not reflected in the accompanying financialstatements. As at December 31, 2012, management is of the opinion that losses, if any,from these commitments and contingencies will not have a material effect on the
Company’s financial statements.
21. CATEGORIES AND FAIR VALUES OF FINANCIAL ASSETS ANDLIABILITIES
The carrying amounts and fair values of the categories of assets and liabilities presented inthe statements of financial position are shown below.
Notes 2012 2011Carrying Fair Carrying Fair Values Values Values Values
Financial Assets
Cash and cash equivalents 5 $ 2,203,548 $ 2,203,548 $ 2,060,127 $ 2,060,127 Trade and
other receivables – net 6 4,619,685 4,619,685 5,446,965 5,446,965
$ 6,823,233 $ 6,823,233 $ 7,507,092 $ 7,507,092
Financial LiabilitiesCurrent:
Interest-bearing loans 11 $ 33,518,645 $ 33,518,645 $ 24,062,102 $ 24,062,102 Trade and other payables 12 10,868,962 10,868,962 9,372,685 9,372,685
Dividends payable - - 1,732,062 1,732,062 Advances from
related parties 18 4,085,368 4,085,368 10,006,670 10,006,670Non-current –
Interest-bearing loans 11 364,148 364,148 1,707,339 1,707,339
$ 48,837,123 $ 48,837,123 $ 47,122,081 $ 47,122,081
See Notes 2.3 and 2.7 for a description of the accounting policies for each category offinancial instrument. A description of the Company’s risk management objectives andpolicies for financial instruments is provided in Note 4.
The Company has no financial instruments that are carried at fair values in the statementof financial position as of December 31, 2012 and 2011, hence no fair value hierarchydisclosure is presented.
22. CAPITAL MANAGEMENT OBJECTIVES, POLICIES AND PROCEDURES
The Company’s capital management objectives are:
•
To ensure the Company’s ability to continue as a going concern;
• To meet maturing obligation to creditors; and,
• To provide an adequate return to shareholders by pricing products and servicescommensurately with the level of risk.
F-314

7/21/2019 PreliminaryProspectus - Century
http://slidepdf.com/reader/full/preliminaryprospectus-century 548/648
- 36 -
DRAFT (For DiscussionPur ose Onl
The Company monitors capital on the basis of the carrying amount of equity as presentedon the face of the statements of financial position. Capital for the reporting periods underreview is summarized as follows:
2012 2011
Total liabilities $ 49,186,501 $ 47,122,081 Total equity 20,904,698 18,725,642
Debt-to-equity ratio 2.35 2.52
The Company sets the amount of capital in proportion to its overall financing structure,i.e., equity and financial liabilities. The Company manages the capital structure and makesadjustments to it in the light of changes in economic conditions and the risk characteristicsof the underlying assets.
23. SUPPLEMENTARY INFORMATION ON STATEMENT OF FINANCIAL
POSITION AND COMPREHENSIVE INCOME
The Company’s financial statements are presented in U.S. dollars, its functional currency. The following information, which shows amounts of the Company’s statements offinancial position and statements of comprehensive income in Philippine pesos, ispresented for purposes of providing supplementary information to certain users and is notintended to be a presentation in accordance with PFRS. Under this supplementalinformation, transactions denominated in Philippines pesos were presented using theamounts at the dates of the transactions, while transactions denominated in U.S. dollars
were translated using appropriate exchange rates. Foreign currency gains and losses arenot translated.
Statements of Financial Position
2012 2011
ASSETS
Current assets P 2,194,606,531 P 2,070,893,799Non-current assets 674,726,869 755,014,918
Total Assets P 2,869,333,400 P 2,825,908,717
LIABILITIES AND EQUITY
Current liabilities P 2,011,090,293 P 1,993,892,745Non-current liabilities 14,355,250 75,000,000
Total Liabilities 2,025,445,543 2,068,892,745
Equity 843,887,857 757,015,972
Total Liabilities and Equity P 2,869,333,400 P 2,825,908,717
F-315

7/21/2019 PreliminaryProspectus - Century
http://slidepdf.com/reader/full/preliminaryprospectus-century 549/648
- 37 -
DRAFT (For DiscussionPur ose Onl
Statements of Comprehensive Income
2012 2011
Revenue – net P 3,793,036,607 P 3,468,026,827Cost of goods sold ( 3,575,252,766) ( 3,307,175,759 )Other operating expenses
and other charges ( 93,713,393) ( 118,190,628 ) Tax expense ( 37,198,563) ( 31,702,294 )
Net profit P 86,871,885 P 10,958,146
The translation into Philippine pesos should not be construed as a representation that theU.S. dollar amounts could be converted into Philippine Peso amounts or at any other ratesof exchange.
24. SUPPLEMENTARY INFORMATION REQUIRED BY THE BUREAU OFINTERNAL REVENUE
Presented below is the supplementary information which is required by the Bureau ofInternal Revenue (BIR) under its existing revenue regulations to be disclosed as part ofthe notes to financial statements. This supplementary information is not a requireddisclosure under PFRS.
24.1 Requirements under Revenue Regulations (RR) 15-2010
The information on taxes, duties and license fees paid or accrued during the taxable yearrequired under RR 15-2010 issued on November 25, 2010 are as follows:
(a)
Output VAT
In 2012, the Company declared output VAT as follows:
In Philippine Pesos In U.S. Dollars
Output Output
Tax Base VAT Tax Base VAT
VATable sales P 47,847,911 P 5,741,740 $ 1,133,250 $ 135,990
Zero-rated sales 3,539,169,480 - 83,823,193 -
Exempt sales 844,879,945 - 20,010,496 -
P 4,431,897,336 P 5,741,740 $ 104,966,939 $ 135,990
The Company’s zero-rated and VAT exempt sales/receipt were determined pursuant toSection 106A, VAT on Export Sales of Goods or Properties , and Section 109, VAT ExemptTransactions , of Revenues in the 2012 statement of comprehensive income.
The tax bases are included as part of Sale of Goods and as part of Other Charges, withrespect to other operating income, in the 2012 statement of comprehensive income. Thetax bases for other operating income are based on the Company’s gross receipts for theyear, hence, may not be the same with the amounts accrued in the 2012 statement ofcomprehensive income.
F-316

7/21/2019 PreliminaryProspectus - Century
http://slidepdf.com/reader/full/preliminaryprospectus-century 550/648
- 38 -
DRAFT (For DiscussionPur ose Onl
(a)
Input Value-Added Tax
The movements in Input VAT in 2012 are summarized below.
In Philippine In U.S.Pesos Dollars
Balance at beginning of year P 30,096,474 $ 685,132Goods for resale/manufacture
or further processing 3,450,628 81,726Capital goods subject to amortization 3,755,406 88,945Services lodged under cost of goods sold 3,120,188 73,900Claims for tax credit/refund ( 7,343,674 ) ( 173,931 )
Applied against output VAT ( 5,741,749 ) ( 135,990 )Foreign currency adjustment - 43,873
Balance at end of year P 27,337,273 $ 663,655
The balance of Input VAT amounting to P27,337,273 ($663,655) as at December 31, 2012is presented as part of Other Non-current Assets in the 2012 statement of financialposition (see Note 10).
(b)
Taxes on Importation
In 2012, the total landed cost of the Company’s imported inventory for the use in businessamounted to P3,081,938,799 ($72,993,948). This amount includes customs’ duties andtariff fees of P194,521,081 ($4,607,120).
(c) Excise Tax
The Company did not have any transactions in 2012 which are subject to excise tax.
(d) Documentary Stamp Tax (DST)
In 2012, the total DST paid and accrued by the Company on loan instruments amountedto P7,765,845 ($183,930).
(e)
Taxes and Licenses
The details of taxes and licenses for the year 2012 are broken down as follows:
In Philippine In U.S.Pesos Dollars
DST P 7,765,845 $ 183,930Business tax 2,422,464 57,375 Real estate tax 1,718,428 40,700
Miscellaneous 734,208 17,390
P 12,640,945 $ 299,395
The amounts of taxes and licenses for the year 2012 are presented as part of Taxes andlicenses under Administrative Expenses in the 2012 statement of comprehensive income(see Note 14).
F-317

7/21/2019 PreliminaryProspectus - Century
http://slidepdf.com/reader/full/preliminaryprospectus-century 551/648
- 39 -
DRAFT (For DiscussionPur ose Onl
(f)
Withholding Taxes
The details of total withholding taxes for the year ended December 31, 2012are shown below.
In Philippine In U.S.
Pesos Dollars
Expanded P 345,334 $ 8,179Compensation and benefits 3,237,682 76,683
P 3,583,016 $ 84,862
The Company has no transactions in 2012 which are subject to final tax.
(g) Deficiency Tax Assessment and Tax Cases
As at December 31, 2012, the Company does not have any deficiency tax assessments with
the BIR or tax cases outstanding or pending in courts or bodies outside of the BIR in anyof the open years.
24.2 Requirements under RR 19-2011
RR 19-2011 requires schedules of taxable revenues and other non-operating income,costs of sales and services, and itemized deductions, to be disclosed in the notes tofinancial statements.
The amounts of taxable revenues and income, and deductible costs and expensespresented below are based on relevant tax regulations issued by the BIR, hence, may notbe the same as the amounts reflected in the 2012 statement of comprehensive income.
(a)
Taxable Revenues
The Company’s sale of goods for the year ended December 31, 2012 which are subject toregular tax rate amounted to P3,793,036,607 ($90,072,393).
(b)
Deductible Costs of Sales
Deductible costs of sales at regular tax rate for the year ended December 31, 2012comprises the following:
In Philippine In U.S.Pesos Dollars
Finished goods at beginning of the year P 549,042,798 $ 11,976,360Cost of goods manufactured 3,455,451,388 81,621,821 Total goods available for sale 4,004,494,186 93,598,181Finished goods at end of year ( 430,241,420 ) ( 10,444,781 )
P 3,574,252,766 $ 83,153,400
F-318

7/21/2019 PreliminaryProspectus - Century
http://slidepdf.com/reader/full/preliminaryprospectus-century 552/648
- 40 -
DRAFT (For DiscussionPur ose Onl
(c)
Taxable Non-operating and Other Income
The details of taxable non-operating and other income in 2012 which are subject to regulartax rate are shown below.
In Philippine In U.S.Pesos Dollars
Rental income P 48,851,651 $ 1,092,821Others 9,023,354 213,713
P 57,875,005 $ 1,306,534
(d) Itemized Deductions
The amounts of itemized deductions at regular tax rate for the year endedDecember 31, 2012 are as follows:
In Philippine In U.S.
Pesos Dollars
Freight and handling P 47,162,798 $ 1,117,024Interest 33,542,104 794,425Other outside services 20,338,231 481,699Salaries and allowances 13,407,188 317,542 Taxes and licenses 12,640,945 299,395Depreciation and amortization 8,171,695 178,423Commissions 1,915,551 45,369Communication, light and water 658,242 15,590Office supplies 403,049 9,546Insurance 235,953 5,588Rental 208,000 4,926Miscellaneous 6,900,366 163,431
P 145,584,122 $ 3,432,958
F-319

7/21/2019 PreliminaryProspectus - Century
http://slidepdf.com/reader/full/preliminaryprospectus-century 553/648F-320

7/21/2019 PreliminaryProspectus - Century
http://slidepdf.com/reader/full/preliminaryprospectus-century 554/648F-321

7/21/2019 PreliminaryProspectus - Century
http://slidepdf.com/reader/full/preliminaryprospectus-century 555/648

7/21/2019 PreliminaryProspectus - Century
http://slidepdf.com/reader/full/preliminaryprospectus-century 556/648

7/21/2019 PreliminaryProspectus - Century
http://slidepdf.com/reader/full/preliminaryprospectus-century 557/648

7/21/2019 PreliminaryProspectus - Century
http://slidepdf.com/reader/full/preliminaryprospectus-century 558/648
December 31, January 1,
2012 2012
December 31, (As Restated - (As Restated -Notes 2013 see Note 2) see Note 2)
CURRENT ASSETS
Cash and cash equivalents 5 49,156,818P 36,933,115P 25,373,381P
Trade and other receivables - net 6 278,899,837 280,440,109 213,991,953
Inventories 7 304,661,051 430,924,704 560,094,395
Prepayments and other current assets 8 46,609,648 65,252,136 60,432,337
Total Current Assets 679,327,354 813,550,064 859,892,066
NON-CURRENT ASSETS
Property, plant and equipment - net 9 164,345,799 22,055,547 31,704,177
Post-employment benefit asset 15 622,299 - -
Deferrex tax asset - net 16 3,412,465 - -
Other non-current assets 10 42,013,295 42,884,295 42,435,295
Total Non-current Assets 210,393,858 64,939,842 74,139,472
TOTAL ASSETS 889,721,212P 878,489,906P 934,031,538P
CURRENT LIABILITIES
Trade and other payables 11 159,735,096P 334,282,846P 317,917,167P
Interest-bearing loans 12 215,000,000 - -
Due to related parties 18 7,965,473 278,872,672 415,465,566
Total Current Liabilities 382,700,569 613,155,518 733,382,733
NON-CURRENT LIABILITY
Post-employment benefit obligation 15 - 529,133 653,124
Total Liabilities 382,700,569 613,684,651 734,035,857
EQUITYCapital stock 17 500,000,000 40,625,000 40,625,000
Deposits for future stock subscriptions 17 - 195,883,200 150,383,200
Other reserve 2, 15 4,800 )( 956,799 )( 1,013,863 )(
Retained earnings 17 7,025,443 29,253,854 10,001,344
Net Equity 507,020,643 264,805,255 199,995,681
TOTAL LIABILITIES AND EQUITY 889,721,212P 878,489,906P 934,031,538P
See Notes to Financial Statements.
A S S E T S
LIABILITIES AND EQUITY
SNOW MOUNTAIN DAIRY CORPORATION
(A Wholly Owned Subsidiary of Century Pacific Food, Inc.)
STATEMENTS OF FINANCIAL POSITION
DECEMBER 31, 2013 AND 2012
(Amounts in Philippine Pesos)
(With Corresponding Figures as of January 1, 2012)
F-325

7/21/2019 PreliminaryProspectus - Century
http://slidepdf.com/reader/full/preliminaryprospectus-century 559/648
2012
(As Restated -Notes 2013 see Note 2)
SALE OF GOODS 18 1,556,358,881P 1,720,370,574P
COST OF GOODS SOLD 13 1,222,454,203 1,419,620,458
GROSS PROFIT 333,904,678 300,750,116
OTHER OPERATING EXPENSES (INCOME)
Selling expenses 13 128,583,164 131,551,269Marketing expenses 13 111,648,759 119,270,662
Administrative expenses 13 35,085,906 23,467,373
Other income 14,681 )( 128,616 )(
275,303,148 274,160,688
OPERATING PROFIT 58,601,530 26,589,428
FINANCE COSTS (INCOME) − Net 14 1,531,854 38,089 )(
PROFIT BEFORE TAX 57,069,676 26,627,517
TAX EXPENSE 16 15,298,087 7,375,007
NET PROFIT 41,771,589 19,252,510
OTHER COMPREHENSIVE INCOME
Item that will not be reclassified
subsequently to profit or loss
Remeasurement of post-employment
defined benefits obligation 15 949,942 57,064
Deferred tax income 16 2,057 -
951,999 57,064
TOTAL COMPREHENSIVE INCOME 42,723,588P 19,309,574P
See Notes to Financial Statements.
SNOW MOUNTAIN DAIRY CORPORATION
(A Wholly Owned Subsidiary of Century Pacific Food, Inc.)
STATEMENTS OF COMPREHENSIVE INCOME
FOR THE YEARS ENDED DECEMBER 31, 2013 AND 2012
(Amounts in Philippine Pesos)
F-326

7/21/2019 PreliminaryProspectus - Century
http://slidepdf.com/reader/full/preliminaryprospectus-century 560/648

7/21/2019 PreliminaryProspectus - Century
http://slidepdf.com/reader/full/preliminaryprospectus-century 561/648
2012
(As Restated -Notes 2013 see Note 2.2)
CASH FLOWS FROM OPERATING ACTIVITIES
Profit before tax 57,069,676P 26,627,517P
Adjustments for:
Depreciation and amortization 9 9,515,021 11,919,169
Finance costs 14 1,646,343 149,281
Finance income 14 114,489 )( 187,370 )(
Impairment losses 6 - 512,760
Operating profit before working capital changes 68,116,551 39,021,357
Decrease (increase) in trade and other receivables 1,540,271 45,243,422 )(
Decrease in inventories 126,263,653 100,110,346
Increase in prepayments and other current assets 47,754 )( 4,819,799 )(
Increase in post-employment benefit asset 201,490 )( 92,183 )(
Decrease (increase) in other non-current assets 871,000 449,000 )(Increase (decrease) in trade and other payables 174,547,750 )( 16,365,682
Cash generated from operations 21,994,481 104,892,981
Income taxes paid 18,253 )( 33,159 )(
Net Cash From Operating Activities 21,976,228 104,859,822
CASH FLOWS FROM INVESTING ACTIVITIES
Acquisitions of property and equipment 9 151,805,272 )( 2,270,539 )(
Interest received 114,489 187,370
Net Cash Used in Investing Activities 151,690,783 )( 2,083,169 )(
CASH FLOWS FROM FINANCING ACTIVITIES
Proceeds of interest-bearing loans 12 540,000,000 -
Repayments of due to related parties 18 527,630,340 )( 91,092,894 )(Repayment of interest-bearing loans 12 325,000,000 )( -
Proceeds from issuance of shares 17 263,491,800 -
Advances from related parties 18 256,723,141 -
Payment of cash dividend 17 64,000,000 )( -
Interest paid 1,646,343 )( 124,025 )(
Net Cash From (Used in) Financing Activities 141,938,258 91,216,919 )(
NET INCREASE IN CASH AND CASH EQUIVALENTS 12,223,703 11,559,734
CASH AND CASH EQUIVALENTS
AT BEGINNING OF YEAR 36,933,115 25,373,381
CASH AND CASH EQUIVALENTS AT END OF YEAR 49,156,818P 36,933,115P
Supplemental Information on Non-cash Financing Activities:
1)
2)
See Notes to Financial Statements.
SNOW MOUNTAIN DAIRY CORPORATION
(A Wholly Owned Subsidiary of Century Pacific Food, Inc.)
STATEMENTS OF CASH FLOWS
FOR THE YEARS ENDED DECEMBER 31, 2013 AND 2012
(Amounts in Philippine Pesos)
In 2013, the Company issued to Century Canning Corporation (CCC) 19,588,320 shares of stock, at par value,
which is equivalent to P195,883,200, upon applicat ion of the total balance of its deposits for future stock
subscription as full payment for its subscription (see Note 17).
In 2012, the Company and CCC agreed to convert portion of the Company’s advances from CCC amounting to
P45,500,000 to deposit for future stock subscription (see Note 17).
F-328

7/21/2019 PreliminaryProspectus - Century
http://slidepdf.com/reader/full/preliminaryprospectus-century 562/648
SNOW MOUNTAIN DAIRY CORPORATION(A Wholly Owned Subsidiary of Century Pacific Food, Inc.)
NOTES TO FINANCIAL STATEMENTSDECEMBER 31, 2013 and 2012(Amounts in Philippine Pesos)
1. CORPORATE INFORMATION
Snow Mountain Dairy Corporation (the Company) was incorporated in the Philippinesand registered with the Philippine Securities and Exchange Commission (SEC) onFebruary 14, 2001. It started commercial operations in November 2002. The Companyis engaged in producing, canning, freezing, preserving, refining, packing, buying andselling at wholesale and retail, food products including all kinds of milk and dairyproducts, fruits and vegetable juices and other milk or dairy preparations andby-products.
The Company is a subsidiary of Century Canning Corporation (CCC) untilOctober 31, 2013 when CCC transferred for a consideration its 100% ownership interestin the Company to Century Pacific Food, Inc. (CPFI or the new parent company) as partof the corporate reorganization undertaken by the Century Pacific Group (the Group)
within which CCC is the parent company (see also Note 17.1). CPFI is a newlyincorporated subsidiary of CCC, which is now the Company’s ultimate parent company.CCC is engaged in the manufacture and distribution of canned tuna products for thePhilippine market. CPFI will soon operate as a food manufacturing company.
On January 7, 2014, the Board of Directors resolved to amend the Company’s articles ofincorporation due to the change in the address of its registered office, which is also itsprincipal place of business, from No.48 Amang Rodriguez Avenue, Ignacio Complex,Manggahan, Pasig City to 32 Arturo Drive, Bagumbayan, Taguig, Metro Manila as part ofthe Company’s expansion activities (see Note 9). The amendment was accordingly
approved by the SEC on February 26, 2014. The ultimate parent and parent company’sregistered office, which is also their principal place of business, is located at Suite 505Centerpoint Building, Julia Vargas St., Ortigas Center, Pasig City.
The financial statements of the Company for the year ended December 31, 2013(including the comparatives financial statements for December 31, 2012 and thecorresponding figures as of January 1, 2012) were authorized for issue by the Company’sBoard of Directors on March 7, 2014.
F-329

7/21/2019 PreliminaryProspectus - Century
http://slidepdf.com/reader/full/preliminaryprospectus-century 563/648
- 2 -
2. SUMMARY OF SIGNIFICANT ACCOUNTING POLICIES
The significant accounting policies that have been used in the preparation of thesefinancial statements are summarized below and in the succeeding pages. The policieshave been consistently applied to all the years presented, unless otherwise stated.
2.1
Basis of Preparation of Financial Statements
(a) Statement of Compliance with Philippine Financial Reporting Standards (PFRS)
The financial statements of the Company have been prepared in accordance withPFRS. PFRS are adopted by the Financial Reporting Standards Council from thepronouncements issued by the International Accounting Standards Board (IASB).
The financial statements have been prepared using the measurement basesspecified by PFRS for each type of asset, liability, income and expense. Themeasurement bases are more fully described in the accounting policies that follow.
(b)
Presentation of Financial Statements
The financial statements are presented in accordance with Philippine AccountingStandards (PAS) 1, Presentation of Financial Statements . The Company presents all itemsof income and expenses and other comprehensive income in a single statement ofcomprehensive income.
The Company presents a third statement of financial position as at the beginning ofthe preceding period when it applies an accounting policy retrospectively, or makes aretrospective restatement or reclassification of items that has a material effect on theinformation in the statement of financial position at the beginning of the precedingperiod. The related notes to the third statement of financial position are not
required to be disclosed.
The Company’s adoption of PAS 19 (Revised), Employee Benefits , resulted in materialretrospective restatements on certain accounts in the comparativefinancial statements for December 31, 2012 and in the corresponding figures asof January 1, 2012 [see Note 2(a)(ii)]. Accordingly, the Company presents a thirdstatement of financial position as at January 1, 2012 without the related notes, exceptfor the disclosures required under PAS 8, Accounting Policies, Changes in Accounting
Estimates and Errors.
(c)
Functional and Presentation Currency
These financial statements are presented in Philippine pesos, the Company’sfunctional and presentation currency, and all values represent absolute amountsexcept when otherwise indicated.
Items included in the financial statements are measured using its functional currency,the currency of the primary economic environment in which the Company operates.
F-330

7/21/2019 PreliminaryProspectus - Century
http://slidepdf.com/reader/full/preliminaryprospectus-century 564/648
- 3 -
2.2
Adoption of New and Amended PFRS
(a) Effective in 2013 that is Relevant to the Company
In 2013, the Company adopted for the first time the following new, amendments,revision and improvements to PFRS that are relevant to the Company and effective
for financial statements for the annual periods beginning on or after July 1, 2012 or January 1, 2013:
PAS 1 (Amendment) : Financial Statements Presentation –Presentation of Items of OtherComprehensive Income
PAS 19 (Revised) : Employee BenefitsPFRS 7 (Amendment) : Financial Instrument: Disclosures –
Offsetting Financial Assets andFinancial Liabilities
PFRS 13 : Fair Value Measurement Annual Improvements : Annual Improvements to PFRS
(2009 – 2011 Cycle)
Discussed below are the relevant information about these new, amended and revisedstandards and the corresponding impact in the Company’s financial statements.
(i)
PAS 1 (Amendment), Financial Statements Presentation – Presentation of Items ofOther Comprehensive Income (effective from July 1, 2012). The amendmentrequires an entity to group items presented in other comprehensive incomeinto those that, in accordance with other PFRS: (a) will not be reclassifiedsubsequently to profit or loss, and, (b) will be reclassified subsequently toprofit or loss when specific conditions are met. The amendment has beenapplied retrospectively, hence, the presentation of other comprehensive
income has been modified to reflect the changes. Management determinedthat the amendment did not significantly affect the financial statements as itsother comprehensive income is only comprised of actuarial gains and losseson post-employment defined benefit obligation, an item which is notreclassified subsequently to profit or loss.
(ii)
PAS 19 (Revised 2011), Employee Benefits (effective from January 1, 2013). Therevision made a number of changes as part of the improvements throughoutthe standard. The main changes relate to defined benefit plans as follows:
• eliminates the corridor approach and requires the recognition ofremeasurements (including actuarial gains and losses) arising in the
reporting period in other comprehensive income;
•
changes the measurement and presentation of certain components of thedefined benefit cost. The net amount in profit or loss is affected by theremoval of the expected return on plan assets and interest costcomponents and their replacement by a net interest expense or incomebased on the net defined benefit liability or asset; and,
• enhances disclosure requirements, including information about thecharacteristics of defined benefit plans and the risks that entities areexposed to through participation in those plans.
F-331

7/21/2019 PreliminaryProspectus - Century
http://slidepdf.com/reader/full/preliminaryprospectus-century 565/648
- 4 -
The Company has applied PAS 19 (Revised) retrospectively in accordance withits transitional provision. Consequently, it restated the previous yearspresented. An analysis of the effect of the adjustments on the specific assets,liabilities, and equity components affected is presented below.
As Previously Prior PeriodReported Adjustment As Restated
December 31, 2012
Change in asset and liability:
Post-employment benefit asset 608,524P 608,524 )( P -
Post-employment benefit
obligation - 529,133 )( 529,133 )(
Total decrease in equity 1,137,657 )( P
Changes in equity:
Retained earnings 29,434,712P 180,858 )( P 29,253,854P
Other reserve - 956,799 )( 956,799 )(
Total decrease in equity 1,137,657 )( P
P
January 1, 2012
Change in asset and liability:
Post-employment benefit asset 484,533P 484,533 )( P -
Post-employmentbenefit obligation - 653,124 )( 653,124 )(
Total decrease in equity 1,137,657 )( P
Changes in equity:
Retained earnings 10,125,138P 123,794 )( P 10,001,344POther reserve - 1,013,863 )( 1,013,863 )(
Total decrease in equity 1,137,657 )( P
P
The effect of the prior period adjustments arising from the adoption of PAS 19(Revised) on certain line items of the statements of comprehensive income andstatements of cash flows for the year ended December 31, 2012 is not material;accordingly, the analyses were no longer presented.
F-332

7/21/2019 PreliminaryProspectus - Century
http://slidepdf.com/reader/full/preliminaryprospectus-century 566/648
- 5 -
(iii)
PFRS 7 (Amendment), Financial Instruments: Disclosures – Offsetting Financial Assetsand Financial Liabilities (effective from January 1, 2013). The amendment requiresqualitative and quantitative disclosures relating to gross and net amounts ofrecognized financial instruments that are set-off in accordance with PAS 32,Financial Instruments: Presentation . The amendment also requires disclosure ofinformation about recognized financial instruments which are subject to
enforceable master netting arrangements or similar agreements, even if they arenot set-off in the statement of financial position, including those which do notmeet some or all of the offsetting criteria under PAS 32 and amounts related to afinancial collateral. These disclosures will allow financial statement users toevaluate the effect or potential effect of netting arrangements, including rights ofset-off associated with recognized financial assets and financial liabilities on theentity’s financial position. This amendment did not have a significant impact onthe Company’s financial statements as the Company has no and does not expectto have offsetting arrangements (see Note 20).
(iv)
PFRS 13, Fair Value Measurement (effective from January 1, 2013). This newstandard clarifies the definition of fair value and provides guidance and enhanced
disclosures about fair value measurements. The requirements under the thisstandard do not extend the use of fair value accounting but provide guidance onhow it should be applied to both financial instrument items and non-financialitems for which other PFRS require or permit fair value measurements ordisclosures about fair value measurements, except in certain circumstances. Theamendment applies prospectively from annual periods beginning January 1, 2013;hence, disclosure requirements need not be resented in the comparativeinformation in the first year of application.
Other than the additional disclosures presented in Note 21, the application ofthis new standard had no significant impact in the amounts recognized in thefinancial statements.
(v)
2009-2011 Annual Improvements to PFRS. Annual improvements to PFRS(2009-2011 Cycle) made minor amendments to a number of PFRS, which areeffective for annual periods beginning on or after January 1, 2013. Among thoseimprovements, the following amendments are relevant to the Company:
(a)
PAS 1 (Amendment), Presentation of Financial Statements – Clarification of theRequirements for Comparative Information . The amendment clarifies that astatement of financial position as at the beginning of the preceding period(third statement of financial position) is required when an entity applies anaccounting policy retrospectively, or makes a retrospective restatement orreclassification of items that has a material effect on the information in the
third statement of financial position. The amendment specifies that otherthan disclosure of certain specified information in accordance with PAS 8, Accounting Policies, Changes in Accounting Estimates and Errors , related notes tothe third statement of financial position are not required to be presented.
Consequent to the Company’s adoption of PAS 19 (Revised) in thecurrent year, which resulted in retrospective restatement of the prior years’financial statements, the Company has presented a third statement offinancial position as at January 1, 2012 without the related notes, exceptfor the disclosure requirements of PAS 8, as allowed under thisamendment to PAS 1.
F-333

7/21/2019 PreliminaryProspectus - Century
http://slidepdf.com/reader/full/preliminaryprospectus-century 567/648
- 6 -
(b)
PAS 16 (Amendment), Property, Plant and Equipment – Classification ofServicing Equipment . The amendment addresses a perceived inconsistencyin the classification requirements for servicing equipment which resultedin classifying servicing equipment as part of inventory when it is used formore than one period. It clarifies that items such as spare parts, stand-byequipment and servicing equipment shall be recognized as property, plant
and equipment when they meet the definition of property, plant andequipment, otherwise, these are classified as inventory. This amendmenthas no significant effect on the financial statements since the Companyhas already been applying the classification requirements of thisamendment for the abovementioned spare parts and equipment inaccordance with the recognition criteria under PAS 16.
(c)
PAS 32 (Amendment ), Financial Instruments : Presentation – Tax Effect ofDistributions to Holders of Equity Instruments . The amendment clarifies thatthe consequences of income tax relating to distributions to holders of anequity instrument and to transaction costs of an equity transaction shall beaccounted for in accordance with PAS 12. Accordingly, income tax
relating to distributions to holders of an equity instrument is recognized inprofit or loss while income tax related to the transaction costs of an equitytransaction is recognized in equity. The adoption of this amendment didnot have an impact on the Company’s financial statements as theCompany’s accounting policy on tax effect of transactions involvingequity instruments is in accordance with the amendment.
(b) Effective in 2013 that are not Relevant to the Company
The following new PFRS, amendments and annual improvements to existingstandards are mandatory for accounting periods beginning on after January 1, 2013but are not relevant to the Company’s financial statements:
PAS 27 (Amendment) : Separate Financial StatementsPAS 28 (Amendment) : Investment in Associate and Joint
VenturePFRS 1 (Amendment) : First-time Adoption of PFRS –
Government LoansPFRS 10 : Consolidated Financial StatementsPFRS 11 : Joint ArrangementsPFRS 12 : Disclosure of Interests in Other
EntitiesPFRS 10, 11 and PFRS 12
(Amendment) : Amendments to PFRS 10, 11 and 12 –
Transition Guidance toPFRS 10, 11 and 12Philippine Interpretation
International FinancialReporting InterpretationsCommittee 20 : Stripping Costs in the Production
Phase of a Surface Mine
F-334

7/21/2019 PreliminaryProspectus - Century
http://slidepdf.com/reader/full/preliminaryprospectus-century 568/648
- 7 -
Annual Improvements2009-2011 CyclePFRS 1 (Amendment) : First-time Adoption of PFRS –
Repeated Application of PFRS 1and Borrowing Cost
PAS 34 (Amendment) : Interim Financial Reporting – Interim
Financial Reporting andSegment Information for Total Assets and Liabilities
(c) Effective Subsequent to 2013 but not Adopted Early
There are new PFRS, amendments and annual improvements to existing standardsthat are effective for periods subsequent to 2013. Management has initiallydetermined the following pronouncements, which the Company will apply inaccordance with their transitional provisions, to be relevant to its financialstatements:
(i)
PAS 19 (Amendment), Employee Benefits – Defined Benefit Plans – EmployeeContributions (effective from January 1, 2014). The amendment clarifies that ifthe amount of the contributions from employees or third parties is dependenton the number of years of service, an entity shall attribute the contributions toperiods of service using the same attribution method (i.e., either using theplan’s contribution formula or on a straight-line basis) for the gross benefit.Management has initially determined that this amendment will have no impacton the Company’s financial statements.
(ii)
PAS 32 (Amendment), Financial Instruments: Presentation – Offsetting Financial Assets and Financial Liabilities (effective from January 1, 2014). Theamendment provides guidance to address inconsistencies in applying the
criteria for offsetting financial assets and financial liabilities. It clarifies that aright of set-off is required to be legally enforceable, in the normal course ofbusiness; in the event of default; and in the event of insolvency or bankruptcyof the entity and all of the counterparties. The amendment also clarifies theprinciple behind net settlement and provided characteristics of a grosssettlement system that would satisfy the criterion for net settlement. TheCompany does not expect this amendment to have a significant impact on itsfinancial statements.
(iii) PAS 36 (Amendment), Impairment of Assets – Recoverable Amount Disclosures for Non-financial Assets (effective from January 1, 2014). The amendment clarifiesthat the requirements for the disclosure of information about the recoverable
amount of assets or cash-generating units is limited only to the recoverableamount of impaired assets that is based on fair value less cost of disposal. Italso introduces an explicit requirement to disclose the discount rate used indetermining impairment (or reversals) where recoverable amount based onfair value less cost of disposal is determined using a present value technique.Management will reflect in its subsequent year’s financial statements thechanges arising from this relief on disclosure requirements.
F-335

7/21/2019 PreliminaryProspectus - Century
http://slidepdf.com/reader/full/preliminaryprospectus-century 569/648
- 8 -
(iv)
PAS 39 (Amendment), Financial Instruments: Recognition and Measurement – Novation of Derivatives and Continuation of Hedge Accounting(effective January 1, 2014). The amendment provides some relief from therequirements on hedge accounting by allowing entities to continue the use ofhedge accounting when a derivative is novated to a clearing counterpartyresulting in termination or expiration of the original hedging instrument as a
consequence of laws and regulations, or the introduction thereof. As theCompany neither enters into transactions involving derivative instruments norit applies hedge accounting, the amendment will not have any impact on thefinancial statements.
(v)
PFRS 9, Financial Instruments: Classification and Measurement . This is the first partof a new standard on financial instruments that will replace PAS 39, FinancialInstruments: Recognition and Measurement , in its entirety. The first phase of thestandard was issued on November 2009 and October 2010 and contains newrequirements and guidance for the classification, measurement andrecognition of financial assets and financial liabilities. It requires financialassets to be classified into two measurement categories: amortized cost or fair
value. Debt instruments that are held within a business model whoseobjective is to collect the contractual cash flows that represent solelypayments of principal and interest on the principal outstanding are generallymeasured at amortized cost. All other debt instruments and equityinstruments are measured at fair value. In addition, PFRS 9 allows entities tomake an irrevocable election to present subsequent changes in the fair valueof an equity instrument that is not held for trading in other comprehensiveincome.
The accounting for embedded derivatives in host contracts that are financialassets is simplified by removing the requirement to consider whether or notthey are closely related, and, in most arrangement, does not require separation
from the host contract.
For liabilities, the standard retains most of the PAS 39 requirements whichinclude amortized cost accounting for most financial liabilities, withbifurcation of embedded derivatives. The main change is that, in case wherethe fair value option is taken for financial liabilities, the part of a fair valuechange due to the liability’s credit risk is recognized in other comprehensiveincome rather than in profit or loss, unless this creates an accountingmismatch.
In November 2013, the IASB has published amendments to InternationalFinancial Reporting Standard (IFRS) 9 that contain new chapter and model
on hedge accounting that provides significant improvements principally byaligning hedge accounting more closely with the risk management activitiesundertaken by entities when hedging their financial and non-financial riskexposures. The amendment also now requires changes in the fair value of anentity’s own debt instruments caused by changes in its own credit quality to berecognized in other comprehensive income rather in profit or loss. It alsoincludes the removal of the January 1, 2015 mandatory effective date ofIFRS 9.
F-336

7/21/2019 PreliminaryProspectus - Century
http://slidepdf.com/reader/full/preliminaryprospectus-century 570/648
- 9 -
To date, the remaining chapter of IFRS 9 and PFRS 9 dealing withimpairment methodology is still being completed. Further, the IASB iscurrently discussing some limited modifications to address certain applicationissues regarding classification of financial assets and to provide otherconsiderations in determining business model.
The Company does not expect to implement and adopt PFRS 9 until itseffective date. In addition, management is currently assessing the impact ofPFRS 9 on the financial statements of the Company and it plans to conduct acomprehensive study of the potential impact of this standard prior to itsmandatory adoption date to assess the impact of all changes.
(vi)
Annual Improvements to PFRS. Annual improvements to PFRS (2010-2012Cycle) and PFRS (2011-2013 Cycle) made minor amendments to a number ofPFRS, which are effective for annual periods beginning on or after
July 1, 2014. Among those improvements, the following amendments arerelevant to the Company but management does not expect a material impacton the Company’s financial statements:
Annual Improvements to PFRS (2010-2012 Cycle)
(a)
PAS 16 (Amendment), Property, Plant and Equipment and PAS 38(Amendment), Intangible Assets . The amendments clarify that when anitem of property, plant and equipment, and intangible assets is revalued,the gross carrying amount is adjusted in a manner that is consistent witha revaluation of the carrying amount of the asset.
(b)
PAS 24 (Amendment), Related Party Disclosures . The amendment clarifiesthat entity providing key management services to a reporting entity isdeemed to be a related party of the latter. It also requires and clarifies
that the amounts incurred by the reporting entity for key managementpersonnel services that are provided by a separate management entityshould be disclosed in the financial statements, and not the amounts ofcompensation paid or payable by the key management entity to itsemployees or directors.
(c)
PFRS 13 (Amendment), Fair Value Measurement . The amendment,through a revision only in the basis of conclusion of PFRS 13, clarifiesthat issuing PFRS 13 and amending certain provisions of PFRS 9 andPAS 39 related to discounting of financial instruments, did not removethe ability to measure short-term receivables and payables with no statedinterest rate on an undiscounted basis, when the effect of not discounting
is immaterial.
Annual Improvement to PFRS (2011-2013 Cycle)
PFRS 13 (Amendment), Fair Value Measurement . The amendment clarifies thatthe scope of the exception for measuring the fair value of a group of financialassets and financial liabilities on a net basis (the portfolio exception) applies toall contracts within the scope of, and accounted for in accordance with,PAS 39 or PFRS 9, regardless of whether they meet the definitions offinancial assets or financial liabilities as defined in PAS 32.
F-337

7/21/2019 PreliminaryProspectus - Century
http://slidepdf.com/reader/full/preliminaryprospectus-century 571/648
- 10 -
2.3
Financial Assets
Financial assets are recognized when the Company becomes a party to the contractualterms of the financial instrument. Financial assets other than those designated andeffective as hedging instruments are classified into the following categories: financialassets at fair value through profit or loss (FVTPL), loans and receivables, held-to-maturity
investments and available-for-sale financial assets. Financial assets are assigned to thedifferent categories by management on initial recognition, depending on the purpose for which the investments were acquired.
Regular purchases and sales of financial assets are recognized on their trade date. Allfinancial assets that are not classified as at FVTPL are initially recognized at fair valueplus any directly attributable transaction costs. Financial assets carried at FVTPL areinitially recorded at fair value and related transaction costs that are recognized in profit orloss.
The financial assets category that is relevant to the Company is loans and receivables.
Loans and receivables are non-derivative financial assets with fixed or determinablepayments that are not quoted in an active market. They arise when the Companyprovides money, goods or services directly to a debtor with no intention of trading thereceivables. They are included in current assets, except for maturities greater than12 months after the end of the reporting period which are classified as non-current assets.
Loans and receivables are subsequently measured at amortized cost using the effectiveinterest method, less impairment loss, if any. Impairment loss is provided when there isobjective evidence that the Company will not be able to collect all amounts due to it inaccordance with the original terms of the receivables. The amount of the impairmentloss is determined as the difference between the assets’ carrying amount and the present
value of estimated cash flows (excluding future credit losses that have not been incurred),
discounted at the financial asset’s original effective interest rate or current effectiveinterest rate determined under the contract if the loan has a variable interest rate.
The Company’s financial assets categorized as loans and receivables are presented asCash and Cash Equivalents, Trade and Other Receivables (except deposit on purchases)and as part of Other Non-current Assets, with respect to security deposits includedtherein, in the statement of financial position. Cash and cash equivalents include cash onhand, demand deposits and short-term, highly liquid investments with original maturitiesof three months or less, readily convertible to known amounts of cash and which aresubject to insignificant risk of changes in value.
All income and expenses, excluding those that relate to operating activities, relating to
financial assets that are recognized in profit or loss in the statement of comprehensiveincome.
Non-compounding interest, and other cash flows resulting from holding financial assetsare recognized in profit or loss when earned, regardless of how the related carryingamount of financial assets is measured.
Derecognition of financial assets occurs when the rights to receive cash flows from thefinancial instruments expire or are transferred and substantially all of the risks andrewards of ownership have been transferred to another party.
F-338

7/21/2019 PreliminaryProspectus - Century
http://slidepdf.com/reader/full/preliminaryprospectus-century 572/648
- 11 -
2.4
Inventories
Inventories are valued at the lower of cost and net realizable value. Cost is determinedusing the first-in, first-out method. Finished goods and work-in-process include the costof raw materials, direct labor and a proportion of manufacturing overhead based onnormal operating capacity. The cost of raw materials include all costs directly attributable
to acquisitions, such as the purchase price, import duties and other taxes that are notsubsequently recoverable from taxing authorities.
Net realizable value is the estimated selling price in the ordinary course of business, lessthe estimated costs of completion and the estimated costs necessary to make the sale.Net realizable value of raw materials is the current replacement cost.
2.5 Property, Plant and Equipment
Property, plant and equipment are stated at cost less accumulated depreciation andamortization and any impairment in value.
The cost of an asset comprises its purchase price and directly attributable costs ofbringing the asset to working condition for its intended use. Expenditures for additions,major improvements and renewals are capitalized; expenditures for repairs andmaintenance are charged to expense as incurred.
Depreciation is computed on a straight-line basis over the estimated useful lives of theassets as follows:
Plant, machinery and equipment 2 to 10 yearsLaboratory tools and equipment 1 to 10 years
Leasehold improvements are amortized over the term of the lease or the useful lives of
the assets of 1 to 10 years, whichever is shorter.
Construction-in-progress represents properties undergoing construction. It is stated atcost which includes cost of construction, applicable borrowing costs (see Note 2.15) andother direct costs. This account is not depreciated until such time that the assets arecompleted and available for use.
Fully depreciated assets are retained in the accounts until these are no longer in use. Nofurther charge for depreciation is made in respect of those accounts.
An asset’s carrying amount is written down immediately to its recoverable amount if theasset’s carrying amount is greater than its estimated recoverable amount (see Note 2.13).
The residual values and estimated useful lives of property, plant and equipment arereviewed, and adjusted if appropriate, at the end of each reporting period.
An item of property, plant and equipment, including related accumulated depreciationand amortization and impairment losses, if any, is derecognized upon disposal or whenno future economic benefits are expected to arise from the continued use of the asset.
Any gain or loss arising on derecognition of the asset (calculated as the differencebetween the net disposal proceeds and the carrying amount of the item) is included in thestatement of comprehensive income in the period the item is derecognized.
F-339

7/21/2019 PreliminaryProspectus - Century
http://slidepdf.com/reader/full/preliminaryprospectus-century 573/648
- 12 -
2.6
Prepayments and Other Assets
Prepayment and other assets pertain to the other resources controlled by the Company asa result of past events. They are recognized in the financial statements when it isprobable that the future economic benefits will flow to the entity and the asset has a costor value that can be measured reliably.
Other recognized assets of similar nature, where future economic benefits are expectedto flow to the Company beyond one year after the end of the reporting period (or in thenormal operating cycle of the business, if longer), are classified as non-current assets.
2.7 Trademarks
The cost of trademarks is the amount of cash or cash equivalents paid or the fair value ofthe other considerations given up to acquire the trademark. The Company’s trademark isnot amortized but tested for impairment annually [see Notes 2.13 and 3.1(a)].
2.8 Financial Liabilities
Financial liabilities of the Company include trade and other payables (except tax-relatedliabilities) and due to related parties which are recognized when the Company becomes aparty to the contractual terms of the instrument. All interest-related charges incurred ona financial liability that relates to financing activities are recognized as an expense in profitor loss under the caption Finance Costs (Income) – net in the statement ofcomprehensive income.
Financial liabilities are recognized initially at their fair value and subsequently measured atamortized cost, using effective interest method for maturities of more than one year, lesssettlement payments.
Financial liabilities are classified as current liabilities if payment is due to be settled withinone year or less after the end of the reporting period (or in the normal operating cycle ofthe business, if longer), or the Company does not have an unconditional right to defersettlement of liability for at least 12 months after the end of the reporting period.Otherwise, these are presented as non-current liabilities.
Financial liabilities are derecognized from the statement of financial position only whenthe obligations are extinguished either through discharge, cancellation or expiration. Thedifference between the carrying amount of the financial liability derecognized and theconsideration paid or payable is recognized in profit or loss.
2.9 Offsetting Financial Instruments
Financial assets and liabilities are offset and the resulting net amount is reported in thestatement of financial position when there is a legally enforceable right to set off therecognized amounts and there is an intention to settle on a net basis, or realize the assetand settle the liability simultaneously.
F-340

7/21/2019 PreliminaryProspectus - Century
http://slidepdf.com/reader/full/preliminaryprospectus-century 574/648
- 13 -
2.10
Provisions and Contingencies
Provisions are recognized when present obligations will probably lead to an outflow ofeconomic resources and they can be estimated reliably even if the timing or amount ofthe outflow may still be uncertain. A present obligation arises from the presence of alegal or constructive obligation that has resulted from past events.
Provisions are measured at the estimated expenditure required to settle the presentobligation, based on the most reliable evidence available at the end of the reportingperiod, including the risks and uncertainties associated with the present obligation.
Where there are a number of similar obligations, the likelihood that an outflow will berequired in settlement is determined by considering the class of obligations as a whole.
When time value of money is material, long-term provisions are discounted to theirpresent values using a pretax rate that reflects market assessments and the risks specific tothe obligation. The increase in the provision due to passage of time is recognized asinterest expense. The provisions are reviewed at the end of each reporting period andadjusted to reflect the current best estimate.
In those cases where the possible outflow of economic resource as a result of presentobligations is considered improbable or remote, or the amount to be provided for cannotbe measured reliably, no liability is recognized in the financial statements. Similarly,possible inflows of economic benefits to the Company that do not yet meet therecognition criteria of an asset are considered contingent assets, hence, are not recognizedin the financial statements. On the other hand, any reimbursement that the Companycan be virtually certain to collect from a third party with respect to the obligation isrecognized as a separate asset not exceeding the amount of the related provision.
2.11 Revenue and Expense Recognition
Revenue comprises of revenue from the sale of goods measured by reference to the fair
value of consideration received or receivable by the Company for goods sold excluding value-added tax (VAT) and any trade discounts.
Revenue is recognized to the extent that the revenue can be reliably measured; it isprobable that the economic benefits will flow to the Company; and the costs incurred orto be incurred can be measured reliably. In addition, the following specific recognitioncriteria must also be met before revenue is recognized:
(a)
Sale of goods – Revenue is recognized when the risks and rewards of ownership of thegoods have passed to the buyer, i.e. generally when the customer has acknowledgeddelivery of goods.
(b)
Interest income – Recognized as the interest accrues taking into account the effectiveyield on the asset.
Costs and expenses are recognized in profit or loss upon receipt of goods, utilization ofservices or at the date they are incurred. All finance costs are reported in profit or loss onan accrual basis, except capitalized borrowing costs which are included as part of the costof the related qualifying asset (see Note 2.15).
F-341

7/21/2019 PreliminaryProspectus - Century
http://slidepdf.com/reader/full/preliminaryprospectus-century 575/648
- 14 -
2.12
Leases – Company as Lessee
Leases which do not transfer to the Company substantially all the risks and benefits ofownership of the asset are classified as operating leases. Operating lease payments arerecognized as expense in the statement of comprehensive income on a straight-line basisover the lease term. Associated costs, such as repairs and maintenance and insurance, are
expensed as incurred.
The Company determines whether an arrangement is, or contains, a lease based on thesubstance of the arrangement. It makes an assessment of whether the fulfilment of thearrangement is dependent on the use of a specific asset or assets and the arrangementconveys a right to use the asset.
2.13 Impairment of Non-financial Assets
The Company’s trademarks, having an indefinite useful life, are tested for impairmentannually. Property, plant and equipment and other non-financial assets are tested forimpairment whenever events or changes in circumstances indicate that the carrying
amount of those assets may not be recoverable.
For purposes of assessing impairment, assets are grouped at the lowest levels for whichthere are separately identifiable cash flows (cash-generating unit). As a result, assets aretested for impairment either individually or at the cash-generating unit level.
Impairment loss is recognized for the amount by which the asset’s or cash-generatingunit’s carrying amount exceeds its recoverable amount. The recoverable amount is thehigher of fair value, reflecting market conditions less costs to sell, and value in use, basedon an internal evaluation of discounted cash flow. Impairment loss is charged pro-rata toother assets in the cash-generating unit.
All assets are subsequently reassessed for indications that an impairment loss previouslyrecognized may no longer exist. An impairment loss is reversed if the asset’s or cashgenerating unit’s recoverable amount exceeds its carrying amount.
2.14 Employee Benefits
(a)
Defined Benefit Plan
The Company provides post-employment benefits to employees through a definedbenefit plan.
A defined benefit plan is a post-employment plan that defines an amount of
post-employment benefit that an employee will receive on retirement, usuallydependent on one or more factors such as age, years of service and salary. The legalobligation for any benefits from this kind of post-employment plan remains with theCompany, even if plan assets for funding the defined benefit plan have beenacquired. Plan assets may include assets specifically designated to a long-termbenefit fund, as well as qualifying insurance policies. The Company’s defined benefitpost-employment plan covers all regular full-time employees. The pension plan istax-qualified, non-contributory and administered by a trustee.
F-342
7/21/2019 PreliminaryProspectus - Century
http://slidepdf.com/reader/full/preliminaryprospectus-century 576/648
- 15 -
The liability recognized in the statement of financial position for a defined benefitplan is the present value of the defined benefit obligation (DBO) at the end of thereporting period less the fair value of plan assets. The DBO is calculated every otheryear by independent actuaries using the projected unit credit method. The present
value of the DBO is determined by discounting the estimated future cash outflowsusing a discount rate derived from the interest rate of a zero coupon government
bonds as published by Philippine Dealing and Exchange Corporation that aredenominated in the currency in which the benefits will be paid and that have termsof maturity approximating to the terms of the related post-employment liability.
Remeasurements, comprising of actuarial gains and losses arising from experienceadjustments and changes in actuarial assumptions and the return on plan assets(excluding amount included in net interest) are reflected immediately in thestatement of financial position with a charge or credit recognized in othercomprehensive income in the period in which they arise. Net interest is calculatedby applying the discount rate at the beginning of the period, taking account of anychanges in the net defined benefit liability or asset during the period as a result ofcontributions and benefit payments. Net interest is reported as part of Finance
Costs (Income) – net account in the statement of profit or loss.
Past-service costs are recognized immediately in profit or loss in the period of anyplan amendment.
(b)
Termination Benefits
Termination benefits are payable when employment is terminated by the Companybefore the normal retirement date, or whenever an employee accepts voluntaryredundancy in exchange for these benefits. The Company recognizes terminationbenefits at the earlier of when it can no longer withdraw the offer of such benefitsand when it recognizes costs for a restructuring that is within the scope of
PAS 37, Provision, Contingent Liabilities and Contingent Assets , and involves the paymentof termination benefits. In the case of an offer made to encourage voluntaryredundancy, the termination benefits are measured based on the number ofemployees expected to accept the offer. Benefits falling due more than 12 monthsafter the reporting period are discounted to their present value.
(c) Compensated Absences
Compensated absences are recognized for the number of paid leave days(including holiday entitlement) remaining at the end of the reporting period. Theyare included in the Trade and Other Payables account in the statement of financialposition at the undiscounted amount that the Company expects to pay as a result of
the unused entitlement.
2.15 Borrowing Costs
Borrowing costs are recognized as expense in the period in which they are incurred,except to the extent that they are capitalized. Borrowing costs that are directlyattributable to the acquisition, construction or production of a qualifying asset(i.e., an asset that takes a substantial period of time to get ready for its intended use orsale) are capitalized as part of the cost of such asset. The capitalization of borrowingcosts commences when expenditures for the asset and borrowing costs are beingincurred and activities that are necessary to prepare the asset for its intended use or saleare in progress. Capitalization ceases when substantially all such activities are complete.
F-343
7/21/2019 PreliminaryProspectus - Century
http://slidepdf.com/reader/full/preliminaryprospectus-century 577/648
- 16 -
Investment income earned on the temporary investment of specific borrowings pendingtheir expenditure on qualifying assets is deducted from the borrowing costs eligible forcapitalization.
2.16 Foreign Currency Transactions and Translation
The accounting records of the Company are maintained in Philippine pesos. Foreigncurrency transactions during the period are translated into the functional currency atexchange rates which approximate those prevailing on transaction dates.
Foreign currency gains and losses resulting from the settlement of such transactions andfrom the translation at period-end exchange rates of monetary assets and liabilitiesdenominated in foreign currencies are recognized in the statement of comprehensiveincome as part of profit or loss from operations.
2.17 Income Taxes
Tax expense recognized in profit or loss comprises the sum of deferred tax and current
tax not recognized in other comprehensive income or directly in equity, if any.
Current tax assets or liabilities comprise those claims from, or obligations to, fiscalauthorities relating to the current or prior reporting period, that are uncollected or unpaidat the end of the reporting period. They are calculated using the tax rates and tax lawsapplicable to the fiscal periods to which they relate, based on the taxable profit for theperiod. All changes to current tax assets or liabilities are recognized as a component oftax expense in profit or loss.
Deferred tax is accounted for using the liability method, on temporary differences at theend of the reporting period between the tax base of assets and liabilities and theircarrying amounts for financial reporting purposes. Under the liability method, with
certain exceptions, deferred tax liabilities are recognized for all taxable temporarydifferences and deferred tax assets are recognized for all deductible temporary differencesand the carryforward of unused tax losses and unused tax credits to the extent that it isprobable that taxable profit will be available against which the deductible temporarydifferences can be utilized. Unrecognized deferred tax assets are reassessed at the end ofeach reporting period and are recognized to the extent that it has become probable thatfuture taxable profit will be available to allow such deferred tax assets to be recovered.
The carrying amount of deferred tax assets is reviewed at the end of each reportingperiod and reduced to the extent that it is probable that sufficient taxable profit will beavailable to allow all or part of the deferred tax asset to be utilized.
Deferred tax assets and liabilities are measured at the tax rates that are expected to applyto in the period when the asset is realized or the liability is settled provided such tax rateshave been enacted or substantively enacted at the end of the reporting period.
The measurement of deferred tax liabilities and assets reflects the tax consequences that would follow from the manner in which the Company expects, at the end of thereporting period, to recover or settle the carrying amount of its assets and liabilities.
Most changes in deferred tax assets or liabilities are recognized as a component of taxexpense in profit or loss, except to the extent that it relates to items recognized in othercomprehensive income or directly in equity. In this case, the tax is also recognized inother comprehensive income or directly in equity, respectively.
F-344

7/21/2019 PreliminaryProspectus - Century
http://slidepdf.com/reader/full/preliminaryprospectus-century 578/648
- 17 -
Deferred tax assets and deferred tax liabilities are offset if the Company has a legallyenforceable right to set off current tax assets against current tax liabilities and thedeferred taxes related to the same entity and the same taxation authority.
The Company establishes liabilities for probable and estimable assessments by the Bureauof Internal Revenue (BIR) resulting from any known tax exposures. Estimates represent
a reasonable provision for taxes ultimately expected to be paid and may need to beadjusted over time as more information becomes available.
2.18 Related Party Relationships and Transactions
Related party transactions are transfer of resources, services or obligations between theCompany and its related parties, regardless whether a price is charged.
Parties are considered to be related if one party has the ability to control the other partyor exercise significant influence over the other party in making financial and operatingdecisions. These parties include: (a) individuals owning, directly or indirectly through oneor more intermediaries, control or are controlled by, or under common control with the
Company; (b) associates; (c) individuals owning, directly or indirectly, an interest in the voting power of the Company that gives them significant influence over the Companyand close members of the family of any such individual; and, (d) the Company’sretirement plan.
In considering each possible related party relationship, attention is directed to thesubstance of the relationship and not merely on the legal form.
2.19 Equity
Capital stock represents the nominal value of shares that have been issued.
Deposits for future stock subscriptions represent deposits from the parent company aspayment for future subscriptions.
Other reserve represents actuarial gains and losses arising from the remeasurements ofthe Company’s net post-employment defined benefit obligation (asset) [see Note 2(a)(ii)].
Retained earnings represent all current and prior period results of operations as reportedin the profit or loss section of the statement of comprehensive income reduced by theamounts of dividend declared.
2.20
Events After the End of the Reporting Period
Any post-period-end event that provides additional information about the Company’sfinancial position at the end of the reporting period (adjusting event) is reflected in thefinancial statements. Post-period-end events that are not adjusting events, if any, aredisclosed when material to the financial statements.
F-345

7/21/2019 PreliminaryProspectus - Century
http://slidepdf.com/reader/full/preliminaryprospectus-century 579/648
- 18 -
3. SIGNIFICANT ACCOUNTING JUDGMENTS AND ESTIMATES
The Company’s financial statements prepared in accordance with PFRS requiremanagement to make judgments and estimates that affect amounts reported in thefinancial statements and related notes. Judgments and estimates are continually evaluatedand are based on historical experience and other factors, including expectations of future
events that are believed to be reasonable under the circumstances. Actual results mayultimately differ from these estimates.
3.1 Critical Management Judgments in Applying Accounting Policies
In the process of applying the Company’s accounting policies, management has made thefollowing judgments, apart from those involving estimation, which have the mostsignificant effect on the amounts recognized in the financial statements:
(a)
Determining the Useful Lives of Trademark
Under the Intellectual Property Code of the Philippines, the legal life of trademark is
10 years and may be perpetually renewed thereafter for another 10 years. However,considering that the management does not expect any circumstances or events which will cause it to decide not to renew its trademarks every 10 years, managementhas taken the position that the useful lives of its trademarks are indefinite; hence therelated costs are not amortized but subjected to annual impairment testing(see Notes 2.7 and 2.13). Changes in assumption and circumstances in the future
will substantially affect the financial statements of the Company, particularly thecarrying value of such asset.
No impairment loss on trademark was recognized in both periods based onmanagement evaluation. The carrying value of the Company’s trademark as atDecember 31, 2013 and 2012 is presented in Note 10.
(b)
Distinction between Operating and Finance Leases
The Company has entered into various lease agreements as a lessee. Judgment wasexercised by management to distinguish each lease agreement as either an operatingor finance lease by looking at the transfer or retention of significant risk and rewardsof ownership of the properties covered by the agreements. Failure to make the rightjudgment will result in either overstatement or understatement of assets andliabilities. Based on management’s judgment such leases were determined to beoperating leases.
(c) Recognition of Provisions and Contingencies
Judgment is exercised by management to distinguish between provisions andcontingencies. Accounting policies on recognition of provisions and contingenciesare discussed in Notes 2.10 and disclosure on relevant provision and contingenciesare presented in Note 19.
F-346

7/21/2019 PreliminaryProspectus - Century
http://slidepdf.com/reader/full/preliminaryprospectus-century 580/648
- 19 -
3.2
Key Sources of Estimation Uncertainty
The following are the key assumptions concerning the future, and other key sources ofestimation uncertainty at the end of the reporting period, that have a significant risk ofcausing a material adjustment to the carrying amounts of assets and liabilities within thenext financial period:
(a) Impairment of Trade and Other Receivables
Adequate amount of allowance is made for specific and groups of accounts, whereobjective evidence of impairment exists. The Company evaluates these accountsbased on available facts and circumstances, including, but not limited to, the lengthof the Company’s relationship with the customers, the customers’ current creditstatus based on known market forces, average age of accounts, collection experienceand historical loss experience.
Based on the analysis done by management, certain receivables were identified to beimpaired and have been provided with adequate allowance for impairment. The
carrying value of trade and other receivables and the analysis of allowance forimpairment on such financial assets are shown in Note 6.
(b) Determining Net Realizable Value of Inventories
In determining the net selling prices of inventories, management takes into accountthe most reliable evidence available at the times the estimates are made. It also takesinto consideration the obsolescence of the inventory in determining net realizable
value. The future realization of the carrying amounts of inventories as disclosed inNote 7 is affected by price changes in different market segments. These aspects areconsidered key sources of estimation uncertainty and may cause significantadjustments to the Company’s inventories within the next financial period.
Impairment loss on inventory amounting to P4.5 million relating to expiredinventories that were written down to net realizable value is recognized in 2013(see Note 7). No similar writedown on inventories was made in 2012.
(c) Estimating Useful Lives of Property, Plant and Equipment
The Company estimates the useful lives of property, plant and equipment based onthe period over which the assets are expected to be available for use. The estimateduseful lives of property, plant and equipment are reviewed periodically and areupdated if expectations differ from previous estimates due to physical wear and tear,technical or commercial obsolescence and legal or other limits on the use of the
assets.
The carrying amounts of property, plant and equipment are analyzed in Note 9.Based on management’s assessment as at December 31, 2013 and 2012, there is nochange in estimated useful lives of property, plant and equipment during thoseperiods. Actual results, however, may vary due to changes in estimates broughtabout by changes in factors mentioned above.
F-347

7/21/2019 PreliminaryProspectus - Century
http://slidepdf.com/reader/full/preliminaryprospectus-century 581/648
- 20 -
(d)
Determining Realizable Amount of Deferred Tax Assets
The Company reviews its deferred tax assets at the end of each reporting period andreduces the carrying amount to the extent that it is no longer probable that sufficienttaxable profit will be available to allow all or part of the deferred tax asset to beutilized. Management assessed that the deferred tax assets recognized as of
December 31, 2013 will be fully utilized in the coming years.
The details of deferred tax assets as of December 31, 2013 are disclosed in Note 16.
(e) Impairment of Non-financial Assets
Except for trademarks with indefinite useful lives which are reviewed forimpairment annually or regularly, PFRS requires that an impairment review beperformed when certain impairment indicators are present. The Company’s policyon estimating the impairment of non-financial assets is discussed in detail inNote 2.13. Though management believes that the assumptions used in theestimation of fair values reflected in the financial statements are appropriate and
reasonable, significant changes in these assumptions may materially affect theassessment of recoverable values and any resulting impairment loss could have amaterial adverse effect on the results of operations.
No impairment loss on non-financial assets was recognized in 2013 and 2012.
(f)
Valuation of Post-employment Defined Benefit
The determination of the Company’s obligation and cost of post-employmentdefined benefit are dependent on the selection of certain assumptions used byactuaries in calculating such amounts. Those assumptions include, among others,discount rates and salary increase rates. In accordance with PFRS, actual results that
differ from the assumptions are accumulated and amortized over future periods and,therefore, generally affect the recognized expense and recorded obligation in suchfuture periods.
The amount of post-employment benefit obligation (asset), related expense and ananalysis of the movements in the estimated present value of post-employmentbenefit obligation and fair value of plan asset are presented in Note 15.2.
4. RISK MANAGEMENT OBJECTIVES AND POLICIES
The Company is exposed to certain financial risks in relation to financial instruments. The Company’s financial assets and liabilities by category are summarized in Note 20. The main types of risks are market risk, credit risk and liquidity risk.
The Company’s risk management is coordinated with its Board of Directors (BOD), andfocuses on actively securing the Company’s short to medium-term cash flows byminimizing the exposure to financial markets.
F-348

7/21/2019 PreliminaryProspectus - Century
http://slidepdf.com/reader/full/preliminaryprospectus-century 582/648
- 21 -
The Company does not engage in the trading of financial assets for speculative purposesnor does it write options. The most significant financial risks to which the Company isexposed to are described below.
4.1 Credit Risk
Credit risk is the risk that a counterparty may fail to discharge an obligation to theCompany. The Company is exposed to this risk for various financial instruments arisingfrom selling goods to customers, including related parties, providing security deposits tolessors, and placing deposits with banks.
The Company continuously monitors defaults of customers and other counterparties,identified either individually or by group, and incorporate this information into its creditrisk controls. The Company’s policy is to deal only with creditworthy counterparties.
Generally, the maximum credit risk exposure of financial assets is the carrying amount ofthe financial assets as shown on the statements of financial position (or in detailedanalysis provided in the notes to the financial statements), as summarized below.
Notes 2013 2012
Cash and cash equivalents 5 42,985,172P 36,424,315P
Trade and
other receivables – net 6 258,579,504 246,999,008
Security deposits 10 1,780,295 1,780,295
303,344,971P 285,203,618P
None of the Company’s financial assets are secured by collateral or other creditenhancements, except for cash and cash equivalents as described below.
(a) Cash and Cash Equivalents
The credit risk for cash and cash equivalents is considered negligible, since thecounterparties are reputable banks with high quality external credit ratings. Included inthe cash and cash equivalents are cash in banks and short-term placements. As part ofCompany policy, bank deposits are only maintained with reputable financial institutions.
Cash in banks which are insured by the Philippine Deposit Insurance Corporation(PDIC) up to a maximum coverage of P500,000 per depositor per banking institution, asprovided for under Republic Act (R.A.) No. 9576, Charter of PDIC , are still subject tocredit risk.
(b)
Trade and Other Receivables
In respect of trade and other receivables, the Company is not exposed to any significantcredit risk exposure to any single counterparty or any group of counterparties havingsimilar characteristics. Trade receivables consist of a large number of customers in
various industries and geographical areas. Based on historical information aboutcustomer default rates, management consider the credit quality of trade receivables thatare not past due or impaired to be good.
F-349

7/21/2019 PreliminaryProspectus - Century
http://slidepdf.com/reader/full/preliminaryprospectus-century 583/648
- 22 -
Some of the financial assets, which are all trade receivables, are past due but unimpairedas at the end of the reporting periods. Trade receivables that are past due but notimpaired are as follows:
2013 2012
Not more than three months 78,650,977P 48,647,741PMore than three months but not more
than six months 6,546,544 24,223,084
85,197,521P 72,870,825P
The fair value of these short-term financial assets is not individually determined as thecarrying amount is a reasonable approximation of fair value.
4.2 Liquidity Risk
The Company manages its liquidity needs by carefully monitoring scheduled debtservicing payments for long-term financial liabilities as well as cash outflows due inday-to-day business. Liquidity needs are monitored in various time bands, on aday-to-day and week-to-week basis, as well as on the basis of a rolling 30-day projection.Long-term liquidity needs for a 6-month and one-year period are identified monthly.
The Company maintains cash to meet its liquidity requirements for up to 60-day periods.Funding for long-term liquidity needs is additionally secured by an adequate amount ofcommitted credit facilities and the ability to sell long-term financial assets.
As at December 31, 2013 and 2012, the Company’s financial liabilities have contractualmaturities within six months or less.
4.3 Foreign Currency Risk
Most of the Company’s transactions are carried out in Philippine pesos, its functionalcurrency. Exposures to currency exchange rates arise from the Company’s overseaspurchases, which are denominated in United States (U.S.) dollars. The Company alsoholds U.S. dollar-denominated cash in banks.
To mitigate the Company’s exposure to foreign currency risk, non-Philippine peso cashflows are monitored and settled within a short period, in the case of liabilities.
Accordingly, the Company does not have significant exposure to foreign currencyexchange rates.
F-350

7/21/2019 PreliminaryProspectus - Century
http://slidepdf.com/reader/full/preliminaryprospectus-century 584/648
- 23 -
5. CASH AND CASH EQUIVALENTS
The breakdown of this account are as follows:
2013 2012
Cash in banks 42,985,172P 35,381,811PCash on hand 6,171,646 508,800Short-term placements - 1,042,504
49,156,818P 36,933,115P
Cash in banks generally earn interest at rates based on daily bank deposit rates.Short-term placements are made for varying periods between 30 to 90 days and earneffective interest ranging from 1.63% to 2.25% for both periods. Interest income earnedamounting to P91,267 in 2013 and P165,794 in 2012 is presented as part of FinanceCosts (Income) – net in the statements of comprehensive income (see Note 14).
6.
TRADE AND OTHER RECEIVABLES
This account is composed of the following:
Notes 2013 2012
Trade receivables 18.1 257,171,099P 252,608,378P Advances to suppliers 17,509,562 29,059,344Others 7 11,072,931 5,626,142
285,753,592 287,293,864
Allowance for impairment 6,853,755 )( 6,853,755 )(
278,899,837P 280,440,109P
Trade receivables are usually due within 30 to 90 days and do not bear any interest.
The Company’s trade and other receivables, which are subject to credit risk exposure(see Note 4.1), have been reviewed for indicators of impairment. Certain tradereceivables were identified to be impaired; hence, adequate amount of allowance forimpairment has been recognized [see Note 3.2(a)].
A reconciliation of the allowance for impairment at the beginning and end of the years
ended December 31, 2013 and 2012 is shown below.
Note 2013 2012
Balance at beginning of year 6,853,755P 6,340,995P
Impairment lossduring the year 13 - 512,760
Balance at end of year 6,853,755P 6,853,755P
F-351

7/21/2019 PreliminaryProspectus - Century
http://slidepdf.com/reader/full/preliminaryprospectus-century 585/648
- 24 -
7. INVENTORIES
Inventories at the end of December 31 2013 and 2012 are broken down as follows:
Note 2013 2012
At Cost:Finished goods 172,179,775P 314,973,334PRaw and packaging materials 127,469,371 109,877,664Other supplies 5,011,905 6,073,706
304,661,051 430,924,704
At Net Realizable Value (NRV):Finished goods 4,143,035 -Raw and packaging materials 319,283 -
4,462,318 - Allowance to writedown
inventory to NRV 13 4,462,318 )( -- -
304,661,051P 430,924,704P
The cost of inventories charged to operations for the years ended December 31, 2013and 2012 are analysed in Note 13.
In 2013, the Company’s management determined that certain raw materials and finishedgoods may no longer be used in production nor the carrying amounts can be recoveredthrough sale. Accordingly, the Company recognized impairment loss on inventoryamounting to P4.5 million which is presented as Loss on inventory obsolescence under
Administrative Expenses in the 2013 statement of comprehensive income[see Notes 3.2(b) and 13]. There was no loss on inventory obsolescence recognized in2012.
The Company has a warehouse located in Tacloban City, Leyte. In November 2013, the warehouse facility was destroyed by a typhoon that resulted in estimated inventory lossesof P2.8 million, which is equivalent to the claims filed with the insurance company. Thesaid claim is still outstanding as at December 31, 2013 and is presented as part of Othersunder the Trade and Other Receivables in the 2013 statement of financial position(see Note 6). There was no similar transaction in 2012.
F-352

7/21/2019 PreliminaryProspectus - Century
http://slidepdf.com/reader/full/preliminaryprospectus-century 586/648
- 25 -
8. PREPAYMENTS AND OTHER CURRENT ASSETS
The composition of this account is shown below.
Note 2013 2012
Input VAT 23.1(b) 29,418,474P 40,180,862PPrepaid taxes 16,917,569 24,007,139Others 273,605 1,064,135
46,609,648P 65,252,136P
The Company’s prepaid taxes represent taxes withheld by the Company’s customersamounting to P16,100,323 and P23,189,893 as at December 31, 2013 and 2012,respectively, and tax credit certificates issued by the Bureau of Customs (BOC)amounting to both P817,246 as at December 31, 2013 and 2012.
9.
PROPERTY, PLANT AND EQUIPMENT
The gross carrying amounts and accumulated depreciation and amortization of property,plant and equipment at the beginning and end of the years ended December 31, 2013 and2012, are shown below.
Plant, Laboratory
Machinery and Tools and Leasehold Construction-Equipment Equipment Improvements in-Progress Total
December 31, 2013
Cost 108,453,610P 8,195,012P 15,753,041P 145,137,943P 277,539,606P Accumulated
depreciation and
amortization 94,422,848 )( 4,818,838 )( 13,952,121 )( - 113,193,807 )(
Net carrying amount 14,030,762P 3,376,174P 1,800,920P 145,137,943P 164,345,799P
December 31, 2012Cost 106,608,328P 5,020,726P 14,105,279P - 125,734,333P
Accumulated
depreciation andamortization 86,677,856 )( 4,323,334 )( 12,677,596 )( - 103,678,786 )(
Net carrying amount 19,930,472P 697,392P 1,427,683P - 22,055,547P
January 1, 2012
Cost 104,956,773P 4,615,406P 13,891,615P - 123,463,794P
Accumulateddepreciation and
amortization 77,093,388 )( 3,977,007 )( 10,689,222 )( - 91,759,617 )(
Net carrying amount 27,863,385P 638,399P 3,202,393P - 31,704,177P
P
P
P
P
F-353

7/21/2019 PreliminaryProspectus - Century
http://slidepdf.com/reader/full/preliminaryprospectus-century 587/648
- 26 -
A reconciliation of the carrying amounts of property, plant and equipment at thebeginning and end of the years ended December 31, 2013 and 2012, is presented below.
Plant, Laboratory
Machinery and Tools and Leasehold Construction-Equipment Equipment Improvements in-Progress Total
Balance at January 1, 2013,net of accumulateddepreciation and
amortization 19,930,472P 697,392P 1,427,684P - 22,055,548P Additions 1,845,282 3,174,286 1,647,761 145,137,943 151,805,272
Depreciation andamortization charges
for the year 7,744,992 )( 495,504 )( 1,274,525 )( - 9,515,021 )(
Balance atDecember 31, 2013, netof accumulateddepreciation and
amortization 14,030,762P 3,376,174P 1,800,920P 145,137,943P 164,345,799P
Balance at
January 1, 2012,net of accumulateddepreciation andamortization 27,863,385P 638,399P 3,202,393P - 31,704,177P
Additions 1,651,555 405,320 213,664 - 2,270,539Depreciation andamortization chargesfor the year 9,584,468 )( 346,327 )( 1,988,374 )( - 11,919,169 )(
Balance at
December 31, 2012, netof accumulated
depreciation and
amortization 19,930,472P 697,392P 1,427,683P - 22,055,547P
P
P
P
Construction-in-progress pertains to the accumulated costs incurred on the ongoingconstruction, which started in 2013, of the Company’s new production plant andadministration building as part of the Company’s expansion activities(see Notes 1 and 19.2). As at December 31, 2013, the construction is not yet complete.
The cost of fully depreciated property, plant and equipment as at December 31, 2013 and2012 which are still being used in operations amounts to P82,828,129 and P46,505,687,respectively.
The Company did not capitalize any borrowing cost related to their general borrowings in2013, since management determined that the effect is not material to the financial
statements.
F-354

7/21/2019 PreliminaryProspectus - Century
http://slidepdf.com/reader/full/preliminaryprospectus-century 588/648
- 27 -
The depreciation and amortization for the years ended December 31 is allocated asfollows (see Note 13):
2013 2012
Cost of goods sold 9,317,311P 11,345,333P
Administrative expenses 197,710 573,836
9,515,021P 11,919,169P
10. OTHER NON-CURRENT ASSETS
This account consists of:
Note 2013 2012
Trademarks 40,000,000P 40,000,000P
Security deposits 4.1 1,780,295 1,780,295Returnable containers 233,000 1,104,000
42,013,295P 42,884,295P
In July 2008, the Company purchased from General Milling Corporation (GMC) certaintrademarks owned and registered with the Intellectual Property Office under the name ofGMC. As discussed in Note 3.1(a), the Company’s trademarks are subject to annualimpairment testing. No impairment losses were recognized for the years endedDecember 31, 2013 and 2012 as the recoverable amounts of the trademarks weredetermined to be higher than their carrying values.
Security deposits pertain to deposits required under the terms of the lease agreements ofthe Company with certain lessors. The carrying amount of these deposits is a reasonableapproximation of its fair value based on management’s assessment as atDecember 31, 2013 and 2012.
F-355

7/21/2019 PreliminaryProspectus - Century
http://slidepdf.com/reader/full/preliminaryprospectus-century 589/648
- 28 -
11. TRADE AND OTHER PAYABLES
The composition of this account is shown below.
Note 2013 2012
Trade payables 18.4 134,974,596P 328,397,554P Accrued expenses 18.3 19,389,701 2,591,982Others 5,370,799 3,293,310
159,735,096P 334,282,846P
Accrued expenses include obligations relating to trucking and shipment fee, consultancyand management fee and salaries and employee benefits. Other payables consist of
various payables to government agencies which includes taxes and employer’s shares incertain mandatory employee benefits.
Due to the short duration of trade and other payables, management considers the carryingamounts to be a reasonable approximation of fair values.
12. INTEREST-BEARING LOANS
On October 30, 2013, the Company obtained two unsecured interest-bearing loans froma local bank for its working capital and capital expenditure requirements (see Note 19.2)totalling to P540.0 million. These loans both bear fixed interest rate of 2.5% per annumand are to be repaid on November 30, 2013. In November and December 2013, theCompany repaid a portion of these loans amounting to P325.0 million. The outstandingbalance of these unsecured interest-bearing loans as at December 31, 2013 is presented asInterest-Bearing Loans in the 2013 statement of financial position.
Interest expense arising from these loans which amounted to P1.6 million is presented aspart of Finance costs under Finance Costs (Income) – Net in the 2013 statement ofcomprehensive income (see Note 14). There is no outstanding interest payable as ofDecember 31, 2013.
F-356

7/21/2019 PreliminaryProspectus - Century
http://slidepdf.com/reader/full/preliminaryprospectus-century 590/648
- 29 -
13. COSTS AND EXPENSES BY NATURE
The details of costs and expenses by nature are shown below.
2012Notes 2013 (As Restated)
Milk and ingredients 734,122,138P 821,975,535P
Packaging and other materials 261,172,270 380,053,910
Changes in inventories of
finished goods 138,650,524 101,850,269
Advertisements 111,507,292 116,893,508
Outside services 18.3 46,447,826 49,546,397
Freight 46,253,380 44,342,447
Forwarding and other
arehousing fees 44,724,843 55,231,107
Merchandisers’ salary 34,951,327 32,607,195
Communication,light and water 16,325,822 20,972,321Salaries and employee benefits 15.1, 18.5 14,398,014 13,977,192
Rentals 18.4 9,606,064 11,031,433
Depreciation and amortization 9 9,515,021 11,919,169
Gas, fuel and oil 8,787,684 12,837,058
Taxes and licenses 23.1(f) 7,311,020 6,897,574Supplies 4,522,876 6,213,439Loss on inventory
obsolescence 7 4,462,318 -
Repairs and maintenance 1,156,243 1,962,046
Impairment loss
on trade receivables 6 - 512,760Miscellaneous 3,857,370 5,086,402
1,497,772,032P 1,693,909,762P
These expenses are classified in the statements of comprehensive income as follows:
20122013 (As Restated)
Cost of goods sold 1,222,454,203P 1,419,620,458P
Selling expenses 128,583,164 131,551,269Marketing expenses 111,648,759 119,270,662
Administrative expenses 35,085,906 23,467,373
1,497,772,032P 1,693,909,762P
F-357

7/21/2019 PreliminaryProspectus - Century
http://slidepdf.com/reader/full/preliminaryprospectus-century 591/648
- 30 -
Cost of goods sold for the years ended December 31, 2013 and 2012 consist of thefollowing:
2012Notes 2013 (As Restated)
Raw and packagingmaterials used:
Raw and packaging
materials atbeginning of year 109,877,664P 135,545,967P
Net purchases
during the year 1,013,207,042 1,176,361,142Raw and packaging
materials atend of year 7 127,788,654 )( 109,877,664 )(
995,296,052 1,202,029,445
Direct labor 922,621 1,000,537
Manufacturing overhead:
Outside services 27,416,959 39,432,092
Communication,
light and water 16,243,975 20,877,595
Rentals 18.4 9,592,647 11,024,845
Depreciation and
amortization 9 9,317,311 11,345,333Indirect labor 15.1 8,906,519 8,258,283
Gas, fuel and oil 8,787,684 12,834,545
Supplies 4,492,636 6,171,109Repairs and maintenance 1,152,517 1,953,615Others 1,674,758 2,841,143
87,585,006 114,738,560
Total cost of goods manufactured 1,083,803,679 1,317,768,542
Finished goods at
beginning of year 314,973,334 416,825,250Finished goods at
end of year 7 176,322,810 )( 314,973,334 )(
1,222,454,203P 1,419,620,458P
F-358

7/21/2019 PreliminaryProspectus - Century
http://slidepdf.com/reader/full/preliminaryprospectus-century 592/648
- 31 -
14. FINANCE COSTS (INCOME)
The details of Finance Costs (Income) – net are presented below.
2012Notes 2013 (As Restated)
Finance costs 12, 15.2 1,646,343P 149,281P
Finance income 5 114,489 )( 187,370 )(
1,531,854P 38,089 )( P
15. EMPLOYEE BENEFITS
15.1 Employee Benefits Expense
Expenses recognized for salaries and employee benefits are presented below.
2012Notes 2013 (As Restated)
Short-term benefits 14,103,227P 13,557,311PPost-employment benefits 15.2 294,787 419,881
13 14,398,014P 13,977,192P
The amount of employee benefits expense is allocated as follows:
2012Note 2013 (As Restated)
Cost of goods sold 13 9,829,140P 9,258,820P Administrative expenses 4,568,874 4,718,372
13 14,398,014P 13,977,192P
15.2 Post-employment Defined Benefit
(a)
Characteristics of the Defined Benefit Plan
The Company maintains a fully funded, tax-qualified, non-contributorypost-employment benefit plan that is being administered by a trustee bank coveringall regular full-time employees.
The normal retirement age is 60 with a minimum of 5 years of credited service. Theplan also provides for an early retirement at age 50 with a minimum of 10 years ofcredited service and late retirement after age 65, both subject to the approval of theCompany’s BOD. Normal retirement benefit is an amount equivalent to 100% ofthe final monthly covered compensation (average monthly basic salary during thelast 12 months of credited service) for every year of credited service.
F-359

7/21/2019 PreliminaryProspectus - Century
http://slidepdf.com/reader/full/preliminaryprospectus-century 593/648
- 32 -
(b)
Explanation of Amounts Presented in the Financial Statements
Actuarial valuations are made every other year to update the retirement benefit costsand the amount of contributions. All amounts presented below are based on theactuarial valuation report obtained from an independent actuary in 2013 includingthe comparative year which has been restated in line with the adoption of PAS 19
(Revised), see Note 2.2(a)(ii).
The amounts of post-employment benefit obligation (asset) recognized in thestatements of financial position are determined as follows:
20122013 (As Restated)
Present value of the obligation 2,560,525P 3,379,996PFair value of plan assets 3,212,678 )( 2,850,863 )(
Under (over) funded 652,153 )( 529,133Effect of asset ceiling 29,854 -
622,299 )( P 529,133P
The movements in the present value of the post-employment benefit obligationrecognized in the books are as follows:
20122013 (As Restated)
Balance at beginning of year 3,379,996P 2,802,558P
Current service cost 294,787 419,881
Interest expense 158,296 157,557Remeasurements − Actuarial losses(gains) arising from:− changes in financial assumption 427,968 -− experience adjustments 1,700,522 )( -
Balance at end of year 2,560,525P 3,379,996P
The movements in the fair value of plan assets are presented below[see also Note 15.2(b)].
2012
2013 (As Restated)
Balance at beginning of year 2,850,863P 2,149,434PContributions 512,064 512,064Interest income 142,509 132,301Return on plan assets (excluding -
amounts included in net interest) 292,758 )( 57,064
Balance at end of year 3,212,678P 2,850,863P
F-360

7/21/2019 PreliminaryProspectus - Century
http://slidepdf.com/reader/full/preliminaryprospectus-century 594/648
- 33 -
The composition of the fair value of plan assets as at December 31, 2013 and 2012for each category and risk characteristics is shown below.
2013 2012
Cash and cash equivalents 311,630P 301,906P
Debt instruments - government bonds 1,955,878 1,728,193Debt instruments - other bonds 452,024 560,195Others 493,146 260,569
3,212,678P 2,850,863P
Except for cash and cash equivalents which have insignificant risk of changes in value, the fair values of the above financial assets are determined based on quotedmarket prices in active markets.
The plan assets do not comprise any of the Company’s own financial instruments orany of its assets occupied and/or used in its operations. It incurred a negative returnof P0.2 million in 2013 and positive return of P0.2 million in 2012.
The components of amounts recognized in profit or loss and in othercomprehensive income in respect of the defined benefit plan are as follows:
20122013 (As Restated)
Recognized in profit or loss:
Current service cost 294,787P 419,881P
Net interest expense 15,787 25,256
310,574P 445,137P
Recognized in other comprehensive income:
Actuarial losses (gains) arising from:
−experience adjustments 1,700,522 )( P -
−changes in financial assumptions 427,968 -
Return of plan assets
(excluding amount included in
net interest expense) 292,758 57,064 )(Effect of asset ceiling 29,854 -
949,942 )( P 57,064 )( P
P
F-361

7/21/2019 PreliminaryProspectus - Century
http://slidepdf.com/reader/full/preliminaryprospectus-century 595/648
- 34 -
Current service cost is allocated and presented in the statements of comprehensiveincome under the following accounts:
2013 2012
Cost of goods sold 261,689P 363,309P
Administrative expenses 33,098 56,572
294,787P 419,881P
Net interest expense is included in Finance Costs (Income) – net account in thestatements of comprehensive income (see Note 14).
The amount recognized in other comprehensive income was classified as item that will not be reclassified subsequently to profit or loss.
In determining the amounts of the post-employment benefit obligation, thefollowing significant actuarial assumptions were used:
2013 2012
Discount rates 4.63% 5.62%Expected rate of salary increases 3.00% 2.00%
Assumptions regarding future mortality experience are based on published statisticsand mortality tables. The average remaining working lives of an individual retiring atthe age of 60 is 22 for males and 30 for females. These assumptions were developedby management with the assistance of an independent actuary. Discount factors aredetermined close to the end of each reporting period by reference to the interest
rates of a zero coupon bond government bonds with terms to maturityapproximating to the terms of the retirement obligation. Other assumptions arebased on current actuarial benchmarks and management’s historical experience.
(c) Risks Associated with the Retirement Plan
The plan exposes the Company to actuarial risks such as investment risk, interestrate risk, longevity risk and salary risk.
(i) Investment and Interest Risk
The present value of the defined benefit obligation is calculated using a discount ratedetermined by reference to market yields of government bonds. Generally, adecrease in the interest rate of a reference government bond will increase the planobligation. However, this will be partially offset by an increase in the return on theplan’s investments in debt securities and if the return on plan asset falls below thisrate, it will create a deficit in the plan. Currently, the plan has significant investmentin debt instruments.
F-362

7/21/2019 PreliminaryProspectus - Century
http://slidepdf.com/reader/full/preliminaryprospectus-century 596/648
- 35 -
(ii)
Longevity and Salary Risks
The present value of the defined benefit obligation is calculated by reference to thebest estimate of the mortality of the plan participants both during and after theiremployment and to their future salaries. Consequently, increases in the lifeexpectancy and salary of the plan participants will result in an increase in the plan
obligation.
(d)
Other Information
The information on the sensitivity analysis for certain significant actuarialassumptions, the Company’s asset-liability matching strategy, and the timing anduncertainty of future cash flows related to the retirement plan are described asfollows:
(i) Sensitivity Analysis
The following table summarizes the effects of changes in the significant actuarial
assumptions used in the determination of the defined benefit obligation as ofDecember 31, 2013:
Change in Increase in Decrease inassumption assumption assumption
Salary increase rate +9.3% to - 8.5% 238,550P 217,830 )( PDiscount rate +10.3% to - 9.1% 234,207 )( 263,271
Impact on post-employment define benefit obligation
The sensitivity analysis in the foregoing table is based on a change in an assumption while holding all other assumptions constant. This analysis may not berepresentative of the actual change in the defined benefit obligation as it is unlikely
that the change in assumptions would occur in isolation of one another as some ofthe assumptions may be correlated. Furthermore, in presenting the previous pagesensitivity analysis, the present value of the defined benefit obligation has beencalculated using the projected unit credit method at the end of the reporting period,
which is the same as that applied in calculating the defined benefit obligation liabilityrecognized in the statements of financial position.
The methods and types of assumptions used in preparing the sensitivity analysis didnot change compared to the previous years.
(ii) Asset-liability Matching Strategies
To efficiently manage the retirement plan, the Company ensures that the investmentpositions are managed in accordance with its asset-liability matching strategy toachieve that long-term investments are in line with the obligations under theretirement scheme. This strategy aims to match the plan assets to the retirementobligations by investing in long-term fixed interest securities (i.e., government orcorporate bonds) with maturities that match the benefit payments as they fall dueand in the appropriate currency. The Company actively monitors how the durationand the expected yield of the investments are matching the expected cash outflowsarising from the retirement benefit obligations.
F-363

7/21/2019 PreliminaryProspectus - Century
http://slidepdf.com/reader/full/preliminaryprospectus-century 597/648
- 36 -
In view of this, investments are made in reasonably diversified portfolio congruentto the level of credit risks identified on such investments, such that the failure of anysingle investment will be minimized and would not have a material impact on theoverall level of assets.
A large portion of the plan assets as of December 31, 2013 and 2012 consists of debt
securities, although the Company also invests in cash and cash equivalents and otherforms of investments. The Company believes that the debt securities which mainlyrepresent government bond investments offer the best returns over the long term
with an acceptable level of risk.
There has been no change in the Company’s strategies to manage its risks fromprevious periods.
(iii)
Funding Arrangements and Expected Contributions
The plan is currently overfunded by P0.6 million based on the latest actuarial valuation. While there are no minimum funding requirement in the country,
expected retirement of significant number of employees may pose a cash flow risk inabout 12 years’ time.
The maturity profile of undiscounted expected benefits payments from the plan isbetween 6 to 10 years amounting to P1.1 million.
The weighted average duration of the defined benefit obligation at the end of thereporting period is 12 years.
16. CURRENT AND DEFERRED TAXES
The components of tax expense as reported in profit or loss and other comprehensiveincome are as follows:
2013 2012
Recognized in profit or loss:
Regular corporate income tax(RCIT) at 30% 18,690,242P 7,341,848P
Final tax at 20% and 7.5% 18,253 33,159
18,708,495 7,375,007Deferred tax income relating
to origination and reversal of
temporary difference 3,410,408 )( -
15,298,087P 7,375,007P
F-364

7/21/2019 PreliminaryProspectus - Century
http://slidepdf.com/reader/full/preliminaryprospectus-century 598/648
- 37 -
2013 2012
Recognized in other comprehensive income:
Recognition of previouslyunrecognized DTA 287,040 )( P -
Deferred tax expense for the year 284,983 -
2,057 )( P -
P
P
A reconciliation of tax on pretax profit computed at the applicable statutory rates to taxexpense reported in the statements of comprehensive income is presented below.
2013 2012
Tax on pretax profit at 30% 17,120,903P 7,988,255P
Adjustment for income subjected to
lower income tax rates 9,127 )( 16,579 )(
Tax effects of:Recognition of previously
unrecognized DTA 2,188,081 )( -
Non-deductible expenses 374,392 16,414Unrecognized deductible
temporary difference - 127,757 Application of previously
unrecognized DTA on minimumcorporate income tax (MCIT) - 740,840 )(
Tax Expense 15,298,087P 7,375,007P
The Company did not recognize deferred tax assets (as restated) related to the followingtemporary differences as at December 31, 2012, since their recoverability and utilizationis not yet certain during that period based on the management’s assessment.
Deferred tax assets: Allowance for impairment loss
on trade and other receivables 2,056,127PUnamortized past service cost 267,537Retirement benefit obligation 158,739
2,482,403Deferred tax liabilities −
Unrealized foreign currency gain 7,282 )(
Unrecognized Net Deferred Tax Assets 2,475,121P
F-365

7/21/2019 PreliminaryProspectus - Century
http://slidepdf.com/reader/full/preliminaryprospectus-century 599/648
- 38 -
However, based on the recent historical profitability analysis made in 2013 and positiveexpectations on future results of the Company’s operations, the Company recognized thedeferred tax assets related to the following temporary differences as at December 31,2013:
Statement of OtherFinancial ComprehensivePosition Profit or Loss Income
Deferred tax assets: Allowance for impairment loss
on trade and other receivables 2,056,127P 2,056,127P - Allowance to write-down
inventory to NRV 1,338,695 1,338,695 -Unamortized past service cost 287,596 287,596 -
3,682,418 3,682,418 -
Deferred tax liabilities:
Post-employment benefit asset 186,690 )( 188,747 )( 2,057Prepayments 82,082 )( 82,082 )( -Unrealized foreign currency gain 1,181 )( 1,181 )( -
269,953 )( 272,010 )( 2,057
Net Deferred Tax Assets 3,412,465P
Net Deferred Tax Income 3,410,408P 2,057P
Comprehensive IncomeStatement of Other
P
The Company is subject to MCIT which is computed at 2% of gross income, as definedunder tax regulations, or RCIT, whichever is higher. In 2013 and 2012, RCIT was higherthan MCIT.
As at December 31, 2012, the Company has fully utilized its MCIT amounting to
P740,840 which represents the total of MCIT incurred in 2011 (P133,950) and 2010(P606,890).
For the years ended December 31, 2013 and 2012, the Company opted to claim itemizeddeductions in computing its income tax due.
F-366

7/21/2019 PreliminaryProspectus - Century
http://slidepdf.com/reader/full/preliminaryprospectus-century 600/648
- 39 -
17. EQUITY
17.1 Capital Stock
Capital stock consists of common shares with details as follows:
Note 2013 2012 2013 2012
Authorized – P10 par value:Balance at beginning
of year 5,000,000 5,000,000 50,000,000P 50,000,000PIncrease during the year 17.2 45,000,000 - 450,000,000 -
Balance at end of year 50,000,000 5,000,000 500,000,000P 50,000,000P
Issued and outstanding:Balance at beginning
of year 4,062,500 4,062,500 40,625,000P 40,625,000PIssuances during
the year:Cash subscription 17.2 25,411,680 - 254,116,800 - Application of deposit
for future stocksubscription 17.2 19,588,320 - 195,883,200 -
Collection of subscriptionreceivable 937,500 - 9,375,000 -
Balance at end of year 50,000,000 4,062,500 500,000,000 40,625,000
Subscribed:Balance at beginning
of year 937,500 937,500 9,375,000 9,375,000 Additional subscription
during the year 45,000,000 - 450,000,000 -Issued during the year 45,937,500 )( - 459,375,000 )( -
Balance at end of year - 937,500 - 9,375,000
Subscription receivable:Balance at beginning 9,375,000 )( 9,375,000 )(
of yearCollection 17.2 9,375,000 -
Balance at end of year - 9,375,000 )(
500,000,000P 40,625,000P
Shares mount
In 2013, apart from CCC’s subscription to the increase in authorized capital stock paid by
way of application of its deposits for future stock subscription (see Note 17.2), it alsosubscribed to additional shares amounting to P254.1 million, which was paid in cash byCCC. The Company also collected its P9.4 million outstanding subscription receivable inprevious years.
In October 2013, CCC sold 100% of its ownership interest to CPFI (see Note 1).
As at December 31, 2013 and 2012, the Company has three stockholders owning 100 ormore shares each of the Company’s capital stock.
-
F-367

7/21/2019 PreliminaryProspectus - Century
http://slidepdf.com/reader/full/preliminaryprospectus-century 601/648
- 40 -
17.2
Deposits for Future Stock Subscriptions
On October 18, 2012, the Company filed an application with the SEC for its proposedincrease in authorized capital stock from P50.0 million divided into 5,000,000 toP500.0 million divided into 50,000,000 shares with the same par value per share of P10.
This was previously approved by the Company’s BOD on December 6, 2011. In
compliance with the SEC’s rules relating to the foregoing, the Company applied a portionof the parent company’s advances to the Company amounting to P45,500,000(see Note 18.2) and the parent company’s previously recognized Deposits for FutureStock Subscriptions amounting to P150,383,200 as subscription payments. As atDecember 31, 2012, approval of the application is still pending with the SEC.
Accordingly, the subscription payments were presented as Deposits for Future StockSubscriptions in the 2012 statement of financial position.
Subsequently, on April 15, 2013, the SEC approved the Company’s proposed increase inauthorized capital stock. Accordingly, on the same date, the Company issued 19,588,320shares to CCC by applying its deposits on future stock subscription of P195,883,200 onthe subscription price which equals the par value of the shares; hence, no additionalpaid-in-capital arose from this equity transaction.
17.3 Dividends Declaration
The BOD approved the declaration of cash dividend amounting to P64.0 million onSeptember 30, 2013 payable to stockholders of record as of September 30, 2013. Thecash dividend was fully settled in October 2013. There was no dividend declaration in2012.
18. RELATED PARTY TRANSACTIONS
The Company’s related parties include its ultimate parent company, the Company’s key
management personnel, related parties under common ownership and retirement planassets.
The summary of the Company’s related party transactions is presented below.
Outstanding Outstanding mount of Receivable Amount of Receivable
Note Transactions (Payable) Transactions (Payable)
Related Parties Under
Common Ownership:
Sale of goods 18.1 8,378,197P - 127,866,796P 7,044,926PConsultancy and
management fees 18.3 12,087,285 8,334,584 )( 7,279,445 2,556,101 )(
Advances 18.2 270,907,199 )( 7,965,473 )( 136,592,894 )( 278,872,672 )(Rentals 18.4 - - 1,547,100 3,456,221 )(
Key Management
Personnel
Compensation 18.5 3,165,483 - 2,958,888 -
2013 2012
P
F-368

7/21/2019 PreliminaryProspectus - Century
http://slidepdf.com/reader/full/preliminaryprospectus-century 602/648
- 41 -
18.1
Sale of Goods
The Company sold finished goods inventories to CCC amounting to P8.4 million in 2013and P127.9 million in 2012 which is presented as part of Sale of Goods in the statementsof comprehensive income. Outstanding balance in relation to the sale of goods as atDecember 31, 2012 amounts to P7.0 million and is shown as part of Trade receivables
under the Trade and Other Receivables account in the 2012 statement of financialposition (see Note 6). There is no outstanding balance of receivable from this transactionas at December 31, 2013.
Also, no impairment loss was recognized in both years on the Company’s receivable fromparent company.
18.2 Advances from Related Parties
In the normal course of business, the Company obtains unsecured, noninterest-bearingadvances from related parties, including its parent company and entities under commonownership, for working capital requirements and other purposes. Such advances arepresented as Due to Related Parties in the statements of financial position. Presented
below are the movement in the account.
Note 2013 2012
Balance at beginning of year 278,872,672P 415,465,566P Additional borrowings
during the year 256,723,141 -Repayments during the year 527,630,340 )( 91,092,894 )(
Applied as deposits forfuture stock subscription 18.2 - 45,500,000 )(
Balance at end of year 7,965,473P 278,872,672P
These are due on demand and normally repaid in cash.
18.3 Consultancy and Management Fees
The Company incurs management and consultancy fees based on an agreement betweenCCC and the Company. Under the agreement, CCC can allocate and charge commoncorporate expenses to its subsidiaries. The consultancy and management fees incurredand paid by the Company for the years ended December 31, 2013 and 2012 amounted toP12.1 million and P7.3 million, respectively, and is presented as part of Outside Servicesunder Administrative Expenses in the statements of comprehensive income(see Note 13). The outstanding payables arising from these transactions amount toP8.3 million and P2.6 million as at December 31, 2013 and 2012, respectively, are shownas part of Accrued expenses under the Trade and Other Payables account in thestatements of financial position (see Note 11).
F-369

7/21/2019 PreliminaryProspectus - Century
http://slidepdf.com/reader/full/preliminaryprospectus-century 603/648
- 42 -
18.4
Rentals
For the year ended December 31, 2012, CCC leased out storage and production facilitiesto the Company. In 2013, both parties agreed that the Company may use the facilities atno cost to the Company. Rental expense incurred amounting to P1.5 million for the yearended December 31, 2012 is presented as part of Rentals under Cost of Goods Sold in
the 2012 statement of comprehensive income (see Note 13). The outstanding payablesarising from these transactions amounts to P3.5 million as at December 31, 2012 and areshown as part of Trade payables under the Trade and Other Payables account in the 2012statement of financial position (see Note 11).
18.5 Key Management Personnel Compensations
The short-term employee benefits of the key management personnel amounted toP3.2 million and P3.0 million for the years ended December 31, 2013 and 2012, areincluded in Salaries and employee benefits presented as part of Administrative Expensesin the statements of comprehensive income (see Note 13).
18.6 Retirement Plan
The Company’s retirement plan for its post-employment defined benefit plan isadministered and managed by a trustee bank. The fair value and the composition of theplan assets as well as details of the contributions of the Company and benefits paid out bythe plan as of December 31, 2013 and 2012 are presented in Note 15.2(b).
The retirement fund neither provides any guarantee or surety for any obligation of theCompany nor its investments covered by any restriction or liens.
19. COMMITMENTS AND CONTINGENCIES
The following are the significant commitments and contingencies involving theCompany.
19.1
Credit Facilities
The Company has continuing surety with related parties on a P2,700,000,000 creditfacility with a major local bank and a P1,345,376,000 combined sub-limits through intercorporate guarantee lines from other local banks.
19.2 Capital Commitments
As at December 31, 2013, the Company has construction-in-progress totalling
P145,137,943. The construction relates to the Company’s new production plant in Taguig City (see Note 9). The construction is expected to be completed in 2014 and hasremaining estimated costs to complete of P51,925,717 as at December 31, 2013 which ispartly financed by the interest-bearing loans obtained from a local bank onOctober 30, 2013 (see Note 12).
F-370

7/21/2019 PreliminaryProspectus - Century
http://slidepdf.com/reader/full/preliminaryprospectus-century 604/648
- 43 -
19.3
Others
There are other commitments, guarantees, litigations and contingent liabilities that arise inthe normal course of the Company’s operations which are not reflected in theaccompanying financial statements. As at December 31, 2013, management is of theopinion that losses, if any, from these commitments and contingencies will not have a
material effect on the Company’s financial statements.
20.
CATEGORIES AND OFFSETTING OF FINANCIAL ASSETS ANDLIABILITIES
The carrying amounts and fair values of the categories of assets and liabilities presented inthe statements of financial position are shown below.
Notes Carrying Values Fair Values Carrying Values Fair Values
Financial assets
Loans and receivables:
Cash and cash equivalents 5 49,156,818P 49,156,818P 36,933,115P 36,933,115P Trade and other
receivables – net 6 258,579,504 258,579,504 246,999,008 246,999,008Security deposits 10 1,780,295 1,780,295 1,780,295 1,780,295
309,516,617P 309,516,617P 285,712,418P 285,712,418P
Financial Liabilities
At amortized cost: Trade and other payables 11 158,555,004P 158,555,004P 331,787,190P 331,787,190PInterest-bearing loans 12 215,000,000 215,000,000 - -Due to related parties 18 7,965,473 7,965,473 278,872,672 278,872,672
381,520,477P 381,520,477P 610,659,862P 610,659,862P
2013 2012
See Notes 2.3 and 2.8 for a description of the accounting policies for each category offinancial instrument. A description of the Company’s risk management objectives andpolicies for financial instruments is provided in Note 4.
The Company has no financial instrument offsetting arrangements in 2013 and 2012.
F-371
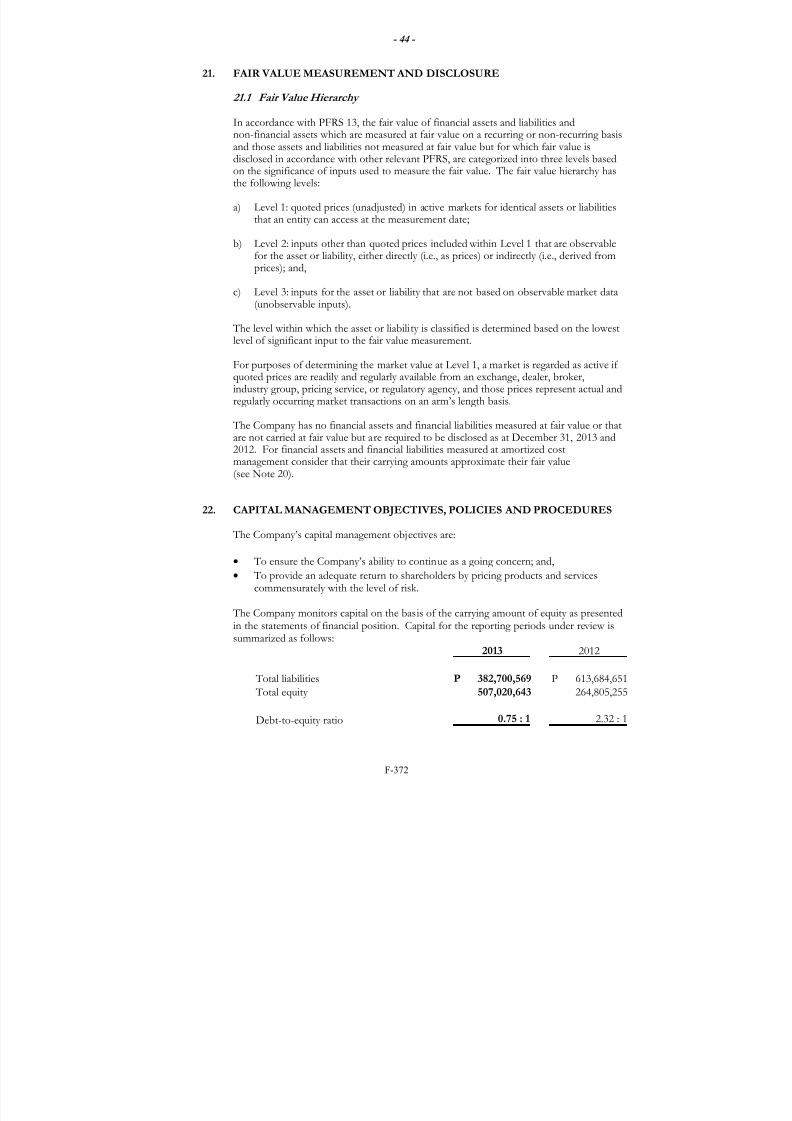
7/21/2019 PreliminaryProspectus - Century
http://slidepdf.com/reader/full/preliminaryprospectus-century 605/648
- 44 -
21. FAIR VALUE MEASUREMENT AND DISCLOSURE
21.1 Fair Value Hierarchy
In accordance with PFRS 13, the fair value of financial assets and liabilities andnon-financial assets which are measured at fair value on a recurring or non-recurring basis
and those assets and liabilities not measured at fair value but for which fair value isdisclosed in accordance with other relevant PFRS, are categorized into three levels basedon the significance of inputs used to measure the fair value. The fair value hierarchy hasthe following levels:
a) Level 1: quoted prices (unadjusted) in active markets for identical assets or liabilitiesthat an entity can access at the measurement date;
b) Level 2: inputs other than quoted prices included within Level 1 that are observablefor the asset or liability, either directly (i.e., as prices) or indirectly (i.e., derived fromprices); and,
c) Level 3: inputs for the asset or liability that are not based on observable market data
(unobservable inputs).
The level within which the asset or liability is classified is determined based on the lowestlevel of significant input to the fair value measurement.
For purposes of determining the market value at Level 1, a market is regarded as active ifquoted prices are readily and regularly available from an exchange, dealer, broker,industry group, pricing service, or regulatory agency, and those prices represent actual andregularly occurring market transactions on an arm’s length basis.
The Company has no financial assets and financial liabilities measured at fair value or thatare not carried at fair value but are required to be disclosed as at December 31, 2013 and
2012. For financial assets and financial liabilities measured at amortized costmanagement consider that their carrying amounts approximate their fair value(see Note 20).
22. CAPITAL MANAGEMENT OBJECTIVES, POLICIES AND PROCEDURES
The Company’s capital management objectives are:
• To ensure the Company’s ability to continue as a going concern; and,
•
To provide an adequate return to shareholders by pricing products and servicescommensurately with the level of risk.
The Company monitors capital on the basis of the carrying amount of equity as presentedin the statements of financial position. Capital for the reporting periods under review issummarized as follows:
2013 2012
Total liabilities 382,700,569P 613,684,651P
Total equity 507,020,643 264,805,255
Debt-to-equity ratio 0.75 : 1 2.32 : 1
F-372

7/21/2019 PreliminaryProspectus - Century
http://slidepdf.com/reader/full/preliminaryprospectus-century 606/648
- 45 -
The Company sets the amount of capital in proportion to its overall financing structure,i.e., equity and liabilities. The Company manages the capital structure and makesadjustments to it in the light of changes in economic conditions and the riskcharacteristics of the underlying assets.
23.
SUPPLEMENTARY INFORMATION REQUIRED BY THE BIR
Presented below is the supplementary information which is required by the BIR under itsexisting revenue regulations to be disclosed as part of the notes to financial statements.
This supplementary information is not a required disclosure under PFRS.
23.1 Requirements under Revenue Regulations (RR) 15-2010
The information on taxes, duties and license fees paid or accrued during the taxable yearrequired under RR 15-2010 are as follows:
(a) Output VAT
The total revenue and corresponding VAT of the Company for 2013 is as follows:
OutputTax Base VAT
VATable sales 1,551,915,037P 186,229,804P
Zero-rated sales 4,443,844 -
1,556,358,881P 186,229,804P
The Company’s VAT zero-rated sales/receipt were determined pursuant to Section
106(A)(2)(a), Zero-rated VAT on Export Sale of Goods , and Section 109, VAT ExemptTransactions , of the 1997 National Internal Revenue Code.
The tax bases are presented as Sale of Goods in the 2013 statement of comprehensiveincome.
There is no outstanding output VAT payable as of December 31, 2013.
F-373

7/21/2019 PreliminaryProspectus - Century
http://slidepdf.com/reader/full/preliminaryprospectus-century 607/648
- 46 -
(b)
Input VAT
The movements in input VAT, which is presented as part of the Prepayments and OtherCurrent Assets (see Note 8), in 2013 are summarized below.
Balance at beginning of year 40,180,862P
Input tax on imported goods 73,843,567Goods for resale/manufacture
or further processing 46,589,848Services lodged under other accounts 45,564,142Services lodged under cost of goods sold 9,000,435Capital goods not subject to amortization 469,424
Applied against output VAT 186,229,804 )(
Balance at end of year 29,418,474P
(c) Taxes on Importation
In 2013, the total landed cost of the Company’s imported inventory for use in businessamounted to P615,363,047. This amount includes customs duties and tariff fees ofP6,320,868.
(d) Excise Tax
The Company does not have excise tax in 2013 since it does not have any transactions which are subject to excise tax.
(e)
Documentary Stamp Tax (DST)
In 2013, the Company incurred DST amounting to P2,250,000 [see Note 23.1(f)] inconnection with its increase in the authorized capital stock (see Note 17.2).
(f)
Taxes and Licenses
The details of Taxes and licenses are broken down as follows:
Notes
Business tax 4,936,848P
DST 23.1(e) 2,250,000
Municipal license and permit 70,764
Miscellaneous 53,408
13 7,311,020P
The amounts of taxes and licenses are allocated as follows:
Cost of goods sold 161,729POperating expenses 7,149,291
7,311,020P
F-374

7/21/2019 PreliminaryProspectus - Century
http://slidepdf.com/reader/full/preliminaryprospectus-century 608/648
- 47 -
(g)
Withholding Taxes
The details of total withholding taxes for the year ended December 31, 2013are shown below.
Expanded 13,965,214P
Compensation and benefits 1,785,175
15,750,389P
The Company has no transaction in 2013 which are subject to final tax.
(h) Deficiency Tax Assessment and Tax Cases
As of December 31, 2013, the Company does not have any final deficiency taxassessment from the BIR nor does it have tax cases outstanding or pending in courts orbodies outside of the BIR in any of the open years.
23.2
Requirements under RR 19-2011
RR 19-2011 requires schedules of taxable revenues and other non-operating income,costs of g, itemized deductions and other significant tax information, to be disclosed inthe notes to financial statements.
The amount of taxable revenues and income, and deductible costs and expensespresented below are based on relevant tax regulations issued by the BIR, hence, may notbe the same as the amounts reflected in the 2013 statement of comprehensive income.
(a)
Taxable Revenues
The Company’s taxable revenues subject to regular tax rate for the year endedDecember 31, 2013 amounted to P1,556,358,881.
(b)
Deductible Cost of Goods Sold
Deductible cost of goods sold for the year ended December 31, 2013 which is subject toregular tax rate comprises the following:
Finished goods at beginning of year 314,973,334PCost of goods manufactured 1,084,309,547
Total goods available for sale 1,399,282,881Finished goods at end of year 176,322,810 )(
1,222,960,071P
(c) Taxable Non-operating and Other Income
Taxable non-operating and other income which are subject to the regular tax rateamounted to P58,240.
F-375

7/21/2019 PreliminaryProspectus - Century
http://slidepdf.com/reader/full/preliminaryprospectus-century 609/648
- 48 -
(d)
Itemized Deductions
The amounts of itemized deductions for the year ended December 31, 2013 follow:
Advertisements 111,507,292PFreight 45,810,049
Forwarding and other warehousing fees 44,724,843Merchandisers’ salary 34,951,327Outside services 19,030,867
Taxes and licenses 7,149,291Salaries and employee benefits 4,585,762Finance costs 1,630,556Depreciation and amortization 197,710Communication, light and water 81,847Supplies 30,240Rentals 13,417Repairs and maintenance 3,726Miscellaneous 1,439,317
271,156,244P
F-376

7/21/2019 PreliminaryProspectus - Century
http://slidepdf.com/reader/full/preliminaryprospectus-century 610/648

7/21/2019 PreliminaryProspectus - Century
http://slidepdf.com/reader/full/preliminaryprospectus-century 611/648

7/21/2019 PreliminaryProspectus - Century
http://slidepdf.com/reader/full/preliminaryprospectus-century 612/648

7/21/2019 PreliminaryProspectus - Century
http://slidepdf.com/reader/full/preliminaryprospectus-century 613/648
Notes 2012 2011
CURRENT ASSETS
Cash and cash equivalents 5 36,933,115P 25,373,381P
Trade and other receivables - net 6 251,380,765 213,991,953
Inventories 7 459,984,049 560,094,395
Prepayments and other current assets 8 65,252,136 60,432,337
Total Current Assets 813,550,065 859,892,066
NON-CURRENT ASSETS
Property, plant and equipment - net 9 22,055,547 31,704,177
Retirement benefit asset 15 608,524 484,533
Other non-current assets 10 42,884,295 42,435,295
Total Non-current Assets 65,548,366 74,624,005
TOTAL ASSETS 879,098,431P 934,516,071P
CURRENT LIABILITIES
Trade and other payables 11 334,282,849P 317,917,167P
Due to related parties 17 278,872,672 415,465,566
Total Liabilities 613,155,521 733,382,733
EQUITY
Capital stock 16 40,625,000 40,625,000Deposits for future stock subscriptions 16 195,883,200 150,383,200
Retained earnings 29,434,710 10,125,138
Net Equity 265,942,910 201,133,338
TOTAL LIABILITIES AND EQUITY 879,098,431P 934,516,071P
SNOW MOUNTAIN DAIRY CORPORATION
STATEMENTS OF FINANCIAL POSITION
DECEMBER 31, 2012 AND 2011
(Amounts in Philippine Pesos)
See Notes to Financial Statements.
A S S E T S
LIABILITIES AND EQUITY
(A Subsidiary of Century Canning Corporation)
F-380

7/21/2019 PreliminaryProspectus - Century
http://slidepdf.com/reader/full/preliminaryprospectus-century 614/648
Notes 2012 2011
SALE OF GOODS 17 1,720,370,574P 1,279,476,627P
COST OF GOODS SOLD 12 1,419,592,252 1,088,308,409
GROSS PROFIT 300,778,322 191,168,218
OPERATING EXPENSES (INCOME)
Selling expenses12 131,551,269
94,115,732Marketing expenses 12 119,270,662 64,472,398
Administrative expenses 12 23,318,349 21,348,147
Other income 128,616 )( 1,298,461 )(
274,011,664 178,637,816
OPERATING PROFIT 26,766,658 12,530,402
FINANCE COSTS - Net 13 82,077 337,244
PROFIT BEFORE TAX 26,684,581 12,193,158
TAX EXPENSE 15 7,375,007 3,884,847
NET PROFIT 19,309,574 8,308,311
OTHER COMPREHENSIVE INCOME - -
TOTAL COMPREHENSIVE INCOME 19,309,574P 8,308,311P
SNOW MOUNTAIN DAIRY CORPORATION
STATEMENTS OF COMPREHENSIVE INCOME
FOR THE YEARS ENDED DECEMBER 31, 2012 AND 2011
(Amounts in Philippine Pesos)
See Notes to Financial Statements.
(A Subsidiary of Century Canning Corporation)
F-381

7/21/2019 PreliminaryProspectus - Century
http://slidepdf.com/reader/full/preliminaryprospectus-century 615/648
Note 2012 2011
CAPITAL STOCK 16
Balance at beginning of year 40,625,000P 3,125,000P
Issuance of shares during the year - 37,500,000
Balance at end of year 40,625,000 40,625,000
DEPOSITS FOR FUTURE STOCK
SUBSCRIPTIONS 16Balance at beginning of year 150,383,200 187,883,200
Additional subscription during the year 45,500,000 -
Applied to subscription during the year - 37,500,000 )(
Balance at end of year 195,883,200 150,383,200
RETAINED EARNINGS
Balance at beginning of year 10,125,136 1,816,827
Net profit 19,309,574 8,308,311
Balance at end of year 29,434,710 10,125,138
TOTAL EQUITY 265,942,910P 201,133,338P
SNOW MOUNTAIN DAIRY CORPORATION
STATEMENTS OF CHANGES IN EQUITY
FOR THE YEARS ENDED DECEMBER 31, 2012 AND 2011
(Amounts in Philippine Pesos)
See Notes to Financial Statements.
(A Subsidiary of Century Canning Corporation)
F-382

7/21/2019 PreliminaryProspectus - Century
http://slidepdf.com/reader/full/preliminaryprospectus-century 616/648
Notes 2012 2011
CASH FLOWS FROM OPERATING ACTIVITIES
Profit before tax 26,684,581P 12,193,158P
Adjustments for:
Depreciation and amortization 9 11,919,168 14,192,440
Impairment losses 6 512,760 )( 319,869 )(
Finance costs 13 124,025 261,567
Finance income 13 187,370 )( 158,321 )(
Operating profit before working capital changes 38,027,644 26,168,975
Increase in trade and other receivables 44,217,902 )( 6,919,250 )(
Decrease in inventories 100,110,346 261,135,452
Increase in prepayments and other current assets 4,819,799 )( 9,841,291 )(
Increase in retirement benefit asset 123,991 )( 225,788 )(Increase in other non-current assets 449,000 )( 542,180 )(
Increase in trade and other payables 16,365,682 10,144,512
Cash generated from operations 104,892,980 279,920,430
Interest received 187,370 158,321
Income taxes paid 33,159 )( 27,844 )(
Net Cash From Operating Activities 105,047,191 280,050,907
CASH FLOWS FROM INVESTING ACTIVITIES
Acquisitions of property and equipment 9 2,270,538 )( 57,221 )(
CASH FLOWS FROM FINANCING ACTIVITIES
Repayments of due to related parties 17 91,092,894 )( 282,232,333 )(Interest paid 124,025 )( 261,567 )(
Net Cash Used in Financing Activities 91,216,919 )( 282,493,900 )(
NET INCREASE (DECREASE) IN CASH AND
CASH EQUIVALENTS 11,559,734 2,500,214 )(
CASH AND CASH EQUIVALENTS
AT BEGINNING OF YEAR 25,373,381 27,873,595
CASH AND CASH EQUIVALENTS
AT END OF YEAR 36,933,115P 25,373,381P
Supplemental Information on Non-cash Financing Activities:
1)
2)
FOR THE YEARS ENDED DECEMBER 31, 2012 AND 2011
(Amounts in Philippine Pesos)
See Notes to Financial Statements.
SNOW MOUNTAIN DAIRY CORPORATION
STATEMENTS OF CASH FLOWS
(A Subsidiary of Century Canning Corporation)
In 2012, the Company and Century Canning Corporation (CCC) agreed to convert portion of
the Company's advances from CCC amounting to P45,500,000 to equity (see Note 16).
In December 2011, the Company issued 3,750,000 shares to a stockholder by applying the
stockholder's deposit for future stock subscription amounting to P37,500,000 (see Note 16).
F-383

7/21/2019 PreliminaryProspectus - Century
http://slidepdf.com/reader/full/preliminaryprospectus-century 617/648
SNOW MOUNTAIN DAIRY CORPORATION(A Subsidiary of Century Canning Corporation)
NOTES TO FINANCIAL STATEMENTSDECEMBER 31, 2012 AND 2011(Amounts in Philippine Pesos)
1. CORPORATE INFORMATION
1.1 Incorporation and Operations
Snow Mountain Dairy Corporation (the Company) was incorporated in the Philippinesand registered with the Philippine Securities and Exchange Commission (SEC) onFebruary 14, 2001. It started commercial operations in November 2002. The Company isengaged in producing, canning, freezing, preserving, refining, packing, buying and sellingat wholesale and retail, food products including all kinds of milk and dairy products, fruitsand vegetable juices and other milk or dairy preparations and by-products.
In December 2011, the Company became a subsidiary of Century Canning Corporation(CCC or the parent company), a company incorporated and domiciled in the Philippines.CCC is presently engaged in manufacturing and distribution of canned tuna products forthe Philippine market.
The registered office of the Company, which is also its principal place of business, islocated at No. 48 Amang Rodriguez Avenue, Ignacio Complex, Manggahan, Pasig City.CCC’s registered office, which is also its principal place of business, is located at 32 ArturoDrive, Bagumbayan, Taguig, Metro Manila.
1.2 Approval of Financial Statements
The financial statements of the Company for the year ended December 31, 2012(including the comparatives for the year ended December 31, 2011) were authorized forissue by the Company’s Vice President for Finance on April 12, 2013.
2.
SUMMARY OF SIGNIFICANT ACCOUNTING POLICIES
The significant accounting policies that have been used in the preparation of thesefinancial statements are summarized below and in the succeeding pages. The policieshave been consistently applied to all the years presented, unless otherwise stated.
2.1 Basis of Preparation of Financial Statements
(a)
Statement of Compliance with Philippine Financial Reporting Standards
The financial statements of the Company have been prepared in accordance withPhilippine Financial Reporting Standards (PFRS). PFRS are adopted by theFinancial Reporting Standards Council from the pronouncements issuedby the International Accounting Standards Board (IASB).
F-384

7/21/2019 PreliminaryProspectus - Century
http://slidepdf.com/reader/full/preliminaryprospectus-century 618/648
- 2 -
The financial statements have been prepared using the measurement basesspecified by PFRS for each type of asset, liability, income and expenses. Themeasurement bases are more fully described in the accounting policies that follow.
(b)
Presentation of Financial Statements
The financial statements are presented in accordance with Philippine AccountingStandards (PAS) 1, Presentation of Financial Statement s. The Company presents all itemsof income and expenses in a single statement of comprehensive income. Twocomparative periods are presented for the statement of financial position when theCompany applies an accounting policy retrospectively, makes a retrospectiverestatement of items in its financial statements, or reclassifies items in the financialstatements.
(c)
Functional and Presentation Currency
These financial statements are presented in Philippine pesos, the Company’sfunctional and presentation currency, and all values represent absolute amountsexcept when otherwise indicated.
Items included in the financial statements of the Company are measured using itsfunctional currency, the currency of the primary economic environment in which theentity operates.
2.2 Adoption of New and Amended PFRS
(a) Effective in 2012 that is Relevant to the Company
In 2012, the Company adopted PFRS 7 (Amendment), Financial Instruments:Disclosures – Transfers of Financial Assets , effective for financial statements for the annualperiods beginning on or after July 1, 2011. The amendment requires additionaldisclosures that will allow users of financial statements to understand the relationshipbetween transferred financial assets that are not derecognized in their entirety and theassociated liabilities; and, to evaluate the nature of, and risk associated with anycontinuing involvement of the reporting entity in financial assets that arederecognized in their entirety. The Company did not transfer any financial assetinvolving this type of arrangement; hence, the amendment did not result in anysignificant change in the Company’s disclosures in its financial statements.
(b) Effective in 2012 that are not Relevant to the Company
The following amendments and improvement to PFRS are mandatory for accountingperiods beginning on or after July 1, 2011 or January 1, 2012 but are not relevant to
the Company’s financial statements:
PFRS 1 (Amendment) : First time adoption of PFRS –Severe Hyperinflation and Removalof Fixed Date for First-time Adopters
PAS 12 (Amendment) : Income Taxes – Deferred Tax:Recovery of Underlying Assets
F-385

7/21/2019 PreliminaryProspectus - Century
http://slidepdf.com/reader/full/preliminaryprospectus-century 619/648
- 3 -
(c)
Effective Subsequent to 2012 but not Adopted Early
There are new PFRS, amendments and annual improvements to existing standardsthat are effective for periods subsequent to 2012. Management has initiallydetermined the following pronouncements, which the Company will apply inaccordance with their transitional provisions, to be relevant to its financial
statements:
(i) PAS 1 (Amendment), Financial Statements Presentation – Presentation of Items ofOther Comprehensive Income (effective from July 1, 2012). The amendmentrequires an entity to group items presented in other comprehensive incomeinto those that, in accordance with other PFRSs: (a) will not be reclassifiedsubsequently to profit or loss and (b) will be reclassified subsequently to profitor loss when specific conditions are met. The Company’s managementexpects that this will not change the current presentation of items in othercomprehensive income.
(ii)
PAS 19 (Revised), Employee Benefits (effective from January 1, 2013). Therevision made a number of changes as part of the improvements throughout
the standard. The main changes relate to defined benefit plans as follows:
• eliminates the corridor approach under the existing guidance of PAS 19and requires an entity to recognize all actuarial gains and losses arising inthe reporting period;
• streamlines the presentation of changes in plan assets and liabilitiesresulting in the disaggregation of changes into three main components ofservice costs, net interest on net defined benefit obligation or asset, andremeasurement; and,
•
enhances disclosure requirements, including information about the
characteristics of defined benefit plans and the risks that entities areexposed to through participation in those plans.
Currently, the Company is using the corridor approach and its unrecognizedactuarial loss as at December 31, 2012 which amounts to P1.1 million(see Note 14.2) which will be retrospectively recognized as loss in othercomprehensive income in 2013.
(iii)
PFRS 7 (Amendment), Financial Instruments: Disclosures – Offsetting Financial Assets and Financial Liabilities (effective from January 1, 2013). The amendmentrequires qualitative and quantitative disclosures relating to gross and netamounts of recognized financial instruments that are set-off in accordance
with PAS 32, Financial Instruments: Presentation . The amendment also requiresdisclosure of information about recognized financial instruments which aresubject to enforceable master netting arrangements or similar agreements,even if they are not set-off in the statement of financial position, includingthose which do not meet some or all of the offsetting criteria under PAS 32and amounts related to a financial collateral. These disclosures will allowfinancial statement users to evaluate the effect or potential effect of nettingarrangements, including rights of set-off associated with recognized financialassets and financial liabilities on the entity’s financial position. The Companyhas initially assessed that the adoption of the amendment will not have asignificant impact on its financial statements.
F-386
7/21/2019 PreliminaryProspectus - Century
http://slidepdf.com/reader/full/preliminaryprospectus-century 620/648
- 4 -
(iv)
PFRS 13, Fair Value Measurement (effective from January 1, 2013). Thisstandard aims to improve consistency and reduce complexity by providing aprecise definition of fair value and a single source of fair value measurementand disclosure requirements for use across PFRS. The requirements do notextend the use of fair value accounting but provide guidance on how it shouldbe applied where its use is already required or permitted by other standards.
Management is in the process of reviewing its valuation methodologies forconformity with the new requirements and has yet to assess the impact of thenew standard on the Company’s financial statements.
(v) PAS 32 (Amendment), Financial Instruments: Presentation – Offsetting Financial Assets and Financial Liabilities (effective from January 1, 2014). The amendmentprovides guidance to address inconsistencies in applying the criteria foroffsetting financial assets and financial liabilities. It clarifies that a right of set-off is required to be legally enforceable, in the normal course of business; inthe event of default; and in the event of insolvency or bankruptcy of the entityand all of the counterparties. The amendment also clarifies the principlebehind net settlement and provided characteristics of a gross settlement
system that would satisfy the criterion for net settlement. The Company doesnot expect this amendment to have a significant impact on its financialstatements.
(vi) PFRS 9, Financial Instruments: Classification and Measurement (effective from January 1, 2015). This is the first part of a new standard on financialinstruments that will replace PAS 39, Financial Instruments: Recognition and
Measurement , in its entirety. This chapter covers the classification andmeasurement of financial assets and financial liabilities and it deals with twomeasurement categories for financial assets: amortized cost and fair value. Allequity instruments will be measured at fair value while debt instruments willbe measured at amortized cost only if the entity is holding it to collectcontractual cash flows which represent payment of principal and interest. Theaccounting for embedded derivatives in host contracts that are financial assetsis simplified by removing the requirement to consider whether or not they areclosely related, and, in most arrangement, does not require separation from thehost contract.
For liabilities, the standard retains most of the PAS 39 requirements whichinclude amortized cost accounting for most financial liabilities, withbifurcation of embedded derivatives. The main change is that, in case wherethe fair value option is taken for financial liabilities, the part of a fair valuechange due to an entity’s own credit risk is recorded in other comprehensiveincome rather than in profit or loss, unless this creates an accountingmismatch.
To date, other chapters of PFRS 9 dealing with impairment methodology andhedge accounting are still being completed.
Further, in November 2011, the IASB tentatively decided to consider makinglimited modifications to International Financial Reporting Standard (IFRS) 9’sfinancial asset classification model to address certain application issues.
F-387

7/21/2019 PreliminaryProspectus - Century
http://slidepdf.com/reader/full/preliminaryprospectus-century 621/648
- 5 -
The Company does not expect to implement and adopt PFRS 9 until itseffective date. In addition, management is currently assessing the impact ofPFRS 9 on the financial statements of the Company and it plans to conduct acomprehensive study of the potential impact of this standard prior to itsmandatory adoption date to assess the impact of all changes.
(vii)
2009-2011 Annual Improvements to PFRS. Annual improvements to PFRS(2009-2011 Cycle) made minor amendments to a number of PFRS, which areeffective for annual periods beginning on or after January 1, 2013. Amongthose improvements, the following amendments are relevant to the Companybut management does not expect a material impact on the Company’sfinancial statements:
(a)
PAS 1 (Amendment), Presentation of Financial Statements – Clarification of theRequirements for Comparative Information . The amendment clarifies therequirements for presenting comparative information for the following:
• Requirements for opening statement of financial position
If an entity applies an accounting policy retrospectively, or makes aretrospective restatement or reclassification of items that has a materialeffect on the information in the statement of financial position at thebeginning of the preceding period (i.e., opening statement of financialposition), it shall present such third statement of financial position.
Other than disclosure of certain specified information in accordance with PAS 8, Accounting Policies, Changes in Accounting Estimates and Errors ,related notes to the opening statement of financial position as at thebeginning of the preceding period are not required to be presented.
• Requirements for additional comparative information beyondminimum requirements
If an entity presented comparative information in the financialstatements beyond the minimum comparative informationrequirements, the additional financial statements information should bepresented in accordance with PFRS including disclosure ofcomparative information in the related notes for that additionalinformation. Presenting additional comparative information voluntarily
would not trigger a requirement to provide a complete set of financialstatements.
(b)
PAS 16 (Amendment), Property, Plant and Equipment – Classification ofServicing Equipment. The amendment addresses a perceived inconsistencyin the classification requirements for servicing equipment which resultedin classifying servicing equipment as part of inventory when it is used formore than one period. It clarifies that items such as spare parts, stand-byequipment and servicing equipment shall be recognized as property, plantand equipment when they meet the definition of property, plant andequipment, otherwise, these are classified as inventory.
F-388

7/21/2019 PreliminaryProspectus - Century
http://slidepdf.com/reader/full/preliminaryprospectus-century 622/648
- 6 -
(c)
PAS 32 (Amendment ), Financial Instruments : Presentation – Tax Effect ofDistributions to Holders of Equity Instruments . The amendment clarifies thatthe consequences of income tax relating to distributions to holders of anequity instrument and to transaction costs of an equity transaction shall beaccounted for in accordance with PAS 12. Accordingly, income taxrelating to distributions to holders of an equity instrument is recognized in
profit or loss while income tax related to the transaction costs of an equitytransaction is recognized in equity.
2.3 Financial Assets
Financial assets are recognized when the Company becomes a party to the contractualterms of the financial instrument. Financial assets other than those designated andeffective as hedging instruments are classified into the following categories: financialassets at fair value through profit or loss (FVTPL), loans and receivables, held-to-maturityinvestments and available-for-sale financial assets. Financial assets are assigned to thedifferent categories by management on initial recognition, depending on the purpose for
which the investments were acquired.
Regular purchases and sales of financial assets are recognized on their trade date. Allfinancial assets that are not classified as at FVTPL are initially recognized at fair valueplus any directly attributable transaction costs. Financial assets carried at FVTPL areinitially recorded at fair value and related transaction costs that are recognized in profit orloss.
The financial assets currently category relevant to the Company is loans and receivables.
Loans and receivables are non-derivative financial assets with fixed or determinablepayments that are not quoted in an active market. They arise when the Companyprovides money, goods or services directly to a debtor with no intention of trading the
receivables. They are included in current assets, except for maturities greater than12 months after the end of the reporting period which are classified as non-current assets.
Loans and receivables are subsequently measured at amortized cost using the effectiveinterest method for maturities extending beyond one year, less impairment losses. Anychange in their value is recognized in profit or loss. Impairment loss is provided whenthere is objective evidence that the Company will not be able to collect all amounts dueto it in accordance with the original terms of the receivables. The amount of theimpairment loss is determined as the difference between the assets’ carrying amount andthe present value of estimated cash flows.
The Company’s financial assets categorized as loans and receivables are presented as
Cash and Cash Equivalents, Trade and Other Receivables (except deposit on purchases)and Other Non-current Assets, with respect to security deposits included therein, in thestatement of financial position. Cash and cash equivalents are defined as cash on hand,demand deposits and short-term, highly liquid investments readily convertible to knownamounts of cash and which are subject to insignificant risk of changes in value.
All income and expenses, except impairment loss on trade and other receivables which isconsidered administrative expense, relating to financial assets that are recognized in profitor loss are presented as part of Finance Costs (Income) in the statement ofcomprehensive income.
F-389

7/21/2019 PreliminaryProspectus - Century
http://slidepdf.com/reader/full/preliminaryprospectus-century 623/648
- 7 -
Non-compounding interest, and other cash flows resulting from holding financial assetsare recognized in profit or loss when earned, regardless of how the related carryingamount of financial assets is measured.
Derecognition of financial assets occurs when the rights to receive cash flows from thefinancial instruments expire or are transferred and substantially all of the risks and
rewards of ownership have been transferred.
2.4 Inventories
Inventories are valued at the lower of cost and net realizable value. Cost is determinedusing the first-in, first-out method. Finished goods and work-in-process include thecost of raw materials, direct labor and a proportion of manufacturing overhead basedon normal operating capacity. The cost of raw materials include all costs directlyattributable to acquisitions, such as the purchase price, import duties and other taxesthat are not subsequently recoverable from taxing authorities.
Net realizable value is the estimated selling price in the ordinary course of business,
less the estimated costs of completion and the estimated costs necessary to make thesale. Net realizable value of raw materials is the current replacement cost.
2.5 Property, Plant and Equipment
Property, plant and equipment are stated at cost less accumulated depreciation andamortization and any impairment loss. The cost of an asset comprises its purchase priceand directly attributable costs of bringing the asset to working condition for its intendeduse. Expenditures for additions, major improvements and renewals are capitalized;expenditures for repairs and maintenance are charged to expense as incurred.
Depreciation is computed on a straight-line basis over the estimated useful lives of theassets as follows and any impairment loss:
Plant, machinery and equipment 2 to 10 yearsLaboratory tools and equipment 1 to 10 years
Leasehold improvements are amortized over the term of the lease or useful lives of theassets of 1 to 10 years, whichever is shorter.
Fully depreciated assets are retained in the accounts until these are no longer in use. Nofurther charge for depreciation is made in respect of those accounts.
Construction-in-progress represents properties undergoing construction. It is stated atcost which includes cost of construction, applicable borrowing cost (see Note 2.15) andother direct costs. This account is not depreciated until such time that the assets arecompleted and available for use.
An asset’s carrying amount is written down immediately to its recoverable amount if theasset’s carrying amount is greater than its estimated recoverable amount (see Note 2.13).
The residual values and estimated useful lives of property, plant and equipment arereviewed, and adjusted if appropriate, at the end of each reporting period.
F-390

7/21/2019 PreliminaryProspectus - Century
http://slidepdf.com/reader/full/preliminaryprospectus-century 624/648
- 8 -
An item of property, plant and equipment, including related accumulated depreciationand amortization and impairment losses, if any, is derecognized upon disposal or whenno future economic benefits are expected to arise from the continued use of the asset.
Any gain or loss arising on derecognition of the asset (calculated as the differencebetween the net disposal proceeds and the carrying amount of the item) is included in thestatement of comprehensive income in the year the item is derecognized.
2.6 Prepayments and Other Assets
Prepayment and other assets pertain to the other resources controlled by the Company asa result of past events. They are recognized in the financial statements when it isprobable that the future economic benefits will flow to the entity and the asset has a costor value that can be measured reliably.
Other recognized assets of similar nature, where future economic benefits are expectedto flow to the Company beyond one year after the end of the reporting period (or in thenormal operating cycle of the business, if longer), are classified as non-current assets.
2.7
Trademarks
The cost of trademarks is the amount of cash or cash equivalents paid or the fair value ofthe other considerations given up to acquire the trademark. The Company’s trademark isnot amortized but tested for impairment annually [see Notes 2.13and 3.1(a)].
2.8
Financial Liabilities
Financial liabilities of the Company include trade and other payables (excepts tax-relatedliabilities) and due to related parties which are recognized when the Company becomes aparty to the contractual terms of the instrument. These are recognized initially at their
fair value and subsequently measured at amortized cost, using effective interest methodfor maturities of more than one year less settlement payments. All interest-relatedcharges are recognized as an expense in profit or loss under the caption Finance Costs(Income) in the statement of comprehensive income.
Financial liabilities are classified as current liabilities if payment is due to be settled withinone year or less after the end of the reporting period (or in the normal operating cycle ofthe business, if longer), or the Company does not have an unconditional right to defersettlement of liability for at least twelve months after the end of the reporting period.Otherwise, these are presented as non-current liabilities.
Financial liabilities are derecognized from the statement of financial position only when
the obligations are extinguished either through discharge, cancellation or expiration.
2.9 Offsetting Financial Instruments
Financial assets and liabilities are offset and the resulting net amount is reported in thestatement of financial position when there is a legally enforceable right to set off therecognized amounts and there is an intention to settle on a net basis, or realize the assetand settle the liability simultaneously.
F-391

7/21/2019 PreliminaryProspectus - Century
http://slidepdf.com/reader/full/preliminaryprospectus-century 625/648
- 9 -
2.10
Provisions and Contingencies
Provisions are recognized when present obligations will probably lead to an outflow ofeconomic resources and they can be estimated reliably even if the timing or amount ofthe outflow may still be uncertain. A present obligation arises from the presence of alegal or constructive obligation that has resulted from past events.
Provisions are measured at the estimated expenditure required to settle the presentobligation, based on the most reliable evidence available at the end of the reportingperiod, including the risks and uncertainties associated with the present obligation.
Where there are a number of similar obligations, the likelihood that an outflow will berequired in settlement is determined by considering the class of obligations as a whole.
When time value of money is material, long-term provisions are discounted to theirpresent values using a pretax rate that reflects market assessments and the risks specific tothe obligation. The increase in the provision due to passage of time is recognized asinterest expense. The provisions are reviewed at the end of each reporting period andadjusted to reflect the current best estimate.
In those cases where the possible outflow of economic resource as a result of presentobligations is considered improbable or remote, or the amount to be provided for cannotbe measured reliably, no liability is recognized in the financial statements. Similarly,possible inflows of economic benefits to the Company that do not yet meet therecognition criteria of an asset are considered contingent assets, hence, are not recognizedin the financial statements. On the other hand, any reimbursement that the Companycan be virtually certain to collect from a third party with respect to the obligation isrecognized as a separate asset not exceeding the amount of the related provision.
2.11 Revenue and Expense Recognition
Revenue comprise of revenue from the sale of goods are measured by reference to the
fair value of consideration received or receivable by the Company for goods soldexcluding vlue-added tax (VAT).
Revenue is recognized to the extent that the revenue can be reliably measured; it isprobable that the economic benefits will flow to the Company; and the costs incurred orto be incurred can be measured reliably. In addition, the following specific recognitioncriteria must also be met before revenue is recognized:
(a)
Sale of goods – Revenue is recognized when the risks and rewards of ownership of thegoods have passed to the buyer, i.e. generally when the customer has acknowledgeddelivery of goods.
(b) Interest income – Recognized as the interest accrues taking into account the effectiveyield on the asset.
Costs and expenses are recognized in profit or loss upon receipt of goods and/orutilization of services or at the date they are incurred. All finance costs are reported inprofit or loss on an accrual basis.
F-392

7/21/2019 PreliminaryProspectus - Century
http://slidepdf.com/reader/full/preliminaryprospectus-century 626/648
- 10 -
2.12
Leases – Company as Lessee
Leases, which do not transfer to the Company substantially all the risks and benefits ofownership of the asset, are classified as operating leases. Operating lease payments arerecognized as expense in the statement of comprehensive income on a straight-line basisover the lease term. Associated costs, such as repairs and maintenance and insurance, are
expensed as incurred.
The Company determines whether an arrangement is, or contains, a lease based on thesubstance of the arrangement. It makes an assessment of whether the fulfilment of thearrangement is dependent on the use of a specific asset or assets and the arrangementconveys a right to use the asset.
2.13 Impairment of Non-financial Assets
The Company’s trademarks, having an indefinite useful life, are tested for impairmentannually. Property, plant and equipment and other nonfinancial are tested forimpairment whenever events or changes in circumstances indicate that the carrying
amount may not be recoverable.
For purposes of assessing impairment, assets are grouped at the lowest levels for whichthere are separately identifiable cash flows (cash-generating unit). As a result, assets aretested for impairment either individually or at the cash-generating unit level.Impairment loss is recognized for the amount by which the asset’s or cash-generatingunit’s carrying amount exceeds its recoverable amount. The recoverable amount is thehigher of fair value, reflecting market conditions less costs to sell, and value in use, basedon an internal evaluation of discounted cash flow. Impairment loss is charged pro-rata toother assets in the cash-generating unit.
All assets are subsequently reassessed for indications that an impairment loss previously
recognized may no longer exist and the carrying amount of the asset is adjusted to therecoverable amount resulting in the reversal of the impairment loss.
2.14 Employee Benefits
The Company provides post-employment benefits to employees through a definedbenefit plan.
(a)
Post-employment Benefits
A defined benefit plan is a post-employment plan that defines an amount ofpost-employment benefit that an employee will receive on retirement, usually
dependent on one or more factors such as age, years of service and salary. Thelegal obligation for any benefits from this kind of post-employment plan remains with the Company, even if plan assets for funding the defined benefit plan havebeen acquired. Plan assets may include assets specifically designated to along-term benefit fund, as well as qualifying insurance policies. The Company’spost-employment defined benefit pension plan covers all regular full-timeemployees. The pension plan is tax-qualified, noncontributory and administered bya trustee bank.
F-393

7/21/2019 PreliminaryProspectus - Century
http://slidepdf.com/reader/full/preliminaryprospectus-century 627/648
- 11 -
The assets recognized in the statement of financial position for post-employmentdefined benefit pension plans is the present value of the defined benefit obligation(DBO) at the end of the reporting period less the fair value of plan assets, together
with adjustments for unrecognized actuarial gains or losses and past service costs. The DBO is calculated regularly by independent actuaries using the projectedunit credit method. The present value of the DBO is determined by discounting
the estimated future cash outflows using interest rates of high quality corporatebonds that are denominated in the currency in which the benefits will be paid andthat have terms to maturity approximating to the terms of the relatedpost-employment liability.
Actuarial gains and losses are not recognized as an income or expense unless thetotal unrecognized gain or loss exceeds 10% of the greater of the obligation andrelated plan assets. The amount exceeding this 10% corridor is charged or creditedto profit or loss over the employees’ expected average remaining working lives.
Actuarial gains and losses within the 10% corridor are disclosed separately. Pastservice costs are recognized immediately in profit or loss, unless the changes to thepost-employment plan are conditional on the employees remaining in service for a
specified period of time (the vesting period). In this case, the past-service costs areamortized on a straight-line basis over the vesting period.
(b) Termination Benefits
Termination benefits are payable when employment is terminated by the Companybefore the normal retirement date, or whenever an employee accepts voluntaryredundancy in exchange for these benefits. The Company recognizes terminationbenefits when it is demonstrably committed to either: (a) terminating theemployment of current employees according to a detailed formal plan withoutpossibility of withdrawal; or (b) providing termination benefits as a result of anoffer made to encourage voluntary redundancy. Benefits falling due more than
12 months after the reporting period are discounted to present value.
(c) Compensated Absences
Compensated absences are recognized for the number of paid leave days(including holiday entitlement) remaining at the end of the reporting period. Theyare included in the Trade and Other Payables account in the statement of financialposition at the undiscounted amount that the Company expects to pay as a result ofthe unused entitlement.
2.15 Borrowing Costs
Borrowing costs are recognized as expense in the period in which they are incurred,except to the extent that they are capitalized. Borrowing costs that are directlyattributable to the acquisition, construction or production of a qualifying asset (i.e., anasset that takes a substantial period of time to get ready for its intended use or sale) arecapitalized as part of the cost of such asset. The capitalization of borrowing costscommences when expenditures for the asset and borrowing costs are being incurred andactivities that are necessary to prepare the asset for its intended use or sale are inprogress. Capitalization ceases when substantially all such activities are complete.
F-394

7/21/2019 PreliminaryProspectus - Century
http://slidepdf.com/reader/full/preliminaryprospectus-century 628/648
- 12 -
2.16
Foreign Currency Transactions and Translation
The accounting records of the Company are maintained in Philippine pesos. Foreigncurrency transactions during the year are translated into the functional currency atexchange rates which approximate those prevailing on transaction dates.
Foreign currency gains and losses resulting from the settlement of such transactions andfrom the translation at year-end exchange rates of monetary assets and liabilitiesdenominated in foreign currencies are recognized in the statement of comprehensiveincome as part of profit or loss from operations.
2.17 Income Taxes
Tax expense recognized in profit or loss comprises the sum of deferred tax and currenttax not recognized in other comprehensive income or directly in equity, if any.
Current tax assets or liabilities comprise those claims from, or obligations to, fiscalauthorities relating to the current or prior reporting period, that are uncollected or unpaid
at the end of the reporting period. They are calculated using the tax rates and tax lawsapplicable to the fiscal periods to which they relate, based on the taxable profit for theyear. All changes to current tax assets or liabilities are recognized as a component of taxexpense in profit or loss.
Deferred tax is accounted for using the liability method, on temporary differences at theend of the reporting period between the tax base of assets and liabilities and theircarrying amounts for financial reporting purposes. Under the liability method, withcertain exceptions, deferred tax liabilities are recognized for all taxable temporarydifferences and deferred tax assets are recognized for all deductible temporary differencesand the carryforward of unused tax losses and unused tax credits to the extent that it isprobable that taxable profit will be available against which the deductible temporary
differences can be utilized. Unrecognized deferred tax assets are reassessed at the end ofeach reporting period and are recognized to the extent that it has become probable thatfuture taxable profit will be available to allow such deferred tax assets to be recovered.
The carrying amount of deferred tax assets is reviewed at the end of each reportingperiod and reduced to the extent that it is probable that sufficient taxable profit will beavailable to allow all or part of the deferred tax asset to be utilized.
Deferred tax assets and liabilities are measured at the tax rates that are expected to applyto the period when the asset is realized or the liability is settled provided such tax rateshave been enacted or substantively enacted at the end of the reporting period.
Most changes in deferred tax assets or liabilities are recognized as a component of taxexpense in profit or loss. Only changes in deferred tax assets or liabilities that relate toitems recognized in other comprehensive income or directly in equity are recognized inother comprehensive income or directly in equity.
The Company establishes liabilities for probable and estimable assessments by the Bureauof Internal Revenue (BIR) resulting from any known tax exposures. Estimates representa reasonable provision for taxes ultimately expected to be paid and may need to beadjusted over time as more information becomes available.
F-395

7/21/2019 PreliminaryProspectus - Century
http://slidepdf.com/reader/full/preliminaryprospectus-century 629/648
- 13 -
2.18
Related Party Relationships and Transactions
Related party transactions are transfer of resources, services or obligations between theCompany and its related parties, regardless whether a price is charged.
Parties are considered to be related if one party has the ability to control the other party
or exercise significant influence over the other party in making financial and operatingdecisions. These parties include: (a) individuals owning, directly or indirectly through oneor more intermediaries, control or are controlled by, or under common control with theCompany; (b) associates; (c) individuals owning, directly or indirectly, an interest in the
voting power of the Company that gives them significant influence over the Companyand close members of the family of any such individual; and, (d) the Company’sretirement plan.
In considering each possible related party relationship, attention is directed to thesubstance of the relationship and not merely on the legal form.
2.19 Equity
Capital stock represents the nominal value of shares that have been issued.
Deposits for future stock subscriptions represent deposits from the parent company aspayment for future subscriptions.
Retained earnings represent all current and prior period results of operations as reportedin the profit or loss section of the statements of comprehensive income .
2.20
Events After the End of the Reporting Period
Any post-year-end event that provides additional information about the Company’sfinancial position at the end of the reporting period (adjusting event) is reflected in the
financial statements. Post-year-end events that are not adjusting events, if any, aredisclosed when material to the financial statements.
3. SIGNIFICANT ACCOUNTING JUDGMENTS AND ESTIMATES
The Company’s financial statements prepared in accordance with PFRS requiremanagement to make judgments and estimates that affect amounts reported in thefinancial statements and related notes. Judgments and estimates are continually evaluatedand are based on historical experience and other factors, including expectations of futureevents that are believed to be reasonable under the circumstances. Actual results mayultimately differ from these estimates.
F-396

7/21/2019 PreliminaryProspectus - Century
http://slidepdf.com/reader/full/preliminaryprospectus-century 630/648
- 14 -
3.1
Critical Management Judgments in Applying Accounting Policies
In the process of applying the Company’s accounting policies, management has made thefollowing judgments, apart from those involving estimation, which have the mostsignificant effect on the amounts recognized in the financial statements:
(a)
Determining the Useful Lives of Trademark
Under the Intellectual Property Code of the Philippines, the legal life of trademark is10 years and may be renewed every other 10 years. However, considering that themanagement does not expect any circumstances or events which will cause it todecide not to renew its trademarks every 10 years, management has taken theposition that the useful lives of its trademarks is indefinite; hence its costs is notamortized but subjected to annual impairment testing (see Note 2.7 and 2.13).Changes in assumption and circumstances in the future will substantially affect thefinancial statements of the Company, particularly the carrying value of assets.
No impairment loss on trademark was recognized in both years based on
management evaluation.
(b)
Distinction between Operating and Finance Leases
The Company has entered into various lease agreements as a lessee. Judgment wasexercised by management to distinguish each lease agreement as either an operatingor finance lease by looking at the transfer or retention of significant risk and rewardsof ownership of the properties covered by the agreements. Failure to make the rightjudgment will result in either overstatement or understatement of assets andliabilities. Based on management’s judgment such leases were determined to beoperating leases.
(c)
Recognition of Provisions and Contingencies
Judgment is exercised by management to distinguish between provisions andcontingencies. Accounting policies on provisions and contingencies are discussed inNotes 2.10 and relevant disclosures are presented in Note 18.
3.2 Key Sources of Estimation Uncertainty
The following are the key assumptions concerning the future, and other key sources ofestimation uncertainty at the end of the reporting period, that have a significant risk ofcausing a material adjustment to the carrying amounts of assets and liabilities within thenext financial year:
(a)
Impairment of Trade and Other Receivables
Adequate amount of allowance is made for specific and groups of accounts, whereobjective evidence of impairment exists. The Company evaluates these accountsbased on available facts and circumstances, including, but not limited to, the lengthof the Company’s relationship with the customers, the customers’ current creditstatus based on known market forces, average age of accounts, collection experienceand historical loss experience.
The carrying value of trade and other receivables and the analysis of allowance forimpairment on such financial assets are shown in Note 6.
F-397
7/21/2019 PreliminaryProspectus - Century
http://slidepdf.com/reader/full/preliminaryprospectus-century 631/648
- 15 -
(b)
Determining Net Realizable Value of Inventories
In determining the net selling prices of inventories, management takes into accountthe most reliable evidence available at the times the estimates are made. It also takesinto consideration the obsolescence of the inventory in determining net realizable
value. The future realization of the carrying amounts of inventories as disclosed in
Note 7 is affected by price changes in different market segments. These aspects areconsidered key sources of estimation uncertainty and may cause significantadjustments to the Company’s inventories within the next financial year.
No impairment loss on inventory was recognized in both years based onmanagement’s assessment..
(c)
Estimating Useful Lives of Property, Plant and Equipment
The Company estimates the useful lives of property, plant and equipment, exceptland, based on the period over which the assets are expected to be available for use.
The estimated useful lives of property, plant and equipment are reviewed
periodically and are updated if expectations differ from previous estimates due tophysical wear and tear, technical or commercial obsolescence and legal or otherlimits on the use of the assets.
The carrying amounts of property, plant and equipment are analyzed in Note 9.Based on management’s assessment as at December 31, 2012 and 2011 there is nochange in estimated useful lives of property, plant and equipment during those years.
Actual results, however, may vary due to changes in estimates brought about bychanges in factors mentioned above.
(d)
Determining Recoverable Value of Deferred Tax Assets
The Company reviews its deferred tax assets at the end of each reporting period andreduces the carrying amount to the extent that it is no longer probable that sufficienttaxable profit will be available to allow all or part of the deferred tax asset to beutilized.
The Company did not recognize any deferred tax assets as at December 31, 2012 and2011 as the management believes that it cannot realize the tax benefits from itsdeductible temporary differences in the foreseeable future. The details of deferredtax assets that were not recognized by the Company are disclosed in Note 15.
(e) Impairment of Non-financial Assets
Except for trademarks with indefinite useful lives which are reviewed forimpairment annually or regularly, PFRS requires that an impairment review beperformed when certain impairment indicators are present. The Company’s policyon estimating the impairment of non-financial assets is discussed in detail inNote 2.13. Though management believes that the assumptions used in theestimation of fair values reflected in the financial statements are appropriate andreasonable, significant changes in these assumptions may materially affect theassessment of recoverable values and any resulting impairment loss could have amaterial adverse effect on the results of operations.
No impairment loss on non-financial assets was recognized both in 2012 and 2011.
F-398

7/21/2019 PreliminaryProspectus - Century
http://slidepdf.com/reader/full/preliminaryprospectus-century 632/648
- 16 -
(f)
Valuation of Post-employment Defined Benefit
The determination of the Company’s obligation and cost of post-employmentdefined benefit are dependent on the selection of certain assumptions used byactuaries in calculating such amounts. Those assumptions are described inNote 14.2 and include, among others, discount rates, expected return on plan assets,
salary increase rate and employee turnover. In accordance with PFRS, actual resultsthat differ from the assumptions are accumulated and amortized over future periodsand therefore, generally affect the recognized expense and recorded obligation insuch future periods.
The amount of retirement benefit asset and expense and an analysis of themovements in the estimated present value of retirement benefit asset are presentedin Note 14.2.
4. RISK MANAGEMENT OBJECTIVES AND POLICIES
The Company is exposed to certain financial risks in relation to financial instruments. The Company’s financial assets and liabilities by category are summarized in Note 19. The main types of risks are market risk, credit risk and liquidity risk.
The Company’s risk management is coordinated with its Board of Directors, and focuseson actively securing the Company’s short to medium-term cash flows by minimizing theexposure to financial markets.
The Company does not engage in the trading of financial assets for speculative purposesnor does it write options. The most significant financial risks to which the Company isexposed to are described below.
4.1 Credit Risk
Credit risk is the risk that a counterparty may fail to discharge an obligation to theCompany. The Company is exposed to this risk for various financial instruments, forexample by granting loans and receivables to customers and placing deposits.
The Company continuously monitors defaults of customers and other counterparties,identified either individually or by group, and incorporate this information into its creditrisk controls. The Company’s policy is to deal only with creditworthy counterparties. Inaddition, for a significant portion of sales, advance payments are received to mitigatecredit risk.
Generally, the maximum credit risk exposure of financial assets is the carrying amount of
the financial assets as shown on the statements of financial position (or in detailedanalysis provided in the notes to the financial statements), as summarized below.
Notes 2012 2011
Cash and cash equivalents 5 P 36,933,115 P 25,373,381 Trade and other
receivables – net 6 254,367,946 211,381,610Security deposits 10 1,780,295 1,780,295
P 293,081,356 P 238,535,286
F-399

7/21/2019 PreliminaryProspectus - Century
http://slidepdf.com/reader/full/preliminaryprospectus-century 633/648
- 17 -
(a) Cash and Cash Equivalents
The credit risk for cash and cash equivalents is considered negligible, since thecounterparties are reputable banks with high quality external credit ratings. Included inthe cash and cash equivalents are cash in banks and short-term placements. As part ofCompany policy, bank deposits are only maintained with reputable financial institutions.
Cash in banks which are insured by the Philippine Deposit Insurance Corporation(PDIC) up to a maximum coverage of P500,000 per depositor per banking institution, asprovided for under Republic Act (RA) No. 9576, Charter of PDIC , are still subject to creditrisk.
(b) Trade and Other Receivables
In respect of trade and other receivables, the Company is not exposed to any significantcredit risk exposure to any single counterparty or any group of counterparties havingsimilar characteristics. Trade receivables consist of a large number of customers in
various industries and geographical areas. Based on historical information aboutcustomer default rates management consider the credit quality of trade receivables that
are not past due or impaired to be good.
Some of the unimpaired trade receivables are past due as at the end of the reportingperiod. Trade receivables that are past due but not impaired are as follows:
2012 2011
Not more than three months P 48,647,741 P 33,623,543More than three months but not more
than six months 24,223,084 6,990,171
P 72,870,825 P 40,613,714
4.2 Liquidity Risk
The Company manages its liquidity needs by carefully monitoring scheduled debtservicing payments for long-term financial liabilities as well as cash outflows due inday-to-day business. Liquidity needs are monitored in various time bands, on aday-to-day and week-to-week basis, as well as on the basis of a rolling 30-day projection.Long-term liquidity needs for a 6-month and one-year period are identified monthly.
The Company maintains cash to meet its liquidity requirements for up to 60-day periods.Funding for long-term liquidity needs is additionally secured by an adequate amount ofcommitted credit facilities and the ability to sell long-term financial assets.
In 2012 and 2011, the Company’s financial liabilities have contractual maturities withinsix months.
F-400

7/21/2019 PreliminaryProspectus - Century
http://slidepdf.com/reader/full/preliminaryprospectus-century 634/648
- 18 -
5. CASH AND CASH EQUIVALENTS
The breakdown of this account as of December 31 follows:
2012 2011
Cash in banks P 35,381,811 P 24,961,420Cash on hand 508,800 411,961Short-term placements 1,042,504 -
P 36,933,115 P 25,373,381
Cash in banks generally earn interest at rates based on daily bank deposit rates.Short-term placements are made for varying periods of between 30 to 90 days and earneffective interest ranging from 1.63% to 2.25% for both years. There was noshort-term placement as at December 31, 2011. Interest income earned amounting toP165,794 and P139,218 in 2012 and 2011, respectively and presented as part of FinanceCosts - net in the statements of comprehensive income (see Note 13).
6. TRADE AND OTHER RECEIVABLES
This account (see also Note 4.1) is composed of the following:
2012 2011
Trade receivables P 252,608,378 P 217,449,658Others 5,626,142 2,883,290
258,234,520 220,332,948 Allowance for impairment ( 6,853,755 ) ( 6,340,995 )
P 251,380,765 P 213,991,953
Trade receivables are usually due within 30 to 90 days and do not bear any interest.
The Company’s trade and other receivables, which are subject to credit risk exposure(see Note 4.1), have been reviewed for indicators of impairment. Certain tradereceivables were identified to be impaired; hence, adequate amount of allowance forimpairment has been recorded.
A reconciliation of the allowance for impairment at the beginning and end of 2012 and2011 is shown below.
Note 2012 2011
Balance at beginning of year P 6,340,995 P 6,021,126Impairment loss during the year 12 512,760 319,869
Balance at end of year P 6,853,755 P 6,340,995
Due to their short duration, the net carrying amounts of trade and other receivables is areasonable approximation of fair values.
F-401

7/21/2019 PreliminaryProspectus - Century
http://slidepdf.com/reader/full/preliminaryprospectus-century 635/648
- 19 -
7. INVENTORIES
All inventories at the end of 2012 and 2011 are stated at cost and are broken down asfollows:
Note 2012 2011
Finished goods 12 P 314,973,334 P 416,825,250Raw materials 12 138,937,009 135,545,967Packaging materials and
other supplies 6,073,706 7,723,178
P 459,984,049 P 560,094,395
Raw materials include items in transit amounting to P29,059,345 and P9,866,353 as atDecember 31, 2012 and 2011, respectively. The cost of inventories charged to operationsin 2012 and 2011 are analysed in Note 12.
8.
PREPAYMENTS AND OTHER CURRENT ASSETS
The composition of this account is shown below.
Note 2012 2011
Input VAT 21.1(b) P 40,180,862 P 40,794,187Prepaid taxes 24,007,117 18,462,173Others 1,064,157 1,175,977
P 65,252,136 P 60,432,337
The Company’s prepaid taxes represent taxes withheld by the Company’s customersamounting to P23,189,873 and P17,644,949 as at December 31, 2012 and 2011,respectively, and tax credit certificates issued by the Bureau of Customs (BOC)amounting to P817,244 as at December 31, 2012 and 2011.
F-402

7/21/2019 PreliminaryProspectus - Century
http://slidepdf.com/reader/full/preliminaryprospectus-century 636/648
- 20 -
9. PROPERTY, PLANT AND EQUIPMENT
The gross carrying amounts and accumulated depreciation and amortization of property,plant and equipment at the beginning and end of 2012 and 2011, are shown below.
Plant, LaboratoryMachinery and Tools and Leasehold Construction-
Equipment Equipment Improvements in-Progress Total
December 31, 2012Cost P 106,608,328 P 5,020,726 P 14,105,279 P - P 125,734,333 Accumulated
depreciationand amortization ( 86,677,856 ) ( 4,323,334 ) ( 12,677,596 ) - ( 103,678,786 )
Net carrying amount P 19,930,472 P 697,392 P 1,427,683 P - P 22,055,547
December 31, 2011Cost P 104,956,773 P 4,615,406 P 13,891,615 P - P 123,463,794 Accumulated
depreciationand amortization ( 77,093,388 ) ( 3,977,007 ) ( 10,689,222 ) - ( 91,759,617 )
Net carrying amount P 27,863,385 P 638,399 P 3,202,393 P - P 31,704,177
January 1, 2011 Cost P 91,088,979 P 4,124,558 P 11,155,442 P 17,037,594 P 123,406,573 Accumulated
depreciationand amortization ( 66,255,721 ) ( 3,668,861 ) ( 7,642,595 ) - ( 77,567,177 )
Net carrying amount P 24,833,258 P 455,697 P 3,512,847 P 17,037,594 P 45,839,396
A reconciliation of the carrying amounts of property, plant and equipment at thebeginning and end of 2012 and 2011, is presented below.
Plant, LaboratoryMachinery and Tools and Leasehold Construction-
Equipment Equipment Improvements in-Progress Total
Balance at January 1, 2012,net of accumulateddepreciation andamortization P 27,863,385 P 638,399 P 3,202,393 P - P 31,704,177
Additions 1,651,554 405,321 213,664 - 2,270,539Depreciation and
amortizationcharges for the year ( 9,584,467 ) ( 346,328 ) ( 1,988,374 ) - ( 11,919,169 )
Balance at
December 31, 2012,net of accumulateddepreciation andamortization P 19,930,472 P 697,392 P 1,427,683 P - P 22,055,547
Balance at
January 1, 2011,net of accumulateddepreciation andamortization P 24,833,258 P 455,697 P 3,512,847 P 17,037,594 P 45,839,396
Additions 57,221 - - - 57,221Reclassification 13,810,573 490,848 2,736,173 ( 17,037,594 ) -Depreciation and
amortizationcharges for the year ( 10,837,667 ) ( 308,146 ) ( 3,046,627 ) - ( 14,192,440 )
Balance at
December 31, 2011,net of accumulateddepreciation andamortization P 27,863,385 P 638,399 P 3,202,393 P - P 31,704,177
F-403

7/21/2019 PreliminaryProspectus - Century
http://slidepdf.com/reader/full/preliminaryprospectus-century 637/648
- 21 -
In 2011, certain assets amounting to P17,037,594 were completed and, accordingly,reclassified to their appropriate classification within the Property, Plant and Equipmentaccount.
The cost of fully depreciated property, plant and equipment as at December 31, 2012 and2011 which are still being used in operations amounts to P46,505,687 and P34,513,265,
respectively.
The depreciation and amortization for the year is allocated as follows:
Note 2012 2011
Cost of goods sold P 11,345,333 P 12,636,367 Administrative expenses 573,835 1,556,073
12 P 11,919,168 P 14,192,440
10.
OTHER NON-CURRENT ASSETS
This account consists of:
Note 2012 2011
Trademarks 3.1(a) P 40,000,000 P 40,000,000Security deposits 1,780,295 1,780,295Returnable containers 1,104,000 655,000
P 42,884,295 P 42,435,295
In July 2008, the Company purchased from General Milling Corporation (GMC) certaintrademarks owned and registered with the Intellectual Property Office under the name ofGMC. As discussed in Note 3.1(a), the Company’s trademarks are subject to annualimpairment testing. No impairment losses were recognized in 2012 and 2011 as therecoverable amounts of the trademarks were determined to be higher than their carrying
values.
Security deposits pertain to deposits required under the terms of the lease agreements ofthe Company with certain lessors (see Note 18.1). The carrying amount of these depositsis a reasonable approximation of its fair value based on management assessment as atDecember 31, 2012 and 2011.
11.
TRADE AND OTHER PAYABLES
The composition of this account is shown below.
Note 2012 2011
Trade payables P 330,953,655 P 312,873,691 Accrued expenses 35,881 2,057,667Others 17.1 3,293,313 2,985,809
P 334,282,849 P 317,917,167
F-404

7/21/2019 PreliminaryProspectus - Century
http://slidepdf.com/reader/full/preliminaryprospectus-century 638/648
- 22 -
Due to the short duration of trade and other payables, management considers the carryingamounts to be a reasonable approximation of fair values.
12.
COSTS AND EXPENSES BY NATURE
The details of costs and expenses by nature are shown below.
Notes 2012 2011
Milk and ingredients P 821,975,535 P 721,790,335Packaging and other materials 380,053,910 240,054,709 Advertisements 116,893,508 64,317,897Changes in inventories of
finished goods 7 101,851,916 47,779,399 Forwarding and other
warehousing fees 55,231,107 35,247,175Outside services 17.2 49,546,397 40,106,072Freight 44,342,447 30,783,423
Merchandisers’ salary 32,607,195 28,526,805Communication, light and water 20,972,321 12,742,850
Salaries and employee benefits 14 13,945,384 12,357,164Gas, fuel and oil 12,837,058 70,133Depreciation and amortization 9 11,919,168 14,192,440Rentals 17.1, 18.1 11,031,433 10,914,244 Taxes and licenses 21.1(f) 6,897,574 6,124,444Supplies 6,213,439 178,326Repairs and maintenance 1,960,399 1,259,265Impairment loss
on trade receivables 6 512,760 319,869Miscellaneous 4,940,981 1,480,136
P 1,693,732,532 P 1,268,244,686
These expenses are classified in the statements of comprehensive income as follows:
2012 2011
Cost of goods sold P 1,419,592,252 P 1,088,308,409Selling expenses 131,551,269 94,115,732Marketing expenses 119,270,662 64,472,398 Administrative expenses 23,318,349 21,348,147
P 1,693,732,532 P 1,268,244,686
F-405

7/21/2019 PreliminaryProspectus - Century
http://slidepdf.com/reader/full/preliminaryprospectus-century 639/648
- 23 -
Cost of goods sold for the years ended December 31, 2012 and 2011 consist of thefollowing:
Notes 2012 2011
Raw materials used:Raw materials at beginning
of year 7 P 135,545,967 P 348,324,445Net purchases during the year 1,205,420,487 749,066,566Raw materials at end
of year 7 ( 138,937,009) ( 135,545,967 )1,202,029,445 961,845,044
Direct labor 14 1,000,537 751,657
Manufacturing overhead:Outside services 39,432,092 31,954,958Communication, light
and water 20,877,595 12,599,068Depreciation and
amortization 9 11,345,333 12,636,367Rentals 17.1, 18.1 11,024,845 10,906,609Indirect labor 14 8,230,077 6,692,786Repairs and maintenance 1,953,615 1,157,785Supplies 6,171,109 135,809Gas, fuel and oil 12,834,545 44,209
Others 2,841,143 1,804,718 114,710,354 77,932,309
Total cost of goods manufactured 1,317,740,336 1,040,529,010
Finished goods at beginningof year 7 416,825,250 464,604,649
Finished goods at end of year 7 ( 314,973,334) ( 416,825,250)
P 1,419,592,252 P 1,088,308,409
13. FINANCE COSTS (INCOME)
The details of Finance Costs (Income) are presented below.
Note 2012 2011
Finance income 5 (P 187,370) (P 158,321 )Finance costs 124,025 261,567
Other finance charges 145,422 233,998
P 82,077 P 337,244
F-406

7/21/2019 PreliminaryProspectus - Century
http://slidepdf.com/reader/full/preliminaryprospectus-century 640/648
- 24 -
14. EMPLOYEE BENEFITS
14.1 Employee Benefits Expense
Expenses recognized for salaries and employee benefits are presented below(see Note 12).
2012 2011
Short-term benefits P 13,557,311 P 11,830,280Post-employment benefits 388,073 526,884
P 13,945,384 P 12,357,164
The amount of employee benefits expense is allocated as follows:
Note 2012 2011
Cost of goods sold 12 P 9,230,614 P 7,444,443 Administrative expenses 12 4,714,770 4,912,721
P 13,945,384 P 12,357,164
14.2 Post-employment Benefits
The Company maintains a partially funded, tax qualified, noncontributory post-employmentbenefit plan that is being administered by a trustee bank covering all regular full-timeemployees.
The amount of retirement benefit asset recognized in the statements of financial positionis determined as follows:
2012 2011
Present value of the obligation P 3,379,996 P 2,802,558Fair value of plan assets ( 2,850,863 ) ( 2,149,434 )Unfunded obligation 529,133 653,124Unrecognized actuarial losses ( 1,137,657 ) ( 1,137,657 )
(P 608,524 ) (P 484,533 )
The movement in the present value of the retirement benefit obligation is as follows:
2012 2011
Balance at beginning of year P 2,802,558 P 2,260,245 Current service and interest costs 577,438 620,721Benefits paid - ( 475,028 )
Actuarial loss - 396,620
Balance at end of year P 3,379,996 P 2,802,558
F-407

7/21/2019 PreliminaryProspectus - Century
http://slidepdf.com/reader/full/preliminaryprospectus-century 641/648
- 25 -
The movement in the fair value of plan assets is presented below.
2012 2011
Balance at beginning of year P 2,149,434 P 1,872,842Contributions paid into the plan 512,064 752,672
Benefits paid - ( 475,028 ) Actuarial loss - ( 111,694 )Expected return on plan assets 189,365 110,642
P 2,850,863 P 2,149,434
Actual return (loss) on plan assets were P189,365 in 2012 and (P1,052) in 2011.
As at December 31, 2012, the Company has no definite plan of funding its retirementbenefit plan in 2013.
The major categories of plan assets as a percentage of the fair value of total plan assetsare as follows:
2012 2011
Cash 10.59% 8.34%Government securities 60.62% 46.30%Debt instruments 19.65% 35.73%Others 9.14% 9.63%
Presented below are the historical information related to the present value of theretirement benefit obligation, fair value of plan assets and excess or deficit in the plan.
2012 2011 2010 2009 2008
Present value of the obligation P 3,379,996 P 2,802,558 P 2,260,245 P 1,907,108 P1,253,261Fair value of plan assets 2,850,863 2,149,434 1,872,842 996,681 487,564
Deficit in the plan (P 529,133)( P 653,124 ) ( P 387,403 ) (P 910,427) ( P 765,697)
Experience adjustmentsarising on plan liabilities P - ( P 449,976 ) P - (P 851,376) P -
Experience adjustmentsarising on plan assets P - ( P 111,694 ) P - (P 17,673 ) P -
The amounts of post-employment benefits expense recognized in the statements ofcomprehensive income are as follows:
2012 2011
Current service costs P 419,881 P 411,648Interest costs 157,557 209,073Expected return on plan assets ( 189,365) ( 110,642)Net actuarial loss recognized in the year - 16,805
P 388,073 P 526,884
F-408

7/21/2019 PreliminaryProspectus - Century
http://slidepdf.com/reader/full/preliminaryprospectus-century 642/648
- 26 -
The amounts of post-retirement benefits expense are allocated as follows:
2012 2011
Cost of goods sold P 335,103 P 405,190 Administrative expenses 52,970 121,694
P 388,073 P 526,884
For the determination of the present value of retirement benefit obligation, fair value ofplan assets and related expense, the following actuarial obligation were used:
2012 2011
Expected rate of return on plan assets 8.81% 9.25%Expected rate of salary increases 2.00% 2.00%Discount rates 5.62% 5.50%
Assumptions regarding future mortality are based on published statistics and mortalitytables. The average remaining working life of an individual, male and female, retiring atthe age of 60 is 25 years.
15. CURRENT AND DEFERRED TAXES
The components of tax expense (all are current) as reported in profit or loss are as follows:
2012 2011
Regular corporate income tax(RCIT) at 30% P 7,341,848 P 3,723,053
Excess of minimum corporateincome tax (MCIT) at 2%over RCIT - 133,950
Final tax at 20% and 7.5% 33,159 27,844
P 7,375,007 P 3,884,847
A reconciliation of tax on pretax profit computed at the applicable statutory rates to taxexpense reported in the statements of comprehensive income is presented below.
2012 2011
Tax on pretax profit at 30% P 8,005,374 P 3,657,947
Adjustment for income subjected tolower income tax rates ( 16,579 ) ( 13,922)
Tax effects of: Application of previously
unrecognized DTA on MCIT ( 740,840 ) -Unrecognized deductible
temporary difference 110,638 82,450Non-deductible expenses 16,414 24,422Unrecognized DTA on MCIT - 133,950
Tax expense P 7,375,007 P 3,884,847
F-409

7/21/2019 PreliminaryProspectus - Century
http://slidepdf.com/reader/full/preliminaryprospectus-century 643/648
- 27 -
The Company did not recognize net deferred tax assets totalling to P2,133,825 andP2,764,027 as at December 31, 2012 and 2011, respectively, since their recoverability andutilization is unlikely at this time based on the assessment of management. The netdeferred tax assets not recognized as at December 31, 2012 and 2011 pertain to thefollowing:
2012 2011 Amount Tax Effect Amount Tax Effect
Allowance for impairment loss P 6,853,755 P 2,056,127 P 6,340,995 P 1,902,299Unamortized past service cost 891,788 267,537 928,294 278,489MCIT - - 740,840 740,840 Retirement benefit assets ( 608,524 ) ( 182,557 ) ( 484,533 ) ( 145,360 )Unrealized foreign
currency gain ( 24,272 ) ( 7,282 ) ( 40,803 ) ( 12,241 )
P 7,112,747 P 2,133,825 P 7,484,793 P 2,764,027
The Company is subject to MCIT which is computed at 2% of gross income, as definedunder tax regulations, or RCIT, whichever is higher. In 2012, RCIT was higher than
MCIT while MCIT was higher in 2011.
As at December 31, 2012, the Company has fully utilized its MCIT amounting toP740,840 which represents that total of MCIT incurred in 2011 (P133,950) and 2010(P606,890).
In 2012 and 2011, the Company opted to claim itemized deductions in computing for itsincome tax due.
16. EQUITY
16.1 Capital Stock
Capital stock consists of common shares with details as follows:
Shares Amount
2012 2011 2012 2011
Authorized – P10 par value 5,000,000 5,000,000
Issued and outstanding:
Balance at beginning of year 4,062,500 312,500 P 40,625,000 P 3,125,000
Issuances during the year - 3,750,000 - 37,500,000Balance at end of year 4,062,500 4,062,500 40,625,000 40,625,000
Subscribed:
Balance at beginning of year 937,500 937,500 9,375,000 9,375,000
Subscription during the year 3,750,000 - 37,500,000
Issuances during the year - ( 3,750,000 ) - ( 37,500,000 ) Balance at end of year 937,500 937,500 9,375,000 9,375,000
Subscription receivable ( 9,375,000)( 9,375,000 )
P 40,625,000 P 40,625,000
As at December 31, 2012 and 2011, the Company has three stockholders owning 100 ormore shares each of the Company’s capital stock.
F-410

7/21/2019 PreliminaryProspectus - Century
http://slidepdf.com/reader/full/preliminaryprospectus-century 644/648
- 28 -
16.2 Deposits on Future Stock Subscriptions
On October 18, 2012, the Company filed an application with the SEC for its proposedincrease in authorized capital stock from P50.0 million divided into 5,000,000 toP500.0 million divided into 50,000,000 shares with the same value per share of P10. This
was previously approved by the Company’s BOD on December 6, 2011. In compliance
with the SEC’s rules relating to the foregoing, the Company applied a portion of theparent company’s advances to the Company amounting to P45,500,000 and the parentcompany’s previously recognized Deposits for Future Stock Subscriptions amounting toP150,383,200 as subscription payments. As at December 31, 2012, approval of theapplication is still pending with the SEC. Accordingly, the subscription payments werepresented as Deposits for Future Stock Subscriptions in the statements of financialposition.
In December 2011, the Company issued 3,750,000 shares to a stockholder by applyingdeposits on future stock subscription amounting to P37,500,000 on the subscription price
which equals the par value of the shares, hence, no additional paid-in-capital wasrecognized.
17. RELATED PARTY TRANSACTIONS
A summary of the Company’s related party transactions is presented below.
2012 2011Outstanding Outstanding
Amount of Receivable Amount of Receivable Note Transactions (Payable) Transactions (Payable)
Parent:Sale of goods 17.1 P 127,866,796 P 7,044,926 P - P -Consultancy and
management fees 17.3 7,279,445 ( 2,556,101) 5,088,473 -
Advances 17.2 127,929,279 ( 278,872,672) 290,895,948 ( 406,801,951)Rentals 17.4 1,547,100 ( 3,456,221) 1,986,476 ( 1,986,476)
Related Parties UnderCommon Ownership –
Advances 17.2 8,663,615 - ( 8,663,615) ( 8,663,615)
Key Management PersonnelCompensation 17.5 2,958,888 - 2,748,221 -
17.1 Sale of Goods
In 2012, the Company sold P127,866,796 (nil in 2011) worth of finished goodsinventories to CCC included in Sale of Goods in the 2012 statement of comprehensive
income. Outstanding balance in relation to the sale of goods as at December 31, 2012amounts to P7.0 million and is shown as part of Trade Receivables under Trade andOther Receivables account in the 2012 statement of financial position.
F-411

7/21/2019 PreliminaryProspectus - Century
http://slidepdf.com/reader/full/preliminaryprospectus-century 645/648
- 29 -
17.2 Advances from Related Parties
In the normal course of business, the Company obtains unsecured, noninterest-bearingadvances from related parties, including stockholders and entities under commonownership, for working capital requirements and other purposes. Such advances arepresented as Due to Related Parties in the statements of financial position and has an
outstanding balance of P278,872,672 and P415,465,566 as at December 31, 2012 and2011, respectively. Presented below are the movements in the account.
Note 2012 2011
Balance at beginning of year P 415,465,566 P 697,697,899Repayments during the year ( 91,092,394) ( 724,743,133)
Applied as deposits for futurestock subscription 16 ( 45,500,000) -
Additional borrowingsduring the year - 442,510,800
Balance at end of year P 278,872,672 P 415,465,566
17.3 Consultancy and Management Fees
The Company incurs management and consultancy fees based on an agreement betweenCCC and the Company. Under the agreement, CCC can allocate and charge commoncorporate expenses to its subsidiaries. The consultancy and management fees incurredand paid by the Company amounted to P7,279,445 in 2012 and P5,088,473 in 2011 and ispresented as part of Outside Services under Administrative Expenses in the statements ofcomprehensive income (see Note 12). As at December 31, 2012 and 2011, the Companyhas no outstanding liability arising from this agreement.
17.4 Rentals
In 2012 and 2011, CCC leased out storage and production facilities to the Company.Rental expense incurred amounting to P1,547,100 in 2012 and P1,986,476 in 2011 ispresented as part of Rentals under Cost of Goods Sold in the statements ofcomprehensive income. The outstanding payables amounting to P3,456,221 andP1,986,476 as at December 31, 2012 and 2011, respectively, arising from thesetransactions are shown as part of Trade Payables under Trade and Other Payables(see Note 11).
17.5 Key Management Personnel Compensations
The short-term employee benefits of the key management personnel amounted toP2,958,888 in 2012 and P2,748,221 in 2011, and are included in the salaries and employeebenefits presented as part of Administrative expenses in the statements of comprehensiveincome (see Note 12).
F-412

7/21/2019 PreliminaryProspectus - Century
http://slidepdf.com/reader/full/preliminaryprospectus-century 646/648
- 30 -
18. COMMITMENTS AND CONTINGENCIES
The following are the significant commitments and contingencies involving theCompany.
18.1 Operating Leases
The Company is a lessee under several short-term lease contracts with renewal options. The usual term of the lease contract is one year that usually ends in December. Theamount of rent expense is allocated as follows:
Note 2012 2011
Cost of goods sold 12 P 11,024,845 P 10,906,609 Administrative expenses 6,588 7,635
P 11,031,433 P 10,914,244
As of December 31, 2012, the future minimum lease payments under these lease
agreements amounted to P7,052,625.
18.2 Credit Facilities
The Company has continuing surety with related parties on several credit facilities with various local banks amounting to P250,000,000. These credit facilities will expire in 2013.
18.3 Others
There are other commitments, guarantees, litigations and contingent liabilities that arise inthe normal course of the Company’s operations which are not reflected in theaccompanying financial statements. As at December 31, 2012, management is of the
opinion that losses, if any, from these commitments and contingencies will not have amaterial effect on the Company’s financial statements.
19. CATEGORIES AND FAIR VALUES OF FINANCIAL ASSETS ANDLIABILITIES
The carrying amounts and fair values of the categories of assets and liabilities presented inthe statements of financial position are shown below.
Notes 2012 2011
Carrying Values Fair Values Carrying Values Fair Values
Financial assetsCash and cash equivalents 5 P 36,933,115 P 36,933,115 P 25,373,381 P 25,373,381
Trade and other receivables – net 6 254,367,946 254,367,946 211,381,610 211,381,610
Security deposits 10 1,780,295 1,780,295 1,780,295 1,780,295
P 293,081,356 P 293,081,356 P 238,535,286 P 238,535,286
Financial Liabilities
Trade and other payables P 334,282,849 P 334,282,849 P 317,917,167 P 317,917,167
Due to related parties 17 278,872,672 278,872,672 415,465,566 415,465,566
P 613,155,521 P 613,155,521 P 733,382,733 P 733,382,733
F-413

7/21/2019 PreliminaryProspectus - Century
http://slidepdf.com/reader/full/preliminaryprospectus-century 647/648
- 31 -
See Notes 2.3 and 2.8 for a description of the accounting policies for each category offinancial instrument. A description of the Company’s risk management objectives andpolicies for financial instruments is provided in Note 4.
There is no disclosure of fair value hierarchy as the Company does not have anyfinancial instruments valued at fair value in the statements of financial position as at
December 31, 2012 and 2011.
20. CAPITAL MANAGEMENT OBJECTIVES, POLICIES AND PROCEDURES
The Company’s capital management objectives are:
• To ensure the Company’s ability to continue as a going concern; and,
• To provide an adequate return to shareholders by pricing products and servicescommensurately with the level of risk.
The Company monitors capital on the basis of the carrying amount of equity as presentedin the statements of financial position. Capital for the reporting periods under review issummarized as follows:
2012 2011
Total liabilities P 613,155,521 P 733,382,733 Total equity 265,942,910 201,133,338
Debt-to-equity ratio 2.31:1 3.65:1
The Company sets the amount of capital in proportion to its overall financing structure,i.e., equity and liabilities. The Company manages the capital structure and makesadjustments to it in the light of changes in economic conditions and the riskcharacteristics of the underlying assets.
21. SUPPLEMENTARY INFORMATION REQUIRED BY THE BUREAU OFINTERNAL REVENUE
Presented in the succeeding pages is the supplementary information which is required bythe BIR under its existing revenue regulations to be disclosed as part of the notes tofinancial statements. This supplementary information is not a required disclosure underPFRS.
F-414

7/21/2019 PreliminaryProspectus - Century
http://slidepdf.com/reader/full/preliminaryprospectus-century 648/648
- 32 -
21.1 Requirements under Revenue Regulations (RR) 15-2010
The information on taxes, duties and license fees paid or accrued during the taxableyear required under RR 15-2010 issued on November 25, 2010 follows:
(a) Output VAT
In 2012, the Company declared output VAT on the sale of goods as follows:
OutputTax Base VAT
Taxable sales P 1,715,808,460 P 205,897,015Zero-rated sales 3,907,898 -Government related sales 654,216 78,506
P1,720,370,574 P 205,975,521
The Company’s VAT zero-rated sales/receipt were determined pursuant to Section106(A)(2)(a), Zero-rated VAT on Export Sale of Goods , and Section 109, VAT ExemptTransactions , of the 1997 National Internal Revenue Code.
The tax bases are presented as Sale of Goods in the 2012 statement ofcomprehensive income.
There is no outstanding output VAT payable as of December 31, 2012.
(b)
Input VAT
The movements in input VAT, which is presented as part of the Prepayments andOther Current Assets account (see Note 8), in 2012 are summarized below.
Balance at beginning of year P 40,794,187Goods for resale/manufacture
or further processing 77,249,604Services lodged under other accounts 29,,906,819Services lodged under cost of goods sold 10,241,643Goods other than for resale
or manufacture 2,359,409Capital goods not subject to amortization 197,009Claims for tax credit/refund
and other adjustments 896,987Input tax on imported goods 84,432,219
Applied against output VAT ( 205,897,015 )
Balance at end of year P 40,180,862
(c)
Taxes on Importation
In 2012, the total landed cost of the Company’s imported inventory for use inbusiness amounted to P704,256,038. This amount includes customs duties and tarifffees of P9,770,978.
F-415