Embed Size (px)
Citation preview
8/6/2019 Preliminary water utility report
http://slidepdf.com/reader/full/preliminary-water-utility-report 1/24
Copyright © GHD 2011
Thomas Keown, P.E., GHD
Katy Isaksen, KI &A
Gary Bourne, P.E., BHC
18 May 2011
Water Utility Business Advisor:
Preliminary Findings Workshop
8/6/2019 Preliminary water utility report
http://slidepdf.com/reader/full/preliminary-water-utility-report 2/24
Agenda
�� IntroductionsIntroductions
�� Process OverviewProcess Overview
�� Initial FindingsInitial Findings
�� Q+ AQ+ A
Copyright © GHD 2011
8/6/2019 Preliminary water utility report
http://slidepdf.com/reader/full/preliminary-water-utility-report 3/24
Water Utility Review
��
February 2011February 2011 -- GHD Team selected to assist withGHD Team selected to assist withassessment of Water Utility management optionsassessment of Water Utility management options
�� March 2011March 2011 -- Project KickProject Kick--off and begin data collectionoff and begin data collection
�� April to May 2011 April to May 2011 -- Initial Analysis and interviews of Initial Analysis and interviews of interested 3interested 3rdrd parties:parties: ± ± City staff (COBI)City staff (COBI)
± ± Kitsap Public Utility District (KPUD)Kitsap Public Utility District (KPUD)
± ± Washington Water Service Company (WWSC)Washington Water Service Company (WWSC)
�� May 2011May 2011 ± ± Developed draft assessment of Developed draft assessment of management optionsmanagement options
Copyright © GHD 2011
8/6/2019 Preliminary water utility report
http://slidepdf.com/reader/full/preliminary-water-utility-report 4/24
Issues To Be Assessed
�� OperationalOperational ± ± Levels of Service ImpactsLevels of Service Impacts
± ± Future Capital PlanningFuture Capital Planning
�� FinancialFinancial ± ± Valuation of Water UtilityValuation of Water Utility
± ± Evaluate Level of Monthly RatesEvaluate Level of Monthly Rates
± ± Impacts to Utility and General Fund (i.e. stranded costs)Impacts to Utility and General Fund (i.e. stranded costs)
± ± Existing Debt/Bonding IssuesExisting Debt/Bonding Issues
± ± Utility Tax Revenue ImpactUtility Tax Revenue Impact
�� StrategicStrategic ± ± Management of Growth and Water ResourcesManagement of Growth and Water Resources
± ± Franchise AgreementsFranchise Agreements
± ± Public vs. PrivatePublic vs. Private
Copyright © GHD 2011
8/6/2019 Preliminary water utility report
http://slidepdf.com/reader/full/preliminary-water-utility-report 5/24
Benchmark Criteria Overview
�� Industry StandardsIndustry Standards ± ± Key Performance IndicatorsKey Performance Indicators�� Level of Service (LOS) Criteria and BenchmarksLevel of Service (LOS) Criteria and Benchmarks
Cover:Cover:
�� Operations & MaintenanceOperations & Maintenance
�� EngineeringEngineering�� Customer ServiceCustomer Service
�� ManagementManagement
�� FinanceFinance
Copyright © GHD 2011
8/6/2019 Preliminary water utility report
http://slidepdf.com/reader/full/preliminary-water-utility-report 6/24
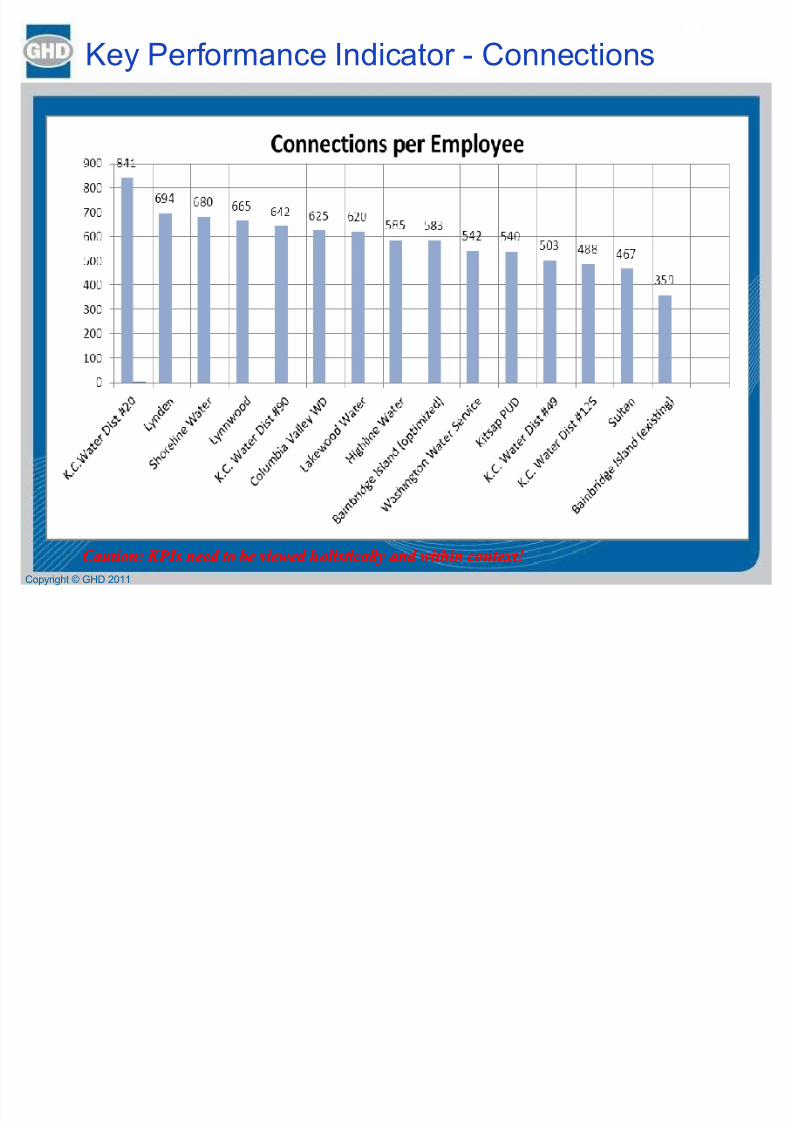
Key Performance Indicator - Connections
Copyright © GHD 2011
Caution: KPIs need to be viewed holistically and within context!Caution: KPIs need to be viewed holistically and within context!
8/6/2019 Preliminary water utility report
http://slidepdf.com/reader/full/preliminary-water-utility-report 7/24
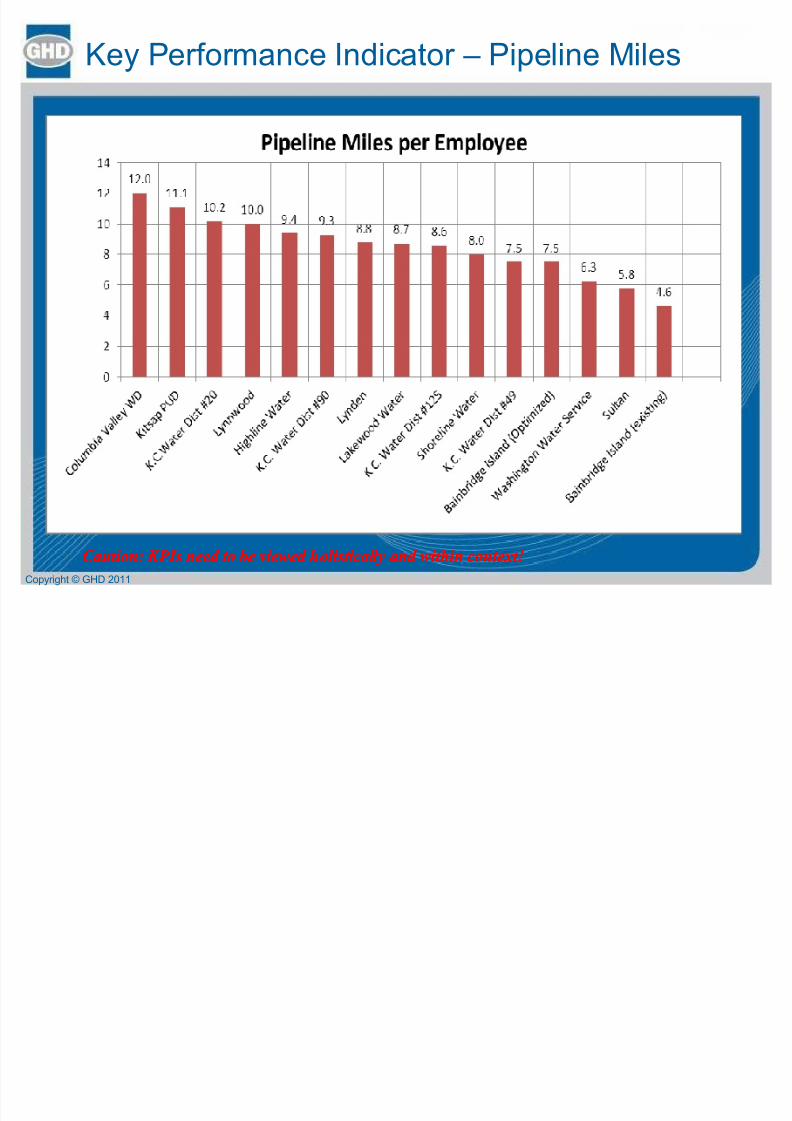
Key Performance Indicator ± Pipeline Miles
Copyright © GHD 2011
Caution: KPIs need to be viewed holistically and within context!Caution: KPIs need to be viewed holistically and within context!
8/6/2019 Preliminary water utility report
http://slidepdf.com/reader/full/preliminary-water-utility-report 8/24
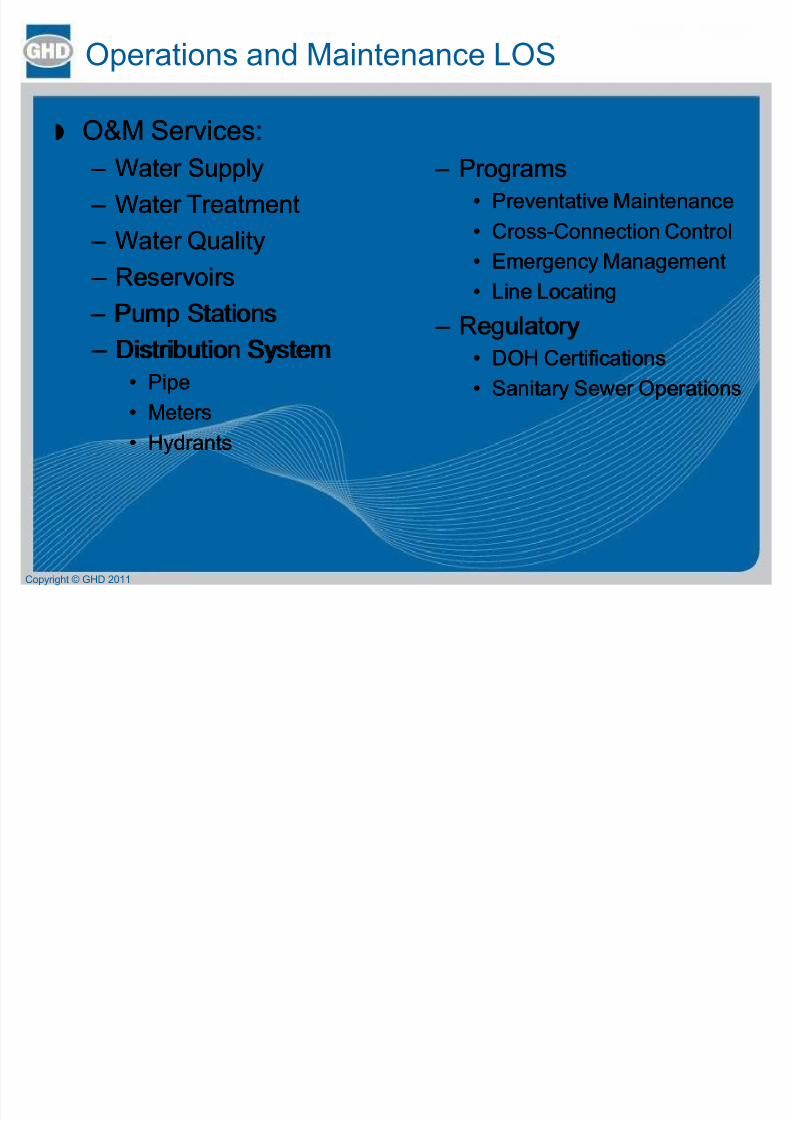
Operations and Maintenance LOS
�� O&M Services:O&M Services: ± ± Water SupplyWater Supply
± ± Water TreatmentWater Treatment
± ± Water QualityWater Quality
± ± ReservoirsReservoirs ± ± Pump StationsPump Stations
± ± Distribution SystemDistribution System
�� PipePipe
�� MetersMeters�� HydrantsHydrants
Copyright © GHD 2011
± ± ProgramsPrograms�� Preventative MaintenancePreventative Maintenance
�� CrossCross--Connection ControlConnection Control
�� Emergency ManagementEmergency Management
�� Line LocatingLine Locating
± ± RegulatoryRegulatory�� DOH CertificationsDOH Certifications
�� Sanitary Sewer OperationsSanitary Sewer Operations
8/6/2019 Preliminary water utility report
http://slidepdf.com/reader/full/preliminary-water-utility-report 9/24
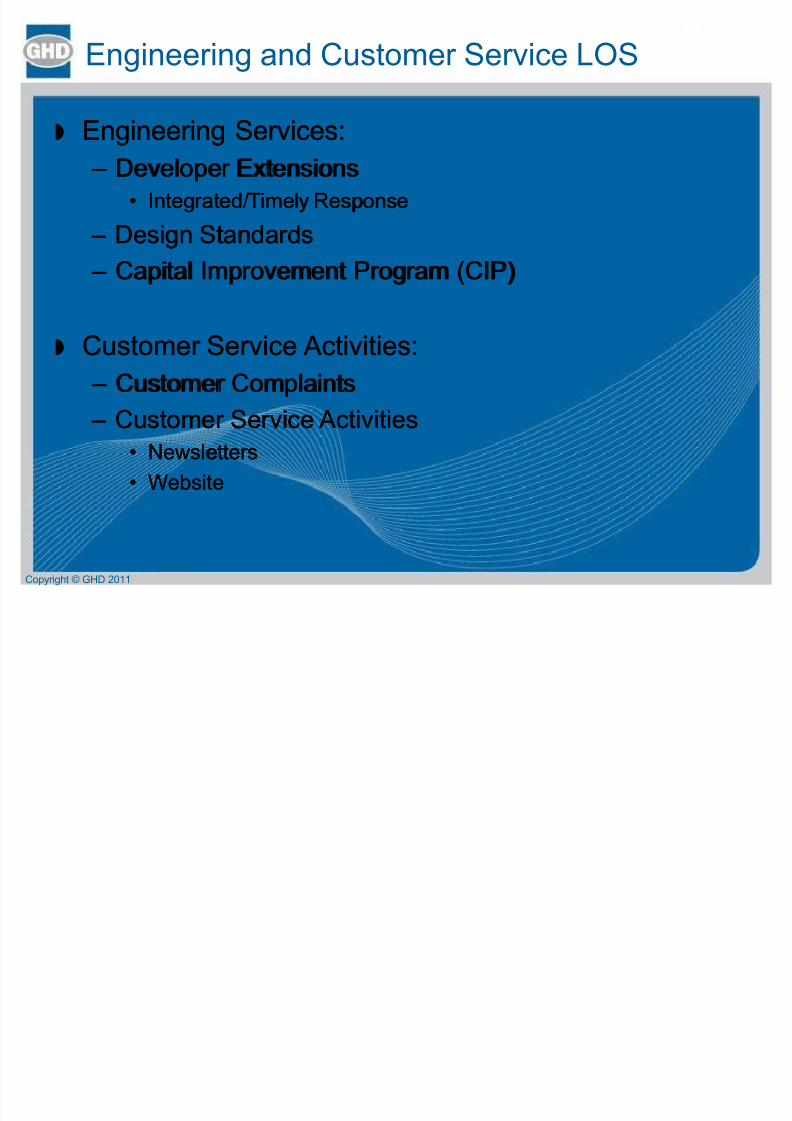
Engineering and Customer Service LOS
Copyright © GHD 2011
�� Engineering Services:Engineering Services: ± ± Developer ExtensionsDeveloper Extensions
�� Integrated/Timely ResponseIntegrated/Timely Response
± ± Design StandardsDesign Standards
± ± Capital Improvement Program (CIP)Capital Improvement Program (CIP)
�� Customer Service Activities:Customer Service Activities:
± ± Customer ComplaintsCustomer Complaints
± ± Customer Service ActivitiesCustomer Service Activities�� NewslettersNewsletters
�� WebsiteWebsite
8/6/2019 Preliminary water utility report
http://slidepdf.com/reader/full/preliminary-water-utility-report 10/24
Management and Finance LOS
�� ManagementManagement
± ± Comprehensive PlanningComprehensive Planning
�� Development ControlDevelopment Control
�� Water Resource PlanningWater Resource Planning
± ± LegalLegal
�� Authorization Authorization
�� Public vs. PrivatePublic vs. Private
�� FinanceFinance
± ± Water RatesWater Rates
�� Operations, Admin., BillingOperations, Admin., Billing
�� Debt RepaymentDebt Repayment
�� Capital / System Replacement FundingCapital / System Replacement Funding
± ± Outstanding bonds/debt with combined utilityOutstanding bonds/debt with combined utility
± ± ReservesReservesCopyright © GHD 2011
8/6/2019 Preliminary water utility report
http://slidepdf.com/reader/full/preliminary-water-utility-report 11/24
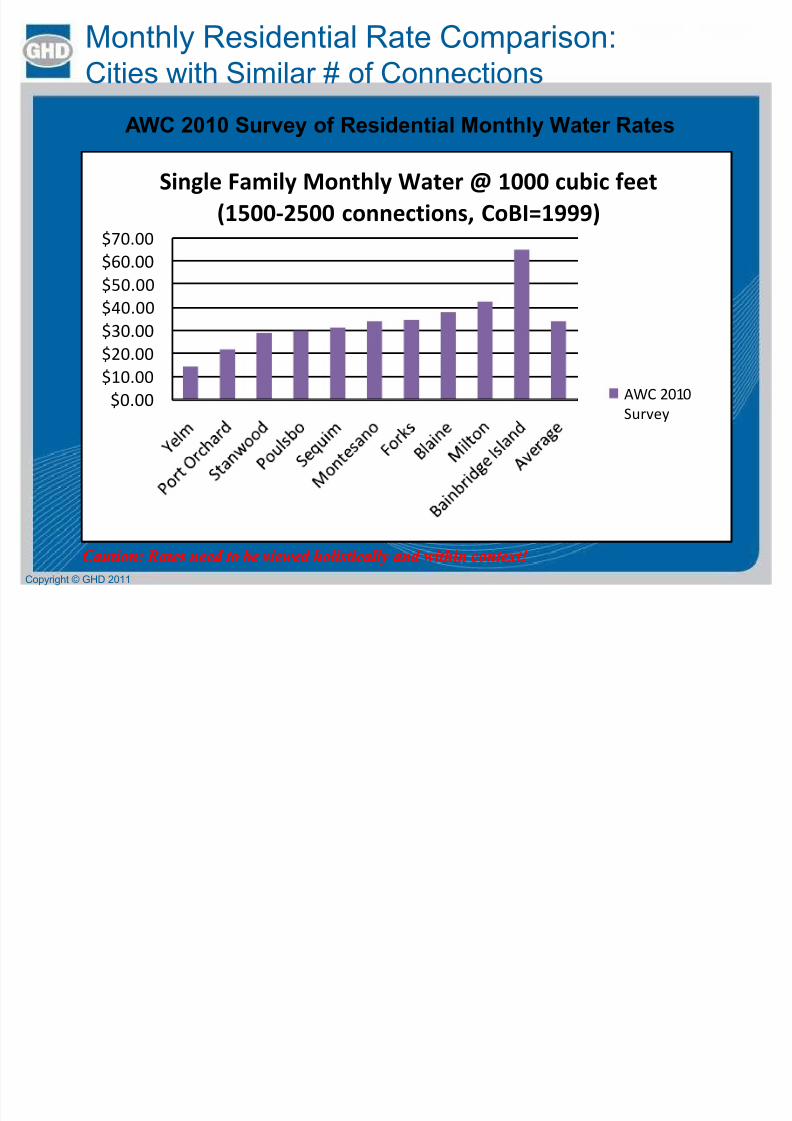
Monthly Residential Rate Comparison:Cities with Similar # of Connections
Copyright © GHD 2011
AWC 2010 Sur vey of Residential Monthly Water Rates
AWC 2010 Sur vey of Residential Monthly Water Rates
$0.00
$10.00
$20.00
$30.00
$40.00
$50.00
$60.00
$70.00
Single Family Monthly Water @ 1000 cubic feet
(1500-2500 connections, CoBI=1999)
AWC 2010
Survey
Caution: Rates need to be viewed holistically and within context!Caution: Rates need to be viewed holistically and within context!
8/6/2019 Preliminary water utility report
http://slidepdf.com/reader/full/preliminary-water-utility-report 12/24
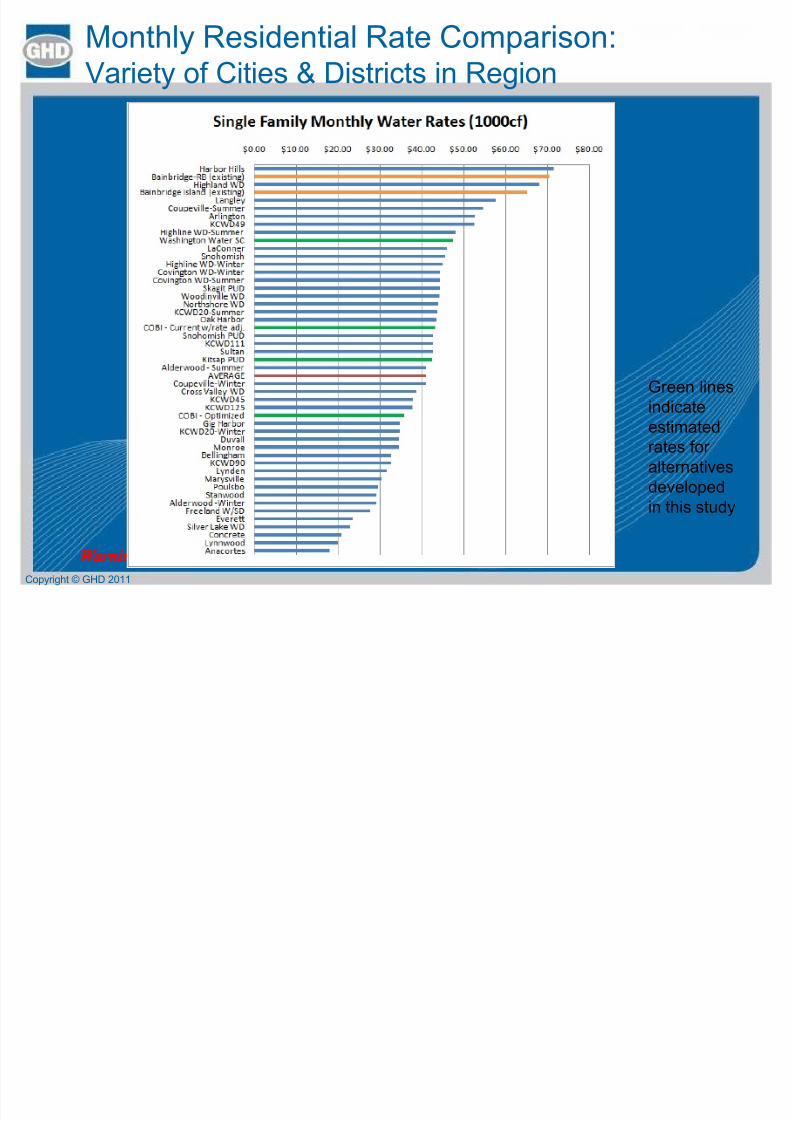
Monthly Residential Rate Comparison:Variety of Cities & Districts in Region
Copyright © GHD 2011
W arning: Rates need to be viewed holistically and within context!W arning: Rates need to be viewed holistically and within context!
Green lines
indicateestimatedrates for alternativesdevelopedin this study
8/6/2019 Preliminary water utility report
http://slidepdf.com/reader/full/preliminary-water-utility-report 13/24
Management Options to Consider
�� Management OptionsManagement Options ± ± City of Bainbridge IslandCity of Bainbridge Island
�� Current (with Rate Reduction)Current (with Rate Reduction)
�� OptimizedOptimized
�� ExpandedExpanded
± ± Kitsap Public Utility District (KPUD)Kitsap Public Utility District (KPUD)�� Management ContractManagement Contract
�� Transfer/Sell OwnershipTransfer/Sell Ownership
± ± Washington Water Service Company (WWSC)Washington Water Service Company (WWSC)
�� Management ContractManagement Contract
�� Transfer/Sell OwnershipTransfer/Sell Ownership
Copyright © GHD 2011
8/6/2019 Preliminary water utility report
http://slidepdf.com/reader/full/preliminary-water-utility-report 14/24
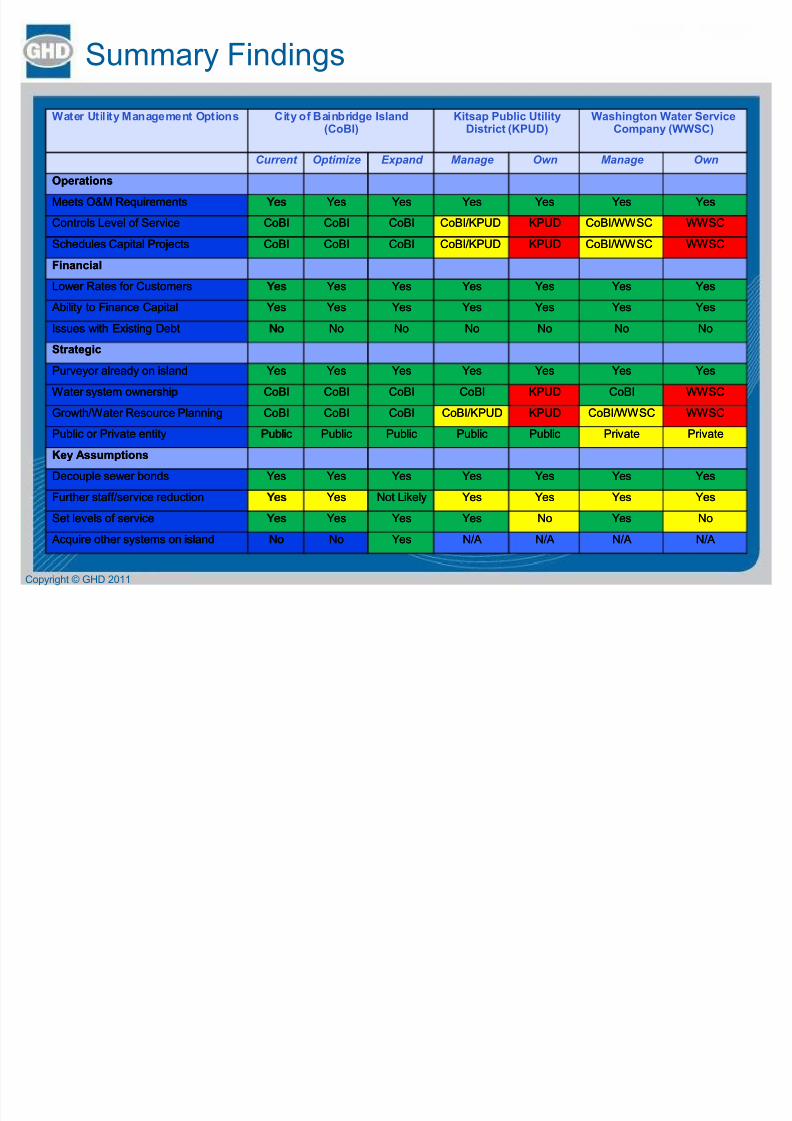
Summary Findings
Copyright © GHD 2011
Water Utility Management Options City of Bainbridge Island (CoBI)
Kitsap Public UtilityDistrict (KPUD)
Washington Water Ser viceCompany (WWSC)
Current Optimize Expand Manage Own Manage Own
OperationsOperations
Meets O&M RequirementsMeets O&M Requirements YesYes YesYes YesYes YesYes YesYes YesYes YesYes
Controls Level of ServiceControls Level of Service CoBICoBI CoBICoBI CoBICoBI CoBI/KPUDCoBI/KPUD KPUDKPUD CoBI/WWSCCoBI/WWSC WWSCWWSC
Schedules Capital ProjectsSchedules Capital Projects CoBICoBI CoBICoBI CoBICoBI CoBI/KPUDCoBI/KPUD KPUDKPUD CoBI/WWSCCoBI/WWSC WWSCWWSC
FinancialFinancial
Lower Rates for CustomersLower Rates for Customers YesYes YesYes YesYes YesYes YesYes YesYes YesYes
Ability to Finance Capital Ability to Finance Capital YesYes YesYes YesYes YesYes YesYes YesYes YesYes
Issues with Existing DebtIssues with Existing Debt NoNo NoNo NoNo NoNo NoNo NoNo NoNo
StrategicStrategic
Purveyor already on islandPurveyor already on island YesYes YesYes YesYes YesYes YesYes YesYes YesYes
Water system ownershipWater system ownership CoBICoBI CoBICoBI CoBICoBI CoBICoBI KPUDKPUD CoBICoBI WWSCWWSC
Growth/Water Resource PlanningGrowth/Water Resource Planning CoBICoBI CoBICoBI CoBICoBI CoBI/KPUDCoBI/KPUD KPUDKPUD CoBI/WWSCCoBI/WWSC WWSCWWSCPublic or Private entityPublic or Private entity PublicPublic PublicPublic PublicPublic PublicPublic PublicPublic PrivatePrivate PrivatePrivate
Key AssumptionsKey Assumptions
Decouple sewer bondsDecouple sewer bonds YesYes YesYes YesYes YesYes YesYes YesYes YesYes
Further staff/service reductionFurther staff/service reduction YesYes YesYes Not LikelyNot Likely YesYes YesYes YesYes YesYes
Set levels of serviceSet levels of service YesYes YesYes YesYes YesYes NoNo YesYes NoNo
Acquire other systems on island Acquire other systems on island NoNo NoNo YesYes N/ AN/ A N/ AN/ A N/ AN/ A N/ AN/ A
8/6/2019 Preliminary water utility report
http://slidepdf.com/reader/full/preliminary-water-utility-report 15/24
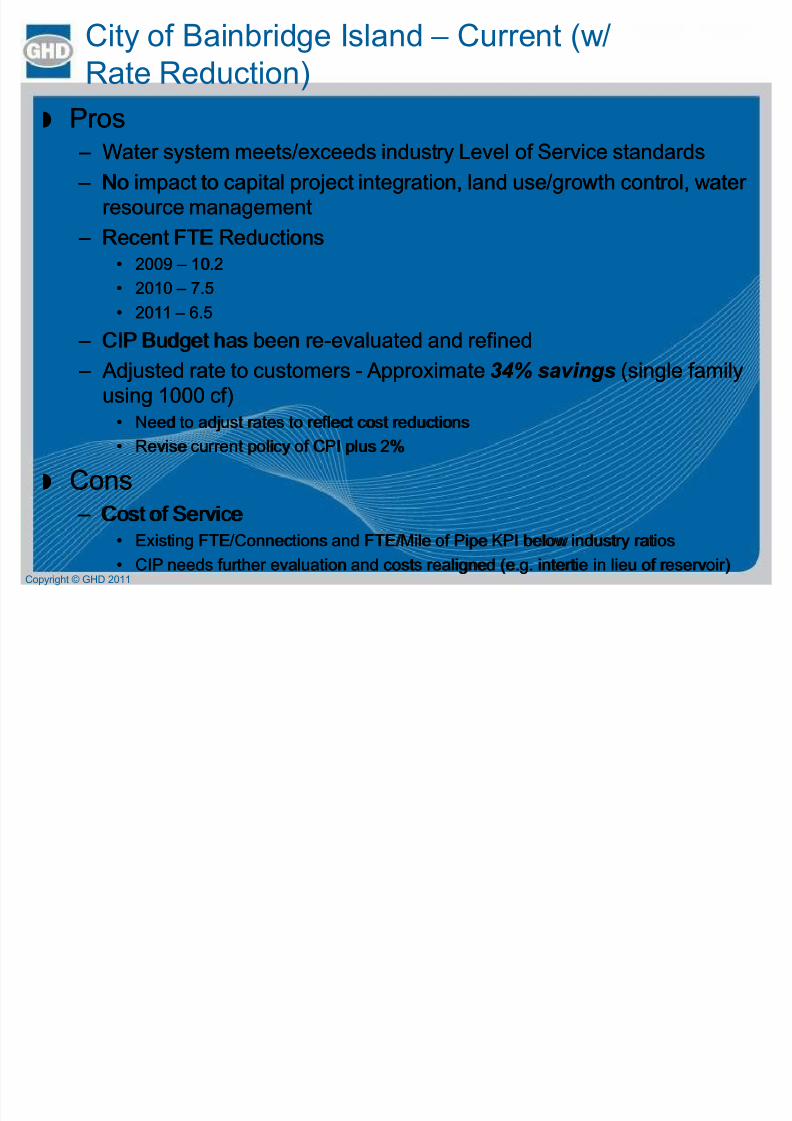
City of Bainbridge Island ± Current (w/Rate Reduction)
�� ProsPros ± ± Water system meets/exceeds industry Level of Service standardsWater system meets/exceeds industry Level of Service standards
± ± No impact to capital project integration, land use/growth control, water No impact to capital project integration, land use/growth control, water resource managementresource management
± ± Recent FTE ReductionsRecent FTE Reductions�� 20092009 ± ± 10.210.2
�� 20102010 ± ± 7.57.5
�� 20112011 ± ± 6.56.5
± ± CIP Budget has been reCIP Budget has been re--evaluated and refinedevaluated and refined
± ± Adjusted rate to customers Adjusted rate to customers -- Approximate Approximate 34% saving s34% saving s (single family(single familyusing 1000 cf)using 1000 cf)
�� Need to adjust rates to reflect cost reductionsNeed to adjust rates to reflect cost reductions
�� Revise current policy of CPI plus 2%Revise current policy of CPI plus 2%
�� ConsCons ± ± Cost of ServiceCost of Service
�� Existing FTE/Connections and FTE/Mile of Pipe KPI below industry ratiosExisting FTE/Connections and FTE/Mile of Pipe KPI below industry ratios
�� CIP needs further evaluation and costs realigned (e.g. intertie in lieu of reservoir)CIP needs further evaluation and costs realigned (e.g. intertie in lieu of reservoir)Copyright © GHD 2011
8/6/2019 Preliminary water utility report
http://slidepdf.com/reader/full/preliminary-water-utility-report 16/24
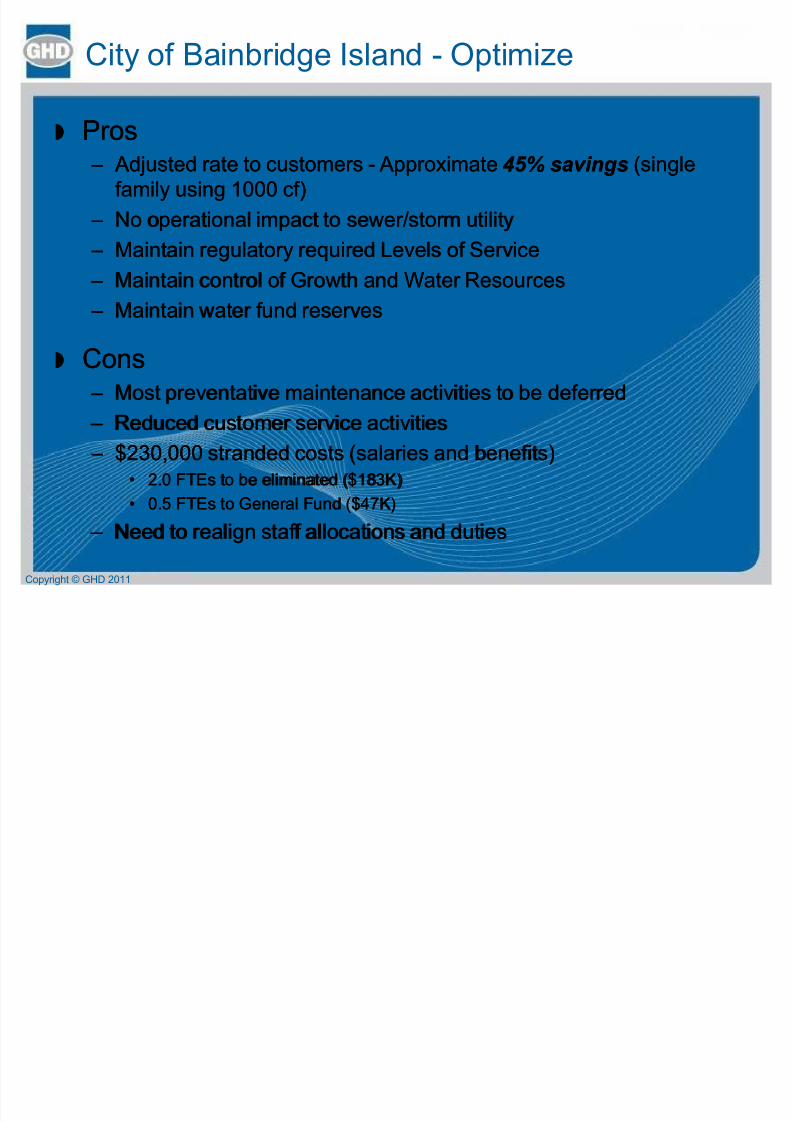
City of Bainbridge Island - Optimize
��
ProsPros ± ± Adjusted rate to customers Adjusted rate to customers -- Approximate Approximate 45% saving s45% saving s (single(singlefamily using 1000 cf)family using 1000 cf)
± ± No operational impact to sewer/storm utilityNo operational impact to sewer/storm utility
± ± Maintain regulatory required Levels of ServiceMaintain regulatory required Levels of Service
± ± Maintain control of Growth and Water ResourcesMaintain control of Growth and Water Resources ± ± Maintain water fund reservesMaintain water fund reserves
�� ConsCons ± ± Most preventative maintenance activities to be deferredMost preventative maintenance activities to be deferred
± ± Reduced customer service activitiesReduced customer service activities
± ± $230,000 stranded costs (salaries and benefits)$230,000 stranded costs (salaries and benefits)�� 2.0 FTEs to be eliminated ($183K)2.0 FTEs to be eliminated ($183K)
�� 0.5 FTEs to General Fund ($47K)0.5 FTEs to General Fund ($47K)
± ± Need to realign staff allocations and dutiesNeed to realign staff allocations and duties
Copyright © GHD 2011
8/6/2019 Preliminary water utility report
http://slidepdf.com/reader/full/preliminary-water-utility-report 17/24
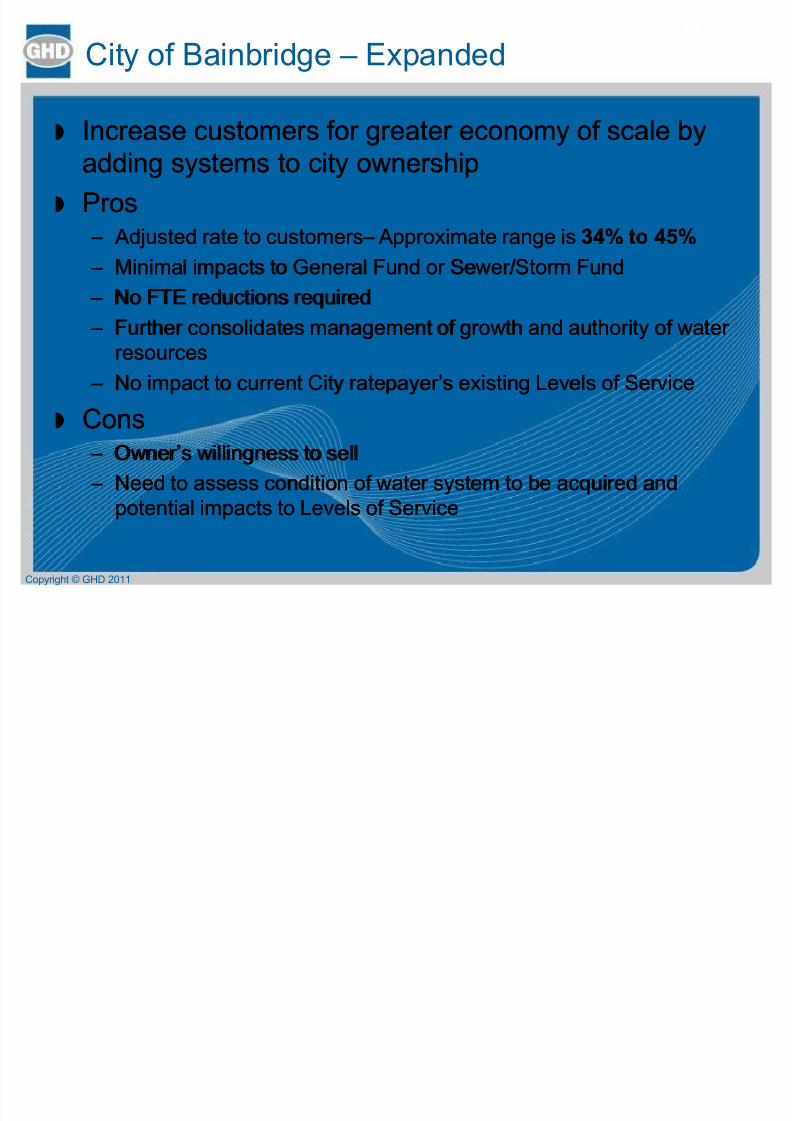
City of Bainbridge ± Expanded
��
Increase customers for greater economy of scale byIncrease customers for greater economy of scale byadding systems to city ownershipadding systems to city ownership
�� ProsPros ± ± Adjusted rate to customers Adjusted rate to customers± ± Approximate range is Approximate range is 34% to 45%34% to 45%
± ± Minimal impacts to General Fund or Sewer/Storm FundMinimal impacts to General Fund or Sewer/Storm Fund ± ± No FTE reductions requiredNo FTE reductions required
± ± Further consolidates management of growth and authority of water Further consolidates management of growth and authority of water resourcesresources
± ± No impact to current City ratepayer¶s existing Levels of ServiceNo impact to current City ratepayer¶s existing Levels of Service
�� ConsCons ± ± Owner¶s willingness to sellOwner¶s willingness to sell
± ± Need to assess condition of water system to be acquired andNeed to assess condition of water system to be acquired andpotential impacts to Levels of Servicepotential impacts to Levels of Service
Copyright © GHD 2011
8/6/2019 Preliminary water utility report
http://slidepdf.com/reader/full/preliminary-water-utility-report 18/24
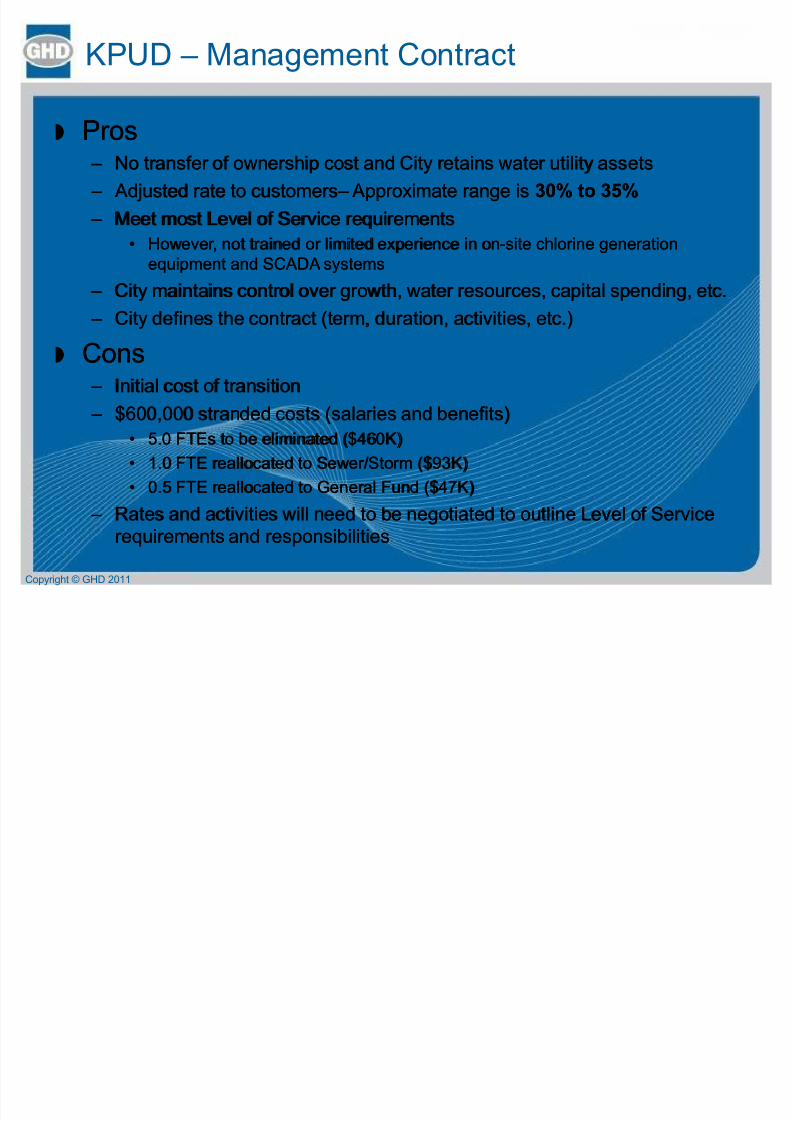
KPUD ± Management Contract
��
ProsPros ± ± No transfer of ownership cost and City retains water utility assetsNo transfer of ownership cost and City retains water utility assets
± ± Adjusted rate to customers Adjusted rate to customers± ± Approximate range is Approximate range is 30% to 35%30% to 35%
± ± Meet most Level of Service requirementsMeet most Level of Service requirements
�� However, not trained or limited experience in onHowever, not trained or limited experience in on--site chlorine generationsite chlorine generationequipment and SC AD A systemsequipment and SC AD A systems
± ± City maintains control over growth, water resources, capital spending, etc.City maintains control over growth, water resources, capital spending, etc.
± ± City defines the contract (term, duration, activities, etc.)City defines the contract (term, duration, activities, etc.)
�� ConsCons ± ± Initial cost of transitionInitial cost of transition
± ± $600,000 stranded costs (salaries and benefits)$600,000 stranded costs (salaries and benefits)�� 5.0 FTEs to be eliminated ($460K)5.0 FTEs to be eliminated ($460K)
�� 1.0 FTE reallocated to Sewer/Storm ($93K)1.0 FTE reallocated to Sewer/Storm ($93K)
�� 0.5 FTE reallocated to General Fund ($47K)0.5 FTE reallocated to General Fund ($47K)
± ± Rates and activities will need to be negotiated to outline Level of ServiceRates and activities will need to be negotiated to outline Level of Servicerequirements and responsibilitiesrequirements and responsibilities
Copyright © GHD 2011
8/6/2019 Preliminary water utility report
http://slidepdf.com/reader/full/preliminary-water-utility-report 19/24
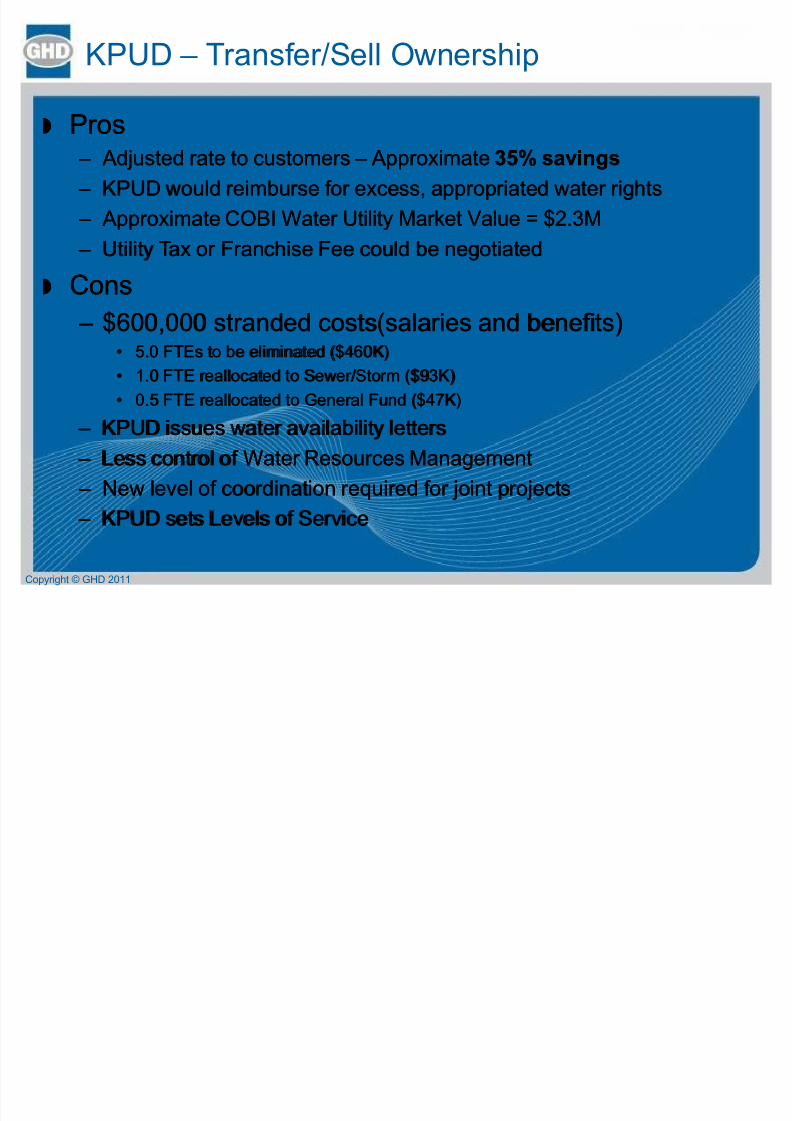
KPUD ± Transfer/Sell Ownership
�� ProsPros ± ± Adjusted rate to customers Adjusted rate to customers ± ± Approximate Approximate 35% savings35% savings
± ± KPUD would reimburse for excess, appropriated water rightsKPUD would reimburse for excess, appropriated water rights
± ± Approximate COBI Water Utility Market Value = $2.3M Approximate COBI Water Utility Market Value = $2.3M
± ± Utility Tax or Franchise Fee could be negotiatedUtility Tax or Franchise Fee could be negotiated
�� ConsCons ± ± $600,000 stranded costs(salaries and benefits)$600,000 stranded costs(salaries and benefits)
�� 5.0 FTEs to be eliminated ($460K)5.0 FTEs to be eliminated ($460K)
�� 1.0 FTE reallocated to Sewer/Storm ($93K)1.0 FTE reallocated to Sewer/Storm ($93K)
�� 0.5 FTE reallocated to General Fund ($47K)0.5 FTE reallocated to General Fund ($47K)
± ± KPUD issues water availability lettersKPUD issues water availability letters
± ± Less control of Water Resources ManagementLess control of Water Resources Management
± ± New level of coordination required for joint projectsNew level of coordination required for joint projects
± ± KPUD sets Levels of ServiceKPUD sets Levels of Service
Copyright © GHD 2011
8/6/2019 Preliminary water utility report
http://slidepdf.com/reader/full/preliminary-water-utility-report 20/24
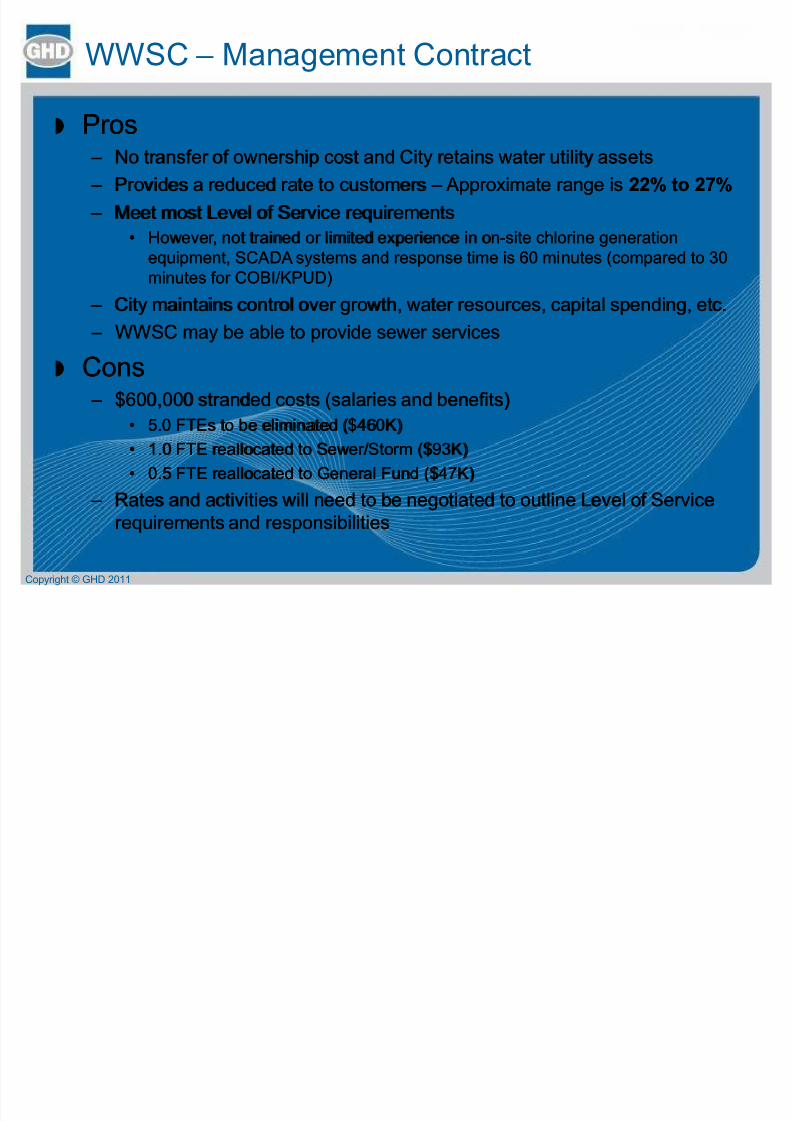
WWSC ± Management Contract
Copyright © GHD 2011
�� ProsPros ± ± No transfer of ownership cost and City retains water utility assetsNo transfer of ownership cost and City retains water utility assets
± ± Provides a reduced rate to customersProvides a reduced rate to customers ± ± Approximate range is Approximate range is 22% to 27%22% to 27%
± ± Meet most Level of Service requirementsMeet most Level of Service requirements
�� However, not trained or limited experience in onHowever, not trained or limited experience in on--site chlorine generationsite chlorine generationequipment, SC AD A systems and response time is 60 minutes (compared to 30equipment, SC AD A systems and response time is 60 minutes (compared to 30
minutes for COBI/KPUD)minutes for COBI/KPUD) ± ± City maintains control over growth, water resources, capital spending, etc.City maintains control over growth, water resources, capital spending, etc.
± ± WWSC may be able to provide sewer servicesWWSC may be able to provide sewer services
�� ConsCons ± ± $600,000 stranded costs (salaries and benefits)$600,000 stranded costs (salaries and benefits)
�� 5.0 FTEs to be eliminated ($460K)5.0 FTEs to be eliminated ($460K)
�� 1.0 FTE reallocated to Sewer/Storm ($93K)1.0 FTE reallocated to Sewer/Storm ($93K)
�� 0.5 FTE reallocated to General Fund ($47K)0.5 FTE reallocated to General Fund ($47K)
± ± Rates and activities will need to be negotiated to outline Level of ServiceRates and activities will need to be negotiated to outline Level of Servicerequirements and responsibilitiesrequirements and responsibilities
8/6/2019 Preliminary water utility report
http://slidepdf.com/reader/full/preliminary-water-utility-report 21/24
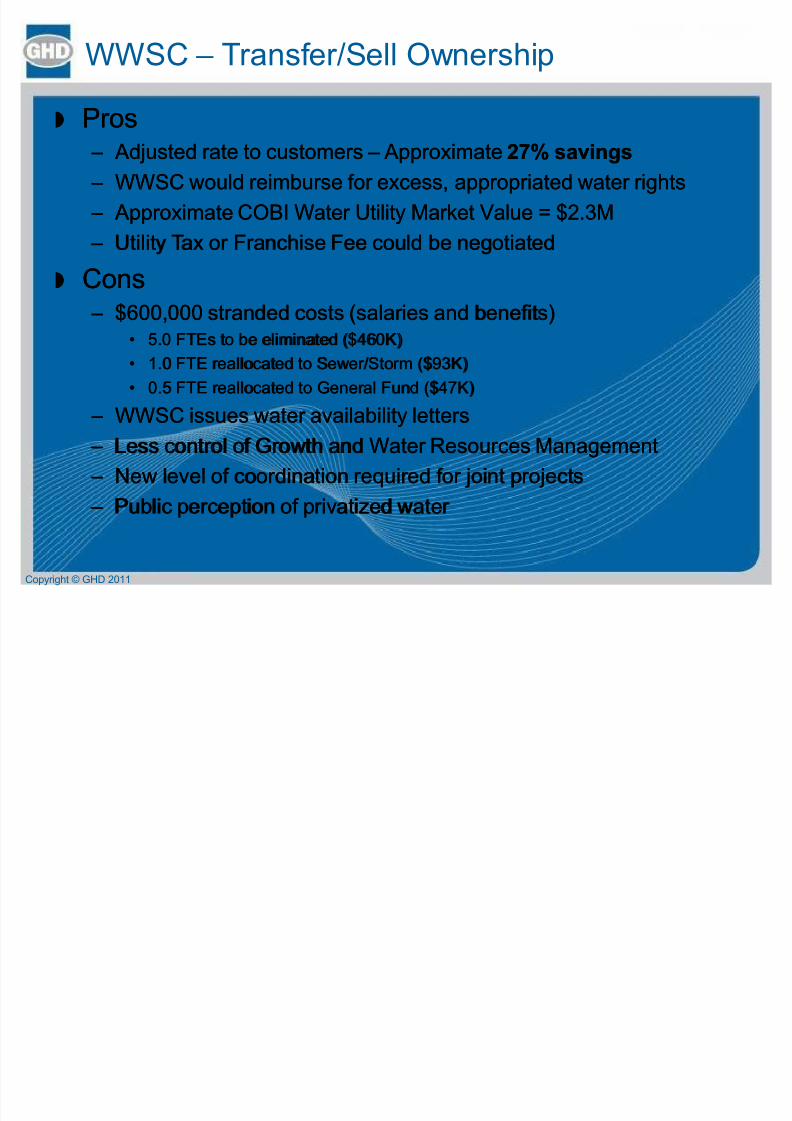
WWSC ± Transfer/Sell Ownership
�� ProsPros ± ± Adjusted rate to customers Adjusted rate to customers ± ± Approximate Approximate 27% savings27% savings
± ± WWSC would reimburse for excess, appropriated water rightsWWSC would reimburse for excess, appropriated water rights
± ± Approximate COBI Water Utility Market Value = $2.3M Approximate COBI Water Utility Market Value = $2.3M
± ± Utility Tax or Franchise Fee could be negotiatedUtility Tax or Franchise Fee could be negotiated
�� ConsCons ± ± $600,000 stranded costs (salaries and benefits)$600,000 stranded costs (salaries and benefits)
�� 5.0 FTEs to be eliminated ($460K)5.0 FTEs to be eliminated ($460K)
�� 1.0 FTE reallocated to Sewer/Storm ($93K)1.0 FTE reallocated to Sewer/Storm ($93K)
�� 0.5 FTE reallocated to General Fund ($47K)0.5 FTE reallocated to General Fund ($47K)
± ± WWSC issues water availability lettersWWSC issues water availability letters ± ± Less control of Growth and Water Resources ManagementLess control of Growth and Water Resources Management
± ± New level of coordination required for joint projectsNew level of coordination required for joint projects
± ± Public perception of privatized water Public perception of privatized water
Copyright © GHD 2011
8/6/2019 Preliminary water utility report
http://slidepdf.com/reader/full/preliminary-water-utility-report 22/24
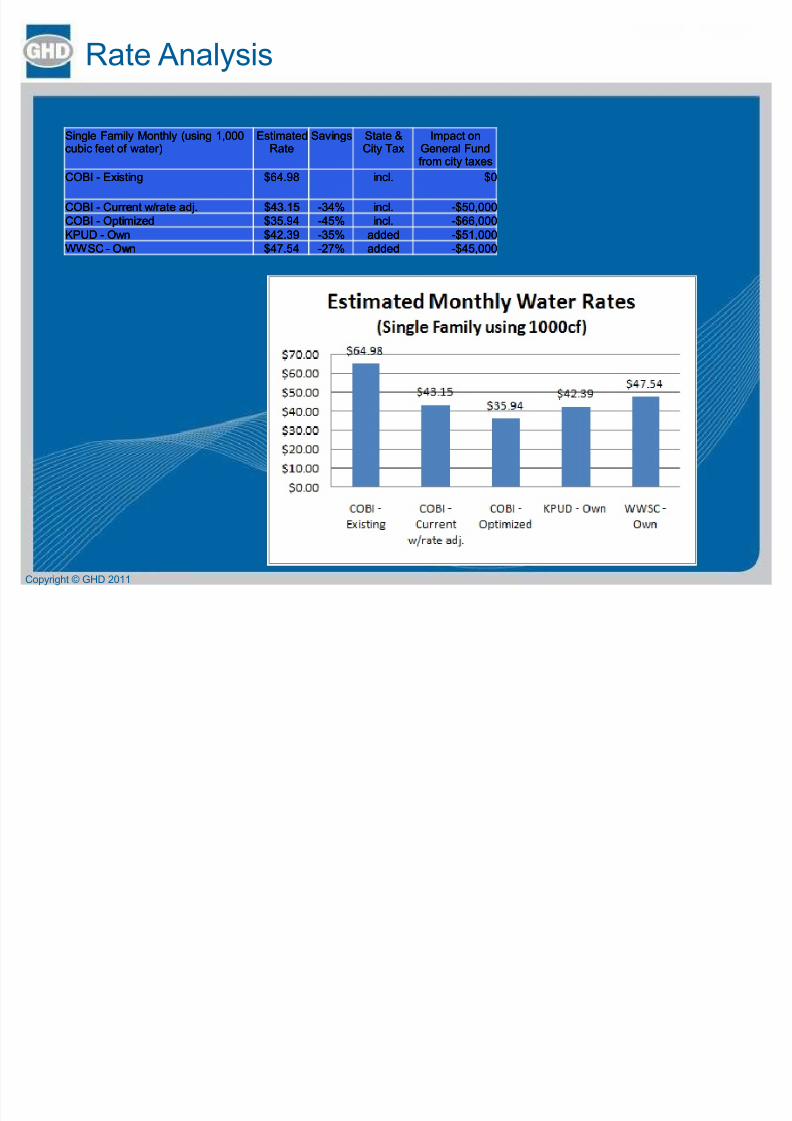
Rate Analysis
Copyright © GHD 2011
Single Family Monthly (using 1,000Single Family Monthly (using 1,000cubic feet of water)cubic feet of water) EstimatedEstimatedRateRate SavingsSavings State &State &City TaxCity Tax Impact onImpact onGeneral FundGeneral Fundfrom city taxesfrom city taxes
COBICOBI -- ExistingExisting $64.98$64.98 incl.incl. $0$0
COBICOBI -- Current w/rate adj.Current w/rate adj. $43.15$43.15 --34%34% incl.incl. --$50,000$50,000COBICOBI -- OptimizedOptimized $35.94$35.94 --45%45% incl.incl. --$66,000$66,000KPUDKPUD -- OwnOwn $42.39$42.39 --35%35% addedadded --$51,000$51,000WWSCWWSC -- OwnOwn $47.54$47.54 --27%27% addedadded --$45,000$45,000
8/6/2019 Preliminary water utility report
http://slidepdf.com/reader/full/preliminary-water-utility-report 23/24
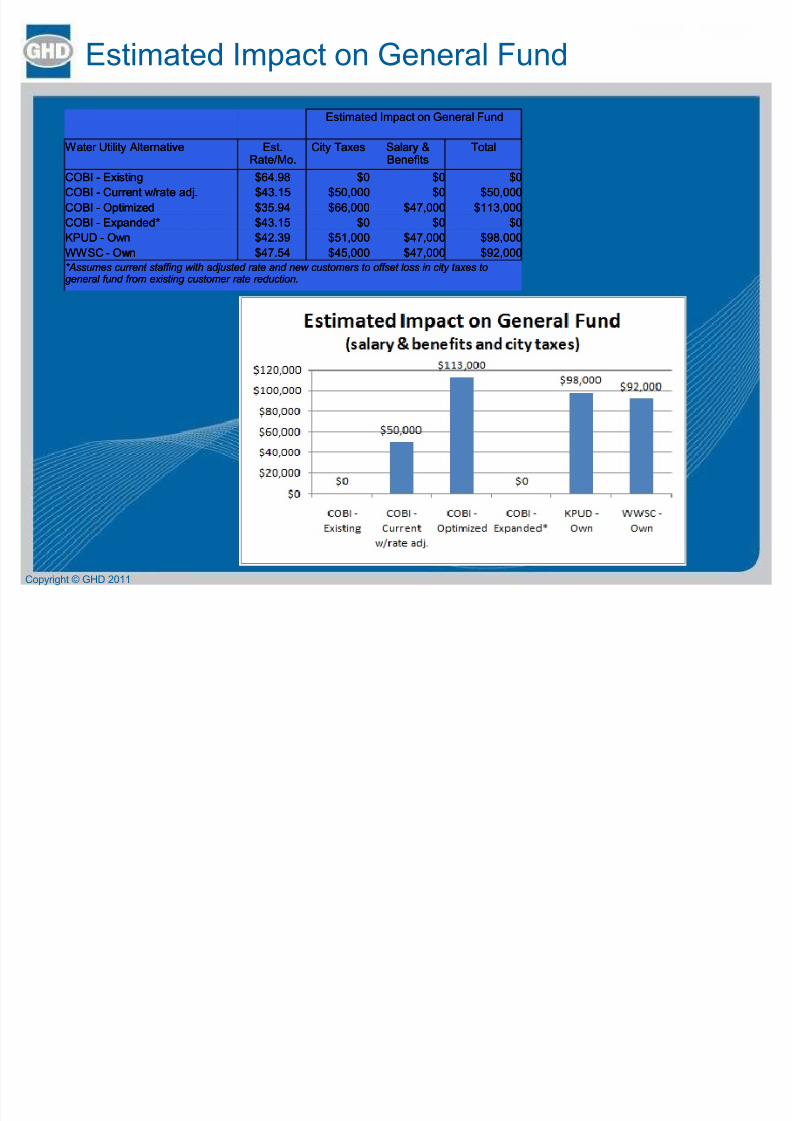
Estimated Impact on General Fund
Copyright © GHD 2011
Estimated Impact on General FundEstimated Impact on General Fund
Water Utility AlternativeWater Utility Alternative Est.Est.Rate/Mo.Rate/Mo.
City TaxesCity Taxes Salary &Salary &BenefitsBenefits
TotalTotal
COBICOBI -- ExistingExisting $64.98$64.98 $0$0 $0$0 $0$0
COBICOBI -- Current w/rate adj.Current w/rate adj. $43.15$43.15 $50,000$50,000 $0$0 $50,000$50,000
COBICOBI -- OptimizedOptimized $35.94$35.94 $66,000$66,000 $47,000$47,000 $113,000$113,000
COBICOBI -- Expanded*Expanded* $43.15$43.15 $0$0 $0$0 $0$0
KPUDKPUD -- OwnOwn $42.39$42.39 $51,000$51,000 $47,000$47,000 $98,000$98,000
WWSCWWSC -- OwnOwn $47.54$47.54 $45,000$45,000 $47,000$47,000 $92,000$92,000*Assumes current staffing with adjusted rate and new customers to offset loss in city taxes to*Assumes current staffing with adjusted rate and new customers to offset loss in city taxes to
general fund from existing customer rate reduction.general fund from existing customer rate reduction.
8/6/2019 Preliminary water utility report
http://slidepdf.com/reader/full/preliminary-water-utility-report 24/24
QUESTIONS???
Copyright © GHD 2011