Embed Size (px)
Citation preview
Techn1ca1Reports C9nter: Texas Transportation Institute
PRELIMINARY STUDY OF IN-SITU MEASUREMENTS OF FRICTION AND BEARING IN CLAY
By
Joseph D. Rehmet
Research Assistant
and
Harry M. Coyle
Associate Research Engineer
Research Report Number 125- 3
Bearing Capacity for Axially Loaded Piles
Research Study Number 2- 5- 67-125
Sponsored by
The Texas Highway Department
In Cooperation with the
U.S. Department of Transportation
Federal Highway Administration
Bureau of Public Roads
September 1969
TEXAS TRANSPORTATION INSTITUTE Texas A&M University College Station, Texas
i
ABSTRACT
This report presents the results of a series of field tests conducted on several newly developed in-situ testing devices. The in-situ testing devices are to be used to measure static values of skin friction and point bearing during sampling operations with an auger or a core drilling rig. Measured values of skin friction and point bearing taken during sampling operations are compared with the values taken from tests on an 8-foot section of instrumented drill pipe. All tests are conducted at one test site. The soil at the test site is a highly plastic clay. Soil samples are taken during all phases of the test program.
A few dynamic tests are conducted at the test site using one of the in-situ devices which records simultaneous measurements of skin friction and point bearing. Data from the dynamic tests are used to evaluate friction and tip damping constants for the clay soil. The limited dynamic. data indicate that soil damping does increase with depth and is a function of overburden pressure.
This study is preliminary in nature because the in-situ devices and testing procedures are in the development stage. Therefore, no definite conclusions are made concerning the application of test results. However, recommendations are made concerning the device and procedure which should be used for future large scale field test programs.
ii
IMPLEMENTATION STATEMENT
This report presents the results of a test program conducted on several newly developed devices for use with core drilling rigs to measure skin friction and point bearing in clays. The study is preliminary in nature because the devices and the test procedures are in the development stage. The research has not progressed to the point that implementation of the results can be started by the Texas Highway Department.
The opmwns, findings, and conclusions expressed in this report are those of the authors and not necessarily those of the Bureau of Public Roads.
iii
TABLE OF CONTENTS Chapter Page
I INTRODUCTION ..... ----------------------------------------------------------------------------------------------------------------------------------------------------- 1 Nature of the Problem __________________________________________________________________________________________________________________________________________________ 1
Present Status of the Question ....... ---------------------------·------------------------------------------------------------------------------------------------- 1
Prior Research·------------------------------------------------------------·-------------------------------------------------------------------------------------------------- 1 Objectives ________________________________________________________________________________________________________________________________________________________________________ 1
II TEST EQUIPMENT AND INSTRUMENTATION. ____________________________________________________ :: __________________________________________ 2
GeneraL ___________________________________________________________________________________________________________________________________________________________________________ 2
Simultaneous Device.---------------------------------------------------------------------------------------------------------------------------------------------------- 2
The Tip-Only Device·-------------------------------------------------·------------------------------------------------------------------------------------------------- 2
The Skin Friction Device ........ -------------------------------------------------------------·-----------------------------·------------------------------------------ 2
Loading Equipment .. ----------------------------------------------------------------------------------------------------------------------------------------------------- 3
Load Recording Equipment. ............ ---------------------------------------------------------------------------------------------------------------------------- 4
Displacement Recording EquipmenL·----------------------·------------------------------------------------------------------------------------------------- 4
Calibration·--------------------------------------------------------------------------------------------------------------------------------------------------------------------- 5
III SOIL PROPERTIES.--------------------------------------------------··------------------------------------------------------------------------------------------------- 7
Boring Log·------------------------------------------------------------------·------------------------------------------------------------------------------------------------- 7
Soil Properties .......... ----------------------------------------------------------------------------------------------------------------------------------------------------- 7
Weather Conditions .. ---------------------------------------------------·------------------------------------------------------------------------------------------------- 8
IV TEST PROCEDURES·------------------------------------------------··------------------------------------------------------------------------------------------------- 9
Introduction·-----------------------------------------------------------------··------------------------------------------------------------------------------------------------- 9
Static Test Procedure·-------------------------------------------------·------------------------------------------------------------------------------------------------- 9
Dynamic Test Procedure .... ------------------------------------------------------------------------------------------------------------------------------------------ 9
Test Series·-------------------------------------------------------------------·--------------------------------------------------------------------------------------------------10
V ANALYSIS OF STATIC TESTS ...... ---------------------------------------------------------------------------------------------------------------------------12
Test Designation .... -------------------------------------------------------·------------------·------------------------------------------------------------------------------12
Data Reduction Procedure .... --------------------------------------·-------------------------------------------------------------------------------------------------12
Load-Movement Curves _______________________________________________ ·-------------------------------------------------------------------------------------------------13
Test Series I----------------------------------------------------------------·-------------------------------------------------------------------------------------------------13 Test Series IL _________________________________________________________________________________________________________________________________________________________________ 14
Test Series III _______________________________________________________________________________________________________________________________________________________________ 15
VI ANALYSIS OF DYNAMIC TESTS ........ -------------------------------------------------------------------------------------------------------------------16 Background _____________________________________________________________________________________________________________________________________________________________________ 16
Data Reduction .......... ----------------------------------------------------------------------------------------------------------------------------------------------------18
VII CONCLUSIONS AND RECOMMENDATIONS _______________________________________________________________________________________________________ 19
Conclusions _____________________________________________________________________________________________________________________________________________________________________ 19
Recommendations ...... -----------------------------------------------------------------------------------------------------------------------------------------------------19 REFERENCES ________________________________________________________________________________________________________________________________________________________________ 19
APPENDIX A-Static Load-Deformation Curves .. ---------------------------------------------------------------------------------------------------20
APPENDIX B-Dynamic Load-Deformation Curves·-------------------------·---------------------------------------------------------------------27
APPENDIX C-Load-Settlement and Load Distribution Curves.--------------------------------------------------------------------------31
iv
LIST OF 'rABLES Table Page
I Engineering Properties of Test Soils .... ----------------·······------------------------------------------------------------------------------------------------- 8
II Test Designation and Description·------------------------------------------------------------------------------------------------------------------------------12
III Test Series I Results·---------------------------------------------------·-·-----------------------------------------------------------------------------------------------13
IV Test Series II Results __________________________________________________ ·-------------------------------------------------------------------------------------------------14
V Total Surface Load Reduction Factor·------------------------------------------------------------------------------------------------------------------------15
VI Friction Data·---------------------------------------------------------------·-------------------------------------------------------------------------------------------------15
VII Tip Damping Data ------------------------------------------------------·-------------------------------------------------------------------------------------------------17
VIII Friction Damping Data·-----------------------------------------------·-------------------------------------------------------------------------------------------------18
v
LIST OF FIGURES
Figure Page
1 Simultaneous Measurement Device ...................................... ---------------------------------------------------------------------------------------- 2
2a Skin Friction Measurement Device .... ------------------------------------------------------------------------------------------------------------------------- 3
2b Spacer ............................ -------------------------------------------------------------------------------------·----------------------------------------------------------- 3
2c Tip Only Measurement Device ... ---------------------------------------------------------------------------------------------------------------------------------- 3
3 Load Frame .......... ---------------------------------------------------------------------------------------------------------------------------------------------------------- 3
4 Driving 8-Foot Section .. ·---------------------------------------------------------------------------------------------------------------------------------------------- 4
5 Static Test Recording Equipment----------------------------------------------------------------·--------------------------------------------------------------- 4
6 Dynamic Test Recording EquipmenL ...... --------------------------------------------------------------------------------------------------------------·--- 4 7 Linear Displacement Transducer Circuit.. _____________________________________________________________________________________________ ------ .... ___ ....... 5
8 Load Cell Circuit ............ ------------------------------------------··········--·-············--··--····---------------------------------------------------------------- 5
9 Dynamic Test Diagram ............ ----------------------------------------------------------------------------------------------------------------------·············· 5
10 Static Test Diagram .... -----------···················------------------------------------------------------------------------------------------------------------------- 5
11 Load Cell Calibration for Static Testing .... ----------------·------------------------------------------------------------------------------------------------- 6
12 Load Cell Calibration for Dynamic Testing ............ ------------------------------------------------------------------------------------------------- 6
13 Displacement Transducer Calibration .. ·---------------------------------------------------------------------------------------------------------------------- 6
14 Generator Calibration .................................................. -------------------------------------------------------------------------------------------------- 6
15 Boring Log ........................ -------------------------------------------··-·----------------------------------------------------------------------------------------------- 7
16 Static Test Set UP---------- __ . ____________ .... ____ .. ____ ... ____ .......... ____________________ ... ____________________________ ... ____ ......... _____ ............... ________ .. 9
17 Dynamic Test Set Up .... --------------------------------------------------------------------------------------~--------------------------------------------------------- 9
18 Layout of Test Area.·----------------------------------------------------------------------------------------------------------------------------------------------------10
19 Eight-Foot Pile Test. ............... --------------------------------------------------------------------------------------------------------------------------------------10
20 Test With Simultaneous Device ............ -----------------------------------------------------------------------------------------------------------------------11
21 Test With Load Cell at Top ............ -----------------------------------------------------------------------------------------------------------------------------11
22 Test With Load Cells Together .. ________________________________ -------------------------------------------------------------------------------------------------11
23 Load Distribution Assumption for Simultaneous Device ........................ ________________ -------------------------------------------------13 24 Data From Test III-3-1 ........... _______________________________________________________________________________________________________________________________________ 16
25 Smith's Model. ............ ----- ________ .... ___ . _______________ .... _____ ..... ___________ . __________ . ____________ . _______________ ......... _______________ ... __ .. ______ ......... 17
26 Soil Load-Deformation Assumption .......................... -------------------------------------------------------------------------------------------------17
27 Tip Damping Constant vs Pile Displacement Velocity ................ ---------------------------------------------------------------------------18
28 Friction Damping Constant vs Pile Displacement Velocity .... ------------------------------------------------------------------------------18
29 Friction Damping Constant vs Pile Displacement Velocity Using Modified Smith ModeL. .......................... 18
A-1 Skin Friction vs Movement Curve ............................ -------------------------------------------------------------------------------------------------20
A-2 Point Bearing vs Movement Curve ........................ -----------------------------------------------------------------------------------------------------20
A-3 Point Bearing vs Movement Curve ........................ -----------------------------------------------------------------------------------------------------20
A-4 Total Load vs Movement Curve ........ -------------------------------------------------------------------------------------------------------------------------20
A-5 Theoretical Skin Friction 'vs Movement Curve ............. --------------------------------------------------------------------------------------------21
A-6 Total Load vs Movement Curve .................................... ----------------------------------------------------------------------------------------------21
A-7 Theoretical Skin Friction vs Movement Curve ............ --------------------------------------------------------------------------------------------21
A-8 Point Bearing vs Movement Curve ........................ --------------------------------------------------------------------------------·-·········-----------21
A-9 Total Load vs Movement Curve .................................. -----------------------------------------------------------------------------------------------22
vi
,----------------- -- --------
A-10 Skin Friction vs Movement Curve·----------------------------------------------------------------------------------------------------------------------------22
A-ll Point Bearing vs Movement Curve·---------------------------·-------------------------------------------------------------------------------------------------22
A-12 foint Bearing vs Movement Curve·----------------------------------------------------------------------------------------------------------------------------22
A-13 iSkin Friction vs Movement Curve·------------------------------------------------------------------------------------------------------------------------------23
A-14 Skin Friction vs Movement Curve·------------------------------------------------------------------------------------------------------------------------------23
· A-15 Point Bearing vs Movement Curve ____________________________ ----------------------- ____ -------------,-------------------------------------------------------23
A-16 Point Bearing vs Movement Curve ___________________________________________________ -------------------------------------------------------------------------23
A-17 Total Load vs Movement Curve-----------------------------------------------------------------------------------------------------------------------------------24
A-18 Theoretical Skin Friction vs Movement Curve·--------------------------------------------------------------------------------------------------------24
A-19 Point Bearing vs Movement Curve·----------------------------------------------------------------------------------------------------------------------------24
A-20 Total Load vs Movement Curve ________________________________ -------------------------------------------------------------------------------------------------24
A-21 Theoretical Skin Friction vs Movement Curve---------------------------------------------------------------------------------------------------------25
A-22 Point Bearing vs Movement Curve ____________________________ -------------------------------------------------------------------------------------------------25
A-23 Total Load vs Movement Curve·--------------------------------------------------------------------------------------------------------------------------------25
A-24 Skin Friction vs Movement Curve ______________________ : ___________________________ ·--------------------------------------------------------------------------25
A-25 Point Bearing vs Movement Curve·----------------------------------------------------------------------------------------------------------------------------26
A-26 Point Bearing vs Movement Curve·----------------------------------------------------------------------------------------------------------------------------26
A-27 Total Load vs Movement Curve·--------------------------------------------------------------------------------------------------------------------------------26
A-28 Skin Friction vs Movement Curve .... -------------------------------------------------------------------------------------------------------------------------26
A-29 Point Bearing vs Movement Curve ____________________________ -------------------------------------------------------------------------------------------------27
B-1 Load Deformation Curves·---------------------------------------------------------------------------------------------------------------------------------------------27
B-2 Load Deformation Curves----------------------------------------------------------------------------------------------------------------------------------------------27
B-3 Load Deformation Curves-------------------------------------------- -------------------------------------------------------------------------------------------------28
B-4 Load Deformation Curves---------------------------------------------------------------------------------------------------------------------------------------------28
B-5 'Load Deformation Curves----------------------------------------------------------------------------------------------------------------------------------------------28
B-6 Load Deformation Curves-------------------------------------------------------------------------------------------------------------·--------------------------------28 B-7 Load Deformation Curves. _______________________________________________________________________________________________ ------- _______ --------- ______________________ 29
B-8 Load Deformation Curves-------·-------------------------------------------------------------------------------------------------------------------------------------29
B-9 Load Deformation Curves ____________________________________________ -------------------------------------------------------------------------------------------------29
B-10 Load Deformation Curves---------------------------------------------------------------------------------------------------------------------------------------------.29
B-ll Load Deformation Curves---------------------------------------------------------------------------------------------------------------------------------------------30 C-1 Load vs Settlement Curve Test 1-l-2 ___________________________________________________________________________________________________________________________ 31
C-2 Load vs Settlement Curve Test 11-l-1 _________________________________________________________________________________________________________________________ 31
C-3 Load Distribution at Failure Test l-l-2---------------------------------------------------------------------------------------------------------------------32 C-4 Load Distribution at Failure Test II-l-L ___________________________________________________________________________________________________________________ 32
vii
- -------------------------------------------------------------
The following notation was used in this study:
Q A. f
ultimate static bearing capacity,
embedded surface area of pile shaft,
unit skin friction,
Ap pile end area,
q unit point bearing,
w1 soils liquid limit,
wp soils plastic limit,
'YT = total unit weight (lbs/ cf),
viii
natural moisture content (%),
w shear = moisture content at time of shear test (%) ,
P dynami{! = maximum dynamic resistance,
Pstatic = maximum static resistance,
J'
X
N
J
a viscous friction damping constant (sec/ft),
velocity of pile segment in any time interval (fps)'
a power to which the loading velocity is raised, and
a viscous tip damping constant (sec/ft).
Chapter I INTRODUCTION
Nature of the Problem
Since man first utilized the pile as a method of transporting a load to deeper soil stratas which are more capable of sustaining it, he has been concerned with the bearing capacity of these piles. Chellis ( 3) * enumerates a number of methods and formulas, many empirical in nature, which have been brought forward to predict the load a pile will carry in skin friction and point bearing. None of these have proved entirely satisfactory for one reason or another.
There are presently three methods of predicting the bearing capacity of a pile, as suggested by Bowles (2).
l. A static formula in which the load carried by a pile in skin friction and point bearing are calculated and added to give a static bearing capacity.
2. A dynamic formula which relates the blow count during driving to the static bearing capacity.
3. A full-scale static load test performed at the actual construction site.
The second method is widely considered as an erroneous one and the third method is often very expensive and time consuming. The first method, which uses soil borings and laboratory or in-situ tests seems to be the most practical approach.
The static method of predicting, Q, the ultimate bearing capacity, is based on the following equation:
Q = fAs + qAp (l)
where:
As = Embedded surface area of the pile shaft
f Unit skin friction,
Av Pile end area, and
q Unit point bearing.
It would seem that an in-situ device which could make measurement of unit skin friction, f, and unit point bearing, q, would be desirable. Ideally the device and test procedure should fit the following criteria:
l. The device can be utilized during foundation exploration.
2. The test can be run in-situ.
3. It should be simple, reliable, inexpensive to perform, fast, and trouble-free.
4. It can be used to test soft soil materials to hard rock.
*Numbers in parenthesis refer to references at the end of this report. "The citations on the following pages follow the style of the Journal of Soil Mechanics and Foundation Division," American Society of Civil Engineers.
5. It must provide data which can be correlated with piling and drilled shafts as well as various laboratory data.
Present Status of the Question According to its Foundation Manual ( 4), the Texas
Highway Department presently utilizes laboratory shear strength tests and the cone penetrometer test to determine bearing capacity of a pile. Sometimes it is hn· practical or impossible to obtain undisturbed soil samples for laboratory tests. This leaves the cone penetration test as the sole basis of design. Since the cone penetration test is empirical in nature, the data obtained from the test do not give a true indication of the amount of support a pile will gain from skin friction and point bearing. In many cases, the Texas Highway Department also performs full-scale static load tests at a pro· posed bridge site.
Bauder (l) states that the New Mexico State Highway Commission uses a penetration test which involves a 2%-in. diameter pointed pipe. It is driven by a 380-lb ram and is dropped 3 ft. The data obtained are then used with empirical design curves to predict the static bearing capacity of a pile.
As reported by Railway Engineering and Maintenance ( 6) , the Southern Railroad uses a miniature pile driving test in which a l 5/16-in. steel rod with a forged steel point is driven at the test site. After counting the number of blows per foot of penetration, comparison with the pile driving records of full size piles is made to determine the bearing capacity for each foot of pene· tration.
Prior Research
A literature survey has shown that little research has been done in the area of in-situ measurements of skin friction and point bearing. Schmertmann (7) has done research at the University of Florida recently with an in-situ device known as the Dutch Friction Cone. It is a device which makes separate but non-simultaneous measurement of skin friction and point bearing during a static test.
Vbjectives
The objectives of this study are:
l. To design and fabricate several testing devices and the equipment necessary to conduct in-situ loading tests during sampling operations.
2. To conduct a field test program at one test site which includes measurement of in-situ skin friction and point bearing during sampling operations and during the static load test on a instrumented drill pipe.
3. To make recommendations, based on the results of this study, concerning the device and procedure which should be used for future field test programs.
PAGE ONE
Chapter II TEST EQUIPMENT AND INSTRUMENTATION
General
To carry out the objectives of the study the follow-ing equipment was needed:
1. Testing devices,
2. Loading equipment, and
3. Data recording equipment.
The testing devices had to have the capability of being utilized in different configurations and in at least one case, be able to make simultaneous measurement of skin friction and point bearing. For this reason, a device which could accomplish this simultaneous measurement was fabricated and will be called the simultaneous device for the remainder of the report. A second testing device was fabricated which would measure essentially tip-only loads as was a third device which would give a skin friction measurement capability. These will be called the tip-only and skin friction devices, respectively, for the remainder of the report.
The purpose of the loading equipment was essentially threefold: ( 1) to assist in driving the 8-ft test section of drill pipe, (2) to allow static load tests at different depths, and (3) to allow dynamic load tests at different depths.
The recording equipment was needed to measure strains in the devices and displacement of the devices during static and dynamic load tests.
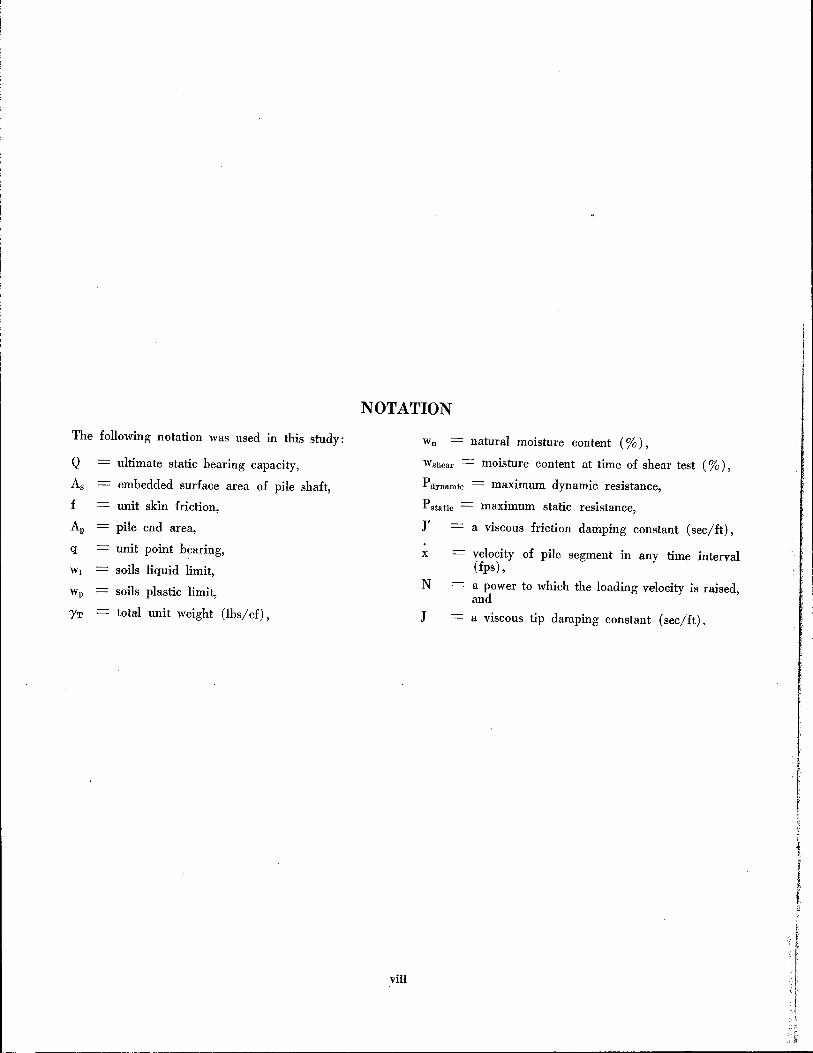
The Simultaneous Device This device, capable of simultaneous in-situ meas
urement of skin friction and point bearing was fashioned after a similar device utilized by Korb ( 5) (see Figure 1). Essentially it consisted of an outer tubular shaft, and separate inner shaft with a circular tip.
The outer shaft was fabricated from 2.375 in. O.D. 304 stainless steel with a wall thickness of 0.063 in. Four 90 degree Budd SR-4 gage rosettes were mounted 90 degrees apart and 7.5 in. from the bottom of the shaft. These gages were wired to read only axial loads.
The inner shaft was also fabricated of 304 stainless steel. At the tip of the shaft was welded a 0.75-in. thick, 2.23-in. diameter circular section of stainless steel. Four 90 degree Budd SR-4 gage rosettes were mounted on the inner shaft 2.25 in. from the bottom. They were wired in the same manner as the outer shaft. The separation between the outer and inner shafts was sealed by a 1/16-in. C. S. Teflon "0" ring.
Both tubes were connected and aligned with an adapter which in turn was connected to a standard female drill rod coupling. Strain gage leads were brought out through a small hole in the adapter.
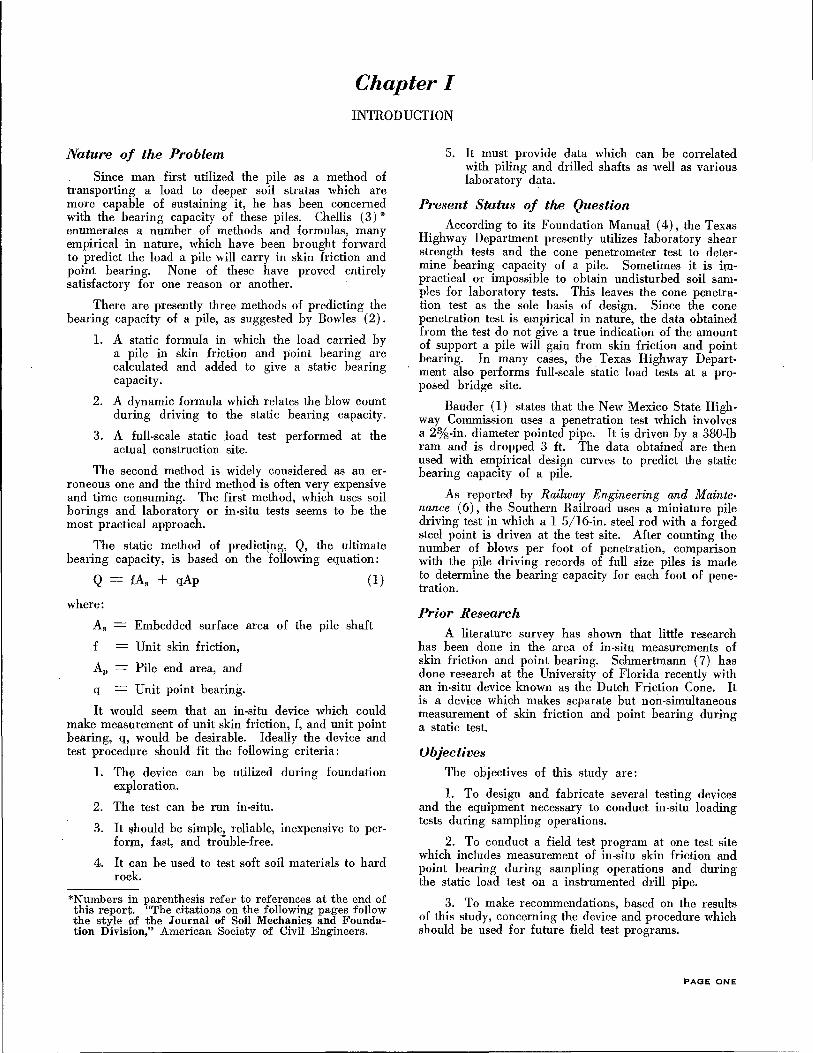
The Tip- Only Device This device (see Figure 2C) was fabricated of
2.735-in. 0. D. steel drill pipe. The top 3.75 in. was a standard female drill rod coupling. The bottom 5 in.
PAGE TWO
was made of the standard drill pipe. The bottom was welded with a 1.0-in. thick steel plate. Four SR-4 Budd gage rosettes were placed 2.13 in. from the bottom of the cell. The walls of the drill pipe were machined to a thickness of .10 in. at the bridge locations in order to produce a specified sensitiviey.
The Skin Friction Device
This device (see Figure 2a) was fabricated of 2.375-in. 0. D. steel tubing and 2 standard drill rod couplings welded to the tube, male on one end, female
BRIDGE N2 I
INNER TUBE 304 STAINLESS STEEL~------
BRIDGE N22----~~
TEFLON "o" RING
I i6 c.s. Figure 1. Simultaneous measurement device.
10
0 0
~ I
10
N21
~ 0
[ a)
BRIDGE
0
-- 10
~ ~ 10
? ~ 10 '-- ~
~ 1'-00 II')
10
~ I': N
~
~ 2.375
Figure 2a. Skin friction measurement device.
Figure 2b. Spacer.
on the other. The strain gages were placed 5.88 in. from the bottom of the device. Wall thickness at bridge locations were the same as the tip-only device. As can be seen, the skin friction and tip-only devices were fabricated to be used in interchangeable configurations or together. In order to give a larger area to skin friction measurements when the two were used together, a "spacer" was fabricated (see Figure 2b). It consisted simply of a male and female coupling of the drill pipe welded together. The configurations utilizing the tiponly, skin friction, and "spacer" devices are discussed in greater detail in Chapter IV.
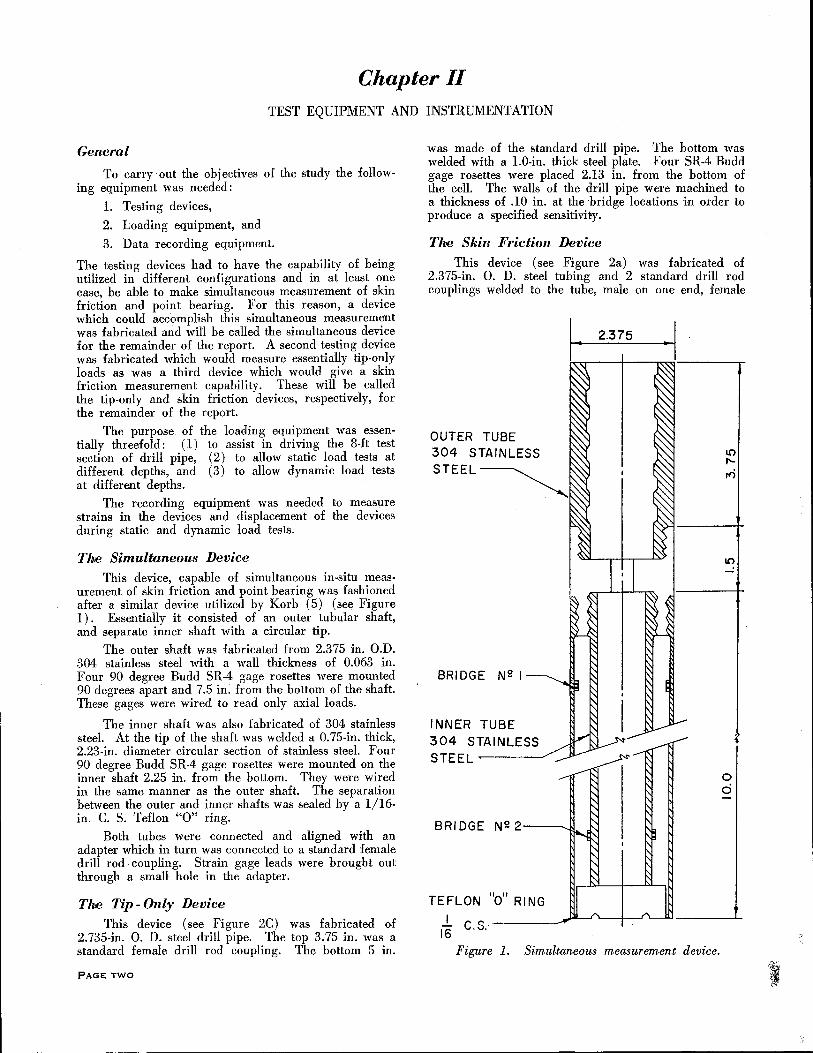
Loading Equipment The load frame used in the study is shown in Fig. 3.
The two vertical members were 6 WF 15.5, 6 feet in length. Twenty-inch by twenty-inch plates were welded to the bottom of each vertical member. Two detachable overlapping plates 2 ft by 6 ft by 0.25 in. were also fabricated to fit around the base of the vertical members. Each was rimmed b-.1 2-in. angle iron and had two 4 ft.-0.75-in. rod arms wh1ch allowed them to be bolted to the loading frame. This was to allow for greater weight to be placed on the loading frame during testing due to the fact that static loads in the 4000 lbs to 7000 lb range were expected.
The top horizontal member was fabricated of a 32 in. long 4 WF 13 member with two 6-in: by 6 in. by 0.50-in. plates welded on either end. This member is bolted between the two vertical members. Located in
CONCRETE BLOCKS PLACED l HERE
) 1
10 1'-ex)
BRIDGE
p "'[ NQ 2
-~1- 2.375 .I
Figure 2c. Tip only measurement device.
DYNAMIC TEST ASSEMBLY
DYNAMIC TEST DROP WEIGHT
JACK AND PROVING RING
CONCRETE
TEST- PLACED
[
BLOCKS
PILE HERE
Figure 3. Load frame.
PAGE THREE
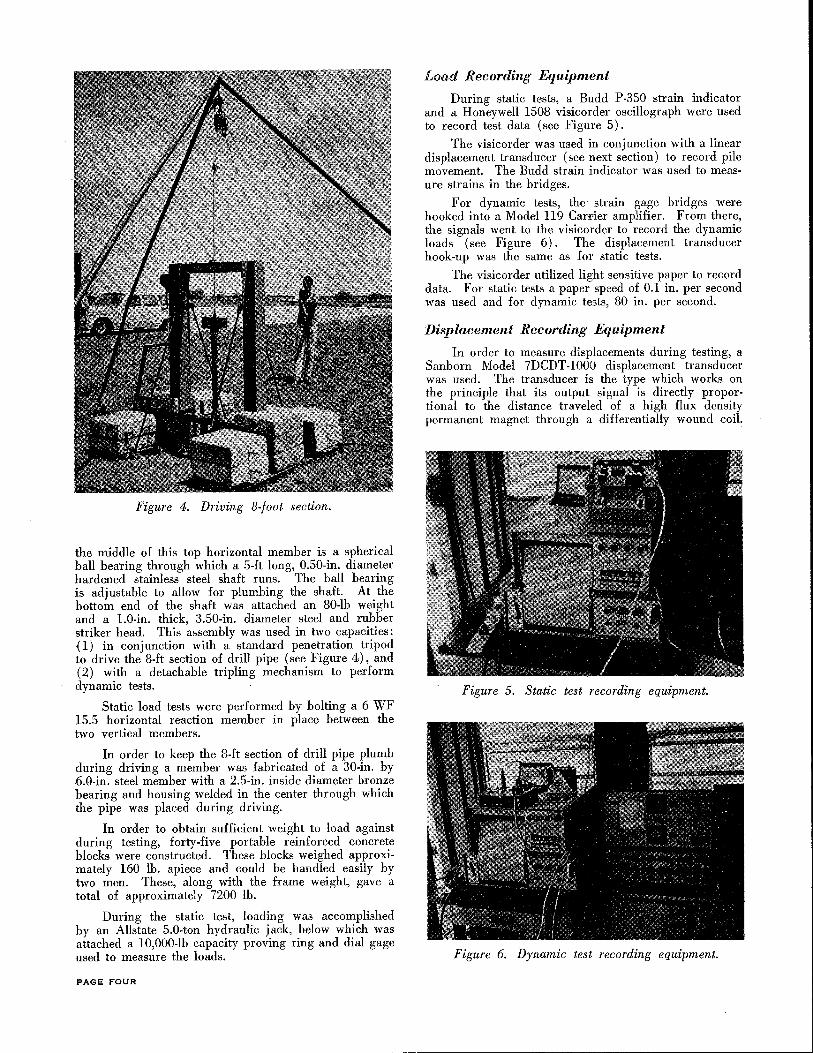
Figure 4. Driving 8-foot section.
the middle of this top horizontal member is a spherical ball bearing through which a 5-ft long, 0.50-in. diameter hardened stainless steel shaft runs. The ball bearing is adjustable to allow for plumbing the shaft. At the bottom end of the shaft was attached an 80-lb weight and a 1.0-in. thick, 3.50-in. diameter steel and rubber striker head. This assembly was used in two capacities: (1) in conjunction with a standard penetration tripod to drive the 8-ft section of drill pipe (see Figure 4), and (2) with a detachable tripling mechanism to perform dynamic tests.
Static load tests were performed by bolting a 6 WF 15.5 horizontal reaction member in place between the two vertical members.
In order to keep the 8-ft section of drill pipe plumb during driving a member was fabricated of a 30-in. by 6.0-in. steel member with a 2.5-in. inside diameter bronze bearing and housing welded in the center through which the pipe was placed during driving.
In order to obtain sufficient weight to load against during testing, forty-five portable reinforced concrete blocks were constructed. These blocks weighed approximately 160 lb. apiece and could be handled easily by two men. These, along with the frame weight, gave a total of approximately 7200 lb.
During the static test, loading was accomplished by an Allstate 5.0-ton hydraulic jack, below which was attached a 10,000-lb capacity proving ring and dial gage used to measure the loads.
PAGE FOUR
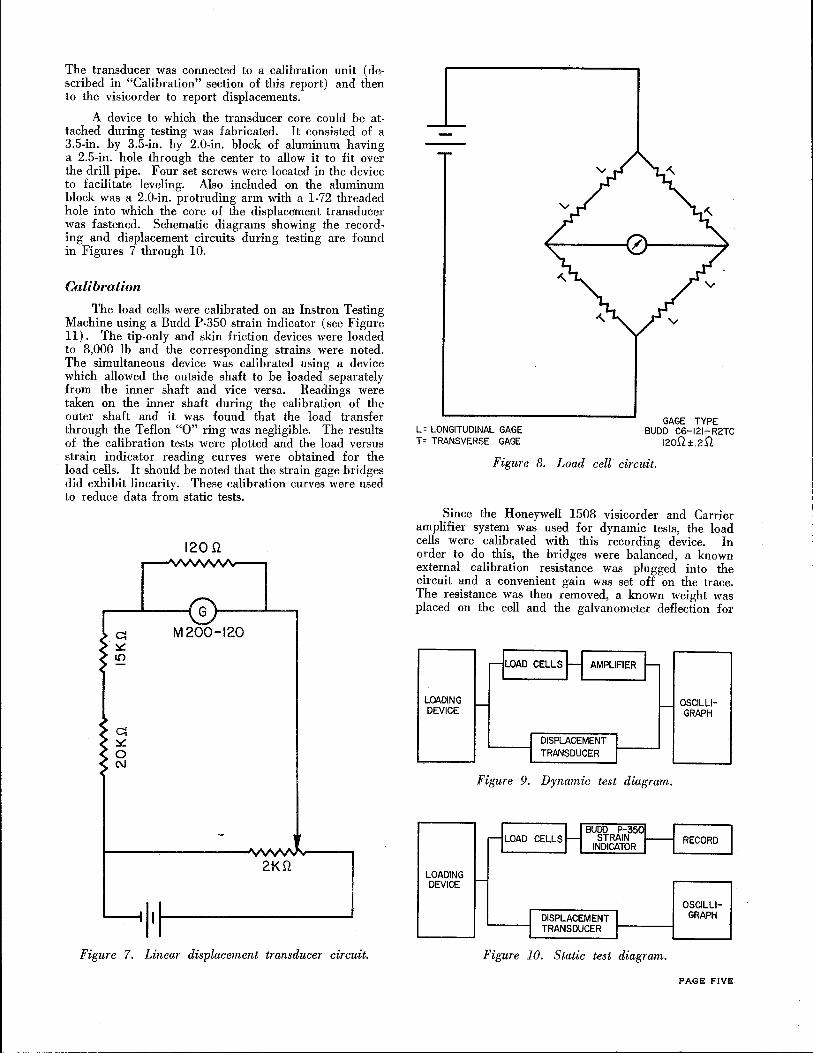
Load Recording Equipment
During static tests, a Budd P -350 strain indicator and a Honeywell 1508 visicorder oscillograph were used to record test data (see Figure 5).
The visicorder was used in conjunction with a linear displacement transducer (see next section) to record pile movement. The Budd strain indicator was used to measure strains in the bridges.
For dynamic tests, the strain gage bridgm were hooked into a Model 119 Car:Fier amplifier. From there, the signals went to the visicorder to record the dynamic loads (see Figure 6). The displacement transducer hook-up was the same as for static tests.
The visicorder utilized light sensiiive paper to record data. For static tests a paper speed of 0.1 in. per second was used and for dynamic te3ts, 80 in. per second.
Displacement Recording Equipment
In order to measure displacements during testing, a Sanborn Model 7DCDT-l000 displacement transducer was used. The transducer is the type which works on the principle that its output signal is directly proportional to the distance traveled of a high flux density permanent magnet through a differentially wound coil.
Figure 5. Static test recordtng equipment.
Figure 6. Dynamic test recording equipment.
~~- _____________________________________ _j
The transducer was connected to a calibration unit (described in "Calibration" section of this report) and then to the visicorder to report displacements.
A device to which the transducer core could be attached during testing was fabricated. It consisted of a 3.5-in. by 3.5-in. by 2.0-in. block of aluminum having a 2.5-in. hole through the center to allow it to fit over the drill pipe. Four set screws were located in the device to facilitate leveling. Also included on the aluminum block was a 2.0-in. protruding arm with a 1-72 threaded hole into which the core of the displacement transducer was fastened. Schematic diagrams showing the recording and displacement circuits during testing are found in Figures 7 through 10.
Calibration
The load cells were calibrated on an lnstron Testing Machine using a Budd P-350 strain indicator (see Figure ll). The tip-only and skin friction devices were loaded to 8,000 lb and the corresponding strains were noted. The simultaneous device was calibrated using a .device which allowed the outside shaft to be loaded separately from the inner shaft and vice versa. Readings were taken on the inner shaft during the calibration of the outer shaft and it was found that the load transfer through the Teflon "0" ring was negligible. The results of the calibration tests were plotted and the load versus strain indicator reading curves were obtained for the load cells. It should be noted that the strain gage bridges did exhibit linearity. These calibration curves were used to reduce data from static tests.
120 .n
G 1----L----,
c: M200-120 ~ l{)
2KQ
Figure 7. Linear displacement transducer circuit.
L= LONGITUDINAL GAGE T= TRANSVERSE GAGE
GAGE TYPE BUDD C6-121-R2TC
120ilt.2il
Figure 8. Load cell circuit.
Since the Honeywell 1508 visicorder and Carrier amplifier system was used for dynamic tests, the load cells were calibrated with this recording device. In order to do this, the bridges were balanced, a known external calibration resistance was plugged into the circuit and a convenient gain was set off on the trace. The resistance was then removed, a known weight was placed on the cell and the galvanometer deflection for
LOADING DEVICE
LOADING DEVICE
rlLOAD CELLS AMPLIFIER ~
- f-
I DISPLACEMENT L L TRANSDUCER I
Figure 9. Dynamic test diagram.
DISPLACEMENT TRANSDUCER t-----t
Figure 10. Static test diagram.
OSCILLI-GRAPH
OSCILLIGRAPH
PAGE FIVE
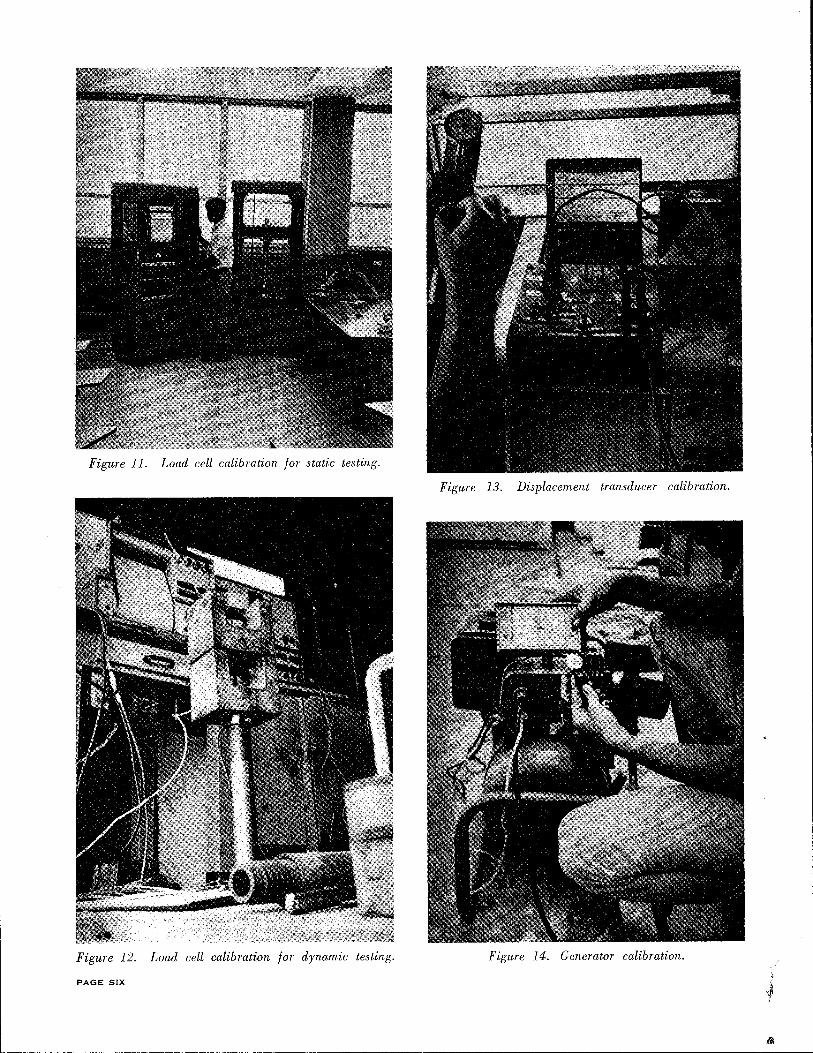
Figure 11. Load cell calibration for static testing.
Figure 13. Displacement transducer calibration.
Figure 12. Load cell calibration for dynamic testing. Figure 14. Generator calibration.
PAGE SIX
that particular weight was noted. This gave a calibration factor for that load cell at a specific gain (see Figure 12).
Before a static test the Budd P-350 strain indicator was .-palanced at full sensitivity with a load cell other than.;:•those being used for the test, it was then unplugged. Initi~J readings were then taken, before loading, of the bridges to be tested. This procedure was used because a switch and balance strain indicator unit was not available. During testing, the difference between initial reading and test reading was the strain in the cell under a particular load.
Preceding a dynamic test, it was only necessary to balance the bridges, plug in the external calibration resistance, set the desired gain, remove resistance and the system was ready to test.
The linear displacement transducer was calibrated using an Ames dial indicator and moving the magnetic core a known distance (see Figure 13). The resulting deflection of the galvanometer could be adjusted, using a variable resistance calibration unit, to a desired displacement scale.
The power for the recording equipment was supplied by a 2.5-kilowatt gasoline powered generator. To insure that fluctuations in the generator operating frequency did not cause varying test results, it was calibrated. This was accomplished by checking time on a clock connected to the generator with a watch. When both completed a specified period of time at the same instant, the generator was operating at 60 cycles per second. The generator could he slowed down or speeded up by throttle adjustments (see Figure 14).
Chapter III SOIL PROPERTIES
Boring Log
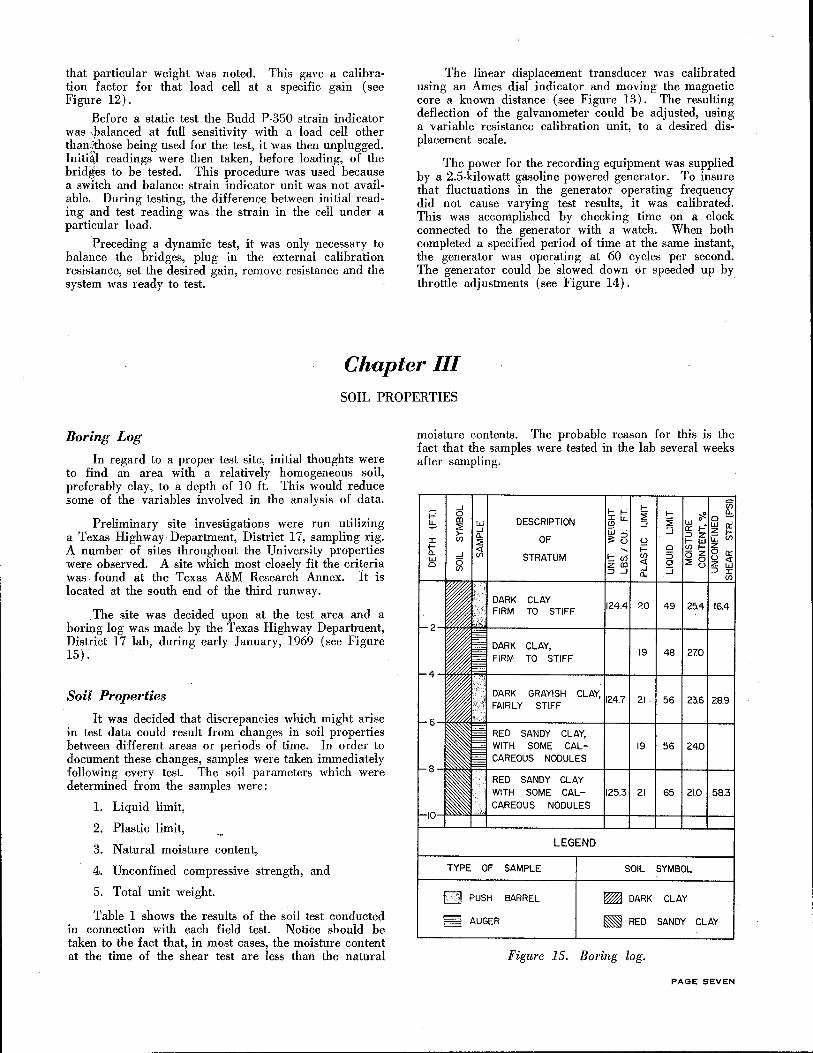
In regard to a proper test site, initial thoughts were to find an area with a relatively homogeneous soil, preferably clay, to a depth of 10 ft. This would reduce some of the variables involved in the analysis of data.
Preliminary site investigations were run utilizing a Texas Highway Department, District 17, sampling rig. A number of sites throughout the University properties were observed. A site which most closely fit the criteria was found at the Texas A&M Research Annex. It is located at the south end of the third runway.
. The site was decided upon at the test area and a boring log was made by the Texas Highway Department, District 17 lab, during early January, 1969 (see Figure 15).
Soil Propertie.<;
It was decided that discrepancies which might arise in test data could result from changes in soil properties between different areas or periods of time. In order to document these changes, samples were taken immediately following every test. The soil parameters which were determined from the samples were:
l. Liquid limit,
2. Plastic limit,
3. Natural moisture content,
4. Unconfined compressive strength, and
5. Total unit weight.
Table 1 shows the results of the soil test conducted in connection with each field test. Notice should be taken to the fact that, in most cases, the moisture content at the time of the shear test are less than the natural
moisture contents. The probable reason for this is the fact that the samples were tested in the lab several weeks after sampling.
f-1-' f-~ f-
DESCRIPTION :X:LL ~ (!) ::J w . ::J
OF ::a u i= 0
STRATUM (f) 5 <[ 0 ..J :J a.
DARK CLAY ?.0 49 25.4 16.4 FIRM TO STIFF
DARK CLAY, 19 48 27.0 FIRM TO STIFF
DARK GRAYISH CLAY, 21. 56 23.6 FAIRLY STIFF 28.9
RED SANDY CLAY, WITH SOME CAL- 19 56 24.0 CAREOUS NODULES
RED SANDY CLAY WITH SOME CAL- 21 65 21.0 58.3 CAR EO US NODULES
LEGEND
TYPE OF SAMPLE SOIL SYMBOL
D PUSH BARREL ~DARK CLAY
§ AUGER ~ RED SANDY CLAY
Figure 15. Boring log.
PAGE SEVEN
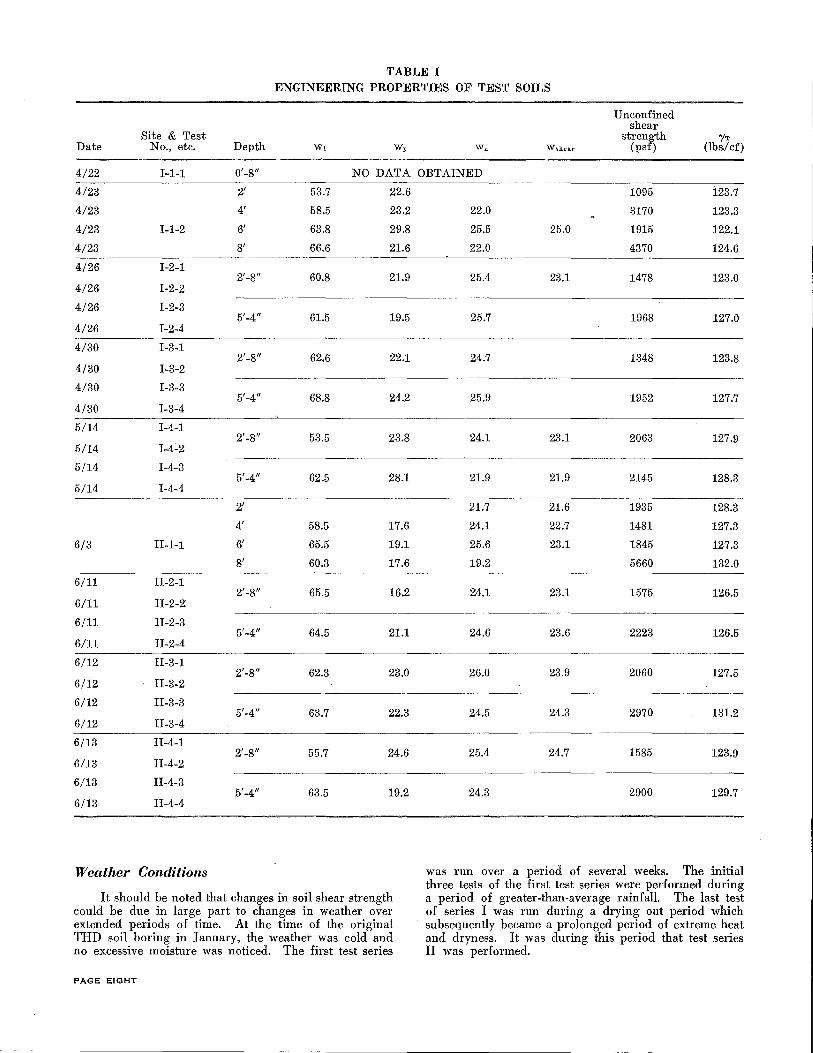
TABLE I
ENGINEERING PROPERTIES OF TEST SOILS
Unconfined shear
Site & Test strength ')IT Date No., etc. Depth WJ Wp Wn Wshear (psf) (lbs/cf)
4/22 1-1-1 0'-8" NO DATA OBTAINED
4/23 2' 53.7 22.6
4/23 4' 58.5 23.2
4/23 1-1-2 6' 63.8 29.8
4/23 8' 66.6 21.6
4/26 1-2-1 2'-8" 60.8 21.9
4/26 I-2-2
4/26 I-2-3 5'-4" 61.5 19.5
4/26 I-2-4
4/30 I-3-1 2'-8" 62.6 22.1
4/30 I-3-2
4/30 I-3-3 5'-4" 68.8 24.2
4/30 I-3-4
5/14 I-4-1 2'-8" 53.5 23.8
5/14 I-4-2
5/14 I-4-3 5'-4" 62.5 28.1
5/14 I-4-4
2'
4' 58.5 17.6
6/3 II-1-1 6' 65.5 19.1
8' 60.3 17.6
6/11 II-2-1 2'-8" 65.5 16.2
6/11 II-2-2
6/11 II-2-3 5'-4" 64.5 21.1
6/11 II-2-4
6/12 II-3-1 2'-8" 62.3 23.0
6/12 II-3-2
6/12 II-3-3 5'-4" 63.7 22.3
6/12 II-3-4
6/13 II-4-1 2'-8" 55.7 24.6
6/13 II-4-2
6/13 II-4-3 5'-4" 63.5 19.2
6/13 II-4-4
Weather Conditions
It should be noted that changes in soil shear strength could be due in large part to changes in weather over extended periods of time. At the time of the original THD soil boring in January, the weather was cold and no excessive moisture was noticed. The first test series
PAGE EIGHT
1095 123.7
22.0 3170 123.3
25 .. 5 25.0 1915 122.1
22.0 4370 124.6
25.4 23.1 1478 123.0
25.7 1968 127.0
24.7 1348 123.8
25.9 1952 127.7
24.1 23.1 20()3 127.9
21.9 21.9 2145 128.3
21.7 21.6 1935 128.3
24.1 22.7 1481 127.3
25.6 23.1 1845 127.3
19.2 5660 132.0
24.1 23.1 1575 126.5
24.6 23.6 2223 126.5
26.0 23.9 2060 127.5
24.5 24.3 2970 131.2
25.4 24.7 1585 123.9
24.3 2900 129.7
was run over a period of several weeks. The initial three tests of the first test series were performed during a period of greater-than-average rainfall. The last test of series I was run during a drying out period which subsequently became a prolonged period of extreme heat and dryness. It was during this period that test series II was performed.
Chapter IV TEST PROCEDURES
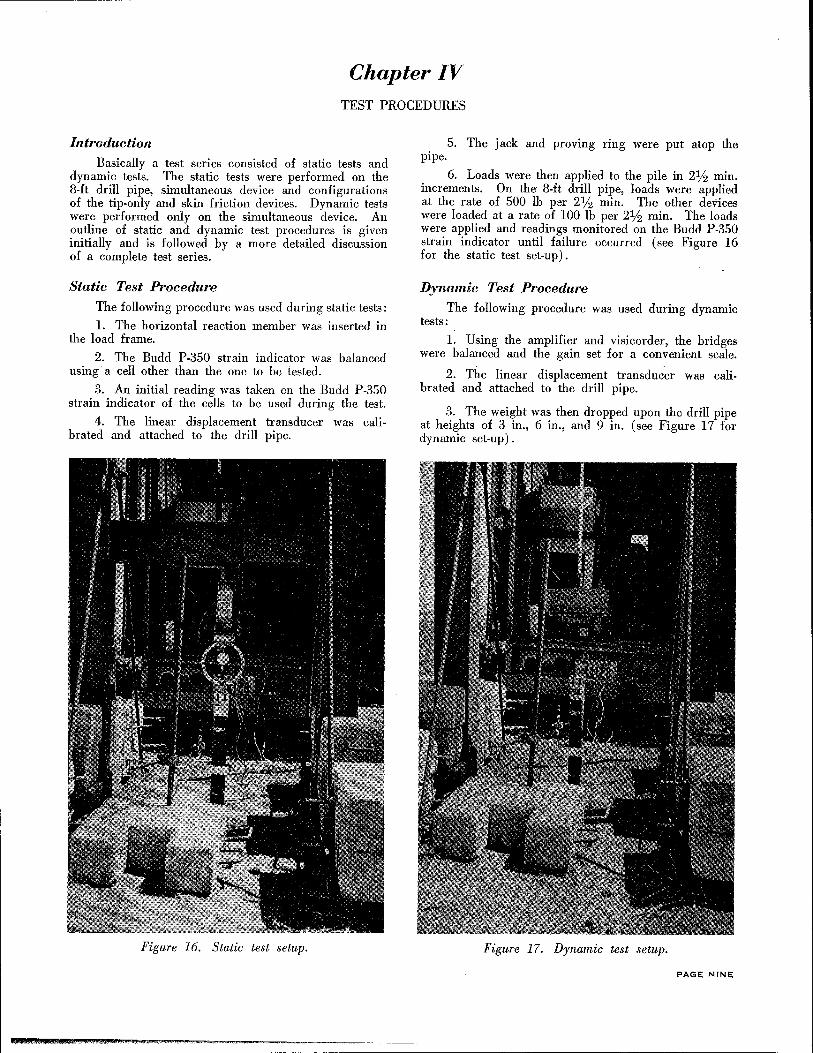
Introduction
Basically a test series consisted of static tests and dynamic tests. The static tests were performed on the 8·ft drill pipe, simultaneous device and configurations of the tip-only and skin friction devices. Dynamic tests were performed only on the simultaneous device. An outline of static and dynamic test procedures is given initially and is followed by a more detailed discussion of a complete test series.
Static Test Procedure
The following procedure was used during static tests:
l. The horizontal reaction member was inserted in the load frame.
2. The Budd P-350 strain indicator was balanced using· a cell other than the one to be tested.
3. An initial reading was taken on the Budd P-350 strain indicator of the cells to be used during the test.
4. The linear displacement transducer was calibrated and attached to the drill pipe.
Figure 16. Static test setup.
5. The jack and proving ring were put atop the pipe.
6. Loads were then applied to the pile in 2llz min. increments. On the 8-ft drill pipe, loads were applied at the rate of 500 lb per 21/z min. The other devices were loaded at a rate of 100 lb per 2llz min. The loads were applied and readings monitored on the Budd P-350 strain indicator until failure occurred (see Figure 16 for the static test set-up) .
Dynamic Test Procedure
The following procedure was used during dynamic tests:
l. Using the amplifier and visicorder, the bridges were balanced and the gain set for a convenient scale.
2. The linear displacement transduc~r was calibrated and attached to the drill pipe.
3. The weight was then dropped upon the drill pipe at heights of 3 in., 6 in., and 9 in. (see Figure 17 for dynamic set-up) .
Figure 17. Dynamic test setup.
PAGE NINE
HOLE 3 •
1 30"
HOLE 2 HOLE ~ HOLE 4 • • • I..- 30" J .. 30"-J
HOLE I' TEST OF 8 FT. INSTRUMENTED DRILL PIPE
HOLE 2• TESTS WITH SIMULTANEOUS DEVICE HOLE 3• TESTS WITH SKIN FRICTION DEVICE AT
TOP
HOLE 4• TESTS WITH SKIN FRICTION AND TIP ONLY DEVICES TOGETHER
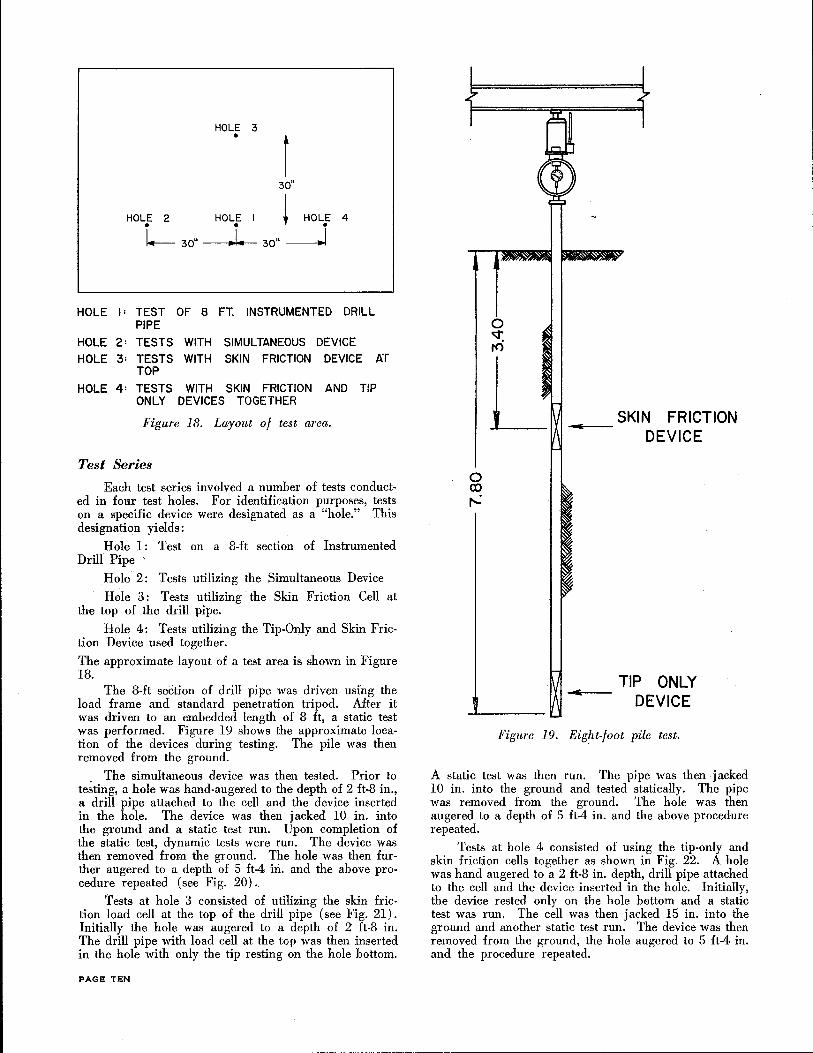
Figure 18. Layout of test area.
Test Series
Each test series involved a number of tests conducted in four test holes. For identification purposes, tests on a specific device were designated as a "hole." This designation yields:
Hole 1: Test on a 8-ft section of Instrumented Drill Pipe '
Hole 2: Tests utilizing the Simultaneous Device
Hole 3: Tests utilizing· the Skin Friction Cell at the top of the drill pipe.
Hole 4: Tests utilizing the Tip-Only and Skin Friction Device used together.
The approximate layout of a test area is shown in Figure 18.
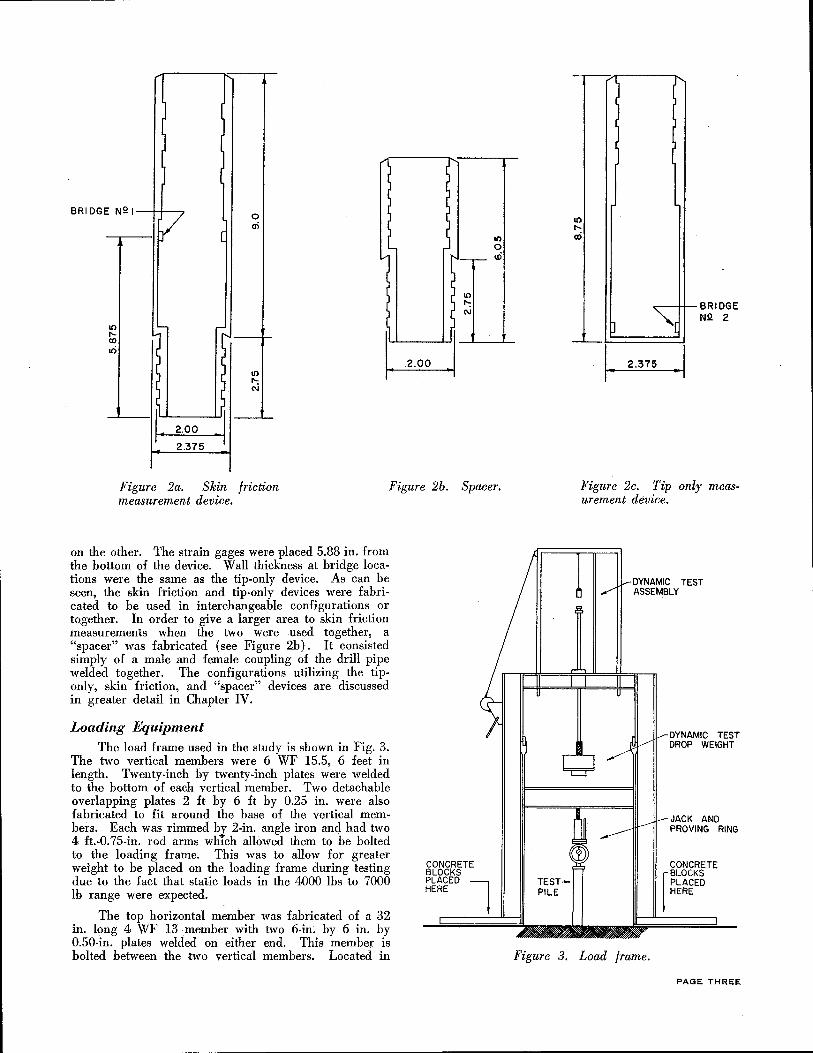
The 8-ft section of drill pipe was driven using the load frame and standard penetration tripod. After it was driven to an embedded length of 8 ft, a static test was performed. Figure 19 shows the approximate location of the devices during testing. The pile was then removed from the ground.
The simultaneous device was then tested. Prior to te~ting, a hole was hand-angered to the depth of 2 ft-8 in., a drill pipe attached to the cell and the device inserted in the hole. The device was then jacked 10 in. into the ground and a static test run. Upon completion of the static test, dynamic tests were run. The device was then removed from the ground. The hole was then further angered to a depth of 5 ft-4 in. and the above procedure repeated (see Fig. 20) ~
Tests at hole 3 consisted of utilizing the skin friction load cell at the top of the drill pipe (see Fig. 21). Initially the hole was angered to a depth of 2 ft-8 in. The drill pipe with load cell at the top was then inserted in the hole with only the tip resting on the hole bottom.
PAGE TEN
0 ro r--:
~
I"'"
0
:;, !
~~
•··
""'
SKIN FRICTION DEVICE
TIP ONLY DEVICE
Figure 19. Eight-foot pile test.
A static test was then run. The pipe was then jacked 10 in. into the ground and tested statically. The pipe was removed from the ground. The hole was then angered to a depth of 5 ft-4 in. and the above procedure repeated.
Tests at hole 4 consisted of using the tip-only and skin friction cells together as shown in Fig. 22. A hole was hand angered to a 2 ft-8 in. depth, drill pipe attached to the cell and the device inserted in the hole. Initially, the device rested only on the hole bottom and a static test was run. The cell was then jacked 15 in. into the ground and another static test run. The device was then removed from the ground, the hole angered to 5 ft-4 in. and the procedure repeated.
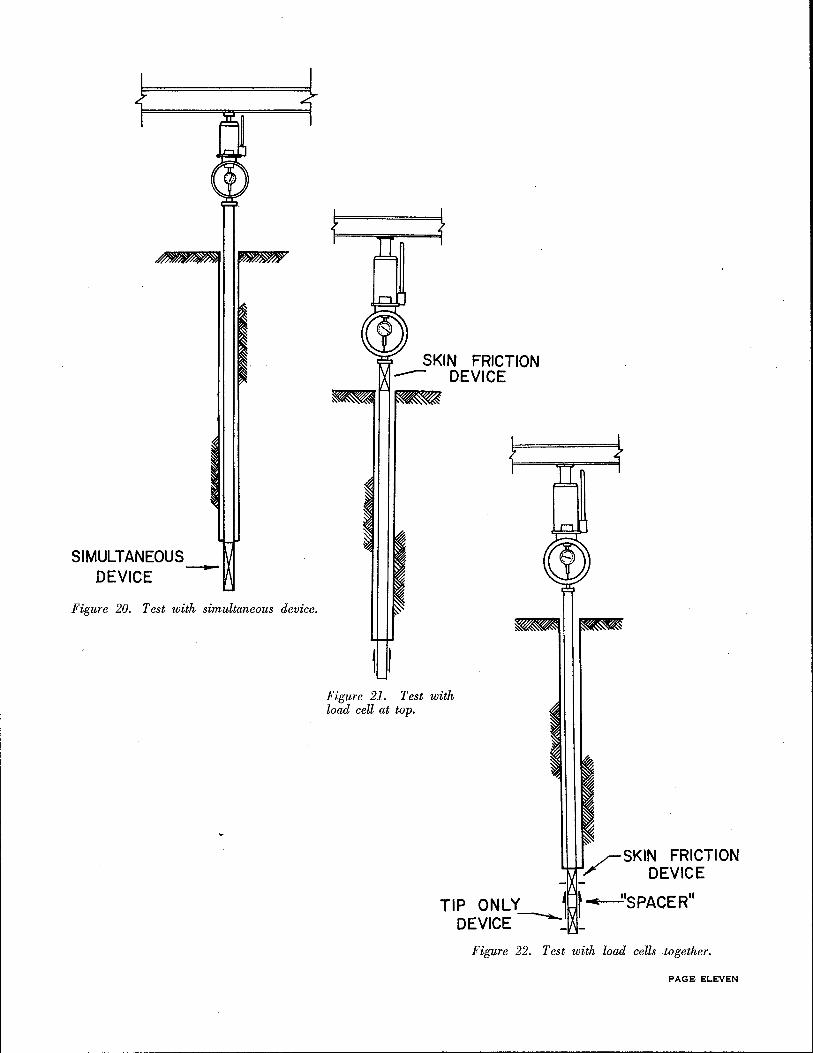
SIMULTANEOUS -DEVICE
Figure 20. Test with simultaneous device.
SKIN FRICTION --- DEVICE
Figure 21. Test with load cell at top.
1 ~SKIN FRICTION '/ DEVICE
TIP ONLY---..1 t~'SPACER11
DEVICE __
Figure 22. Test with load cells together.
PAGE ELEVEN
--- ________________________________________________ ___j
Chapter V ANALYSIS OF STATIC TESTS
Test Designation
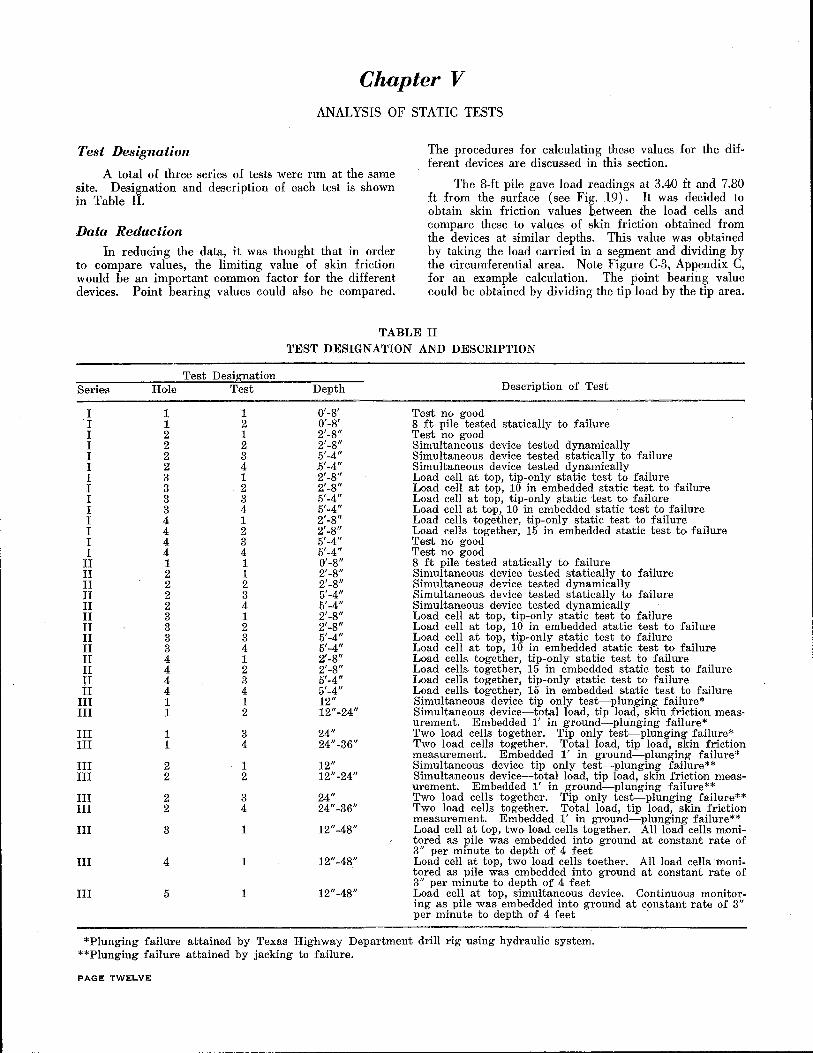
A total of three series of tests were run at the same site. Designation and description of each test is shown in Table II.
Data Reduction In reducing the data, it was thought that in order
to compare values, the limiting value of skin friction would be an important common factor for the different devices. Point bearing values could also be compared.
The procedures for calculating these values for the different devices are discussed in this section.
The 8-ft pile gave load readings at 3.40 ft and 7.80 ft from the surface (see Fig. 19). It was decided to obtain skin friction values between the load cells and compare these to values of skin friction obtained from the devices at similar depths. This value was obtained by taking the load carried in a segment and dividing by the circumferential area. Note Figure C-3, Appendix C, for an example calculation. The point bearing value could be obtained by dividing the tip load by the tip area.
TABLE II
Series
I I I I I I I I I I I I I I
II II II II II II II II II II II II II III III
III III
III III
III III
III
III
III
Test Designation Hole Test
1 1 1 2 2 1 2 2 2 3 2 4 3 1 3 2 3 3 3 4 4 1 4 2 4 3 4 4 1 1 2 1 2 2 2 3 2 4 3 1 3 2 3 3 3 4 4 1 4 2 4 3 4 4 1 1 1 2
1 3 1 4
2 1 2 2
2 3 2 4
3 1
4 1
5 1
TEST DESIGNATION AND DESCRIPTION
Depth
0'-8' 0'-8' 2'-8" 2'-8" 5'-4" .5'-4" 2'-8" 2.'-8" 5'-4" 5'-4" 2'-8" 2'-8" 5'-4" 5'-4" 0'-8" 2'-8" 2'-8" 5'-4" 5'-4" 2'-8" 2'-8" 5'-4" 5'-4" 2'-8" 2'-8" 5'-4" 5'-4" 12" 12"-24"
24" 24"-36"
12" 12"-24"
24" 24"-36"
12"-48"
12"-48"
12"-48"
Description of Test
Test no good 8 ft pile tested statically to failure Test no good Simultaneous device tested dynamically Simultaneous device tested statically to failure Simultaneous device tested dynamically Load cell at top, tip-only static test to failure Load cell at top, 10 in embedded static test to failure Load cell at top, tip-only static test to failure Load cell at top, 10 in embedded static test to failure Load cells together, tip-only static test to failure Load cells together, 15 in embedded static test to· failure Test no good Test no good 8 ft pile tested statically to failure Simultaneous device tested statically to failure Simultaneous device tested dynamically Simultaneous device tested statically to failure Simultaneous device tested dynamically Load cell at top, tip-only static test to failure Load cell at top, 10 in embedded static test to failure Load cell at top, tip-only static test to failure Load cell at top, 10 in embedded static test to failure Load cells together, tip-only static test to failure Load cells together, 15 in embedded static test to failure Load cells together, tip-only static test to failure Load cells together, 15 in embedded static test to failure Simultaneous device tip only test-plunging failure* Simultaneous device-total load, tip load, skin friction measurement. Embedded 1' in ground-plunging failure* Two load cells together. Tip only test-plunging failure* Two load cells together. Total load, tip load, skin friction measurement. Embedded 1' in ground-plunging failure* Simultaneous device tip only test-plunging failure** Simultaneous device-total load, tip load, skin friction measurement. Embedded 1' in ground-plunging failure** Two load cells together. Tip only test-plunging failure** Two load cells together. Total load, tip load, skin friction measurement. Embedded 1' in ground-plunging failure** Load cell at top, two load cells together. All load cells monitored as pile was embedded into ground at constant rate of 3" per minute to deP'th of 4 feet Load cell at top, two load cells toether. All load cells monitored as pile was embedded into ground at constant rate of 3" per minute to depth of 4 feet Load cell at top, simultaneous device. Continuous monitoring as pile was embedded into ground at constant rate of 3" per minute to depth of 4 feet
*Plunging failure attained by Texas Highway Department drill rig using hydraulic system. **Plunging failure attained by jacking to failure.
PAGE TWELVE
------------ -
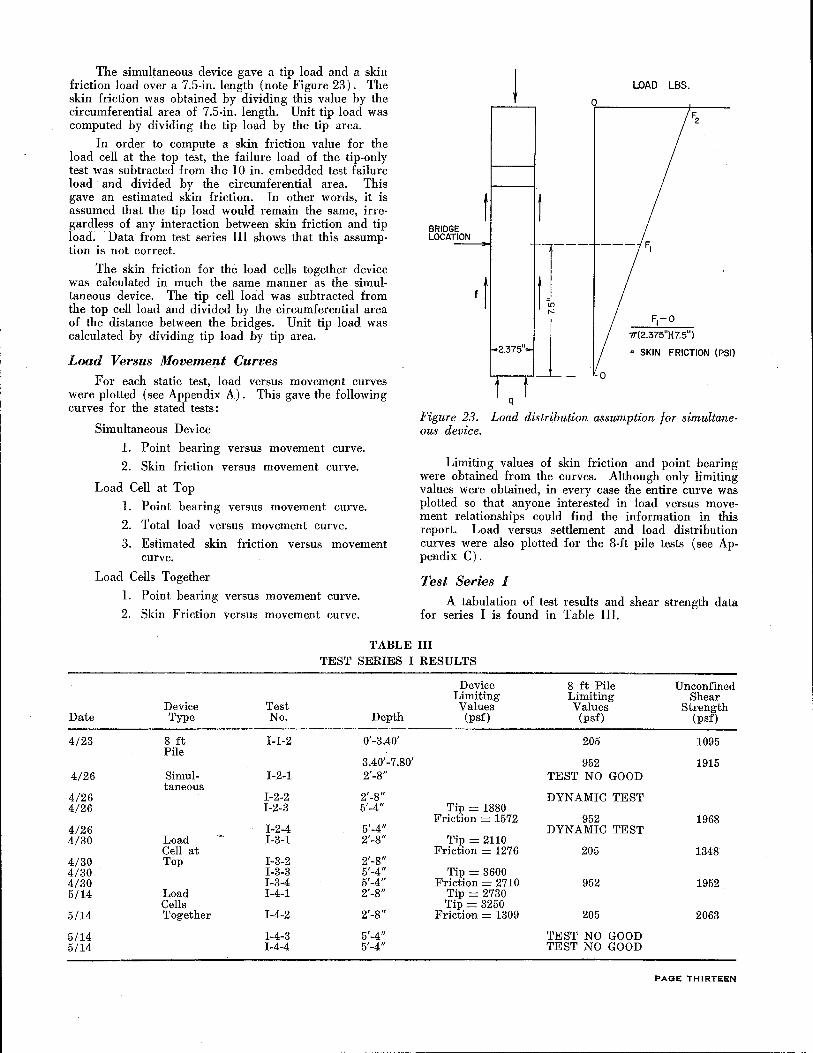
The simultaneous device gave a tip load and a skin friction load over a 7.5-in. length (note Figure 23). The skin friction was obtained by dividing this value by the circumferential area of 7.5-in. length. Unit tip load was computed by dividing the tip load by the tip area.
In order to compute a skin friction value for the load cell at the top test, the failure load of the tip-only test was subtracted from the 10 in. embedded test failure load and divided by the circumferential area. This gave an estimated skin friction. In other words, it is assumed that the tip load would remain the same, irregardless of any interaction between skin friction and tip load. Data from test series III shows that this assumption is not correct.
The skin friction for the load cells together device was calculated in much the same manner as the simultaneous device. The tip cell load was subtracted from the top cell load and divided by the circumferential area of the distance between the bridges. Unit tip load was calculated by dividing tip load by tip area.
Load Versus Movement Curves
For each static test, load versus movement curves were plotted (see Appendix A). This gave the following curves for the stated tests:
Simultaneous Device
l. Point bearing versus movement curve.
2. Skin friction versus movement curve.
Load Cell at Top
l. Point bearing versus movement curve.
2. Total load versus movement curve.
3. Estimated skin friction versus movement curve.
Load Cells Together
l. Point bearing versus movement curve.
2. Skin Friction versus movement curve.
t E BRIDG
LOCAT ·~
f t
-2.375" ...
t t q
LOAD LBS.
0
t 1--
t
0 l_ 7T(2.375")(7.5")
= SKIN FRICTION (PSI)
Figure 23. Load distribution assumption for simultaneous device.
Limiting values of skin friction and point bearing were obtained from the curves. Although only limiting values were obtained, in every case the entire curve was plotted so that anyone interested in load versus movement relationships could find the information in this report. Load versus settlement and load distribution curves were also plotted for the 8-ft pile tests (see Appendix C).
Test Series I
A tabulation of test results and shear strength data for series I is found in Table III.
TABLE III
Date
4/23
4/26
4/26 4/26
4/26 4/30
4/30 4/30 4/30 5/14
5/14
5/14 5/14
Device Type
8ft Pile
Simultaneous
Load Cell at Top
Load Cells Together
Test No.
I-1-2
I-2-1
I-2-2 I-2-3
I-2-4 I-3-1
I-3-2 I-3-3 I-3-4 I-4-1
I-4-2
I-4-3 I-4-4
TEST SERIES I RESULTS
Device Limiting Values
Depth (psf)
0'-3.40'
3.40'-7.80' 2'-8"
2'-8" .5'-4" Tip= 1880
Friction = 1572 5'-4" 2'-8" Tip= 2110
Friction = 1276 2'-8" 5'-4" Tip= 3600 5'-4" Friction = 2710 2'-8" Tip= 2730
2'-8" Tip= 3250
Friction = 1309
5'-4" 5'-4"
8 ft Pile Limiting Values (psf)
205
952 TEST NO GOOD
DYNAMIC TEST
952 DYNAMIC TEST
205
952
205
TEST NO GOOD TEST NO GOOD
Unconfined Shear
Strength (psf)
1095
1915
1968
1348
1952
2063
PAGE THIRTEEN
The limiting value of skin friction for the upper 3.40 ft of the 8-foot pile (Test 1-l-2) is very low (205 psf). It was observed during driving of the section that a small gap extended to some unknown depth around the test pile at the ground surface. It was judged that this was possibly caused by repeated jarring of the soil during driving. It was also thought that overburden pressures would cause closure of the gap at greater depths. Therefore, it would seem that the upper skin friction values should not be considered as being a representative value. The average skin friction value for the lower part of the 8-ft pile was found to be 952 psf. This compared to values of 1572 psf and 2710 psf obtained from the devices in Tests 1-2-3 and I-3-4, respectively. These values do not compare favorably and there seems to be little correlation either between the devices or with the 8-foot instrumented section.
An attempt was made to explain the lack of correlation by studying the changes in soil shear strength in the different test holes. It should be noted at this point that unconfined compression tests were not run immediately following sampling. Samples were wrapped and waxed when taken and stored in a moisture room. It was found that the moisture contents for the unconfined compression test samples were not the same as the moisture contents for the in-situ samples. Table I, Chapter III shows the changes noted in the moisture contents. Some of the shear test moisture contents in series I are absent due to loss of moisture cans in the drying oven. Because of the changes in moisture, which in turn resulted in shear strength changes, it was felt that soil shear strength could not be used to explain differences in the in-situ measurements.
Tests 1-4-l and 1-4-2 indicate that point bearing values increased when the device was embedded 15 inches. This is shown due to the fact that Test 1-4-l was a tip-only test at the bottom of the hole and Test 1-4-2 was an embedded test with both skin friction and point bearing measurements.
Tests I-l-l, I-2-l, I-4-3, and 1-4-4 were no good due to instrumentation difficulties which occurred after the tests started.
Test Series II
A tabulation of test results and shear strength data for series_ II can be found in Table IV.
For the reason that has been stated in the previous section, the skin friction value of 132 psf over the top 3.40 feet of the 8-foot pile is questionable.
The lower part of the 8-foot pile had an average skin friction value of 1670 psf. Test II-2-3 had a friction value of 1805 psf, whjch is a percent error of 8.08%. Test II-3-4 showed a friction value of 1770 psf which yields a percent error of 5.98%. Test II-4-4 had a friction value of 2490 psf giving a percent error of 49.1 %. Shear strength values could not be used to explain the lack of correlation of Test II-4-4 as the shear strength for Test II-3-4 is essentially the same as for Test 11-4-4 yet a large difference shows up in skin friction values. It is possible that these shear strength values are not correct because of changes in moisture content which occurred between sampling and testing as discussed previously.
Tests II-4-l, II-4-2, and tests 11-4-3 and 11-4-4 indicate also that point bearing is greater in an embedded test as compared to a tip-only test. Test Il-4-3, a tip-only test, gives a point bearing value of 4460 psf whereas Test II-4-4, an embedded test, gives a point bearing value of 10,000 psf. Such a large increase does not seem possible unless the tip in the later test was situated in a soil strata with a much higher shear strength.
As a result of the apparent lack of correlation of the data from test series I and II, it was decided that a change in test procedures should be made and a third series of tests should be conducted. Instead of trying to correlate limiting values of skin friction in different test holes, it was felt that emphasis should be placed on comparing the changes in frictional resistance resulting from changes in tip load and soil shear strength in one test hole. Any changes should correlate with changes in soil shear strength if the shear strength determinations are made immediately after field testing:
TABLE IV TEST SERIES ·n RESULTS
Device 8 ft Pile Unconfined Limiting Limiting Shear
Test Values Values Strength No. Depth (psf) (psf) (psf)
Device Date Type
6/3 8 ft Pile II-1-1 0'-3.40' 132 1935 3.40'-7.80' 1670 1845
6/11 Simul- II-2-1 2'-8" Tip= 2059 taneous Friction = 1145 132 1575
II-2-2 2'-8" DYNAMIC TEST 11-2-3 5'-4" Tip= 2910
Friction = 1805 1670 ·2223 II-2-4 5'-4" DYNAMIC TEST
6/12 Load Il-3-1 2'-8" Tip= 2730 Cell at 11-3-2 2'-8" Friction = 134.5 132 2060
11-3-3 5'-4" Tip= 3600 11-3-4 5'-4" Friction = 1770 1670 2970
Top
6/13 Load 11-4-1 2'-8" Tip= 2760 Cells II-4-2 2'-8" Tip= 3025
Friction = 1735 132 1585 11-4-3 5'-4" Tip= 4460 11-4-4 5'-4" Tip= 10,000
Together
Friction = 2490 1670 2900
PAGE FOURTEEN
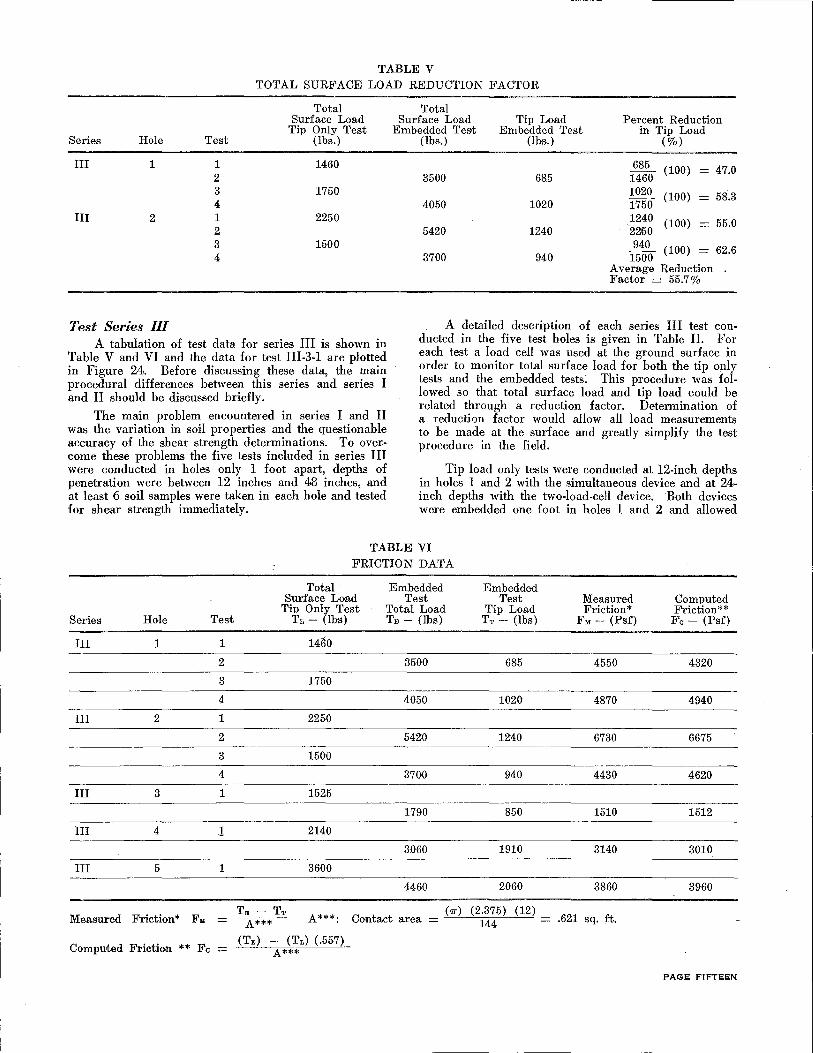
TABLE V
TOTAL SURFACE LOAD REDUCTION FACTOR
Total Surface Load
Tip Only Test Series Hole Test (lbs.)
III 1 1 1460 2 3 1750 4
III 2 1 2250 2 3 1500 4
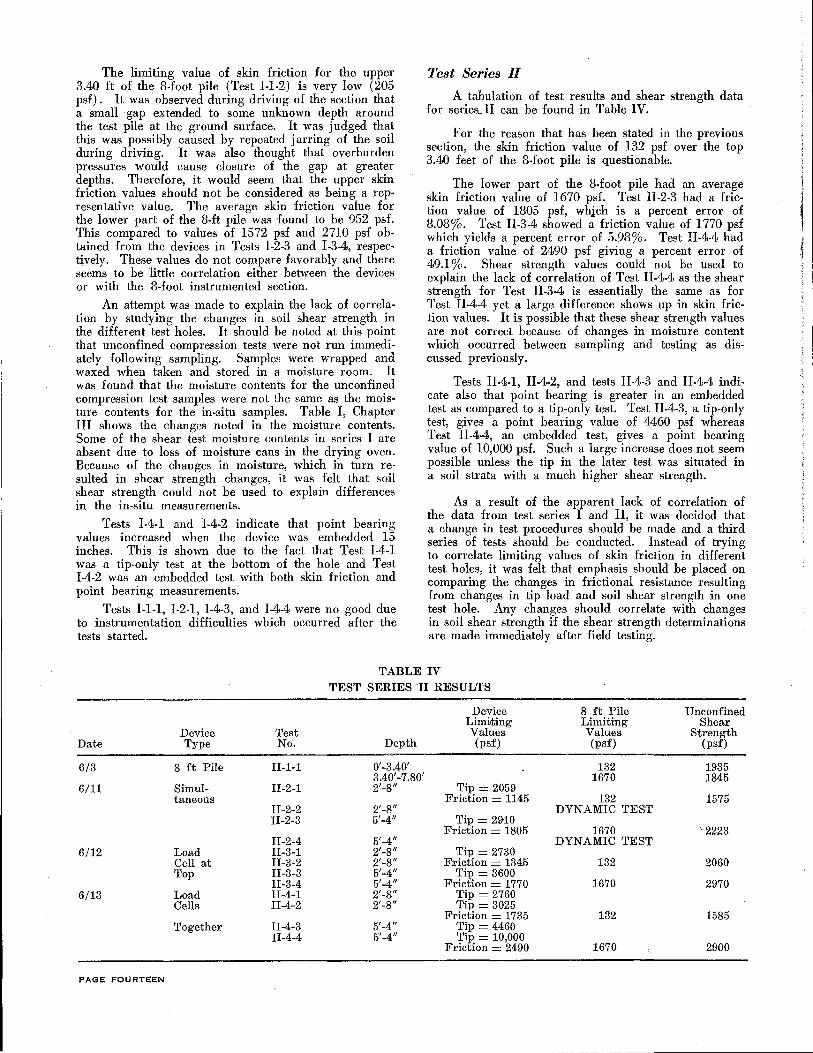
Test Series Ill A tabulation of test data for series III is shown in
Table V and VI and the data for test III-3-l are plotted in Figure 24. Before discussing these data, the main procedural differences between this series and series I and II should be discussed briefly.
The main problem encountered in series I . and II was the variation in soil properties and the questionable accuracy of the shear strength determinations. To over.come these problems the five tests included in series III were conducted in holes only l foot apart, depths of penetration were between 12 inches and 48 inches, and at least 6 soil samples were taken in each hole and tested for shear strength immediately.
Total Surface Load Tip Load Percent Reduction
Embedded Test Embedded Test in Tip Load (lbs.) (lbs.) (%)
685 (100) 47.0 3500 68.5 1460
1020 (100) 58.3 4050 1020 1750-
1240 (100) 55.0 5420 1240 2250
940 (100) 62.6 3700 940 l500
Average Reduction Factor = 55.7%
A detailed description of each series III test conducted in the five test holes is given in Table II. For each test a load cell was used at the ground surface in order to monitor total surface load for both the tip only tests and the embedded tests. This procedure was followed so that total surface load and tip load could be related through a reduction factor. Determination of a reduction factor would allow all load measurements to be made at the surface and greatly simplify the test procedure in the field.
Tip load only tests were conducted at 12-inch depths in holes l and 2 with the simultaneous device and at 24-inch depths with the two-load-cell device. Both devices were embedded one foot in holes 1 and 2 and allowed
TABLE VI
FRICTION DATA
Total Embedded Embedded Surface Load Test Test Measured Computed
Tip Only Test Total Load Tip Load Friction* Friction** Series Hole Test Tr,- (lbs) Tm- (lbs) TT- (lbs) F"- (Psf) Fe- (Psf)
III 1 1 1460
2 3500 685 4550 4320
3 1750
4 4050 1020 4870 4940
III 2 1 2250
2 5420 1240 6730 6675
3 1500
4 3700 940 4430 4620
III 3 1 1525
1790 850 1510 1512
III 4 1 2140
3060 1910 3140 3010
III 5 1 3600
4460 2060 3860 3960
Measured Friction* F .. T,- TT
A***: Contact area = (7T) (2.375) (12)
. 621 sq. ft . A***- 144
Computed Friction ** Fe (T,.) - (TL) (.557)
A***
PAGE FIFTEEN
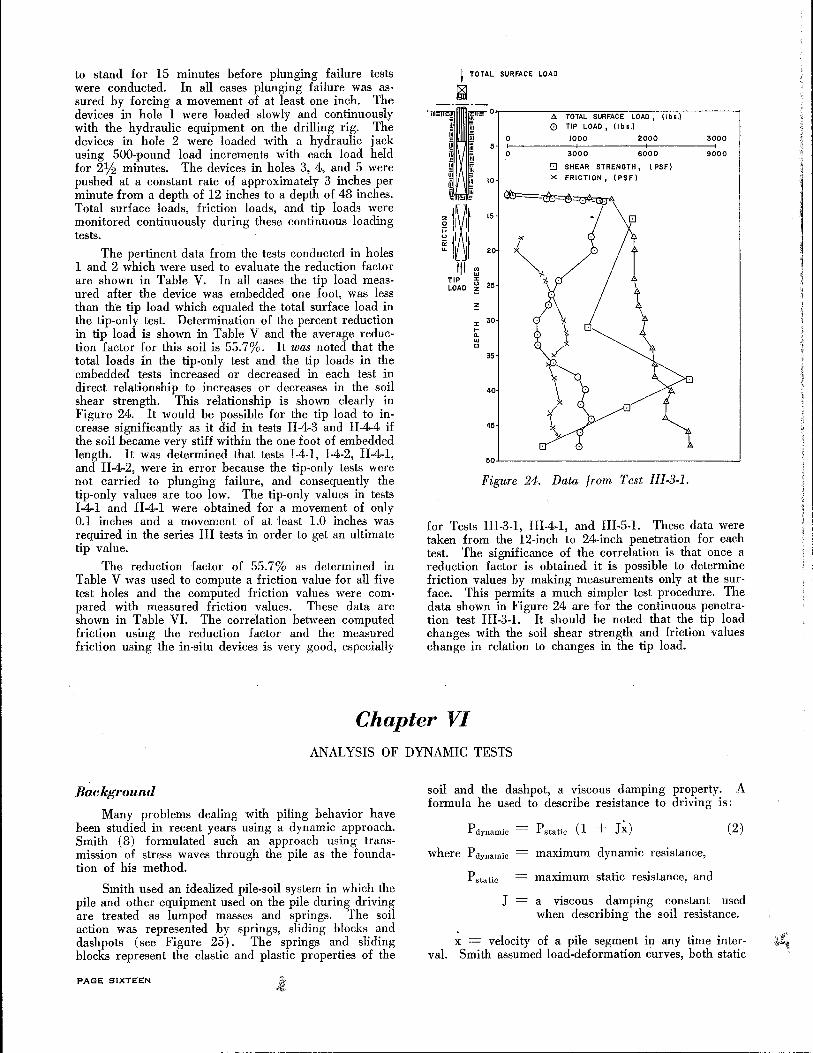
to stand for 15 minutes before plunging failure tests were conducted. In all cases plunging failure was assured by forcing a movement of at least one inch. The devices in hole 1 were loaded slowly and continuously with the hydraulic equipment on the drilling rig. The devices in hole 2 were loaded with a hydraulic .i ack using 500-pound load increments with each load held for 2lf2 minutes. The devices in holes 3, 4, and 5 were pushed at a constant rate of approximately 3 inches per minute from a depth of 12 inches to a depth of 48 inches. Total surface loads, friction loads, and tip loads were monitored continuously during these continuous loading tests.
The pertinent data from the tests conducted in holes 1 and 2 which were used to evaluate the reduction factor are shown in Table V. In all cases the tip load measured after the device was embedded one foot, was less than the tip load which equaled the total surface load in the tip-only test. Determination of the percent reduction in tip load is shown in Table V and the average reduction factor for this soil is 55.7%. It was noted that the total loads in the tip-only test and the tip loads in the embedded tests increased or decreased in each test in direct relationship to increases or decreases in the soil shear strength. This relationship is shown clearly in Figure 24. It would be possible for the tip load to increase significantly as it did in tests II-4-3 and II-4-4 if the soil became very stiff within the one foot of embedded length. It was determined that tests I-4-1, I-4-2, II-4-1, and II-4-2, were in error because the tip-only tests were not carried to plunging failure, and consequently the tip-only values are too low. The tip-only values in tests I-4-1 and II-4-1 were obtained for a movement of only 0.1 inches and a movement of at least 1.0 inches was required in the series III tests in order to get an ultimate tip value.
The reduction factor of 55.7% as determined in Table V was used to compute a friction value for all five test holes and the computed friction values were compared with measured friction values. These data are shown in Table VI. The correlation between computed friction using the reduction factor and the measured friction using the in-situ devices is very good, especially
I TOTAL SURFACE LOAD
~
1~1 l' I~ Ill "' "' TIP :I:
LOAD 0
"" "" :I: 1-a. "' 0
10
25
30
35
40
45
.8. TOTAL SURFACE LOAD, (lbs.) 0 TIP LOAD, libs.)
0 1000 2000 3000 ~------~--------+--------0 3000 6000 9000
[!] SHEAR STRENGTH, l PSF)
X FRICTION, ( PSF)
Figure 24. Data from Test III-3-1.
for Tests 111-3-1, Ill-4-1, and III-5-1. These data were taken from the 12-inch to 24-inch penetration for each test. The significance of the correlation is that once a reduction factor is obtained it is possible to determine friction values by making measurements only at the surface. This permits a much simpler test procedure. The data shown in Figure 24 are for the continuous penetration test III-3-1. It should be noted that the tip load changes with the soil shear strength and friction values change in relation to changes in the tip load.
Chapter VI ANALYSIS OF DYNAMIC TESTS
Background
Many problems dealing with piling behavior have been studied in recent years using a dynamic approach. Smith ( 8) formulated such an approach using transmission of stress waves through the pile as the foundation of his method.
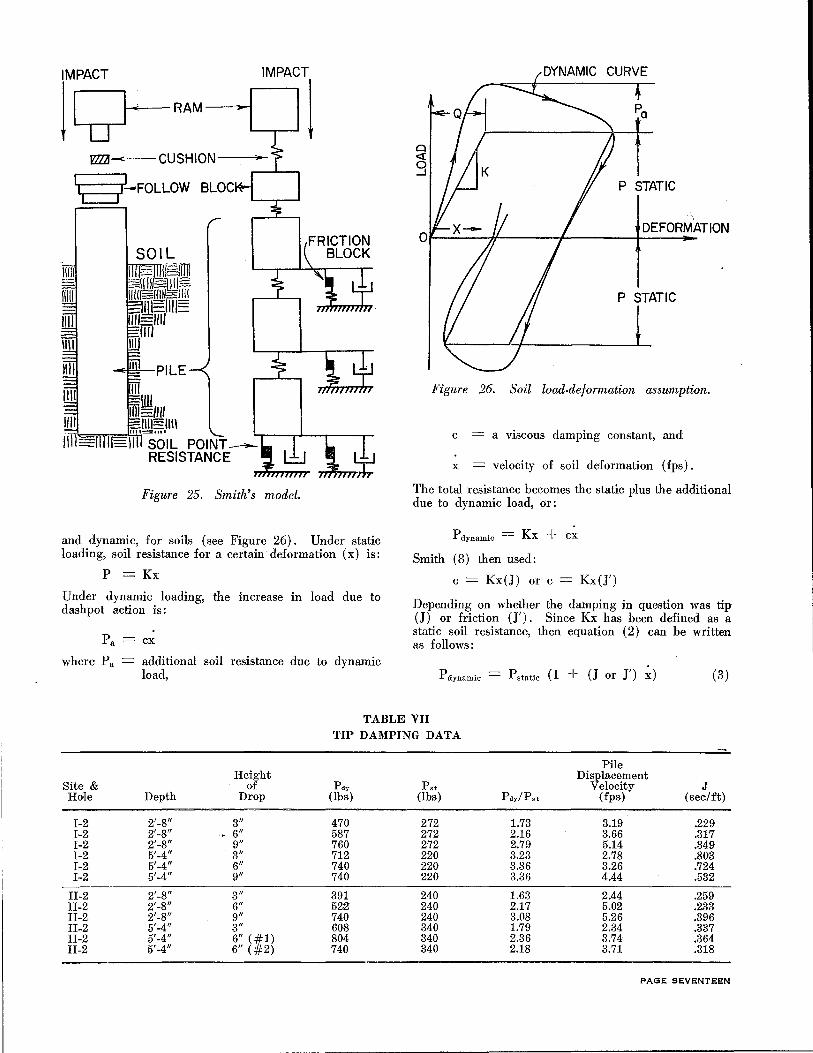
Smith used an idealized pile-soil system in which the pile and other equipment used on the pile during driving are treated as lumped masses and springs. The soil action was represented by springs, sliding blocks and dash pots (see Figure 25) . The springs and sliding blocks represent the elastic and plastic properties of the
PAGE SIXTEEN
soil and the dashpot, a viscous damping property. A formula he used to describe resistance to driving is:
Pdynamic
where P dynamic
P static
J
Pstatic (1 + J~) (2)
maximum dynamic resistance,
maximum static resistance, and
a viscous damping constant used when describing the soil resistance.
x velocity of a pile segment in any time inter-val. Smith assumed load-deformation curves, both static
r9-- RAM----'
IMPACT!
Fm CUSHION---"-
§-FOLLOW BLOC
Figure 25. Smith's model.
and dynamic, for soils (see Figure 26). Under static loading, soil resistance for a certain' deformation (x) is:
P = Kx
Under dynamic loading, the increase in load due to dash pot action is:
Pa =ex
where P a = additional soil resistance due to dynamic load,
P STATIC
DEFORMATION
P STATIC
Figure 26. Soil load-deformation assumption.
c - a viscous damping constant, and
x = velocity of soil deformation (fps).
The total resistance becomes the static plus the additional due to dynamic load, or:
P dynamic = Kx + ex
Smith (8) then used:
c = Kx(J) or c = Kx(J')
Depending on whether the damping in question was tip (J) or friction (J'). Since Kx has been defined as a static soil resistance, then equation (2) can be written as follows:
Pdynamic Pstatic (l + (J or J') x) (3)
TABLE VII
TIP DAMPING DATA
Pile Height Displacement
Site & of Pdy Pst Velocity J Hole Depth Drop (lbs) (lbs) Pdy/P,. (fps) (sec/ft)
I-2 2'-8" 3" 470 272 1.73 3.19 .229 I-2 2'-8" - 6" 587 272 2.16 3.66 .317 I-2 2'-8" 9" 760 272 2.79 5.14 .349 I-2 5'-4" 3" 712 220 3.23 2.78 .803 I-2 5'-4" 6" 740 220 3.36 3.26 .724 I-2 5'-4" 9" 740 220 3.36 4.44 .532
11-2 2'-8" 3" 391 240 1.63 2.44 .259 11-2 2'-8" 6" 522 240 2.17 5.02 .233 11-2 2'-8" 9" 740 240 3.08 5.26 .396 11-2 5'-4" 3" 608 340 1.79 2.34 .337 11-2 5'-4" 6" (#1) 804 340 2.36 3.74 .364 11-2 5'-4" 6" ( #2) 740 340 2.18 3.71 .318
PAGE SEVENTEEN
------~--------- -
0.9
0.8
0.7
Q6
0.2
Ql
A
A
0 2'8" DEPTH
A 5'4" DEPTH
514 11
----------~----
A • e0 --------"'-~--
0 0 2'8n G
0o~--~~.o---2~0--~30---4~0--~5~.0--~60-
DI SPLACEMENT VELOCITY FPS
Figure 27. Tip damping constant vs pile displacement velocity.
Data Reduction
The viscous damping constants J and J' were the unknowns in the analysis. They were calculated from equation ( 3) as follows:
J
and
J'
P dynamic (tip) P static (tip)
X
-I
P dynamic (friction) Pstatic (friction)
X
-I
Table VII shows the values for J obtained from the dynamic tests and Table VIII shows the values obtained for J'.
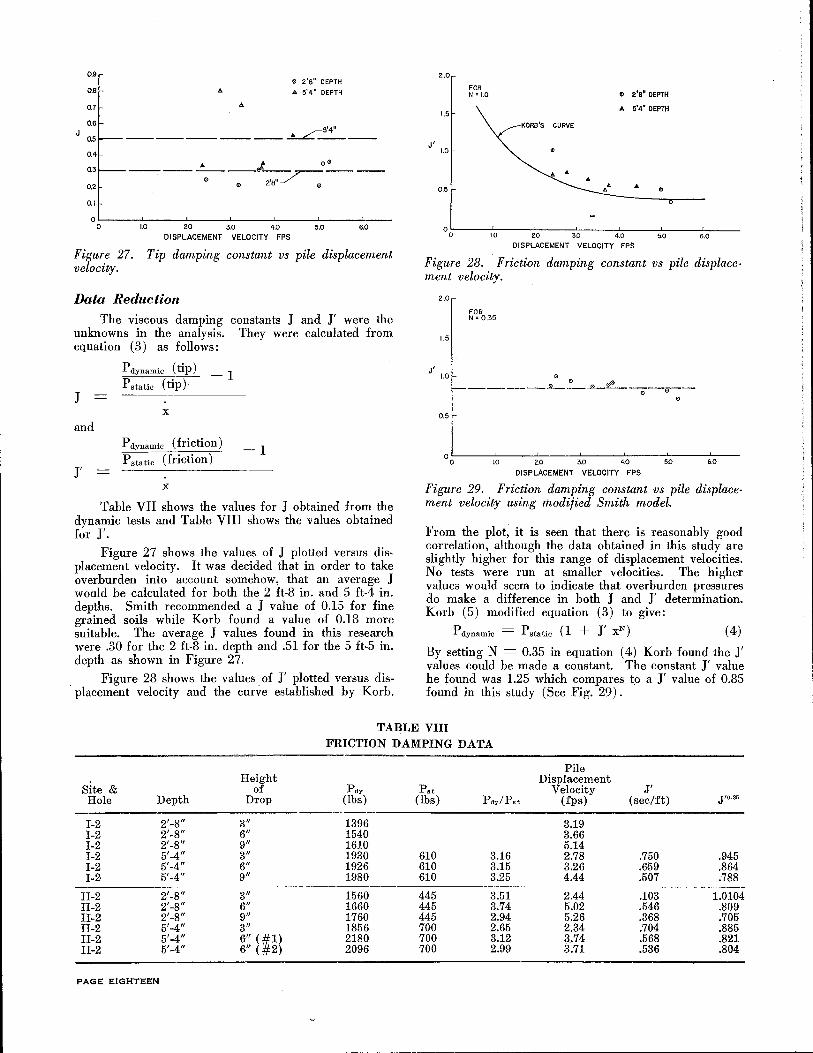
Figure 27 shows the values of J plotted versus displacement velocity. It was decided that in order to take overburden into account somehow, that an average J would be calculated for both the 2 ft-8 in. and 5 ft-4 in. depths. Smith recommended a J value of 0.15 for fine grained soils while Korb found a value of 0.18 more suitable. The average J values found in this research were .30 for the 2 ft-8 in. depth and .51 for the 5 ft-5 in. depth as shown in Figure 27.
. Figure 28 shows the values . of J' plotted versus dis-placement velocity and the curve established by Korb.
2.0
FOR N •1.0
1.5
J' 1.0
0.5
0 0
KORB'S CURVE
"
<!> 2'8" DEPTH
A 5'4" DEPTH
.. "
1.0 2.0 30 4.0 5.0
DISPLACEMENT VELOCITY FPS 6.0
Figure 28. Friction damping constant vs pile displacement velocity.
J'
2.0
1.5
1.0
0.5
FOR N • 0.35
0
--------L--"-~~----e--0
"
oL---~--~---L--~---~--~-~ o w w m w w w
DISPLACEMENT VELOCITY FPS
Figure 29. Friction damping constant vs pile displacement velocity using modified Smith model.
From the plot, it is seen that there is reasonably good correlation, although the data obtained in this study are slightly higher for this range of displacement velocities. No tests were run at smaller velocities. The higher values would seem to indicate that overburden pressures do make a difference in both J and J' determination. Korb (5) modified equation (3) to give:
Pdynamic = Pstatic (I + J' xN) (4) By setting N = 0.35 in equation ( 4) Korb found the J' values could be made a constant. The constant J' value he found was 1.25 which compares to a J' value of 0.85 found in this study (See Fig. 29).
TABLE VIII
FRICTION DAMPING DATA
Height Site & of pdy
Hole Depth Drop (lbs)
I-2 2'-8" 3" 1396 I-2 2'-8" 6" 1540 I-2 2'-8" 9" 1610 I-2 5'-4" 3" 1930 I-2 5'-4" 6" 1926 I-2 5'-4" 9" 1980
II-2 2'-8" 3" 1560 II-2 2'-8" 6" 1660 II-2 2'-8" 9" 1760 II-2 5'-4" 3" 1856 II-2 5'-4" 6" (#1) 2180 II-2 5'-4" 6" ( #2) 2096
PAGE EIGHTEEN
P,t (lbs)
610 610 610
445 445 445 700 700 700
3.16 3.15 3.25
3.51 3.74 2.94 2.65 3.12 2.99
Pile Displacement
Velocity (fps)
3.19 3.66 5.14 2.78 3.26 4.44
2.44 5.02 5.26 2.34 3.74 3.71
J' (sec/ft)
.750
.659
.507
.103
.546
.368
.704
.568
.536
J'0-35
.945
.864
.788
1.0104 .809 .705 .885 .821 .804
Chapter VII CONCLUSIONS AND RECOMMENDATIONS
Conclusions
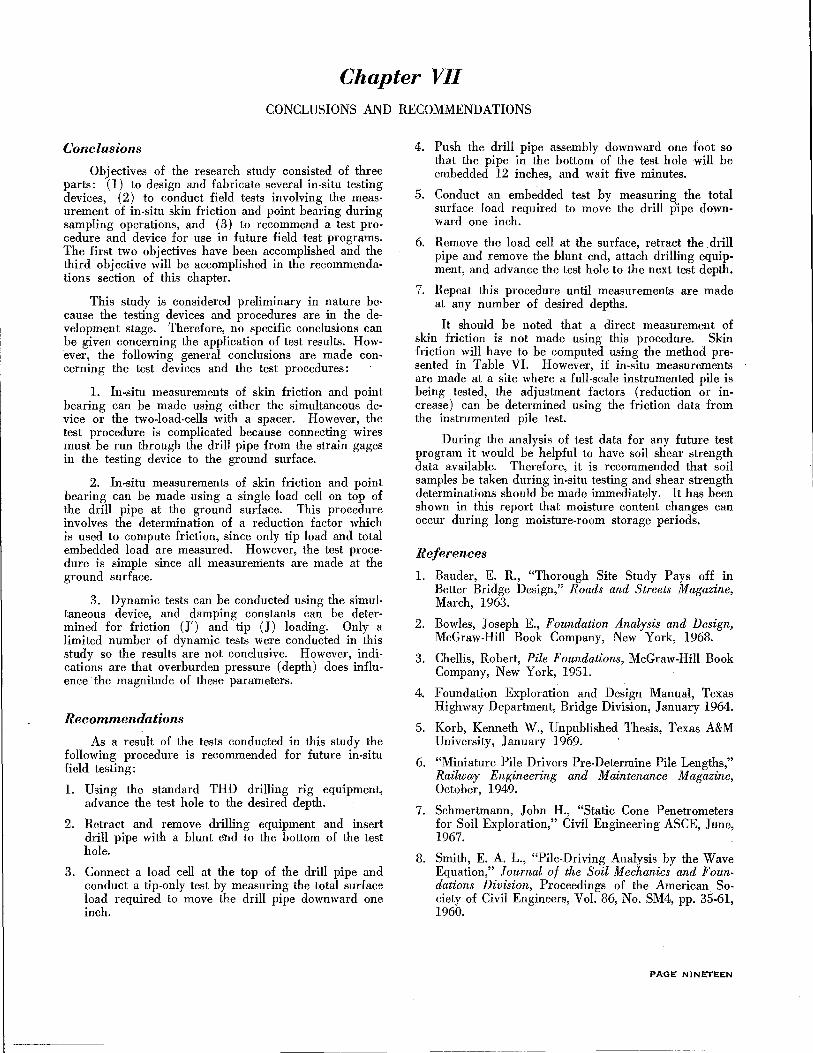
Objectives of the research study consisted of three parts: (l) to design and fabricate several in-situ testing devices, (2) to conduct field tests involving the measurement of in-situ skin friction and point bearing during sampling operations, and (3) to recommend a test procedure and device for use in future field test programs. The first two objectives have been accomplished and the third objective will be accomplished in the recommendations section of this chapter.
This study is considered preliminary in nature because the testing devices and procedures are in the development stage. Therefore, no specific conclusions can be given concerning the application of test results. However, the following general conclusions are made con· cerning the test devices and the test procedures:
l. In-situ measurements of skin friction and point bearing can be made using either the simultaneous device or the two-load-cells with a spacer. However, the test procedure is complicated because connecting wires must be run through the drill pipe from the strain gages in the testing device to the ground surface.
2. In-situ measurements of skin friction and point bearing can be made using a single load cell on top of the drill pipe at the ground surface. This procedure involves the determination of a reduction factor which is used to compute friction, since only tip load and total embedded load are measured. However, the test procedure is simple since all measurements are made at the ground surface.
3. Dynamic tests can be conducted using the simultaneous device, and damping constants can be determined for friction (J') and tip (J) loading. Only a limited number of dynamic tests were conducted in this study so the results are not conclusive. However, indications are that overburden pressure (depth) does in fluence the magnitude of these parameters.
Recommendations
As a result of the tests conducted in this study the following procedure is recommended for future in-situ field testing:
l. Using the standard THD drilling rig equipment, advance the test hole to the desired depth.
2. Retract and remove drilling equipment and insert drill pipe with a blunt et1d to the bottom of the test hole.
3. Connect a load cell at the top of the drill pipe and conduct a tip-only test by measuring the total surface load required to move the drill pipe downward one inch.
4. Push the drill pipe assembly downward one foot so that the pipe in the bottom of the test hole will be embedded 12 inches, and wait five minutes.
5. Conduct an embedded test by measuring; the total surface load required to move the drill pipe downward one inch.
6. Remove the load cell at the surface, retract the drill pipe and remove the blunt end, attach drilling equipment, and advance the test hole to the next test depth.
7. Repeat this procedure until measurements are made at any number of desired depths.
It should he noted that a direct measurement of skin friction is not made using this procedure. Skin friction will have to he computed using the method presented in Table VI. However, if in-situ measurements are made at a site where a full-scale instrumented pile is being tested, the adjustment factors (reduction or increase) can he determined using the friction data from the instrumented pile test.
During the analysis of test data for any future test program it would he helpful to have soil shear strength data available. Therefore, it is recommended that soil samples he taken during in-situ testing and shear strength determinations should be made immediately. It has been shown in this report that moisture content changes can occur during long moisture-room storage periods.
References
l. Bauder, E. R., "Thorough Site Study Pays off in Better Bridge Design," Roads and Streets Magazine, March, 1963.
2. Bowles, Joseph E., Foundation Analysis and Design, McGraw-Hill Book Company, New York, 1968.
3. Chellis, Robert, Pile Foundations, McGraw-Hill Book Company, New York, 1951.
4. Foundation Exploration and Design Manual, Texas Highway Department, Bridge Division, January 1964.
5. Korh, Kenneth W., Unpublished Thesis, Texas A&M University, January 1969.
6. "Miniature Pile Drivers Pre-Determine Pile Lengths," Railway Engineering and Maintenance Magazine, October, 1949.
7. Schmertmann, John H., "Static Cone Penetrometers for Soil Exploration," Civil Engineering ASCE, June, 1967.
8. Smith, E. A. L., "Pile-Driving Analysis by the Wave Equation," Journal of the Soil Mechanics and Foundations Division, Proceedings of the American Society of Civil Engineers, Vol. 86, No. SM4, pp. 35-61, 1960.
PAGE NINETEEN
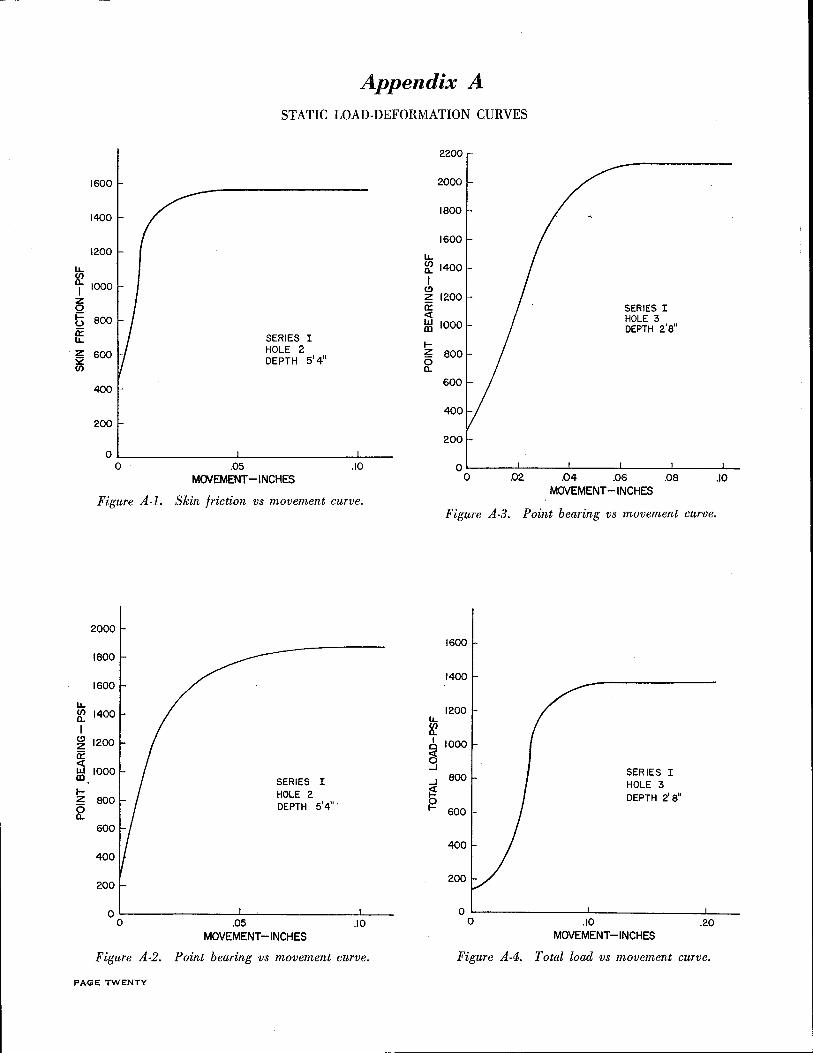
1600
1400
1200
LL
~ 1000 I z 0
t3 800 i'i LL
z 600 S2 (/)
400
200
0 0
Figure A-1.
2000
1800
1600
LL (/) 1400 a. I
(!) 1200 z i'i c:t IJJ 1000 Ill
1-z 800 5 a.
600
400
200
0 0
Appendix A STATIC LOAD-DEFORMATION CURVES
SERIES I HOLE 2 DEPTH 5'4"
2200
2000
1800
1600
LL lr 1400 I
(!)
z 1200 0: c:t ~ 1000
1-~ 800 a.
600
SERIES I HOLE 3 DEPTH 2'8"
.05 .10 OL-----L-----~----~-----L-----L-
MCNEMENT -INCHES
Skin friction vs movement curve.
.05
SERIES I HOLE 2 DEPTH 5'4" ·
MOVEMENT -INCHES .10
LL
~ I
0 (§ ...J
...J
~ g
0 .02 .04 .06 .08 MOVEMENT -INCHES
Figure A-3. Point bearing vs movement curve.
1600
1400
1200
1000
800
600
400
200
0 0 .10
SERIES I HOLE 3 DEPTH 2'8"
MOVEMENT -INCHES .20
.10
Figure A-2. Point bearing vs movement curve. Figure A-4. Total load vs movement curve.
PAGE TWENTY
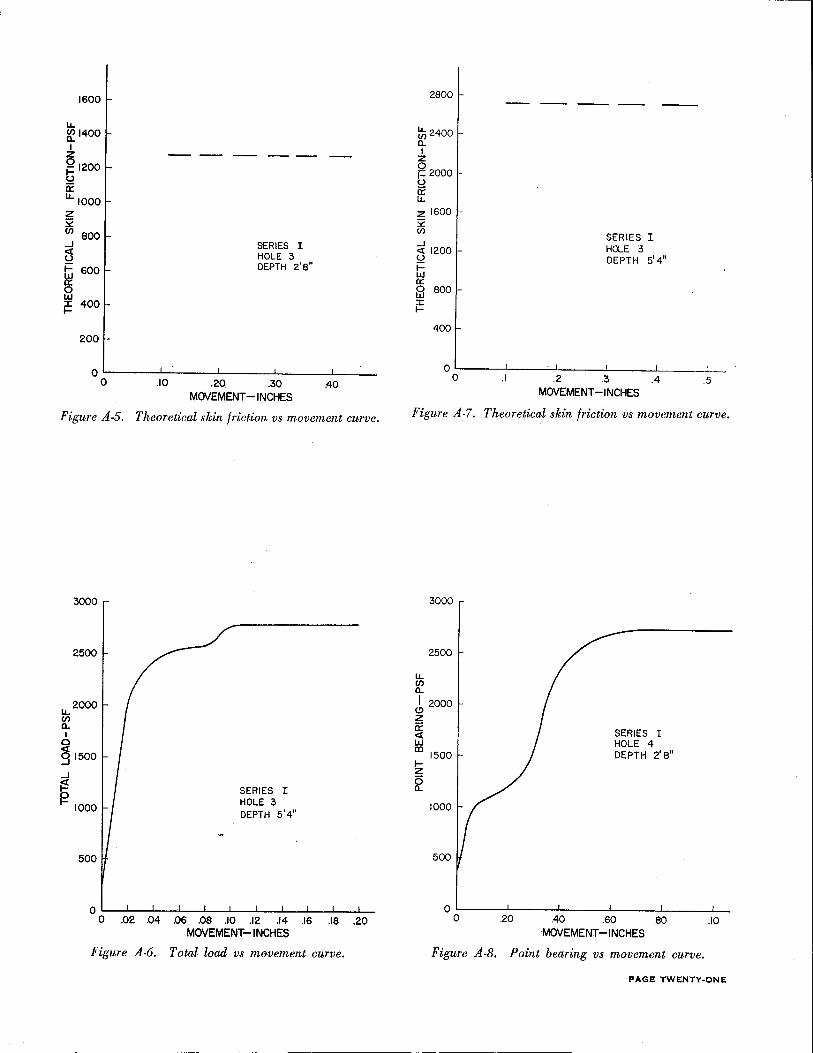
1600
I.J... !:e 1400 I z ~1200 (.)
iE I.J...IOOO z 3i: en 800 ...1 () ~ 600
0 w ~ 400
200
SERIES I HOLE 3 DEPTH 2'8"
0~----~-----L-----L----~-----0 .10 .20 .30 .40
MOVEMENT -INCHES
Figure A-5. Theoretical skin friction vs movement curve.
3000
2500
2000 I.J... en a. I
0
91500
...1
~ SERIES I 0 F- 1000 HOLE 3
DEPTH 5'4"
500
o~~--~--~~--~--~~--~--L-~--0 .02 .04 .06 .08 .10 .12 .14 .16 .18 .20
MOVEMENT-INCHES
Figure A-6. Total load vs movement curve.
2800
~2400 a. I z ~2000 (.)
1r I.J...
~ 1600 :>:: en ...1 ~ 1200 (.)
i= w a:: 8 800 :X: 1-
400
SERIES I HOLE 3 DEPTH 5'4"
0~----~--~~-----L-----L----~--0 .I .2 .3 .4 .5
MOVEMENT -INCHES
Figure A-7. Theoretical skin friction vs movement curve.
3000
2500
I.J... en a. ~ 2000 z iE ~ SERIES I w HOLE 4 m
1500 DEPTH 2'8" 1-z 6 a.
1000
500
0~----~----~----~----~-----L-0 .20 .40 .60 .80 .10
MOVEMENT -INCHES
Figure A-8. Point bearing vs movement curve.
PAGE TWENTY-ONE
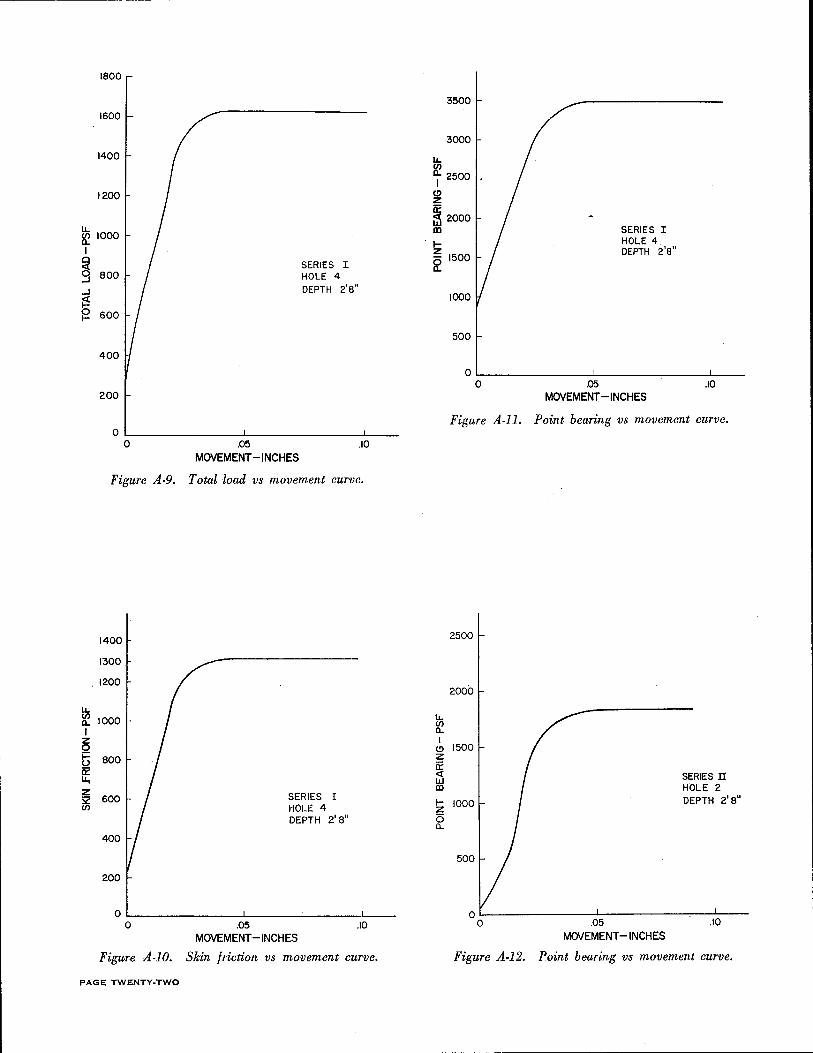
----------------------------------------------------- --
u. ~ I
0 <{
9 .J
i:! g
u. II) a.. I z 0
~ 0: 11,
z S2 II)
1800
1400
1200
1000
800
600
400
200
0 0 .05
MOVEMENT -INCHES
SERIES I HOLE 4 DEPTH 2'8"
.10
Figure A-9. Total load vs movement curve.
1400
1300
. 1200
1000
800
600
400
200
0 0
SERIES I HOLE 4 DEPTH 2' 8"
.05 MOVEMENT -INCHES
.10
Figure A-10. Skin friction vs movement curve.
PAGE TWENTY-TWO
u. II)
3500
3000
~ 2500
(!) z 0: ~ 2000 ID
!z ~ 1500
1000
500
SERIES I HOLE 4 DEPTH 2'8"
0~------------L-------~----~---
u. II) a.. I
(!) z 0:: <{ w ID
1-z i5 a..
0 .05 MOVEMENT -INCHES
.10
Figure A-11. Point bearing vs movement curve.
2500
2000
1500
SERIES II HOLE 2
1000 DEPTH 2'8"
500
.05 .10
MOVEMENT -INCHES
Figure A-12. Point bearing vs movement curve.
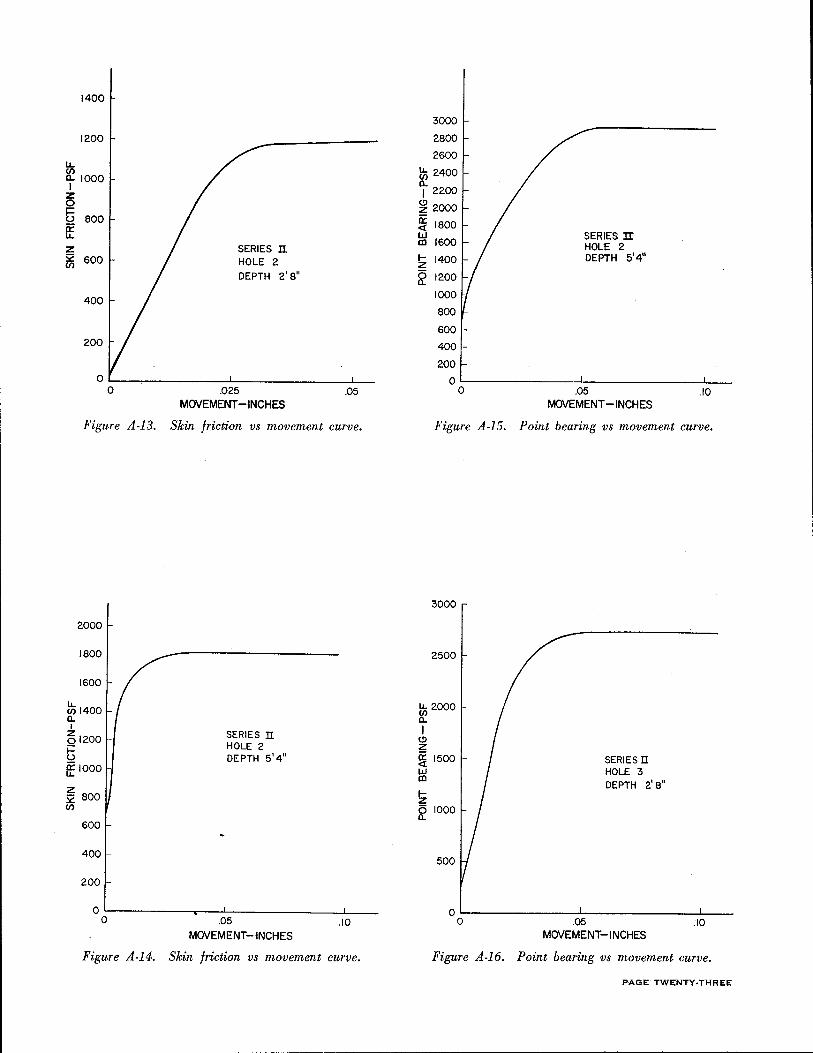
u. en
1400
1200
a. 1000 I z 0
t3 800
a: z ~ 600
400
200
SERIES n HOLE 2
DEPTH 2'8"
o~------------~--------------~--0 .025
MOVEMENT -INCHES .05
Figure A-13. Skin friction vs movement curve.
2000
1800
1600
~1400 a. I
~1200 !3 a: 1000
z :;;: 800 en
600
400
200
SERIES n HOLE 2 DEPTH 5'4"
o~--------~---L--------------L----0 .05
MOVEMENT-INCHES .10
Figure A-14. Skin friction vs movement curve.
3000
2800
2600
~ 2400 a. 1 2200
~ 2000
~ 1800 w m 1600
1- 1400 z ~ 1200
1000
800
600
400
200
0 0
SERIES IT HOLE 2 DEPTH 5'4"
.05 MOVEMENT -INCHES
.10
Figure A-15. Point bearing vs movement curve.
3000
2500
~ 2000 a. I
(!) z ~ 1500 w m
!z ~ 1000
500
SERIES II HOLE 3 DEPTH 2'8"
o~--------------~--------------~---0 .05 MOVEMENT-INCHES
.10
Figure A-16. Point bearing vs movement curve.
PAGE TWENTY-THREE
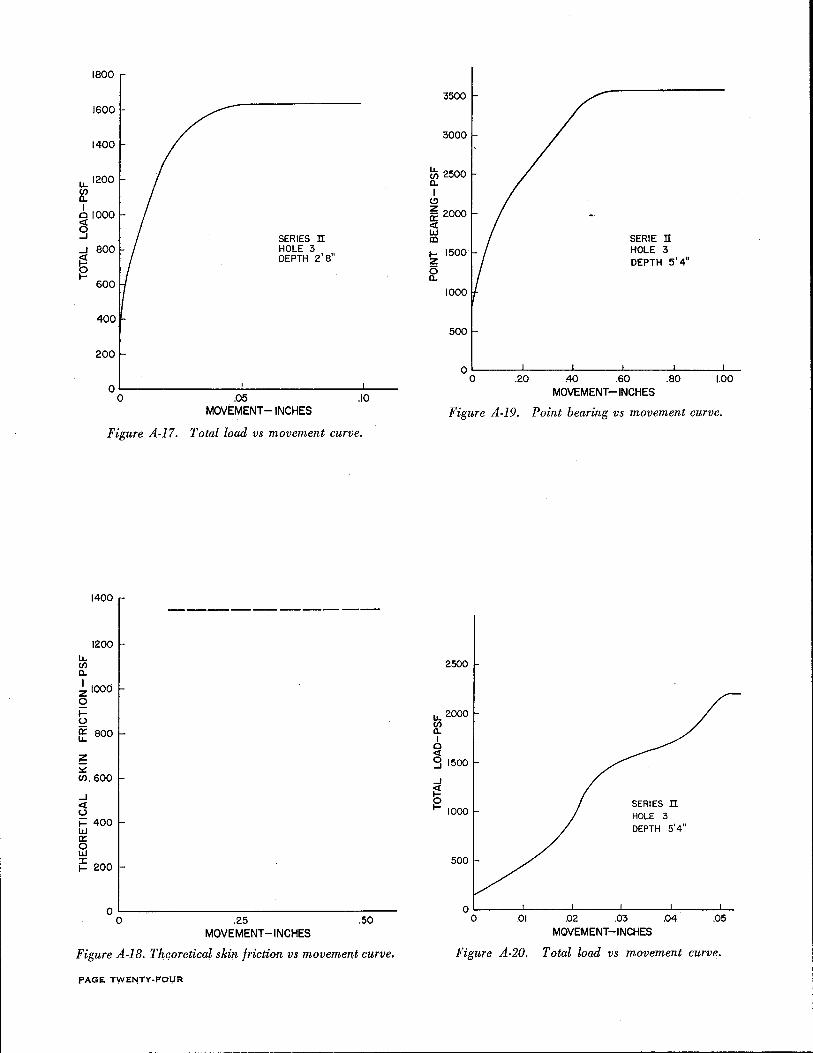
1800
1600
1400
u. 1200
~
~ 1000
.J 800 ~ ~
600
400
200
SERIES li HOLE 3 DEPTH 2' a"
OL--------------L------------~----0 .05
MOVEMENT- INCHES .10
Figure A-17. Total load vs movement curve.
u. fJ) a.
1400
1200
I 1000 z 0 1-(..)
a: 800 u.
z ::.: Vl, 600
.J <X (..)
i= 400 IJJ 0: 0 IJJ
i= 200
o~--------------------------------0 .25 .50
MOVEMENT -INCHES
Figure A-18. Theoretical skin friction vs movement curve.
PAGE TWEf'!TY-FOUR
3500
3000
!J; 2500 a. I
(!)
~ 2000 0: <X IJJ m ~ 1500
~ 1000
500
SERlE ll HOLE 3 DEPTH 5'4"
OL-----~----J_-----L-----L----~--0 .20 .40 .60 .80 1.00
MOVEMENT -INCHES
Figure A-19. Point bearing vs movement curve.
2500
u.2000 fJ) a. I
0 <{
g 1500
.J
i:! 0 1- 1000
500
SERIES li HOLE 3 DEPTH 5'4"
OL-----L-----L-----~----J_ ____ _L_
0 .01 .02 .03 .04 .05 MOVEMENT-INCHES
Figure A-20. Total load vs movement curve.
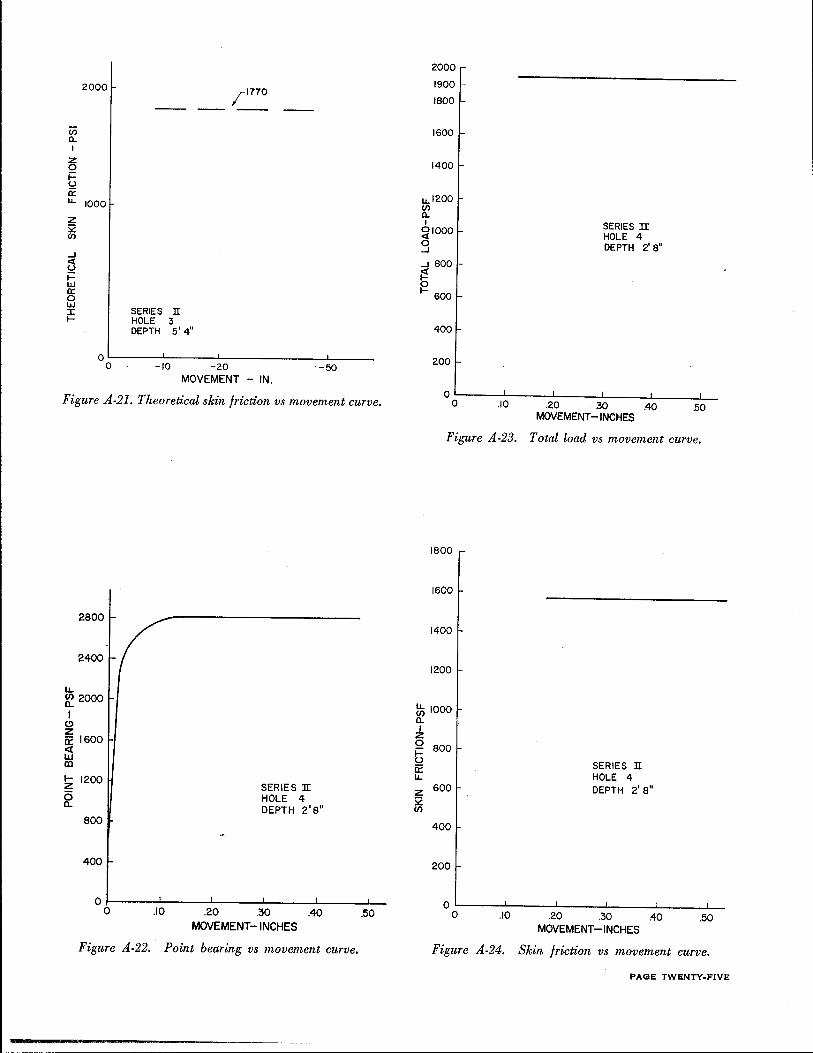
2000 /1770
-- --(/) 0.. I
z 0 i= (.)
0: I.L. 1000
z 52 (/)
..J <t (.)
i= w a:: 0 w :r: SERIES li 1- HOLE 3
DEPTH 5' 4 11
0 0 -10 -20 -50
MOVEMENT -IN.
Figure A-21. Theoretical skin friction vs movement curve.
2800
2400 r
l.L. ~ 2000
I C) z 0:: 1600 <( LlJ m
!z 1200
~ 800
400
SERIES JI HOLE 4 DEPTH 2'8"
0~----~----~-----L----~----~--0 .10 .20 .30 .40 .50
MOVEMENT-INCHES
Figure A-22. Point bearing vs movement curve.
2000
1900
1800
1600
1400
u.1200 (/) 0.. I ~1000 0 ..J
..J 800 ~ 0 1-600
400 r
200
0 0 .10
SERIES Ir HOLE 4 DEPTH 2' 8"
I
.20 .30 .40 MOVEMENT -INCHES
50
Figure A-23. Total load vs movement curve.
1800 r
1600
1400
1200
~ 1000 0..
~ 0
800 ~ 0: I.L.
z 600 52 (/)
400
200
SERIES li HOLE 4 DEPTH 2' 8"
0 ~---~---~-----L---~---~--0 .10 .20 .30 .40 .50
MOVEMENT -INCHES
Figure A-24. Skin friction vs movement curve.
PAGE TWENTY-FIVE
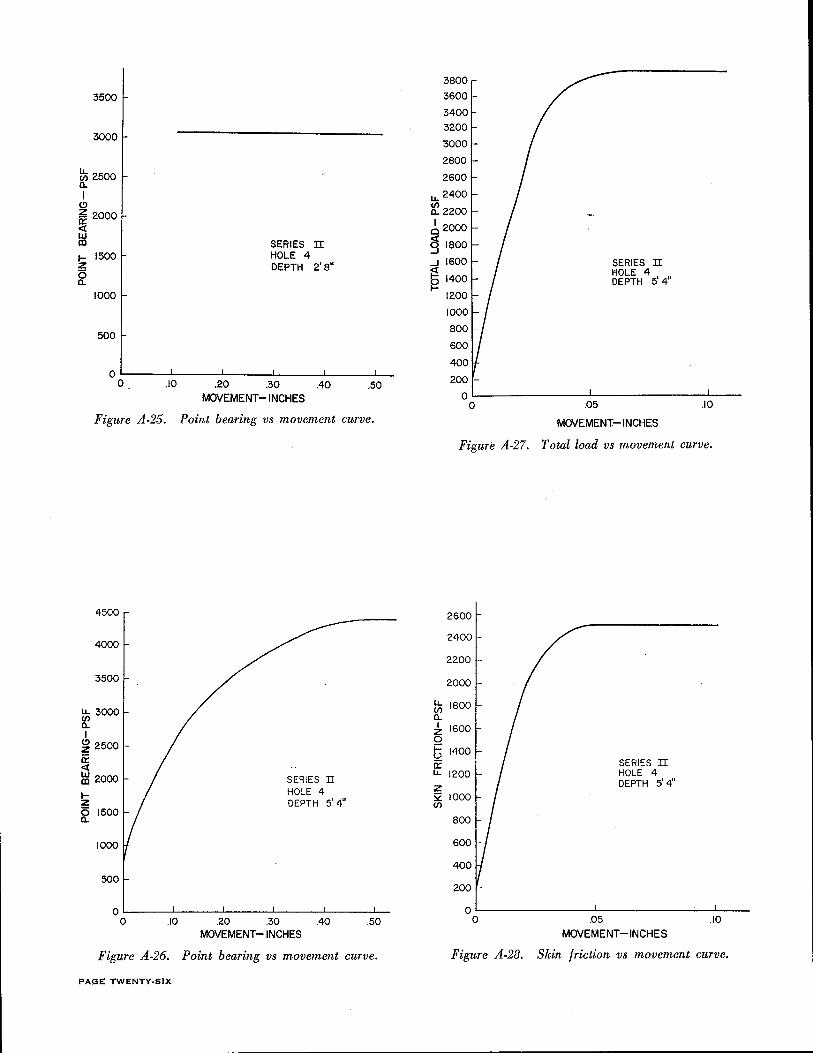
3500
3000
t:; 2500 a. I
(!)
~ 2000 <1:
~ ~ 1500
5 a. 1000
500
SERIES II HOLE 4 DEPTH 2'8"
o~----~----~------L-----~-----L--0 .10 .20 .30 .40 .50
MOVEMENT -INCHES
Figure A-25. Point bearing vs movement curve.
4500
4000
3500
lL. 3000 (/) a. I ~ 2500 ex: <1: ~ 2000
1-z ~ 1500
1000
500
SERIES II HOLE 4 DEPTH 5'4"
0~----~----~------~----~------~ 0 .10 .20 .30 .40 .50
MOVEMENT-INCHES
Figure A-26. Point bearing vs movement curve.
PAGE TWENTY-SIX
3800
3600
3400
3200
2800
2600
1..1.. 2400
lr 2200
62000
§ 1800
...J
~ ~
SERIES II HOLE 4 DEPTH 5' 411
oL-------------~------------~----
lL. (/) a. I z
0
5 ex: lL.
z S2 (/)
0 .05 .10
MOVEMENT -INCHES
Figure A-27. Total load vs movement curve.
2600
2200
2000
1800
1600
1400
1200
1000
BOO
600
400
200
0 0 .05
SERIES II HOLE 4 DEPTH 5' 4"
MOVEMENT -INCHES .10
Figure A-28. Skin friction vs movement curve.
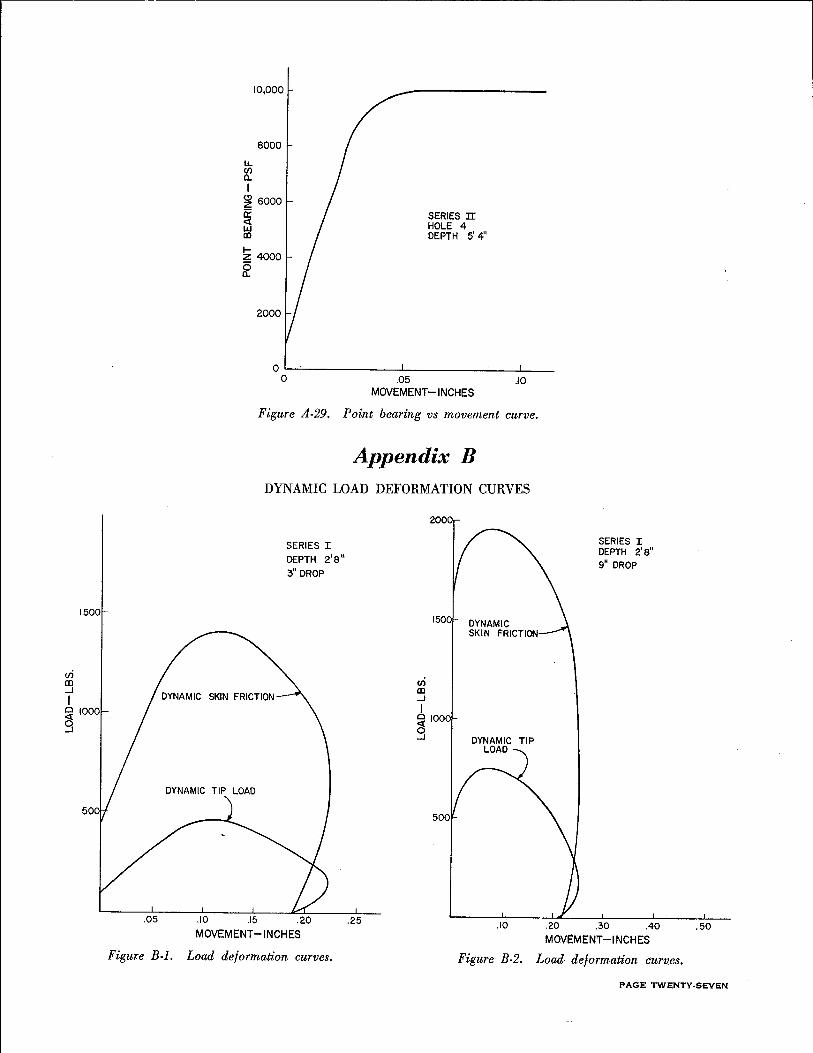
ui []) ...J
I
1500
~ 1000 g
10,000
8000
u. ~ I ~ 6000 a: SERIES IT
HOLE 4 DEPTH 5'4"
<3: LLJ [])
~ 4000
~
2000
0 ~~------------~--------------~---0 .05 .10
MOVEMENT -INCHES
Figure A-29. Point bearing vs movement curve.
Appendix B DYNAMIC LOAD DEFORMATION CURVES
SERIES I DEPTH 2'8"
3" DROP
ui [])
...J I ~ 1000 g
TIP
SERIES I DEPTH 2'8" 9" DROP
.05 .10 .15 .20 .25
MOVEMENT-INCHES .10 .20 .30 .40 .50
MOVEMENT-INCHES
Figure B-1. Load deformation curves. Figure B-2. Load deformation curves.
PAGE TWENTY-SEVEN
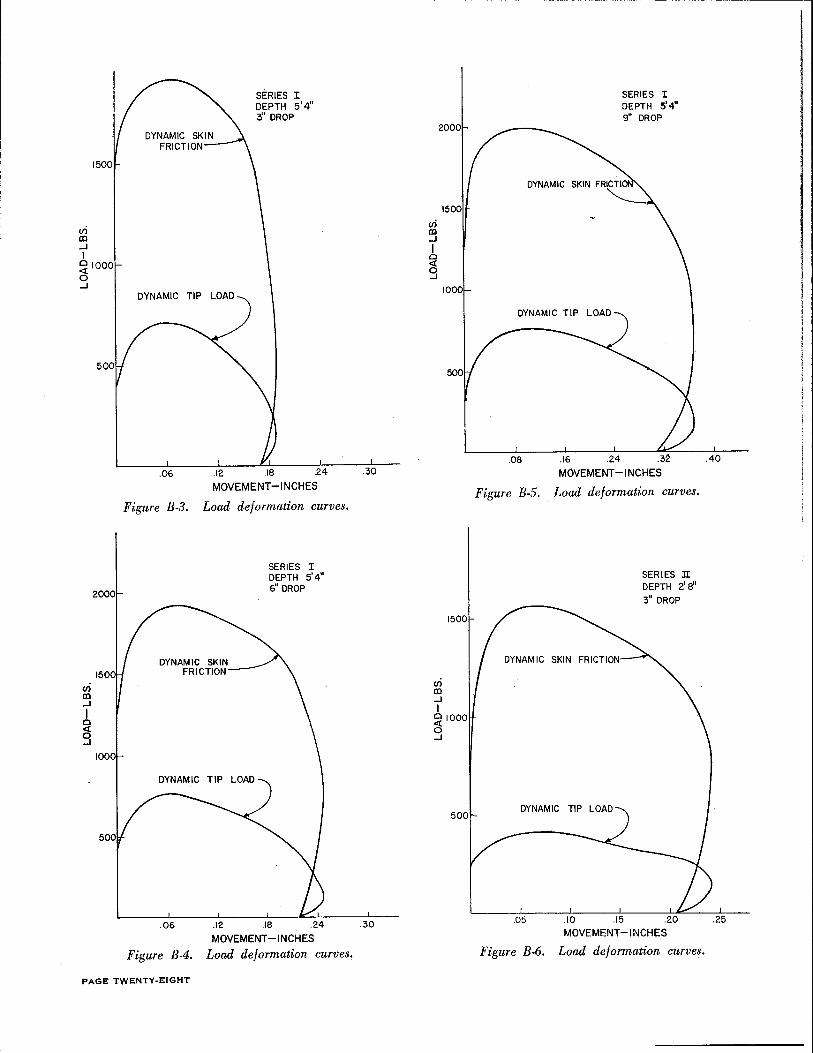
ui m .....J I
1500
~ 1000 0 .....J
(/) m .....J
I 0 g
DYNAMIC TIP LOAD
SERIES I DEPTH 5'4" 311 DROP
.06 .12 .18 .24 .30
MOVEMENT-INCHES
Figure B-3- Load deformation curves.
DYNAMIC SKIN FRICTION
SERIES I DEPTH 5'4" 6" DROP
.06 .12 .~ .24
MOVEMENT -INCHES
Figure B-4. Load deformation curves.
.30
PAGE TWENTY-EIGHT
ui m .....J I ~ g
(/)
m .....J I
1500
~ 1000 0 .....J
SERIES I DEPTH 5'4" 9" DROP
.08 .16 .24 .3:1. .40
MOVEMENT -INCHES
Figure B-5. Load deformation curves.
SERIES JI DEPTH 2' 8"
3" DROP
DYNAMIC TIP LOAD
.05 .10 .15 .20
MOVEMENT -INCHES
Figure B-6. Load deformation curves.
.25
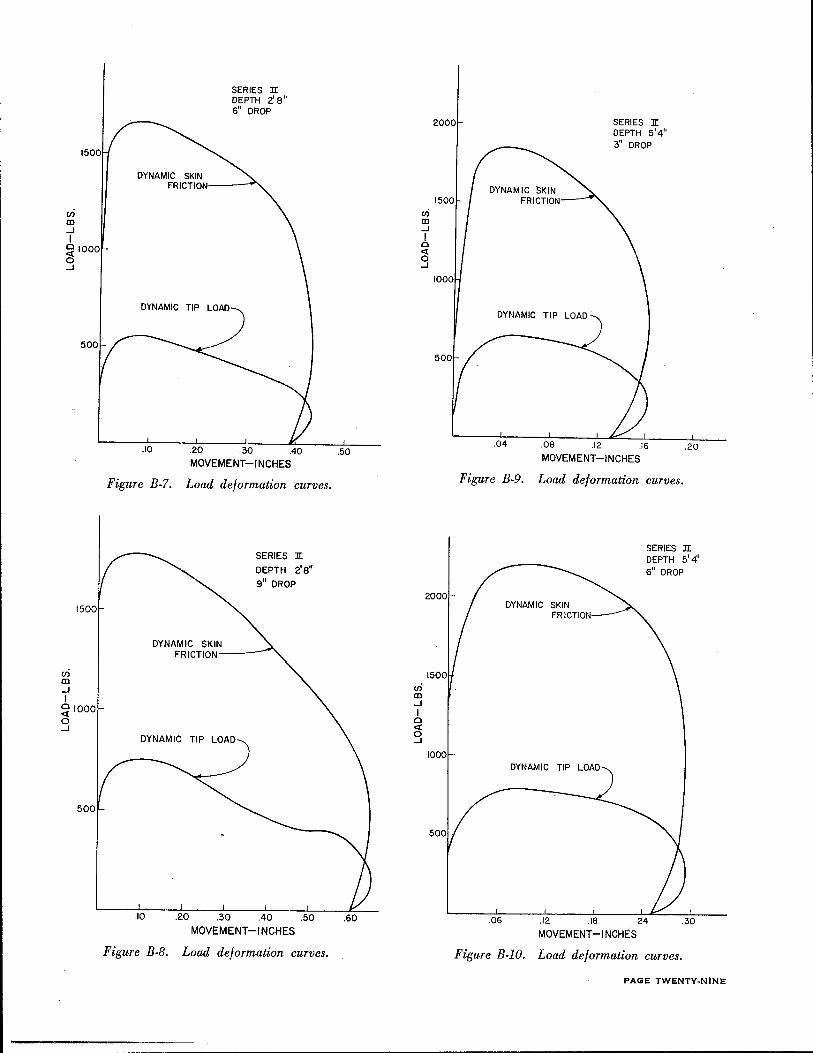
en m ...J I ~ 1000 0 ...J
ui m ...J I ~ 1000 0 ...J
SERIES :rr DEPTH 2'8" 6" DROP
DYNAMIC SKIN FRICTION---~
DYNAMIC TIP LOAD
.10 .20 .30 .40
MOVEMENT-INCHES
Figure B-7. Load deformation curves.
SERIES :n: DEPTH 2'8"
9" DROP
DYNAMIC SKIN FRICTION----
DYNAMIC TIP LOAD
.10 .20 .30 .40 .50
MOVEMENT-INCHES
Figure B-8. Load deformation curves.
.50
ui m ...J I c <( 0 ...J
ui m ...J I
0
g
2000
1000
SERIES :n: DEPTH 5'4" 3" DROP
DYNAMIC TIP LOAD
.04 .08 .12 .16 .20 MOVEMENT-INCHES
Figure B-9. Load deformation curves.
.06
DYNAMIC TIP LOAD
SERIES JI DEPTH 5'4"
.12 .18 24 .30
MOVEMENT -INCHES
Figure B-10. Load deformation curves.
PAGE TWENTY-NINE
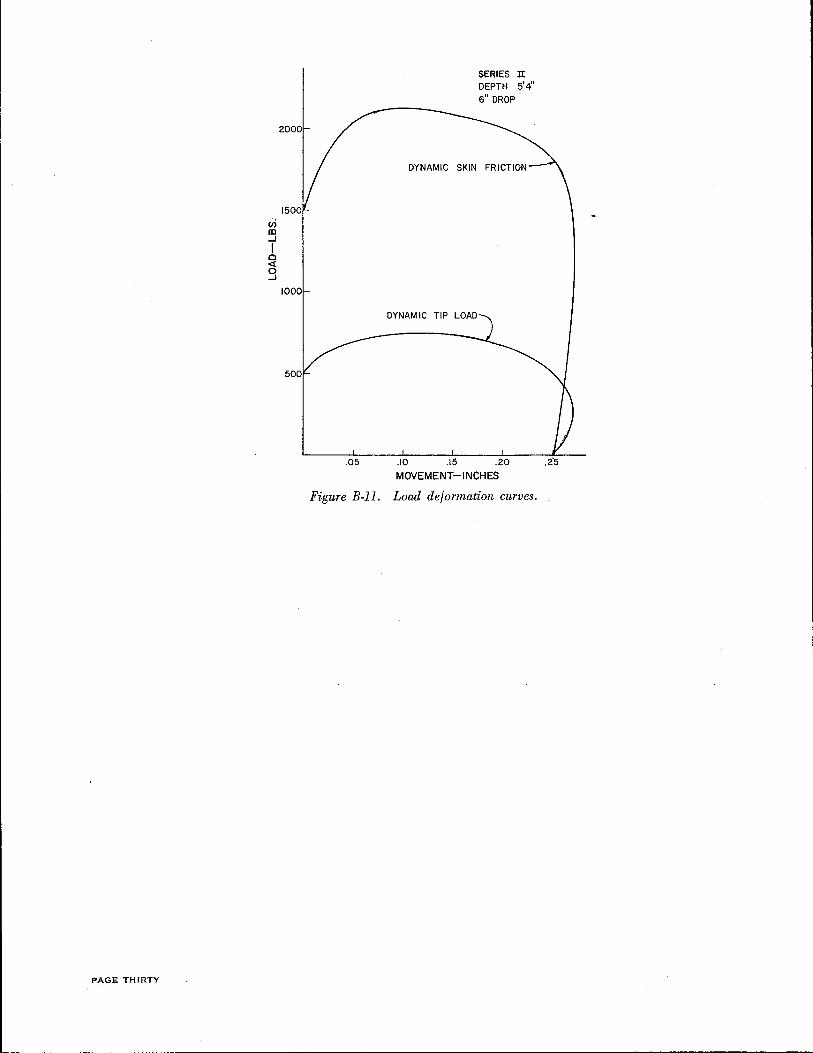
PAGE THIRTY
u) III ..J
I 0 <t g
.05
SERIES li DEPTH 5'4''
6" DROP
.10 .15 .20
MOVEMENT-INCHES
Figure B-11. Load deformation curves.
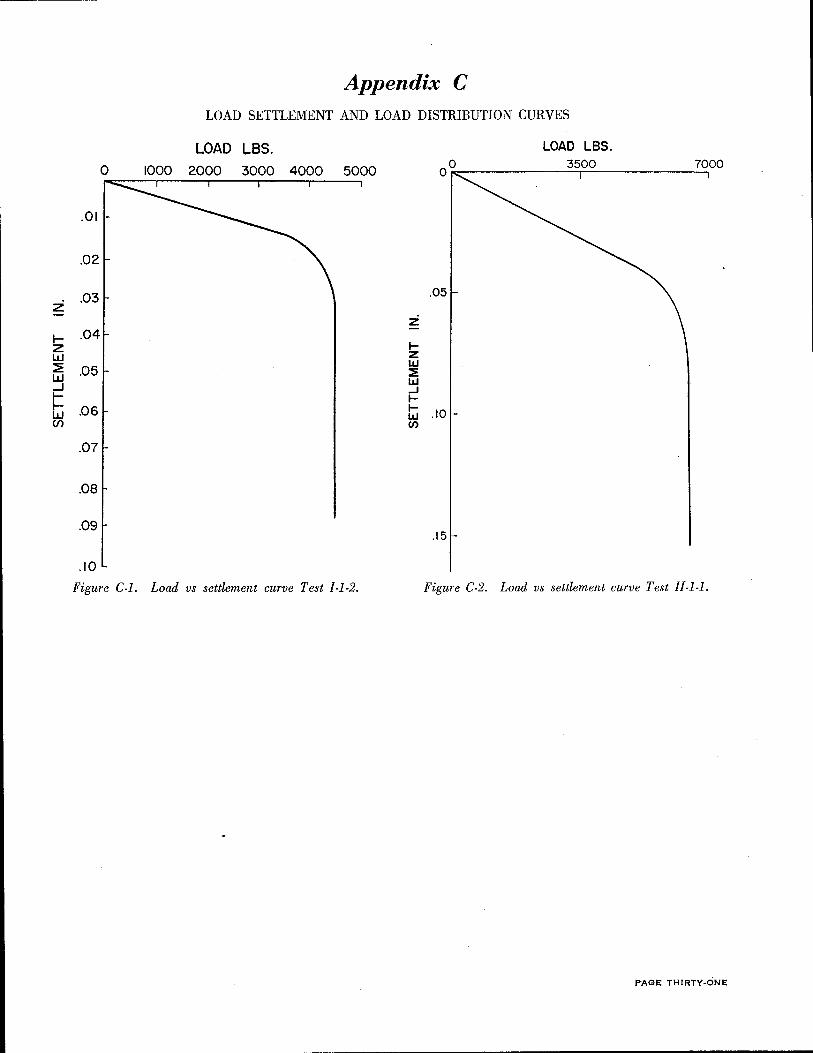
Appendix C LOAD SETTLEMENT AND LOAD DISTRIBUTION CURVES
LOAD LBS. LOAD LBS.
0 1000 2000 3000 4000 5000 7000
.01
.02
.03 .05 z
z I- .04 z w :::!: .05 w ....J I-I- .06 w (/)
t-z w :::ii! w ...J t-t- .10 w (/)
.07
.08
.09 .15
.10
Figure C-1. Load vs settlement curve Test l-1-2. Figure C-2. Load vs settlement curve Test Il-1-1.
PAGE THIRTY-ONE
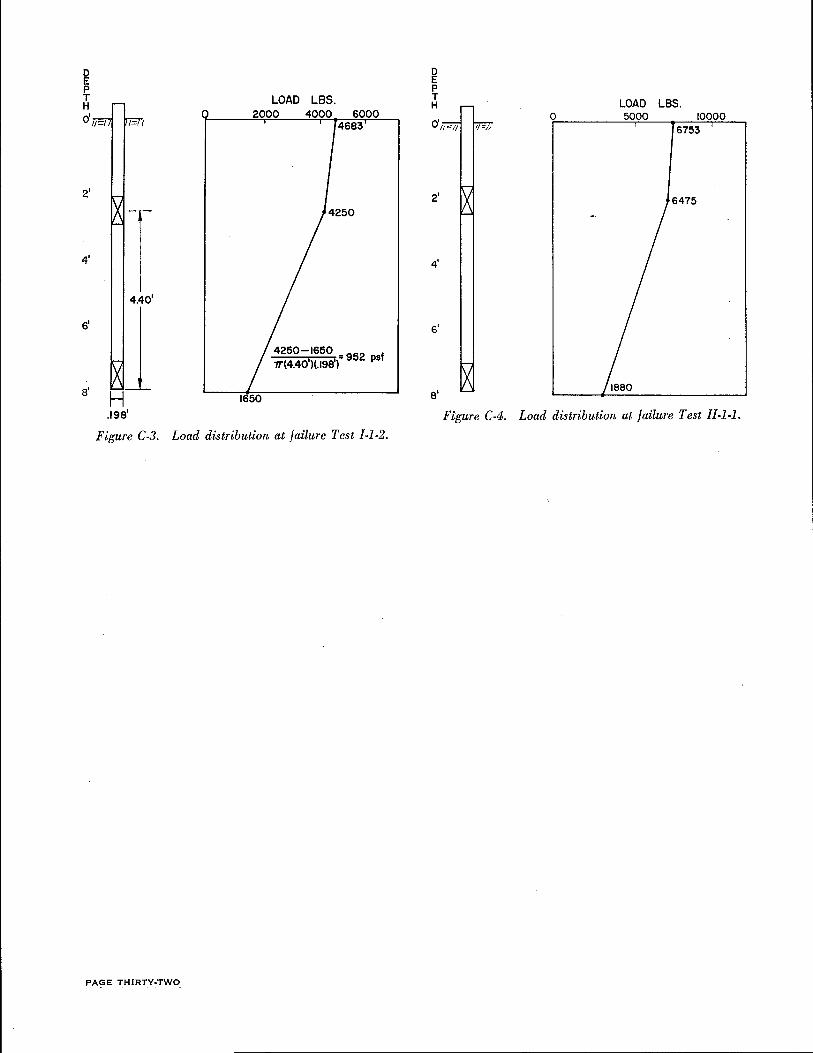
LOAD LBS. 2000 4000 6000
4683
2'
4'
4.401
6'
8'
.198'
Figure C-3. Load distribution at failure Test /-1-2.
PAGE THIRTY-TWO . . .
0 LOAD LBS. 5000 10000
6753
Figure C-4. Load distribution at failure Test //-1-1.