Embed Size (px)
Citation preview

Preliminary risk rating for mountain pine beetle infestation of lodgepole pine forests
over large areas with ordinal regression modelling Colin Robertson1, Michael A. Wulder2,
Trisalyn A. Nelson1 and Joanne C. White2
Mountain Pine Beetle working paper 2009-19
1 Spatial Pattern Analysis & Research (SPAR) Laboratory Dept of Geography
University of Victoria PO Box 3060, Victoria, BC V8W 3R4, Canada
2 Pacific Forestry Centre Canadian Forest Service
Natural Resources Canada 506 West Burnside, Victoria, BC V8Z 1M5, Canada
MPBI Project # 7.36
Natural Resources Canada Canadian Forest Service Pacific Forestry Centre
506 West Burnside Road Victoria, British Columbia V8Z 1M5
Canada
2009
© Her Majesty the Queen in Right of Canada 2009 Printed in Canada
ii
Library and Archives Canada Cataloguing in Publication
Preliminary risk rating for mountain pine beetle infestation of lodgepole pine forests over large areas with ordinal regression modelling [electronic resource] / Colin Robertson ... [et al.]. (Mountain pine beetle working paper ; 2009-19) "MPBI Project # 7.36". Includes bibliographical references. Type of computer file: Electronic monograph in PDF format. Issued also in printed form. Includes abstract in French. ISBN 978-1-100-13452-9 Cat. no.: Fo143-3/2009-19E-PDF
1. Mountain pine beetle--British Columbia. 2. Lodgepole pine--Diseases and pests--Risk assessment--British Columbia. 3. Mountain pine beetle--British Columbia--Forecasting. 4. Mountain pine beetle--Effect of forest management on--British Columbia. 5. Forests and forestry--Risk management--British Columbia. 6. Forest management--British Columbia. I. Robertson, C. (Colin), 1978- II. Pacific Forestry Centre III. Series: Mountain Pine Beetle Initiative working paper (Online) 2009-19 SB945 M78 P73 2009 634.9'7516768 C2009-980226-0
iii
Abstract The mountain pine beetle (Dendroctonus ponderosae Hopkins) is endemic to lodgepole pine (Pinus contorta var. latifolia Engelmann) forests in western Canada. However, the current beetle epidemic in this area highlights the challenges faced by forest managers who must prioritize stands for mitigation activities such as salvage harvesting, thinning, and direct control methods. In western Canada, the operational risk rating system for mountain pine beetle is based on biological knowledge gained from a rich legacy of stand-scale field studies. Owing to the large spatial and temporal extents of the current epidemic, new research into large-area mountain pine beetle processes has revealed further insights into the landscape-scale characteristics of beetle-infested forests. In this research, we evaluate the potential for this new knowledge to augment an established system for rating the short-term risk of tree mortality in a stand due to mountain pine beetle. New variables explored for use in risk rating include direct shortwave radiation, site index, diameter at breast height, the temporal trends in local beetle populations, Biogeoclimatic Ecosystem Classification, and beetle-host interaction variables. Proportional odds ordinal regression was used to develop a model for the Vanderhoof Forest District in west–central British Columbia. Prediction based on independent data was assessed with the area under the receiver operator curve (AUC), indicating good discriminatory power (AUC = 0.84) for predicting damage due to mountain pine beetle.
Keywords: mountain pine beetle, landscape-scale, ordinal regression, risk rating, infestation
Résumé
Le dendroctone du pin ponderosa (Dendroctonus ponderosae Hopkins) est endémique aux forêts de pins tordus latifoliés (Pinus contorta var. latifolia Engelmann) de l’Ouest canadien. Cependant, l’épidémie actuelle de dendroctone du pin dans cette région met en lumière les difficultés auxquelles doivent faire face les aménagistes forestiers qui ont la tâche de prioriser des peuplements à des fins d’atténuation, comme les coupes de sauvetage, les coupes d’éclaircie et les méthodes de contrôle direct. Dans l’Ouest canadien, le système de notation du risque opérationnel du dendroctone du pin ponderosa est fondé sur des connaissances biologiques provenant d’un vaste héritage d’études à l’échelle des peuplements forestiers. En raison du facteur temporel et du vaste espace occupé par l’épidémie actuelle, une nouvelle recherche de processus pour une vaste étendue infestée par le dendroctone du pin ponderosa a ouvert d’autres perspectives, à l’échelle de l’écopaysage, concernant les caractéristiques des forêts infestées de dendroctone. Dans la présente recherche, nous évaluons les possibilités pour cette nouvelle connaissance d’augmenter un système établi de notation du risque, à court terme, de mortalité d’arbres d’un peuplement attribuable au dendroctone du pin ponderosa. Les nouvelles variables étudiées pour être utilisées dans l’évaluation du risque comprennent le rayonnement direct de courtes longueurs d’onde, l’indice de qualité de station, le diamètre à hauteur de poitrine, les tendances temporelles dans les populations locales de dendroctones, le Système de classification biogéoclimatique des écosystèmes et les variables de l’interaction de l’espèce hôte du dendroctone. La régression ordinale de chances proportionnelles fut utilisée pour élaborer un modèle pour le Vanderhoof Forest District dans le centre-ouest de la Colombie-Britannique. Des prévisions fondées sur des données indépendantes ont été évaluées avec la surface sous la courbe (AUC), indiquant une bonne puissance discriminatoire (AUC = 0,84) pour prévoir les dommages attribuables au dendroctone du pin ponderosa.
Mots clés : dendroctone du pin ponderosa, échelle de l’écopaysage, régression ordinale, évaluation du risque, infestation

iv
v
Table of Contents
1 Introduction................................................................................................................ 1 1.1 Mountain pine beetle risk rating .................................................................... 1 1.2 Recent Research............................................................................................. 2
1.2.1 Landscape scale red attack modeling................................................. 2 1.2.2 Data uncertainty, accuracy, and large-area spatial analysis............... 3 1.2.3 Epidemiology and population dynamics............................................ 3 1.2.4 Range expansion, geographic variation and novel habitats ............... 4
2 Material and Methods ................................................................................................ 4 2.1 Study area and data ........................................................................................ 4 2.2 Materials and Methods................................................................................... 6
2.2.1 Modelling risk for large areas ............................................................ 6 2.2.2 Ordinal Logistic Regression .............................................................. 9
2.3 Model Development, Selection and Validation ........................................... 10
3 Results and Discussion ............................................................................................ 11 3.1 Results.......................................................................................................... 11
3.1.1 Baseline model................................................................................. 11 3.1.2 Adjusted model ................................................................................ 12 3.1.3 Prediction Accuracy......................................................................... 14
3.2 Discussion.................................................................................................... 16
4 Conclusions.............................................................................................................. 18
5 Acknowledgements.................................................................................................. 19
6 Contact ..................................................................................................................... 19
7 Literature Cited ........................................................................................................ 20

vi
List of Tables
Table 1. Overview of recent studies and variables for predicting mountain pine beetle red attack
damage. ............................................................................................................................................3 Table 2. Damage level classes are based on the amount of infestation and the percentage of pine.. .....6 Table 3. New Variables included in model development. ......................................................................7 Table 4. Model coefficients and estimates. ...........................................................................................12 Table 5. Prediction accuracy for different damage levels using 50% probability threshold.................14
List of Figures Figure 1. Biogeoclimatic ecosystem classification (BEC) subzones of the Vanderhoof Forest
District. ............................................................................................................................................5 Figure 2. Interaction variable curves.......................................................................................................9 Figure 3. Variables in new model.. .......................................................................................................13 Figure 4. Plots of independent variable means ordinally for adjusted model. ......................................13 Figure 5. ROC curves for 2005 mountain pine beetle forest damage levels predicted from separate
model alpha coefficients. ...............................................................................................................14 Figure 6. Maps of predicted probabilities for each damage level. ........................................................15
1
1 Introduction Management of lodgepole pine (Pinus contorta var. latifolia Engelmann) forests in western Canada in recent years has been dominated by a mountain pine beetle (Dedroctonus ponderosae Hopkins) epidemic that, by 2006, had impacted more than 9 million ha (Westfall 2007). Management of any forest disturbance requires decision support tools that help managers predict future forest scenarios, set priorities, and evaluate management strategies. In the context of mountain pine beetle, forest managers must know the ability of a forest stand to support an epidemic mountain pine beetle population (i.e., susceptibility), and the possibility of host tree mortality consequent to an existing beetle infestation (i.e., risk). Susceptibility is determined using stand and site characteristics independent of surrounding beetle population levels. Conversely, risk is determined by considering stand susceptibility in the context of the beetle population within both the stand and its vicinity (Bentz et al. 1993). A risk rating system is a decision support tool that identifies stands at greatest risk of timber losses as a result of a mountain pine beetle infestation (Shore et al. 2006).
1.1 Mountain pine beetle risk rating Many risk rating systems for mountain pine beetle have been developed over the past three decades. Safranyik et al. (1975) initially used weather station data to model and map the beetle outbreak hazard in western Canada. Amman et al. (1977) used stand characteristics such as elevation, age, and diameter at breast height (dbh) to develop a three-class risk classification system (i.e., low, moderate, high). Other risk rating systems also relied on stand characteristics and adopted similar approaches to rating stand risk as a categorical variable (e.g., Mahoney 1978; Berryman 1978a; Stuart 1984; Anhold and Jenkins 1987). Bentz et al. (1993) evaluated the accuracy of three categorical risk rating systems (Amman et al. 1977; Mahoney 1978; Berryman 1978a) and one continuous variable risk rating system (Schenk et al. 1980), and found them all to provide poor estimates of pine mortality, primarily because they failed to consider spatial relationships between host stands and beetle populations. Furthermore, the study concluded that the empirical development of these risk rating systems limits their portability to other geographic areas.
Shore and Safranyik (1992) introduced a continuous variable risk rating system that incorporated elements of previous systems with a strong theoretical basis for characterizing susceptibility and risk. Shore and Safranyik (1992) define risk as the short-term expectation of volume loss due to mountain pine beetle attack. Their risk rating system has two components: stand susceptibility, defined as the inherent characteristics of a stand of trees that affect its likelihood of attack by mountain pine beetle; and beetle pressure, which is a measure of the size and proximity of the mountain pine beetle population to the stand. Susceptibility in Shore and Safranyik (1992) is determined using stand density, age, composition, and geographic location. Each variable has a direct link to biological processes associated with mountain pine beetle. Stand density affects tree competition for light and nutrients, so less dense stands tend to have larger, more vigorous trees; however, low-density stands diminish the microclimate required to facilitate pheromone-mediated attacks, landing, and emergence rates (Bartos and Amman 1989). Intermediate stand densities of 750 to 1500 stems/ha are thought to be more conducive to beetle-induced tree mortality (Anhold and Jenkins 1987), giving rise to a nonlinear relationship between risk and stand density. Stand age relates to the beetle’s preference for large diameter trees (Safranyik et al. 1974), and it has an inverse relationship with tree vigor after maturity, which determines a tree’s ability to resist infection by beetle-introduced fungi (Shrimpton 1973). Once trees reach physiological maturity, they become susceptible to attack, although the rate and likelihood of attack is affected by other variables such as climate (Shrimpton and Thomson 1983). Stand composition is included in the Shore and Safranyik model because stand risk relates to the amount of near-term volume loss, so
2
greater amounts of pine contribute to higher risk ratings. The composition variable is measured as the percentage of a stand’s basal area composed of large-diameter pine. The location factor incorporates the impact of geographic location on beetle survival. At higher elevations and northern latitudes, beetles are exposed to colder temperatures, thereby increasing winter mortality and disrupting the beetle's development cycle (Amman 1973).
Beetle pressure in Shore and Safranyik (1992) is based on the number of beetles within and near the stand. Beetle population is estimated by the number of infested trees, and the likelihood of attack is calculated by the distance between the stand being rated and the infestation. The maximum distance at which beetles from surrounding areas can enter the stand being assessed is 3 km. Susceptibility variables and beetle pressure are multiplied to determine the overall risk rating for a stand of trees. Recent model refinements have replaced discrete look-up tables with continuous equations for each of the susceptibility variables, the beetle population variable, and for the risk calculation in an effort to reduce the impact of class boundaries on final risk assessments (Shore et al. 2006). However, the fundamental elements of the Shore and Safranyik model remain unchanged: four equally weighted susceptibility variables and a spatial measure of the beetle population determine a relative ranking of stand risk.
With the explosive growth of mountain pine beetle populations in western Canada, the risk rating system has become a recommended forest planning tool (BCMOF 1995). However, there are considerable limitations to implementing the Shore and Safranyik system over large areas. First, the relationships in the model are derived from field research over small geographic areas (Shore and Safranyik 1992; Shore et al. 2000). Extrapolating these relationships to new regions may neglect regional variations in mountain pine beetle processes. Secondly, the data inputs required for operational modeling across large areas often do not exist, and substitute variables available in forest inventory data are generally poor replacements (Nelson et al. 2006). Hence, there is an information need for a decision support tool capable of assessing risk over large areas.
1.2 Recent Research Research conducted over the last decade may enhance existing risk rating systems. The growth of geographic information systems (GIS) as a tool for managing complex spatial and attribute information, combined with increasing efficiencies in automated and semi-automated data collection technologies, has enabled forest managers and researchers to link theoretical and empirical knowledge of ecological processes (e.g., Blackburn and Milton 1996). Additionally, recent advances in analytical methods for spatial data facilitate spatially explicit analysis of forest disturbances across large spatial and temporal scales (e.g., Nelson and Boots 2005).
1.2.1 Landscape scale red attack modeling Previous studies have investigated the potential for locating and estimating the severity of red attack, i.e., the characteristic fading of a beetle-attacked tree's foliage which typically occurs within 6 to 8 months following attack. Variables useful for predicting red attack damage over large areas may help predict areas at risk of beetle attack. While remotely sensed data have been used in many studies for detecting and mapping red attack damage at a range of spatial scales (Sirois and Ahern 1988; Franklin et al. 2003; Skakun et al. 2003; White et al. 2006; Wulder et al. 2006b), here we highlight studies that have used imagery in conjunction with ancillary terrain and radiation information (White et al. 2006; Wulder et al. 2006a; Coops et al. 2006). Elevation, slope, and direct radiation have all been significant predictors in logistic regression models of red attack damage (see Table 1). Additionally, Coops et al. (2006) investigated the relationship between probability of attack, forest structure, and forest susceptibility variables using regression tree models and found site index and slope to be most important for explaining variation in the probability of red attack. Negron and Popp (2004) used a similar approach for ponderosa pine

3
(Pinus ponderosa Lawson) and found stand density index (SDI) and quadratic mean diameter to be most important for estimating the plot scale probability of infestation.
Table 1. Overview of recent studies and variables for predicting mountain pine beetle red attack damage. Publication Scale Primary
Data Source
Dependent Variable
Significant Predictors
Method Accuracy (95% CI)
Wulder et al. 2006
landscape Landsat7, DEM 30m
Red attack presence
+elevation, -slope
Logistic 86% (5%)
White et al. 2006
landscape SPOT5 10m, DEM 25m
Red attack presence
+direct radiation, -elevation
Logistic 71% (9%)
Coops et al. 2006
landscape Landsat7, Landsat5,DEM 30m
Red attack presence
+direct radiation, +elevation
Logistic 69% (N/A)
Coops et al. 2006
landscape VRI Probability of red attack
Site index, slope, basal area, crown closure
CART N/A
Coops et al. 2006
landscape VRI Probability of red attack
Location factor, age factor, basal area factor, density factor
CART N/A
Negron and Popp 2004
Plot Field plot Probability of red attack
Stand density index, quadratic mean diameter
CART N/A
1.2.2 Data uncertainty, accuracy, and large-area spatial analysis Large-area application of forest risk models relies on operational data which often have varying levels of accuracy and completeness. For instance, detailed variables such as stand density and basal area by species are not available in most provincial or national forest inventory products. Nelson et al. (2006) explored the impact of operationally available data representative of large areas on the Shore and Safranyik susceptibility model. The authors found that lack of detail prevented the surrogate variables from being more than moderately correlated with the true variables, thereby highlighting the importance of including operationally available variables in landscape scale models. In an investigation of the accuracy of the Shore and Safranyik risk model computed with similar large-area data, Dymond et al. (2006) found the risk index to be within 30% to 43% true positive for high risk (>5), and 93% accurate for low risk (>0, <5) for predicting presence of infestation. However, the severity of infestation was not evaluated against the risk index. Wulder et al. (2006c) compared two methods for estimating the beetle pressure component of risk, the distance-based method used in Shore and Safranyik (1992), and a density-based method employing Voronoi polygons. The density-based estimate was found to have greater correspondence with infestation occurrence.
1.2.3 Epidemiology and population dynamics The current state of knowledge on biology and epidemiology of the mountain pine beetle is succinctly reviewed in Safranyik and Carroll (2006). New research indicates that the four-stage population cycle of the mountain pine beetle (endemic, incipient-epidemic, epidemic, and post-epidemic) is based on complex interactions with the host tree and an assemblage of secondary bark beetles. The nature of large area sampling of mountain pine beetle populations (identification of red attack damage by aerial survey) makes it difficult to detect beetle populations at endemic levels, where spatially disparate assemblages of only a few trees are
4
infested. The most important aspect of the population cycle for modeling risk is the epidemic threshold: the point at which the growth in the beetle population exceeds the stand’s ability to resist mass attacks of its large, healthy trees (Berryman 1982). Large-diameter trees promote exponential growth in brood production, thereby enabling an epidemic when suitable host and climatic conditions exist (Safranyik et al. 1974). In population dynamics, this is the shift from one stable equilibrium (endemic) to another stable equilibrium (epidemic) (Berryman 1978b). The critical threshold between these equilibria is governed by events that increase beetle populations (e.g., warm winter temperatures) or decrease stand resistance (e.g., drought). For modeling the risk of mountain pine beetle damage, it is important to represent the dynamic nature of this critical population threshold to accurately forecast future infestation advance or collapse (Raffa and Berryman 1986; Bentz et al. 1993; Logan et al. 1998; Nelson et al. 2007).
1.2.4 Range expansion, geographic variation and novel habitats A key contributor to sustaining western Canada’s current beetle epidemic is an increase in climatically suitable habitat, enabling beetle range expansion (Carroll et al. 2006). Historically, the range of the primary host species exceeded the limits to mountain pine beetle range imposed by climate conditions. This has important implications for modeling risk, as it is common for processes (e.g., dispersal) at range margins to differ from those in traditionally colonized areas (Thomas et al. 2001). Indeed, latitudinal variation in mountain pine beetle developmental rates has been shown by Bentz et al. (2001). This perhaps supports other recent research pointing to large scale spatial synchrony of epidemic beetle populations (Aukema et al. 2006). Mountain pine beetle spatial processes such as dispersal, pheromone dynamics, and host selection are influenced, if not determined, by environmental factors. It might therefore be expected that spatial patterns representing these processes will vary in different environments. Robertson et al. (2007) found spatial patterns of dispersal processes to have different frequencies in different Biogeoclimatic Ecosystem Classification (BEC) subzones. It may be useful for large-scale models of risk to identify regional variations in the spatial patterns used to represent dynamic beetle processes (i.e., Wu et al. 2005).
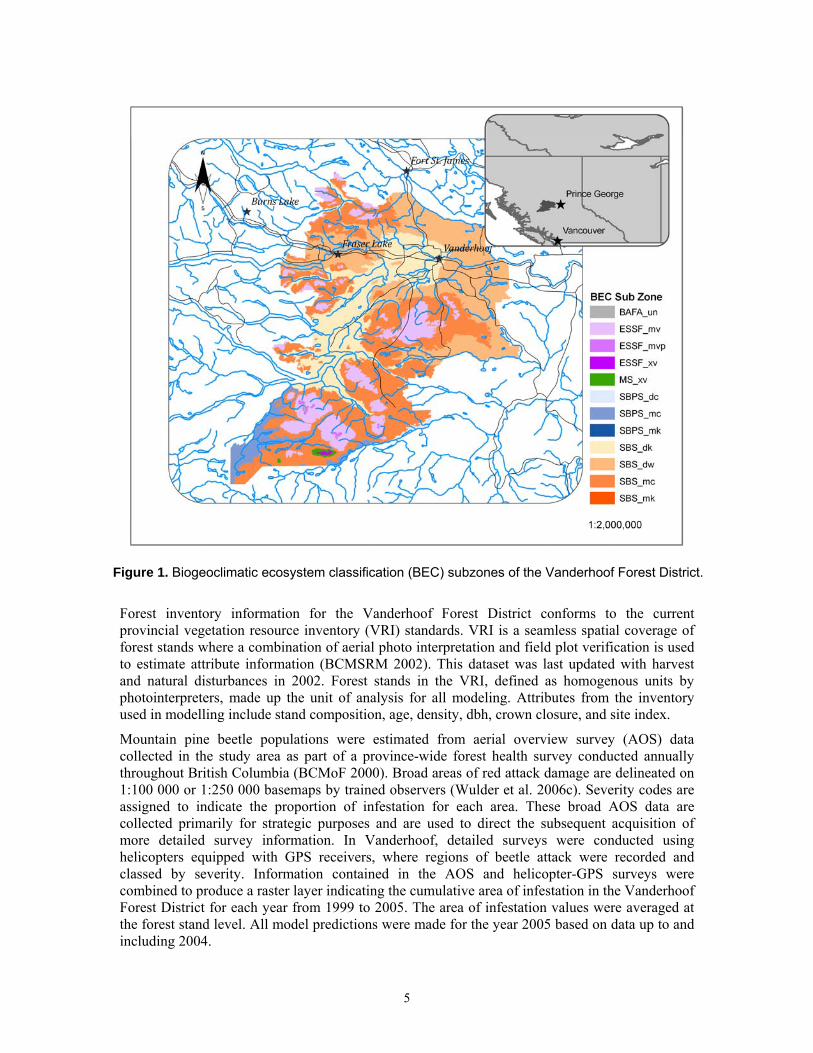
2 Material and Methods 2.1 Study area and data The study area for our model development is the Vanderhoof Forest District, in central British Columbia, Canada (Figure 1). The approximately 1.38 million ha Vanderhoof Forest District has lost a substantial volume of lodgepole pine from mountain pine beetle attack. Forest inventory data is available for this area and mountain pine beetle monitoring data is spatially and temporally exhaustive, providing a comprehensive view of beetle population levels. This area is dominated by forests of lodgepole pine and spruce (Picea engelmannii x glauca Moench. Voss), with a median age of 105 years. Three main BEC zones are represented in Vanderhoof, ranging in elevation from 680 to 1800 m: Sub Boreal Spruce (SBS), Sub Boreal Pine Spruce (SBPS), and Engelmann Spruce-Subalpine Fir (ESSF). The Vanderhoof Forest District is proximal to the outbreak’s epicentre, which is thought to be just to the west near Entiako Park and Protected Area and Tweedsmuir Provincial Park (Aukema et al. 2006).
5
Figure 1. Biogeoclimatic ecosystem classification (BEC) subzones of the Vanderhoof Forest District.
Forest inventory information for the Vanderhoof Forest District conforms to the current provincial vegetation resource inventory (VRI) standards. VRI is a seamless spatial coverage of forest stands where a combination of aerial photo interpretation and field plot verification is used to estimate attribute information (BCMSRM 2002). This dataset was last updated with harvest and natural disturbances in 2002. Forest stands in the VRI, defined as homogenous units by photointerpreters, made up the unit of analysis for all modeling. Attributes from the inventory used in modelling include stand composition, age, density, dbh, crown closure, and site index.
Mountain pine beetle populations were estimated from aerial overview survey (AOS) data collected in the study area as part of a province-wide forest health survey conducted annually throughout British Columbia (BCMoF 2000). Broad areas of red attack damage are delineated on 1:100 000 or 1:250 000 basemaps by trained observers (Wulder et al. 2006c). Severity codes are assigned to indicate the proportion of infestation for each area. These broad AOS data are collected primarily for strategic purposes and are used to direct the subsequent acquisition of more detailed survey information. In Vanderhoof, detailed surveys were conducted using helicopters equipped with GPS receivers, where regions of beetle attack were recorded and classed by severity. Information contained in the AOS and helicopter-GPS surveys were combined to produce a raster layer indicating the cumulative area of infestation in the Vanderhoof Forest District for each year from 1999 to 2005. The area of infestation values were averaged at the forest stand level. All model predictions were made for the year 2005 based on data up to and including 2004.
6
The BEC system stratifies landscapes based on vegetation, soils, and climatic and site characteristics. BEC zones are characterized by a common regional climate. Subzones, the finest spatial unit in the BEC system, represent geographically related ecosystems (Eng and Meidinger 1999). The BEC data used in this analysis were mapped at a scale of 1:20 000 in 2003. The main BEC zone in the Vanderhoof Forest District is the Sub Boreal Spruce (SBS), making up 84% of the total area. Figure 1 illustrates where different subzones are located within the study area.
Elevation base data in the form of a digital elevation model were used for all topographic variables. This data set was obtained from the Government of Canada geographic data portal GeoBase, and conforms to Canadian Digital Elevation Data 1:50 000 standards. Elevation values are referenced to the Canadian Vertical Geodetic Datum 1928. The data was resampled to 100 m grid cell resolution. The DEM was used to generate direct solar radiation using the methods of Kumar et al. (1997).
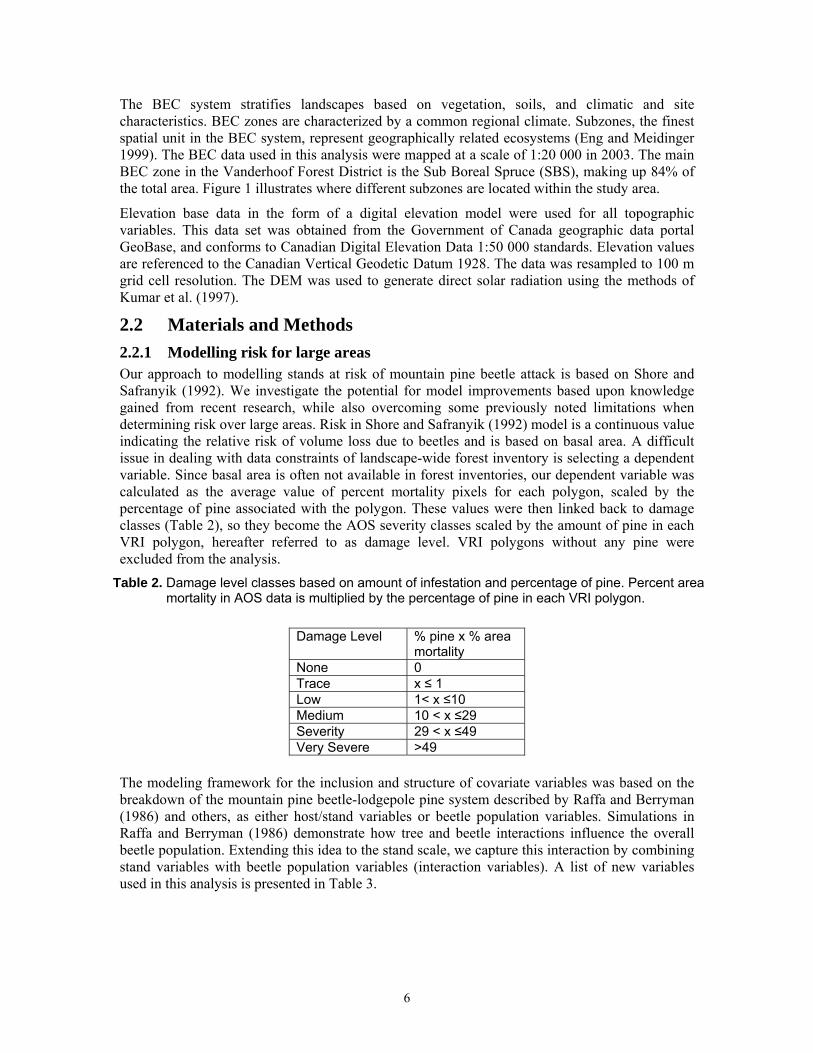
2.2 Materials and Methods 2.2.1 Modelling risk for large areas Our approach to modelling stands at risk of mountain pine beetle attack is based on Shore and Safranyik (1992). We investigate the potential for model improvements based upon knowledge gained from recent research, while also overcoming some previously noted limitations when determining risk over large areas. Risk in Shore and Safranyik (1992) model is a continuous value indicating the relative risk of volume loss due to beetles and is based on basal area. A difficult issue in dealing with data constraints of landscape-wide forest inventory is selecting a dependent variable. Since basal area is often not available in forest inventories, our dependent variable was calculated as the average value of percent mortality pixels for each polygon, scaled by the percentage of pine associated with the polygon. These values were then linked back to damage classes (Table 2), so they become the AOS severity classes scaled by the amount of pine in each VRI polygon, hereafter referred to as damage level. VRI polygons without any pine were excluded from the analysis.
Table 2. Damage level classes based on amount of infestation and percentage of pine. Percent area mortality in AOS data is multiplied by the percentage of pine in each VRI polygon.
Damage Level % pine x % area
mortality None 0 Trace x ≤ 1 Low 1< x ≤10 Medium 10 < x ≤29 Severity 29 < x ≤49 Very Severe >49
The modeling framework for the inclusion and structure of covariate variables was based on the breakdown of the mountain pine beetle-lodgepole pine system described by Raffa and Berryman (1986) and others, as either host/stand variables or beetle population variables. Simulations in Raffa and Berryman (1986) demonstrate how tree and beetle interactions influence the overall beetle population. Extending this idea to the stand scale, we capture this interaction by combining stand variables with beetle population variables (interaction variables). A list of new variables used in this analysis is presented in Table 3.

7
Table 3. New variables included in model development. Variable name Category Rationale BEC Subzone
(BEC) Stand Resistance The beetle life cycle is principally determined by temperature.
BEC zones may represent suitably scaled delineations for identifying variations in the productivity of beetle populations.
Annual direct shortwave
radiation (SWR)
Stand Resistance Changing climate may impact the effect of elevation on beetle populations. Direct radiation may indicate variability in the productivity of beetle populations more accurately than elevation alone.
% pine infested in 2004 (PPI04)
Beetle Population The proportion of pine infested represents both beetles and the amount of pine remaining in the stand.
Damage level in 2004 (INC0304)
Beetle Population Aerial increase in infestation in 2004 as recorded in aerial surveys.
Damage level in 2003 (INC0203)
Beetle Population Aerial increase in infestation in 2003 as recorded in aerial surveys.
# years infestation present in 2004
(INFDUR)
Beetle Population Indicator of the infestation trend.
# red attacked trees in stand in 2004 (NUMRED)
Beetle Population Estimate of the local beetle population.
Site index (R_SI) Interaction High site indices represent productive stands and, under epidemic conditions, productive beetle populations.
Crown closure (R_C)
Interaction Stand canopies determine the amount of radiation received on the bole and impact pheromone mediated dispersal.
Quadratic mean diameter at breast height (R_QDBH)
Interaction Mountain pine beetles attack large diameter pine disproportionately. Tree diameters above 25.4 cm are thought to be infestation sources, while those below this threshold are infestation sinks (Safranyik et al. 1974)
2.2.1.1 Stand Resistance Variables Stand resistance typically indicates stand vigour, which is inversely related to the ability of mountain pine beetles to overcome a tree's defences. New variables related to the stand’s ability to defend against beetle attacks include its BEC subzone and the amount of annual direct shortwave radiation (SWR) (Wulder et al. 2006a). Other stand resistance variables known to be intimately linked with the state of the beetle population, such as site index, crown closure, and dbh, are included instead as interaction variables.
2.2.1.2 Beetle Population Variables The integrated beetle population data contains cumulative area infested levels for each year from 1999 to 2005. From this data, we estimated the spatial and temporal trends in beetle population levels. Beetle population variables provide information about the local characteristics of the infestation; those used in modelling included percent pine infested in 2004 (PPI), infestation in 2004 (INC0304), infestation in 2003 (INC0203), duration of infestation (INFDUR), and the number of red attacked trees in 2004 (NUMRED).
8
2.2.1.3 Interaction Variables Stand variables whose impacts on beetle populations are tied to the population state were modelled as interaction variables. We used a sigmoid function to scale interaction variables, w, on a scale [0,x], where x is the percentage of pine in the stand.
))/)2/((1 zrzzrtcxw −++
= (1)
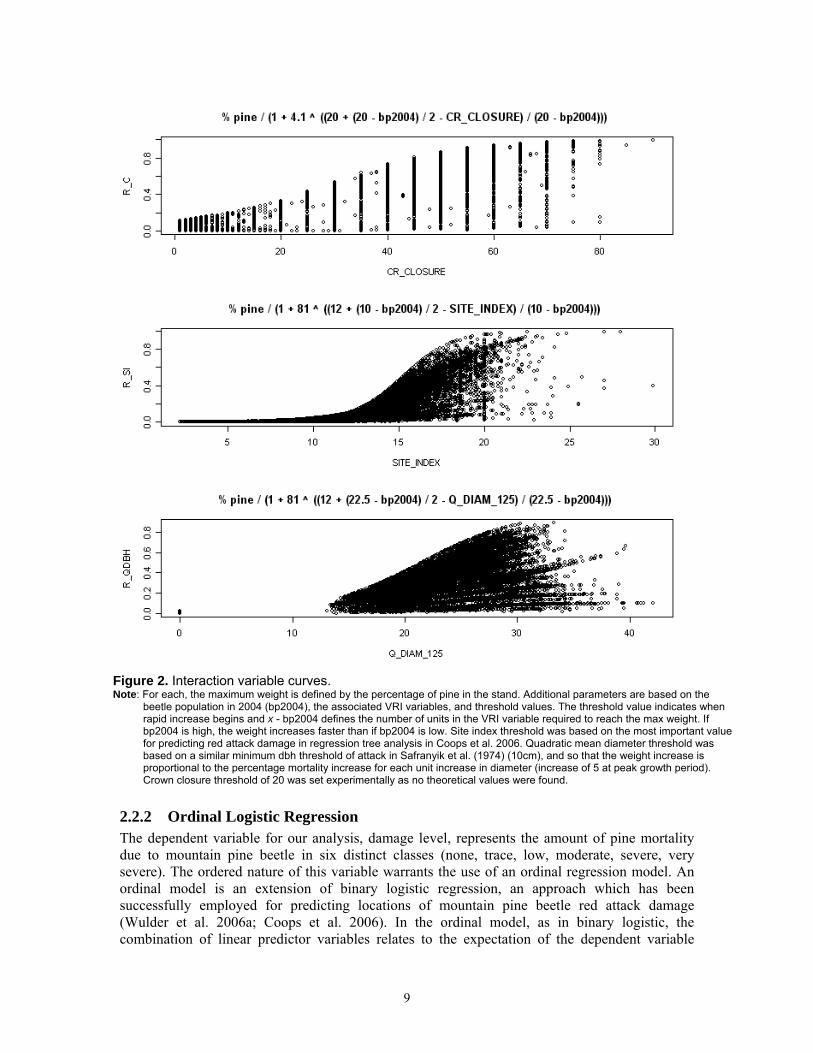
The threshold value of the variable z is denoted as t, and the range of z that defines how quickly w reaches x is defined by zr. A constant c defines initial values and was determined experimentally from the data available. This sigmoid function represents the threshold nature of mountain pine beetle population interaction with variable z by defining two parameters: the initial increase of the weight as variable z increases, and the value of z at which exponential increase in weight occurs. The beetle population variable defines the slope of the curve (zr) and the threshold value (t) of z is defined based on previous mountain pine beetle research. The highest weights are associated with stand conditions that promote beetle brood production when the population state is at epidemic levels. Variables modelled as interactions were crown closure (R_C), site index (R_SI), and quadratic mean diameter at breast height (R_QDBH). Figure 2 presents the details of the interaction variable curves.
9
Figure 2. Interaction variable curves. Note: For each, the maximum weight is defined by the percentage of pine in the stand. Additional parameters are based on the
beetle population in 2004 (bp2004), the associated VRI variables, and threshold values. The threshold value indicates when rapid increase begins and x - bp2004 defines the number of units in the VRI variable required to reach the max weight. If bp2004 is high, the weight increases faster than if bp2004 is low. Site index threshold was based on the most important value for predicting red attack damage in regression tree analysis in Coops et al. 2006. Quadratic mean diameter threshold was based on a similar minimum dbh threshold of attack in Safranyik et al. (1974) (10cm), and so that the weight increase is proportional to the percentage mortality increase for each unit increase in diameter (increase of 5 at peak growth period). Crown closure threshold of 20 was set experimentally as no theoretical values were found.
2.2.2 Ordinal Logistic Regression The dependent variable for our analysis, damage level, represents the amount of pine mortality due to mountain pine beetle in six distinct classes (none, trace, low, moderate, severe, very severe). The ordered nature of this variable warrants the use of an ordinal regression model. An ordinal model is an extension of binary logistic regression, an approach which has been successfully employed for predicting locations of mountain pine beetle red attack damage (Wulder et al. 2006a; Coops et al. 2006). In the ordinal model, as in binary logistic, the combination of linear predictor variables relates to the expectation of the dependent variable
10
through a link function, usually the logit function. Since there are multiple ordered responses, multiple equations need to be resolved in ordinal regression (Guisan and Harrell 2000).
Two common ordinal regression models involving dependent variables derived from a continuous phenomenon have been categorized. The proportional odds (PO) model (Walker and Duncan 1967) is based on cumulative probabilities, and the continuation ratio (CR) model (Armstrong and Sloan 1989) is based on conditional probabilities. CR models are suited for situations where the dependent variable Y must pass through one category to reach the next (Guisan and Harrell 2000). The standard PO model assumes that the slopes of each independent variable X are equal for all levels of Y. Since we are modelling the dynamics between Y and X explicitly through the interaction variables and the progression of damage level need not pass through one level to reach the next (given our temporal resolution), we selected the PO model, defined as follows.
)])(exp[1(
1)|(Xba
XjYPj +−+
=≥ (2)
Or rather, that the probability of the observed Y falling in a class greater than or equal to class j given the explanatory variables in X is similar to a logistic model where {Y ≥ j, 1 and {Y < j,
0 for all levels of j in the ordinal dependent variable Y. Thus in the case where j = 1, the PO model is equivalent to the logistic model. For additional levels of j, the coefficients, b, stay the same while the intercept term, a, varies. All models were developed using functions in the Design package (Harrell 2001) for the statistical software R (Ihaka and Gentelman 1996). The PO model assumes that the independent variables vary linearly with the ordinal response variable. To check this assumption, we plotted the mean of each of the final predictor variables for each damage level against the expected value under ordinality. Confirmation of the PO assumption can be determined if the observed means are similar to the expected.
Despite the more relaxed assumptions for ordinal regression (similar to logistic) compared to ordinary least squares (OLS), one remaining requirement is that observations are independent. Since we know mountain pine beetle processes are structured spatially, we might also expect damage level to be spatially autocorrelated, and therefore there is the potential for inflated parameter estimates due to reduced degrees of freedom (Cliff and Ord 1981; Legendre 1993). Following the approach laid out in Bigler et al. (2005), we applied the Huber-White covariance estimator for cluster-correlated data, where each stand polygon was treated as a cluster (Huber 1967; White 1982). Correlated responses were corrected using the Huber-White method as implemented in the Design package for R (Harrell 2001). All reported model parameter estimates are corrected versions.
2.3 Model Development, Selection and Validation Models were developed using a random sample of approximately 50% of the polygons in the Vanderhoof VRI data (n = 23,683). Edge polygons were excluded to avoid any edge effects in the neighbourhood effect variable. Significance of predictor variables was assessed with the Wald x2, which tests the null hypothesis that the coefficient is zero. The relative importance of variables was determined with x2-df on significant variables in the model. The overall fit of the model was assessed with the Nagelkerke R-Square (R2) (Nagelkerke 1991). Furthermore, model fit was also assessed with a measure of association for ordinal data, Goodman-Kruskal Gamma (Goodman and Kruskal 1954), which accounts for the ordered nature of the data (i.e., L predicted as M is less wrong than L predicted as VS); calculated as:
)/()( QPQP +−=γ (3)
11
Where P is the number of concordant pairs and Q is the number of discordant pairs, so it ranges from 0 to 1, where 1 indicates perfect prediction. Predictions no better than random will have γ near 0. In our analysis, P corresponds to the number of pairs classified in a class adjacent to the true damage level, while Q is the number of pairs where the predicted class is not adjacent to the true damage level. Ties, or correctly predicted classes, are ignored. Gamma can be interpreted as contribution of the independent variables in reducing errors incurred when predicting the response randomly.
To assess our model as a means of developing a large-area risk index, we compared a baseline model where damage level is related to the Shore and Safranyik Pine Risk Index (PRI), a modification of the 1992 risk rating system, to the best model obtained by adding the new variables outlined in Table 3. The component variables of PRI were also included separately during model development to assess their individual impact on risk. This allowed us to determine the relative enhancements additional variables may play in risk rating for large areas. Potential co-linearity in variables was assessed with Pearson’s r for each pairwise combination of variables. For values of r > 0.7, we tested variables separately during model development. As a final test to determine the impact of the interaction variables on model results, they were replaced by untransformed versions and models were re-estimated and assessed.
Model testing on independent data (i.e., the remaining 50% of the VRI polygons; n = 23 729) was also undertaken to assess the predictive accuracy of the adjusted model. The final adjusted model used for prediction used significant variables with coefficients ≥ 0.01. Prediction accuracy was assessed for each level of the dependent variable to assess the variation in model sensitivity to different damage levels. Prediction accuracy was measured by calculating sensitivity, specificity and classification accuracy for each damage level based on a 50% probability threshold.
We also assessed prediction accuracy with the area (AUC) under the receiver operator characteristic (ROC) curve for each set of predictions (Fielding and Bell 1997; Manel et al. 2001; Allouche et al. 2006; Coudun and Gegout 2007; Wunder et al. 2007). The ROC is a plot of the true positive rate on the y axis against the false positive rate on the x axis. The AUC is a threshold independent measure of overall accuracy with values from 0.5, indicating a random model, to 1, indicating perfect prediction. The AUC avoids the need for an arbitrary selection of a single probability threshold and provides information about the nature of both sensitivity and specificity (Manel et al 2001; Allouche et al. 2006). ROC plots for each predicted damage level are presented to assess the trade-off between sensitivity and specificity. Hosmer and Lemeshow (2000) suggest the following general guide to interpreting the AUC: a value > 0.9 is outstanding prediction, 0.8 – 0.9 is an excellent model, and 0.7 – 0.8 is an acceptable model.
3 Results and Discussion 3.1 Results 3.1.1 Baseline model The fit of the baseline model is summarized in Table 4a. Overall, PRI in 2004 related weakly to forest damage level in 2005. PRI was a significant predictor variable (x2 = 2603.66, p < 0.0001) of forest damage, yet the model explained a small proportion of the overall variability (R2 = 0.11). The ordinal association measure was low, with γ = 0.26. The adjusted parameter estimate for PRI indicates a very slight increase (1.54%) in the odds of an increase in damage level will occur with one unit increase in PRI. The baseline model was not assessed for predictive accuracy on the independent data.

12
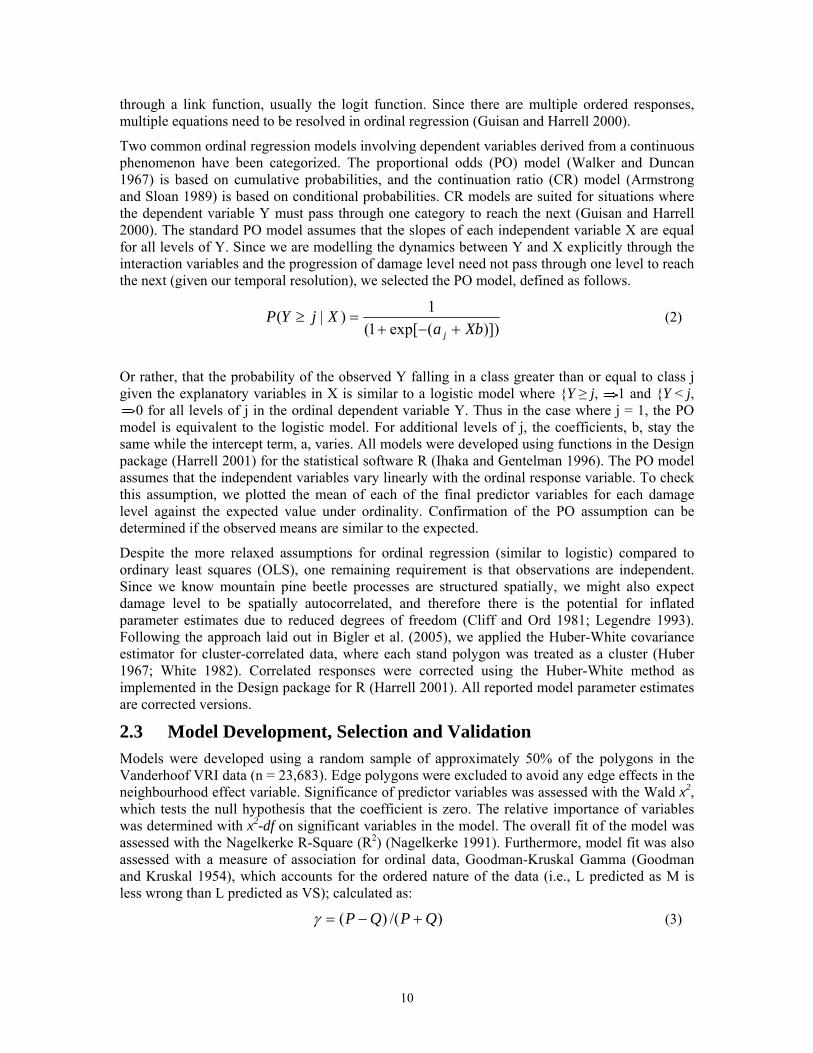
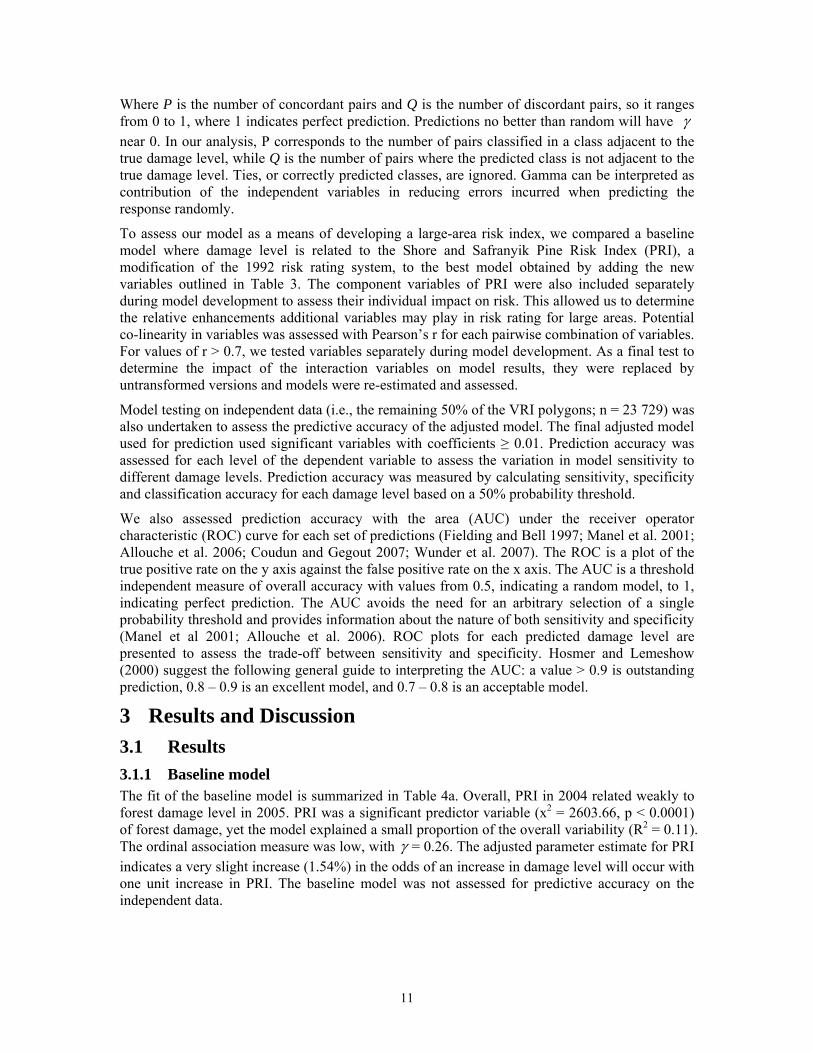
3.1.2 Adjusted model Pearson’s correlation matrix of all new variables revealed colinearity in NUMRED and INC0304. NUMRED was subsequently dropped from model development. The fit of the adjusted model incorporating additional variables is summarized in Table 4b. With all variables, the model was moderately successful (Nagelkerke R2 = 0.47, γ = 0.57) at explaining the variation in damage level. The relative importance of model variables is presented in Figure 3. Increased probability of an increase in damage level of forests in 2005 was associated mostly with R_C, INC0203, BEC subzones in the ESSF zone, MSxv, SBPSdc, SBSdw, SBSmc, R_SI and BP. The plots of the independent variable means against the expected for each damage level indicated that the PO assumption was justified for most variables (Figure 4). Parameter estimates are provided in Table 4b. Re-estimating the full model with interaction variables replaced by the untransformed variables from the VRI (site index, crown closure, quadratic mean dbh) yielded a weaker model with much less explanatory power (Nagelkerke R2 = 0.21, γ = 0.37).
Table 4. Model coefficients and estimates. a) Baseline Model. Nagelkerke R2 = 0.11, K-W γ = 0.26.
Parameter coefficient Wald Sig. S.E. Y ≥ T 0.8941 37.73 0.000 0.024 Y ≥ L -0.3184 -14.55 0.000 0.022 Y ≥ M -1.4177 -61.07 0.000 0.023 Y ≥ S -2.4484 -91.21 0.000 0.027 Y ≥ VS -3.7628 -107.51 0.000 0.035 PRI 0.0153 51.03 0.000 0.000
b) Adjusted Model. Nagelkerke R2 = 0.47, K-W γ = 0.57.
Parameter coefficient Wald Sig. S.E. Y ≥ T -0.8820 -12.83 0.000 0.069 Y ≥ L -2.5582 -35.88 0.000 0.071 Y ≥ M -3.9838 -54.66 0.000 0.073 Y ≥ S -5.3274 -70.54 0.000 0.076 Y ≥ VS -6.9153 -85.44 0.000 0.080 PRI -0.0047 -9.45 0.000 0.000 BP 2.3129 30.87 0.000 0.075 Inc0203 -6.1958 -40.34 0.000 0.154 Inc0304 -1.1121 -5.15 0.000 0.216 R_QDBH 1.1073 9.67 0.000 0.114 R_C 4.8708 67.80 0.000 0.072 R_SI -2.6736 -30.27 0.000 0.088 ESSFmvp 1.1219 2.20 0.028 0.510 ESSFxv 1.1601 3.11 0.002 0.373 MSxv 0.4191 1.89 0.059 0.222 SBPSdc 0.2374 2.00 0.046 0.119 SBPSmc -0.6227 -10.57 0.000 0.059 SBSdk -0.6039 -12.89 0.000 0.047 SBSdw 0.3819 8.47 0.000 0.045 SBSmc 0.2810 7.10 0.000 0.040
13
Figure 3. Variables in new model.
Note: The measure of variable importance in the model, x2 – df, takes into consideration the extra degrees of freedom in BEC subzone variable (categorical predictors), and is equivalent to the x2 test for continuous predictor variables.
Figure 4. Plots of independent variable means ordinally for adjusted model. Note: The PO assumption is confirmed if the observed (solid) matches the predicted (dotted) under the assumption of
proportional odds. This can be roughly confirmed for 4 out of the 6 variables, suggesting the PO model was appropriate.
14
3.1.3 Prediction Accuracy The adjusted model performed reasonably well when using a 50% probability of damage threshold for the cutoff (Table 5). The percentage of correctly classified cases ranged between 75%–93%. Examining the prediction performance for positive against negative cases revealed widely varying prediction accuracies. The sensitivity, or true positive rate, ranged from 1%–98%, while the specificity, or true negative rate, ranged from 48%–100%. Sensitivity declined with increasing damage level, while specificity showed the opposite trend. The variability in these measures demonstrates their sensitivity to prevalence, common to most measures derived from contingency tables (Allouche et al. 2006).
Table 5. Prediction accuracy for different damage levels using 50% probability threshold. Damage level Sensitivity Specificity Correct Classification Rate T 98% 48% 91% L 84% 60% 76% M 67% 80% 75% S 38% 92% 81% VS 1% 100% 93% Note: Sensitivity is the percentage of correctly predicted true positives, and specificity is the percentage of correctly predicted true negatives. Correct classification rate is the total percentage of correctly predicted cases.
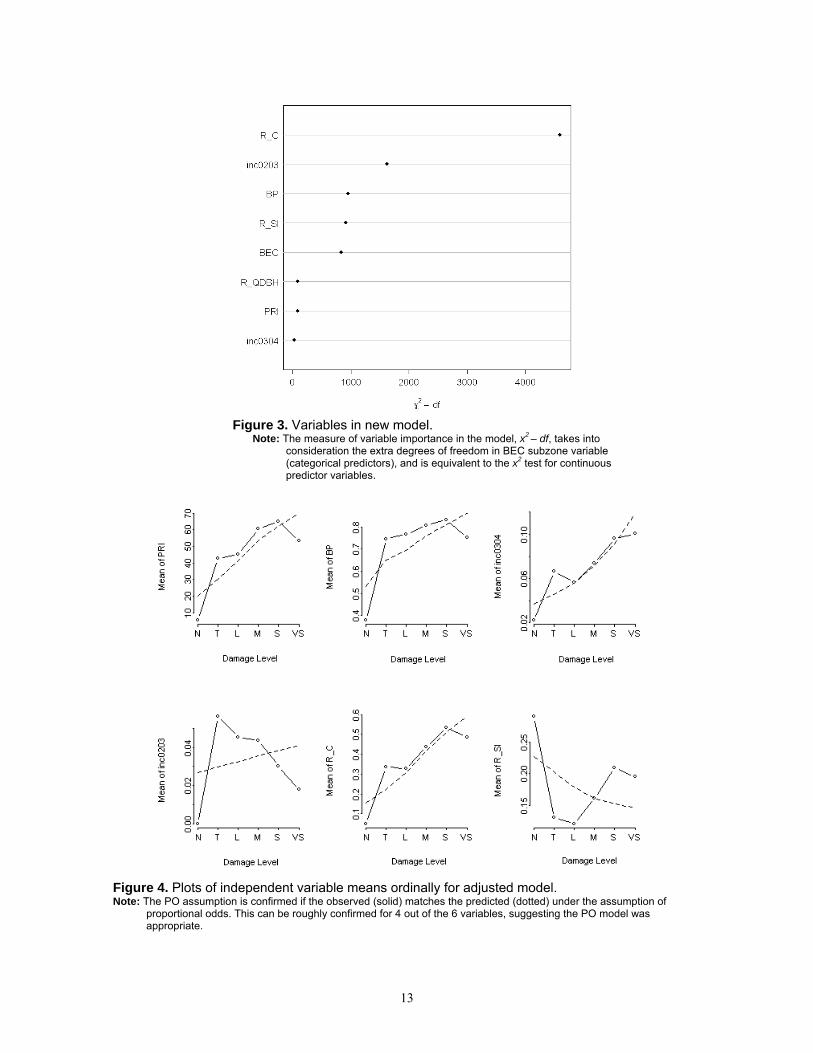
Predictions made on cumulative damage levels yielded an average AUC of 0.84. This falls in the range of an ‘excellent’ predictor. The ROC curves for each damage level are presented in Figure 5. Predictions of polygons with at least a trace amount of damage, analogous to predicting red attack presence, yielded an AUC of 0.93. Predictions made at other damage levels ranged from 0.80 to 0.83. All of these scores indicate good prediction accuracy for the adjusted model.
Figure 5. ROC curves for 2005 mountain pine beetle forest damage
levels predicted from separate model alpha coefficients.

15
Spatial distributions of predicted probabilities for each cumulative damage level are presented in Figure 6. Polygons in each map indicate the probability value that is equal to or above the specified damage level. There is large spatial variation in damage level. A large patch of non susceptible pine is discriminated fairly well at the low damage level. Prediction probabilities for very severe are quite low, indicating underprediction in areas with very severe damage. However, overall predictive accuracy for the very severe class was high because so much of the area was classified as true negative (Table 5). The 50% probability threshold used to derive contingency table scores in Table 5 was too low to capture the predictions of very severe damage output by the model. This highlights the difficulty of using a fixed probability threshold for predicting multiple ordinal classes. Depending on infestation level or user information need, the threshold may be made more or less conservative. The probability values may also be mapped to spatially identify trends in infestation levels and as an aid to planning or mitigation activities.
Figure 6. Maps of predicted probabilities for each damage level.
16
3.2 Discussion The improvement of the adjusted model over the baseline model highlights the importance of additional variables for assessing the risk of mountain pine beetle infestation over large areas. Components of PRI such as tree age, location, stand density, and stand composition are derived from many field experiments and have been validated empirically (Safranyik et al. 1974 and others), yet when used for modeling stand risk in this analysis, the PRI did not perform well, either as an index or when broken into its individual factors. Only one (BP) out of the five most important predictors of damage level was from the baseline model (Figure 3). Reasons for this disparity are likely based on data quality rather than biological factors associated with the beetle. Specifically, performance is likely impacted by how well different variables are represented in the forest inventory and the nature of mountain pine beetle aerial detection surveys. For example, crown closure may be more accurately estimated than stems per hectare via air photo interpretation. Additionally, the nonlinear relationship between risk and stem density in PRI, representing intraspecific competition yielding weaker, less productive beetle broods (Shore and Safranyik 1992), may not be important for modeling the overall trend of the infestation over large areas. Stands with many moderately productive trees or fewer very productive trees, as long as they are above the diameter threshold, will contribute to an increased beetle population the following year.
The objective of this research was to incorporate knowledge gained from recent mountain pine beetle research, and new methodological approaches, to identify variables important for predicting risk of mountain pine beetle infestation over large areas. The adjusted model (Nagelkerke R2 = 0.47, γ = 0.57) demonstrated an improved fit over the baseline model (Nagelkerke R2 = 0.11, γ = 0.26), indicating the importance of some of the new variables in predicting risk over large areas. The adjusted model performed well when used for predicting mountain pine beetle damage level on independent data (AUC = 0.84). The ROC curves for model predictions at different cumulative damage levels in Figure 5 show that the model predicts best for at least trace amounts, which is similar to a binary logistic model predicting locations of red attack. Interestingly, the next best predictions were for polygons with ‘at least severe’ and ‘at least very severe’ damage levels.
The use of ordinal regression modelling provides a framework for exploring the probability of occurrence of different levels of mountain pine beetle infestation. The PO ordinal model specifies constant regression coefficients and regression intercepts that vary with different levels of the dependent variable. We applied the adjusted model to independent data and assessed prediction accuracy for different damage levels. Using the AUC as our measure of predictive accuracy avoided the need to select an arbitrary probability threshold. This is important for mountain pine beetle risk assessment because the main source of beetle population data, aerial overview surveys, is collected in ordinal mortality classes. We were able to explore the variation in these classes, and build a new model of risk for large areas that predicts new occurrences of mortality classes. In our analysis, mortality classes were scaled by the percentage of pine in each polygon to yield damage level.
Probabilities derived from the adjusted model for cumulative levels of damage were mapped for the entire study area (Figure 6). Each map shows the probability that each polygon is at greater than or equal to a given damage level. Examining the difference between these maps sheds light onto the spatial distribution of mountain pine beetle risk over a very large area. While beyond the scope of this current research, spatial investigation of the differences between these probability maps may yield insights into the importance of various model input variables (Wulder et al. 2007).
17
The interaction variables R_C and R_SI were both important predictors of damage level. The s-curve functions defining the interaction variables appear to have captured the dynamics of damage level increases. When interaction variables were replaced with untransformed versions, the model fit declined markedly. R_C was the most important variable in the model (Figure 3). Increases in R_C were associated with an increased probability of an increase in damage level. This supports results from Powell et al. (2000), which found crown closure to be positively related to stand risk to mountain pine beetle attack. The interaction between beetle population level and crown closure indicates that high crown closure, high percentage of pine, and a large increase in infestation in the year previous is positively associated with increases in damage level. Perhaps modelling crown closure in this way captures the period during which stand resistance declines, yet phloem thickness remains sufficient to sustain the epidemic (Berryman 1982), or indicates that beetle populations have grown to the point where even an effective host resistance is no defense against beetle mass-attack (Safranyik and Carroll 2006). For predicting risk over large areas, R_C may be a more useful variable for risk rating than variables based on stand density. This is important because crown closure is more commonly available than stand density in forest inventory data
The site index interaction variable, R_SI, was also an important predictor of damage level. Site index has been identified in previous models of red attack damage as an important variable at the stand level (Coops et al. 2006). In our model, R_SI was inversely related to the increases in beetle damage. This suggests that high site index combined with high percentage of pine is associated with lower odds of a stand sustaining an increased damage level. This is expected if site index accurately reflects the site conditions of the stand and contributes to increased tree vigour and concomitant stand resistance to beetle attack. Furthermore, site index is a difficult variable to include in models of large area risk because it generally refers to site productivity of the leading species. Thus, where lodgepole pine is not the leading species, site index does not represent site productivity for lodgepole pine. In the Vanderhoof Forest District, lodgepole pine is a leading species in over 50% of stands. Species composition is less of an issue in our model because the upper bound of R_SI is defined by the percentage of pine, so stands where site index describes a non-pine leading species will have a maximum R_SI value less than 0.50.
BEC subzones were also important factors for predicting damage level. Negative associations were found in the SBPSmc and the SBSdk. The SBPSmc occurs along the south eastern edge and south western edges of the study area (Figure 1). This zone is dominated by dry lodgepole pine forests, and the site productivity in the SBPS is generally low. Stressed and stunted trees in this zone may be limiting the broods of beetles, and the cold climate of the SBPS may be causing greater mortality of beetles in this area relative to other zones (Steen and Demarchi 1991). The SBSdk occurs throughout study area at lower elevations, following the Nechako river valley. Here, conditions for lodgepole pine are more favourable with higher site productivity, yet mixed forests are also more common (Meidinger et al. 1991). Since a high damage level is related to the amount of pine in each stand, the risk level may not increase past a certain level in these areas. All other subzones had positive associations with damage level. The importance of climate and location in the mountain pine beetle system is well known. The BEC subzones in our model of stand risk offer a suitably scaled stratification of the landscape for exploring regional variation in mountain pine beetle processes, and subsequently, for predicting the future course of epidemics.
Interestingly the most important beetle population variable in the model was the increase in infestation in 2003, two years previous to the prediction year. Over large areas, locations previously infested are more likely to be infested than locations that have not already been subjected to attack (White et al. 2006). It is possible that the winter conditions (brood over-wintering success) in 2002 were similar to those in 2004, resulting in similar outcomes.
18
Mitigating the spread of mountain pine beetles into new areas may be facilitated by focusing efforts on known areas of infestation to effect local reductions in beetle populations (as well as the proportion of beetles eligible for long range transport). The effort and expense in seeking endemic infestation levels at the leading edge, which may be less “dangerous” as fewer beetles exist locally for mass attack, and the proportion of beetles that do engage in long-range transport (estimated at 2.5% by Safranyik et al. 1992) will not be sufficient in number to overwhelm the defenses of a mature pine (especially in climatically difficult, new range, environments). Much research has indicated that short range dispersal is the primary means of infestation spread over large areas. Perhaps the largest, most intense landscape infestations should be the focus of management activities aimed at reducing the spread of beetle populations into new areas.
Modeling beetle-host interactions at the stand level with interaction variables also improved our model. Incorporating ecological complexity into models of risk requires a trade-off with accuracy. Our formulation captures some of the dynamics of this ecological complexity, yet remains relatively simple to implement with operational data. Future risk assessment models may benefit from exploring interaction variables further.
Including BEC subzones in the model provides evidence that incorporating information about local ecological characteristics is vital to any model of mountain pine beetle infestation. For British Columbia, the BEC system offers a suitably scaled classification which could serve this purpose. However, incorporating the full BEC system into a mountain pine beetle risk model requires detailed analysis of the suitability of each subzone for mountain pine beetle. One option would be to map mountain pine beetle climate suitability classes (Carroll et al. 2006) to BEC subzones and use these as a component in a large area risk index. Alternatively, regional variation in mountain pine beetle populations may be too complex to model accurately with one model. A better approach may be to develop region-specific models of risk.
4 Conclusions In this research, we developed a model using operationally available data for predicting mountain pine beetle damage over a large area. Our objective was to identify new variables related to mountain pine beetle risk, with the aim of ultimately developing an index, similar to the Shore and Safranyik PRI, which could easily be applied to large areas throughout the mountain pine beetle range. The results of our model have several implications for predicting the spatial pattern of mountain pine beetle infestations.
The addition of variables describing the temporal trend in beetle population improved our ability to predict future patterns of infestation. Detection and mapping of beetle red attack damage levels have been topics of extensive research and many sources of data are available to accurately characterize past infestations (AOS, satellite remotely sensed data, helicopter-GPS, and air photo interpreted products). Most beetle monitoring programs have been collecting data for many years and, for many locations, multiple years of survey data have been compiled. Additionally, the use of various remotely sensed data sources facilitates retrospective analyses for spatial and/or temporal gaps in the historical survey record. The integration of various sources of survey data allows temporal and spatial trends in the beetle infestation to be extracted and used for risk assessment. In our analysis, the beetle population from two years previous to the prediction year was most important for discriminating damage level.
Through this research, we have demonstrated the utility of including readily available data sets for representing beetle population trend, interaction with hosts, and a stratification of the landscape to aid in operational risk rating of mountain pine beetle infestation. We follow Shore et al. (2006) in acknowledging the stochastic nature of the prediction mountain pine beetle infestation likelihood. The complex interactions between forest conditions, climate, and insects have many random or poorly understood elements, and as a result, any improvement in model
19
predictive ability, especially those facilitated through readily available additional support data, are welcomed and of use to the science and management communities interested in mountain pine beetle movement and impacts.
5 Acknowledgements This project was funded by the Government of Canada through the Mountain Pine Beetle Program, a three-year $100-million program administered by Natural Resources Canada, Canadian Forest Service. Publication does not necessarily signify that the contents of this report reflect the views or policies of Natural Resources Canada, Canadian Forest Service.
6 Contact Trisalyn Nelson Spatial Pattern Analysis & Research (SPAR) Laboratory Dept of Geography, University of Victoria PO Box 3060 Victoria, BC, V8W 3R4, Canada, Tel: 250-472-5620 Email: [email protected]
20
7 Literature Cited Allouche, O.; Asaf, T.; Ronen, K. 2006. Assessing the accuracy of species distribution models:
Prevalence, kappa and the true skill statistic (TSS). Journal of Applied Ecology 43:1223–1232.
Amman, G.D. 1973. Population changes of the mountain pine beetle in relation to elevation. Environmental Entomology 2:541–547.
Amman, G.D.; McGregor, M.D.; Dahill, D.B.; Klein, W.H. 1977. Guidelines for reducing losses of lodgepole pine to the mountain pine beetle in unmanaged stands in the Rocky Mountains. USDA Forest Service General Technical Report INT-136. 19 p.
Anhold, J.; Jenkins, M. 1987. Potential mountain pine beetle (Coleoptera: Scolytidae) attack of lodgepole pine as described by stand density index. Environmental Entomology 16:738–742.
Armstrong, B.G.; Sloan, M. 1989. Ordinal regression models for epidemiologic data. American Journal of Epidemiology 129:191–204.
Aukema, B.H.; Carroll, A.L.; Zhu, J.; Raffa, K.F.; Sickley, T.A.; Taylor, S.W. 2006. Landscape level analysis of mountain pine beetle in British Columbia, Canada: Spatiotemporal development and spatial synchrony within the present outbreak. Ecography 29:427–441.
Bartos, D.L.; Amman, G.D. 1989. Microclimate: An alternative to tree vigor as a basis for mountain pine beetle infestations. Research Paper INT-400, USDA Forest Service. 10p.
Bentz, B.; Amman, G.; Logan, L. 1993. A critical assessment of risk classification systems for the mountain pine beetle. Forest Ecology and Management 61:349–366.
Bentz, B.J.; Logan, J.A.; Vandygriff, J.C. 2001. Latitudinal variation in Dendroctonus ponderosae (Coleoptera: Scolytidae) development time and adult size. Canadian Entomologist 133:375–387.
Berryman, A.A. 1978a. A synoptic model of the lodgepole pine/mountain pine beetle interactions and its potential application in forest management. Pages 98–105 in A.A. Berryman, G.D. Amman, R.W. Stark, eds. Theory and practice of mountain pine beetle management in lodgepole pine forests. University of Idaho, Moscow, ID. 223 p.
Berryman, A.A. 1978b. Towards a theory of insect epidemiology. Researches on Population Ecology 19:181–196.
Berryman, A.A. 1982. Mountain pine beetle outbreaks in Rocky Mountain lodgepole pine forests. Journal of Forestry 80:410–413.
Bigler, C.; Kulakowski, D.; Veblen, T.T. 2005. Multiple disturbance interactions and drought influence fire severity in Rocky Mountain subalpine forests. Ecology 86:3018–3029.
Blackburn, G.A.; Milton, E.J. 1996. Filling the gaps: Remote sensing meets woodland ecology. Global Ecology and Biogeography Letters 5:175–191.
(BCMoF) British Columbia Ministry of Forests. 1995. Bark beetle management guidebook. Forest Practices Branch. URL: http://www.for.gov.bc.ca/tasb/legsregs/fpc/fpcguide/beetle/betletoc.htm
BCMoF. 2000. Forest health aerial overview survey standards for British Columbia, Version 2.0. British Columbia Ministry of Forests, Forest Practices Branch, and Canadian Forest Service. Victoria, BC. 45 p.
21
(BCMSRM) British Columbia Ministry of Sustainable Resource Management. 2002. Vegetation resources inventory: Photo interpretation procedures, Version 2.4. http://www.for.gov.bc.ca/hts/vri/standards/
Carroll, A.L.; Regniere, J.; Logan, J.A.; Taylor, S.W.; Bentz, B.J.; Powell, J.A. 2006. Impacts of climate change on range expansion by the mountain pine beetle. Natural Resources Canada, Canadian Forest Service, Pacific Forestry Centre, Victoria, BC. Mountain Pine Beetle Initiative working paper 2006-14. 20 p.
Cliff, A.; Ord, J.K. 1981. Spatial processes models and applications. Pion Limited, London. 266 p.
Coops, N.C.; Wulder, M.A.; White, J.C. 2006. Integrating remotely sensed and ancillary data sources to characterize a mountain pine beetle infestation. Remote Sensing of Environment 30:83–97.
Coudun, C.; Gegout, J.C. 2007. Quantitative prediction of the distribution and abundance of Vaccinium myrtillus with climatic and edaphic factors. Journal of Vegetation Science 18:517–524.
Dymond, C.C.; Wulder, M.A.; Shore, T.L.; Nelson, T.A.; Boots, B.; Riel, B. 2006. Evaluation of risk assessment of mountain pine beetle infestations. Western Journal of Applied Forestry 21:5–13.
Eng, M.; Meidinger, D. 1999. A method for large-scale biogeoclimatic mapping in British Columbia. Ministry of Forests, Research Branch. Victoria, BC. 15 p.
Fielding, A.H.; Bell, J.F. 1997. A review of methods for the assessment of prediction error in conservation presence / absence models. Environmental Conservation 24:38–49.
Franklin, S.; Wulder, M.A.; Skakun, R.; Carroll, A. 2003. Mountain pine beetle red-attack forest damage classification using stratified Landsat TM data in British Columbia, Canada. Photogrammetric Engineering and Remote Sensing 69:283–288.
Goodman, L.A.; Kruskal, W.H. 1954. Measures of association for cross classifications. Journal of the American Statistical Association 49:732–764.
Guisan, A.; Harrell, F.E. 2000. Ordinal response regression models in ecology. Journal of Vegetation Science 11:617–626.
Harrell, F.E. 2001. Regression modeling strategies: With applications to linear models, logistic regression, and survival analysis. Springer, New York. 600 p.
Hosmer, D.W.; Lemeshow, S. 2000. Applied logistic regression. 2nd ed. John Wiley, New York. 392 p.
Huber, P.J. 1967. The behaviour of maximum likelihood estimates under non-standard conditions. Proceedings of the 5th Berkeley Symposium on Mathematical Statistics and Probability 1:221–233.
Ihaka, I.; Gentelman, R. 1996. R: A language for data analysis and graphics. Journal of Computational and Graphical Statistics 5:299–314.
Kumar, L.; Skidmore, A.K.; Knowles, E. 1997. Modelling topographic variation in solar radiation in a GIS environment. International Journal of Geographic Information Science 11:475–497.
Legendre, P. 1993. Spatial autocorrelation: Trouble or new paradigm? Ecology 74:1659–1673.
Logan, J.; White, P.; Bentz, B.; Powell, J.A. 1998. Model analysis of spatial patterns in mountain pine beetle outbreaks. Theoretical Population Biology 53:236–255.

22
Mahoney, R. 1978. Lodgepole pine-mountain pine beetle risk classification methods and their application. Pages 106–113 in D.M. Baumgartner, ed. Theory and practice of mountain pine beetle management in lodgepole pine forests. Pullman, WA. 223 p
Manel, S.; Williams, H.C.; Ormerod, S.J. 2001. Evaluating presence-absence models in ecology: The need to account for prevalence. Journal of Applied Ecology 38:921–931.
Meidinger, D.V.; Pojar, J.; Harper, W.L. 1991. Sub-Boreal Spruce Zone. Pages 209–221 in D.V. Meidinger and J. Pojar, eds. Ecosystems of British Columbia. Special Report Series 6, British Columbia Ministry of Forests, Victoria, BC. 330 p.
Nagelkerke, N.J. 1991. A note on a general definition of the coefficient of determination. Biometrika 78:691–692.
Negron, J.F.; Popp, J.B. 2004. Probability of ponderosa pine infestation by mountain pine beetle in the Colorado Front Range. Forest Ecology and Management 191:17–27.
Nelson, T.; Boots, B. 2005. Identifying insect infestation hot spots: An approach using conditional spatial randomization. Journal of Geographical Systems 7:291–311.
Nelson, T.; Boots, B.; Wulder, M.A.; Shore, T.; Safranyik, L.; Ebata, T. 2006. The impact of data on the rating of forest susceptibility to mountain pine beetle infestations. Canadian Journal of Forest Research 36:2815–2825.
Nelson, W.A.; Potapov, A.; Lewis, M.A.; Hundsdorfer, A.E.; He, F. 2007. Balancing ecological complexity in predictive models: A reassessment of risk models in the mountain pine beetle system. Journal of Applied Ecology 45:248–257.
Powell, J.; Kennedy, B.; White, P.; Bentz, B.; Roberts, D. 2000. Mathematical elements of attack risk analysis for mountain pine beetles. Journal of Theoretical Biology 204:601–620.
Raffa, K.F.; Berryman, A.A. 1986. A mechanistic computer model of mountain pine beetle populations interacting with lodgepole pine stands and its implications for forest managers. Forest Science 32:789–805.
Robertson, C.; Nelson, T.; Boots, B. 2007. Mountain pine beetle dispersal: The spatial-temporal interaction of infestations. Forest Science 53:395–405.
Safranyik, L.; Shrimpton, D.M.; Whitney, H.S. 1974. Management of lodgepole pine to reduce losses from the mountain pine beetle. Forestry Technical Report 1. Pacific Forestry Centre, Canadian Forestry Service, Victoria, BC. 25 p.
Safranyik, L.; Shrimpton, D.; Whitney, H. 1975. An interpretation of the interaction between lodegpole pine, the mountain pine beetle, and its associated blue stain fungi. Pages 406–428 in D.M. Baumgartner, ed. Management of lodgepole pine ecosystems. Symposium Proceedings of Washington State University Cooperative Extension Service.
Safranyik, L.; Linto, D.; Silversides, R.; McMullen, L. 1992. Dispersal of released mountain pine beetles under the canopy of a mature lodgepole pine stand. Journal of Applied Entomology 113:441-450.
Safranyik, L.; Carroll, A. 2006. The biology and epidemiology of the mountain pine beetle in lodgepole pine forests. Pages 3–66 in L. Safranyik and B. Wilson, eds. The mountain pine beetle: A synthesis of biology, management, and impacts on lodgepole pine. Natural Resources Canada, Canadian Forest Service, Pacific Forestry Centre, Victoria, BC. 304 p.
Schenk, J.A.; Mahoney, R.L.; Moore, J.A.; Adams, D.L. 1980. A model for hazard rating lodgepole pine stands for mortality by mountain pine beetle. Forest Ecology and Management 3:57–58.
23
Shore, T.; Safranyik, L. 1992. Susceptibility and risk rating systems for the mountain pine beetle in lodgepole pine stands. Information Report No. BC-X-336. Forestry Canada, Pacific and Yukon Region, Pacific Forestry Centre, Victoria, BC. 12 p.
Shore, T.L.; Safranyik, L.; Lemieux, J.P. 2000. Susceptibility of lodgepole pine stands to the mountain pine beetle: Testing of a rating system. Canadian Journal of Forest Research 20:44–49.
Shore, T.L.; Riel, B.G.; Safranyik, L.; Fall, A. 2006. Decision support systems. Pages 193–230 in L. Safranyik and B. Wilson, eds. The mountain pine beetle: A synthesis of biology, management, and impacts on lodgepole pine. Natural Resources Canada, Canadian Forest Service, Pacific Forestry Centre, Victoria, BC. 304 p.
Shrimpton, D.M. 1973. Age- and size-related response of lodgepole pine to inoculation with Europhium clavigerum. Canadian Journal of Botany 51:1155–1160.
Shrimpton, D.M.; Thomson, A.J. 1983. Growth characteristics of lodgepole pine associated with the start of mountain pine beetle outbreaks. Canadian Journal of Forest Research 13:137–144.
Sirois, J.; Ahern, F.J. 1988. An investigation of SPOT HRV for detecting recent mountain pine beetle mortality. Canadian Journal of Remote Sensing 14:104–110.
Skakun, R.; Wulder, M.A.; Franklin, S. 2003. Sensitivity of the thematic mapper enhanced wetness difference index to detect mountain pine beetle red-attack damage. Remote Sensing of Environment 86:433–443.
Steen, O.; Demarchi, D.A. 1991. Sub-Boreal Pine-Spruce Zone. Pages 195–208 in D.V. Meidinger and J. Pojar, eds. Ecosystems of British Columbia. Special Report Series 6: B.C. Ministry of Forests. 330 p.
Stuart, J.D. 1984. Hazard rating of lodgepole pine stands to mountain pine beetle outbreaks in southcentral Oregon. Canadian Journal of Forest Research 14: 666–671.
Thomas, C.D.; Bodsworth, E.J.; Wilson, R.J.; Simmons, A.D.; Davies, Z.G.; Musche, M. 2001. Ecological and evolutionary processes at expanding range margins. Nature 411:577–581.
Walker, S.H.; Duncan, D.B. 1967. Estimation of the probability of an event as a function of several independent variables. Biometrika 54:167–179.
Westfall, J. 2007. 2006 Summary of forest health conditions in British Columbia. Ministry of Forests, Forest Practices Branch, Victoria, BC. 66 p.
White, H. 1982. Maximum likelihood estimation of misspecified models. Econometrica 50:1–25.
White, J.C.; Wulder, M.A.; Grills, D. 2006. Detection and mapping mountain pine beetle red-attack damage with SPOT-5 10-m multispectral imagery. BC Journal of Ecosystems and Management 7:105–118.
Wu, H.X.; Ying, C.C.; Ju, H.B. 2005. Predicting site productivity and pest hazard in lodgepole pine using biogeoclimatic system and geographic variables in British Columbia. Annals of Forest Science 62:31–42.
Wulder, M.A.; White, J.C.; Bentz, B.; Alvarez, M.F.; Coops, N.C. 2006a. Estimating the probability of mountain pine beetle red-attack damage. Remote Sensing of Environment 101:150–166.
Wulder, M.A.; White, J.C.; Dymond, C.C.; Nelson, T.; Boots, B.; Shore, T.L. 2006b. Calculating the risk of mountain pine beetle attack: A comparison of distance- and density-based estimates of beetle pressure. Journal of Environmental Informatics 8:58–69.
24
Wulder, M.A.; Dymond, C.C.; White, J.C.; Leckie, D.G.; Carroll, A.L. 2006c. Surveying mountain pine beetle damage of forests: A review of remote sensing opportunities. Forest Ecology and Management 221:27–41.
Wulder, M.A.; White, J.C.; Coops, N.C.; Nelson, T.; Boots, B. 2007. Using local spatial autocorrelation to compare outputs from a forest growth model. Ecological Modelling 209:264–276.
Wunder, J.; Reineking, B.; Matter, J-F.; Bigler, C.; Bugmann, H. 2007. Predicting tree death for Fagus sylvatica and Abies alba using permanent plot data. Journal of Vegetation Science 18:525–534.