Embed Size (px)
Citation preview
Preliminary Resilience
Assessment
#resilient305
All cities face risk, and although Southeast Florida is vulnerable to rising sea levels due to its low elevation, unique geology, and the density of coastal developments- there are many opportunities for innovation with mangroves, dunes, parks spaces, and innovative building materials and designs.
Water attracted many us here- as we adapt to more water, how can we thrive socially, environmentally, and economically? How can we leverage and protect the Everglades and Biscayne Bay? This discovery area will focus investing in natural and man-made infrastructure to rise above and learn to live with water to create a more resilient community in the face of storms and sea level rise.
hello, miami We are Resilient Greater Miami & the Beaches, a partnership of Miami-Dade County, and the cities of Miami and
Miami Beach. We are the only city of the 100 Resilient Cities Network—pioneered by the Rockefeller Foundation—where multiple governments are collaborating to develop a collective voice that will, together, better allow us to plan, prepare, and respond to our community’s challenges. As part of this effort, we reached out to each of the 35 individual governments in the Greater Miami region to listen, learn, and incorporate input directly from community leaders, residents, and subject-matter experts. Like many metropolitan areas, we recognize our transportation, housing, and socioeconomic challenges; however, we are also aware of the concerns associated with climate change, sea level rise, and other long-term issues. As Resilient Greater Miami & the Beaches, we are working to reduce and mitigate many of these difficulties because Miami, as we know it today, is our home as much as it is yours. As we continue this process, we continue to engage; we continue to invest. We thank our mayors, commissioners, and city managers whose leadership and support make this happen.
We are here to stay. We hope you are, too.
James F. Murley Miami-Dade County
Jane Gilbert City of Miami
Susanne M. Torriente City of Miami Beach
James F. Murley Miami-Dade County
Jane Gilbert City of Miami
Susanne M. Torriente City of Miami Beach
Table of Contents
Welcome Introduction GM&B Today: City Context Key Actions + Progress Demographics
Engagement: Listening + Learning Areas for Discovery
Connecting Context to Discovery Pending Questions
Next Steps Acknowledgements: Thank you!
All cities face risk, and although Southeast Florida is vulnerable to rising sea levels due to its low elevation, unique geology, and the density of coastal developments- there are many opportunities for innovation with mangroves, dunes, parks spaces, and innovative building materials and designs.
Water attracted many us here- as we adapt to more water, how can we thrive socially, environmentally, and economically? How can we leverage and protect the Everglades and Biscayne Bay? This discovery area will focus investing in natural and man-made infrastructure to rise above and learn to live with water to create a more resilient community in the face of storms and sea level rise.
This Preliminary Resilient Assessment (PRA) has been created by Greater Miami & the Beaches (GM&B) as part of 100 Resilient Cities (100RC) resilience planning process. It is the culmination of our first phase of listening to and learning from all of you—residents, businesses, and community organizations. It is the foundation for our next step and outlines our most important resilience priorities. We hope you find this to be a great resource about resilience issues in Greater Miami & the Beaches. We invite to you continue on this journey with us over the next few months as we develop and prioritize actions to increase our resilience.
Participate locally through: www.resilient305.com Learn more about the global effort at: www.100resilientcities.org
welcome

Introduction
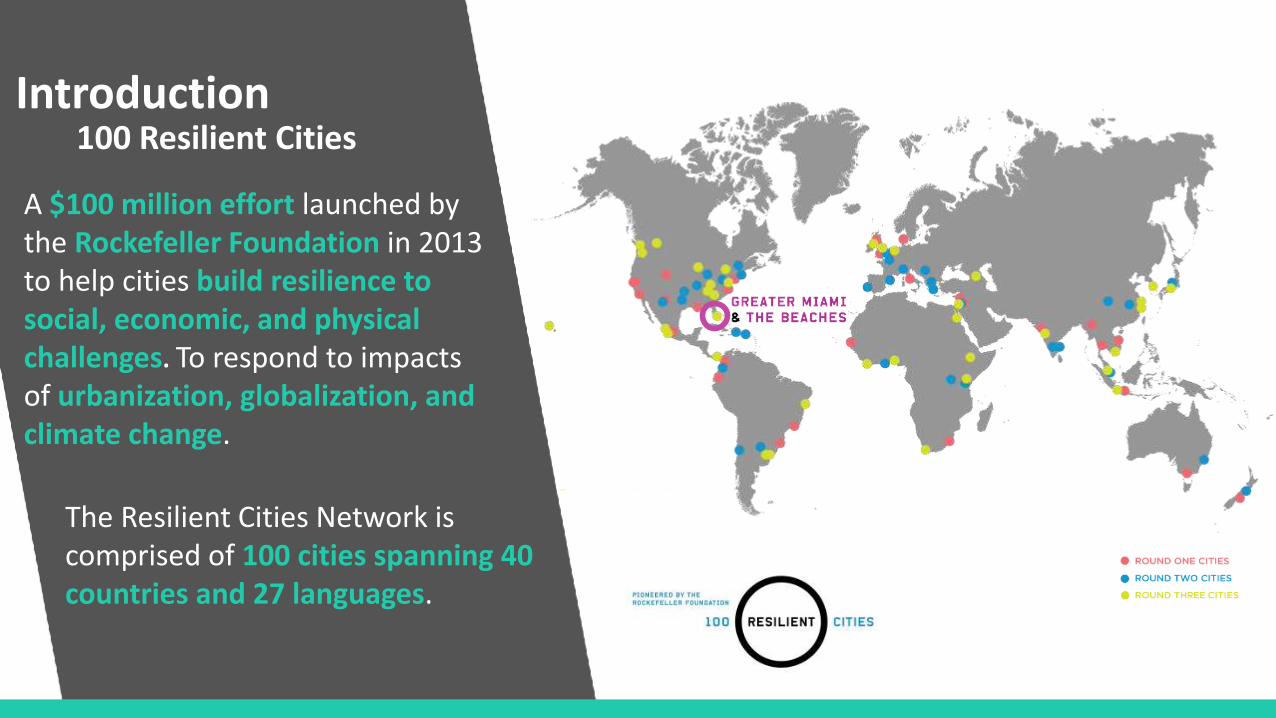
Introduction 100 Resilient Cities
A $100 million effort launched by the Rockefeller Foundation in 2013 to help cities build resilience to social, economic, and physical challenges. To respond to impacts of urbanization, globalization, and climate change.
The Resilient Cities Network is comprised of 100 cities spanning 40 countries and 27 languages.
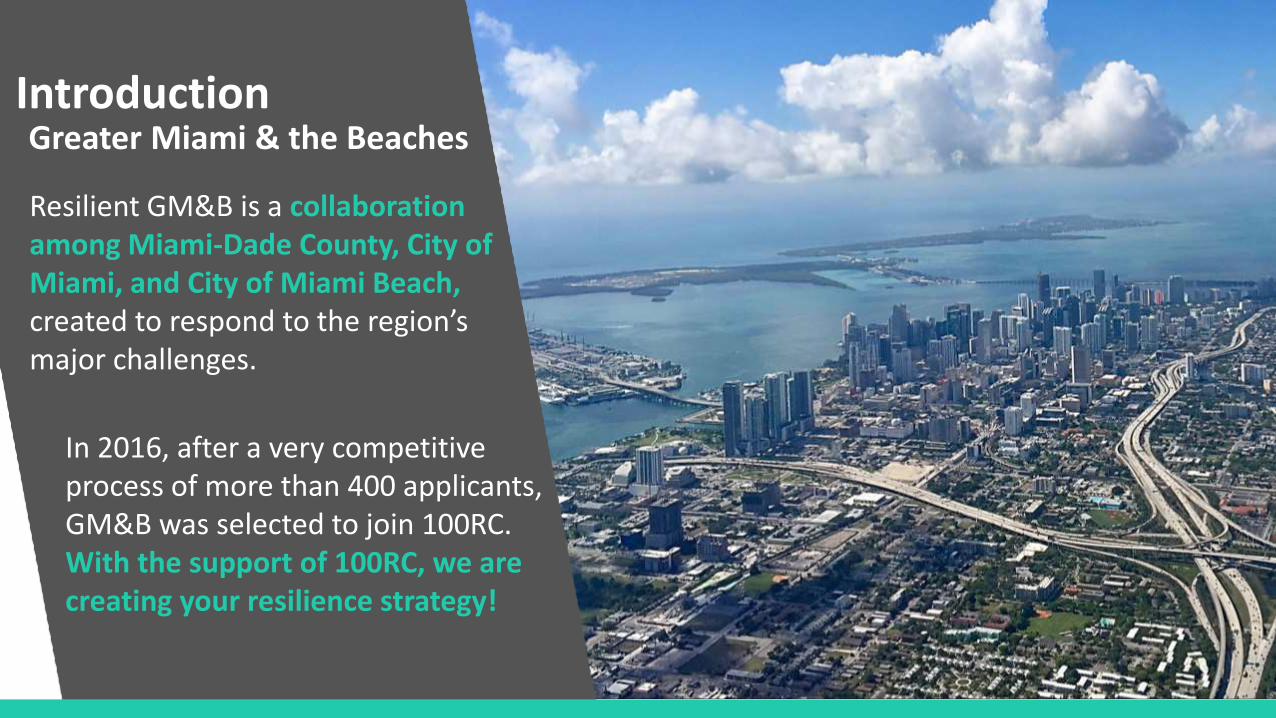
Introduction Greater Miami & the Beaches Resilient GM&B is a collaboration among Miami-Dade County, City of Miami, and City of Miami Beach, created to respond to the region’s major challenges.
In 2016, after a very competitive process of more than 400 applicants, GM&B was selected to join 100RC. With the support of 100RC, we are creating your resilience strategy!
Introduction
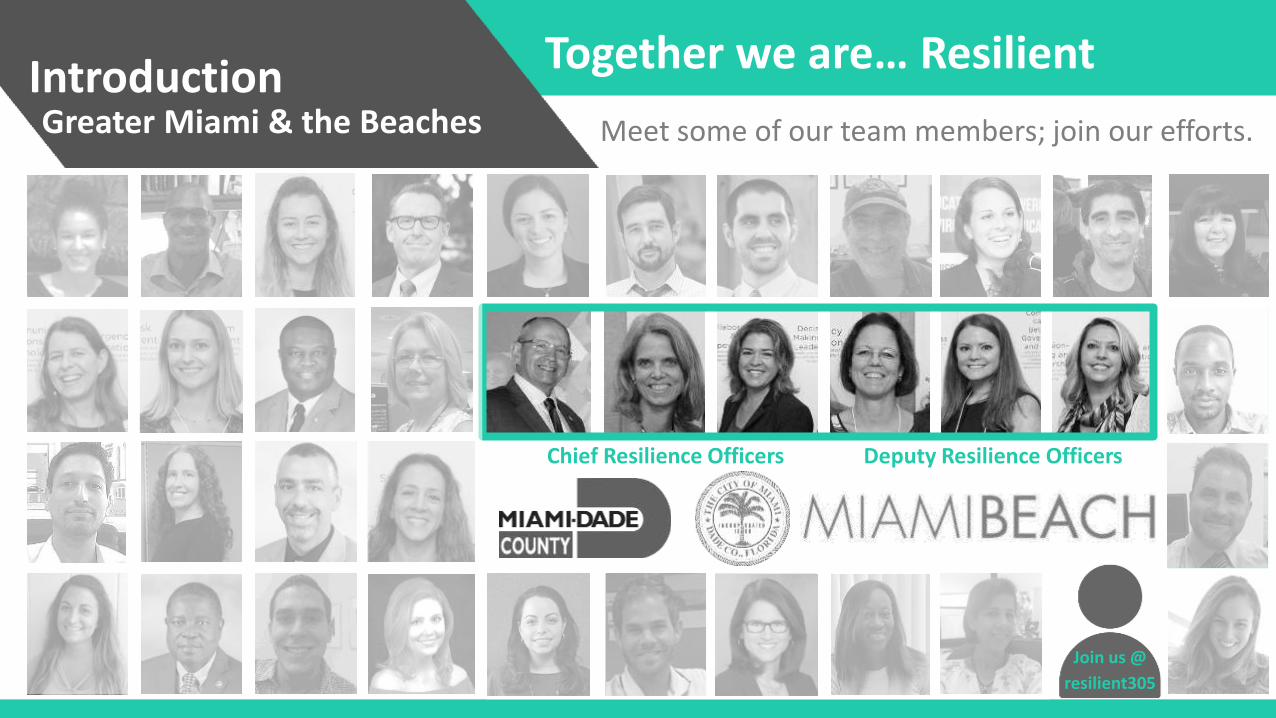
Together we are… Resilient
Greater Miami & the Beaches
Chief Resilience Officers Deputy Resilience Officers
resilient305
Join us @
Meet some of our team members; join our efforts.
Introduction
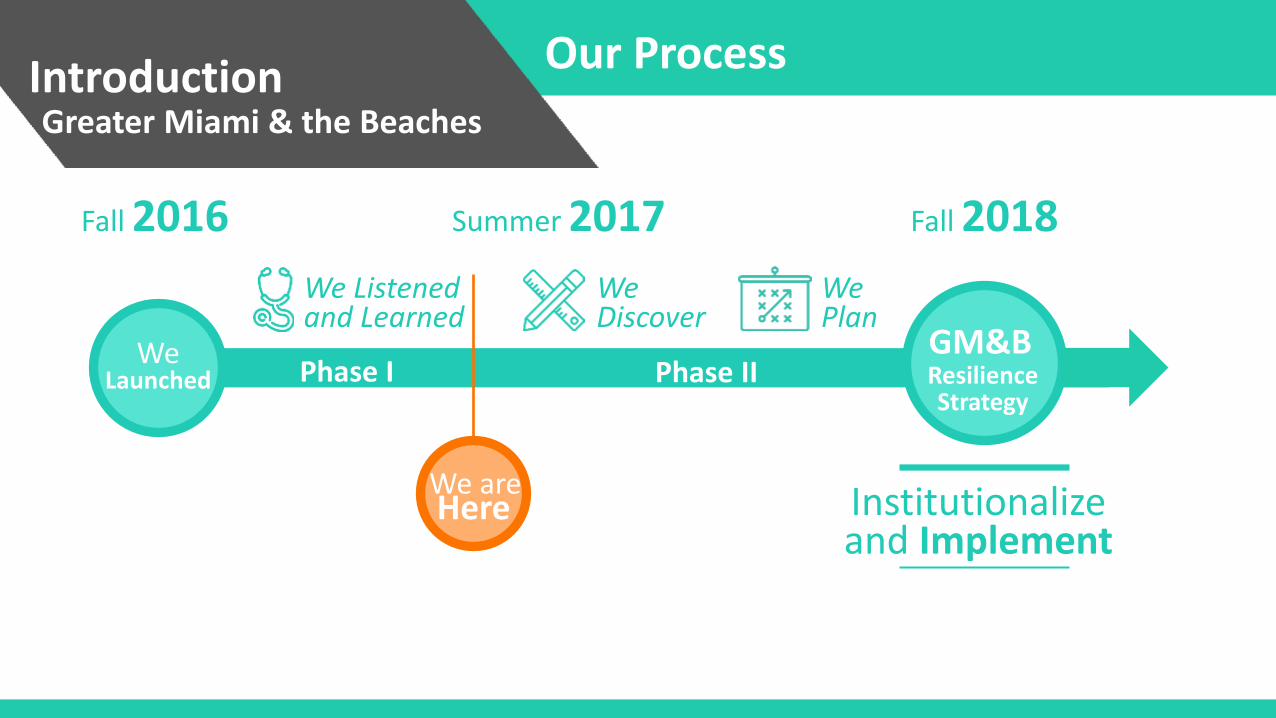
Our Process
Greater Miami & the Beaches
Fall 2016 Summer 2017 Fall 2018
We Launched Resilience
Strategy
GM&B
Institutionalize and Implement
We Listened and Learned
Phase I Phase II
We are Here
We Discover
We Plan
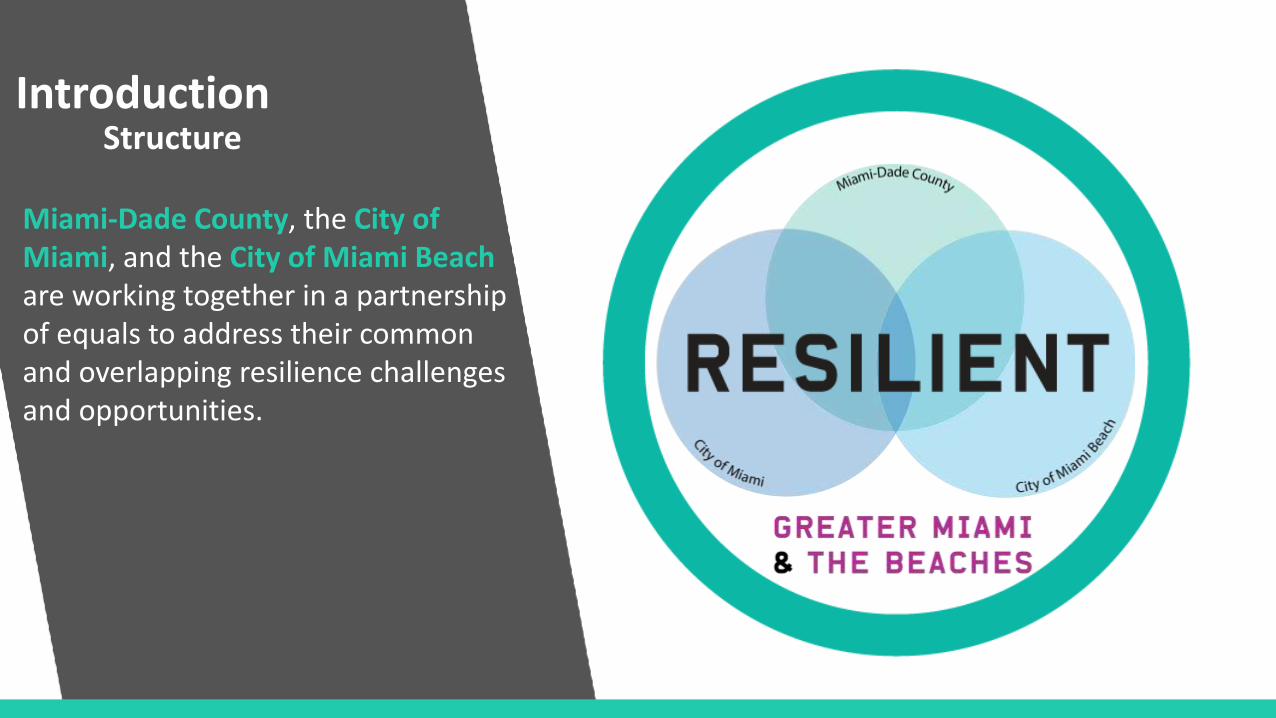
Introduction Structure
Miami-Dade County, the City of Miami, and the City of Miami Beach are working together in a partnership of equals to address their common and overlapping resilience challenges and opportunities.
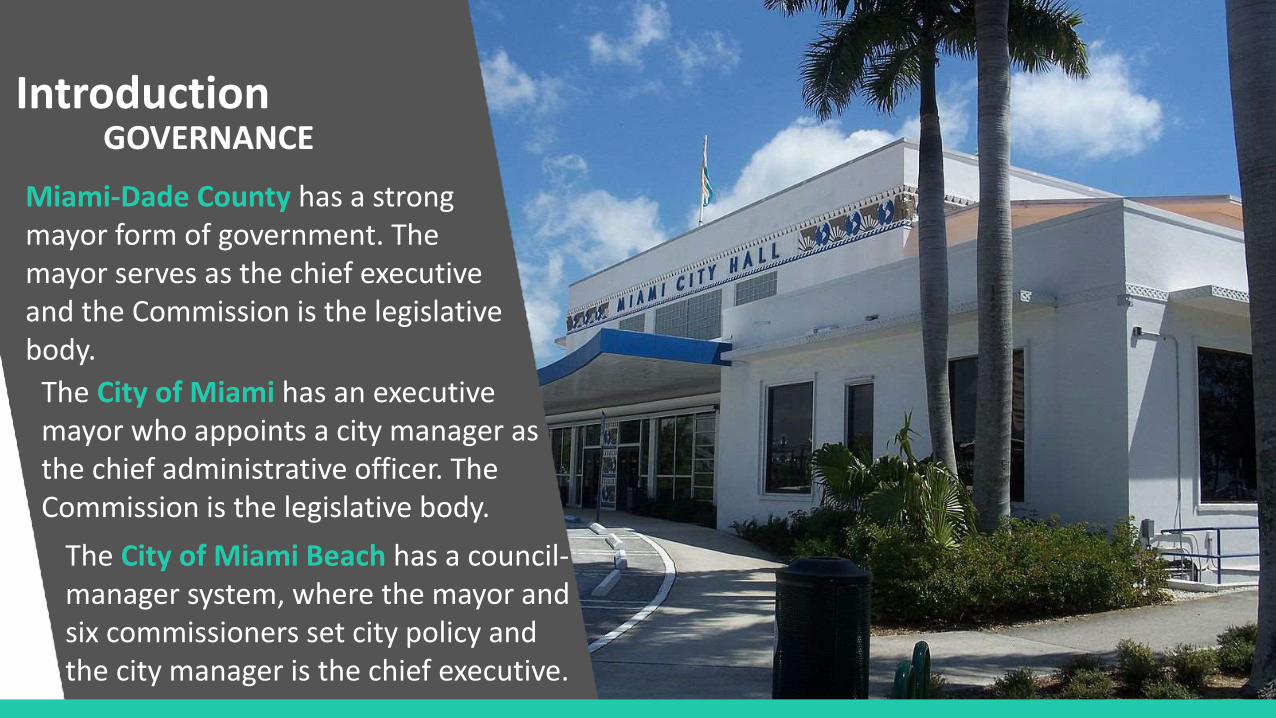
Introduction GOVERNANCE
Miami-Dade County has a strong mayor form of government. The mayor serves as the chief executive and the Commission is the legislative body.
The City of Miami has an executive mayor who appoints a city manager as the chief administrative officer. The Commission is the legislative body.
The City of Miami Beach has a council-manager system, where the mayor and six commissioners set city policy and the city manager is the chief executive.
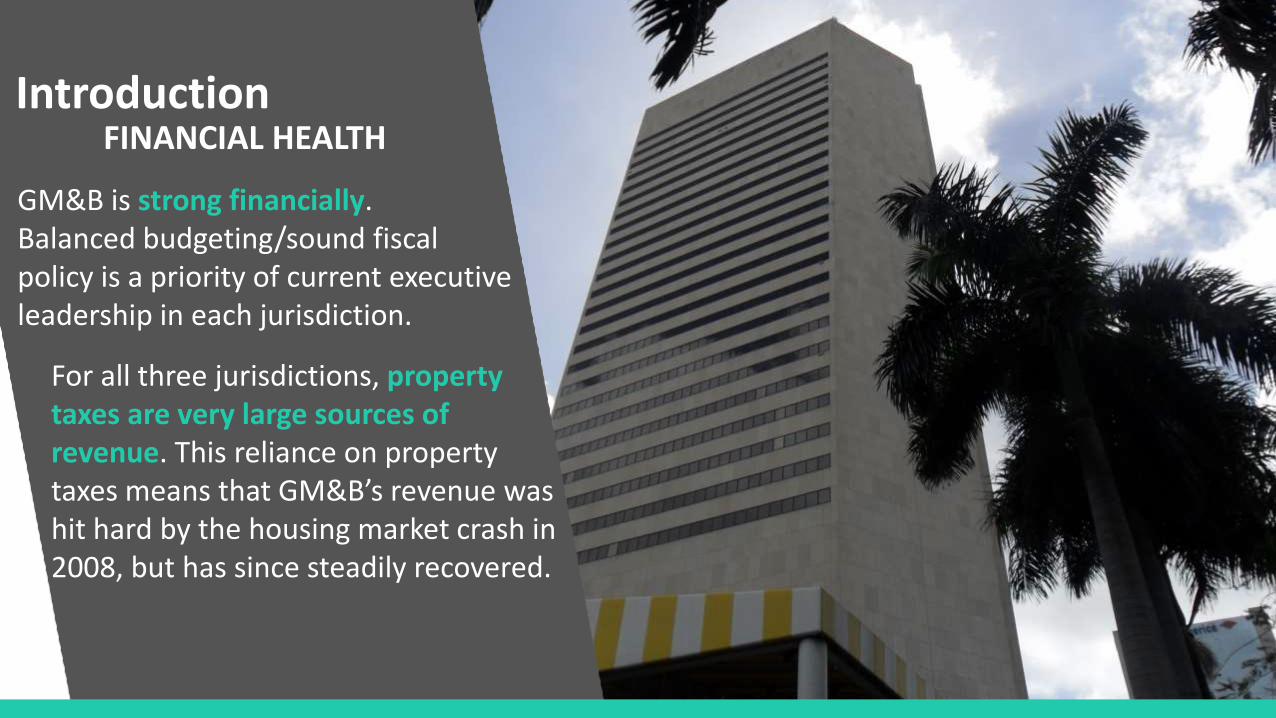
Introduction FINANCIAL HEALTH
GM&B is strong financially. Balanced budgeting/sound fiscal policy is a priority of current executive leadership in each jurisdiction.
For all three jurisdictions, property taxes are very large sources of revenue. This reliance on property taxes means that GM&B’s revenue was hit hard by the housing market crash in 2008, but has since steadily recovered.
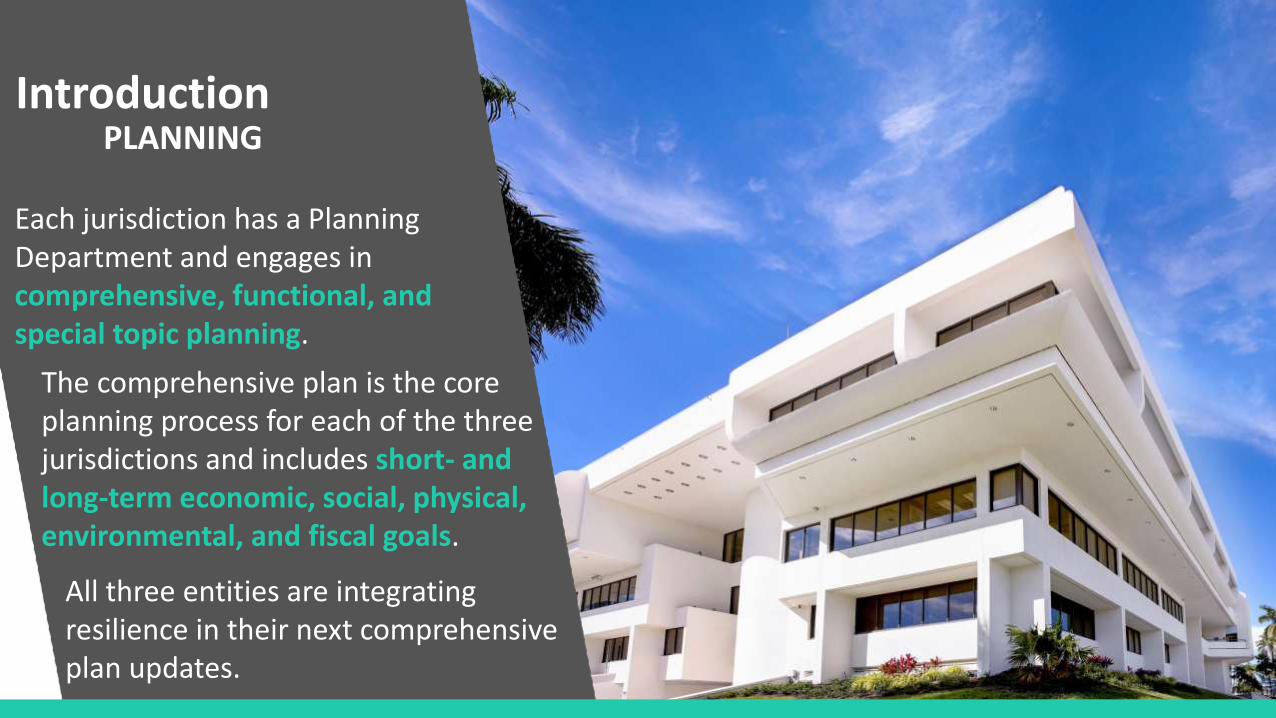
Introduction PLANNING
Each jurisdiction has a Planning Department and engages in comprehensive, functional, and special topic planning.
The comprehensive plan is the core planning process for each of the three jurisdictions and includes short- and long-term economic, social, physical, environmental, and fiscal goals.
All three entities are integrating resilience in their next comprehensive plan updates.

GM&B Today
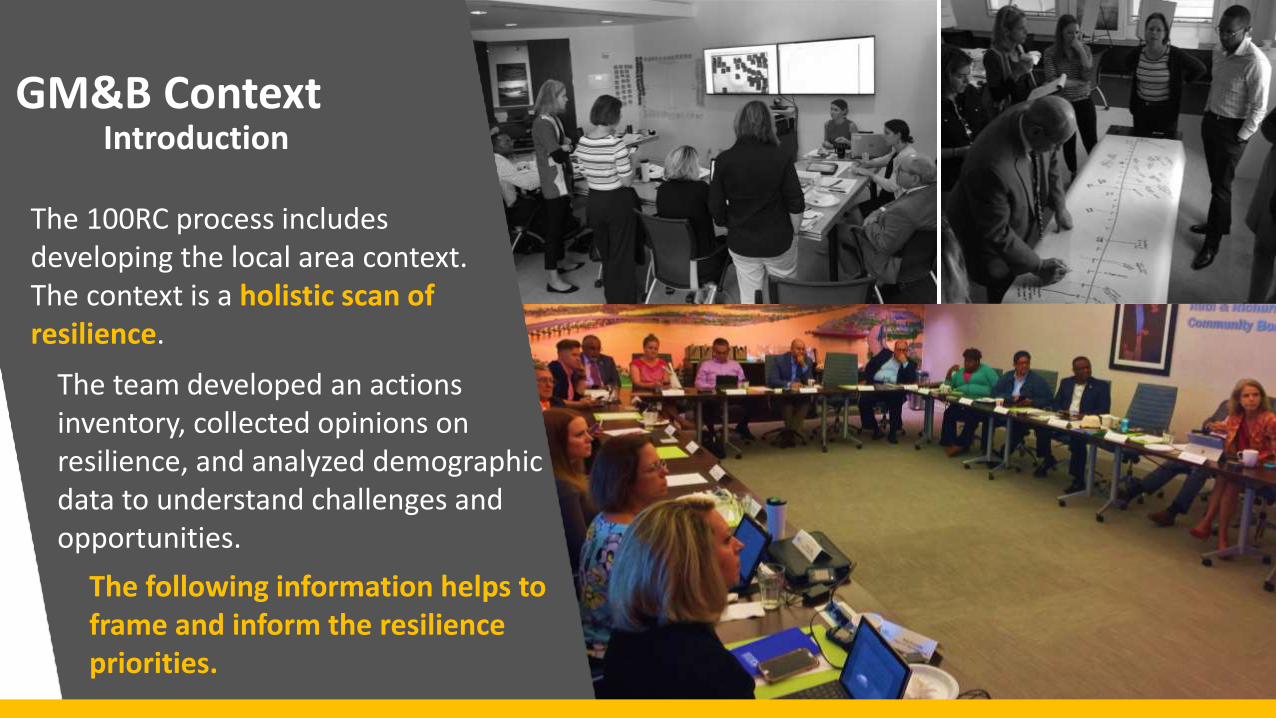
GM&B Context Introduction
The 100RC process includes developing the local area context. The context is a holistic scan of resilience.
The team developed an actions inventory, collected opinions on resilience, and analyzed demographic data to understand challenges and opportunities.
The following information helps to frame and inform the resilience priorities.
GM&B Context
VULNERABLE: AAAAAAAAAAAA
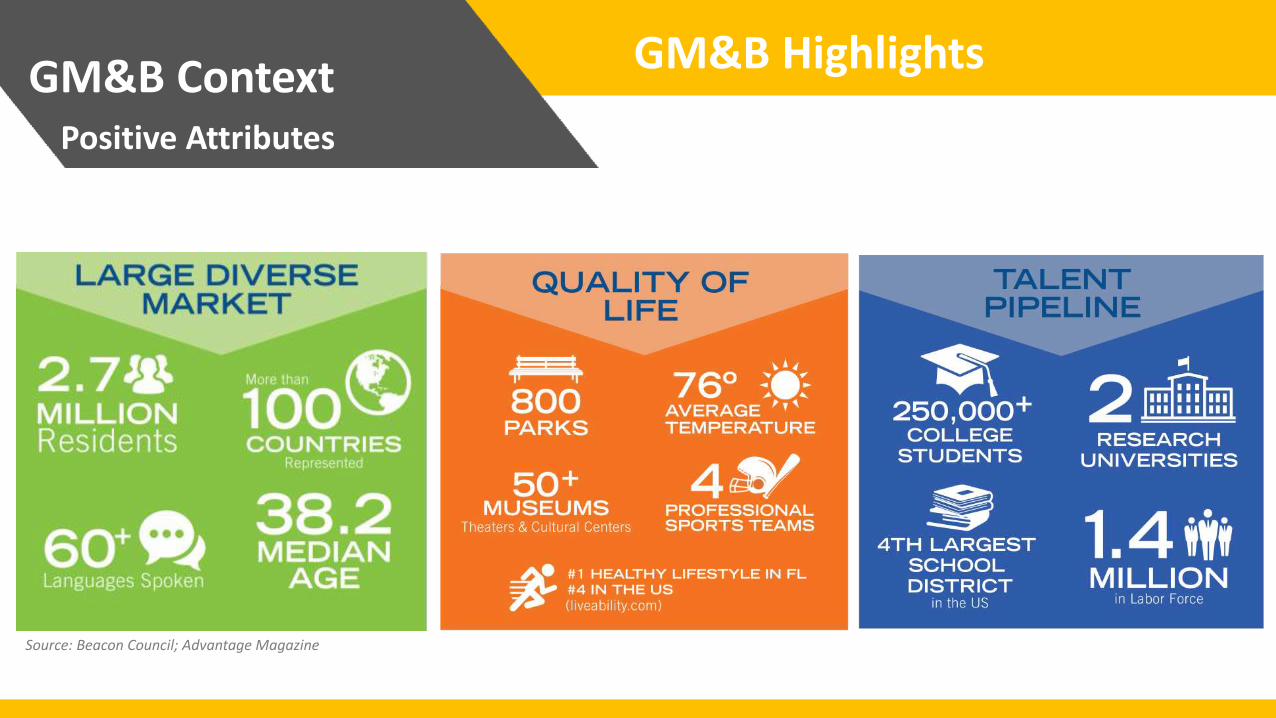
GM&B Highlights
Positive Attributes
Source: Beacon Council; Advantage Magazine
GM&B Context
VULNERABLE: AAAAAAAAAAAA
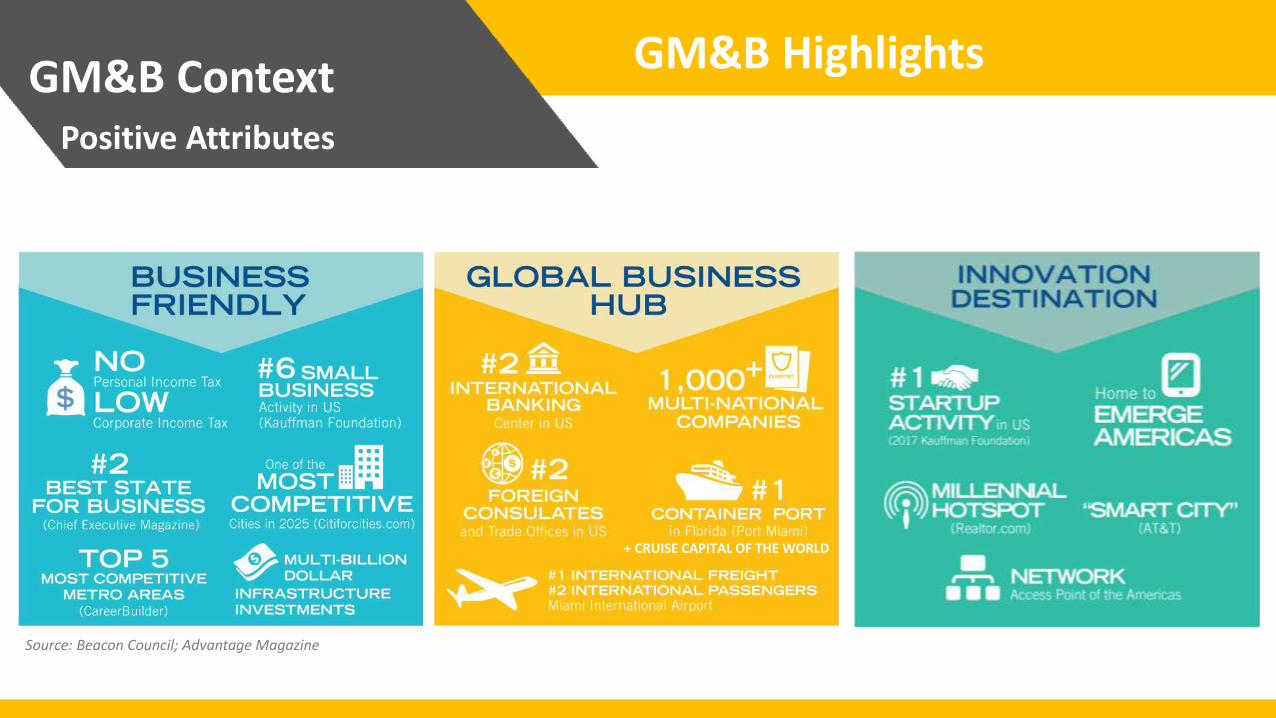
GM&B Highlights
Positive Attributes
+ CRUISE CAPITAL OF THE WORLD
Source: Beacon Council; Advantage Magazine
GM&B Context
Water attracted many us here- as we adapt to more water, how can we thrive socially, environmentally, and economically? How can we leverage and protect the Everglades and Biscayne Bay? This discovery area will focus investing in natural and man-made infrastructure to rise above and learn to live with water to create a more resilient community in the face of storms and sea level rise.
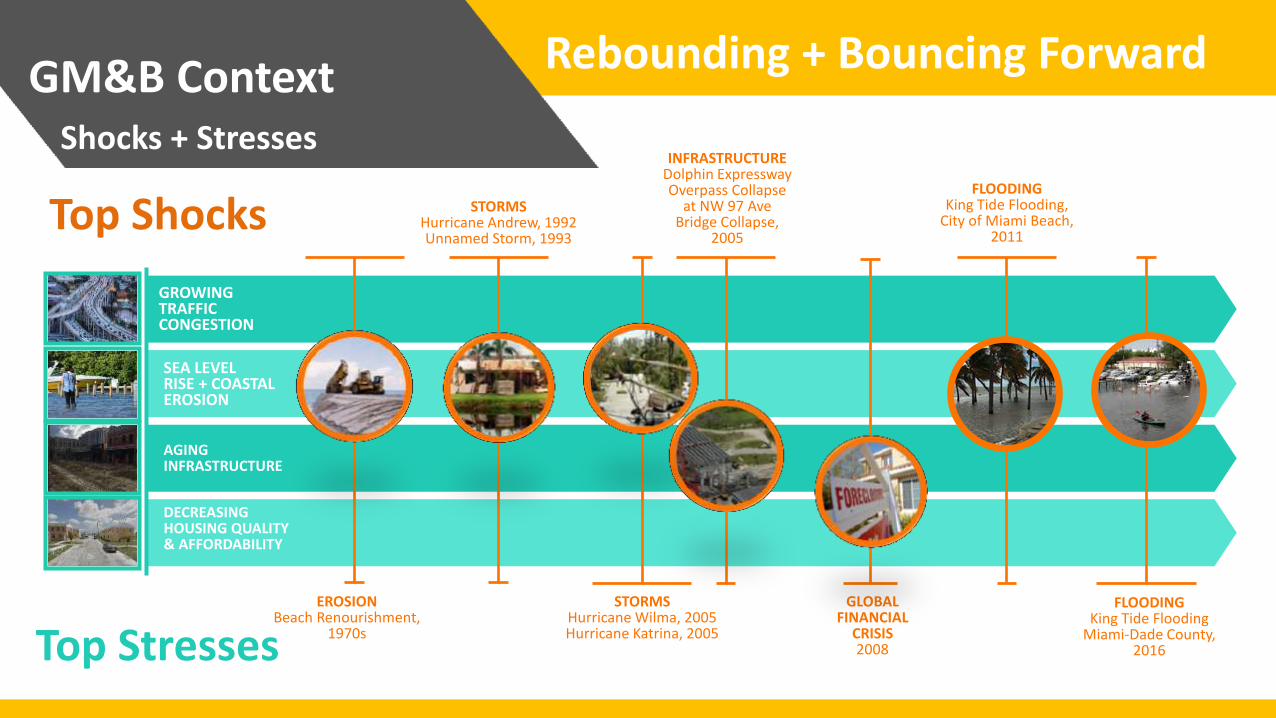
Rebounding + Bouncing Forward
Shocks + Stresses
Top Stresses
GROWING TRAFFIC CONGESTION
SEA LEVEL RISE + COASTAL EROSION
AGING INFRASTRUCTURE
STORMS Hurricane Andrew, 1992 Unnamed Storm, 1993
STORMS Hurricane Wilma, 2005 Hurricane Katrina, 2005
FLOODING King Tide Flooding,
City of Miami Beach, 2011
GLOBAL FINANCIAL
CRISIS 2008
INFRASTRUCTURE Dolphin Expressway Overpass Collapse
at NW 97 Ave Bridge Collapse,
2005
DECREASING HOUSING QUALITY & AFFORDABILITY
Top Shocks
FLOODING King Tide Flooding
Miami-Dade County, 2016
EROSION Beach Renourishment,
1970s
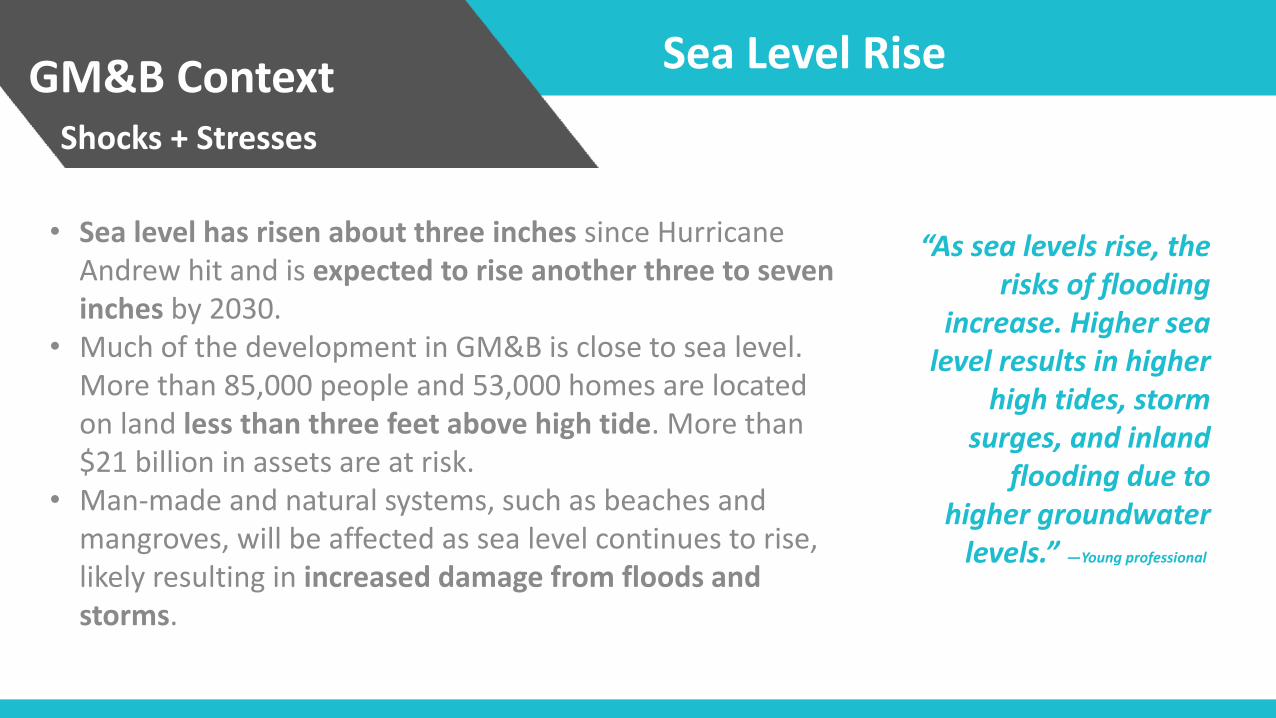
GM&B Context Shocks + Stresses
• Sea level has risen about three inches since Hurricane Andrew hit and is expected to rise another three to seven inches by 2030.
• Much of the development in GM&B is close to sea level. More than 85,000 people and 53,000 homes are located on land less than three feet above high tide. More than $21 billion in assets are at risk.
• Man-made and natural systems, such as beaches and mangroves, will be affected as sea level continues to rise, likely resulting in increased damage from floods and storms.
“As sea levels rise, the risks of flooding
increase. Higher sea level results in higher
high tides, storm surges, and inland
flooding due to higher groundwater
levels.” —Young professional
Sea Level Rise
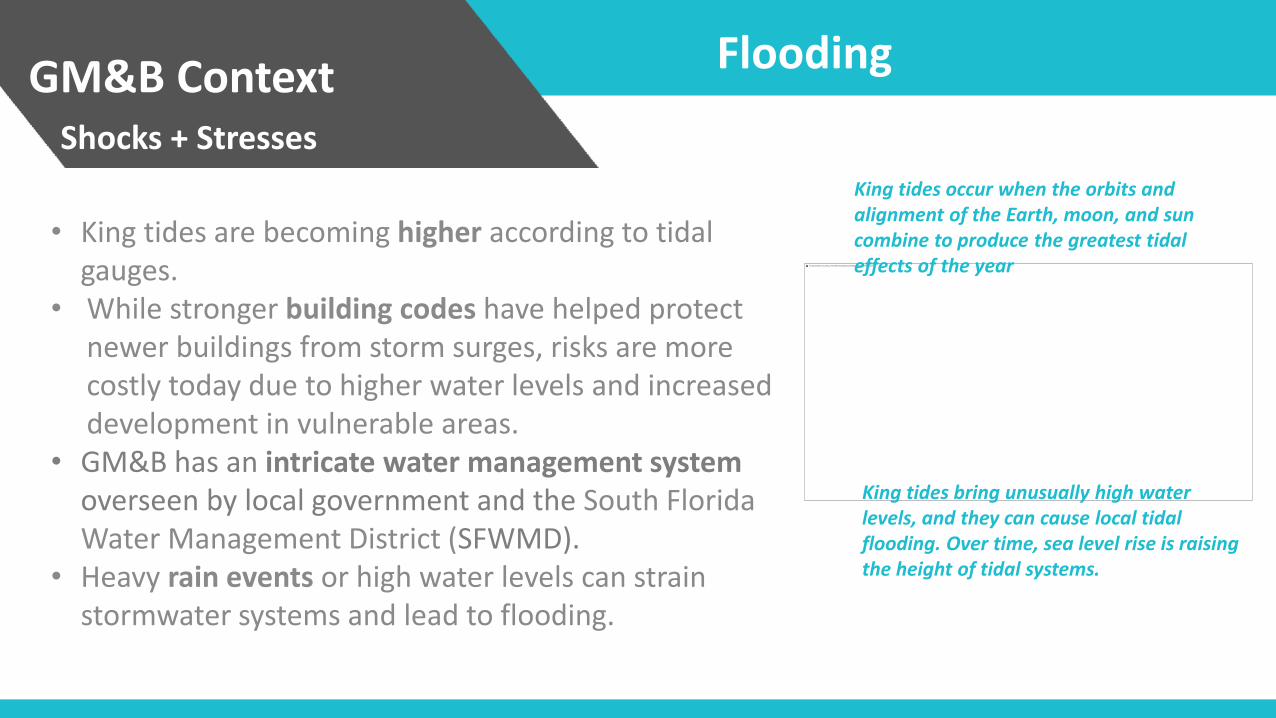
• King tides are becoming higher according to tidal gauges.
• While stronger building codes have helped protect newer buildings from storm surges, risks are more costly today due to higher water levels and increased development in vulnerable areas.
• GM&B has an intricate water management system overseen by local government and the South Florida Water Management District (SFWMD).
• Heavy rain events or high water levels can strain stormwater systems and lead to flooding.
GM&B Context Shocks + Stresses
Flooding
King tides occur when the orbits and alignment of the Earth, moon, and sun combine to produce the greatest tidal effects of the year
King tides bring unusually high water levels, and they can cause local tidal flooding. Over time, sea level rise is raising the height of tidal systems.
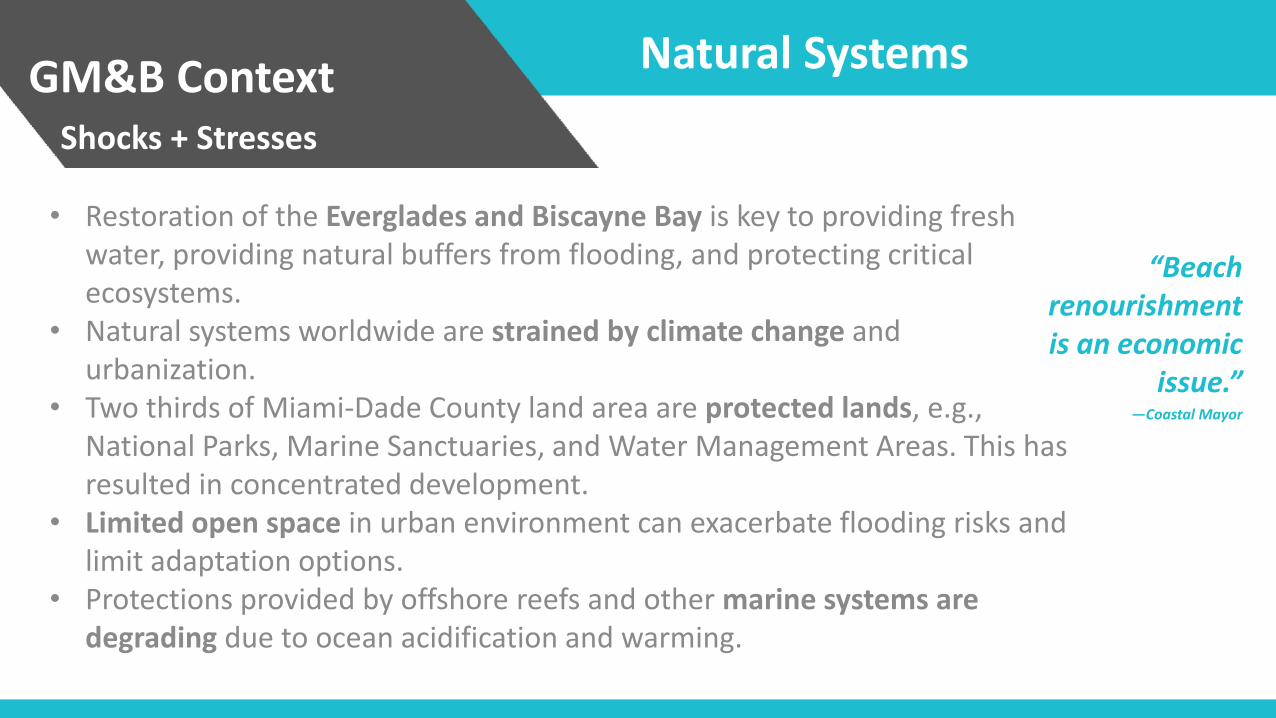
• Restoration of the Everglades and Biscayne Bay is key to providing fresh water, providing natural buffers from flooding, and protecting critical ecosystems.
• Natural systems worldwide are strained by climate change and urbanization.
• Two thirds of Miami-Dade County land area are protected lands, e.g., National Parks, Marine Sanctuaries, and Water Management Areas. This has resulted in concentrated development.
• Limited open space in urban environment can exacerbate flooding risks and limit adaptation options.
• Protections provided by offshore reefs and other marine systems are degrading due to ocean acidification and warming.
GM&B Context Shocks + Stresses
Natural Systems
“Beach renourishment is an economic
issue.” —Coastal Mayor
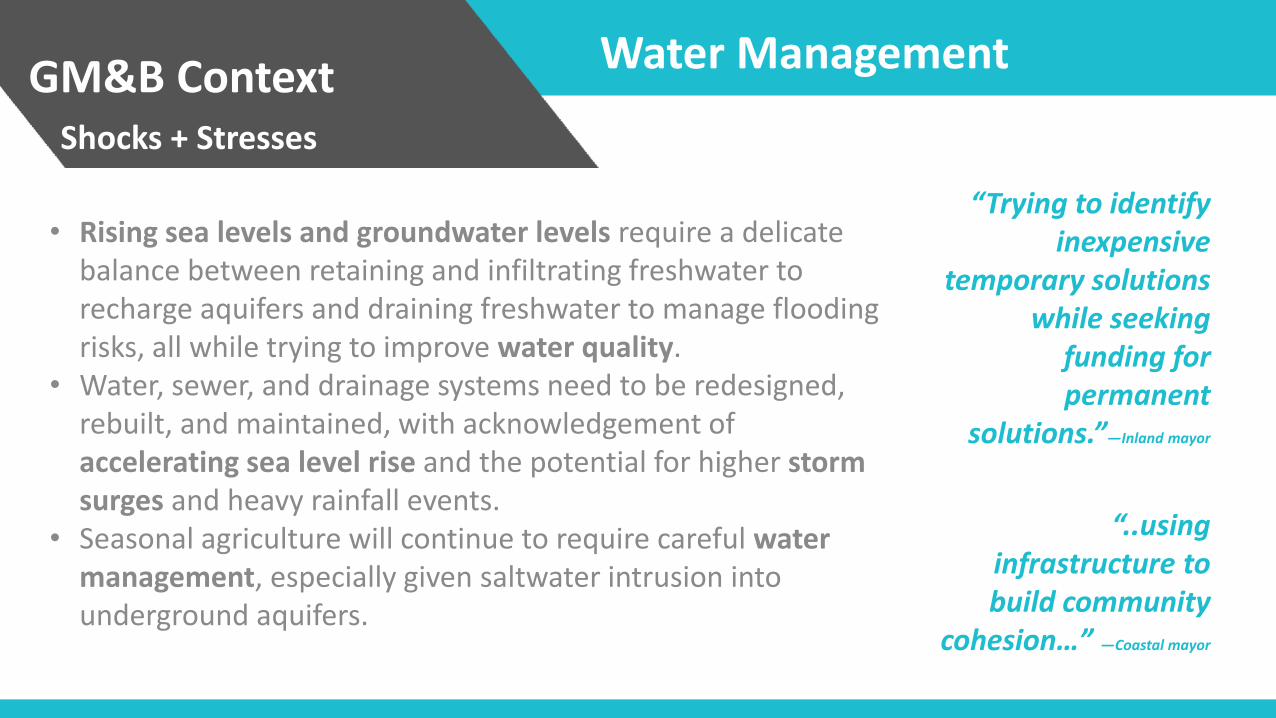
• Rising sea levels and groundwater levels require a delicate balance between retaining and infiltrating freshwater to recharge aquifers and draining freshwater to manage flooding risks, all while trying to improve water quality.
• Water, sewer, and drainage systems need to be redesigned, rebuilt, and maintained, with acknowledgement of accelerating sea level rise and the potential for higher storm surges and heavy rainfall events.
• Seasonal agriculture will continue to require careful water management, especially given saltwater intrusion into underground aquifers.
GM&B Context Shocks + Stresses
Water Management
“Trying to identify inexpensive
temporary solutions while seeking
funding for permanent
solutions.”—Inland mayor
“..using infrastructure to build community
cohesion…” —Coastal mayor
GM&B Context Shocks + Stresses
Housing
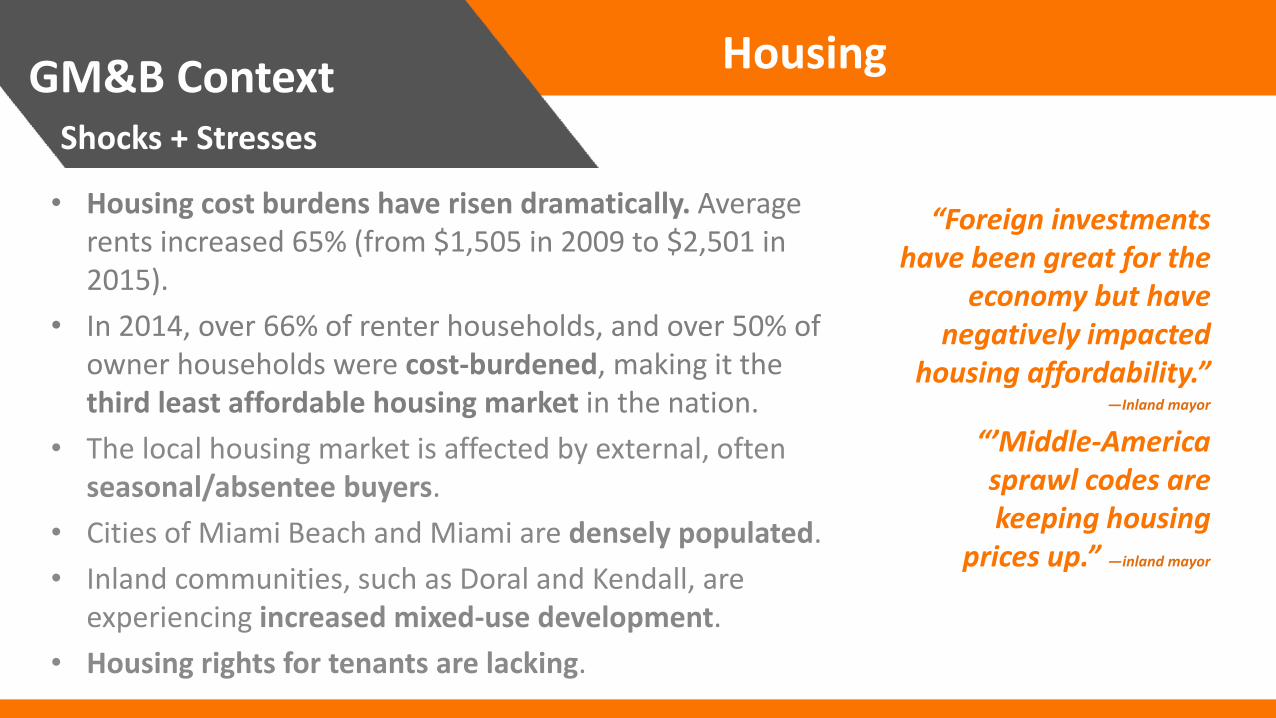
• Housing cost burdens have risen dramatically. Average rents increased 65% (from $1,505 in 2009 to $2,501 in 2015).
• In 2014, over 66% of renter households, and over 50% of owner households were cost-burdened, making it the third least affordable housing market in the nation.
• The local housing market is affected by external, often seasonal/absentee buyers.
• Cities of Miami Beach and Miami are densely populated.
• Inland communities, such as Doral and Kendall, are experiencing increased mixed-use development.
• Housing rights for tenants are lacking.
“Foreign investments have been great for the
economy but have negatively impacted
housing affordability.” —Inland mayor
“’Middle-America sprawl codes are keeping housing
prices up.” —inland mayor
GM&B Context Shocks + Stresses
Housing
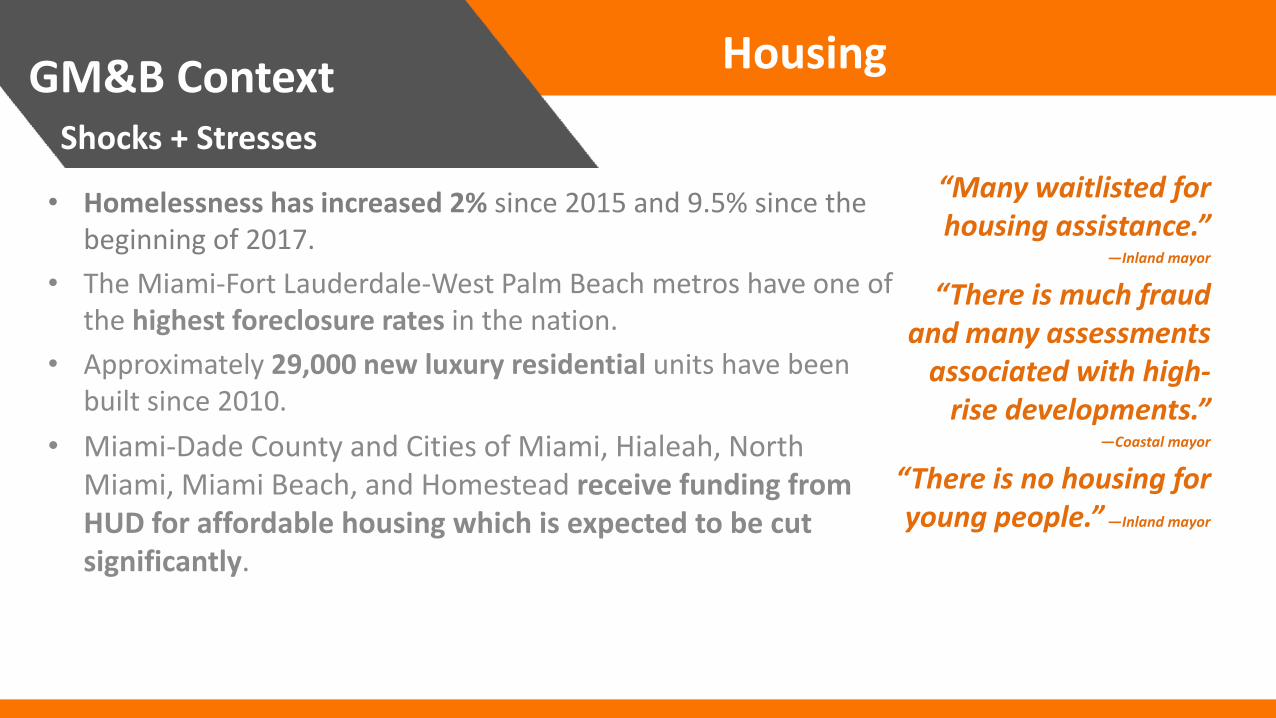
• Homelessness has increased 2% since 2015 and 9.5% since the beginning of 2017.
• The Miami-Fort Lauderdale-West Palm Beach metros have one of the highest foreclosure rates in the nation.
• Approximately 29,000 new luxury residential units have been built since 2010.
• Miami-Dade County and Cities of Miami, Hialeah, North Miami, Miami Beach, and Homestead receive funding from HUD for affordable housing which is expected to be cut significantly.
“Many waitlisted for housing assistance.”
—Inland mayor
“There is much fraud and many assessments
associated with high-rise developments.”
—Coastal mayor
“There is no housing for young people.” —Inland mayor
GM&B Context Shocks + Stresses
Mobility
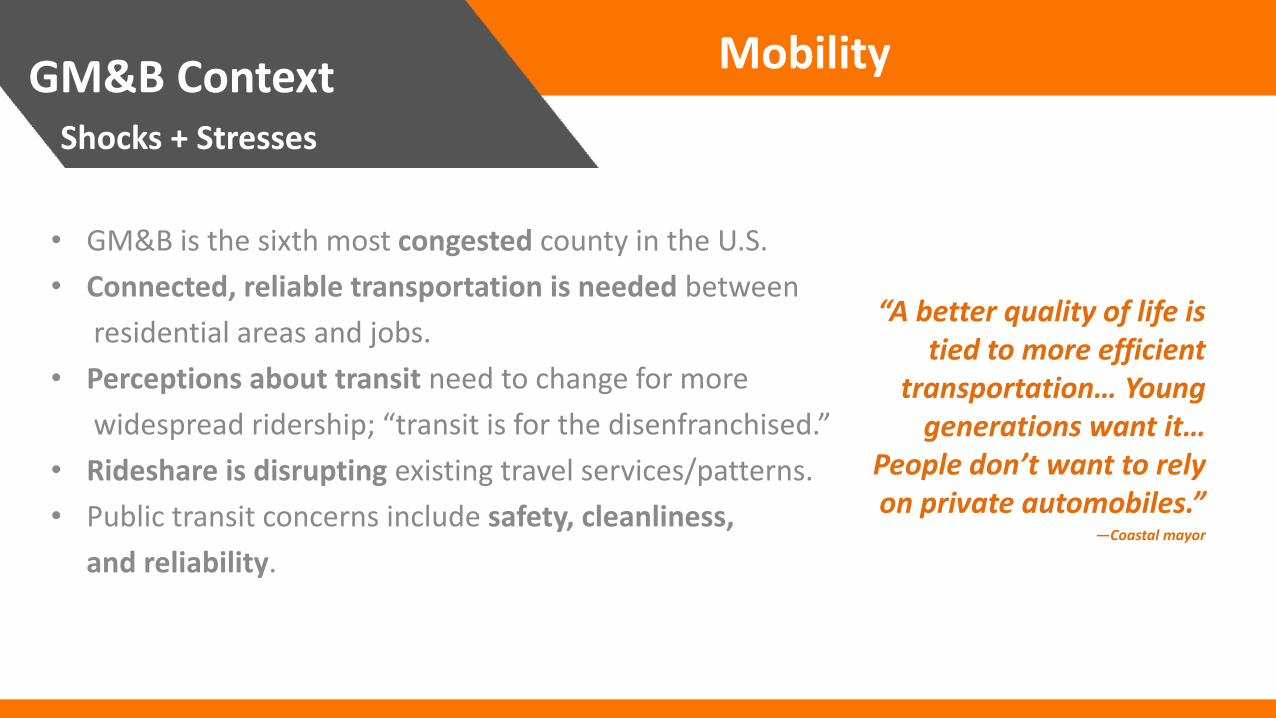
• GM&B is the sixth most congested county in the U.S.
• Connected, reliable transportation is needed between
residential areas and jobs.
• Perceptions about transit need to change for more
widespread ridership; “transit is for the disenfranchised.”
• Rideshare is disrupting existing travel services/patterns.
• Public transit concerns include safety, cleanliness,
and reliability.
“A better quality of life is tied to more efficient
transportation… Young generations want it…
People don’t want to rely on private automobiles.”
—Coastal mayor
GM&B Context Shocks + Stresses
Mobility
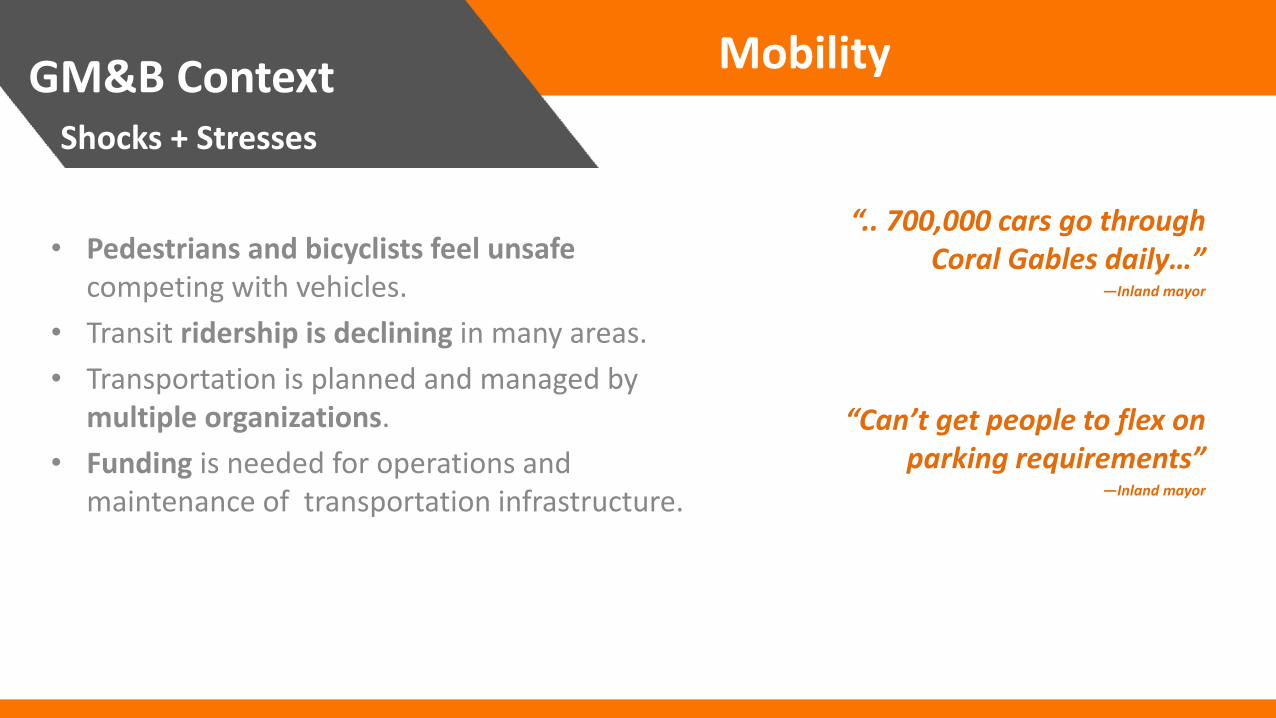
• Pedestrians and bicyclists feel unsafe competing with vehicles.
• Transit ridership is declining in many areas.
• Transportation is planned and managed by multiple organizations.
• Funding is needed for operations and maintenance of transportation infrastructure.
“.. 700,000 cars go through Coral Gables daily…”
—Inland mayor
“Can’t get people to flex on parking requirements”
—Inland mayor
GM&B Context Shocks + Stresses
Mobility
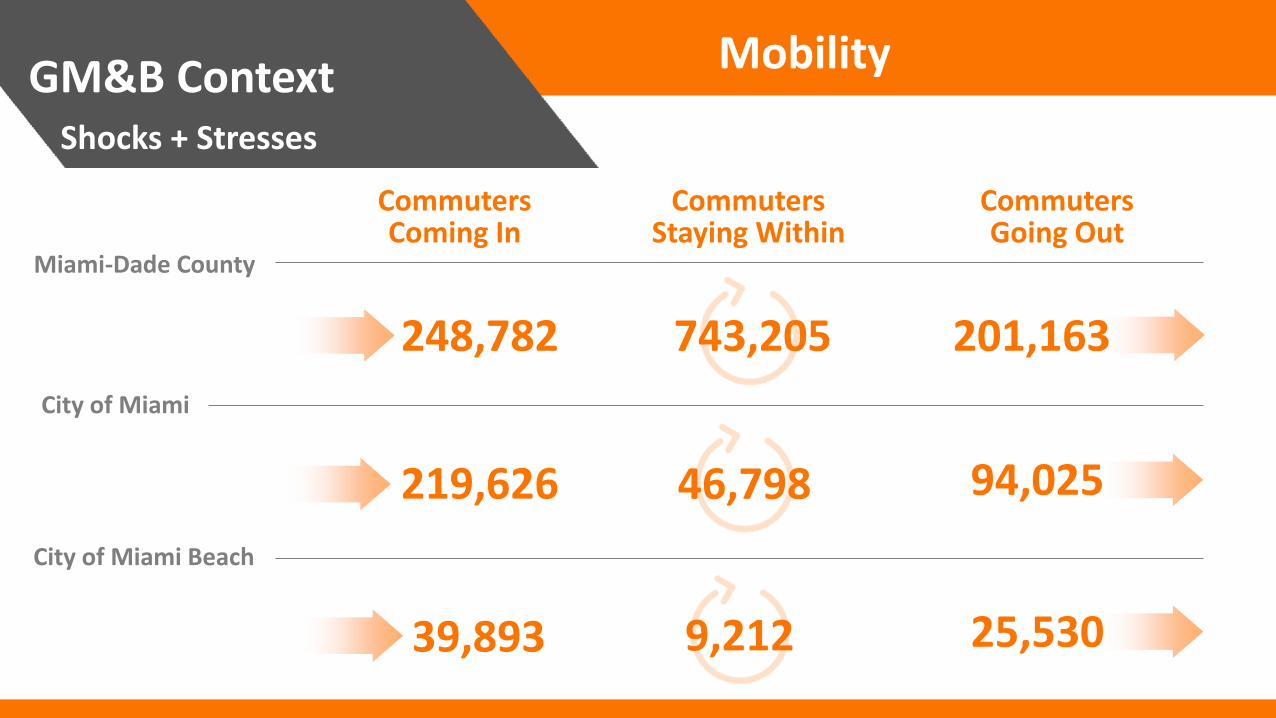
248,782
46,798
Commuters Coming In
Commuters Staying Within
Commuters Going Out
219,626
39,893
743,205
Miami-Dade County
City of Miami
City of Miami Beach
201,163
94,025
25,530 9,212
GM&B Context Shocks + Stresses
Economy
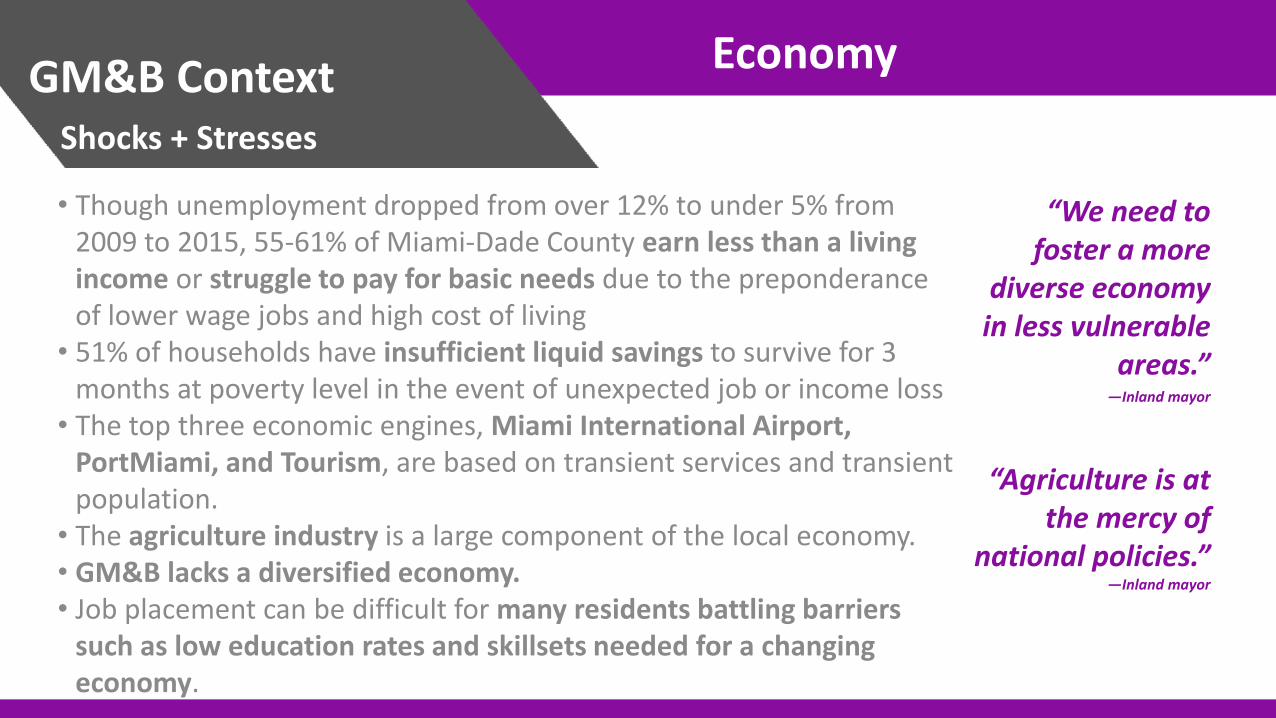
• Though unemployment dropped from over 12% to under 5% from 2009 to 2015, 55-61% of Miami-Dade County earn less than a living income or struggle to pay for basic needs due to the preponderance of lower wage jobs and high cost of living
• 51% of households have insufficient liquid savings to survive for 3 months at poverty level in the event of unexpected job or income loss
• The top three economic engines, Miami International Airport, PortMiami, and Tourism, are based on transient services and transient population.
• The agriculture industry is a large component of the local economy. • GM&B lacks a diversified economy. • Job placement can be difficult for many residents battling barriers
such as low education rates and skillsets needed for a changing economy.
“We need to foster a more
diverse economy in less vulnerable
areas.” —Inland mayor
“Agriculture is at the mercy of
national policies.” —Inland mayor
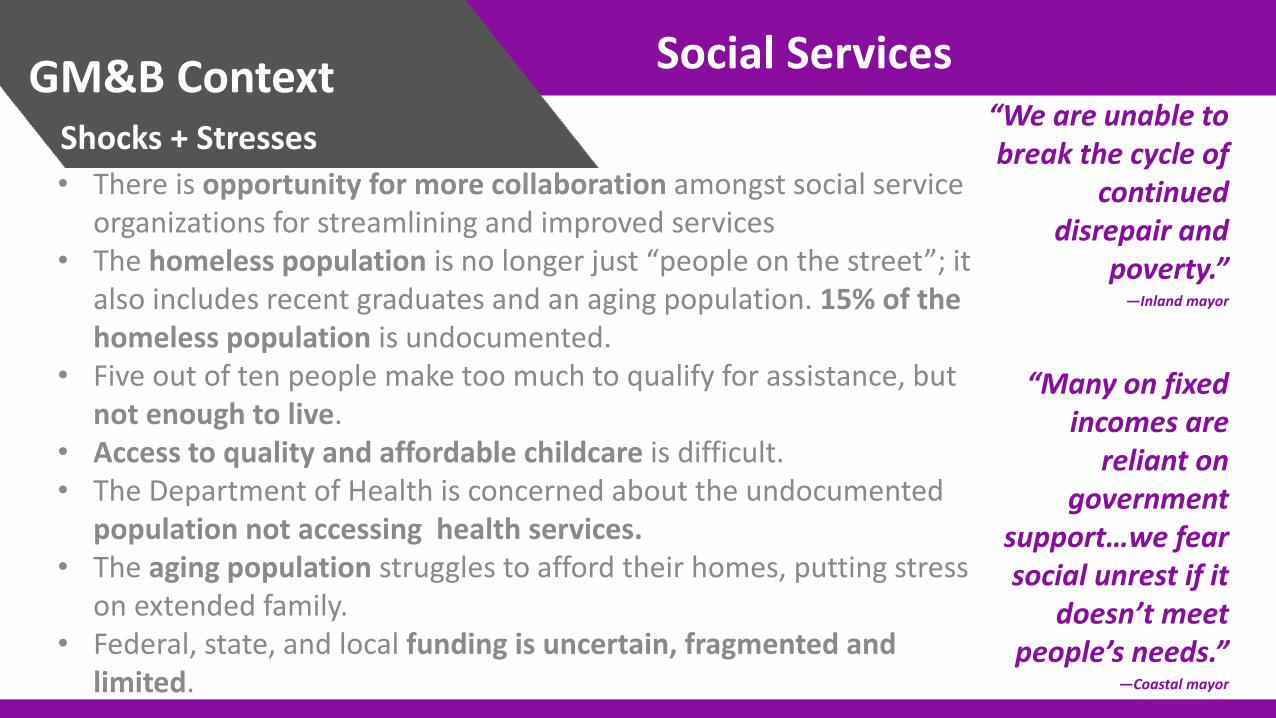
• There is opportunity for more collaboration amongst social service organizations for streamlining and improved services
• The homeless population is no longer just “people on the street”; it also includes recent graduates and an aging population. 15% of the homeless population is undocumented.
• Five out of ten people make too much to qualify for assistance, but not enough to live.
• Access to quality and affordable childcare is difficult. • The Department of Health is concerned about the undocumented
population not accessing health services. • The aging population struggles to afford their homes, putting stress
on extended family. • Federal, state, and local funding is uncertain, fragmented and
limited.
GM&B Context Shocks + Stresses
Social Services “We are unable to break the cycle of
continued disrepair and
poverty.” —Inland mayor
“Many on fixed incomes are
reliant on government
support…we fear social unrest if it
doesn’t meet people’s needs.”
—Coastal mayor
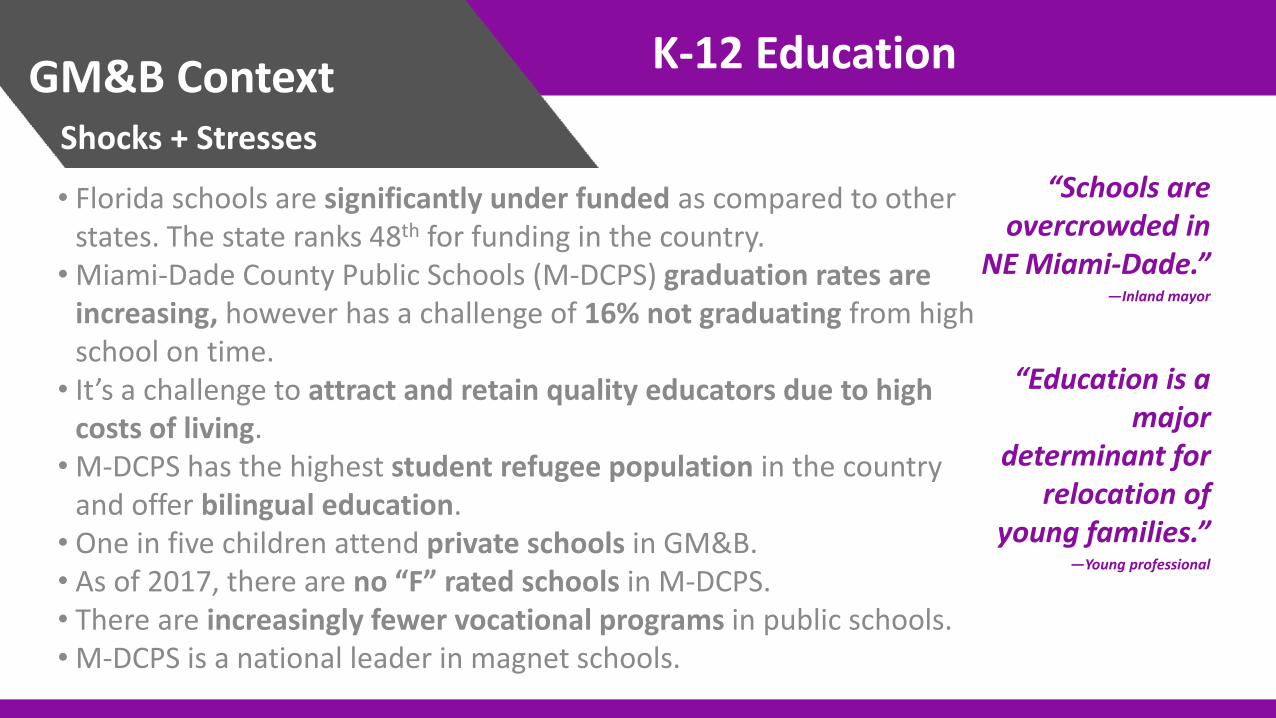
• Florida schools are significantly under funded as compared to other states. The state ranks 48th for funding in the country.
• Miami-Dade County Public Schools (M-DCPS) graduation rates are increasing, however has a challenge of 16% not graduating from high school on time.
• It’s a challenge to attract and retain quality educators due to high costs of living.
• M-DCPS has the highest student refugee population in the country and offer bilingual education.
• One in five children attend private schools in GM&B. • As of 2017, there are no “F” rated schools in M-DCPS. • There are increasingly fewer vocational programs in public schools. • M-DCPS is a national leader in magnet schools.
GM&B Context Shocks + Stresses
K-12 Education
“Schools are overcrowded in
NE Miami-Dade.” —Inland mayor
“Education is a major
determinant for relocation of
young families.” —Young professional
GM&B Context Shocks + Stresses
Universities
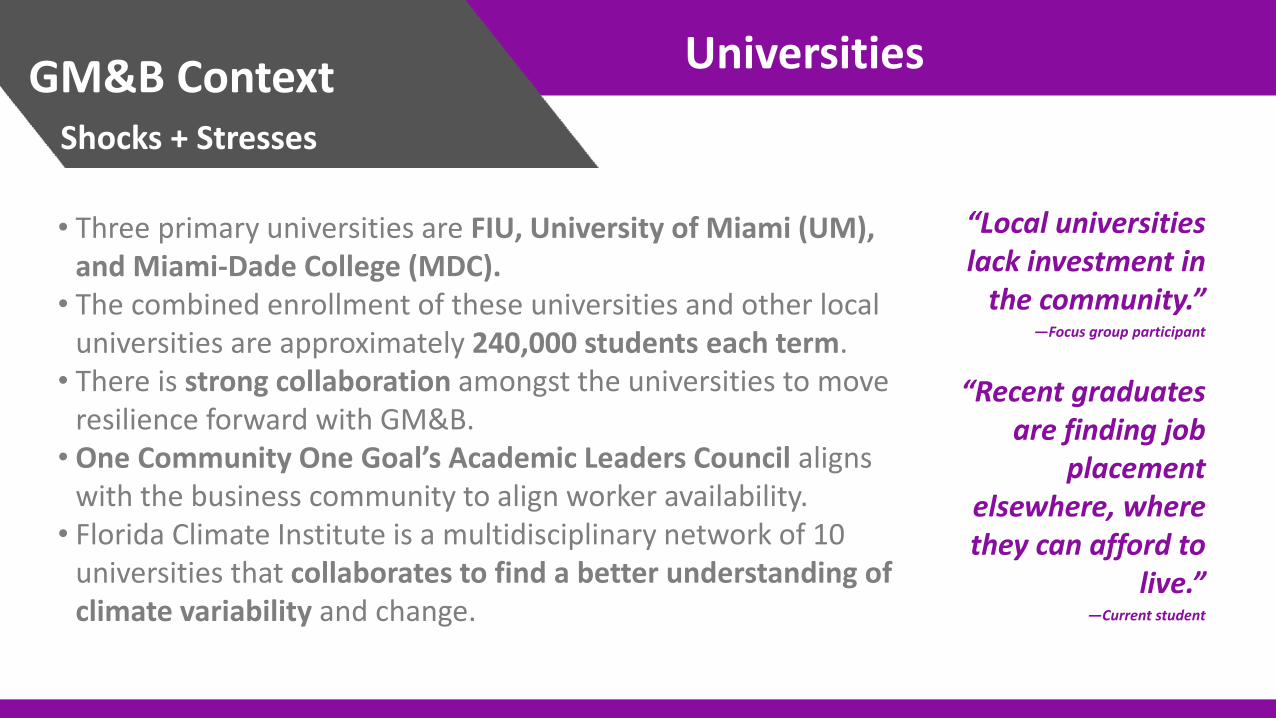
• Three primary universities are FIU, University of Miami (UM), and Miami-Dade College (MDC).
• The combined enrollment of these universities and other local universities are approximately 240,000 students each term.
• There is strong collaboration amongst the universities to move resilience forward with GM&B.
• One Community One Goal’s Academic Leaders Council aligns with the business community to align worker availability.
• Florida Climate Institute is a multidisciplinary network of 10 universities that collaborates to find a better understanding of climate variability and change.
“Local universities lack investment in
the community.” —Focus group participant
“Recent graduates are finding job
placement elsewhere, where they can afford to
live.” —Current student
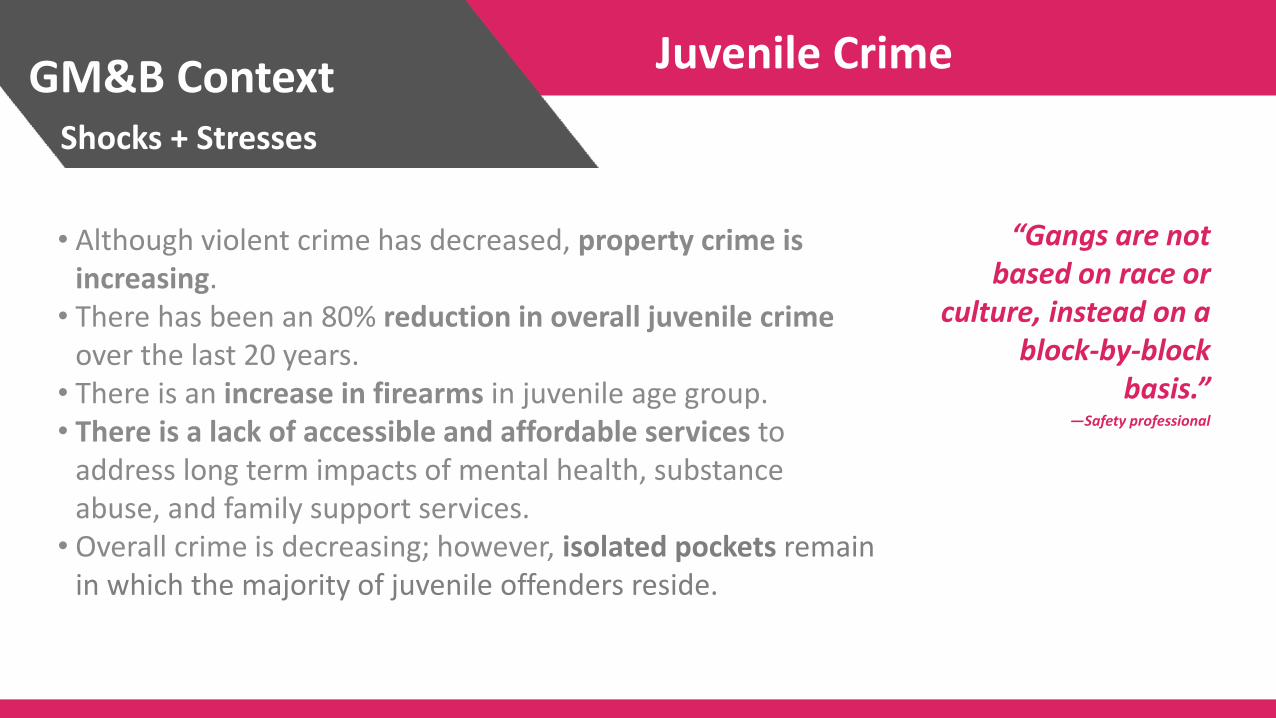
• Although violent crime has decreased, property crime is increasing.
• There has been an 80% reduction in overall juvenile crime over the last 20 years.
• There is an increase in firearms in juvenile age group. • There is a lack of accessible and affordable services to
address long term impacts of mental health, substance abuse, and family support services.
• Overall crime is decreasing; however, isolated pockets remain in which the majority of juvenile offenders reside.
GM&B Context Shocks + Stresses
Juvenile Crime
“Gangs are not based on race or
culture, instead on a block-by-block
basis.” —Safety professional
GM&B Context Shocks + Stresses
Health
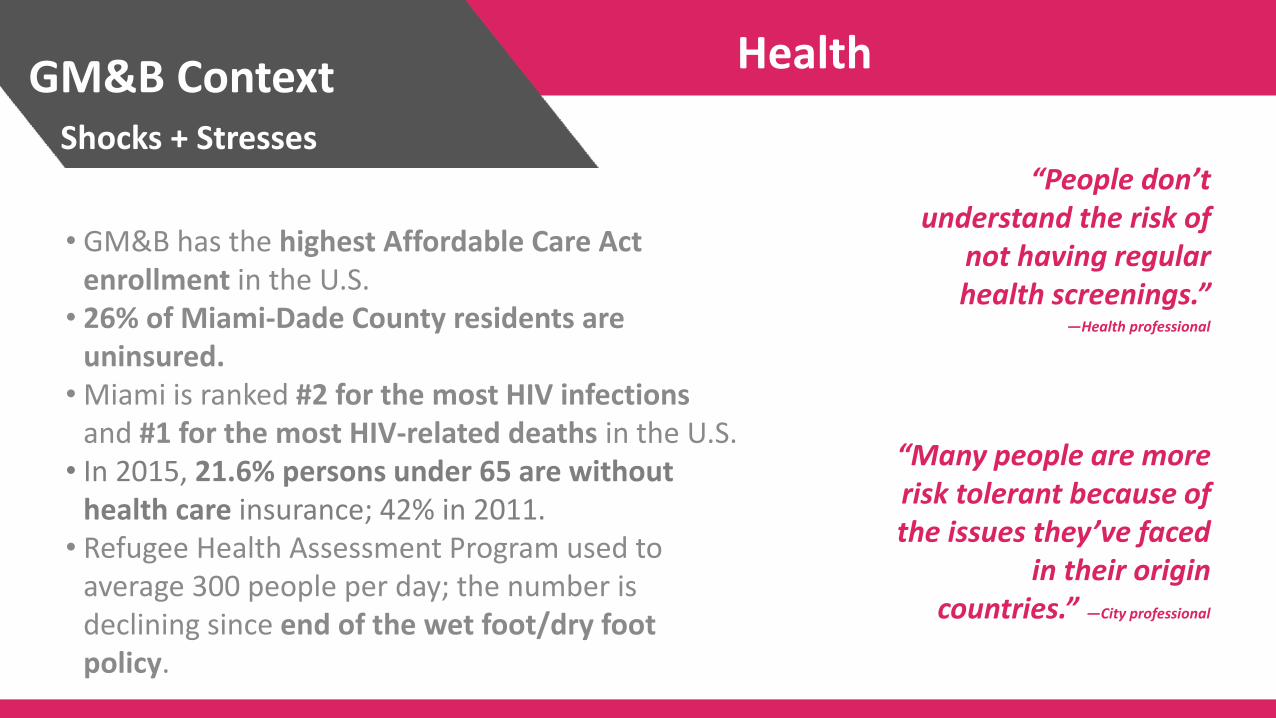
• GM&B has the highest Affordable Care Act enrollment in the U.S.
• 26% of Miami-Dade County residents are uninsured.
• Miami is ranked #2 for the most HIV infections and #1 for the most HIV-related deaths in the U.S.
• In 2015, 21.6% persons under 65 are without health care insurance; 42% in 2011.
• Refugee Health Assessment Program used to average 300 people per day; the number is declining since end of the wet foot/dry foot policy.
“People don’t understand the risk of
not having regular health screenings.”
—Health professional
“Many people are more risk tolerant because of the issues they’ve faced
in their origin countries.” —City professional
GM&B Context Shocks + Stresses
Health
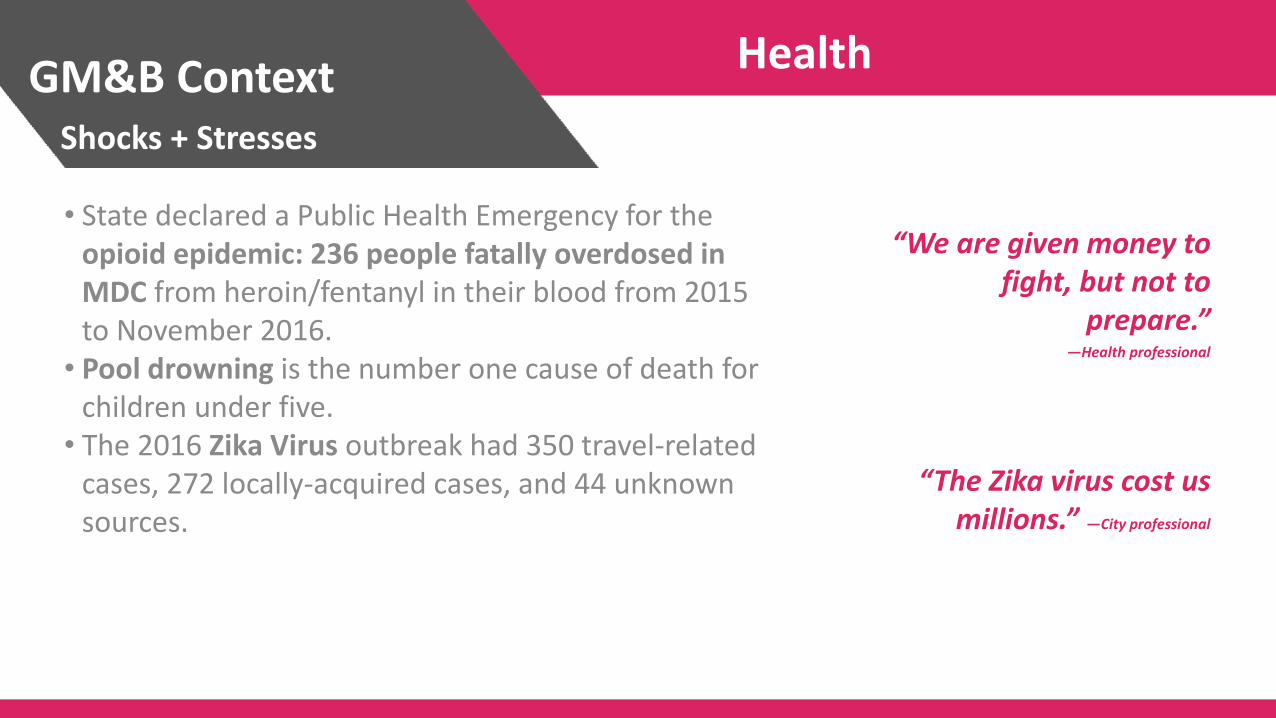
• State declared a Public Health Emergency for the opioid epidemic: 236 people fatally overdosed in MDC from heroin/fentanyl in their blood from 2015 to November 2016.
• Pool drowning is the number one cause of death for children under five.
• The 2016 Zika Virus outbreak had 350 travel-related cases, 272 locally-acquired cases, and 44 unknown sources.
“We are given money to fight, but not to
prepare.” —Health professional
“The Zika virus cost us millions.” —City professional
GM&B Context Shocks + Stresses
Storms + Recovery
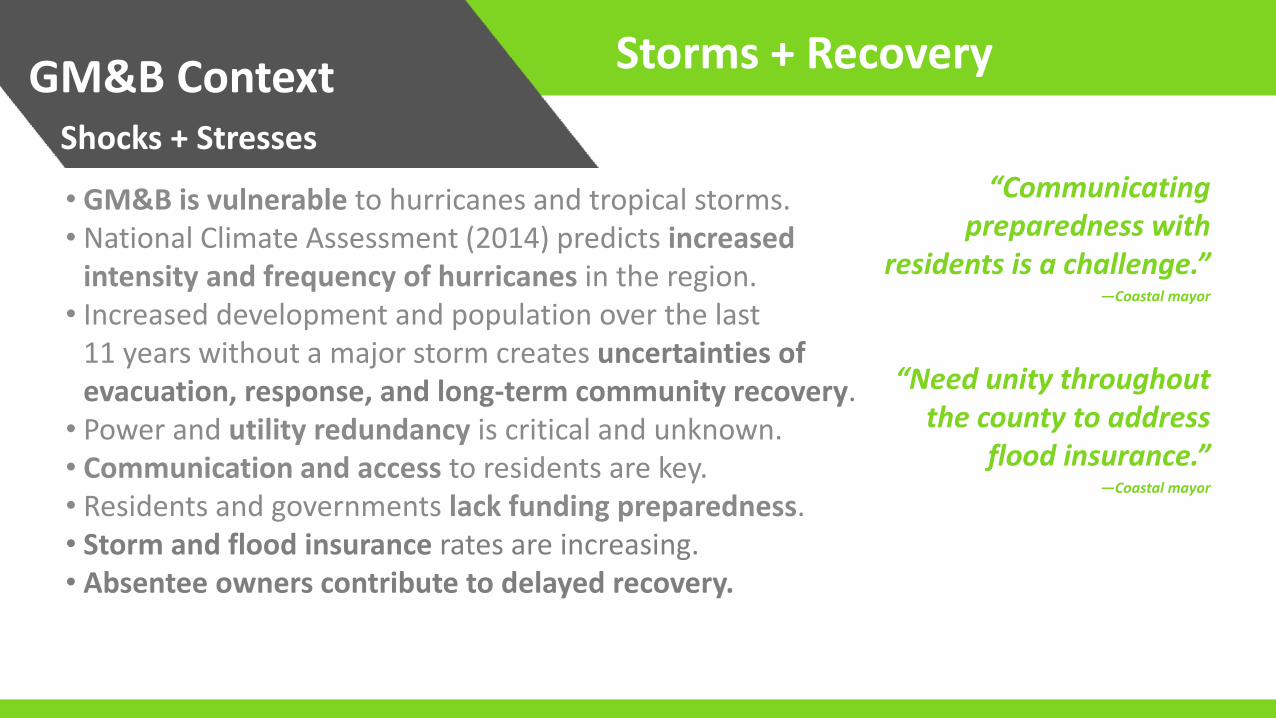
• GM&B is vulnerable to hurricanes and tropical storms. • National Climate Assessment (2014) predicts increased
intensity and frequency of hurricanes in the region. • Increased development and population over the last
11 years without a major storm creates uncertainties of evacuation, response, and long-term community recovery.
• Power and utility redundancy is critical and unknown. • Communication and access to residents are key. • Residents and governments lack funding preparedness. • Storm and flood insurance rates are increasing. • Absentee owners contribute to delayed recovery.
“Communicating preparedness with
residents is a challenge.” —Coastal mayor
“Need unity throughout the county to address
flood insurance.” —Coastal mayor
GM&B Context Shocks + Stresses
Collaboration
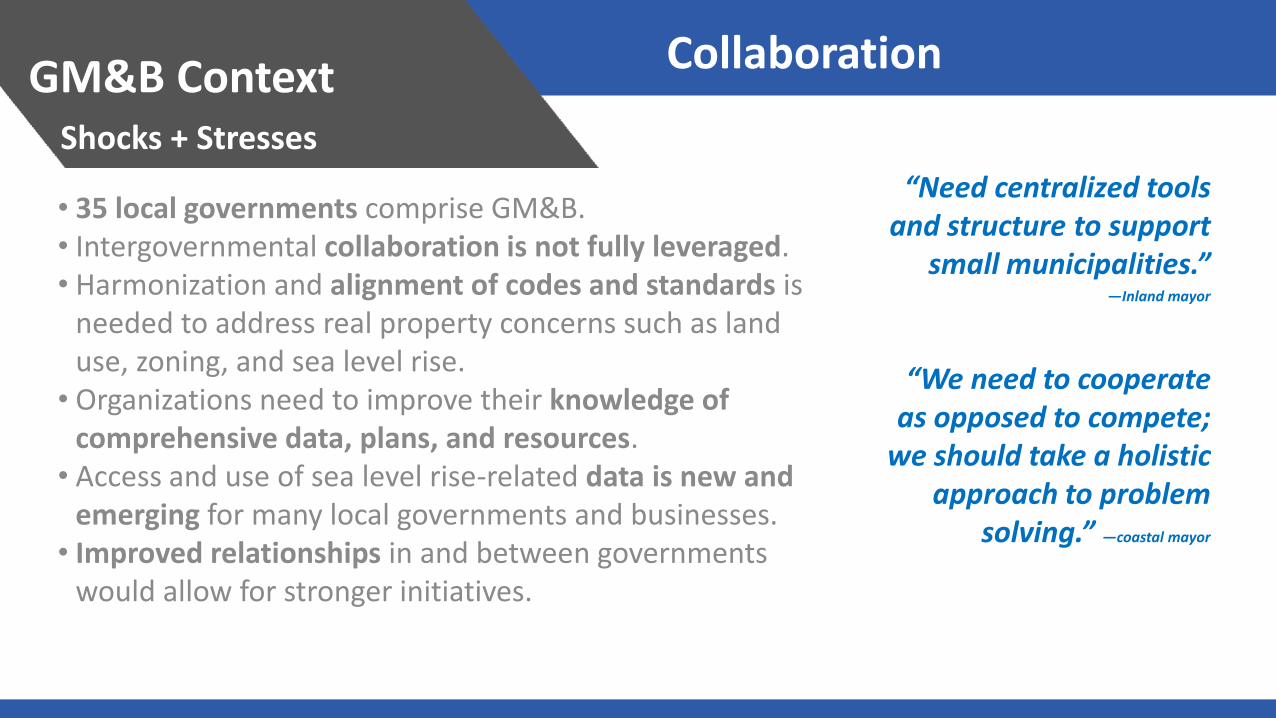
• 35 local governments comprise GM&B. • Intergovernmental collaboration is not fully leveraged. • Harmonization and alignment of codes and standards is
needed to address real property concerns such as land use, zoning, and sea level rise.
• Organizations need to improve their knowledge of comprehensive data, plans, and resources.
• Access and use of sea level rise-related data is new and emerging for many local governments and businesses.
• Improved relationships in and between governments would allow for stronger initiatives.
“Need centralized tools and structure to support
small municipalities.” —Inland mayor
“We need to cooperate as opposed to compete;
we should take a holistic approach to problem
solving.” —coastal mayor
Plans, Programs + Strategies
This City Resilience Framework is a 100RC Tool to categorize plans, programs, projects, studies, and initiatives. A total of 280 were identified throughout the engagement process. Of those, 100 were prioritized for consideration in future Resilient GM&B efforts, many of which are identified on the following pages.
Actions
GM&B Context Actions Inventory
Sea Level Rise + Climate Change GM&B Context Key Actions
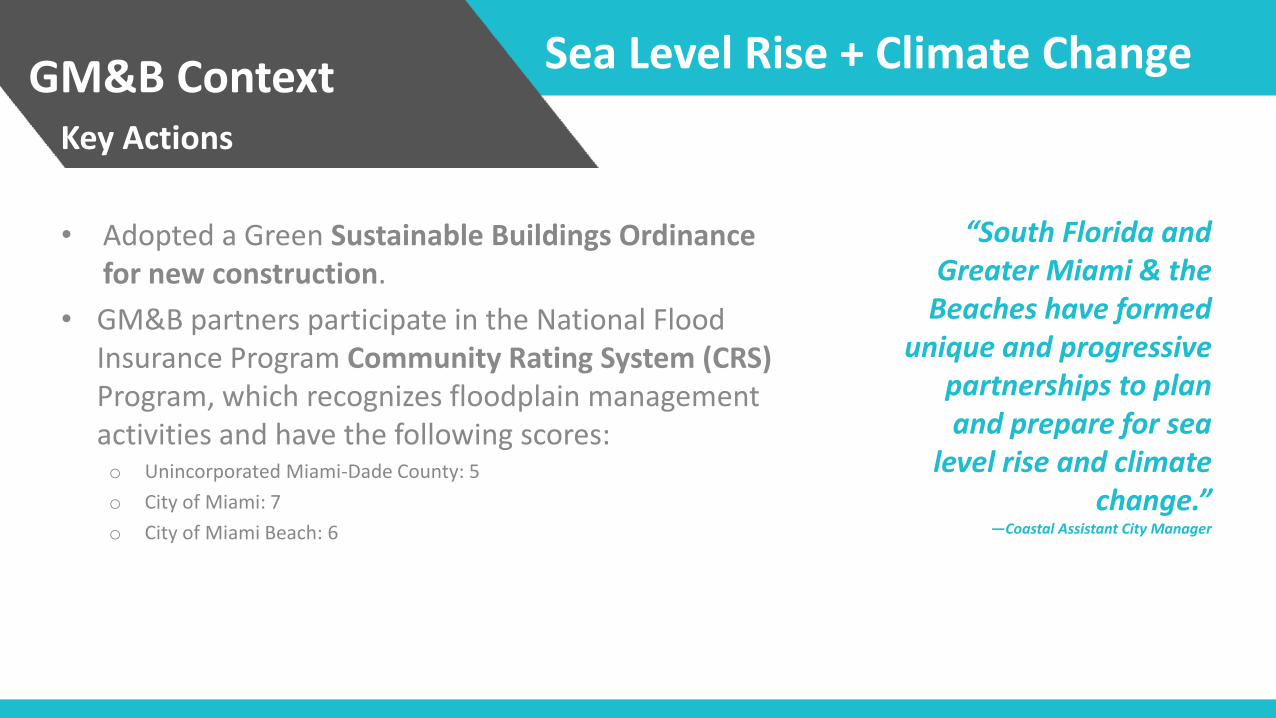
• Adopted a Green Sustainable Buildings Ordinance for new construction.
• GM&B partners participate in the National Flood Insurance Program Community Rating System (CRS) Program, which recognizes floodplain management activities and have the following scores: o Unincorporated Miami-Dade County: 5
o City of Miami: 7
o City of Miami Beach: 6
“South Florida and Greater Miami & the
Beaches have formed unique and progressive
partnerships to plan and prepare for sea
level rise and climate change.”
—Coastal Assistant City Manager
Sea Level Rise + Climate Change GM&B Context Key Actions
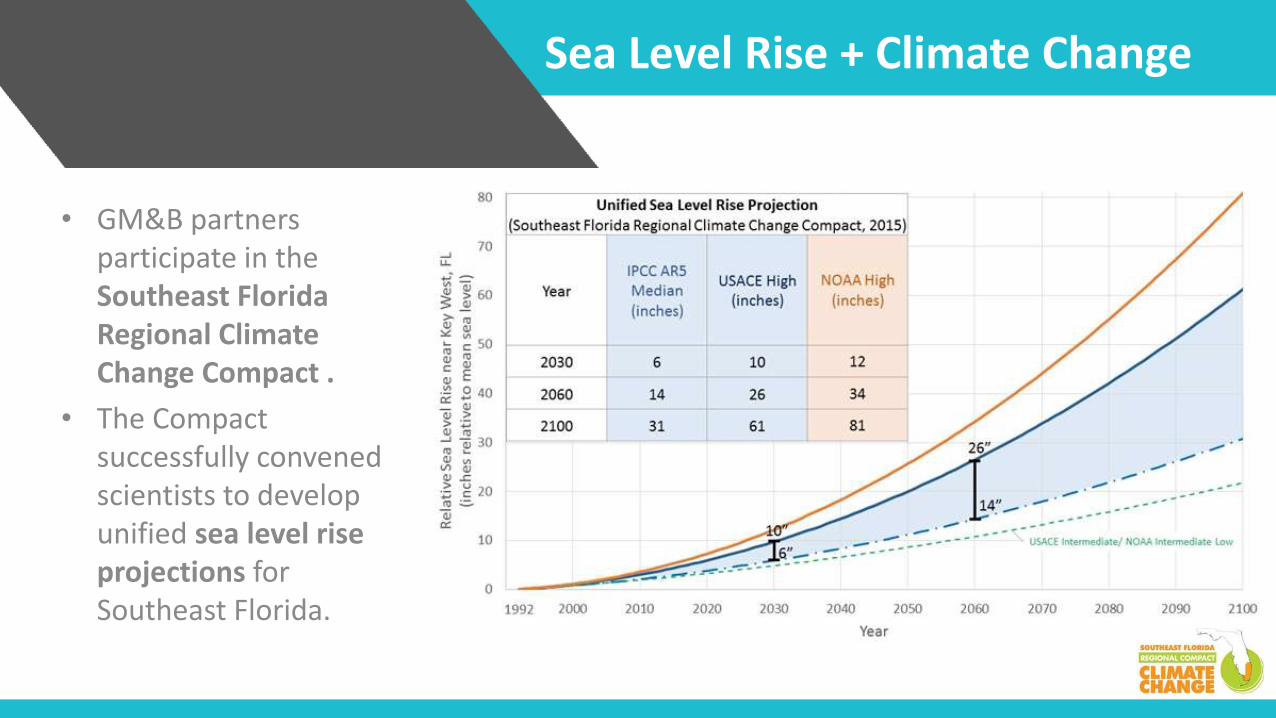
• GM&B partners participate in the Southeast Florida Regional Climate Change Compact .
• The Compact successfully convened scientists to develop unified sea level rise projections for Southeast Florida.
Sea Level Rise + Climate Change GM&B Context Key Actions
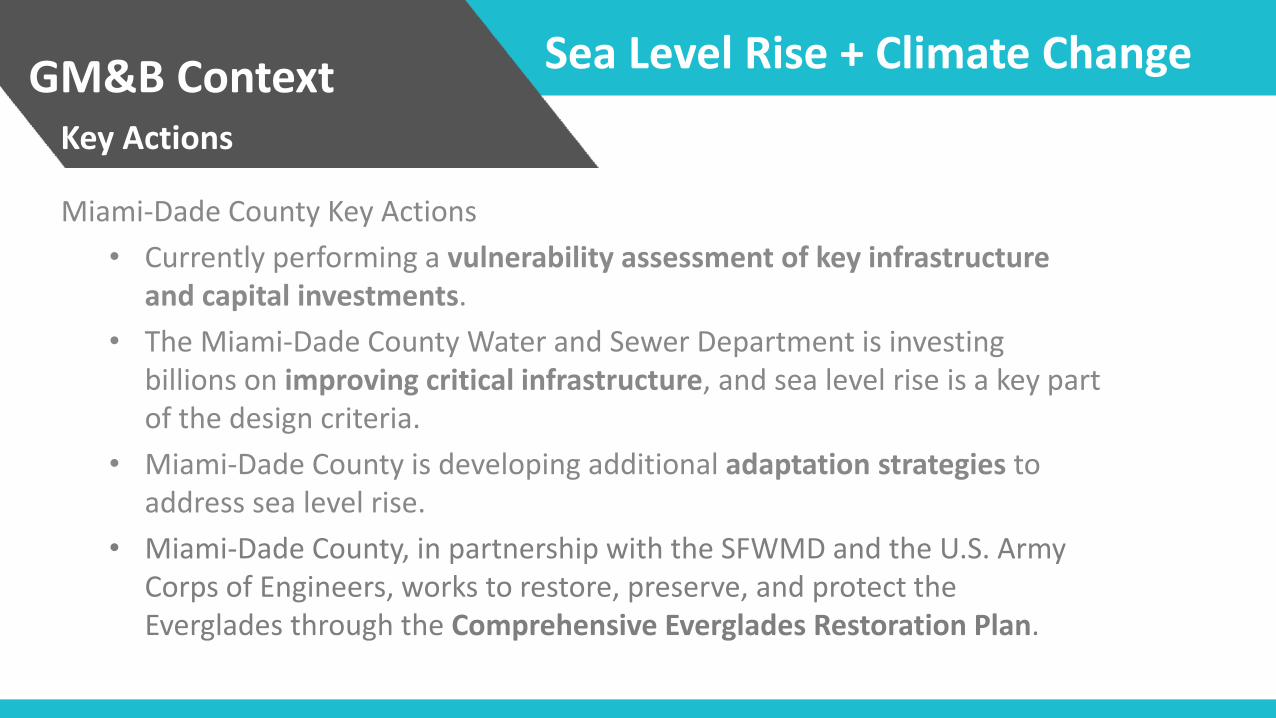
Miami-Dade County Key Actions
• Currently performing a vulnerability assessment of key infrastructure and capital investments.
• The Miami-Dade County Water and Sewer Department is investing billions on improving critical infrastructure, and sea level rise is a key part of the design criteria.
• Miami-Dade County is developing additional adaptation strategies to address sea level rise.
• Miami-Dade County, in partnership with the SFWMD and the U.S. Army Corps of Engineers, works to restore, preserve, and protect the Everglades through the Comprehensive Everglades Restoration Plan.
Sea Level Rise + Climate Change GM&B Context Key Actions
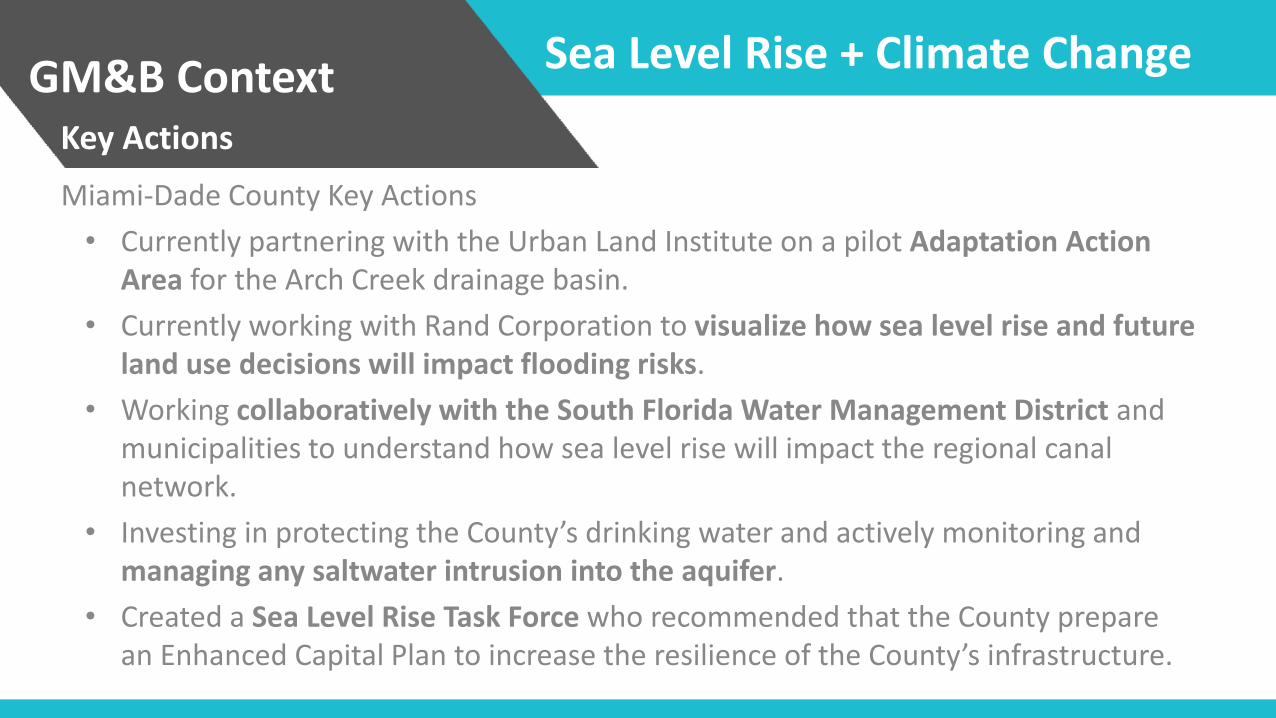
Miami-Dade County Key Actions
• Currently partnering with the Urban Land Institute on a pilot Adaptation Action Area for the Arch Creek drainage basin.
• Currently working with Rand Corporation to visualize how sea level rise and future land use decisions will impact flooding risks.
• Working collaboratively with the South Florida Water Management District and municipalities to understand how sea level rise will impact the regional canal network.
• Investing in protecting the County’s drinking water and actively monitoring and managing any saltwater intrusion into the aquifer.
• Created a Sea Level Rise Task Force who recommended that the County prepare an Enhanced Capital Plan to increase the resilience of the County’s infrastructure.
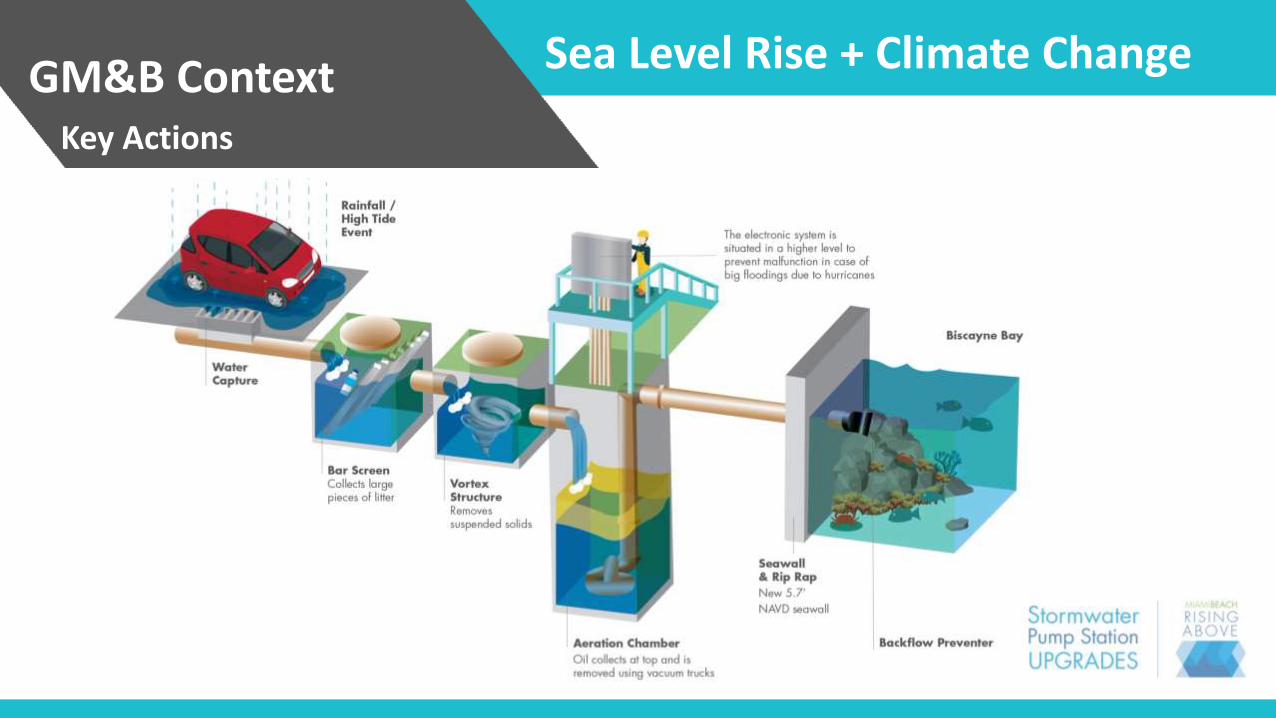
Sea Level Rise + Climate Change GM&B Context Key Actions
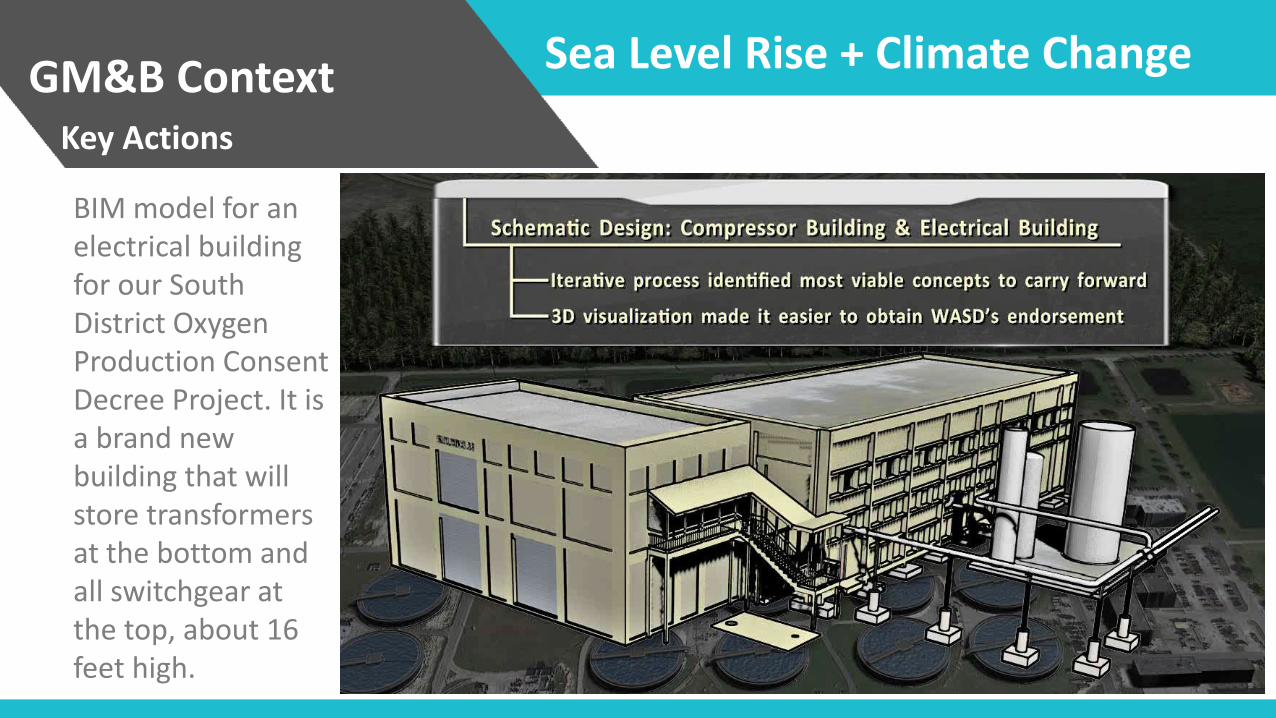
BIM model for an electrical building for our South District Oxygen Production Consent Decree Project. It is a brand new building that will store transformers at the bottom and all switchgear at the top, about 16 feet high.
Sea Level Rise + Climate Change GM&B Context Key Actions
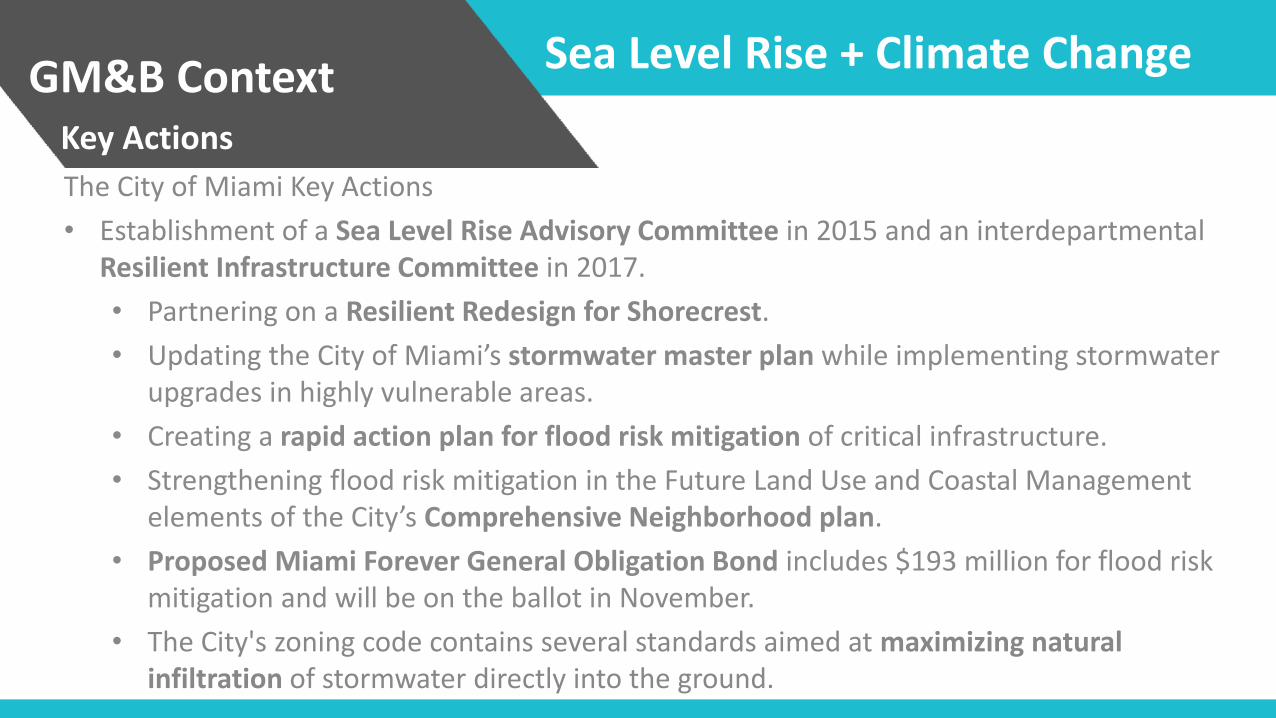
The City of Miami Key Actions
• Establishment of a Sea Level Rise Advisory Committee in 2015 and an interdepartmental Resilient Infrastructure Committee in 2017.
• Partnering on a Resilient Redesign for Shorecrest.
• Updating the City of Miami’s stormwater master plan while implementing stormwater upgrades in highly vulnerable areas.
• Creating a rapid action plan for flood risk mitigation of critical infrastructure.
• Strengthening flood risk mitigation in the Future Land Use and Coastal Management elements of the City’s Comprehensive Neighborhood plan.
• Proposed Miami Forever General Obligation Bond includes $193 million for flood risk mitigation and will be on the ballot in November.
• The City's zoning code contains several standards aimed at maximizing natural infiltration of stormwater directly into the ground.
Sea Level Rise + Climate Change GM&B Context Key Actions
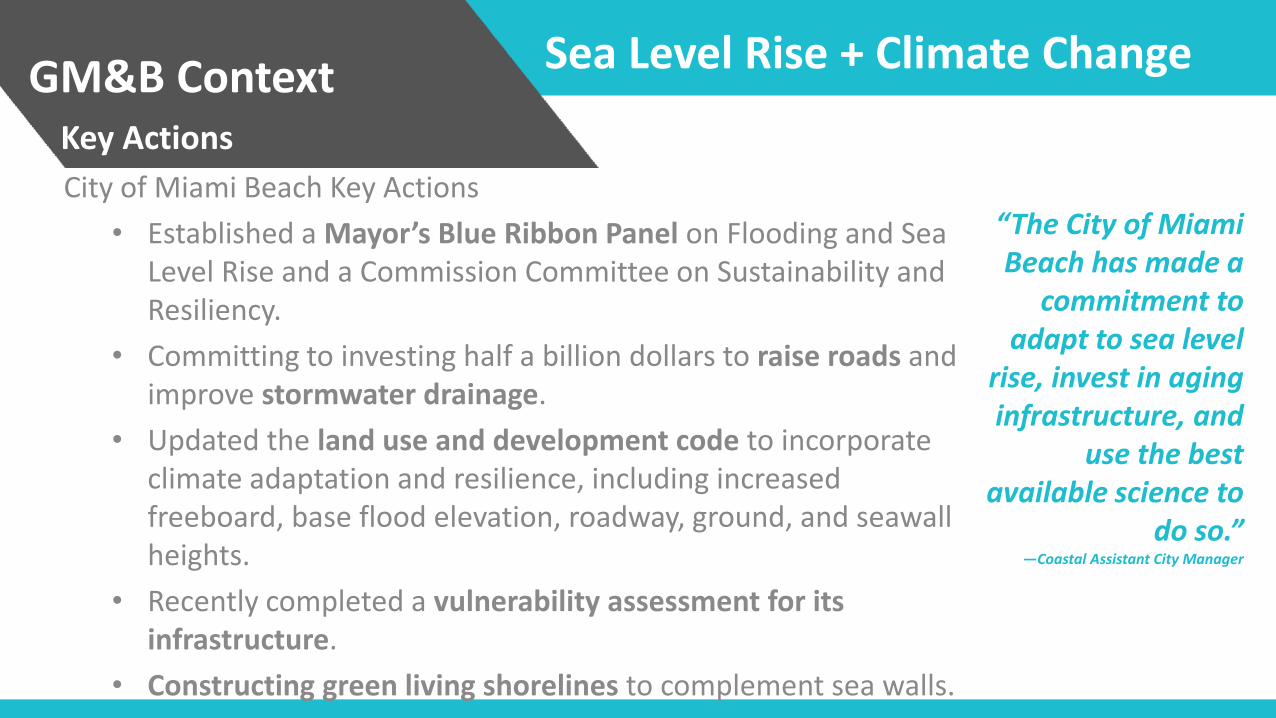
City of Miami Beach Key Actions
• Established a Mayor’s Blue Ribbon Panel on Flooding and Sea Level Rise and a Commission Committee on Sustainability and Resiliency.
• Committing to investing half a billion dollars to raise roads and improve stormwater drainage.
• Updated the land use and development code to incorporate climate adaptation and resilience, including increased freeboard, base flood elevation, roadway, ground, and seawall heights.
• Recently completed a vulnerability assessment for its infrastructure.
• Constructing green living shorelines to complement sea walls.
“The City of Miami Beach has made a
commitment to adapt to sea level
rise, invest in aging infrastructure, and
use the best available science to
do so.” —Coastal Assistant City Manager
Sea Level Rise + Climate Change GM&B Context Key Actions
Sea Level Rise + Climate Change GM&B Context Key Actions
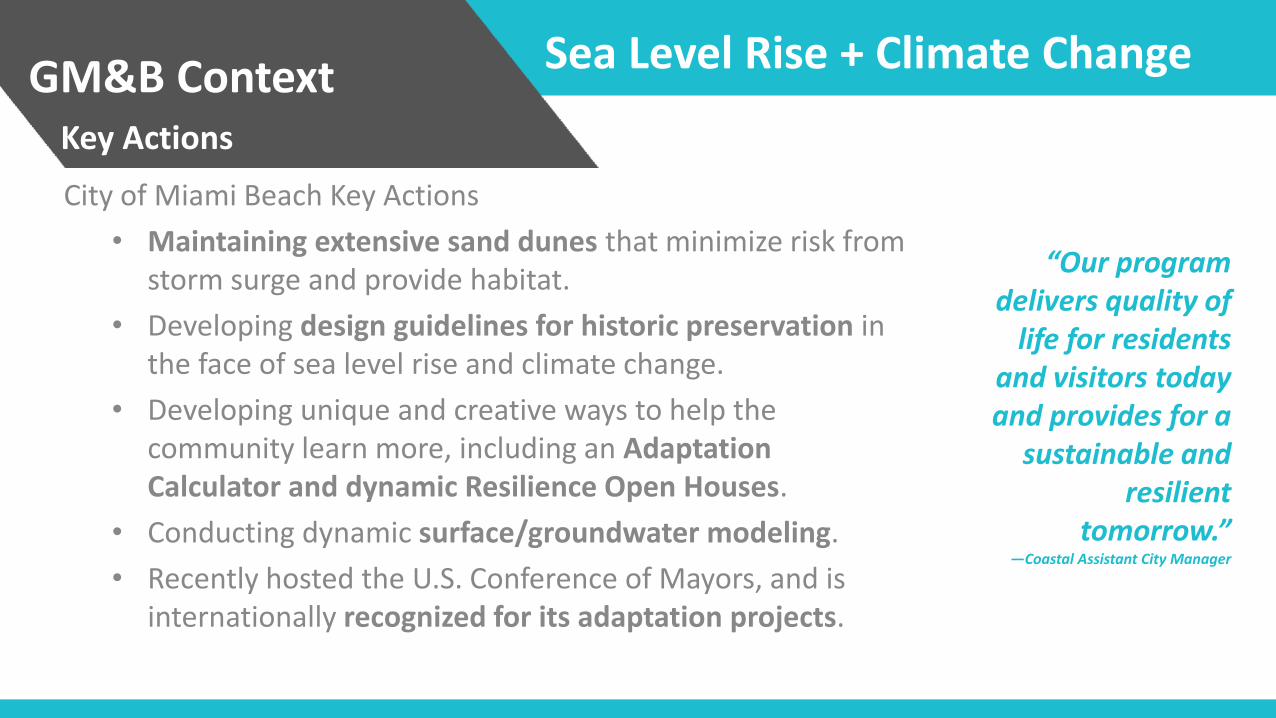
City of Miami Beach Key Actions
• Maintaining extensive sand dunes that minimize risk from storm surge and provide habitat.
• Developing design guidelines for historic preservation in the face of sea level rise and climate change.
• Developing unique and creative ways to help the community learn more, including an Adaptation Calculator and dynamic Resilience Open Houses.
• Conducting dynamic surface/groundwater modeling.
• Recently hosted the U.S. Conference of Mayors, and is internationally recognized for its adaptation projects.
“Our program delivers quality of
life for residents and visitors today and provides for a
sustainable and resilient
tomorrow.” —Coastal Assistant City Manager
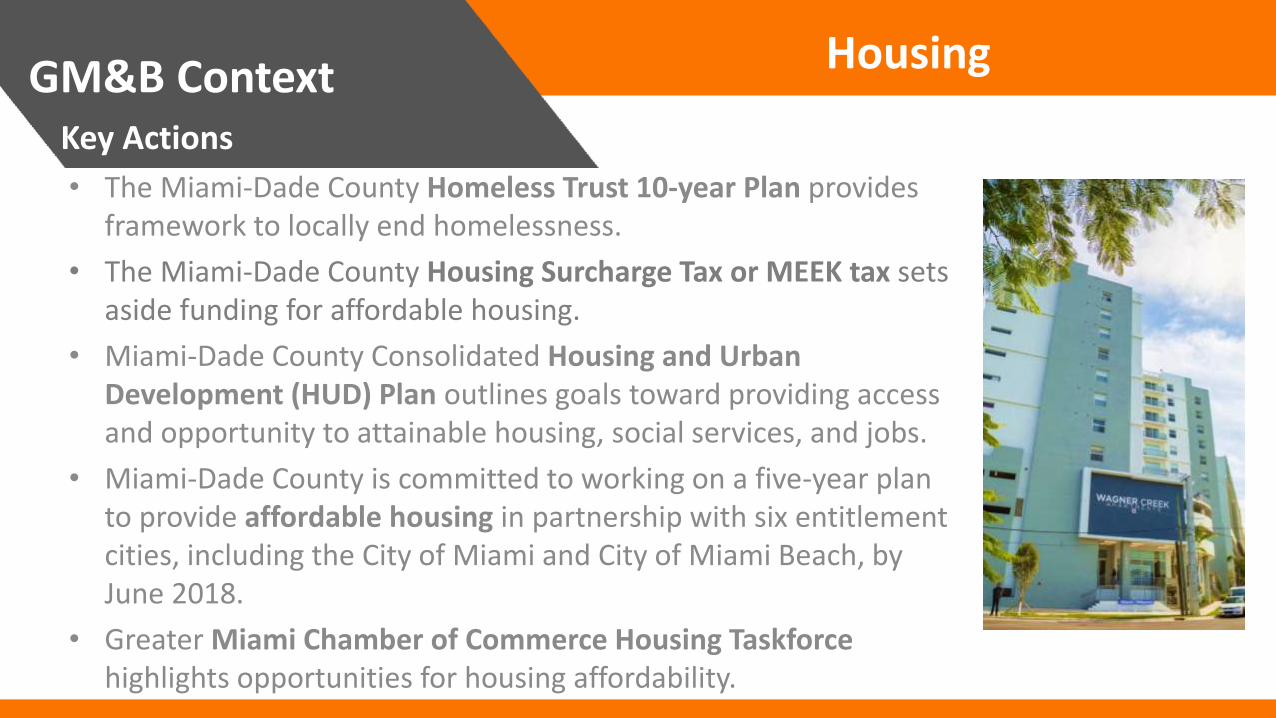
Housing GM&B Context Key Actions
• The Miami-Dade County Homeless Trust 10-year Plan provides framework to locally end homelessness.
• The Miami-Dade County Housing Surcharge Tax or MEEK tax sets aside funding for affordable housing.
• Miami-Dade County Consolidated Housing and Urban Development (HUD) Plan outlines goals toward providing access and opportunity to attainable housing, social services, and jobs.
• Miami-Dade County is committed to working on a five-year plan to provide affordable housing in partnership with six entitlement cities, including the City of Miami and City of Miami Beach, by June 2018.
• Greater Miami Chamber of Commerce Housing Taskforce highlights opportunities for housing affordability.
Housing GM&B Context Key Actions
• University of Miami’s Miami Affordability Project
is a tool to visualize neighborhood level housing market dynamics.
• The City of Miami Beach initiated Innovative Housing Conversion Projects.
• The City of Miami’s affordable and attainable mixed-income and workforce housing benefits ordinances.
• The City of Miami’s Miami 21 is a form-based zoning code guide based on principles of New Urbanism and Smart Growth
• Florida International University (FIU) Metropolitan Center is an urban policy think tank and solutions center.
• Liberty Square Rising revitalization initiative is for the redevelopment of the Liberty Square Public Housing Project.
• Adopted a volunteer Property Assessed Clean Energy Programs (PACE) program.
Mobility GM&B Context Key Actions
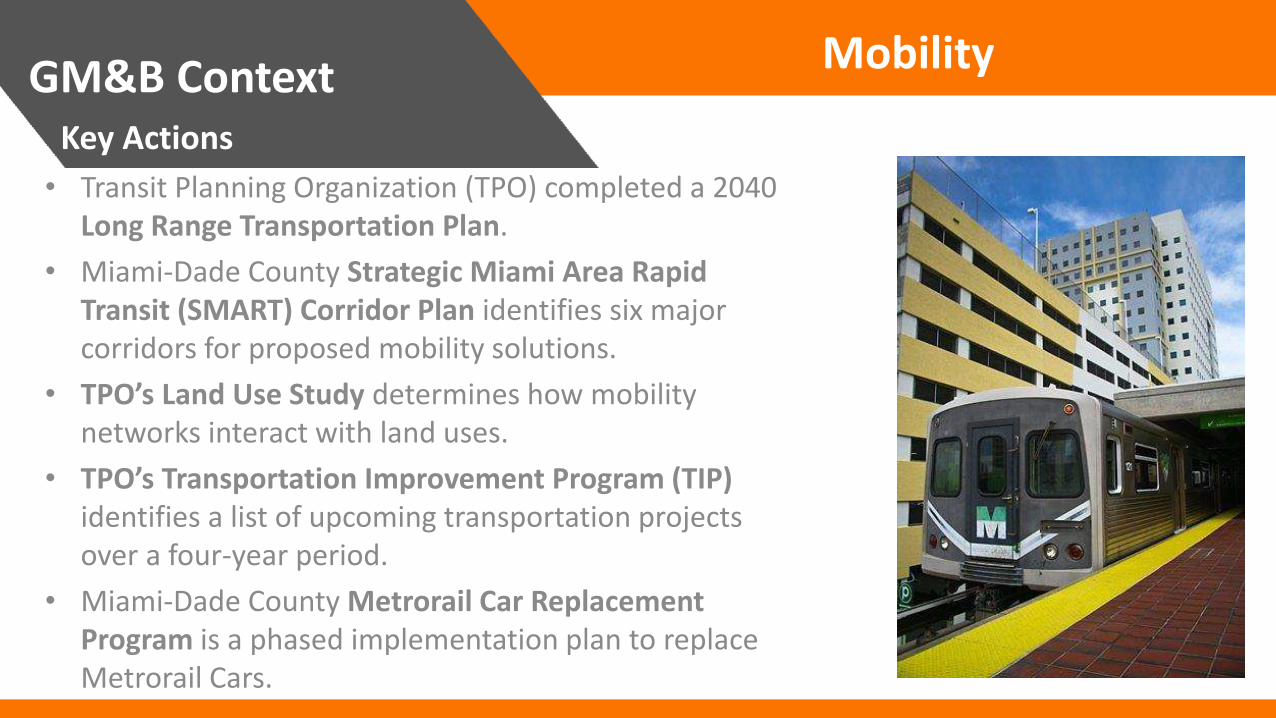
• Transit Planning Organization (TPO) completed a 2040 Long Range Transportation Plan.
• Miami-Dade County Strategic Miami Area Rapid Transit (SMART) Corridor Plan identifies six major corridors for proposed mobility solutions.
• TPO’s Land Use Study determines how mobility networks interact with land uses.
• TPO’s Transportation Improvement Program (TIP) identifies a list of upcoming transportation projects over a four-year period.
• Miami-Dade County Metrorail Car Replacement Program is a phased implementation plan to replace Metrorail Cars.
Mobility GM&B Context Key Actions
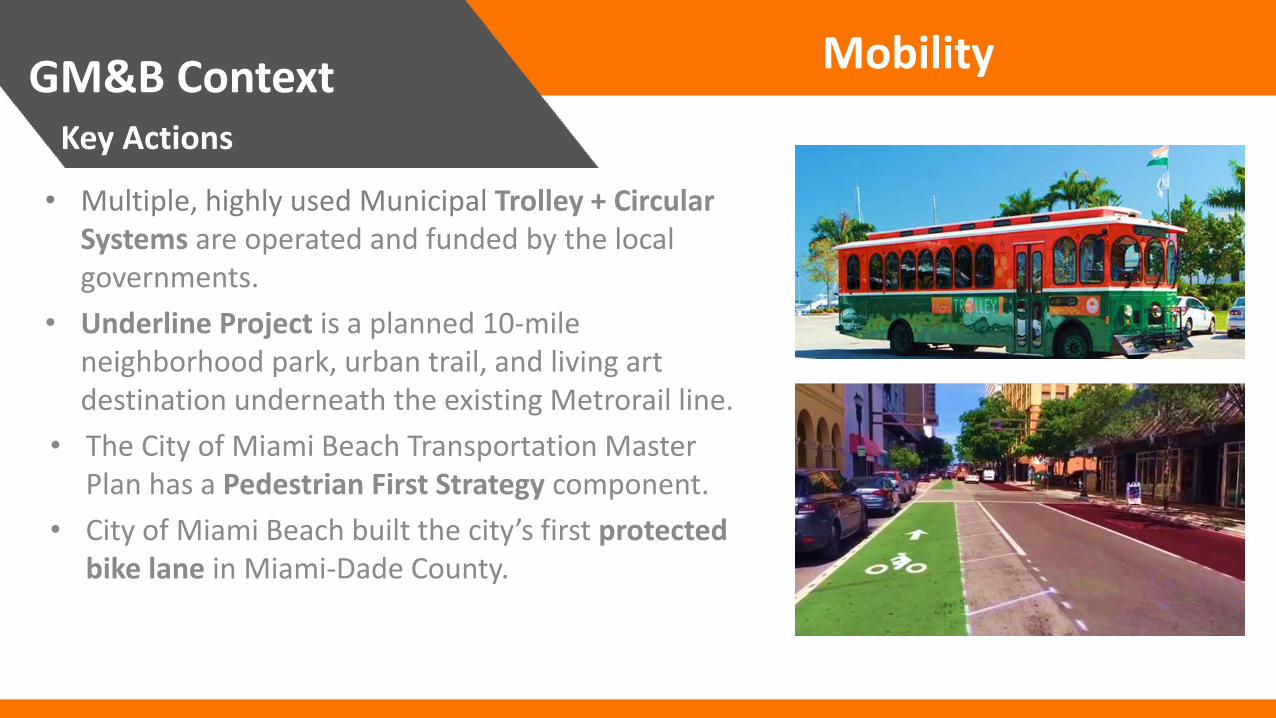
• Multiple, highly used Municipal Trolley + Circular
Systems are operated and funded by the local governments.
• Underline Project is a planned 10-mile neighborhood park, urban trail, and living art destination underneath the existing Metrorail line.
• The City of Miami Beach Transportation Master Plan has a Pedestrian First Strategy component.
• City of Miami Beach built the city’s first protected bike lane in Miami-Dade County.
Social Services GM&B Context Key Actions
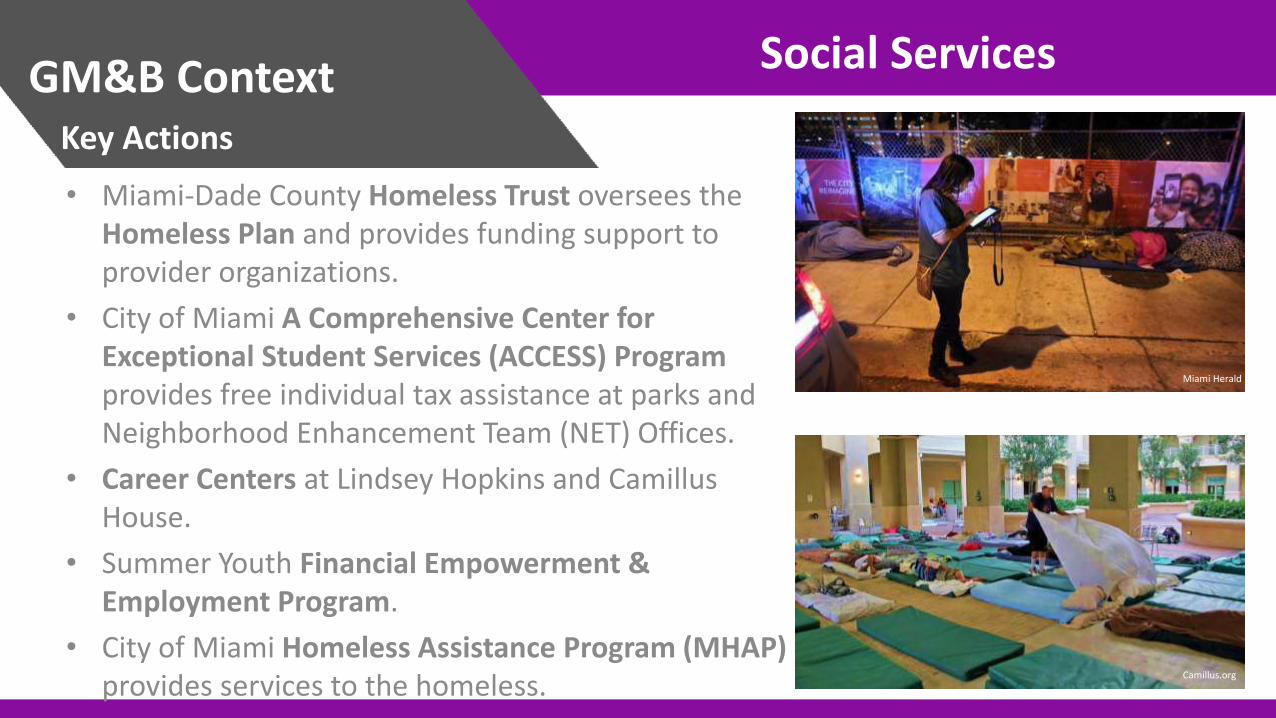
• Miami-Dade County Homeless Trust oversees the
Homeless Plan and provides funding support to provider organizations.
• City of Miami A Comprehensive Center for Exceptional Student Services (ACCESS) Program provides free individual tax assistance at parks and Neighborhood Enhancement Team (NET) Offices.
• Career Centers at Lindsey Hopkins and Camillus House.
• Summer Youth Financial Empowerment & Employment Program.
• City of Miami Homeless Assistance Program (MHAP) provides services to the homeless.
Miami Herald
Camillus.org
Social Services GM&B Context Key Actions
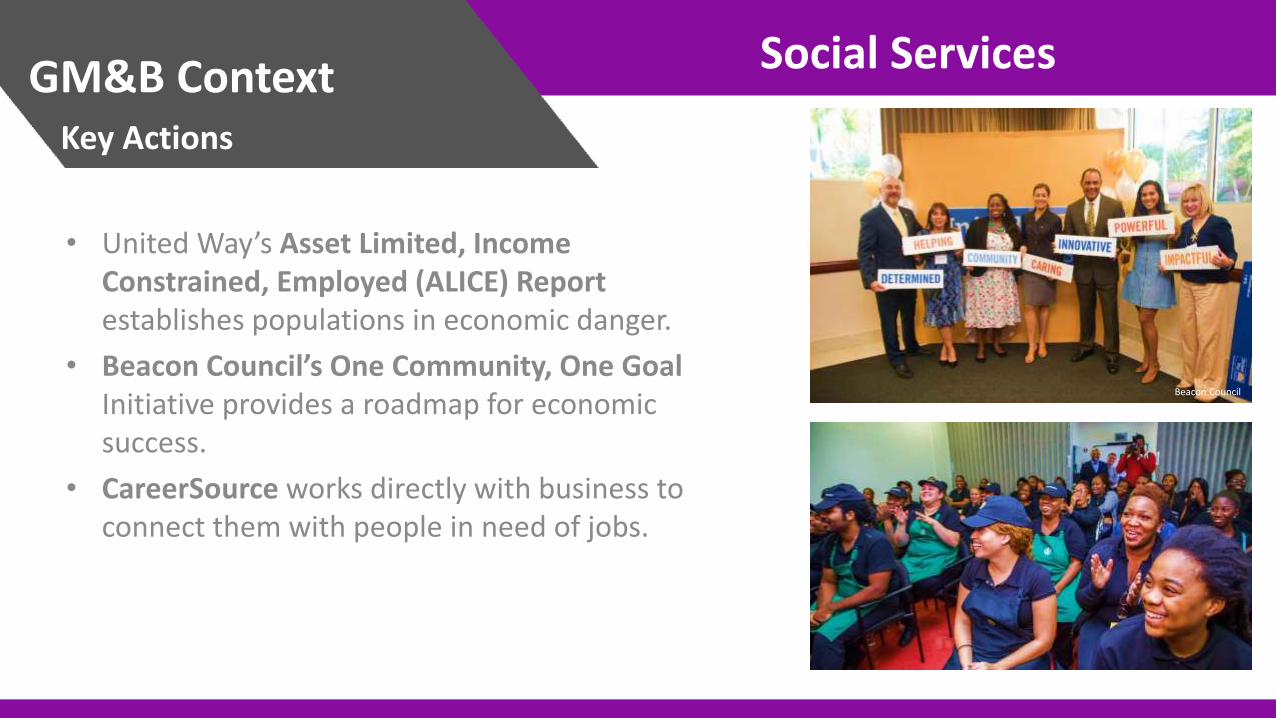
• United Way’s Asset Limited, Income Constrained, Employed (ALICE) Report establishes populations in economic danger.
• Beacon Council’s One Community, One Goal Initiative provides a roadmap for economic success.
• CareerSource works directly with business to connect them with people in need of jobs.
Beacon Council
Health GM&B Context Key Actions
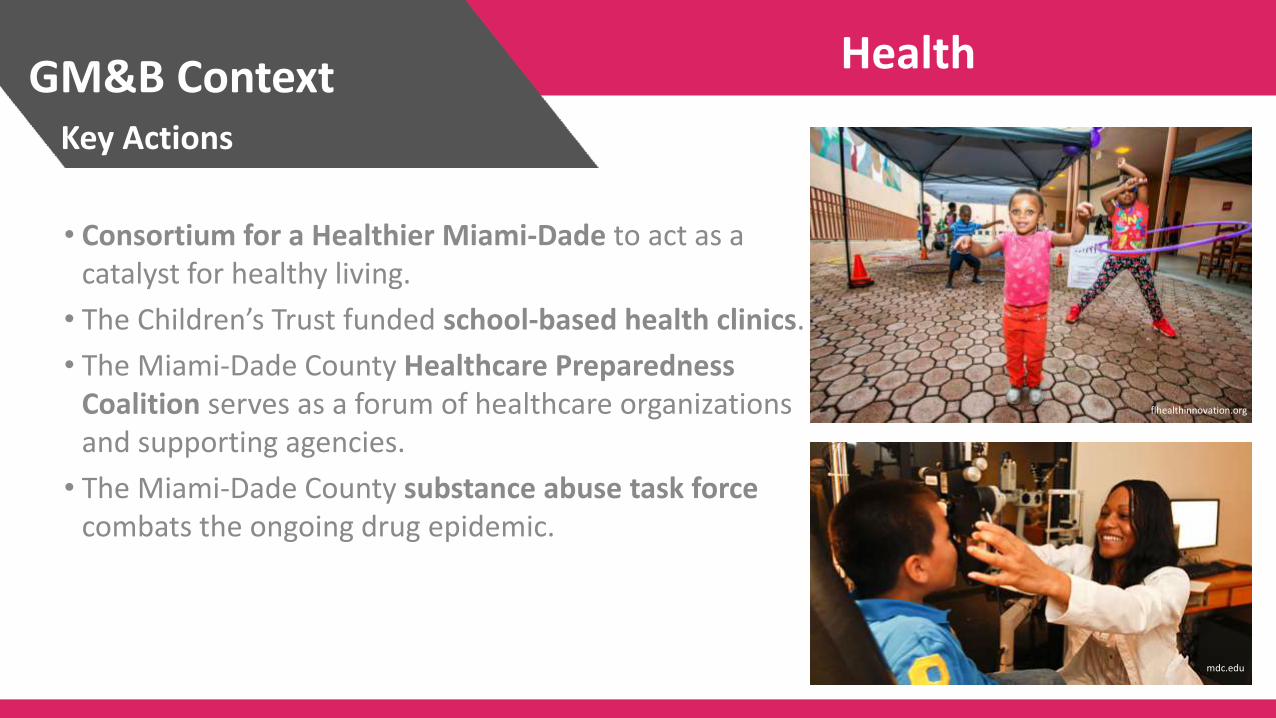
• Consortium for a Healthier Miami-Dade to act as a catalyst for healthy living.
• The Children’s Trust funded school-based health clinics.
• The Miami-Dade County Healthcare Preparedness Coalition serves as a forum of healthcare organizations and supporting agencies.
• The Miami-Dade County substance abuse task force combats the ongoing drug epidemic.
flhealthinnovation.org
mdc.edu
Health GM&B Context Key Actions
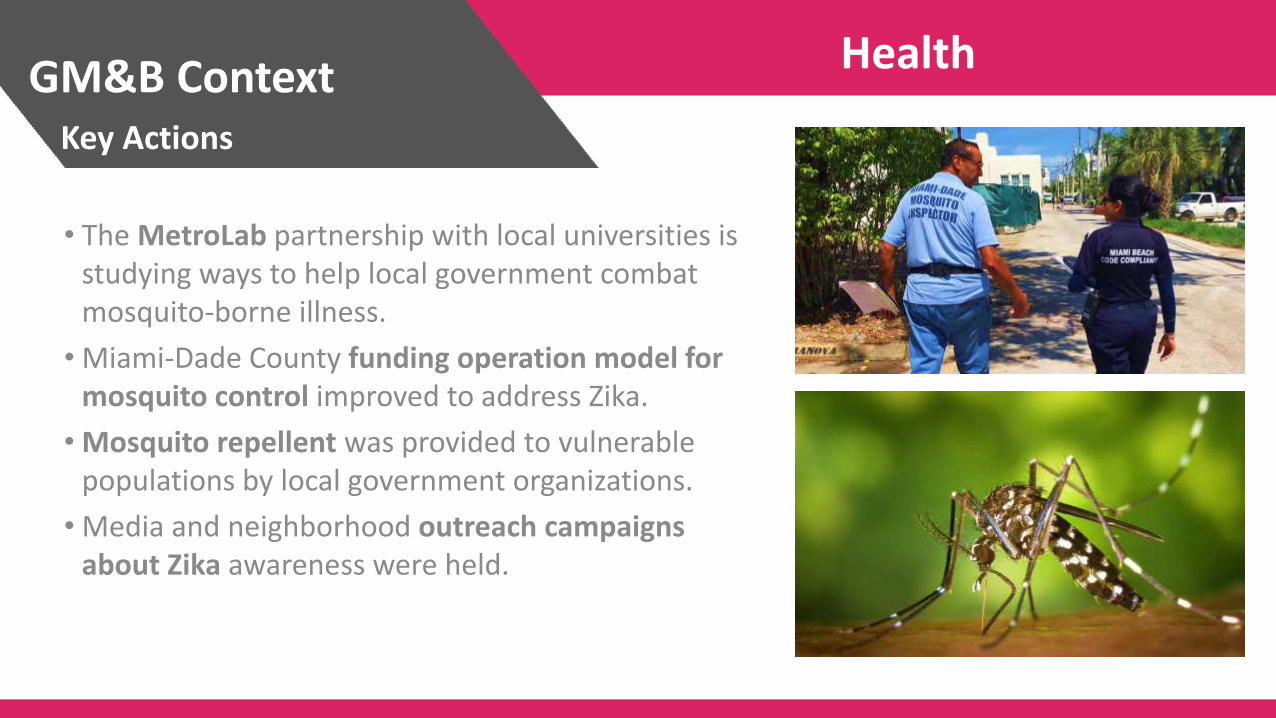
• The MetroLab partnership with local universities is studying ways to help local government combat mosquito-borne illness.
• Miami-Dade County funding operation model for mosquito control improved to address Zika.
• Mosquito repellent was provided to vulnerable populations by local government organizations.
• Media and neighborhood outreach campaigns about Zika awareness were held.
Juvenile Crime GM&B Context Key Actions
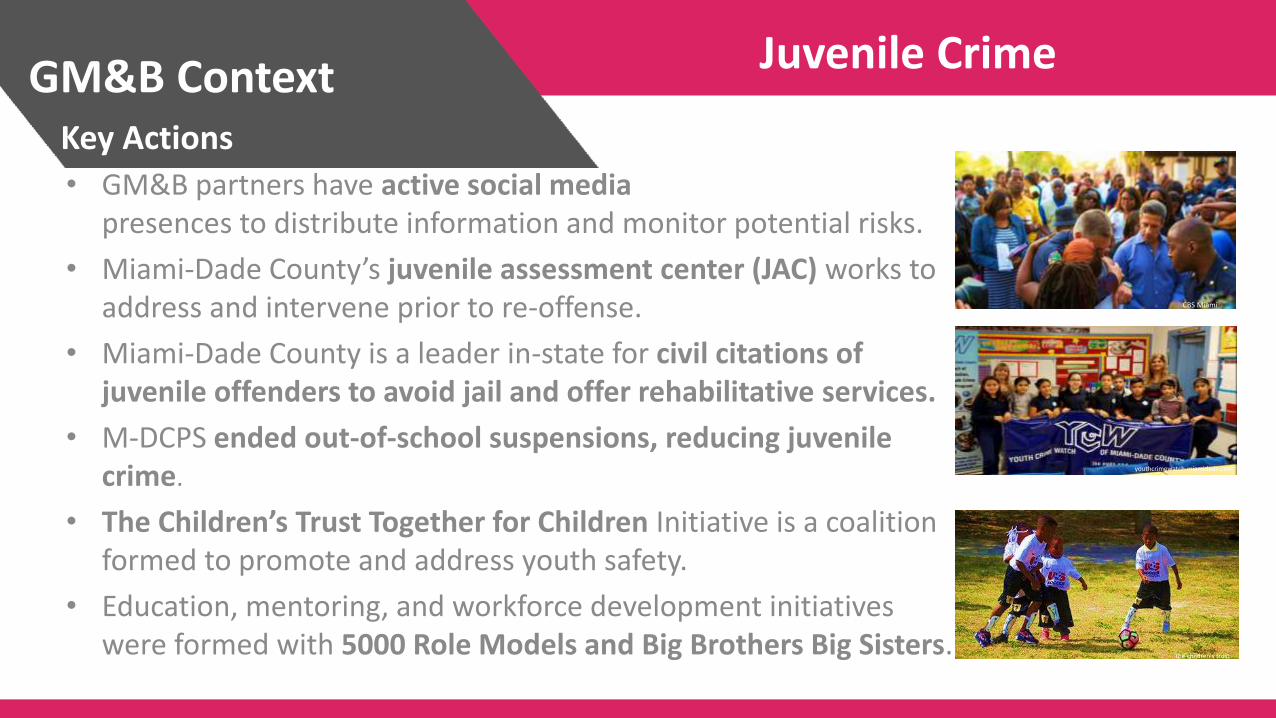
• GM&B partners have active social media presences to distribute information and monitor potential risks.
• Miami-Dade County’s juvenile assessment center (JAC) works to address and intervene prior to re-offense.
• Miami-Dade County is a leader in-state for civil citations of juvenile offenders to avoid jail and offer rehabilitative services.
• M-DCPS ended out-of-school suspensions, reducing juvenile crime.
• The Children’s Trust Together for Children Initiative is a coalition formed to promote and address youth safety.
• Education, mentoring, and workforce development initiatives were formed with 5000 Role Models and Big Brothers Big Sisters.
youthcrimewatch-miamidade.com
The children's trust
CBS Miami
Emergency Management GM&B Context Key Actions
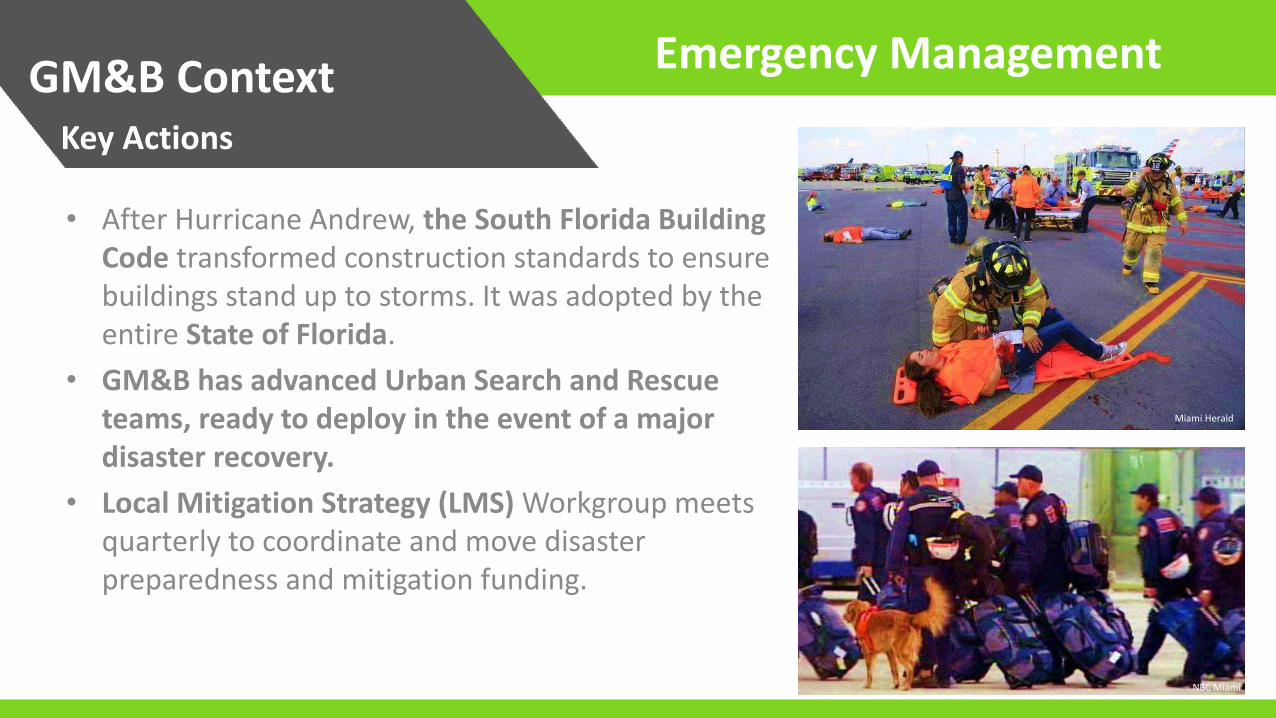
• After Hurricane Andrew, the South Florida Building Code transformed construction standards to ensure buildings stand up to storms. It was adopted by the entire State of Florida.
• GM&B has advanced Urban Search and Rescue teams, ready to deploy in the event of a major disaster recovery.
• Local Mitigation Strategy (LMS) Workgroup meets quarterly to coordinate and move disaster preparedness and mitigation funding.
Miami Herald
NBC Miami
Emergency Management GM&B Context Key Actions
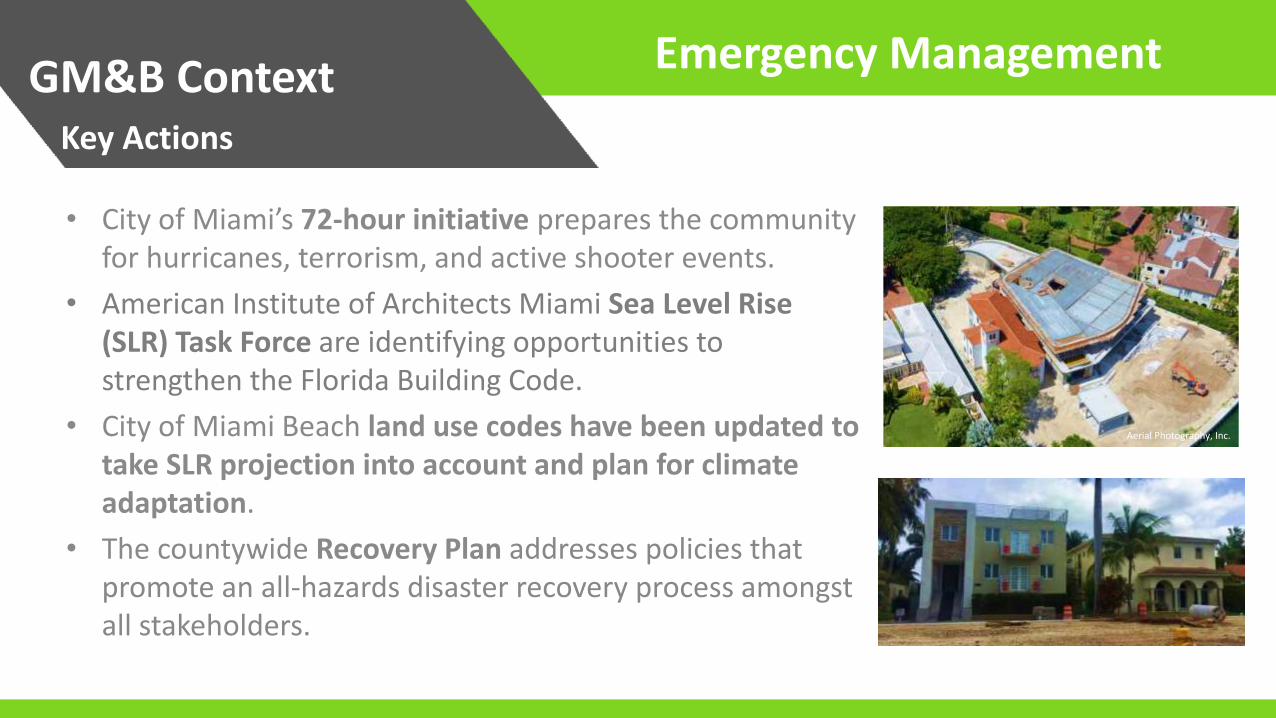
• City of Miami’s 72-hour initiative prepares the community for hurricanes, terrorism, and active shooter events.
• American Institute of Architects Miami Sea Level Rise (SLR) Task Force are identifying opportunities to strengthen the Florida Building Code.
• City of Miami Beach land use codes have been updated to take SLR projection into account and plan for climate adaptation.
• The countywide Recovery Plan addresses policies that promote an all-hazards disaster recovery process amongst all stakeholders.
Aerial Photography, Inc.
Intergovernmental Collaboration GM&B Context Key Actions
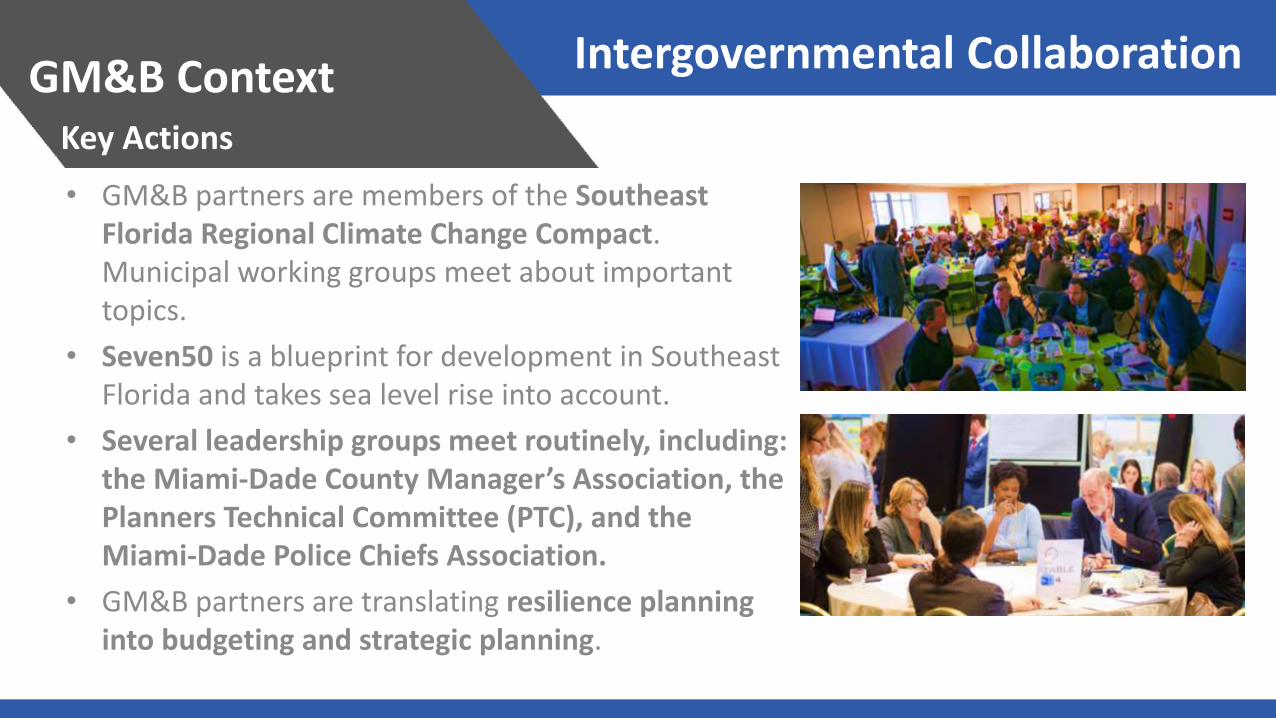
• GM&B partners are members of the Southeast
Florida Regional Climate Change Compact. Municipal working groups meet about important topics.
• Seven50 is a blueprint for development in Southeast Florida and takes sea level rise into account.
• Several leadership groups meet routinely, including: the Miami-Dade County Manager’s Association, the Planners Technical Committee (PTC), and the Miami-Dade Police Chiefs Association.
• GM&B partners are translating resilience planning into budgeting and strategic planning.
GM&B Context Key Actions
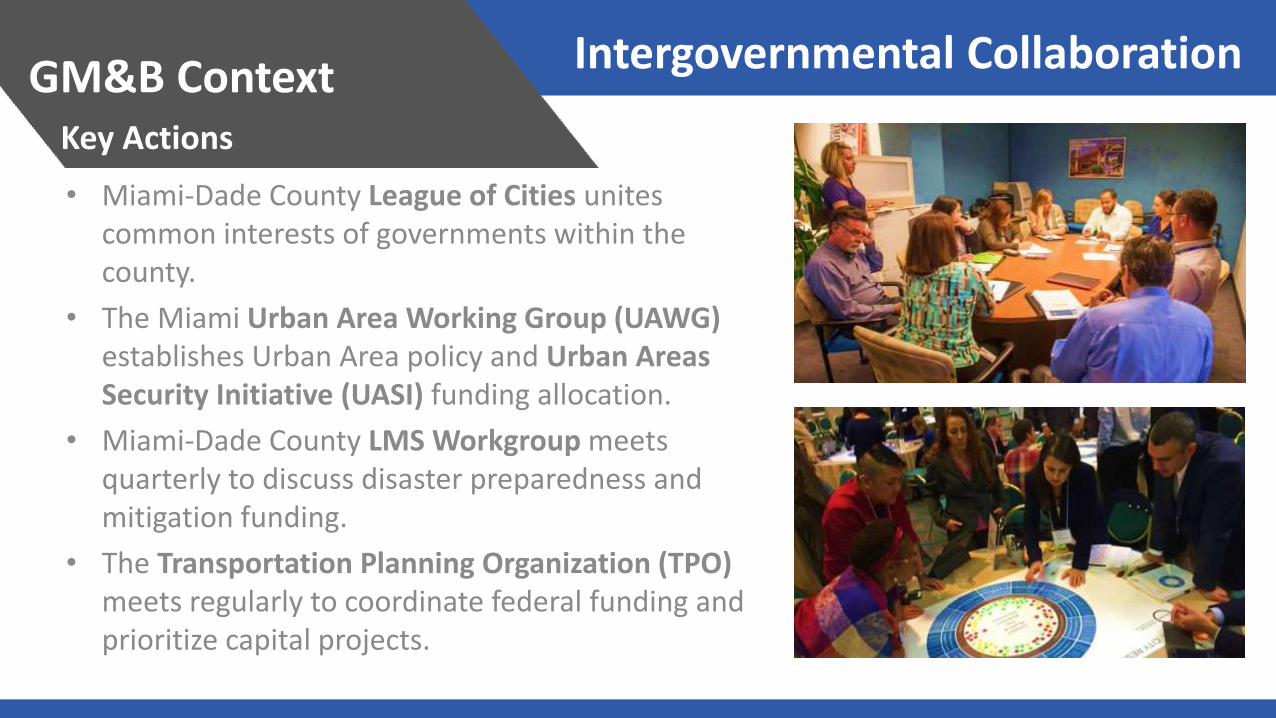
• Miami-Dade County League of Cities unites
common interests of governments within the county.
• The Miami Urban Area Working Group (UAWG) establishes Urban Area policy and Urban Areas Security Initiative (UASI) funding allocation.
• Miami-Dade County LMS Workgroup meets quarterly to discuss disaster preparedness and mitigation funding.
• The Transportation Planning Organization (TPO) meets regularly to coordinate federal funding and prioritize capital projects.
Intergovernmental Collaboration
GM&B Context Case Study
Miami-Dade County is vulnerable to a variety of hazards and the Comprehensive Emergency Management Plan establishes the framework for the County and its 34 municipalities to address these risks. The Plan outlines the intergovernmental roles and responsibilities. Each municipality is independently responsible for the safety of its residents and visitors with mutual aid support from the County.
The Local Mitigation Strategy (LMS) Working Group is made up of a broad stakeholder group including federal, state, and local government; private enterprise; private and public schools, colleges, and universities; hospitals; and not-for-profits. The Working Group meets quarterly to update the strategy which includes a countywide list of funded and unfounded projects which are tracked to monitor progress on risk mitigation and comprehensively address the impact the current and future hazards.
In addition to the LMS working group, the Whole Community Engagement Group is convened quarterly by The County's Emergency Management with representatives of the municipalities, universities/colleges and other County partners. The group is convened to discuss current issues, best practices, and inform and solicit feedback on current plans.
Intergovernmental Collaboration
•
•
•
•
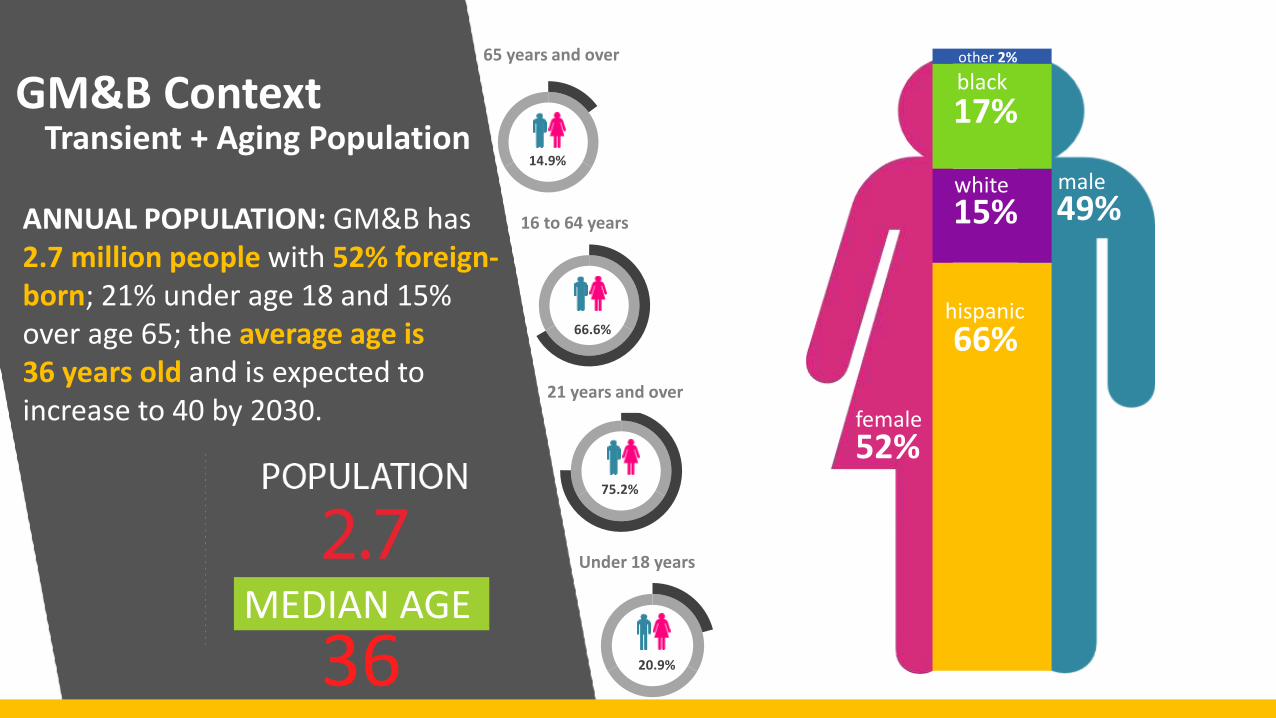
20.9%
75.2%
66.6%
14.9%
Under 18 years
65 years and over
16 to 64 years
21 years and over
GM&B Context Transient + Aging Population
ANNUAL POPULATION: GM&B has 2.7 million people with 52% foreign-born; 21% under age 18 and 15% over age 65; the average age is 36 years old and is expected to increase to 40 by 2030.
66% hispanic
15% white
17% black other 2%
49% male
52% female
36 MEDIAN AGE
48%
25%
18%
9%
Northeast
Southern
Midwest
Western
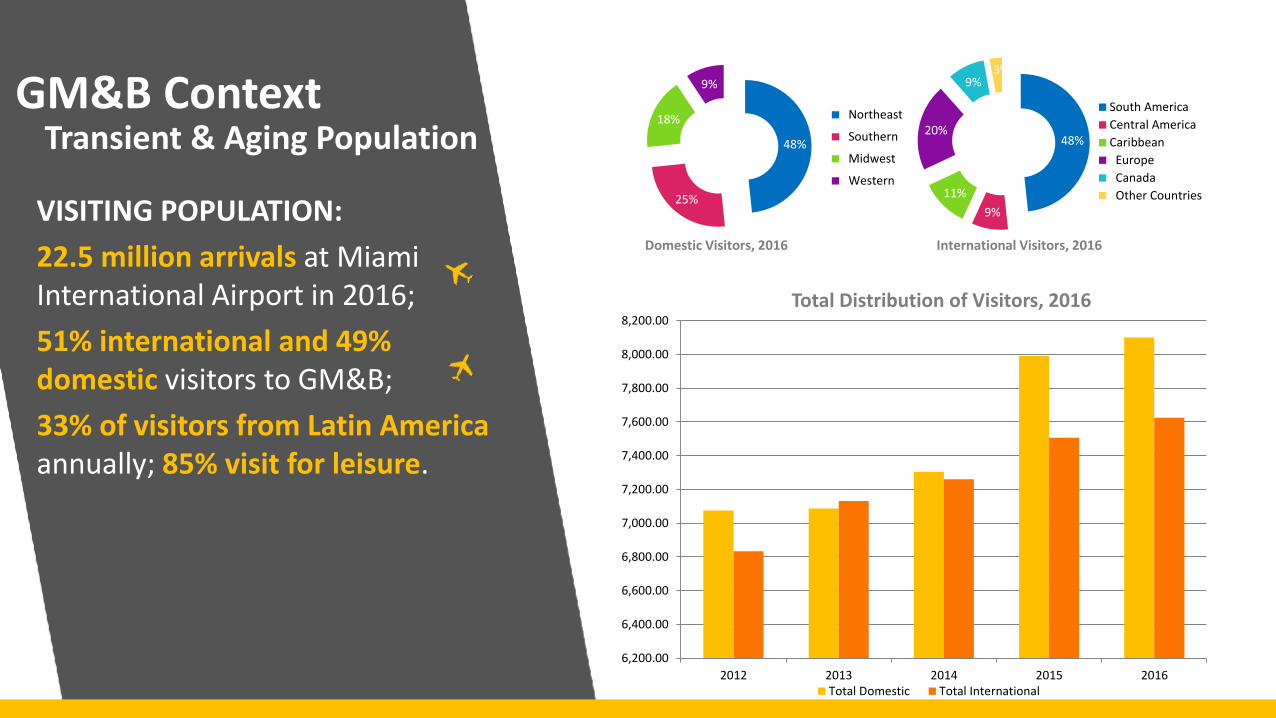
GM&B Context Transient & Aging Population
VISITING POPULATION:
22.5 million arrivals at Miami International Airport in 2016;
51% international and 49% domestic visitors to GM&B;
33% of visitors from Latin America annually; 85% visit for leisure.
Domestic Visitors, 2016
6,200.00
6,400.00
6,600.00
6,800.00
7,000.00
7,200.00
7,400.00
7,600.00
7,800.00
8,000.00
8,200.00
2012 2013 2014 2015 2016Total Domestic Total International
48%
9%
11%
20%
9% 3%
South America
Central America
Caribbean
Europe
Canada
Other Countries
International Visitors, 2016
Total Distribution of Visitors, 2016
-
50,000
100,000
150,000
200,000
250,000
300,000
350,000
5 to 17 18 to 64 65+
Years
-
5,000
10,000
15,000
20,000
25,000
5 to 17 18 to 64 65+
Years
•
• •
0%
10%
20%
30%
40%
50%
60%
1960 1970 1980 1990 2000 2010 2020Year
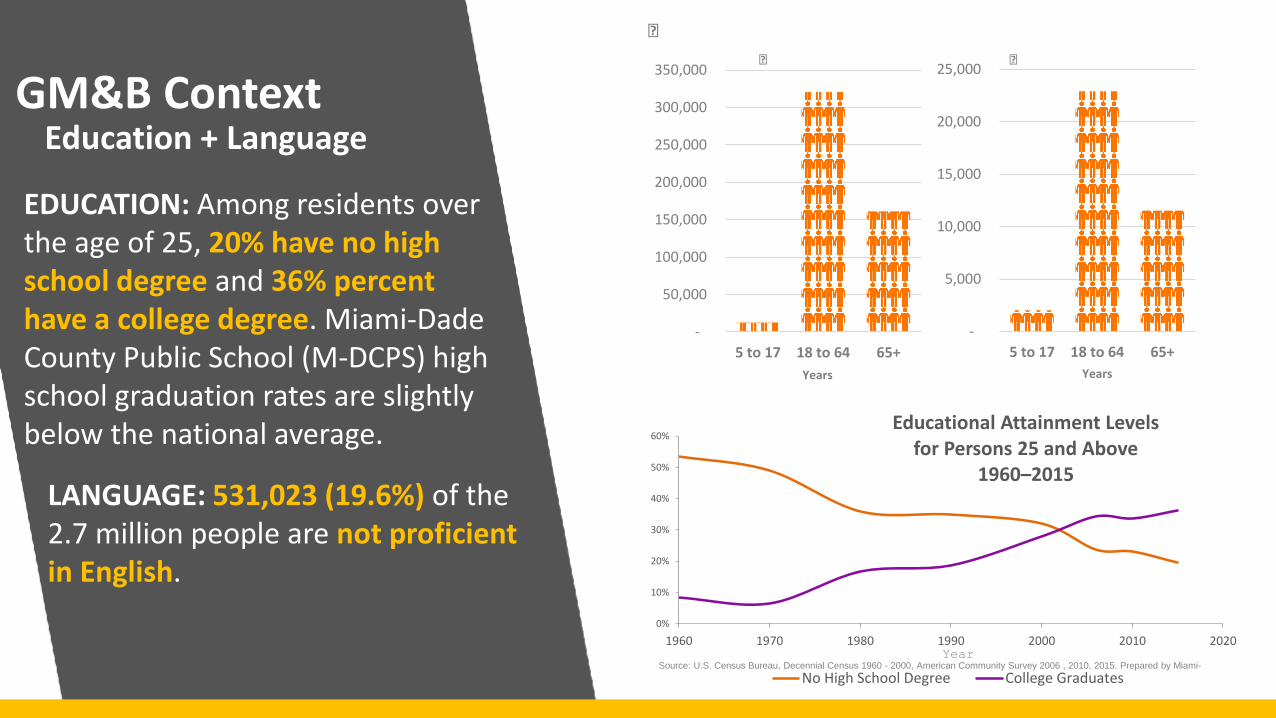
Educational Attainment Levels for Persons 25 and Above
1960–2015
No High School Degree College GraduatesSource: U.S. Census Bureau, Decennial Census 1960 - 2000, American Community Survey 2006 , 2010, 2015. Prepared by Miami-
GM&B Context Education + Language
EDUCATION: Among residents over the age of 25, 20% have no high school degree and 36% percent have a college degree. Miami-Dade County Public School (M-DCPS) high school graduation rates are slightly below the national average.
LANGUAGE: 531,023 (19.6%) of the 2.7 million people are not proficient in English.
0
10,000
20,000
30,000
40,000
50,000
60,000
1980 1990 2000 2010 2015
USA Miami-Dade County
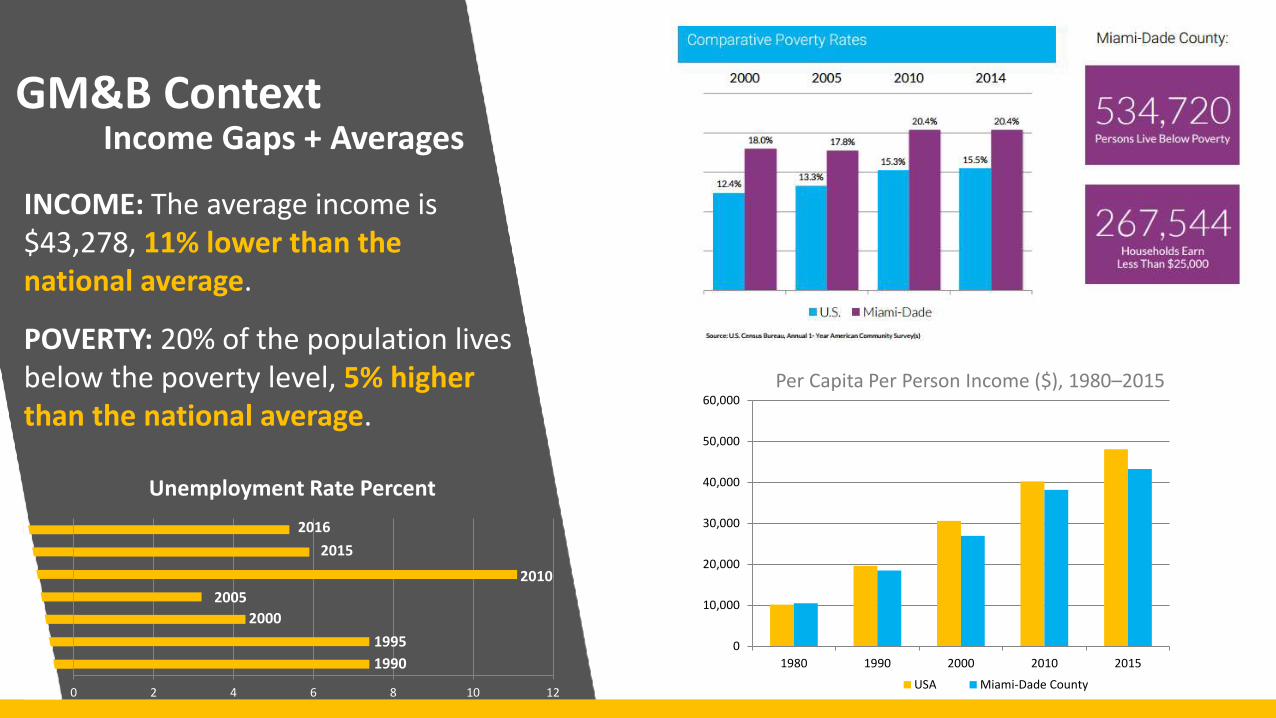
GM&B Context Income Gaps + Averages
INCOME: The average income is $43,278, 11% lower than the national average.
POVERTY: 20% of the population lives below the poverty level, 5% higher than the national average.
0 2 4 6 8 10 12
Unemployment Rate Percent
2016
2015
2010
2005
2000
1995
1990
Per Capita Per Person Income ($), 1980–2015
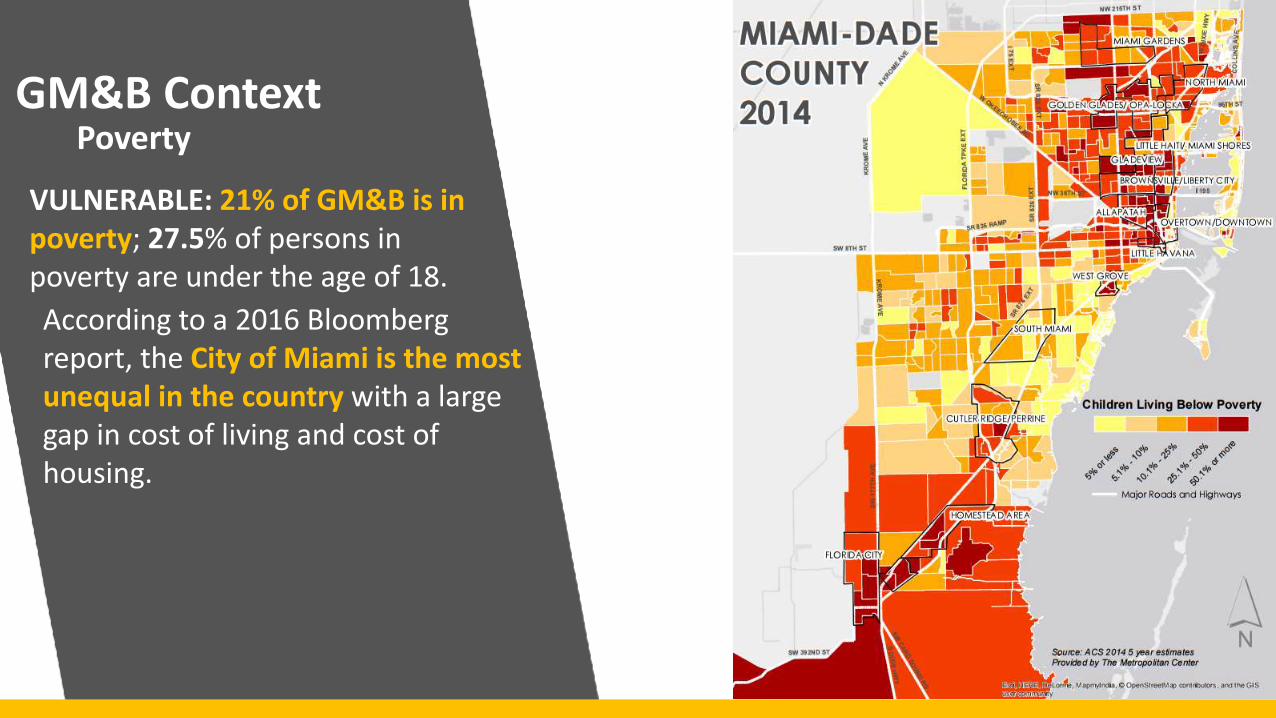
GM&B Context Poverty
VULNERABLE: 21% of GM&B is in poverty; 27.5% of persons in poverty are under the age of 18.
According to a 2016 Bloomberg report, the City of Miami is the most unequal in the country with a large gap in cost of living and cost of housing.
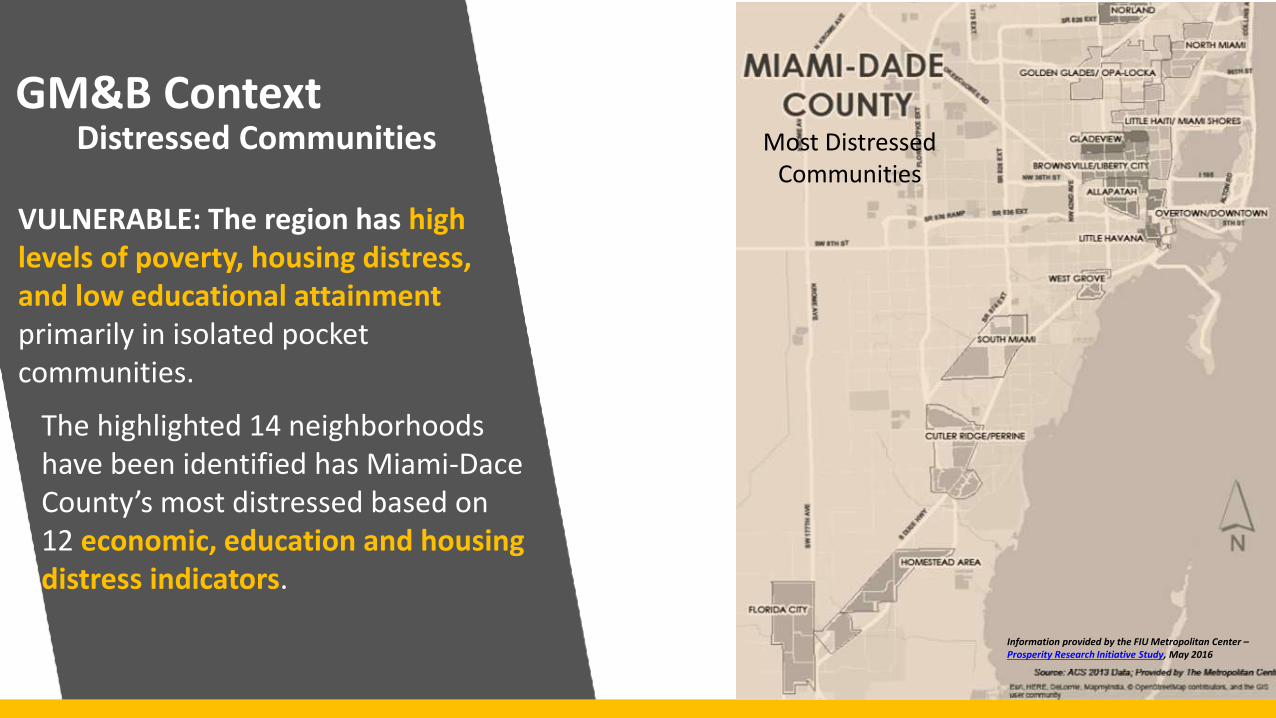
GM&B Context Distressed Communities
VULNERABLE: The region has high levels of poverty, housing distress, and low educational attainment primarily in isolated pocket communities.
The highlighted 14 neighborhoods have been identified has Miami-Dace County’s most distressed based on 12 economic, education and housing distress indicators.
Communities Economic
Index Education Distress
Owner Housing Distress
Index
Renter Housing Distress
Index
Total Distress
Index
Total Population
Population Below
Poverty
Gladeview 7 7 15 10 39 11,510 5,180
Brownsville/Liberty City
12 10 15 5 42 36,974 15,899
Allapattah 40 12 7 7 66 36,260 13,054
Florida City 32 13 17 4 66 38,794 15,130
Little Haiti 26 24 15 8 73 48,548 17,963
Homestead 42 18 8 6 74 30,827 10,173
NMB/Norland 48 21 8 13 90 14,653 3,077
West Grove 42 41 9 2 94 12,128 3,275
Little Havana 45 36 11 3 95 34,334 14,764
North Miami 37 48 11 1 97 36,398 11,283
Golden Glades 41 27 20 9 97 39,638 12,684
Overtown/ Downtown
35 34 24 14 107 14,071 5,910
Cutler Ridge/Perrine 48 24 23 12 107 36,494 8,394
South Miami 70 45 20 11 146 21,279 1,915
Totals 411,908 34%
Distressed Community Index Scorecard
Information provided by the FIU Metropolitan Center – Prosperity Research Initiative Study, May 2016
Most Distressed Communities
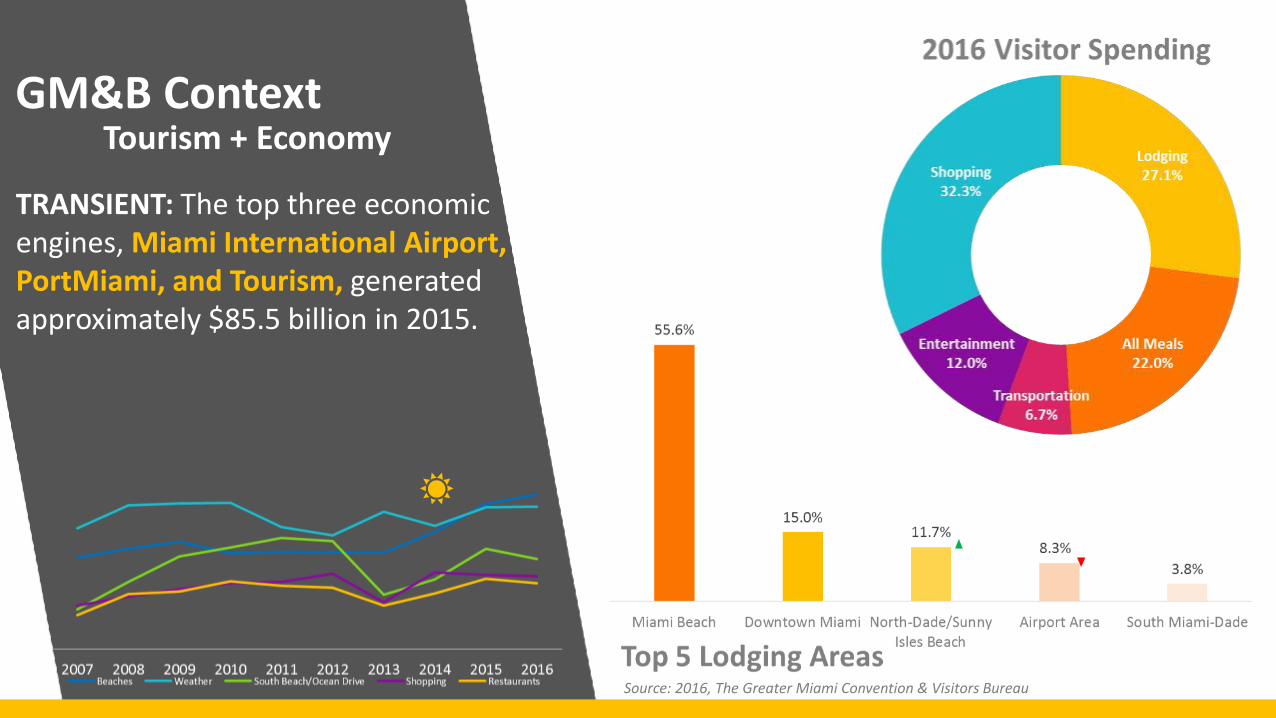
GM&B Context Tourism + Economy
TRANSIENT: The top three economic engines, Miami International Airport, PortMiami, and Tourism, generated approximately $85.5 billion in 2015.
Source: 2016, The Greater Miami Convention & Visitors Bureau
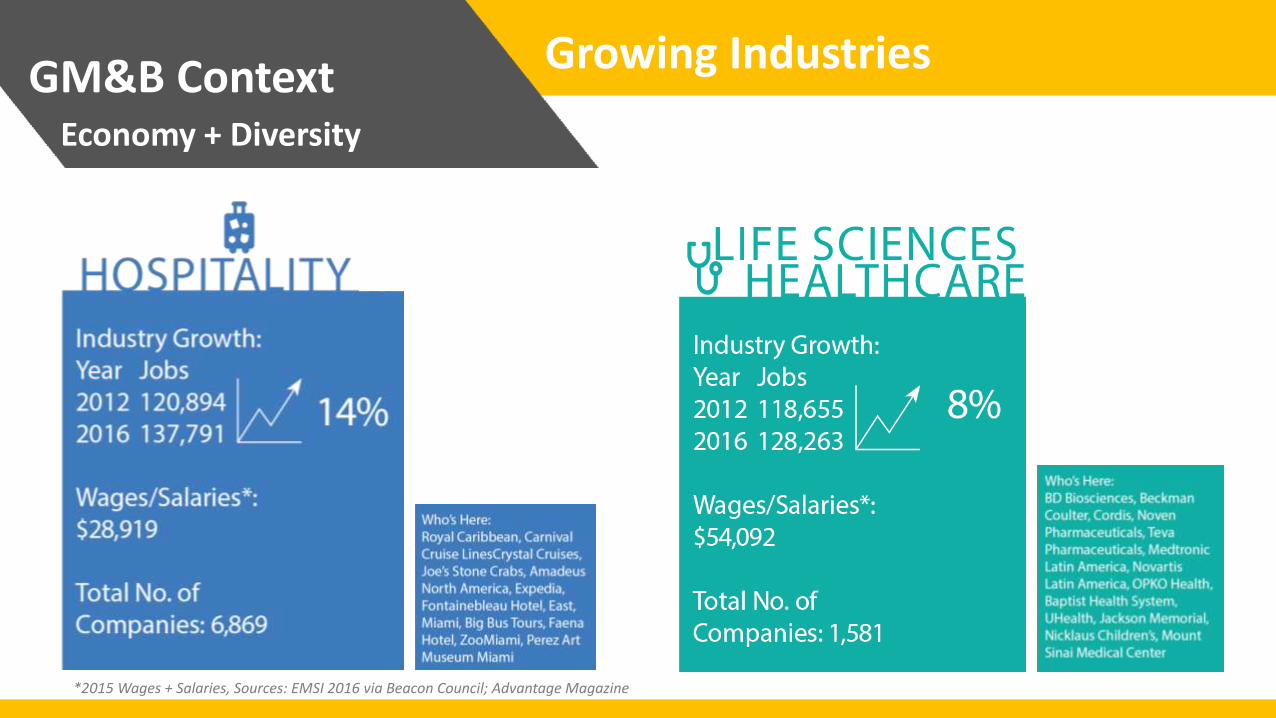
GM&B Context
Growing Industries
Economy + Diversity
*2015 Wages + Salaries, Sources: EMSI 2016 via Beacon Council; Advantage Magazine
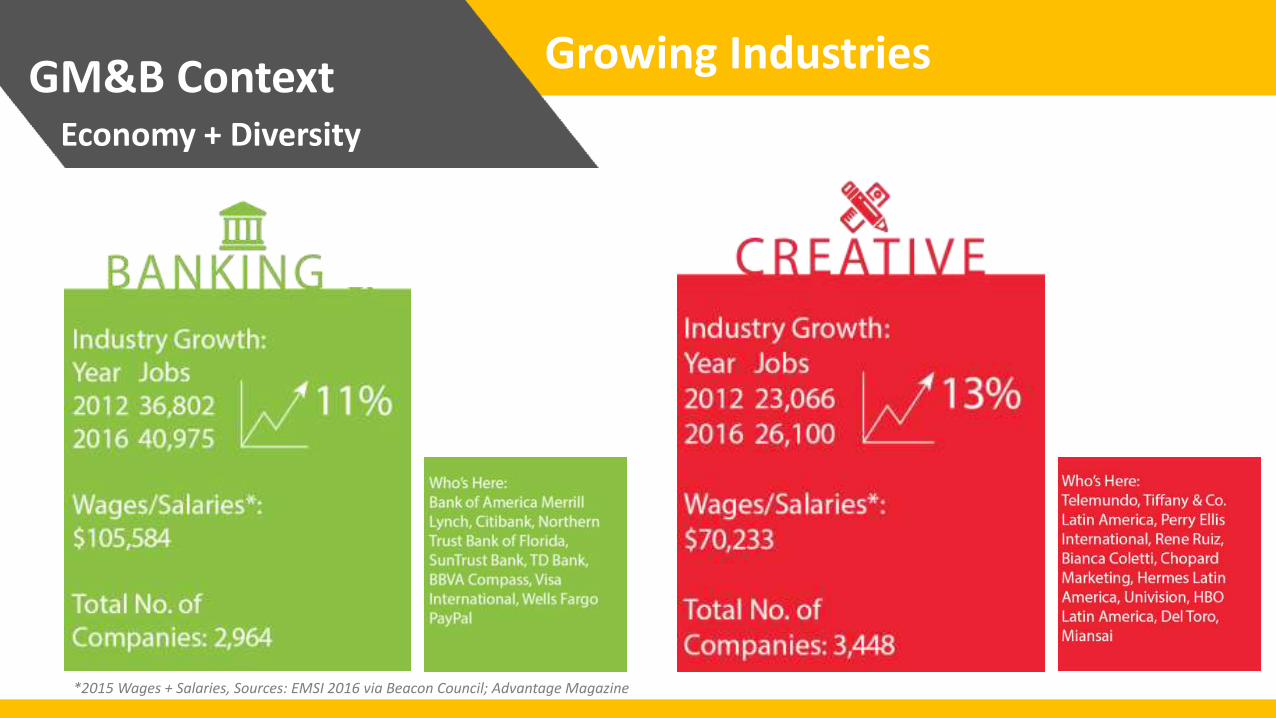
GM&B Context
Growing Industries
Economy + Diversity
*2015 Wages + Salaries, Sources: EMSI 2016 via Beacon Council; Advantage Magazine
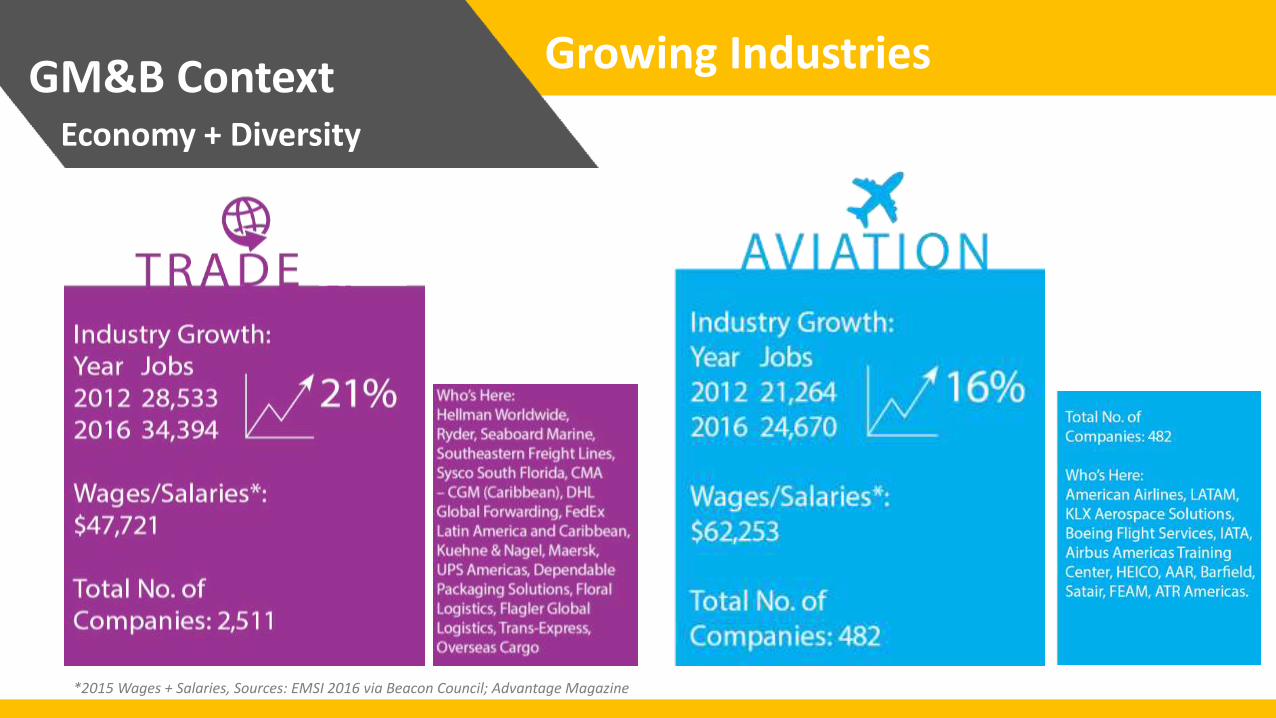
GM&B Context
Growing Industries
Economy + Diversity
*2015 Wages + Salaries, Sources: EMSI 2016 via Beacon Council; Advantage Magazine
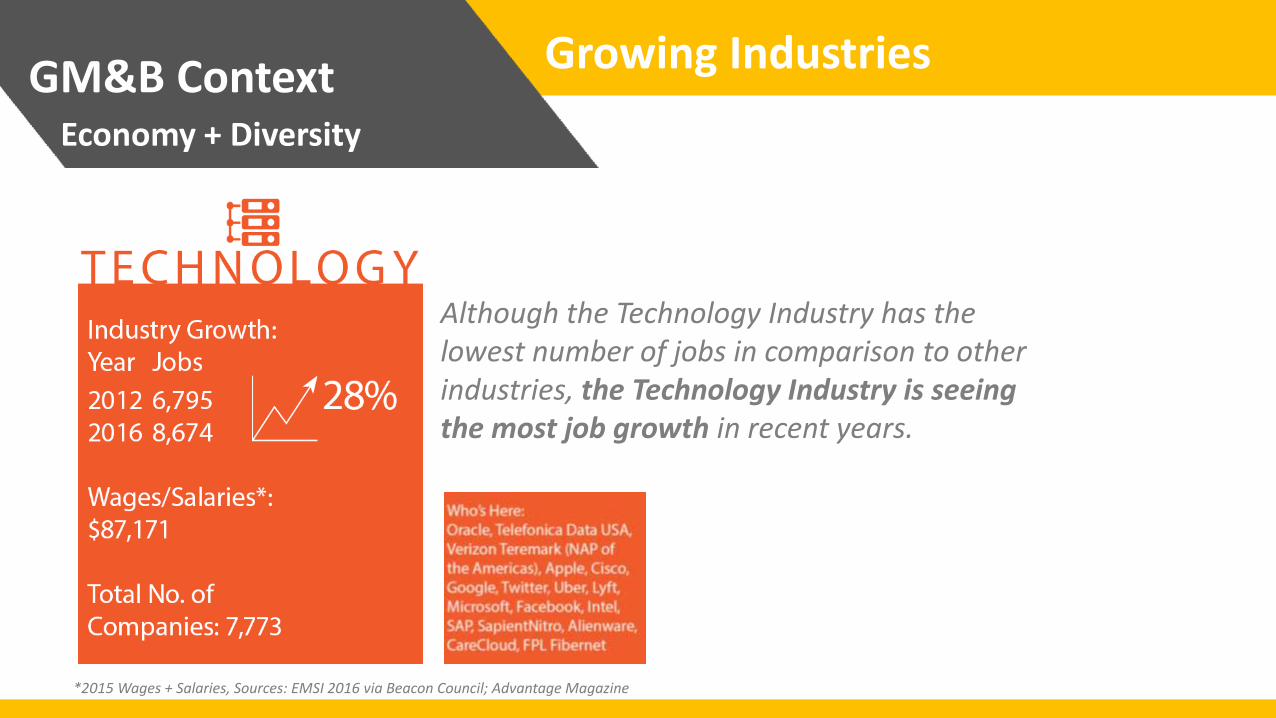
GM&B Context
Growing Industries
Economy + Diversity
Although the Technology Industry has the lowest number of jobs in comparison to other industries, the Technology Industry is seeing the most job growth in recent years.
*2015 Wages + Salaries, Sources: EMSI 2016 via Beacon Council; Advantage Magazine

Stakeholder Engagement
Stakeholder Engagement Introduction
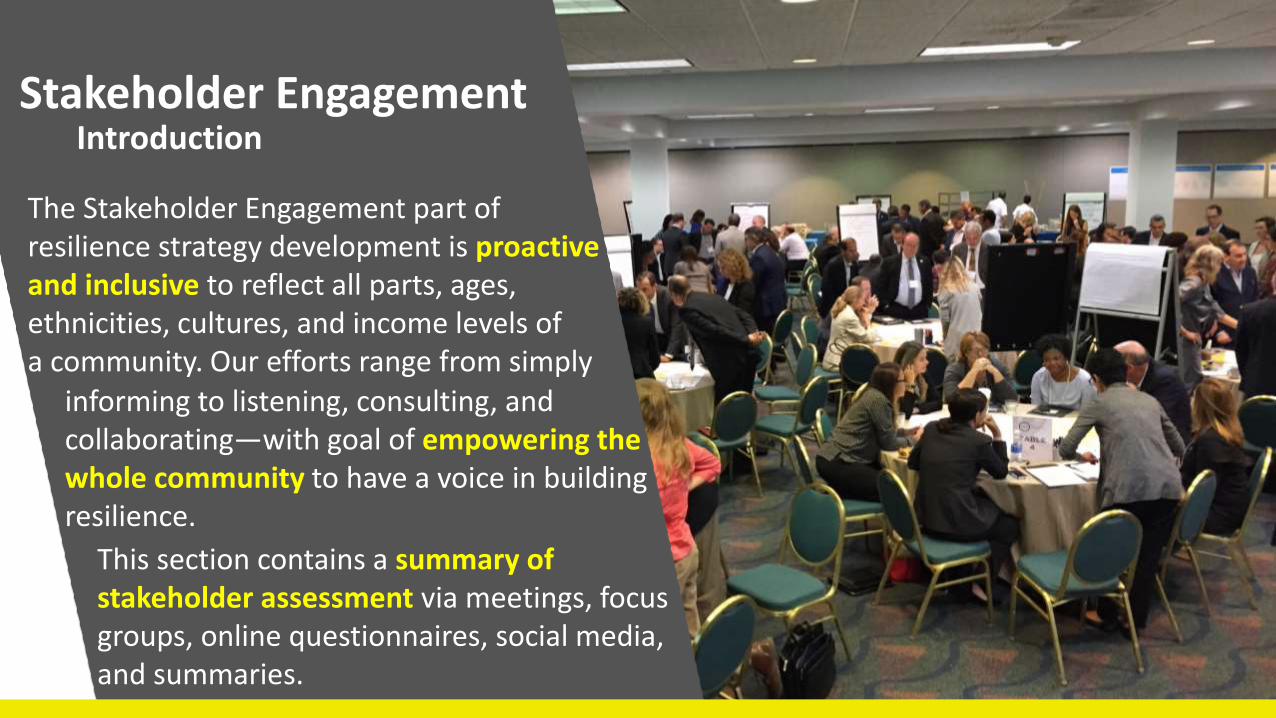
The Stakeholder Engagement part of resilience strategy development is proactive and inclusive to reflect all parts, ages, ethnicities, cultures, and income levels of a community. Our efforts range from simply
This section contains a summary of stakeholder assessment via meetings, focus groups, online questionnaires, social media, and summaries.
informing to listening, consulting, and collaborating—with goal of empowering the whole community to have a voice in building resilience.
Stakeholder Engagement
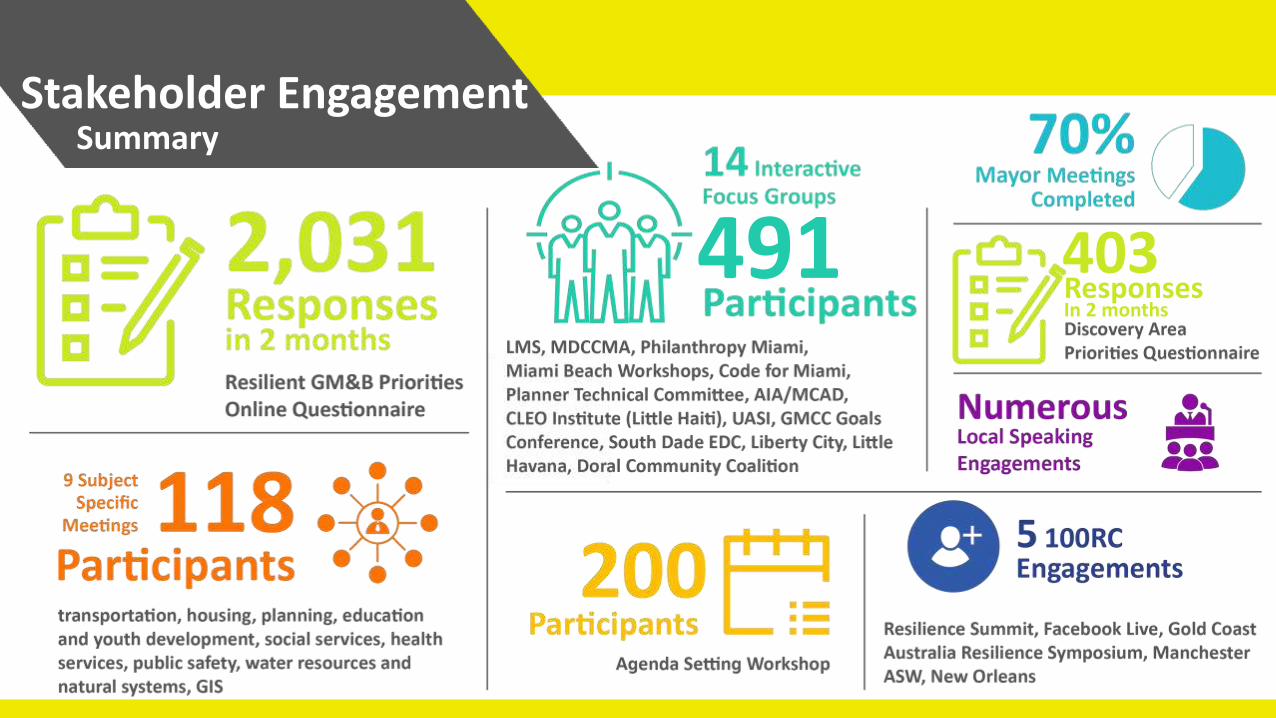
491 403
Summary
Responses In 2 months
Stakeholder Engagement
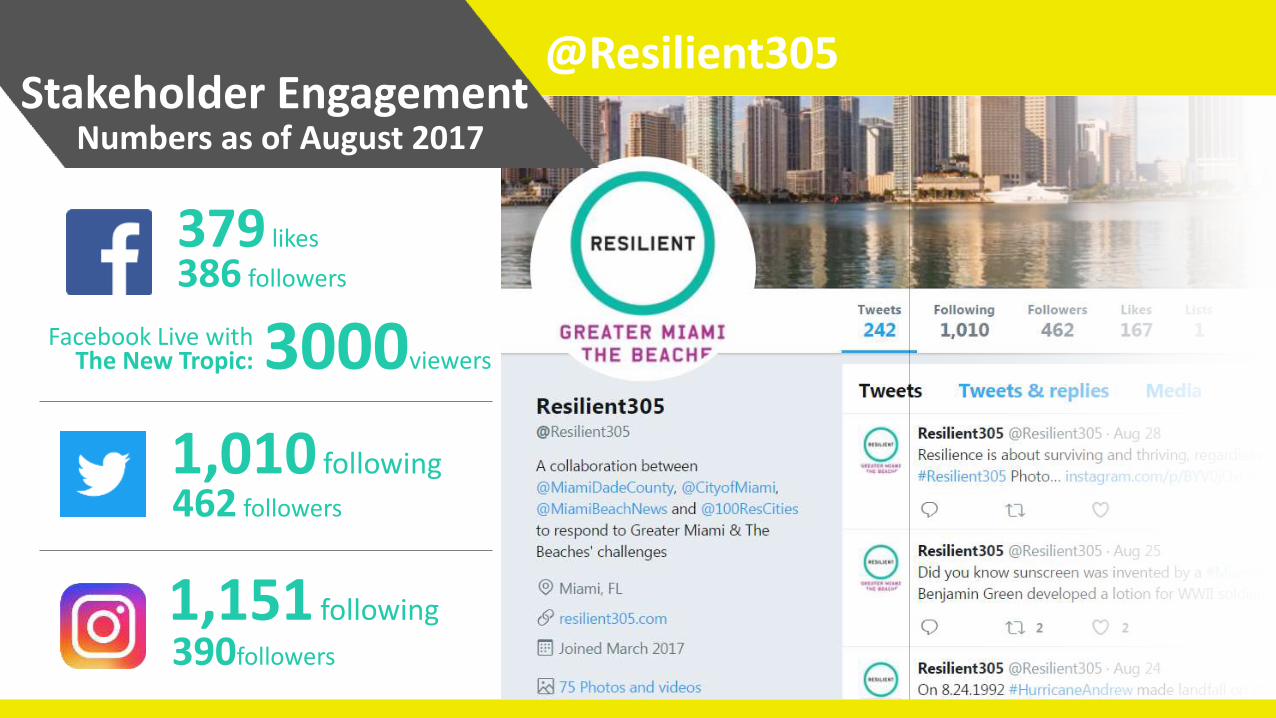
@Resilient305
379 likes
Facebook Live with The New Tropic:
390followers
1,151 following
3000viewers
1,010 following
462 followers
386 followers
Numbers as of August 2017
Stakeholder Engagement
Key Issue Topics
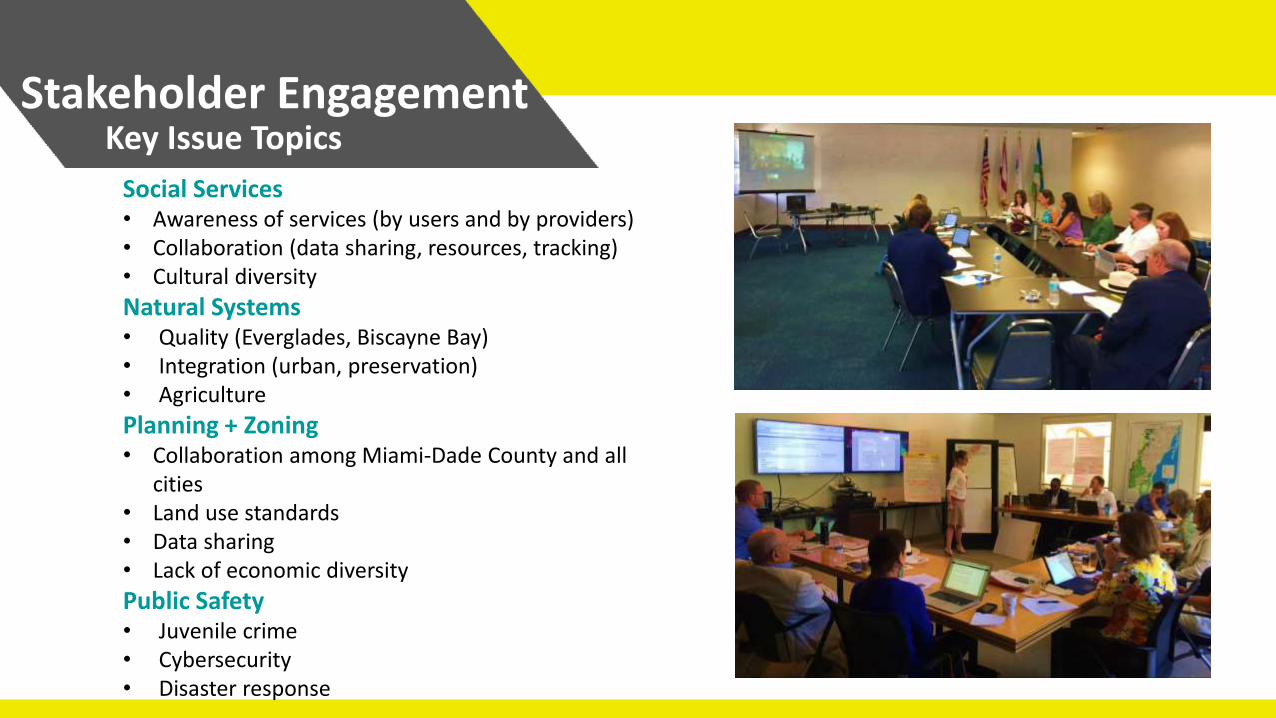
Social Services • Awareness of services (by users and by providers) • Collaboration (data sharing, resources, tracking) • Cultural diversity
Natural Systems • Quality (Everglades, Biscayne Bay) • Integration (urban, preservation) • Agriculture
Planning + Zoning • Collaboration among Miami-Dade County and all
cities • Land use standards • Data sharing • Lack of economic diversity
Public Safety • Juvenile crime • Cybersecurity • Disaster response
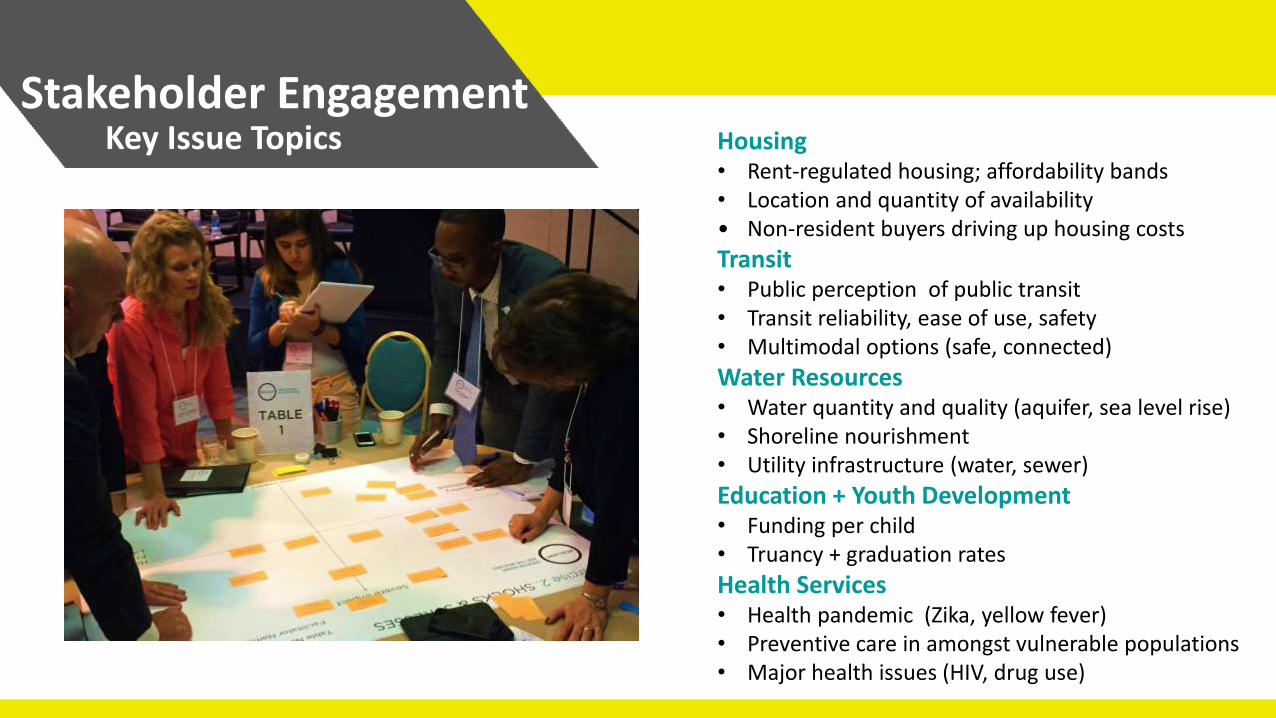
Stakeholder Engagement
Key Issue Topics Housing • Rent-regulated housing; affordability bands • Location and quantity of availability • Non-resident buyers driving up housing costs
Transit • Public perception of public transit • Transit reliability, ease of use, safety • Multimodal options (safe, connected)
Water Resources • Water quantity and quality (aquifer, sea level rise) • Shoreline nourishment • Utility infrastructure (water, sewer)
Education + Youth Development • Funding per child • Truancy + graduation rates
Health Services • Health pandemic (Zika, yellow fever) • Preventive care in amongst vulnerable populations • Major health issues (HIV, drug use)
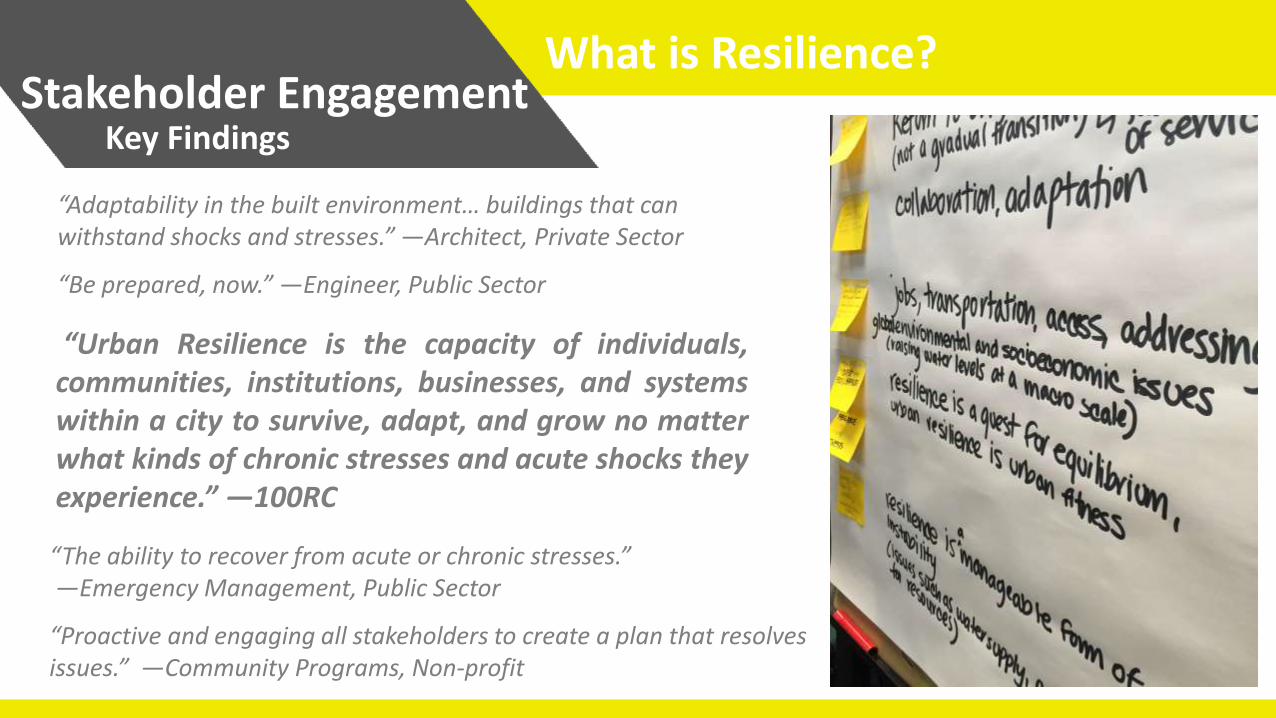
Stakeholder Engagement
What is Resilience?
Key Findings
“Adaptability in the built environment… buildings that can withstand shocks and stresses.” —Architect, Private Sector
“Be prepared, now.” —Engineer, Public Sector
“The ability to recover from acute or chronic stresses.” —Emergency Management, Public Sector
“Proactive and engaging all stakeholders to create a plan that resolves issues.” —Community Programs, Non-profit
“Urban Resilience is the capacity of individuals, communities, institutions, businesses, and systems within a city to survive, adapt, and grow no matter what kinds of chronic stresses and acute shocks they experience.” —100RC
Innovative Infrastructure
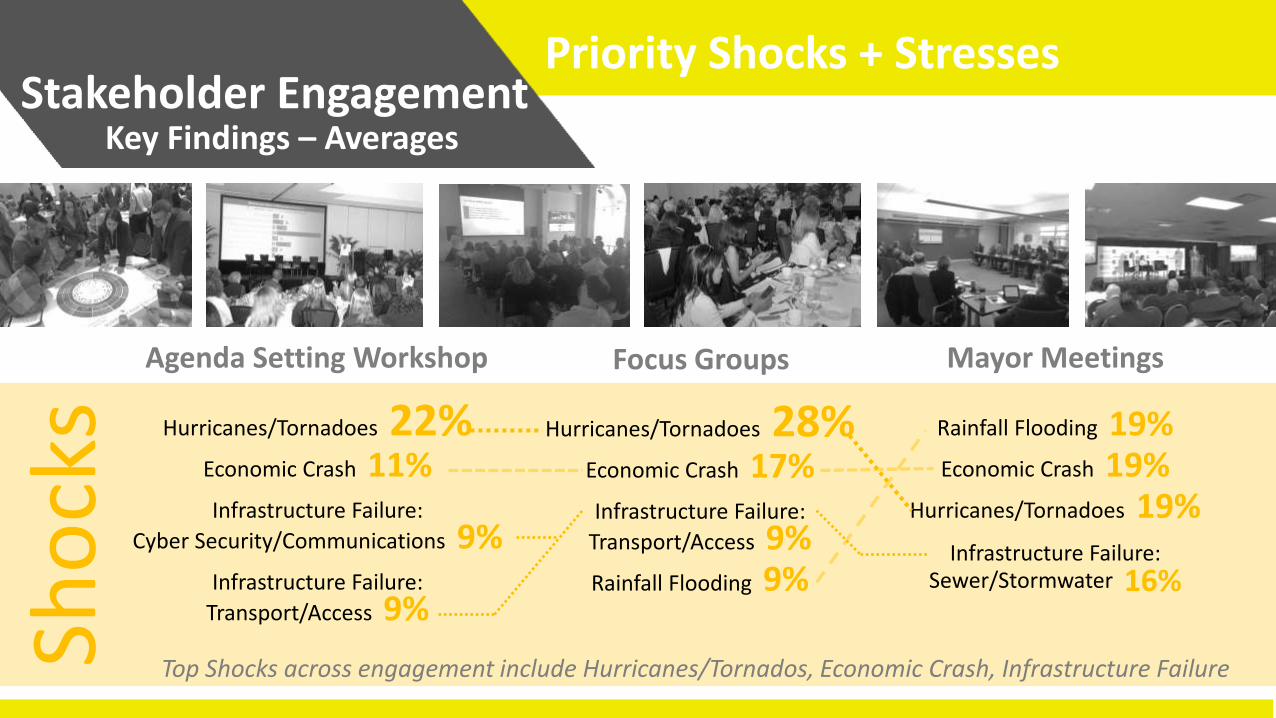
Stakeholder Engagement
Priority Shocks + Stresses
Key Findings – Averages
Agenda Setting Workshop Mayor Meetings
Hurricanes/Tornadoes 22% Economic Crash 11% Infrastructure Failure:
Cyber Security/Communications 9% Infrastructure Failure:
Transport/Access 9%
Hurricanes/Tornadoes 28% Economic Crash 17% Infrastructure Failure:
Transport/Access 9% Rainfall Flooding 9%
Rainfall Flooding 19% Economic Crash 19%
Hurricanes/Tornadoes 19% Infrastructure Failure:
Sewer/Stormwater 16%
Sho
cks
Focus Groups
Top Shocks across engagement include Hurricanes/Tornados, Economic Crash, Infrastructure Failure
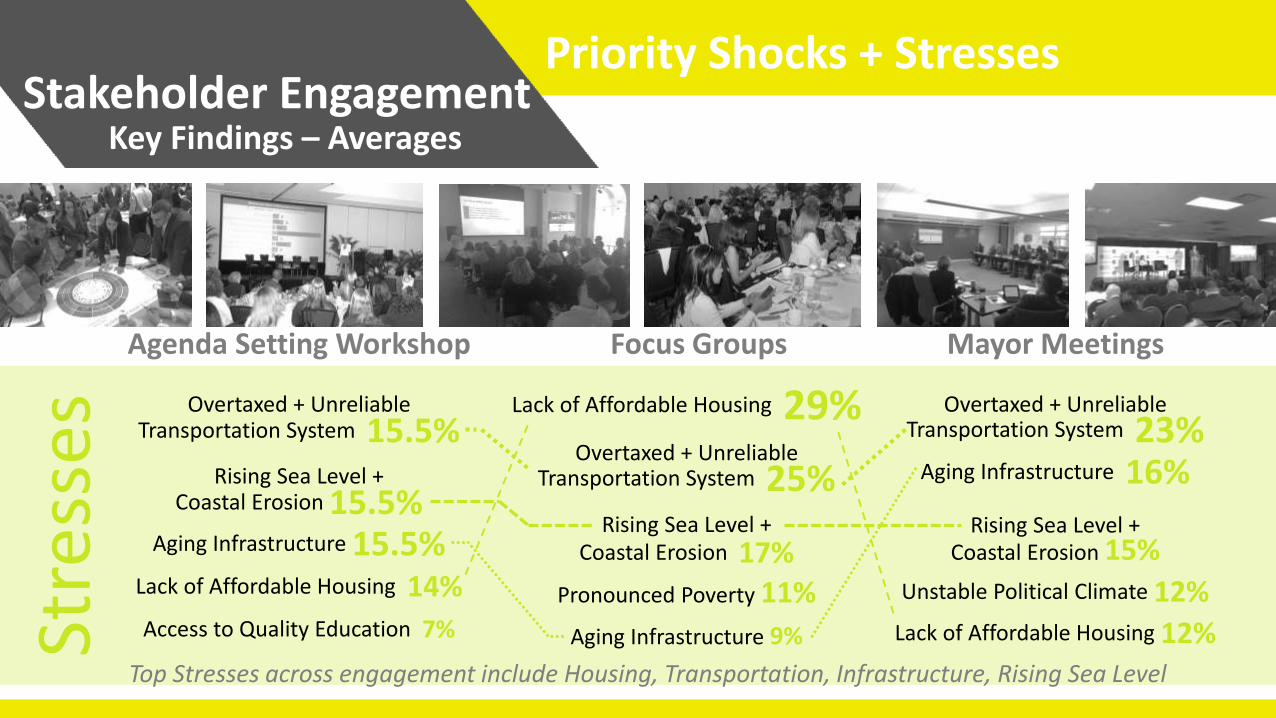
Stakeholder Engagement
Priority Shocks + Stresses
Key Findings – Averages
Agenda Setting Workshop Focus Groups Mayor Meetings
Overtaxed + Unreliable Transportation System 15.5%
Rising Sea Level + Coastal Erosion 15.5%
Aging Infrastructure 15.5% Lack of Affordable Housing 14%
Access to Quality Education 7%
Lack of Affordable Housing 29% Overtaxed + Unreliable
Transportation System 25% Rising Sea Level +
Coastal Erosion 17%
Pronounced Poverty 11%
Aging Infrastructure 9%
Overtaxed + Unreliable Transportation System 23%
Aging Infrastructure 16%
Rising Sea Level + Coastal Erosion 15%
Unstable Political Climate 12% Lack of Affordable Housing 12%
Stre
sses
Top Stresses across engagement include Housing, Transportation, Infrastructure, Rising Sea Level
Innovative Infrastructure
Stakeholder Engagement
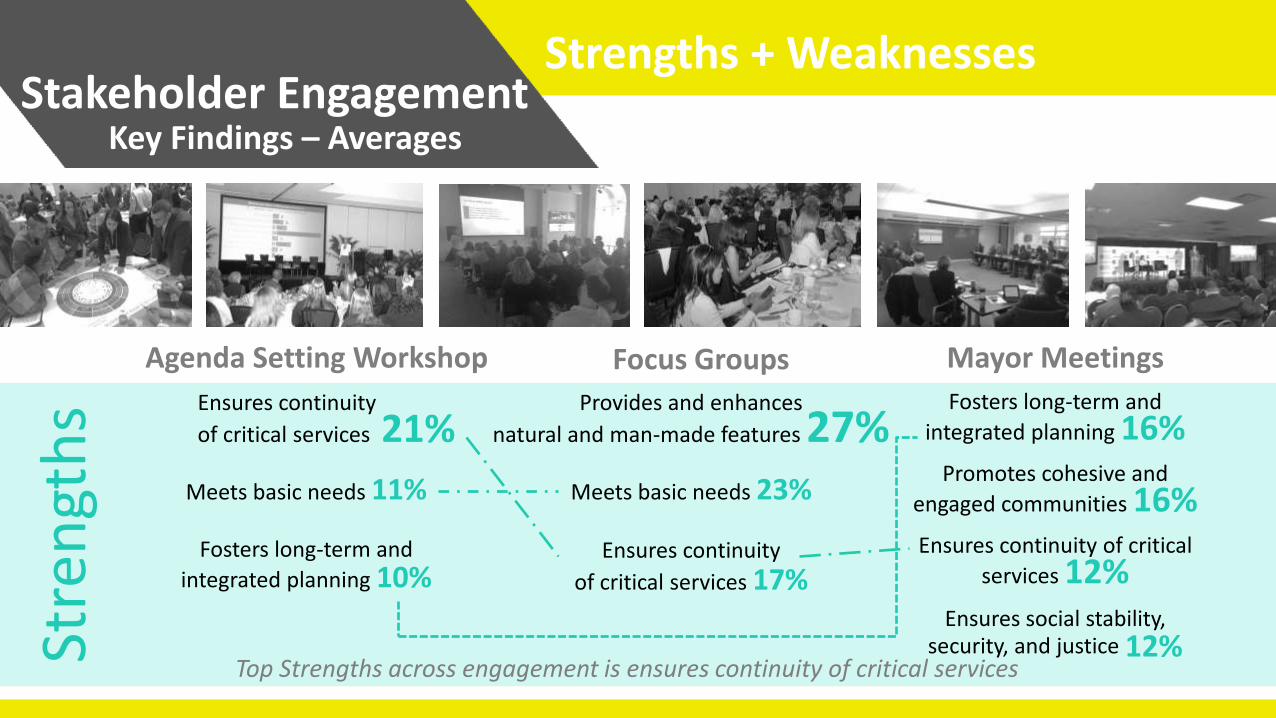
Strengths + Weaknesses
Key Findings – Averages
Agenda Setting Workshop Mayor Meetings
Ensures continuity
of critical services 21%
Meets basic needs 11%
Fosters long-term and
integrated planning 10%
Fosters long-term and
integrated planning 16% Promotes cohesive and
engaged communities 16% Ensures continuity of critical
services 12% Ensures social stability,
security, and justice 12% Stre
ngt
hs
Focus Groups
Provides and enhances
natural and man-made features 27% Meets basic needs 23%
Ensures continuity
of critical services 17%
Top Strengths across engagement is ensures continuity of critical services
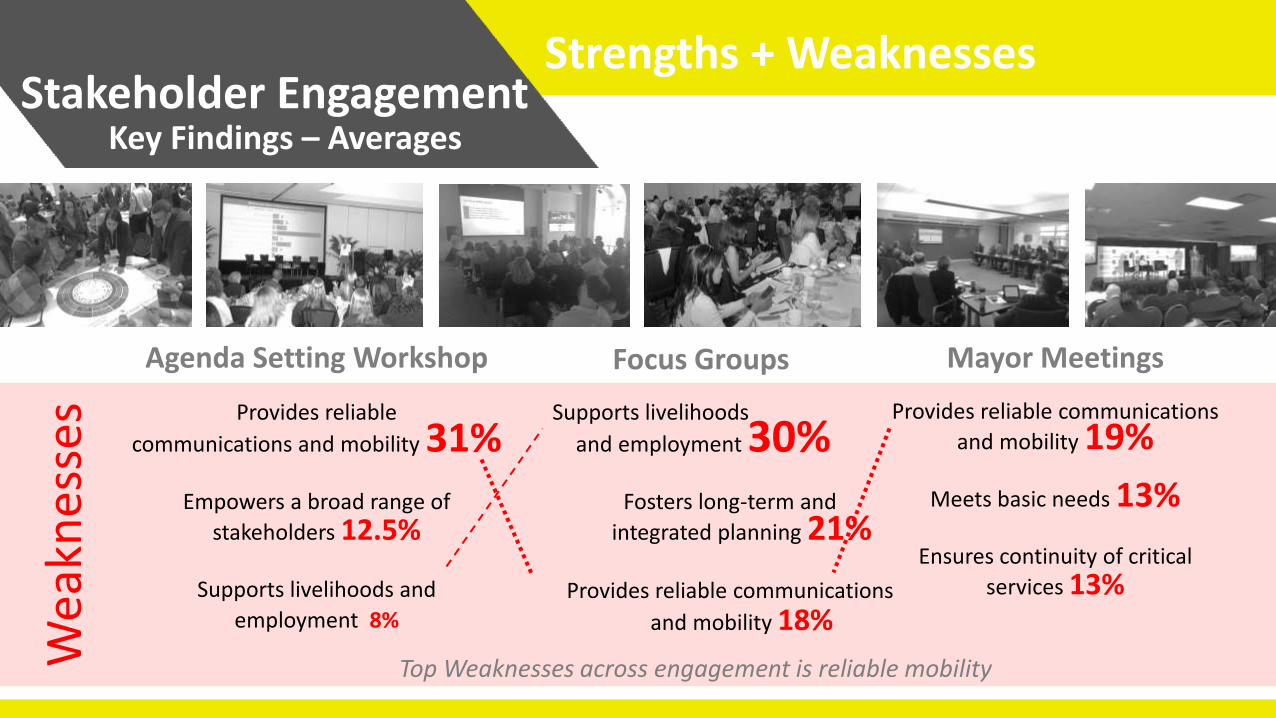
Stakeholder Engagement
Strengths + Weaknesses
Key Findings – Averages
Agenda Setting Workshop Mayor Meetings
Provides reliable
communications and mobility 31%
Empowers a broad range of
stakeholders 12.5%
Supports livelihoods and
employment 8%
Provides reliable communications
and mobility 19%
Meets basic needs 13%
Ensures continuity of critical
services 13%
Wea
knes
ses
Focus Groups
Supports livelihoods
and employment 30% Fosters long-term and
integrated planning 21%
Provides reliable communications
and mobility 18%
Top Weaknesses across engagement is reliable mobility
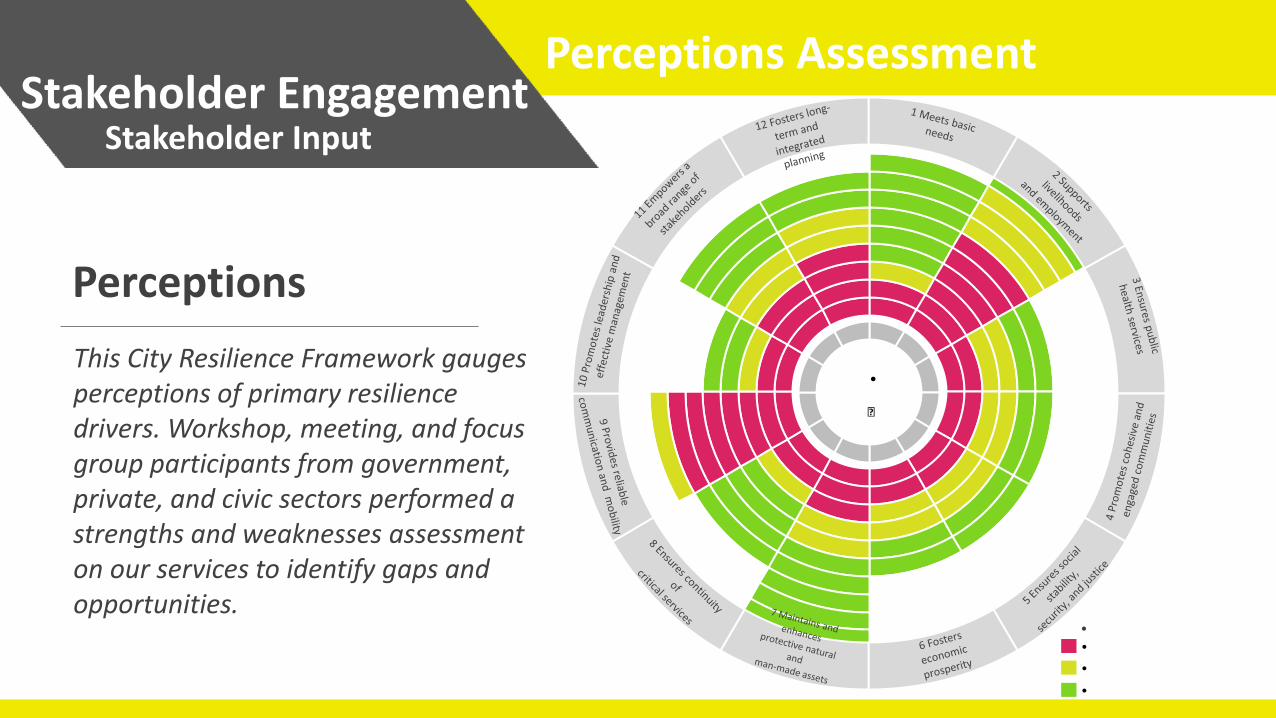
Stakeholder Engagement
Perceptions Assessment
Stakeholder Input
This City Resilience Framework gauges perceptions of primary resilience drivers. Workshop, meeting, and focus group participants from government, private, and civic sectors performed a strengths and weaknesses assessment on our services to identify gaps and opportunities.
Perceptions
•
•
•
•
•
•
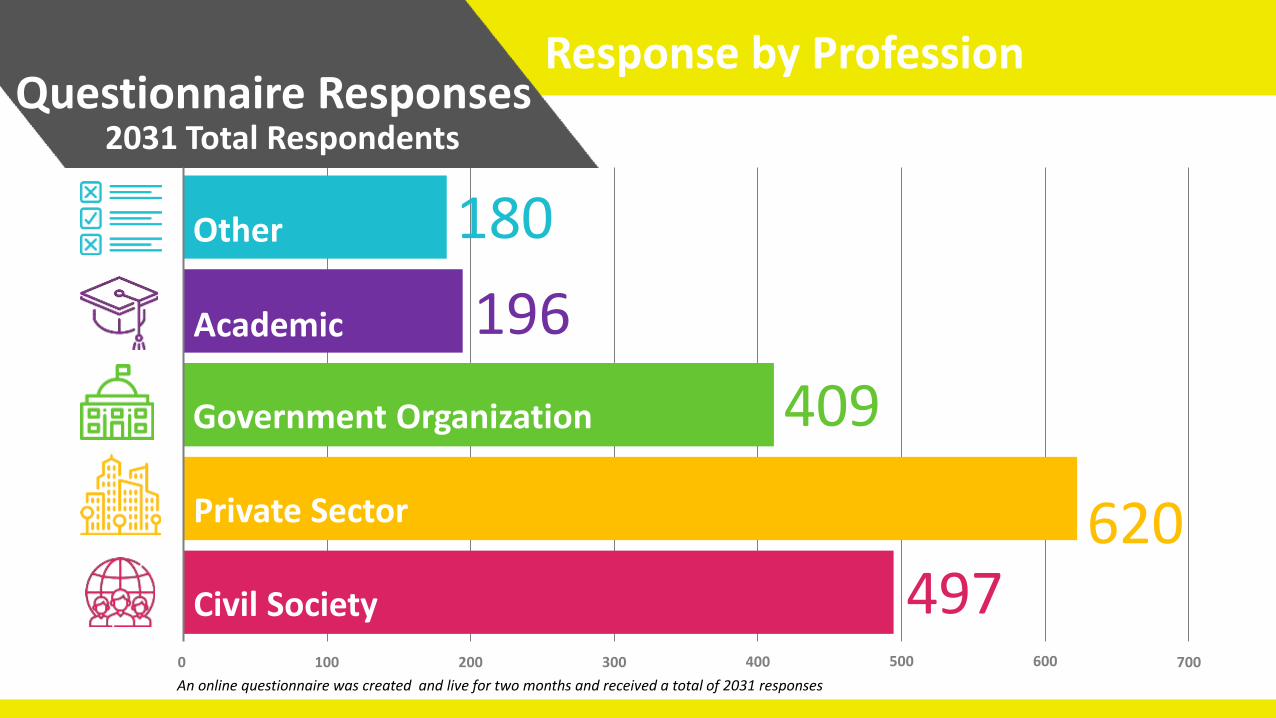
Questionnaire Responses Response by Profession
2031 Total Respondents
100 200 300 600 700 0
Other 180
Academic 196
Government Organization 409
Private Sector 620 Civil Society 497
400 500
An online questionnaire was created and live for two months and received a total of 2031 responses
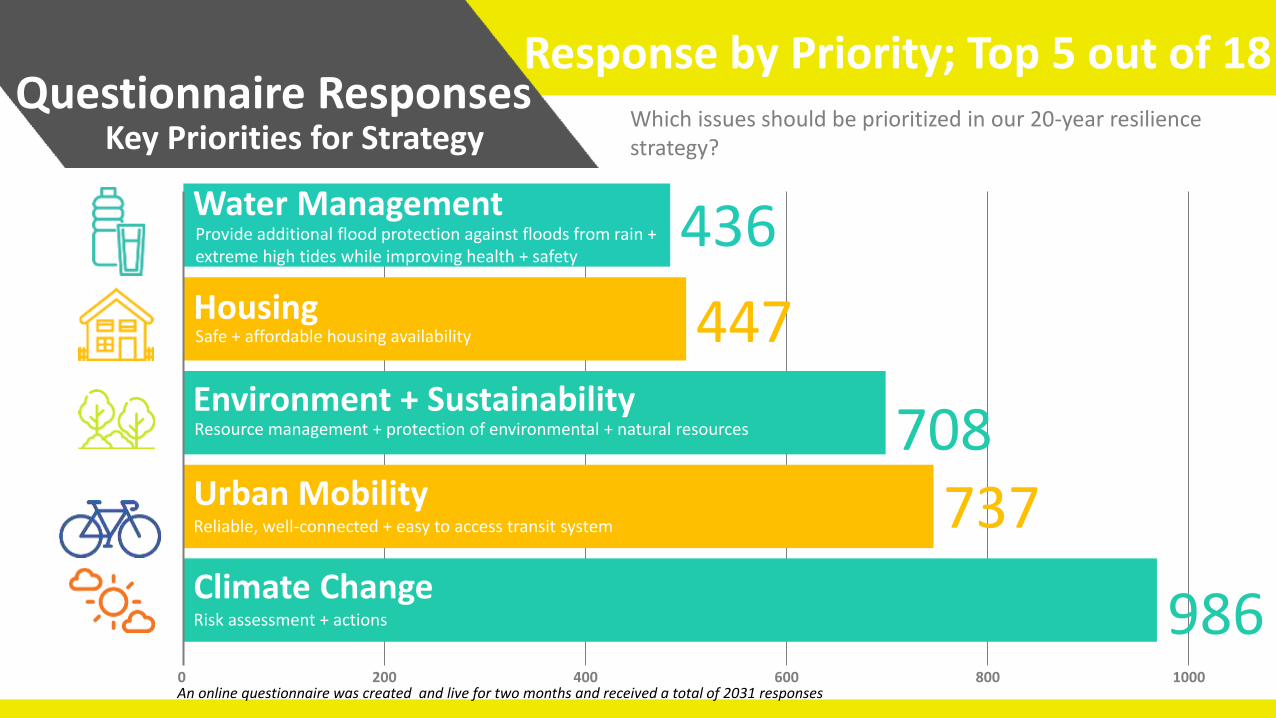
Questionnaire Responses Response by Priority; Top 5 out of 18
Key Priorities for Strategy
200 400 600 800 1000 0
Water Management 436 Housing 447 Environment + Sustainability
708 Urban Mobility Reliable, well-connected + easy to access transit system 737 Climate Change Risk assessment + actions 986
Provide additional flood protection against floods from rain + extreme high tides while improving health + safety
Safe + affordable housing availability
Resource management + protection of environmental + natural resources
An online questionnaire was created and live for two months and received a total of 2031 responses
Which issues should be prioritized in our 20-year resilience strategy?
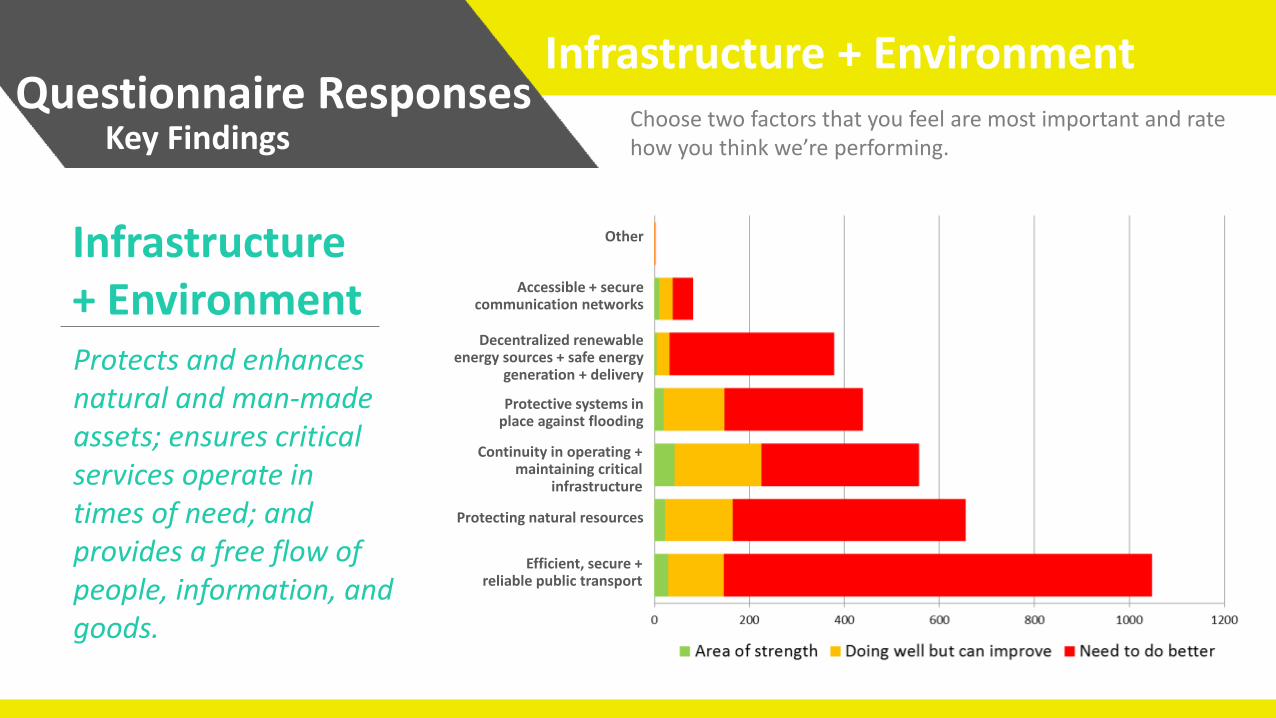
Other
Accessible + secure communication networks
Decentralized renewable energy sources + safe energy
generation + delivery
Protective systems in place against flooding
Continuity in operating + maintaining critical
infrastructure
Protecting natural resources
Efficient, secure + reliable public transport
Questionnaire Responses Infrastructure + Environment
Key Findings
Protects and enhances natural and man-made assets; ensures critical services operate in times of need; and provides a free flow of people, information, and goods.
Infrastructure + Environment
Choose two factors that you feel are most important and rate how you think we’re performing.
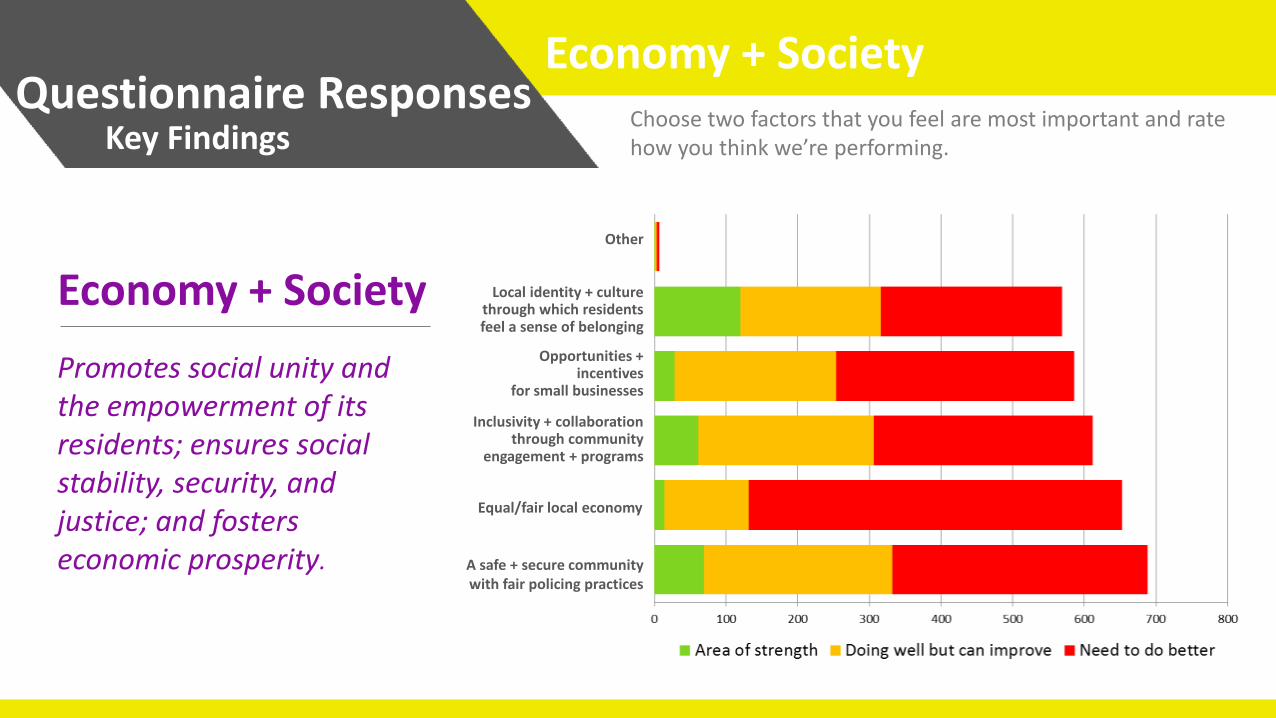
Other
Local identity + culture through which residents feel a sense of belonging
Opportunities + incentives
for small businesses
Inclusivity + collaboration through community
engagement + programs
Equal/fair local economy
A safe + secure community with fair policing practices
Questionnaire Responses Economy + Society
Key Findings
Promotes social unity and the empowerment of its residents; ensures social stability, security, and justice; and fosters economic prosperity.
Economy + Society
Choose two factors that you feel are most important and rate how you think we’re performing.
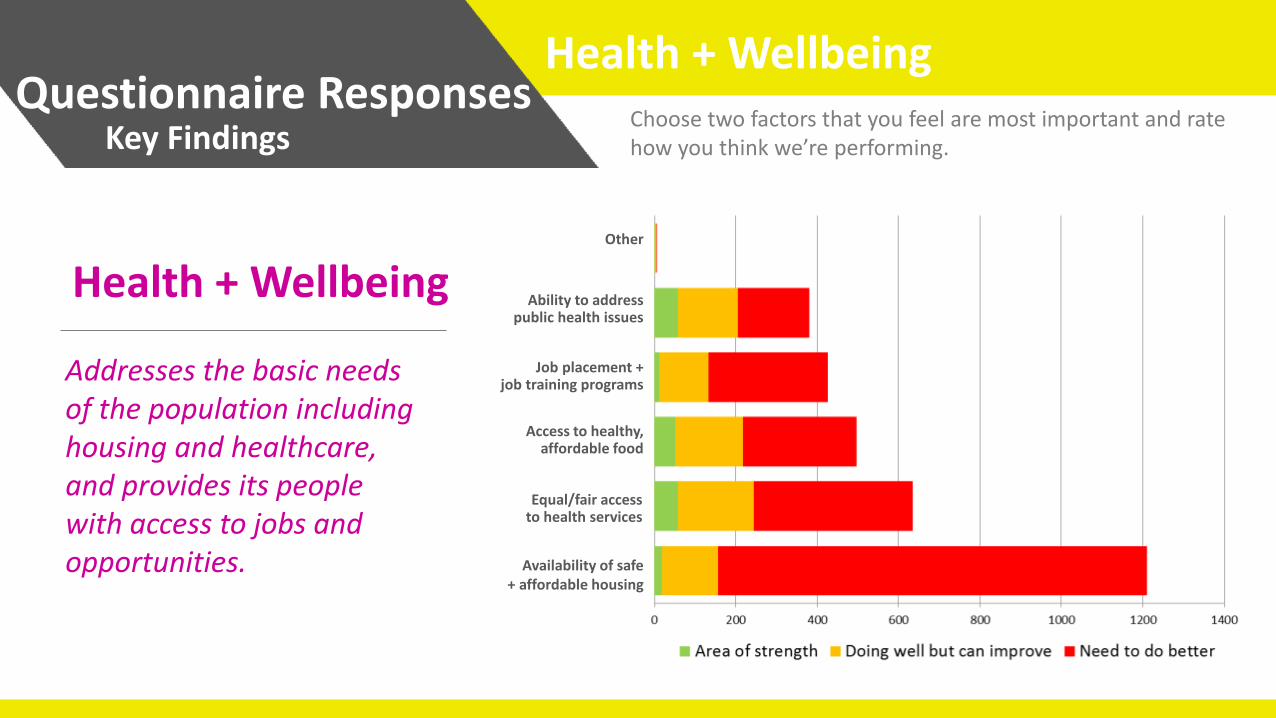
Other
Ability to address public health issues
Job placement + job training programs
Access to healthy, affordable food
Equal/fair access to health services
Availability of safe + affordable housing
Questionnaire Responses Health + Wellbeing
Key Findings
Addresses the basic needs of the population including housing and healthcare, and provides its people with access to jobs and opportunities.
Health + Wellbeing
Choose two factors that you feel are most important and rate how you think we’re performing.
Other
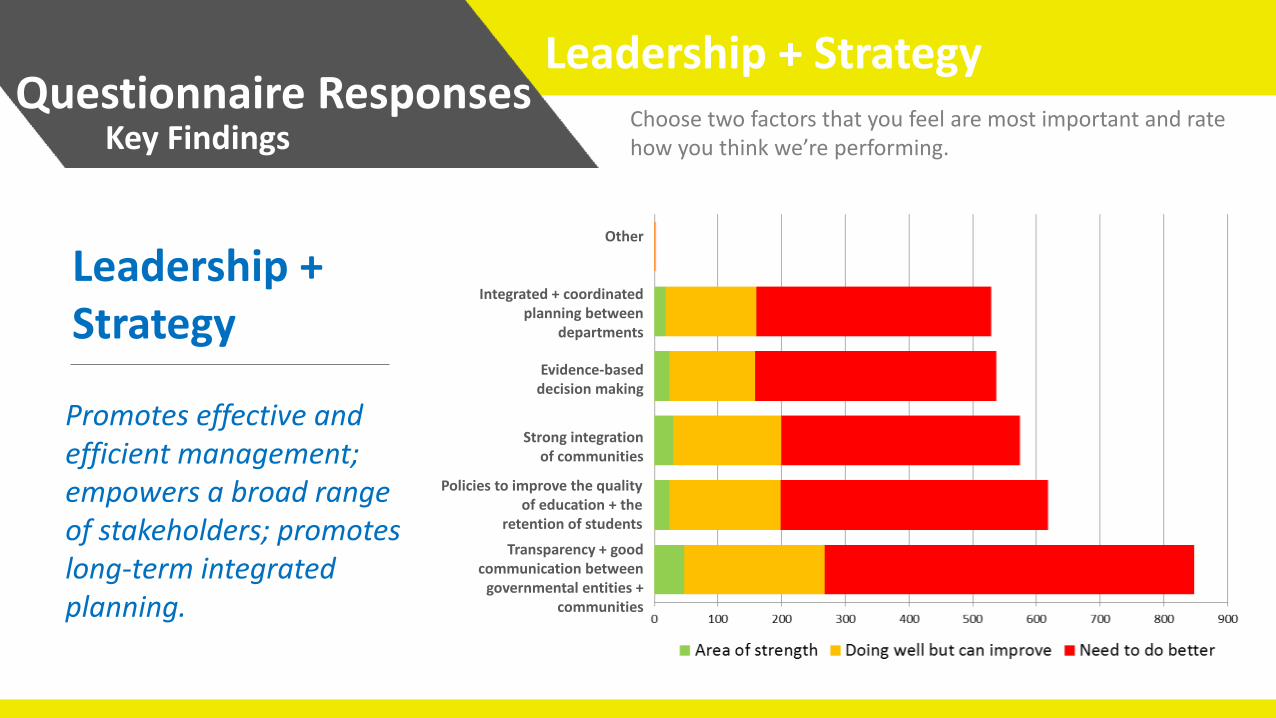
Integrated + coordinated planning between
departments
Evidence-based decision making
Strong integration of communities
Policies to improve the quality of education + the
retention of students
Transparency + good communication between
governmental entities + communities
Promotes effective and efficient management; empowers a broad range of stakeholders; promotes long-term integrated planning.
Leadership + Strategy
Questionnaire Responses Leadership + Strategy
Key Findings Choose two factors that you feel are most important and rate how you think we’re performing.
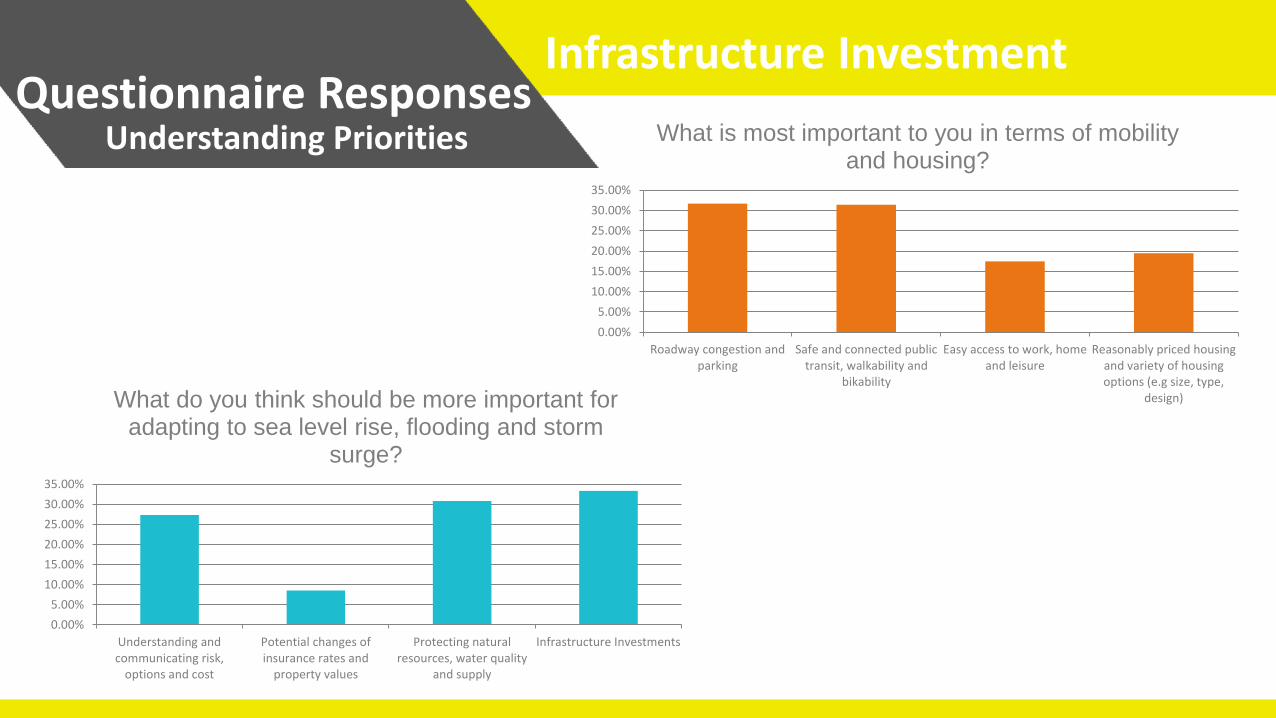
Questionnaire Responses Infrastructure Investment
Understanding Priorities
Understanding andcommunicating risk,
options and cost
Potential changes ofinsurance rates and
property values
Protecting naturalresources, water quality
and supply
Infrastructure Investments
0.00%
5.00%
10.00%
15.00%
20.00%
25.00%
30.00%
35.00%
What do you think should be more important for adapting to sea level rise, flooding and storm
surge?
Roadway congestion andparking
Safe and connected publictransit, walkability and
bikability
Easy access to work, homeand leisure
Reasonably priced housingand variety of housingoptions (e.g size, type,
design)
0.00%
5.00%
10.00%
15.00%
20.00%
25.00%
30.00%
35.00%
What is most important to you in terms of mobility and housing?
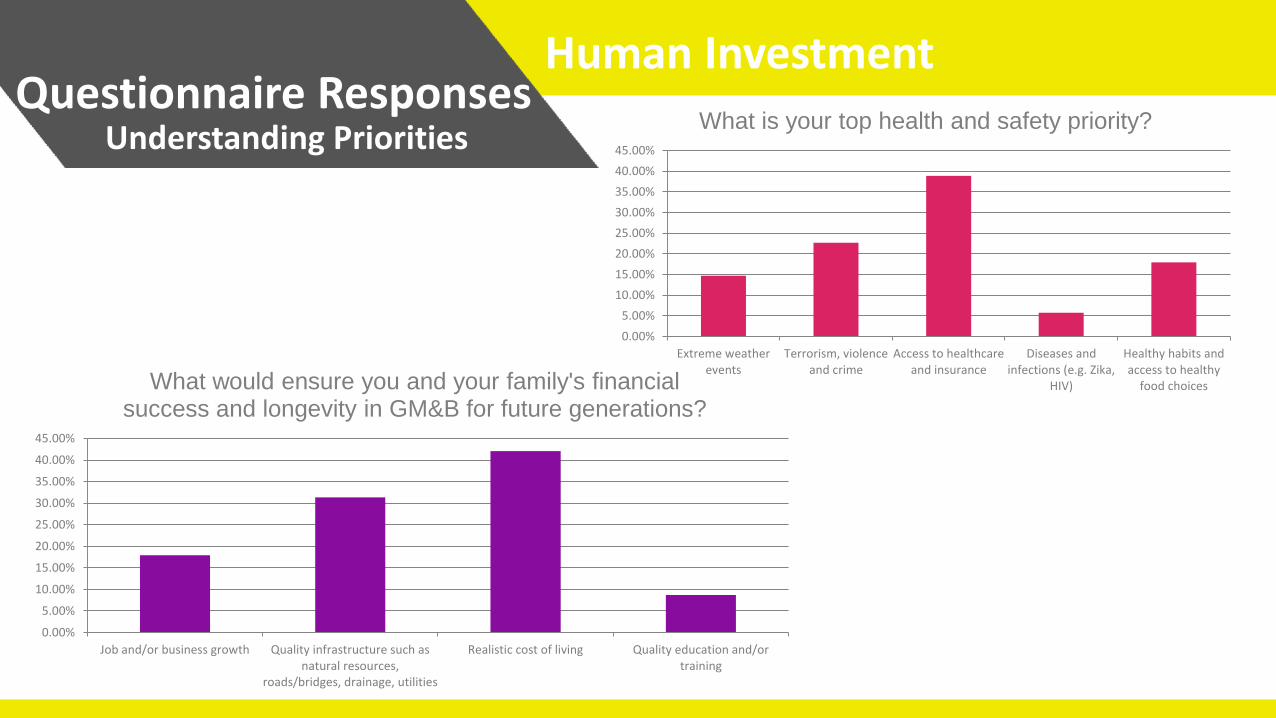
Questionnaire Responses Human Investment
Understanding Priorities
Job and/or business growth Quality infrastructure such asnatural resources,
roads/bridges, drainage, utilities
Realistic cost of living Quality education and/ortraining
0.00%
5.00%
10.00%
15.00%
20.00%
25.00%
30.00%
35.00%
40.00%
45.00%
What would ensure you and your family's financial success and longevity in GM&B for future generations?
Extreme weatherevents
Terrorism, violenceand crime
Access to healthcareand insurance
Diseases andinfections (e.g. Zika,
HIV)
Healthy habits andaccess to healthy
food choices
0.00%
5.00%
10.00%
15.00%
20.00%
25.00%
30.00%
35.00%
40.00%
45.00%
What is your top health and safety priority?
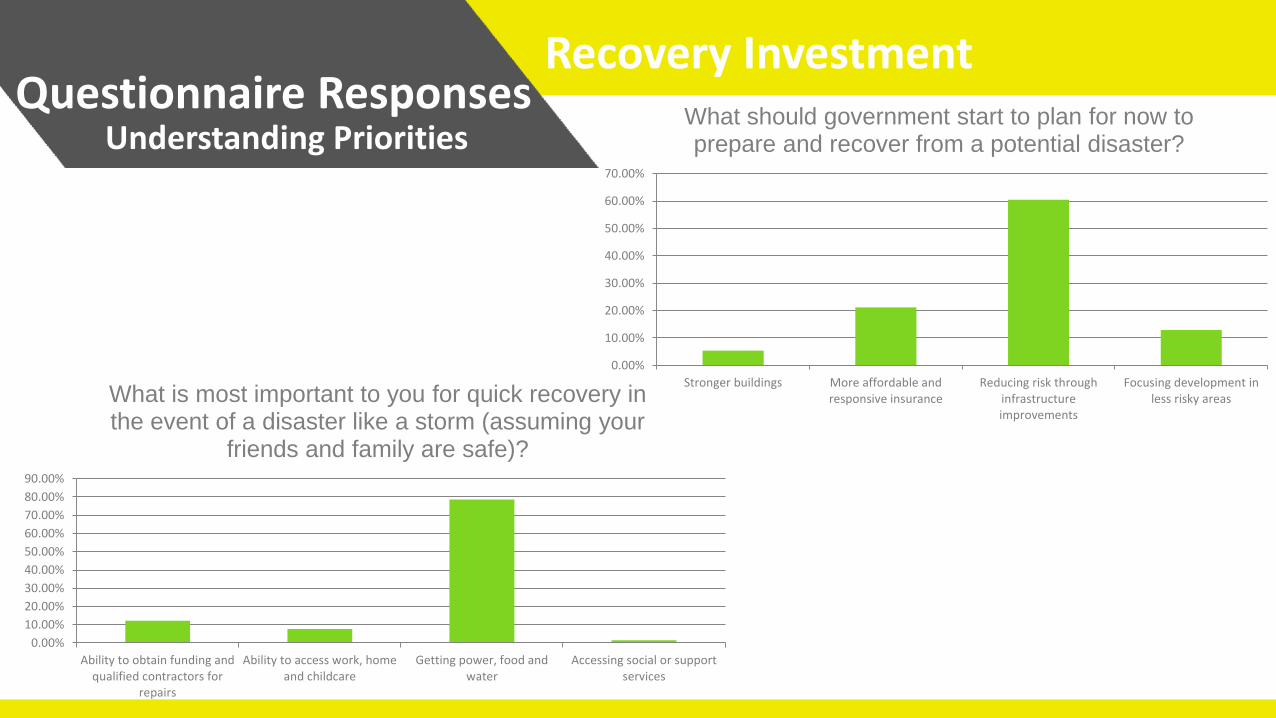
Questionnaire Responses Recovery Investment
Understanding Priorities
Ability to obtain funding andqualified contractors for
repairs
Ability to access work, homeand childcare
Getting power, food andwater
Accessing social or supportservices
0.00%
10.00%
20.00%
30.00%
40.00%
50.00%
60.00%
70.00%
80.00%
90.00%
What is most important to you for quick recovery in the event of a disaster like a storm (assuming your
friends and family are safe)?
Stronger buildings More affordable andresponsive insurance
Reducing risk throughinfrastructureimprovements
Focusing development inless risky areas
0.00%
10.00%
20.00%
30.00%
40.00%
50.00%
60.00%
70.00%
What should government start to plan for now to prepare and recover from a potential disaster?
Questionnaire Responses Collaborative Investment
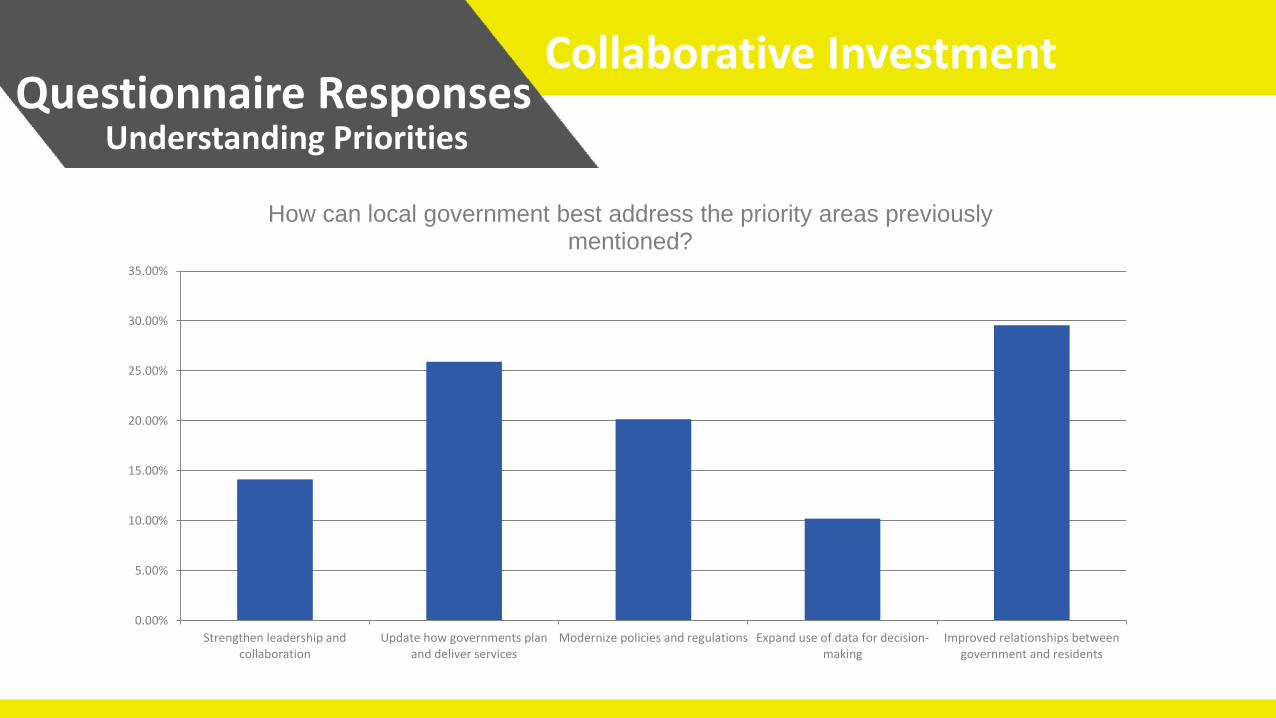
Understanding Priorities
Strengthen leadership andcollaboration
Update how governments planand deliver services
Modernize policies and regulations Expand use of data for decision-making
Improved relationships betweengovernment and residents
0.00%
5.00%
10.00%
15.00%
20.00%
25.00%
30.00%
35.00%
How can local government best address the priority areas previously mentioned?
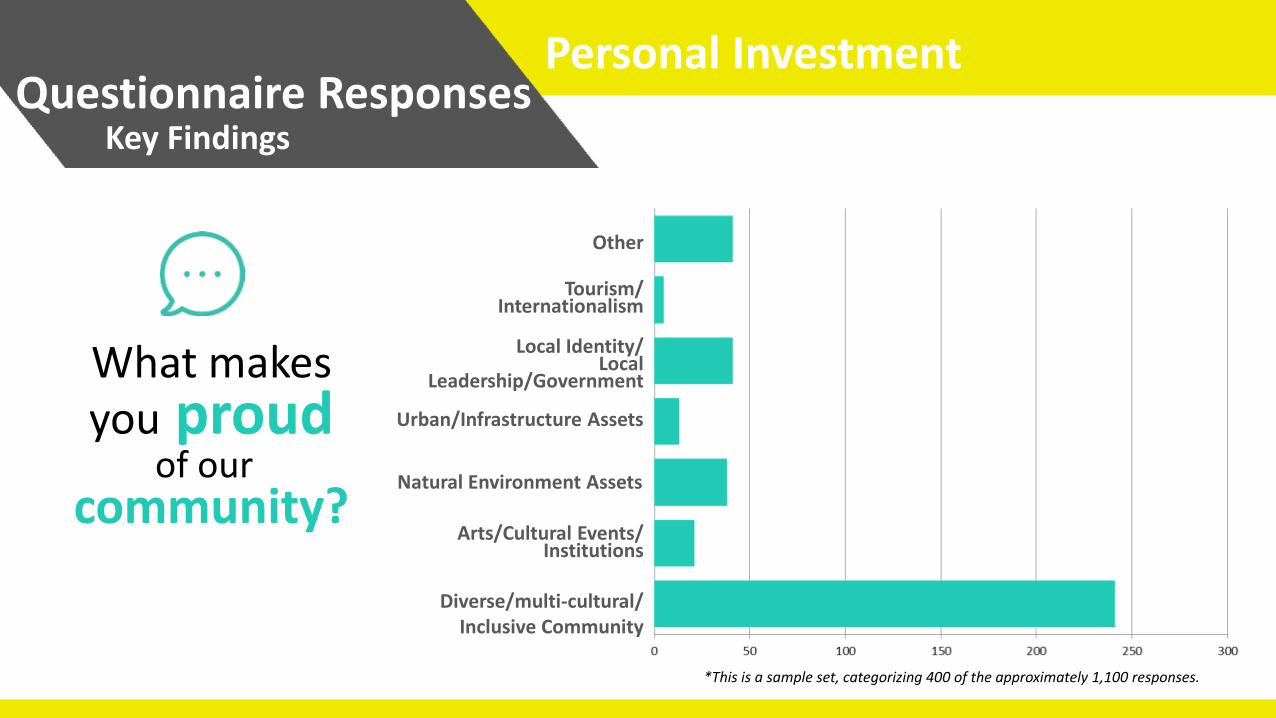
What makes
Other
Tourism/ Internationalism
Local Identity/ Local
Leadership/Government
Urban/Infrastructure Assets
Natural Environment Assets
Diverse/multi-cultural/ Inclusive Community
Arts/Cultural Events/ Institutions
*This is a sample set, categorizing 400 of the approximately 1,100 responses.
you proud
community? of our
Questionnaire Responses Personal Investment
Key Findings
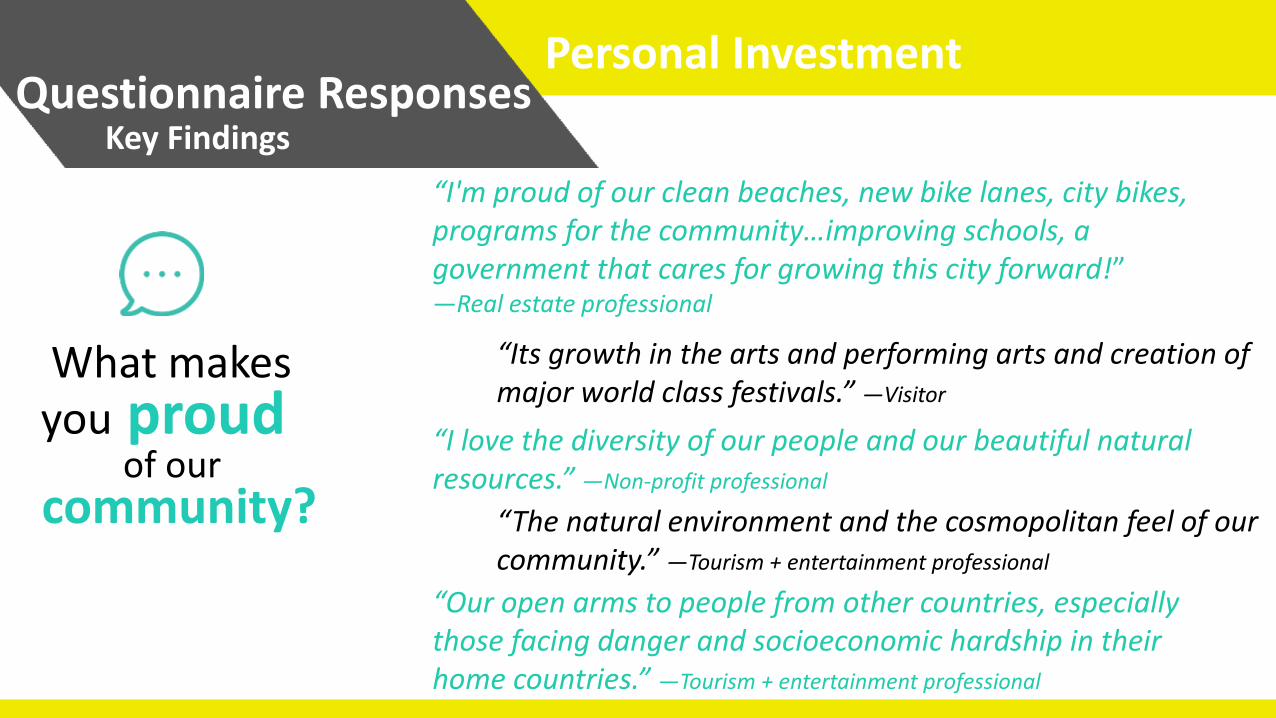
What makes you proud
community? of our
Questionnaire Responses Personal Investment
Key Findings
“I'm proud of our clean beaches, new bike lanes, city bikes, programs for the community…improving schools, a government that cares for growing this city forward!” —Real estate professional
“Its growth in the arts and performing arts and creation of major world class festivals.” —Visitor
“I love the diversity of our people and our beautiful natural resources.” —Non-profit professional
“The natural environment and the cosmopolitan feel of our community.” —Tourism + entertainment professional
“Our open arms to people from other countries, especially those facing danger and socioeconomic hardship in their home countries.” —Tourism + entertainment professional

Discovery Areas
Discovery Areas
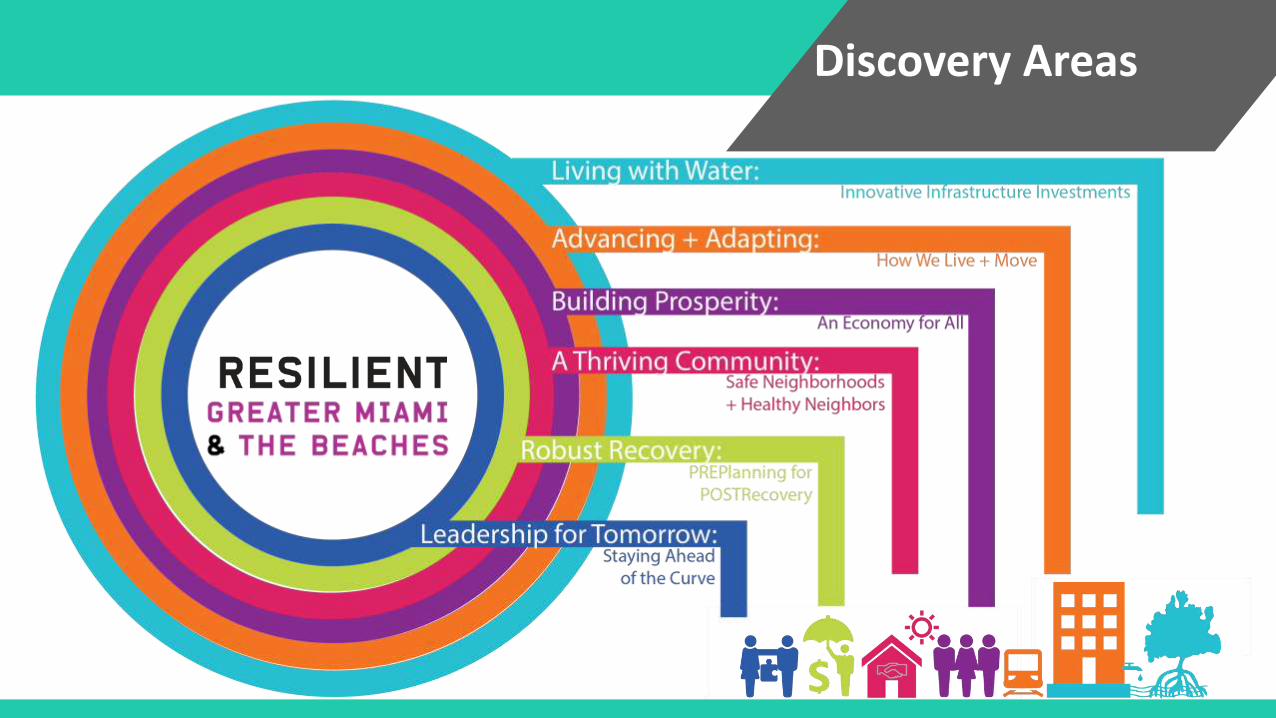
The Resilient GM&B team has engaged residents and organizations to prioritize Discovery Areas for further investigation.
The Discovery Areas outlined in the following pages are the framework for our next body of work. They will help us understand risk, recognize connections, and focus on data.
Here is what we have learned:
Living with Water Innovative Infrastructure
Building On Our Strengths Discovery Areas
We are proud of our rich cultural diversity. This is one of our greatest strengths. Diversity with real dialogue and strong relationships result in great opportunities. We are a series of neighboring communities with distinct challenges and opportunities from neighborhood to neighborhood or from one side of the highway to the other. We crisscross each other from Little Havana to Homestead. How do we stop and connect? How do we empathize and uplift? How do we create a cohesive GM&B community of communities? A beautiful mosaic or quilt – that can stand alone, but is so much stronger together? We propose six Discovery Areas.
Living with Water Innovative Infrastructure
Discovery Areas
Living with Water Innovative Infrastructure
Cross-Cutting Themes Discovery Areas
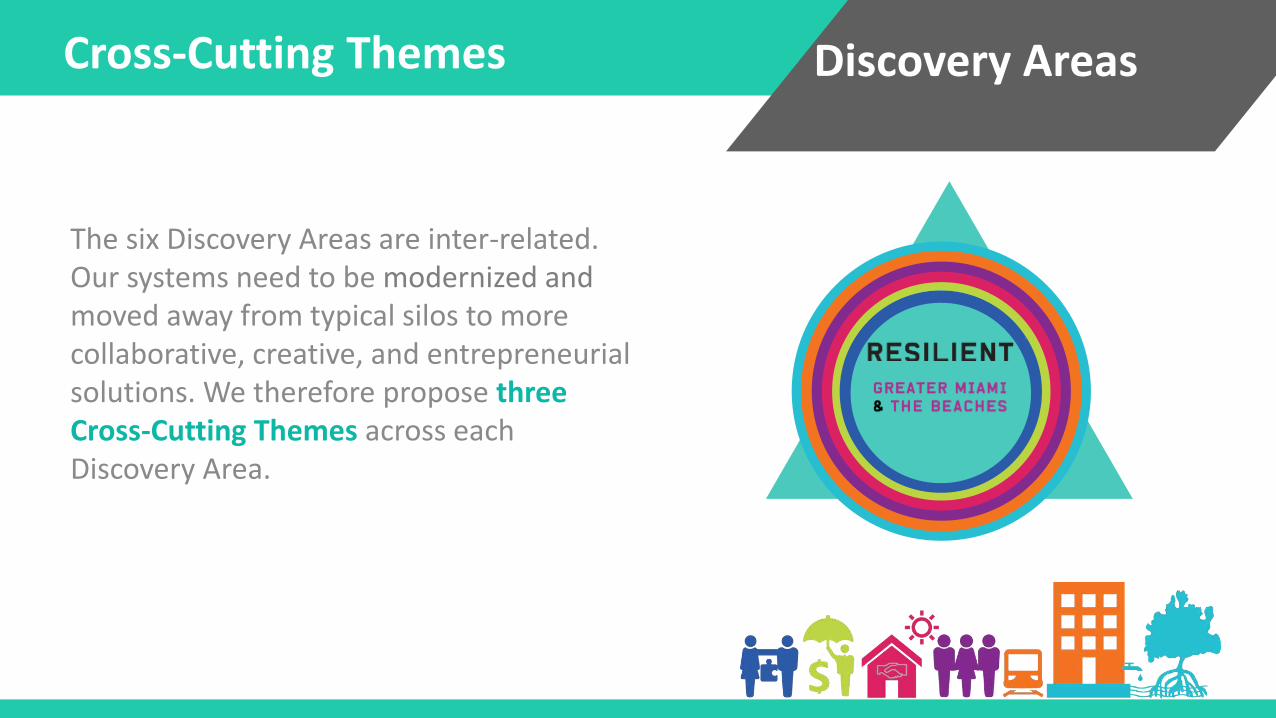
The six Discovery Areas are inter-related. Our systems need to be modernized and moved away from typical silos to more collaborative, creative, and entrepreneurial solutions. We therefore propose three Cross-Cutting Themes across each Discovery Area.
Living with Water
Cross-Cutting Themes Discovery Areas
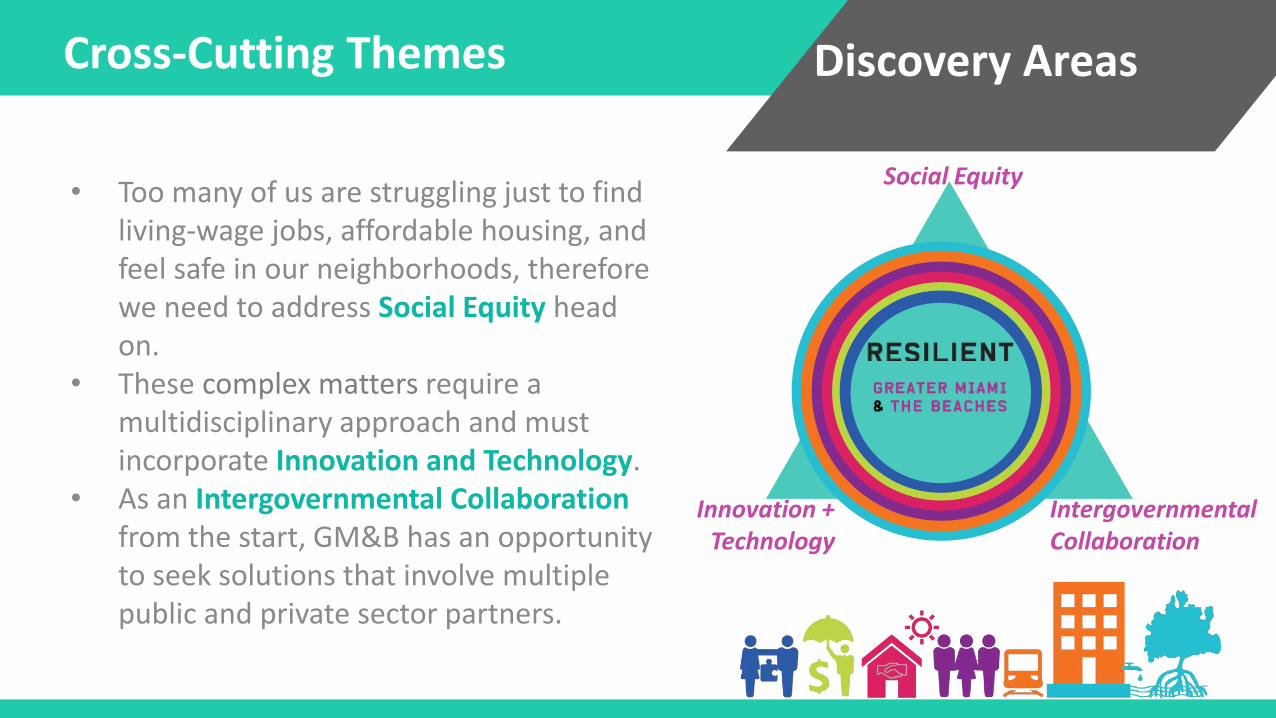
• Too many of us are struggling just to find living-wage jobs, affordable housing, and feel safe in our neighborhoods, therefore we need to address Social Equity head on.
• These complex matters require a multidisciplinary approach and must incorporate Innovation and Technology.
• As an Intergovernmental Collaboration from the start, GM&B has an opportunity to seek solutions that involve multiple public and private sector partners.
Social Equity
Innovation + Technology
Intergovernmental Collaboration
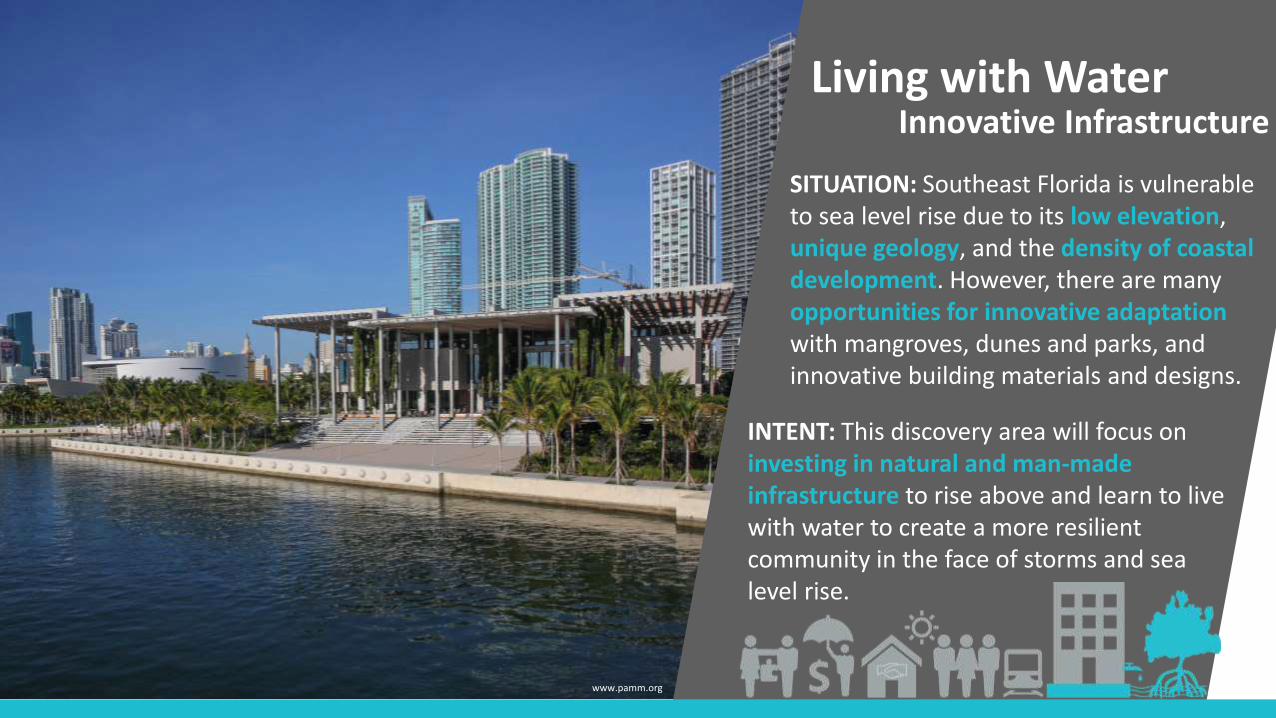
SITUATION: Southeast Florida is vulnerable to sea level rise due to its low elevation, unique geology, and the density of coastal development. However, there are many opportunities for innovative adaptation with mangroves, dunes and parks, and innovative building materials and designs.
Living with Water Innovative Infrastructure
INTENT: This discovery area will focus on investing in natural and man-made infrastructure to rise above and learn to live with water to create a more resilient community in the face of storms and sea level rise.
www.pamm.org
Living with Water
Living with Water Innovative Infrastructure
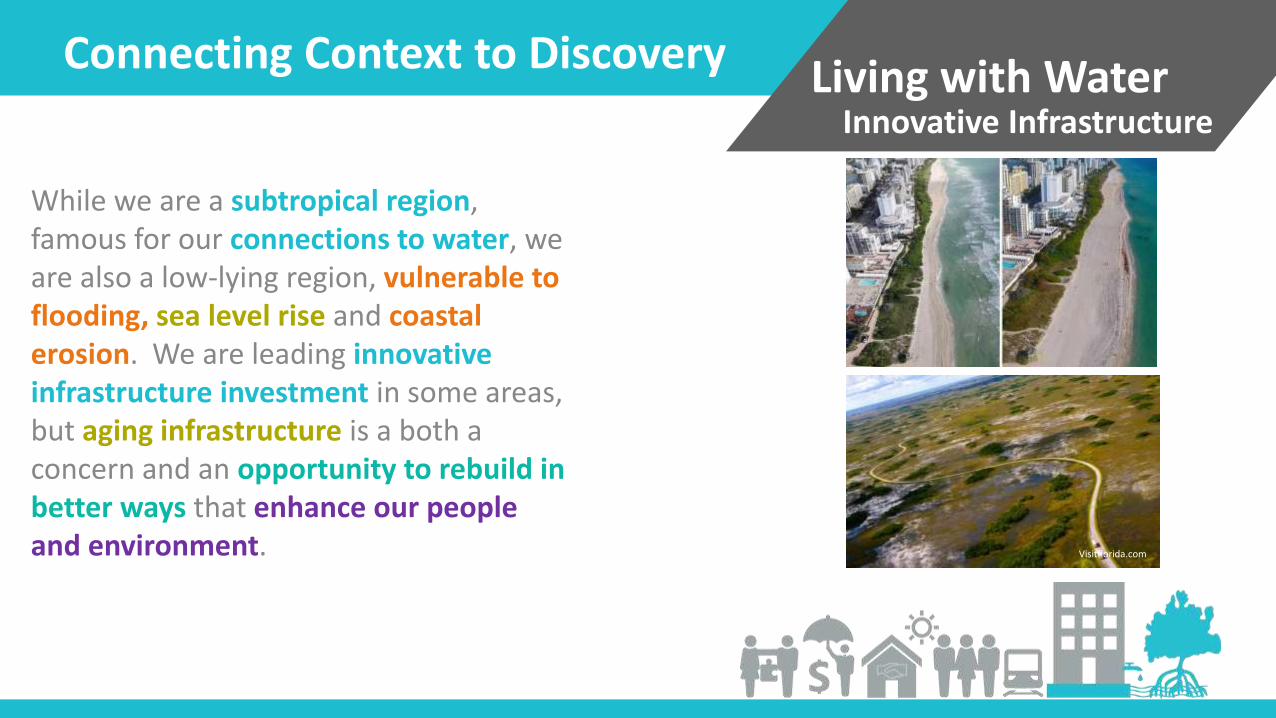
Connecting Context to Discovery
While we are a subtropical region, famous for our connections to water, we are also a low-lying region, vulnerable to flooding, sea level rise and coastal erosion. We are leading innovative infrastructure investment in some areas, but aging infrastructure is a both a concern and an opportunity to rebuild in better ways that enhance our people and environment. Visitflorida.com
Living with Water
Living with Water Innovative Infrastructure
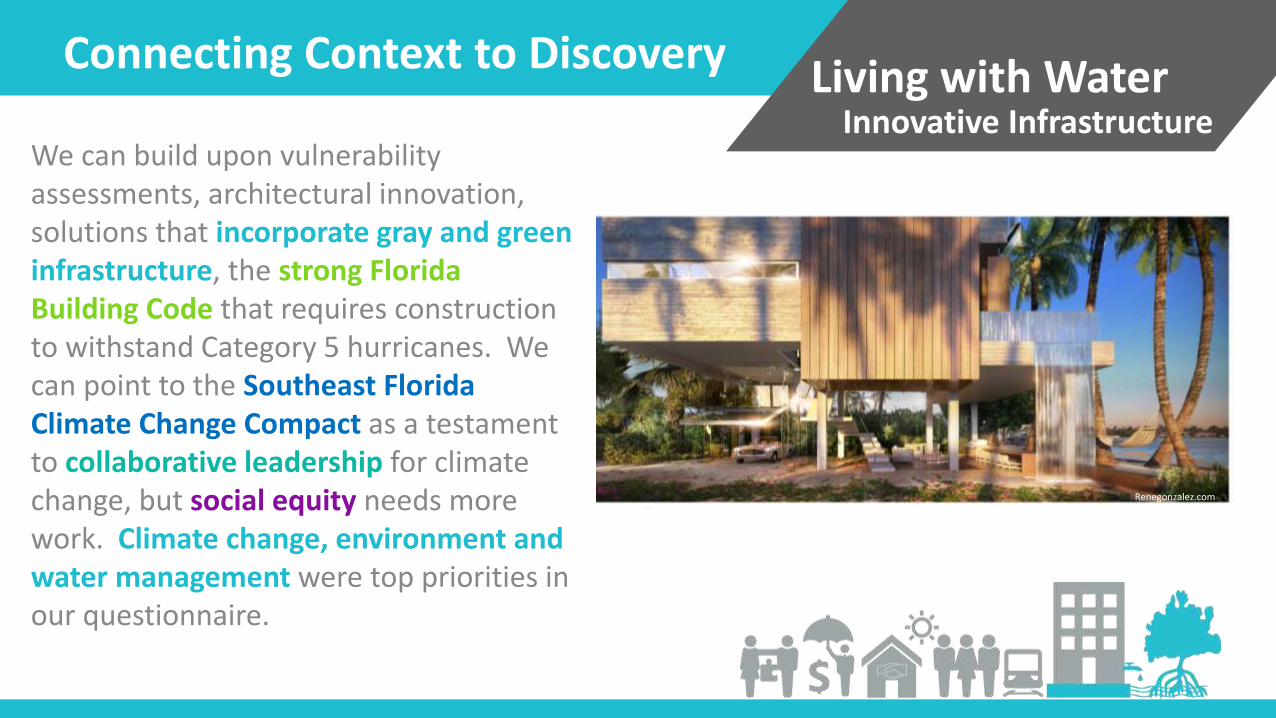
Connecting Context to Discovery
We can build upon vulnerability assessments, architectural innovation, solutions that incorporate gray and green infrastructure, the strong Florida Building Code that requires construction to withstand Category 5 hurricanes. We can point to the Southeast Florida Climate Change Compact as a testament to collaborative leadership for climate change, but social equity needs more work. Climate change, environment and water management were top priorities in our questionnaire.
Renegonzalez.com
Living with Water
Living with Water Innovative Infrastructure
Pending Questions for Phase II
• Coordinated and Committed Planning: How do we proactively plan, coordinate, and use consistent data and communications strategies across governments and the private sector to address sea level rise risks?
• Funding: How do we utilize existing budgets and leverage innovative financing and funding mechanisms to equitably implement adaptation projects and improvements to aging infrastructure?
• Natural Systems: How do we use emerging science to plan for and manage sea level rise impacts on coastal erosion and natural ecosystems?
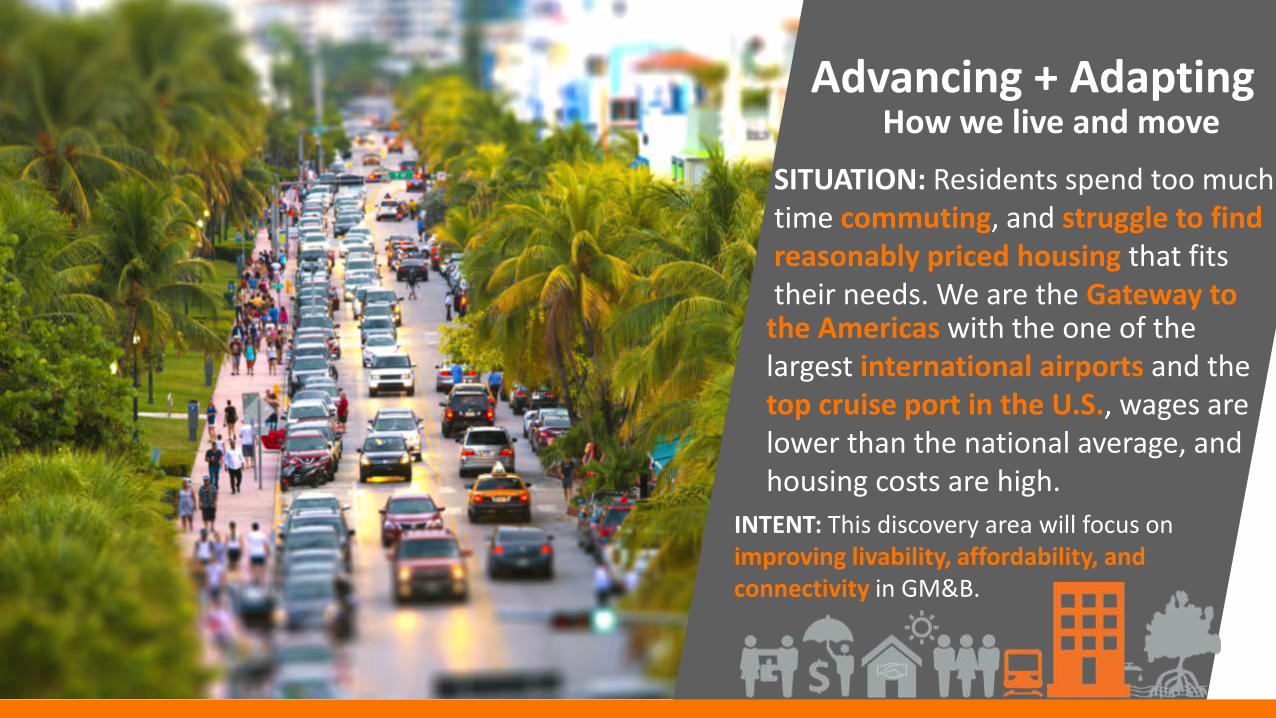
SITUATION: Residents spend too much time commuting, and struggle to find reasonably priced housing that fits their needs. We are the Gateway to
Advancing + Adapting How we live and move
INTENT: This discovery area will focus on improving livability, affordability, and connectivity in GM&B.
the Americas with the one of the largest international airports and the top cruise port in the U.S., wages are lower than the national average, and housing costs are high.
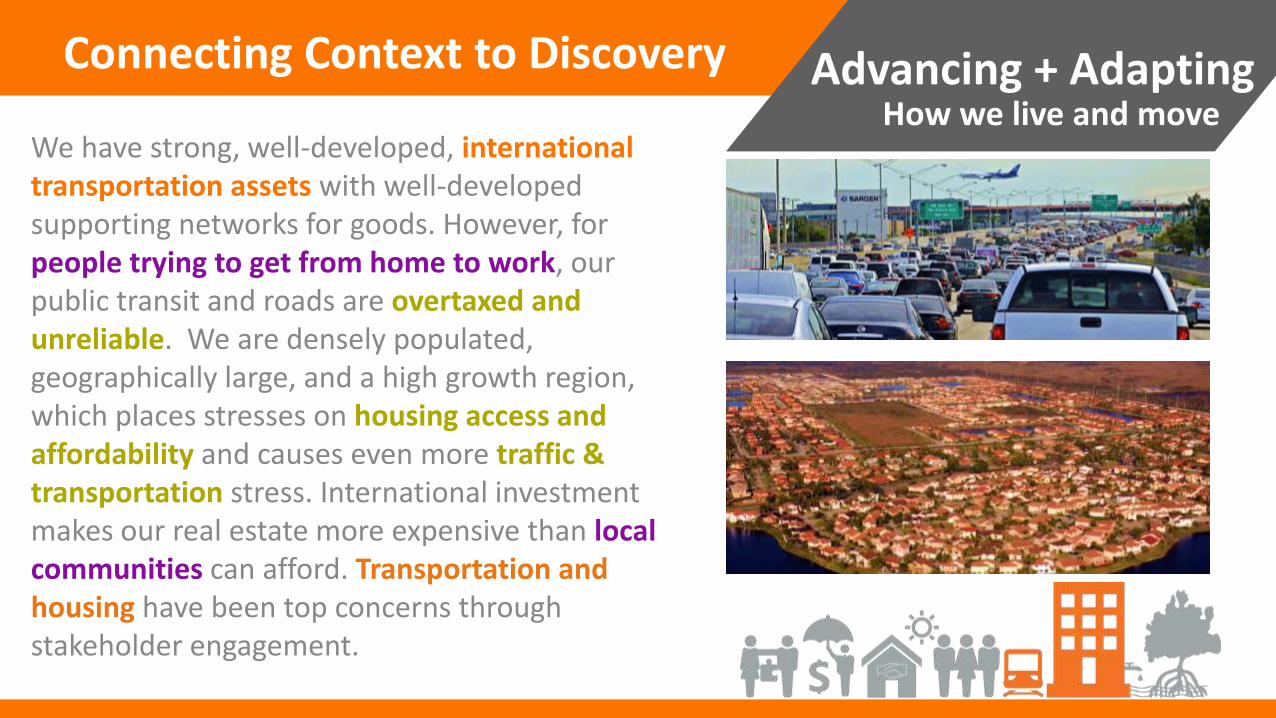
We have strong, well-developed, international transportation assets with well-developed supporting networks for goods. However, for people trying to get from home to work, our public transit and roads are overtaxed and unreliable. We are densely populated, geographically large, and a high growth region, which places stresses on housing access and affordability and causes even more traffic & transportation stress. International investment makes our real estate more expensive than local communities can afford. Transportation and housing have been top concerns through stakeholder engagement.
Connecting Context to Discovery Advancing + Adapting How we live and move
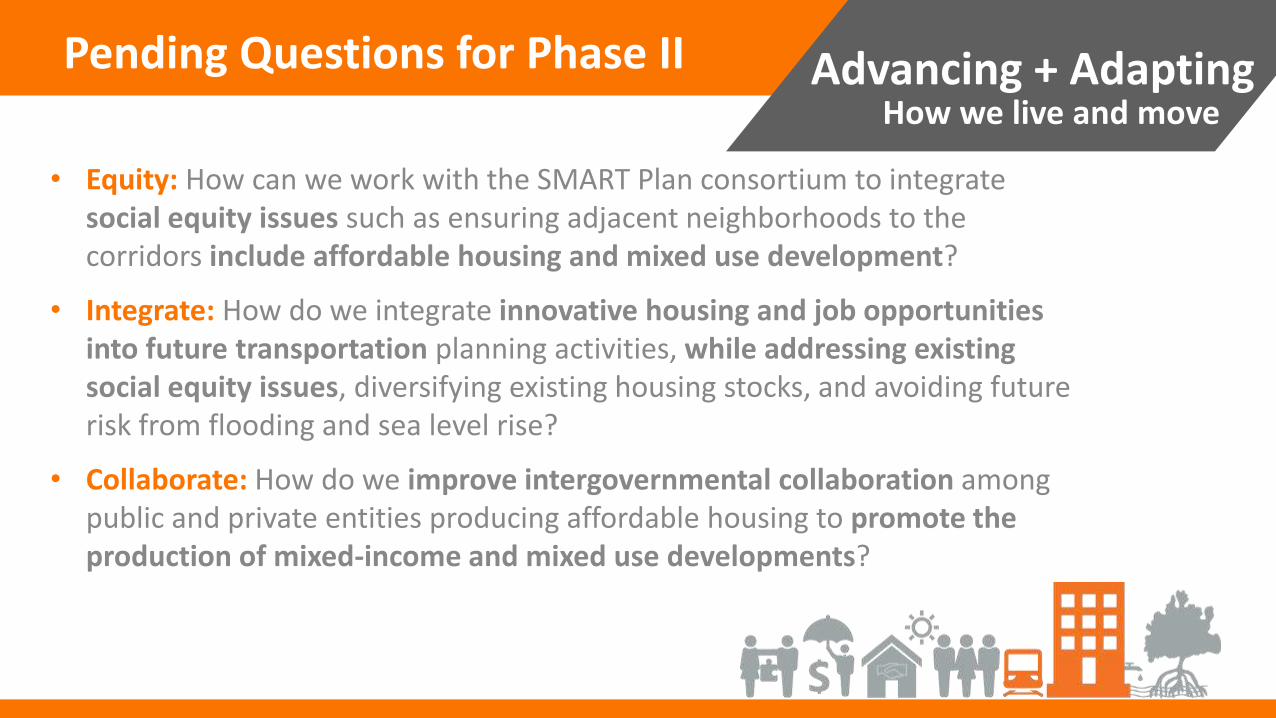
• Equity: How can we work with the SMART Plan consortium to integrate social equity issues such as ensuring adjacent neighborhoods to the corridors include affordable housing and mixed use development?
• Integrate: How do we integrate innovative housing and job opportunities into future transportation planning activities, while addressing existing social equity issues, diversifying existing housing stocks, and avoiding future risk from flooding and sea level rise?
• Collaborate: How do we improve intergovernmental collaboration among public and private entities producing affordable housing to promote the production of mixed-income and mixed use developments?
Advancing + Adapting How we live and move
Pending Questions for Phase II
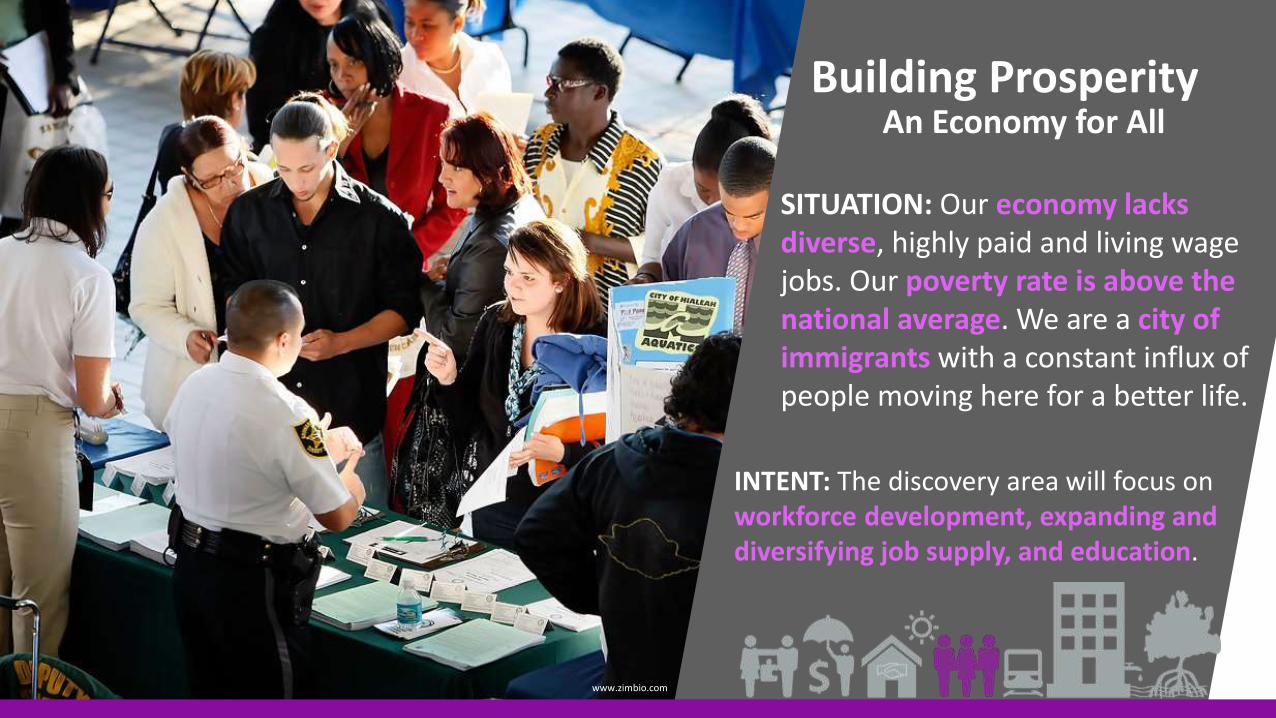
SITUATION: Our economy lacks diverse, highly paid and living wage jobs. Our poverty rate is above the national average. We are a city of immigrants with a constant influx of people moving here for a better life.
Building Prosperity An Economy for All
INTENT: The discovery area will focus on workforce development, expanding and diversifying job supply, and education.
www.zimbio.com
Connecting Context to Discovery Building Prosperity An Economy for All
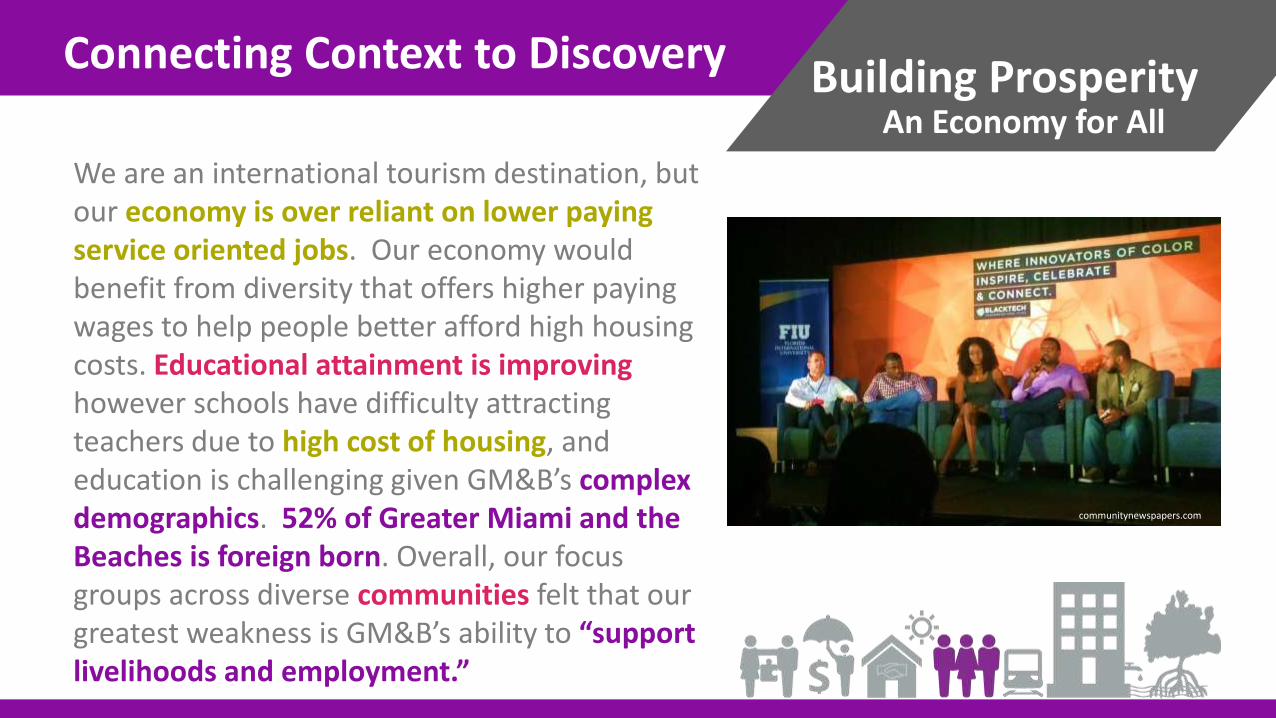
We are an international tourism destination, but our economy is over reliant on lower paying service oriented jobs. Our economy would benefit from diversity that offers higher paying wages to help people better afford high housing costs. Educational attainment is improving however schools have difficulty attracting teachers due to high cost of housing, and education is challenging given GM&B’s complex demographics. 52% of Greater Miami and the Beaches is foreign born. Overall, our focus groups across diverse communities felt that our greatest weakness is GM&B’s ability to “support livelihoods and employment.”
communitynewspapers.com
Pending Questions for Phase II Building Prosperity An Economy for All
• Priorities: How do we ensure that our economic and workforce
development programs are addressing the dramatic disparities that exist between our racial and ethnic groups?
• Innovation: How could technology, private, civic and government sector partnerships help our workforce development programs to better address the needs of our most vulnerable?
• Opportunity: How do we leverage the major investments in infrastructure to ensure local and inclusive access to the resulting business and job opportunities?
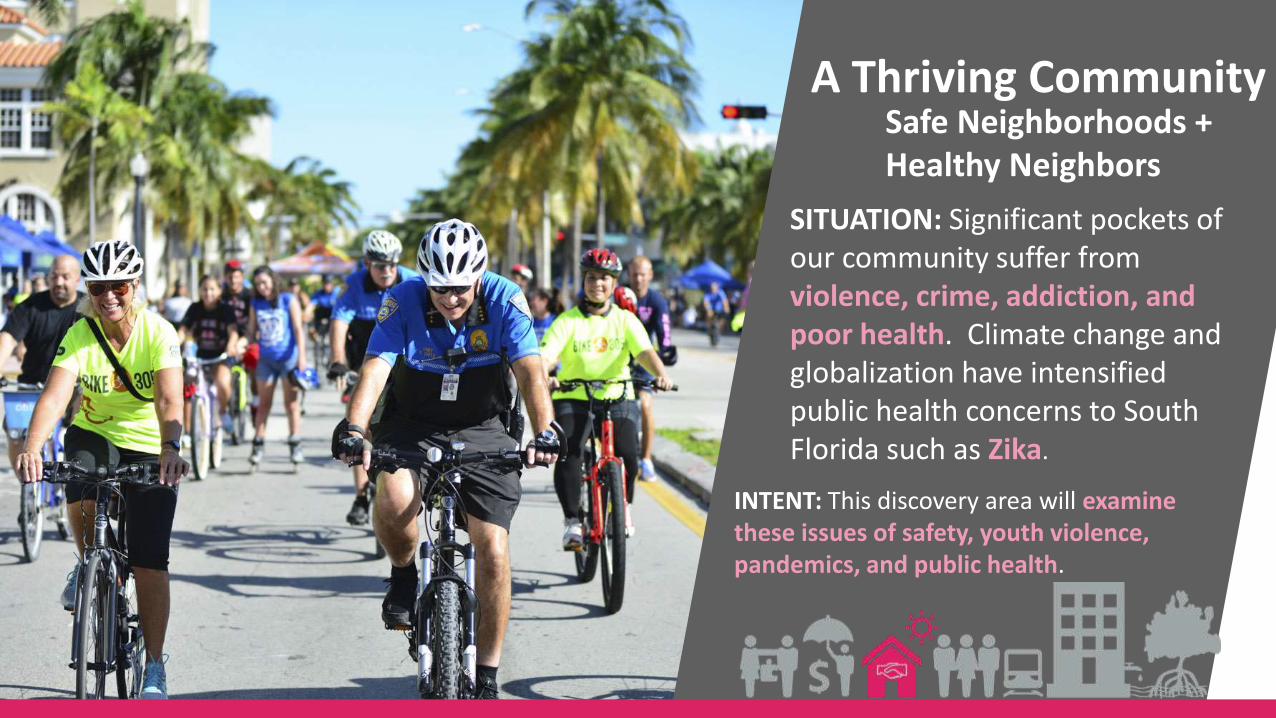
SITUATION: Significant pockets of our community suffer from violence, crime, addiction, and poor health. Climate change and globalization have intensified public health concerns to South Florida such as Zika.
A Thriving Community Safe Neighborhoods +
Healthy Neighbors
INTENT: This discovery area will examine these issues of safety, youth violence, pandemics, and public health.
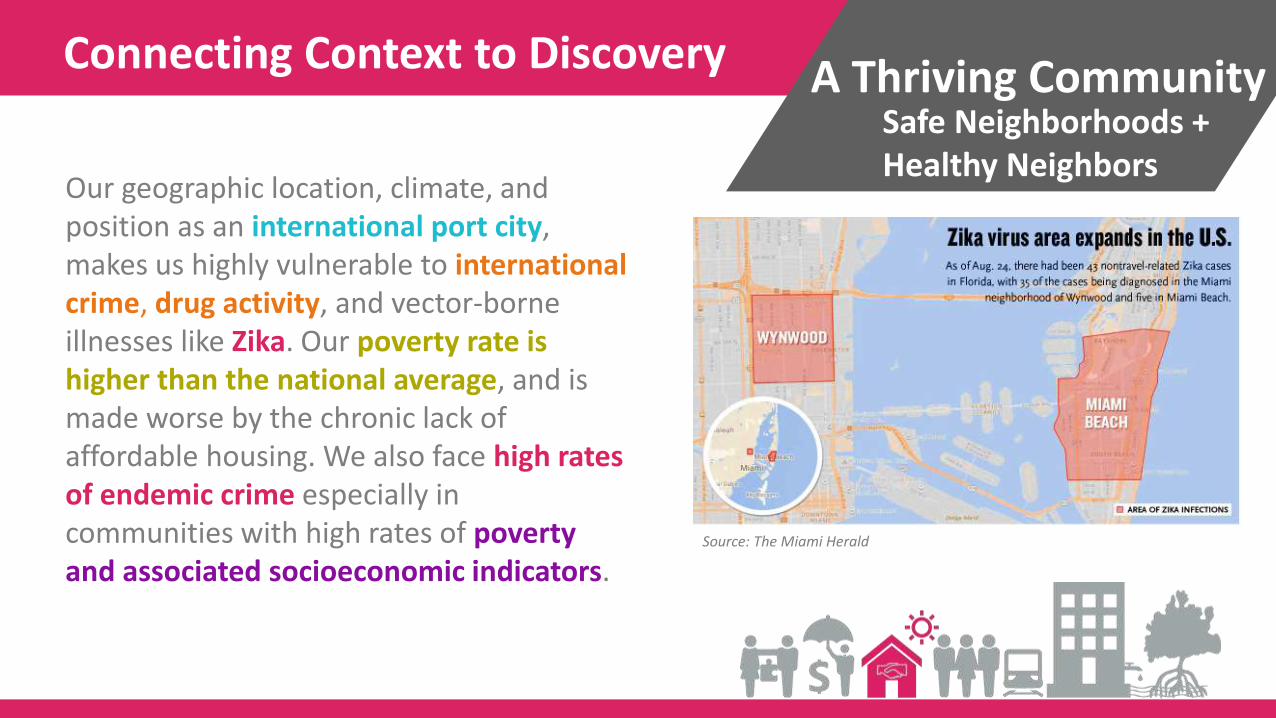
Our geographic location, climate, and position as an international port city, makes us highly vulnerable to international crime, drug activity, and vector-borne illnesses like Zika. Our poverty rate is higher than the national average, and is made worse by the chronic lack of affordable housing. We also face high rates of endemic crime especially in communities with high rates of poverty and associated socioeconomic indicators.
Connecting Context to Discovery A Thriving Community Safe Neighborhoods +
Healthy Neighbors
Source: The Miami Herald
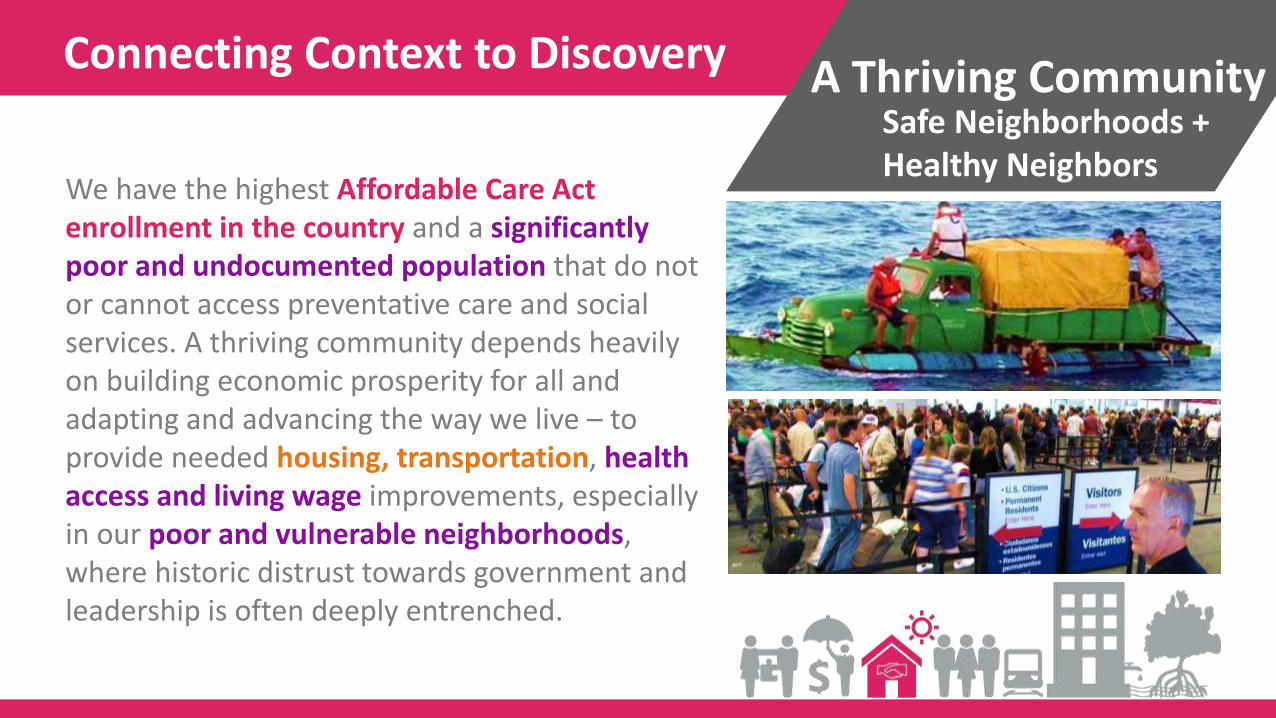
We have the highest Affordable Care Act enrollment in the country and a significantly poor and undocumented population that do not or cannot access preventative care and social services. A thriving community depends heavily on building economic prosperity for all and adapting and advancing the way we live – to provide needed housing, transportation, health access and living wage improvements, especially in our poor and vulnerable neighborhoods, where historic distrust towards government and leadership is often deeply entrenched.
Connecting Context to Discovery A Thriving Community Safe Neighborhoods +
Healthy Neighbors
• Advance: How do we elevate, accelerate, and integrate the work products of our university and other partners to better prepare our systems to prevent, respond to, and recover from changes in public health due to climate change, globalization, and urbanization?
• Equity: How can we prioritize neighborhood enhancements, engagement and access to opportunity in neighborhoods experiencing high incidences of violent crime and poverty?
• Intervention: What sort of cross sector, data-driven and/or technology-based interventions could be effective to respond to the root causes of the opioid and HIV epidemics?
Pending Questions for Phase II A Thriving Community Safe Neighborhoods +
Healthy Neighbors
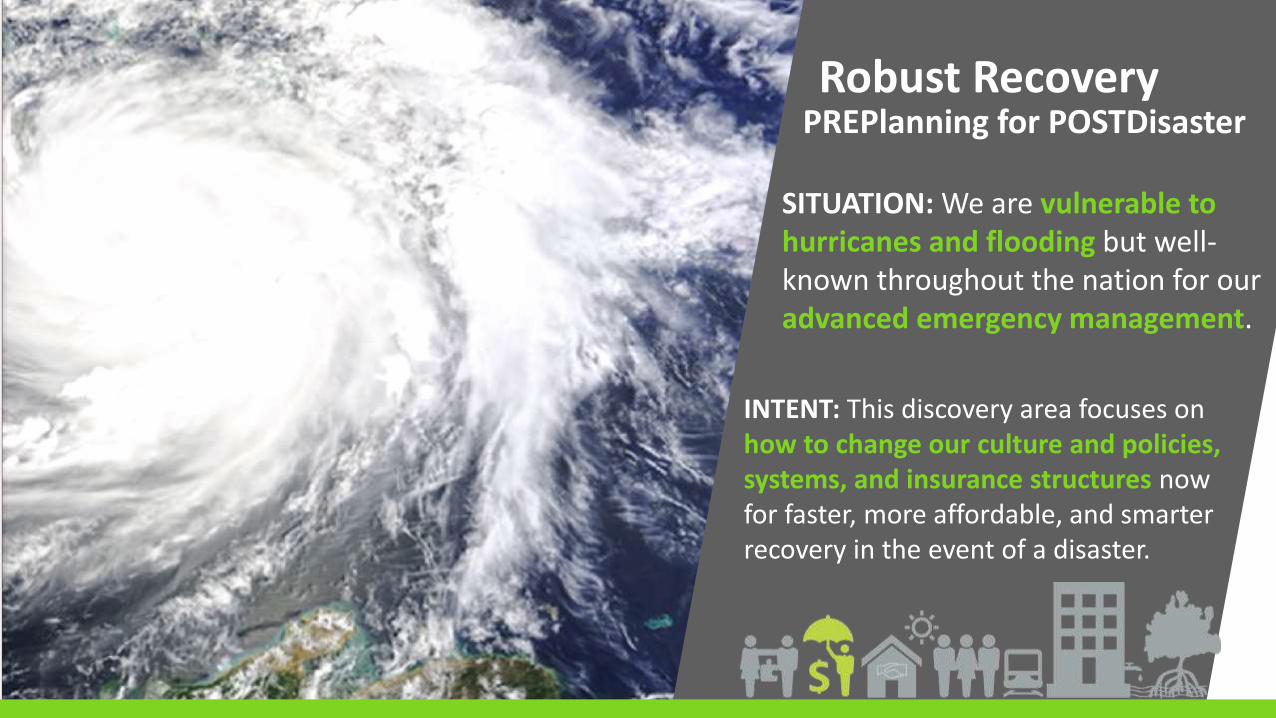
SITUATION: We are vulnerable to hurricanes and flooding but well-known throughout the nation for our advanced emergency management.
Robust Recovery PREPlanning for POSTDisaster
INTENT: This discovery area focuses on how to change our culture and policies, systems, and insurance structures now for faster, more affordable, and smarter recovery in the event of a disaster.
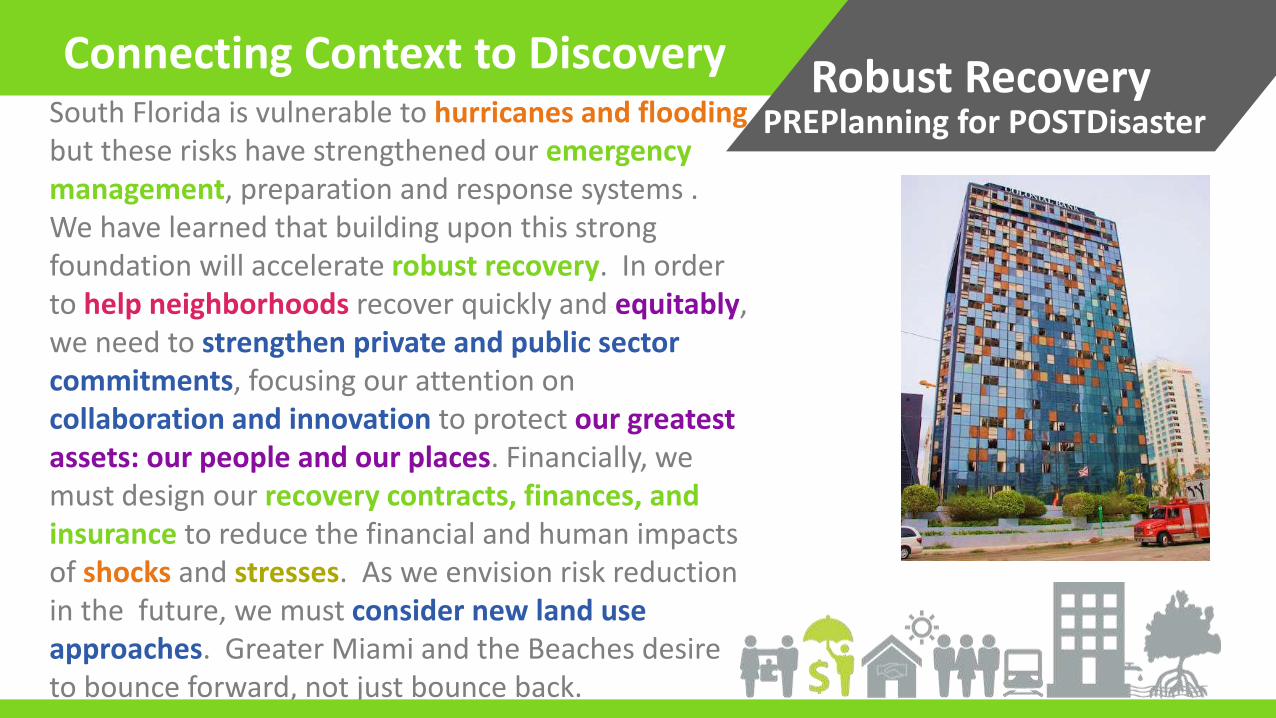
South Florida is vulnerable to hurricanes and flooding but these risks have strengthened our emergency management, preparation and response systems . We have learned that building upon this strong foundation will accelerate robust recovery. In order to help neighborhoods recover quickly and equitably, we need to strengthen private and public sector commitments, focusing our attention on collaboration and innovation to protect our greatest assets: our people and our places. Financially, we must design our recovery contracts, finances, and insurance to reduce the financial and human impacts of shocks and stresses. As we envision risk reduction in the future, we must consider new land use approaches. Greater Miami and the Beaches desire to bounce forward, not just bounce back.
Connecting Context to Discovery Robust Recovery PREPlanning for POSTDisaster
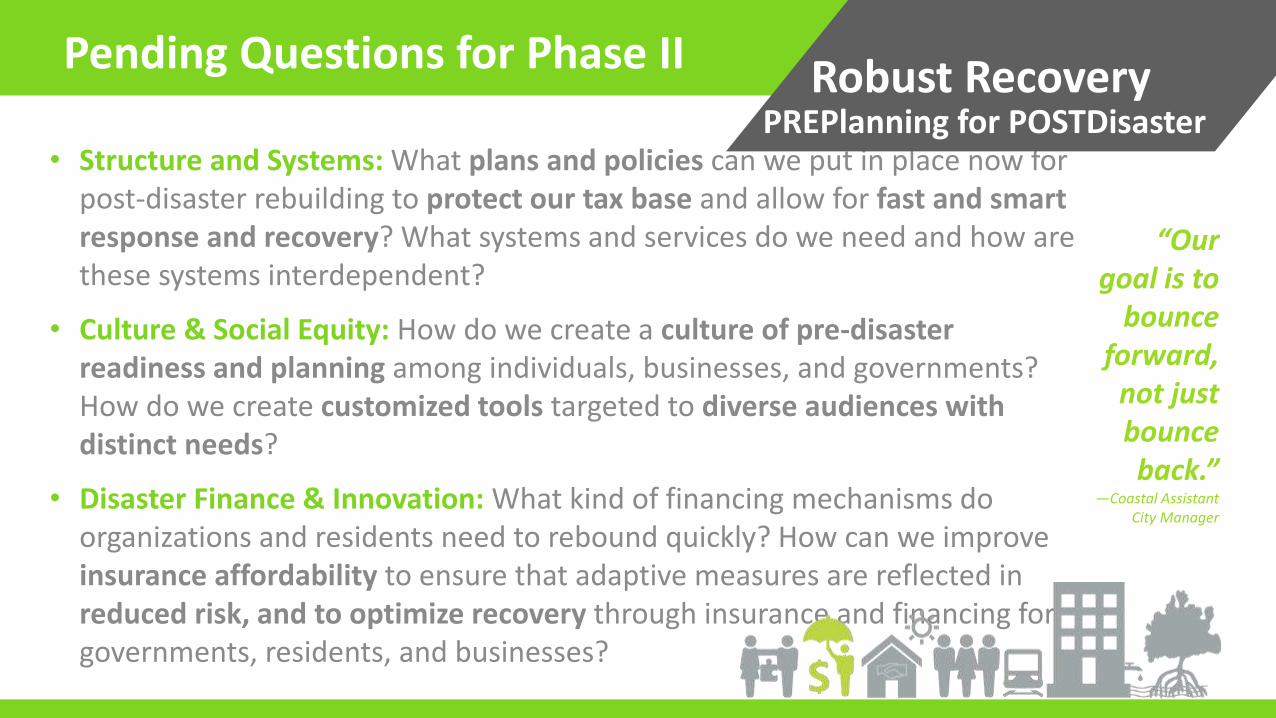
• Structure and Systems: What plans and policies can we put in place now for post-disaster rebuilding to protect our tax base and allow for fast and smart response and recovery? What systems and services do we need and how are these systems interdependent?
• Culture & Social Equity: How do we create a culture of pre-disaster readiness and planning among individuals, businesses, and governments? How do we create customized tools targeted to diverse audiences with distinct needs?
• Disaster Finance & Innovation: What kind of financing mechanisms do organizations and residents need to rebound quickly? How can we improve insurance affordability to ensure that adaptive measures are reflected in reduced risk, and to optimize recovery through insurance and financing for governments, residents, and businesses?
Pending Questions for Phase II Robust Recovery PREPlanning for POSTDisaster
“Our goal is to
bounce forward,
not just bounce back.”
—Coastal Assistant City Manager
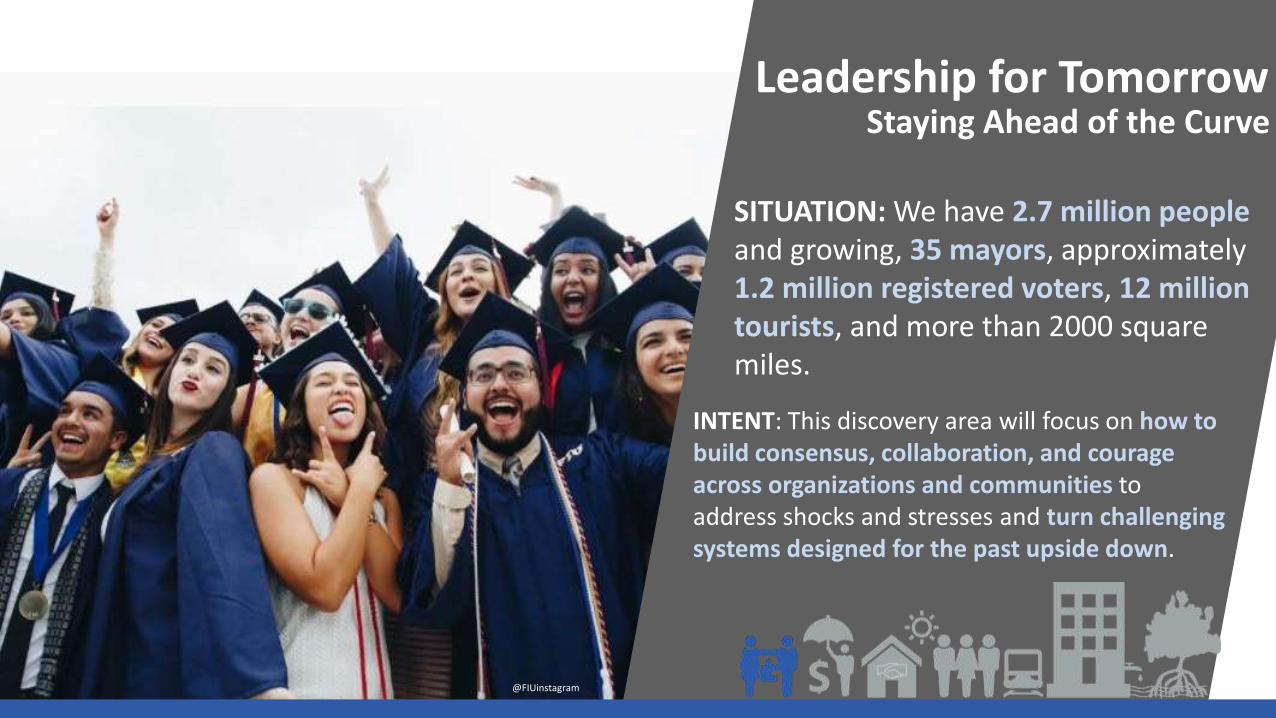
SITUATION: We have 2.7 million people and growing, 35 mayors, approximately 1.2 million registered voters, 12 million tourists, and more than 2000 square miles.
Leadership for Tomorrow Staying Ahead of the Curve
INTENT: This discovery area will focus on how to build consensus, collaboration, and courage across organizations and communities to address shocks and stresses and turn challenging systems designed for the past upside down.
@FIUinstagram
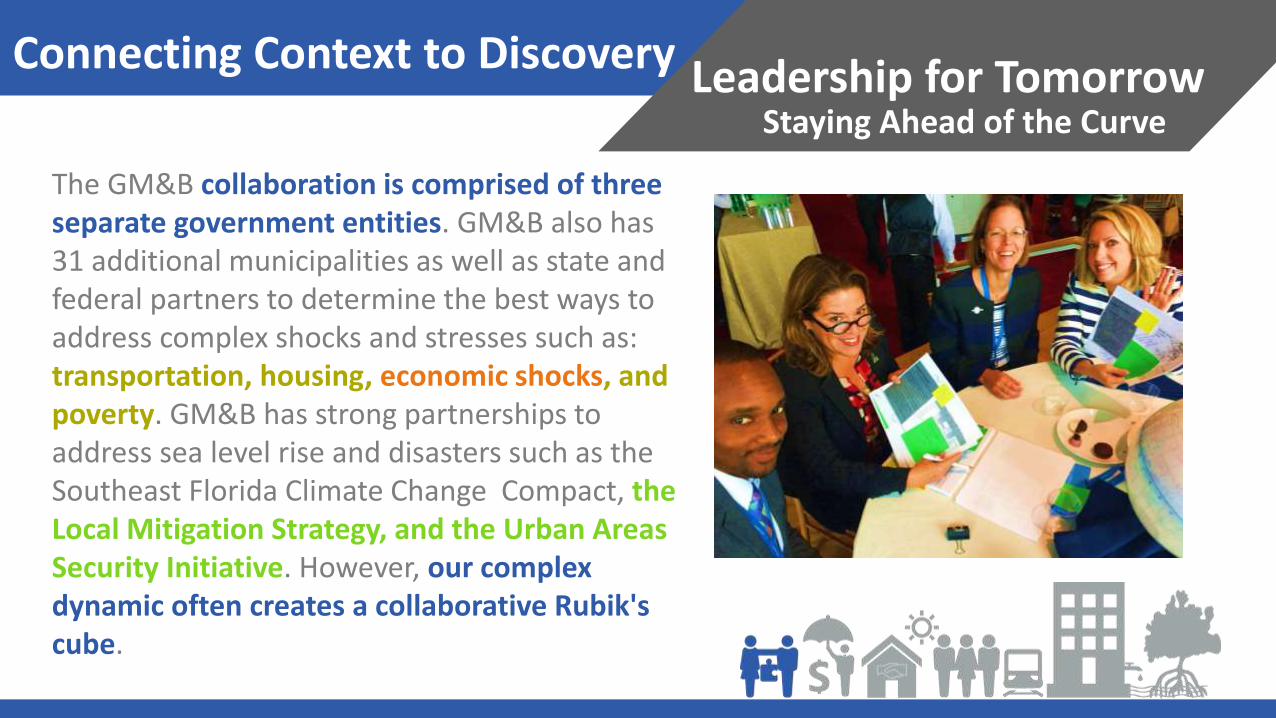
The GM&B collaboration is comprised of three separate government entities. GM&B also has 31 additional municipalities as well as state and federal partners to determine the best ways to address complex shocks and stresses such as: transportation, housing, economic shocks, and poverty. GM&B has strong partnerships to address sea level rise and disasters such as the Southeast Florida Climate Change Compact, the Local Mitigation Strategy, and the Urban Areas Security Initiative. However, our complex dynamic often creates a collaborative Rubik's cube.
Connecting Context to Discovery Leadership for Tomorrow Staying Ahead of the Curve
• Collaboration: How do we modernize the way government does business, given the threats we face? How do we create, organize, and commit a culture of interdisciplinary and interjurisdictional collaboration around resilience? How do we use GM&B as the model for better city-county coordination? How do or can cities better access the county to know what projects are happening and how cities can help and participate? What legislative changes are needed to achieve more integrated practices?
Pending Concerns + Questions Leadership for Tomorrow Staying Ahead of the Curve
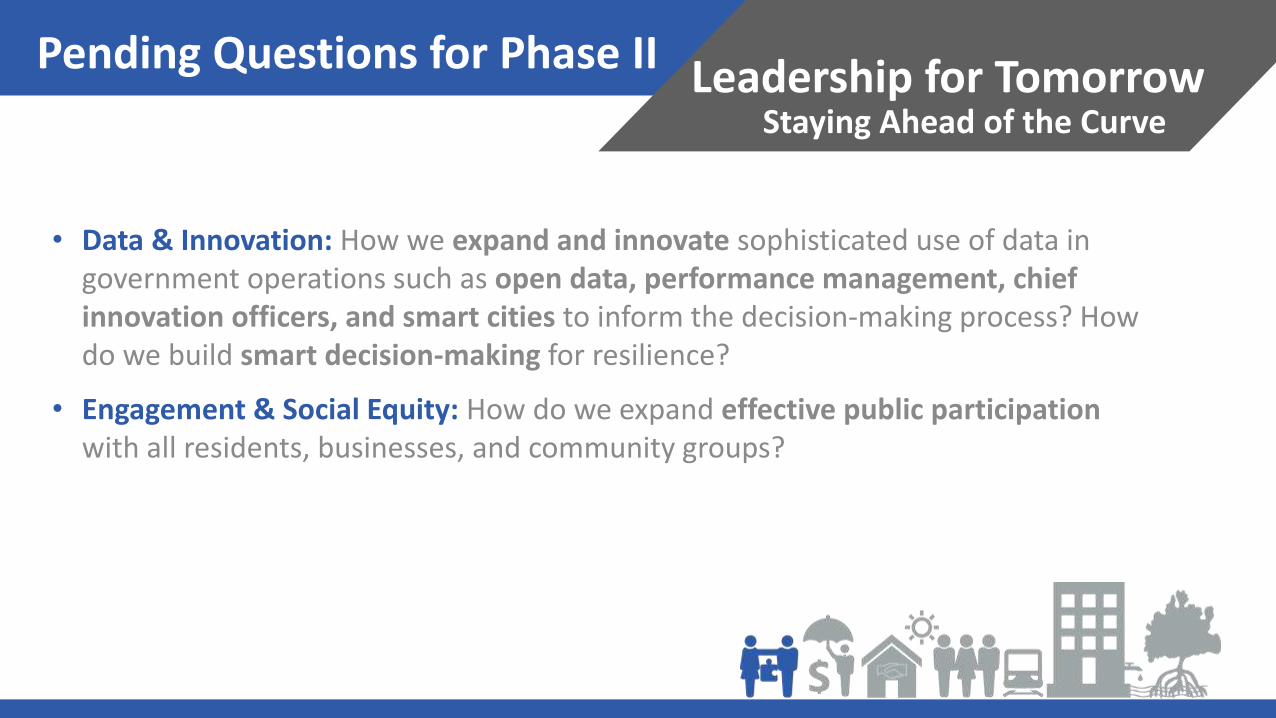
• Data & Innovation: How we expand and innovate sophisticated use of data in government operations such as open data, performance management, chief innovation officers, and smart cities to inform the decision-making process? How do we build smart decision-making for resilience?
• Engagement & Social Equity: How do we expand effective public participation with all residents, businesses, and community groups?
Pending Questions for Phase II Leadership for Tomorrow Staying Ahead of the Curve

Next Steps
Areas for Discovery Toward a More Resilient GM&B
Next Steps
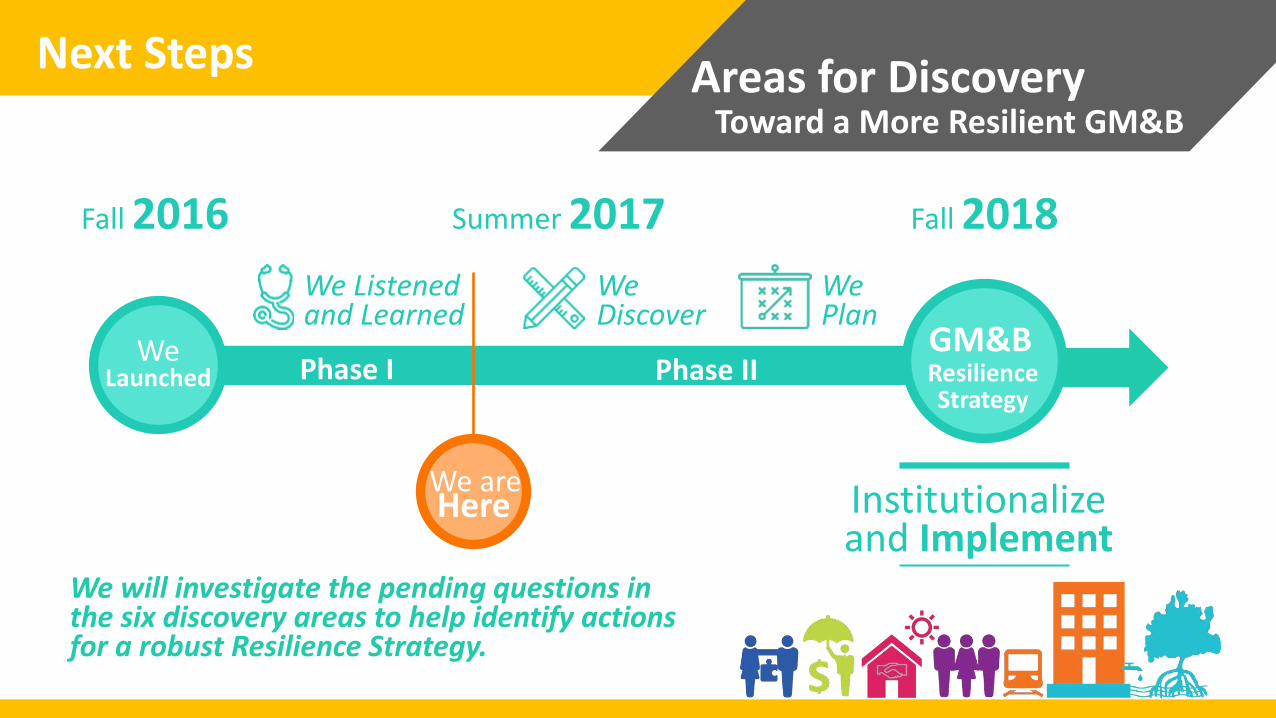
Fall 2016 Summer 2017 Fall 2018
We Launched Resilience
Strategy
GM&B
Institutionalize and Implement
We Listened and Learned
Phase I Phase II
We are Here
We Discover
We Plan
We will investigate the pending questions in the six discovery areas to help identify actions for a robust Resilience Strategy.

Acknowledgements
All cities face risk, and although Southeast Florida is vulnerable to rising sea levels due to its low elevation, unique geology, and the density of coastal developments- there are many opportunities for innovation with mangroves, dunes, parks spaces, and innovative building materials and designs.
Living with Water Innovative Infrastructure
Water attracted many us here- as we adapt to more water, how can we thrive socially, environmentally, and economically? How can we leverage and protect the Everglades and Biscayne Bay? This discovery area will focus investing in natural and man-made infrastructure to rise above and learn to live with water to create a more resilient community in the face of storms and sea level rise.
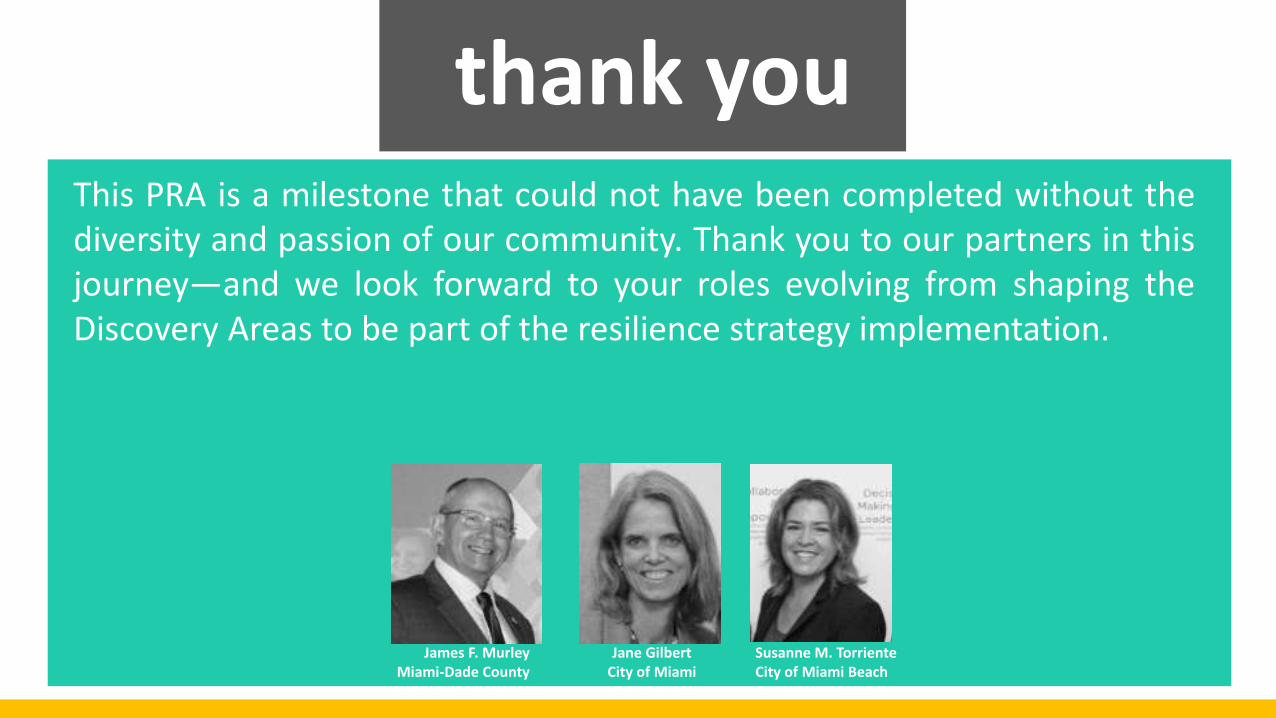
This PRA is a milestone that could not have been completed without the diversity and passion of our community. Thank you to our partners in this journey—and we look forward to your roles evolving from shaping the Discovery Areas to be part of the resilience strategy implementation.
thank you
James F. Murley Miami-Dade County
Jane Gilbert City of Miami
Susanne M. Torriente City of Miami Beach
Thank you! Toward a More Resilient GM&B
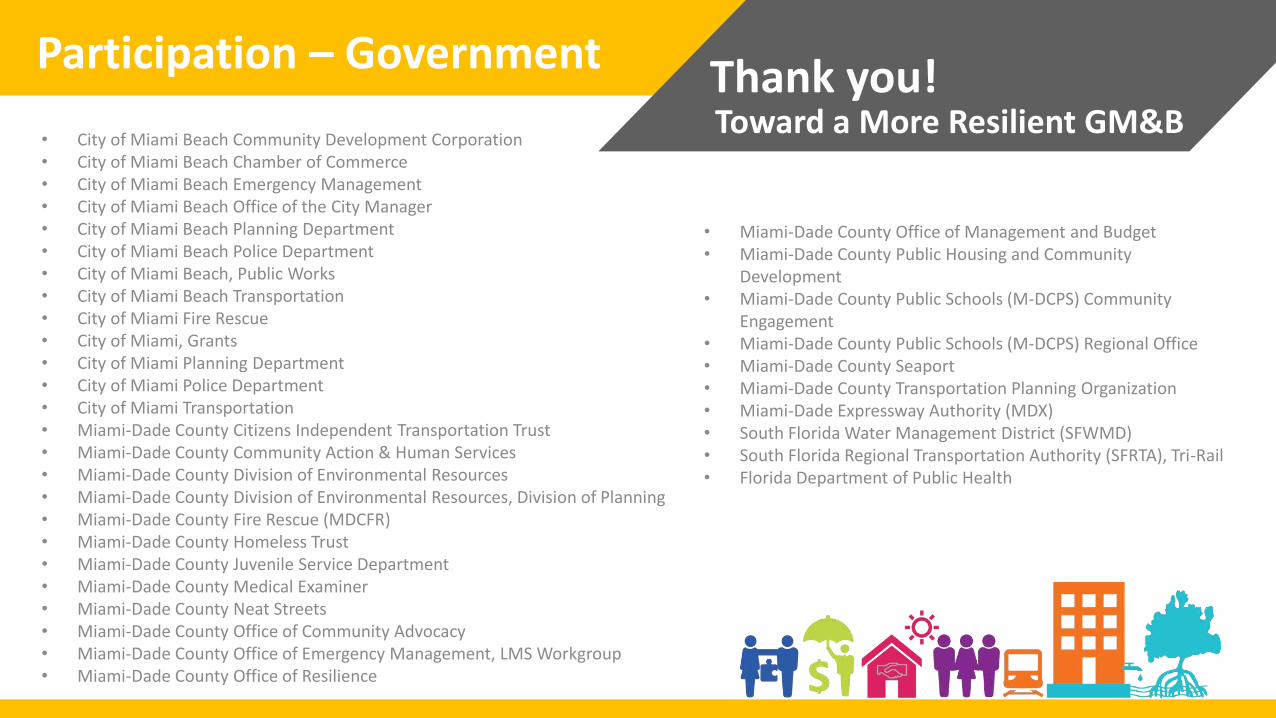
• City of Miami Beach Community Development Corporation • City of Miami Beach Chamber of Commerce • City of Miami Beach Emergency Management • City of Miami Beach Office of the City Manager • City of Miami Beach Planning Department • City of Miami Beach Police Department • City of Miami Beach, Public Works • City of Miami Beach Transportation • City of Miami Fire Rescue • City of Miami, Grants • City of Miami Planning Department • City of Miami Police Department • City of Miami Transportation • Miami-Dade County Citizens Independent Transportation Trust • Miami-Dade County Community Action & Human Services • Miami-Dade County Division of Environmental Resources • Miami-Dade County Division of Environmental Resources, Division of Planning • Miami-Dade County Fire Rescue (MDCFR) • Miami-Dade County Homeless Trust • Miami-Dade County Juvenile Service Department • Miami-Dade County Medical Examiner • Miami-Dade County Neat Streets • Miami-Dade County Office of Community Advocacy • Miami-Dade County Office of Emergency Management, LMS Workgroup • Miami-Dade County Office of Resilience
Participation – Government
• Miami-Dade County Office of Management and Budget • Miami-Dade County Public Housing and Community
Development • Miami-Dade County Public Schools (M-DCPS) Community
Engagement • Miami-Dade County Public Schools (M-DCPS) Regional Office • Miami-Dade County Seaport • Miami-Dade County Transportation Planning Organization • Miami-Dade Expressway Authority (MDX) • South Florida Water Management District (SFWMD) • South Florida Regional Transportation Authority (SFRTA), Tri-Rail • Florida Department of Public Health
Thank you! Toward a More Resilient GM&B
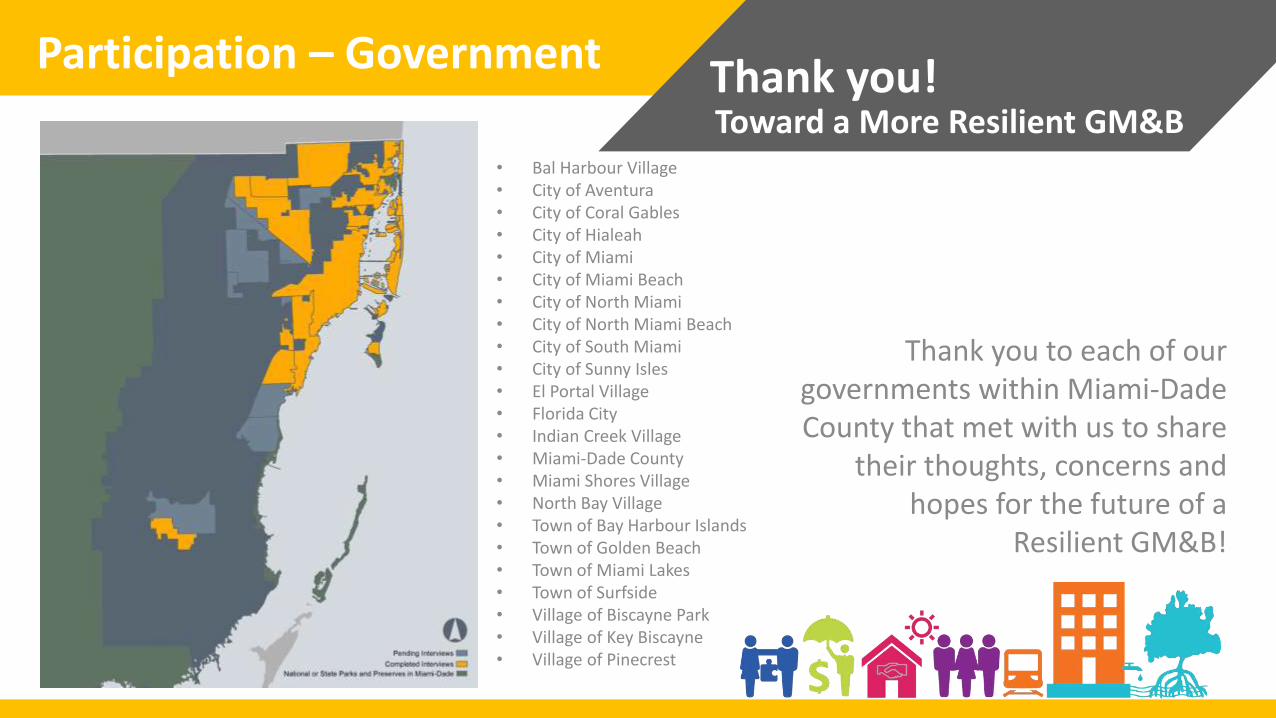
• Bal Harbour Village • City of Aventura • City of Coral Gables • City of Hialeah • City of Miami • City of Miami Beach • City of North Miami • City of North Miami Beach • City of South Miami • City of Sunny Isles • El Portal Village • Florida City • Indian Creek Village • Miami-Dade County • Miami Shores Village • North Bay Village • Town of Bay Harbour Islands • Town of Golden Beach • Town of Miami Lakes • Town of Surfside • Village of Biscayne Park • Village of Key Biscayne • Village of Pinecrest
Participation – Government
Thank you to each of our governments within Miami-Dade County that met with us to share
their thoughts, concerns and hopes for the future of a
Resilient GM&B!
Thank you! Toward a More Resilient GM&B
Participation – Civil + Private
• American Institute of Architects (AIA) Miami Chapter • Bank United • Beacon Council • CareerSource • Catalyst Miami • CLEO Institute • ESRI • FernLeaf • FIU Metropolitan Center • FIU Sea-Level Solutions Center • Greater Miami Chamber of Commerce (GMCC) • Greater Miami Convention & Visitors Bureau (GMCVB) • Jewish Community Services of South Florida • Miami-Dade County City and County Management Association (MDCCMA) • Miami-Dade Hospital Coalition • Michael Berman Consulting • Miami Center for Architecture and Design (MCAD) • Miami Homes for All • Miami Waterkeeper • Nicklaus Children’s Hospital • People Acting for Community Together (PACT) • PhilanthropyMiami • Service Employees International Union (SEIU) Florida • South Florida Centers for Disease Control and Prevention
And of course, thank you all of the amazing residents throughout GM&B
who have participated by attending our meetings, responding to our
questionnaires, following us on social media, and checking out our website!
• The Children’s Trust • The Miami Foundation • United Way of Miami-Dade County • University of Miami Office of Civic and Community Engagement
Thank you! Toward a More Resilient GM&B
Steering Committee
• Gretchen Beesing, Catalyst Miami • Truly Burton, Builders Association South Florida • Jaret Davis, Beacon Council • Erik Eikenberg, Everglades Foundation • Maurice Ferre, MDX • Valencia Gunder, New Florida Majority • Bobbi Ibarra, Homes for All • Marsha Jackman, Vailon Group • Jorge Luis Lopez, Parks Foundation • Michelle Mejia, Baptist Health Kendall • Rebekah Monson, The New Tropic • Delaney Reynolds, Sink or Swim • Scott Robins, Developer
• Zerry Ihekwaba, City of Miami • Jimmy Morales, City of Miami Beach • Jack Osterholt, Miami-Dade County • Javier Soto, The Miami Foundation
Thank you! Toward a More Resilient GM&B
Special Thanks
• Deputy Chief Resilience Officers: Nichole Hefty, Amy Knowles, Stephanie Tashiro • 100RC Team: Otis Rolley, Eric Wilson, Peter Jenkins • Strategy Partner: Claire Bonham-Carter and Lauren Swan • Miami Beach Intern: Corin Smith • Graphics + Data: The Greater Miami Convention & Visitors Bureau (GMCVB) for
tourism data; Miami-Dade County GreenPrint for demographic data; Beacon Council: Advantage Miami for economic data; FIU Metropolitan Center for distressed community data
• Accommodation + Support: A special thanks to PortMiami, the Cruise Capital of the World for hosting us throughout the strategy development process!
Leadership for Tomorrow; Robust Recovery; Thriving Community; Building Prosperity; Advance + Adapt; Innovative Infrastructure
Social Equity; Innovation + Technology; Intergovernmental Collaboration
@resilient305