Embed Size (px)
Citation preview

Preliminary Report of the CommitteeStudying Home Run Rates in MLB
Jim Albert1, Anette (Peko) Hosoi2,Alan Nathan3, and Lloyd Smith4
1Bowling Green State University2MIT
3University of Illinois at Urbana-Champaign4Washington State University
December 10, 2019
Abstract
A preliminary report is presented analyzing possible causes of thechange in home run rate in Major League Baseball during the period2017-2019 and the features of the baseball that affect its aerodynamicproperties. Analysis of StatCast data shows that the increase in homerun rate between 2018 and 2019 was due in part to a change in launchconditions and in part to a change in the baseball drag. The increasedue to changes in launch conditions was determined to be due to achange in player behavior rather than to changes in the baseball. Theincrease due to changes in drag was confirmed in both the StatCastdata and laboratory measurements, both of which show a significantball-to-ball variation in the baseball drag that is large compared to theyear-to-year change in the average drag. The laboratory experiments,using newly developed techniques, show a correlation between dragand seam height, with the average seam height in 2019 smaller thanthat in 2018 by less than 0.001 inches. Other properties of the baseballcontributing to the variation in drag were not identified, althoughvarious hypotheses suggested in the media were ruled out. No evidence
1

was found that changes in baseball performance were due to anythingintentional on the part of Rawlings or MLB and were likely due tomanufacturing variability.
2

1 Introduction
The number of home runs per season in MLB has changed dramaticallyduring the period 2014-2019, as shown in Fig. 1, After a steady downwardtrend during the period 2000-2014, home runs have increased rapidly sincethen, with the exception of the drop in 2018. Indeed, in 2019 a new recordwas set for the most home runs in a season, breaking the previous record setonly two years earlier in 2017.
Figure 1: Yearly home runs per batted ball during the period 2000-2019along with a smooth trendline.
In 2017 MLB commissioned an independent study to investigate thecauses of the home run increase during the period 2015-2017. The resultsof the study were presented in a May 2018 report [1], with the followingprincipal findings:
3

• The primary factor causing the increase in home runs during the 2015-2017 period was a change in the aerodynamic properties of the baseball,specifically a reduction in the average drag coefficient Cd, resultingin baseballs carrying farther for given launch parameters (e.g., exitvelocity EV, launch angle LA, etc.) The increase in home runs was notdue to a change in the launch conditions themselves.
• In any given year, the ball-to-ball variation in Cd is much larger thanthe relatively small change in the mean Cd that accounts for the changein the home run rates between seasons.
• Neither the year-to-year changes nor the significant ball-to-ball varia-tion in Cd could be associated with any specific physical property of theball, such as seam height, surface roughness, size, etc. Nor could thesefactors be explained by any changes in the manufacturing materials orprocesses.
In view of latter finding as well as the significant increase in home runrates during the 2019 season, members of the original committee were re-convened in 2019. The committee set its own agenda and arrived at its ownconclusions and recommendations, independent of MLB. The primary goalsof the committee were to seek answers to the following questions, all of whichare addressed in Sec. 3:
1. What are the physical properties of the baseball that lead to both alarge ball-to-ball variation and to a smaller year-to-year change in itsdrag properties? This question will be addressed in Sec. 3.1.
2. What are the underlying causes of the changes in home run rate duringthe 2018 and 2019 seasons? This question is divided into the followingsub-questions and will be addressed in Sec. 3.2:
• How much of the changes in home run rate are due to changes inthe ball that affect its carry?
• How much of the changes in home run rate are due to changes inlaunch parameters? Is there evidence that changes in launch pa-rameters are due to changes in the baseball as opposed to changesin player behavior?
4
3. Did the home run rate change during the 2019 postseason, and if sowhat is driving that change? This question will be addressed in Sec. 3.3.
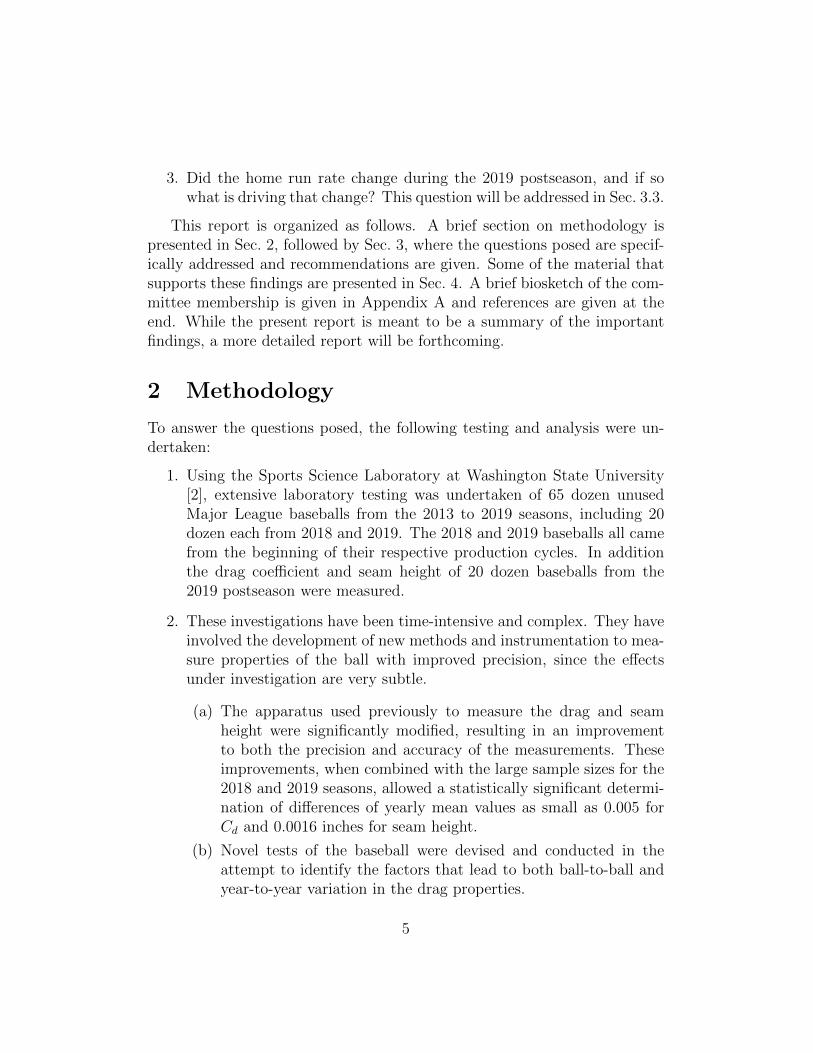
This report is organized as follows. A brief section on methodology ispresented in Sec. 2, followed by Sec. 3, where the questions posed are specif-ically addressed and recommendations are given. Some of the material thatsupports these findings are presented in Sec. 4. A brief biosketch of the com-mittee membership is given in Appendix A and references are given at theend. While the present report is meant to be a summary of the importantfindings, a more detailed report will be forthcoming.
2 Methodology
To answer the questions posed, the following testing and analysis were un-dertaken:
1. Using the Sports Science Laboratory at Washington State University[2], extensive laboratory testing was undertaken of 65 dozen unusedMajor League baseballs from the 2013 to 2019 seasons, including 20dozen each from 2018 and 2019. The 2018 and 2019 baseballs all camefrom the beginning of their respective production cycles. In additionthe drag coefficient and seam height of 20 dozen baseballs from the2019 postseason were measured.
2. These investigations have been time-intensive and complex. They haveinvolved the development of new methods and instrumentation to mea-sure properties of the ball with improved precision, since the effectsunder investigation are very subtle.
(a) The apparatus used previously to measure the drag and seamheight were significantly modified, resulting in an improvementto both the precision and accuracy of the measurements. Theseimprovements, when combined with the large sample sizes for the2018 and 2019 seasons, allowed a statistically significant determi-nation of differences of yearly mean values as small as 0.005 forCd and 0.0016 inches for seam height.
(b) Novel tests of the baseball were devised and conducted in theattempt to identify the factors that lead to both ball-to-ball andyear-to-year variation in the drag properties.
5

3. StatCast data from the 2016-2019 seasons were analyzed.
(a) By modeling the dependence of home run probability on launchparameters, the fraction of the year-to-year home run changesdue to changes in the launch parameters and the fraction due tochanges in the drag were determined.
(b) StatCast trajectory data for fly balls were analyzed to determineCd, including the dependence on spin and the relationship to flyball distance.
(c) The publicly available StatCast trajectory data for pitched base-balls (the so-called 9P parametrization) were analyzed to deter-mine Cd, including determining the dependence on and controllingfor the transverse spin [3].
4. The quality control data on Major League baseballs from Rawlings andUMass/Lowell for the 2010-2019 period were reviewed and analyzed.
3 Findings
3.1 What Baseball Properties Affect Drag?
1. The improved experimental measurements reveal a ball-to-ball correla-tion between Cd and seam height (Fig. 2) with R2 ≈ 0.35 in additionto a strong correlation between the yearly-average Cd and seam heightfor the four periods encompassing the years 2013-2019 (Fig. 3).
2. Other than seam height, none of the other alternate hypotheses dis-cussed in the media (e.g., roundness, surface roughness, lace thickness)are correlated with Cd. Factors other than seam height account forroughly 65% of the ball-to-ball differences in Cd, and have been rela-tively constant between 2013 and 2019. An example is shown in Fig. 4
3. Given the large ball-to-ball variation and the comparatively small year-to-year changes in both Cd and seam height (Fig. 5), large sample sizes(≈ 20 dozen) are needed to compare yearly changes using current testmethods.
4. The aerodynamic flow over a baseball is complex [4], resulting in dragproperties that depend not only on seam height but also on spin rate,
6

spin axis, seam orientation, application of mud (see Fig. 6), and possi-bly other factors not yet identified. While we have learned much fromour studies as well as those of other investigators [5], there is much thatis not yet understood.
3.2 What Drives the Home Run Changes?
1. The StatCast data were analyzed using the technique described byAlbert [6] to separate the home run changes into two parts: a part dueto changes in carry and a part due to changes in launch conditions.The following results are obtained (see Figs. 7-8 and Table 1):
• For 2016-2017, the increase in home runs is primarily due to anincrease in carry, as previously concluded in the 2018 report [1].
• For 2017-2018, the change in home runs is due to two opposingeffects: a change in launch conditions, which would have increasedthe number of home runs; and a decrease in carry, which wouldhave decreased the number of home runs. The combined effectwas a decrease in home runs.
• For 2018-2019, approximately 60% of the home run increase isdue to an increase in carry and 40% to a change in launch con-ditions. As noted above, only 35% of the increase in home runrate attributable to greater carry is due to a change in the seamheight.
2. The part of the home run changes due to carry (both the decrease in2018 and the increases in 2017 and 2019) is consistent with changesin Cd values determined from multiple sources, including the analy-sis of StatCast fly ball and pitched ball trajectories (Fig. 9). Thesemeasurements indicate a decrease in Cd in the 2016-2017 transition,an increase in the 2017-2018 transition, and another decrease in the2018-2019 transition.
3. The laboratory Cd shows a somewhat smaller gap in the 2018-2019transition than those from StatCast, perhaps due to the fact that thelaboratory baseballs were sampled from very early in each productionseason whereas the StatCast baseballs were sampled throughout theentire season. Moreover, the pattern of changes during the period
7

2016-2018 from laboratory measurements (Fig. 3), with much smallersamples sizes in 2016 and 2017, do not follow the pattern from StatCastdata (Fig. 9). These discrepancies are puzzling and perhaps point tothe need for larger sample sizes, such as those available for 2018-2019.
4. Both Cd values and fly ball distances show considerable variation abouttheir mean values (Fig. 10), qualitatively consistent with the ball-to-ball variation in drag found in laboratory experiments. However, forgiven exit velocity and launch angle, the variation of fly ball distancewith rate of backspin and sidespin on the batted ball is much largerthan the variation due to Cd (Table 2). Whether year-to-year changesin those spin rates play a role in the changes in home run rates iscurrently under investigation.
5. Some of the home run increase is due to the changes in launch condi-tions.
• Not only is there a general increase in home run hitting, but therates of hitting home runs has shown a general increase acrossplayers of all slugging abilities (see Fig. 11).
• The parameters contributing to this change are exit velocities,launch angles (see Fig. 12), and spray angles.
• From analysis of the Rawlings and UMass/Lowell test data (Fig. 13),there is some evidence of a small increase in the CCOR of the base-ball between 2018 and 2019. However, that increase was too smallto play a significant role in the home run increase in 2019.
• Lacking strong evidence that the change in launch conditions aredue to changes in the baseball, we conclude that they are due toa change in player behavior.
3.3 Did the Home Run Rate Change in the 2019 Post-season?
1. It is the understanding of the committee that Rawlings uses the samemanufacturing process to create the baseball used in the postseason asthey do to create the ball used in the regular season, save for the appli-cation of the postseason stamp. There would therefore be no reason to
8
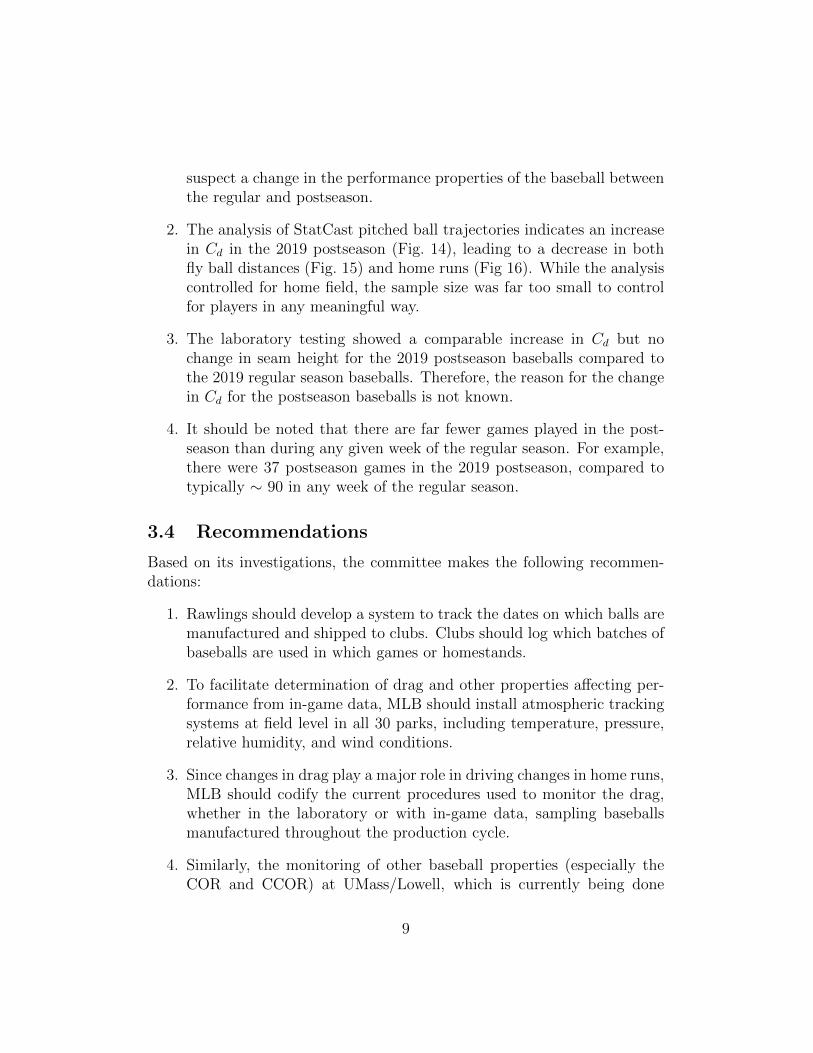
suspect a change in the performance properties of the baseball betweenthe regular and postseason.
2. The analysis of StatCast pitched ball trajectories indicates an increasein Cd in the 2019 postseason (Fig. 14), leading to a decrease in bothfly ball distances (Fig. 15) and home runs (Fig 16). While the analysiscontrolled for home field, the sample size was far too small to controlfor players in any meaningful way.
3. The laboratory testing showed a comparable increase in Cd but nochange in seam height for the 2019 postseason baseballs compared tothe 2019 regular season baseballs. Therefore, the reason for the changein Cd for the postseason baseballs is not known.
4. It should be noted that there are far fewer games played in the post-season than during any given week of the regular season. For example,there were 37 postseason games in the 2019 postseason, compared totypically ∼ 90 in any week of the regular season.
3.4 Recommendations
Based on its investigations, the committee makes the following recommen-dations:
1. Rawlings should develop a system to track the dates on which balls aremanufactured and shipped to clubs. Clubs should log which batches ofbaseballs are used in which games or homestands.
2. To facilitate determination of drag and other properties affecting per-formance from in-game data, MLB should install atmospheric trackingsystems at field level in all 30 parks, including temperature, pressure,relative humidity, and wind conditions.
3. Since changes in drag play a major role in driving changes in home runs,MLB should codify the current procedures used to monitor the drag,whether in the laboratory or with in-game data, sampling baseballsmanufactured throughout the production cycle.
4. Similarly, the monitoring of other baseball properties (especially theCOR and CCOR) at UMass/Lowell, which is currently being done
9

three times each season, should be expanded to sample baseballs man-ufactured throughout the production cycle.
5. In view of the apparent dependence of drag on the applied mud basedon measurements of a small sample, a more extensive study should beperformed with much larger sample.
6. MLB should study the viability of employing humidors in all 30 parksto reduce the variability in storage conditions across the league.
3.5 Summary
The laboratory data show a correlation between seam height and drag. Theyfurther show a large ball-to-ball variation in those quantitites and muchsmaller year-to-year changes in their averages. Indeed, the change in meanseam height between 2018 and 2019 is less than one-thousandth of an inch.Statcast data show that a significant part of the home run increase in 2019was due to a reduction in the drag properties of the baseball, although somewas due to a change in launch parameters. The Rawlings quality controldata show a slight increase in the CCOR for 2019, but that increase did notplay an important role in the home run increase. The committee found noevidence in either this study or the May 2018 report that the changes in base-ball performance were due to anything intentional on the part of Rawlingsor MLB and were likely due to normal manufacturing variability.
10

4 Supporting Material
4.1 Laboratory Analysis
0.30
0.33
0.36
0.39
0.025 0.030 0.035 0.040Seam Height (inches)
Cd
Figure 2: Cd as a function of seam height for 65 dozen baseballs from theperiod 2013-2019, along with a linear regression fit and error band (R2 ≈0.35)
.
11

Fig. 16. Drag as a function of seam height, where squares represent 45°, triangles represent 0° and 90°,
and circles represent 2500 rpm.
The mean ball drag and seam height for four periods spanning 2013‐2019 are presented in Fig. 17. Ball
drag is observed to decrease over time, a trend that is consistent with recent offensive statistics. The
mean seam height also decreases with time and is strongly correlated to drag (r2=0.98). In spite of the
high variance presented in Fig. 15, average seam height appears to be a good indicator of drag, provided
a sufficiently large sample is considered.
Fig. 17. Mean drag and seam height for four periods between 2013 and 2019.
y = 5.28x + 0.17
y = 3.19x + 0.32
y = 1.35x + 0.22
0.20
0.25
0.30
0.35
0.40
0.45
0.50
0.02 0.025 0.03 0.035 0.04
Cd
Seam Height (in)
45°
0° & 90°
2500 rpm
0.028
0.029
0.03
0.031
0.032
0.033
0.034
0.035
0.036
0.037
0.320
0.325
0.330
0.335
0.340
0.345
0.350
0.355
0.360
2013‐15AS 2015B‐17 2018 2019
SH (in)
Cd
Cd
SHn=160
n=140
n=240n=240
Figure 3: Yearly averages of Cd vs. seam height, with standard errors in-dicated by the bars, for the four periods encompassing the years 2013-2019,where 2015AS and 2015B refer to pre- and post-All Star Game in 2015,respectively. The sample sizes are indicated.
12

0.025
0.027
0.029
0.031
0.033
0.035
0.037
0.28
0.3
0.32
0.34
0.36
0.38
Low High
Lace or seam (in)
C DDragLace thicknessSeam height
Figure 4: Comparision of Cd, seam height, and lace thickness for a groupof one dozen each of high-drag and low-drag baseballs. These data show asignificant difference between the two groups in seam height but not in lacethickness.
13

0.30
0.32
0.34
0.36
0.38
2015 2016 2017 2018 2019Year
Cd
0.028
0.032
0.036
0.040
2015 2016 2017 2018 2019Year
Sea
m H
eigh
t (in
ches
)
Figure 5: Box plot of the distribution of yearly averages of Cd (top) and seamheight (bottom), showing that the year-to-year variation of mean values aresignificantly smaller than the variation within any given year. The samplesize was 20 dozen for both 2018 and 2019 and 5 dozen for each of the earlieryears.
14

0.30
0.32
0.34
0.36
before mud after mudcondition
Cd
Figure 6: Boxplot of Cd measurements on a one-dozen sample of new base-balls before and after the application of mud. Even with this limited sample,the data show a significant increase in both the mean and the variation inCd when the mud is applied.
15

4.2 StatCast Analysis
Figure 7: Predicted and observed home run counts for each season. The blackbar represents a 90% confidence interval for the count using a model trainedwith data from the previous season and the red label shows the location ofthe actual home run count. The model was based on exit velocity, launchangle, and spray angle. Including additional variables to the model, such aspark, do not alter the conclusions in any substantial way. The differencesbetween the observed and predicted values are assumed to be due to a changein the carry of the ball, presumably due to a change in drag. For example,a year in which the number of observed home runs (shown in red) is largerthan the predicted number (shown in black) would indicate that the dragcoefficient of the baseball decreased from the previous season.
16

Figure 8: Change in the total number of home runs, the number attributedto the carry of the ball, and the number due to the launch conditions for theseasons 2017, 2018, and 2019. These results are summarized in Table 1.
Table 1: Total increase in home runs, increase due to carry, and increase dueto changes in launch conditions, for the three yearly transitions.
Transition Total Increase Increase Due Increase Due toin Home Runs to Carry Launch Conditions
2016 to 2017 464 522 -582017 to 2018 -418 -936 5182018 to 2019 1169 789 380
17
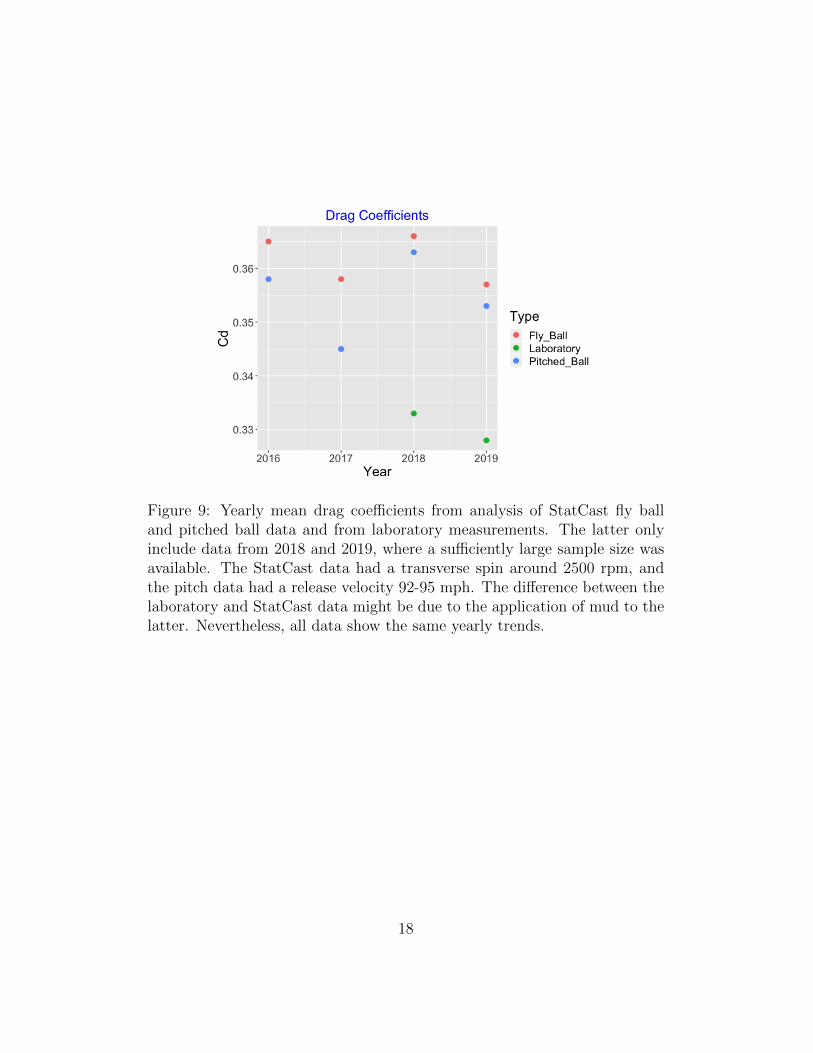
Figure 9: Yearly mean drag coefficients from analysis of StatCast fly balland pitched ball data and from laboratory measurements. The latter onlyinclude data from 2018 and 2019, where a sufficiently large sample size wasavailable. The StatCast data had a transverse spin around 2500 rpm, andthe pitch data had a release velocity 92-95 mph. The difference between thelaboratory and StatCast data might be due to the application of mud to thelatter. Nevertheless, all data show the same yearly trends.
18

365
370
375
380
385
390
395
400
405
410
0.24 0.26 0.28 0.30 0.32 0.34Spin−Independent Cd
Adj
uste
d F
ly B
all D
ista
nce
(ft)
Figure 10: Relationship between fly ball distances and the spin-independentdrag coefficient. The distances are for 100 mph exit velocities and launchangles 25◦-30◦ and have been controlled for air density, spin rate, and spinaxis. The plot shows that the adjusted distances are inversely proportionalto the spin-independent part of the drag coefficient, as expected. The totalspread in distances, ∼8 ft rms, is due primarily to the ball-to-ball variationin Cd (∼6 ft), with the remainder due to experimental noise.
Table 2: Root-mean-square(rms) scatter of fly ball distances for the 2019 sea-son, for covered stadiums. All distances have been controlled for air densityand are for launch conditions with exit velocity 100 mph and launch angles25◦-30◦. Column 1 is the total rms scatter and columns 2-4 are the contribu-tions of spin, drag, and noise, respectively, with σ2
T = σ2spin + σ2
drag + σ2noise.
These results show that the contribution of spin far outweighs the contribu-tion of drag.
σT σspin σdrag σnoise17.1 15.1 6.1 5.2
19

−5
0
5
10
2.5 5.0 7.5 10.0Home Run Rate (Pct)
Incr
ease
in H
R R
ate
(Pct
)Comparing 2018 with 2019
Figure 11: Scatterplot of 2018-to-2019 change in home run rate vs. averagehome run rate for the two seasons, the latter being a measure of sluggingability. Each point represents a single batter with at least 200 batted ballsin each of the two seasons. The blue curve is a trend line. These data showthat the increase in home run rate was widespread across batters of differentslugging ability.
20
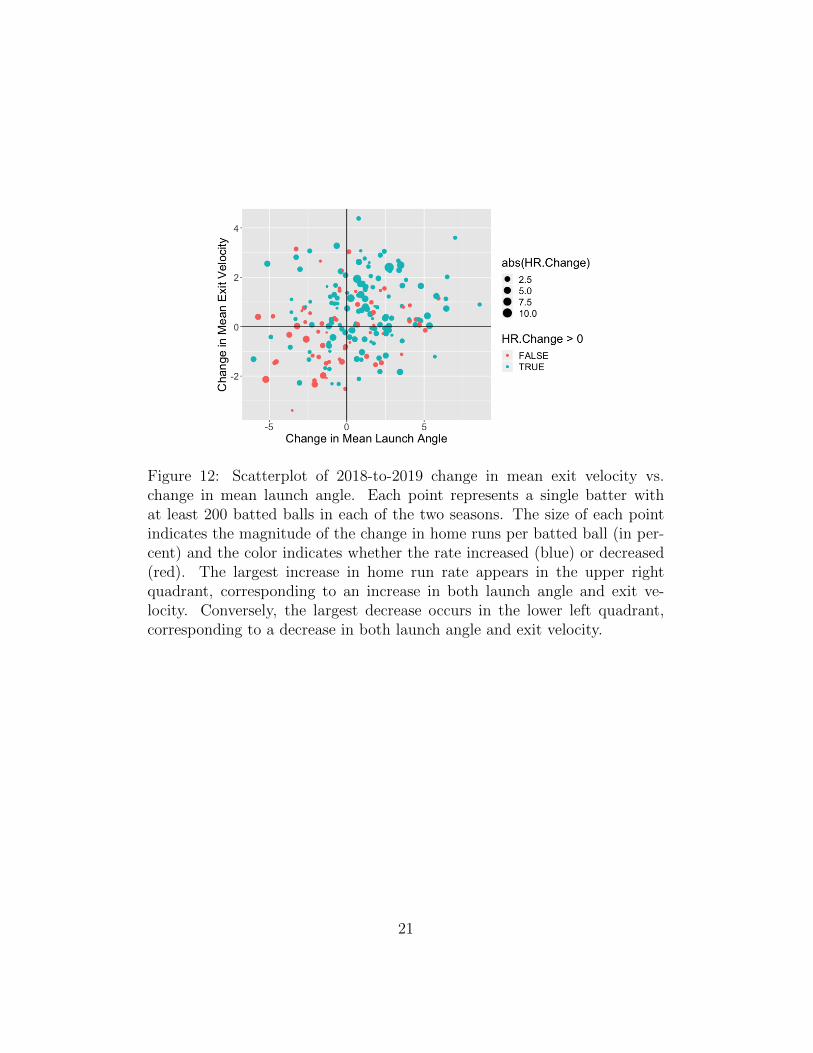
Figure 12: Scatterplot of 2018-to-2019 change in mean exit velocity vs.change in mean launch angle. Each point represents a single batter withat least 200 batted balls in each of the two seasons. The size of each pointindicates the magnitude of the change in home runs per batted ball (in per-cent) and the color indicates whether the rate increased (blue) or decreased(red). The largest increase in home run rate appears in the upper rightquadrant, corresponding to an increase in both launch angle and exit ve-locity. Conversely, the largest decrease occurs in the lower left quadrant,corresponding to a decrease in both launch angle and exit velocity.
21

0.46
0.47
0.48
0.49
0.50
0.51
2018
−01
2018
−07
2019
−01
2019
−07
Date
CC
OR
CCOR From Rawlings, 2018−2019
Figure 13: Test data over time from Rawlings on the high-speed CCOR ofthe baseball for the period 2018-2019. Each point represents the mean of6 or 12 baseballs. Although there is considerable scatter to the data, thereis a definite upward trend over time, as indicated by the smoothing curveand error band. The vertical red line marks the separation between ballstested for use in the 2018 and 2019 seasons. The lower and upper dashedlines are the mean CCOR for 2018 and 2019 balls, respectively, and suggestan increase in the CCOR across the two seasons of approximately 0.0025,which is well within the MLB specifications indicated by the dashed blackhorizontal lines. This increase in CCOR corresponds to an increase in exitvelocity of about 0.3 mph, an increase in fly ball distance by about 1.5 ft,and an increase in home run probability by less than 4%. (see Tables 7-8 in[1]).
22

4.3 Postseason Analysis
2018 2019
2016 2017
20 30 40 20 30 40
0.31
0.32
0.33
0.34
0.35
0.36
0.31
0.32
0.33
0.34
0.35
0.36
Week
Mea
n D
rag
Coe
ffici
ent
Weekly Cd Averages 90−95 mph, 1250−1750 rpm
Postseason Venues Only
Figure 14: Weekly average of drag coefficients from StatCast pitched balldata, all fastballs with release velocity 90-95 mph and transverse spin 1250-1750 rpm. The black and blue points are for the regular season and postsea-son, respectively, with the latter all lumped into week 40. The regular seasondata only include home venues that coincided with the postseason for thatyear. There is a small uptick in Cd in the 2019 postseason.
23

Figure 15: Actual minus predicted fly ball distance for the 2019 postseason.The predicted value is based on a model determined from the 2019 regularseason, including the effect of exit velocity, launch angle, home field, andtempearture. The dots are individual batted ball hits in the distance range350-400 ft. The median of ∼-6 ft shows that fly balls had less carry in thepostseason compared to the regular season, consistent with the increase indrag and the decrease in home runs.
24

Figure 16: Predicted and observed home run counts for each season of play-offs. The black bar represents a 95% prediction interval for the home runrate using model determined from the regular season, including the effect oftemperature, and the red dot shows the location of the actual home run rate.
25

Appendix A The Committee
• Jim Albert is Distinguished University Professor at Bowling GreenState University. He has written many published papers and authoredfour books on the interface of statistical thinking and baseball. He isactive in the Section on Statistics and Sports in the American Sta-tistical Association and is former editor of the Journal of Quantita-tive Analysis of Sports. He contributes regularly on the blog https:
//baseballwithr.wordpress.com that illustrates the use of the sta-tistical system R in exploring baseball data.
• Anette (Peko) Hosoi is the Neil and Jane Pappalardo Professor ofMechanical Engineering and Professor of Mathematics at MIT. She isa Fellow of the American Physical Society (APS) and co-founder ofthe MIT Sports Lab. Her research interests include fluid mechanicsand biomechanics, particularly the intersection of engineering, appliedmathematics, and athletic performance.
• Alan Nathan (chair) is Professor Emeritus of Physics at the Univer-sity of Illinois at Urbana-Champaign and a Fellow of the APS. Aftera successful career doing experimental nuclear/particle physics, he hasspent much of the past two decades doing research in various aspects ofthe physics of baseball. He has written numerous articles, both for aca-demic journals and for the popular media, and runs an oft-visited web-site devoted to the topic, http://baseball.physics.illinois.edu.
• Lloyd Smith is a Professor in the School of Mechanical and Mate-rials Engineering at Washington State University and is a Fellow ofthe ASME and ISEA. He is the director of the Sports Science Labo-ratory (https://ssl.wsu.edu/), which specializes in measuring andmodeling equipment performance and personal protection.
26

References
[1] Jim Albert, et al., “Report of the Committee Studying Home Run Ratesin Major League Baseball”, May 2018 https://atmlb.com/35xv40i.
[2] https://ssl.wsu.edu/
[3] Alan Nathan, “All Spin Is Not Alike,” Baseball Prospectus,March 31, 2015, http://www.baseballprospectus.com/article.
php?articleid=25915
[4] F. Alam, H. Ho, L. Smith, A. Subic, H. Chowdhury, and A. Kumar, “Astudy of baseball and softball aerodynamics,” Procedia Eng., 34, 8691(2012).
[5] Bart Smith, Baseball Aerodynamics web site, http://www.
baseballaero.com.
[6] Jim Albert, “What is Causing the Home Run Explosion,” August 19,2019: http://bit.ly/2XSnoTx.
27