Embed Size (px)
Citation preview
PRELIMINARY REPORT
Do Trenchless Pipeline Construction Methods Reduce Greenhouse Gas Emissions?
Report Prepared for:
Prepared by
Centre for the Advancement of Trenchless Technologies (CATT) Department of Civil and Environmental Engineering
University of Waterloo Waterloo, Ontario
Rashid Rehan
Dr. Mark Knight
September 2007
Do Trenchless Pipeline Construction Methods Reduce Greenhouse Gas Emissions?
September 2007 i
EXECUTIVE SUMMARY ............................................................................................................ 1 1. Introduction............................................................................................................................. 2 2. Literature Review.................................................................................................................... 3 3. Problem Statement .................................................................................................................. 4 4. Methodology........................................................................................................................... 6
4.1. Determination of Speed Reductions and Queuing Delays.............................................. 6 4.2. Determination of CO2 Emissions for different Traffic Control Plans ............................ 9 4.3. Determination of CO2 Emissions due to Operation of Construction Machinery.......... 11
5. Case Studies .......................................................................................................................... 12 5.1. Case Study I .................................................................................................................. 12 5.2. Case Study II................................................................................................................. 13 5.3. Case Study III ............................................................................................................... 14 5.4. Summary ....................................................................................................................... 17
6. Research Needs..................................................................................................................... 18 Acknowledgement .................................................................................................................... 18 References................................................................................................................................. 18
Do Trenchless Pipeline Construction Methods Reduce Greenhouse Gas Emissions?
September 2007 1
EXECUTIVE SUMMARY This document investigates the following hypothesis.
What reduction in greenhouse gas emissions can be expected when trenchless construction methods are used for municipal pipeline construction?
To answer this question a review of the published literature was completed. The literature found no publications on greenhouse gas emissions resulting from open cut or trenchless construction methods. Publications were found that compare trenchless and open cut methods for pipeline construction in terms of traffic delays, direct costs, indirect costs, social costs, and environmental costs. Using information obtained from the literature review a methodology was developed to estimate the amount of greenhouse gas resulting from trenchless and open cut traffic delays on roadways with varying traffic volumes and construction equipment use. Using the methodology developed trenchless and open cut greenhouse gas emissions were determined for the construction of a 300mm diameter pipeline 250m long. The preliminary analysis found that the use of trenchless construction methods can result in 78 to 100 percent lower green house gas emissions than open-cut pipeline installation methods. The reduction in emissions associated with trenchless construction are achieved mainly due to its shorter job duration using less construction equipment and limited or no disruption to traffic flow. It must be emphasized that this is a preliminary estimate that does not include greenhouse gas emissions resulting from: the production and transportation of additional quantities of asphalt concrete and trench restoration materials; loss of pavement life; and/or pavement maintenance and rehabilitation. Thus, it is a conservative preliminary estimate. The report concludes by identifying further research needs that will expand further trenchless technology greenhouse gas emission savings and the applicability of the green house gas calculation methodology.
Do Trenchless Pipeline Construction Methods Reduce Greenhouse Gas Emissions?
September 2007 2
1. Introduction
A major portion of the underground water and wastewater infrastructure in North America is
rapidly approaching the end of its useful service life. Accordingly, large scale construction works
will need to be undertaken for rehabilitating or renewing these vital infrastructure assets.
Underground infrastructure networks have traditionally been installed, repaired, rehabilitated or
renewed using open cut construction - a trench has to be excavated to the required depth and
width along the entire length of pipeline. Although open cut may appear economical in terms of
direct cost it can have high social and environmental costs when the construction work is
executed in densely populated urban areas. Over the past two decades, innovative trenchless
construction methods have become popular for installation and renovation of underground pipe
networks in densely populated urban areas. The North America Society of Trenchless
Technology (NASTT) defines trenchless technology as techniques for utility line installation,
replacement, rehabilitation, renovation, repair, inspection, location and leak detection, with
minimum excavation from the ground surface. Since trenchless construction methods typically
require only minimal excavation (entrance and/or exit pits) or no excavation to install a pipeline
they are considered have lower direct costs and significantly lower social and environmental
costs than open cut. Trenchless technologies include construction methods known as pipe
ramming, horizontal auger boring, micro tunneling, horizontal directional drilling, cured in place
pipe lining, sliplining, and pipe bursting, etc (Najafi and Gokhale, 2005).
This paper completes a preliminary study on open cut and trenchless construction in terms of
their carbon dioxide (CO2) greenhouse gas emissions. Section 2 presents a review of the
published literature with respect to the comparative assessment of open cut and trenchless
technologies while Section 3 provides the problem statement. Section 4 describes a new
Do Trenchless Pipeline Construction Methods Reduce Greenhouse Gas Emissions?
September 2007 3
methodology for completing a preliminary CO2 comparative analysis while Section 5 uses this
methodology to compare open cut and trenchless CO2 emissions for three case studies. A
summary is presented in Section 6 and research needs are discussed in Section 7.
2. Literature Review
Social and environmental cost comparisons among the open cut methods and trenchless
technologies have been of considerable interest to researchers during the past two decades.
McKim, 1997 defined social costs as “costs of construction to society which are not included in
the construction bid.” Cited examples of social costs include post-construction reinstatement of
public and private property, traffic delay and safety costs, environmental costs due to large scale
earthmoving, lost business and tax revenues etc. Jung and Sinha, 2007 also included workers’
safety, and air, water, and noise pollution as social and environmental costs.
Gangavarapu et. al, 2003 compared open cut and trenchless technologies in terms of costs arising
from traffic disruption. In their analysis they considered fuel costs, time delay costs, and vehicle
depreciation costs (for additional miles traveled). Fuel costs were calculated on the basis of
additional detour miles traveled with an average miles per gallon consumption. Labour wages
per hour were used to determine time delay costs.
Boyce and Bried, 1994 developed detailed equations for estimating trenchless construction social
cost savings. In their analysis they considered traffic and pedestrian disruption costs, costs of
public awareness in terms of lost productivity, and lost revenue from parking meters and parking
tickets. In contrast to these detailed estimating methods, McKim, 1997 put forward a
generalized, albeit rough, estimating method based on average social costs from 14 construction
Do Trenchless Pipeline Construction Methods Reduce Greenhouse Gas Emissions?
September 2007 4
projects. Using this generalized estimate method McKim demonstrated the need for including
social costs in selection process of municipal bids.
Tighe et. al, 1999 analyzed costs associated with traffic disruptions due to utility cuts using
various construction durations and typical traffic control plans. In their analysis, equations were
developed that relate costs to annual average daily traffic (AADT) under various traffic control
plans. Costs are determined based on user delays arising from speed delays, queuing delays and
detour delays. Open cut excavation for pipe installations were also shown to result in premature
pavement deterioration. Tighe et. al, 2002 reported that open cut construction can result in a
flexible pavement service life loss of at least 30%. This pavement life loss implies increased
maintenance and rehabilitation costs to maintain the road at an acceptable level of service.
Jung and Sinha, 2007 in their comparative evaluation of trenchless technologies and open cut
methods considered direct, social, and environmental costs. Under social costs, they calculated
traffic delay costs (based on the work of (Tighe et al., 1999)) and income loss to businesses.
Under the environmental category, they evaluated only noise costs. Furthermore, they discussed
but did not quantify productivity, workers’ safety, and structural costs.
No papers were found that estimated or compared greenhouse gases (GHG) emissions resulting
from trenchless or open cut construction methods.
3. Problem Statement
Carbon dioxide (CO2) is one of the major greenhouse gases. This paper attempts to determine the
CO2 emissions associated with open cut and trenchless construction methods for the installation
of municipal pipelines –water and sewer. CO2 emissions result from:
Do Trenchless Pipeline Construction Methods Reduce Greenhouse Gas Emissions?
September 2007 5
Increased fuel consumption due to traffic delays and increased travel distances for
detours;
Fuel consumption of construction machinery and equipment involved in excavation,
compaction, backfilling, and repaving operations;
Fuel consumption used to haul materials to and from the site; and
Manufacture of materials such as pipes, asphalt concrete, back fill materials, chemicals,
etc.
This paper addresses only the first two CO2 emissions sources noted above. Depending upon the
nature of construction work being executed, one or several lanes of a road may be closed to
traffic, lane or shoulder widths may be reduced, or the road may be closed completely to traffic.
These road conditions often cause reduced speeds thereby reducing the road capacity resulting in
queues to build up. When the road is completely closed, traffic has to be diverted to alternate
routes. This result in longer travel distances, more traffic on the detour route and speed
reductions. When the traffic exceeds the capacity of a road, queues build up and vehicles have to
spend more time on the road resulting in higher fuel consumption. Thus in construction zones,
CO2 emission regimes will increase due to altered traffic speeds, idling in queues, and/or
increased travel distances.
The installation of pipelines is completed using heavy machinery that consumes diesel fuel.
Davis and Diegel, 2007 indicate that commercial diesel fuel equipment generates more CO2 than
non commercial gasoline vehicles. According to the EPA (2005) 10.1 kg of CO2 is generated for
each a gallon of diesel fuel consumed.
Do Trenchless Pipeline Construction Methods Reduce Greenhouse Gas Emissions?
September 2007 6
4. Methodology
4.1. Determination of Speed Reductions and Queuing Delays
Depending upon the layout of the construction zone on a road, various traffic control plans can
be implemented. These traffic control plans will alter the geometric conditions of road and hence
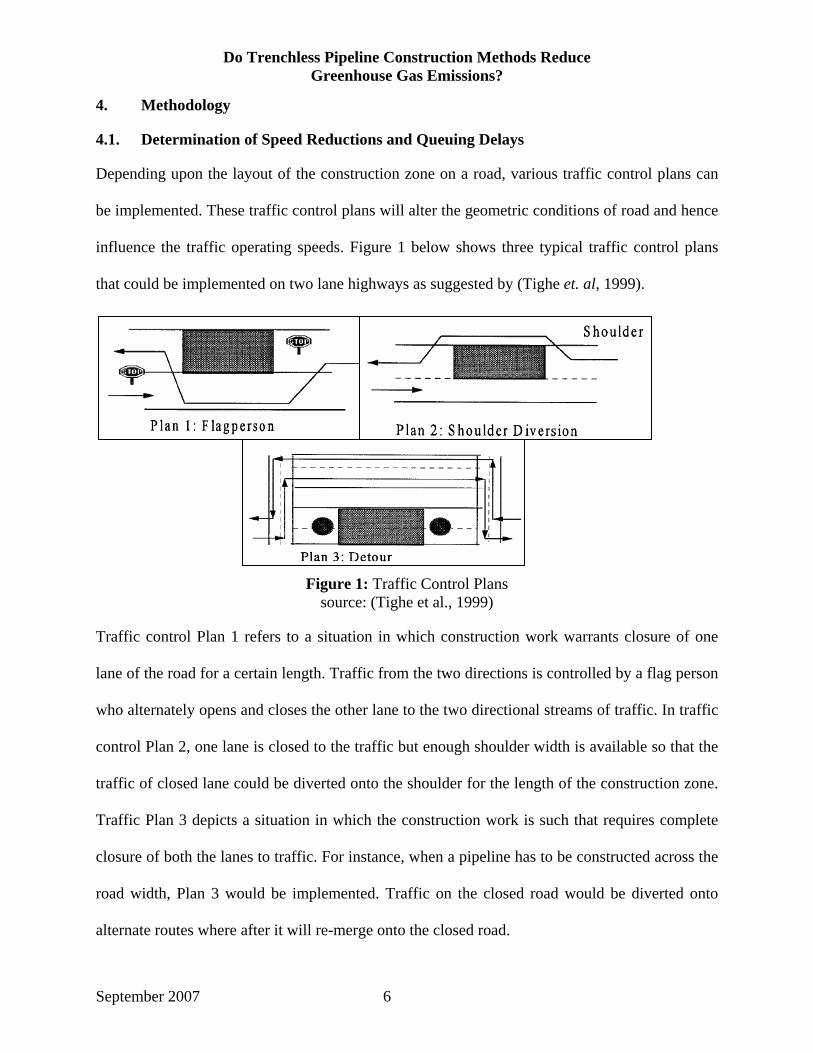
influence the traffic operating speeds. Figure 1 below shows three typical traffic control plans
that could be implemented on two lane highways as suggested by (Tighe et. al, 1999).
Figure 1: Traffic Control Plans source: (Tighe et al., 1999)
Traffic control Plan 1 refers to a situation in which construction work warrants closure of one
lane of the road for a certain length. Traffic from the two directions is controlled by a flag person
who alternately opens and closes the other lane to the two directional streams of traffic. In traffic
control Plan 2, one lane is closed to the traffic but enough shoulder width is available so that the
traffic of closed lane could be diverted onto the shoulder for the length of the construction zone.
Traffic Plan 3 depicts a situation in which the construction work is such that requires complete
closure of both the lanes to traffic. For instance, when a pipeline has to be constructed across the
road width, Plan 3 would be implemented. Traffic on the closed road would be diverted onto
alternate routes where after it will re-merge onto the closed road.
Do Trenchless Pipeline Construction Methods Reduce Greenhouse Gas Emissions?
September 2007 7
Tighe et al., 1999 have utilized traffic analysis techniques provided in TRB, 1994 to derive a
simplified approach for calculating speed reductions and queuing delays arising due to the above
mentioned traffic control plans. A brief description of this approach is presented below. The
following discussion has been adopted from Tighe et al., 1999 unless indicated otherwise.
The normal capacity of a two-lane road is calculated using:
wnn FxxCAP 72.01400= (1)
where CAPn is normal capacity of a single lane (vehicles/hour/lane), 1400 is the number of
passenger cars on each lane under ideal conditions (vehicles/hour/lane), 0.72 is an adjustment
factor that reduces capacity to account for the presence of heavy vehicles, and Fwn is an
adjustment factor that incorporates the effects of narrow lanes and shoulder widths on capacity.
For different lane widths (metres), Fwn is calculated as a function of shoulder width (SHD in
metres) using:
2021040.020935.071285.0 SHDSHDFwn −+= (2)
2016662.019016.067295.0 SHDSHDFwn −+= (3)
2015654.017889.062588.0 SHDSHDFwn −+= (4)
2020156.017525.056485.0 SHDSHDFwn −+= (5)
2020156.015413.049142.0 SHDSHDFwn −+= (6) where equations 2, 3, 4, 5 and 6 are for lane widths of 3.75, 3.5, 3.25, 3.0, and 2.75 metres respectively.
When the lanes are narrow and shoulders are restricted, such as under plans 1 and 2, the reduced
capacity of a lane is calculated using Equation 1 with Fwn modified accordingly.
Do Trenchless Pipeline Construction Methods Reduce Greenhouse Gas Emissions?
September 2007 8
To determine the reduced traffic speeds under the changed traffic flow regimes, another
parameter, i.e. hourly volume (HV), needs to be calculated. HV (vehicles/hour/lane) translates the
annual average daily flow volume into an hourly volume for one lane while taking seasonal and
directional split (DF) factors into account. For a two-lane highway, it is given by:
125.02.1 xAADTxDFxHV = (7)
where 1.2 is average summer factor for Ontario, and 0.125 is an adjustment factor for two-lane
highways. With the normal capacity, reduced capacity and hourly volume known, the normal
speed and reduced speed is calculated using:
32
622.6114.100047.71322.99 ⎟⎟⎠
⎞⎜⎜⎝
⎛−⎟⎟
⎠
⎞⎜⎜⎝
⎛+⎟⎟
⎠
⎞⎜⎜⎝
⎛−=
nnnn CAP
HVCAPHV
CAPHVV (8)
32
505.58133.90406.60584.94 ⎟⎟⎠
⎞⎜⎜⎝
⎛−⎟⎟
⎠
⎞⎜⎜⎝
⎛+⎟⎟
⎠
⎞⎜⎜⎝
⎛−=
rrrr CAP
HVCAPHV
CAPHVV (9)
where Vn and Vr are speeds under the normal conditions and under a traffic control plan
respectively.
Tighe et al., 1999 have used these equations only for determining the speed reductions under
traffic control Plan 2. Since Tighe et al., 1999 are primarily interested in time delays that are
caused, (traffic control Plan 1), they focused only on the delay arising from the traffic streams
coming to complete stop and then waiting for the lane to be cleared for them alternately.
Similarly, for traffic Plan 3, they have measured only the additional time that has to be spent
while traversing the detour.
The present study takes into consideration the speed reductions for both plans 1 and 3. For Plan
1, the reduced speed given by Equation 9 modified to consider that traffic will have to accelerate
Do Trenchless Pipeline Construction Methods Reduce Greenhouse Gas Emissions?
September 2007 9
from a state of rest when it is cleared for moving. While this effect can be calculated using
Newton’s First and Second laws of motion, it was assumed to be taken into account by an
arbitrary 20 percent reduction to the speed determined using Equation 9 under traffic control
Plan 1. For traffic control Plan 3, the normal speed is calculated for the detour road using its own
hourly volume of traffic, lane width and shoulder width. To calculate the reduced speed, the
hourly volume is the sum of the hourly volume of the diverted traffic and the existing traffic on
the detour road. This summation of hourly volumes is inserted into Equation 9 to arrive at the
reduced speed that will prevail on the detour road.
As mentioned earlier, for traffic control Plan 1, traffic streams are stopped to use the sole open
lane alternately. Tighe et al., 1999 calculated the idling time using:
( )[ ] ( ) ( )( )[ ]3600
16111733600138.0
5.0222rCAPXXXXCgCD +−+−
+−
= (10)
where D is the average delay time (hour/vehicle/hour), C is the cycle length time (seconds) under
Plan 1 for the stop and go signals by the flag person, g is the green time (seconds), and
X=HV/CAPr . C and g are dependent on the annual average daily traffic (AADT). Values of both
C and g for different AADT ranges have been presented in Tighe et al., 1999.
4.2. Determination of CO2 Emissions for different Traffic Control Plans
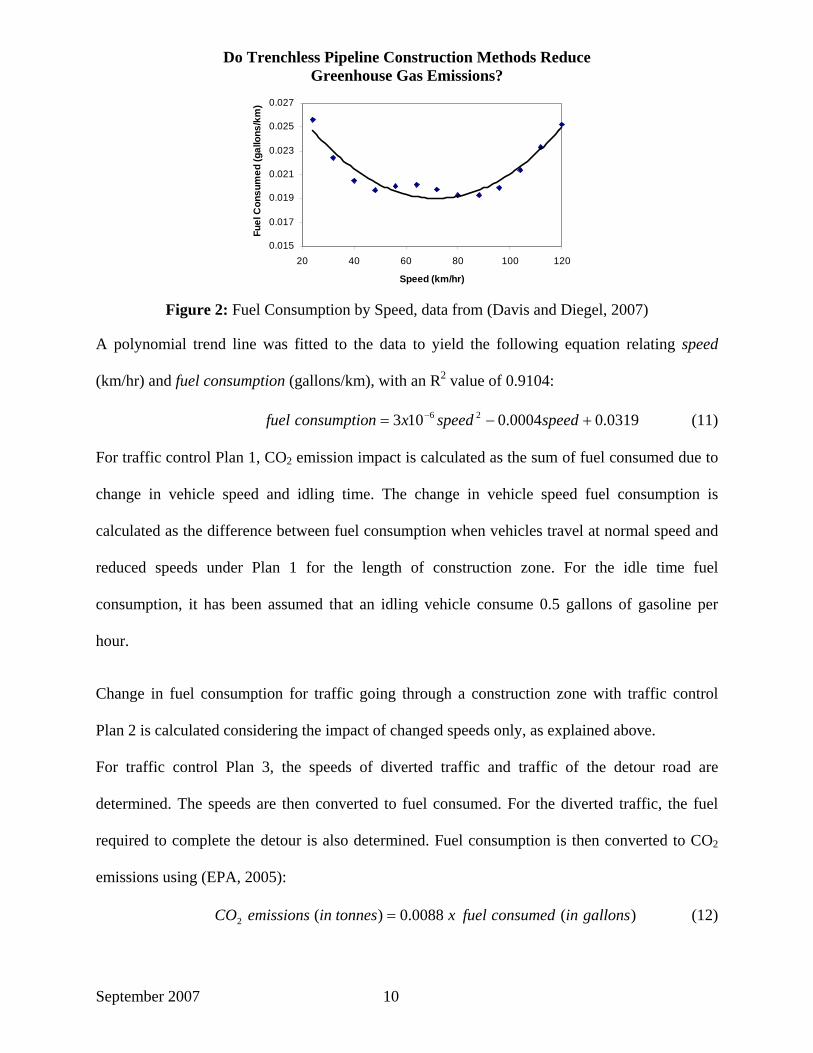
As mentioned earlier, vehicle fuel consumption depends upon the operating speeds. Data for
average fuel economy for a mix of various vehicle types under varying operating speeds has
been reported in Davis and Diegel, 2007. The fuel economy, provided as miles per gallon, was
converted gallons per kilometre and speed was converted from miles per hour into kilometres per
hour to produce Figure 2.
Do Trenchless Pipeline Construction Methods Reduce Greenhouse Gas Emissions?
September 2007 10
0.015
0.017
0.019
0.021
0.023
0.025
0.027
20 40 60 80 100 120
Speed (km/hr)
Fuel
Con
sum
ed (g
allo
ns/k
m)
Figure 2: Fuel Consumption by Speed, data from (Davis and Diegel, 2007)
A polynomial trend line was fitted to the data to yield the following equation relating speed
(km/hr) and fuel consumption (gallons/km), with an R2 value of 0.9104:
0319.00004.0103 26 +−= − speedspeedxnconsumptiofuel (11)
For traffic control Plan 1, CO2 emission impact is calculated as the sum of fuel consumed due to
change in vehicle speed and idling time. The change in vehicle speed fuel consumption is
calculated as the difference between fuel consumption when vehicles travel at normal speed and
reduced speeds under Plan 1 for the length of construction zone. For the idle time fuel
consumption, it has been assumed that an idling vehicle consume 0.5 gallons of gasoline per
hour.
Change in fuel consumption for traffic going through a construction zone with traffic control
Plan 2 is calculated considering the impact of changed speeds only, as explained above.
For traffic control Plan 3, the speeds of diverted traffic and traffic of the detour road are
determined. The speeds are then converted to fuel consumed. For the diverted traffic, the fuel
required to complete the detour is also determined. Fuel consumption is then converted to CO2
emissions using (EPA, 2005):
)(0088.0)(2 gallonsinconsumedfuelxtonnesinemissionsCO = (12)
Do Trenchless Pipeline Construction Methods Reduce Greenhouse Gas Emissions?
September 2007 11
4.3. Determination of CO2 Emissions due to Operation of Construction Machinery
The installation of pipelines using open cut and trenchless construction methods involves the use
of construction machinery, such as, excavators, backhoes, loaders, and hauling trucks, etc.
To determine the heavy construction equipment CO2 emissions, the time duration for which any
piece of equipment is operated has to be determined and the associated fuel consumption. Data
reported in RS Means (2006) was used to estimate the time for various construction activities to
be completed. Peurifoy, et al (2002) indicates that construction equipment fuel consumption can
range from one gallon per hour to 11.5 gallons per hour depending on the equipment utilization -
low, medium or high. For this analysis a conservative fuel consumption rate of 2.4 gallons per
hour was used to determine the amount of CO2 generated. The fuel consumption was converted
to kg of CO2 using 10.1 kg of CO2 for each a gallon of diesel fuel used (EPA, 2005).
For example, a 100m long, 3m deep and 1m wide trench required excavating 300m3 (392 cubic
yards) of earth. RS Means (2006) suggests that an excavator with 1 cubic metre bucket capacity
can excavate 400 cubic metres per day (for 8 hour work day). Thus, the excavator would need to
operate for 8 hours to complete the 100 m long, 3m deep and 1m wide trench. Using 2.4 gallons
of fuel per hour the excavation of the trench would produce approximately 200 kg of CO2.
Similarly, the job durations for backhoes, front end loaders, compactors, required for excavating,
backfilling and restoring the trench or pits were determined.
The total amount of CO2 was determined by adding the amount determined in Section 4.2 and
4.3.
Do Trenchless Pipeline Construction Methods Reduce Greenhouse Gas Emissions?
September 2007 12
5. Case Studies
To facilitate calculations for various scenarios, a spreadsheet model was developed using the
foregoing discussion in Section 4. The utility of this model is demonstrated through the use of
hypothetical case studies where CO2 emissions from open-cut and trenchless construction
methods are compared. Job duration for the open-cut pipeline installation is estimated using the
approach described in Section 4.3. For trenchless construction pipeline installation the Jung and
Sinha, (2007) production rate of 200 m/day was used and it was assumed that only entrance and
exit pits would be required at the start and end of the project. Each case study investigates the
installation of a 250 metres long, 300mm diameter pipeline to replace an existing sewer or
watermain whose performance has been determined as inadequate. Three case studies are
presented, one each for traffic control plans 1, 2 and 3.
5.1. Case Study I
The existing pipeline is under a two-way highway. The open-cut method requires excavation of a
trench along the road to extract the existing pipe and replace it with a new one. If trenchless
construction is used, then an entry pit and exit pit will be needed at the starting and terminating
points of the pipe being installed. Hence both methods would require closing of one lane of the
road for construction purposes. Hence traffic control Plan 1 will be implemented, that will close
a 250 metres long section of the highway. Using the methodology described in Section 4.3, the
job duration for open-cut method was estimated to be 120 working hours, while that for
trenchless construction, the job duration was estimated to be 10 hours. Simulations were
performed for AADT values ranging from 3,500 to 10,000 on the highway. The results for
increased emissions due to construction activities using open-cut and trenchless construction are
shown Figure 3.
Do Trenchless Pipeline Construction Methods Reduce Greenhouse Gas Emissions?
September 2007 13
0
10
20
30
40
50
60
70
80
90
100
3,500 4,500 5,500 6,500 7,500 8,500 9,500AADT
Tonn
es o
f CO
2Open cutTrenchless
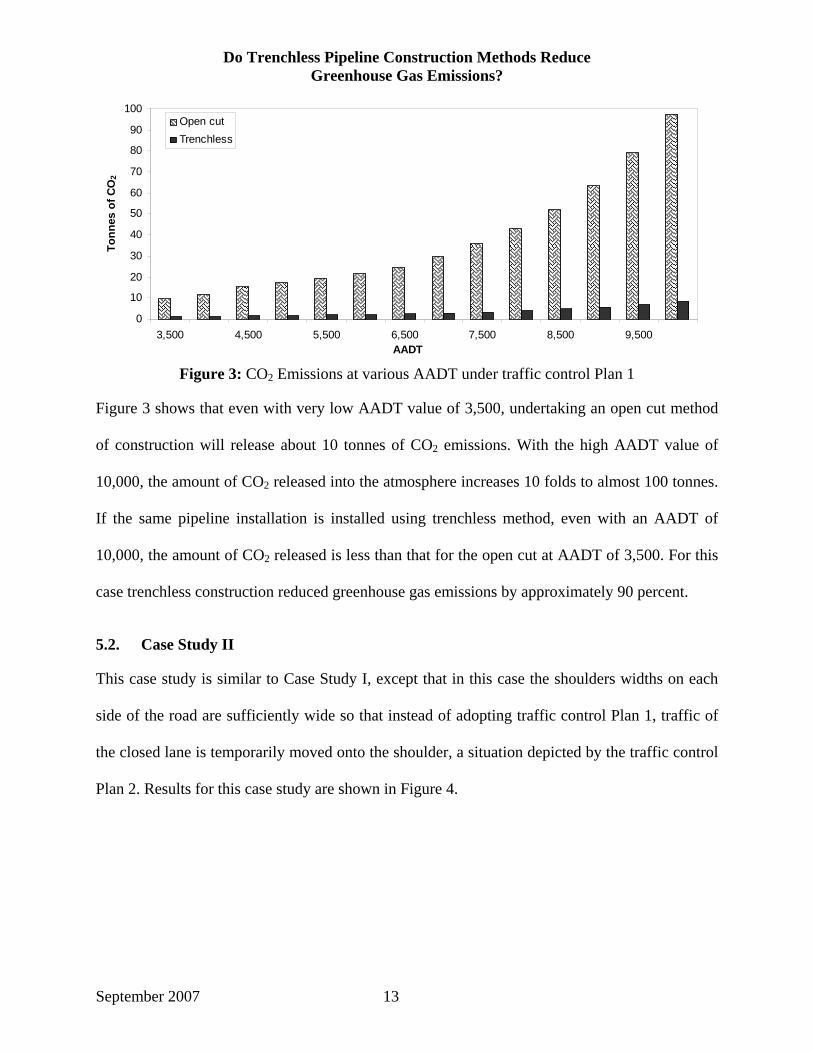
Figure 3: CO2 Emissions at various AADT under traffic control Plan 1
Figure 3 shows that even with very low AADT value of 3,500, undertaking an open cut method
of construction will release about 10 tonnes of CO2 emissions. With the high AADT value of
10,000, the amount of CO2 released into the atmosphere increases 10 folds to almost 100 tonnes.
If the same pipeline installation is installed using trenchless method, even with an AADT of
10,000, the amount of CO2 released is less than that for the open cut at AADT of 3,500. For this
case trenchless construction reduced greenhouse gas emissions by approximately 90 percent.
5.2. Case Study II
This case study is similar to Case Study I, except that in this case the shoulders widths on each
side of the road are sufficiently wide so that instead of adopting traffic control Plan 1, traffic of
the closed lane is temporarily moved onto the shoulder, a situation depicted by the traffic control
Plan 2. Results for this case study are shown in Figure 4.
Do Trenchless Pipeline Construction Methods Reduce Greenhouse Gas Emissions?
September 2007 14
0.0
0.5
1.0
1.5
2.0
2.5
3.0
3.5
4.0
4.5
3,500 4,500 5,500 6,500 7,500 8,500 9,500
AADT
Tonn
es o
f CO
2Open cutTrenchless
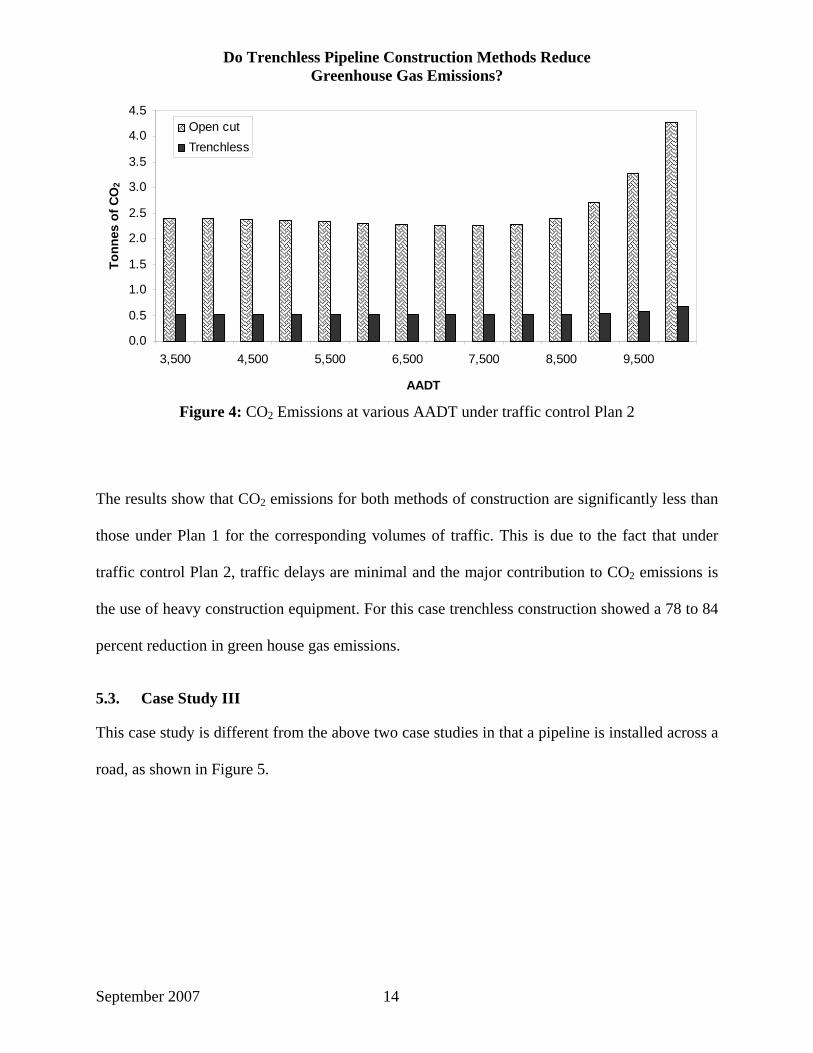
Figure 4: CO2 Emissions at various AADT under traffic control Plan 2
The results show that CO2 emissions for both methods of construction are significantly less than
those under Plan 1 for the corresponding volumes of traffic. This is due to the fact that under
traffic control Plan 2, traffic delays are minimal and the major contribution to CO2 emissions is
the use of heavy construction equipment. For this case trenchless construction showed a 78 to 84
percent reduction in green house gas emissions.
5.3. Case Study III
This case study is different from the above two case studies in that a pipeline is installed across a
road, as shown in Figure 5.
Do Trenchless Pipeline Construction Methods Reduce Greenhouse Gas Emissions?
September 2007 15
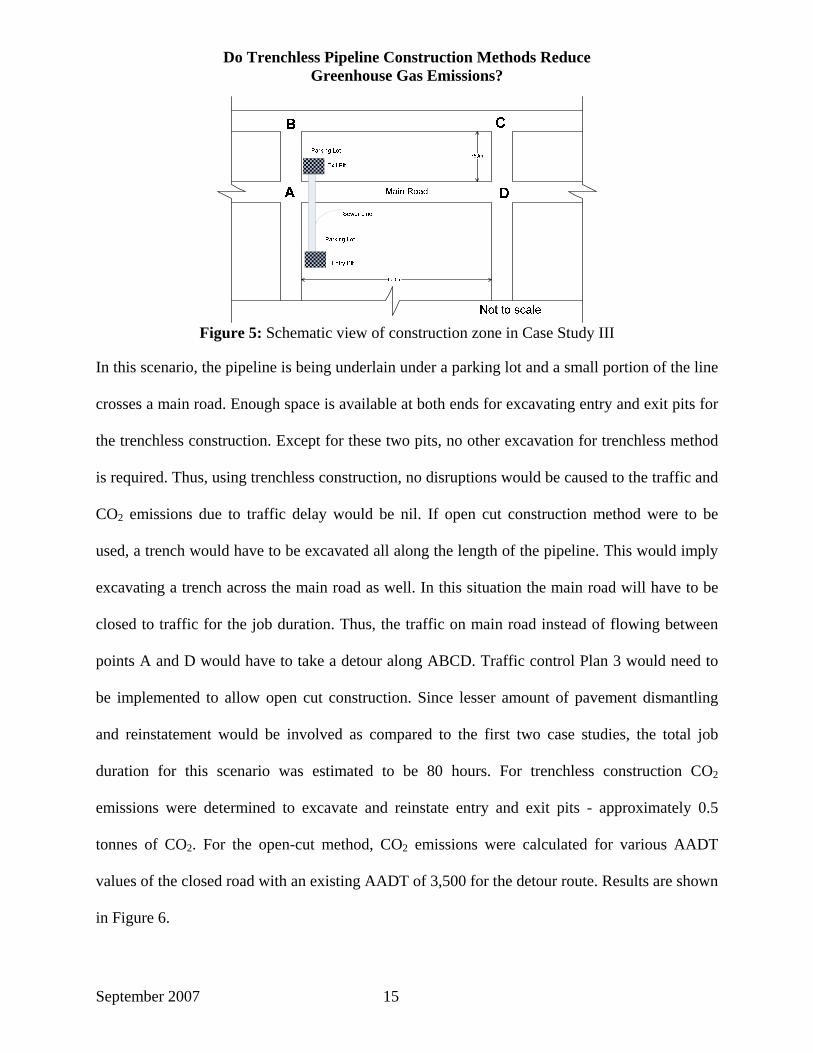
Figure 5: Schematic view of construction zone in Case Study III
In this scenario, the pipeline is being underlain under a parking lot and a small portion of the line
crosses a main road. Enough space is available at both ends for excavating entry and exit pits for
the trenchless construction. Except for these two pits, no other excavation for trenchless method
is required. Thus, using trenchless construction, no disruptions would be caused to the traffic and
CO2 emissions due to traffic delay would be nil. If open cut construction method were to be
used, a trench would have to be excavated all along the length of the pipeline. This would imply
excavating a trench across the main road as well. In this situation the main road will have to be
closed to traffic for the job duration. Thus, the traffic on main road instead of flowing between
points A and D would have to take a detour along ABCD. Traffic control Plan 3 would need to
be implemented to allow open cut construction. Since lesser amount of pavement dismantling
and reinstatement would be involved as compared to the first two case studies, the total job
duration for this scenario was estimated to be 80 hours. For trenchless construction CO2
emissions were determined to excavate and reinstate entry and exit pits - approximately 0.5
tonnes of CO2. For the open-cut method, CO2 emissions were calculated for various AADT
values of the closed road with an existing AADT of 3,500 for the detour route. Results are shown
in Figure 6.
Do Trenchless Pipeline Construction Methods Reduce Greenhouse Gas Emissions?
September 2007 16
0
5
10
15
20
25
30
35
40
45
3,500 4,500 5,500 6,500 7,500 8,500 9,500AADT
Tonn
es o
f CO
2
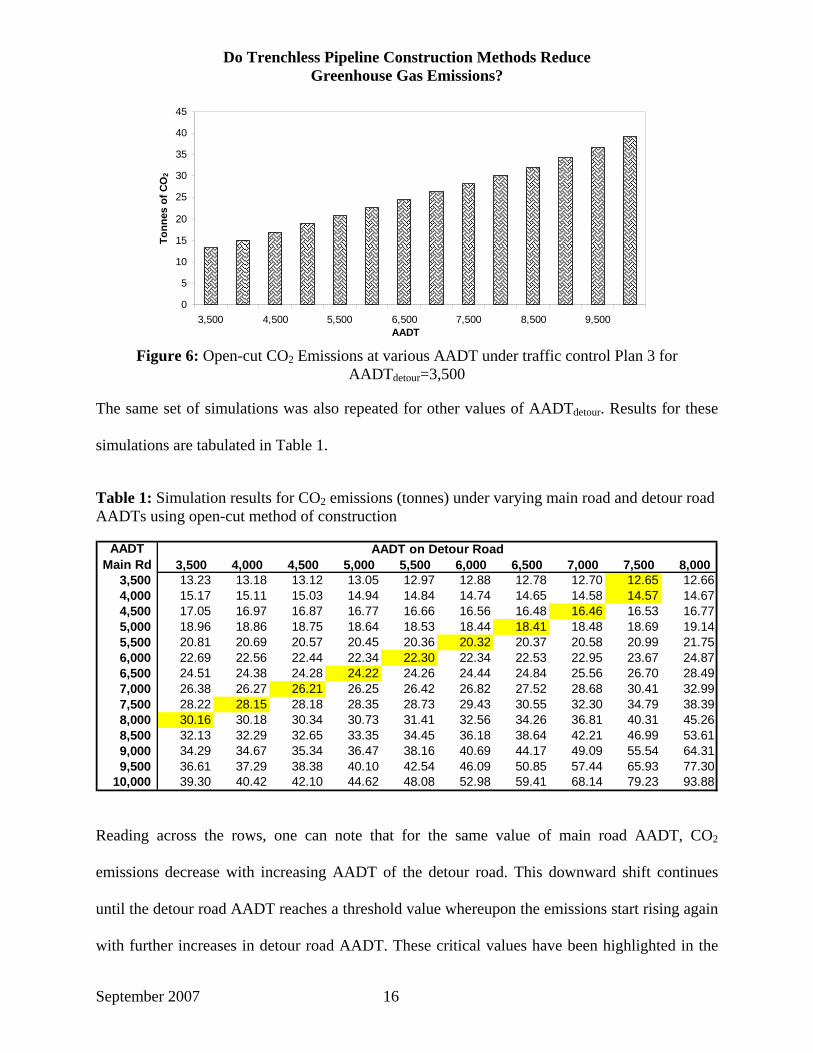
Figure 6: Open-cut CO2 Emissions at various AADT under traffic control Plan 3 for
AADTdetour=3,500
The same set of simulations was also repeated for other values of AADTdetour. Results for these
simulations are tabulated in Table 1.
Table 1: Simulation results for CO2 emissions (tonnes) under varying main road and detour road AADTs using open-cut method of construction
3,500 4,000 4,500 5,000 5,500 6,000 6,500 7,000 7,500 8,000 3,500 13.23 13.18 13.12 13.05 12.97 12.88 12.78 12.70 12.65 12.664,000 15.17 15.11 15.03 14.94 14.84 14.74 14.65 14.58 14.57 14.674,500 17.05 16.97 16.87 16.77 16.66 16.56 16.48 16.46 16.53 16.775,000 18.96 18.86 18.75 18.64 18.53 18.44 18.41 18.48 18.69 19.145,500 20.81 20.69 20.57 20.45 20.36 20.32 20.37 20.58 20.99 21.756,000 22.69 22.56 22.44 22.34 22.30 22.34 22.53 22.95 23.67 24.876,500 24.51 24.38 24.28 24.22 24.26 24.44 24.84 25.56 26.70 28.497,000 26.38 26.27 26.21 26.25 26.42 26.82 27.52 28.68 30.41 32.997,500 28.22 28.15 28.18 28.35 28.73 29.43 30.55 32.30 34.79 38.398,000 30.16 30.18 30.34 30.73 31.41 32.56 34.26 36.81 40.31 45.268,500 32.13 32.29 32.65 33.35 34.45 36.18 38.64 42.21 46.99 53.619,000 34.29 34.67 35.34 36.47 38.16 40.69 44.17 49.09 55.54 64.319,500 36.61 37.29 38.38 40.10 42.54 46.09 50.85 57.44 65.93 77.30
10,000 39.30 40.42 42.10 44.62 48.08 52.98 59.41 68.14 79.23 93.88
AADT on Detour RoadAADT Main Rd
Reading across the rows, one can note that for the same value of main road AADT, CO2
emissions decrease with increasing AADT of the detour road. This downward shift continues
until the detour road AADT reaches a threshold value whereupon the emissions start rising again
with further increases in detour road AADT. These critical values have been highlighted in the
Do Trenchless Pipeline Construction Methods Reduce Greenhouse Gas Emissions?
September 2007 17
table for ready reference. Furthermore, it can be seen that the above trends are valid only up to
main road AADT of 8,000. For main road AADTs above 8,000, the emissions follow an
increasing trend with the rising values of detour road AADTs. For Case III the analysis indicates
that the use of trenchless construction will result in a 100 percent reduction in greenhouse gas
emissions.
5.4. Summary
This study demonstrated that large amounts of CO2 are released due to traffic disruptions
associated with construction of sewers under major roads. It also shows that depending on the
traffic plan used a small net reduction in CO2 emissions may occur due to reduced speeds that
increases vehicle fuel economy. Time delays during vehicle slow downs will still occur. It was
also shown that trenchless construction is considerably efficient in reducing CO2 emissions. This
reduction in emissions is mainly due to its shorter job duration for heavy construction equipment
and limited or no disruption to traffic flow. The three case studies show that 78 to 100 percent
reduction in green house gas emission can be realized through the use of trenchless construction
methods.
The amount of CO2 emissions determined in this study are considered to be conservative as
sources of CO2 emissions associated with the production and transportation of additional
quantities of asphalt concrete, and trench restoration materials were not calculated. CO2
emissions resulting from loss of pavement life, pavement maintenance and rehabilitation were
also not determined. Since these activities would increase traffic delays they are expected to
increase the total amount of CO2 emissions for open-cut method.
Do Trenchless Pipeline Construction Methods Reduce Greenhouse Gas Emissions?
September 2007 18
6. Research Needs
This study addressed the need of comparing CO2 emissions associated with open cut and
trenchless construction. Many simplifying assumptions were made in this study. Thus, there is
considerable room to increase the scope of this research topic.
This study was limited in application to a short pipe length and small diameter. Annual net CO2
emissions need to be calculated based on typical sewer construction projects. These net savings
can be then be compared to reductions in the number of vehicles off the road, etc. Other factors
that can be investigated include: small and large diameter (1m and greater) pipeline projects;
other trenchless construction methods (directional drilling, microtunnelling, jack and bore, and
renovation); road type (multi-lane highways - divided and undivided), and the development of a
more rigorous analytical method. The study can also be expanded to include CO2 contributions
resulting from materials’ production and transportation and other second order effects, such as,
open-cut pavement loss of service life.
Acknowledgement
This report was prepared by funding provided by the British Columbia Chapter of the North America Society of Trenchless Technology.
References
Boyce, G. M., & Bried, E. M. (1994). Estimating the social cost savings of trenchless techniques. No-Dig Engineering, 1(2), 2-5.
Davis, S. C., & Diegel, S. W. (2007). Transportation energy data book (26th ed.). Oak Ridge, Tennessee 37831-6073: Oak Ridge National Laboratory. Retrieved June 28, 2007, from http://cta.ornl.gov/data/download26.shtml
Environmental Protection Agency (EPA). (2005). Emission facts: Average carbon dioxide emissions resulting from gasoline and diesel fuel. Retrieved August/7, 2007, from http://www.epa.gov/otaq/climate/420f05001.htm#calculating
Do Trenchless Pipeline Construction Methods Reduce Greenhouse Gas Emissions?
September 2007 19
Gangavarapu, B. S., Najafi, M., & Salem, O. (2003). Quantitative analysis and comparison of traffic disruption using open-cut and trenchless methods of pipe installation. Proceedings of the ASCE International Conference on Pipeline Engineering and Construction, , 2 1714-1724.
Jung, Y. J., & Sinha, S. K. (2007). Evaluation of trenchless technology methods for municipal infrastructure system. Journal of Infrastructure Systems, 13(2), 144-156.
McKim, R. A. (1997). Bidding strategies for conventional and trenchless technologies considering social costs. Canadian Journal of Civil Engineering, 24(5), 819-827.
Najafi, M., & Gokhale, S. B. (2005). Trenchless technology : Pipeline and utility design, construction, and renewal. New York: McGraw-Hill.
Peurifoy, R. L., and Schexnayder, C. J., (2002). Construction Planning, Equipment, and Methods, 6th Ed., McGraw-Hill, New York, 2002, 669 p.
RS Means (2006). Site work & landscape cost data - Site work & landscape cost data, v. 25.
Tighe, S., Knight, M., Papoutsis, D., Rodriguez, V., & Walker, C. (2002). User cost savings in eliminating pavement excavations through employing trenchless technologies. Canadian Journal of Civil Engineering, 29(5), 751-761.
Tighe, S., Lee, T., McKim, R., & Haas, R. (1999). Traffic delay cost savings associated with trenchless technology. Journal of Infrastructure Systems, 5(2), 45-52.
Transportation Research Board (TRB). (1994). Highway capacity manual, special report 209 (3rd ed.). Washington, D.C.: National Research Council.