Embed Size (px)
Citation preview
ISSN 1728-5445
studies andPERSPECTIves
eclac subregionalheadquarters for the caribbean
Preliminary overview of the economies of the Caribbean 2017–2018
Sheldon McLean Dillon Alleyne Michael Hendrickson Machel Pantin Nyasha Skerrette
SE
RI
ES
Thank you for your interest in
this ECLAC publication
Please register if you would like to receive information on our editorial
products and activities. When you register, you may specify your particular
areas of interest and you will gain access to our products in other formats.
www.cepal.org/en/suscripciones
ECLACPublications
Preliminary overview of the economies of the Caribbean 2017–2018
Sheldon McLean
Dillon Alleyne
Michael Hendrickson
Machel Pantin
Nyasha Skerrette
74
This document has been prepared by Sheldon McLean, Coordinator of the Economic Development Unit of the Economic Commission for Latin America and the Caribbean (ECLAC) subregional headquarters for the Caribbean, with the assistance of Dillon Alleyne and Michael Hendrickson, Economic Affairs Officers, and Machel Pantin and Nyasha Skerrette, Economic Affairs Assistants.
The views expressed in this document, which has been reproduced without formal editing, are those of the authors and do not necessarily reflect the views of the Organization. United Nations publication ISSN: 1728-5445 (electronic version) ISSN: 1727-9917 (print version) LC/TS.2019/6 LC/CAR/TS.2018/2 Distribution: L Copyright © United Nations, 2019 All rights reserved Printed at United Nations, Santiago S.18-01013 This publication should be cited as: S. McLean and others, “Preliminary overview of the economies of the Caribbean 2017-2018”, Studies and Perspectives Series – ECLAC Subregional Headquarters for the Caribbean, No. 74 (LC/TS.2019/6; LC/CAR/TS.2018/2), Santiago, Economic Commission for Latin America and the Caribbean (ECLAC), 2019. Applications for authorization to reproduce this work in whole or in part should be sent to the Economic Commission for Latin America and the Caribbean (ECLAC), Publications and Web Services Division, [email protected]. Member States and their governmental institutions may reproduce this work without prior authorization, but are requested to mention the source and to inform ECLAC of such reproduction.
ECLAC – Studies and Perspectives Series – The Caribbean – No. 74 Preliminary overview of the economies of the Caribbean…
3
Contents
Abstract ..................................................................................................................................................... 5
Introduction ............................................................................................................................................... 7
I. Macroeconomic policy ................................................................................................................. 11
A. Fiscal policy and public debt .................................................................................................. 11
1. Fiscal flexibility ............................................................................................................. 14
2. Public debt ..................................................................................................................... 15
3. Debt service payments ................................................................................................... 16
B. Monetary policy, domestic credit and inflation...................................................................... 17
1. Interest rates ................................................................................................................... 17
2. Monetary supply and credit ............................................................................................ 19
3. Inflation .......................................................................................................................... 20
II. The external sector ....................................................................................................................... 23
A. Current account ...................................................................................................................... 23
B. Terms of trade ........................................................................................................................ 24
C. Foreign direct investment ....................................................................................................... 25
III. Conclusion ..................................................................................................................................... 27
IV. Country notes ............................................................................................................................... 29
A. Bahamas ................................................................................................................................. 29
B. Barbados ................................................................................................................................ 31
C. Belize ..................................................................................................................................... 33
D. Eastern Caribbean Currency Union (ECCU) ......................................................................... 35
E. Guyana ................................................................................................................................... 38
F. Jamaica ................................................................................................................................... 40
G. Suriname ................................................................................................................................ 42 H. Trinidad and Tobago .............................................................................................................. 44
Studies and Perspectives Series – The Caribbean: Issues published .................................................. 47
ECLAC – Studies and Perspectives Series – The Caribbean – No. 74 Preliminary overview of the economies of the Caribbean…
4
Tables Table 1 Actual and projected growth rates 2016-2018..................................................................................7 Table 2 Latin American and Caribbean GDP growth rates, 2012-2018.....................................................8 Table 3 Tourist stop-over arrivals 2013-2017.................................................................................................9 Table 4 Unemployment rates 2013-2017.......................................................................................................10 Table 5 Overall fiscal balance..........................................................................................................................11 Table 6 Fiscal expenditure by category..........................................................................................................13 Table 7 Total public debt, 2015-2017 ............................................................................................................16 Table 8 Lending rate, deposit rate and spread, 2016-2017 .........................................................................18 Table 9 Monetary aggregates and domestic credit to the private and public sector, 2016-2017 ............................................................................................................19 Table 10 Inflat ion rates........................................................................................................................................20 Table 11 Bahamas: main economic indicators................................................................................................31 Table 12 Barbados: main economic indicators ...............................................................................................33 Table 13 Belize: main economic indicators.....................................................................................................35 Table 14 Eastern Caribbean Currency Union : main economic indicators .................................................37 Table 15 Guyana: main economic indicators ..................................................................................................39 Table 16 Jamaica: main economic indicators..................................................................................................42 Table 17 Suriname: main economic indicators ...............................................................................................43 Table 18 Trin idad and Tobago: main economic indicators...........................................................................46
Figures Figure 1 Unemployment rate, 2013-2017 .......................................................................................................10 Figure 2 Public debt vs fiscal balance..............................................................................................................12 Figure 3 Fiscal flexib ility index ........................................................................................................................15 Figure 4 Lending rate, deposit rate and spread, 2016-2017 .........................................................................18 Figure 5 Inflat ion .................................................................................................................................................21 Figure 6 Current account balance 2017 ...........................................................................................................24 Figure 7 Terms of trade ......................................................................................................................................25
ECLAC – Studies and Perspectives Series – The Caribbean – No. 74 Preliminary overview of the economies of the Caribbean…
5
Abstract
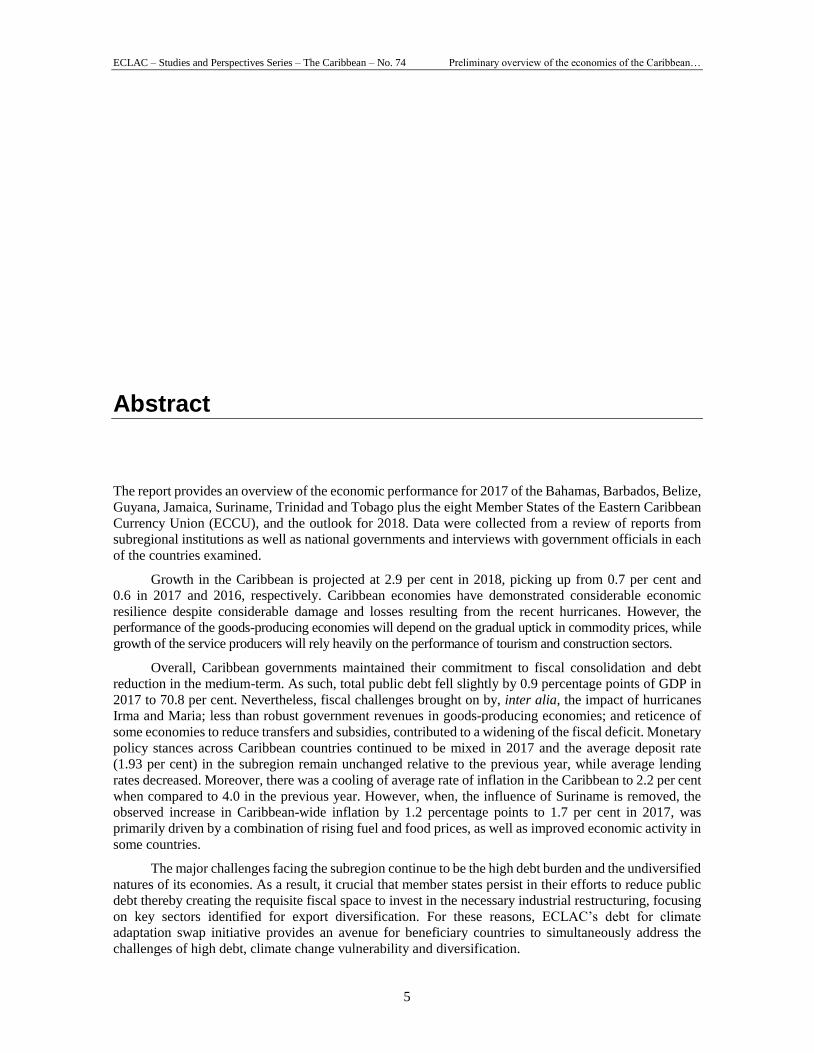
The report provides an overview of the economic performance for 2017 of the Bahamas, Barbados, Belize,
Guyana, Jamaica, Suriname, Trinidad and Tobago plus the eight Member States of the Eastern Caribbean
Currency Union (ECCU), and the outlook for 2018. Data were collected from a review of reports from
subregional institutions as well as national governments and interviews with government officials in each
of the countries examined.
Growth in the Caribbean is projected at 2.9 per cent in 2018, picking up from 0.7 per cent and
0.6 in 2017 and 2016, respectively. Caribbean economies have demonstrated considerable economic
resilience despite considerable damage and losses resulting from the recent hurricanes. However, the
performance of the goods-producing economies will depend on the gradual uptick in commodity prices, while
growth of the service producers will rely heavily on the performance of tourism and construction sectors.
Overall, Caribbean governments maintained their commitment to fiscal consolidation and debt
reduction in the medium-term. As such, total public debt fell slightly by 0.9 percentage points of GDP in
2017 to 70.8 per cent. Nevertheless, fiscal challenges brought on by, inter alia, the impact of hurricanes
Irma and Maria; less than robust government revenues in goods-producing economies; and reticence of
some economies to reduce transfers and subsidies, contributed to a widening of the fiscal deficit. Monetary
policy stances across Caribbean countries continued to be mixed in 2017 and the average deposit rate
(1.93 per cent) in the subregion remain unchanged relative to the previous year, while average lending
rates decreased. Moreover, there was a cooling of average rate of inflation in the Caribbean to 2.2 per cent
when compared to 4.0 in the previous year. However, when, the influence of Suriname is removed, the
observed increase in Caribbean-wide inflation by 1.2 percentage points to 1.7 per cent in 2017, was
primarily driven by a combination of rising fuel and food prices, as well as improved economic activity in
some countries.
The major challenges facing the subregion continue to be the high debt burden and the undiversified
natures of its economies. As a result, it crucial that member states persist in their efforts to reduce public
debt thereby creating the requisite fiscal space to invest in the necessary industrial restructuring, focusing
on key sectors identified for export diversification. For these reasons, ECLAC’s debt for climate
adaptation swap initiative provides an avenue for beneficiary countries to simultaneously address the
challenges of high debt, climate change vulnerability and diversification.

ECLAC – Studies and Perspectives Series – The Caribbean – No. 74 Preliminary overview of the economies of the Caribbean…
7
Introduction
There is renewed optimism that the world economy may be turning a corner since all projections for
growth have been higher over the last quarter (WEO 2018). This improved forecast is broad based and
covers most regions. Part of the reason given is the positive impact of United States (U.S.) tax reforms
which are likely to stimulate short term growth through retention of higher earnings by large corporations
arising from tax cuts. World output is expected to increase from 3.2 per cent in 2016 to 3.9 per cent in
2018 and while this is not a huge increase it is trending in the right direction (see table 1).
Table 1
Actual and projected growth rates 2016-2018
(Percentage)
Estimates Projections
2016 2017 2018
World output 3.2 3.7 3.9
Advanced economies 1.7 2.3 2.3
United States 1.5 2.3 2.7
Euro area 1.8 2.4 2.2
Emerging and developing economies 4.4 4.7 4.9
India 7.1 6.7 7.4
China 6.7 6.8 6.6
Latin America and the Caribbean 1.2 1.6 2.8
Source: International Monetary Fund (IMF) (2015), “World Economic Outlook database, October 2016; Economic Commission for Latin America and the Caribbean (ECLAC), on the basis of official figures.
Advanced economies are expected to show no real improvement between 2017 and 2018 while the
United States will grow from 2.3 per cent in 2017 to 2.7 per cent in 2018. The Euro Area will continue to
be challenged, however, driven by better credit conditions, increasing internal demand and a favorable
market for exports is expected to see positive growth of 2.2 per cent in 2018. In the case of emerging
ECLAC – Studies and Perspectives Series – The Caribbean – No. 74 Preliminary overview of the economies of the Caribbean…
8
developing economies, which continue to be a main source of positive global growth, growth is expected
to be strong, moving from 4.7 per cent in 2017 to 4.9 per cent in 2018. The IMF has pointed out that capital
flows to emerging economies remained resilient through the third quarter of 2017, with continued strength
in non-resident portfolio inflows. India and China are expected to show continued positive growth of
7.4 and 6.6 per cent respectively in 2018. Altough, China’s growth rate is projected to contract in 2018
relative to 2017, the stability of the country’s growth is linked to solid external demand. Economic activity
in Latin America is also expected to show significant improvement with 2.8 per cent growth expected for
2018, however this could be reduced if conditions deteriorate further in Venezuela (see table 2).
Interestingly, the Caribbean situation has improved and in 2018 growth is expected to be
2.9 per cent for the subregion which is quite remarkable in light of the recent hurricanes that passed through
the region and created considerable damage and losses. If the forecast holds this would be as good a
performance as in 2014, the last time the subregion grew by at least 2 per cent. The performance will
continue to be uneven between the service and goods producers, with the service producers growing at
3.1 per cent and the goods producers at 2.1 per cent. This latter performance will depend on the gradual
pick up in commodity prices. The growth of the service producers will depend heavily on the performance
of tourism services. The table below which reports the percentage change in tourist arrivals between 2013
and 2017 shows that the growth rates of arrivals have been uneven over this period. In 2017 most
destinations showed positive growth except for Saint Vincent and the Grenadines, Trinidad and Tobago
and the Bahamas. It is interesting that while Belize and Guyana have shown robust growth over this period,
tourism value added is a small share of their economies.
Table 2
Latin American and Caribbean GDP growth rates, 2012-2018
(Percentage)
2012 2013 2014 2015 2016 2017b 2018c
Anguilla -6.4 -0.6 5.0 3.2 1.1 -3.5 5.1
Antigua and Barbuda 5.0 -0.2 4.6 4.1 5.3 4.5 5.8
Bahamas 3.1 0.0 -0.5 -1.7 0.2 1.2 2.0
Barbados 0.3 -0.1 0.2 0.9 1.6 1.5 1.5
Belize 3.7 1.3 4.1 1.2 -0.8 2.5 2.4
Dominica -1.3 0.8 4.2 -1.8 2.6 -8.3 7.6
Grenada -1.2 2.4 7.3 6.2 3.7 3.5 2.5
Guyana 4.8 5.2 3.8 3.2 3.4 2.9 3.5
Jamaica -0.5 0.2 0.5 0.8 1.3 1.2 1.3
Montserrat 3.7 5.1 2.0 0.4 2.0 2.4 1.5
Saint Kitts and Nevis 2.9 6.2 6.0 3.8 2.2 2.1 3.8
Saint Lucia -1.3 0.1 0.4 1.9 1.7 2.8 3.6
Saint Vincent and the Grenadines
1.4 1.8 1.2 1.6 1.3 0.8 1.5
Suriname 2.2 2.9 0.2 -2.4 -10.5 -0.7 0.7
Trinidad and Tobago 1.3 2.7 -0.6 -0.6 -6 -2.3 0.5
The Caribbean (15)a 1.2 1.8 2.6 1.4 0.6 0.7 2.9
Service producersa 0.7 1.5 2.6 1.4 1.0 0.6 3.1
Goods producersa 3.3 3.1 2.4 1.3 -1.1 1.0 2.1
Latin America (20)a 3.8 4.4 2.9 2.5 1.7 2.2 2.8
South America (10)a 3.5 5.2 2.0 1.1 0.1 1.2 2.1
ECLAC – Studies and Perspectives Series – The Caribbean – No. 74 Preliminary overview of the economies of the Caribbean…
9
2012 2013 2014 2015 2016 2017b 2018c
Central America (9)a 4.2 3.8 3.8 4.1 3.4 3.4 3.6
Latin America and the Caribbean (35)a
2.7 3.3 2.7 2.0 1.2 1.6 2.8
Source: Economic Commission for Latin America and the Caribbean (ECLAC), on the basis of official figures. a Regional or producer aggregates are calculated as simple averages. b Preliminary estimates. c Forecast. Service producers: Anguilla, Antigua and Barbuda, Bahamas, Barbados, Dominica, Grenada, Jamaica, Montserrat, Saint Kitts and Nevis, Saint Lucia and Saint Vincent and the Grenadines. Goods Producers: Belize, Guyana, Suriname and Trinidad and Tobago. South America: Argentina, Bolivia, Brazil, Chile, Colombia, Ecuador, Paraguay, Peru, Uruguay and Venezuela. Central America: Costa Rica, Cuba, Dominican Republic, El Salvador, Guatemala, Haiti, Honduras, Nicaragua and Panama. Latin America: South America, Central America and Mexico. The Caribbean: Anguilla, Antigua and Barbuda, Bahamas, Barbados Belize, Dominica, Grenada, Guyana, Jamaica, Montserrat, Saint Kitts and Nevis, Saint Lucia, Saint Vincent and the Grenadines Suriname, and Trinidad and Tobago.
Table 3
Tourist stop-over arrivals 2013-2017
(Percentange)
Destination 2013 2014 2015 2016 2017
Anguillaa 6.8 2.7 3.3 8.2 0.3
Antigua and Barbudab -1.2 2.2 0.5 5.9 -6.7
Bahamas -4.0 4.5 4.0 -0.2
Barbadosa -5.2 2.2 13.9 6.7 6
Belizeb 6.1 9.2 6.2 13.0 10.8
Dominicac -0.9 4.1 -8.6 4.8 7.9
Grenadab 0.2 14.7 -0.8 2.1 8.1
Guyanad 13.3 2.9 0.5 13.8 6.1
Jamaicab 1.1 3.6 2.1 2.8 7.8
Montserrat -1.5 22.2 1.6 2.6
Saint Luciab 3.2 3.7 7.1 -2.3 11
Saint Kitts & Nevis 3.9 6.1 2.0 0.9
Saint Vincent and the Grenadinesd -3.5 -1.4 6.6 4.5 -4.4
Suriname 3.8 1.0 -9.5 12.8
Trinidad and Tobagob -4.5 -5.0 6.6 -7.0 -3.5
Caribbean 1.2 4.8 2.4 4.6 3.9
Source: Caribbean Tourism Organization. aJan-Oct;bJan-Dec;cJan-Sep;dJan-Nov.
A. Unemployment rates
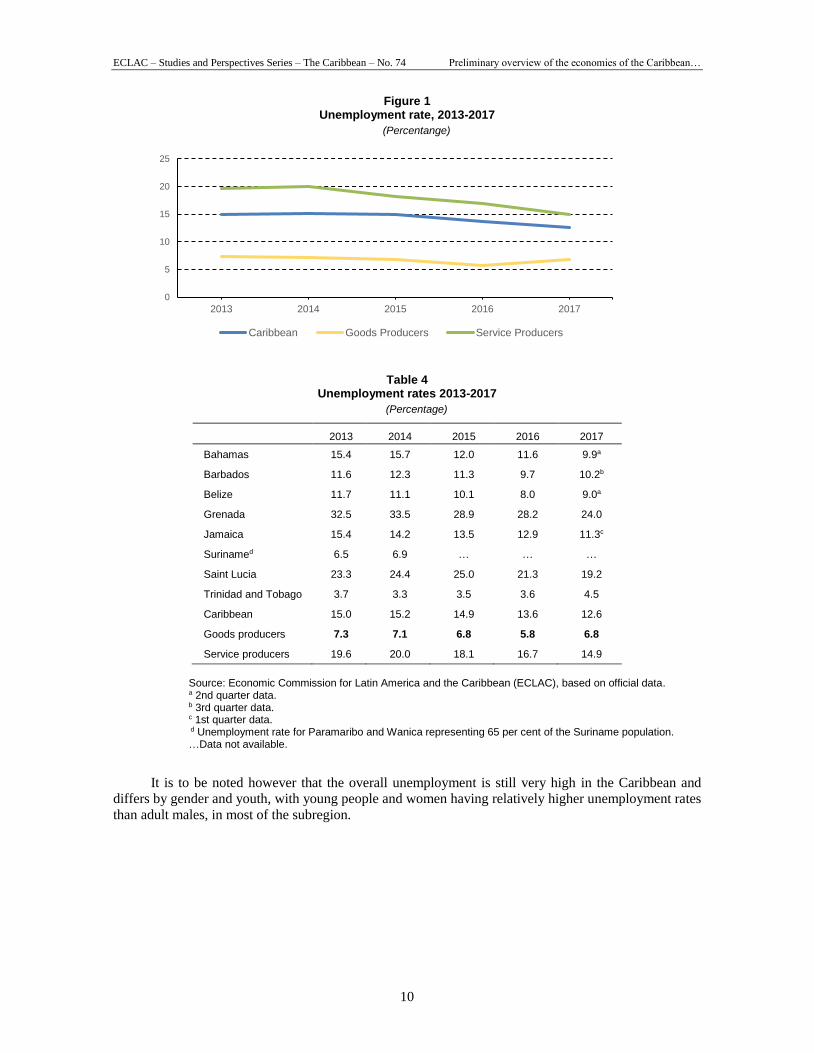
It is expected that the improved growth should increase employment. Not surprisingly unemployment rates
for those countries for which data are available, started to decline. Unemployment rates since 2014 have
fallen for the Bahamas, Grenada, Jamaica and Saint Lucia. Unemployment rates have however rose in
Barbados (10.2 per cent) which is still undergoing a period of recession, as well as Belize (9 per cent) and
Trinidad and Tobago (4.5 per cent), which have been negatively impacted by declining government revenue.
Table 1 (concluded)
ECLAC – Studies and Perspectives Series – The Caribbean – No. 74 Preliminary overview of the economies of the Caribbean…
10
Figure 1 Unemployment rate, 2013-2017
(Percentange)
Table 4
Unemployment rates 2013-2017
(Percentage)
2013 2014 2015 2016 2017
Bahamas 15.4 15.7 12.0 11.6 9.9a
Barbados 11.6 12.3 11.3 9.7 10.2b
Belize 11.7 11.1 10.1 8.0 9.0a
Grenada 32.5 33.5 28.9 28.2 24.0
Jamaica 15.4 14.2 13.5 12.9 11.3c
Surinamed 6.5 6.9 … … …
Saint Lucia 23.3 24.4 25.0 21.3 19.2
Trinidad and Tobago 3.7 3.3 3.5 3.6 4.5
Caribbean 15.0 15.2 14.9 13.6 12.6
Goods producers 7.3 7.1 6.8 5.8 6.8
Service producers 19.6 20.0 18.1 16.7 14.9
Source: Economic Commission for Latin America and the Caribbean (ECLAC), based on official data. a 2nd quarter data. b 3rd quarter data. c 1st quarter data. d Unemployment rate for Paramaribo and Wanica representing 65 per cent of the Suriname population. …Data not available.
It is to be noted however that the overall unemployment is still very high in the Caribbean and
differs by gender and youth, with young people and women having relatively higher unemployment rates
than adult males, in most of the subregion.
0
5
10
15
20
25
2013 2014 2015 2016 2017
Caribbean Goods Producers Service Producers
ECLAC – Studies and Perspectives Series – The Caribbean – No. 74 Preliminary overview of the economies of the Caribbean…
11
I. Macroeconomic policy
A. Fiscal policy and public debt
This subsection of the report analyses recent fiscal performance in the Caribbean, by examining the
evolution of the fiscal deficit, public debt and debt service payments in an effort to assess the region’s
progress in improving its debt profile through fiscal consolidation.
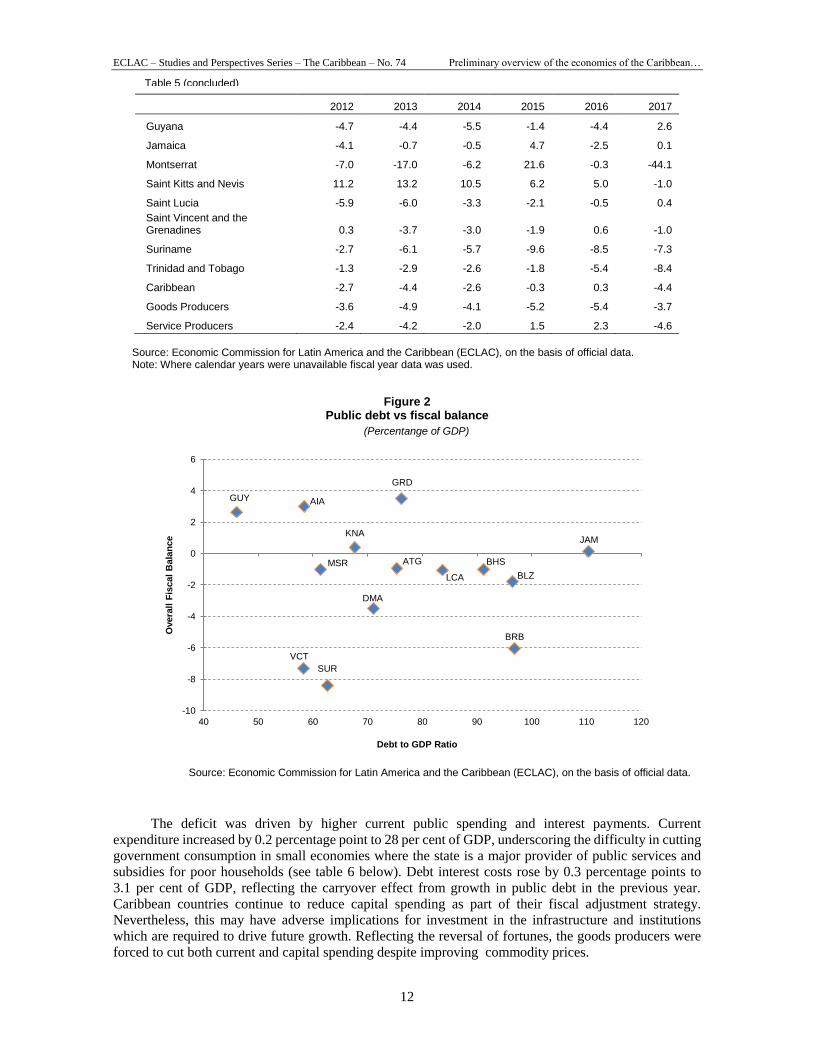
Overall, Caribbean governments maintained their commitment to fiscal consolidation in 2017.
Jamaica maintained fiscal tightening under its IMF programme, and similarly Grenada, despite the
conclusion of the IMF supported three-year home-grown Structural Adjustment Programme, while
Barbados continued its adjustment programme. However, the region was confronted by a number of
challenges in 2017, which led to gaps between fiscal targets and outcomes. Key in this regard were the
fallout from hurricanes in Dominica, Antigua and Barbuda, Anguilla and the Bahamas; the continued
impact of commodity prices, abiet slowly recovering, on goods-producing economies; and resistance to
the reduction of high transfers and subsidies in some countries. With these setbacks, the median deficit of the
region moved from 0.5 per cent of GDP in 2016 to 1 per cent of GDP in 2017 (see table 5 and figure 2 below).
Table 5
Overall fiscal balance
(Percentange of GDP)
2012 2013 2014 2015 2016 2017
Anguilla 1.5 0.7 2.5 0.5 -0.3 3.0
Antigua and Barbuda -1.3 -4.5 -2.7 2.1 1.1 -0.9
Bahamas -0.8 -1.1 -6.5 -4.3 -2.9 -1.0
Barbados -6.0 -11.1 -6.9 -7.7 -9.4 -6.0
Belize -5.6 -6.4 -2.9 -7.9 -3.4 -1.8
Dominica -9.2 -9.6 -1.3 -1.7 32.5 -3.5
Grenada -5.5 -6.6 -4.7 -1.2 2.3 3.5
ECLAC – Studies and Perspectives Series – The Caribbean – No. 74 Preliminary overview of the economies of the Caribbean…
12
2012 2013 2014 2015 2016 2017
Guyana -4.7 -4.4 -5.5 -1.4 -4.4 2.6
Jamaica -4.1 -0.7 -0.5 4.7 -2.5 0.1
Montserrat -7.0 -17.0 -6.2 21.6 -0.3 -44.1
Saint Kitts and Nevis 11.2 13.2 10.5 6.2 5.0 -1.0
Saint Lucia -5.9 -6.0 -3.3 -2.1 -0.5 0.4
Saint Vincent and the Grenadines 0.3 -3.7 -3.0 -1.9 0.6 -1.0
Suriname -2.7 -6.1 -5.7 -9.6 -8.5 -7.3
Trinidad and Tobago -1.3 -2.9 -2.6 -1.8 -5.4 -8.4
Caribbean -2.7 -4.4 -2.6 -0.3 0.3 -4.4
Goods Producers -3.6 -4.9 -4.1 -5.2 -5.4 -3.7
Service Producers -2.4 -4.2 -2.0 1.5 2.3 -4.6
Source: Economic Commission for Latin America and the Caribbean (ECLAC), on the basis of official data. Note: Where calendar years were unavailable fiscal year data was used.
Figure 2 Public debt vs fiscal balance
(Percentange of GDP)
Source: Economic Commission for Latin America and the Caribbean (ECLAC), on the basis of official data.
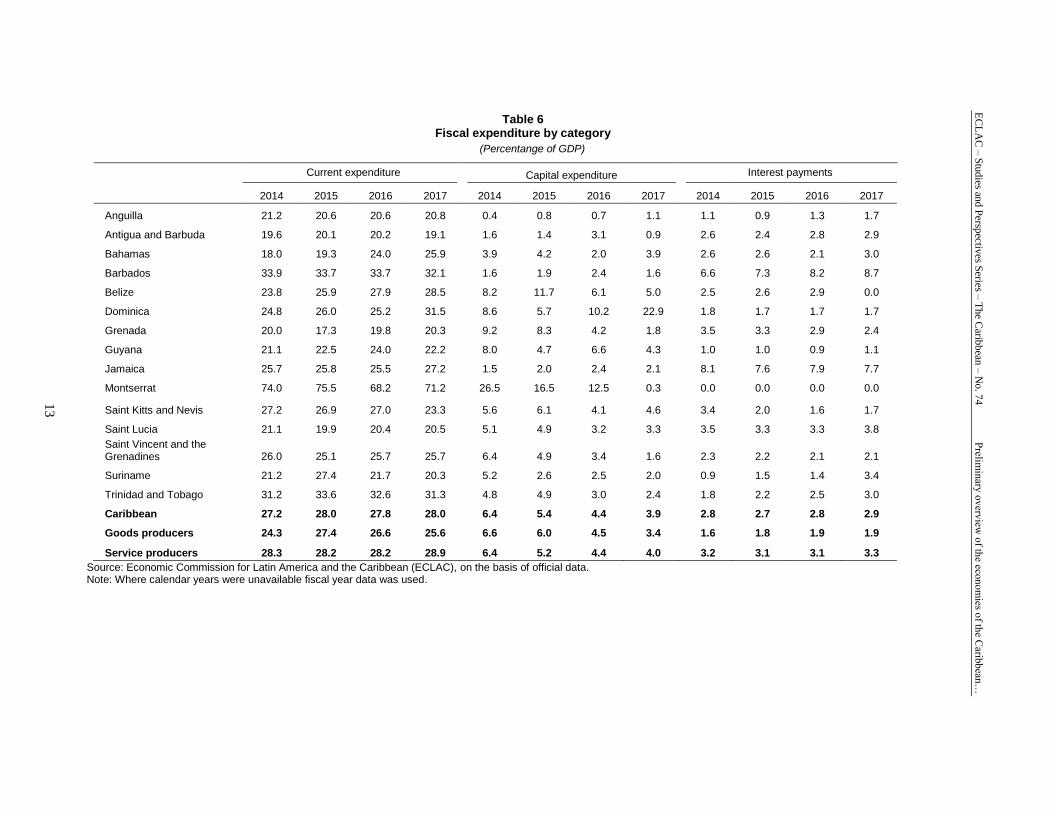
The deficit was driven by higher current public spending and interest payments. Current
expenditure increased by 0.2 percentage point to 28 per cent of GDP, underscoring the difficulty in cutting
government consumption in small economies where the state is a major provider of public services and
subsidies for poor households (see table 6 below). Debt interest costs rose by 0.3 percentage points to
3.1 per cent of GDP, reflecting the carryover effect from growth in public debt in the previous year.
Caribbean countries continue to reduce capital spending as part of their fiscal adjustment strategy. Nevertheless, this may have adverse implications for investment in the infrastructure and institutions
which are required to drive future growth. Reflecting the reversal of fortunes, the goods producers were
forced to cut both current and capital spending despite improving commodity prices.
AIA
ATG BHS
BRB
BLZ
DMA
GRD
GUY
JAM
MSR
KNA
LCA
VCT
SUR
-10
-8
-6
-4
-2
0
2
4
6
40 50 60 70 80 90 100 110 120
Overa
ll F
iscal
Bala
nce
Debt to GDP Ratio
Table 5 (concluded)
EC
LA
C –
Stu
dies an
d P
erspectiv
es Series –
The C
aribb
ean –
No
. 74
Prelim
inary
ov
erview
of th
e econ
om
ies of th
e Carib
bean
…
Table 6 Fiscal expenditure by category
(Percentange of GDP)
Current expenditure Capital expenditure Interest payments
2014 2015 2016 2017 2014 2015 2016 2017 2014 2015 2016 2017
Anguilla 21.2 20.6 20.6 20.8 0.4 0.8 0.7 1.1 1.1 0.9 1.3 1.7
Antigua and Barbuda 19.6 20.1 20.2 19.1 1.6 1.4 3.1 0.9 2.6 2.4 2.8 2.9
Bahamas 18.0 19.3 24.0 25.9 3.9 4.2 2.0 3.9 2.6 2.6 2.1 3.0
Barbados 33.9 33.7 33.7 32.1 1.6 1.9 2.4 1.6 6.6 7.3 8.2 8.7
Belize 23.8 25.9 27.9 28.5 8.2 11.7 6.1 5.0 2.5 2.6 2.9 0.0
Dominica 24.8 26.0 25.2 31.5 8.6 5.7 10.2 22.9 1.8 1.7 1.7 1.7
Grenada 20.0 17.3 19.8 20.3 9.2 8.3 4.2 1.8 3.5 3.3 2.9 2.4
Guyana 21.1 22.5 24.0 22.2 8.0 4.7 6.6 4.3 1.0 1.0 0.9 1.1
Jamaica 25.7 25.8 25.5 27.2 1.5 2.0 2.4 2.1 8.1 7.6 7.9 7.7
Montserrat 74.0 75.5 68.2 71.2 26.5 16.5 12.5 0.3 0.0 0.0 0.0 0.0
Saint Kitts and Nevis 27.2 26.9 27.0 23.3 5.6 6.1 4.1 4.6 3.4 2.0 1.6 1.7
Saint Lucia 21.1 19.9 20.4 20.5 5.1 4.9 3.2 3.3 3.5 3.3 3.3 3.8
Saint Vincent and the Grenadines 26.0 25.1 25.7 25.7 6.4 4.9 3.4 1.6 2.3 2.2 2.1 2.1
Suriname 21.2 27.4 21.7 20.3 5.2 2.6 2.5 2.0 0.9 1.5 1.4 3.4
Trinidad and Tobago 31.2 33.6 32.6 31.3 4.8 4.9 3.0 2.4 1.8 2.2 2.5 3.0
Caribbean 27.2 28.0 27.8 28.0 6.4 5.4 4.4 3.9 2.8 2.7 2.8 2.9
Goods producers 24.3 27.4 26.6 25.6 6.6 6.0 4.5 3.4 1.6 1.8 1.9 1.9
Service producers 28.3 28.2 28.2 28.9 6.4 5.2 4.4 4.0 3.2 3.1 3.1 3.3
Source: Economic Commission for Latin America and the Caribbean (ECLAC), on the basis of official data. Note: Where calendar years were unavailable fiscal year data was used.
13
ECLAC – Studies and Perspectives Series – The Caribbean – No. 74 Preliminary overview of the economies of the Caribbean…
14
Soft prices of export commodities, as well as revenue shortfalls in some instances, have forced
goods-producing economies make some fiscal adjustment. As a result, their fiscal deficit contracted by
1.7 percentage points to 3.7 per cent of GDP. The deficit declined by 1.6 and 1.2 percentage points in
Belize and Suriname, respectively. Belize benefited from fairly high growth in revenues, which offset
higher expenditure, while the outturn in Suriname was influenced by a spike in both tax and non-tax
revenues. Meanwhile, the fiscal deficit increased by 3 percentage points in Trinidad and Tobago mainly
due to shortfalls in revenue that was linked to delays in recovering loan funds to CL Financial and CLICO.
Meanwhile, there was slippage among the service-producing economies,1 which with the exception
of Montserrat,2 experienced a turnaround from an average surplus of 0.3 per cent of GDP to a deficit of
1.5 per cent of GDP. Fiscal performance improved in Jamaica, as the deficit of 2.5 per cent of GDP in
2016 reverted to a surplus of 0.1 per cent of GDP in 2017. Expenditure was contained to 1 per cent below
the budgeted amount in order to meet the target under the stand-by arrangement with the IMF.
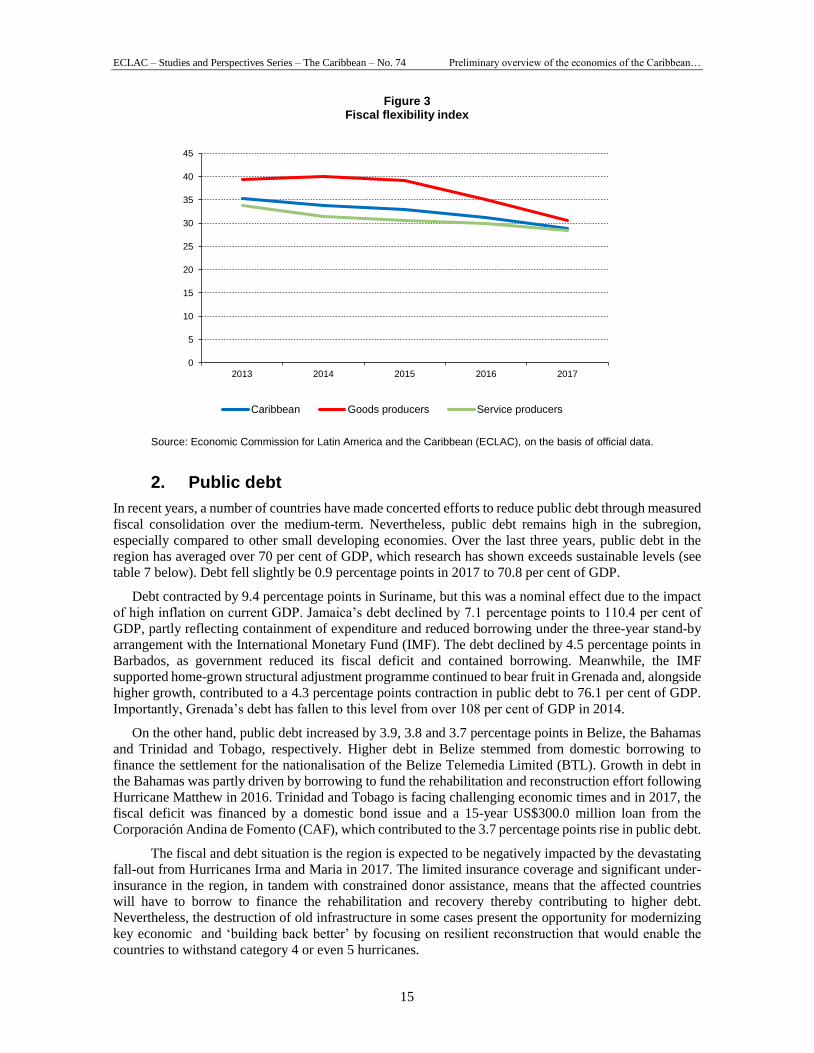
1. Fiscal flexibility
The fiscal flexibility index3 is a measure of government’s discretionary spending as a proportion of total
expenditure. Fiscal flexibility in the region remains a challenge in the region, owing to limited government
leverage over non-discretionary spending, due in part to public sector wage commitments; high debt
interest obligations; and significant outlays on transfers and subsidies to maintain social welfare.
The reality is that given the relatively small size of the private sector, the state tends to play a more active
role in regional economies.
Fiscal flexibility continued to decline in 2017, falling by 2.3 percentage points to 29.0 (see figure 3
below). Notably at 29.0, flexibility is substantially lower than the median level of 50.0. Partly reflecting a
reversal of economic fortunes, the decline in fiscal flexibility was much larger (4.4 percentage points) in
the goods producing economies, compared with (1.6 percentage points) in the service producers.
Montserrat, Guyana, Grenada and Antigua and Barbuda experienced largest declines in flexibility in the
region. Flexibility fell by 10.8 percentage points in Montserrat reflecting higher spending on personal
emoluments and transfers and subsidies. Flexibility declined by 9.5 percentage points in Guyana, owing
to an increase in spending on wages and salaries, goods and services interest payments on the debt.
Meanwhile Grenada and Antigua and Barbuda experienced lower flexibility. In the case of Grenada, this
stemmed from higher outlays on wages and salaries due to salary and increment increases for public
servants and an increase in spending on transfers and subsidies. While higher interest payments on the
debt in Antigua and Barbuda led to the lowering of its fiscal flexibility. In contrast, due to lower interest
payments, there was an improvement in fiscal flexibility in Dominica.
1 The goods-producing economies comprise Belize, Guyana, Suriname and Trinidad and Tobago, which specialize mainly in the
production and trade in goods, while the service-producing economies are Antigua and Barbuda, The Bahamas, Barbados, Dominica, Grenada, Jamaica, Saint Kitts and Nevis, Saint Lucia and Saint Vincent and the Grenadines, which specialize in the production
and trade in services. 2 Montserrat was an important outlier, as its deficit expanded from 0.3 per cent of GDP in 2016 to 44.1 per cent of GDP in 2017; and
would therefore have skewed the averaged deficit for the services-based economies. 3 The fiscal flexibility index is defined as: FFI = (1-NDE/TGE)*100, NDE is non-discretionary expenditure defined as outlays on wages
and salaries, transfers and interest payments and TGE is total government expenditure. The maximum value of the uncorrected index is 100, reflecting total fiscal flexibility. IMF (2012) “The Challenges of Fiscal Consolidation and Debt Reduction in the Caribbean”,
Amo-Yartey et.al, Working Paper WP/12/276.
ECLAC – Studies and Perspectives Series – The Caribbean – No. 74 Preliminary overview of the economies of the Caribbean…
15
Figure 3 Fiscal flexibility index
Source: Economic Commission for Latin America and the Caribbean (ECLAC), on the basis of official data.
2. Public debt
In recent years, a number of countries have made concerted efforts to reduce public debt through measured
fiscal consolidation over the medium-term. Nevertheless, public debt remains high in the subregion,
especially compared to other small developing economies. Over the last three years, public debt in the
region has averaged over 70 per cent of GDP, which research has shown exceeds sustainable levels (see
table 7 below). Debt fell slightly be 0.9 percentage points in 2017 to 70.8 per cent of GDP.
Debt contracted by 9.4 percentage points in Suriname, but this was a nominal effect due to the impact
of high inflation on current GDP. Jamaica’s debt declined by 7.1 percentage points to 110.4 per cent of
GDP, partly reflecting containment of expenditure and reduced borrowing under the three-year stand-by
arrangement with the International Monetary Fund (IMF). The debt declined by 4.5 percentage points in
Barbados, as government reduced its fiscal deficit and contained borrowing. Meanwhile, the IMF
supported home-grown structural adjustment programme continued to bear fruit in Grenada and, alongside
higher growth, contributed to a 4.3 percentage points contraction in public debt to 76.1 per cent of GDP.
Importantly, Grenada’s debt has fallen to this level from over 108 per cent of GDP in 2014.
On the other hand, public debt increased by 3.9, 3.8 and 3.7 percentage points in Belize, the Bahamas
and Trinidad and Tobago, respectively. Higher debt in Belize stemmed from domestic borrowing to
finance the settlement for the nationalisation of the Belize Telemedia Limited (BTL). Growth in debt in
the Bahamas was partly driven by borrowing to fund the rehabilitation and reconstruction effort following
Hurricane Matthew in 2016. Trinidad and Tobago is facing challenging economic times and in 2017, the
fiscal deficit was financed by a domestic bond issue and a 15-year US$300.0 million loan from the
Corporación Andina de Fomento (CAF), which contributed to the 3.7 percentage points rise in public debt.
The fiscal and debt situation is the region is expected to be negatively impacted by the devastating
fall-out from Hurricanes Irma and Maria in 2017. The limited insurance coverage and significant under-
insurance in the region, in tandem with constrained donor assistance, means that the affected countries
will have to borrow to finance the rehabilitation and recovery thereby contributing to higher debt.
Nevertheless, the destruction of old infrastructure in some cases present the opportunity for modernizing
key economic and ‘building back better’ by focusing on resilient reconstruction that would enable the
countries to withstand category 4 or even 5 hurricanes.
0
5
10
15
20
25
30
35
40
45
2013 2014 2015 2016 2017
Caribbean Goods producers Service producers

ECLAC – Studies and Perspectives Series – The Caribbean – No. 74 Preliminary overview of the economies of the Caribbean…
16
Table 7 Total public debt, 2015-2017
(Percentange of GDP)
2015 2016 2017
Foreign Domestic Total Foreign Domestic Total Foreign Domestic Total
Anguilla 18.2 5.6 23.9 22.8 37.8 60.6 21.7 36.7 58.4
Antigua and Barbuda 38.7 43.1 81.8 34.7 42.1 76.9 33.0 42.4 75.3
Bahamas 24.6 59.7 84.3 26.3 61.2 87.4 29.3 61.9 91.2
Barbados 35.4 71.2 106.7 34.0 67.4 101.4 32.6 64.3 96.9
Belize 68.3 14.3 82.7 70.6 22.0 92.6 69.5 27.0 96.5
Dominica 52.8 22.4 75.3 46.5 21.2 67.6 49.1 22.0 71.1
Grenada 61.5 27.1 88.6 57.0 23.4 80.4 54.1 22.1 76.1
Guyana 36.0 12.4 48.4 33.8 11.9 45.7 33.8 12.3 46.1
Jamaica 73.0 51.9 124.8 72.4 45.1 117.5 73.1 37.3 110.4
Montserrat 5.7 0.0 5.7 5.1 0.0 5.1 6.1 0.0 6.1
Saint Kitts and Nevis 24.3 42.6 66.9 21.7 41.6 63.2 20.2 41.1 61.4
Saint Lucia 30.8 35.4 66.2 31.7 35.3 67.0 33.8 33.9 67.7
Saint Vincent and the Grenadines
52.7 26.3 79.0 59.6 23.5 83.1 58.4 25.3 83.7
Suriname 29.4 22.9 52.3 49.9 17.8 67.7 43.1 15.2 58.3
Trinidad and Tobago 10.2 39.5 49.7 15.1 43.8 58.9 16.9 45.8 62.6
Caribbean 37.4 31.6 69.1 38.8 32.9 71.7 38.3 32.5 70.8
Goods producers 36.0 22.3 58.3 42.4 23.9 66.2 40.8 25.1 65.9
Service producers 38.0 35.0 73.0 37.4 36.2 73.7 37.4 35.2 72.6
Source: Economic Commission for Latin America and the Caribbean (ECLAC), on the basis of official data.
3. Debt service payments
High debt servicing costs continue to complicate economic management in the Caribbean. External debt
service payments absorb a significant portion of the foreign exchange that is earned by sugregional
economies, while total debt service payments accounts for a significant share of government revenue. The
high external debt service ratio is of particular concern owing to the subpar private capital inflows that has
contributed to a foreign exchange crunch in countries such as Trinidad and Tobago and Barbados.
Debt service data are not available for all countries. For the five countries for which data are available, the
external debt service ratio rose from 6.9 per cent of exports of goods and services in 2016 to 10.6 per cent
in 2017. The ratio increased from 22.2 per cent in 2016 to 27.3 per cent in 2017 in Jamaica reflecting an
increase in external debt service payments, which offset growth in exports of goods and services. Jamaica
benefited from higher exports of alumina and non-traditional services and an increase in tourism receipts,
but these were not suffiecient to reduce the debt service ratio. The ratio also increased marginally for
Trinidad and Tobago but declined by over 2.0 percentage points for Suriname as debt service fell in line
with an over 9 per cent decline in public debt.
With the exception of Barbados and the Bahamas for which data were unavailable, total debt service
payments represented 30.3 per cent of government revenue in 2017, up from 26.8 per cent in 2016. Debt
service costs accounted for a higher proportion of revenue in both the goods and service based economies.
ECLAC – Studies and Perspectives Series – The Caribbean – No. 74 Preliminary overview of the economies of the Caribbean…
17
B. Monetary policy, domestic credit and inflation
This subsection will explore issues relating to the nature and focus of monetary policy-setting in Caribbean
economies in 2017, as well as trends in interest rates, money supply, domestic credit and inflation.
The Bahamas, for instance adopted a somewhat expansionary monetary policy stance, with both
bank liquidity and external reserves expanding during in 2017, as a consequence of increased external
borrowings. In contrast, the Central Bank of Barbados, adjusted its monetary policy stance in 2017 to
become more contractionary in nature, raising the commercial banks’ security reserve requirement in three
stages from 10 per cent to 20 per cent; while the Eastern Caribbean Central Bank (ECCB) sustained its
approach of managing monetary policy in the Eastern Caribbean Currency Union towards maintaining the
fixed exchange rate peg and financial sector stability.
Reflective of lower inflation expectations, monetary policy of Jamaica was accommodative in 2017
with the Bank of Jamaica cutting its 30-day certificate deposit rate from 3.75 per cent to 3.5 per cent in
August, and again in November to 3.25 per cent. Interventions by the Bank of Guyana continued to be
centered on the maintenance of price and exchange rate stability; and similarly, there were no changes in
monetary policy in Trinidad and Tobago in 2017 with the repo rate remaining unchanged at 4.75 per cent
since December 2015.
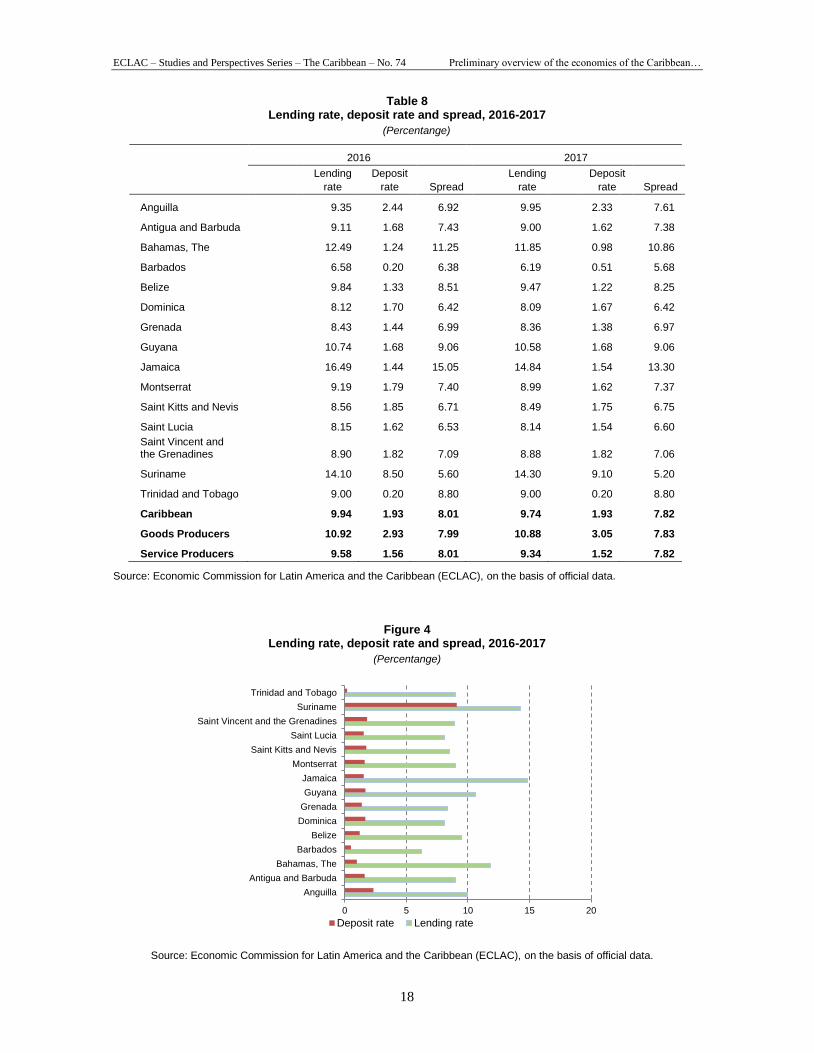
1. Interest rates
In 2017, the average deposit rate (1.93 per cent) in the Caribbean remain unchanged relative to the previous
year, while average lending rates decreased by 20 basis points to 9.74 per cent. Further, on average the
lending, deposit and interest rate spread all declined in the services producing economies, relative to
2016. Key drivers in this regard included, the lowering of the 30-day certificate of deposit rate, which
placed downward pressures on interest rates in Jamaica, precipitating a fall in weighted interest rates. In
addition, in the ECCU, on the back-end of the Monetary Council of the ECCB’s decision in 2015 to reduce
the minimum deposit rate to 2.0 per cent, the average interest rate spread narrowed by 3 basis points to
6.78 per cent as both the weighted average deposit and lending rates continued to fall in 2017. While for
The Bahamas, among the key interest rates, the average 90-day Treasury bill rate fell by 49 basis points
to 1.28 per cent, while the Central Bank’s discount rate and the commercial banks’ prime rate were
unchanged at 4.00 per cent and 4.25 per cent, respectively.
Although decreasing, Jamaica (13.30 per cent) and the Bahamas (10.86 per cent), continue to have the
largest interest rate spreads in the Caribbean. In the Bahamas on the other hand the observed 39 basis
points contraction the interest rate spread was underpinned by a steep (1.63 percentage points) decline in
the average lending rate, which was accompanied by a relatively modest 26 basis points contraction in the
average deposit rate.
In the goods-producing economies, year-on-year, the average interest spread also declined (4 basis
points). However, in contrast to the services-based economies, there was a 12 basis points increase in the
average deposit rate to 3.05 per cent; while the average lending rate fell by 4 basis points to 10.88 per cent
as invariably the banking sector attempted to stimulate credit demand with economic activity continuing
to be sluggish.
More specifically, indicative of the differing monetary policy stances, interest rates in Trinidad and
Tobago remained unchanged in 2017; lending rates in Guyana declined by 16 basis points; and both
lending and deposit rates fell steeply in Belize. Contrastingly, in Suriname, nominal interest rates
continued to increase in 2017 and the interest rate spread contracted by 4 basis points to 5.20 per cent.
(table 8 and figure 4 refer).
ECLAC – Studies and Perspectives Series – The Caribbean – No. 74 Preliminary overview of the economies of the Caribbean…
18
Table 8 Lending rate, deposit rate and spread, 2016-2017
(Percentange)
2016 2017
Lending
rate
Deposit
rate Spread
Lending
rate
Deposit
rate Spread
Anguilla 9.35 2.44 6.92 9.95 2.33 7.61
Antigua and Barbuda 9.11 1.68 7.43 9.00 1.62 7.38
Bahamas, The 12.49 1.24 11.25 11.85 0.98 10.86
Barbados 6.58 0.20 6.38 6.19 0.51 5.68
Belize 9.84 1.33 8.51 9.47 1.22 8.25
Dominica 8.12 1.70 6.42 8.09 1.67 6.42
Grenada 8.43 1.44 6.99 8.36 1.38 6.97
Guyana 10.74 1.68 9.06 10.58 1.68 9.06
Jamaica 16.49 1.44 15.05 14.84 1.54 13.30
Montserrat 9.19 1.79 7.40 8.99 1.62 7.37
Saint Kitts and Nevis 8.56 1.85 6.71 8.49 1.75 6.75
Saint Lucia 8.15 1.62 6.53 8.14 1.54 6.60
Saint Vincent and the Grenadines 8.90 1.82 7.09 8.88 1.82 7.06
Suriname 14.10 8.50 5.60 14.30 9.10 5.20
Trinidad and Tobago 9.00 0.20 8.80 9.00 0.20 8.80
Caribbean 9.94 1.93 8.01 9.74 1.93 7.82
Goods Producers 10.92 2.93 7.99 10.88 3.05 7.83
Service Producers 9.58 1.56 8.01 9.34 1.52 7.82
Source: Economic Commission for Latin America and the Caribbean (ECLAC), on the basis of official data.
Figure 4 Lending rate, deposit rate and spread, 2016-2017
(Percentange)
Source: Economic Commission for Latin America and the Caribbean (ECLAC), on the basis of official data.
0 5 10 15 20
Anguilla
Antigua and Barbuda
Bahamas, The
Barbados
Belize
Dominica
Grenada
Guyana
Jamaica
Montserrat
Saint Kitts and Nevis
Saint Lucia
Saint Vincent and the Grenadines
Suriname
Trinidad and Tobago
Deposit rate Lending rate
ECLAC – Studies and Perspectives Series – The Caribbean – No. 74 Preliminary overview of the economies of the Caribbean…
19
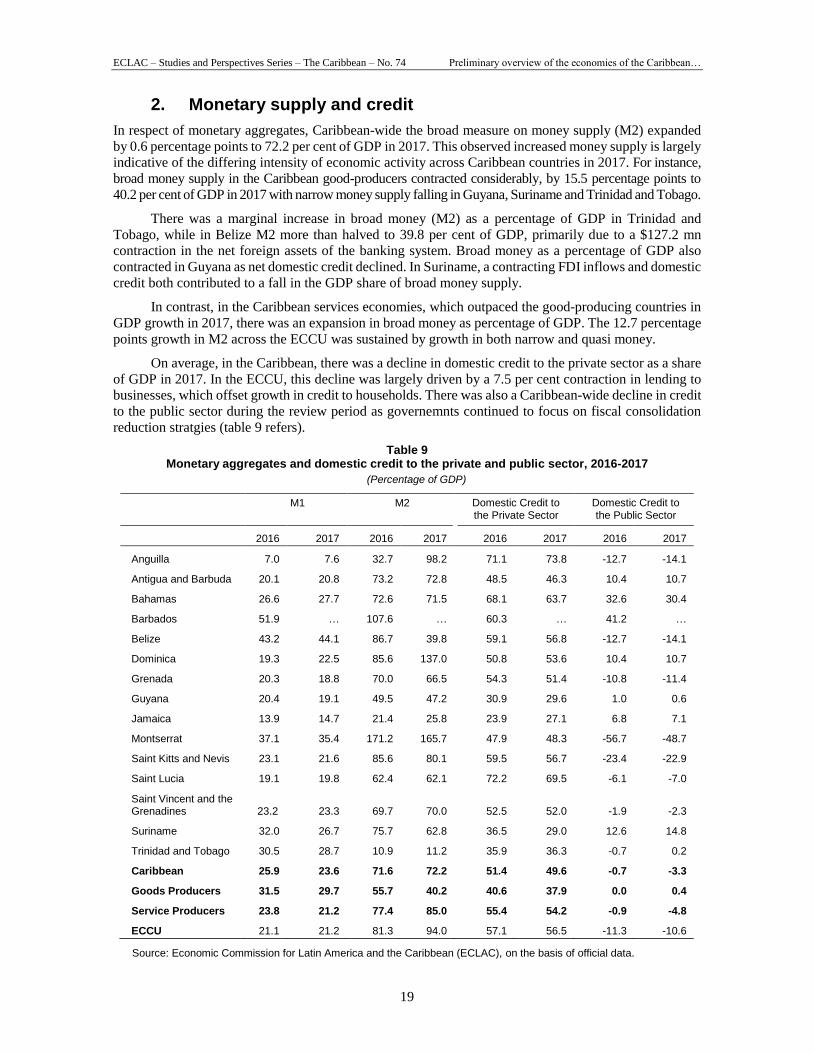
2. Monetary supply and credit
In respect of monetary aggregates, Caribbean-wide the broad measure on money supply (M2) expanded
by 0.6 percentage points to 72.2 per cent of GDP in 2017. This observed increased money supply is largely
indicative of the differing intensity of economic activity across Caribbean countries in 2017. For instance,
broad money supply in the Caribbean good-producers contracted considerably, by 15.5 percentage points to
40.2 per cent of GDP in 2017 with narrow money supply falling in Guyana, Suriname and Trinidad and Tobago.
There was a marginal increase in broad money (M2) as a percentage of GDP in Trinidad and
Tobago, while in Belize M2 more than halved to 39.8 per cent of GDP, primarily due to a $127.2 mn
contraction in the net foreign assets of the banking system. Broad money as a percentage of GDP also
contracted in Guyana as net domestic credit declined. In Suriname, a contracting FDI inflows and domestic
credit both contributed to a fall in the GDP share of broad money supply.
In contrast, in the Caribbean services economies, which outpaced the good-producing countries in
GDP growth in 2017, there was an expansion in broad money as percentage of GDP. The 12.7 percentage
points growth in M2 across the ECCU was sustained by growth in both narrow and quasi money.
On average, in the Caribbean, there was a decline in domestic credit to the private sector as a share
of GDP in 2017. In the ECCU, this decline was largely driven by a 7.5 per cent contraction in lending to
businesses, which offset growth in credit to households. There was also a Caribbean-wide decline in credit
to the public sector during the review period as governemnts continued to focus on fiscal consolidation
reduction stratgies (table 9 refers).
Table 9 Monetary aggregates and domestic credit to the private and public sector, 2016-2017
(Percentage of GDP)
M1 M2 Domestic Credit to the Private Sector
Domestic Credit to the Public Sector
2016 2017 2016 2017 2016 2017 2016 2017
Anguilla 7.0 7.6 32.7 98.2 71.1 73.8 -12.7 -14.1
Antigua and Barbuda 20.1 20.8 73.2 72.8 48.5 46.3 10.4 10.7
Bahamas 26.6 27.7 72.6 71.5 68.1 63.7 32.6 30.4
Barbados 51.9 … 107.6 … 60.3 … 41.2 …
Belize 43.2 44.1 86.7 39.8 59.1 56.8 -12.7 -14.1
Dominica 19.3 22.5 85.6 137.0 50.8 53.6 10.4 10.7
Grenada 20.3 18.8 70.0 66.5 54.3 51.4 -10.8 -11.4
Guyana 20.4 19.1 49.5 47.2 30.9 29.6 1.0 0.6
Jamaica 13.9 14.7 21.4 25.8 23.9 27.1 6.8 7.1
Montserrat 37.1 35.4 171.2 165.7 47.9 48.3 -56.7 -48.7
Saint Kitts and Nevis 23.1 21.6 85.6 80.1 59.5 56.7 -23.4 -22.9
Saint Lucia 19.1 19.8 62.4 62.1 72.2 69.5 -6.1 -7.0
Saint Vincent and the Grenadines 23.2 23.3 69.7 70.0 52.5 52.0 -1.9 -2.3
Suriname 32.0 26.7 75.7 62.8 36.5 29.0 12.6 14.8
Trinidad and Tobago 30.5 28.7 10.9 11.2 35.9 36.3 -0.7 0.2
Caribbean 25.9 23.6 71.6 72.2 51.4 49.6 -0.7 -3.3
Goods Producers 31.5 29.7 55.7 40.2 40.6 37.9 0.0 0.4
Service Producers 23.8 21.2 77.4 85.0 55.4 54.2 -0.9 -4.8
ECCU 21.1 21.2 81.3 94.0 57.1 56.5 -11.3 -10.6
Source: Economic Commission for Latin America and the Caribbean (ECLAC), on the basis of official data.
ECLAC – Studies and Perspectives Series – The Caribbean – No. 74 Preliminary overview of the economies of the Caribbean…
20
3. Inflation
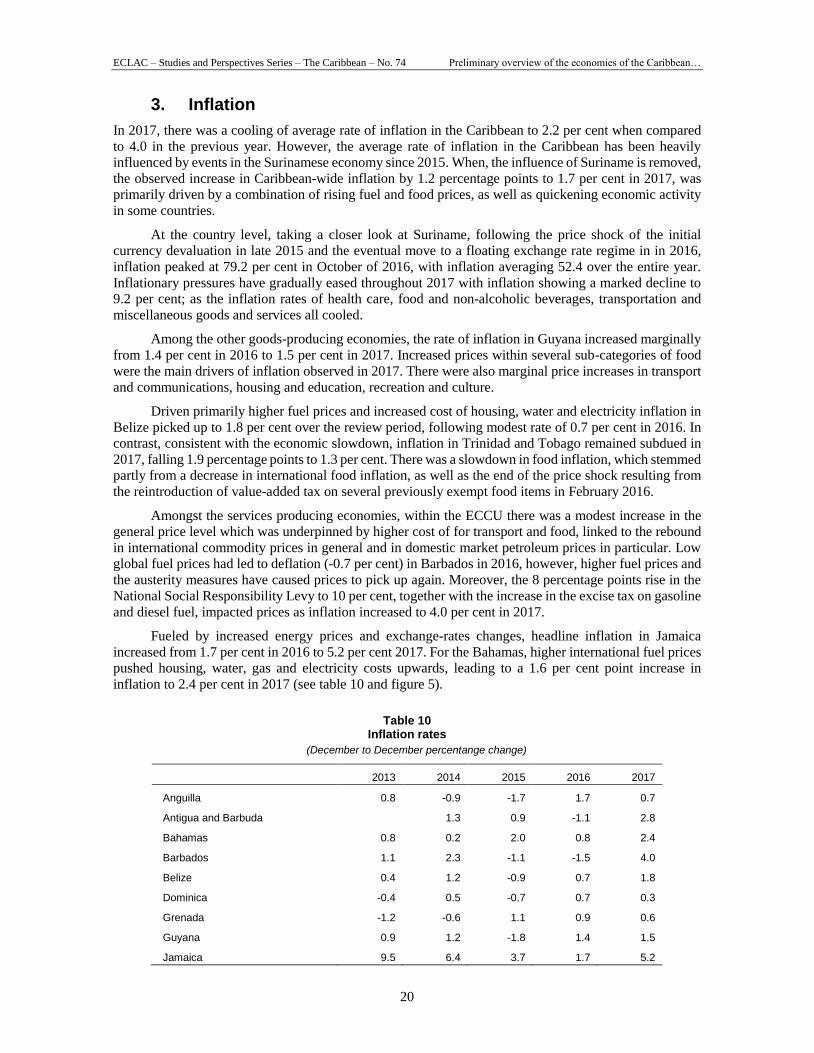
In 2017, there was a cooling of average rate of inflation in the Caribbean to 2.2 per cent when compared
to 4.0 in the previous year. However, the average rate of inflation in the Caribbean has been heavily
influenced by events in the Surinamese economy since 2015. When, the influence of Suriname is removed,
the observed increase in Caribbean-wide inflation by 1.2 percentage points to 1.7 per cent in 2017, was
primarily driven by a combination of rising fuel and food prices, as well as quickening economic activity
in some countries.
At the country level, taking a closer look at Suriname, following the price shock of the initial
currency devaluation in late 2015 and the eventual move to a floating exchange rate regime in in 2016,
inflation peaked at 79.2 per cent in October of 2016, with inflation averaging 52.4 over the entire year.
Inflationary pressures have gradually eased throughout 2017 with inflation showing a marked decline to
9.2 per cent; as the inflation rates of health care, food and non-alcoholic beverages, transportation and
miscellaneous goods and services all cooled.
Among the other goods-producing economies, the rate of inflation in Guyana increased marginally
from 1.4 per cent in 2016 to 1.5 per cent in 2017. Increased prices within several sub-categories of food
were the main drivers of inflation observed in 2017. There were also marginal price increases in transport
and communications, housing and education, recreation and culture.
Driven primarily higher fuel prices and increased cost of housing, water and electricity inflation in
Belize picked up to 1.8 per cent over the review period, following modest rate of 0.7 per cent in 2016. In
contrast, consistent with the economic slowdown, inflation in Trinidad and Tobago remained subdued in
2017, falling 1.9 percentage points to 1.3 per cent. There was a slowdown in food inflation, which stemmed
partly from a decrease in international food inflation, as well as the end of the price shock resulting from
the reintroduction of value-added tax on several previously exempt food items in February 2016.
Amongst the services producing economies, within the ECCU there was a modest increase in the
general price level which was underpinned by higher cost of for transport and food, linked to the rebound
in international commodity prices in general and in domestic market petroleum prices in particular. Low
global fuel prices had led to deflation (-0.7 per cent) in Barbados in 2016, however, higher fuel prices and
the austerity measures have caused prices to pick up again. Moreover, the 8 percentage points rise in the
National Social Responsibility Levy to 10 per cent, together with the increase in the excise tax on gasoline
and diesel fuel, impacted prices as inflation increased to 4.0 per cent in 2017.
Fueled by increased energy prices and exchange-rates changes, headline inflation in Jamaica
increased from 1.7 per cent in 2016 to 5.2 per cent 2017. For the Bahamas, higher international fuel prices
pushed housing, water, gas and electricity costs upwards, leading to a 1.6 per cent point increase in
inflation to 2.4 per cent in 2017 (see table 10 and figure 5).
Table 10
Inflation rates
(December to December percentange change)
2013 2014 2015 2016 2017
Anguilla 0.8 -0.9 -1.7 1.7 0.7
Antigua and Barbuda 1.3 0.9 -1.1 2.8
Bahamas 0.8 0.2 2.0 0.8 2.4
Barbados 1.1 2.3 -1.1 -1.5 4.0
Belize 0.4 1.2 -0.9 0.7 1.8
Dominica -0.4 0.5 -0.7 0.7 0.3
Grenada -1.2 -0.6 1.1 0.9 0.6
Guyana 0.9 1.2 -1.8 1.4 1.5
Jamaica 9.5 6.4 3.7 1.7 5.2
ECLAC – Studies and Perspectives Series – The Caribbean – No. 74 Preliminary overview of the economies of the Caribbean…
21
2013 2014 2015 2016 2017
Montserrat …. …. 0.1 1.3 0.9
Saint Kitts and Nevis 0.6 -0.5 -2.4 0.0 0.6
Saint Lucia -0.7 3.7 -2.6 -3.0 -0.3
Saint Vincent and the Grenadines 0.0 0.1 -2.1 1.0 1.9
Suriname 0.6 3.9 25.1 52.4 9.2
Trinidad and Tobago 5.6 8.5 1.5 3.1 1.3
Caribbean w/o Suriname 1.4 1.8 -0.3 0.5 1.7
Caribbean (15) 1.3 1.9 1.4 4.0 2.2
Goods producers 1.9 3.7 6.0 14.4 3.5
Service producers 1.1 1.2 -0.3 0.2 1.7
ECCU 0.0 0.5 -0.9 0.2 0.9
Source: Economic Commission for Latin America and the Caribbean (ECLAC), on the basis of official data. Note: Inflation rates for 2017 represents per cent change over the last 12 months.
Figure 5 Inflation
(Year-on-year percentange change)
Source: Economic Commission for Latin America and the Caribbean (ECLAC), on the basis of official data.
-0.5
1.5
3.5
5.5
7.5
9.5
-10
0
10
20
30
40
50
60
2013 2014 2015 2016 2017
Suriname (left axis) Caribbean w/o Suriname (right axis)
Table 10 (concluded)

ECLAC – Studies and Perspectives Series – The Caribbean – No. 74 Preliminary overview of the economies of the Caribbean…
23
II. The external sector
A. Current account
Based on available data, the average current account balance in the Caribbean narrowed by 2 percentage
points to -3.8 per cent of GDP in 2017. However, this average excludes current account data for the eight
OECS member States as updated statistics remained unavailable at the time of publication. This
assessment, therefore, includes all four goods-based economies along with three of the eleven
service-based economies.
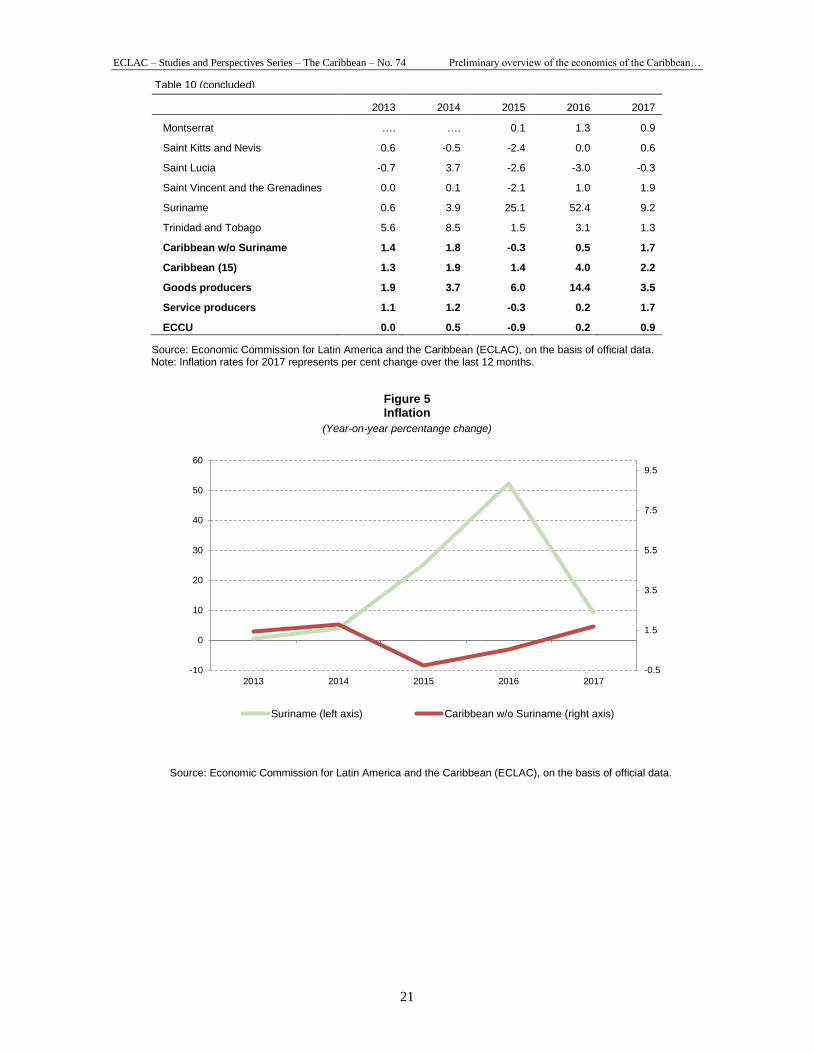
The observed narrowing of the Caribbean current account deficit in 2017 was primarily driven by
strong improvements among the goods producing economies where the current account deficit contracted
by 5.4 percentage points to 0.3 per cent of GDP. More specifically, the current account balances for both
Suriname and Trinidad and Tobago moved from deficits to surpluses (figure 6). For Suriname, an
expansion in the goods balance, as exports expanded and imports fell, largely precipitated the
13.8 percentage point increase in the current account balance to 10.3 per cent of GDP. This represents a
turnaround from the current account deficits observed over the last four years. For Trinidad and Tobago,
growth in total exports stemming from increased energy exports, boosted by higher energy prices,
supported the 13.2 percentage point increase in the current account balance to 1.8 per cent of GDP.
Alternatively, among the three service producing economies with available data, the average current
account deficit widened in 2017 by 2.5 percentage points to 8.4 per cent of GDP relative to 2016. The
deterioration in the current account was primarily driven by a widening of Bahamas’ current account
deficit by 6.2 percentage points. This resulted from a sharp decline in the vital services account surplus
underpinned by a significant net payment for construction and other services. In particular, construction
payments increased with the completion of the Baha Mar Resort and travel receipts fell with lower stop-
over visitor arrivals and spending.
ECLAC – Studies and Perspectives Series – The Caribbean – No. 74 Preliminary overview of the economies of the Caribbean…
24
Figure 6 Current account balance 2017
(Percentages)
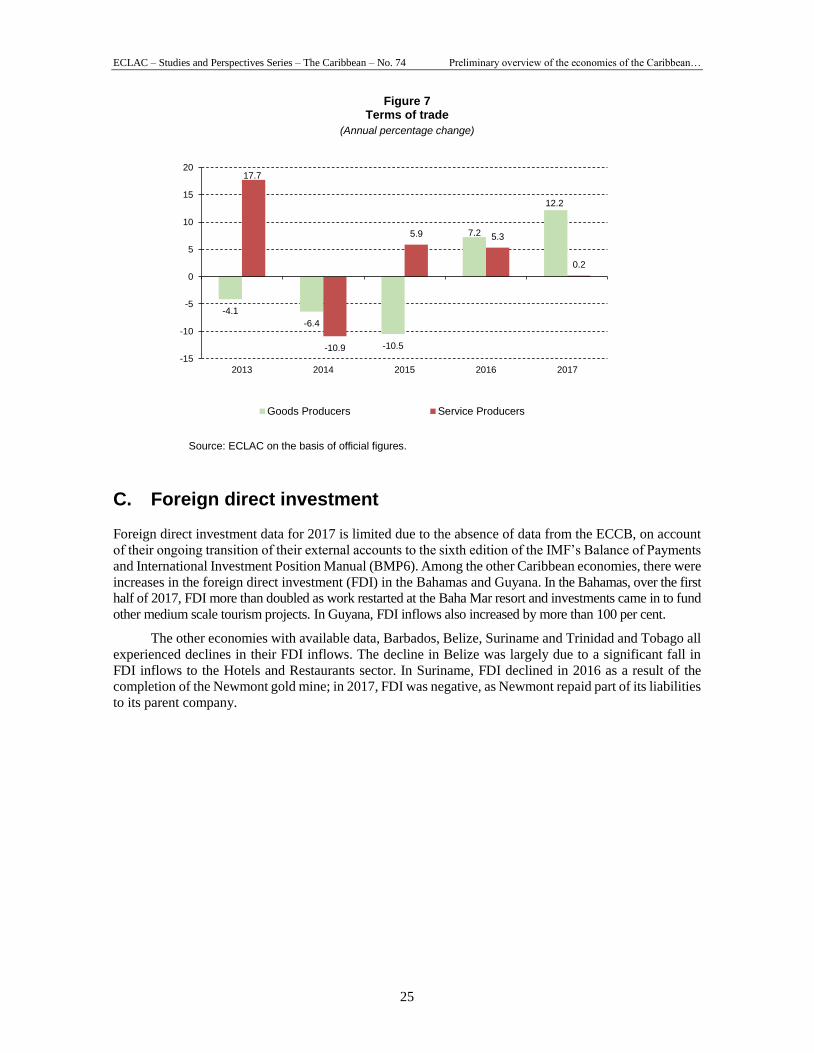
B. Terms of trade
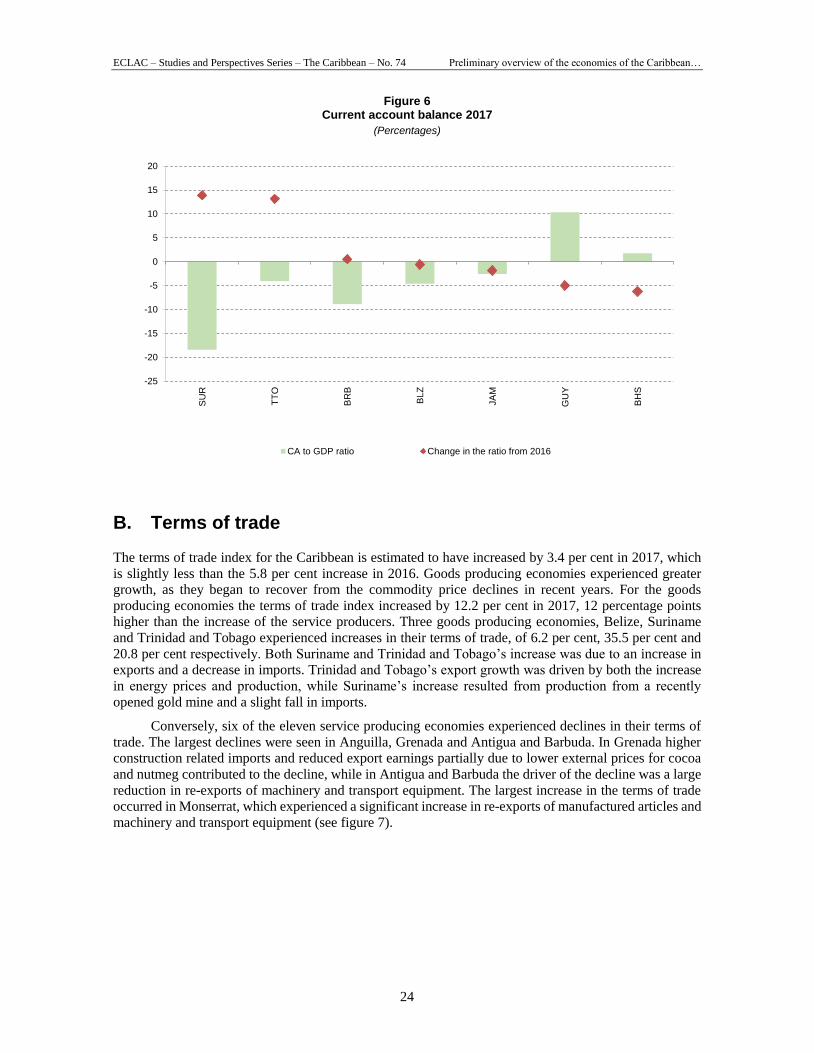
The terms of trade index for the Caribbean is estimated to have increased by 3.4 per cent in 2017, which
is slightly less than the 5.8 per cent increase in 2016. Goods producing economies experienced greater
growth, as they began to recover from the commodity price declines in recent years. For the goods
producing economies the terms of trade index increased by 12.2 per cent in 2017, 12 percentage points
higher than the increase of the service producers. Three goods producing economies, Belize, Suriname
and Trinidad and Tobago experienced increases in their terms of trade, of 6.2 per cent, 35.5 per cent and
20.8 per cent respectively. Both Suriname and Trinidad and Tobago’s increase was due to an increase in
exports and a decrease in imports. Trinidad and Tobago’s export growth was driven by both the increase
in energy prices and production, while Suriname’s increase resulted from production from a recently
opened gold mine and a slight fall in imports.
Conversely, six of the eleven service producing economies experienced declines in their terms of
trade. The largest declines were seen in Anguilla, Grenada and Antigua and Barbuda. In Grenada higher
construction related imports and reduced export earnings partially due to lower external prices for cocoa
and nutmeg contributed to the decline, while in Antigua and Barbuda the driver of the decline was a large
reduction in re-exports of machinery and transport equipment. The largest increase in the terms of trade
occurred in Monserrat, which experienced a significant increase in re-exports of manufactured articles and
machinery and transport equipment (see figure 7).
-25
-20
-15
-10
-5
0
5
10
15
20
SU
R
TT
O
BR
B
BLZ
JA
M
GU
Y
BH
S
CA to GDP ratio Change in the ratio from 2016
ECLAC – Studies and Perspectives Series – The Caribbean – No. 74 Preliminary overview of the economies of the Caribbean…
25
Figure 7 Terms of trade
(Annual percentage change)
Source: ECLAC on the basis of official figures.
C. Foreign direct investment
Foreign direct investment data for 2017 is limited due to the absence of data from the ECCB, on account
of their ongoing transition of their external accounts to the sixth edition of the IMF’s Balance of Payments
and International Investment Position Manual (BMP6). Among the other Caribbean economies, there were
increases in the foreign direct investment (FDI) in the Bahamas and Guyana. In the Bahamas, over the first
half of 2017, FDI more than doubled as work restarted at the Baha Mar resort and investments came in to fund
other medium scale tourism projects. In Guyana, FDI inflows also increased by more than 100 per cent.
The other economies with available data, Barbados, Belize, Suriname and Trinidad and Tobago all
experienced declines in their FDI inflows. The decline in Belize was largely due to a significant fall in
FDI inflows to the Hotels and Restaurants sector. In Suriname, FDI declined in 2016 as a result of the
completion of the Newmont gold mine; in 2017, FDI was negative, as Newmont repaid part of its liabilities
to its parent company.
-4.1
-6.4
-10.5
7.2
12.2
17.7
-10.9
5.9 5.3
0.2
-15
-10
-5
0
5
10
15
20
2013 2014 2015 2016 2017
Goods Producers Service Producers

ECLAC – Studies and Perspectives Series – The Caribbean – No. 74 Preliminary overview of the economies of the Caribbean…
27
III. Conclusion
The outlook for the Caribbean economies is positive and favourable as most of the economies posted
positive growth in 2017, and overall growth is expected to quicken in 2018. For the goods producing
countries, the positive outlook is influenced by the global rebound in commodity prices, and the associated
improvement in the respective island terms of trade. Growth in the services-producing economies will
continue to be highly reliant upon the performance of the tourism sector, particularly tourist arrivals. High
public debt, undiversified economies, and vulnerability to extreme weather conditions were the major
challenges faced by the subregion in 2017. Given that the Caribbean countries have limited fiscal
flexibility, ECLAC’s debt for climate adaption swap would be an excellent intitative to improve the
countries’ fiscal space, address their climate vulnerabilities, and build resilence and adaptive capacity.

ECLAC – Studies and Perspectives Series – The Caribbean – No. 74 Preliminary overview of the economies of the Caribbean…
29
IV. Country notes
A. Bahamas
Economic growth picked up to 1.2 per cent in 2017, relative to 0.2 per cent in 2016. Hurricane Irma was
expected to result in a 0.2 percentage point decline in growth from its previous forecast. Activity was
bolstered by increased value added in construction, linked the resumption of work on the Baha Mar Resort
and other varied-sized tourism projects. Value added in tourism remained subdued owing to a fall in air
and sea arrivals that was related to the lower room capacity in Grand Bahama following Hurricane
Matthew in 2016. Meanwhile, activity in the offshore financial services sector was buoyant. The fiscal
deficit based on the revised national accounts data increased from 0.8 per cent of GDP in FY2015/16 to
1.0 per cent of GDP in FY2016/17. Monetary conditions were influenced by high liquidity and a decline
in domestic credit as banks remained cautious amidst relatively high levels of non-performing loans
(NPLs). The balance of payments current account deficit widened due to lower services inflows and higher
payments for construction services. Growth is projected to strengthen to over 2.0 per cent in 2018. The
impetus will come from improved tourism activity based on the phased opening of the Baha Mar resort,
other tourism projects and the reconstruction after Hurricane Irma.
The new government has highlighted fiscal consolidation is a major policy priority in order to
reduce public debt. The 2017/18 Budget has outlined key measures to advance consolidation. These
include: a review of government expenditure programmes with a focus on improving efficiency and
effectiveness of spending; the introduction of fiscal responsibility legislation to make ministries and
departments more accountable for their spending and improved revenue administration to enhance tax
collection. Thegovernment also plans to introduce Public Procurement Regulations to achieve improved
value for money in public procurement.
Fiscal policy was expansionary in FY2016/17, as planned consolidation did not gain traction. Public
finances deteriorated during the first 11 months (year-to-date to May) with the overall deficit increasing
from 0.8 per cent of GDP to 1.0 per cent of GDP based on the new revised GDP figures [and is expected
to reach -4.5 per cent of GDP by the end of the fiscal year]. Total revenues grew by 3.7 per cent, but were offset by a 4.9 per cent expansion in expenditure. Tax receipts increased by 3.7 per cent, reflecting higher
proceeds from taxes on international trade and transactions in line with growth in imports, and increased
receipts from property tax. Meanwhile, VAT receipts declined marginally by 0.7 per cent. Expenditure
ECLAC – Studies and Perspectives Series – The Caribbean – No. 74 Preliminary overview of the economies of the Caribbean…
30
advanced by 4.9 per cent to 20.4 per cent of GDP. Current spending rose by 2.3 per cent, reversing the
over 10 per cent decline for the similar period of FY2015/16. Growth in current spending was driven by
higher outlays on goods and services and wages and salaries, partly reflecting increased procurement for
relief and rehabilitation after Hurricane Matthew and hiring of workers for the clean-up and rehabilitation
after the hurricane. Debt interest costs rose by 2.5 per cent, reflecting growth in public debt. Public debt
based on the revised GDP expanded from 65.1 per cent of GDP at the end of the second quarter of 2016
to 70.3 per cent of GDP for the similar period of 2017.
Monetary policy was neutral as the Central Bank held its policy discount rate constant at
4 per cent. Liquidity in the banking system remained elevated with banks excess liquid assets expanding
by B$260.3 million year-on-year to September. Liquidity was boosted by a US$250 million external loan
to the government and cautious lending practices by banks in the wake of continued high non-performing
loans (NPL) ratios. Domestic credit increased by 1.8 per cent, relative to a decline of 0.1 per cent in the
first nine months of 2016. Growth in credit was affected by the sale of B$138 million in NPLs to the
government’s Resolve Corporation that was established to help distressed banks clean-up their loan
portfolio. Credit to the government expanded by B$116 million, partly reflecting borrowing for reconstruction
following Hurricane Matthew, while credit to the private sector declined by B$134.7 million.
The balance of payments current account deficit more than doubled from 7.5 per cent of GDP in
the first half of 2016 to 15.3 per cent of GDP for the first half of 2017. This reflected a sharp
(28.4 per cent) decline in the vital services account surplus to B$576.7 million, underpinned by a
significant net payments for construction and other services. Construction payments rose in line with
outlays for the completion of the Baha Mar Resort. Developments also reflected a 1.6 per cent fall in travel
receipts that were associated with lower stopover visitor arrivals and spending. Also, the income account
deficit increased by 6.8 per cent in line with higher investment income outflows and compensation of
employees. Meanwhile, the capital and financial account surplus improved significantly. This reflected a
sharp reversal of outflows by commercial banks and a spike in other investments. These were reinforced
by a more than doubling of FDI inflows to B$ 39.9 million. International reserves amounted to
US$1,064.9 million at the end of September 2017, covering 4 months of imports relative to 3.8 months a
year earlier.
Economic growth is expected to pick up to 1.2 per cent in 2017 buoyed by construction activity,
including FDI-related projects and reconstruction after Hurricane Irma. FDI-funded projects included
continued work on the Chinese financed The Pointe Development and the Great Exuma Adventure Resort
that entails a B$370 million outlay between 2016 and 2022. Meanwhile, tourism activity slowed in 2017.
Total visitor arrivals declined by 2.8 per cent to 4.3 million during the first eight months of 2017 relative
to growth of 4.0 per cent in the similar period of 2016, partly due to the fallout from Hurricane Matthew
on visitor arrivals, especially in Grand Bahama. Air arrivals, which include the highest spending stopover
visitors was contracted by 6.3 per cent, compared with an increase of 3.2 per cent in 2016. Sea arrivals
dipped by 1.6 per cent, following firm growth of 4.3 per cent in 2016. The offshore financial services
sector remained buoyant, despite consolidations to optimise value.
Inflation picked up to around 1 per cent year-on-year to August from 0.15 per cent for the similar
period of 2016. The impetus for higher prices came from higher international fuel prices that fed through
to housing, water, gas and electricity costs. The rate of unemployment fell from 12.7 per cent in May 2016
to 9.9 per cent in May 2017. This is the lowest rate registered since the 2008 global crisis and was
underpinned by the addition of almost 12,000 jobs, partly reflecting the resumption of major work on the
Baha Mar resort. In a sign of improving labour market conditions, the rate of unemployment fell despite
a 22.1 per cent decline in the number of discouraged workers to 1,925.

ECLAC – Studies and Perspectives Series – The Caribbean – No. 74 Preliminary overview of the economies of the Caribbean…
31
Table 11 Bahamas: main economic indicators
2014 2015 2016 2017a
Annual percentage growth rates
GDP -0.5 -1.7 0.0 1.2
GDP per capita
Variation in consumer pricesb 0.2 2.0 0.8 2.4
Money (M1) 21.6
3.8
18.8 12.7
Annual average percentages
Unemployment 13.8
12.0
12.7 9.9
Central government overall balance/GDPc
-6.5 -4.3 -2.9 -1.0
Nominal deposit rated 1.7 1.4 1.10 0.92d
Nominal lending rated 11.1 11.8 12.26 10.96
Millions of dollars
Exports of goods and servicese 3 550.6 3 415.9 3 3742.0 315.2f
Imports of goods and servicese 5 040.5 4 231.9 4 295.6 1 498.6f
Current account balance -1 928.0 -1 203.2 -1 106.3 -863.3f
Capital and financial accountg 1 974.1 1 227.5 1 198.3 919.3f
Overall balance 46 24.3 92.0 56f
Source: Economic Commission for Latin America and the Caribbean (ECLAC), on the basis of official figures. a Preliminary data. b Twelve month variation to September. c Fiscal year, July to June. d Deposit rate, weighted average, twelve month to September. e Only includes exports of goods for 2017. f Data for 2015 is from January to June. g Includes errors and omissions.
B. Barbados
The Barbados economy is projected to achieve GDP growth of approximately 1.5 per cent in 2017
underpinned primarily by a productive performance in the tourism sector and spill over into the
construction sector. Performance in remaining sectors was subdued. The tourism sector grew by 4.2 per
cent in the first nine months of 2017 notwithstanding disruptions in air and cruise ship arrivals due to the
active hurricane season. Total long stay arrivals increased by 6.2 per cent with growth up in the United
States and Canada markets but the United Kingdom market continued to soften. Despite continued delays
in tourism-related infrastructural projects, activity in the construction sector remained strong as large
tourism investment projects progressed. As a consequence, the average unemployment rate fell to
9.7 per cent by September 2017. The current account deficit of the balance of payments widened
marginally to 4.1 per cent of GDP as an expansion in the goods trade deficit slightly offset the services
surplus. Moreover, despite remaining unsustainably high, the fiscal deficit dropped by 4.2 percentage
points to 5.6 per cent of GDP year-on-year and the gross public-sector debt stock fell below the
100 per cent mark to 96.2 per cent of GDP. Increasing global oil prices coupled with recently implemented
fiscal measures contributed to an increase in inflation to 3.4 per cent. Growth in 2018 is also projected at
around 1.5. per cent, tempered by austerity measures but shored up by continued dynamism in the tourism
and tourism-related infrastructural projects advancing to boost the construction sector.
ECLAC – Studies and Perspectives Series – The Caribbean – No. 74 Preliminary overview of the economies of the Caribbean…
32
Over the years, fiscal policy has centred on measures aimed at reducing the fiscal deficit through a
combination of revenue boosting and expenditure dampening measures. As a consequence of measures in
recent budgets, the fiscal deficit fell by 4.2 percentage points to 5.6 per cent of GDP in FY 2016-17 relative
to FY 2015-16, with a primary surplus of 2.6 per cent of GDP. The gross public sector debt also broke the
100 per cent of GDP mark for the first time in five years reaching 96.2 per cent of GDP by September
2017 relative to 100.4 per cent of GDP during the same period in 2016. However, achieving the targeted
4.4 per cent of GDP by the end of FY 2017-18 as proposed in the budget poses some challenge given the
upcoming elections in 2018.
For a number of years, the Central Bank of Barbados (CBB) has contributed to the financing of the
fiscal deficit through the purchase of government debt and creation of money. However, in the 2017-18
budget speech, the government of Barbados announced its intention to curb this trend given the resulting
pressure on the maintenance of the currency peg. By September 2017, CBB’s government financing
contribution had decreased by 91.9 per cent to US$ 23.1 million. In order to counteract the reduction in
financing, the CBB tightened its monetary policy stance by implementing a 5 per cent increase in the
Barbados dollar securities reserve requirement ratio for commercial banks to 15 per cent. This policy
directly translated to the commercial bank government financing almost doubling to US $105.8 million
by September 2017 relative to the same period in 2016. By November 2017, CBB announced two further
increases to 18 per cent effective December 1, 2017 and 20 per cent effective January 1, 2018.
As of September 2017, the international reserves fell to US $549.7 million representing 8.6 weeks
of import cover, well below the 12 week minimum threshold of sustainability. However, the CBB is
committed to preserving the fixed exchange rate peg (BDS $2: US $1) in order to maintain monetary
stability and to facilitate ease of conversion for the numerous foreign visitors. In the short term, the
government has initiated the sale of state owned enterprises such as the National Terminal Company and
the Hilton hotel to stem the fall of international reserves. However, progress with the sale of the National
Terminal Company has been slow as they await approval from the Fair Trade Commission to proceed.
Long term measures to counter any further shortfall in the international reserves will focus on investments
in the tourism industry.
In an effort to address the urgent need for restructuring of the Barbados economy in the medium to
long term, the government of Barbados established working groups from the Social Partnership to develop
the National Fiscal, Economic, and Social Development Restructuring and Enhancement programme. The
working groups have been tasked with the responsibility of developing national plans that can accelerate
economic growth, significantly narrow the fiscal deficit, establish debt sustainability management plan,
reduce unemployment, rebuild the international reserves and enhance social and environmental
protections. More comprehensive details of the plan are expected to be rolled out by end of 2017.
The current account deficit widened marginally to 4.1 per cent of GDP in the first three quarters of
2017. A 3.4 per cent increase in the service surplus, the largest positive component of the current account,
was offset by a 7.4 per cent fall in goods exports which outpaced the decline in goods imports. The balance
of payments continues to record a moderate income deficit along with low levels of remittances relative
to transfers abroad. It is, however, the substantial fall in the international reserves by US $67 million as a
consequence of a steep drop in net short-term investment flows that remains a top priority for the government.
Over the last decade, the Barbados economy has struggled to regain a firm grip on economic growth.
The dynamic performance of the tourism sector and its spill over into sectors such as construction has
bolstered the economy, however, the economy remains highly vulnerable to external events and growth
remains low. In the first three quarters of 2017, economic activity slowed to 1.4 per cent relative to
1.6 per cent during the same period in 2016. Activity in the tourism sector grew by 4.2 per cent in the first
nine months of 2017 with a strong performance in the first half of 2017 that was impeded in the third
quarter by disruptions in air and cruise ship arrivals stemming from an active hurricane season. Long-stay
arrivals in major source markets such as the United States and Canada were robust, expanding by
14.4 per cent and 10.7 per cent, respectively. However, arrivals from the United Kingdom, Barbados’ main
source market, remained unchanged as uncertainty around the Brexit referendum persist. The construction
sector grew by 4.7 per cent as projects such as the Sandals Royal progressed but was stymied by continued

ECLAC – Studies and Perspectives Series – The Caribbean – No. 74 Preliminary overview of the economies of the Caribbean…
33
delays in other large-scale tourism-related projects. Although activity in the international business sector has
been subdued, there is hope for recovery as efforts are being made to boost transparency and opportunities in
alternative markets are pursued. Value added in all other sectors was muted. GDP growth in 2018 is projected
at 1.5 per cent driven by a buoyant tourism sector and progress with major tourism-related construction projects.
However, further delays in major construction projects can potentially temper this projection.
After a period of deflation as a consequence of weak global fuel prices, prices have begun to pick
up again as a result of increased fuel prices and austerity measures passed in the recent budget. By
September 2017, the 8 percentage point increase in the National Social Responsibility Levy to 10 per cent
along with the increase in the excise tax on gasoline and fuel began to impact prices as inflation increased
to 3.4 per cent, a 3.4 percentage point increase year-on-year. However, prices are expected to stabilize by
late 2017 into 2018. The buoyant tourism sector along with spill-overs in the construction sector
contributed to a further drop in the unemployment rate for the third consecutive year, falling to an average
of 9.7 per cent over the first three quarters of 2017 compared to 10 per cent in the same period in 2016.
This downward trend can, however, be impeded by government’s austerity policies.
Table 12 Barbados: main economic indicators
2015 2016 2017a
Annual percentage growth rates
Gross domestic product growth 0.9 2.0 1.4
Per capita gross domestic product growth NC 1.2 …
Consumer prices -1.1 -1.5 3.4
Money (M1) 20.9 14.5 …
Annual average percentages
Central government overall balance /GDP -7.7 -9.4 --5.5
Nominal deposit rate 1.8 1.7 0.6
Nominal lending rate 7.9 7.9 6.2
Millions of dollars
Exports of goods 800.5 834.5 574.5
Imports of goods [c.i.f.] 1 537.2 1 540.5 1 086.5
Current account balance -577.1 -415.3 -282.3
Capital and financial account balance 425.4 75.6 133.4
Overall balance -125.5 -245.8 -133.9
Source: Economic Commission for Latin America and the Caribbean (ECLAC), on the basis of official figures.
a January – September 2017. NC – unable to calculate.
C. Belize
Economic activity picked up with growth of 2.5 per cent in 2017, following the decline of 0.8 per cent in
2016. The improvement in activity was led by a 5.7 per cent growth in the primary sector, after a major
contraction in 2016. The secondary and tertiary sectors grew by 1.8 per cent and 1.3 per cent, respectively.
With the growth in activity and higher fuel prices inflation increased to 1.8 per cent in 2017 from
0.7 per cent in 2016. Fiscal consolidation continued, with the deficit declining to 1.8 per cent of GDP from
3.4 per cent of GDP last year on a calendar year basis. Similarly, the current account deficit narrowed
marginally from 8.8 per cent of GDP in 2016 to 8.7 per cent of GDP in 2017, reflecting an improvement
ECLAC – Studies and Perspectives Series – The Caribbean – No. 74 Preliminary overview of the economies of the Caribbean…
34
in both the trade and services account. The economy is projected to grow by 2.4 per cent in 2018, buoyed
by a 4.4 per cent expansion in agriculture due mainly to strong performance of sugar subsector. The
services sector is projected to grow by 2.0 per cent, underpinned by firm growth in stay-over visitor arrivals.
In 2017, economic policy centred on fiscal adjustment through debt restructuring and efforts to
contain public spending. In March, Belize secured an agreement to restructure its private external debt,
the third restructuring since 2006. Under the agreement, the interest rate on the debt has been reduced from
4.9 per cent, down from the scheduled step up rate of 6.77 per cent that was due in August of 2017. The
start of principal repayments has been pushed back to 2030-34 instead of 2019. Overall, the net present
value (NPV) of the debt has been cut by around 28 per cent. Nevertheless, the failure to secure a haircut
on principal payments means that the debt will remain elevated over the medium to longer-term.
Fiscal policy was contractionary in 2017, with the fiscal deficit declining from 3.4 per cent of GDP
in 2016 to 1.8 per cent of GDP in 2017. Total revenue and grants expanded by 8.0 per cent, bolstered by
higher proceeds from taxes on goods and services, property taxes and non-tax revenue. Expenditure grew
by 2.6 per cent, underpinned by 6.6 per cent increase in current spending. Outlays on wages and salaries
rose by 5.2 per cent to BZ$419 million, reflecting the increase in public sector wages. Spending on goods
and services expanded by 12.6 per cent, including the fees incurred for the renegotiation of the Superbond
debt. Capital expenditure contracted by 16.3 per cent in line with government’s policy of cutting capital
outlays to reduce public debt.
During the first quarter of FY2017/18, the fiscal deficit stood at 0.6 per cent of GDP. Total revenue
expanded by 7.6 per cent to BZ$282.1 million, while expenditure contracted by 5.1 per cent, mainly due
to lower capital spending. The trend has been for authorities to cut capital spending to improve the fiscal
position, but given the importance of capital investment for growth, the focus should shift instead to cutting
government consumption. Central government debt increased from 88.8 per cent of GDP in 2016 to 91.7
per cent of GDP in 2017. This mainly reflected growth in domestic debt, partly to finance the settlement
for the nationalisation of the Bahamas Telemedia Limited (BTL).
Monetary policy remained neutral in 2017, as the Central Bank maintained its policy liquid assets
ratio at 6.5 per cent. Despite improved activity, the broad money supply contracted by 1.7 per cent, owing
to reduced net foreign assets, reflecting government external debt servicing costs and payments for the
acquisition of BTL. Domestic credit grew by 4.7 per cent in 2017, driven by increased lending to the private
sector for agricultural processing, sugar production, commercial fishing and real estate development.
The external current account deficit widened from 8.1 per cent of GDP in 2016 to 8.7 per cent of
GDP in 2017. Developments reflected a sharp growth in the income deficit and reduced net transfers,
which offset the fall in the merchandise deficit and the increase in the services account surplus. The deficit
on the income account expanded by 41.5 per cent, due to higher outflows of investment income. Net
transfers contracted by over 36 per cent in line with lower multilateral grant receipts. The trade deficit
contracted by 6.9 per cent to US$402.5 million, in line with 5.5 per cent increase in exports and a 0.6
per cent decline in imports. Exports of sugar expanded by 48.3 per cent to 114, 263 long tons, but receipts
rose by significantly, owing to an 18.4 per cent rise in the average price. Meanwhile, petroleum exports
fell by 33.3 per cent to 133,866 barrels, but higher prices bolstered export receipts. The services account
surplus widened by 11.7 per cent, boosted by an 8.6 per cent increase in tourism receipts to
US$213 million. By contrast, the surplus on the capital and financial account contracted by 12.7 per cent
to US$70.2 million, mainly reflecting a sharp fall in FDI to US$12.3 million. International reserves
declined by 23 per cent to 288.1 million, covering 3.7 months of imports.
The economy recovered in 2017 with growth of 2.5 per cent, reversing the decline of 0.6 per cent
in 2016. The primary sectors experienced a major turnaround, registering growth of 5.7 per cent, following
a decline of over 22 per cent in 2016. Sugar production expanded by 22.2 per cent to 161,545 long tons
for the first eight months of 2017, reflecting increased productivity as the cane to sugar ratio fell from 10.1
to 9.4 Banana output was up by 14 per cent, owing in part to favourable weather. By contrast, petroleum
output contracted by 17.8 per cent to 253,760 barrels. Construction activity slowed with growth of
1.9 per cent, partly associated with the tapering off of some government infrastructure projects. Value
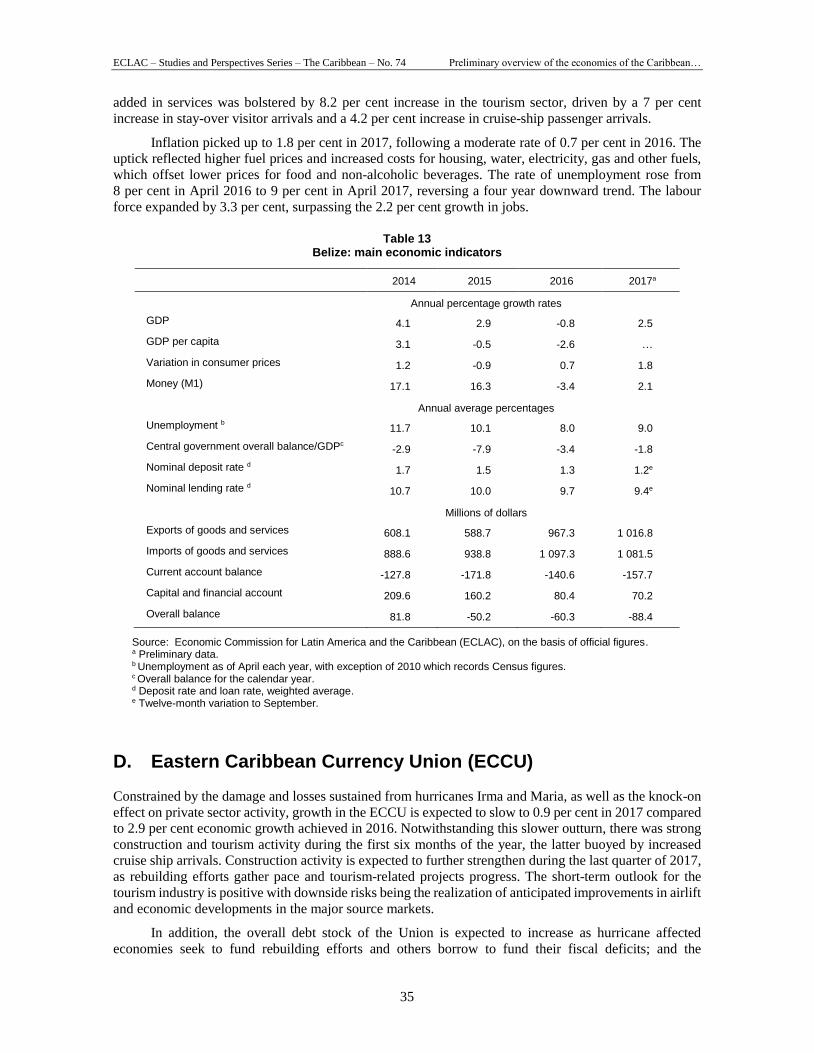
ECLAC – Studies and Perspectives Series – The Caribbean – No. 74 Preliminary overview of the economies of the Caribbean…
35
added in services was bolstered by 8.2 per cent increase in the tourism sector, driven by a 7 per cent
increase in stay-over visitor arrivals and a 4.2 per cent increase in cruise-ship passenger arrivals.
Inflation picked up to 1.8 per cent in 2017, following a moderate rate of 0.7 per cent in 2016. The
uptick reflected higher fuel prices and increased costs for housing, water, electricity, gas and other fuels,
which offset lower prices for food and non-alcoholic beverages. The rate of unemployment rose from
8 per cent in April 2016 to 9 per cent in April 2017, reversing a four year downward trend. The labour
force expanded by 3.3 per cent, surpassing the 2.2 per cent growth in jobs.
Table 13 Belize: main economic indicators
2014 2015 2016 2017a
Annual percentage growth rates
GDP 4.1 2.9 -0.8 2.5
GDP per capita 3.1 -0.5 -2.6 …
Variation in consumer prices 1.2 -0.9 0.7 1.8
Money (M1) 17.1 16.3 -3.4 2.1
Annual average percentages
Unemployment b 11.7 10.1 8.0 9.0
Central government overall balance/GDPc -2.9 -7.9 -3.4 -1.8
Nominal deposit rate d 1.7 1.5 1.3 1.2e
Nominal lending rate d 10.7 10.0 9.7 9.4e
Millions of dollars
Exports of goods and services 608.1 588.7 967.3 1 016.8
Imports of goods and services 888.6 938.8 1 097.3 1 081.5
Current account balance -127.8 -171.8 -140.6 -157.7
Capital and financial account 209.6 160.2 80.4 70.2
Overall balance 81.8 -50.2 -60.3 -88.4
Source: Economic Commission for Latin America and the Caribbean (ECLAC), on the basis of official figures. a Preliminary data. b Unemployment as of April each year, with exception of 2010 which records Census figures. c Overall balance for the calendar year. d Deposit rate and loan rate, weighted average. e Twelve-month variation to September.
D. Eastern Caribbean Currency Union (ECCU)
Constrained by the damage and losses sustained from hurricanes Irma and Maria, as well as the knock-on
effect on private sector activity, growth in the ECCU is expected to slow to 0.9 per cent in 2017 compared
to 2.9 per cent economic growth achieved in 2016. Notwithstanding this slower outturn, there was strong
construction and tourism activity during the first six months of the year, the latter buoyed by increased
cruise ship arrivals. Construction activity is expected to further strengthen during the last quarter of 2017,
as rebuilding efforts gather pace and tourism-related projects progress. The short-term outlook for the
tourism industry is positive with downside risks being the realization of anticipated improvements in airlift
and economic developments in the major source markets.
In addition, the overall debt stock of the Union is expected to increase as hurricane affected
economies seek to fund rebuilding efforts and others borrow to fund their fiscal deficits; and the
ECLAC – Studies and Perspectives Series – The Caribbean – No. 74 Preliminary overview of the economies of the Caribbean…
36
merchandize trade deficit is expected to increase. This notwithstanding, the ECCU is projected to achieve
real growth of 4.1 per cent in 2018 as Dominica returns to positive growth; several private sector tourism-
related and public sector infrastructure projects come on stream in Antigua and Barbuda, Grenada and
Saint Lucia; and positive outruns are projected for the tourism and manufacturing sectors.
The fiscal operations (Overall Balance after grants) of the ECCU economies generated a surplus of
EC$27.2 million during the first half of June 2017, compared to the EC$138.5 million surplus achieved
during the same period in 2016.This weakening of the fiscal performance over the review period was
influenced by a deterioration in the current account position coupled with increased capital expenditure,
particularly on infrastructural projects. In this regard, it is noteworthy that there was a significant fall off
in Citizen by Investment Programme (CIB) inflows in Saint Kitts and Nevis (EC$66.5 million of
58.4 per cent) and Dominica (EC$48.1 million or 23.2 per cent) during the first half of 2017 relative to the
same period in 2016. Concomitantly, Dominica (EC$21.0 million) exhibited the largest increase in
payments for goods and services, followed by Saint Lucia (EC$5.2 million). Furthermore, underpinned by
a more than doubling of capital outlays in Dominica, there was an expansion (6.3 per cent) in capital
expenditure4 during the first half of 2017, when compared to the same period in 2016. Capital expenditure
in Dominica was centred of general recovery and reconstruction activities following Tropical Storm Erica,
specifically rehabilitation work at the Douglas Charles Airport, dredging of rivers, reconstruction of the
new West Bridge and investment in housing. Moreover, fiscal deficits were recorded in Antigua and
Barbuda, Dominica, and Saint Vincent and the Grenadines, while surpluses were recorded in Anguilla,
Grenada, Saint Kitts and Nevis, and Saint Lucia during the first half of 2017.
As a natural consequence of the weakening fiscal position of the ECCU during the first half of
2017, there was a concomitant expansion in the debt stock. The total outstanding public debt stock of the
ECCU rose by 1.4 per cent from end of the fourth quarter of 2016 to the end of the second quarter of 2017,
as total external debt expanded. During the aforementioned period public debt stock increased in all ECCU
countries with the exception of Anguilla and Dominica. However, the debt as a percentage of GDP
declined in Antigua and Barbuda, Grenada, Saint Kitts and Nevis and Saint Vincent and the Grenadines.
With regard to the monetary sector, monetary liabilities (M2) grew by 2.3 per cent to EC$16,220.0 million
during the first quarter of 2017, this was comparable to the growth achieved over the same period in the previous
year. It is noteworthy that by end of June 2017, narrow money (M1) grew by 5.7 per cent. In addition, during
the first quarter of 2017, commercial bank liquidity, as measured by the ratio of liquid assets to total
deposits plus liquid liabilities, increased by 2.4 percentage points to 47.0 per cent. During the first six
months of 2017, however, the nominal deposit rate declined marginally from 1.7 per cent at the end of
June 2016, to 1.6 per cent at the end of June 2017. The nominal lending rate remain unchanged at 8.5 per
as at June 2017, from the same period during the previous year. Thus, there was a minor contraction in the
interest rate spread by 10 basis points over the first six months of 2017. Domestic credit expanded by
1.3 per cent to EC$10,128.5m during the first quarter of 2017, in contrast to a decline of
2.7 per cent by over the same period in 2016.Net credit to the general government increased by 20.3 per cent,
while credit to the private sector declined by 0.3 per cent.
Exchange rate between the Eastern Caribbean dollar and the United States dollar remained fixed at
EC$2.7 to US$1 during the first half of 2017.
Driven by the combination of declining exports and rising imports, there was a widening of the
merchandise trade deficit of the ECCU relative to the first half of 2017. The expansion in imports was
fuelled by machinery and transport equipment, manufactured goods and articles, and food and live animals.
Within the real sector of the ECCU, there was higher construction activity in Antigua and Barbuda,
Dominica, Grenada, Saint Kitts and Nevis, Saint Lucia. This offset observed weakening in construction
activity in theSt Vincent and the Grenadines with the completion of the Argyle International Airport during
the first quarter of 2017.This ECCU-wide up-tick in construction activity was largely fuelled by private
sector investment in hotels and other-tourism-related projects, as well as increased capital expenditure,
which focussed on schools, roads and infrastructural development alluded to earlier. Across the ECCU,
4 i.e. capital expenditure and net lending of which: Capital expenditure.
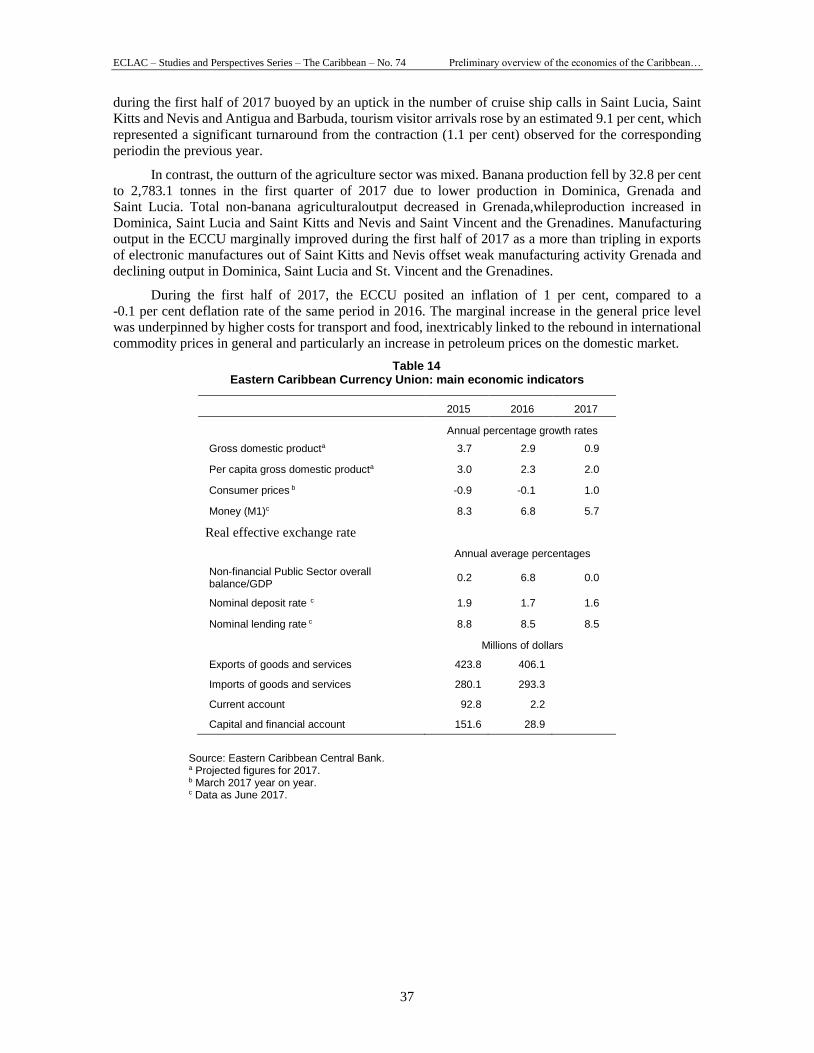
ECLAC – Studies and Perspectives Series – The Caribbean – No. 74 Preliminary overview of the economies of the Caribbean…
37
during the first half of 2017 buoyed by an uptick in the number of cruise ship calls in Saint Lucia, Saint
Kitts and Nevis and Antigua and Barbuda, tourism visitor arrivals rose by an estimated 9.1 per cent, which
represented a significant turnaround from the contraction (1.1 per cent) observed for the corresponding
periodin the previous year.
In contrast, the outturn of the agriculture sector was mixed. Banana production fell by 32.8 per cent
to 2,783.1 tonnes in the first quarter of 2017 due to lower production in Dominica, Grenada and
Saint Lucia. Total non-banana agriculturaloutput decreased in Grenada,whileproduction increased in
Dominica, Saint Lucia and Saint Kitts and Nevis and Saint Vincent and the Grenadines. Manufacturing
output in the ECCU marginally improved during the first half of 2017 as a more than tripling in exports
of electronic manufactures out of Saint Kitts and Nevis offset weak manufacturing activity Grenada and
declining output in Dominica, Saint Lucia and St. Vincent and the Grenadines.
During the first half of 2017, the ECCU posited an inflation of 1 per cent, compared to a
-0.1 per cent deflation rate of the same period in 2016. The marginal increase in the general price level
was underpinned by higher costs for transport and food, inextricably linked to the rebound in international
commodity prices in general and particularly an increase in petroleum prices on the domestic market.
Table 14 Eastern Caribbean Currency Union: main economic indicators
2015 2016 2017
Annual percentage growth rates
Gross domestic producta 3.7 2.9 0.9
Per capita gross domestic producta 3.0 2.3 2.0
Consumer prices b -0.9 -0.1 1.0
Money (M1)c 8.3 6.8 5.7
Real effective exchange rate
Annual average percentages
Non-financial Public Sector overall balance/GDP
0.2 6.8 0.0
Nominal deposit rate c 1.9 1.7 1.6
Nominal lending rate c 8.8 8.5 8.5
Millions of dollars
Exports of goods and services 423.8 406.1
Imports of goods and services 280.1 293.3
Current account 92.8 2.2
Capital and financial account 151.6 28.9
Source: Eastern Caribbean Central Bank. a Projected figures for 2017. b March 2017 year on year. c Data as June 2017.
ECLAC – Studies and Perspectives Series – The Caribbean – No. 74 Preliminary overview of the economies of the Caribbean…
38
E. Guyana
During the first half of 2017, there was a dedicated focus on quickening the pace of spending under the
Public Sector Investment Programme (PSIP) and instituting structural reforms geared towards promoting
diversification and greening of the Guyana economy. However, given Guyana’s high product
specialization, falling commodity prices continued to negatively impact on export performance, while
lower private sector investment coupled with adverse weather conditions lead to declining output in key
sectors (e.g. mining, sugar and forestry, as well as financial & insurance). This notwithstanding, fuelled
by increased activity in the manufacturing (primarily rice), construction and other services sectors the
economy expected to achieve overall growth of 2.9 per cent in 2017.
The Guyana economy is projected to expand by 3.5 per cent in 2018 as structural reforms begin to
take hold thereby assisting in boosting economic activity and accelerating the rate of implementation of
infrastructural projects. Further, it is expected that favourable international prices and access new markets
will provide impetus for increased rice production;and output of the gold and services sector will continue
to expand.
The Central Government generated an overall fiscal surplus G$8.3 billion by mid-year 2017,
relative the G$0.82 billion surplus in the first half of the previous year. This positive outturn was
underpinned by improved revenue collections (13.1per cent) as there were observed increases across
almost all fiscal categories, particularly income tax from both private corporations & individuals,
withholding, value-added and excise taxes. This more than off-set a 6.5 per cent expansion in current
expenditure due to increased employment costs and purchases of other goods & services. In this regard,
there was a significant reduction in transfer payments, as disbursements to the Guyana Sugar Corporation
(GUYSUCO) fell by G$2 billion during the review period. Further, a combination of procurement
planning and capacity constraints, which led to delays in the implementation of projects under the PSIP,
meant that only 27.9 per cent of budgeted allocation was spent.
Shifting to a consideration of the monetary sector, low inflationary pressures coupled with increased
domestic credit (9.0 per cent) contributed to a 3.6 per cent expansion in broad money during the first half
of 2017 relative to the same period in 2016. Concomitantly, the Bank of Guyana continued to utilize the
issuing of Treasury Bills as its primary mechanism for mopping up liquidity in the system. However, a
15 basis points fall in the 91-day treasury bill rate from 1.68 per cent to 1.54 per cent, may have contributed
to dampened demand. The decline in treasury bills held by the commercial banks is noteworthy in this regard.
Moreover, in small open, commodity exporting economies like Guyana, public sector spending
commonly provides an important engine for driving economic activity, including in the private sector. In
this way the Government’s slow implementation of locally-funded projects during the first half of the 2017
had distinct knock-on effects. The expansion (9.0 per cent) in net domestic credit recorded during the first
half of 2017 was principally due to an increase in government’s domestic debt, as private sector credit
grew by (1.8 per cent) for the period. Indeed, lending to agriculture, manufacturing and mining and
quarrying sectors all declined. Against this backdrop, the observed significant uptick in lending to the
services sector (7.0 per cent) suggests that sector may be an emerging area of comparative advantage. The
expansion in mortgage lending (4.1 per cent) when set against declining credit to key productive sectors,
also suggests that there continues to be an adversity to risk in the commercial banking sector of Guyana.
Guyana’s debt burden continues to remain at sustainable levels and there has a dedicated focus by
the Government towards prudent debt management. Key in this regard has been ensuring that debt
servicing costs don’t escalate. Accordingly, there was only a 5.5 per cent, period-on-period, increase in
total public debt during the review period, as both external (5.0 per cent) and domestic (6.9 per cent) debt
trended upwards. Expansion in Guyana’s external debt stock fuelled by higher disbursements from
mulitaleral creditors and the transfer of Atlantic Hotel Inc. (AHI)’s, the owner of Guyana Marriott Hotel,
debt to Republic Bank Limited (Trinidad) to the central government.

ECLAC – Studies and Perspectives Series – The Caribbean – No. 74 Preliminary overview of the economies of the Caribbean…
39
In the real sector, there was a deceleration in the rate of growth agricultural production (from
10 per cent to 6.4 per cent) during the first half of 2017 relative to the same period in the previous year, as
adverse weather conditions affected output. There was, however, a marked increase (31.6 per cent) in rice
production during the review period, as farmers aggressively expanded sown acreage in response to
favourable market prices, gains made in penetrating new markets and progress made by the Guyana Rice
Development Board (GRDB) fostering an industry shift towards value-added. In fact, the rice industry
was the main driver of growth in manufacturing (9.9 per cent) during the period under review. Although
cane yields (tonnes per acre) were higher than the previous year, in the face of falling global
prices,domestic sugar output declined (12.4 per cent) during the first half of 2017 as mechanical problems
at the Skeldon estate prevented production at the plant.
Falling prices and structural issues including absence of lumber certification have affected
investment in the forestry industry, leading to a fall (18.2 per cent) in production during the first six months
of 2017. In the mining and quarrying sector, changes in the tax structure of the gold industry introduced
in 2017 didn’t lead to the anticipated crowding out of domestic private sector investment. However,
production from small and medium sized gold producers marginally decreased (0.5 per cent).This along
with a contraction in output from the two large multinational companies led to an overall gold decline in
gold production (1.7 per cent) during the first six months of 2017.
Inflation stood at 1.1 per cent the end of June 2017, falling from 1.4 per cent as at the end of
December 2016. Increased prices within several subcategories of food were the main divers of the inflation
observed over the review period. There were also marginal increases in transport & communications
(0.4 per cent); housing (0.04 per cent); education, recreation and culture (3.1 per cent) prices.
Table 15 Guyana: main economic indicators
2015 2016 2017
Annual percentage growth rates
GDP 3.2 3.4 2.9
GDP per capita 3.3 8.0
Variation in consumer prices -1.7 1.4 1.1a
Money (M1)
Annual average percentages
Central government overall balance/GDP -1.4 -4.5
Nominal deposit rate 2.3 1.7 1.7b
Nominal lending rate 10.6 10.4 10.3b
Millions of dollars
Exports of goods 1
151.3
1 440.6 677.5c
Imports of goods -1
491.6
-1 447.8
-789.7c
Current account -181.5 13.0 -81.7c
Capital and financial account 179.1 40.2 81.6c
Overall balance -107.7 -53.3 -46.0c
Source: Central Bank of Guyana. a June 2017 year on year. b September 2017. c June 2017.
ECLAC – Studies and Perspectives Series – The Caribbean – No. 74 Preliminary overview of the economies of the Caribbean…
40
F. Jamaica
The Jamaican economy posted growth rates of 0.1 per cent, in the first quarter of 2017 and .3 per cent in
the second quarter. Growth in 2016 was 1.3 per cent and will be no more than 1.2 per cent in 2017 but will
rebound to 1.3 per cent in 2018. The government's main policy objective in 2018 will be to meet the annual
requirement of the three-year, US$1.64bn Stand-By Arrangement (SBA) with the IMF, which was signed
in November 2016 (replacing a US$932 m, four-year extended fund facility signed in May 2013). The
focus will be on promoting economic growth, which has stalled at less than 2 per cent in recent years. The
hope is that growth would continue to build gradually with the new IMF agreement in place. In October
of 2017, at the second review of the programme, all performance criteria and structural benchmarks were
met. The Jamaican authorities have indicated that they intend to treat the SBA as precautionary, that is,
effectively an insurance policy against unforeseen economic shocks that are beyond the control of Jamaica.
Inflation in 2016 was 1.7 per cent and is likely to be higher in 2017 as in June it stood at 4 per cent. Higher
inflation is linked to increased energy prices and exchange rate changes despite fiscal restraint.
The fiscal challenges continue to be the biggest concern of the government as Jamaica seeks to
control its public finances. In October 2017 the IMF reported the successful completion of the second
review of the SBA due to expenditure restraints and tax increases. In fiscal year 2016/17 most categories
of government expenditure were below budget and overall expenditure was 1 per cent below budget. In
addition capital expenditure was 6.4 per cent below budget. This resulted in a primary surplus of
8.4 per cent while the budget target was 7.8 per cent of GDP. As part of the reduction in borrowing
requirements, loan receipts were some 11.8 per cent below budget. In terms of tax changes, the government
raised the minimum personal income tax threshold, from J$592,800 (US$4,200) to J$1.5 m, effective from
April 2017 and it is anticipated that increases in indirect taxes will compensate for the loss of income tax
earnings in the 2017/18 fiscal year.
The main challenge facing Jamaica is the debt overhang which stood at 124 per cent of GDP in
fiscal year 2016/17 and projected as 119 per cent in 2017/18. By December 2016, External debt was
61.28 per cent of total debt and domestic debt was 38.8 per cent. The large foreign exchange component
of the debt carries foreign exchange risks. At the end of December 2016 foreign currency debt to total debt
was 61 per cent of debt and domestic foreign exchange component was 8 per cent. The Jamaican
government has been leveraging the low interest rates in international markets to reduce debt service costs.
For example, in August 2017, the government reopened two Eurobonds and raised US$869m, which it
will use to retire more expensive debt maturing in 2019-2025. The long anticipated increase in US interest
rates will also adversely affect debt repayment costs. It is important to note that some 34.6 per cent of total
debt is subject to interest rate variations.
Turning to the exchange rate, the weighted average selling rate of the Jamaica Dollar vis-á-vis the
US dollar closed the June 2017 quarter at J$128.62 = US$1.00, reflecting an annual rate of depreciation
of 1.8 per cent, relative to 5.4 per cent at the end of the previous quarter
The exchange rate will continue to face pressures throughout 2018 but the Bank of Jamaica will
manage a moderate depreciation as part of its intervention strategy. Relatively low oil prices and a recovery
in the US economy will aid this by boosting tourism and remittances receipts.
Faster depreciation would occur should the government miss fiscal targets by a significant margin,
which would damage confidence and reignite capital flight. Despite recommendations by the IMF that the
central bank intervene less frequently in order to build up reserves, the monetary authorities are expected
to step up foreign exchange sales if they need to contain faster depreciation, imported inflation or rises in
external debt-servicing costs. Factors such as severe weather, causing increasing imports, and commodity
price swings could also cause the rate of depreciation to accelerate. While the depreciation of the currency
may be improving competitiveness5 especially in light of falling oil prices, continual depreciation will
begin to affect inflation and encourage a stronger demand for wage increases.
5 There are limits to which devaluation can improve competiveness in a small open economy.
ECLAC – Studies and Perspectives Series – The Caribbean – No. 74 Preliminary overview of the economies of the Caribbean…
41
Monetary policy in 2016 was accommodating and the Bank of Jamaica (BOJ) cut its 30 day
certificate of deposit rate in August from 3.75 per cent to 3.5 per cent and no further rate changes are
expected for 2017. This policy move was due to the significant lowering of inflation expectations as well
as the moderation in price increases that resulted mainly from reduced international oil prices. The Bank
also advanced its plan to use its overnight certificate of deposit (CD) rate, or the rate at which the
commercial banks borrow from each other, as its policy rate. The decision is related to the BoJ's goal to
improve the effectiveness of monetary policy transmission.
In 2016 credit to the private sector grew by 11.4 per cent which was an acceleration relative to
9.6 per cent in 2015. There was a continuation in credit expansion in 2017 as at the end of June annual
credit grew by 31.1 per cent relative to 32.9 per cent at the end of March and this reflected increased
economic activity and probably increasing confidence by the private sector. Meanwhile the weighted
interest rates fell to 14.98 per cent in June 2017.
The current account balance has seen steady improvement from 2.6 per cent of GDP in 2016 relative
to 2.8 per cent in 2015. This is the fifth year of improvement and the lowest deficit in 15 years. Net reserves
of the Central Bank amounted to US2.7 billion while gross reserves were US$3291.5 million at end of
2016, the equivalent of approximately 24 weeks of goods and services imports. Meanwhile, net reserves
were 2.6 billion by June 2017.This slippage may be linged to interventions by the Bank of Jamaica.
The bank is also introducing a new system of foreign exchange management (BOJ Foreign
Exchange Intervention & Trading Tool (B-FXITT), under which the Bank will conduct weekly
(pre-announced) interventions that reflect market conditions. The Bank will also conduct flash
interventions if market conditions warrant.
The economic growth rate was 1.3 per cent in 2016 and for the first two quarters of 2017 they were
0.1 per cent, 0.3 per cent respectively. In the first quarter, the largest contributor to growth was the service
industry (0.5 per cent) while the goods producing sector contracted by 1.1 per cent. Within the latter sector,
agriculture declined by 2.5 per cent, mining and quarrying declined by 10.8 per cent reflecting weak
external demand. The outturn in the second quarter was driven by poor performance in the goods sector
(-2.5 per cent) and a positive performance of the service sector (1.2 per cent). Remittance flows have also
been improving due to better economic performances in the US and the UK. Interestingly, the performance
of manufacturing sector has not been stellar despite the improvement in competitiveness due to the
depreciating exchange rate.The projection for 2018 is that growth will be 1.3 per cent due to continued
tourism growth and increasing credit expansion by the domestic private sector.
In 2016 the inflation rate was 1.7 per cent and at end-June 2017 headline inflation is projected to
be much higher at 4 per cent. Inflationary pressure has diminished due to softer demand at both the
domestic and international levels, lower commodity prices.
Wage restraint has been an important part of the agreement with the IMF. For FY 2017/2018, the
Wage and Salaries bill amounted to $179.5 billion, which is a 5.2 per cent increase over FY 2016/17.
However, the reduction in the Wage to GDP ratio which is programmed at 9.5 per cent of GDP in the
budget, was down from 9.7 per cent in FY 2016/2017. The wage bill was 9 per cent of GDP in fiscal year
2016/17 and the government is committed to maintaining the ratio of public debt to GDP on a downward
path over the medium term. Keeping wages from growing while pursuing public sector reforms may be a
tough sell given the fiscal fatigue that will begin to set in.
The unemployment rate fell to 12.9 per cent in October 2016 compared with 13.5 per cent a year
before. Over that period, 34,000 new jobs were created of which, importantly, 25,500 went to women and
8,500 went to men.
In the case of males the rate was 9.6 per cent in July 2016 and for females it 18.4 per cent for the
same period. In July 2017 the unemployment rate fell further to 11.3 per cent. This decrease was driven
by a decline in the unemployment rate for both males and females relative to 2016. The unemployment rate for males decreased to 8.0 per cent while that of the female rate was 15.2 per cent. Significant decline
in unemployment will only occur with improved domestic activity and robust external demand.
Meanwhile, youth unemployment continues to be a serious challenge.

ECLAC – Studies and Perspectives Series – The Caribbean – No. 74 Preliminary overview of the economies of the Caribbean…
42
Table 16 Jamaica: main economic indicators
2015 2016 2017
Annual percentage growth rates
GDP 0.9 1.3 1.2a
GDP per capita 0.1 0.1 0.1a
Variation in consumer prices 3.7 1.7 4.0a
Money (M1) 20.8 15.4 13.89c
Annual average percentages
Unemployment 3.50 12.90 11.30b
Central government overall balance/GDP 1.80 1.50 1.60a
Nominal deposit rate 1.62 1.56d 1.42d
Nominal lending rate 16.90 16.20 14.98e
Millions of dollars
Exports of goods 1 261.1 1 195 1 222a
Imports of goods -4 414.4 -2974 -4 200a
Current account -399.8 -370.9 -358a
Change in capital and financial account -28.9 -7.2 -
Change in reserves -435.9 -282.0 -148a
Source: Economic Commission for Latin America and the Caribbean (ECLAC), on the basis of official figures. a Forecast for 2017. b July 2017 STATIN. c June 2017. d February 2017. e March 2017.
G. Suriname
The economic crisis in Suriname began to abate in 2017, as economic growth is projected to be
-0.7 per cent. After signing a two-year Stand-By Arrangement with the IMF in April 2016, the
administration made the move from a pegged exchange rate with the US dollar to a freely floating rate.
This move, along with removal of some utility subsidies saw inflation soar to over 70 per cent. The rising
prices, along with the slowdown in the economy led to austerity protests against the ruling government.
In late 2016, the IMF was concerned about Suriname’s performance under the arrangement, particularly
of negative real interest rates and the slow removal of subsidies. In May 2017, the government decided to
cancel its arrangement with the IMF and announced its own recovery plan. The economy has seen some
progress in 2017 in the form of falling inflation and expansion in the mining sectors, but the fiscal deficit
remains wide and growth remains negative.
After the fiscal deficit ballooned to 10.3 per cent of GDP in 2015, the government has managed
slowly to bring it down. The deficit was 8.7 per cent of GDP in 2016 and 7.3 per cent in the first five
months of 2017 (annualized). Revenues over the first five months of 2017 expanded by 32 per cent relative
to the same period in 2016. The main contributors to the growth were a 75 per cent increase in direct tax
and a 59 per cent increase in non tax revenue. Expenditure grew by 43 per cent relative to 2016. The largest
increases were seen in capital expenditure (90 per cent) and interest payments (206 per cent). Total central
government debt fell from 67.8 per cent at the end of 2016 to 59.3 per cent by April 2017.
Reserve requirements remained unchanged in 2017, at 35 per cent for SRD deposits, 46 per cent for USD
deposits and 28 per cent for Euro deposits. After increasing by around one percentage point in 2015 and 2016,
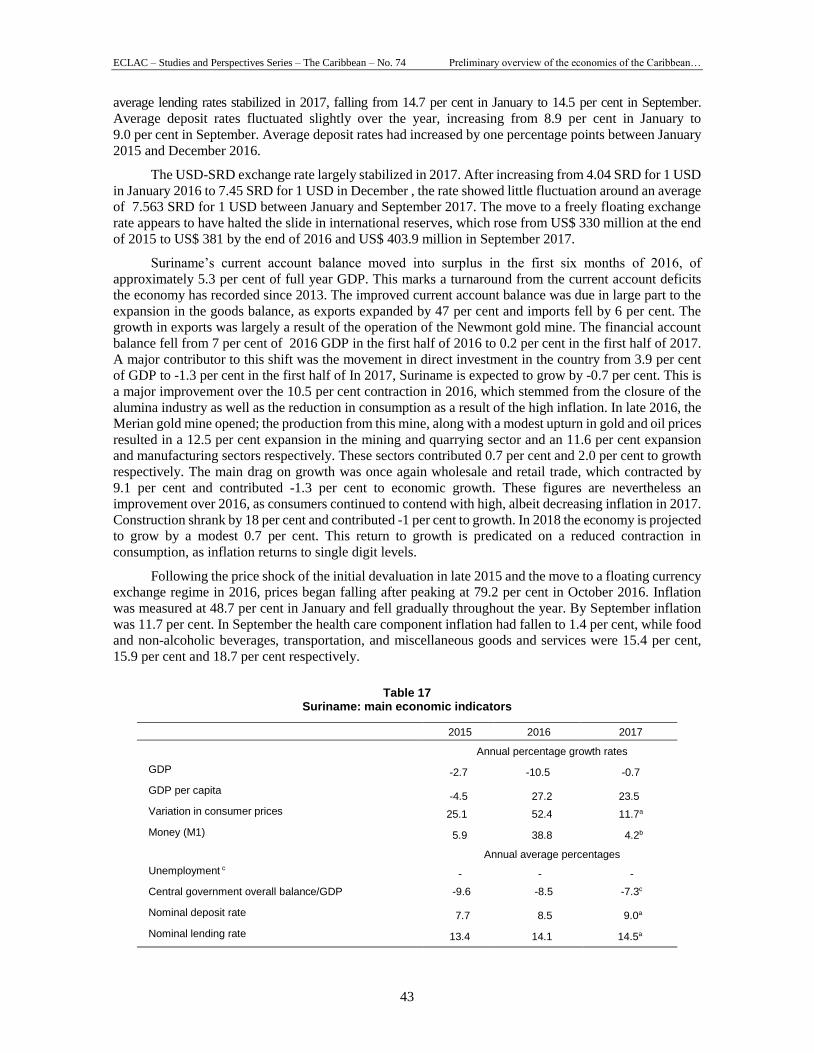
ECLAC – Studies and Perspectives Series – The Caribbean – No. 74 Preliminary overview of the economies of the Caribbean…
43
average lending rates stabilized in 2017, falling from 14.7 per cent in January to 14.5 per cent in September.
Average deposit rates fluctuated slightly over the year, increasing from 8.9 per cent in January to
9.0 per cent in September. Average deposit rates had increased by one percentage points between January
2015 and December 2016.
The USD-SRD exchange rate largely stabilized in 2017. After increasing from 4.04 SRD for 1 USD
in January 2016 to 7.45 SRD for 1 USD in December , the rate showed little fluctuation around an average
of 7.563 SRD for 1 USD between January and September 2017. The move to a freely floating exchange
rate appears to have halted the slide in international reserves, which rose from US$ 330 million at the end
of 2015 to US$ 381 by the end of 2016 and US$ 403.9 million in September 2017.
Suriname’s current account balance moved into surplus in the first six months of 2016, of
approximately 5.3 per cent of full year GDP. This marks a turnaround from the current account deficits
the economy has recorded since 2013. The improved current account balance was due in large part to the
expansion in the goods balance, as exports expanded by 47 per cent and imports fell by 6 per cent. The
growth in exports was largely a result of the operation of the Newmont gold mine. The financial account
balance fell from 7 per cent of 2016 GDP in the first half of 2016 to 0.2 per cent in the first half of 2017.
A major contributor to this shift was the movement in direct investment in the country from 3.9 per cent
of GDP to -1.3 per cent in the first half of In 2017, Suriname is expected to grow by -0.7 per cent. This is
a major improvement over the 10.5 per cent contraction in 2016, which stemmed from the closure of the
alumina industry as well as the reduction in consumption as a result of the high inflation. In late 2016, the
Merian gold mine opened; the production from this mine, along with a modest upturn in gold and oil prices
resulted in a 12.5 per cent expansion in the mining and quarrying sector and an 11.6 per cent expansion
and manufacturing sectors respectively. These sectors contributed 0.7 per cent and 2.0 per cent to growth
respectively. The main drag on growth was once again wholesale and retail trade, which contracted by
9.1 per cent and contributed -1.3 per cent to economic growth. These figures are nevertheless an
improvement over 2016, as consumers continued to contend with high, albeit decreasing inflation in 2017.
Construction shrank by 18 per cent and contributed -1 per cent to growth. In 2018 the economy is projected
to grow by a modest 0.7 per cent. This return to growth is predicated on a reduced contraction in
consumption, as inflation returns to single digit levels.
Following the price shock of the initial devaluation in late 2015 and the move to a floating currency
exchange regime in 2016, prices began falling after peaking at 79.2 per cent in October 2016. Inflation
was measured at 48.7 per cent in January and fell gradually throughout the year. By September inflation
was 11.7 per cent. In September the health care component inflation had fallen to 1.4 per cent, while food
and non-alcoholic beverages, transportation, and miscellaneous goods and services were 15.4 per cent,
15.9 per cent and 18.7 per cent respectively.
Table 17
Suriname: main economic indicators
2015 2016 2017 Annual percentage growth rates
GDP -2.7 -10.5 -0.7
GDP per capita -4.5 27.2 23.5
Variation in consumer prices 25.1 52.4 11.7a
Money (M1) 5.9 38.8 4.2b
Annual average percentages
Unemployment c - - -
Central government overall balance/GDP -9.6 -8.5 -7.3c
Nominal deposit rate 7.7 8.5 9.0a
Nominal lending rate 13.4 14.1 14.5a
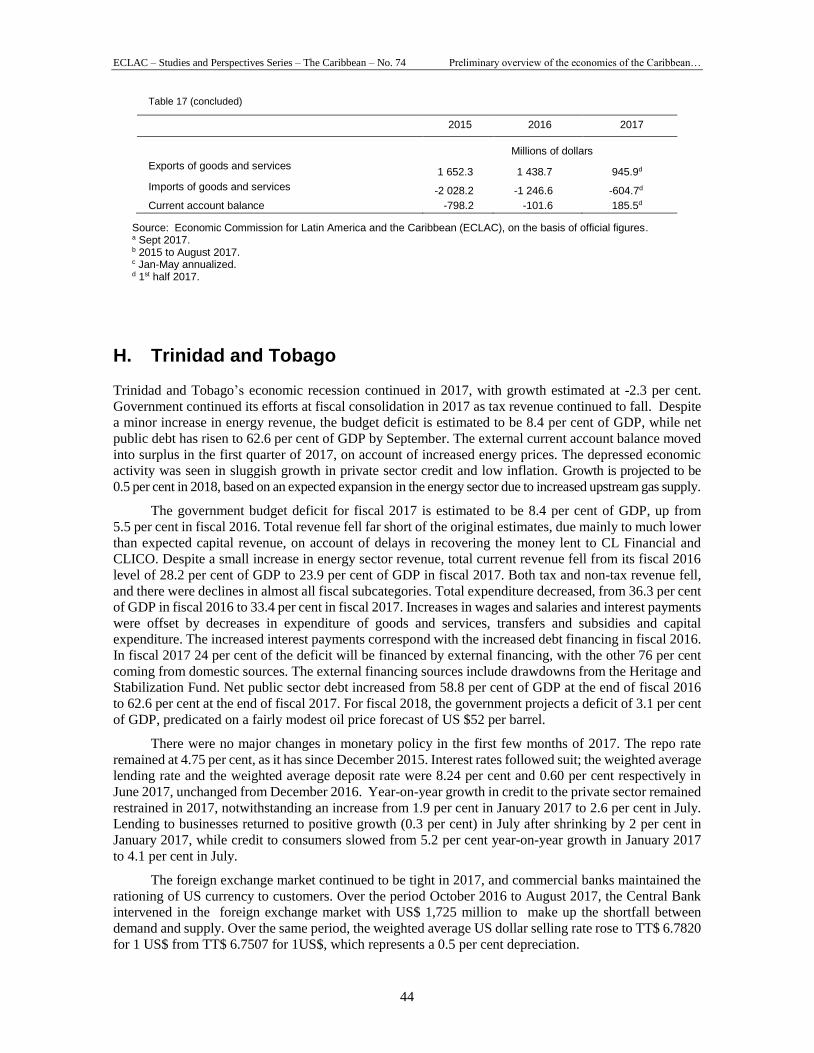
ECLAC – Studies and Perspectives Series – The Caribbean – No. 74 Preliminary overview of the economies of the Caribbean…
44
Table 17 (concluded)
2015 2016 2017
Millions of dollars
Exports of goods and services 1 652.3 1 438.7 945.9d
Imports of goods and services -2 028.2 -1 246.6 -604.7d
Current account balance -798.2 -101.6 185.5d
Source: Economic Commission for Latin America and the Caribbean (ECLAC), on the basis of official figures. a Sept 2017. b 2015 to August 2017. c Jan-May annualized. d 1st half 2017.
H. Trinidad and Tobago
Trinidad and Tobago’s economic recession continued in 2017, with growth estimated at -2.3 per cent.
Government continued its efforts at fiscal consolidation in 2017 as tax revenue continued to fall. Despite
a minor increase in energy revenue, the budget deficit is estimated to be 8.4 per cent of GDP, while net
public debt has risen to 62.6 per cent of GDP by September. The external current account balance moved
into surplus in the first quarter of 2017, on account of increased energy prices. The depressed economic
activity was seen in sluggish growth in private sector credit and low inflation. Growth is projected to be
0.5 per cent in 2018, based on an expected expansion in the energy sector due to increased upstream gas supply.
The government budget deficit for fiscal 2017 is estimated to be 8.4 per cent of GDP, up from
5.5 per cent in fiscal 2016. Total revenue fell far short of the original estimates, due mainly to much lower
than expected capital revenue, on account of delays in recovering the money lent to CL Financial and
CLICO. Despite a small increase in energy sector revenue, total current revenue fell from its fiscal 2016
level of 28.2 per cent of GDP to 23.9 per cent of GDP in fiscal 2017. Both tax and non-tax revenue fell,
and there were declines in almost all fiscal subcategories. Total expenditure decreased, from 36.3 per cent
of GDP in fiscal 2016 to 33.4 per cent in fiscal 2017. Increases in wages and salaries and interest payments
were offset by decreases in expenditure of goods and services, transfers and subsidies and capital
expenditure. The increased interest payments correspond with the increased debt financing in fiscal 2016.
In fiscal 2017 24 per cent of the deficit will be financed by external financing, with the other 76 per cent
coming from domestic sources. The external financing sources include drawdowns from the Heritage and
Stabilization Fund. Net public sector debt increased from 58.8 per cent of GDP at the end of fiscal 2016
to 62.6 per cent at the end of fiscal 2017. For fiscal 2018, the government projects a deficit of 3.1 per cent
of GDP, predicated on a fairly modest oil price forecast of US $52 per barrel.
There were no major changes in monetary policy in the first few months of 2017. The repo rate
remained at 4.75 per cent, as it has since December 2015. Interest rates followed suit; the weighted average
lending rate and the weighted average deposit rate were 8.24 per cent and 0.60 per cent respectively in
June 2017, unchanged from December 2016. Year-on-year growth in credit to the private sector remained
restrained in 2017, notwithstanding an increase from 1.9 per cent in January 2017 to 2.6 per cent in July.
Lending to businesses returned to positive growth (0.3 per cent) in July after shrinking by 2 per cent in
January 2017, while credit to consumers slowed from 5.2 per cent year-on-year growth in January 2017
to 4.1 per cent in July.
The foreign exchange market continued to be tight in 2017, and commercial banks maintained the
rationing of US currency to customers. Over the period October 2016 to August 2017, the Central Bank
intervened in the foreign exchange market with US$ 1,725 million to make up the shortfall between
demand and supply. Over the same period, the weighted average US dollar selling rate rose to TT$ 6.7820
for 1 US$ from TT$ 6.7507 for 1US$, which represents a 0.5 per cent depreciation.
ECLAC – Studies and Perspectives Series – The Caribbean – No. 74 Preliminary overview of the economies of the Caribbean…
45
A current account surplus of 1.7 per cent of GDP was recorded in the first quarter of 2017, up from
a deficit of 8 per cent of GDP in the same quarter of 2016. The central bank estimates that total exports
grew by 27.4 per cent, on the back of increased energy exports boosted by higher energy prices. The
services deficit contracted by 48 per cent, mainly due to reduced expenditure abroad by travellers from
Trinidad and Tobago. Gross official reserves fell to 10.1 months of import cover by August 2017, down
from 10.5 months at the end of 2016 and 11.2 month at the end of 2015.
The economy of Trinidad and Tobago is projected to contract by 2.3 per cent in 2017, which is still
an improvement over the 6 per cent contraction in 2016. A year after shrinking by 13.2 per cent, mining
and quarrying is expected to contact by 2.2 per cent, and contribute -0.43 per cent to economic growth due
to declines in crude output. The decline in crude production was tempered by a projected increase in
production in natural gas in the fourth quarter, stemming from the launch of the Juniper platform. The
largest contraction was seen in the trade and repairs sector, which is expected to decline by 9.4 per cent
and contribute -1.59 per cent to growth. The wholesale and retail trade subsector has been severely
impacted by reduced private consumption in the current recession. The largest positive contribution to
growth was seen in financial and insurance activities. This sector grew by 4 per cent and contributed
0.38 per cent to growth, down from the 0.82 per cent and 0.63 per cent contributions in 2015 and 2016.
Significant positive contributions to growth were also seen in professional, scientific and technical services
(0.33 per cent), and transport and storage (0.28 per cent). Growth is projected to be 0.5 per cent in 2018,
as a result of increased upstream gas production and an expected increase in energy prices.
Inflation remained subdued in 2017, in line with the economic slowdown. It fell from 3.6 per cent
in January 2017 to 1.2 per cent in September. The largest increases were seen in the health sub component
of the RPI, which fell from 18.7 per cent year-on-year growth in January 2017 to 12.3 per cent in
September. The year-on-year change in the food price sub component fell from 7.7 per cent in January
2017 to 1.9 per cent in September. The slowdown in food inflation was due partly to a decrease in
international food inflation, as well as the end of the price shock resulting from the reintroduction of VAT
on several previously exempt food items in February 2016.
Unemployment was measured at 3.6 per cent in the fourth quarter of 2016, up slightly from the
3.5 per cent recorded in the same period of 2015. The minimal change was due in part to a significant number
of workers leaving the labour force over the period. The sectors with the highest unemployment rates were
electricity and water, construction and manufacturing with 8.5 per cent, 6.3 per cent and 4.6 per cent respectively.
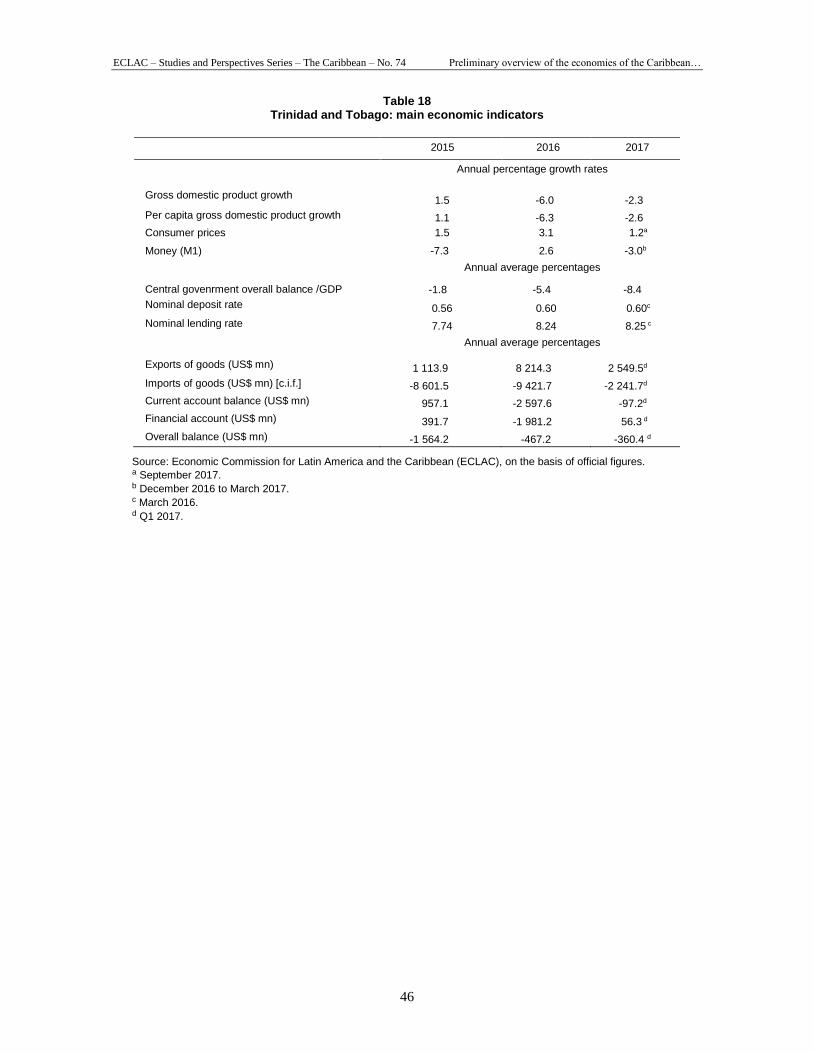
ECLAC – Studies and Perspectives Series – The Caribbean – No. 74 Preliminary overview of the economies of the Caribbean…
46
Table 18 Trinidad and Tobago: main economic indicators
2015 2016 2017
Annual percentage growth rates
Gross domestic product growth 1.5 -6.0 -2.3
Per capita gross domestic product growth 1.1 -6.3 -2.6
Consumer prices 1.5 3.1 1.2a
Money (M1) -7.3 2.6 -3.0b
Annual average percentages
Central govenrment overall balance /GDP -1.8 -5.4 -8.4
Nominal deposit rate 0.56 0.60 0.60c
Nominal lending rate 7.74 8.24 8.25 c
Annual average percentages
Exports of goods (US$ mn) 1 113.9 8 214.3 2 549.5d
Imports of goods (US$ mn) [c.i.f.] -8 601.5 -9 421.7 -2 241.7d
Current account balance (US$ mn) 957.1 -2 597.6 -97.2d
Financial account (US$ mn) 391.7 -1 981.2 56.3 d
Overall balance (US$ mn) -1 564.2 -467.2 -360.4 d
Source: Economic Commission for Latin America and the Caribbean (ECLAC), on the basis of official figures. a September 2017. b December 2016 to March 2017. c March 2016. d Q1 2017.
ECLAC – Studies and Perspectives Series – The Caribbean – No. 74 Preliminary overview of the economies of the Caribbean…
47
Studies and Perspectives Series – The Caribbean.
Issues published
A complete list as well as pdf files are available at
www.eclac.org/publicaciones
74. Preliminary overview of the economies of the Caribbean 2017–2018. LC/TS.2019/6, LC/CAR/TS.2018/2, 2019.
73. Review of the Regional Coordinating Mechanism for the implementation of the sustainable development agenda in the
small island developing States of the Caribbean. LC/TS.2017/160, LC/CAR/TS.2017/21, 2017.
72. A study on the creative industry as a pillar of sustained growth and diversification. LC/TS.2017/159,
LC/CAR/TS.2017/20, 2017.
71. Mechanisms to accelerate the implementation of the Sustainable Development Goals in the Caribbean. LC/TS.2017/158,
LC/CAR/TS.2017/19, 2017.
70. Caribbean development report. LC/TS.2017/157, LC/CAR/TS.2017/18, 2017.
69. A global value chain analysis of offshore medical universities in the Caribbean. LC/TS.2017/156, LC/CAR/TS.2017/17, 2017.
68. Planning for the 2020 round of population censuses in the Caribbean. LC/TS.2017/155, LC/CAR/TS.2017/16, 2017.
67. Economic impact of de-risking on the Caribbean. LC/TS.2017/154, LC/CAR/TS.2017/15, 2017.
66. Inclusive social protection and demographic change. LC/TS.2017/153, LC/CAR/TS.2017/14, 2017.
65. Monitoring trade agreements: improving export performance and promoting industrialization in the goods-producing
economies of the Caribbean. LC/TS.2017/152, LC/CAR/TS.2017/13, 2017.
64. Disability, human rights, and public policy in the Caribbean. LC/TS.2017/151, LC/CAR/TS.2017/12, 2017.
63. An Analysis of the art and craft sector and its potential for sustainable tourism development in the Caribbean.
LC/TS.2017/150, LC/CAR/TS.2017/11, 2017.
62. Caribbean synthesis report on the Madrid International Plan of Action on Ageing and the San José Charter on the Rights
of Older Persons in Latin America and the Caribbean, LC/TS.2017/143, LC/CAR/TS.2017/10, 2017.
61. Economic Survey of the Caribbean 2017, LC/TS.2017/140, LC/CAR/TS.2017/9, 2017.
60. Advancing the economic empowerment and autonomy of women in the Caribbean through the 2030 Agenda
for Sustainable Development, LC/TS.2017/128, LC/CAR/TS.2017/8, 2017.

74
studies and perspectives
ECONOMIC COMMISSION FOR LATIN AMERICA AND THE CARIBBEAN
COMISIÓN ECONÓMICA PARA AMÉRICA LATINA Y EL CARIBE
www.eclac.org