Embed Size (px)
Citation preview

https://nsa.org.na
PRELIMINARY NATIONAL ACCOUNTS 2020 AND FEBRUARY 2021 SECTORAL REPORTS
ByNgaingonekue Uamburu
Manager, National Accounts31 March 2021, Gobabis
https://nsa.org.na
Outline
1Economic Performance
Overview
2
ANA 2018
3
Q3GDP
4
Pg-4
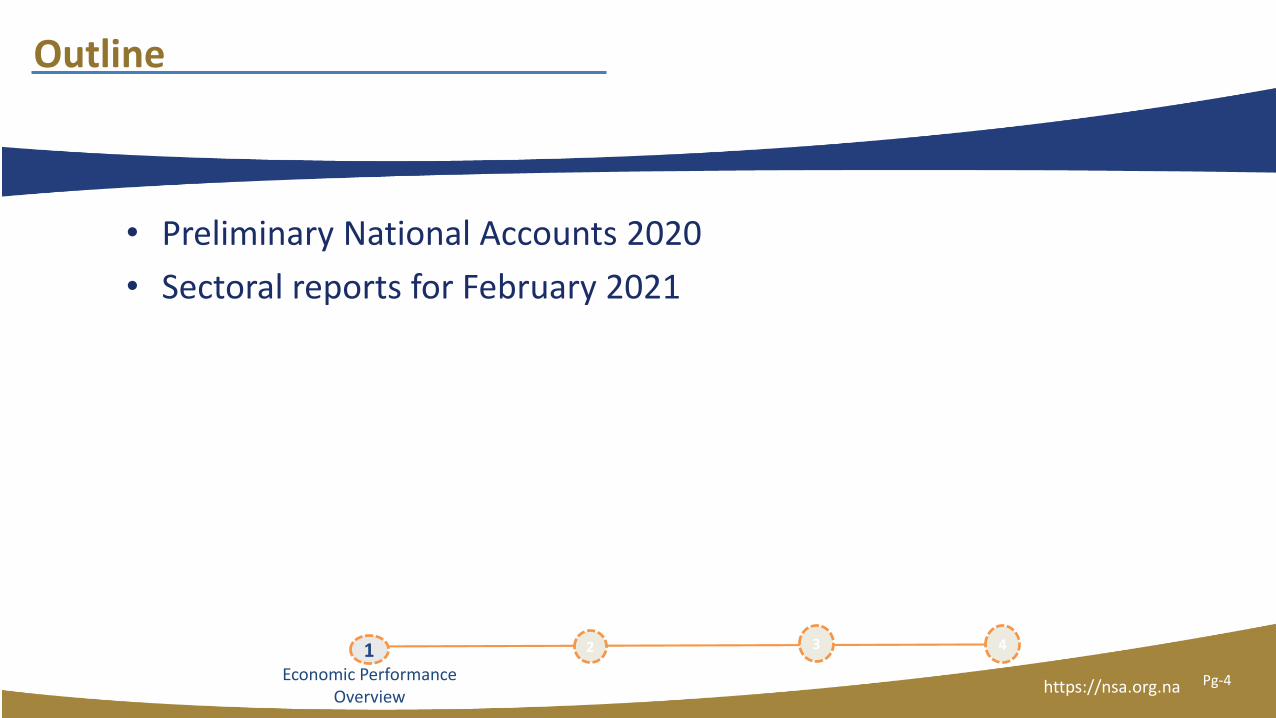
• Preliminary National Accounts 2020
• Sectoral reports for February 2021

ECONOMIC PERFORMANCE OVERVIEW
PG-3

https://nsa.org.na
Economic Performance Overview
1Economic Performance
Overview
2
ANA 2018
3
Q3GDP
4
Introduction
Pg-4
• Namibia national accounts is compiled in line with SNA 2008 of the UN
• Annual accounts are published twice a year [Preliminary and Revised Annual national accounts]
• Sources are surveys and administrative data
• Results are presented in calendar year for 18 sectors of the economy
https://nsa.org.na
Economic Performance Overview
1Economic Performance
Overview
2
ANA 2018
3
Q3GDP
4
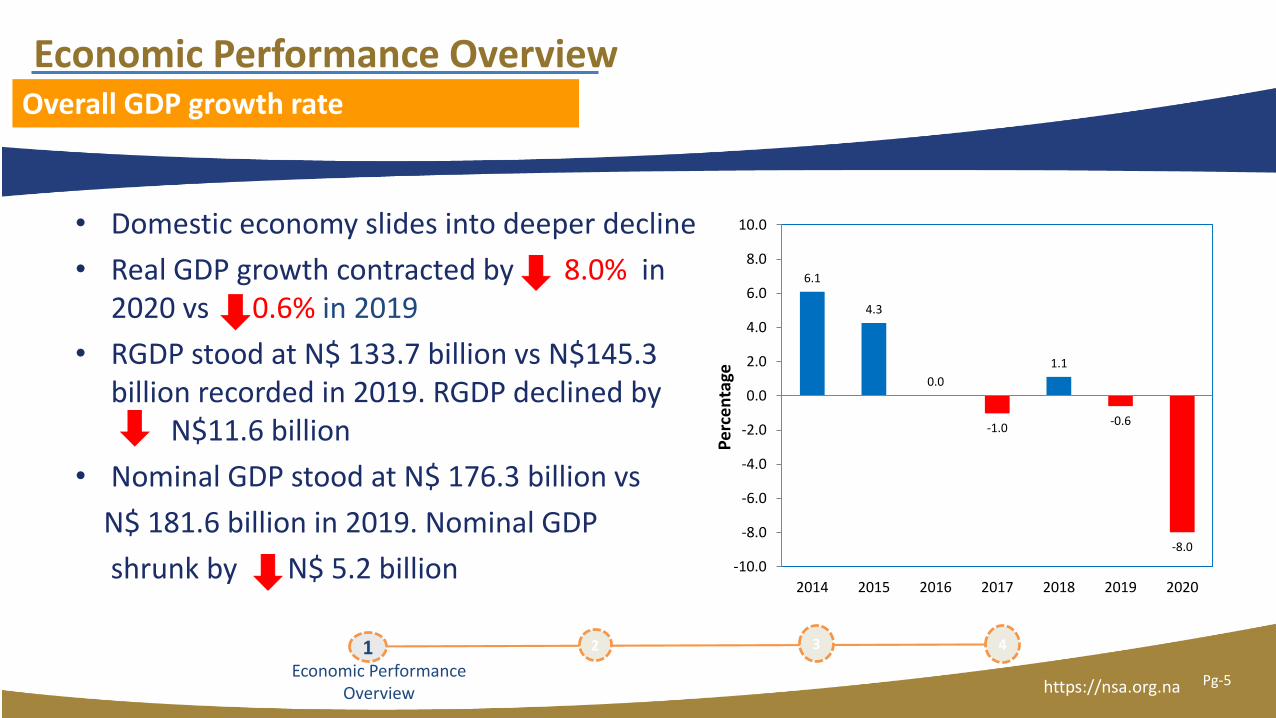
Overall GDP growth rate
• Domestic economy slides into deeper decline
• Real GDP growth contracted by 8.0% in 2020 vs 0.6% in 2019
• RGDP stood at N$ 133.7 billion vs N$145.3 billion recorded in 2019. RGDP declined by
N$11.6 billion
• Nominal GDP stood at N$ 176.3 billion vs
N$ 181.6 billion in 2019. Nominal GDP
shrunk by N$ 5.2 billion
Pg-5
6.1
4.3
0.0
-1.0
1.1
-0.6
-8.0
-10.0
-8.0
-6.0
-4.0
-2.0
0.0
2.0
4.0
6.0
8.0
10.0
2014 2015 2016 2017 2018 2019 2020
Pe
rce
nta
ge

https://nsa.org.na
Economic Performance Overview
1Economic Performance
Overview
2
ANA 2018
3
Q3GDP
• Poor performance across major sectors of
economy:
“Hotels and Restaurants” lead the pack with 33.1%
“Transport” registered 22.4%Manufacturing registered 19.6% “Mining and quarrying” recorded 14.9% Admin and support services recorded
14.5% Construction sector 11.8% “Wholesale and retail trade, repairs” and
Financial intermediation both recorded 11.7%
Key drivers to GDP growth
4
Pg-6
-33.1
-22.4-19.6
-17.0-14.9-14.5
-11.8-11.7-11.7
-7.6-5.3
-3.2 -1.8
0.12.8
4.8 5.9
17.4 18.4
-40.0
-30.0
-20.0
-10.0
0.0
10.0
20.0
30.0
Perc
enta
ge

https://nsa.org.na
Economic Performance overview
1Economic Performance
overview
2
ANA 2018
3
Q3GDP
Sectoral share to a decline of 8.0%
4
• Contributors to the decline of 8.0 %
Manufacturing sector contributed 2.5% pt.
Mining and Quarrying 1.2% pt.
Wholesale & Retail trade 1.1% pt.
Financial services 1.0% pt.
• Despite Hotels and Restaurants declining by 33.1%, it’s only contributing 0.7% pt.
Pg-7
-2.5
-1.4-1.2
-1.1-1.0
-0.7 -0.7
-0.2 -0.2 -0.2-0.1 -0.1 0.0
0.00.2 0.2 0.2 0.2
0.4
-3.0
-2.5
-2.0
-1.5
-1.0
-0.5
0.0
0.5
1.0
Perc
enta
ge
https://nsa.org.na
Economic Performance Overview
1Economic Performance
overview
2
ANA 2018
3
Q3GDP
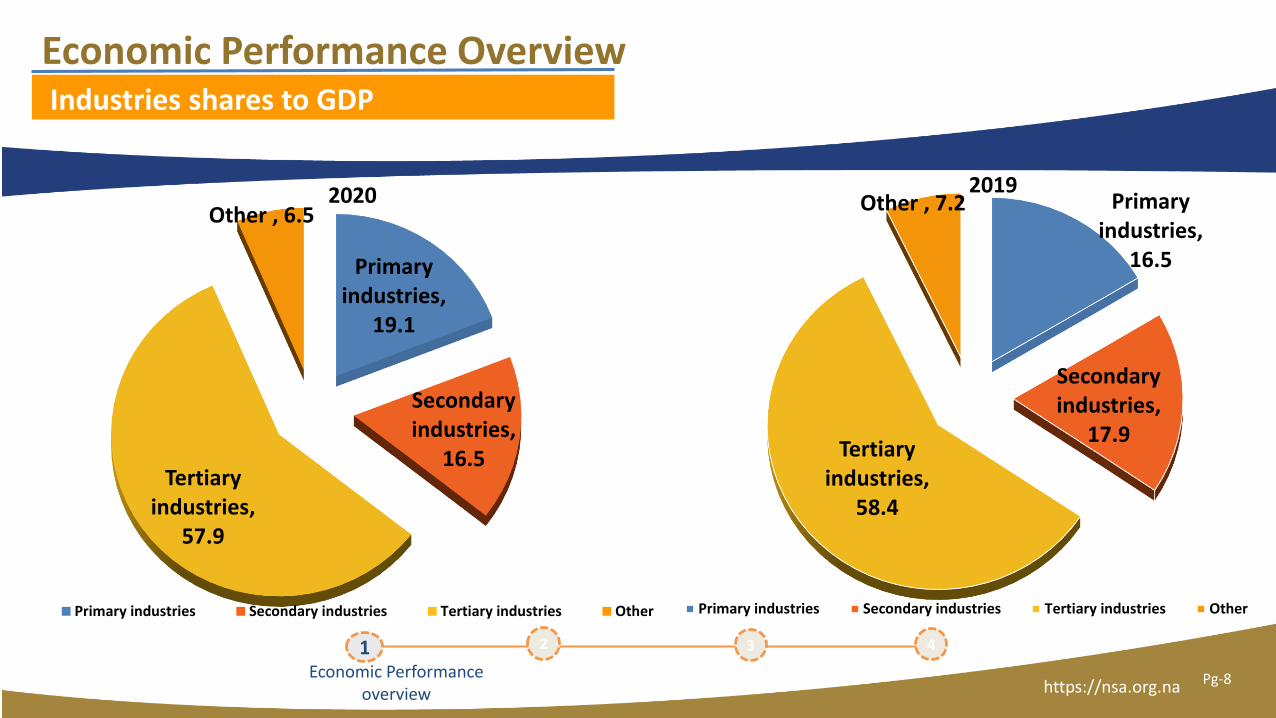
Industries shares to GDP
4
Pg-8
Primary industries,
19.1
Secondary industries,
16.5Tertiary
industries, 57.9
Other , 6.52020
Primary industries Secondary industries Tertiary industries Other
Primary industries,
16.5
Secondary industries,
17.9Tertiary
industries, 58.4
Other , 7.22019
Primary industries Secondary industries Tertiary industries Other
https://nsa.org.na
Economic Performance Overview
1Economic Performance
Overview
2
ANA 2018
3
Q3GDP
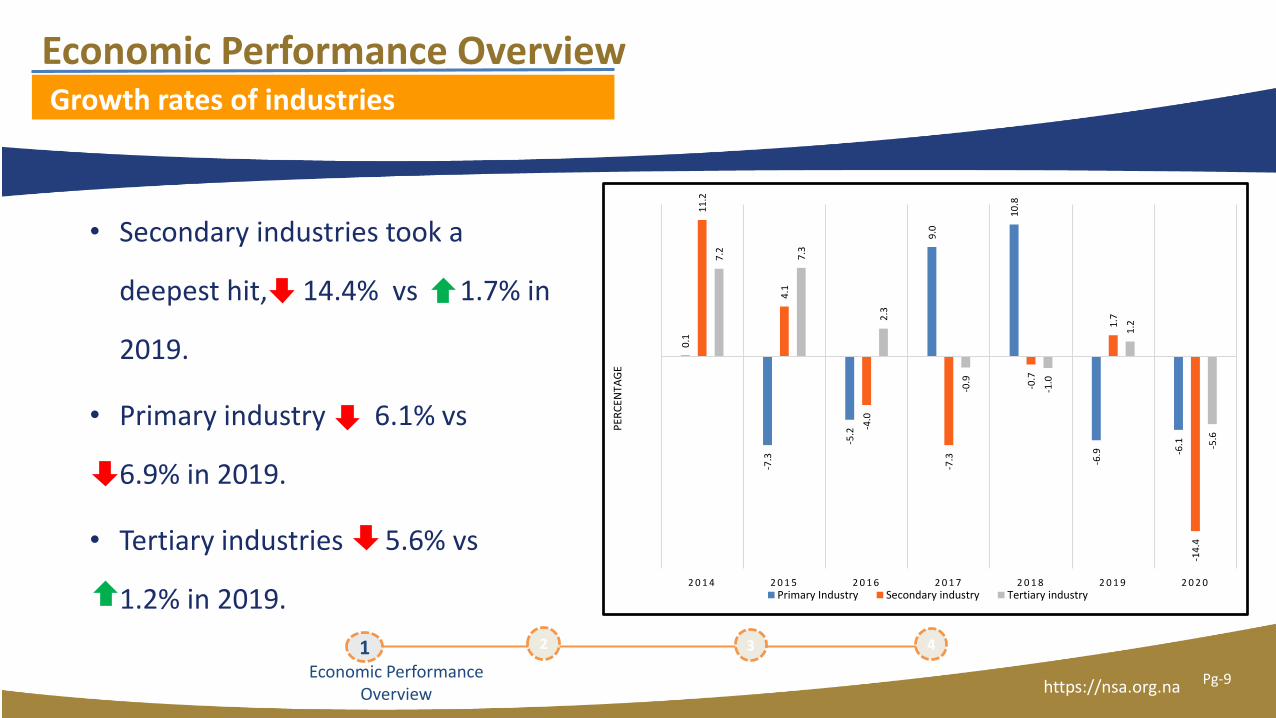
Growth rates of industries
4
Pg-9
• Secondary industries took a
deepest hit, 14.4% vs 1.7% in
2019.
• Primary industry 6.1% vs
6.9% in 2019.
• Tertiary industries 5.6% vs
1.2% in 2019.
0.1
-7.3
-5.2
9.0
10
.8
-6.9 -6
.1
11
.2
4.1
-4.0
-7.3
-0.7
1.7
-14
.4
7.2 7.3
2.3
-0.9
-1.0
1.2
-5.6
2 0 1 4 2 0 1 5 2 0 1 6 2 0 1 7 2 0 1 8 2 0 1 9 2 0 2 0
PER
CEN
TAG
E
Primary Industry Secondary industry Tertiary industry

PRIMARY INDUSTRIES OVERVIEW
PG-10
https://nsa.org.na
Primary Industries Overview
1Primary Industry
2
Primary Industry overview
3
Q3GDP
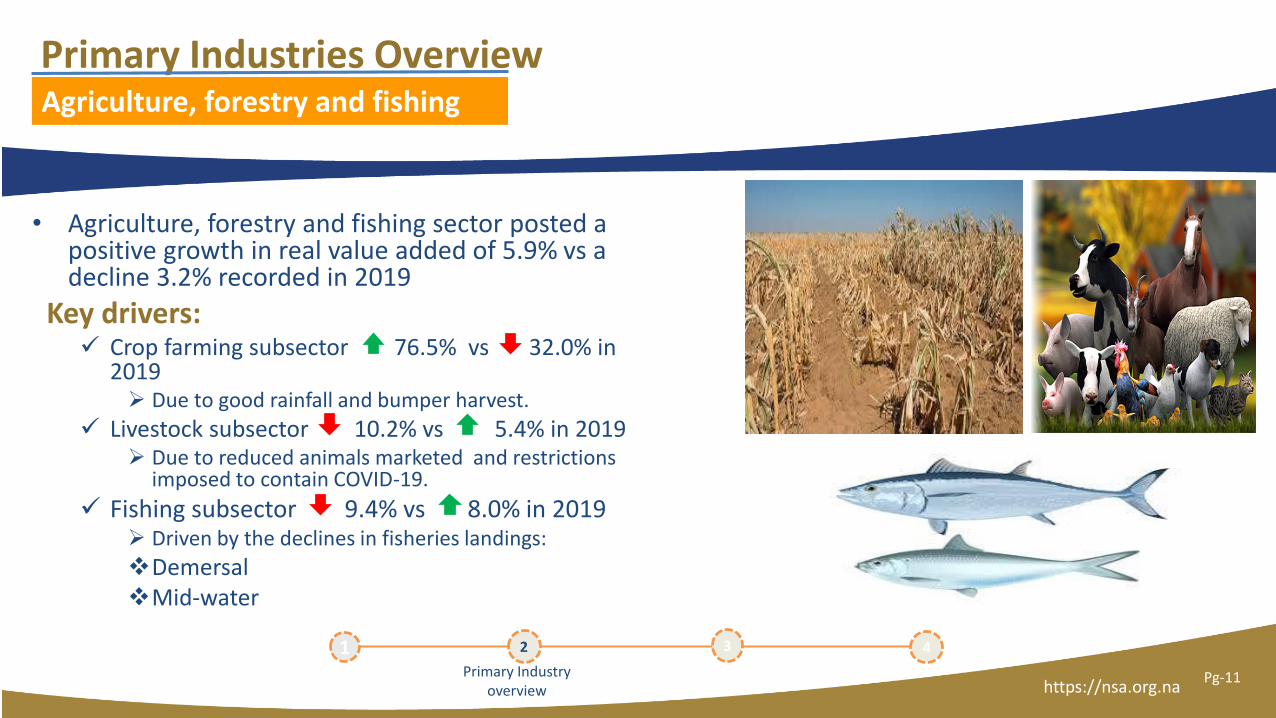
• Agriculture, forestry and fishing sector posted a positive growth in real value added of 5.9% vs a decline 3.2% recorded in 2019
Key drivers: Crop farming subsector 76.5% vs 32.0% in
2019 Due to good rainfall and bumper harvest.
Livestock subsector 10.2% vs 5.4% in 2019 Due to reduced animals marketed and restrictions
imposed to contain COVID-19.
Fishing subsector 9.4% vs 8.0% in 2019 Driven by the declines in fisheries landings:
DemersalMid-water
Agriculture, forestry and fishing
4
Pg-11
https://nsa.org.na
Primary Industries overview
1 2
Primary Industry Overview
3
Q3GDP
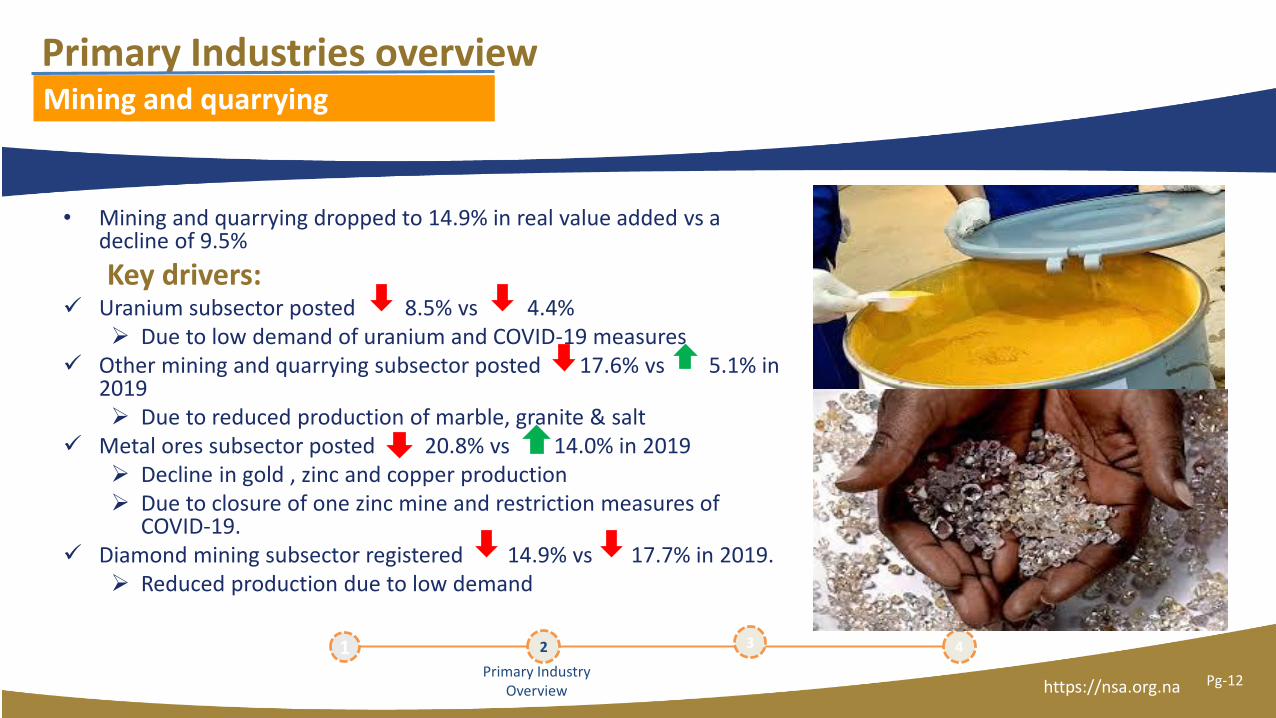
• Mining and quarrying dropped to 14.9% in real value added vs a decline of 9.5%
Key drivers: Uranium subsector posted 8.5% vs 4.4%
Due to low demand of uranium and COVID-19 measures Other mining and quarrying subsector posted 17.6% vs 5.1% in
2019 Due to reduced production of marble, granite & salt
Metal ores subsector posted 20.8% vs 14.0% in 2019 Decline in gold , zinc and copper production Due to closure of one zinc mine and restriction measures of
COVID-19. Diamond mining subsector registered 14.9% vs 17.7% in 2019.
Reduced production due to low demand
Mining and quarrying
4
Pg-12

SECONDARY INDUSTRIES OVERVIEW
PG-13
https://nsa.org.na
Secondary Industry Overview
1 2
Primary Industry
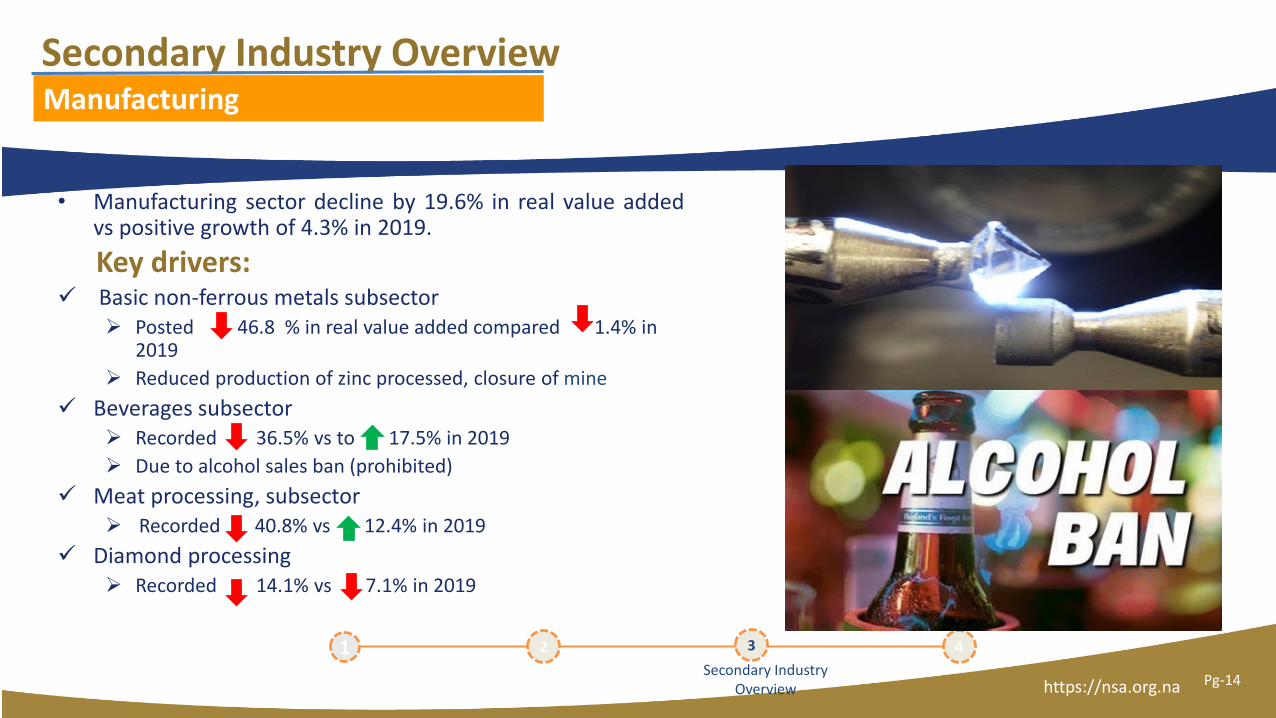
• Manufacturing sector decline by 19.6% in real value addedvs positive growth of 4.3% in 2019.
Key drivers: Basic non-ferrous metals subsector
Posted 46.8 % in real value added compared 1.4% in 2019
Reduced production of zinc processed, closure of mine
Beverages subsector Recorded 36.5% vs to 17.5% in 2019
Due to alcohol sales ban (prohibited)
Meat processing, subsector Recorded 40.8% vs 12.4% in 2019
Diamond processing Recorded 14.1% vs 7.1% in 2019
Manufacturing
43
Secondary Industry Overview
Pg-14
https://nsa.org.na
Secondary Industries overview
1 2
Primary Industry
Construction
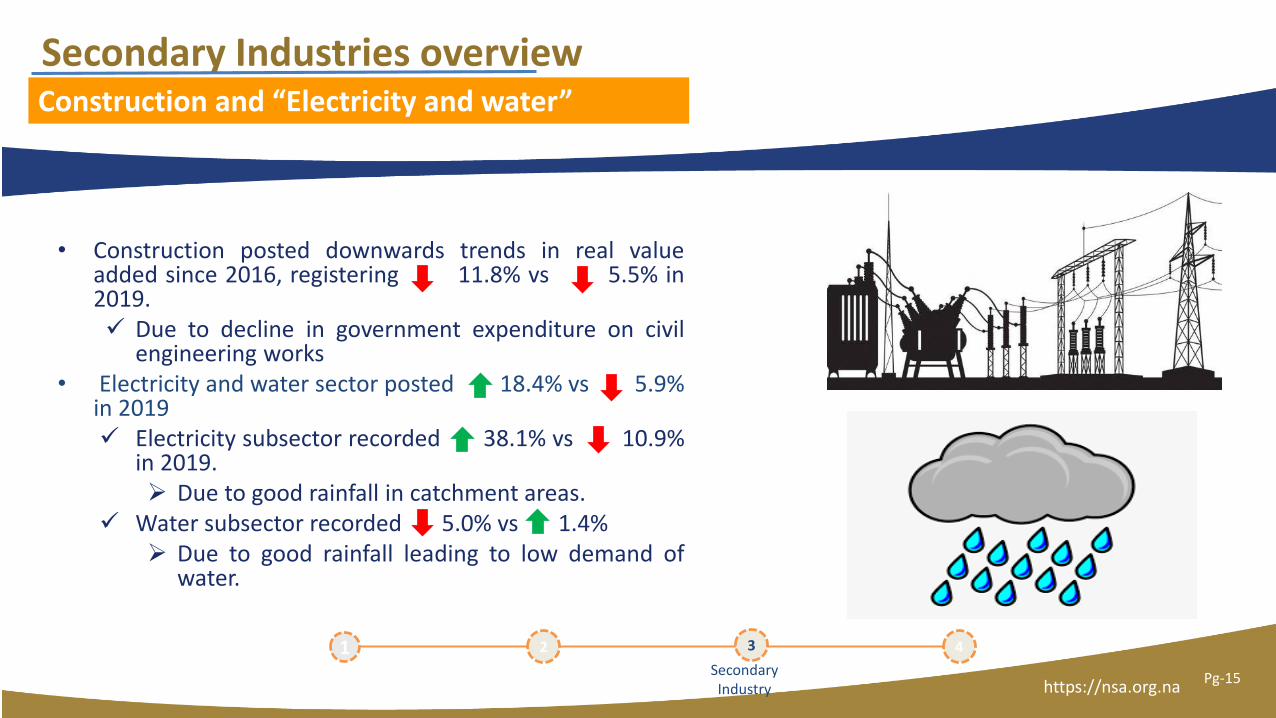
• Construction posted downwards trends in real valueadded since 2016, registering 11.8% vs 5.5% in2019. Due to decline in government expenditure on civil
engineering works• Electricity and water sector posted 18.4% vs 5.9%
in 2019 Electricity subsector recorded 38.1% vs 10.9%
in 2019. Due to good rainfall in catchment areas.
Water subsector recorded 5.0% vs 1.4% Due to good rainfall leading to low demand of
water.
Construction and “Electricity and water”
43
Secondary Industry
Pg-15

TERTIARY INDUSTRIES OVERVIEW
PG-16
https://nsa.org.na
Tertiary Industries Overview
1Primary Industry
2
Primary industry
3
Secondary Industry
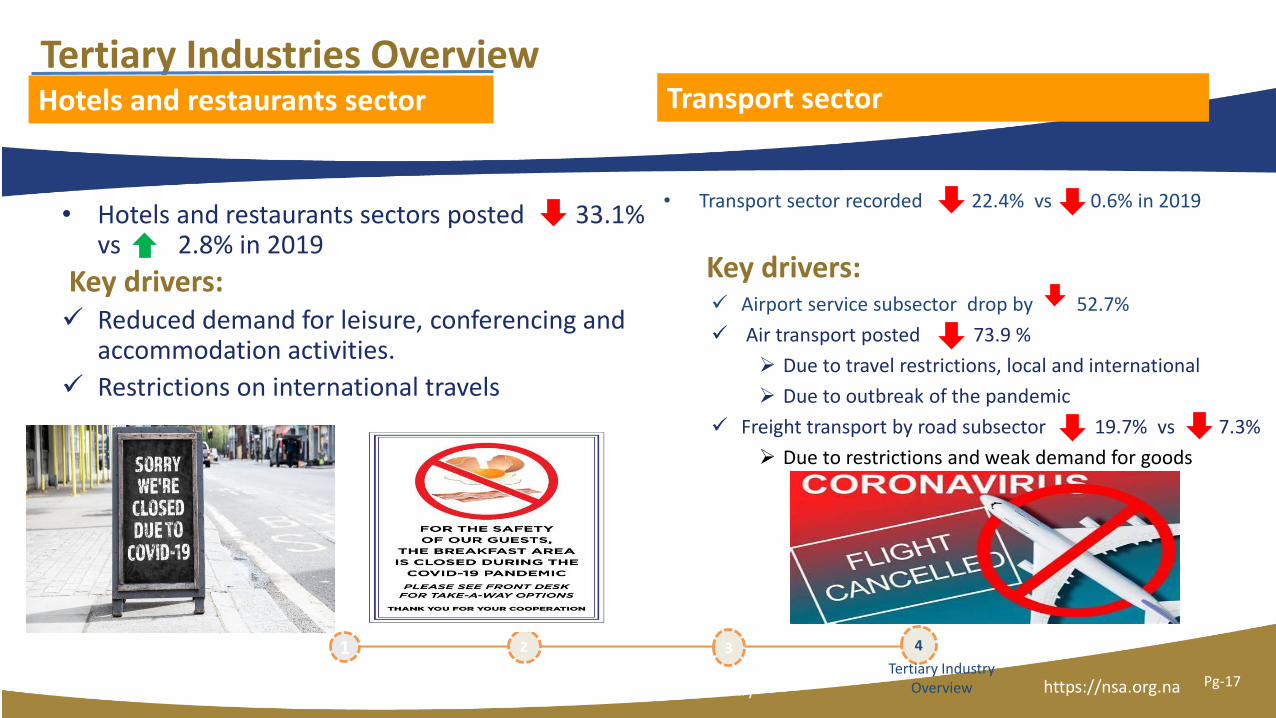
• Hotels and restaurants sectors posted 33.1% vs 2.8% in 2019
Key drivers: Reduced demand for leisure, conferencing and
accommodation activities.
Restrictions on international travels
Hotels and restaurants sector Transport sector
• Transport sector recorded 22.4% vs 0.6% in 2019
Key drivers: Airport service subsector drop by 52.7%
Air transport posted 73.9 %
Due to travel restrictions, local and international
Due to outbreak of the pandemic
Freight transport by road subsector 19.7% vs 7.3%
Due to restrictions and weak demand for goods
4
Tertiary Industry Overview Pg-17

https://nsa.org.na
Tertiary Industries Overview
1Primary Industry
2
Primary industry
3
Secondary Industry
• Financial and insurance services activities’ sector 11.7% vs 12.4% in 2019.
Key drivers: Insurance service activities subsector 18.5% vs
23.6% Reduced demand for long term insurance policy as
cancelation increases due to reduced disposable income.
Financial services activities drop by 4.3% vs2.5% Reduced demand for loans and deposits by
households.
Financial and insurance services Wholesale and retail sector
• Wholesale and retail sector recorded 11.7% vs7.8 %
Key drivers: Weak demand was observed in Clothing, Furniture and
Vehicles .
Due to reduced disposable income.
4
Tertiary Industry Overview
Pg-18
https://nsa.org.na
Tertiary Industries Overview
1Primary Industry
2
Primary industry
3
Secondary Industry
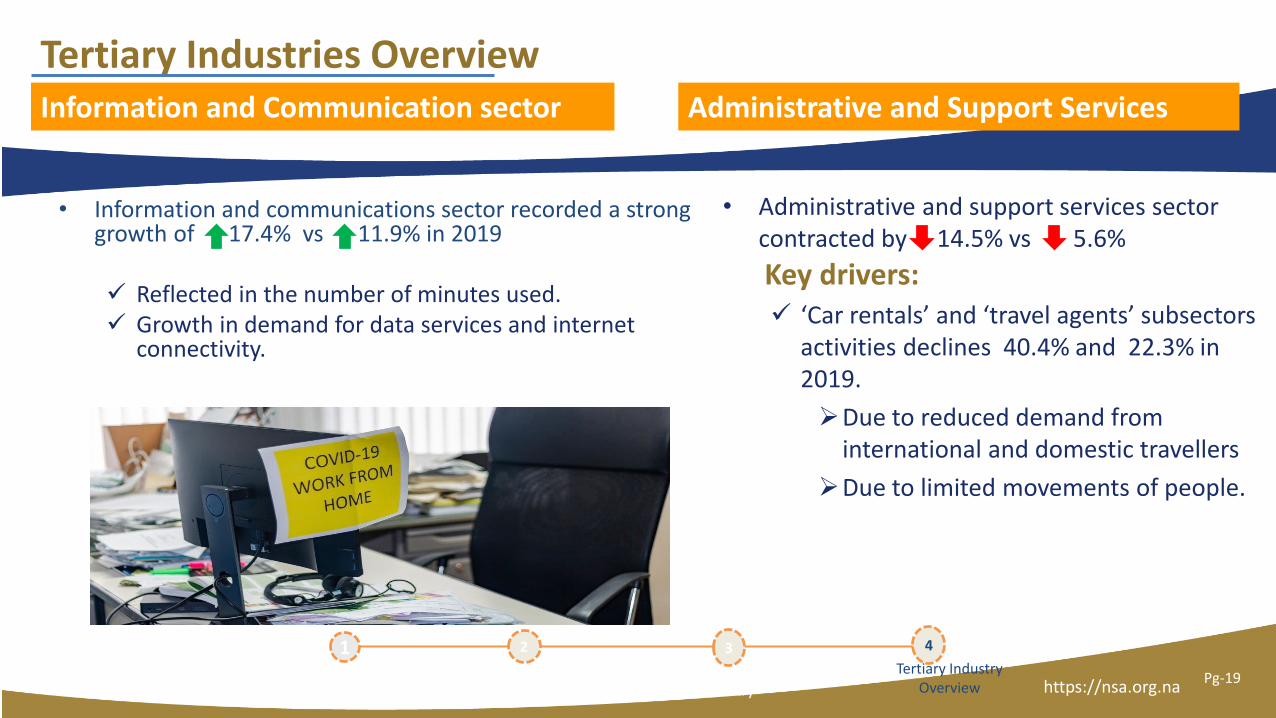
• Information and communications sector recorded a strong growth of 17.4% vs 11.9% in 2019
Reflected in the number of minutes used. Growth in demand for data services and internet
connectivity.
Information and Communication sector Administrative and Support Services
• Administrative and support services sector contracted by 14.5% vs 5.6%
Key drivers: ‘Car rentals’ and ‘travel agents’ subsectors
activities declines 40.4% and 22.3% in 2019.
Due to reduced demand from international and domestic travellers
Due to limited movements of people.
4
Tertiary Industry Overview
Pg-19
https://nsa.org.na
Tertiary Industries Overview
1Primary Industry
2
Primary industry
3
Secondary Industry
• Public administration and defense 1.8% vs 1.5% in 2019.
Increase in resignations and retirees relative to new recruits
• Education sector posted 0.1% vs 1.7% in 2019.
Slow growth witnessed in “primary and secondary education” subsector.
• Health sector posted 4.8% vs 1.5% in 2019
Increased health activities to combat the spread of the pandemic.
Public administration, Health and Education
4
Tertiary Industry Overview
Pg-20
https://nsa.org.na
1
Revision NA
2
ANA 2018
3
Q3GDP
4Pg-21
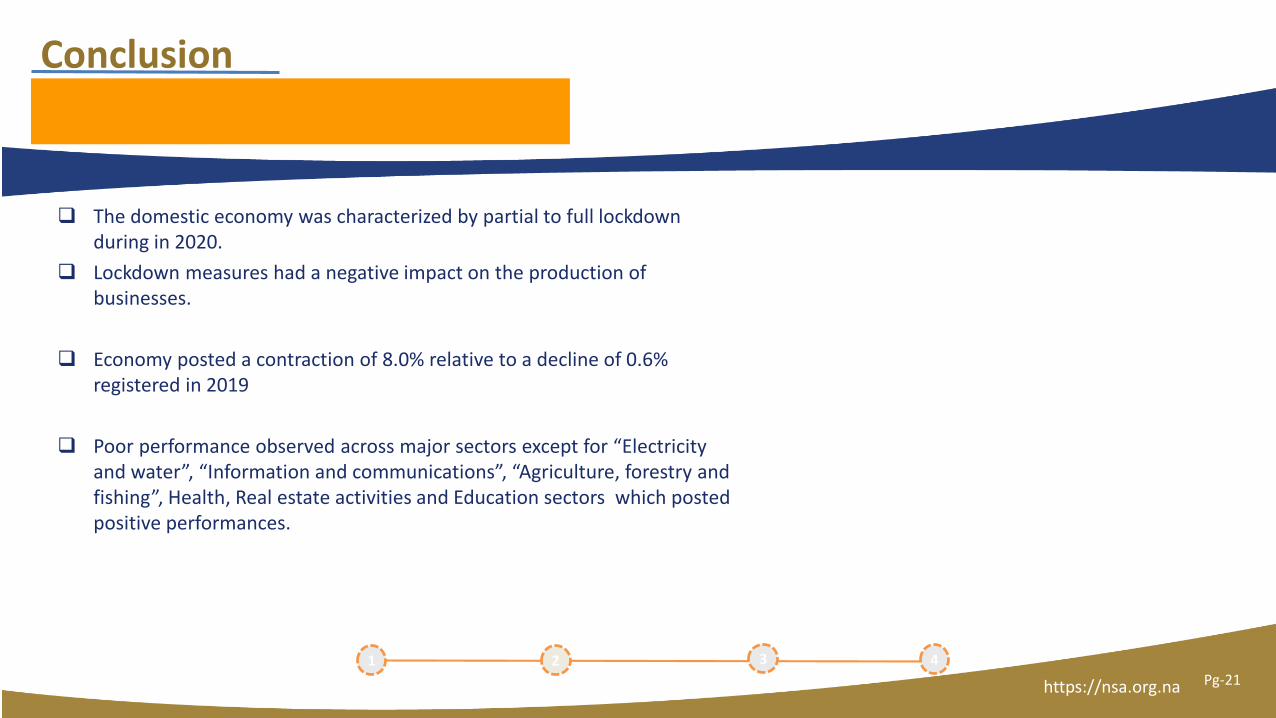
Conclusion
The domestic economy was characterized by partial to full lockdown during in 2020.
Lockdown measures had a negative impact on the production of businesses.
Economy posted a contraction of 8.0% relative to a decline of 0.6% registered in 2019
Poor performance observed across major sectors except for “Electricity and water”, “Information and communications”, “Agriculture, forestry and fishing”, Health, Real estate activities and Education sectors which posted positive performances.
SECTORAL REPORTS
PG-16
https://nsa.org.na
Background
• Short-term indicators that assist in monitoring business cycle
• Sectors covered on a month lag are;
– Electricity,
– Transport and,
– Beverages;
• Presented in a form of indices with reference period 2015 = 100
• Produced on a monthly basis
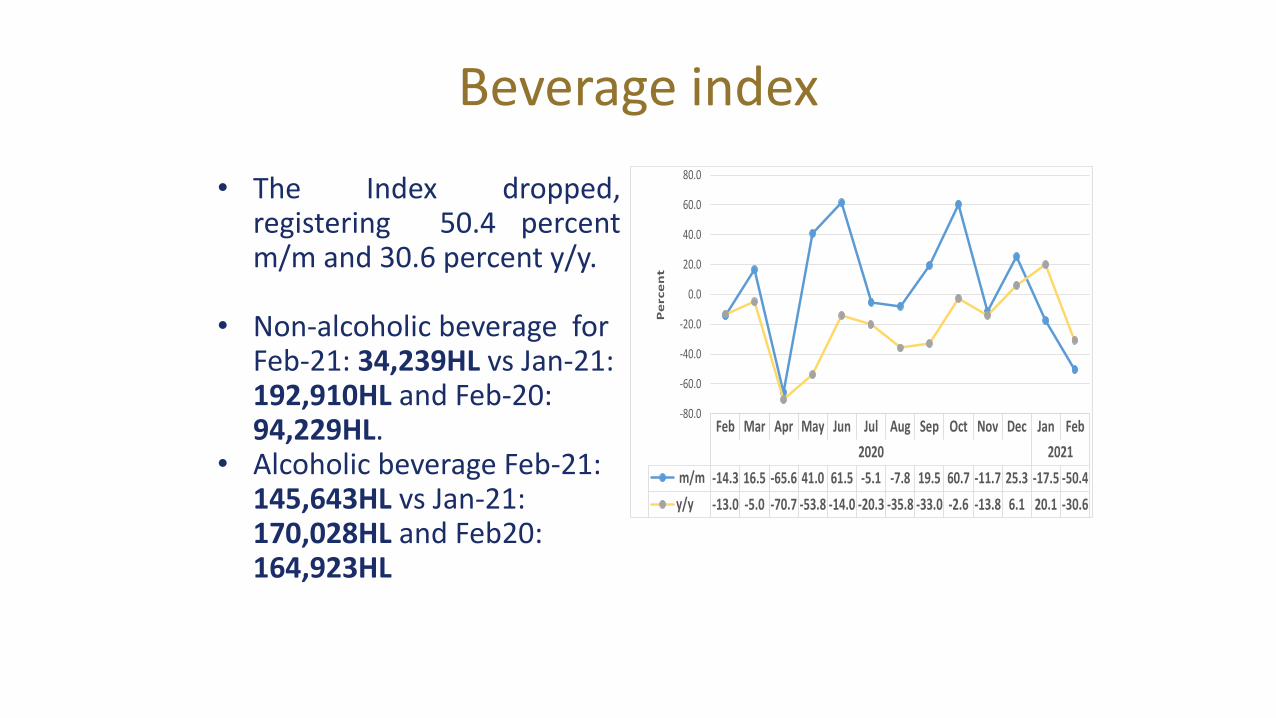
Beverage index
• The Index dropped,registering 50.4 percentm/m and 30.6 percent y/y.
• Non-alcoholic beverage for Feb-21: 34,239HL vs Jan-21: 192,910HL and Feb-20: 94,229HL.
• Alcoholic beverage Feb-21: 145,643HL vs Jan-21: 170,028HL and Feb20: 164,923HL
Feb Mar Apr May Jun Jul Aug Sep Oct Nov Dec Jan Feb
2020 2021
m/m -14.3 16.5 -65.6 41.0 61.5 -5.1 -7.8 19.5 60.7 -11.7 25.3 -17.5 -50.4
y/y -13.0 -5.0 -70.7 -53.8 -14.0 -20.3 -35.8 -33.0 -2.6 -13.8 6.1 20.1 -30.6
-80.0
-60.0
-40.0
-20.0
0.0
20.0
40.0
60.0
80.0
Pe
rce
nt
Electricity Sources index
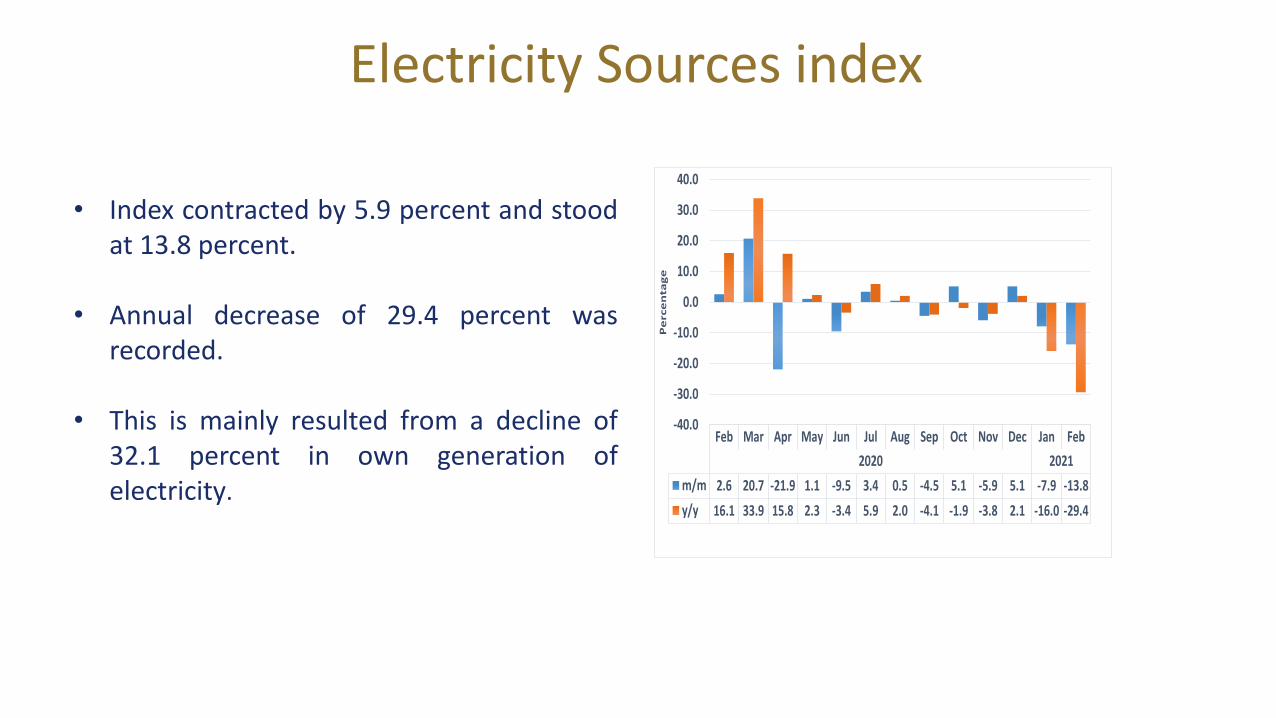
• Index contracted by 5.9 percent and stoodat 13.8 percent.
• Annual decrease of 29.4 percent wasrecorded.
• This is mainly resulted from a decline of32.1 percent in own generation ofelectricity.
Feb Mar Apr May Jun Jul Aug Sep Oct Nov Dec Jan Feb
2020 2021
m/m 2.6 20.7 -21.9 1.1 -9.5 3.4 0.5 -4.5 5.1 -5.9 5.1 -7.9 -13.8
y/y 16.1 33.9 15.8 2.3 -3.4 5.9 2.0 -4.1 -1.9 -3.8 2.1 -16.0 -29.4
-40.0
-30.0
-20.0
-10.0
0.0
10.0
20.0
30.0
40.0
Pe
rce
nta
ge
Electricity Sales index
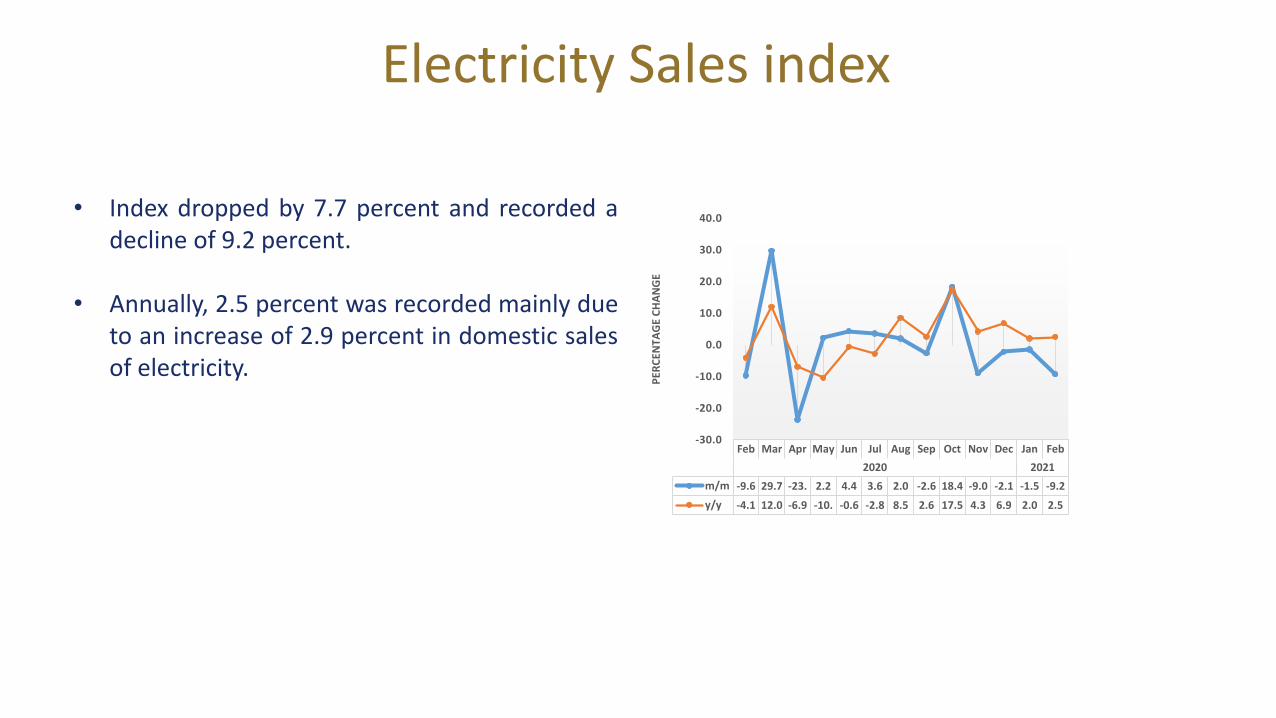
• Index dropped by 7.7 percent and recorded adecline of 9.2 percent.
• Annually, 2.5 percent was recorded mainly dueto an increase of 2.9 percent in domestic salesof electricity.
Feb Mar Apr May Jun Jul Aug Sep Oct Nov Dec Jan Feb
2020 2021
m/m -9.6 29.7 -23. 2.2 4.4 3.6 2.0 -2.6 18.4 -9.0 -2.1 -1.5 -9.2
y/y -4.1 12.0 -6.9 -10. -0.6 -2.8 8.5 2.6 17.5 4.3 6.9 2.0 2.5
-30.0
-20.0
-10.0
0.0
10.0
20.0
30.0
40.0
PER
CEN
TAG
E C
HA
NG
E

Transport Index
• Measures index in tonnestransported via Rail, Road, Airand Sea Cargo.
• Index registered a negativegrowth of 5.0 percent m/mand 11.3 y/y.
• Namibia transported 948 107tonnes of cargo lower with49,717 tonnes transported inJanuary 2021.
• COVID-19 measures imposedin the country impacted onthe transport of goods.
https://nsa.org.na
• Beverage, Electricity and the Transport sector indicators has showed a steep and downward trend on monthly basis.
• The COVID-19 pandemic effect on the economy is still prevailing within the second month of the year.
Conclusion
https://nsa.org.na
THANK YOU!
1
Revision NA
2
ANA 2018
3
Q3GDP
4Pg-22