Embed Size (px)
Citation preview

ROY R. ROMER GOVERNOR
COLORADO GEOLOGICAL SURVEY DEPARTMENT OF NATURAL RESOURCES
715 STATE CENTENNIAL BUILDING - 1313 SHERMAN STREET DENVER, COLORADO 80203 PHONE (303) 866·2611
PRELIMINARY GEOLOGIC ASSESSMENT OF A TRACT OF LAND IN SECTIONS 19 and 30, T39N, R7E
FOR USE AS THE NEW LANDFILL SITE FOR RIO GRANDE COUNTY
Prepared for the Rio Grande County Commissioners
By Robert M. Kirkham
October 13, 1992
GEOLOGY STORY OF THE PAST ... KEY TO THE FUTURE
JOHN W. ROLD DIRECTOR
TABLE OF CONTENTS
Page
1.0 2.0 3.0
Introduction ................... . .......................... .•• 1 Regional Geologic Setting ..... . ••• 1
4.0
Site 3.1 3.2 3.3 3.4 3.5 Site 4.1 4.2
Geology ................•...... ................... • ••• 2 Bedrock Stratigraphy ................. . •••••••••• 2 Surficial Deposits .............. . ••••••••••••.•••• 3 Depth to Bedrock ....... . ..4 Structure and Faulting .......... . •• 5 Seismic Ground Motion ...... . ••••••••• 6 Hydrology ......................... . ••••••• 7 Surface Water Hydrology. • •••• 7 Ground Water Hydrology .......................•. • •••• 7
5.0 6.0 7.0 8.0
Recommendations ......... . . •.•.•••..•••••••••••.... 8 Ref e renees C; ted ....................................................... 9 Appendix A-Lithologic Logs for Test Pits ...............•............... 10 Appendix B-List of Water Wells ...................................•..... 12
FIGURES
Fi gure 1. Figure 2. Figure 3. Figure 4.
Geologic Map of the General Vicinity of the Property .••••...•...•. 13 Test Pit Location Map .•.•...................••.••...•......•...•.. 14 Revised Location Map for Fault A .................................. 15 Map showing peak horizontal acceleration with 90 % probability of not being exceeded in 250 years .......•....•................•.. 16
Figure 5. Figure 6.
Surface Drainage Map .............................................. 17 Water Well Location Map .............•.........•.............•..... 18

-------------------------------------------------------
1.0 INTRODUCTION
At the request of the Rio Grande County Commissioners the Colorado Geological Survey (CGS) conducted a reconnaissance geologic investigation of a tract of land in sections 19 and 30, T39N, R7E which was being considered for use as the new Rio Grande County landfill. The tract contains about 480 acres and includes the SW/4 of section 19 and the N/2 of section 30. The purpose of the study was to assess the geological attributes of the property relative to new solid waste disposal regulations promulgated by the U.S. Environmental Protection Agency (EPA) and to the draft regulations proposed by the Colorado Health Department (CDH), prior to the county acquiring the property.
An investigation of the property was conducted during the fall of 1991 which involved review of existing published geologic mapping, examination of aerial photography, brief field inspection, logging of test pits, and review of registered water well information. Results of the reconnaissance investigation were presented orally at a commissioner's meeting last fall. This report is being prepared subsequent to a recent request from the county for a written summary of our investigation.
2.0 REGIONAL GEOLOGICAL SETTING
The property lies in the foothills on the western edge of San Luis Valley. It is roughly midway between the towns of Monte Vista and Del Norte, and is south of the Rio Grande and U.S. Highway 160.
San Luis Valley is the topographic expression of a major structural depression called the San Luis Basin. This structural basin is a Neogene age, asymetrically shaped, half graben or hinged graben that is an integral part of the Rio Grande rift system. The eastern margin of San Luis Basin is formed by a major normal fault system, the Sangre de Cristo fault zone, along which the valley is downdropped and the Sangre de Cristo Mountains are upthrown. Tens of thousands of feet of fault displacement have occurred on this fault zone since the Miocene, and fault activity has continued on this structure into the Holocene (Kirkham and Rogers, 1981; McCalpin, 1983).
The western margin of San Luis Basin is generally a gently folded hinge structure which separates the volcanic formations exposed in the eastern San Juan Mountains from the sediments that fill the basin. Relatively minor, small-displacement faults have been mapped at a few locations along the hinge zone (Lipman, 1976; Steven and others, 1973). The property lies within the hinge zone, and several of these small faults are in close proximity to the property.
Bedrock in this portion of the foothills consists of a sequence of volcanic deposits which are several hundred to perhaps over a thousand feet thick that were derived from the former volcanoes once present in the mountains to the west. Included within the volcanic formations are quartz latite and rhyolitic ash-flow tuffs, basaltic lava flows, and volcaniclastic deposits which gently dip to the northeast or east into San Luis Basin.
-1-
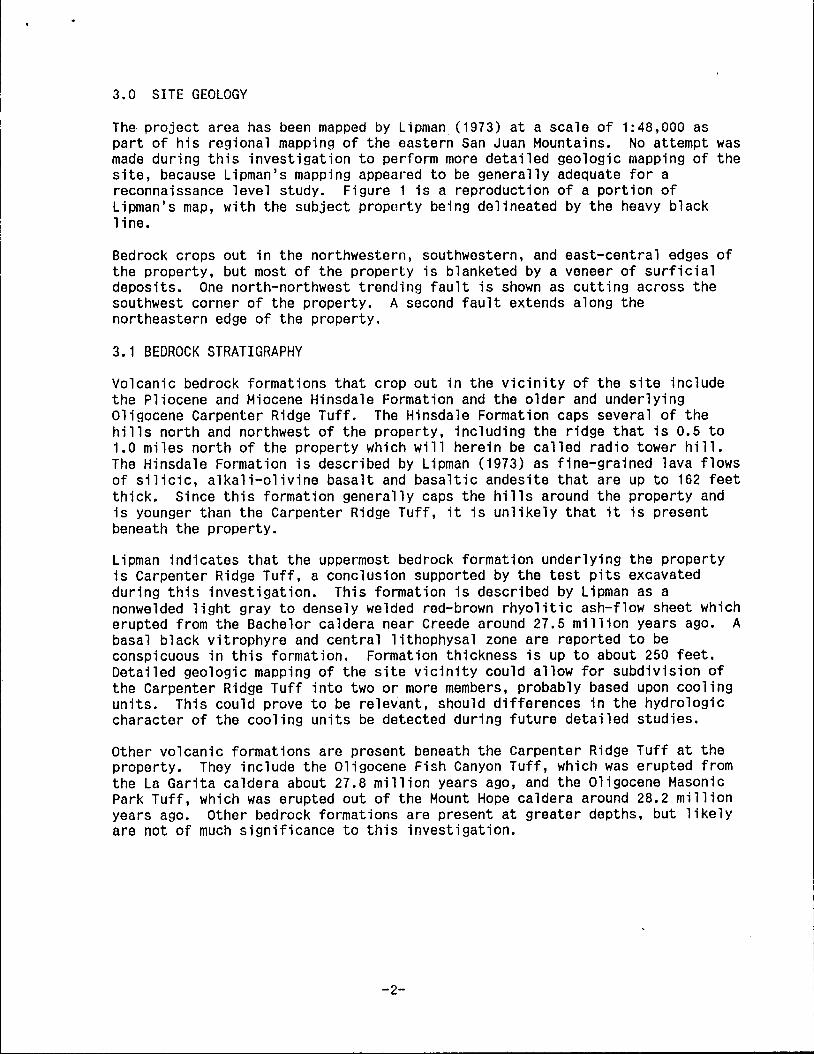
3.0 SITE GEOLOGY
The project area has been mapped by Lipman (1973) at a scale of 1:48,000 as part of his regional mapping of the eastern San Juan Mountains. No attempt was made during this investigation to perform more detailed geologic mapping of the site, because Lipman's mapping appeared to be generally adequate for a reconnaissance level study. Figure 1 is a reproduction of a portion of Lipman's map, with the subject proporty being delineated by the heavy black line.
Bedrock crops out in the northwestern, southwestern, and east-central edges of the property, but most of the property is blanketed by a veneer of surficial deposits. One north-northwest trending fault is shown as cutting across the southwest corner of the property. A second fault extends along the northeastern edge of the property.
3.1 BEDROCK STRATIGRAPHY
Volcanic bedrock formations that crop out in the vicinity of the site include the Pliocene and Miocene Hinsdale Formation and the older and underlying Oligocene Carpenter Ridge Tuff. The Hinsdale Formation caps several of the hills north and northwest of the property, including the ridge that is 0.5 to 1.0 miles north of the property which will herein be called radio tower hill. The Hinsdale Formation is described by Lipman (1973) as fine-grained lava flows of silicic, alkali-olivine basalt and basaltic andesite that are up to 162 feet thick. Since this formation generally caps the hills around the property and is younger than the Carpenter Ridge Tuff, it is unlikely that it is present beneath the property.
Lipman indicates that the uppermost bedrock formation underlying the property is Carpenter Ridge Tuff, a conclusion supported by the test pits excavated during this investigation. This formation is described by Lipman as a nonwe1ded light gray to densely welded red-brown rhyolitic ash-flow sheet which erupted from the Bachelor caldera near Creede around 27.5 million years ago. A basal black vitrophyre and central 1ithophysa1 zone are reported to be conspicuous in this formation. Formation thickness is up to about 250 feet. Detailed geologic mapping of the site vicinity could allow for subdivision of the Carpenter Ridge Tuff into two or more members, probably based upon cooling units. This could prove to be relevant, should differences in the hydrologic character of the cooling units be detected during future detailed studies.
Other volcanic formations are present beneath the Carpenter Ridge Tuff at the property. They include the Oligocene Fish Canyon Tuff, which was erupted from the La Garita caldera about 27.8 million years ago, and the Oligocene Masonic Park Tuff, which was erupted out of the Mount Hope caldera around 28.2 million years ago. Other bedrock formations are present at greater depths, but likely are not of much significance to this investigation.
-2-

3.2 SURFICIAL DEPOSITS
All non-1ithified sedimentary deposits present at or near the ground surface on the property are classified as surficial deposits. Engineers commonly refer to these types of deposits as soil. Lipman (1973) maps two surficial deposits as being present on the property: Holocene and Pleistocene alluvial fan deposits and Pleistocene and Pliocene older fan deposits. The older fan deposits crop out only in the easternmost corner of the property. They generally consist of upland gravel, sand, and silt units which appear to more or less concordantly overlie the Carpenter Ridge Tuff in the vicinity of the site.
Alluvial fan deposits blanket much of the property between the bedrock outcrops. Lipman describes this unit as generally poorly sorted material ranging from silt to boulders which grades to colluvium in the upper parts of drainages. He believes this unit largely predates Pinedale outwash.
Based on lithologic information collected from on-site test holes and the geomorphic character of the deposit as observed on aerial photographs, these alluvial fan deposits may be better classified as debris flow deposits, and will be referred to as such in the remainder of this report. They appear to be the result of sudden rainstorm events during which soil and rock debris are eroded from the upper reaches of the drainage basin and subsequently deposited downstream in areas where the carrying capacity of the flood water diminishes. The character of the fine-grained sediments exposed in the test pits suggested debris flow deposition.
little evidence of bedding was observed in the debris flow deposits, and much of the fine-grained sediments possessed significant macroscopic, interstia1 void spaces up to around 1/16 inch in diameter. Such voids typically result from air entrapped in the roiling, sediment-loaded waters of debris flows. Sediments such as these are subject to hydrocompaction when sufficiently wetted. No obvious areas of historic hydrocompaction were noted during this brief study, but hydrocompaction of the debris flow deposits should be considered when designing this facility.
Significant debris flow activity in Nicomodes Gulch apparently has occurred at this site during the historic period. A stock pond/erosion control dam located in the SE/4 of the NW/4 of section 30 has been filled to capacity with debris flow deposits since being constructed. The extent of this historic debris flow is readily apparent on U.S. Bureau of land Management CBlM) color aerial photographs 1-2S-23 and 1-2S-24 taken on September 8, 1977. The debris flow can also be identified on the ground based on changes in vegetation and soil colors.
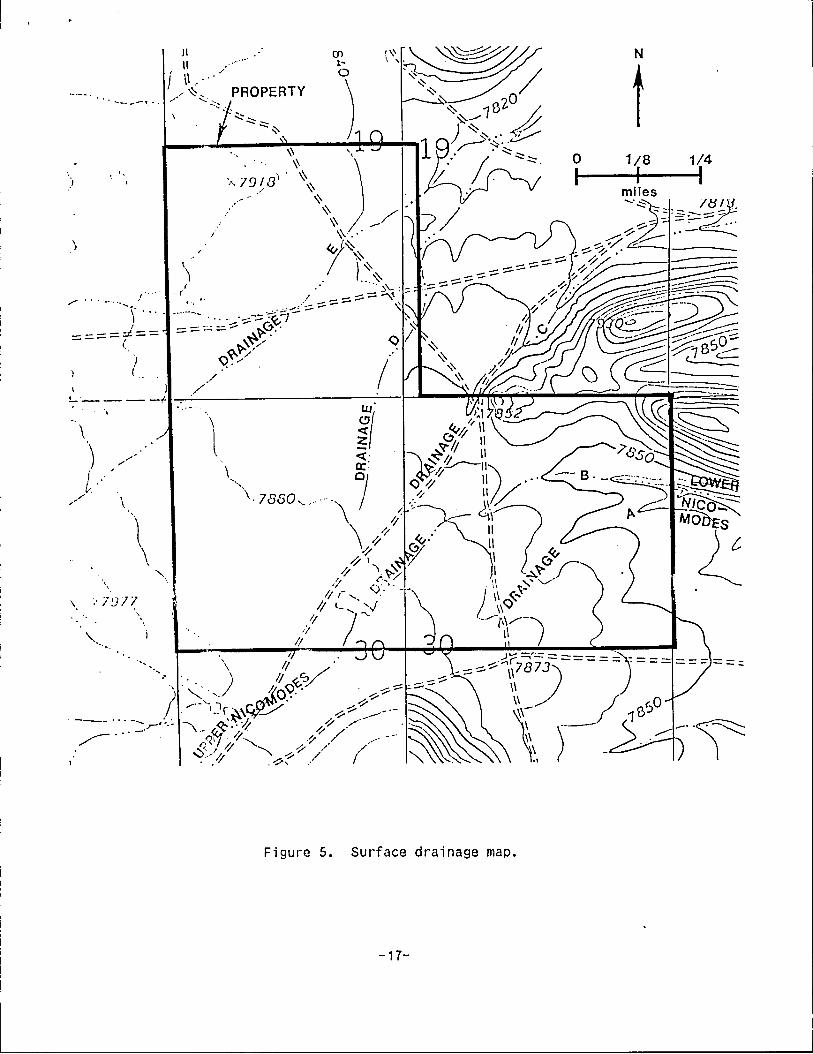
The historic debris flow event deposited a fairly thick accumulation of material in and around the stock pond, and four lobes consisting of the less viscous portion of the flow extended downstream in four different drainages. Surprisingly, the lobe which flowed down the mainstem of Nicomodes Gulch travelled the least distance from the main depositional area, while those portions of the flow moving down drainages C, 0, and A (please refer to Figure 5 for locations of each of these lettered drainages) were, respectively, transported the greatest distances. As measured from the filled dam, the distance of travel in each of the drainages amounts to about 1600 ~eet for drainage B (Nicomodes Gulch), 3500 feet for drainage A, 5300 feet for drainage 0, and 8500 feet for drainage C. This suggests that the depositional area in
-3-
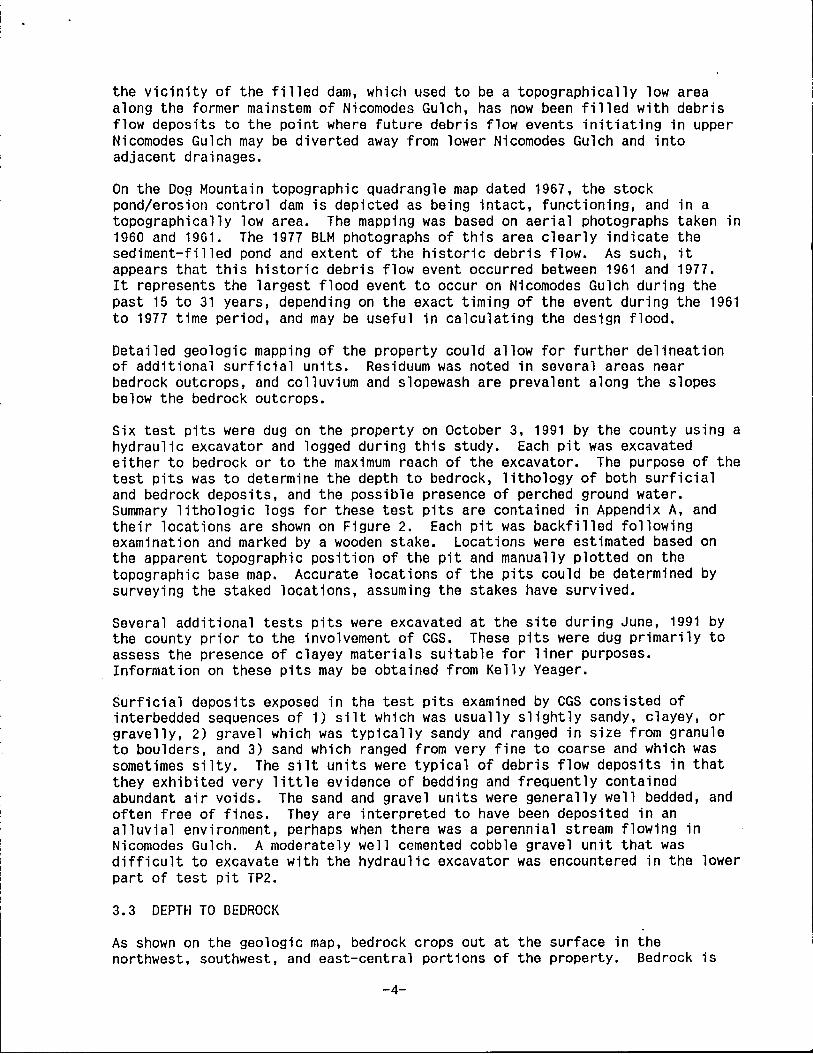
the vicinity of the filled dam, which used to be a topographically low area along the former mainstem of Nicomodes Gulch, has now been filled with debris flow deposits to the point where future debris flow events initiating in upper Nicomodes Gulch may be diverted away from lower Nicomodes Gulch and into adjacent drainages.
On the Dog Mountain topographic quadrangle map dated 1967, the stock pond/erosion control dam is depicted as being intact, functioning, and in a topographically low area. The mapping was based on aerial photographs taken in 1960 and 1961. The 1977 BLM photographs of this area clearly indicate the sediment-filled pond and extent of the historic debris floW. As such, it appears that this historic debris flow event occurred between 1961 and 1977. It represents the largest flood event to occur on Nicomodes Gulch during the past 15 to 31 years, depending on the exact timing of the event during the 1961 to 1977 time period, and may be useful in calculating the design flood.
Detailed geologic mapping of the property could allow for further delineation of additional surficial units. Residuum was noted in several areas near bedrock outcrops, and colluvium and slopewash are prevalent along the slopes below the bedrock outcrops.
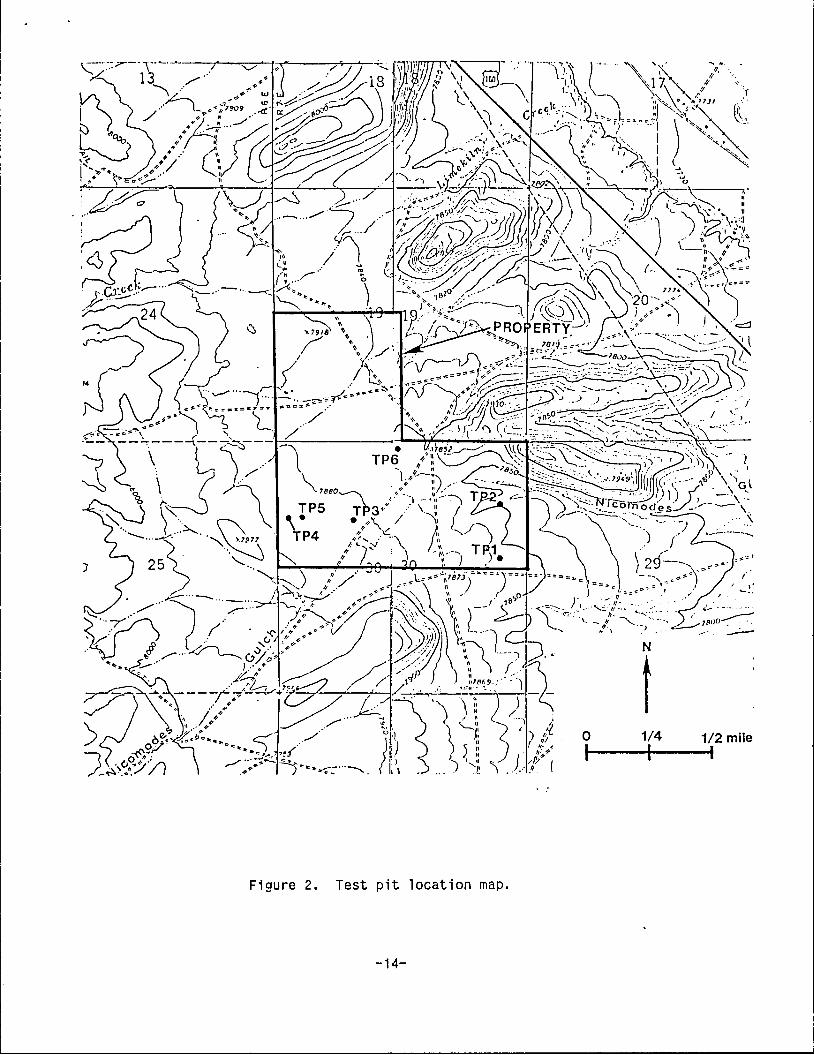
Six test pits were dug on the property on October 3, 1991 by the county using a hydraulic excavator and logged during this study. Each pit was excavated either to bedrock or to the maximum reach of the excavator. The purpose of the test pits was to determine the depth to bedrock, lithology of both surficial and bedrock deposits, and the possible presence of perched ground water. Summary lithologic logs for these test pits are contained in Appendix A, and their locations are shown on Figure 2. Each pit was backfilled following examination and marked by a wooden stake. Locations were estimated based on the apparent topographic position of the pit and manually plotted on the topographic base map. Accurate locations of the pits could be determined by surveying the staked locations, assuming the stakes have survived.
Several additional tests pits were excavated at the site during June, 1991 by the county prior to the involvement of CGS. These pits were dug primarily to assess the presence of clayey materials suitable for liner purposes. Information on these pits may be obtained from Kelly Yeager.
Surficial deposits exposed in the test pits examined by CGS consisted of interbedded sequences of 1) silt which was usually slightly sandy, clayey, or gravelly, 2) gravel which was typically sandy and ranged in size from granule to boulders, and 3) sand which ranged from very fine to coarse and which was sometimes silty. The silt units were typical of debris flow deposits in that they exhibited very little evidence of bedding and frequently contained abundant air voids. The sand and gravel units were generally well bedded, and often free of fines. They are interpreted to have been deposited in an alluvial environment, perhaps when there was a perennial stream flowing in Nicomodes Gulch. A moderately well cemented cobble gravel unit that was difficult to excavate with the hydraulic excavator was encountered in the lower part of test pit TP2.
3.3 DEPTH TO BEDROCK
As shown on the geologic map, bedrock crops out at the surface in the northwest, southwest, and east-central portions of the property. Bedrock is
-4-

present at very shallow depths along the entire western portion of property. Test pit TP4 encountered bedrock at a depth of only o.s feet, and it was only 2 feet to bedrock in test pit TPS. An earlier pit dug near the center of the SW/4 of section 19 found bedrock at a depth of about 6 feet (Kelly Yeager, oral communication). It is unlikely that a significant thickness of surficial deposits is present west of the powerline.
Depth to bedrock increases to around 20 feet in the vicinity of the old stock pond/erosion control dam. Test pit TP3 encountered bedrock at 19 feet below ground level, and earlier pits reportedly found bedrock around 20 feet deep in the area immediately north and east of the old pond. Depth to bedrock apparently increases in an easterly direction from the old pond, based on test pits TP1 and TP2. These pits were, respectively, 22.S feet and 24 feet deep and did not intercept bedrock. Actual depth to bedrock in the E/2 of the NE/4 of section 30, thus is not accurately known at this time. Test pit TP6 was excavated near the north quarter corner of section 30. Bedrock was found at a depth of 21.S feet, suggesting that an adequate thickness of surficial material is present at this location. Test pits were not installed in the E/2 of the SW/4 of section 19, due to the presence of drainages D and E, which reduced the suitability of this area as a landfill site.
3.4 STRUCTURE AND FAULTING
The property lies on the structural hinge zone on the western margin of San Luis Basin. Bedrock in the vicinity of the property strikes approximately N10-200 W and dips around S degrees to the northeast into the valley. The property is situated on the eastern edge of a belt of northwest-trending, steeply dipping or vertical faults that offset the volcanic bedrock and early Pleistocene/Pliocene older gravels. This zone of faults is one of the few which occurs along the hinge zone on the western margin of San Luis Basin. They are also unusual in that many are down-dropped to the west, opposite of the regional structural dip into the basin.
Pansze and Covarrubias (1987) studied this fault zone using geologic mapping, seismic data, gravity surveys, and magnetic surveys. They suggest this fault zone has experienced at least three episodes of activity since the middle Tertiary. The first was an early, down to the east, listric, normal faulting associated with early rifting. A second period of activity involved subtle, west-to-east rotation of existing fault blocks which steepened east-dipping faults and displaced strata down to the west. This period of activity may have been associated with broad folding. Late reactivation of some of the faults by continued rift extension produced normal, down-to-east movement.
Lipman (1973) maps the faults within this zone as offsetting various bedrock units and the early Quaternary/Pliocene older gravel deposit. None of the faults within the entire zone are mapped by him as offsetting any of the younger deposits, suggesting an absence of Holocene activity on these faults.
Two of the faults within this zone are of particular interest to this investigation, because the regulations require that the facility be set back at least 200 feet from any faults which have experienced movement during the Holocene. As shown on Figure 1, faults A and B are either within or near the property.
-S-
------------------------------------------------------------------------------------,
Fault A offsets the Hinsdale Formation that caps the radio tower hill north of the property 10 to 20 feet. Displacement is down to the east. Field investigations suggest this formation may actually be sharply folded, not faulted at this location. Lipman maps this fault as concealed beneath younger deposits immediately south of radio tower hill, and then dying out a short distance south. Its projected trend extends towards the property. A fault that offsets the older gravel unit capping the hilltop in the NE/4 of section 19 was identified during our study. This fault has a sense of displacement similar to the fault on radio hill, and the two appear to align on aerial photography. If these two fault exposures are on the the same fault, then its mapped location should be revised as shown in Figure 3, making it unlikely that fault A trends into the property. Fault A appears to die out before reaching the bedrock outcrops near the SE corner of section 19.
Fault B offsets bedrock and the older gravel deposits in the SW/4 of section 30. At this location the older gravel deposit is down-dropped to the west a few tens of feet. Lipman (1973) maps the northern extension of this fault as being concealed beneath debris flow deposits across the NW/4 of section 30, and as offsetting bedrock at two location near Limekiln Creek (Figure 1). Bedrock is continuously exposed in the outcrop north of Limekiln Creek, but no evidence of faulting was detected within this outcrop when inspected during this study. This suggests fault B may not extend as far north as mapped by Lipman, or it may lie west of the bedrock outcrop in the NE/4 of section 25.
Steven and others (1974) indicate that fault B continues southward and into section 5, where the older gravels are juxtaposed against the Carpenter Ridge Tuff. Lipman, however, does not connect the two faults on his map. A subtle linear feature visible on aerial photographs in the NW/4 of section 5 aligns with the projection of this fault through the debris flow deposits. Field reconnaissance of this area did not successfully locate the linear feature, but it was possible to determine that a distinctive scarp was not present. It is recommended that a neotectonic expert be employed to evaluate the significance of this linear feature.
No evidence of fault displacement or folding within the surficial deposits were detected during this investigation anywhere along faults A or B. Since the most recent movement on these two faults apparently predates deposition of the Pleistocene and Holocene surficial deposits, it is reasonable to infer that neither fault A or B have experienced activity during the Holocene. To further minimize the possibility of fault disruption of a landfill cell in the future, we recommend that the facility not be situated on any known fault.
3.5 SEISMIC GROUND MOTION
A number of maps showing the expected ground motion or maximum horizontal acceleration at various probabilities and return periods are available. San Luis Valley is considered by some to be a potentially seismically active area, based on the presence of the active Sangre de Cristo fault zone at the base of the Sangre de Cristo Mountains. Any ground acceleration model which encompasses the potential effects of active faults will reflect the activity of the Sangre de Cristo fault zone. Historic moderate-sized earthquakes have occurred at Dulce, New Mexico and near Montrose, Colorado, so models which rely upon the historic earthquake record typically show a zone of slightly higher ground motion that runs along the west side of the valley. Models that incorporate both types of seismic sources will reflect active faults and historic earthquakes.
-6-
~~-----------------------------------------------....,
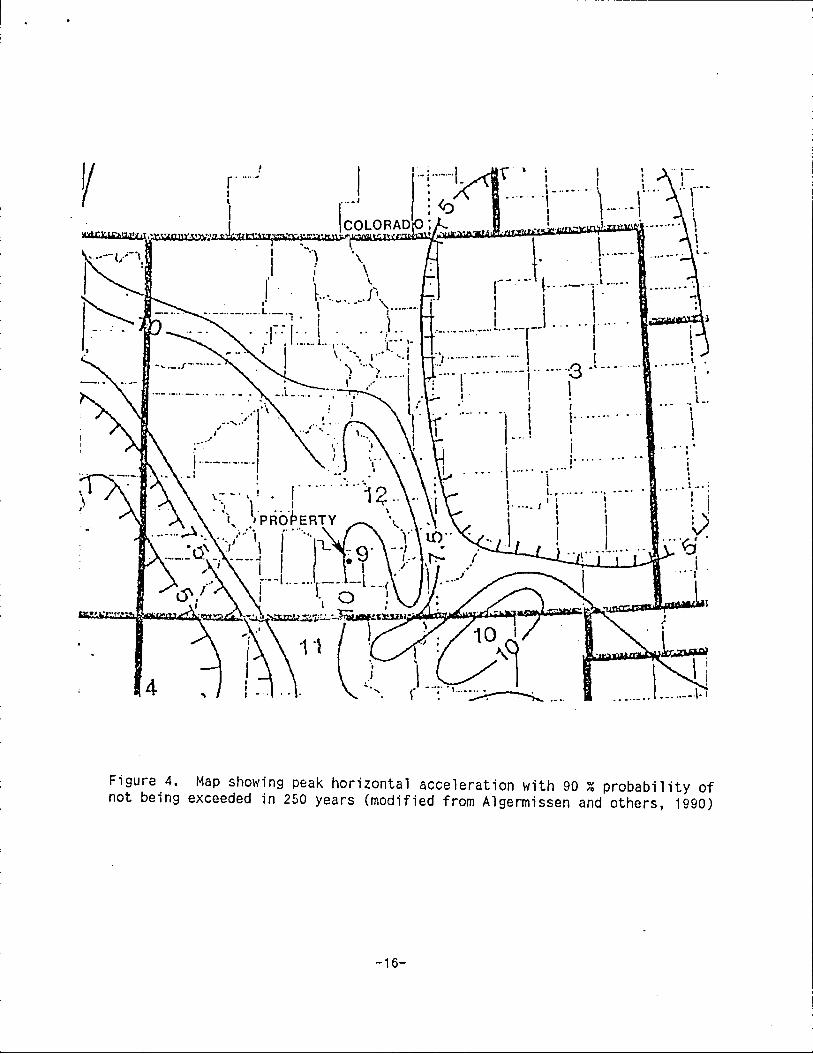
We have reviewed two frequently utilized maps to determine whether this property is within a "seismic impact zone". Any area that has a ten % or greater probability of the maximum horizontal acceleration exceeding 0.10g in 250 years based upon these maps is considered to be within a seismic impact zone. According to Algermissen and others (1982) the property is within such an area. Algermissen and others (1990) utilized additional data in their most recent model, a copy of which is shown in Figure 4. It appears that the peak acceleration for this property based on the new map is about 0.09g, which would indicate the property is outside the seismic impact zone. Due to the close proximity of the property to the 0.10g contour, the CDH may still require seismic design for a site on this property.
4.0 SITE HYDROLOGY
4.1 SURFACE WATER HYDROLOGY
Five principal ephemeral drainages, herein referred to as drainages A to E, extend across the property from southwest to northeast (see Figure 5). Of the five drainages, only drainage B, which coincides with Nicomodes Gulch, has a sizeable catchment basin above the site. The topographic map indicates Nicomodes Gulch has a distinct channel through the property. However, historic debris flow events occurring since the topographic map was prepared have modified the topographic configuration of the area near the old stock pond/erosion control dam. The former channel of Nicomodes Gulch in this area is now filled with deposited sediments. Because of this, Nicomodes Gulch is divided into upper and lower reaches which are separated by the sediment-choked older channel. Presently, surface water flowing out of upper Nicomodes Gulch will naturally be diverted around the sediment-filled older channel and into any or all of drainages A, B, C, and D.
To satisfy regulations, a facility must be designed to accommodate the design flood. The debris flow activity of Nicomodes Gulch should be incorporated into the design flood to accurately predict its characteristics.
4.2 GROUND WATER HYDROLOGY
An accurate interpretation of the ground water hydrology of the property cannot be developed until test holes are drilled into aquifers underlying the property and proper hydrologic tests are performed. General observations relating to ground water hydrology of the property may be formulated based on nearby wells, regional hydrologic data, test pits, and field inspection.
No evidence of springs or seeps were noted during this study on or near the property. Ground water was not encountered in any of the six test pits excavated for this study. A moist sand layer was reported within one of the earlier test pits dug prior to the CGS participation (Kelly Yeager, oral communication). This test pit was located near the old stock pond/erosion control dam.
Test pits TP3 and TP6 were excavated to bedrock through relative thick sequences of surficial deposits, and no ground water was present. Test pits TP1 and TP2 did not reach bedrock, hence the possible occurrence of perched ground water on the bedrock surface cannot be fully assessed for t~ese locations based on available information. It is recommended that test holes or pits be installed at the selected landfill site to determine the presence or absence of perched ground water.
-7-
Water well information was obtained from the Colorado Division of Water Resources. They provided a computer printout dated November 5, 1991, which lists all registered water wells in the general vicinity of the property. Wells within about one mile of the property are shown on Figure 6, and pertinent data for each well is listed in Appendix B. No effort was made during this study to confirm the accuracy of the computer records provided by the state, and the permit files for individual wells were not inspected.
No registered water wells are on or within 1/4 mile of the property, however, there are 27 wells within about a mile of the property. They occur in two groups, one to the northeast of tho property and a second group east-southeast of the property. Wells in the area to the northeast are used for domestic, stock, and irrigation purposes. Seventeen of these wells are in the NE/4 of section 20 and are over 3/4 mile from the property. Depths to water in this area are reported as ranging from 26 to 92 feet, while total depths of the wells range from 47 feet to 175 feet. Wells in the area east-southeast of the property are permitted for use as irrigation, stock, and domestic purposes. The depth to water is reported to range from 8 to 183 feet. Total depth of the wells in this area ranges from 157 to 250 feet.
The well in the SE/4 SE/4 of section 30 probably is the most representative of conditions beneath the property. This well is 157 feet deep and yields 10 gpm. Depth to water was not reported. The irrigation well in the SE/4 NE/4 of section 29 is of interest, because it suggests that adequate water may be produced from the bedrock in this area to support irrigation needs, and it reports a water level of only 8 feet deep. A well located in the SE/4 SE/4 of section 23 is just west of the one mile perimeter around the property, but also is of interest, because it is 357 feet deep and yields 10 gpm.
Well data suggest that the first underlying aquifer is probably over 100 feet deep beneath the property. Depth to water appears to decrease east of the property and increase west of the property.
5.0 RECOMMENDATIONS
** Based on available information, this property does appear to contain at least two areas, each of 20 to 40 acre size, that likely could be permitted as a solid waste disposal facility under the EPA regulations and draft CDH regulations. One favorable area is located in the southeast portion of the property, being generally within the S/2 S/2 NE/4 of section 30. A second potentially favorable area is in the center of the property, extending from near the north quarter corner of section 30 southwesterly parallel to and between drainages C and D. Although additional subsurface data is needed, the southeast site appears to be preferable based on existing data, because it is less exposed to the debris flow hazard, and it is very unlikely that a fault lies beneath it. Neither favorable area is ideal, but both areas possess significant desirable geologic attributes and both would require less engineering solutions to geologic problems than many other areas within the county or valley.
** Before proceeding with the purchase of this property, it is recommended that additional subsurface information be collected in the vicinity of at least one of the two favorable locations regarding a) the depth to
-8-
-----------------------------------------------
bedrock, b) character of surficial deposits, c) presence of possible perched water tables on the bedrock surface or within the surficial deposits, and d) depth to the first underlying regional aquifer. A drilled test hole would be the preferable method by which to obtain this information, but an excavated test pit to bedrock could potentially supply all data except for the depth to the first underlying aquifer. It may be advisable to maintain the current lease/purchase option and postpone the purchase of this property until a permit is actually secured, or until a consulting firm or team of consultants is selected, and they recommend purchasing the property based upon their initial technical findings.
** Although this preliminary study suggests that the faults on or near the property do not have Holocene activity, it is recommended that an expert on neotectonics be asked to briefly review these faults using aerial photography and field inspection. Such an expert should be able to assess whether Holocene activity has occurred on faults A or B and confirm the suspected location of the faults so that the appropriate set-back distance can be maintained.
** The debris flow potential of Nicomodes Gulch should be carefully evaluated as a geologic hazard and integrated into the flood design. It may be necessary to construct an engineered channel in the southwest corner of the property to divert debris flow events away from a disposal site and into drainage D or E.
** Potential hydrocompaction of the debris flow deposits should be considered in the design of this facility.
** Nearby existing water wells, particularly the one in the SE/4 SE/4 of section 30, should further investigated. The complete files for these wells should be reviewed, and each well should be located in the field. Current depths to water should also be measured for each well, especially the irrigation well in section 29, which has a reported water level of only 8 feet.
6.0 REFERENCES CITED
Algermissen, S.T., and others, 1982, Probabilistic estimates of maximum acceleration and velocity in rock in the contiguous United States: U.S. Geological Survey, Open-File Report 82-1033.
Algermissen, S.T., and others, 1990, Probabilistic earthquake acceleration and velocity maps for the United States and Puerto Rico: U.S. Geological Survey, Miscellaneous Field Studies map MF-2120.
Kirkham, R.M., and Rogers, W.P., 1981, Earthquake potential in Co10rado--A preliminary evaluation: Colorado Geological Survey Bulletin 43, 171 p.
Lipman, P.W., 1976, Geologic map of the Del Norte area, eastern San Juan Mountains, Colorado: U.S. Geological Survey, Miscellaneous Investigations map 1-952.
McCalpin, J., 1983, Quaternary geology and neotectonics of the west flank of the northern Sangre de Cristo Mountains, south-central Colorado: Colorado School of Mines Quarterly, v. 77, no. 3, 97 p.
-9-
Pansze, A., and Covarrubias, 0., 1987, [abstr.], Rift-margin faulting near Monte Vista, Colorado: A structural and geophysical analysis: Geological Society of America, Abstracts with Programs, v. 19, no. 5, p. 325, abstract no. 124163.
Steven, T.A., Lipman, P.W., Hail, W.J., Jr., Barker, F., and Luedke, R.G., 1973, Geologic map of the Durango quadrangle, southwestern Colorado: u.s. Geological Survey, Miscellaneous Investigations map 1-764.
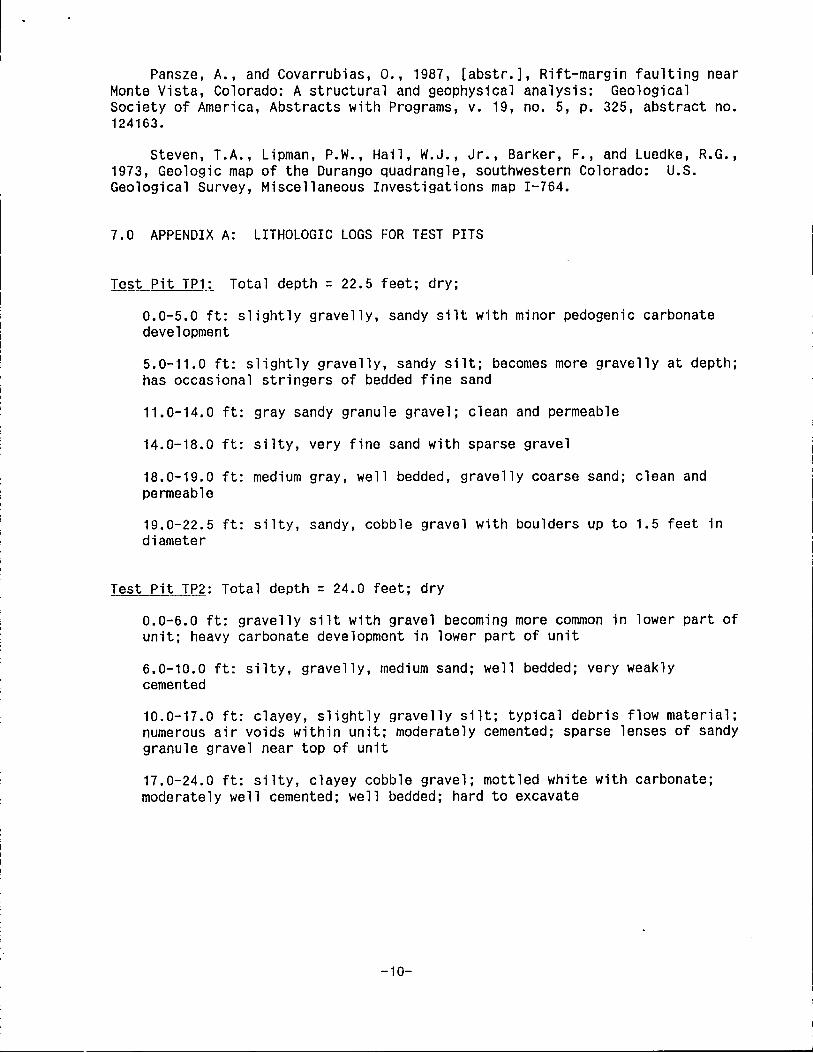
7.0 APPENDIX A: LITHOLOGIC LOGS FOR TEST PITS
L~~t Pit TPl=- Total depth = 22.5 feet; dry;
0.0-5.0 ft: slightly gravelly, sandy silt with minor pedogenic carbonate development
5.0-11.0 ft: slightly gravelly, sandy silt; becomes more gravelly at depth; has occasional stringers of bedded fine sand
11.0-14.0 ft: gray sandy granule gravel; clean and permeable
14.0-18.0 ft: silty, very fine sand with sparse gravel
18.0-19.0 ft: medium gray, well bedded, gravelly coarse sand; clean and permeable
19.0-22.5 ft: silty, sandy, cobble gravel with boulders up to 1.5 feet in diameter
Test Pit TP2: Total depth = 24.0 feet; dry
0.0-6.0 ft: gravelly silt with gravel becoming more common in lower part of unit; heavy carbonate development in lower part of unit
6.0-10.0 ft: silty, gravelly, medium sand; well bedded; very weakly cemented
10.0-17.0 ft: clayey, slightly gravelly silt; typical debris flow material; numerous air voids within unit; moderately cemented; sparse lenses of sandy granule gravel near top of unit
17.0-24.0 ft: silty, clayey cobble gravel; mottled white with carbonate; moderately well cemented; well bedded; hard to excavate
-10-
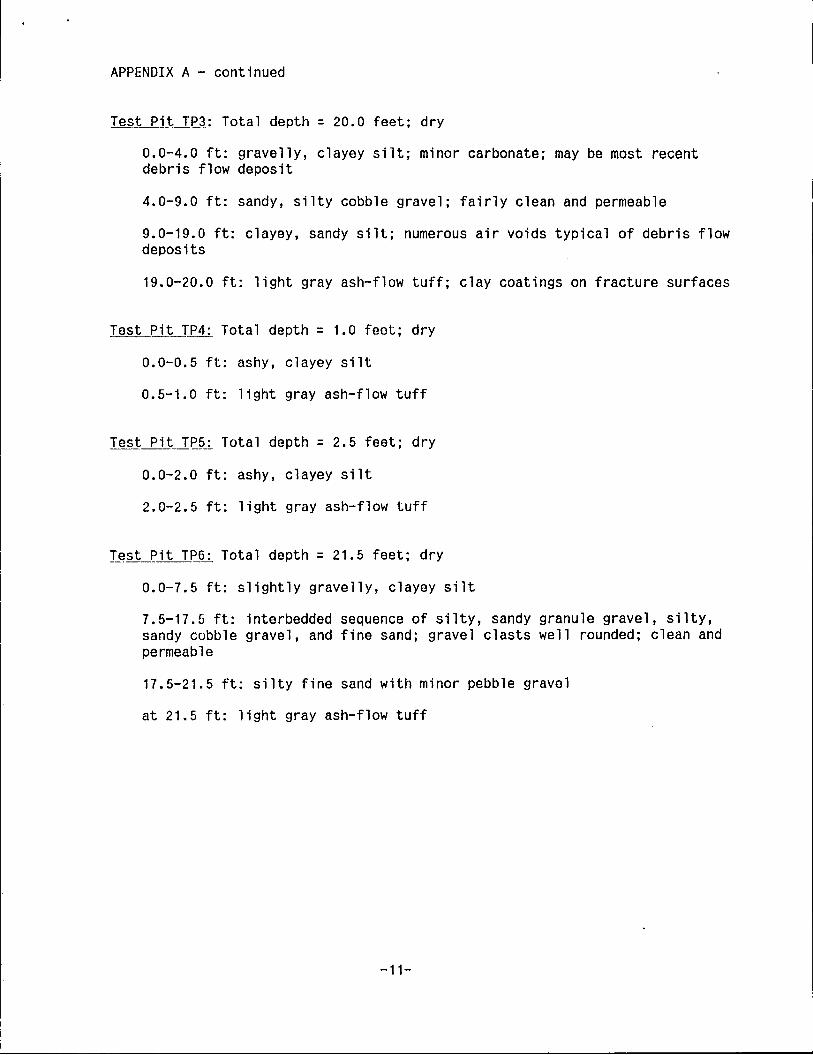
APPENDIX A - continued
Te~~jt~~~: Total depth = 20.0 feet; dry
0.0-4.0 ft: gravelly, clayey silt; minor carbonate; may be most recent debris flow deposit
4.0-9.0 ft: sandy, silty cobble gravel; fairly clean and permeable
9.0-19.0 ft: clayey, sandy silt; numerous air voids typical of debris flow deposits
19.0-20.0 ft: light gray ash-flow tuff; clay coatings on fracture surfaces
Te~LPi~.JP4:_ Total depth = 1.0 feet; dry
0.0-0.5 ft: ashy, clayey silt
0.5-1.0 ft: light gray ash-flow tuff
Test Pit TP5: Total depth = 2.5 feet; dry
0.0-2.0 ft: ashy. clayey silt
2.0-2.5 ft: light gray ash-flow tuff
J_~st Pit TP6: Total depth = 21.5 feet; dry
0.0-7.5 ft: slightly gravelly. clayey silt
7.5-17.5 ft: interbedded sequence of silty, sandy granule gravel, silty, sandy cobble gravel, and fine sand; gravel clasts well rounded; clean and permeable
17.5-21.5 ft: silty fine sand with minor pebble gravel
at 21.5 ft: light gray ash-flow tuff
-11-
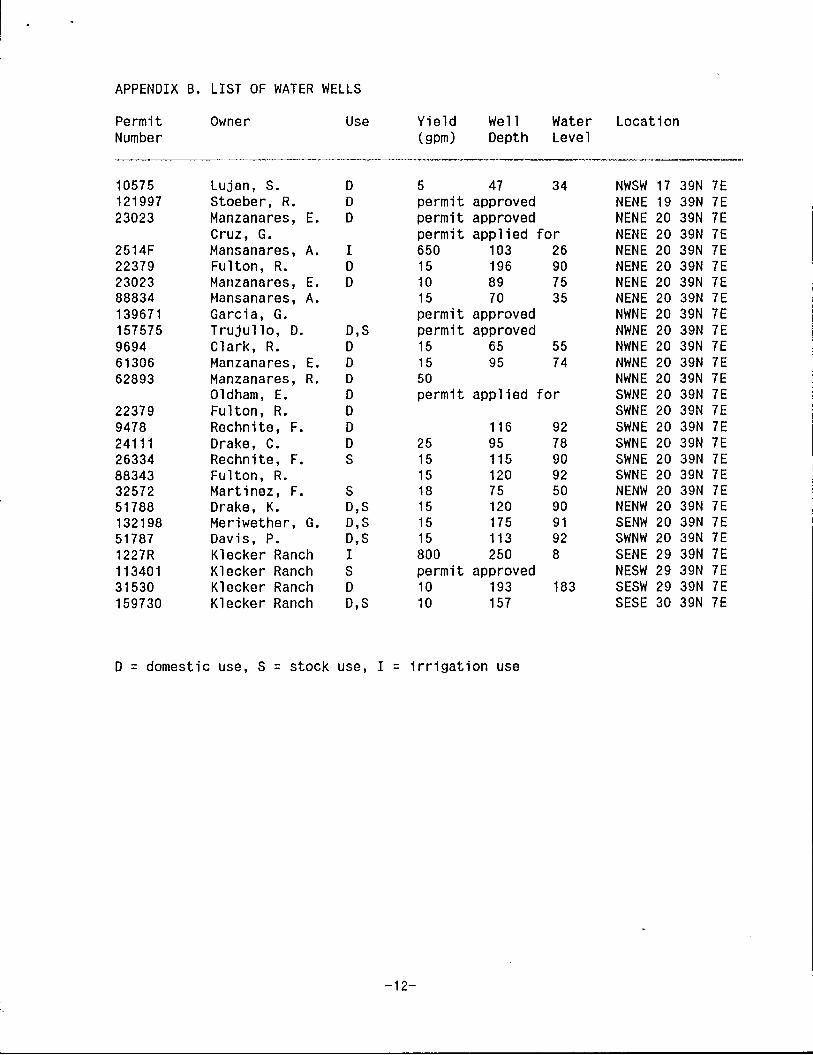
APPENDIX B. LIST OF WATER WELLS
Permit Owner Use Yield Well Water Location Number (gpm) Depth Level
10575 Lujan, S. D 5 47 34 NWSW 17 39N 7E 121997 Stoeber, R. D permit approved NENE 19 39N 7E 23023 Manzanares, E. D permit approved NENE 20 39N 7E
Cruz, G. permit applied for NENE 20 39N 7E 2514F Mansanares, A. I 650 103 26 NENE 20 39N 7E 22379 Fulton, R. D 15 196 90 NENE 20 39N 7E 23023 Manzanares, E. D 10 89 75 NENE 20 39N 7E 88834 Mansanares, A. 15 70 35 NENE 20 39N 7E 139671 Garcia, G. permit approved NWNE 20 39N 7E 157575 Trujullo, D. D,S permit approved NWNE 20 39N 7E 9694 Clark, R. D 15 65 55 NWNE 20 39N 7E 61306 Manzanares, E. D 15 95 74 NWNE 20 39N 7E 62893 Manzanares, R. D 50 NWNE 20 39N 7E
Oldham, E. D permit applied for SWNE 20 39N 7E 22379 Fulton, R. D SWNE 20 39N 7E 9478 Rechnite, F. D 116 92 SWNE 20 39N 7E 24111 Drake, C. D 25 95 78 SWNE 20 39N 7E 26334 Rechnite, F. S 15 115 90 SWNE 20 39N 7E 88343 Fulton, R. 15 120 92 SWNE 20 39N 7E 32572 Martinez, F. S 18 75 50 NENW 20 39N 7E 51788 Drake, K. D,S 15 120 90 NENW 20 39N 7E 132198 Meriwether, G. D,S 15 175 91 SENW 20 39N 7E 51787 Davis, P. D,S 15 113 92 SWNW 20 39N 7E 1227R Klecker Ranch I 800 250 8 SENE 29 39N 7E 113401 Klecker Ranch S permit approved NESW 29 39N 7E 31530 Klecker Ranch D 10 193 183 SESW 29 39N 7E 159730 Klecker Ranch D,S 10 157 SESE 30 39N 7E
D = domestic use, S = stock use, I = irrigation use
-12-

" :
' . . . , : , .', ,': :~
N
t 0 0.5 1 mile
I I I
Figure 1. Geologic map of the property (modified from Lipman, 1973). Explanation of formation symbols are as follows: Qal = Holocene alluvium; Qc = Holocene colluvium; Qf = Holocene and Pleistocene alluvial fan deposits; QTf = Pleistocene and Pliocene older fan deposits; Thb = Pliocene and Miocene Hinsdale Formation; Tcr = Oligocene Carpenter Ridge Tuff; Tfc = Oligocene Fish Canyon Tuff.
-13-
--
o 1/4 1/2 mile 1-1 ---+-I---tl
Figure 2. Test pit location map.
-14-

Figure 3 bedrock .•
Revised loc . Dotted l' at lon map f lne where or fault A concealed b • eneath
-15-
o I
Solid line whe surficial d n~ exposed in eposlts.
1/2 I
v ! r .... ~
I {
I
-r '; I : \ I I •
i- ...... ", \!, .. ... , . '1 I •...• - I
I I
•••• 1 : V) r • . . . _ .....
~~~.:t.I.l; •• ;'~;uu:.soV;l;' ..,~ ICOLORADO; ,.. ,
I
I .r \ .. ' .. ~ '. __ J'.., ... _", .,
··-~·--"--·':'·~·r;·l··· I .. , .J .. ... C· ... r
4
, I I r
.,\ I 1 .... , ...• _ .1 !
! I I j ••...•. , .,
.! ...... ·C:·,: .. "' ... -. r I I I I· . ". I I ! I ' I
1 I I . . .1...... .,
I I
.. 1 .. i I ... , . .
I , . . .. ! ... :
I ,
~ I V .... <:; .
"'Ii .
Figure 4. Map showing peak horizontal acceleration with 90 % probability of not being exceeded in 250 years (modified from Algermissen and others, 1990)
-16-
.11 II • f \\ . /
____ - ...... / ~~';~::. PROPERTY
) \ '.
I
======:;t== t.
I
\
I (
r
/
:'.791 [JI ./
I
Figure 5. Surface drainage map.
-17-
N
t 0 1/8 1/4
I I I miles
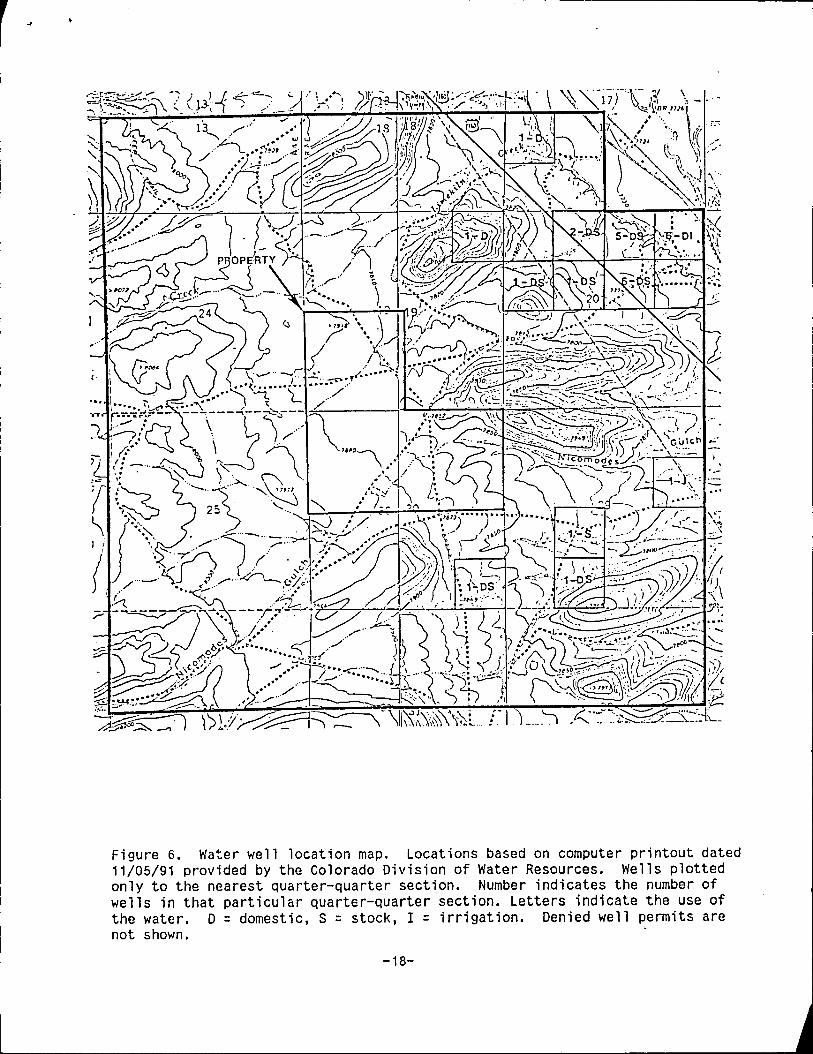
Figure 6. Water well location map. Locations based on computer printout dated 11/05/91 provided by the Colorado Division of Water Resources. Wells plotted only to the nearest quarter-quarter section. Number indicates the number of wells in that particular quarter-quarter section. Letters indicate the use of the water. D = domestic, S = stock, I = irrigation. Denied well permits are not shown.
-18-