Embed Size (px)
Citation preview
Preliminary Evaluation of the Feasibility of
Artificial Recharge in Northern Qatar
by
John Vecchioli
r-U.S. Geological Siirveyo)pen-File/Repor-b;-(76"540j

ERRATA
"Preliminary Evaluation of the Feasibility of Artificial Recharge in Nor4jrfern Qatar"
Open-File Report 76-540
p. 10 , line 7 , replace Pile with Pike.
p. 12, line 2, replace describes with described.
p. 12, line 23, replace the with to.
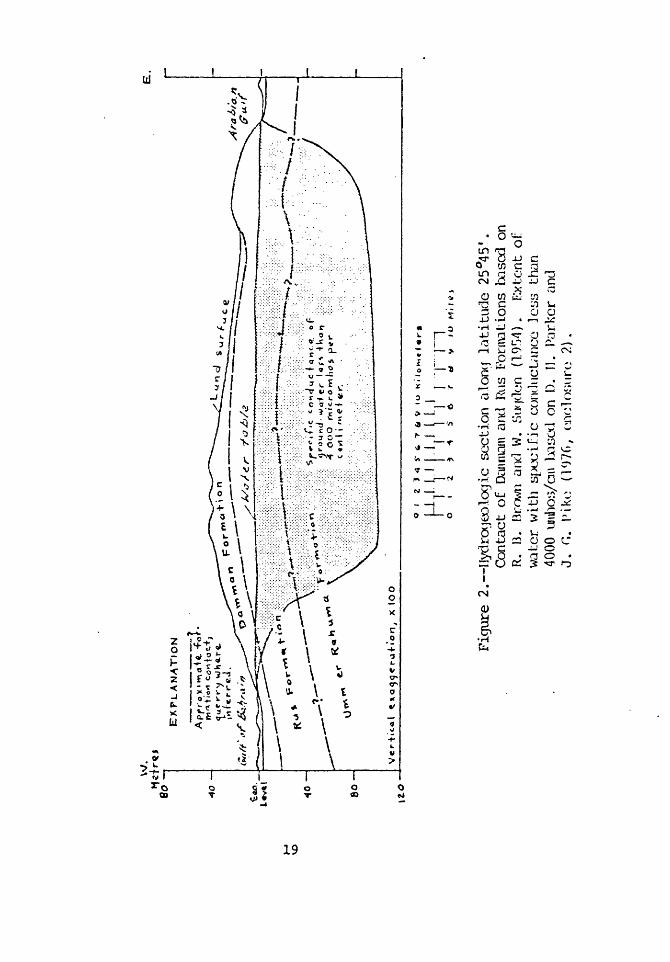
p. 19 Caption for figure 2 should read, "Hydrogeologic section along latitude 25°45'. Contact of Dammam and Rus Forma tions based on R.B. Brown and W. Sugden (1954). Extent of water with specific conductance less than 4,000*fmhos/cm based on Geotest (1976). Water table altitude based on D.H. Parker and J.G. Pike (1976, enclosure 2).
p. 30, line 3, replace quantitatively with qualitatively.
p. 41, line 14, replace Gevtest with Geotest.
p. 41, line 22, replace Pile with Pike.
p. 47, line 6, replace 32,28 with 32.28.
p. 47, line 14, replace 28490"with 28.49.
V
.'W
sj>-v<;
PRELIMINARY EVALUATION OF THE FEASIBILITY OF
ARTIFICIAL RECHARGE IN NORTHERN QATAR 77V
Open-File Report 76-540
Prepared in cooperation with the U.S. Agency for International
Development
2S3038
PRELIMINARY EVALUATION OF THE FEASIBILITY OF
ARTIFICIAL RECHARGE IN NORTHERN QATAR
by John VecchioliU.S. Geological Survey
Open-File Report 76-540
Prepared in cooperation with the U.S. Agency for International
Development
Open-File Report June 1976
CONTENTS
Page
Abbreviations and metric-English equivalents 6
Abs tract 7
Introduction
Purpose and scope 8
Acknowledgments 10
Previous work 11
Geolo gy ~ - - - - * « 2_2
Ground-water hydrology
Occurrence of ground water 17
Status of ground-water supply ' 21
Potential for artificial recharge in northern Qatar 24
Recommended scope of practicability study on
artificial recharge in northern Qatar 29
Hydrogeological appraisal 30
Total water-management plan 33
Conclusions and recommendations 39
References cited 41
ILLUSTRATIONS
Page
Figure 1. Map of Qatar In pocket
Figure 2. Hydrogeologic section along latitude
25°45 f 19
Tables
Page
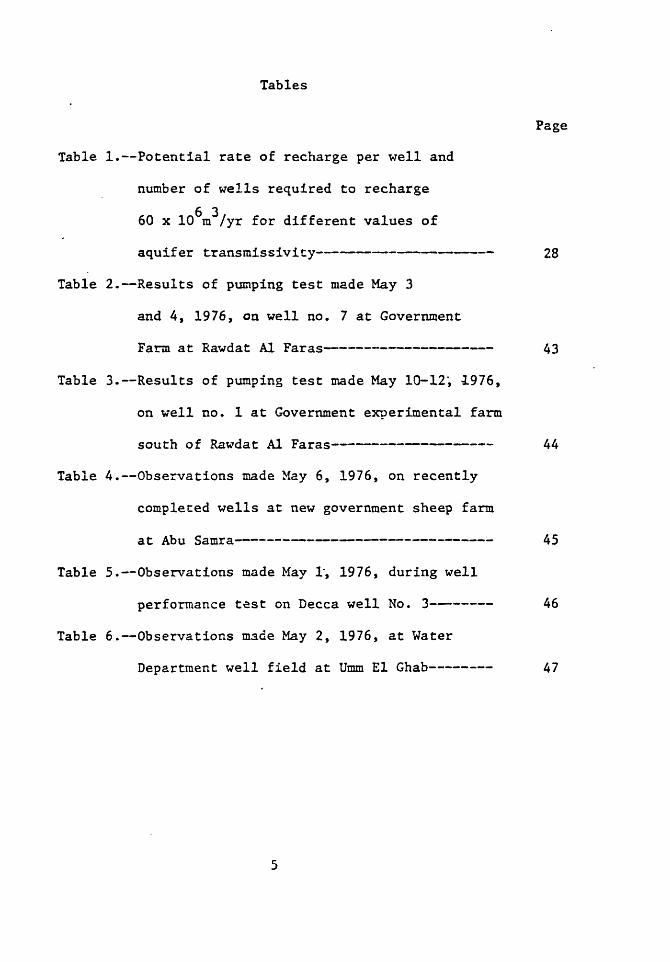
Table 1. Potential rate of recharge per well and
number of wells required to recharge
6 3 60 x 10 m /yr for different values of
aquifer transmissivity 28
Table 2. Results of pumping test made May 3
and 4, 1976, on well no. 7 at Government
Farm at Rawdat Al Faras 43
Table 3. Results of pumping test made May 10-12', 1976,
on well no. 1 at Government experimental farm
south of Rawdat Al Faras 44
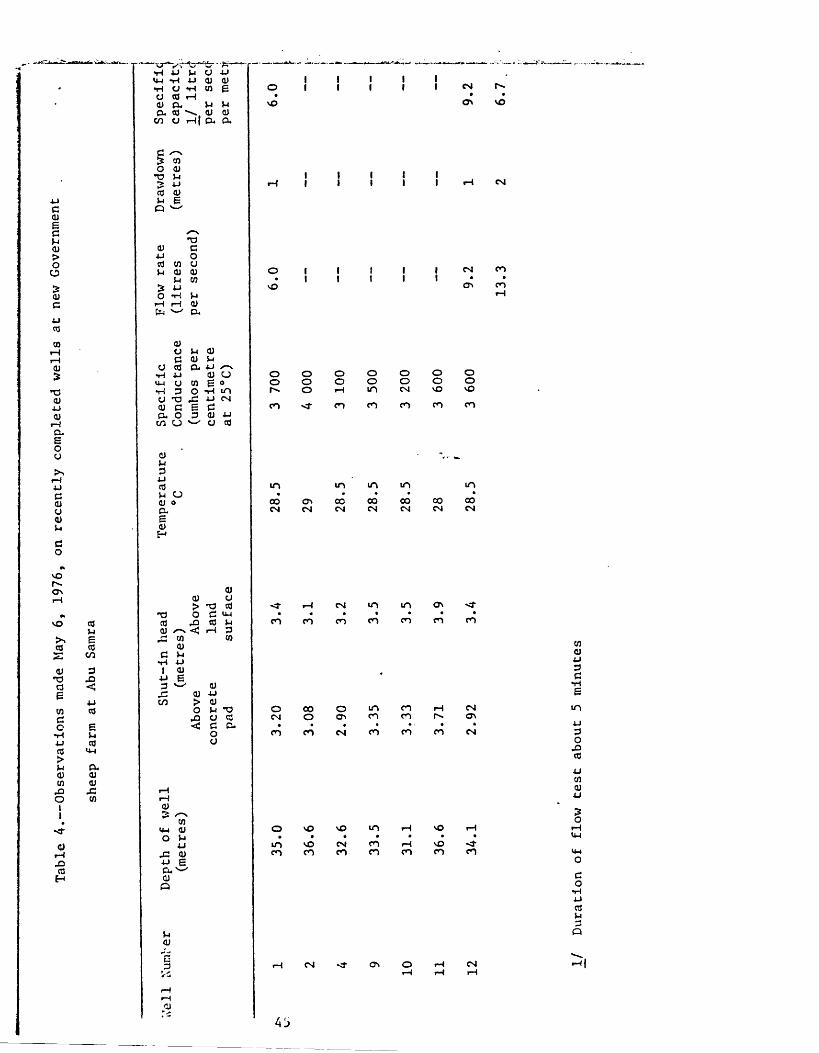
Table 4. Observations made May 6, 1976, on recently
completed wells at new government sheep farm
at Abu Samra 45
Table 5. Observations made May T, 1976, during well
performance test on Decca well No. 3 46
Table 6. Observations made May 2, 1976, at Water
Department well field at Umm El Ghab 47

ABBREVIATIONS AND METRIC-ENGLISH EQUIVALENTS
millimetre (mm)
centimetre (cm)
metre (m)
kilometre (km)
cubic metre (m )
day (d)
month (mo)
year (yr)
milligrams per litre (mg/L)
micromhos per centimetre (umhos/cm)
3 cubic metres per day (m /d)
2 metres squared per day (m /d)
cubic metres per year (m /yr)
litres per second (L/s)
litres per second per metre
' 0.03937 inch
.3937 inch
3.28 feet
.62 mile
:35.31 cubic feet or 262.4 gallons
degree Celsius (°C) (temperature)
0.00026 million gallons per day
10.764 feet squaredper day (transmissivity)
0.00026 million gallons per year
15.85 gallons per minute
4.83 gallons per minute per foot (specific capacity)
[(1.8x°C)+32] degrees Fahrenheit

PRELIMINARY EVALUATION OF THE FEASIBILITY
OF ARTIFICIAL RECHARGE IN NORTHERN QATAR
by
John Vecchioli
Abstract
Fresh ground water in northern Qatar occurs as a lens In
limestone and dolomite of Eocene age. Natural recharge from
precipitation averages 17x10 cubic metres per year whereas
current discharge averages 26.6x10 cubic metres per year.
Depletion of storage is accompanied by a deterioration in
quality due to encroachment of salty water from the Gulf and
from underlying formations. Artificial recharge with desalted
sea water to permit additional agricultural development appears
technically feasible but its practicability needs to be examined
further. A hydrogeclogical appraisal including test drilling,
geophysical logging, pumping tests, and a recharge test, coupled
with engineering analysis of direct surface storage/distribution
of desalted sea water versus aquifer storage/distribution, is
recommended.
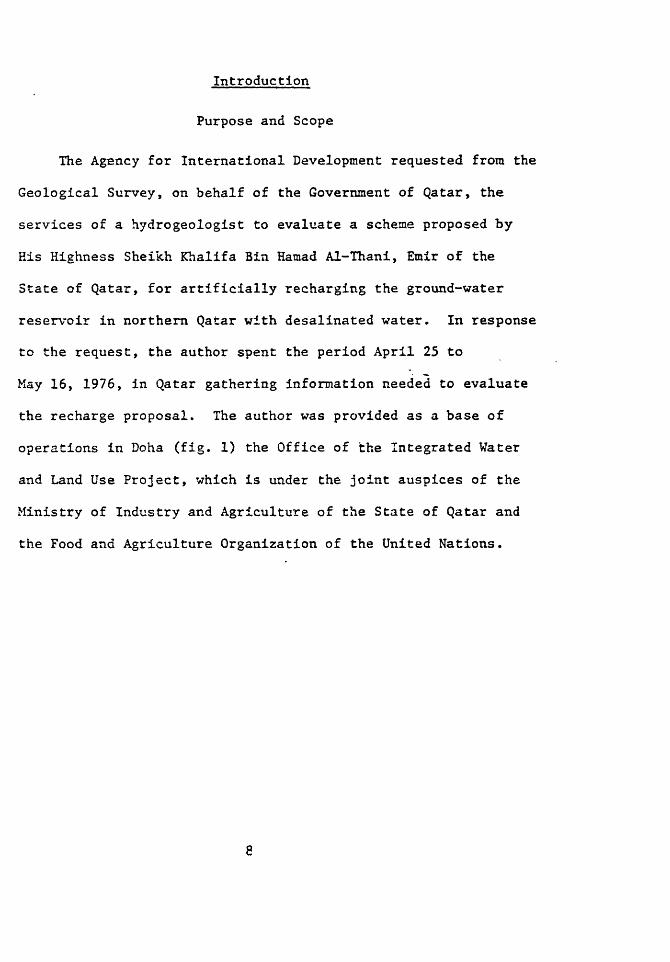
Introduction
Purpose and Scope
The Agency for International Development requested from the
Geological Survey, on behalf of the Government of Qatar, the
services of a hydrogeologist to evaluate a scheme proposed by
His Highness Sheikh Khalifa Bin Hamad Al-Thani, Emir of the
State of Qatar, for artificially recharging the ground-water
reservoir in northern Qatar with desalinated water. In response
to the request, the author spent the period April 25 to
May 16, 1976, in Qatar gathering information needed to evaluate
the recharge proposal. The author was provided as a base of
operations in Doha (fig. 1) the Office of the Integrated Water
and Land Use Project, which is under the joint auspices of the
Ministry of Industry and Agriculture of the State of Qatar and
the Food and Agriculture Organization of the United Nations.
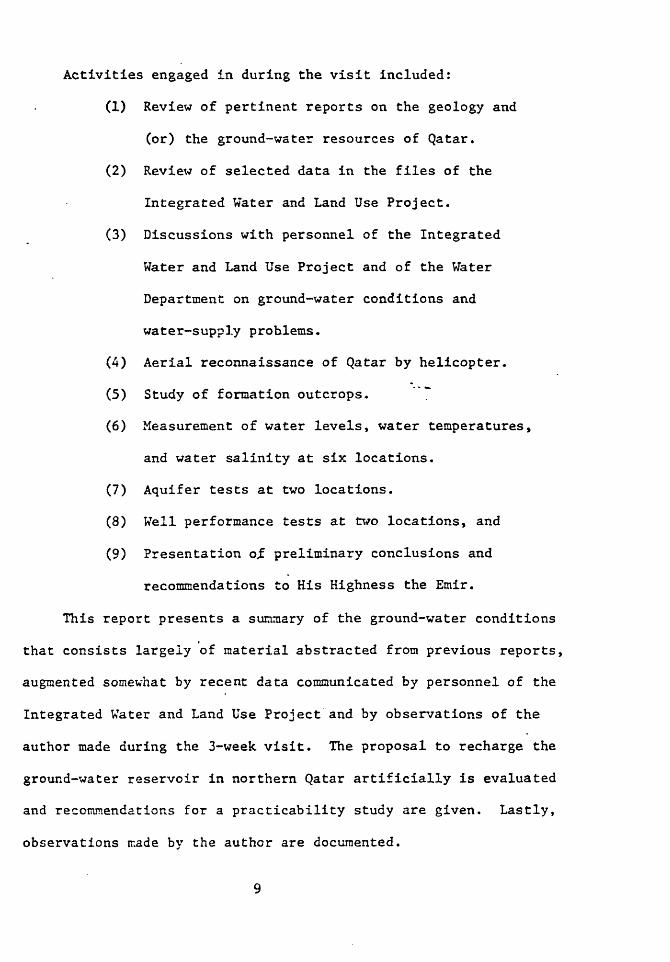
Activities engaged in during the visit included:
(1) Review of pertinent reports on the geology and
(or) the ground-water resources of Qatar.
(2) Review of selected data in the files of the
Integrated Water and Land Use Project.
(3) Discussions with personnel of the Integrated
Water and Land Use Project and of the Water
Department on ground-water conditions and
water-supply problems.
(4) Aerial reconnaissance of Qatar by helicopter.
(5) Study of formation outcrops.
(6) Measurement of water levels, water temperatures,
and water salinity at six locations.
(7) Aquifer tests at two locations.
(8) Well performance tests at two locations, and
(9) Presentation o£ preliminary conclusions and
recommendations to His Highness the Emir.
This report presents a summary of the ground-water conditions
that consists largely of material abstracted from previous reports,
augmented somewhat by recent data communicated by personnel of the
Integrated Water and Land Use Project and by observations of the
author made during the 3-week visit. The proposal to recharge the
ground-water reservoir in northern Qatar artificially is evaluated
and recommendations for a practicability study are given. Lastly,
observations made bv the author are documented.
Acknowledgments
The author wishes to thank His Highness The Emir for
providing generously facilities and personnel of the State of
Qatar. Thanks are due also to their Excellencies the Ministers
of Industry and Agriculture and of Electricity and Water for the
help given by personnel within their ministries. Particular
thanks are due to Mr. John G. Pile, Project Manager, and
Mr. Michael Farah, Project Co-Manager, of the Integrated Water
and Land Use Project for making available use of their office,
equipment, and personnel. The author is especially grateful
to Dr. David Parker, FAO Senior Kydrogeologist, and to
Mr. Ibrahim Karhash, Government Kydrologist, for the invaluable
technical assistance they provided and for the numerous kindnesses
they extended in both the field and office. Finally, the author
thanks also the Ambassador of the United States of America,
Mr. Robert P. Paganelli, and Mr. Ryan C. Crocker, Commercial
Attache of the Embassy, for the logistical support they provided.
All this help made it possible to conduct the investigation
expeditiously and with thoroughness during the time allotted.
10

Previous Work
The geology of the Qatar peninsula was mapped in detail by
Claude Cavelier, Abdullah Salatt, and Yves Heuze (1970) and
discussed by Claude Cavelier (1970). The Lexique Stratigraphique
International (1975) contains detailed descriptions of the
overall stratigraphy of Qatar by W. Sugden and H. J. Standring
and of the Tertiary System by C. Cavelier.
11

Several reports discuss the hydrogeology and ground-water
resources of Qatar. Le Grand Adsco, Ltd. (1959) describes the
results of extensive test drilling conducted in northern Qatar
particularly in reference to the quality of the water encountered.
A later study by Parsons Engineering and Construction Corp.
(1962) reviewed all available hydrogeologic information and
proposed additional studies to evaluate the ground-water
potential of Qatar with emphasis on the deeper water-bearing
zones. The Food and Agriculture Organization of the United
Nations studied the water resources of Qatar and reported their
findings in a report (1974) that evaluates aquifer characteristics,
water quality, water usage, and the water balance of the area. A
report by L. W. Hyde (1975) presents a review of the hydrogeology
of Qatar and develops guidelines for a test-well drilling
program to define the extent of the fresh ground water and for
recharge wells to infiltrate surface runoff that collects in
depressions. An evaluation of precipitation and ground-water
recharge was made by J. G. Pike, I. Harhash, and B. A. P. Gemmell
(1975). Thickness of the fresh ground-water reservoir was
delineated through an electrical resistivity survey done by
Geotest (1976). Lastly, D. H. Parker and J. G. Pike (1976)
reviewed the ground-water resources in Qatar and evaluated their
potential for development, with emphasis on a plan the recharge
the ground-v:ater reservoir in northern Qatar artificially.
12
Geology
The Qatar peninsula is underlain by a flat-lying to
gently dipping sequence of sediments that was deposited upon
gradually subsiding basement rocks. The major structure of the
peninsula is that of a broad, north-south trending anticline
that plunges to the north and south and that has a surface
expression of a broad shallow dome. "Dips on the flanks and
north plunge are on the order of one half to two metres per
kilometre. The south plunge in less clearly defined," (Sugden
and Standring, 1975, p. 18). Parallel to the west coast is the
more pronounced, narrow, elongate Dukhan anticline which is
separated from the shallow dome by a syncline. Trend of the
Dukhan anticline and the adjoining syncline are north-northwest
to north.
Topography of the peninsula varies from moderately rough
terrain in the south where deep surface depressions and steep
mesa-type hills occur to gently rolling terrain in the north
where surface depressions are shallow but more numerous. Maximum
altitudes of about 100 m occur in the southwestern part of the
country. In the north the higher altitudes are between 40 and
50 m. Just to the west of Dukhan is an area of sabkhah (salt
flats) that lies at an altitude of a few metres below sea level.
13

Geologic formations or units of the Qatar peninsula from
youngest to oldest include Quaternary sand dunes, sabkah deposits,
alluvial deposits in wadi bottoms and surface depressions, and
marine deposits; the Miocene Hofuf and Dam Formations; the Eocene
Dammam and Rus Formations; the lower Eocene and Paleocene Umm
er Radhuna Formation; the Cretaceous Aruma and Wasia Groups; and
other older formations. The total thickness of these units is
roughly 5 000 m.
14
"Only the Cretaceous age and younger rocks have been
considered and explored for production of potable water supplies
and only the Eocene age rocks have been found to contain potable
water" (FAO, 1974, p. 7 and 8). Descriptions of the Eocene and
Paleocene formations are given below in descending order.
Dan-mam Formation: The Daiamam Formation crops out over most
of the Qatar peninsula. The upper part of the Dammam consists of
doloinltic marl and limestone, known as the Abarug Member, underlain
by highly recrystallized chalky limestone of the Umm Bab Member.
The lower part of the Dammam is comprised of massive clayey
whitish to yellowish fossiliferrous limestone, called the Dukhan
Alveolina Limestone Member, underlain by the Midra Shale Member
made up of yellow-brown to greenish-gray attapulgite shale more or
less rich in carbonate, and in turn underlain by the Rujm Aid
Velates Limestone Member consisting of whitish, crystalline, hard,
fossiliferrous limestone. The Dammam Formation is about 50 m
thick of which the upper part makes up 40 m. The upper part is
well fractured and contains vugs and solution cavities.
15

Rus Formation: The Rus Formation conformably underlies the
Dammam. It consists of generally whitish to ye lowish, soft,
chalky, irregularly dolomitized limestone with thin intercalations
of greenish to brownish clay. Varying thicknesses of gypsum and
anhydrite beds within the Rus have been reported. In northern
Qatar these evaporite beds are generally absent and are thought
to have been removed by dissolution, evidence for which is given
by the circulation losses commonly experienced in the drilling of
rotary bore holes and by the abundance of collapse features.
Thickness of the Rus Formation ranges from 28 to 84 m. The Rus
contains abundant fractures, vugs, and solution cavities.
Umm er Radhuna Formation: The Umm er Radhuma Formation .
underlies the Rus conformably. It consists of a sequence more
than 300 m thick of brownish or grayish limestone that is
dolomitic and very porous in the upper part and argillaceous
in the lower part. The formation is well fractured. Some
anhydrite has been reported within the Umm er Radhuma.
16
Ground-Water Hydrology
Occurrence of Ground Water
Over most of Qatar the water table generally occurs either
in the Daimaa Formation, especially in coastal areas, or in the
underlying Rus Formation. Shallow ground water is more or less
a lens of "freshwater" floating on more dense saltier water
below. Most of the "freshwater" occurs in the Rus Formation
and in the upper part of the Umm er Radhuina Formation. Fractures,
vugs, and solution channels provide the principal means for
storage and novenent of ground vater in this limestone aquifer.
17

The maximum altitude of the water table, which marks the
upper surface of the "freshwater" lens in northern Qatar, is
less than 5 m above mean Gulf level. The configuration of the
"freshwater" lens at depth is not accurately known. Using
2 000 mg/L total dissolved solids concentration as the upper
limit of "freshwater", D. H. Parker and J. G. Fike (1976, p. 12)
estimated the maximum thickness of the freshwater lens to be
up to '120 m on the basis of a salinity-depth profile in the
center of the lens. Results of a recent electrical resistivity
survey (Geotest, 1976) defines the maximum thickness of water
having a specific conductance of less than 4 000 umhos per cm
at 25°C to be 120 m. Seawater of the Arabian Gulf has a
density of" 1.033 and ground water at depth beneath the freshwater
lens is probably of comparable salinity. Accordingly, applying
the Ghyben-Herzberg relationship, one obtains a maximum thickness
of the freshwater lens that approximates that indicated by the
salinity-depth profile and by the resistivity survey. A
hydrcgeologic section showing the vertical extent of the
"freshwater" lens in northern Qatar is given in figure 2. The
"freshwater" lens in northern Qatar is considered to be the
principal aquifer.
18
VO
W ci
80 -
i
80
EX
PL
AN
AT
ION
Apf ro
x «
»na4*.
-fo
rc
o«
1o
f s
uJh
«.re
.
Ara
4>/
a. n
V"
fo
l
* *
**'*
'
-'»V
»OV
'io
"» !
.' '! :
.«.
of
r.
»C
C Q
v\ <
j ti
I O
OO
fh
icrO
r>
i;.;
c «
KI
i f
»i e
f «
r.
t K
Q^
cjr
ru
f io
n,
XlO
O
O
l Z
)
-^
S
6
r M
V
IO
M
i I *»
Fig
ure
2. I
lydr
cKje
olog
ic s
ecti
on
alo
n(f
lati
tude 2
5°45
'. C
onta
ct o
f D
aiiu
iain
and
Rus
For
nrat
ions
bas
ed o
n R.
B.
B
row
n an
d W
. Su
<|de
n (1
9r>4
) .
Ext
ent
ol:
wat
er w
ith
spec
ific
con
duct
ance
le
ss
than
40
00 u
iuho
s/cM
bas
ed o
n D
. II
. P
arke
r an
d J.
r,.
pi
ke
(107
6,
encl
osur
e 2)
.

Shallow ground water in southern Qatar generally has a
higher total dissolved solids concentration than that in the
north, although there are small isolated areas of water containing
less than 2 000 mg/L concentration. Evaporite beds are reported
to be more prominent in central and southern Qatar (FAO, 1974,
p. 10). Apparently there has been less dissolution of these
beds there and, consequently, less secondary permeability has
developed.
In the southwestern corner of Qatar, near Abu Samra, the
Abarug Member of the Dannam Formation contains water under
sufficient confined head to rise several metres above land
surface. This water has a specific conductance ranging between
3 000 and 4 000 pmhos per cm at the new government sheep farm
but elsewhere in the southwest region the specific conductance
has been reported to range from 4 300 to 16 500 umhos per cm.
Results of deep drilling at several locations from extreme
north to extreme south Qatar indicate that there is little
likelihood of encountering freshwater at depth in formations
that in Saudi Arabia and Bahrain contain usable water. Reported
specific conductances of water from the Umin er Radhurna Formation
and the Uasia Group range from 24 000 to 100 000 jjmho/cm.
20
Status of Ground-Water Supply
All of the fresh ground water in Qatar originates from
local rainfall, except for the confined slightly brackish water
near Abu Saiara which is believed to have its source to the west
in Saudi Arabia. Mean annual rainfall at Doha for 17 years of
record was 60.4 am and the range recorded was from a minimum of
2.0 mm to a maximum of 190.7 mm (Pike and others, 1975, p. 6).
The greater part of the annual recharge results from infiltration
of runoff that collects in surface depressions, commonly from
stems of more than 10 mm precipitation. Such stcfrms have a 90
percent probability of occurring at least once each winter and a
50 percent probability of occurring twice (Pike and others, 1975,
p. 12). Recharge to ground water is estimated to be 7 to 10
percent of annual rainfall in northern Qatar and 3.5 to 5 percent
6 3in southern Qatar. Annually this amounts to 20.9 x 10 m of
6 3which 17 x 10 m occurs in northern Qatar (Parker and Pike, 1976,
p. 14).
According to D. H. Parker and J. G. Pike (1976, p. 14), for
the period 1972-75, the major part of the withdrawal from the
ground-water reservoir was for agriculture, estimated to be
6 3 f- 3 28.7 x 10 m per year, of which 26.6 x 10 in was from the
principal aquifer in the north. An additional 4.6 x 10 m per
year was extracted for dor.estic-industrial use, all from the north,
Another 3.0 x 10 m per year discharged annually to the sea r ) AT
1.6 x 10 :TI from the northern area and 1.2 x 1C m from the
southern area.
21

Based on the above estimates of recharge and discharge, the
northern area experienced a depletion from storage of about
6 316 x 10 in per year during this 4-year period. Change in storage
in the southern area was insignificant. Depletion of storage
in the north is thought to have been in progress since 1966.
Continual depletion of storage in the northern area has
caused and will continue to cause the freshwater lens there to
shrink in size both laterally and vertically. Ground-water levels
declined an average of 0.11 metre per year during 1972-75
(Parker and Pike, 1976, p. 15). The total dissolved-solids
concentration of the ground water increased an average of 22
percent during this period (Parker and Pike, 1976, p. 15).
Saltwater apparently is encroaching on the domain of the freshwater
laterally frora the sea and vertically from the deeper-lying
formations. If extractions continue, and especially if their
rate exceeds the rate of recharge, further deterioration in water
quality will result. Any increase in the rate of extraction from
the freshwater lens in the north will accelerate the depletion of
storage and aggravate the increases in salinity to the point where
much of the ground water will become unusable for either
agricultural or domestic purposes.
Predictions of the life of the freshwater lens at various
given rates of overdraft cannot be made reliably with the data
available. Little is known, except in a general way, about the
change in salinity with depth. Also, the specific yield of the
limestone aquifer has not been reliably determined. It has been
estimated to be 2 percent but recently acquired aquifer test data
(tables 2 & 3) suggest that the specific yield could be much
smaller than 2 percent. If the specific yield were only 1 percent,
6 3 the estimated 3 500 x 10 in of freshwater contained in the lens
(Parker and Pike, 1976, p. 16) would be reduced by half and,
correspondingly, the estimated life of the resource would also be
halved.
23

Potential for Artificial Recharge in Northern Qatar
Large additional extractions from the ground-water reservoir
in northern Qatar cannot be made over an extended period of time
without causing severe deterioration in the quality of ground
water. As indicated previously, current extractions already exceed
the average annual rate of replenishment. Some deterioration in
quality of ground water has already been observed, particularly in
the coastal areas in the north and east sides of the peninsula.
6 3Agriculture currently consumes annually almost 29 x 10 m of
6 3ground water, of which almost 27 x 10 m are from the ground-
water reservoir in northern Qatar (Parker and Pike, 1976, p. 7).
The Government of Qatar expects to expand agriculture considerably
and, consequently, large additional volumes of water would be
required for irrigation. Areas containing irrigable soils in
northern Qatar occur scattered in numerous small depressions
rather than in large contiguous tracts. Areas currently irrigated
are supplied with ground water from numerous wells stratigically
located near the irrigated fields. However, because the current
level of agricultural development already has resulted in mining of
ground water, and because available data are not sufficient to
determine the life of the ground-water resource reliably under
current and increased rates of mining, significant agricultural
expansion should be preceded by detailed studies of the amount and
distribution of usable ground-water in storage and by plans to
develop conjunctively other sources of water for irrigation.

Desalinated seawater is being used directly in increasingly
greater quantities for the domestic-industrial needs of Doha and
other urban centers. It has been proposed to use desalinated
seawater, either directly or indirectly, for agricultural needs
as well. Indirect use would involve artificial recharge of the
ground-water reservoir in northern Qatar with desalinated
seawater in order to maintain the rate of replenishment in
balance with the rate of extraction from numerous irrigation wells.
Benefits that could accrue from a properly designed and
executed artificial recharge scheme would include:
(1) Stabilization or retardation of the deterioration in
quality of fresh ground water resulting from
encroachment of saline water from the Gulf and (or) from
deeper-lying saltwater aquifers.
(2) Use of the freshwater aquifer as a storage reservoir to
even out fluctuations in demand, seasonally and daily, by
irrigation.
(3) Use of the freshwater aquifer as a transmission system to
distribute desalinated seawater from one or perhaps two or
three plants to numerous dispersed small tracts of
irrigable land where the needed water could be
recovered through on-site wells, and
(4) Use of the freshwater aquifer as a standby reserve of
potable water in the event of a massive failure of
distillation equipment.
25

Based on available information on the hydrogeology and
hydraulic properties of the limestone aquifer in northern Qatar,
artificial recharge of the aquifer with desalted seawater appears
technically feasible and worthy of further study. Recharge in
the interior areas of the peninsula would probably be of greater
overall benefit than recharge in coastal areas. The lengthy
coastline and the irregularity in hydraulic conductivity of the
limestone aquifer would make extremely difficult the development
of a hydraulic pressure barrier that would reliably stabilize or
retard the encroachment of salt water from the Gulf everywhere
along the coast. Moreover, less of the water injected would
be recoverable if recharge is done near the coast as compared to
inland areas. Also, recharge done near the coast would not
provide as much protection to inland wells from encroachment upward
of salty water from deeper-lying formations as would recharge
done inland. Therefore, for these reasons, as well as for the
need to avoid local water-logging of land that could result from
a rise in the water table, inland areas in which depth to the
water table is at least 10 m would be the preferred areas to
investigate as potential recharge sites.
26
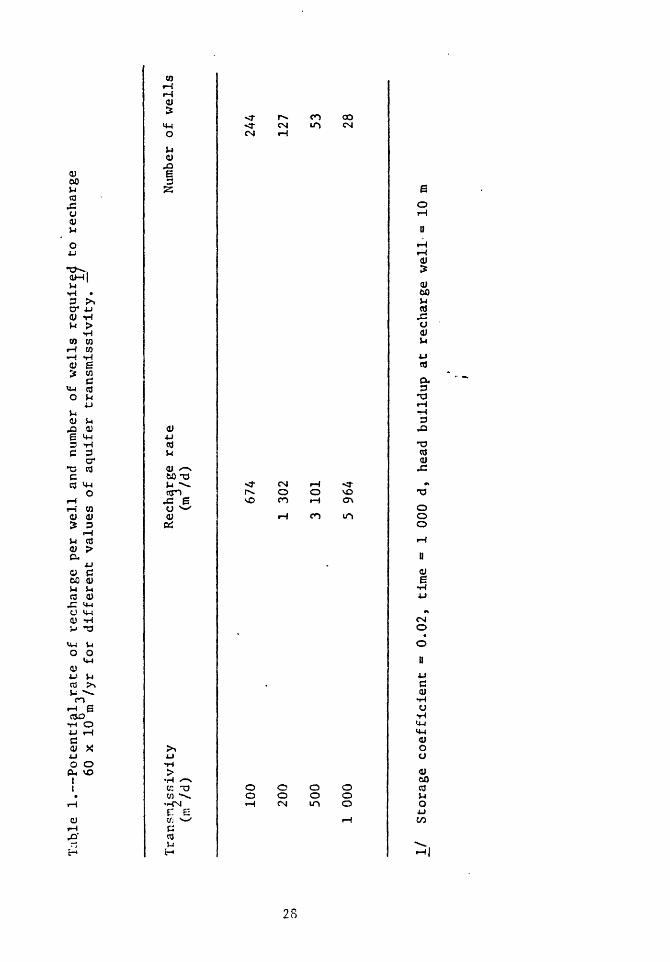
Recharge should be done through wells rather than through
surface spreading techniques in order to avoid high water losses
to evaporation. A typical recharge well would have a diameter of
about 30 cm and a depth of about 60 m. A conservative estimate
of the rate of recharge per well, based upon yield characteristics
cf existing supply wells and on aquifer-test data, most likely
3 would be on the order of 1 000 m /d, given that at least 10 m
of head buildup could be tolerated at the well site.
Higher rates could be realized where the transraissivity of
the aquifer is higher or the depth to the water table greater.
Potential recharge rates for different values of transmissivity
are given in table 1. Regional transmissivity values for most
2 areas in the north are probably in the range of 100 to 500 m /d.
The cost of a typical recharge well, based on current (1976)
costs experienced by the Water Department for supply wells,
would be at least 40 000 Riyals ($10 000).
27
K3
CO
Tab.
le 1. Potential-rate of
recharge pe
r we
ll an
d nu
mber
of wells
required
to recharge
60 x
10 m /yr
for
diff
eren
t va
lues
of
aq
uife
r transmissivity.
Tran
snis
sivi
ty
(in /d)
100
200
500
1 000
Recharge ra
te
(in /d)
674
1 302
3 101
5 964
Number of wells
244
127 53 28
I/
Stor
age
coef
fici
ent
- 0.
02,
time -
1 00
0 d, he
ad buildup
at re
char
ge well =
10m
Recommended Scope of Practicability Study on
Artificial Recharge in Northern Qatar
Implementation of artificial recharge of desalted sea6 o
water on a large scale such as the proposed 60 x 10 m /yr scheme
would require perhaps as many as 200 recharge wells, many
kilometres of transmission line, one or more pumping stations,
and construction of numerous other wells to be used for extraction
in currently undeveloped farm areas. Even though consideration
of capital costs of such a scheme may be unnecessary, the
complexity of the operations and the continuing operation and
maintenance costs indicate the need to conduct a thorough
evaluation of the practicability of large-scale recharge. The
scope of the investigation required is detailed below.

Hydrogeological Appraisal
Available information is enough to evaluate ground-water
conditions quantitatively but is not sufficient to make quantitative
predictions reliably. Detailed data on the changes in salinity
with depth and on the variations in the water-yield characteristics
of the individual rock layers are required in order to evaluate the
size of the fresh ground-water reservoir properly and to identify
the hydrogeologically best potential sites for recharge wells.
Because of the complex nature of secondary permeability developed
in the limestone aquifer, acquisition of the needed information
should be done under a carefully planned and executed test-drilling
program that is under the direction of a ground-water hydrologist
experienced in the hydrology of limestone aquifers. The testing
program should include the drilling of about 10 test holes through
the boundary between fresh and salt water to a depth where the
water has a dissolved solids content of 10 000 mg/L. Preferably
the drilling should be done by the percussion method because this
method is best for monitoring changes in salinity, water level,
water yield, and lithology as the hole is deepened, all of which are
vital for a thorough hydrogeologic appraisal. Geophysical legs,
including at least caliper, electrical resistivity, fluid conductivity,
natural gaim.a, and calibrated neutron, should be run on the completed
holes. These test holes should be distributed strategically within
approximately the central third of the peninsula that extends from
latitude 25°15' north to latitude 25°50'. Once the geophysical logs
have been obtained, the lower part of the hole should be cemented to
seal off the deeper water with dissolved solids concentration above
2 000 ng/L.
30
Upon completion of the test-drilling program, at least three
of the test-hole sites should be selected for further testing
of the aquifer's hydraulic properties. At each of the three sites
selected, piezometers should be installed, at least three per
site, near the test holes. Pumping tests of a week or more
should be made at each site to determine the transmissivity and
storage properties of the aquifer.
At least one extended recharge test should be made to
demonstrate the aquifer f s capability to accept water injected
continuously for a 1- to 3-month period. Ground .water from
existing wells could be used for the recharge test in lieu of a
desalinated water supply. It should be noted that desalinated
water might react differently with the aquifer than would water
recirculated from existing wells, although it is unlikely that
the difference, if any, would be great in the limestone aquifer.
The water should be injected into-one of the test holes on which
a pumping test was made.
31
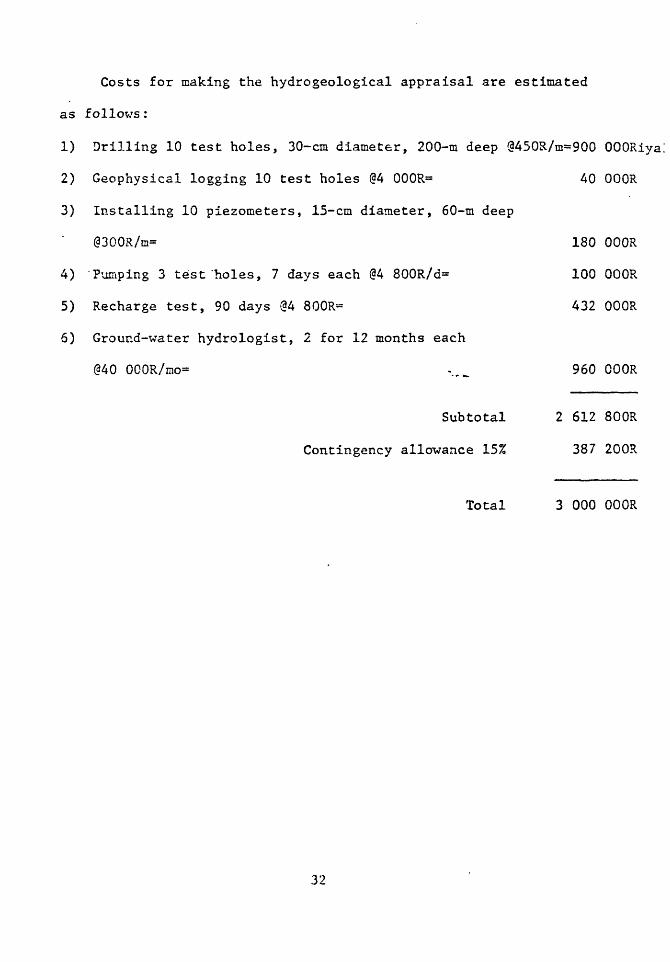
Costs for making the hydrogeological appraisal are estimated
as follows:
1) Drilling 10 test holes, 30-cm diameter, 200-m deep @450R/m=900 OOORiyals
2) Geophysical logging 10 test holes @4 OOOR= 40 OOOR
3) Installing 10 piezometers, 15-cm diameter, 60-m deep
@3COR/m= 180 OOOR
4) Pumping 3 test'holes, 7 days each @4 800R/d= 100 OOOR
5) Recharge test, 90 days (§4 800R= 432 OOOR
6) Ground-water hydrologist, 2 for 12 months each
OOOR/mo=
Subtotal
Contingency allowance 15%
Total
960 OOOR
2 612 800R
387 200R
3 000 OOOR
32
Total Water Management Plan
An integrated water-management plan that embraces
coordinated utilization of all sources of water should be
developed in conjunction with the hydrogeological appraisal.
The only likely sources of fresh water in addition to the
dwindling ground-water supply are desalted seawater and renovated
wastewater.
The potential of the desalted seavater supply is constrained
mainly by economic considerations, that is, capital costs and
operation and maintenance costs which include cost of energy,
chemicals, repairs, and manpower.
33
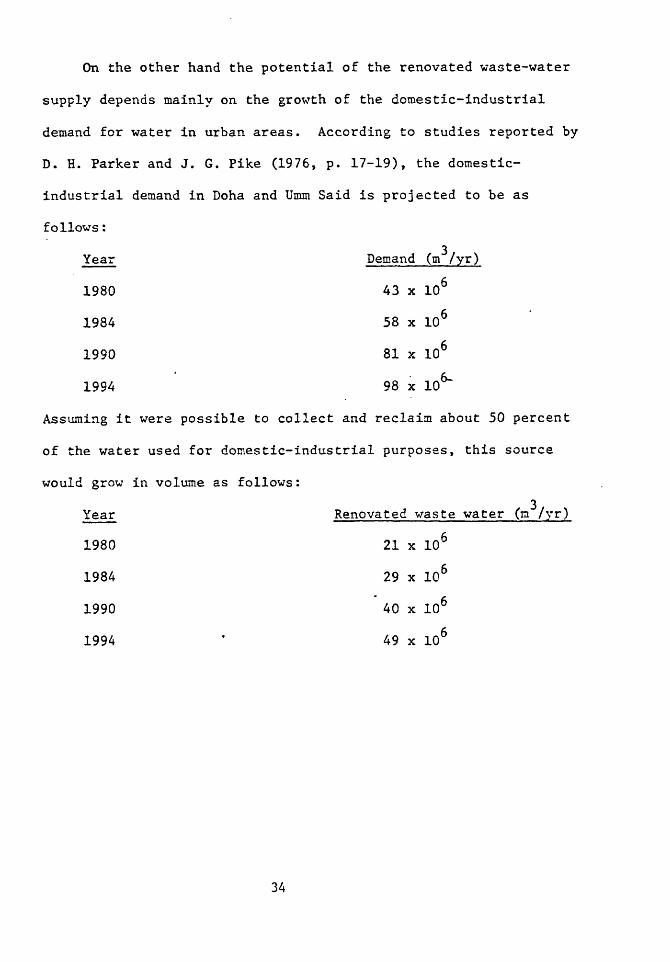
On the other hand the potential of the renovated waste-water
supply depends mainly on the growth of the domestic-industrial
demand for water in urban areas. According to studies reported by
D. H. Parker and J. G. Pike (1976, p. 17-19), the domestic-
industrial demand in Doha and Umm Said is projected to be as
follows:
3 Year Demand (m /yr)
1980 43 x 106
1984 58 x 106
1990 81 x 106
19S4 98 x 10
Assuming it were possible to collect and reclaim about 50 percent
of the water used for domestic-industrial purposes, this source
would grow in volume as follows:
Year Renovated waste water (la /yr)
1980 21 x 106
1984 29 x 106
1990 40 x 106
1994 ' 49 x 106
34

The amount of renovated wastewater that could be made
available by 1984 to help support agricultural development
6 3equals the 29 x 10 m /yr of ground water currently consumed for
agriculture. By 1994, 1.7 times the currently consumed amount
would be available. The cost of reclaiming water from sewage is
generally considered to be less than the cost of desalting sea
water. Treated sewage would be suitable for irrigation of many
types of crops, and, in fact, because of the nutrients contained
in treated sewage, its use could be preferred to other sources.
Therefore, a thorough engineering analysis of the practicality of
integrating renovated waste water into a total water-management
plan should be made. Highly treated wastewater could be used
directly for irrigation or used as part of the supply to be
artificially recharged to the ground-water reservoir.
Another aspect of the total water-management plan that should
be examined is the phasing out of the pumpage from well fields in
northern Qatar that is used, blended with distilled water, to
supply the domestic-industrial needs of Doha. Those well fields
could then be utilized, in part at least, as artificial recharge
sites.
35
An alternate plan, that might be less costly overall than
6 3implementing artificial recharge at a scale of 60 x 10 m /yr
would be that of supplying either entirely or partly the needs
of larger farms and closely clustered smaller farms directly
with desalted sea water from one or two distillation plants.
Areal irrigation demand varies little seasonally in Qatar, but
varies greatly diurnally and from day to day. A distillation
plant or a sewage treatment plant would operate under comparatively
steady daily output. Therefore, storage is required to even out
the fluctuation demands of irrigation.

The ground-water reservoir could be used as the storage
facility by recharging it with desalinated sea water at times
when direct use of irrigation was less than the supply capacity
of the system. Wells used for recharge could be used also for
extraction of the injected desalinated water at times when
irrigation demand exceeded the supply capacity of the surface
distribution system. For example, water is applied to the farmed fields
in Qatar only during daylight hours, or approximately half a day.
Hence, the rate of application needs to be twice the actual daily
crop requirement. If the desalination plant(s) and distribution
system were sized according to the average daily w"ater requirement
and operated continuously, the ground-water reservoir could be
recharged with desalinated water delivered during the night.
During the day, the desalinated water that was injected at night
would be recovered and used to supplement the rate at which the
desalinated water from the distribution system was being delivered
directly to the irrigated fields. Various modifications of this
concept of dual use of wells could be developed to suit specific
situations so as to make optimum use of existing extraction wells.
An engineering cost analysis of various combinations of surface
storage/distribution and aquifer storage/distribution through
artificial recharge should be made. This analysis would, of
course, be dependent on information acquired through the
hydro^eolcgical appraisal.
37
Lastly, the water-management plan should include
recommendations for the organizational structure of a single
governmental agency to administer the water plan and regulate
use of all waters for all purposes. Jurisdiction by a single
agency would facilitate the integrated management of all water
sources for the optimum development of Qatar.
Costs of developing the total water-management plan would
be in addition to the cost of the hydrogeologic appraisal. The
cost of developing the plan cannot be estimated reliably by the
author in that details of the scope of the effort involved are
outside of the author's expertise. It is suggested that
proposals for development of an integrated water plan, including
the hydrogeological appraisal, be solicited from large inter
national water-resources engineering firms. These firms should
have the capacity to provide all of the technical expertise and
equipment required, through their own company or through
association with other firms, so as to expedite the work and to
assure proper coordination of the various facets involved.
38
Conclusions and Recommendations
1. Large additional extractions from the ground-water reservoir
most likely cannot be nade over an extended period of time
without causing severe deterioration in the quality of ground
water. Current extractions exceed rate of replenishment.
Some deterioration in quality has already been observed. The
life of the freshwater resource cannot be accurately predicted
on the basis of existing data.
2. Expansion of agriculture will require large additional
supplies of freshwater. The only likely sources of additional
large supply over long periods of time are desalted seawater
and renovated waste vater.
3. It appears technically possible to recharge the aquifer in
northern Qatar artificially with desalinated seawater. The
benefits of artificial recharge would include a stabilization
or retardation of the deterioration in ground-water quality,
aquifer storage and transmission of desalinated seawater, and
maintenance of a standby supply of potable water.
4. The practicability of artificial recharge should be studied
further through a hydrogeological appraisal that includes
test drilling, geophysical logging, pumping tests, and a
recharge test. Cost of this work is estimated to be
3 000 000 Rivals.
39

5. The hydrogeological appraisal should be accompanied by the
development of an integrated water-management plan. The
plan should evaluate the practicability of using enovated
waste water to meet part of the agricultural demand. It
should also analyze costs of various combinations of direct
surface storage/distribution of desalinated water and aquifer
storage/distribution through artificial recharge. The plan
should recommend the administrative structure required to
manage the plan and regulate water use.
6. Proposals for development of the water plan, including the
hydrogeological appraisal, should be solicited"from large
international water-resources engineering firms who have the
capacity to provide all of the technical expertise and
equipment required.
40

References Cited
Browne, R. V. and Sugden, W., 1954, Structure contour map of the
Qatar Peninsula, Alveolina surface, 8th edition: Qatar
Petroleum Company.
Cavelier, Claude, 1970, Geological description of the Qatar
Peninsula: Qatar Department of Petroleum Affairs, 39 p.
__________, 1975, Le Tertiaire du Qatar en affleureraent, in,
Lexique stratigraphique international, Volume III Asie,
Fascicule 10b3 Qatar Peninsula: Paris, Centre National de la
Recherche Scientifique, p. 89-120.
Cavelier, Claude, Salatt, Abdullah, and Hueze, Yves, 1970, Qatar
Geological map: Qatar Department of Petroleum Affairs, 3
sheets, scale 1:100 000.
Gevtest, 1976, Integrated water and land use project in Qatar,
Geophysical Survey 1975: Zollikofen/Bern, Final Rept 75040,
29 p., 3 appendices, 9 plates.
Hyde, L. W., 1975, Hydrogeological evaluation and test-drilling
proposal: Montgomery, Alabama, 105 p.
Le Grand Adsco, Ltd., 1959, A survey of the fresh water resources
of northern Qatar; Part I: Southhall Middlesex, 33 p.,
appendices.
Parker, D. H., and Pile, J. G., 1976, Groundwater resources in
Qatar and their potential for development: United Nations
Food and Agriculture Organization, Integrated water and land
use project Tech. Note no. 34, 32 p.
41

Parsons Engineering and Construction Corp., 1962, Qatar
ground-water survey: Los Angeles, 38 p.
Pike, J. G., Harhash, Ibrahim, and Gemmel, B. A. P., 1975,
Rainfall and groundwater recharge over Qatar: United Nations
Food and Agriculture Organization, Integrated water and land
use project Tech. Note No. 24., 22 p.
Sugden, W., and Standring, A. J., 1975, Stratigraphic Lexicon:
Qatar Peninsula, in, Lexique stratigraphique international,
Volume II Asie, Fascicule 10b3 Qatar Peninsula: Paris,
Centre National de la Recherche Scientifique, p. 7-88.
United Nations Food and Agriculture Organization, 1974,
Hydroagricultural resources survey, Qatar Water resources
and use: Rome, Tech. Rept. 2, 131 p.
42

Table 2. Results of Pumping Test made May 3 and 4, 1976, on
Well No. 7 at Government Farm at Rawdat Al Faras
Length of test: 1 410 min
Discharge rate: 1 100 m /d (approximate)
Water temperature: 29°C
Specific Conductance: 2 100-2 400 pihos/cm at 25°C
Observation wells:
a) ' Test well located 14.6 m southwest of well No. 7
b) Recharge well No. 2 located 210 m north of well No. 7
Method of Analyses: log-log time-drawdown
Transmissivity:
2a) Test well: 520 m /d
b) Recharge well No. 2: 2 950 m /d
Storage Coefficient:
a) Test well: 0.0017
b) Recharge well No. 2: 0.0014
Remarks: Some interference from other pumping
wells. Measurement of discharge poor
43

Table 3. Results of Pumping Test made May 10-12, 1976, on Well
No. 1 at Government Experimental Farm south of Rawdat
Al Faras
Length of test: 2 380 inin
3Discharge rate: 1 187 m /d (metered)
Water Temperature: 28°
Specific Conductance: 700-730 umhos/cm
Observation wells:
a) Pumping well .(No. 1)
b) Well No. 2 located 187.6 m south of well No. 1
c) Well No. 4 located 161.7 m north of well No. 1
Method of analysis:
a) Log-log time-drawdown
Transmissivity:
a) Well No. 2: 350 m2/d
b) Well No. 4: 320 m2 /d
Storage Coefficient:
a) Well No. 2: 0.003
b) Well No. 4: 0.008
Tabl
e A.
Obs
erva
tion
s ma
de
sheep
Well
Ku
mVer
De
pth
of we
ll
(met
res)
: 1
35.0
2 36
.6
4 32.6
9 33.5
10
31.1
11
36.6
12
34.1
farm a
t Ab
u
May
6, 19
76,
Samra
Shut-in
head
(met
res)
Abov
e Ab
ove
conc
rete
pad
3.20
3.08
2.90
3.35
3.33
3.71
2.92
land
surface
3.4
3.1
3.2
3.5
3.5
3.9
3.4
on recently completed
well
s at
new
Government
.
Temperature
°C 28.5
29 28.5
28.5
28.5
28t
28.5
Specific
Cond
ucta
nce
(umh
os per
centimetre
at 25°C)
3 700
4 000
3 10
0
3 500
3 20
0
3 600
3 60
0
Flow ra
te
Drawdown
Spec
ific
(l
itre
s (m
etre
s)
capa
city
pe
r se
cond
) JL
/ li
tre
per
sect
per
meti
j i
6.0
1 6.
0
^ _
__ 9.2
1 9.
2 !
13.3
6.7
I/
Dura
tion
of
fl
ow te
st ab
out
5 minutes

Table 5. Observation made May 1, 1976, during well performance
test on Decca Well No. 3
Drilled depth of well:
Depth at time of test:
Static water level:
Pumping rate:
Drawdown after 37.5 minutes:
Specific capacity:
Temperature:
Specific Conductance:
47.6 m
42.6 m
29.15 m below land surface
3.0 L/s
6.71 m
0.44 (L/s)/m
30°C
3 000 umhos/cra
46
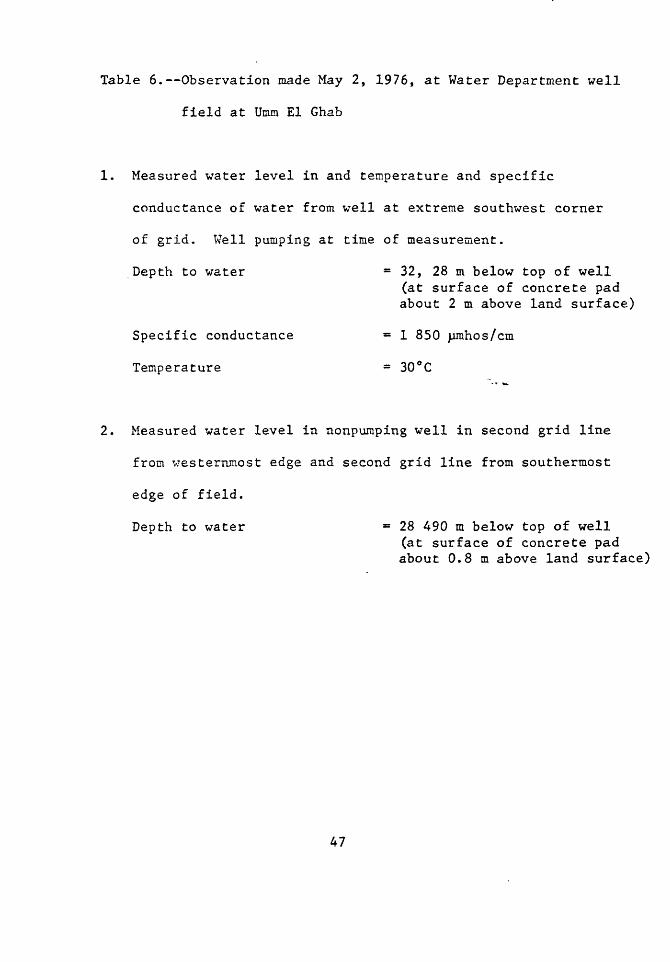
Table 6. Observation made May 2, 1976, at Water Department well
field at Umm El Ghab
1. Measured water level in and temperature and specific
conductance of water from well at extreme southwest corner
of grid. Well pumping at time of measurement.
Depth to water = 32, 28 m below top of well(at surface of concrete pad about 2 m above land surface)
Specific conductance = 1 850 umhos/cm
Temperature = 30°C
2. Measured water level in nonpumping well in second grid line
from westernmost edge and second grid line from southermost
edge of field.
Depth to water = 28 490 m below top of well(at surface of concrete pad about 0.8 m above land surface)
47