Embed Size (px)
Citation preview

1
LBNL-61303
Preliminary evaluation of the energy saving potentials of exterior operable window shading systems for residential buildings in California
climates Evaluation Report
Submitted to the Art Rosenfeld, Bill Pennington, Ann Petersen, and Chris Scruton
California Energy Commission 1516 Ninth Street
Sacramento CA 95814
Prepared by Joe Huang, Joshua Apte, and Christian Kohler
Building Technologies Department Environmental Energy Technologies Division
Lawrence Berkeley National Laboratory University of California
Berkeley CA 94720
December 23, 2006
2
Background
Unwanted window solar heat gain during the summer is a major source of cooling energy use in California residences, particularly in the mild Mediterranean climates within which dwell most of the state's population. There are numerous ways to control this window solar heat gain, including fixed "hardware" solutions, e.g., window location, glazing characteristics, overhangs, and shade screens, and temporary "software" solutions, e.g., drapes, blinds, or shutters, installed either on the inside or outside of the house. Historically, Title-24 has recognized only the "hardware" solutions, and ignored the "software" solutions as unreliable, unverifiable, or anathema to the California lifestyle. There are good reasons for skepticism. In the early 90's, Title-24 did give partial credit for movable window shades, which was later withdrawn because of abuse on the part of builders (shades were installed for the compliance inspection, and later removed), and uncertainty whether they would be used by the occupants.
Despite the above institutional concerns, the potential energy savings from the use of exterior blinds and shutters are clearly large. For a CIEE project on "Alternatives to Compressive Cooling" six years ago, the PI found the single most effective strategy for reducing peak indoor temperatures were exterior window shutters that blocked all daytime window solar heat gain (Huang 1999). While this strategy was discarded as unacceptable in California, it should be noted that exterior operable shading devices, either traditional wooden shutters or newer roller blinds, are extremely common in European countries such as Germany, Italy, Portugal, or Spain. In dismissing this potential energy strategy a priori, the Commission is in danger of overlooking a proven and inexpensive strategy that is being used in millions of houses in other parts of the world with similar climates.
Objectives The objective of this study is to make a preliminary assessment of the energy savings and cost-benefit of exterior operable window shading systems combining DOE-2 computer simulations, and a limited market survey of availability and cost. Some queries have been made on an "as available" basis with vendors and store staff on user acceptance and operations, but any systematic market assessment or user survey is beyond the scope of at least this initial phase of the project.
The aim of the DOE-2 simulations is to quantify the potential savings of these exterior operable window shading systems (exterior roller blinds and Mediterranean shutters) under various operating strategies. The aim of the limited market survey is to determine what devices are currently available in the state, as well as in other countries. The latter task is important because this is very clearly a developing or immature market in California, so that availability and costs in other locations may give a better indication of likely mature market situations. Once these costs are obtained, a cost-benefit analysis will be done to inform the Commission whether and to what degree such products and strategies should be promoted.
Preliminary survey of exterior operable window shading systems
Define exterior operable window shading systems for study. Our primary contact on the characteristics and costs of movable shading systems has been Mr. Helmut Blum, president of European Rolling Shutters, a San Jose company specializing in shutters, awnings, and solar screens imported from Germany. In addition, we have also contacted Prof. Eduardo Maldanado,

3
a colleague in Portugal about the characteristics and costs of exterior window shading systems that are very common in that country. However, we wish to emphasize that the calculated energy savings potentials in this study are generic, in the sense that any product with similar solar and thermal properties, and operated in the similar fashion as what was assumed in this study should produce similar results in terms of their energy performance.
DOE-2 simulations
The aim of the DOE-2 simulations is to quantify the savings of the exterior operable window shading systems under several likely operating strategies, utilizing an existing set of prototypical Title-24 residential buildings available from previous LBNL projects (see Huang 2006).
Building conditions for new and old vintage California houses
The building models used in the DOE-2 simulations are prototypical buildings of average size, and non-directional orientation, i.e., the amounts of wall, roof, and windows in each orientation has been kept the same. Although such are hardly typical buildings, they do represent average conditions among the thousands of buildings that each prototype is supposed to represent.
The average floor area for the buildings is assumed to be 1800 ft2 for both vintages of houses. The thermal conditions for the New vintage houses are taken from Package D in the 2005 Title-24 Residential Building Energy Standard (CEC 2005). The thermal conditions for the Old vintage houses are taken from a 1992 modeling study of evaporative coolers in California houses (Huang, Hanford, and Wu 1992). The thermal conditions of both vintages are summarized in Table 1, although the window Solar Heat Gain Coefficient (SHGC) in locations with no Title-24 SHGC requirements have been modified to make them more representative of actual window assemblies that meet the U-factor requirements. The dark-colored and light-colored shading devices are modeled with solar absorptivities of 0.90 and 0.30, respectively, and assumed to add a layer with a resistance of 0.36 Btu/ft2·ºF·hr (0.63 W/m2·º·C·hr), as well as two additional air films, to the window assembly. Table 2 gives the resultant U-factor and SHGC for all combinations of window and shading devices.
Operating conditions for exterior operable window shading systems.
The energy performance of exterior shading devices varies considerably great deal depending on how they are operated. In this document, we present simulations based on two control strategies aimed at bracketing the likely savings from the use of exterior blinds or shutters.
• Energy Optimized, where an automatic controller draws the shading system whenever non-negligible cooling loads are present1, regardless of home occupancy.
• View Optimized, where shades are automatically controlled (as above) only while the home is not occupied. To maximize view, shading is not used while the home is occupied.2
1 We experimented with several possible cooling load threshold points as triggers for deploying the shading system. We ultimately conducted the DOE-2 simulations such that 4 consecutive days with greater than 5 CDD (base = 65 °F) each trigger deployment of the shading system. A less stringent criterion for sensing the need for shading was considered, but rejected when it was found to increase heating and overall TDV energy demand due to shoulder season effects.

4
Table 1. Modeled envelope conditions for houses in the 16 Calif. Climate Zones
R-values Windows Infiltration
Location Ceiling Wall1 Found
ation Area2 (% flr)
DOE-2 Code
(Table 2)
Base Case
U-factor3
Base Case
SHGC ELF5
Old Houses (pre-Title 24) CTZ 1 through 13 10 0 0 15 100 1.10 0.78 0.007 CTZ 14 through 16 19 0 0 15 100 1.10 0.78 0.007 2005 Title 24 CTZ 1 (Arcata) 38 21 5 - 2 ft. 14 200 0.57 0.684 0.005 CTZ 2 (Santa Rosa) 30 13 5 - 2 ft. 16 300 0.57 0.40 0.005 CTZ 3 (Oakland) 30 13 5 - 2 ft. 14 400 0.67 0.704 0.005 CTZ 4 (Sunnyvale) 30 13 5 - 2 ft. 14 500 0.67 0.40 0.005 CTZ 5 (Santa Maria) 30 13 5 - 2 ft. 16 400 0.67 0.704 0.005 CTZ 6 (Long Beach) 30 13 5 - 2 ft. 14 400 0.67 0.704 0.005 CTZ 7 (San Diego) 30 13 5 - 2 ft. 14 500 0.67 0.40 0.005 CTZ 8 (El Toro) 30 13 5 - 2 ft. 14 500 0.67 0.40 0.005 CTZ 9 (Pasadena) 30 13 5 - 2 ft. 14 500 0.67 0.40 0.005 CTZ 10 (Riverside) 30 13 5 - 2 ft. 16 300 0.57 0.40 0.005 CTZ 11 (Red Bluff) 38 19 5 - 2 ft. 16 300 0.57 0.40 0.005 CTZ 12 (Sacramento) 38 19 5 - 2 ft. 16 300 0.57 0.40 0.005 CTZ 13 (Fresno) 38 19 5 - 2 ft. 16 300 0.57 0.40 0.005 CTZ 14 (China Lake) 38 21 5 - 2 ft. 14 300 0.57 0.40 0.005 CTZ 15 (El Centro) 38 21 5 - 2 ft. 16 300 0.57 0.40 0.005 CTZ 16 (Mt. Shasta) 38 21 5 - 2 ft. 14 600 0.55 0.684 0.005
1. Walls up to R-19 are modeled with 2x4 16 “ O.C. construction, above R-19 with 2x6 24” O.C. construction. 2. Windows are modeled as equal numbers of 3' x 4' windows in each orientation; window areas based on Package D of 2005
Title-24 Residential Standards. 3. U-1.10 windows are modeled as single-pane, others as double-pane 4. Title-24 has no SHGC requirement for this location; SHGC based on generic product meeting U-value requirements 5. ELF = Effective-Leakage-Fraction used to model the air-tightness of the house (Sherman and Grimsrud 1980); 0.007
corresponds to loose, 0.0056 to moderate, and 0.003 to tight leakage.
Table 2. Modeled window conditions with and without exterior shading
2 We assumed the home is unoccupied during the 9 AM – 5 PM workday, with the home occupied on weekends. This results in shading being deployed weekdays from 9-5, with no shading on weekends.
Window type Base Case w/Dk. Shading w/Lt. Shading
Generic description DOE-2 code
U-value SHGC U-
value SHGC U-value SHGC
Single-pane clear alum frame 100 1.103 0.783 0.646 0.217 0.646 0.110 Double-pane clear alum w/th. break 200 0.578 0.676 0.438 0.149 0.438 0.073 Double-pane Low-E alum w/th. break 300 0.576 0.392 0.437 0.148 0.437 0.073 Double-pane clear alum frame 400 0.676 0.701 0.536 0.172 0.536 0.097 Double-pane Low-E alum frame 500 0.673 0.409 0.536 0.170 0.536 0.096 Double-pane clear wood frame 600 0.557 0.677 0.430 0.146 0.430 0.072

5
Time-Dependent Valuation of Energy Savings
In 2003 the Commission developed TDV files that give the hour-by-hour value of electricity and fuel for the 16 California Climate Zones. For each DOE-2 run, we used these files to determine the total TDV Energy consumption in kBtu (for heating and cooling). We then used the CEC residential cost of $0.14/TDV kBtu to estimate the energy cost savings associated with each shading strategy.
Building Energy Simulation: Results and Discussion
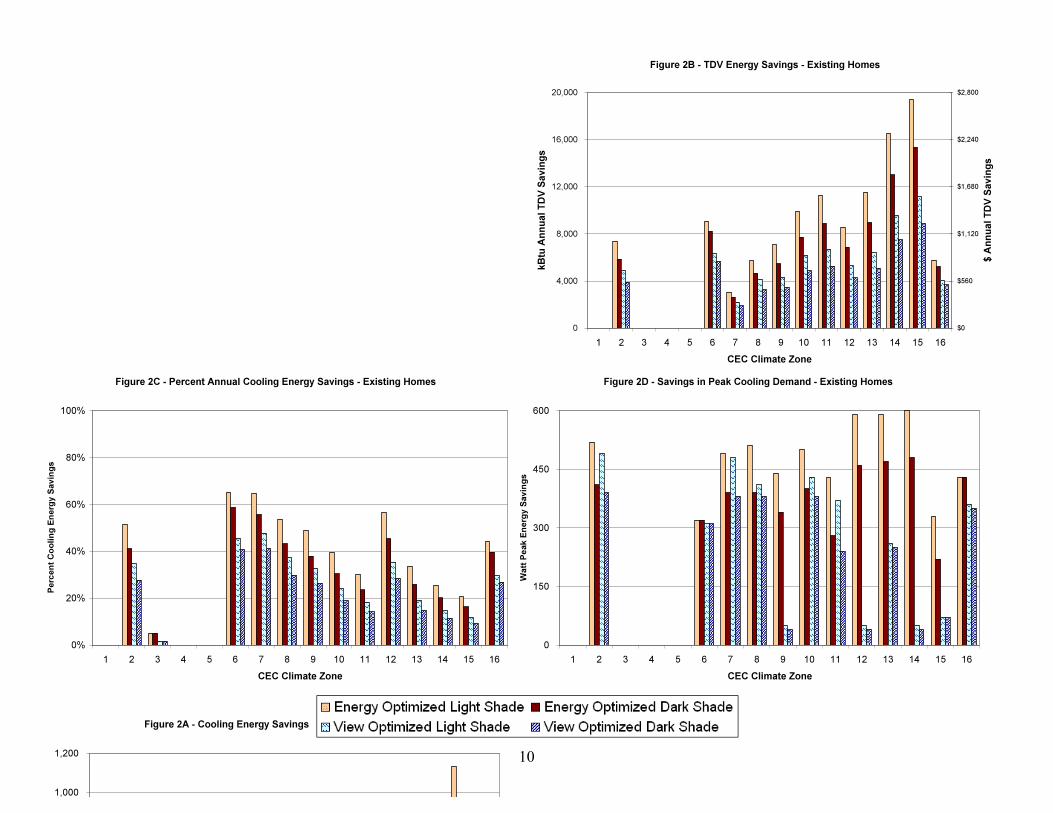
Simulation results are presented in Tables 4-7, and in graphical form in Figures 1 and 2. Before discussing the results in detail, two broad trends merit pointing out:
- The Energy Optimized scenario resulted in significantly (30% - 90%) higher energy savings than the View Optimized scenario. This highlights the importance of control strategy assumptions in any assessment of shading systems.
- The light-colored shade (solar absorbtivity = 0.3) resulted in energy savings roughly 10-25% than the dark-colored shade (absorbtivity = 0.9).
Simulation results for homes complying with the 2004 Title 24 standards are presented in Figures 1a-1d and in the upper half of Tables 4-7. As is evident in Figure 1a, no energy savings from shading systems were found3 in CTZ 1 (Arcata), 3 (Oakland), 4 (Sunnyvale), and 5 (Santa Maria. In the other 12 climate zones, annual cooling energy consumption reductions of 25% - 65% were achieved in the Energy Optimized scenario (Table 4). Using the Commission’s Time Dependent Valuation (TDV) methodology, nearly identical percentage cooling savings were observed (Table 5). Under the View Optimized scenario, cooling energy savings ranged from 15 – 50% (Table 6). Peak cooling energy demand was reduced by 0.3 – 0.55 kW (Figure 1d) using a light-colored shading material, and by slightly less with the dark-colored shading material. The View Optimized scenario resulted in very similar peak cooling energy demand savings in climate zones such as CTZ02 and CTZ07, while in other climate zones peak cooling demand savings were substantially lower in the View Optimized scenario. Simulation results for Pre-Title 24 homes are presented in Figures 2a-2d and in the lower half of Tables 4-7. In general, we found that shading systems resulted in higher energy savings in these homes than they did in the Title 24 homes. As can be seen in Figure 2c, light colored shades resulted in a 20 – 65% reduction in annual cooling energy consumption under the Energy Optimized scenario, and a 20 – 45% reduction in the View Optimized scenario. Light colored shades reduced peak cooling demand reduced by 0.35 - 0.6 kW in the Energy Optimized scenario (Figure 2d), and by 0.05 – 0.5 kW in the View Optimized scenario. 3 By using an alternate shading procedure (described in footnote 2), we were able to simulate small cooling savings from operable shading systems (on the order of 10 kWh / yr); however, these savings came at the cost of increased heating consumption, with the result that overall annual energy consumption increased.

6
Economics of User-Operable Shading Systems
In this section, we present a simple economic analysis of window shading systems. Based on price estimates provided by Mr. Helmut Blum of European Rolling Shutters, Inc. (San Jose, CA), we estimated a range of costs for operable shading systems. Based on quoted prices (including labor) of $25/ft2 for aluminum shading and $500 per window for motors, tracks and controls, we estimated a complete system cost of $15,625 for the modeled DOE-2 home, which has 325 ft2 of windows (Table 3). In addition to this complete system cost, we considered an alternate window shading scenario, where only windows on the south and west orientations are shaded. We assumed that this South and West scenario would have roughly half the cost of the Complete System scenario - $8,050 (Table 3). This scenario presumably would be more cost effective than the Complete System scenario, since solar gains tend to be highest for south- and west-oriented windows.
Table 3 – Estimated cost of complete shading system
Estimated Retail Costs for System Components Motors and Controls, per Window $500 Aluminum Shading, per sq. ft $25
Scenario # of Windows
Shaded window
area 2006 Cost Estimate
Complete System - Shade all orientations 15 325 $15,625 South and West – Shade S&W only 8 162 $8,050
The costs presented in Table 3 may be conservatively high. The market for rolling window shades in California is small, dominated by small businesses, and appears to be relatively uncompetitive. Since many components are currently custom-fabricated, a larger market might offer significant economies of scale. To give a sense of comparison, costs estimates from the Portuguese market provided by Professor Eduardo Maldonado suggest that aluminum roller shading material may be available for as little as $3 per square foot, with motors and controls costing on the order of $250 per unit. Thus, we expect that the cost estimates provided here represent somewhat of an upper bound.
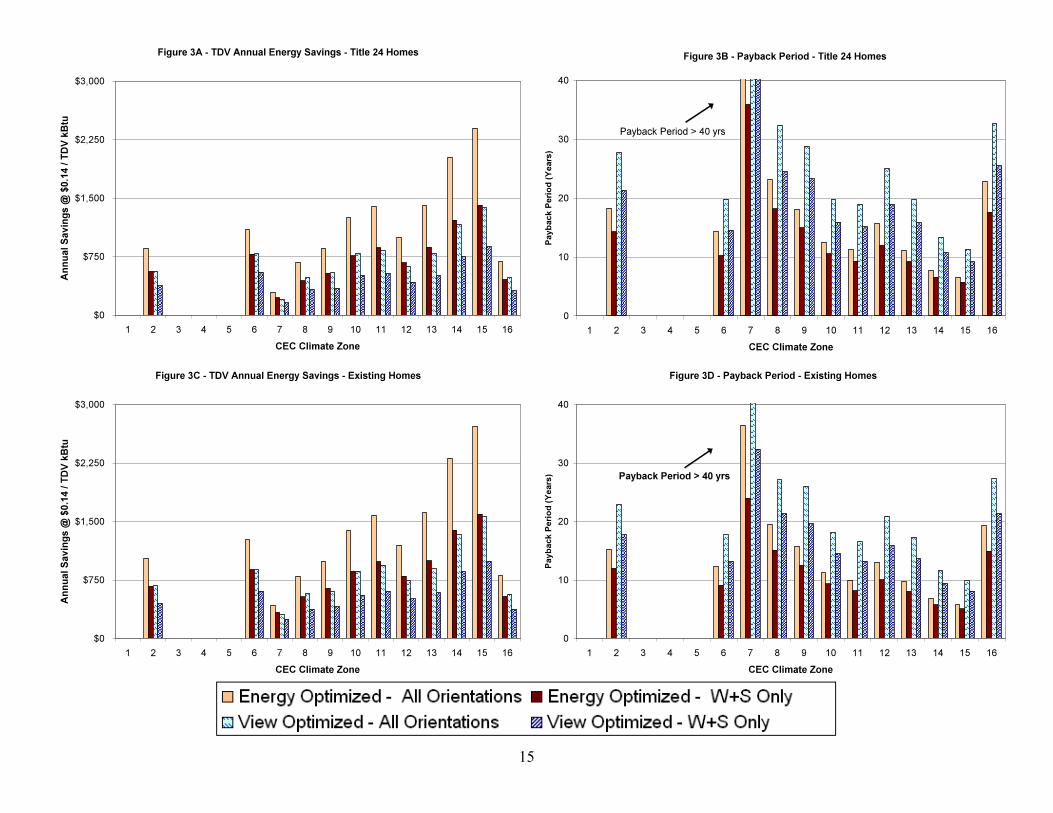
Energy Cost Savings
Estimates of energy cost savings from light colored shades are presented in Figures 3a (Title 24 Homes) and 3c (Existing Pre-Title 24 homes). For the View Optimized scenario, annual energy savings in Title 24 homes range from $250 - $1400/yr (Complete System), and roughly 60-70% of these values in the South and West case. Based on shading system cost estimates presented in the previous section, these savings equate to simple payback periods of 11 to over 40 years for the Complete System case, and slightly shorter durations in the South and West case (Figure 3b). Payback periods are also slightly shorter for shading systems installed in Existing (pre-Title 24) homes. It should be stressed that since these payback periods are based on TDV savings (which
7
account for reductions in society-wide costs), they represent a societal rate of return, not the rate of return seen by a homeowner. Homeowners are likely to pay a lower cost for their energy than the $0.14/kBtu TDV rate, and are thus likely to see even longer payback periods than those described above.
Conclusions
A clear trend across every metric analyzed in this study is a heavy dependence on climate. In northern or coastal climates with minimal cooling loads, e.g. Arcata or Oakland, window shading systems clearly result in negligible energy benefits. In other climates, window shading system result in very significant energy savings at the household level, but may result in relatively small aggregate or societal benefit due to a relatively small overall population (eg, El Centro). Setting these exceptional regions aside, , it is clear that for a broad swath of California’s climates – including many fast-growing regions – user-operated window shading systems offer the potential to substantially reduce cooling energy consumption. However, several key hurdles exist:
- Cost. Our simple cost analysis, while admittedly based on upper-bound costs, suggests that window shading systems are not, at least in the near term, particularly cost-effective on the basis of cooling energy savings alone. However, similar to replacing single-pane with double-pane windows, there are numerous other non-energy benefits, such as security, privacy, visual and thermal comfort, etc., that will make the system attractive to customers. For the Commission, a policy question remains whether the energy savings calculated in this report are reliable enough to warrant giving limited incentives to encourage their use.
- User Behavior. Based on assumptions of user behavior, a wide range of potential energy savings from shading systems can be estimated. While it’s true the energy savings of a movable shading system will be nil if the user chose not to use them, in most probability the customer base is a self-selected group, i.e., it is highly unlikely that customers would install such a system if they did not like the appearance or have no intention of using it. Thus, the question for the Commission should focus less on how acceptable are movable shading systems among California homeowners, but whether they should encourage their use by homeowners who do find them appealing.
References
Blum, H. Personal Communication, October 16th, 2006. European Rolling Shutters, Inc. San Jose, CA.
Huang, Y.J. 1999. “Simulated performance of CIEE’s ‘alternatives to compressive cooling’ prototype house under design conditions in various California climates”, LBNL Report 42963.
Huang, Y.J., J.W. Hanford, and H.F. Wu 1992. “Preliminary evaluation of the performance, water use, and current application trends of evaporative coolers in California climates”, Report LBL-32826, Lawrence Berkeley National Laboratory, Berkeley CA.
Huang, Y.J. 2006. “The Performance of Evaporative Coolers in California Climates (Draft Evaluation Report for Task 1) ”, Report LBL-59269, Lawrence Berkeley National Laboratory, Berkeley CA.
8
Kohler, C.J., Goudey, H. and Arasteh, D. 2004. “A First-Generation Prototype Dynamic Residential Window”, LBNL-56075 http://www-library.lbl.gov/docs/LBNL/560/75/PDF/LBNL-56075.pdf

9
10

11
Table 4. Simulation results for movable shading in New and Old vintage houses in the 16 California Climate Zones
Energy Consumption and Savings in Energy Optimized Scenario
12
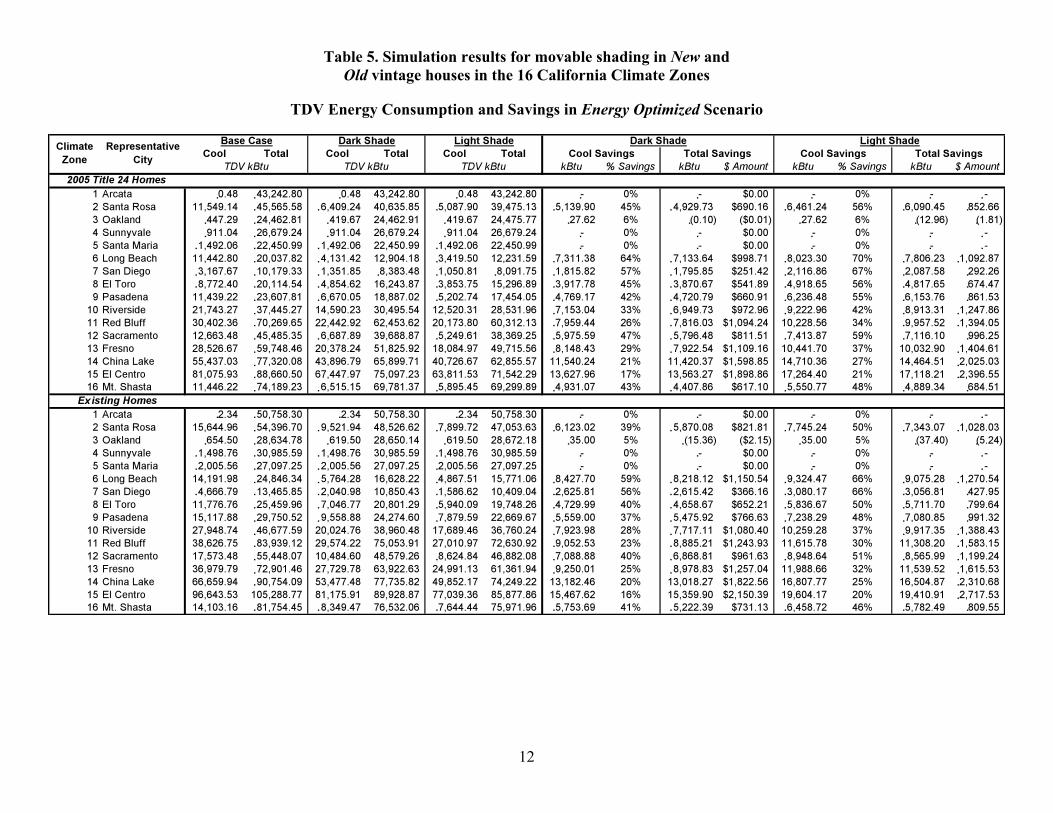
Table 5. Simulation results for movable shading in New and Old vintage houses in the 16 California Climate Zones
TDV Energy Consumption and Savings in Energy Optimized Scenario

13
Table 6. Simulation results for movable shading in New and Old vintage houses in the 16 California Climate Zones, View Optimized Scenario
Energy Consumption and Savings in View Optimized Scenario
14
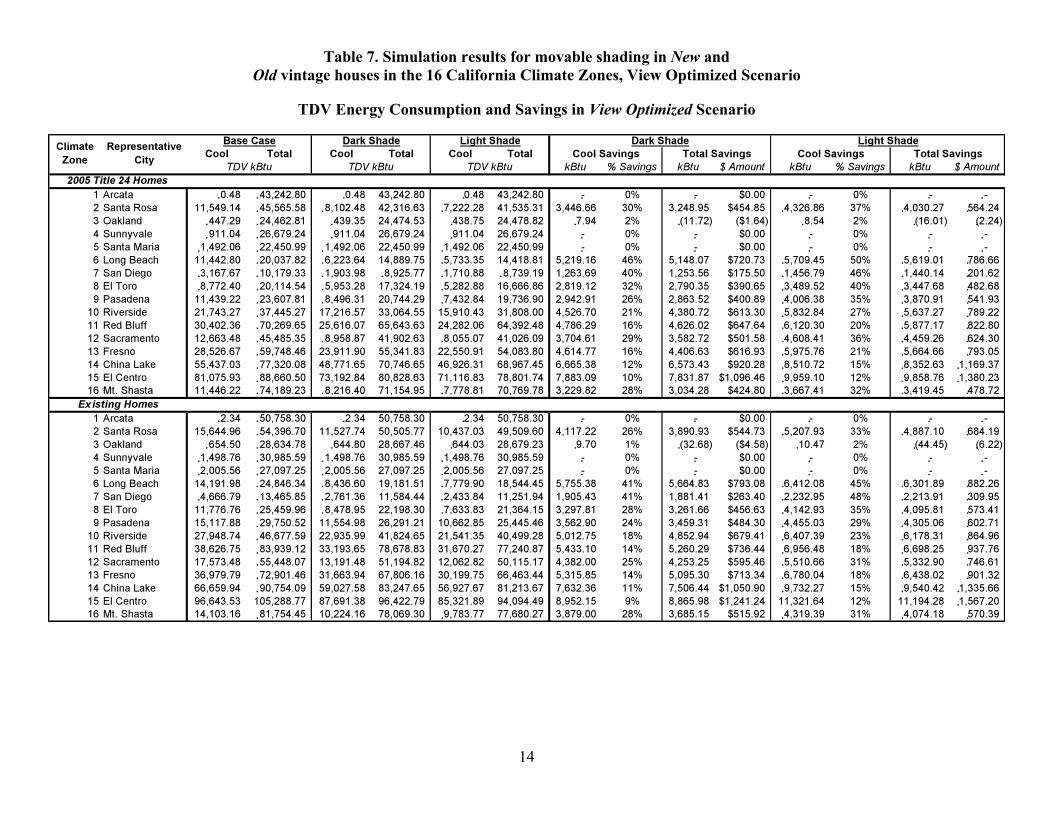
Table 7. Simulation results for movable shading in New and Old vintage houses in the 16 California Climate Zones, View Optimized Scenario
TDV Energy Consumption and Savings in View Optimized Scenario
15