Embed Size (px)
Citation preview
Journal of Geography and Geology; Vol. 4, No. 2;2012 ISSN 1916-9779 E-ISSN 1916-9787
Published by Canadian Center of Science and Education
124
Preliminary Estimation of Snow Covers Extents of Astore River Basin in Northern Areas, Pakistan
Anam Ashraf1, Sheikh Saeed Ahmad1, Neelam Aziz1 & Muhammad Tahir Ali Shah2
1 Department of Environmental Sciences, Fatima Jinnah Women University, Rawalpindi, Pakistan 2 Department of Agriculture, Allama Iqbal Open University, Islamabad, Pakistan
Correspondence: Sheikh Saeed Ahmad, Department of Environmental Sciences, Fatima Jinnah Women University, Rawalpindi, Pakistan. Tel: 92-321-516-7726. E-mail: [email protected]
Received: April 21, 2012 Accepted: May 2, 2012 Online Published: May 22, 2012
doi:10.5539/jgg.v4n2p124 URL: http://dx.doi.org/10.5539/jgg.v4n2p124
Abstract
An assessment of snow accumulation and depletion is necessary for the management of water resources in the region, where a great portion of annual precipitation falls in form of snow. This study was done to estimate the snow covered area of Northern Areas (Astore) in snow accumulation and snow ablation period with the aid of remote sensing (RS) techniques. Satellite image of Moderate Resolution Imaging Spectroradiometer (MODIS) was used to evaluate snow cover and classify the behavior of different image pixels in snow covered, partially covered and snow free pixels respectively. In order to nullify the obstruction offered by clouds only one cloud free image per week was selected for the years of 2008-2009 and data was analyzed using different ArcGIS and ERDAS Imagine tools. Watershed area of Astore river basin was calculated by using Digital Elevation Model. Normalized Differential Snow Index (NDSI) was used to draw snow cover map. Snow covered area was calculated in square kilometer and curves of snow cover extents were made for both years separately. Furthermore correlation curves were made for snow cover fluctuation with varying precipitation, minimum temperature and maximum temperature for years of 2008-2009. The observed correlation coefficient between snow cover, maximum temperature, minimum temperature and precipitation was found to be -0.784 (0.003), -0.767(0.004), 0.561(0.058) respectively for both the years. Moreover multiple linear regression equation was generated for future snow cover prediction under different climatic scenarios. January and February was found to be snow accumulation period and for May, July, June it was snow ablation period for both years.
Keywords: snow cover, Astore river basin, meteorological parameters, Moderate Resolution Imaging Spectroradiometer (MODIS), Normalized Differential Snow Index (NDSI), Digital Elevation Model (DEM)
1. Introduction
Pakistan has a variety of climatic regime varying from hot deserts to cold snow covered areas. The Northern Areas of Pakistan have cold climate, in winters due to western depression yields snow over Himalaya-Karakorum-Hindukush (HKH). In summers the accumulated snow melts to recharge Himalayan river system. This runoff water is accumulated in water reservoirs for irrigation and hydro power production. Generation of runoff water provide millions of people living in mountainous regions with fresh water (Dahri, Ahmad, Leach, & Ahmad, 2011).
Snow falls in the months of September – February and melts in the moths of March – August in Northern Areas of Pakistan. Frozen snow and glaciated ice in the mountainous Northern regions of Pakistan serves as its reserved hydrological resource. Conventional techniques for the measurement of snow coverextents are challenging and time consuming. More over these areas of Pakistan are difficult to access as they have varying topography and terrain. Nowadays remote sensing (RS) is proved to be a feasible tool to study snow covered areas.
Moderate Resolution Imaging Spectroradiometer (MODIS), aboard terra spacecraft of Earth Observing Systems (EOS) is being very handy for the estimation of Normalized Differential Snow Index (NDSI). Snow cover is highly influenced by changing climate and meteorological parameters. Snow falling and melting both are greatly influenced by daily minimum and maximum temperatures (Rasul, Chudhry, Mahmood, Hyder, & Dahe, 2011). Numerous researches were done on snow cover extent of other districts of Northern Areas but Astore
www.ccsenet.org/jgg Journal of Geography and Geology Vol. 4, No. 2; 2012
125
wasremaining neglected. Therefore this study was designed to analyze the impacts of meteorological parameters on the snow cover of Northern Area, Astore. Basic aim of this study was to find out the spatio-temporal distribution of snow cover of Astore river basin for the period of 2008-2009. Additionally to evaluate the effect of meteorological variables on snow cover distribution. Snow cover is the visible indicator of changing climate, snow cover extent and snow melt runoff are some of the major parameters directly related to the climatic changes. Hence this study signifies the effects of changing climatic conditions on the behavior of snow cover extent of Astore river basin.
2. Study Area
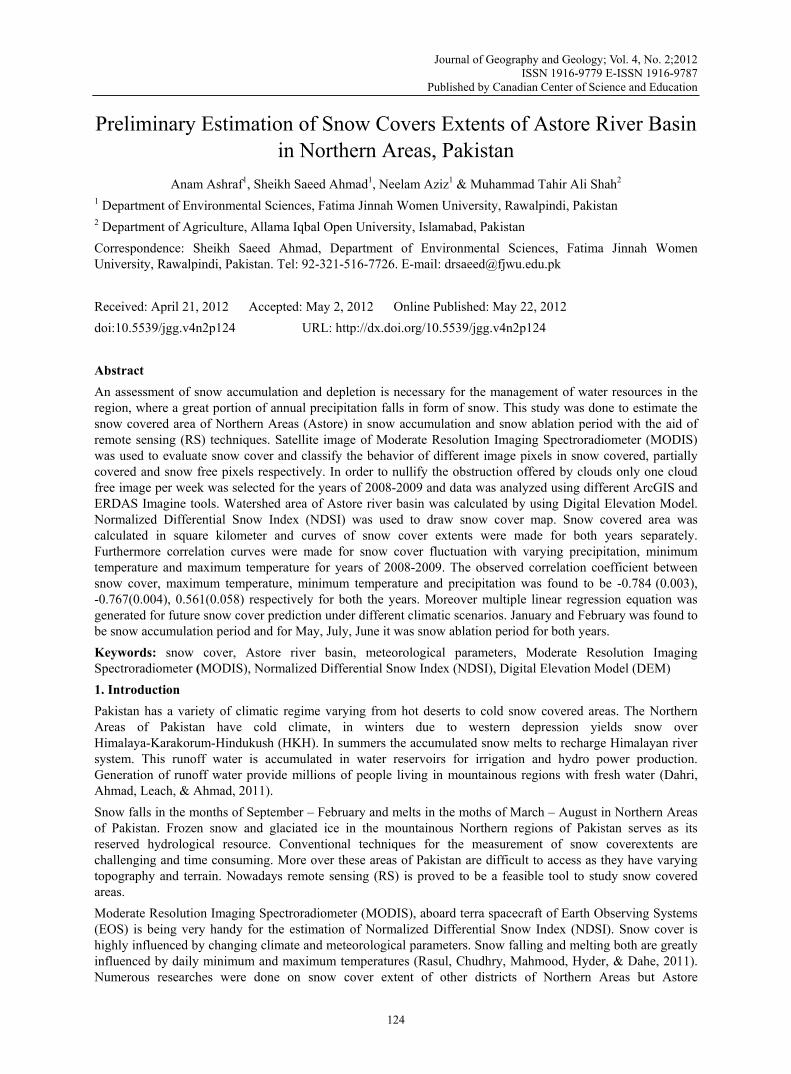
Astore river basin (Figure 1) is located in the high mountains of HKH region with snow peaks exceeding 7000m in height. This area is mostly covered by perennial snow and ice (Akhtar, Ahmad, &Booij, 2008). The geographic location of Astore is 34º, 45' to 35º, 38' N latitude and 74º, 24' to 75º, 14' E longitude. Elevation varies from 1,200m to 7,500m above mean sea level. The total catchment area is 4,214 km2 with 607 km2 glaciated area (Nabi, Latif, Habib-ur-Rehman, & Azhar, 2011). Glaciers are mainly nourished by westerly disturbance (Hewitt, Wake, Young, & David, 1989) According to SHIP (Snow and Ice Hydrology Project, 1990) 80-90% of the area gets covered by snow, seasonal melting of snow and glaciers ice both are large contributor of discharge water in summer season.
Figure 1. Base map of the study area (Astore river basin)
3. Material and Methods
3.1 Data Acquisition
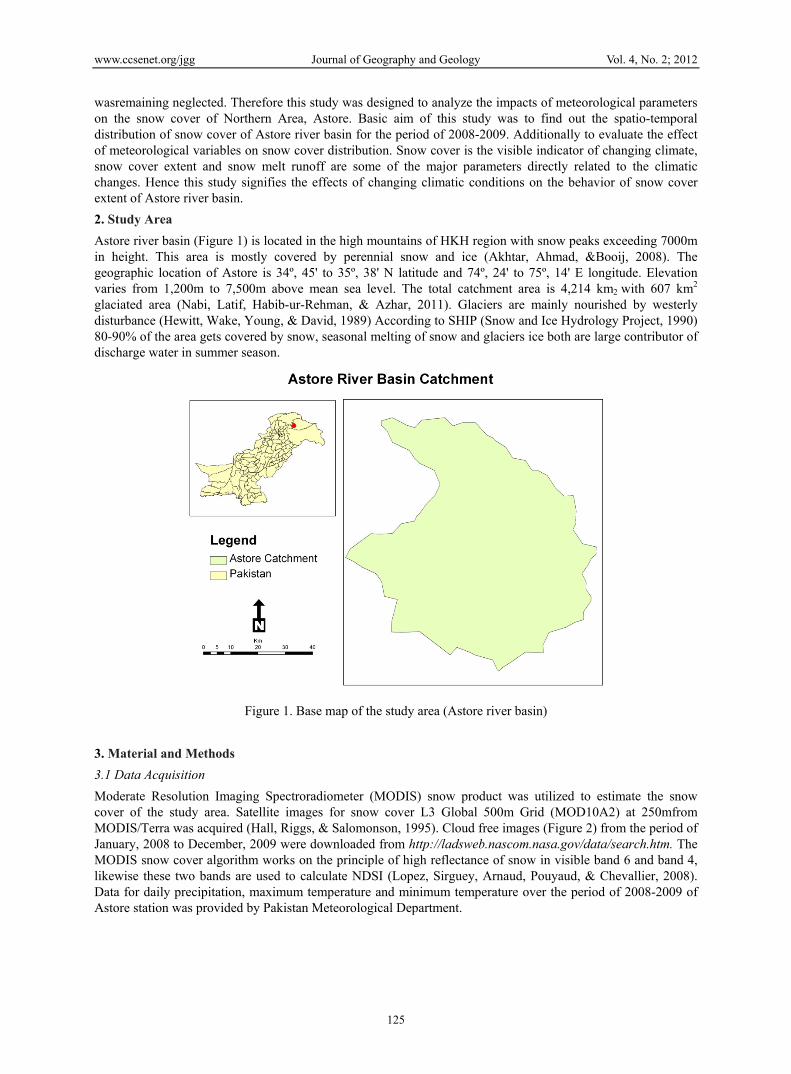
Moderate Resolution Imaging Spectroradiometer (MODIS) snow product was utilized to estimate the snow cover of the study area. Satellite images for snow cover L3 Global 500m Grid (MOD10A2) at 250mfrom MODIS/Terra was acquired (Hall, Riggs, & Salomonson, 1995). Cloud free images (Figure 2) from the period of January, 2008 to December, 2009 were downloaded from http://ladsweb.nascom.nasa.gov/data/search.htm. The MODIS snow cover algorithm works on the principle of high reflectance of snow in visible band 6 and band 4, likewise these two bands are used to calculate NDSI (Lopez, Sirguey, Arnaud, Pouyaud, & Chevallier, 2008). Data for daily precipitation, maximum temperature and minimum temperature over the period of 2008-2009 of Astore station was provided by Pakistan Meteorological Department.
www.ccsen
3.2 Snow C
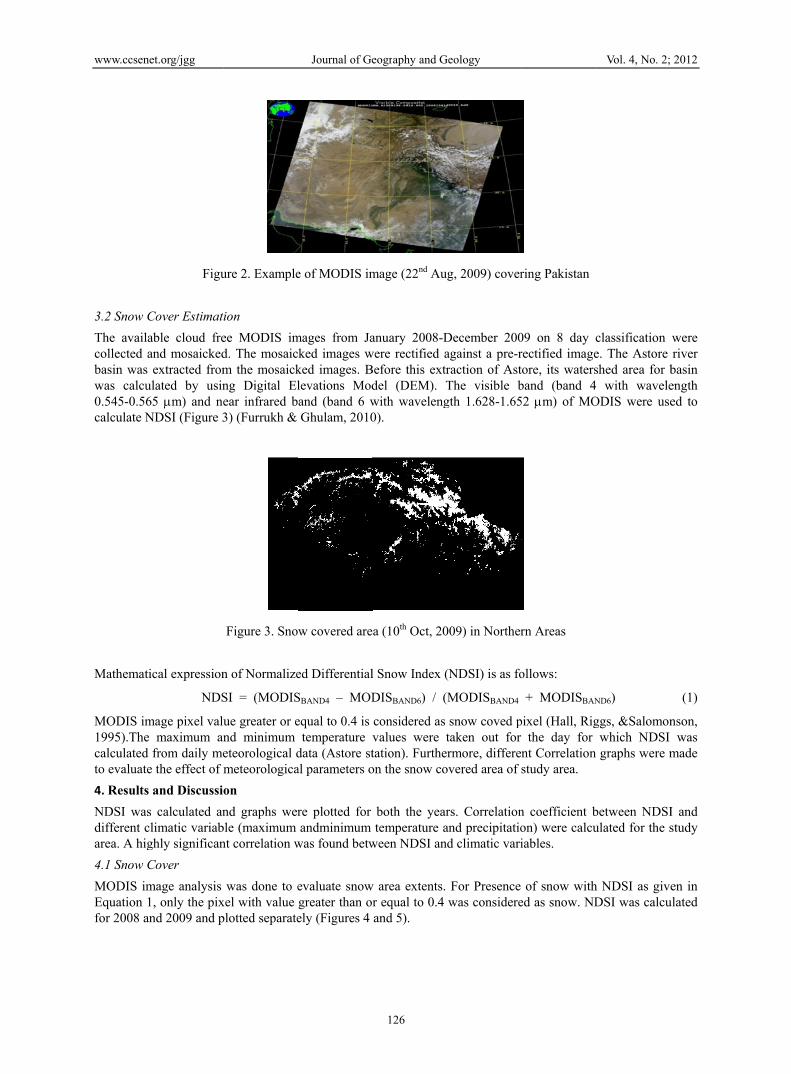
The availacollected abasin was was calcu0.545-0.56calculate N
Mathemati
MODIS im1995).Thecalculated to evaluate
4. Results
NDSI wasdifferent carea. A hig
4.1 Snow C
MODIS imEquation 1for 2008 an
et.org/jgg
Figu
Cover Estimati
able cloud freand mosaickedextracted from
ulated by usin65 m) and neNDSI (Figure 3
ical expression
NDS
mage pixel value maximum an
from daily mee the effect of m
and Discussio
s calculated anclimatic variabghly significan
Cover
mage analysis 1, only the pixnd 2009 and p
ure 2. Example
ion
ee MODIS imd. The mosaicm the mosaickng Digital Elear infrared b3) (Furrukh &
Figure 3. Sno
n of Normalize
SI = (MODIS
ue greater or end minimum eteorological dmeteorologica
on
nd graphs werble (maximum nt correlation w
was done to exel with value plotted separate
Journal of Ge
e of MODIS im
mages from Jaked images w
ked images. Blevations Modand (band 6 wGhulam, 2010
w covered are
ed Differential
SBAND4 – MOD
equal to 0.4 is temperature v
data (Astore stal parameters o
re plotted for andminimum
was found betw
evaluate snowgreater than orely (Figures 4
eography and G
126
mage (22nd Au
anuary 2008-Dwere rectified aBefore this extrdel (DEM). Twith waveleng0).
a (10th Oct, 20
l Snow Index (
DISBAND6) / (
considered as values were ttation). Furtheon the snow co
both the yeartemperature a
ween NDSI and
w area extents. r equal to 0.4 and 5).
Geology
g, 2009) cover
December 200against a pre-rraction of AstThe visible bgth 1.628-1.65
009) in Norther
(NDSI) is as fo
MODISBAND4
snow coved ptaken out for rmore, differen
overed area of s
rs. Correlationand precipitatiod climatic vari
For Presence was considere
ring Pakistan
09 on 8 day crectified imageore, its waters
band (band 452 m) of MO
rn Areas
ollows:
+ MODISBAN
pixel (Hall, Rigthe day for
nt Correlation study area.
n coefficient bon) were calcuiables.
of snow withed as snow. ND
Vol. 4, No. 2;
classification e. The Astore shed area for b with wavele
ODIS were use
ND6)
ggs, &Salomonwhich NDSI graphs were m
between NDSIulated for the s
h NDSI as giveDSI was calcu
2012
were river basin ength ed to
(1)
nson, was
made
I and study
en in ulated
www.ccsen
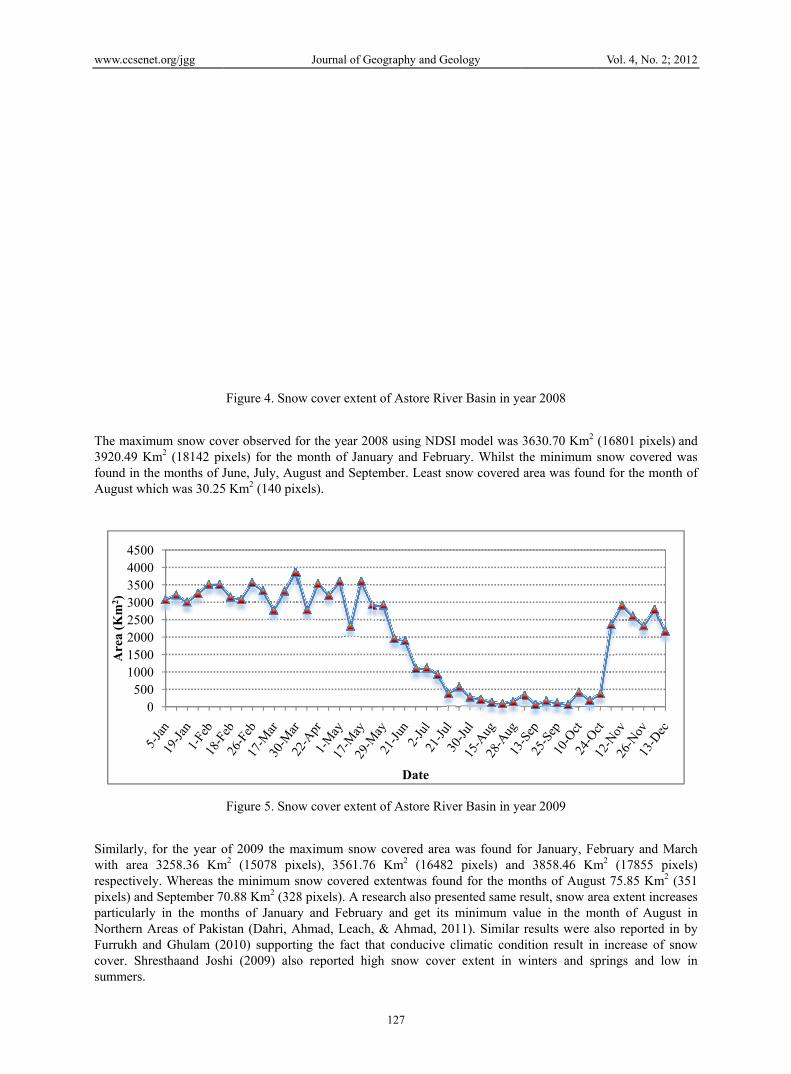
The maxim3920.49 Kfound in thAugust wh
Similarly, with area respectivelpixels) andparticularlyNorthern AFurrukh ancover. Shrsummers.
0500
10001500200025003000350040004500
Are
a (K
m2 )
et.org/jgg
mum snow covKm2 (18142 pihe months of Jhich was 30.25
for the year o3258.36 Km
ly. Whereas thd September 7y in the monAreas of Pakisnd Ghulam (2resthaand Josh
0000000000
Figure 4. Sno
ver observed fixels) for the mJune, July, Au5 Km2 (140 pix
Figure 5. Sno
of 2009 the mm2 (15078 pixhe minimum s0.88 Km2 (328
nths of Januarystan (Dahri, A2010) supportihi (2009) also
Journal of Ge
w cover exten
for the year 20month of Janu
ugust and Septexels).
w cover exten
maximum snowxels), 3561.76snow covered 8 pixels). A rey and Februar
Ahmad, Leach,ing the fact tho reported hig
eography and G
127
t of Astore Riv
008 using NDSuary and Februember. Least s
t of Astore Riv
w covered area6 Km2 (16482extentwas fousearch also prery and get its, & Ahmad, 2hat conducive gh snow cove
Date
Geology
ver Basin in ye
SI model was uary. Whilst tsnow covered
ver Basin in ye
a was found fo2 pixels) and
und for the moesented same rs minimum va2011). Similar
climatic conder extent in w
ear 2008
3630.70 Km2 the minimum area was foun
ear 2009
for January, Fed 3858.46 Kmonths of Auguresult, snow aralue in the mresults were a
dition result inwinters and sp
Vol. 4, No. 2;
(16801 pixelssnow covered
nd for the mon
ebruary and Mm2 (17855 pi
ust 75.85 Km2
rea extent increonth of Augualso reported in increase of springs and lo
2012
) and d was nth of
March ixels) (351
eases ust in in by snow w in
www.ccsenet.org/jgg Journal of Geography and Geology Vol. 4, No. 2; 2012
128
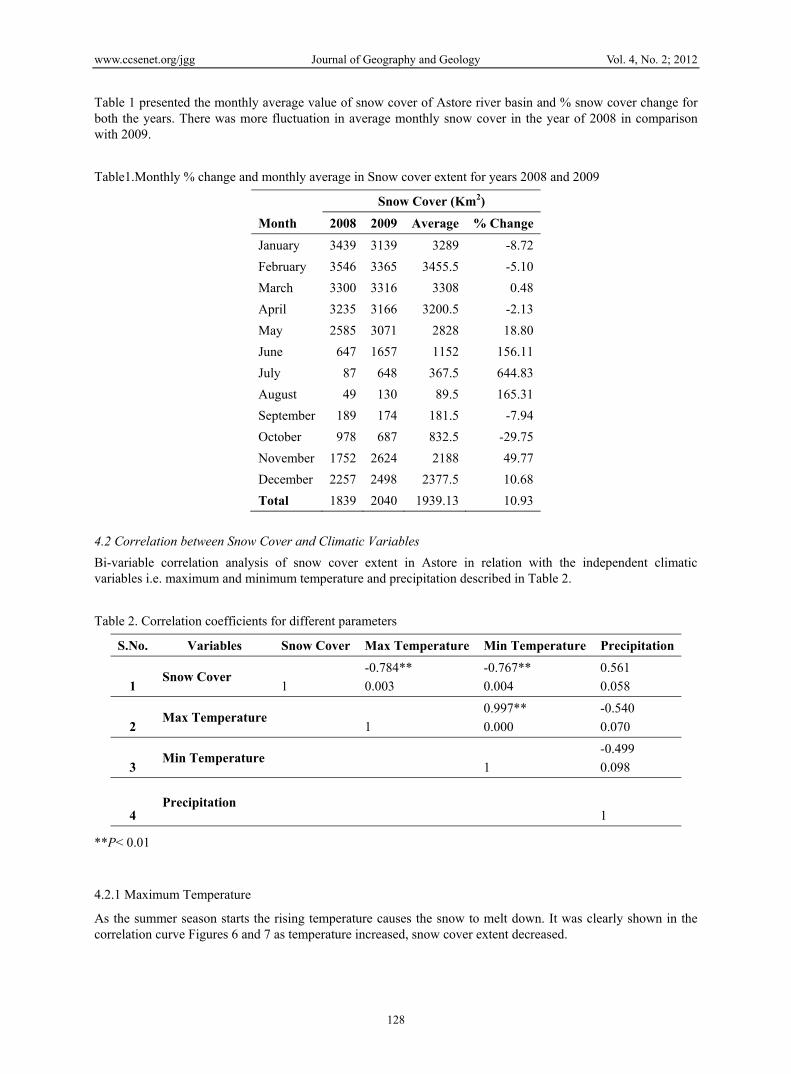
Table 1 presented the monthly average value of snow cover of Astore river basin and % snow cover change for both the years. There was more fluctuation in average monthly snow cover in the year of 2008 in comparison with 2009.
Table1.Monthly % change and monthly average in Snow cover extent for years 2008 and 2009
Month
Snow Cover (Km2)
2008 2009 Average % Change
January 3439 3139 3289 -8.72
February 3546 3365 3455.5 -5.10
March 3300 3316 3308 0.48
April 3235 3166 3200.5 -2.13
May 2585 3071 2828 18.80
June 647 1657 1152 156.11
July 87 648 367.5 644.83
August 49 130 89.5 165.31
September 189 174 181.5 -7.94
October 978 687 832.5 -29.75
November 1752 2624 2188 49.77
December 2257 2498 2377.5 10.68
Total 1839 2040 1939.13 10.93
4.2 Correlation between Snow Cover and Climatic Variables
Bi-variable correlation analysis of snow cover extent in Astore in relation with the independent climatic variables i.e. maximum and minimum temperature and precipitation described in Table 2.
Table 2. Correlation coefficients for different parameters
S.No. Variables Snow Cover Max Temperature Min Temperature Precipitation
1 Snow Cover
1
-0.784**
0.003
-0.767**
0.004
0.561
0.058
2 Max Temperature
1
0.997**
0.000
-0.540
0.070
3 Min Temperature
1
-0.499
0.098
4 Precipitation
1
**P< 0.01
4.2.1 Maximum Temperature
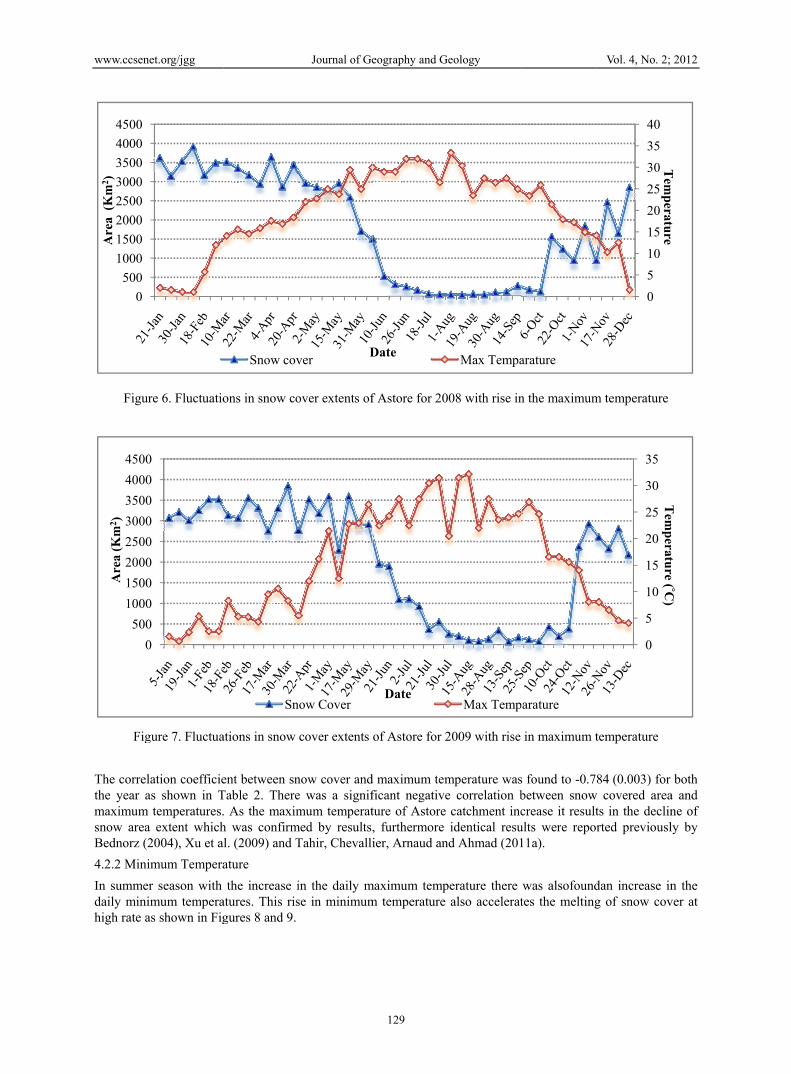
As the summer season starts the rising temperature causes the snow to melt down. It was clearly shown in the correlation curve Figures 6 and 7 as temperature increased, snow cover extent decreased.
www.ccsen
Figur
Fig
The correlthe year amaximum snow areaBednorz (2
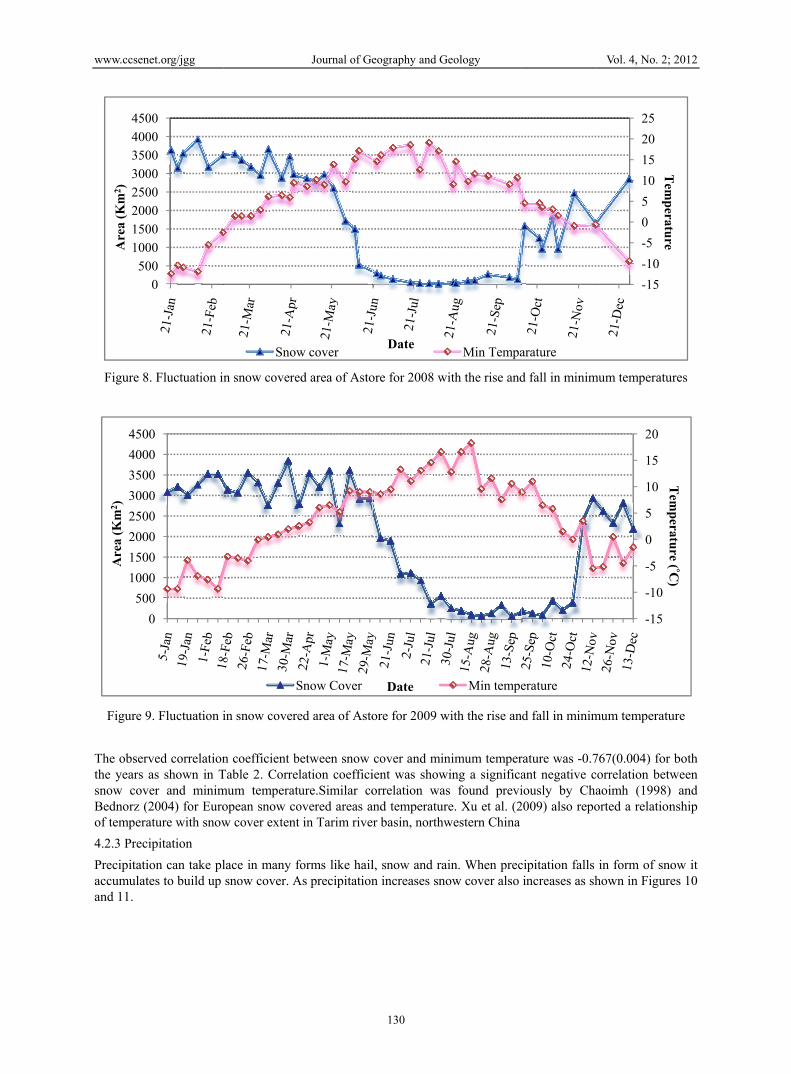
4.2.2 Mini
In summerdaily minihigh rate a
0
500
1000
1500
2000
2500
3000
3500
4000
4500A
rea
(K
m2 )
0
500
1000
1500
2000
2500
3000
3500
4000
4500
Are
a (K
m2 )
et.org/jgg
re 6. Fluctuatio
gure 7. Fluctua
lation coefficieas shown in T
temperatures.a extent which2004), Xu et a
imum Tempera
r season with imum temperaas shown in Fig
0
0
0
0
0
0
0
0
0
0
ons in snow co
ations in snow
ent between snTable 2. There. As the maximh was confirml. (2009) and T
ature
the increase iatures. This risgures 8 and 9.
Snow cov
Sn
Journal of Ge
over extents of
cover extents
now cover ande was a signifmum temperat
med by results,Tahir, Chevalli
in the daily mse in minimum
Dver
now Cover
eography and G
129
f Astore for 20
of Astore for 2
d maximum temficant negativeture of Astore , furthermore ier, Arnaud an
maximum tempm temperature
Date
Date
Geology
008 with rise in
2009 with rise
mperature wase correlation bcatchment incidentical resu
nd Ahmad (201
perature there also accelerat
Max Tempa
Max Temp
n the maximum
in maximum t
s found to -0.7between snowcrease it result
ults were repo11a).
was alsofoundtes the melting
arature
arature
Vol. 4, No. 2;
m temperature
temperature
84 (0.003) for w covered area
ts in the declinrted previousl
dan increase ing of snow cov
0
5
10
15
20
25
30
35
40T
emp
erature
0
5
10
15
20
25
30
35
Tem
peratu
re(
C)
2012
both a and ne of ly by
n the ver at
Tt
Tem
peratu
re( °C
)
www.ccsen
Figure 8
Figure 9
The observthe years asnow covBednorz (2of tempera
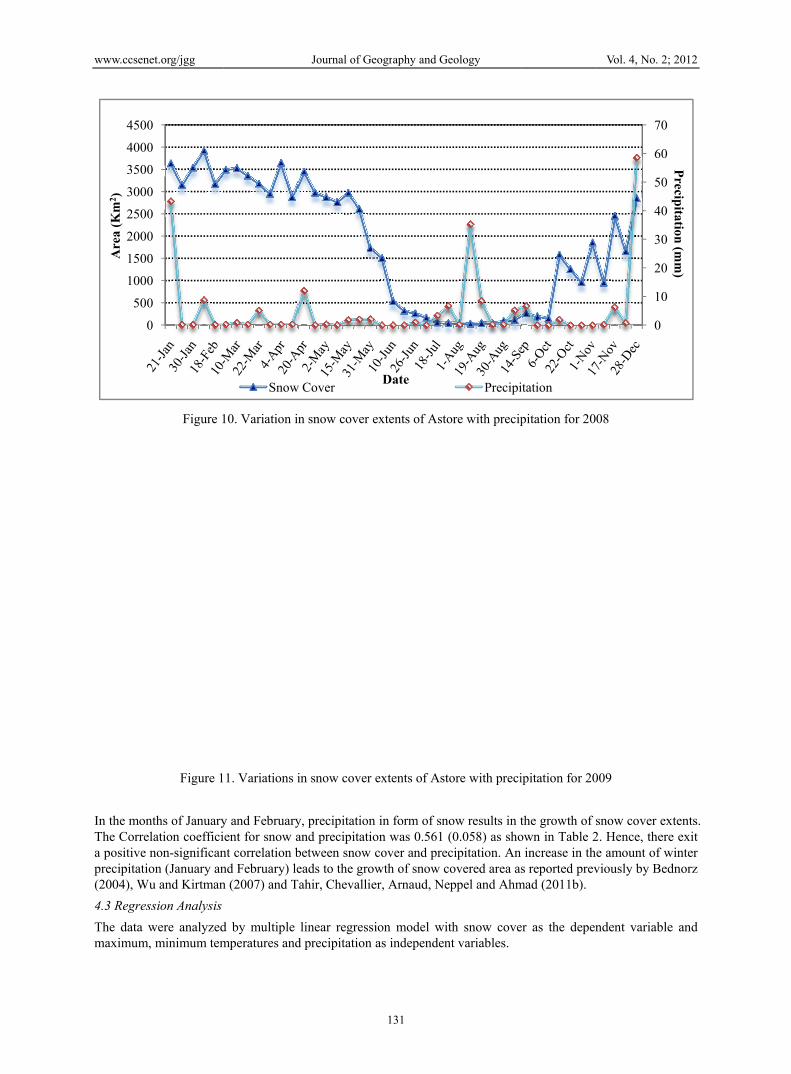
4.2.3 Preci
Precipitatiaccumulatand 11.
50
100150
200250300
350400
450A
rea
(Km
2 )
50
100
150
200
250
300
350
400
450
Are
a (K
m2 )
et.org/jgg
. Fluctuation in
9. Fluctuation i
ved correlationas shown in Ter and minim2004) for Euroature with snow
ipitation
on can take ples to build up
000
0000
000000
0000
00
0
0
0
0
0
0
0
0
0
0
n snow covere
in snow covere
n coefficient bTable 2. Corremum temperatopean snow cow cover extent
lace in many fsnow cover. A
Snow
S
Journal of Ge
ed area of Asto
ed area of Asto
between snow lation coeffici
ture.Similar coovered areas at in Tarim rive
forms like hailAs precipitation
w cover
Snow Cover
eography and G
130
ore for 2008 w
ore for 2009 w
cover and minient was showorrelation was
and temperaturr basin, northw
l, snow and ran increases sno
Date
Date
Geology
ith the rise and
with the rise an
nimum temperwing a significa
s found previre. Xu et al. (2western China
in. When precow cover also
Min Tempa
Min tempe
d fall in minim
d fall in minim
rature was -0.7ant negative ciously by Cha2009) also repo
cipitation falls increases as sh
arature
erature
Vol. 4, No. 2;
mum temperatu
mum temperatu
767(0.004) for correlation betwaoimh (1998)orted a relation
in form of snohown in Figure
-15
-10
-5
0
5
10
15
20
25T
emp
erature
-15
-10
-5
0
5
10
15
20
Tem
peratu
re (C
)
2012
ures
ure
both ween and nship
ow it es 10
Tem
peratu
reT
emp
erature
( °C)
www.ccsen
In the monThe Correa positive precipitatio(2004), W
4.3 Regres
The data wmaximum,
0
500
1000
1500
2000
2500
3000
3500
4000
4500A
rea
(Km
2 )
et.org/jgg
Figure 1
Figure 1
nths of Januarylation coefficinon-significanon (January anu and Kirtman
ssion Analysis
were analyzed, minimum tem
0
0
0
0
0
0
0
0
0
0
10. Variation in
1. Variations i
y and Februaryient for snow ant correlation bnd February) len (2007) and T
d by multiple mperatures and
Snow
Journal of Ge
n snow cover
in snow cover
y, precipitationand precipitatiobetween snow eads to the gro
Tahir, Chevallie
linear regressd precipitation
w Cover
eography and G
131
extents of Asto
extents of Ast
n in form of snon was 0.561cover and pre
owth of snow cer, Arnaud, Ne
sion model wias independen
Date
Geology
ore with precip
tore with preci
now results in t(0.058) as sho
ecipitation. An covered area aseppel and Ahm
ith snow covent variables.
Precipi
pitation for 20
ipitation for 20
the growth of sown in Table 2
increase in ths reported prev
mad (2011b).
er as the depen
itation
Vol. 4, No. 2;
08
009
snow cover ex2. Hence, theree amount of wviously by Bed
ndent variable
0
10
20
30
40
50
60
70
2012
xtents. e exit
winter dnorz
e and
Precip
itation (m
m)
www.ccsenet.org/jgg Journal of Geography and Geology Vol. 4, No. 2; 2012
132
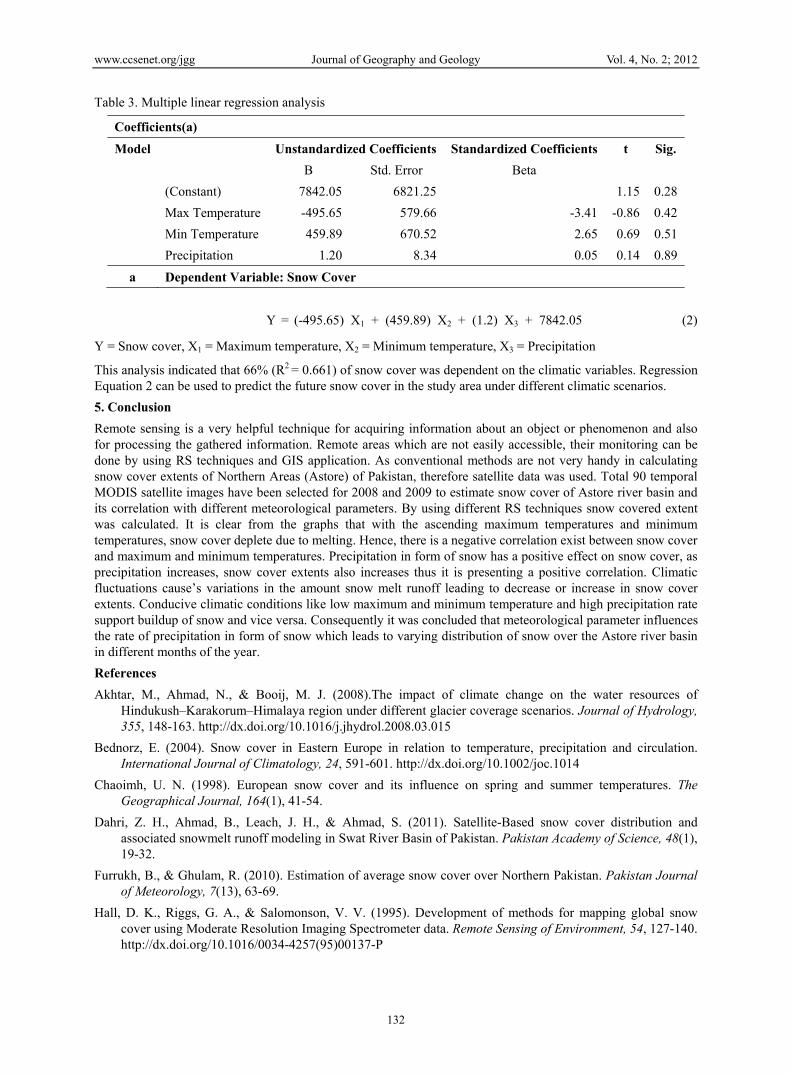
Table 3. Multiple linear regression analysis
Coefficients(a)
Model Unstandardized Coefficients Standardized Coefficients t Sig.
B Std. Error Beta
(Constant) 7842.05 6821.25 1.15 0.28
Max Temperature -495.65 579.66 -3.41 -0.86 0.42
Min Temperature 459.89 670.52 2.65 0.69 0.51
Precipitation 1.20 8.34 0.05 0.14 0.89
a Dependent Variable: Snow Cover
Y = (-495.65) X1 + (459.89) X2 + (1.2) X3 + 7842.05 (2)
Y = Snow cover, X1 = Maximum temperature, X2 = Minimum temperature, X3 = Precipitation
This analysis indicated that 66% (R2 = 0.661) of snow cover was dependent on the climatic variables. Regression Equation 2 can be used to predict the future snow cover in the study area under different climatic scenarios.
5. Conclusion
Remote sensing is a very helpful technique for acquiring information about an object or phenomenon and also for processing the gathered information. Remote areas which are not easily accessible, their monitoring can be done by using RS techniques and GIS application. As conventional methods are not very handy in calculating snow cover extents of Northern Areas (Astore) of Pakistan, therefore satellite data was used. Total 90 temporal MODIS satellite images have been selected for 2008 and 2009 to estimate snow cover of Astore river basin and its correlation with different meteorological parameters. By using different RS techniques snow covered extent was calculated. It is clear from the graphs that with the ascending maximum temperatures and minimum temperatures, snow cover deplete due to melting. Hence, there is a negative correlation exist between snow cover and maximum and minimum temperatures. Precipitation in form of snow has a positive effect on snow cover, as precipitation increases, snow cover extents also increases thus it is presenting a positive correlation. Climatic fluctuations cause’s variations in the amount snow melt runoff leading to decrease or increase in snow cover extents. Conducive climatic conditions like low maximum and minimum temperature and high precipitation rate support buildup of snow and vice versa. Consequently it was concluded that meteorological parameter influences the rate of precipitation in form of snow which leads to varying distribution of snow over the Astore river basin in different months of the year.
References
Akhtar, M., Ahmad, N., & Booij, M. J. (2008).The impact of climate change on the water resources of Hindukush–Karakorum–Himalaya region under different glacier coverage scenarios. Journal of Hydrology, 355, 148-163. http://dx.doi.org/10.1016/j.jhydrol.2008.03.015
Bednorz, E. (2004). Snow cover in Eastern Europe in relation to temperature, precipitation and circulation. International Journal of Climatology, 24, 591-601. http://dx.doi.org/10.1002/joc.1014
Chaoimh, U. N. (1998). European snow cover and its influence on spring and summer temperatures. The Geographical Journal, 164(1), 41-54.
Dahri, Z. H., Ahmad, B., Leach, J. H., & Ahmad, S. (2011). Satellite-Based snow cover distribution and associated snowmelt runoff modeling in Swat River Basin of Pakistan. Pakistan Academy of Science, 48(1), 19-32.
Furrukh, B., & Ghulam, R. (2010). Estimation of average snow cover over Northern Pakistan. Pakistan Journal of Meteorology, 7(13), 63-69.
Hall, D. K., Riggs, G. A., & Salomonson, V. V. (1995). Development of methods for mapping global snow cover using Moderate Resolution Imaging Spectrometer data. Remote Sensing of Environment, 54, 127-140. http://dx.doi.org/10.1016/0034-4257(95)00137-P
www.ccsenet.org/jgg Journal of Geography and Geology Vol. 4, No. 2; 2012
133
Hewitt, K., Wake, C. P., Young, G. J., & David, C. (1989). Hydrological investigations at Biafo Glacier, Karakoram Himalaya: an important source of water for the Indus River. Annals of Glaciology, 13, 103-108. http://dx.doi.org/10.1016/j.jhydrol.2011.08.035
Lopez, P., Sirguey, P., Arnaud, Y., Pouyaud, B., & Chevallier, P. (2008).Snow cover monitoring in the Northern Patagonia Ice field using MODIS satellite images (2000-2006). Global and Planetary Change, 61(3-4), 103-116. http://dx.doi.org/10.1016/j.gloplacha.2007.07.005
Nabi, G., Latif, M., Habib-ur-Rehman, & Azhar, A. H. (2011). The role of environmental parameter (degree day) of snow melt runoff simulation. Soil and Environment, 30(1), 82-87
Peng, S., Piao, S., Ciais, P., Fang, J., & Wang, X. (2010). Change in winter snow depth and its impacts on vegetation in China. Global Change Biology, 16(11), 3004-3013. http://dx.doi.org/10.1111/j.1365-2486.2010.02210.x
Rasul, G., Chudhry, Q. Z., Mahmood, A., Hyder, K. W., & Dahe, Q. (2011). Glaciers and glacial lakes under changing Climate in Pakistan. Pakistan Journal of Meteorology, 8(15), 1-8.
Shrestha, A. B., & Joshi, S. P. (2009). Snow cover and glacier change study in Nepalese Himalaya using Remote Sensing and Geographic Information System. Journal of Hydrology and Meteorology, 29(1), 26-36. http://dx.doi.org/10.3126/jhm.v6i1.5481
Snow and Ice Hydrology Project. (1990). Snow and Ice Hydrology Project, Upper Indus Basin, Overall.Report, WAPDA- IDRC Wilfrid Laurier University, 179.
Tahir, A. A., Chevallier, P., Arnaud, Y., & Ahmad, B. (2011a). Snow cover dynamics and hydrological regime of the Hunza River basin, Karakoram Range, Northern Pakistan. Hydrology and Earth System Sciences, 15, 2275-2290. http://dx.doi.org/10.5194/hess-15-2275-2011
Tahir, A. A., Chevallier, P., Arnaud, Y., Neppel, L., & Ahmad, B. (2011b). Modeling snowmelt-runoff under climate scenarios in the Hunza River basin, Karakoram Range, Northern Pakistan. Journal of Hydrology, 409, 104-117. http://dx.doi.org/10.1016/j.jhydrol.2011.08.035
Wu, R., & Kirtman, B. P. (2007). Observed Relationship of spring and summer East Asian rainfall with winter and spring Eurasian Snow. Journal of Climate, 20, 1285-1304. http://dx.doi.org/10.1175/JCLI4068.1
Xu, C., Chen, Y., Hamid, Y., Tashpolat, T., Chen, Y., Ge, H., & Li, W. (2009). Long-term change of seasonal snow cover and its effects on river runoff in the TarimRiverbasin, northwestern China. Hydrological Processes, 23(14), 2045-2055. http://dx.doi.org/10.1002/hyp.7334