Embed Size (px)
Citation preview
Group 3 Preliminary Engineering Design Report
University of Bristol Department of Aerospace Engineering.
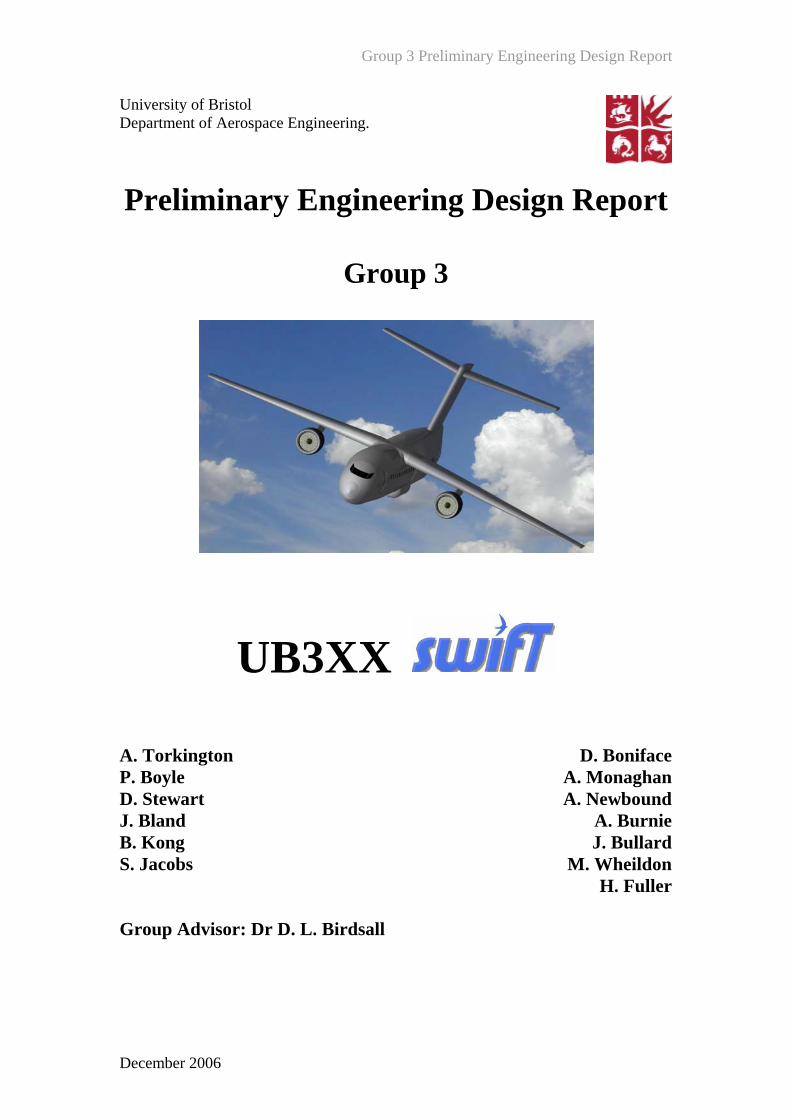
Preliminary Engineering Design Report
Group 3
UB3XX
A. Torkington D. BonifaceP. Boyle A. MonaghanD. Stewart A. NewboundJ. Bland A. BurnieB. Kong J. BullardS. Jacobs M. Wheildon
H. Fuller Group Advisor: Dr D. L. Birdsall
December 2006
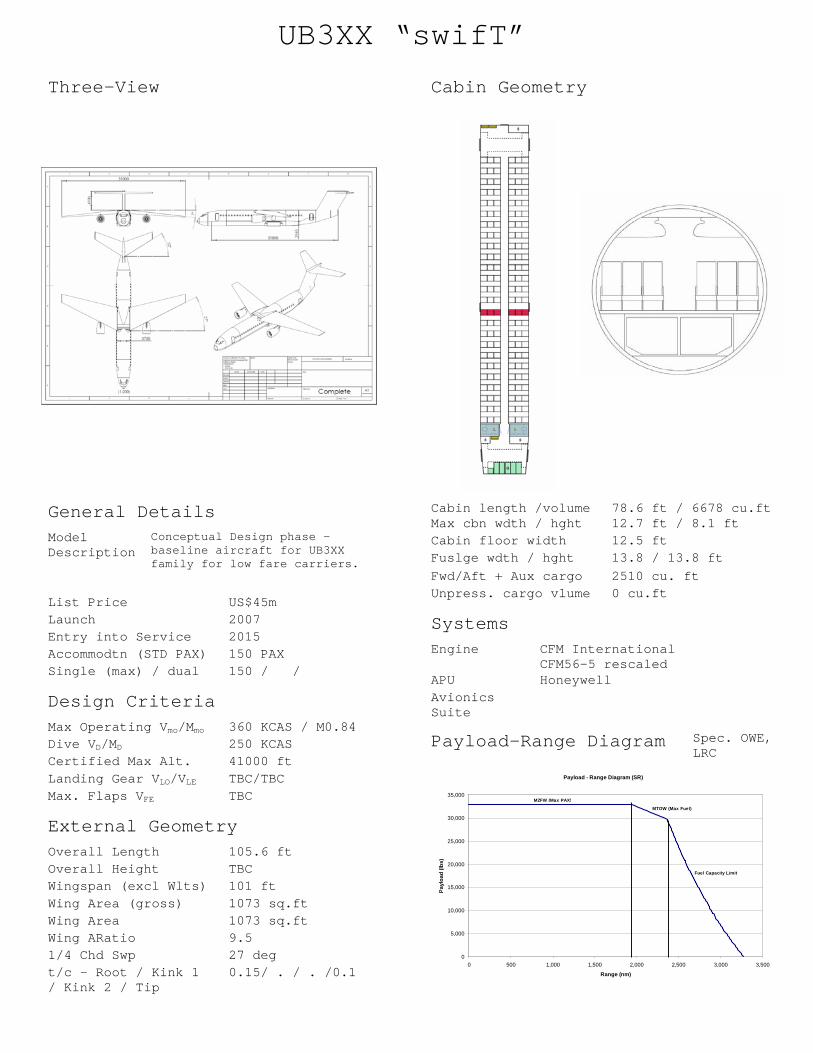
UB3XX “swifT”
Three-View
General Details
Model Description
Conceptual Design phase – baseline aircraft for UB3XX family for low fare carriers.
List Price US$45m Launch 2007 Entry into Service 2015 Accommodtn (STD PAX) 150 PAX Single (max) / dual 150 / /
Design Criteria
Max Operating Vmo/Mmo 360 KCAS / M0.84 Dive VD/MD 250 KCAS Certified Max Alt. 41000 ft Landing Gear VLO/VLE TBC/TBC Max. Flaps VFE TBC
External Geometry
Overall Length 105.6 ft Overall Height TBC Wingspan (excl Wlts) 101 ft Wing Area (gross) 1073 sq.ft Wing Area 1073 sq.ft Wing ARatio 9.5 1/4 Chd Swp 27 deg t/c - Root / Kink 1 / Kink 2 / Tip
0.15/ . / . /0.1
Cabin Geometry
Cabin length /volume 78.6 ft / 6678 cu.ft Max cbn wdth / hght 12.7 ft / 8.1 ft Cabin floor width 12.5 ft Fuslge wdth / hght 13.8 / 13.8 ft Fwd/Aft + Aux cargo 2510 cu. ft Unpress. cargo vlume 0 cu.ft
Systems Engine CFM International
CFM56-5 rescaled APU Honeywell Avionics Suite
Payload-Range Diagram Spec. OWE, LRC
Payload - Range Diagram (SR)
0
5,000
10,000
15,000
20,000
25,000
30,000
35,000
0 500 1,000 1,500 2,000 2,500 3,000 3,500
Range (nm)
Payl
oad
(lbs)
MZFW (Max PAX)
MTOW (Max Fuel)
Fuel Capacity Limit
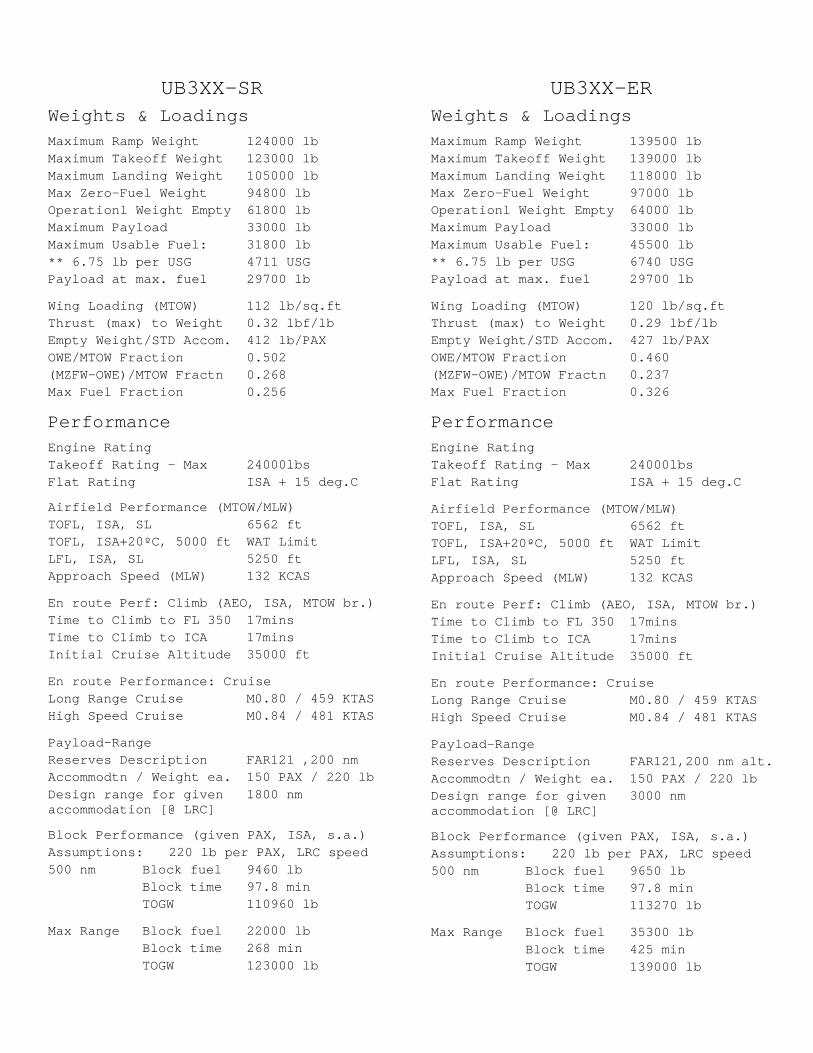
UB3XX-SR Weights & Loadings Maximum Ramp Weight 124000 lb Maximum Takeoff Weight 123000 lb Maximum Landing Weight 105000 lb Max Zero-Fuel Weight 94800 lb Operationl Weight Empty 61800 lb Maximum Payload 33000 lb Maximum Usable Fuel: 31800 lb ** 6.75 lb per USG 4711 USG Payload at max. fuel 29700 lb
Wing Loading (MTOW) 112 lb/sq.ft Thrust (max) to Weight 0.32 lbf/lb Empty Weight/STD Accom. 412 lb/PAX OWE/MTOW Fraction 0.502 (MZFW-OWE)/MTOW Fractn 0.268 Max Fuel Fraction 0.256
Performance Engine Rating Takeoff Rating – Max 24000lbs Flat Rating ISA + 15 deg.C
Airfield Performance (MTOW/MLW) TOFL, ISA, SL 6562 ft TOFL, ISA+20ºC, 5000 ft WAT Limit LFL, ISA, SL 5250 ft Approach Speed (MLW) 132 KCAS
En route Perf: Climb (AEO, ISA, MTOW br.) Time to Climb to FL 350 17mins Time to Climb to ICA 17mins Initial Cruise Altitude 35000 ft
En route Performance: Cruise Long Range Cruise M0.80 / 459 KTAS High Speed Cruise M0.84 / 481 KTAS
Payload-Range Reserves Description FAR121 ,200 nm Accommodtn / Weight ea. 150 PAX / 220 lb Design range for given accommodation [@ LRC]
1800 nm
Block Performance (given PAX, ISA, s.a.) Assumptions: 220 lb per PAX, LRC speed 500 nm Block fuel 9460 lb Block time 97.8 min TOGW 110960 lb
Max Range Block fuel 22000 lb Block time 268 min TOGW 123000 lb
UB3XX-ER
Weights & Loadings
Maximum Ramp Weight 139500 lb Maximum Takeoff Weight 139000 lb Maximum Landing Weight 118000 lb Max Zero-Fuel Weight 97000 lb Operationl Weight Empty 64000 lb Maximum Payload 33000 lb Maximum Usable Fuel: 45500 lb ** 6.75 lb per USG 6740 USG Payload at max. fuel 29700 lb
Wing Loading (MTOW) 120 lb/sq.ft Thrust (max) to Weight 0.29 lbf/lb Empty Weight/STD Accom. 427 lb/PAX OWE/MTOW Fraction 0.460 (MZFW-OWE)/MTOW Fractn 0.237 Max Fuel Fraction 0.326
Performance Engine Rating Takeoff Rating – Max 24000lbs Flat Rating ISA + 15 deg.C
Airfield Performance (MTOW/MLW) TOFL, ISA, SL 6562 ft TOFL, ISA+20ºC, 5000 ft WAT Limit LFL, ISA, SL 5250 ft Approach Speed (MLW) 132 KCAS
En route Perf: Climb (AEO, ISA, MTOW br.) Time to Climb to FL 350 17mins Time to Climb to ICA 17mins Initial Cruise Altitude 35000 ft
En route Performance: Cruise Long Range Cruise M0.80 / 459 KTAS High Speed Cruise M0.84 / 481 KTAS
Payload-Range Reserves Description FAR121,200 nm alt. Accommodtn / Weight ea. 150 PAX / 220 lb Design range for given accommodation [@ LRC]
3000 nm
Block Performance (given PAX, ISA, s.a.) Assumptions: 220 lb per PAX, LRC speed 500 nm Block fuel 9650 lb Block time 97.8 min TOGW 113270 lb
Max Range Block fuel 35300 lb Block time 425 min TOGW 139000 lb
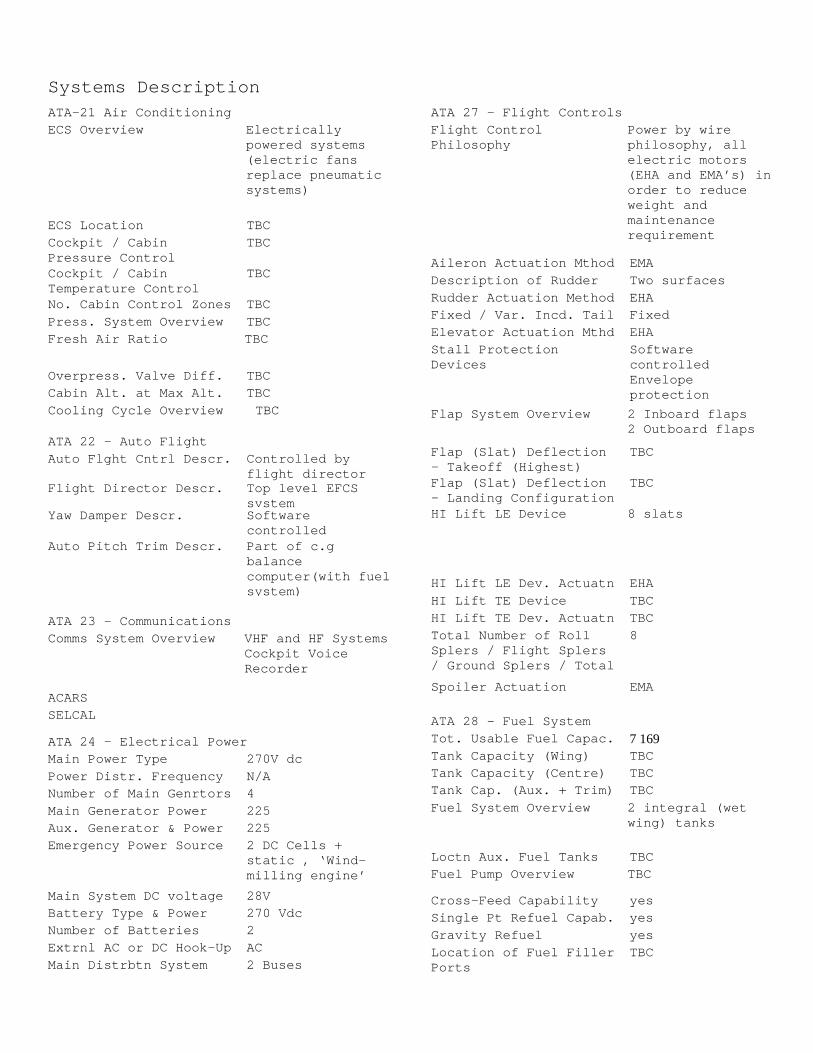
Systems Description ATA-21 Air Conditioning ECS Overview Electrically
powered systems (electric fans replace pneumatic systems)
ECS Location TBC Cockpit / Cabin Pressure Control
TBC
Cockpit / Cabin Temperature Control
TBC
No. Cabin Control Zones TBC Press. System Overview TBC Fresh Air Ratio TBC
Overpress. Valve Diff. TBC Cabin Alt. at Max Alt. TBC Cooling Cycle Overview TBC
ATA 22 - Auto Flight Auto Flght Cntrl Descr. Controlled by
flight directorFlight Director Descr. Top level EFCS
system Yaw Damper Descr. Software
controlled Auto Pitch Trim Descr. Part of c.g
balance computer(with fuel system)
ATA 23 - Communications Comms System Overview VHF and HF Systems
Cockpit Voice Recorder
ACARS SELCAL
ATA 24 - Electrical Power Main Power Type 270V dc Power Distr. Frequency N/A Number of Main Genrtors 4 Main Generator Power 225 Aux. Generator & Power 225 Emergency Power Source 2 DC Cells +
static , ‘Wind-milling engine’
Main System DC voltage 28V Battery Type & Power 270 Vdc Number of Batteries 2 Extrnl AC or DC Hook-Up AC Main Distrbtn System 2 Buses
ATA 27 - Flight Controls Flight Control Philosophy
Power by wire philosophy, all electric motors (EHA and EMA’s) in order to reduce weight and maintenance requirement
Aileron Actuation Mthod EMA Description of Rudder Two surfaces Rudder Actuation Method EHA Fixed / Var. Incd. Tail Fixed Elevator Actuation Mthd EHA Stall Protection Devices
Software controlled Envelope protection
Flap System Overview 2 Inboard flaps 2 Outboard flaps
Flap (Slat) Deflection - Takeoff (Highest)
TBC
Flap (Slat) Deflection - Landing Configuration
TBC
HI Lift LE Device 8 slats
HI Lift LE Dev. Actuatn EHA HI Lift TE Device TBC HI Lift TE Dev. Actuatn TBC Total Number of Roll Splers / Flight Splers / Ground Splers / Total
8
Spoiler Actuation EMA ATA 28 - Fuel System Tot. Usable Fuel Capac. 7 169 Tank Capacity (Wing) TBC Tank Capacity (Centre) TBC Tank Cap. (Aux. + Trim) TBC Fuel System Overview 2 integral (wet
wing) tanks
Loctn Aux. Fuel Tanks TBC Fuel Pump Overview TBC
Cross-Feed Capability yes Single Pt Refuel Capab. yes Gravity Refuel yes Location of Fuel Filler Ports
TBC

ATA 29 - Hydraulic Power Hydraulic System Overview
One control line
Hydraulic Bay Location TBC Number of Main Systems 1 Hydraulic Fluid Type(s) TBC Nominal Working 5000psi Hydraulic Pumps TBC
Hydraulically Actuated Items
Undercarriage
ATA 30 - Ice and Rain Protection Anti-Ice System Overview
• electro-impulsive de-icing system
• electrical: windshield, probes
Wing electro-impulsive de-icing system
H-tail no protection V-tail no protection Nacelle Intake 5th stage engine
bleed air Probes & Sensors electrically
heated Windshield • electrically
heated for: anti-icing, defogging, defrost
• wipers for rain protection
ATA 32 - Landing Gear Landing Gear Actuation retractable
tricycle type Emerg. Extension Procedure
• manual release • gravity extension
Main Landing Gear Type TBC Location of MLG In fairings MLG Strut Type oleo-pneumatic Tire Size - MLG 46X16 – 20 in. Tire Pressure - MLG 133 psi MLG Braking System TBC Nose Landing Gear Type TBC Spatial Direction for Retraction of NLG
forward
NLG Strut Type oleo-pneumatic Tire Size - NLG 36X11 -16 in. Tire Pressure - NLG 85psi NLG Steering Overview TBC
ATA 34 - Navigation Number of ADS Computers TBC Number of AHRS TBC STD / OPT GPS STD EFIS Displays Overview TBC Number of IRS TBC STD / OPT EGPWS TBC STD / OPT TCAS STD No. of Radio Altimeters TBC STD / OPT HUD TBC STD / OPT CatIIIa Appr. TBC STD / OPT CatIIIb Appr. OPT STD / OPT Auto land TBC GPWS / Wind Shear Detection
STD
Digital Weather Radar STD STD / OPT EVS TBC STD / OPT MLS TBC Number of VHF Radios TBC No. of HF Transceivers TBC Number of ADF Receivers TBC No. of DME Transceivers TBC STD / OPT Mode S Trnspn TBC STD / OPT Coupled VNAV TBC RNP Capability TBC Overview of FMS System 2 FMS
ATA 35 - Oxygen Oxygen System Overview TBC
ATA 36 - Pneumatics Pneumatic System Overvw None Location of Bleed Ports and Capacity
Bleed less engine
Pneumatic Source & Use None
Bleed Leak Detection n/a
ATA 39 - Electrical / Electronic Panels Loc. of Major Elec. Components & System
TBC
Main Display Panels TBC Main Display Size (HxW) TBC No. Main Display Panels TBC

Avionics Suite Designtn TBC
Avionics Suite Manufacturer
TBC
Avionics Rack Location TBC
ATA 49 - Auxiliary Power Unit Std / Opt APU tbc APU Designation tbc APU Manufacturer Honeywell APU Location Fuselage rear APU Reqrd for Dispatch tbc APU Operation & Control tbc APU Fire Extinguishing tbc APU Max Start. Altitude 41000ft APU Max Oper. Altitude 41000ft
ATA 53, 54, 55 & 57 - Structure Strctrl Press. Diffrntl 8.6 psi Struc. Life cycle / hrs 75000 cyc / Structure Overview Conventional
aluminium constructions with composite components
Structure & Material Nacelle / Pylon
TBC
Struct. & Material - Horizontal tail
2 spars, CF construction
Struct. & Material - Elevator
1 piece, carbon fibre
Struct. & Material - Vertical tail
2 spars, carbon fibre
Struct. & Material - Rudder
1 piece, carbon fibre
Structure & Material - Wing
2 spars, 1 auxiliary spar config, material - TBC
Wing Tip Geometry Type Conventional, wing tips optional
Structure & Material - Aileron
Carbon fibre
Structure & Material HI Lift LE Device
TBC
Structure & Material HI Lift TE Device
TBC
Structure & Material Speed Brakes
Carbon fibre
ATA 71-80 - Engine Engine Manufacturer CFM International Engine Designation CFM56-5 rescaled
Turbofan No. of Stages Fan/Boost/Compaxial + Compcent//HPT/LPT
1/4 /9 + 0/ 1/5
Number of Engines 2 Mounting Point Under wing Max. Takeoff Thrust TBC Flat Rating Temperature ISA + 15 Thrust Reverser Overview
TBC
Bypass Ratio >6 Overall Pressure Ratio TBC TSFC at M0.80, FL 350 TBC FADEC or DEEC Dual channel FADEC ETOPS Capability 90 mins External Noise, MTOW (ICAO Annex 16) Takeoff / Stage 3 Limit 83.8 / 90.3 EPNdB Sideline / Stage 3 Lim. 90.9 / 96 EPNdB Approach / Stage 3 Lim. 95.8 /99.8 EPNdB Cumultv Margin to Stg 3 15.7 EPN dB Emissions (ICAO LTO cycle) NOx tbc CO tbc Unburnt Hydrocarbons tbc
Group 3 Preliminary Engineering Design Report
CONTENTS 01 SUMMARY OF MARKETING REQUIREMENTS AND OBJECTIVES (MR&O) 01-01-00 Overall Introduction to the problem 1 01-02-00 Assumed Top Level Aircraft Requirements (TLARS) and Assumptions
(TLAAS) 1 01-03-00 Identification of Key Requirements and Drivers 3 01-03-10 Quality Function Deployment 3 02 CONCEPT AND TECHNOLOGY SELECTION 02-01-00 Concept Options Considered 5 02-01-10 Brainstorming 02-02-00 Concept Down-Selection 7 02-02-01 Process 02-02-02 Analysis and Reasoning 02-02-03 Benefit and Risk Assessment 02-02-04 Results 02-03-00 Technology Options Considered 16 02-03-01 Brainstorming 02-04-00 Technology Down-Selection 18 02-04-01 Process 02-04-02 Analysis and Reasoning 02-04-03 Benefit and Risk Assessment 02-04-04 Results 03 CONFIGURATION DESCRIPTION 03-01-00 Family Concept 19 03-02-00 Overall Aircraft 19 03-02-01 Three View and General Arrangement 03-02-02 Operational Limitations 03-02-03 Description of the Key Features of the Overall Aircraft Configuration 03-02-04 Discussion of Configuration 03-02-05 Sizing Process 03-02-06 Trade Studies 03-02-07 Requirements Analysis 03-02-08 Integration Issues 03-03-00 Component Description 21 03-03-10 Wings 03-03-11 Description of Key Features 03-03-12 Planform and Structural Drawing 03-03-13 Discussion of Wing Design Philosophy 03-03-14 Structural Architecture 03-03-15 Aerodynamic Design
i
Group 3 Preliminary Engineering Design Report
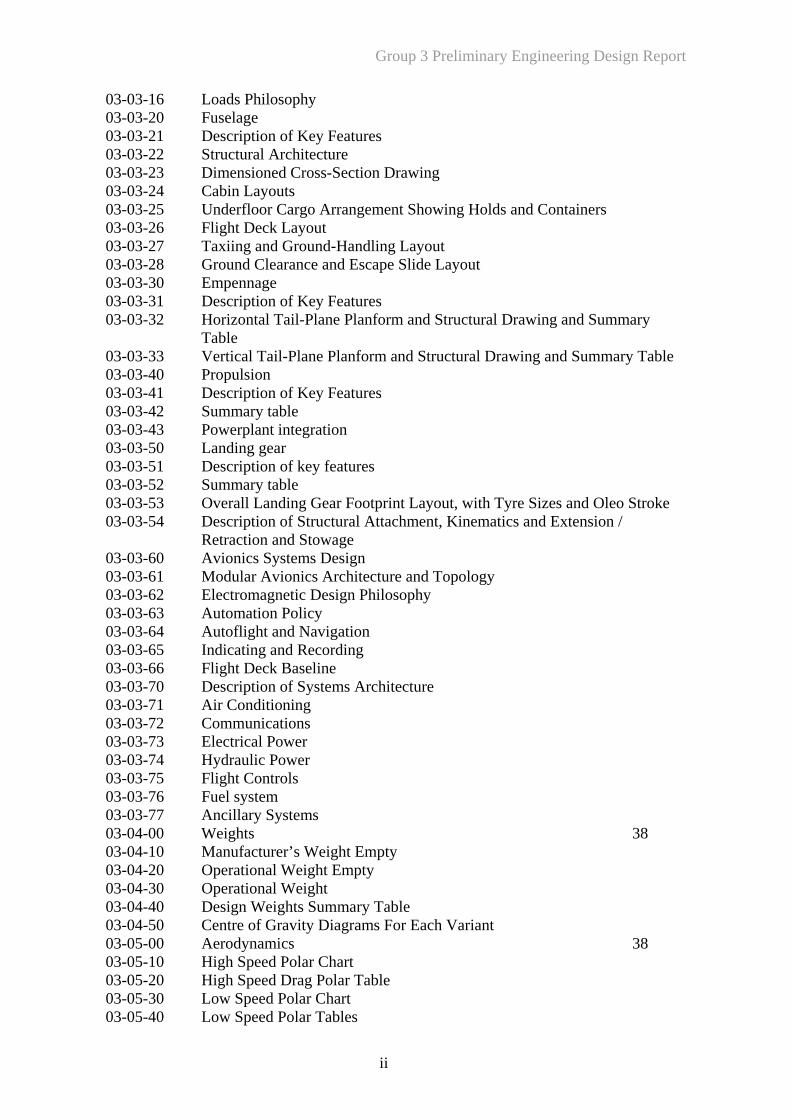
03-03-16 Loads Philosophy 03-03-20 Fuselage 03-03-21 Description of Key Features 03-03-22 Structural Architecture 03-03-23 Dimensioned Cross-Section Drawing 03-03-24 Cabin Layouts 03-03-25 Underfloor Cargo Arrangement Showing Holds and Containers 03-03-26 Flight Deck Layout 03-03-27 Taxiing and Ground-Handling Layout 03-03-28 Ground Clearance and Escape Slide Layout 03-03-30 Empennage 03-03-31 Description of Key Features 03-03-32 Horizontal Tail-Plane Planform and Structural Drawing and Summary
Table 03-03-33 Vertical Tail-Plane Planform and Structural Drawing and Summary Table 03-03-40 Propulsion 03-03-41 Description of Key Features 03-03-42 Summary table 03-03-43 Powerplant integration 03-03-50 Landing gear 03-03-51 Description of key features 03-03-52 Summary table 03-03-53 Overall Landing Gear Footprint Layout, with Tyre Sizes and Oleo Stroke 03-03-54 Description of Structural Attachment, Kinematics and Extension /
Retraction and Stowage 03-03-60 Avionics Systems Design 03-03-61 Modular Avionics Architecture and Topology 03-03-62 Electromagnetic Design Philosophy 03-03-63 Automation Policy 03-03-64 Autoflight and Navigation 03-03-65 Indicating and Recording 03-03-66 Flight Deck Baseline 03-03-70 Description of Systems Architecture 03-03-71 Air Conditioning 03-03-72 Communications 03-03-73 Electrical Power 03-03-74 Hydraulic Power 03-03-75 Flight Controls 03-03-76 Fuel system 03-03-77 Ancillary Systems 03-04-00 Weights 38 03-04-10 Manufacturer’s Weight Empty 03-04-20 Operational Weight Empty 03-04-30 Operational Weight 03-04-40 Design Weights Summary Table 03-04-50 Centre of Gravity Diagrams For Each Variant 03-05-00 Aerodynamics 38 03-05-10 High Speed Polar Chart 03-05-20 High Speed Drag Polar Table 03-05-30 Low Speed Polar Chart 03-05-40 Low Speed Polar Tables
ii
Group 3 Preliminary Engineering Design Report
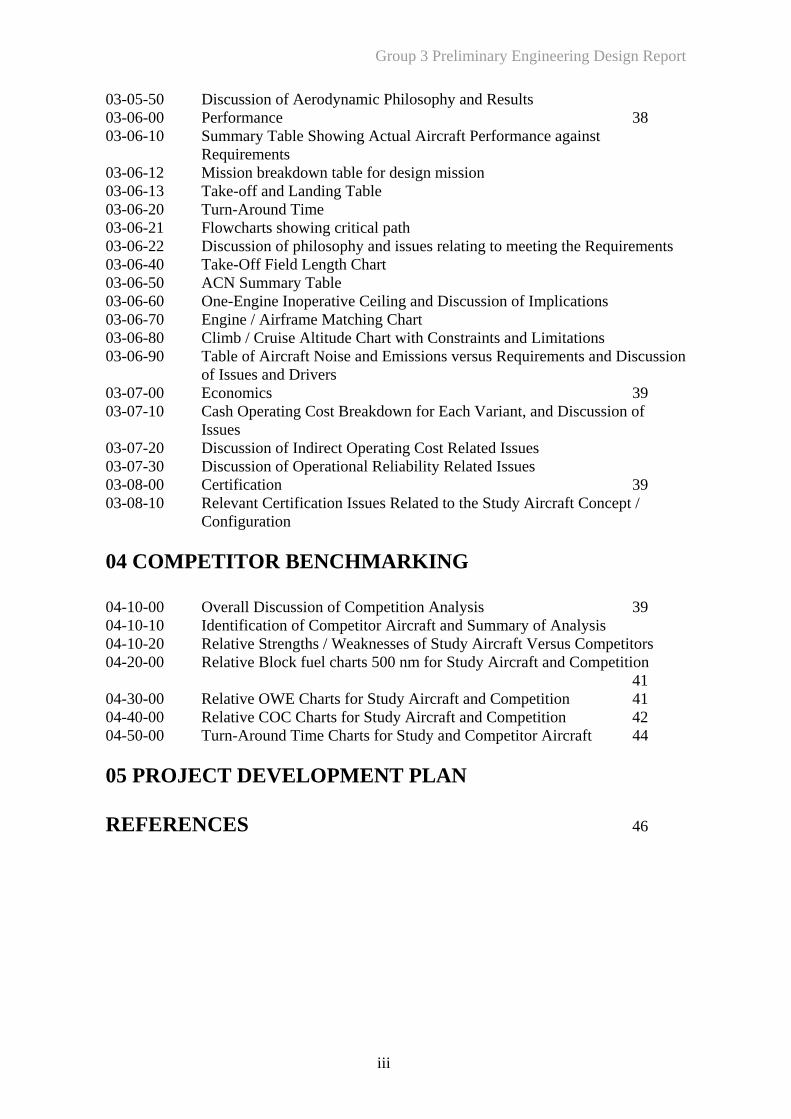
03-05-50 Discussion of Aerodynamic Philosophy and Results 03-06-00 Performance 38 03-06-10 Summary Table Showing Actual Aircraft Performance against
Requirements 03-06-12 Mission breakdown table for design mission 03-06-13 Take-off and Landing Table 03-06-20 Turn-Around Time 03-06-21 Flowcharts showing critical path 03-06-22 Discussion of philosophy and issues relating to meeting the Requirements 03-06-40 Take-Off Field Length Chart 03-06-50 ACN Summary Table 03-06-60 One-Engine Inoperative Ceiling and Discussion of Implications 03-06-70 Engine / Airframe Matching Chart 03-06-80 Climb / Cruise Altitude Chart with Constraints and Limitations 03-06-90 Table of Aircraft Noise and Emissions versus Requirements and Discussion
of Issues and Drivers 03-07-00 Economics 39 03-07-10 Cash Operating Cost Breakdown for Each Variant, and Discussion of
Issues 03-07-20 Discussion of Indirect Operating Cost Related Issues 03-07-30 Discussion of Operational Reliability Related Issues 03-08-00 Certification 39 03-08-10 Relevant Certification Issues Related to the Study Aircraft Concept /
Configuration 04 COMPETITOR BENCHMARKING 04-10-00 Overall Discussion of Competition Analysis 39 04-10-10 Identification of Competitor Aircraft and Summary of Analysis 04-10-20 Relative Strengths / Weaknesses of Study Aircraft Versus Competitors 04-20-00 Relative Block fuel charts 500 nm for Study Aircraft and Competition 41 04-30-00 Relative OWE Charts for Study Aircraft and Competition 41 04-40-00 Relative COC Charts for Study Aircraft and Competition 42 04-50-00 Turn-Around Time Charts for Study and Competitor Aircraft 44 05 PROJECT DEVELOPMENT PLAN REFERENCES 46
iii
Group 3 Preliminary Engineering Design Report
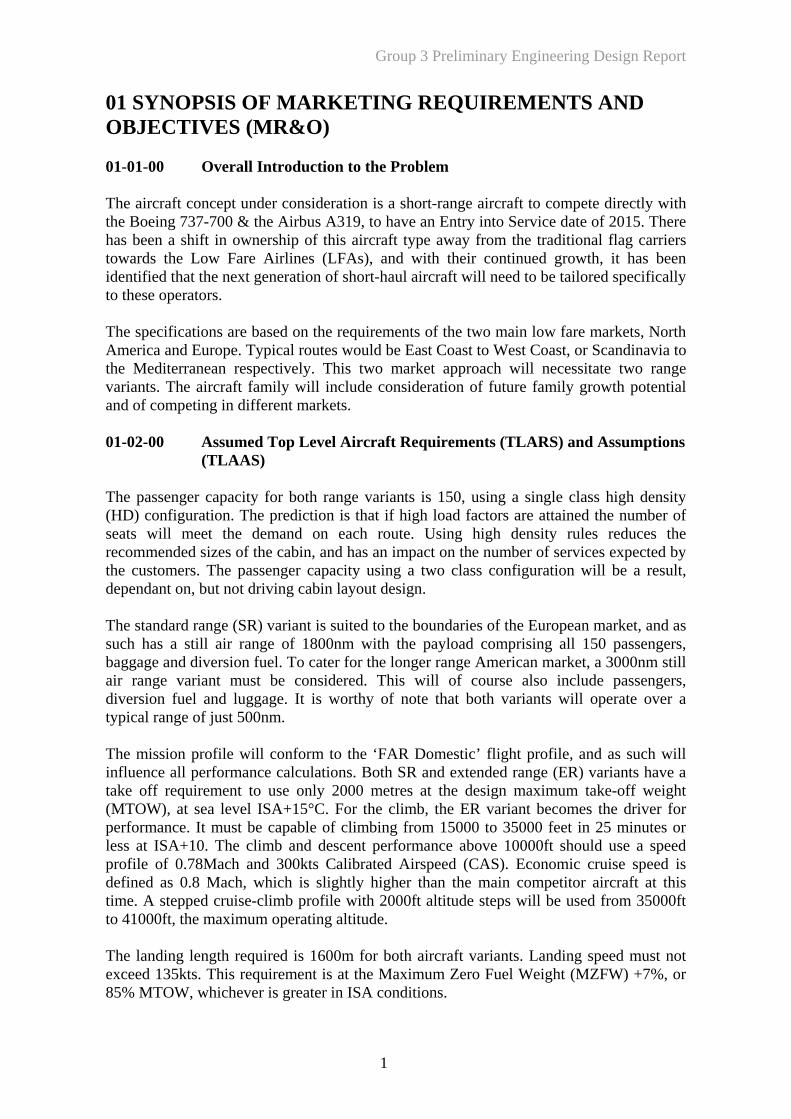
01 SYNOPSIS OF MARKETING REQUIREMENTS AND OBJECTIVES (MR&O) 01-01-00 Overall Introduction to the Problem The aircraft concept under consideration is a short-range aircraft to compete directly with the Boeing 737-700 & the Airbus A319, to have an Entry into Service date of 2015. There has been a shift in ownership of this aircraft type away from the traditional flag carriers towards the Low Fare Airlines (LFAs), and with their continued growth, it has been identified that the next generation of short-haul aircraft will need to be tailored specifically to these operators. The specifications are based on the requirements of the two main low fare markets, North America and Europe. Typical routes would be East Coast to West Coast, or Scandinavia to the Mediterranean respectively. This two market approach will necessitate two range variants. The aircraft family will include consideration of future family growth potential and of competing in different markets. 01-02-00 Assumed Top Level Aircraft Requirements (TLARS) and Assumptions
(TLAAS) The passenger capacity for both range variants is 150, using a single class high density (HD) configuration. The prediction is that if high load factors are attained the number of seats will meet the demand on each route. Using high density rules reduces the recommended sizes of the cabin, and has an impact on the number of services expected by the customers. The passenger capacity using a two class configuration will be a result, dependant on, but not driving cabin layout design. The standard range (SR) variant is suited to the boundaries of the European market, and as such has a still air range of 1800nm with the payload comprising all 150 passengers, baggage and diversion fuel. To cater for the longer range American market, a 3000nm still air range variant must be considered. This will of course also include passengers, diversion fuel and luggage. It is worthy of note that both variants will operate over a typical range of just 500nm. The mission profile will conform to the ‘FAR Domestic’ flight profile, and as such will influence all performance calculations. Both SR and extended range (ER) variants have a take off requirement to use only 2000 metres at the design maximum take-off weight (MTOW), at sea level ISA+15°C. For the climb, the ER variant becomes the driver for performance. It must be capable of climbing from 15000 to 35000 feet in 25 minutes or less at ISA+10. The climb and descent performance above 10000ft should use a speed profile of 0.78Mach and 300kts Calibrated Airspeed (CAS). Economic cruise speed is defined as 0.8 Mach, which is slightly higher than the main competitor aircraft at this time. A stepped cruise-climb profile with 2000ft altitude steps will be used from 35000ft to 41000ft, the maximum operating altitude. The landing length required is 1600m for both aircraft variants. Landing speed must not exceed 135kts. This requirement is at the Maximum Zero Fuel Weight (MZFW) +7%, or 85% MTOW, whichever is greater in ISA conditions.
1
Group 3 Preliminary Engineering Design Report
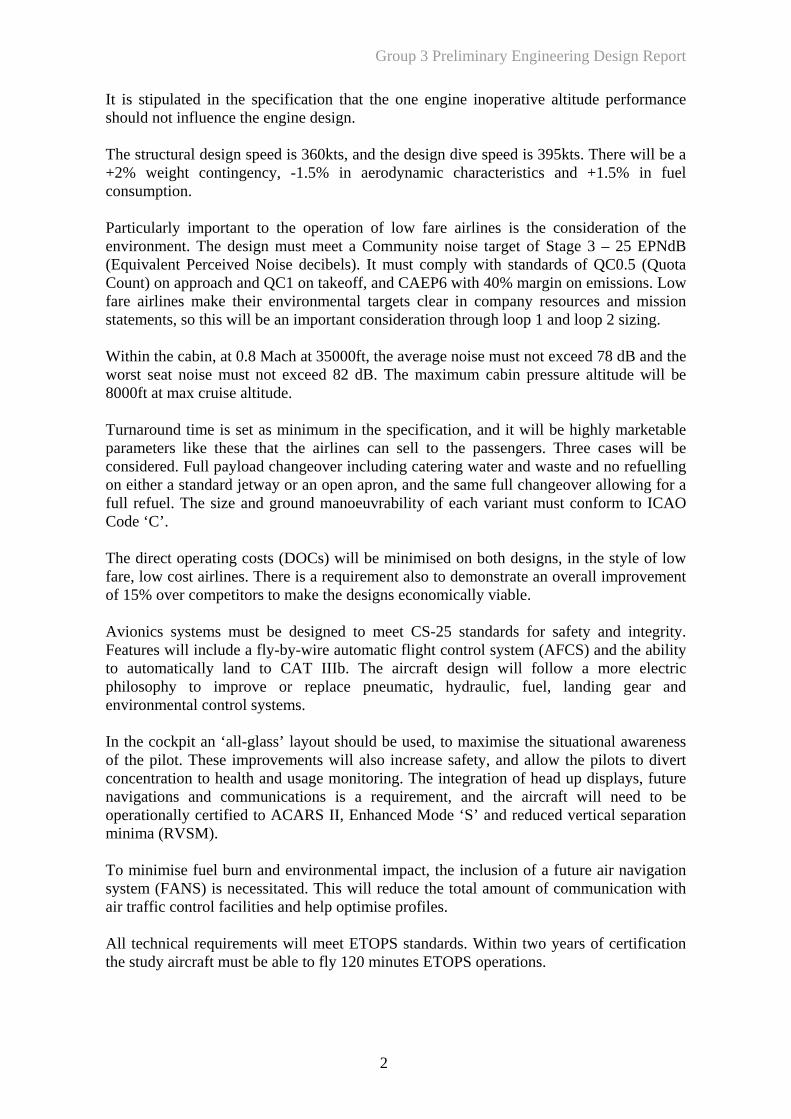
It is stipulated in the specification that the one engine inoperative altitude performance should not influence the engine design. The structural design speed is 360kts, and the design dive speed is 395kts. There will be a +2% weight contingency, -1.5% in aerodynamic characteristics and +1.5% in fuel consumption. Particularly important to the operation of low fare airlines is the consideration of the environment. The design must meet a Community noise target of Stage 3 – 25 EPNdB (Equivalent Perceived Noise decibels). It must comply with standards of QC0.5 (Quota Count) on approach and QC1 on takeoff, and CAEP6 with 40% margin on emissions. Low fare airlines make their environmental targets clear in company resources and mission statements, so this will be an important consideration through loop 1 and loop 2 sizing. Within the cabin, at 0.8 Mach at 35000ft, the average noise must not exceed 78 dB and the worst seat noise must not exceed 82 dB. The maximum cabin pressure altitude will be 8000ft at max cruise altitude. Turnaround time is set as minimum in the specification, and it will be highly marketable parameters like these that the airlines can sell to the passengers. Three cases will be considered. Full payload changeover including catering water and waste and no refuelling on either a standard jetway or an open apron, and the same full changeover allowing for a full refuel. The size and ground manoeuvrability of each variant must conform to ICAO Code ‘C’. The direct operating costs (DOCs) will be minimised on both designs, in the style of low fare, low cost airlines. There is a requirement also to demonstrate an overall improvement of 15% over competitors to make the designs economically viable. Avionics systems must be designed to meet CS-25 standards for safety and integrity. Features will include a fly-by-wire automatic flight control system (AFCS) and the ability to automatically land to CAT IIIb. The aircraft design will follow a more electric philosophy to improve or replace pneumatic, hydraulic, fuel, landing gear and environmental control systems. In the cockpit an ‘all-glass’ layout should be used, to maximise the situational awareness of the pilot. These improvements will also increase safety, and allow the pilots to divert concentration to health and usage monitoring. The integration of head up displays, future navigations and communications is a requirement, and the aircraft will need to be operationally certified to ACARS II, Enhanced Mode ‘S’ and reduced vertical separation minima (RVSM). To minimise fuel burn and environmental impact, the inclusion of a future air navigation system (FANS) is necessitated. This will reduce the total amount of communication with air traffic control facilities and help optimise profiles. All technical requirements will meet ETOPS standards. Within two years of certification the study aircraft must be able to fly 120 minutes ETOPS operations.
2
Group 3 Preliminary Engineering Design Report
3
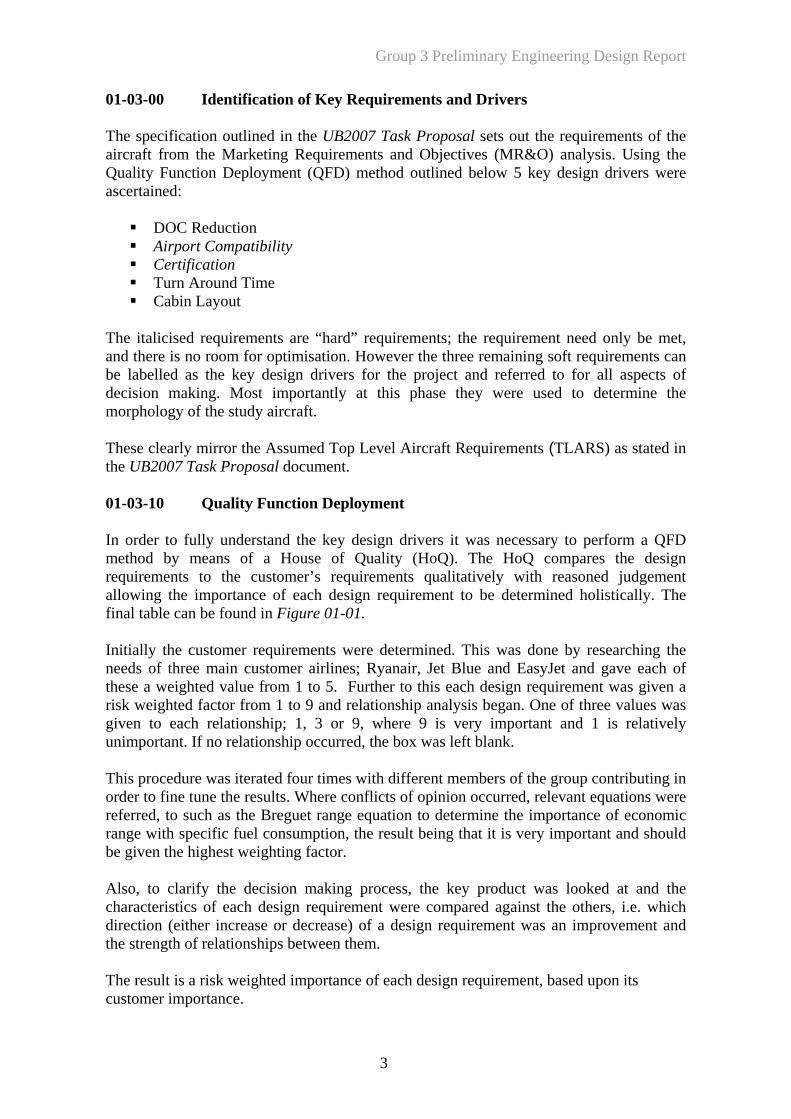
01-03-00 Identification of Key Requirements and Drivers The specification outlined in the UB2007 Task Proposal sets out the requirements of the aircraft from the Marketing Requirements and Objectives (MR&O) analysis. Using the Quality Function Deployment (QFD) method outlined below 5 key design drivers were ascertained:
DOC Reduction Airport Compatibility Certification Turn Around Time Cabin Layout
The italicised requirements are “hard” requirements; the requirement need only be met, and there is no room for optimisation. However the three remaining soft requirements can be labelled as the key design drivers for the project and referred to for all aspects of decision making. Most importantly at this phase they were used to determine the morphology of the study aircraft. These clearly mirror the Assumed Top Level Aircraft Requirements (TLARS) as stated in the UB2007 Task Proposal document. 01-03-10 Quality Function Deployment In order to fully understand the key design drivers it was necessary to perform a QFD method by means of a House of Quality (HoQ). The HoQ compares the design requirements to the customer’s requirements qualitatively with reasoned judgement allowing the importance of each design requirement to be determined holistically. The final table can be found in Figure 01-01. Initially the customer requirements were determined. This was done by researching the needs of three main customer airlines; Ryanair, Jet Blue and EasyJet and gave each of these a weighted value from 1 to 5. Further to this each design requirement was given a risk weighted factor from 1 to 9 and relationship analysis began. One of three values was given to each relationship; 1, 3 or 9, where 9 is very important and 1 is relatively unimportant. If no relationship occurred, the box was left blank. This procedure was iterated four times with different members of the group contributing in order to fine tune the results. Where conflicts of opinion occurred, relevant equations were referred, to such as the Breguet range equation to determine the importance of economic range with specific fuel consumption, the result being that it is very important and should be given the highest weighting factor. Also, to clarify the decision making process, the key product was looked at and the characteristics of each design requirement were compared against the others, i.e. which direction (either increase or decrease) of a design requirement was an improvement and the strength of relationships between them. The result is a risk weighted importance of each design requirement, based upon its customer importance.
Group 3 Preliminary Engineering Design Report
4
Figure 01-01: House of Quality
Group 3 Preliminary Engineering Design Report
02 CONCEPT AND TECHNOLOGY SELECTION 02-01-00 Concept Options Considered At this stage, a brainstorming session was conducted and the group considered a number of conceptual configurations, including several novel designs. These configurations were categorised into the major components of the aircraft i.e. wing type, wing location, fuselage shape, engine position and empennage type. 02-01-10 Brainstorming With the components in mind, the configurations team divided into five groups, each researching into greater detail. The results were as follows. Type of Wing Canards: 1, 2, 3.
• Reduces overall drag by reducing induced drag on the main wing • Disadvantages for stability • Lower wing aerodynamic efficiency • Faster approach speed; long take-off and landing field lengths are required
Forward Swept: 4, 5.
• Highly manoeuvrable at transonic speeds • Improved aileron effectiveness • Single cargo bay, due to wing box position • Requires reinforced structure to counteract root bending moment • Uneven span-wise lift distribution at low speeds
Crank/Kink in Leading Edge: 6
• Increased aerodynamic efficiency • Reduced noise footprint • Reduced drag • Requires structural reinforcement to distribute ‘kink loads’
Oblique Wing: 7, 8.
• Simpler manufacturing • Avoids shift in aerodynamic centre • Increased complexity of control mechanism • Can result in poor handling qualities
Joined Wing: 9
• Lightweight • Low induced drag • Direct side force control capability allows for lateral movement. • Fuel system integration problems • Wing/fuselage joint poses span-wise torque problem in the event of crosswind
5
Group 3 Preliminary Engineering Design Report
Wing Location Low Wing:
• Simple maintenance • Low ground clearance restricts engine size. • Undercarriage is easy to store, but must be stored in fixed position.
High Wing: 10.
• Improved aerodynamic wing due to clean upper wing surface • Enhanced lateral control capability • No restriction on landing gear position • Reinforcement of structure required for undercarriage • Larger wings and flaps can be accommodated • Fuel system becomes heavy if anhedral wing layout is adopted
Fuselage Shape Blended-Wing Body: 11, 12, 13, 14, 15.
• Large payload capability • Large reduction in fuel consumption, thus low weight and DOC • High technology solution, thus high risk • Difficult to pressurise cabin • Complicated control system due to stability problems • Problems with implementation of emergency evacuation requirements
Cylindrical:
• Tried and tested configuration • Difficult to meet 15% reduction in DOC target
Double Bubble: 16, 17.
• Increased cabin and cargo capacity • Larger fuselage mass and skin friction drag
Elliptic: 18.
• Increased fuselage cross-section width • Lower induced drag • Manufacturing problems • Problems with pressurisation
Empennage Type T-Tail: 19.
• Improved aerodynamic efficiency and control • Shorter take-off and landing field length requirement. • Structural reinforcement required • Difficult to implement control surfaces
V-Tail:
• Fewer control surfaces leads to reduced weight and drag
6
Group 3 Preliminary Engineering Design Report
• Stability problems require a complicated control system • Rear fuselage will need reinforcement
Cruciform Tail:
• As T-tail, with less structural reinforcement requirement • Unavoidable deep stall
Standard: • Easily implemented control surfaces • Interference drag from engines
Engine Position Engine position significantly affects the aircraft centre of gravity (c.g.). Engine placement can enable the wings or stabilisers to shield noise from the ground. Over wing
• Theoretical reduction in engine noise on the ground. • Wing blocks access to the engines for maintenance and ground checks. • Upper surface of the wing is interrupted and this severely affects the performance
of the wing. Strong shock waves result from such an installation, increasing drag and flow separation
Under wing
• Higher ground clearance, higher bypass ratio engines can be used. • The T-tail configuration also removes the effect of the jet on the rear stabilisers.
Rear Mounted • Pneumatic lines running from the APU to the engines are significantly shortened. • Supporting structure at the rear of the fuselage shifts the c.g. further back. • This structure takes up space which could otherwise be used for a trim tank.
02-02-00 Concept Down-Selection It is now apparent that when designing a new aircraft there is an extensive array of parameters to consider and optimise. The aim of this section of the report is to portray the general methodology adopted for the down-select process. 02-02-01 Process Definition of initial morphologies 20
During the first few weeks of the project, the configurations team carried out research on the extensive range of aircraft design parameters and concepts, recording the advantages and disadvantages of each. This allowed the progression to the next stage of the design process, which was to determine which morphology showed the most potential to meet the design specification whilst possessing the potential to reduce DOCs. Some morphologies could be disregarded immediately, for example, the Blended-wing body would hold a great deal of technical uncertainty and safety issues (e.g. slow evacuation time) that would make entry into the very conservative civil aircraft market by 2015 difficult. Another
7
Group 3 Preliminary Engineering Design Report
example is that of multi-hull aircraft, which are typically for larger passenger capacity aircraft than specified in this project and also possess technical difficulties concerned with the aerodynamic and structural analysis of the wing between the fuselages. Airflow problems could also affect the control surfaces as well as flight dynamics, and twisting of the wing due to the fuselage dynamics would result in a considerable increase in structural weight. The aim at this stage was to reduce all the feasible concepts and design parameters into a total of nine completely specified morphologies, for which detailed comparison analysis could be performed. The nine concepts developed were as follows:
• Conventional aircraft configuration (under-wing engines) • Configuration with rear-mounted engines and a T-tail • Conventional aircraft with a cruciform tail • Conventional aircraft with a V-tail • Conventional aircraft with leading edge kink/crank • High wing aircraft with a T-tail • Canard configuration • Forward-swept wing with rear-mounted engines and a T-tail • Joined-wing configuration
The inclusion of the purely conventional aircraft in this list is not only due to this morphology being highly successful in the aviation industry but also to provide a general means of comparing different concepts with a potentially optimised standard datum. It should therefore provide a good indication of whether risk involved with other morphologies will ‘pay off’. Refinement of considered morphologies 20
Even after further research into these aircraft, it was difficult to compare such a large selection. Therefore it was decided that the research would be used to qualitatively select five or six configurations from this listing to analyse in detail. The canard configuration was eliminated due to natural instability; a quality more suited to fighter aircraft, and therefore would require more advanced systems and constant trim control. Also, it is difficult to prevent the canard interfering with the flow over the main wing, which creates the vast majority of the lift. This may create a negative impact on lift-to-drag ratios and other aerodynamic properties. The V-tail configuration was also removed from further consideration as although having only two tail surfaces rather than three is an aerodynamic and weight advantage, the V-tail would result in a need to significantly strengthen the fuselage (increasing structural weight) due to its mounting position and the coupling effects of the moments induced when the control surfaces are deflected. Finally the cruciform tail configuration and the conventional design with rear-engines and a T-tail were combined, as it was determined that it is perfectly viable to use a cruciform-tail in conjunction with rear-mounted engines. This morphology has significant advantages over the T-tail configuration with rear-engines, including a lighter empennage, reduced danger of the deep stall that is inherent in T-tail configurations (deep stall occurs
8
Group 3 Preliminary Engineering Design Report
at high angles of attack, causing the stalling wing to form turbulent flow over the tail-plane making recovery more difficult). The final six morphologies were as follows:
• Conventional/Standard configuration • Aircraft with rear-mounted engines and a cruciform tail • Conventional aircraft with leading edge kink/crank • High wing aircraft with a T-tail • Forward-swept wing with rear-engines and a T-tail • Joined-wing configuration
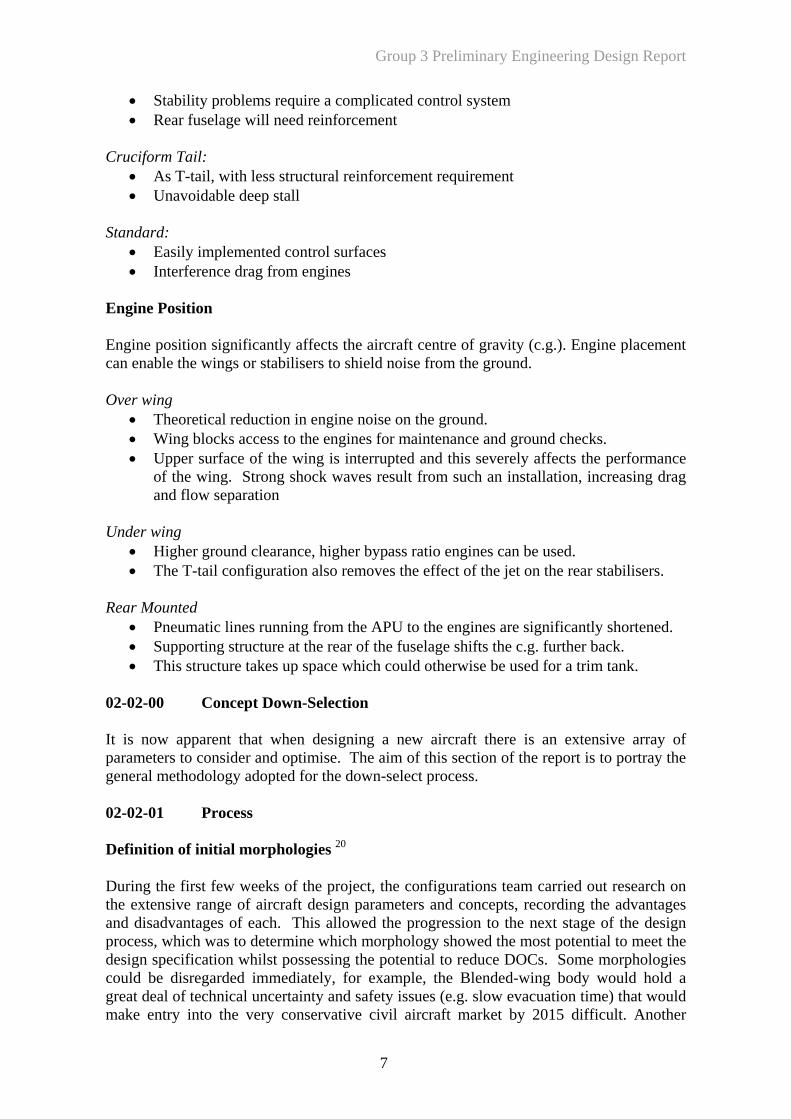
The configurations team was reduced to three members who proceeded to compare the aircraft using the strict comparison table procedures discussed in the next section of this report. Figures 02-01 to 02-06 show the general layout of the six morphologies remaining after this initial down-select process. However, there is no specific information on systems or cabin layouts as these can usually be applied to any morphology so are considered at a later design stage.
• Weight saving purely from composites and more electric systems. • Reduction in drag using devices such as vortex generators and wing tips to reduce boundary layer thickness and trailing vortices, respectively. • Two engines as provide adequate thrust for size of aircraft and keeps maintenance simple. • Problem with ground clearance if higher bypass ratio engines used.
Figure 02-01: Standard Configuration
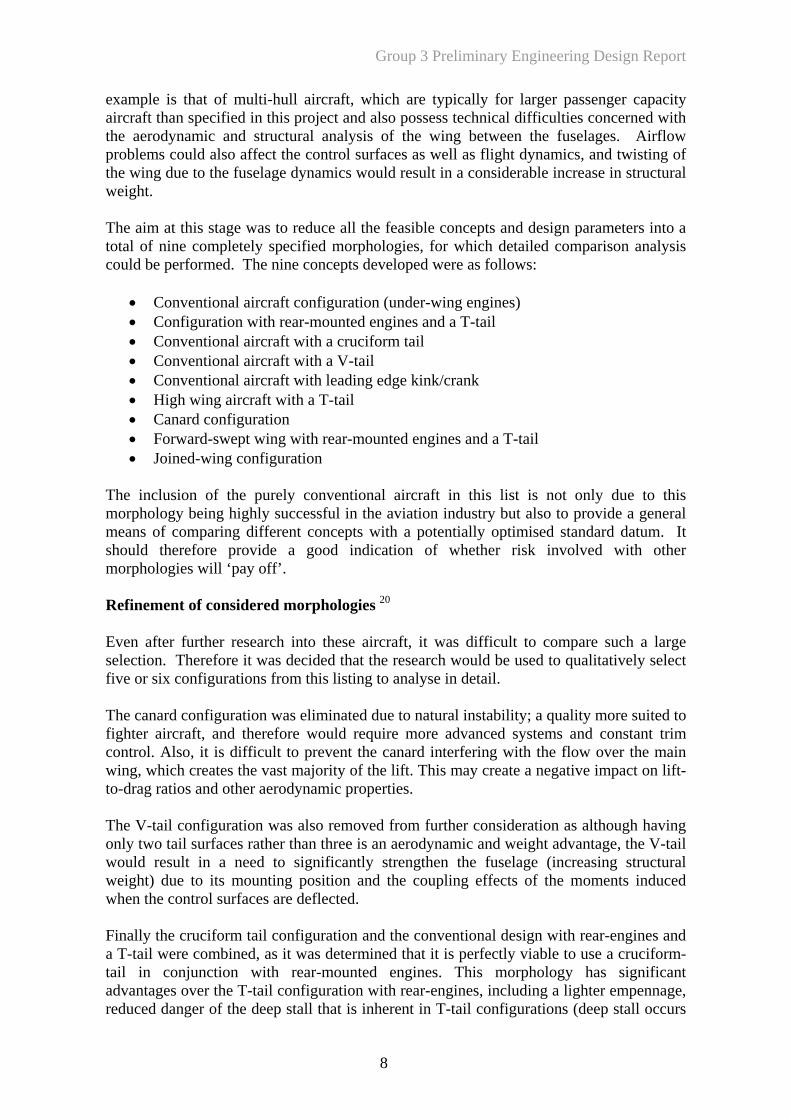
• Weight saving purely from composites and more electric systems. • Improvement in lift/drag as clean wing surface and tail is further from downwash from wing i.e. less interference drag. • Higher bypass engines possible. • Strengthening empennage for family variants is more significant.
Figure 02-02: Rear-mounted engines and cruciform tail configuration
9
Group 3 Preliminary Engineering Design Report
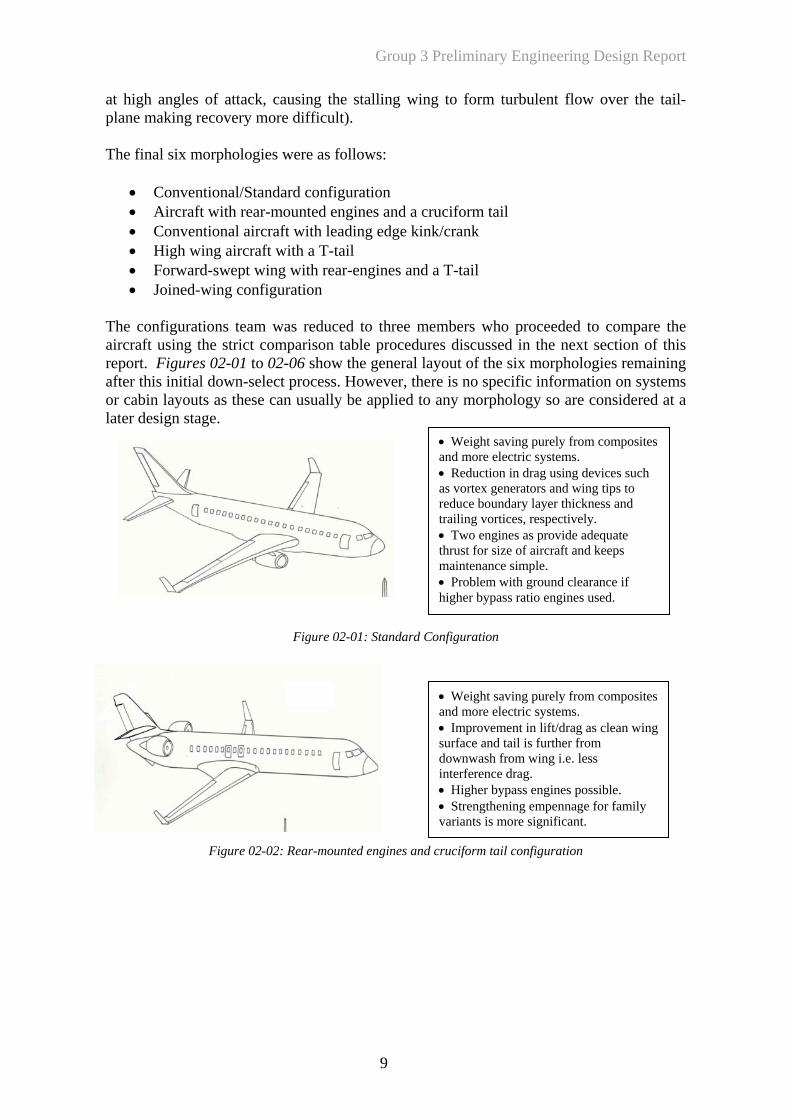
• Weight saving purely from composites and more electric systems. • Kink can help straighten flow across wing, hence reducing span-wise flow that would lead to an increase in boundary layer thickness, increase in drag, reduction of aileron effectiveness and increased risk of tip stall. 20 • Heavier structure at kink. • Slat deployment needs considering. • Restriction on engine bypass ratio.
Figure 02-03: Leading-edge kink configuration
• Weight saving from composites and more electric systems. • Possibility of higher bypass ratio engines. • T-tail out of region where interference drag would be felt. • Must consider cabin arrangement around wing box. • Upper surface of wing undisturbed and high Oswald’s factor for high wing aircraft so lift/drag Ratio can be higher. • Composite fuselage difficult as low ground clearance and so probability of impact damage is high. • Anhedral wing may result in requirement for additional fuel systems.
Figure 02-04: High wing T-tail configuration
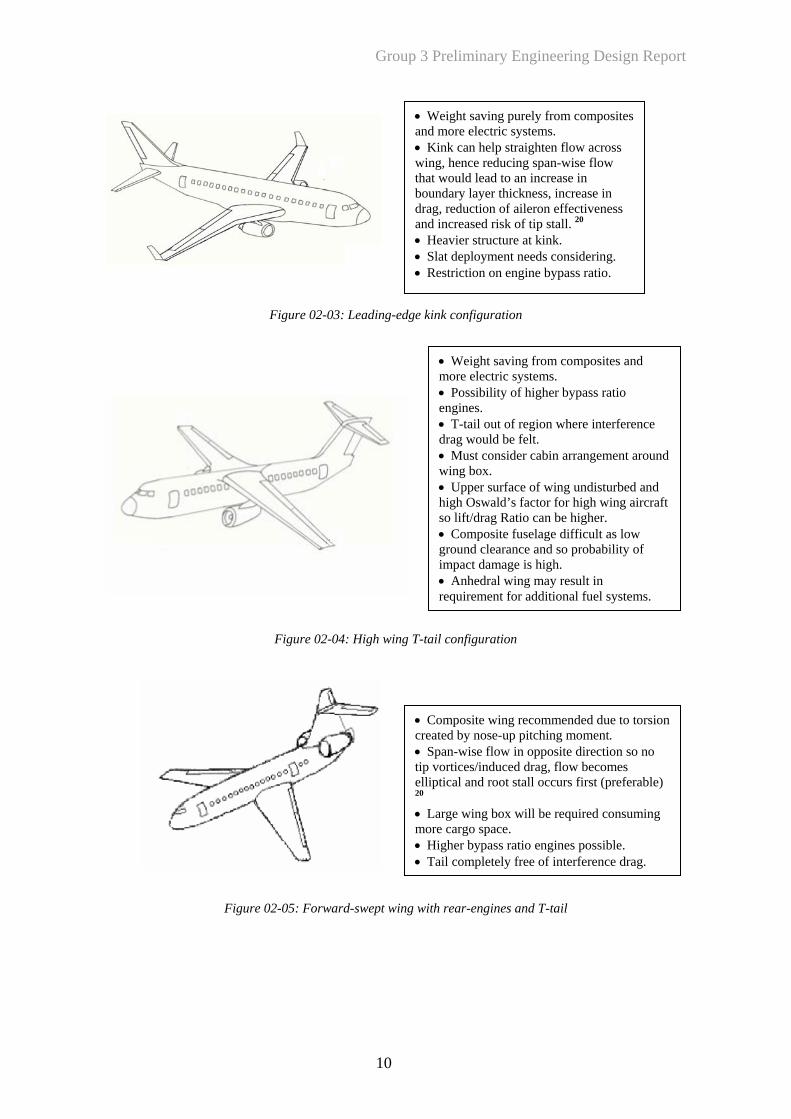
• Composite wing recommended due to torsion created by nose-up pitching moment. • Span-wise flow in opposite direction so no tip vortices/induced drag, flow becomes elliptical and root stall occurs first (preferable) 20 • Large wing box will be required consuming more cargo space. • Higher bypass ratio engines possible. • Tail completely free of interference drag.
Figure 02-05: Forward-swept wing with rear-engines and T-tail
10
Group 3 Preliminary Engineering Design Report
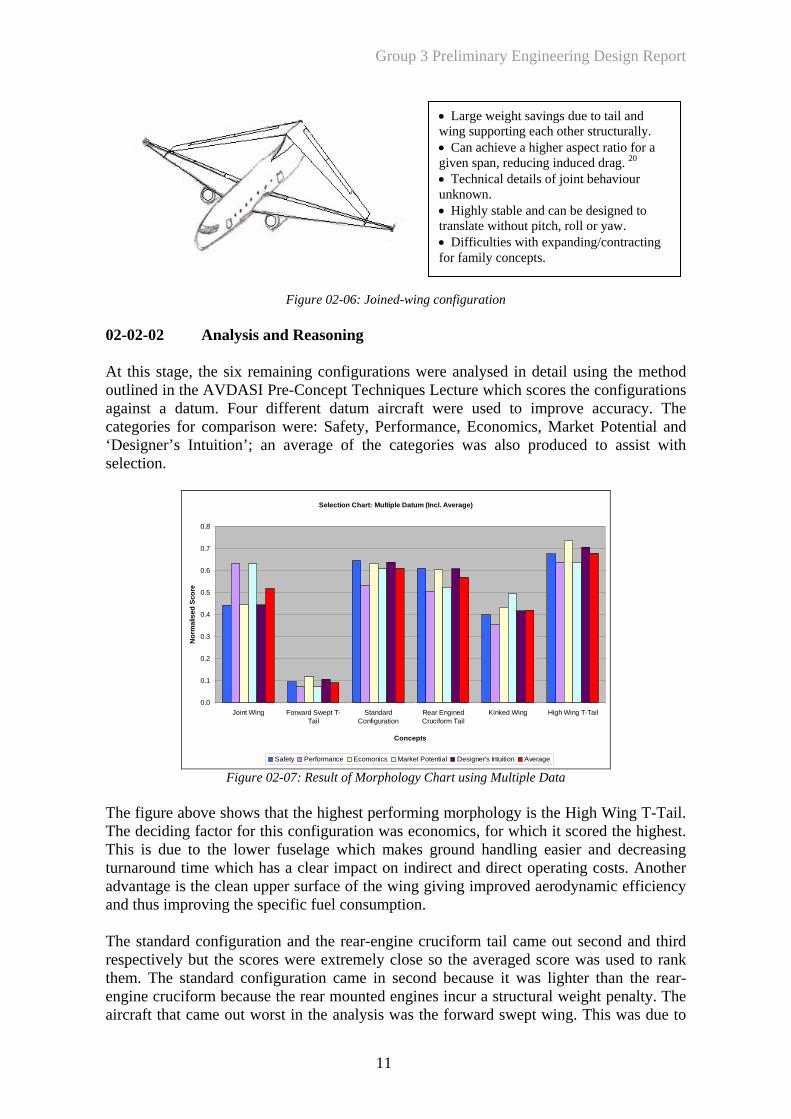
• Large weight savings due to tail and wing supporting each other structurally. • Can achieve a higher aspect ratio for a given span, reducing induced drag. 20 • Technical details of joint behaviour unknown. • Highly stable and can be designed to translate without pitch, roll or yaw. • Difficulties with expanding/contracting for family concepts.
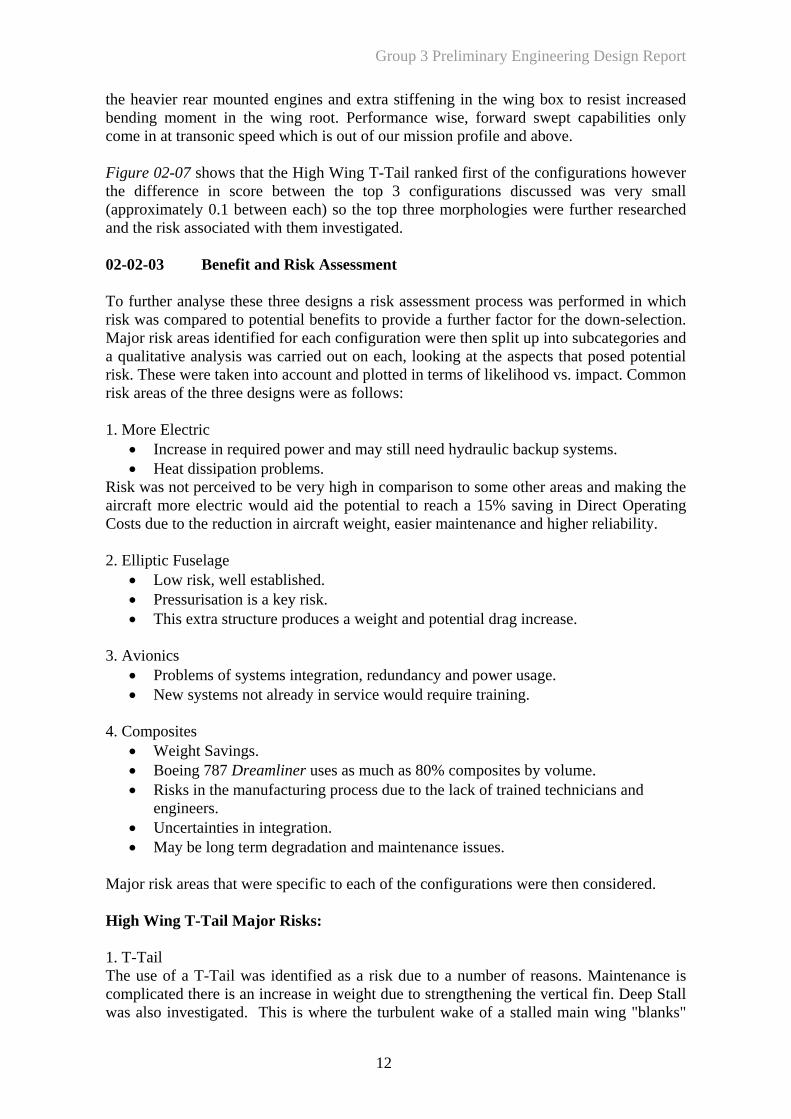
Figure 02-06: Joined-wing configuration 02-02-02 Analysis and Reasoning At this stage, the six remaining configurations were analysed in detail using the method outlined in the AVDASI Pre-Concept Techniques Lecture which scores the configurations against a datum. Four different datum aircraft were used to improve accuracy. The categories for comparison were: Safety, Performance, Economics, Market Potential and ‘Designer’s Intuition’; an average of the categories was also produced to assist with selection.
Selection Chart: Multiple Datum (Incl. Average)
0.0
0.1
0.2
0.3
0.4
0.5
0.6
0.7
0.8
Joint Wing Forward Swept T-Tail
StandardConfiguration
Rear EnginedCruciform Tail
Kinked Wing High Wing T-Tail
Concepts
Nor
mal
ised
Sco
re
Safety Performance Ecomonics Market Potential Designer's Intuition Average Figure 02-07: Result of Morphology Chart using Multiple Data
The figure above shows that the highest performing morphology is the High Wing T-Tail. The deciding factor for this configuration was economics, for which it scored the highest. This is due to the lower fuselage which makes ground handling easier and decreasing turnaround time which has a clear impact on indirect and direct operating costs. Another advantage is the clean upper surface of the wing giving improved aerodynamic efficiency and thus improving the specific fuel consumption. The standard configuration and the rear-engine cruciform tail came out second and third respectively but the scores were extremely close so the averaged score was used to rank them. The standard configuration came in second because it was lighter than the rear-engine cruciform because the rear mounted engines incur a structural weight penalty. The aircraft that came out worst in the analysis was the forward swept wing. This was due to
11
Group 3 Preliminary Engineering Design Report
the heavier rear mounted engines and extra stiffening in the wing box to resist increased bending moment in the wing root. Performance wise, forward swept capabilities only come in at transonic speed which is out of our mission profile and above. Figure 02-07 shows that the High Wing T-Tail ranked first of the configurations however the difference in score between the top 3 configurations discussed was very small (approximately 0.1 between each) so the top three morphologies were further researched and the risk associated with them investigated. 02-02-03 Benefit and Risk Assessment To further analyse these three designs a risk assessment process was performed in which risk was compared to potential benefits to provide a further factor for the down-selection. Major risk areas identified for each configuration were then split up into subcategories and a qualitative analysis was carried out on each, looking at the aspects that posed potential risk. These were taken into account and plotted in terms of likelihood vs. impact. Common risk areas of the three designs were as follows: 1. More Electric
• Increase in required power and may still need hydraulic backup systems. • Heat dissipation problems.
Risk was not perceived to be very high in comparison to some other areas and making the aircraft more electric would aid the potential to reach a 15% saving in Direct Operating Costs due to the reduction in aircraft weight, easier maintenance and higher reliability. 2. Elliptic Fuselage
• Low risk, well established. • Pressurisation is a key risk. • This extra structure produces a weight and potential drag increase.
3. Avionics
• Problems of systems integration, redundancy and power usage. • New systems not already in service would require training.
4. Composites
• Weight Savings. • Boeing 787 Dreamliner uses as much as 80% composites by volume. • Risks in the manufacturing process due to the lack of trained technicians and
engineers. • Uncertainties in integration. • May be long term degradation and maintenance issues.
Major risk areas that were specific to each of the configurations were then considered. High Wing T-Tail Major Risks: 1. T-Tail The use of a T-Tail was identified as a risk due to a number of reasons. Maintenance is complicated there is an increase in weight due to strengthening the vertical fin. Deep Stall was also investigated. This is where the turbulent wake of a stalled main wing "blanks"
12
Group 3 Preliminary Engineering Design Report
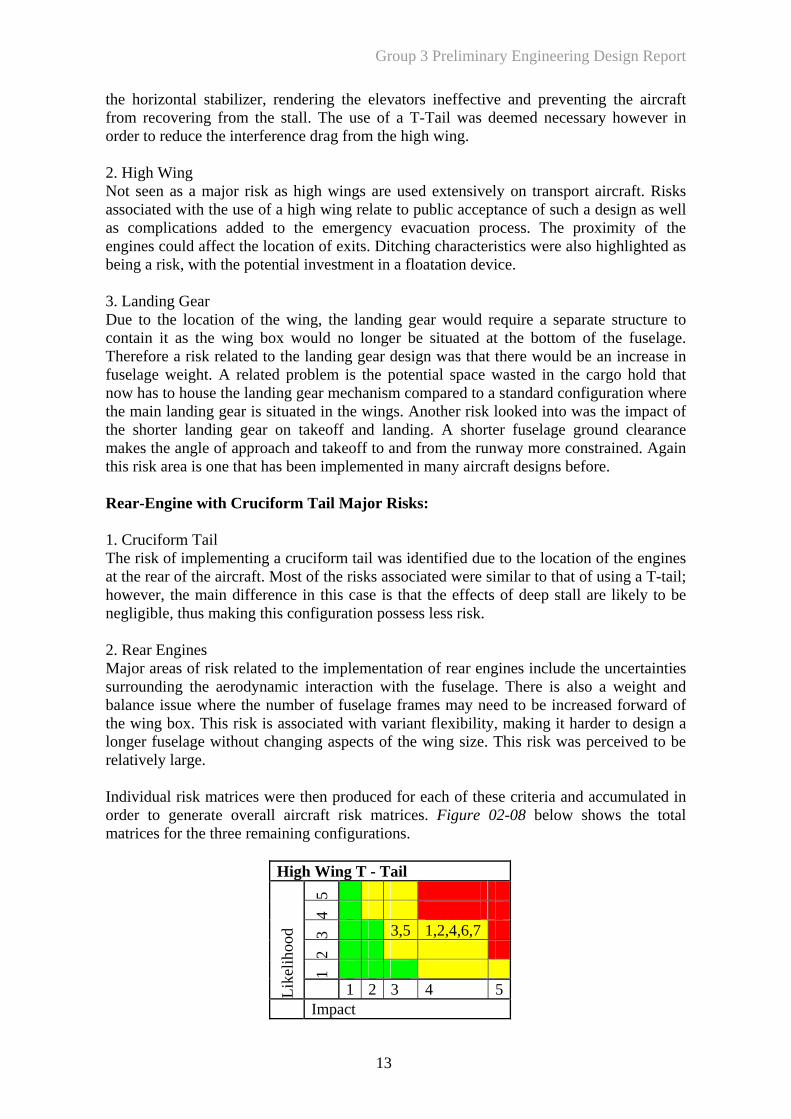
the horizontal stabilizer, rendering the elevators ineffective and preventing the aircraft from recovering from the stall. The use of a T-Tail was deemed necessary however in order to reduce the interference drag from the high wing. 2. High Wing Not seen as a major risk as high wings are used extensively on transport aircraft. Risks associated with the use of a high wing relate to public acceptance of such a design as well as complications added to the emergency evacuation process. The proximity of the engines could affect the location of exits. Ditching characteristics were also highlighted as being a risk, with the potential investment in a floatation device. 3. Landing Gear Due to the location of the wing, the landing gear would require a separate structure to contain it as the wing box would no longer be situated at the bottom of the fuselage. Therefore a risk related to the landing gear design was that there would be an increase in fuselage weight. A related problem is the potential space wasted in the cargo hold that now has to house the landing gear mechanism compared to a standard configuration where the main landing gear is situated in the wings. Another risk looked into was the impact of the shorter landing gear on takeoff and landing. A shorter fuselage ground clearance makes the angle of approach and takeoff to and from the runway more constrained. Again this risk area is one that has been implemented in many aircraft designs before. Rear-Engine with Cruciform Tail Major Risks: 1. Cruciform Tail The risk of implementing a cruciform tail was identified due to the location of the engines at the rear of the aircraft. Most of the risks associated were similar to that of using a T-tail; however, the main difference in this case is that the effects of deep stall are likely to be negligible, thus making this configuration possess less risk. 2. Rear Engines Major areas of risk related to the implementation of rear engines include the uncertainties surrounding the aerodynamic interaction with the fuselage. There is also a weight and balance issue where the number of fuselage frames may need to be increased forward of the wing box. This risk is associated with variant flexibility, making it harder to design a longer fuselage without changing aspects of the wing size. This risk was perceived to be relatively large. Individual risk matrices were then produced for each of these criteria and accumulated in order to generate overall aircraft risk matrices. Figure 02-08 below shows the total matrices for the three remaining configurations.
High Wing T - Tail
5
4
3 3,5 1,2,4,6,7
2
1
Like
lihoo
d
1 2 3 4 5
Impact
13
Group 3 Preliminary Engineering Design Report
Standard Configuration
5
4
3 1,3 2,4
2
1
Like
lihoo
d
1 2 3 4 5
Impact
Standard Rear
5
4
3 1,3,4,5 2,6
2
1 Li
kelih
ood
1 2 3 4 5
Impact
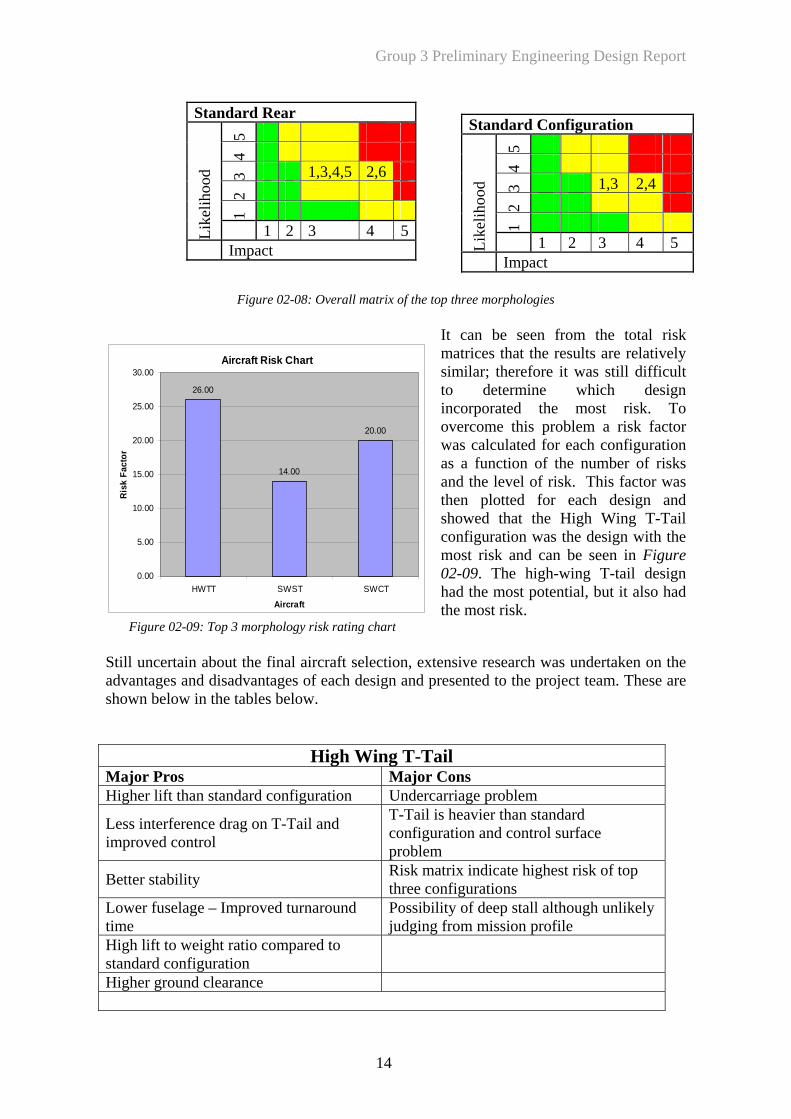
Figure 02-08: Overall matrix of the top three morphologies
It can be seen from the total risk matrices that the results are relatively similar; therefore it was still difficult to determine which design incorporated the most risk. To overcome this problem a risk factor was calculated for each configuration as a function of the number of risks and the level of risk. This factor was then plotted for each design and showed that the High Wing T-Tail configuration was the design with the most risk and can be seen in Figure 02-09. The high-wing T-tail design had the most potential, but it also had the most risk.
Aircraft Risk Chart
26.00
14.00
20.00
0.00
5.00
10.00
15.00
20.00
25.00
30.00
HWTT SWST SWCT
Aircraft
Risk
Fac
tor
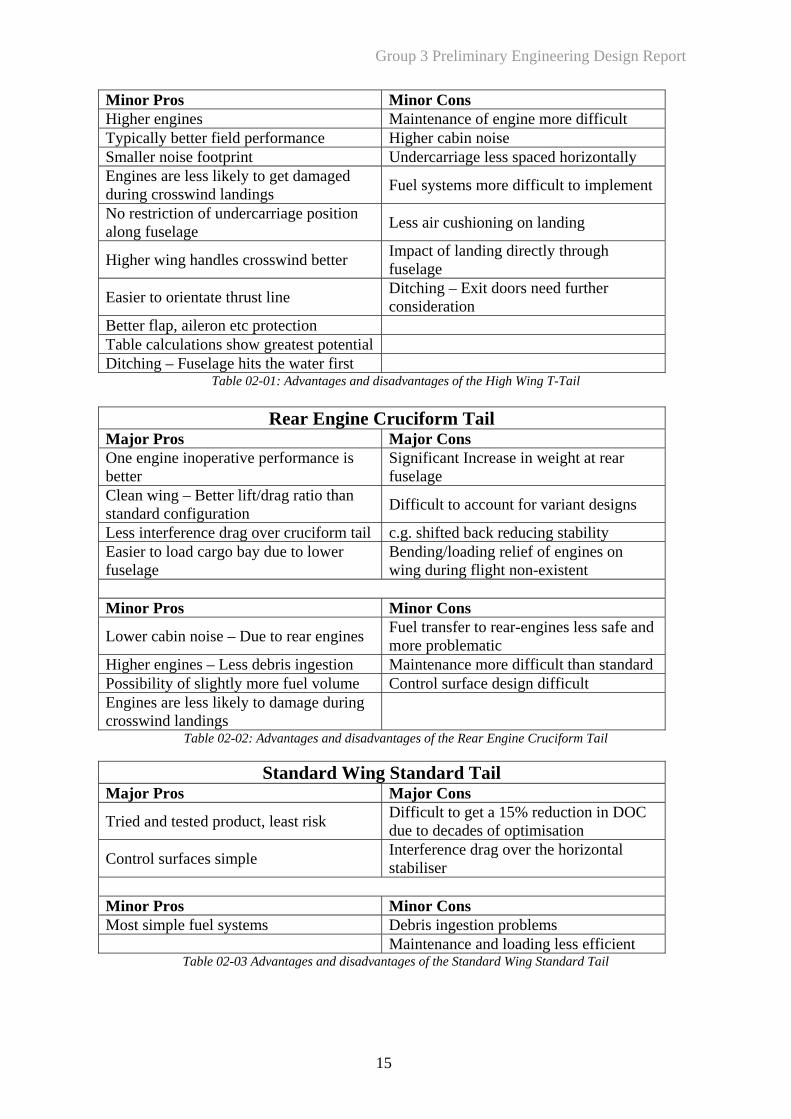
Figure 02-09: Top 3 morphology risk rating chart Still uncertain about the final aircraft selection, extensive research was undertaken on the advantages and disadvantages of each design and presented to the project team. These are shown below in the tables below.
High Wing T-Tail Major Pros Major Cons Higher lift than standard configuration Undercarriage problem
Less interference drag on T-Tail and improved control
T-Tail is heavier than standard configuration and control surface problem
Better stability Risk matrix indicate highest risk of top three configurations
Lower fuselage – Improved turnaround time
Possibility of deep stall although unlikely judging from mission profile
High lift to weight ratio compared to standard configuration
Higher ground clearance
14
Group 3 Preliminary Engineering Design Report
Minor Pros Minor Cons Higher engines Maintenance of engine more difficult Typically better field performance Higher cabin noise Smaller noise footprint Undercarriage less spaced horizontally Engines are less likely to get damaged during crosswind landings Fuel systems more difficult to implement
No restriction of undercarriage position along fuselage Less air cushioning on landing
Higher wing handles crosswind better Impact of landing directly through fuselage
Easier to orientate thrust line Ditching – Exit doors need further consideration
Better flap, aileron etc protection Table calculations show greatest potential Ditching – Fuselage hits the water first
Table 02-01: Advantages and disadvantages of the High Wing T-Tail
Rear Engine Cruciform Tail Major Pros Major Cons One engine inoperative performance is better
Significant Increase in weight at rear fuselage
Clean wing – Better lift/drag ratio than standard configuration Difficult to account for variant designs
Less interference drag over cruciform tail c.g. shifted back reducing stability Easier to load cargo bay due to lower fuselage
Bending/loading relief of engines on wing during flight non-existent
Minor Pros Minor Cons
Lower cabin noise – Due to rear engines Fuel transfer to rear-engines less safe and more problematic
Higher engines – Less debris ingestion Maintenance more difficult than standard Possibility of slightly more fuel volume Control surface design difficult Engines are less likely to damage during crosswind landings
Table 02-02: Advantages and disadvantages of the Rear Engine Cruciform Tail
Standard Wing Standard Tail Major Pros Major Cons
Tried and tested product, least risk Difficult to get a 15% reduction in DOC due to decades of optimisation
Control surfaces simple Interference drag over the horizontal stabiliser
Minor Pros Minor Cons Most simple fuel systems Debris ingestion problems Maintenance and loading less efficient
Table 02-03 Advantages and disadvantages of the Standard Wing Standard Tail
15
Group 3 Preliminary Engineering Design Report
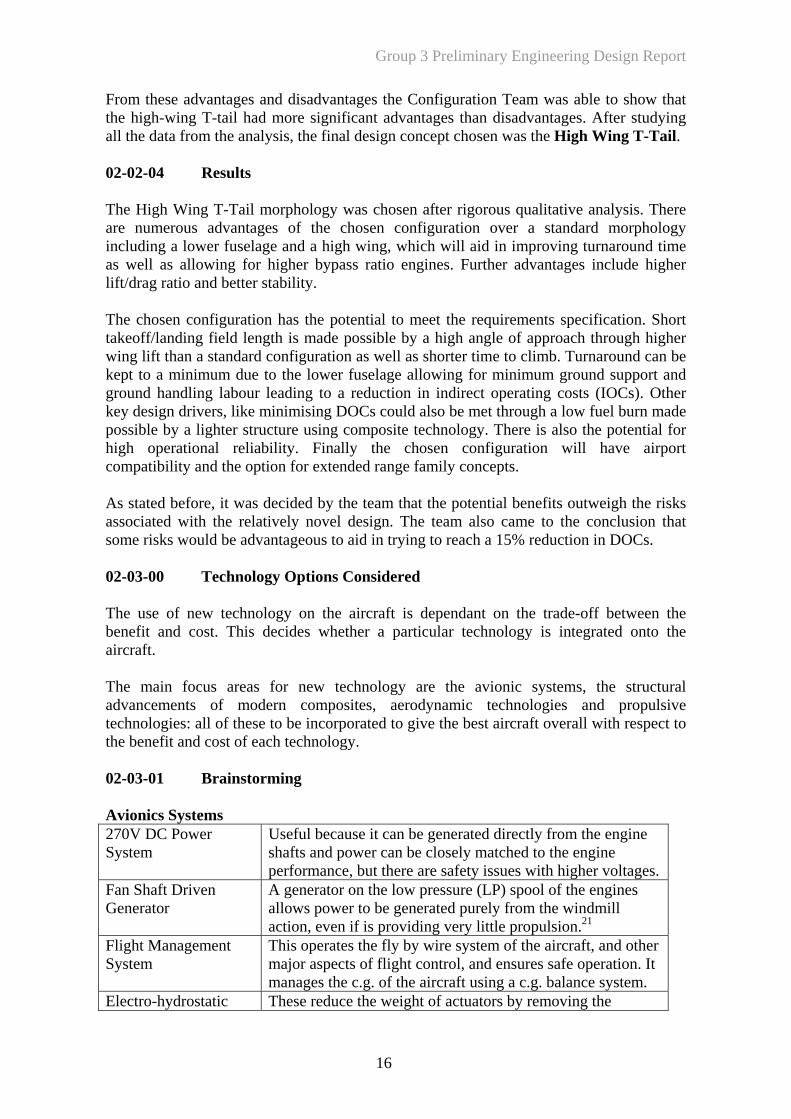
From these advantages and disadvantages the Configuration Team was able to show that the high-wing T-tail had more significant advantages than disadvantages. After studying all the data from the analysis, the final design concept chosen was the High Wing T-Tail. 02-02-04 Results The High Wing T-Tail morphology was chosen after rigorous qualitative analysis. There are numerous advantages of the chosen configuration over a standard morphology including a lower fuselage and a high wing, which will aid in improving turnaround time as well as allowing for higher bypass ratio engines. Further advantages include higher lift/drag ratio and better stability. The chosen configuration has the potential to meet the requirements specification. Short takeoff/landing field length is made possible by a high angle of approach through higher wing lift than a standard configuration as well as shorter time to climb. Turnaround can be kept to a minimum due to the lower fuselage allowing for minimum ground support and ground handling labour leading to a reduction in indirect operating costs (IOCs). Other key design drivers, like minimising DOCs could also be met through a low fuel burn made possible by a lighter structure using composite technology. There is also the potential for high operational reliability. Finally the chosen configuration will have airport compatibility and the option for extended range family concepts. As stated before, it was decided by the team that the potential benefits outweigh the risks associated with the relatively novel design. The team also came to the conclusion that some risks would be advantageous to aid in trying to reach a 15% reduction in DOCs. 02-03-00 Technology Options Considered The use of new technology on the aircraft is dependant on the trade-off between the benefit and cost. This decides whether a particular technology is integrated onto the aircraft. The main focus areas for new technology are the avionic systems, the structural advancements of modern composites, aerodynamic technologies and propulsive technologies: all of these to be incorporated to give the best aircraft overall with respect to the benefit and cost of each technology. 02-03-01 Brainstorming Avionics Systems 270V DC Power System
Useful because it can be generated directly from the engine shafts and power can be closely matched to the engine performance, but there are safety issues with higher voltages.
Fan Shaft Driven Generator
A generator on the low pressure (LP) spool of the engines allows power to be generated purely from the windmill action, even if is providing very little propulsion.21
Flight Management System
This operates the fly by wire system of the aircraft, and other major aspects of flight control, and ensures safe operation. It manages the c.g. of the aircraft using a c.g. balance system.
Electro-hydrostatic These reduce the weight of actuators by removing the
16
Group 3 Preliminary Engineering Design Report
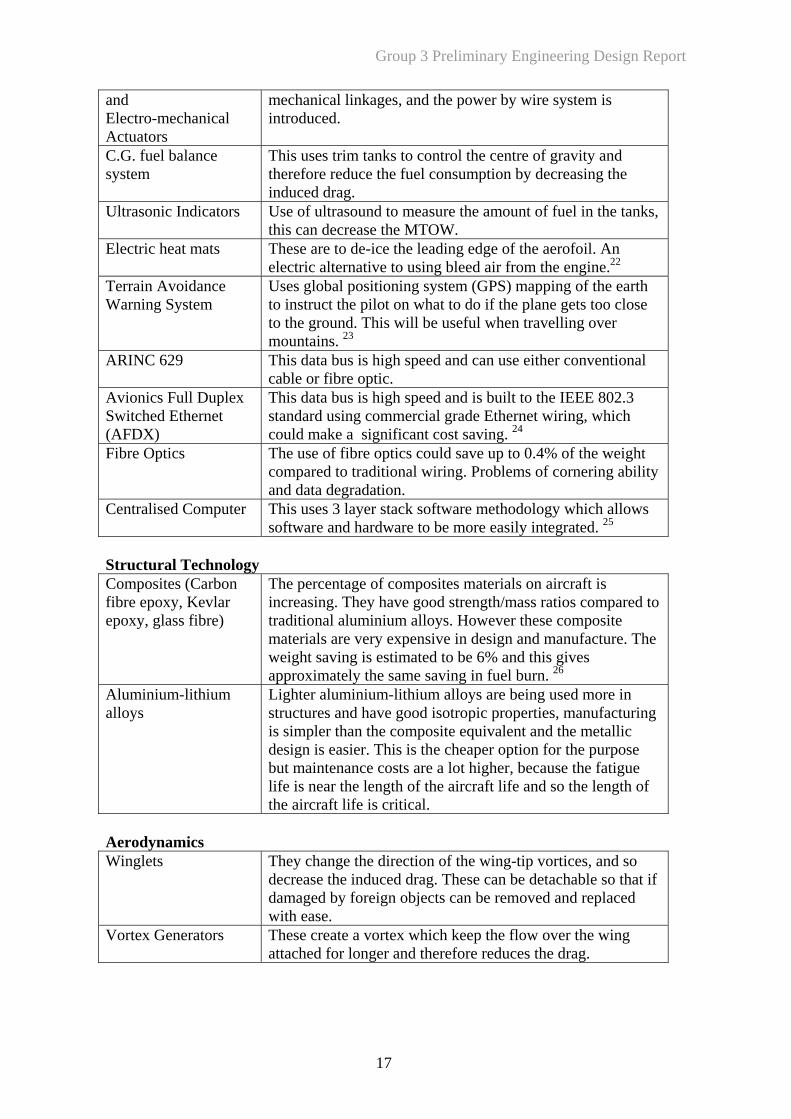
and Electro-mechanical Actuators
mechanical linkages, and the power by wire system is introduced.
C.G. fuel balance system
This uses trim tanks to control the centre of gravity and therefore reduce the fuel consumption by decreasing the induced drag.
Ultrasonic Indicators Use of ultrasound to measure the amount of fuel in the tanks, this can decrease the MTOW.
Electric heat mats These are to de-ice the leading edge of the aerofoil. An electric alternative to using bleed air from the engine.22
Terrain Avoidance Warning System
Uses global positioning system (GPS) mapping of the earth to instruct the pilot on what to do if the plane gets too close to the ground. This will be useful when travelling over mountains. 23
ARINC 629 This data bus is high speed and can use either conventional cable or fibre optic.
Avionics Full Duplex Switched Ethernet (AFDX)
This data bus is high speed and is built to the IEEE 802.3 standard using commercial grade Ethernet wiring, which could make a significant cost saving. 24
Fibre Optics The use of fibre optics could save up to 0.4% of the weight compared to traditional wiring. Problems of cornering ability and data degradation.
Centralised Computer This uses 3 layer stack software methodology which allows software and hardware to be more easily integrated. 25
Structural Technology Composites (Carbon fibre epoxy, Kevlar epoxy, glass fibre)
The percentage of composites materials on aircraft is increasing. They have good strength/mass ratios compared to traditional aluminium alloys. However these composite materials are very expensive in design and manufacture. The weight saving is estimated to be 6% and this gives approximately the same saving in fuel burn. 26
Aluminium-lithium alloys
Lighter aluminium-lithium alloys are being used more in structures and have good isotropic properties, manufacturing is simpler than the composite equivalent and the metallic design is easier. This is the cheaper option for the purpose but maintenance costs are a lot higher, because the fatigue life is near the length of the aircraft life and so the length of the aircraft life is critical.
Aerodynamics Winglets They change the direction of the wing-tip vortices, and so
decrease the induced drag. These can be detachable so that if damaged by foreign objects can be removed and replaced with ease.
Vortex Generators These create a vortex which keep the flow over the wing attached for longer and therefore reduces the drag.
17
Group 3 Preliminary Engineering Design Report
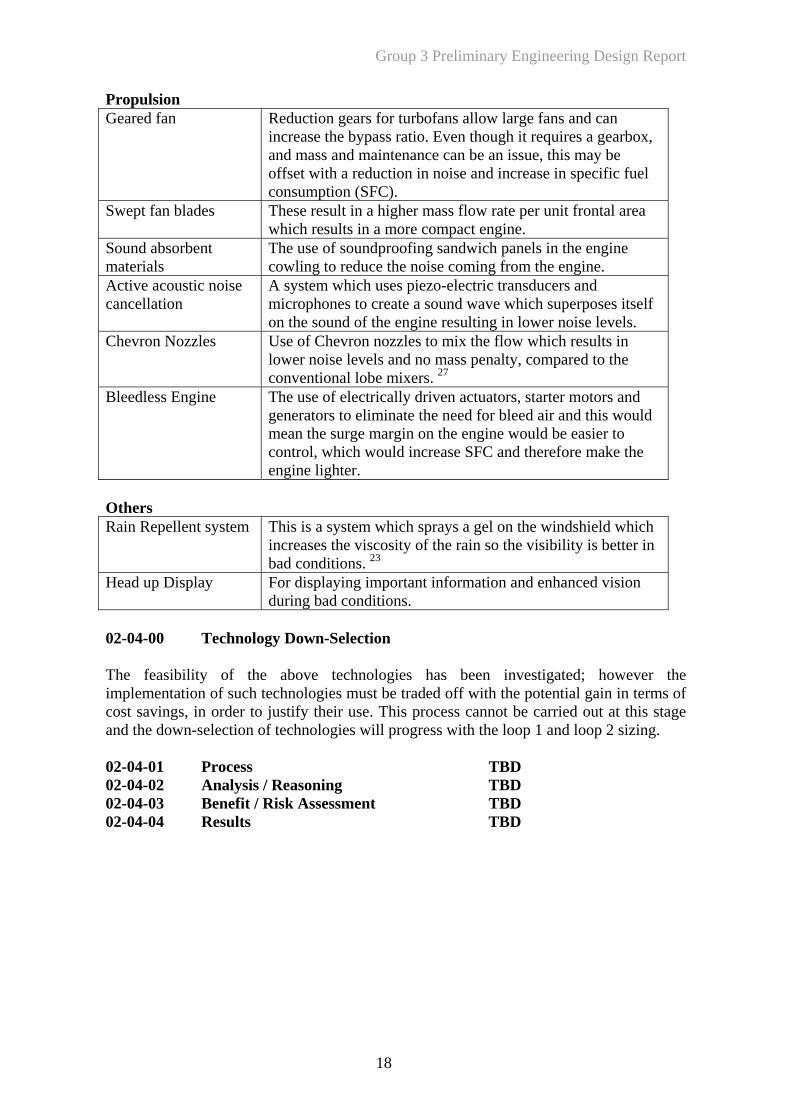
Propulsion Geared fan Reduction gears for turbofans allow large fans and can
increase the bypass ratio. Even though it requires a gearbox, and mass and maintenance can be an issue, this may be offset with a reduction in noise and increase in specific fuel consumption (SFC).
Swept fan blades These result in a higher mass flow rate per unit frontal area which results in a more compact engine.
Sound absorbent materials
The use of soundproofing sandwich panels in the engine cowling to reduce the noise coming from the engine.
Active acoustic noise cancellation
A system which uses piezo-electric transducers and microphones to create a sound wave which superposes itself on the sound of the engine resulting in lower noise levels.
Chevron Nozzles Use of Chevron nozzles to mix the flow which results in lower noise levels and no mass penalty, compared to the conventional lobe mixers. 27
Bleedless Engine The use of electrically driven actuators, starter motors and generators to eliminate the need for bleed air and this would mean the surge margin on the engine would be easier to control, which would increase SFC and therefore make the engine lighter.
Others Rain Repellent system This is a system which sprays a gel on the windshield which
increases the viscosity of the rain so the visibility is better in bad conditions. 23
Head up Display For displaying important information and enhanced vision during bad conditions.
02-04-00 Technology Down-Selection The feasibility of the above technologies has been investigated; however the implementation of such technologies must be traded off with the potential gain in terms of cost savings, in order to justify their use. This process cannot be carried out at this stage and the down-selection of technologies will progress with the loop 1 and loop 2 sizing. 02-04-01 Process TBD 02-04-02 Analysis / Reasoning TBD 02-04-03 Benefit / Risk Assessment TBD 02-04-04 Results TBD
18
Group 3 Preliminary Engineering Design Report
19
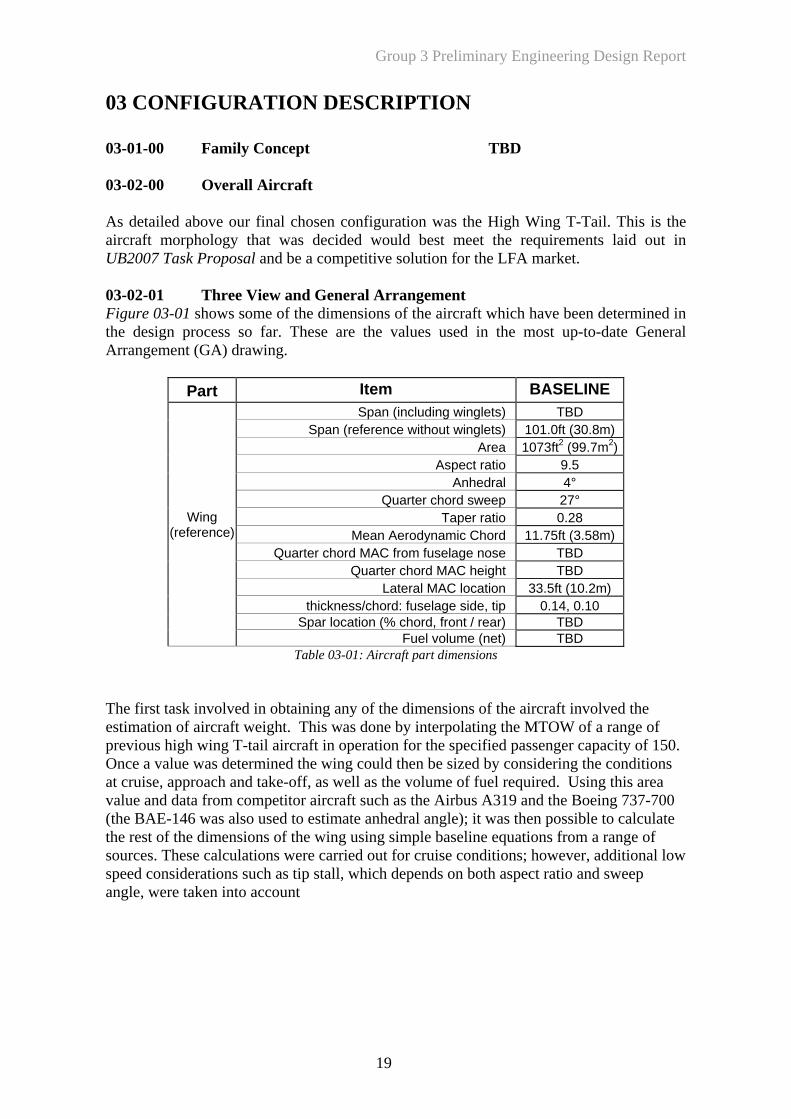
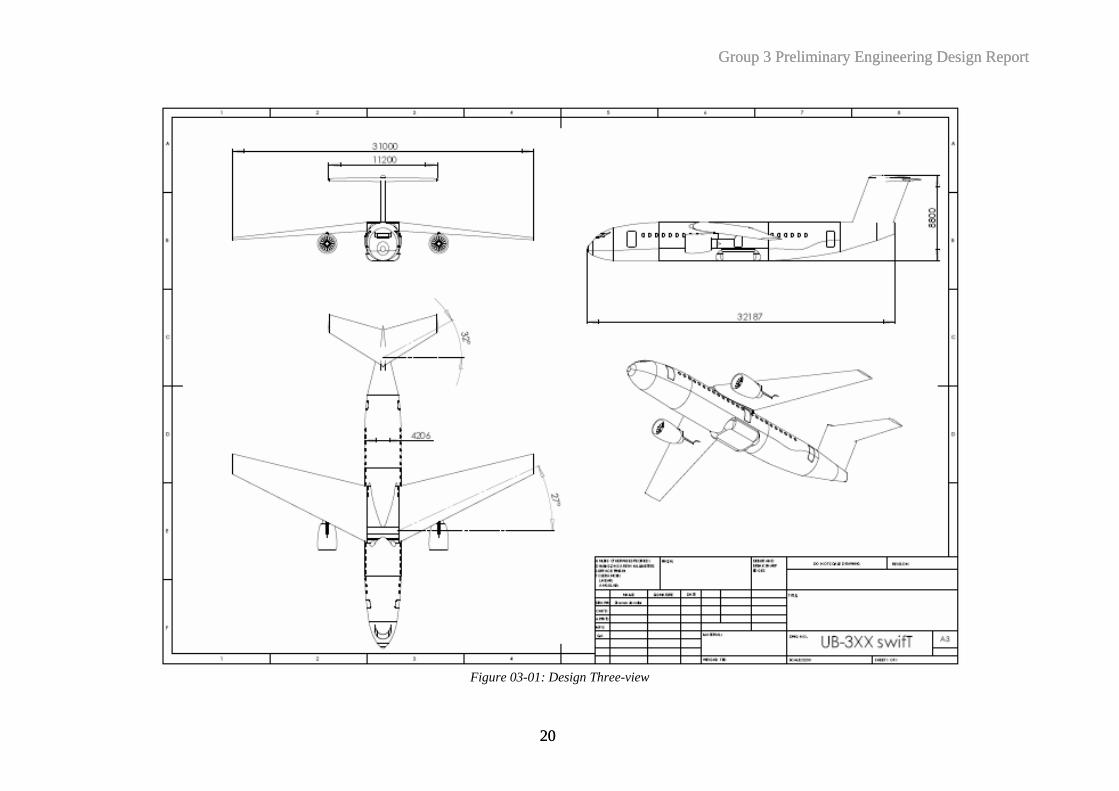
03 CONFIGURATION DESCRIPTION 03-01-00 Family Concept TBD 03-02-00 Overall Aircraft As detailed above our final chosen configuration was the High Wing T-Tail. This is the aircraft morphology that was decided would best meet the requirements laid out in UB2007 Task Proposal and be a competitive solution for the LFA market. 03-02-01 Three View and General Arrangement Figure 03-01 shows some of the dimensions of the aircraft which have been determined in the design process so far. These are the values used in the most up-to-date General Arrangement (GA) drawing.
Part Item BASELINE Span (including winglets) TBD
Span (reference without winglets) 101.0ft (30.8m) Area 1073ft2 (99.7m2)
Aspect ratio 9.5 Anhedral 4°
Quarter chord sweep 27° Taper ratio 0.28
Mean Aerodynamic Chord 11.75ft (3.58m) Quarter chord MAC from fuselage nose TBD
Quarter chord MAC height TBD Lateral MAC location 33.5ft (10.2m)
thickness/chord: fuselage side, tip 0.14, 0.10 Spar location (% chord, front / rear) TBD
Wing (reference)
Fuel volume (net) TBD Table 03-01: Aircraft part dimensions
The first task involved in obtaining any of the dimensions of the aircraft involved the estimation of aircraft weight. This was done by interpolating the MTOW of a range of previous high wing T-tail aircraft in operation for the specified passenger capacity of 150. Once a value was determined the wing could then be sized by considering the conditions at cruise, approach and take-off, as well as the volume of fuel required. Using this area value and data from competitor aircraft such as the Airbus A319 and the Boeing 737-700 (the BAE-146 was also used to estimate anhedral angle); it was then possible to calculate the rest of the dimensions of the wing using simple baseline equations from a range of sources. These calculations were carried out for cruise conditions; however, additional low speed considerations such as tip stall, which depends on both aspect ratio and sweep angle, were taken into account
Group 3 Preliminary Engineering Design Report
20
Group 3 Preliminary Engineering Design Report
20
Figure 03-01: Design Three-view
Group 3 Preliminary Engineering Design Report
03-02-02 Operational Limitations TBD 03-02-03 Description of the Key Features of the Overall Aircraft Configuration The key features of the aircraft configuration include: • High mounted wing, resulting in greater lift due to the eliminated fuselage interference
drag on the upper surface. • Problems with overhead lockers beneath the wing box could be reduced by changing
the locker size. • T-tail configuration escapes the interference drag from the wing. A system for the
actuation and general control of the tail surfaces needs to be considered carefully. • Undercarriage details are yet to be determined, but they will be fuselage mounted.
Structural stiffening in the fuselage will also need to be discussed. • The chosen configuration is single aisle 6-abreast, though the aisle will be wider than
the minimum required aisle width as defined by the specification. 03-02-04 Discussion of Configuration The high wing T-tail morphology shows great potential to reduce DOCs by 15% on
petitor aircraft by its improved aerodynamic efficiency, reduced weight after the oduction of composites and improved turnaround time. However, the design still ds to be optimised further and certain sections of the aircraft such as the undercarriage empennage needs more attention. For example, difficulties in achieving an ‘all-ving’ tail-plane may present themselves as well as the ground clearance of the pennage on take-off. Positioning of the central exit door of the aircraft is also an aspect t may create more problems due to the proximity of the hanging turbofans and the nciding regulations. Plans to alleviate the issue of wasted cabin space, due to the wing ng mounted on the upper fuselage, must also be addressed further. So far this baseline ign configuration has proved promising and these issues will be addressed.
03-02-05 Sizing Process TBD 03-02-06 Trade Studies TBD 03-02-07 Requirements Analysis The main driving requirement has been identified as the direct operating cost of the aircraft. The weight, specific fuel consumption and turnaround time will therefore be the driving factors of the design with the greatest impact on DOCs. To get DOCs to a minimum, technologies for these key drivers may need to be researched incurring extra costs. An estimate of the cost to meet the requirements for certification has yet to be determined, however the flight testing costs, for example, may be reduced due to the selection of a fairly conventional design which has already been certified and flown. 03-02-08 Integration Issues TBD 03-03-00 Component Description TBD 03-03-10 Wings TBD 03-03-11 Description of Key Features TBD 03-03-12 Planform and Structural Drawing TBD 03-03-13 Discussion of Wing Design Philosophy TBD
comintrneeandmoemthacoibeides
21
Group 3 Preliminary Engineering Design Report
03-03-14 Structural Architecture TBD 03-03-15 Aerodynamic Design The basic morphology’s aerodynamic advantages, as well as more specific aerodynamic
provements, have been outlined above. At this stage the majority of the sizing has been
som ns.
With the ICAO “Code C” requirement and the wing area of 1073ft calculated by the .0.
Cle mic an
a p ecause whilst there
aee
rd ratios ean aerodynamic e wing at cruise.
e made for the aircraft design, considering /wave drag. The lift coefficient calculated
m both the start and rovided from the that the critical
ed bu scussed this is yet to be
imperformed on the wing, so this section will explain the aerodynamic reasoning behind
e of the calculated dimensio
2
operational performance team, the maximum aspect ratio obtainable in the design is 13arly this is rather large and would undoubtedly cause some structural and dyna
difficulties. In contrast to this, the A319 has an aspect ratio of 9.4. For this reasons ect ratio of 9.5 has been used for initial calculations of the design b
is considerable margin to increase its value, increasing the aspect ratio reduces induced dr g and increases structural complexity, so a conservative value that poses less risk has
n taken. From this aspect ratio the span could be determined. b
order to prevent supersonic flow occurring across the wing, both sweepback angle and Inthickness/chord ratio were considered carefully. Sweepback is used to delay the drag divergence Mach number by reducing the effective flow velocity across the wing cross-section. Another means of doing this would be to reduce the thickness/chord ratio; however, this may be restricted structurally or due to fuel requirements. Typically, for a given Mach number, increasing the sweep allows for a larger thickness/chord ratio and vice versa. The Airbus A319 has a sweep of 25 degrees and a mean thickness to chord ratio of 0.12, resulting in an Mcrit of 0.82. The design requirements, however, indicate that the aircraft designed must have a maximum operating Mach number (MMO) of 0.84, therefore greater sweep as well as a lower thickness/chord ratio was incorporated into the design to cope with this increase in velocity.
rom these dimensions other parameters such as taper ratio and thickness/choFacross the span could be determined, which enabled calculation of the mchord (MAC) as well as an estimate of 0.73 for the coefficient of lift of th Conservative drag coefficient estimates werrofile drag, induced drag and compressibilityp
for the wing and the estimation of the coefficient of drag of the aircraft then allowed an approximate lift/drag ratio of 16.8 to be determined This is, however, a very conservative estimate, especially with respect to drag, and before the geometry of the aircraft has been optimised there is significant scope for improvement. The value of lift/drag ratio estimated for the wing section was then compared with the lift/drag ratio required for both standard range and extended range derivatives. This was alculated using a rearranged version of the Breguet range equation with the maximuc
equivalent still air range (ESAR) of each aircraft, the aircraft weight at end of the flight, cruise speed and the SFC. After data had been poperational performance team for a first design iteration, it was found
tio f of the extended-range aircraft at 16.7. This lift/drag ra or the two derivatives was thatis marginally within the potential of the wing design t as dioptimised and is conservative.
22
Group 3 Preliminary Engineering Design Report
03-03-16 Loads Philosophy TBD 03-03-20 Fuselage TBD
s TBD 3-03-22 Structural Architecture TBD
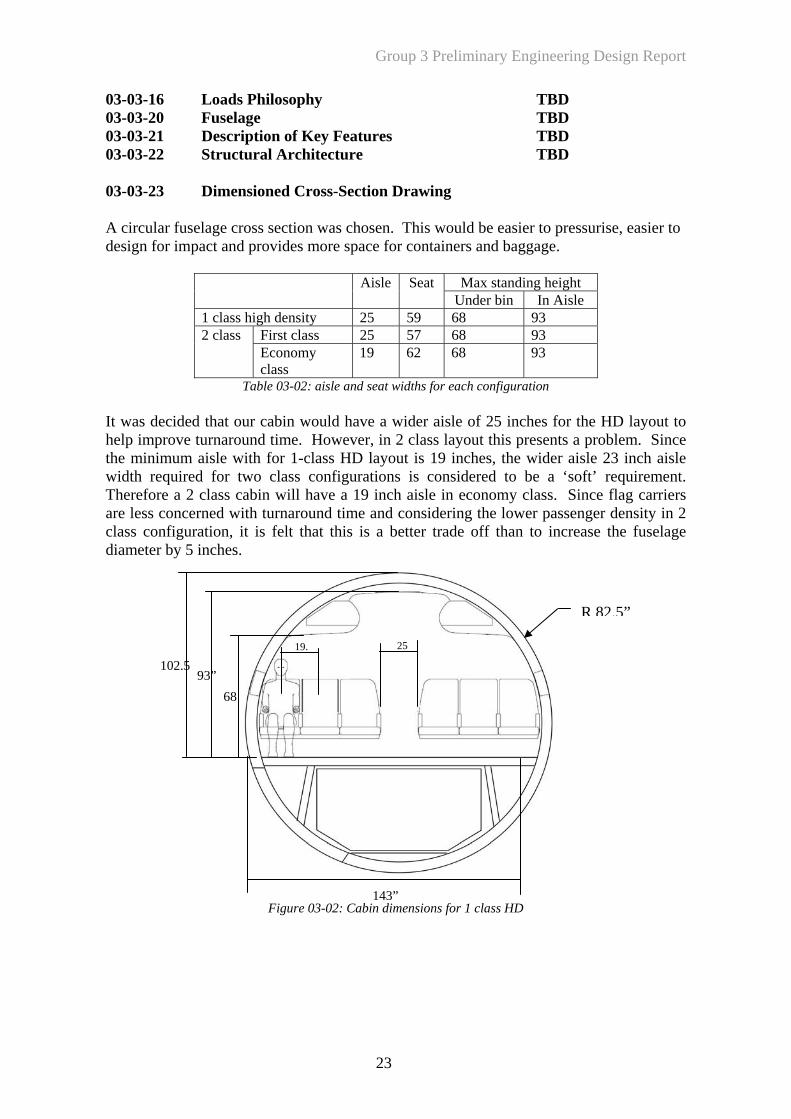
s chosen. This would be easier to pressurise, easier to esign for impact and provides more space for containers and baggage.
03-03-21 Description of Key Feature0 03-03-23 Dimensioned Cross-Section Drawing A circular fuselage cross section wad
Max standing height Aisle Seat Under bin In Aisle
1 class high density 25 59 68 93 First class 25 57 68 93 2 class Economy class
19 62 68 93
Table 03-02: aisle and seat widths for each configuration It was decided that our cabin would have a wider aisle of 25 inches for the HD layout to help improve turnaround time. However, in 2 class layout this presents a problem. Since the minimum aisle with for 1-class HD layout is 19 inches, the wider aisle 23 inch aisle width required for two class configurations is considered to be a ‘soft’ requirement. Therefore a 2 class cabin will have a 19 inch aisle in economy class. Since flag carriers are less concerned with turnaround time and considering the lower passenger density in 2 class configuration, it is felt that this is a better trade off than to increase the fuselage diameter by 5 inches.
Figure 03-02: Cabin dimensions for 1 class HD
R 82.5”
2519.
6893”
102.5
143”
23
Group 3 Preliminary Engineering Design Report
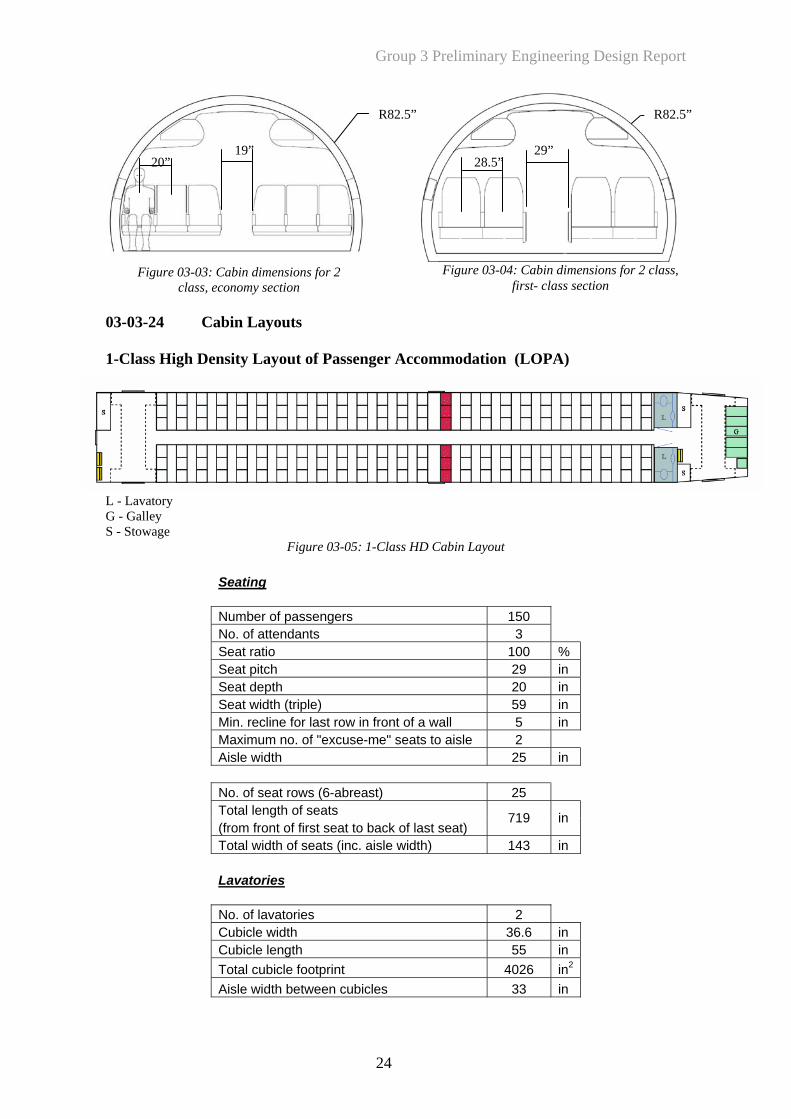
03-03-24 1-Class High Density Layout of Passenger Accommodation (LOPA)
Figure 03-05: 1-Class HD Cabin Layout
Seating
Cabin Layouts
L - Lavatory G - Galley S - Stowage
Number of passengers 150 No. of attendants 3 Seat ratio 100 % Seat pitch 29 in Seat depth 20 in Seat width (triple) 59 in Min. recline for last row in front of a wall 5 in Maximum no. of "excuse-me" seats to aisle 2 Aisle width 25 in No. of seat rows (6-abreast) 25 Total length of seats (from front of first seat to back of last seat)
719 in
Total width of seats (inc. aisle width) 143 in Lavatories
No.
of lavatories 2 Cubicle width 36.6 in Cubicle length 55 in Total cubicle footprint 4026 in2
Aisle width between cubicles 33 in
R82.5”R82.5” R82.5”
19” 20”
29”28.5”
Figure ons for 2 class, tion
Figure 03-0 : Cabin dimensions for 2 class, economy section
03-04: Cabin dimensifirst- class sec
3
24
Group 3 Preliminary Engineering Design Report
Galleys
1
No. of trays per passenger No. of galleys - Whole trolley 5 Half trolley 1 Overall width of galley 82.7 in Overall galley depth 34 in Total galley floor area 2556.2 in2
Table 03-03 Summary of 1-Class Hi nsity Cabin Layout
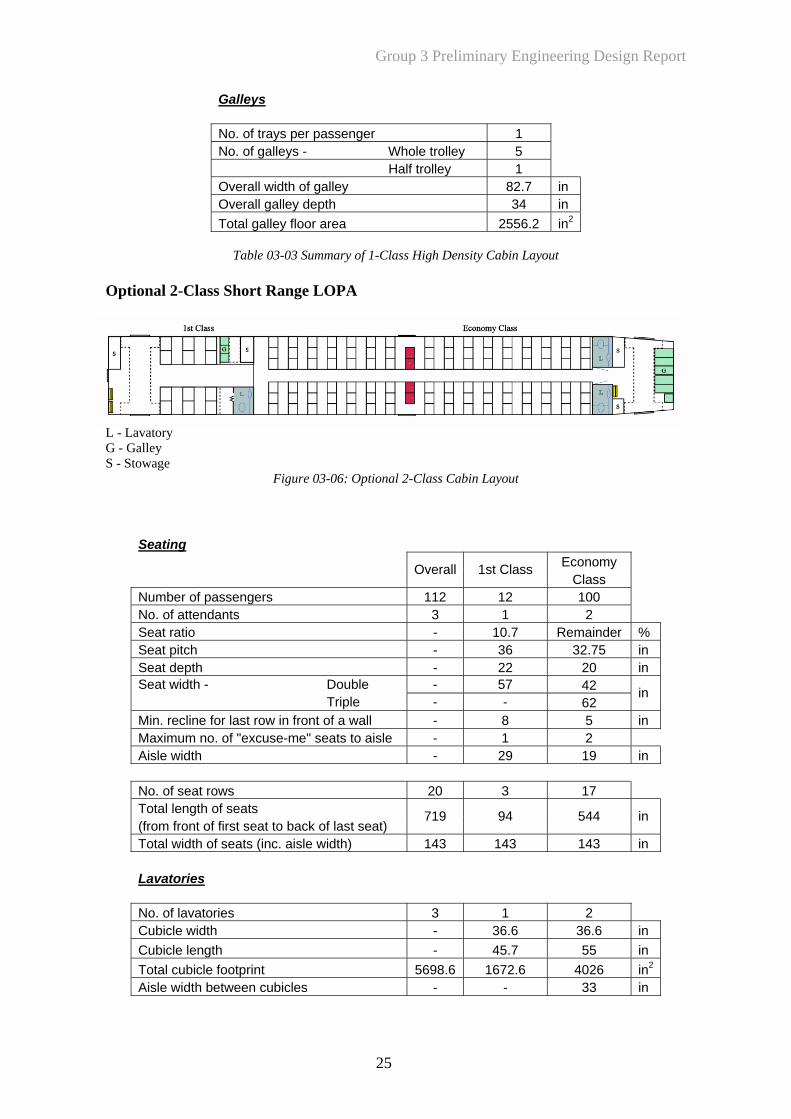
Optional 2-Class Short Range LOPA
- Lavatory - Galley - Stowage
Figure 03-06: Optiona 2-Class Cabin Layout
Seating
gh De
LGS
l
Economy
Overall 1st Class Class
Number of pa sengers 112 12 100 sNo. of attend 3 1 2 ants Seat ratio - 10. mainder % 7 ReSeat pitch - 3 in 6 32.75 Seat depth - 22 20 in Seat width - Double - 57 42 riple - - 62
in T
Min. recline fo 8 5 in r last row in front of a wall - Maximum no. 1 2 of "excuse-me" seats to aisle - Aisle width - 29 19 in No. of seat ro 20 3 17 ws Total length of seats (from front of
719 9 544 in first seat to back of last seat)
4
Total width of 3 14 143 in seats (inc. aisle width) 14 3 Lavatories No. of lavator 3 1 2 ies Cubicle width - 36 36.6 in .6 Cubicle lengt - 45 55 in h .7 Total cubicle 5698.6 167 in2footprint 2.6 4026 Aisle width be - - 33 in tween cubicles
25
Group 3 Preliminary Engineering Design Report
Galleys No. of trays p - 3 1.5 er passenger No. of galleys - 5 - Whole trolley 5 3 1 Half trolley 4 Overall width - 40 82.7 in of galley .8 Overall galley - 17 34 in depth .4 Total galley fl 3266.1 7 in2oor area 09.9 2556.2
Table 03-04 2-Class Short Range Cabin Layout
Item BASELINE
Part Length 105.6 ft Fuselage Maximum height/width 13.8 / 13.8 ft Maximum height 97 in Maximum width 152 in Overall cabin length 943.6 in Seating length 719 in
Galley / Lav area 2556.2 / 4026 in2
Galleys 5 whole, 1 half Cabin
Total gross volume 140 ft3Galley
volume per PAX 0.93 ft3
Ov 6678 ft3erall Cabin Gross Volume Table 0 ons
abin Layout Philosophy
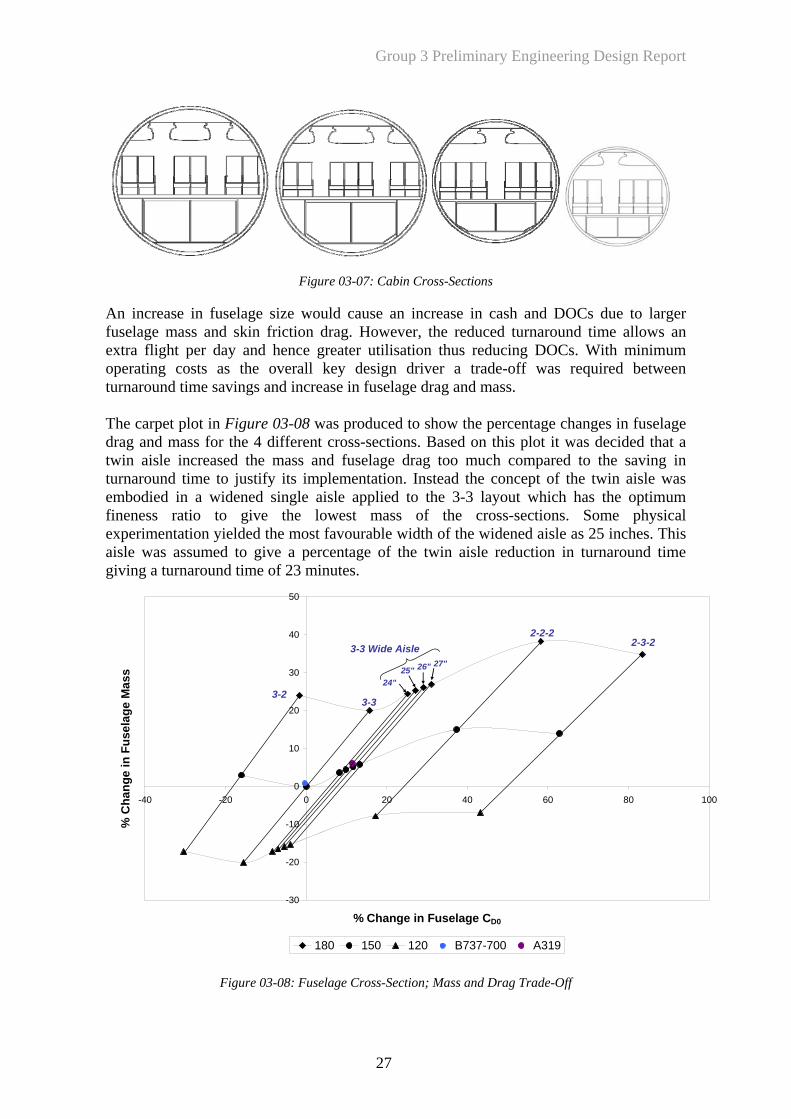
The cabin layout for the UB3XX-“swifT” wadrive s for low fare airlines. The relevant drive ste B20 k P posal as: - High utilisation (i.e. minimum turnaround time) - Mi d support equipment - Mi d handling labour A st aken to in stigate t ost cruc this study were that passenger movem was the c o loa ng and unloading was the next path most likely to delay departure of the aircraft. These findings prompted an investigation of aisle widths and strategies to increase the speed of Aisle A nu dard 1-class aisle width of 19 inches), shown in Figu ere examined. These included two twin aisle cross-sections, the 2-3-2 and the 2-2-2 and two single aisle cross-sections, the 3-3 and the 3-2. It was understood that although a twin aisle layout would help reduce the passenger me t tim it wo ld also require a wider fuselage.
3-05: Summaries of Fu age and Cabin Dimensisel
C
s heavily influenced by the key design rs are lir d in the U 07 Tas ro
nimal grounnimal groun
udy of turnaround time was undert ve he factors which were mial in its minimisation. The results of entritical path of turnaround and that carg di
baggage handling.
Width Study
mber of cabin cross-sections (stanre 03-07, w
move n e u
26
Group 3 Preliminary Engineering Design Report
Figure 03-07 Cross-Sections
An incre elag ould cause an increase in cash and DOCs due to larger fuselage m ski ver, the reduced turnar lows an extra flight per day an utilisation thus reducing DOC minimum operating costs as the overall key design driver a trade-off was between turnaround time saving selage drag and mass. The carpet plot in Figure 03-0 roduced to s percentage changes in fuselage drag and mass for the 4 different cross-sections. Based on this plot it was decided that a twin aisle increased th ompared to the saving in turnaround time to n aisle was mbodied in a wid has the optimum
he lowest mass of the cross-sections. Some physical most favourable width of the widened aisle as 25 inches. This
: Cabin
ase in fusass and
e size wn friction drag. Howe ound time ald hence greater s h. Wit
requireds and increase in fu
8 was p how the
e mass and fuselage drag too much cjustify its implementation. Instead the concept of ened single aisle applied to the 3-3 layout which
the twiefineness ratio to give txperimentation yielded the e
aisle was assumed to give a percentage of the twin aisle reduction in turnaround time giving a turnaround time of 23 minutes.
-30
-20
% Change in Fuselage C
-10
50
-40 -20 0 20 40 60 80 100
D0
40
0
10
20
ange
in F
usel
age
M
30
ass
24"25" 26" 27"
% C
h
180 150 120 B737-700 A319
3-3 Wide Aisle2-2-2
2-3-2
Figure 03-08: Fuselage Cross-Section; Mass and Drag Trade-Off
3-23-3
27
Group 3 Preliminary Engineering Design Report
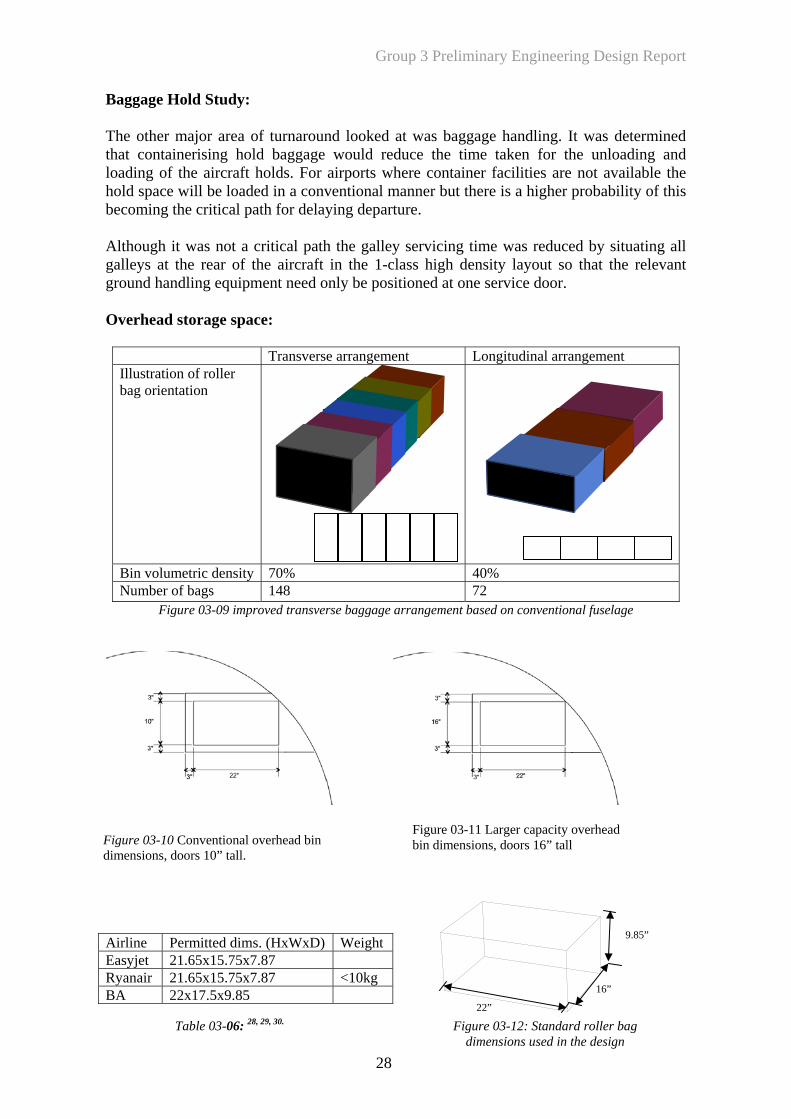
Baggage Hold Study: The other ma d
at containerising hold baggage would reduce the time taken for the unloading and ading of the aircraft holds. For airports where container facilities are not available the
hold space will be loaded in a conventional m nner but there is a higher probability of this becoming the critical path for delaying departure. Although it was not a critical path the galley servicing time was reduced by situating all galleys at the rear of the aircraft in the 1-class high density layout so that the relevant ground handling equipment n vice door.
jor area of turnaround looked at was baggage handling. It was determinethlo
a
eed only be positioned at one ser Overhead storage space:
Transverse arrangement Longitudinal arrangement Illustration of roller bag orientation
Bin volumetric density 70% 40% Number of bags 148 72
Figure 03-09 improved transverse baggage arrangement based on conventional fuselage
Airline Permitted dims. (HxWxD) Weight
Figure 03-10 Conventional overhead bin dimensions, doors 10” tall.
Figure 03-11 Larger capacity overhead bin dimensions, doors 16” tall
Easyjet 21.65x15.75x7.87 Ryanair 21.65x15.75x7.87 <10kg BA 22x17.5x9.85
22”
16”
Table 03-06: P
28, 29, 30. Figure 03-12: Standard roller bag dimensions used in the design
9.85”
28
Group 3 Preliminary Engineering Design Report
A standard sized roller bag was used to study an idealised cabin luggage capacity (Figure 3-12, Table 03-05). Different baggage orientations were considered.
oom. However, this configuration may ave issues with door sizes. A curved profile door and extended bullnose rails will be
ealised luggage rrangement is shown in Figure 03-09.
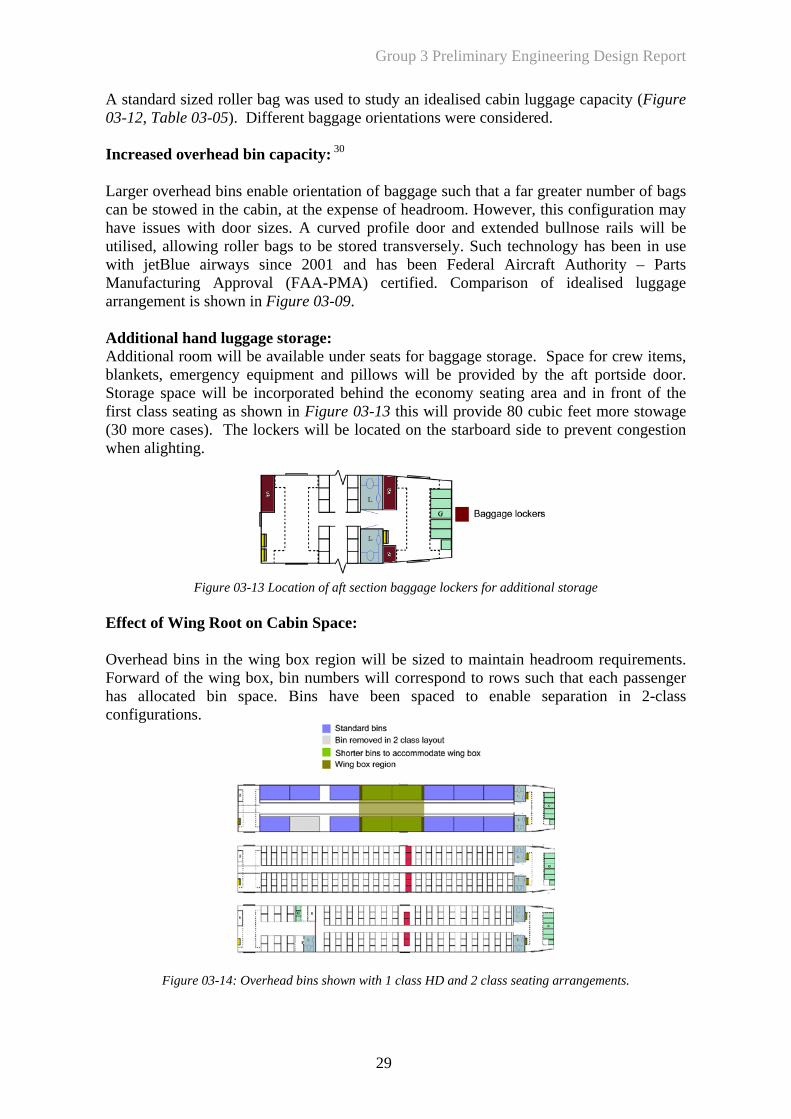
dditional hand luggage storage: Additional room will be r baggag w items, bl equipment and pillows will be provided by the aft portside door. Storage space will be incorporated behind the economy seating area and in front of the first class seating as shown in Figure 03-13 this will provide 80 cubic feet more stowage (30 more cases). The lockers will be located on the starboard side to prevent congestion when alighting.
0 Increased overhead bin capacity: 30
Larger overhead bins enable orientation of baggage such that a far greater number of bags can be stowed in the cabin, at the expense of headrhutilised, allowing roller bags to be stored transversely. Such technology has been in use with jetBlue airways since 2001 and has been Federal Aircraft Authority – Parts Manufacturing Approval (FAA-PMA) certified. Comparison of ida A
available under seats fo e storage. Space for creankets, emergency
Figure 03-13 of aft section baggage locker itional storage
Effect of Wing Root on Cabin Space:
Overhead bins in the wing box region will be sized to maintain headroom requirements. Forward of the wing box, bin numbers will correspond to rows such that each passenger has allocated bin space. Bins have been spaced to enable separation in 2-class configurations.
Location s for add
F d bins sho 1 class HDigure 03-14: Overhea wn with and 2 class seating arrangements.
29
Group 3 Preliminary Engineering Design Report
Overhead capacity Additional bin capacity Aircraft No. roller bags
Cubic feet
No. roller bags
Cubic feet
Crew bin capacity
A319 80 175 0 unknown Use overhead bins swifT 68 150 35 80 21
Table 03-07 comparison of cabin baggage capacity
Item UB3XX - SR UB3XX - ER Gross volume 80 80 Wardrobe Volume per PAX 0.5 0.5 Gross volume 150 cu ft 150 cu ft Overhead bin Volume per PAX 1.5 cu ft 1.5 cu ft Forward / aft 1350/ 1160 cu ft 1350/ 1160 cu ft
Total 2510 cu ft 2510 cu ft Under-floor baggage (usable) r PAX Up to 16.5 cu ft Up to 16.5 cu ft Total pe
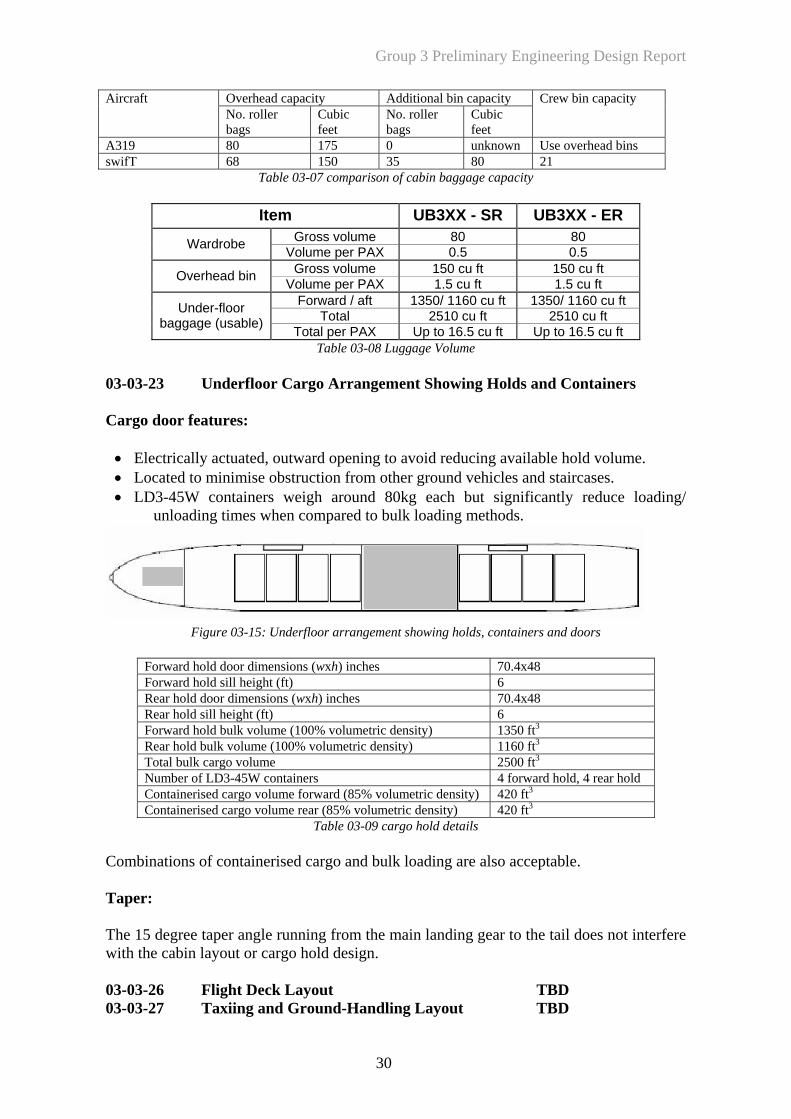
Table 03-08 Luggage Volume 03-03-23 Underfloor Cargo Arrangement Showing Holds and Containers Cargo door features: • Electrically actuated, outward opening to avoid reducing available hold volume. • Located to minimise obstruction from other ground vehicles and staircases. • LD3-45W containers weigh around 80kg each but significantly reduce loading/
unloading times when compared to bulk loading methods.
Figure 03-15: Underfloor arrangement showing holds, containers and doors
Forward hold door dimensions (wxh) inches 70.4x48 Forward hold sill height (ft) 6 Rear hold door dimensions (wxh) inches 70.4x48 Rear hold sill height (ft) 6 Forward hold bulk volume (100% volumetric density) 1350 ft3
Rear hold bulk volume (100% volumetric density) 1160 ft3
Total bulk cargo volume 2500 ft3
Number of LD3-45W containers 4 forward hold, 4 rear hold Containerised cargo volume forward (85% volumetric density) 420 ft3
Containerised cargo volume rear (85% volumetric density) 420 ft3
Table 03-09 cargo hold details Combinations of containerised cargo and bulk loading are also acceptable. Taper: The 15 degree taper angle running from the main landing gear to the tail does not interfere with the cabin layout or cargo hold design. 3-03-263-03-27 Taxiing and Ground-Handling Layout TBD
0 Flight Deck Layout TBD 0
30
Group 3 Preliminary Engineering Design Report
03-03-28 Gr nd Esc03-03-30 Em TBD
Description of K ature TBD -32 Ho ntal Tail-Plane Plan m and Str D
Sum ar D 3-03-33 Vertical Tail-Plane Planform and Structural Drawing and Summary
Table 03-03-40 Propulsi 03-03-41 tion of Key Features The engine thrust is estim inclu rgin for future growth of the aircraft. T oint (T Ma ft, onds to the highest corrected flow at inlet to the compressi . mprovement Targets:
ervice
vement - Pratt and Whitney quote this saving over current engines ed fan and combustor technology. The ACARE 2020 target is for
duce
• ner relative to aircraft. Lufthansa have achieved convincing results in testing of current engines.32
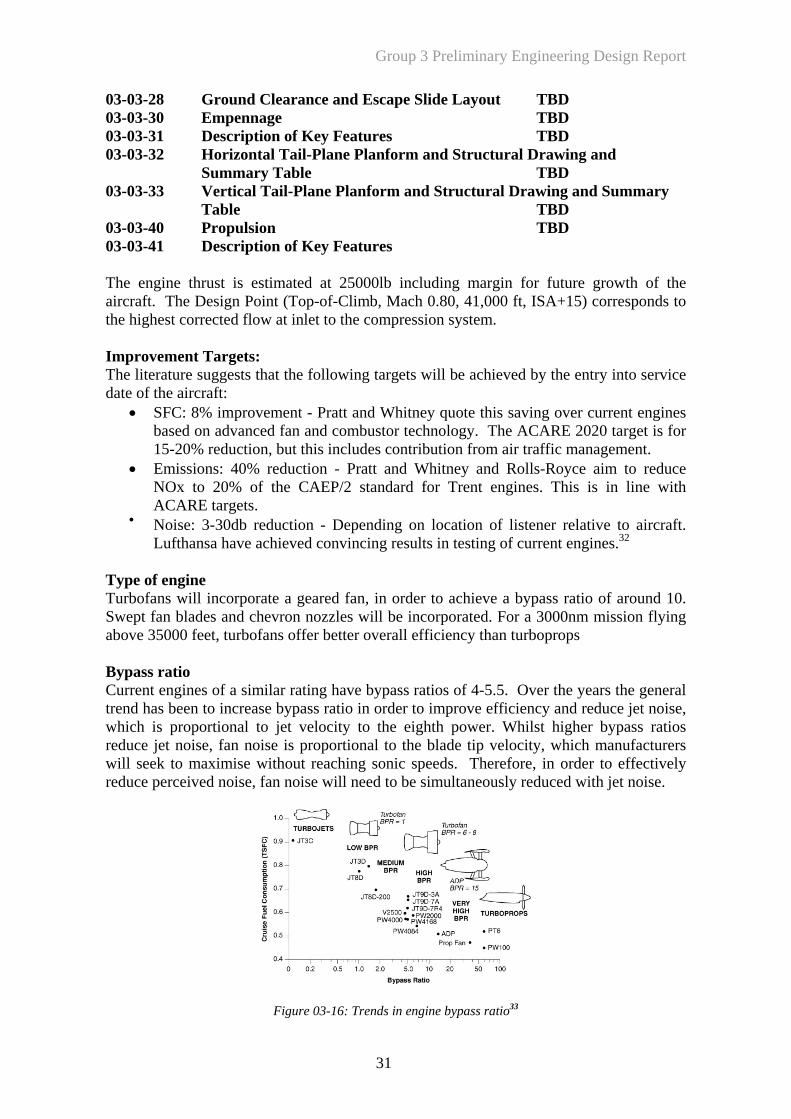
Type of engine Turbofans will incorporate a geared fan, in order to achieve a bypass ratio of around 10. Swept fan blades and chevron nozzles will be incorporated. For a 3000nm mission flying above 35000
BypaCurre bypass ratios of 4-5.5. Over the years the general trend has been to increase bypass ratio in order to improve efficiency and reduce jet noise, which power. higher bypass ratios reduc blade tip v which manufacturers will s out reaching sonic speeds. The in order to effectively reduce perceived noise, fan noise will need to
ound Clearance a ape Slide Layout TBD pennage
03-03-31 ey Fe s 03-03 rizo
mfor uctural raw
Bing and
y Table T0
on
TBD TBD
Descrip
ated at 25000lb ding mahe Design P op-of-Climb, ch 0.80, 41,000 ISA+15) corresp
on system
IThe literature suggests that the following targets will be achieved by the entry into s
ate of the aircraft: d• SFC: 8% impro
based on advanc15-20% reduction, but this includes contribution from air traffic management.
to re• Emissions: 40% reduction - Pratt and Whitney and Rolls-Royce aim NOx to 20% of the CAEP/2 standard for Trent engines. This is in line with ACARE targets. Noise: 3-30db reduction - Depending on location of liste
feet, turbofans offer better overall efficiency than turboprops
ss ratio nt engines of a similar rating have
is proportional to jet velocity to the eighth Whilste jet noise, fan noise is proportional to the elocity,eek to maximise with refore,
be simultaneously reduced with jet noise.
Figure 03-16: Trends in engine bypa ass r tio33
31

Group 3 Preliminary Engineering Design Report
Failure The nacelle shall incorporate a multi-layered Kevlar shroud. In the event of a blade
pro e shro d and e def e rear e aircraft
or causing harm
Starter motorll turn the
y will be carried out to see if this is a better olution to using bleed air from the APU and mini turbines, or more advanced
TBD 3-03-43 Powerplant integration TBD
TBD
ary table TBD 03- 5
03-03-5
03-03-6 03- -6
he avionics system philosophy will be built around a centralised integrated modular A), implemented using the 3 layer stack software methodology. This
allow separate ystems to run on the same module.
e advantages may be offset by the increased system complexity and maintenance required. It is estimated that on a conventional wide body aircraft, as much as 1000lbs could be saved, which translates to 500lbs on our aircraft, or 0.4% of the total aircraft weight. In addition, a fibre-optic data-bus would provide immunity from electromagnetic interference, a problem that affects all standard electrical fly-by-wire systems. A trade-off will be performed to compare the advantages to possible issues regarding complexity. 03-03-62 Electromagnetic Design Philosophy TBD 03-03-63 Automation Policy The autoflight director system y integrated flight management computers ( econdary flight controls
failure, the jectile will be contained by th u b lected towards ththrough the bypass duct. This will prevent any debris escaping and damaging th
.
s The auxiliary power unit (APU) will be used to drive starter motors which wimain engines up to operational speed. A studstechnologies such as high pressure starter generators. 03-03-42 Summary table 003-03-50 Landing gear 03-03-51 Description of key features TBD 03-03-52 Summ
03- 3 Overall Landing Gear Footprint Layout, with Tyre Sizes and Oleo Stroke TBD
4 Description of Structural Attachment, Kinematics and Extension / Retraction and Stowage TBD
0 Avionics Systems Design TBD
03 1 Modular Avionics Architecture and Topology 34, 35.
Tarchitecture (IMsolution allows upgrades to software and hardware to be easily implemented and, more importantly, certified. More specifically, completely new packages can be implemented on standard modules and software partitions can be developed to potentiallys The system would implement 2 or even 3 sets of redundant hardware and software in racks located either all in the cockpit or located at the front and rear of the aircraft. The computer systems will be linked using a combination of AFDX and ARINC 629. Both buses are high speed and can be implemented using fibre optic or conventional electrical cabling. Fibre optics would lead to much lower system weight, though th
, (AFDS) is comprised of several fullFMCs) which control roll, pitch, yaw, s
32
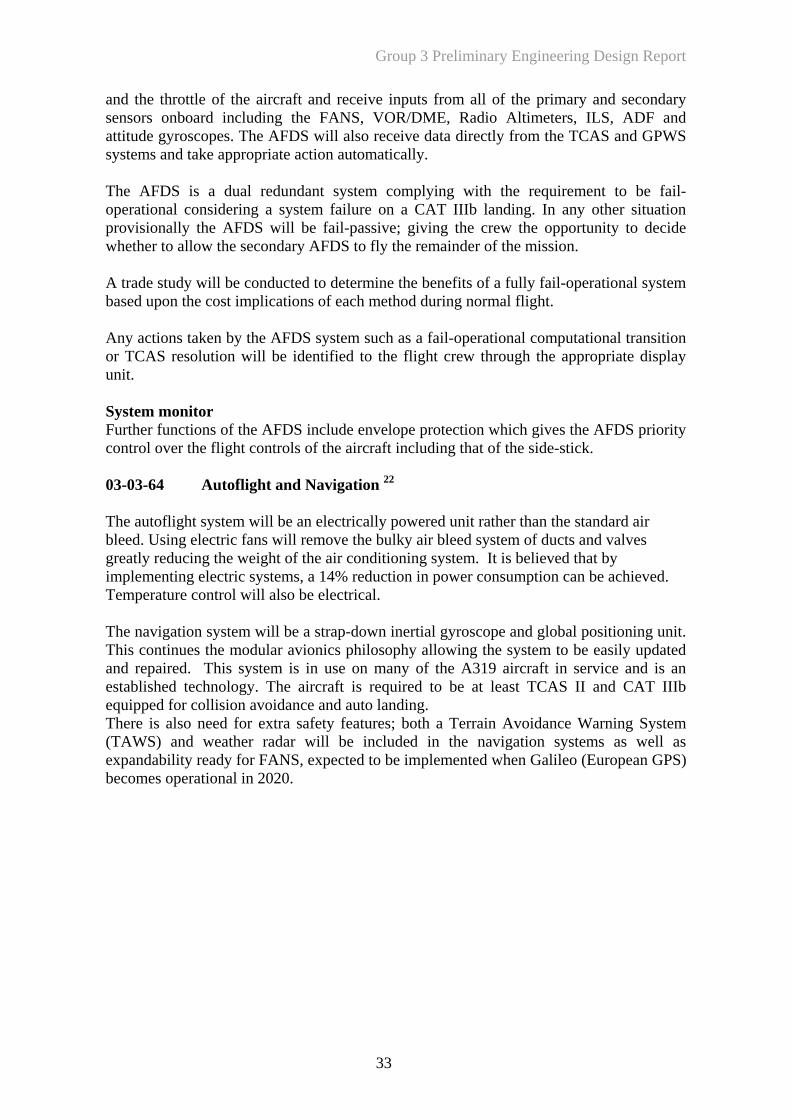
Group 3 Preliminary Engineering Design Report
and the throttle of the aircraft and receive inputs from all of the primary and secondary
he AFDS is a dual redundant system complying with the requirement to be fail-idering a system failure on a CAT IIIb landing. In any other situation
fits of a fully fail-operational system ased upon the cost implications of each method during normal flight.
transition te display
Further functio S priority
ht the standard air leed. Using electric fans will remove the bulky air bleed system of ducts and valves
philosophy allowing the system to be easily updated nd repaired. This system is in use on many of the A319 aircraft in service and is an
here is also need for extra safety features; both a Terrain Avoidance Warning System
sensors onboard including the FANS, VOR/DME, Radio Altimeters, ILS, ADF and attitude gyroscopes. The AFDS will also receive data directly from the TCAS and GPWS systems and take appropriate action automatically. Toperational consprovisionally the AFDS will be fail-passive; giving the crew the opportunity to decide whether to allow the secondary AFDS to fly the remainder of the mission. A trade study will be conducted to determine the beneb Any actions taken by the AFDS system such as a fail-operational computationalor TCAS resolution will be identified to the flight crew through the appropriaunit. System monitor
ns of the AFDS include envelope protection which gives the AFDcontrol over the flight controls of the aircraft including that of the side-stick.
03-03-64 Autoflight and Navigation 22
The autoflig system will be an electrically powered unit rather than bgreatly reducing the weight of the air conditioning system. It is believed that by implementing electric systems, a 14% reduction in power consumption can be achieved. Temperature control will also be electrical. The navigation system will be a strap-down inertial gyroscope and global positioning unit. This continues the modular avionicsaestablished technology. The aircraft is required to be at least TCAS II and CAT IIIb equipped for collision avoidance and auto landing. T(TAWS) and weather radar will be included in the navigation systems as well as expandability ready for FANS, expected to be implemented when Galileo (European GPS) becomes operational in 2020.
33
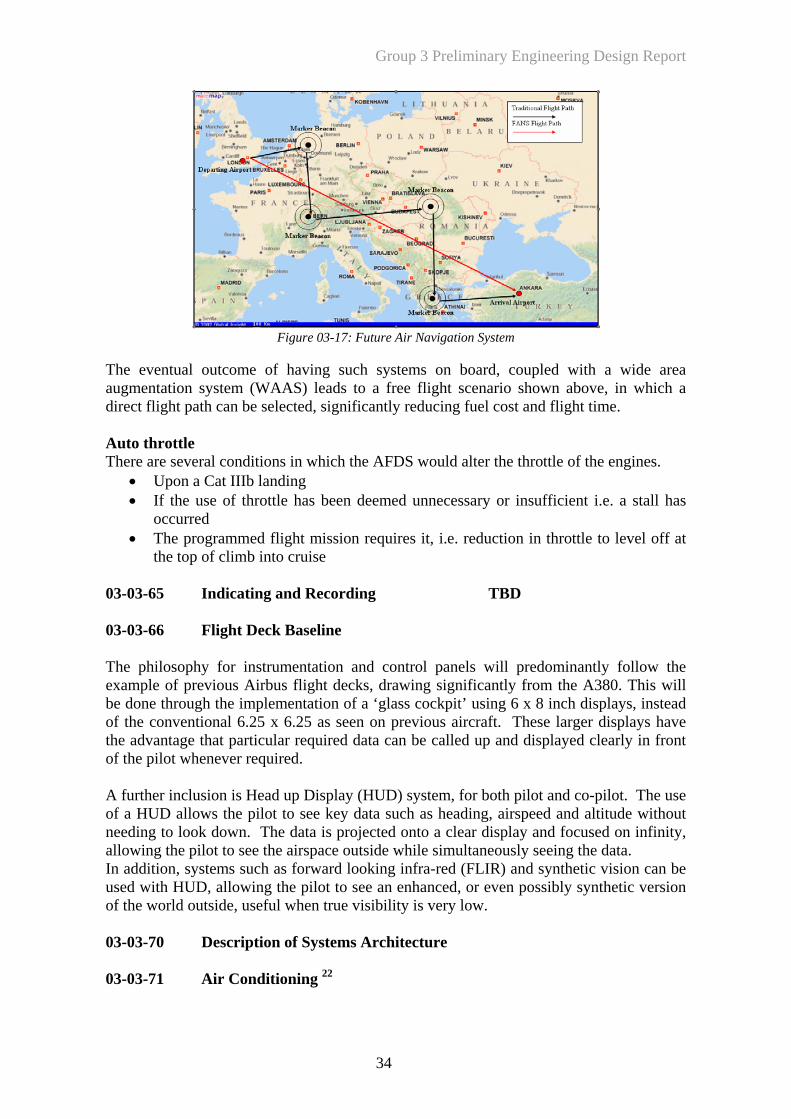
Group 3 Preliminary Engineering Design Report
Figure 03-17: Future Air Navigation System
The eugm
ventual outcome of having such systems on board, coupled with a wide area entation system (WAAS) leads to a free flight scenario shown above, in which a
an be selected, significantly reducing fuel cost and flight time.
here are several conditions in which the AFDS would alter the throttle of the engines.
• If the use of throttle has been deemed unnecessary or insufficient i.e. a stall has
ff at
TBD
pit’ using 6 x 8 inch displays, instead
further inclusion is Head up Display (HUD) system, for both pilot and co-pilot. The use of a HUD allows the pilot to see key data such as heading, airspeed and altitude without needing to look down. The data is projected onto a clear display and focused on infinity, allowing the pilot to see the airspace outside while simultaneously seeing the data. In addition, systems such as forward looking infra-red (FLIR) and synthetic vision can be used with HUD, allowing the pilot to see an enhanced, or even possibly synthetic version of the world outside, useful when true visibility is very low. 03-03-70 Description of Systems Architecture 03-03-71 Air Conditioning 22
adirect flight path c Auto throttle T
• Upon a Cat IIIb landing
occurred • The programmed flight mission requires it, i.e. reduction in throttle to level o
the top of climb into cruise 03-03-65 Indicating and Recording 03-03-66 Flight Deck Baseline The philosophy for instrumentation and control panels will predominantly follow the example of previous Airbus flight decks, drawing significantly from the A380. This will be done through the implementation of a ‘glass cockof the conventional 6.25 x 6.25 as seen on previous aircraft. These larger displays have the advantage that particular required data can be called up and displayed clearly in front of the pilot whenever required. A
34
Group 3 Preliminary Engineering Design Report
This system will be an electrically powered unit rather than the standard air bleed. Using electric fans will remove the bulky air bleed system of ducts and valves greatly reducing the weight of the air conditioning system. It is believed that by implementing electric ECS systems, a 14% reduction in power consumption can be achieved. The temperature control will also be electrical. 03-03-72 Communications To be confirmed, fairly established standard equipment, considering a data transfer facility for advanced navigation and auto-flight. They will be based on the B737-700 systems with both high and very high frequency systems, a cockpit voice recorder and a cockpit audio system. 03-03-73 Electrical P
enerator
(or both) LP and high pressure (HP) shafts of the engine allowing power to be taken from eith The advantages of this are twofold. Firstly, power off-take can be well matched to engine per mbenefit t and system weight. Secondly, we can easily witch to the low pressure spool for generation of power via the wind milling action of the
hig advantage, in that the voltage drop and power loss ffects of electricity transmission are equivalent to current in the wire; for a given power
ower 21, 36, 37, 38
The aircraft will derive power via 270V DC electrical generators mounted on one or both shafts of the engine. This will be backed up by an APU. Emergency power is generated via batteries and the wind milling action of the engine via a fan shaft driven g(FSDG). The choice of 270 V DC comes from the fact that generators can be mounted on either
er, or both simultaneously.
for ance, to provide a more efficient propulsion system. This obviously leads to s in DOC, due to savings in fuel cos
sengine, even if it is not providing much (or any) propulsion. Generally, h voltage power has aselevel, if we increase the voltage we decrease the current and thus the negative effects.
IVPloss = Eqn 03-01
Finally, the choice of 270V DC increases the compatibility with the electric-actuation system on board the aircraft. Higher voltage DC power does have some health and safety issues that would have to be mitigated. For instance insulation of the cabling would have to be thicker, and care would have to be taken that exposure of wires could not happen during an emergency situation. However the system is to be used on military aircraft, and indeed has been implemented during flight tests on the current Joint Strike Fighter program and can therefore be considered to no longer be high risk in terms of its implementation It is possible to improve the system further by implemconventional copper cabling. This is expected to save as m
enting aluminium cabling instead of uch as 30% weight of electrical
ilar value for s to 241400m. Based on a copper cabling weight of
.0079kg/m, the weight of the electrical harnessing on board the aircraft is calculated as
harnessing. Assuming 150 miles of wiring on the aircraft (based on simimilar sized C130 aircraft), this equates
0
35
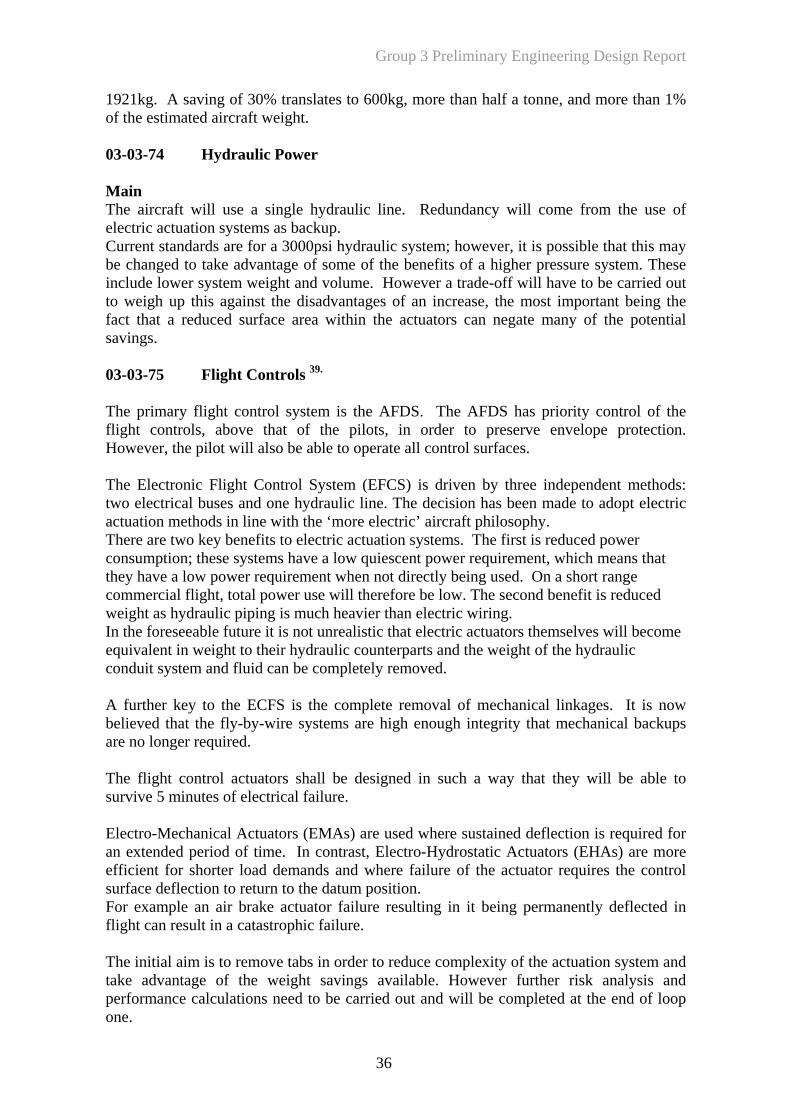
Group 3 Preliminary Engineering Design Report
1921kg. A saving of 30% translates to 600kg, more than half a tonne, and more than 1% of the estimated aircraft weight. 03-03-74 Hydraulic Power Main
ic line. Redundancy will come from the use of lectric actuation systems as backup.
up this against the disadvantages of an increase, the most important being the ct that a reduced surface area within the actuators can negate many of the potential
trols, above that of the pilots, in order to preserve envelope protection. owever, the pilot will also be able to operate all control surfaces.
draulic line. The decision has been made to adopt electric
second benefit is reduced eight as hydraulic piping is much heavier than electric wiring.
A further key to the ECFS is the complete removal of mechanical linkbelieved that the fly-by-wire systems are high enough integrity that mechanical backups
all be designed in such a way that they will be able to
anently deflected in
The aircraft will use a single hydrauleCurrent standards are for a 3000psi hydraulic system; however, it is possible that this may be changed to take advantage of some of the benefits of a higher pressure system. These include lower system weight and volume. However a trade-off will have to be carried out to weighfasavings. 03-03-75 Flight Controls 39.
The primary flight control system is the AFDS. The AFDS has priority control of the flight conH The Electronic Flight Control System (EFCS) is driven by three independent methods: two electrical buses and one hyactuation methods in line with the ‘more electric’ aircraft philosophy. There are two key benefits to electric actuation systems. The first is reduced power consumption; these systems have a low quiescent power requirement, which means that they have a low power requirement when not directly being used. On a short range commercial flight, total power use will therefore be low. ThewIn the foreseeable future it is not unrealistic that electric actuators themselves will become equivalent in weight to their hydraulic counterparts and the weight of the hydraulic conduit system and fluid can be completely removed.
ages. It is now
are no longer required.
he flight control actuators shTsurvive 5 minutes of electrical failure. Electro-Mechanical Actuators (EMAs) are used where sustained deflection is required for an extended period of time. In contrast, Electro-Hydrostatic Actuators (EHAs) are more efficient for shorter load demands and where failure of the actuator requires the control surface deflection to return to the datum position.
or example an air brake actuator failure resulting in it being permFflight can result in a catastrophic failure. The initial aim is to remove tabs in order to reduce complexity of the actuation system and take advantage of the weight savings available. However further risk analysis and performance calculations need to be carried out and will be completed at the end of loop one.
36
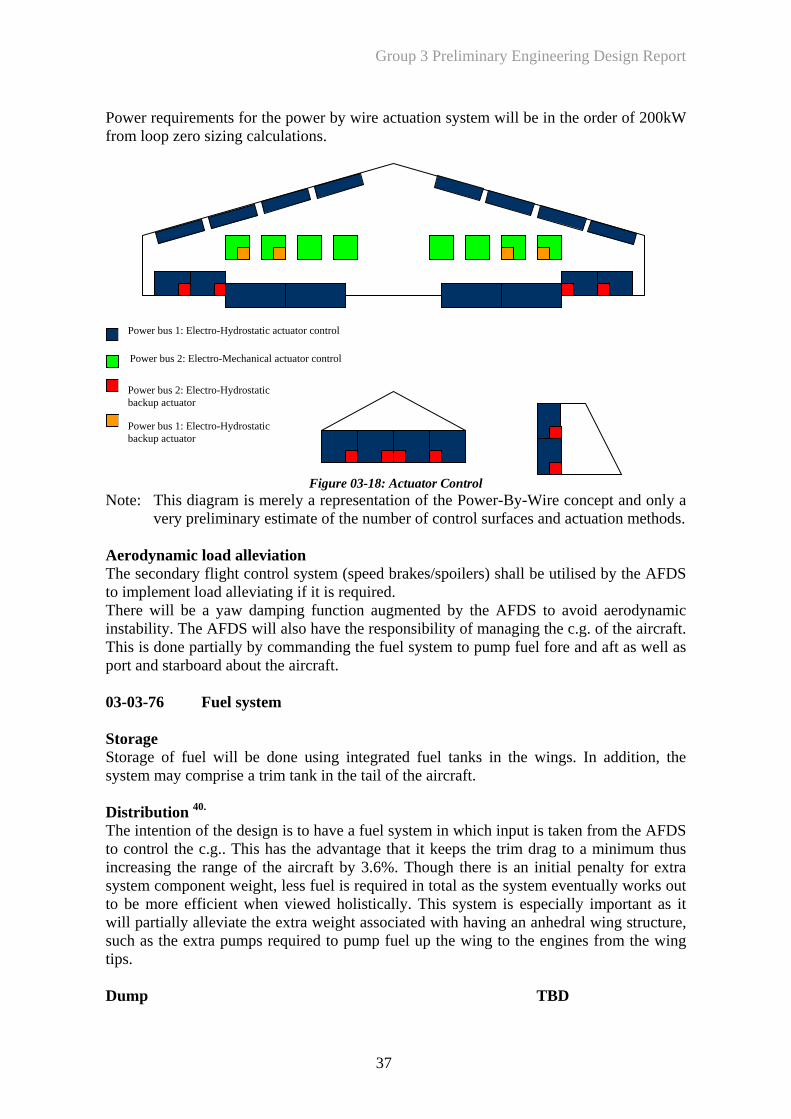
Group 3 Preliminary Engineering Design Report
Power requirements for the power by wire actuation system will be in the order of 200kW
om loop zero sizing calculations.
actuation methods.
AFDS
S to avoid aerodynamic
ell as
torage of fuel will be done using integrated fuel tanks in the wings. In addition, the
istribution
total as the system eventually works out
sociated with having an anhedral wing structure, uch as the extra pumps required to pump fuel up the wing to the engines from the wing
fr
Power bus 1: Electro-Hydrostatic actuator control
Power bus 2: Electro-Mechanical actuator control
Power bus 2: Electro-Hydrostatic
Figure 03-18: Actuator Control Note: This diagram is merely a representation of the Power-By-Wire concept and only a
very preliminary estimate of the number of control surfaces and
backup actuator
Power bus 1: Electro-Hydrostatic backup actuator
Aerodynamic load alleviation The secondary flight control system (speed brakes/spoilers) shall be utilised by the to implement load alleviating if it is required. There will be a yaw damping function augmented by the AFDinstability. The AFDS will also have the responsibility of managing the c.g. of the aircraft. This is done partially by commanding the fuel system to pump fuel fore and aft as wport and starboard about the aircraft. 03-03-76 Fuel system Storage Ssystem may comprise a trim tank in the tail of the aircraft.
40. DThe intention of the design is to have a fuel system in which input is taken from the AFDS to control the c.g.. This has the advantage that it keeps the trim drag to a minimum thus increasing the range of the aircraft by 3.6%. Though there is an initial penalty for extra system component weight, less fuel is required in to be more efficient when viewed holistically. This system is especially important as it will partially alleviate the extra weight asstips. Dump TBD
37
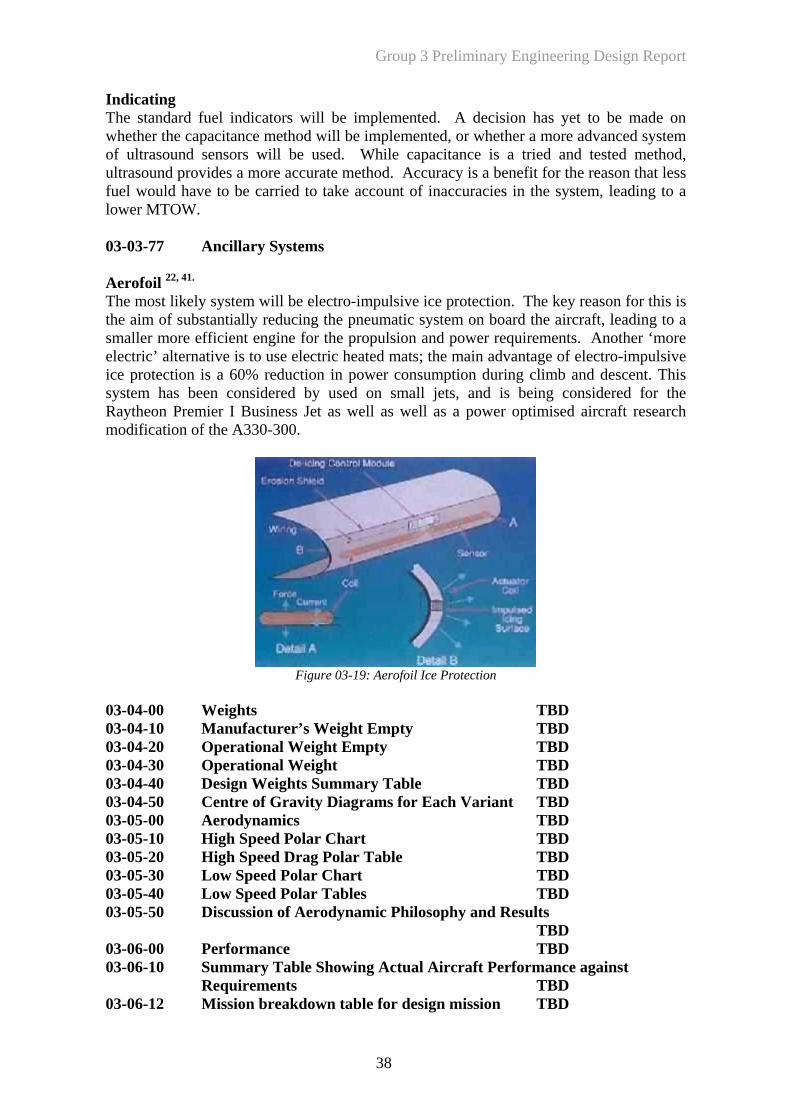
Group 3 Preliminary Engineering Design Report
Indicating
l be implemented, or whether a more advanced system f ultrasound sensors will be used. While capacitance is a tried and tested method,
at less
to a
ore sive
r the earch
The standard fuel indicators will be implemented. A decision has yet to be made on whether the capacitance method wiloultrasound provides a more accurate method. Accuracy is a benefit for the reason thfuel would have to be carried to take account of inaccuracies in the system, leading to a lower MTOW. 03-03-77 Ancillary Systems Aerofoil 22, 41.
The most likely system will be electro-impulsive ice protection. The key reason for this isthe aim of substantially reducing the pneumatic system on board the aircraft, leadingsmaller more efficient engine for the propulsion and power requirements. Another ‘melectric’ alternative is to use electric heated mats; the main advantage of electro-impulice protection is a 60% reduction in power consumption during climb and descent. This system has been considered by used on small jets, and is being considered foRaytheon Premier I Business Jet as well as well as a power optimised aircraft resmodification of the A330-300.
Figure 03-19: Aerofoil Ice Protection
TBD Manufacturer’s Weight Empty TBD
TBD entre of Gravity Diagrams for Each Variant TBD
-10 Summary Table Showing Actual Aircraft Performance against
03-04-00 Weights 03-04-1003-04-20 Operational Weight Empty TBD 03-04-30 Operational Weight TBD 03-04-40 Design Weights Summary Table 03-04-50 C03-05-00 Aerodynamics TBD 03-05-10 High Speed Polar Chart TBD 03-05-20 High Speed Drag Polar Table TBD 03-05-30 Low Speed Polar Chart TBD 03-05-40 Low Speed Polar Tables TBD 03-05-50 Discussion of Aerodynamic Philosophy and Results
TBD 03-06-00 Performance TBD 03-06
Requirements TBD 03-06-12 Mission breakdown table for design mission TBD
38
Group 3 Preliminary Engineering Design Report
03-06-13 Take-off and Landing Table TBD
CN Summary Table TBD 3-06-60 One-Engine Inoperative Ceiling and Discussion of Implications
TBD 3-06-70 Engine / Airframe Matching Chart TBD
Climb / Cruise Altitude Chart with Constraints and Limitations
TBD 3-07-30 Discussion of Operational Reliability Related Issues
TBD 03-08-00 Certification TBD 03-08-10 Relevant Certification Issues Related to the Study Aircraft Concept /
Configuration TBD 04 COMPETITOR BENCHMARKING 04-10-00 Overall Discussion of Competition Analysis One of the first stages of our project was to take the specification and find other aircraft in ervice that adhere to it. This titors to our aircraft design.
e ned for is market
nfor ber of the
decisions e de s for both these com aircraft can be
een ing joint. And
and the
03-06-20 Turn-Around Time TBD 03-06-21 Flowcharts showing critical path TBD 03-06-22 Discussion of philosophy and issues relating to meeting the
Requirements TBD 03-06-40 Take-Off Field Length Chart TBD 03-06-50 A0
003-06-80
TBD 03-06-90 Table of Aircraft Noise and Emissions Versus Requirements and
Discussion of Issues and Drivers TBD 03-07-00 Economics TBD 03-07-10 Cash Operating Cost Breakdown for Each Variant, and Discussion of
Issues TBD 03-07-20 Discussion of Indirect Operating Cost Related Issues
0
sIt
would provide us with the compe quickly became apparent that there were two key competitors for our specification, th
7-70 thes re desigBoeing 73 0 and the Airbus A319. However e are aircraft that weflag-carrier airlines and not the low fare market, they have been adapted to suit thbut since their basic design isn’t specified to a low fare customer they can be improved on. Once the i mation had been gathered on the competitor , it was used in a numsways, as a baseline for the loop zero sizing calculations, as a comparison to show
d a a wor ing de ign to help us makepredicted reductions in operating costs, an s k srthrough th sign process. The summary sheet petito
found as an appendix. We have also analyzed other aircraft for specific functions, once our dchosen; the Bae-146 became relevant for the internal structure of a
esign had bhigh w
other high wing designs were also used for this information including the A400MBombardier Q400.
39
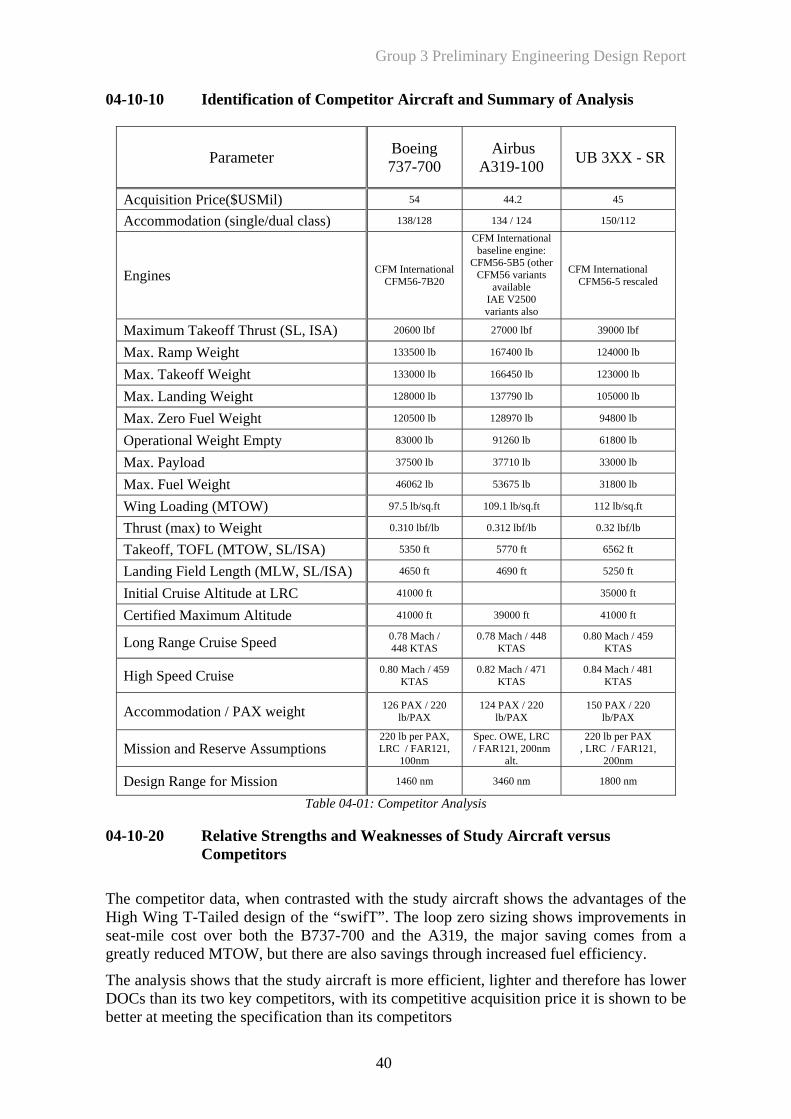
Group 3 Preliminary Engineering Design Report
04-10-10 Identification of Competitor A f S ry of Aircra t and umma nalysis
XX - SR
Parameter Boeing 737-700
Airbus A319-100 UB 3
Acquisition Price($USMil) 54 44.2 45
Accomm tion (single/dual class) 138/128 134 / 124 150/112 oda
Engines l CFM56-7B20 CFM56 variants
available
M International CFM56-5 resca
baseline engiCFM 5B5 (o
IAE V2500
led
CFM Internatio
CFM Internationa 56- ther CF
nal ne:
variants also
Maximu lbf 0 lbf 39000 lbf m Takeoff Thrust (SL, ISA) 20600 2700
Max. Ramp Weight 133500 lb 167400 lb 124000 lb
Max. Takeoff Weight 133000 lb 166450 lb 123000 lb
Max. Landing Weight 128000 lb 137790 lb 105000 lb
Max. Zero Fuel Weight 120500 lb 128970 lb 94800 lb
Operational Weight Empty 83000 lb 91260 lb lb 61800
Max. Payload 37500 lb 37710 lb 33000 lb
Max. Fuel Weight 46062 lb 53675 lb 31800 lb
Wing Lo g (MTOW) 97.5 lb/sq.ft 109.1 lb/sq.ft 112 lb/sq.ft adinThrust (max) bf/lb to Weight 0.310 lbf/lb 0.312 lbf/lb 0.32 l
Takeoff, TOFL (MTOW, SL/ISA) 5350 ft 5770 ft 6562 ft
Landing Field Length (MLW, SL/ISA) 4650 ft 4690 ft 5250 ft
Initial Cruise Altitude at LRC 41000 ft 35000 ft
Certified Maximum Altitude 41000 ft 39000 ft 41000 ft
Long Range Cruise Speed 448 KTAS ach / 448
KTAS 0.80 Mach / 459
KTAS 0.78 Mach / 0.78 M
High Speed Cruise 0.80 Mach / 459 KTAS
0.82 Mach / 471 KTAS
0.84 Mach / 481 KTAS
Accommodation / PAX weight 126 PAX / 220 lb/PAX
124 PAX / 220 lb/PAX
150 PAX / 220 lb/PAX
Mission and Reserve Assumptions 220 lb per PAX, LRC / FAR121,
100nm
Spec. OWE, LRC / FAR121, 200nm
alt.
220 lb per PAX , LRC / FAR121,
200nm
Design Range for Mission 1460 nm 3460 nm 1800 nm
Table 04-01: Competitor Analysis
04-10-20 Relative Strengths and Weaknesses of Study Aircraft versus Competitors
The competitor data, when contrasted with the study aircraft shows the advantages oHigh Wing T-Tailed design of the “swifT”. The loop zero sizing shows improvements iseat-mile cost over both the B737-700 and the A319, the major saving comes from agreatly reduced MT
f the n
OW, but there are also savings through increased fuel efficiency.
he analysis shows that the study aircraft is more efficient, lighter and therefore has lower OCs than its two key competitors, with its competitive acquisition price it is shown to be etter at meeting the specification than its competitors
TDb
40
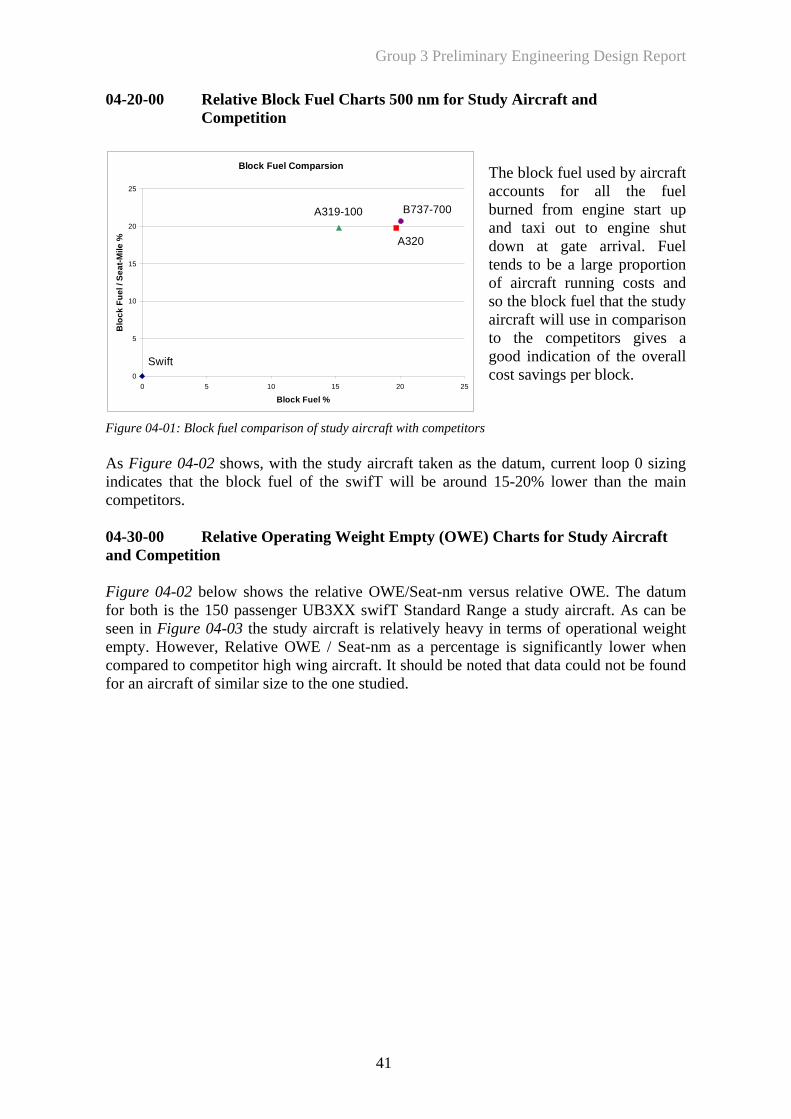
Group 3 Preliminary Engineering Design Report
04-20-00 Relative Block Fuel Charts 500 nm for Study Aircraft and
Block Fuel Comparsion
A320
B737-700-100
10
10 15 25
Block Fuel %
Blo
ck F
uel /
Sea
t-Mile
%
Swift
A31920
0
5
15
25
0 5 20
Competition
fuel used by aircraft accounts for all the fuel burned from engine start up
i out to e shut gate arrival. Fuel rtion
t ru and ock fuel that the study
parison to the competitor ves a
dication verall ings per
Fig of study aircraft with etitors As shows, with the study aircraft taken as the datum, current loop 0 sizing indicates that the block fuel of the swifT will be around 15-20% lower than the main co 04 perating Weight Em tudy Aircraft an Fi relative OW versus relative OWE. The datum for both is the 150 passenger UB3XX swifT ard Ran udy aircra can be seen in vy in termem OWE / Seat-nm rcentage gnificantly r when com tor high wing aircraft e n a cofo r size to the one studie
The block
and tax engindown at tends to beof aircraf
a large proponning costs
so the blaircraft will use in com
s gigood in of the ocost sav block.
ure 04-01: Block fuel comparison comp
Figure 04-02
mpetitors.
-30-00 Relative O pty (OWE) Charts for Sd Competition
gure 04-02 below shows the E/Seat-nm Stand ge a st ft. As
Figure 04-03 the study aircraft is relatively hea s of operational weight is sipty. However, Relative as a pe lowe
pared to competir an aircraft of simila
. It should bd.
oted that dat uld not be found
41
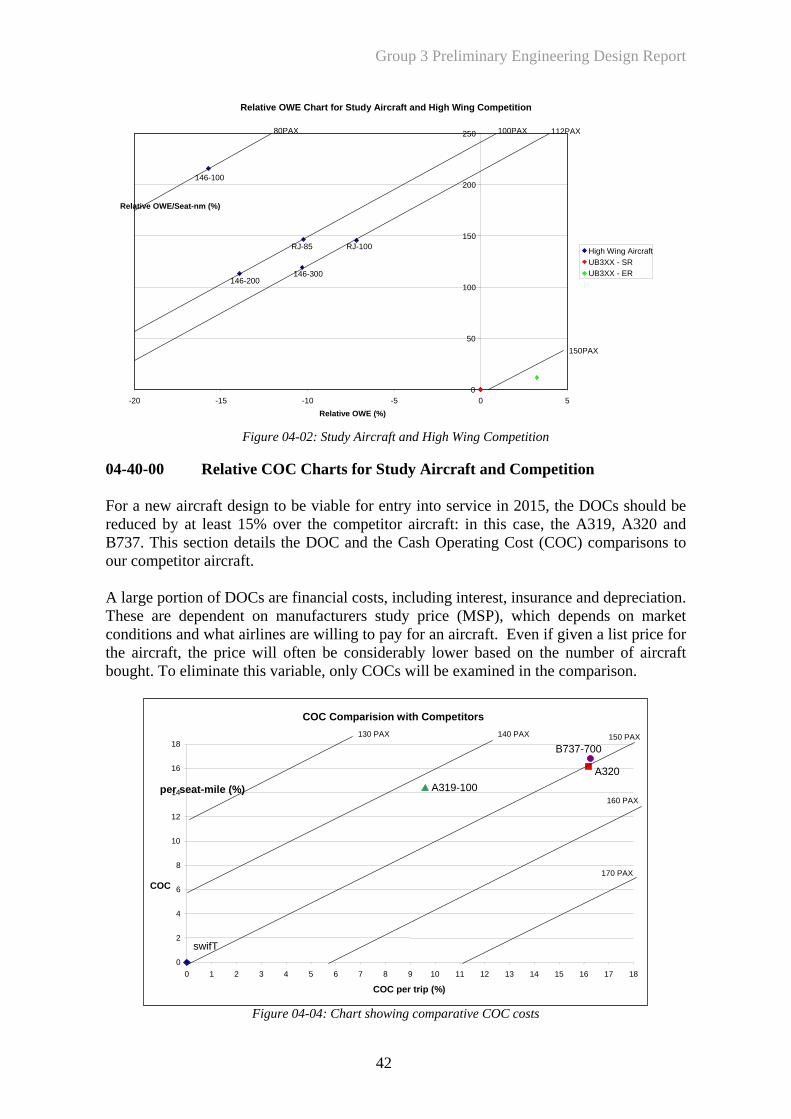
Group 3 Preliminary Engineering Design Report
42
ompetition
craft design to be viable for entry into service in 2015, the DOCs should be y at
to raft.
Figure 04-04: Chart showing comparative COC costs
Relative OWE Chart for Study Aircraft and High Wing Competition
Figure 04-02: Study Aircraft and High Wing C
04-40-00 Relative COC Charts for Study Aircraft and Competition For a new airreduced b least 15% over the competitor aircraft: in this case, the A319, A320 and B737. This section details the DOC and the Cash Operating Cost (COC) comparisons our competitor airc A large portion of DOCs are financial costs, including interest, insurance and depreciation. These are dependent on manufacturers study price (MSP), which depends on market conditions and what airlines are willing to pay for an aircraft. Even if given a list price for the aircraft, the price will often be considerably lower based on the number of aircraft bought. To eliminate this variable, only COCs will be examined in the comparison.
0
50
100
150
200
250
-20 -15 -10 -5 0 5 Relative OWE (%)
Relative OWE/Seat-nm (%)
80PAX
High Wing AircraftUB3XX - SR UB3XX - ER
150PAX
100PAX 112PAX
146-100
146-200146-300
RJ-85 RJ-100
COC Comparision with Competitors
swifT
A320 A319-100
B737-700
0 2 4 6 8
10 12 14 16 18
0 1 2 3 4 5 6 7 8 9 10 11 12 13 14 15 16 17 18 COC per trip (%)
COC
per seat-mile (%)
150 PAX 130 PAX 140 PAX
160 PAX
170 PAX
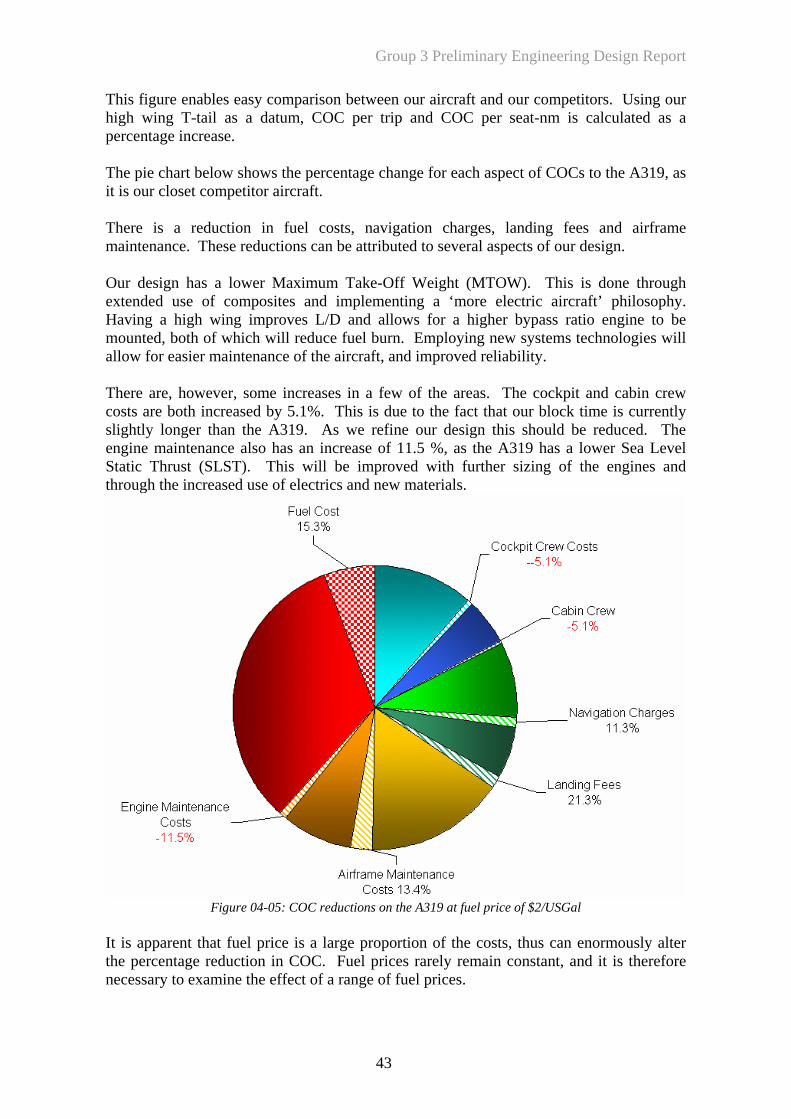
Group 3 Preliminary Engineering Design Report
This figure enables easy comparison between our aircraft and our competitors. Usinhigh wing T-tail as a datum, COC per trip and COC per seat-nm is calculatepercentage increase. The pie chart below shows the percentage change for each aspect of COCs to the A319, asit is our closet competitor aircraft. There is a reduction in fuel costs, navigation charges, landing fees and airframmaintenance. These reductions can be attributed to several aspects of our design. Our design has a lower Maximum Take-Off Weight (MTOW). This is done through extended use of composites and implementing a ‘more electric aircraft’ philosHaving a high wing improves L/D and allows for a higher bypass ratio engine to be mounted, both of which will reduce fuel burn. Employing new systems technologies will allow for easier maintenance of the aircraft, and improved reliability. There are, however, some increases in a few of the areas. The cockpit and cabincosts are both increased by 5.1%. This is due to the fact that our block time is currently slightly longer than
g our d as a
e
ophy.
crew
d be reduced. he engine maintenance also has an increase of
engines and e inc
the A319. As we refine our design this shoul 11.5 %, as the A319 has a lower Sea Level
T
Static Thrust (SLST). This will be improved with further sizing of the rough th reased use of electrics and new materials. th
Figure 04-05: COC reductions on the A319 at fuel price of $2/USGal
arent that fuel price is a large proportion of the costs, thus can enormcentage reduction in COC. Fuel prices rarely remain constant, and it is ther
necessary to examine the effect of a range of fuel prices.
It is app ously alter the per efore
43
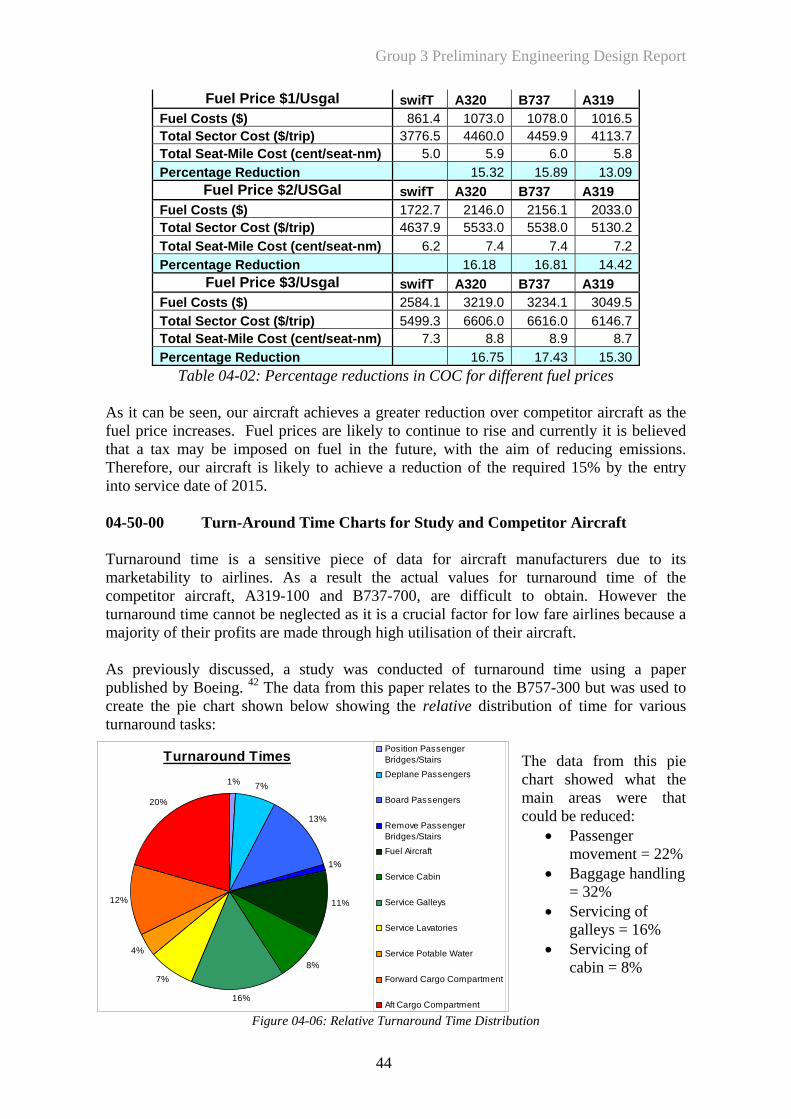
Group 3 Preliminary Engineering Design Report
Fuel Price $1/Usgal swifT A320 B737 A319 Fuel Costs ($) 861.4 1073.0 1078.0 1016.5 Total Sector Cost ($/trip) 3776.5 4460.0 4459.9 4113.7 Total Seat-Mile Cost (cent/seat-nm) 5.0 5.9 6.0 5.8 Percentage Reduction 15.32 15.89 13.09
Fuel Price $2/USGal swifT A320 B737 A319 Fuel Costs ($) 1722.7 2146.0 2156.1 2033.0 Total Sector Cost ($/trip) 4637.9 5533.0 5538.0 5130.2 Total Seat-Mile Cost (cent/seat-nm) 6.2 7.4 7.4 7.2
16.18 16.81 14.42 Percentage Reduction Fuel Price $3/Usgal swifT A320 B737 A319
Fuel Costs ($) 2584.1 3219.0 3234.1 3049.5 Total Sector Cost ($/trip) 5499.3 6606.0 6616.0 6146.7 Total Seat-Mile Cost (cent/seat-nm) 7.3 8.8 8.9 8.7 Percentage Reduction 16.75 17.43 15.30
Turnaround Times1% 7%
13%
1%
16%
12%
20%
11%
8%7%
4%
Position PassengerBridges/StairsDeplane Passengers
Board Passengers
Remove PassengerBridges/Stairs
Fuel Aircraft
Service Cabin
Service Galleys
Service Lavatories
Service Potable Water
Forward Cargo Compartment
Aft Cargo Compartment
Table 04-02: Percentage reductions in COC for different fuel prices
04-50-00 Turn-Around Time Charts for Study and Competitor Aircraft Turnaround time is a sensitive piece of data for aircraft manufacturers due to its marketability to airlines. As a result the actual values for turnaround time of the competitor aircraft, A319-100 and B737-700, are difficult to obtain. However the turnaround time cannot be neglected as it is a crucial factor for low fare airlines because a majority of their profits are made through high utilisation of their aircraft. As previously discussed, a study was conducted of turnaround time using a paper published by Boeing. 42 The data from this paper relates to the B757-300 but was used to create the pie chart shown below showing the relative distribution of time for various turnaround tasks:
The data from this pie chart showed what the main areas were that could be reduced:
• Passenger movement = 22%
• Baggage handling = 32%
vicing of
Figure 04-06: Relative Turnaround Time Distribution
As it can be seen, our aircraft achieves a greater reduction over competitor aircraft as the fuel price increases. Fuel prices are likely to continue to rise and currently it is believed that a tax may be imposed on fuel in the future, with the aim of reducing emissions. Therefore, our aircraft is likely to achieve a reduction of the required 15% by the entry into service date of 2015.
• Sergalleys = 16%
• Servicing of cabin = 8%
44
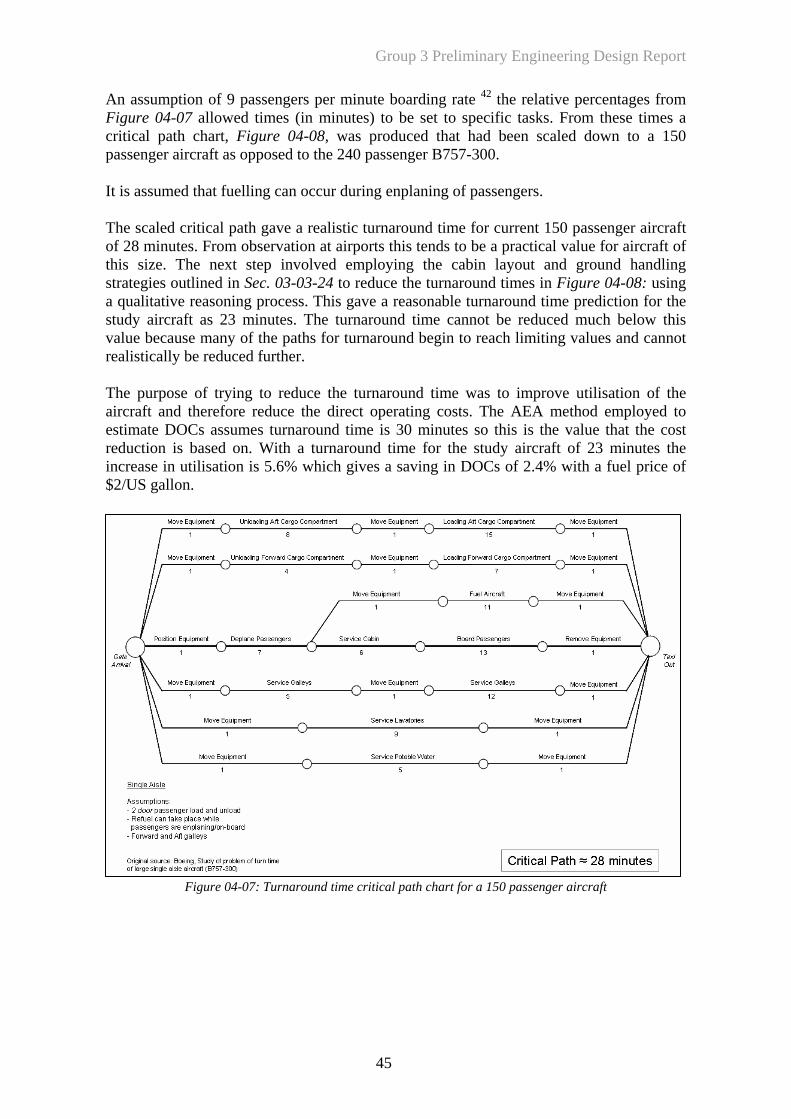
Group 3 Preliminary Engineering Design Report
45
An assumption of 9 passengers per minute b the e p rom Figure 0 times (in minutes) to be set to ta om times a critical , was prod atpasseng enge 57-30 It is assumed th uring en g eng The scaled critical path gave a realistic turnaround time for current 150 passenger aircraft of 28 m this t s to be ractic lue fo craft of this size. The next step involved employing the cabin layout and ground handling strategies outlin reduce n tim Figure 04-08: using a qualitative reasoning process. This gave a r le un pr for the study ai e turnaroun ca r m w this value be und begin to reach limiting values and cannot realistic
he purpose of trying to reduce the turnaround time was to improve utilisation of the
sseng
oarding rate 42 relativ ercentages f4-07 allowed specific sks. Fr these
path chart, Figure 04-08 uced th had been scaled down to a 150 er aircraft as opposed to the 240 pass r B7 0.
at fuelling can occur d planin of pass ers.
inutes. From observation at airports end a p al va r air
ed in Sec. 03-03-24 to the tur around es in easonab turnaro d time ediction
rcraft as 23 minutes. Th d time nnot be educed uch belocause many of the paths for turnaroally be reduced further.
Taircraft and therefore reduce the direct operating costs. The AEA method employed to estimate DOCs assumes turnaround time is 30 minutes so this is the value that the cost reduction is based on. With a turnaround time for the study aircraft of 23 minutes the increase in utilisation is 5.6% which gives a saving in DOCs of 2.4% with a fuel price of $2/US gallon.
Figure 04-07: Turnaround time critical path chart for a 150 pa er aircraft
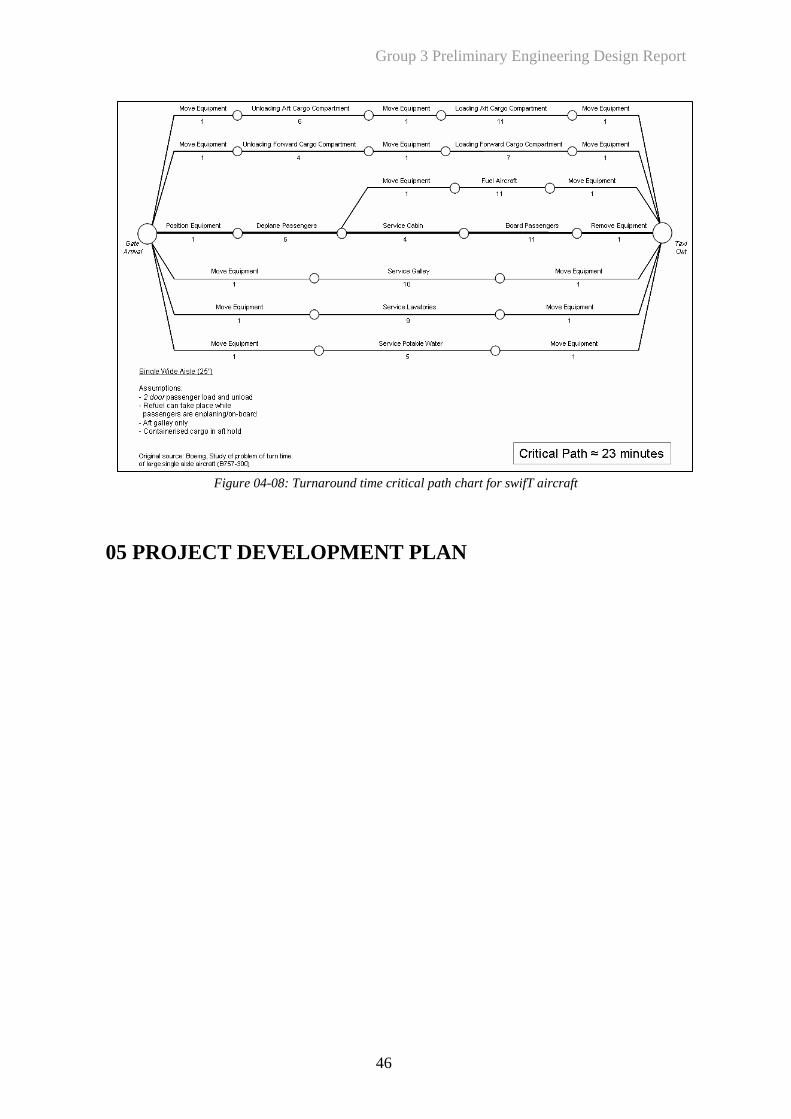
Group 3 Preliminary Engineering Design Report
Figure 04-08: Turnaround time critical path chart for swifT aircraft
05 PROJECT DEVELOPMENT PLAN
46
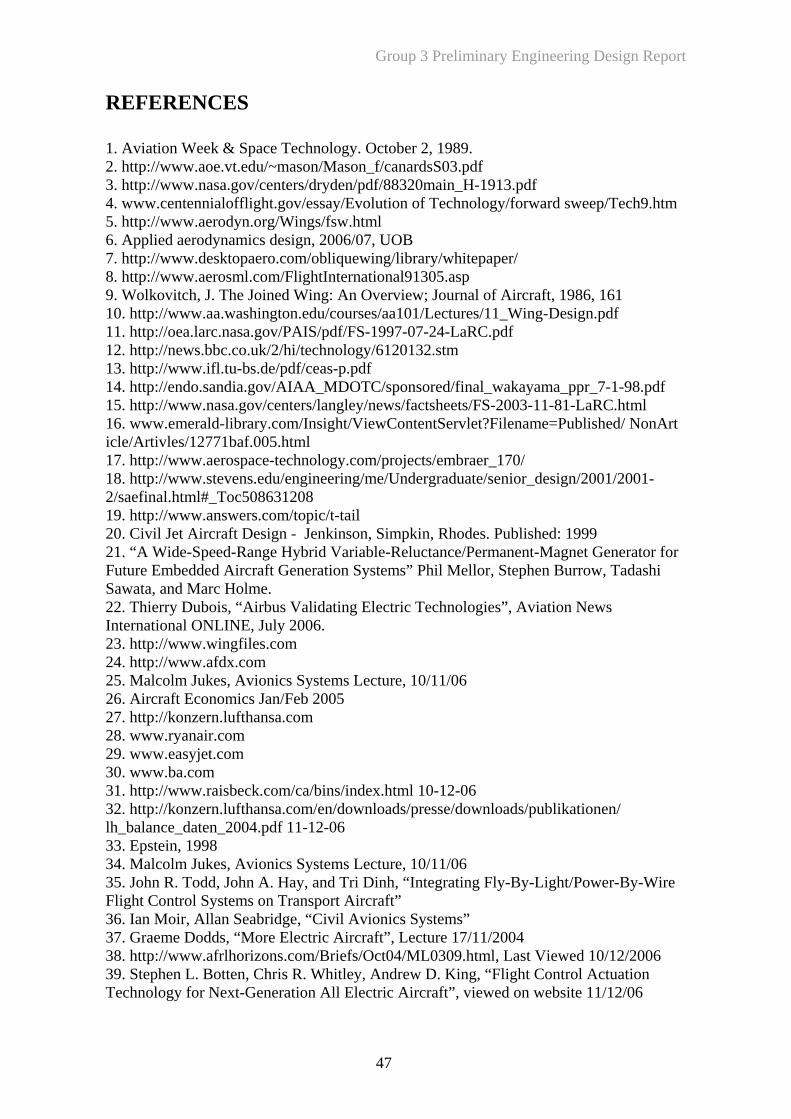
Group 3 Preliminary Engineering Design Report
REFERENCES
1. Aviation Week & Space Technology. October 2, 1989.
. http://www.aoe.vt.edu/~mason/Mason_f/canardsS03.pdf
. http://www.nasa.gov/centers/dryden/pdf/88320main_H-1913.pdf
. www.centennialofflight.gov/essay/Evolution of Technology/forward sweep/Tech9.htm
. http://www.aerodyn.org/Wings/fsw.html
. Applied aerodynamics design, 2006/07, UOB
. http://www.desktopaero.com/obliquewing/library/whitepaper/
. http://www.aerosml.com/FlightInternational91305.asp
. Wolkovitch, J. The Joined Wing: An Overview; Journal of Aircraft, 1986, 161 0. http://www.aa.washington.edu/courses/aa101/Lectures/11_Wing-Design.pdf 1. http://oea.larc.nasa.gov/PAIS/pdf/FS-1997-07-24-LaRC.pdf 2. http://news.bbc.co.uk/2/hi/technology/6120132.stm 3. http://www.ifl.tu-bs.de/pdf/ceas-p.pdf 4. http://endo.sandia.gov/AIAA_MDOTC/sponsored/final_wakayama_ppr_7-1-98.pdf 5. http://www.nasa.gov/centers/langley/news/factsheets/FS-2003-11-81-LaRC.html 6. www.emerald-library.com/Insight/ViewContentServlet?Filename=Published/ NonArt le/Artivles/12771baf.005.html 7. http://www.aerospace-technology.com/projects/embraer_170/
ww.s 001/2001-/saefinal.html#_Toc508631208 9. http://www.answers.com/topic/t-tail 0. Civil Jet Aircraft Design - Jenkinson, Simpkin, Rhodes. Published: 1999
ermanent-Magnet Generator for uture Embedded Aircraft Generation Systems” Phil Mellor, Stephen Burrow, Tadashi awata, and Marc Holme. 2. Thierry Dubois, “Airbus Validating Electric Technologies”, Aviation News ternational ONLINE, July 2006.
3. http://www.wingfiles.com 4. http://www.afdx.com 5. Malcolm Jukes, Avionics Systems Lecture, 10/11/06 6. Aircraft Economics Jan/Feb 2005 7. http://konzern.lufthansa.com 8. www.ryanair.com 9. www.easyjet.com 0. www.ba.com 1. http://www.raisbeck.com/ca/bins/index.html 10-12-06 2. http://konzern.lufthansa.com/en/downloads/presse/downloads/publikationen/ _balance_daten_2004.pdf 11-12-06
3. Epstein, 1998 4. Malcolm Jukes, Avionics Systems Lecture, 10/11/06 5. John R. Todd, John A. Hay, and Tri Dinh, “Integrating Fly-By-Light/Power-By-Wire light Control Systems on Transport Aircraft” 6. Ian Moir, Allan Seabridge, “Civil Avionics Systems” 7. Graeme Dodds, “More Electric Aircraft”, Lecture 17/11/2004 8. http://www.afrlhorizons.com/Briefs/Oct04/ML0309.html, Last Viewed 10/12/2006 9. Stephen L. Botten, Chris R. Whitley, Andrew D. King, “Flight Control Actuation echnology for Next-Generation All Electric Aircraft”, viewed on website 11/12/06
234567891111111ic118. http://w tevens.edu/engineering/me/Undergraduate/senior_design/221221. “A Wide-Speed-Range Hybrid Variable-Reluctance/PFS2In2222222333lh333F3333T
47

Group 3 Preliminary Engineering Design Report
40. Alexander Campbel005
l, “Burn Less Pay Less”, Aircraft Economics January/February
ircraft (B757-300) Boeing
241. http://www.dawnbroker.com/vas05/docs/IOI-Brochure.pdf42. Study of Problem of Turn Time of Large Single Aisle A
48
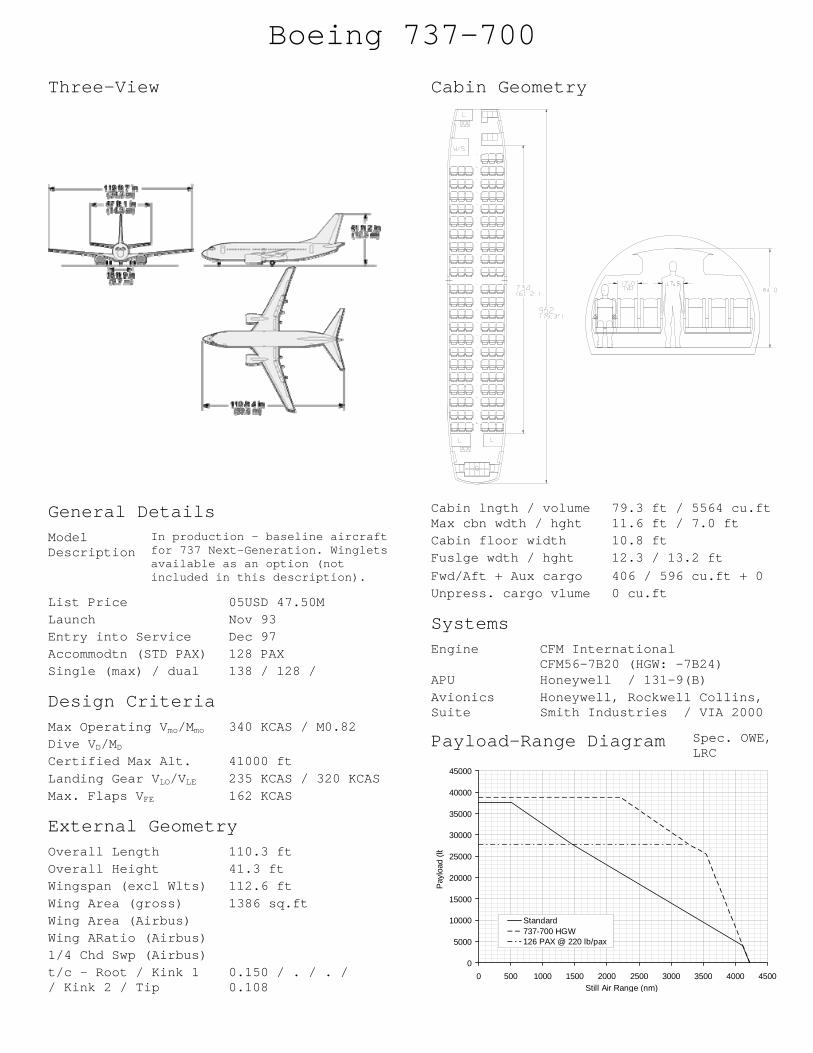
Boeing 737-700
Three-View
General Details
Model Description
In production - baseline aircraft for 737 Next-Generation. Winglets available as an option (not included in this description).
List Price 05USD 47.50M Launch Nov 93 Entry into Service Dec 97 Accommodtn (STD PAX) 128 PAX Single (max) / dual 138 / 128 /
Design Criteria
Max Operating Vmo/Mmo 340 KCAS / M0.82 Dive VD/MD Certified Max Alt. 41000 ft Landing Gear VLO/VLE 235 KCAS / 320 KCAS Max. Flaps VFE 162 KCAS
External Geometry
Overall Length 110.3 ft Overall Height 41.3 ft Wingspan (excl Wlts) 112.6 ft Wing Area (gross) 1386 sq.ft Wing Area (Airbus) Wing ARatio (Airbus) 1/4 Chd Swp (Airbus) t/c - Root / Kink 1 / Kink 2 / Tip
0.150 / . / . / 0.108
Cabin Geometry
Cabin lngth / volume 79.3 ft / 5564 cu.ft Max cbn wdth / hght 11.6 ft / 7.0 ft Cabin floor width 10.8 ft Fuslge wdth / hght 12.3 / 13.2 ft Fwd/Aft + Aux cargo 406 / 596 cu.ft + 0 Unpress. cargo vlume 0 cu.ft
Systems Engine CFM International
CFM56-7B20 (HGW: -7B24) APU Honeywell / 131-9(B) Avionics Suite
Honeywell, Rockwell Collins, Smith Industries / VIA 2000
Payload-Range Diagram Spec. OWE, LRC
0
5000
10000
15000
20000
25000
30000
35000
40000
45000
0 500 1000 1500 2000 2500 3000 3500 4000 4500Still Air Range (nm)
Payl
oad
(lb
Standard737-700 HGW126 PAX @ 220 lb/pax
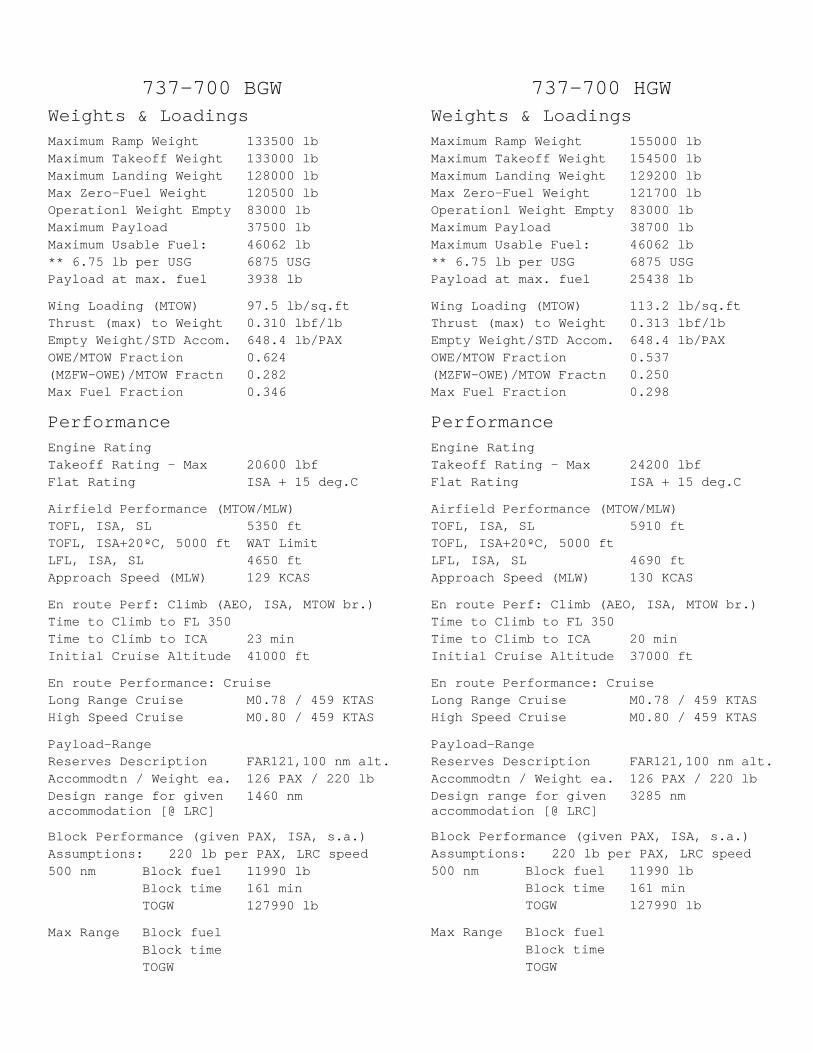
737-700 BGW Weights & Loadings Maximum Ramp Weight 133500 lb Maximum Takeoff Weight 133000 lb Maximum Landing Weight 128000 lb Max Zero-Fuel Weight 120500 lb Operationl Weight Empty 83000 lb Maximum Payload 37500 lb Maximum Usable Fuel: 46062 lb ** 6.75 lb per USG 6875 USG Payload at max. fuel 3938 lb
Wing Loading (MTOW) 97.5 lb/sq.ft Thrust (max) to Weight 0.310 lbf/lb Empty Weight/STD Accom. 648.4 lb/PAX OWE/MTOW Fraction 0.624 (MZFW-OWE)/MTOW Fractn 0.282 Max Fuel Fraction 0.346
Performance Engine Rating Takeoff Rating – Max 20600 lbf Flat Rating ISA + 15 deg.C
Airfield Performance (MTOW/MLW) TOFL, ISA, SL 5350 ft TOFL, ISA+20ºC, 5000 ft WAT Limit LFL, ISA, SL 4650 ft Approach Speed (MLW) 129 KCAS
En route Perf: Climb (AEO, ISA, MTOW br.) Time to Climb to FL 350 Time to Climb to ICA 23 min Initial Cruise Altitude 41000 ft
En route Performance: Cruise Long Range Cruise M0.78 / 459 KTAS High Speed Cruise M0.80 / 459 KTAS
Payload-Range Reserves Description FAR121,100 nm alt. Accommodtn / Weight ea. 126 PAX / 220 lb Design range for given accommodation [@ LRC]
1460 nm
Block Performance (given PAX, ISA, s.a.) Assumptions: 220 lb per PAX, LRC speed 500 nm Block fuel 11990 lb Block time 161 min TOGW 127990 lb
Max Range Block fuel Block time TOGW
737-700 HGW
Weights & Loadings
Maximum Ramp Weight 155000 lb Maximum Takeoff Weight 154500 lb Maximum Landing Weight 129200 lb Max Zero-Fuel Weight 121700 lb Operationl Weight Empty 83000 lb Maximum Payload 38700 lb Maximum Usable Fuel: 46062 lb ** 6.75 lb per USG 6875 USG Payload at max. fuel 25438 lb
Wing Loading (MTOW) 113.2 lb/sq.ft Thrust (max) to Weight 0.313 lbf/lb Empty Weight/STD Accom. 648.4 lb/PAX OWE/MTOW Fraction 0.537 (MZFW-OWE)/MTOW Fractn 0.250 Max Fuel Fraction 0.298
Performance Engine Rating Takeoff Rating – Max 24200 lbf Flat Rating ISA + 15 deg.C
Airfield Performance (MTOW/MLW) TOFL, ISA, SL 5910 ft TOFL, ISA+20ºC, 5000 ft LFL, ISA, SL 4690 ft Approach Speed (MLW) 130 KCAS
En route Perf: Climb (AEO, ISA, MTOW br.) Time to Climb to FL 350 Time to Climb to ICA 20 min Initial Cruise Altitude 37000 ft
En route Performance: Cruise Long Range Cruise M0.78 / 459 KTAS High Speed Cruise M0.80 / 459 KTAS
Payload-Range Reserves Description FAR121,100 nm alt. Accommodtn / Weight ea. 126 PAX / 220 lb Design range for given accommodation [@ LRC]
3285 nm
Block Performance (given PAX, ISA, s.a.) Assumptions: 220 lb per PAX, LRC speed 500 nm Block fuel 11990 lb Block time 161 min TOGW 127990 lb
Max Range Block fuel Block time TOGW
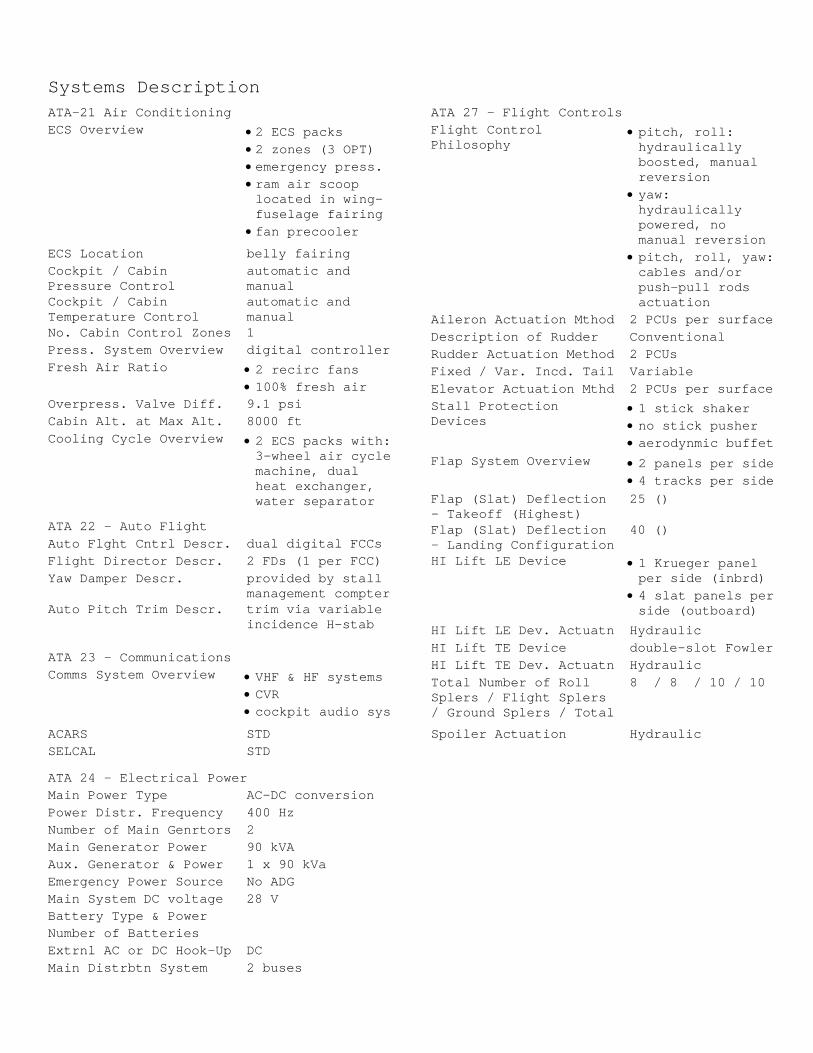
Systems Description ATA-21 Air Conditioning ECS Overview • 2 ECS packs
• 2 zones (3 OPT) • emergency press. • ram air scoop located in wing-fuselage fairing
• fan precooler ECS Location belly fairing Cockpit / Cabin Pressure Control
automatic and manual
Cockpit / Cabin Temperature Control
automatic and manual
No. Cabin Control Zones 1 Press. System Overview digital controller Fresh Air Ratio • 2 recirc fans
• 100% fresh air Overpress. Valve Diff. 9.1 psi Cabin Alt. at Max Alt. 8000 ft Cooling Cycle Overview • 2 ECS packs with:
3-wheel air cycle machine, dual heat exchanger, water separator
ATA 22 - Auto Flight Auto Flght Cntrl Descr. dual digital FCCs Flight Director Descr. 2 FDs (1 per FCC) Yaw Damper Descr. provided by stall
management compter Auto Pitch Trim Descr. trim via variable
incidence H-stab ATA 23 - Communications Comms System Overview • VHF & HF systems
• CVR • cockpit audio sys
ACARS STD SELCAL STD
ATA 24 - Electrical Power Main Power Type AC-DC conversion Power Distr. Frequency 400 Hz Number of Main Genrtors 2 Main Generator Power 90 kVA Aux. Generator & Power 1 x 90 kVa Emergency Power Source No ADG Main System DC voltage 28 V Battery Type & Power Number of Batteries Extrnl AC or DC Hook-Up DC Main Distrbtn System 2 buses
ATA 27 - Flight Controls Flight Control Philosophy
• pitch, roll: hydraulically boosted, manual reversion
• yaw: hydraulically powered, no manual reversion
• pitch, roll, yaw: cables and/or push-pull rods actuation
Aileron Actuation Mthod 2 PCUs per surface Description of Rudder Conventional Rudder Actuation Method 2 PCUs Fixed / Var. Incd. Tail Variable Elevator Actuation Mthd 2 PCUs per surface Stall Protection Devices
• 1 stick shaker • no stick pusher • aerodynmic buffet
Flap System Overview • 2 panels per side • 4 tracks per side
Flap (Slat) Deflection - Takeoff (Highest)
25 ()
Flap (Slat) Deflection - Landing Configuration
40 ()
HI Lift LE Device • 1 Krueger panel per side (inbrd)
• 4 slat panels per side (outboard)
HI Lift LE Dev. Actuatn Hydraulic HI Lift TE Device double-slot Fowler HI Lift TE Dev. Actuatn Hydraulic Total Number of Roll Splers / Flight Splers / Ground Splers / Total
8 / 8 / 10 / 10
Spoiler Actuation Hydraulic
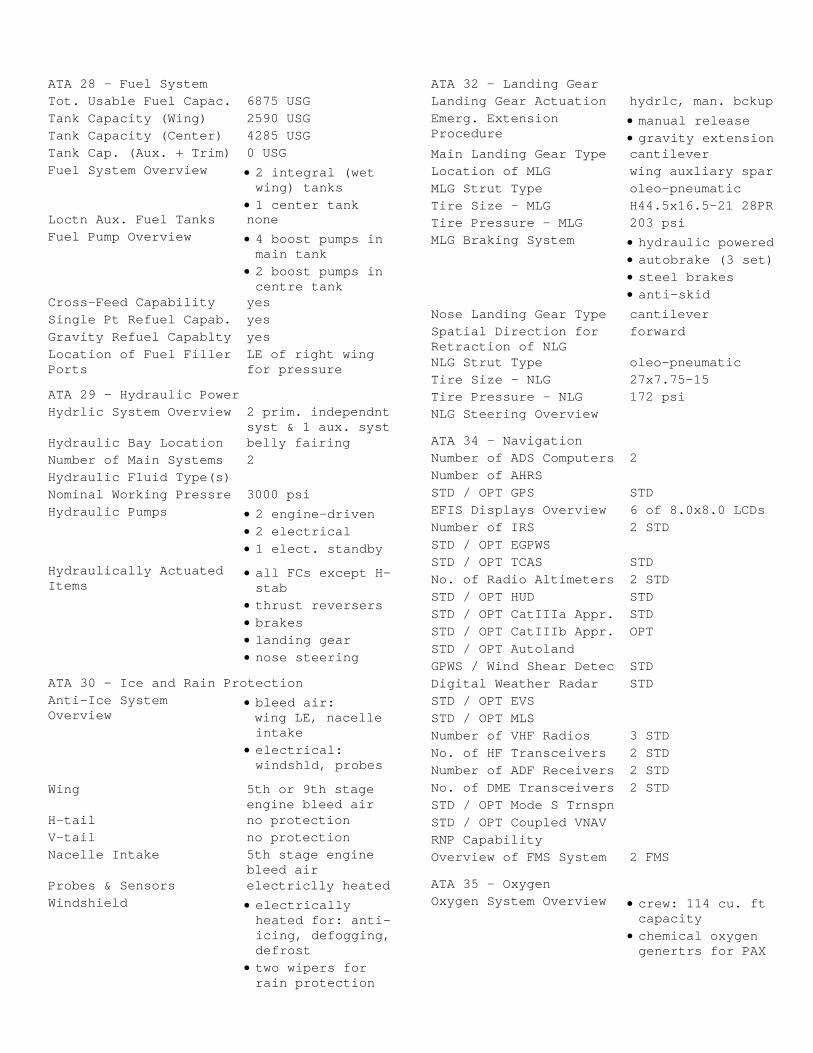
ATA 28 - Fuel System Tot. Usable Fuel Capac. 6875 USG Tank Capacity (Wing) 2590 USG Tank Capacity (Center) 4285 USG Tank Cap. (Aux. + Trim) 0 USG Fuel System Overview • 2 integral (wet
wing) tanks • 1 center tank
Loctn Aux. Fuel Tanks none Fuel Pump Overview • 4 boost pumps in
main tank • 2 boost pumps in centre tank
Cross-Feed Capability yes Single Pt Refuel Capab. yes Gravity Refuel Capablty yes Location of Fuel Filler Ports
LE of right wing for pressure
ATA 29 - Hydraulic Power Hydrlic System Overview 2 prim. independnt
syst & 1 aux. syst Hydraulic Bay Location belly fairing Number of Main Systems 2 Hydraulic Fluid Type(s) Nominal Working Pressre 3000 psi Hydraulic Pumps • 2 engine-driven
• 2 electrical • 1 elect. standby
Hydraulically Actuated Items
• all FCs except H-stab
• thrust reversers • brakes • landing gear • nose steering
ATA 30 - Ice and Rain Protection Anti-Ice System Overview
• bleed air: wing LE, nacelle intake
• electrical: windshld, probes
Wing 5th or 9th stage engine bleed air
H-tail no protection V-tail no protection Nacelle Intake 5th stage engine
bleed air Probes & Sensors electriclly heated Windshield • electrically
heated for: anti-icing, defogging, defrost
• two wipers for rain protection
ATA 32 - Landing Gear Landing Gear Actuation hydrlc, man. bckup Emerg. Extension Procedure
• manual release • gravity extension
Main Landing Gear Type cantilever Location of MLG wing auxliary spar MLG Strut Type oleo-pneumatic Tire Size - MLG H44.5x16.5-21 28PR Tire Pressure - MLG 203 psi MLG Braking System • hydraulic powered
• autobrake (3 set) • steel brakes • anti-skid
Nose Landing Gear Type cantilever Spatial Direction for Retraction of NLG
forward
NLG Strut Type oleo-pneumatic Tire Size - NLG 27x7.75-15 Tire Pressure - NLG 172 psi NLG Steering Overview
ATA 34 - Navigation Number of ADS Computers 2 Number of AHRS STD / OPT GPS STD EFIS Displays Overview 6 of 8.0x8.0 LCDs Number of IRS 2 STD STD / OPT EGPWS STD / OPT TCAS STD No. of Radio Altimeters 2 STD STD / OPT HUD STD STD / OPT CatIIIa Appr. STD STD / OPT CatIIIb Appr. OPT STD / OPT Autoland GPWS / Wind Shear Detec STD Digital Weather Radar STD STD / OPT EVS STD / OPT MLS Number of VHF Radios 3 STD No. of HF Transceivers 2 STD Number of ADF Receivers 2 STD No. of DME Transceivers 2 STD STD / OPT Mode S Trnspn STD / OPT Coupled VNAV RNP Capability Overview of FMS System 2 FMS
ATA 35 - Oxygen Oxygen System Overview • crew: 114 cu. ft
capacity • chemical oxygen genertrs for PAX

ATA 36 - Pneumatics Pneumatic System Overvw port switching Location of Bleed Ports and Capacity
• fan: yes • int: 5th stage • high: 9th stage • APU: yes
Pneumatic Source & Use • engines: ECS, cowl & airframe anti-icing
• APU: ECS Bleed Leak Detection yes
ATA 39 - Electrical / Electronic Panels Loc. of Major Elec. Components & System
cockpit
Main Display Panels LCD screens Main Display Size (HxW) 8.0 X 8.0 No. Main Display Panels 6 Avionics Suite Designtn VIA 2000
Avionics Suite Manufacturer
Honeywell,Rockwell Collins, Smiths
Avionics Rack Location underfloor of forward cabin
ATA 49 - Auxiliary Power Unit Std / Opt APU STD APU Designation 131-9(B) APU Manufacturer Honeywell APU Location tailcone APU Reqrd for Dispatch no APU Operation & Control FADEC APU Fire Extinguishing APU Max Start. Altitude 41000 ft APU Max Oper. Altitude 41000 ft
ATA 53, 54, 55 & 57 - Structure Strctrl Press. Diffrntl 8.4 psi Struc. Life cycle / hrs 75000 cyc / Structure Overview mostly conventnal
Al construction Structure & Material Nacelle / Pylon
Struct. & Material - Horizontal tail
• 2 spars • Al construction with CF TE panels
Struct. & Material - Elevator
1 piece, carbon fibre
Struct. & Material - Vertical tail
• 2 spars • Al construction with CF TE panels
Struct. & Material - Rudder
1 piece, carbon fibre
Structure & Material - Wing
• 2 spars/1 auxlary spar config
• machined ribs • extruded machined string. rivetd to chem-milled skins
Wing Tip Geometry Type conventional, winglets optional
Structure & Material - Aileron
carbon fibre
Structure & Material HI Lift LE Device
Structure & Material HI Lift TE Device
Structure & Material Speed Brakes
carbon fibre
ATA 71-80 - Engine Engine Manufacturer CFM International Engine Designation CFM56-7B20 (HGW: -
7B24) Turbofan No. of Stages Fan/Boost/Compaxial + Compcent//HPT/LPT
1 / 3 / 9 + 0 // 1 / 4
Number of Engines 2 Mounting Point wing Max. Takeoff Thrust 24200 lb.f each Flat Rating Temperature ISA + 15 Thrust Reversr Overview cascade type Bypass Ratio 5.5 Overall Pressure Ratio TSFC at M0.80, FL 350 0.620 lb/lb.hr FADEC or DEEC FADEC ETOPS Capability 180 min External Noise, MTOW (ICAO Annex 16) Takeoff / Stage 3 Limit 83.8 / 90.3 EPNdB Sideline / Stage 3 Lim. 90.9 / 96 EPNdB Approach / Stage 3 Lim. 95.8 /99.8 EPNdB Cumultv Margin to Stg 3 15.7 EPN dB Emissions (ICAO LTO cycle) NOx CO Unburnt Hydrocarbons
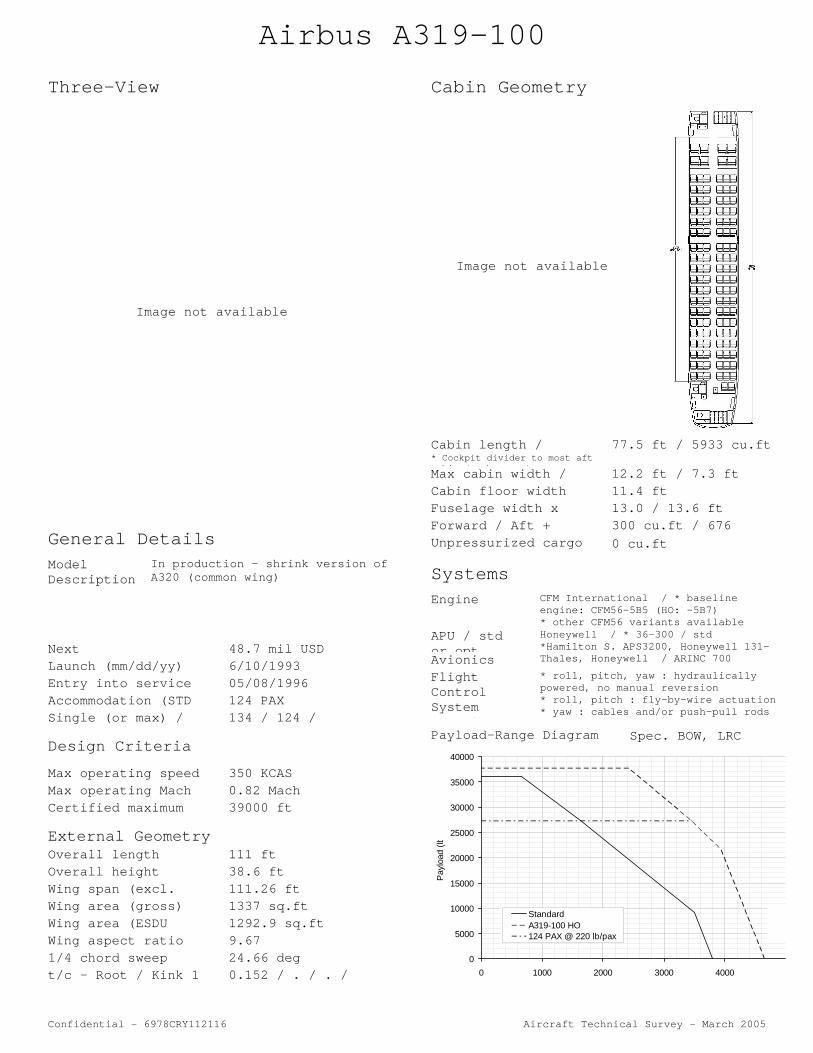
Airbus A319-100
Three-View
Image not available
General Details
Model Description
In production - shrink version of A320 (common wing)
Next 48.7 mil USD Launch (mm/dd/yy) 6/10/1993 Entry into service 05/08/1996 Accommodation (STD 124 PAX Single (or max) / 134 / 124 /
Design Criteria
Max operating speed 350 KCAS Max operating Mach 0.82 Mach Certified maximum 39000 ft
External Geometry Overall length 111 ft Overall height 38.6 ft Wing span (excl. 111.26 ft Wing area (gross) 1337 sq.ft Wing area (ESDU 1292.9 sq.ft Wing aspect ratio 9.67 1/4 chord sweep 24.66 deg t/c - Root / Kink 1 0.152 / . / . /
Cabin Geometry
Image not available
Cabin length / 77.5 ft / 5933 cu.ft * Cockpit divider to most aft bi ( b )
Max cabin width / 12.2 ft / 7.3 ft Cabin floor width 11.4 ft Fuselage width x 13.0 / 13.6 ft Forward / Aft + 300 cu.ft / 676 Unpressurized cargo 0 cu.ft
Systems Engine CFM International / * baseline
engine: CFM56-5B5 (HO: -5B7) * other CFM56 variants available
APU / std or opt
Honeywell / * 36-300 / std *Hamilton S. APS3200, Honeywell 131-
Avionics Thales, Honeywell / ARINC 700
Flight Control System
i
* roll, pitch, yaw : hydraulically powered, no manual reversion * roll, pitch : fly-by-wire actuation * yaw : cables and/or push-pull rods
Payload-Range Diagram Spec. BOW, LRC
0
5000
10000
15000
20000
25000
30000
35000
40000
0 1000 2000 3000 4000
Pay
load
(lb
StandardA319-100 HO124 PAX @ 220 lb/pax
Confidential – 6978CRY112116 Aircraft Technical Survey – March 2005
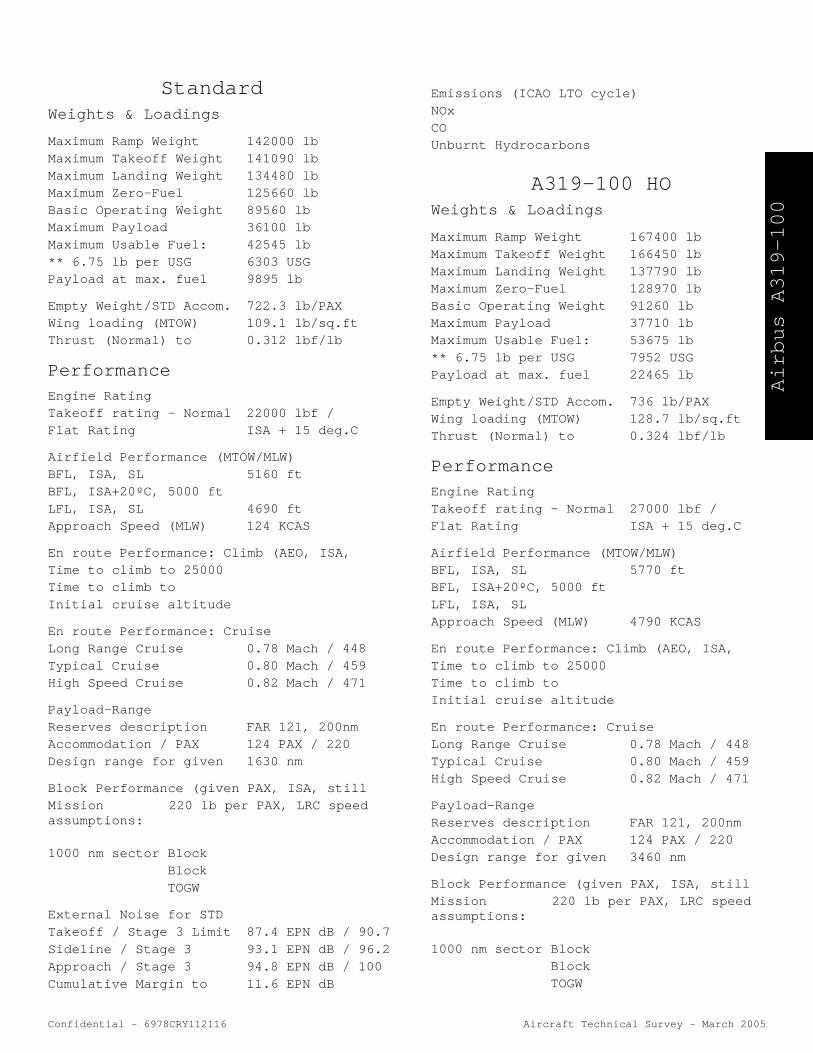
Airbus A319-100
Standard Weights & Loadings Maximum Ramp Weight 142000 lb Maximum Takeoff Weight 141090 lb Maximum Landing Weight 134480 lb Maximum Zero-Fuel 125660 lb Basic Operating Weight 89560 lb Maximum Payload 36100 lb Maximum Usable Fuel: 42545 lb ** 6.75 lb per USG 6303 USG Payload at max. fuel 9895 lb
Empty Weight/STD Accom. 722.3 lb/PAX Wing loading (MTOW) 109.1 lb/sq.ft Thrust (Normal) to 0.312 lbf/lb
Performance Engine Rating Takeoff rating – Normal 22000 lbf / Flat Rating ISA + 15 deg.C
Airfield Performance (MTOW/MLW) BFL, ISA, SL 5160 ft BFL, ISA+20ºC, 5000 ft LFL, ISA, SL 4690 ft Approach Speed (MLW) 124 KCAS
En route Performance: Climb (AEO, ISA, Time to climb to 25000 Time to climb to Initial cruise altitude
En route Performance: Cruise Long Range Cruise 0.78 Mach / 448 Typical Cruise 0.80 Mach / 459 High Speed Cruise 0.82 Mach / 471
Payload-Range Reserves description FAR 121, 200nm Accommodation / PAX 124 PAX / 220 Design range for given 1630 nm
Block Performance (given PAX, ISA, still Mission assumptions:
220 lb per PAX, LRC speed
1000 nm sector Block Block TOGW
External Noise for STD Takeoff / Stage 3 Limit 87.4 EPN dB / 90.7 Sideline / Stage 3 93.1 EPN dB / 96.2 Approach / Stage 3 94.8 EPN dB / 100 Cumulative Margin to 11.6 EPN dB
Emissions (ICAO LTO cycle) NOx CO Unburnt Hydrocarbons
A319-100 HO
Weights & Loadings
Maximum Ramp Weight 167400 lb Maximum Takeoff Weight 166450 lb Maximum Landing Weight 137790 lb Maximum Zero-Fuel 128970 lb Basic Operating Weight 91260 lb Maximum Payload 37710 lb Maximum Usable Fuel: 53675 lb ** 6.75 lb per USG 7952 USG Payload at max. fuel 22465 lb
Empty Weight/STD Accom. 736 lb/PAX Wing loading (MTOW) 128.7 lb/sq.ft Thrust (Normal) to 0.324 lbf/lb
Performance Engine Rating Takeoff rating – Normal 27000 lbf / Flat Rating ISA + 15 deg.C
Airfield Performance (MTOW/MLW) BFL, ISA, SL 5770 ft BFL, ISA+20ºC, 5000 ft LFL, ISA, SL Approach Speed (MLW) 4790 KCAS
En route Performance: Climb (AEO, ISA, Time to climb to 25000 Time to climb to Initial cruise altitude
En route Performance: Cruise Long Range Cruise 0.78 Mach / 448 Typical Cruise 0.80 Mach / 459 High Speed Cruise 0.82 Mach / 471
Payload-Range Reserves description FAR 121, 200nm Accommodation / PAX 124 PAX / 220 Design range for given 3460 nm
Block Performance (given PAX, ISA, still Mission assumptions:
220 lb per PAX, LRC speed
1000 nm sector Block Block TOGW
Confidential – 6978CRY112116 Aircraft Technical Survey – March 2005