Embed Size (px)
Citation preview
PNNL-23374
Prepared for the U.S. Department of Energy under Contract DE-AC05-76RL01830
Preliminary Economics for Hydrocarbon Fuel Production from Cellulosic Sugars J.R. Collett A. Meyer S. Jones May 2014

i

iii
PNNL-23374
Preliminary Economics for Hydrocarbon Fuel Production from Cellulosic Sugars J.R. Collett P. Meyer S. Jones October 2014 Prepared for the U.S. Department of Energy under Contract DE-AC05-76RL01830 Pacific Northwest National Laboratory Richland, Washington 99352
4
Contents
1.0 Introduction ................................................................................................................................ 6 1.1 Developing a Route to Hydrocarbon Fuel Precursors via Oleaginous Yeast ..................... 6 1.2 Lipomyces starkeyi as a Biocatalyst for Hydrocarbon Precursor Production ..................... 7 1.3 Upgrading of Oleaginous Yeast Lipids to Hydrocarbon Fuels .......................................... 8 1.4 Specific Aims of This Study .............................................................................................. 8
2.0 Metabolic Modeling to Predict Maximum Yields of Lipids and Cell Mass ............................... 9 2.1 Metabolic Model Validation .............................................................................................. 9 2.2 Metabolic Model Prediction of Maximum Triglyceride Yield ........................................ 10
3.0 Biorefinery Process and Economic Models .............................................................................. 11 3.1 Biorefinery Process Design and Configuration ................................................................ 11 3.2 Biorefinery Process Economic Assumptions ................................................................... 13 3.3 Biorefinery Modeling Results and Discussion ................................................................. 14
4.0 Conclusions and Future Work .................................................................................................. 18 5.0 Appendix .................................................................................................................................. 19
5.1 Constraint-based Reconstruction and Analysis of Metabolic Networks .......................... 19 5.2 Computational reconstruction of the Lipomyces starkeyi metabolic network .................. 20 5.3 Refinements to the L. starkeyi metabolic model based on experimental and literature
evidence ............................................................................................................................ 22 6.0 References ................................................................................................................................ 23
5
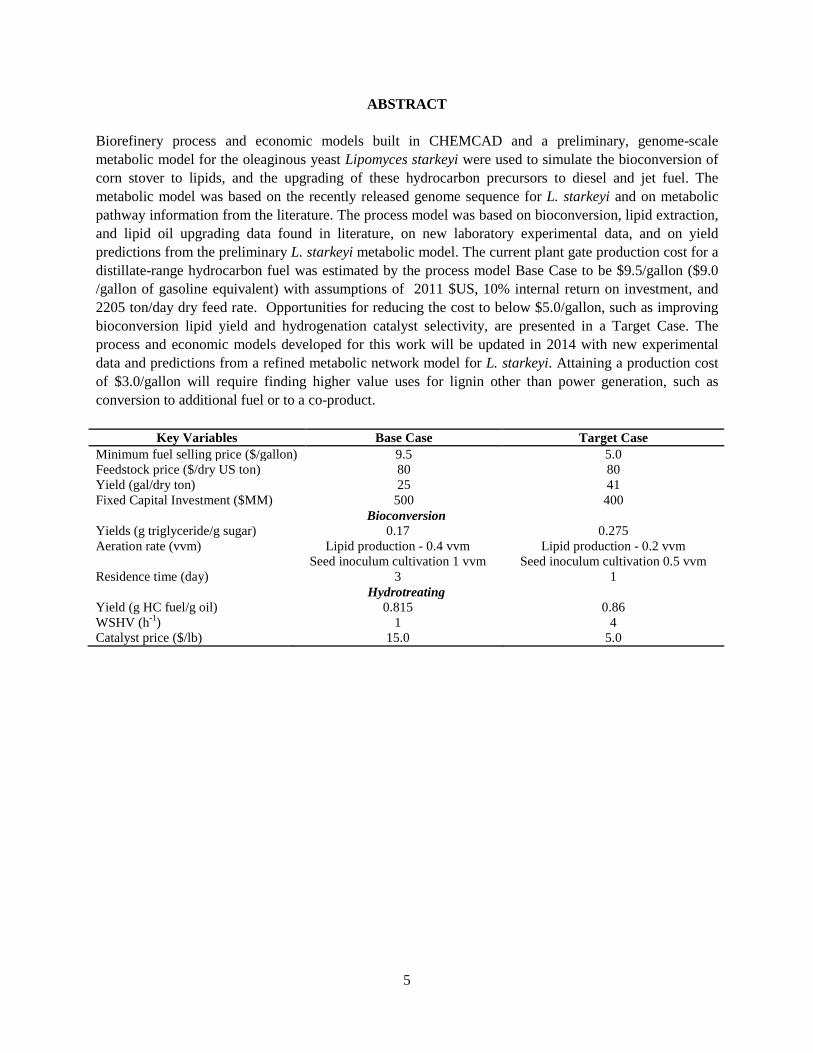
ABSTRACT Biorefinery process and economic models built in CHEMCAD and a preliminary, genome-scale metabolic model for the oleaginous yeast Lipomyces starkeyi were used to simulate the bioconversion of corn stover to lipids, and the upgrading of these hydrocarbon precursors to diesel and jet fuel. The metabolic model was based on the recently released genome sequence for L. starkeyi and on metabolic pathway information from the literature. The process model was based on bioconversion, lipid extraction, and lipid oil upgrading data found in literature, on new laboratory experimental data, and on yield predictions from the preliminary L. starkeyi metabolic model. The current plant gate production cost for a distillate-range hydrocarbon fuel was estimated by the process model Base Case to be $9.5/gallon ($9.0 /gallon of gasoline equivalent) with assumptions of 2011 $US, 10% internal return on investment, and 2205 ton/day dry feed rate. Opportunities for reducing the cost to below $5.0/gallon, such as improving bioconversion lipid yield and hydrogenation catalyst selectivity, are presented in a Target Case. The process and economic models developed for this work will be updated in 2014 with new experimental data and predictions from a refined metabolic network model for L. starkeyi. Attaining a production cost of $3.0/gallon will require finding higher value uses for lignin other than power generation, such as conversion to additional fuel or to a co-product.
Key Variables Base Case Target Case Minimum fuel selling price ($/gallon) 9.5 5.0 Feedstock price ($/dry US ton) 80 80 Yield (gal/dry ton) 25 41 Fixed Capital Investment ($MM) 500 400
Bioconversion Yields (g triglyceride/g sugar) Aeration rate (vvm) Residence time (day)
0.17 Lipid production - 0.4 vvm
Seed inoculum cultivation 1 vvm 3
0.275 Lipid production - 0.2 vvm
Seed inoculum cultivation 0.5 vvm 1
Hydrotreating Yield (g HC fuel/g oil) WSHV (h-1) Catalyst price ($/lb)
0.815 1
15.0
0.86 4
5.0
6
1.0 Introduction
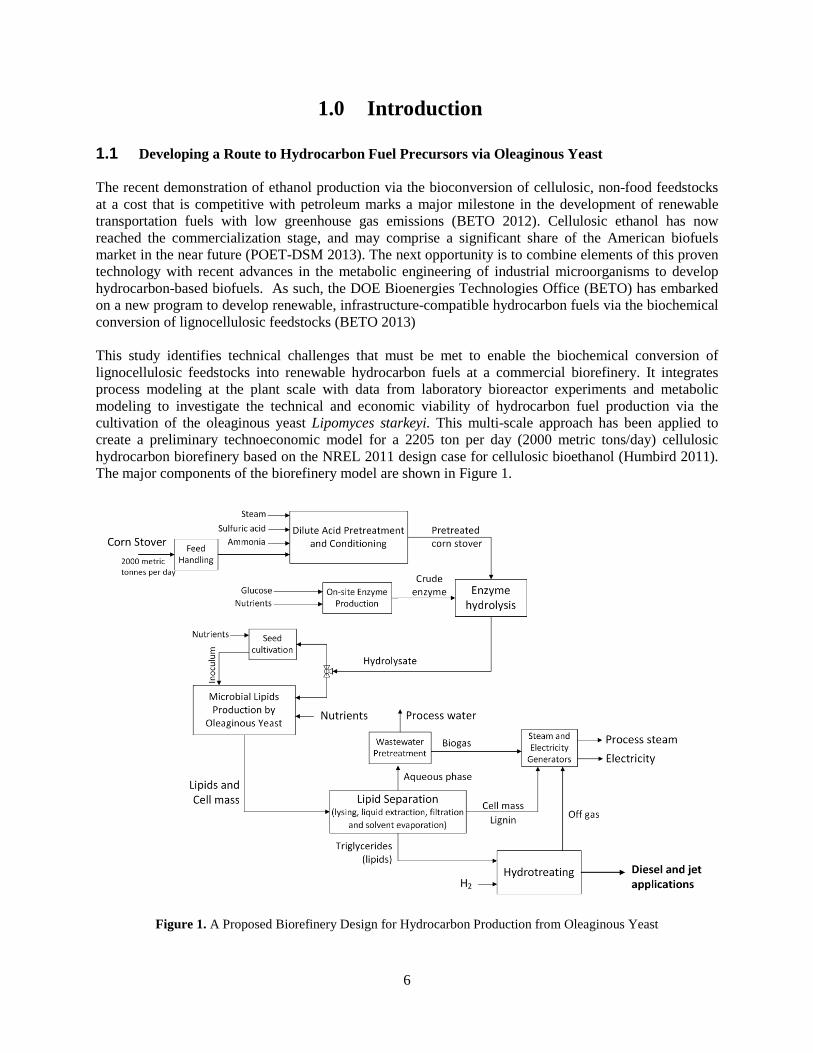
1.1 Developing a Route to Hydrocarbon Fuel Precursors via Oleaginous Yeast The recent demonstration of ethanol production via the bioconversion of cellulosic, non-food feedstocks at a cost that is competitive with petroleum marks a major milestone in the development of renewable transportation fuels with low greenhouse gas emissions (BETO 2012). Cellulosic ethanol has now reached the commercialization stage, and may comprise a significant share of the American biofuels market in the near future (POET-DSM 2013). The next opportunity is to combine elements of this proven technology with recent advances in the metabolic engineering of industrial microorganisms to develop hydrocarbon-based biofuels. As such, the DOE Bioenergies Technologies Office (BETO) has embarked on a new program to develop renewable, infrastructure-compatible hydrocarbon fuels via the biochemical conversion of lignocellulosic feedstocks (BETO 2013) This study identifies technical challenges that must be met to enable the biochemical conversion of lignocellulosic feedstocks into renewable hydrocarbon fuels at a commercial biorefinery. It integrates process modeling at the plant scale with data from laboratory bioreactor experiments and metabolic modeling to investigate the technical and economic viability of hydrocarbon fuel production via the cultivation of the oleaginous yeast Lipomyces starkeyi. This multi-scale approach has been applied to create a preliminary technoeconomic model for a 2205 ton per day (2000 metric tons/day) cellulosic hydrocarbon biorefinery based on the NREL 2011 design case for cellulosic bioethanol (Humbird 2011). The major components of the biorefinery model are shown in Figure 1.
Figure 1. A Proposed Biorefinery Design for Hydrocarbon Production from Oleaginous Yeast
7
As shown in Figure 1, the development of new biorefineries for hydrocarbon biofuel production can leverage cellulosic ethanol technologies that have already reached the commercialization stage, such as dilute acid pretreatment and enzymatic hydrolysis for the release of sugars from lignocellulosic biomass. An important difference, however, between current cellulosic ethanol biorefineries and next-generation biorefineries for the bioconversion of biomass to hydrocarbon fuels is the very different metabolic processes employed by their respective microbial biocatalysts. Cellulosic ethanol biorefineries mainly rely on yeast or bacteria that use an anaerobic process – fermentation – for the synthesis of an excreted alcohol. However, many of the most promising microorganisms for hydrocarbon fuel precursor production, such as oleaginous yeast, use aerobic metabolic pathways for the synthesis of large triglyceride deposits that (as shown in Figure 2) accumulate within the microbial cell (Ratledge 2004, Tews 2010, Kosa and Ragauskas 2011). As such, hydrocarbon production from oleaginous yeast cells requires downstream operations for the extraction of triglyceride lipids from the yeast cells, and for the upgrading of the triglycerides to diesel and jet fuel. Moreover, the production of fuel ethanol via microbial fermentation is an established, worldwide industrial practice, whereas the commercial production of microbial lipids has been mainly directed at niche markets over the last few decades. Two such markets are related to the production of Single Cell Oils (SCO) intended for use as dietary supplements, or as a cocoa butter substitute (Ratledge and Cohen 2008, Ratledge 2010).
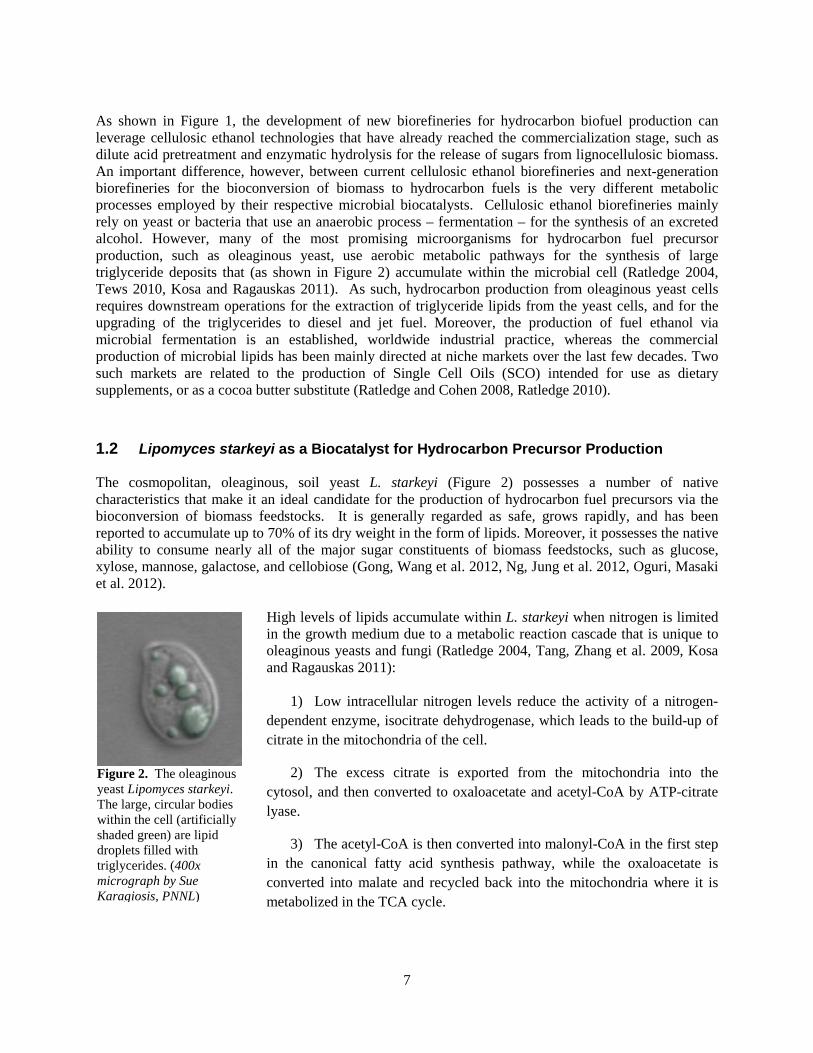
1.2 Lipomyces starkeyi as a Biocatalyst for Hydrocarbon Precursor Production The cosmopolitan, oleaginous, soil yeast L. starkeyi (Figure 2) possesses a number of native characteristics that make it an ideal candidate for the production of hydrocarbon fuel precursors via the bioconversion of biomass feedstocks. It is generally regarded as safe, grows rapidly, and has been reported to accumulate up to 70% of its dry weight in the form of lipids. Moreover, it possesses the native ability to consume nearly all of the major sugar constituents of biomass feedstocks, such as glucose, xylose, mannose, galactose, and cellobiose (Gong, Wang et al. 2012, Ng, Jung et al. 2012, Oguri, Masaki et al. 2012).
High levels of lipids accumulate within L. starkeyi when nitrogen is limited in the growth medium due to a metabolic reaction cascade that is unique to oleaginous yeasts and fungi (Ratledge 2004, Tang, Zhang et al. 2009, Kosa and Ragauskas 2011):
1) Low intracellular nitrogen levels reduce the activity of a nitrogen-dependent enzyme, isocitrate dehydrogenase, which leads to the build-up of citrate in the mitochondria of the cell.
2) The excess citrate is exported from the mitochondria into the cytosol, and then converted to oxaloacetate and acetyl-CoA by ATP-citrate lyase.
3) The acetyl-CoA is then converted into malonyl-CoA in the first step in the canonical fatty acid synthesis pathway, while the oxaloacetate is converted into malate and recycled back into the mitochondria where it is metabolized in the TCA cycle.
Figure 2. The oleaginous yeast Lipomyces starkeyi. The large, circular bodies within the cell (artificially shaded green) are lipid droplets filled with triglycerides. (400x micrograph by Sue Karagiosis, PNNL)
8
Typically, it is the presence and activity of the gene for the enzyme ATP-citrate lyase that distinguish oleaginous species from non-oleaginous ones (Papanikolaou and Aggelis 2011). Fatty acids resulting from oleaginous lipid synthesis within the cell are assembled into triglycerides (also known as triacylglycerols, or TAGs) and into phospholipids in a similar manner as in non-oleaginous yeasts. That is, the synthesis of the neutral triglycerides occurs within lipid droplets (as seen within the cell shown in Figure 2) where they are stored as a reserve energy source for the cell. The more polar phospholipids are synthesized mainly in the endoplasmic reticulum, and then transported throughout the cell to serve as the major structural component of membrane bilayers. Oleaginous yeast grown under nitrogen-limiting conditions have been reported to conserve up to 70% of their dry mass as neutral lipids. Although the simple, stoichiometric, theoretical maximum yield for such storage oils is 33 grams of oil per 100 grams of glucose, the current highest practical conversion of sugar to lipids by wild type oleaginous yeast has been observed to be 20 to 22 grams of oil per 100 grams of glucose (Ratledge and Cohen, 2008). Thus, increasing the lipid yield of oleaginous yeast via metabolic engineering has emerged as an important strategy in the development of these organisms as biocatalysts for conversion of biomass sugars into hydrocarbon precursors for renewable fuel production.
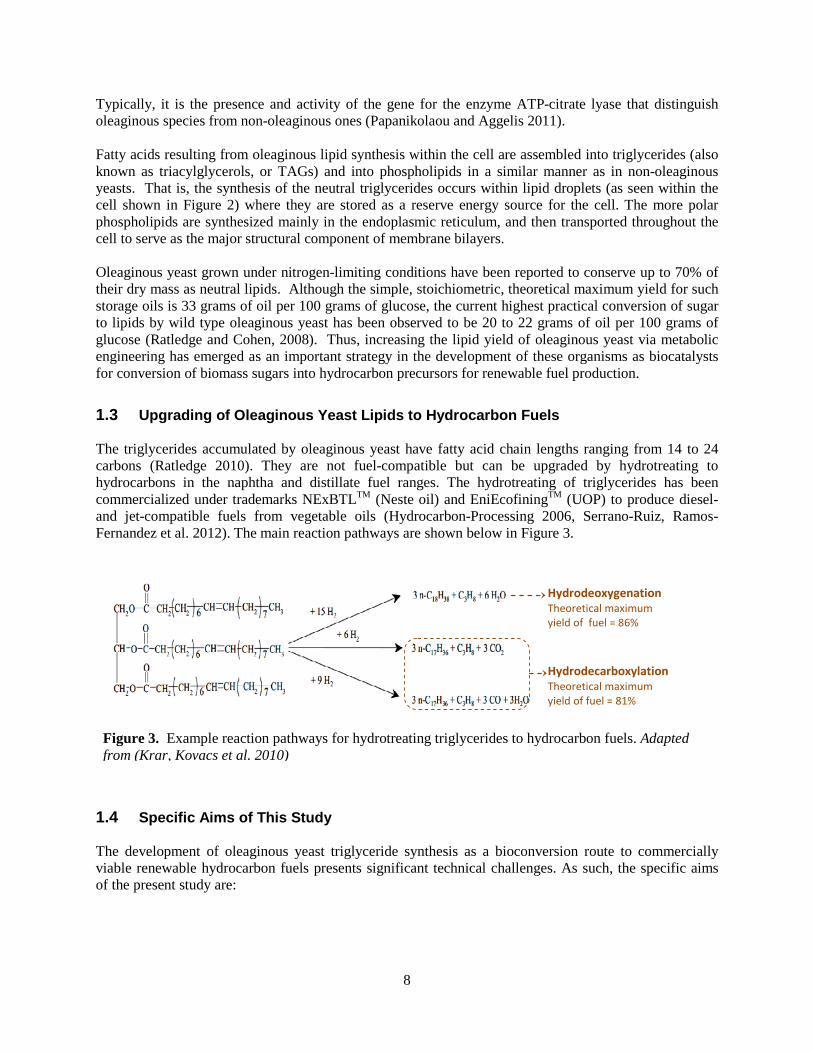
1.3 Upgrading of Oleaginous Yeast Lipids to Hydrocarbon Fuels The triglycerides accumulated by oleaginous yeast have fatty acid chain lengths ranging from 14 to 24 carbons (Ratledge 2010). They are not fuel-compatible but can be upgraded by hydrotreating to hydrocarbons in the naphtha and distillate fuel ranges. The hydrotreating of triglycerides has been commercialized under trademarks NExBTLTM (Neste oil) and EniEcofiningTM (UOP) to produce diesel- and jet-compatible fuels from vegetable oils (Hydrocarbon-Processing 2006, Serrano-Ruiz, Ramos-Fernandez et al. 2012). The main reaction pathways are shown below in Figure 3.
1.4 Specific Aims of This Study The development of oleaginous yeast triglyceride synthesis as a bioconversion route to commercially viable renewable hydrocarbon fuels presents significant technical challenges. As such, the specific aims of the present study are:
Figure 3. Example reaction pathways for hydrotreating triglycerides to hydrocarbon fuels. Adapted from (Krar, Kovacs et al. 2010)
Hydrodeoxygenation Theoretical maximum yield of fuel = 86%
Hydrodecarboxylation Theoretical maximum yield of fuel = 81%
9
1) to estimate, via the use of a genome-scale metabolic model, the maximum biochemically feasible yield of triglycerides from biomass sugars that may be achieved by metabolic engineering of the oleaginous yeast Lipomyces starkeyi for lipid overproduction,
2) to estimate, via the use of a biorefinery-scale process model, the current minimum fuel selling price (MFSP) that would be expected using data from the biochemical and engineering literature, from metabolic model yield predictions, and from ongoing experimental work at PNNL,
3) to identify and prioritize biorefinery process improvements that could lead to an MFSP of $3/ gasoline gallon equivalent.
2.0 Metabolic Modeling to Predict Maximum Yields of Lipids and Cell Mass
In considering the prospects for genetically engineering the metabolism of L. starkeyi as a biocatalyst with optimal productivity, it is useful the estimate the maximum yield of lipids from sugar substrates that it could be reasonably expected to produce. Thus, a preliminary, genome-wide, stoichiometric model of L. starkeyi metabolism was assembled and used in the present study to predict the maximum biochemically feasible yield of triglyceride lipid that the organism could be expected to produce when grown on a variety of sugars. Methods and data sources for the construction of the model and its use for the simulation of L. starkeyi metabolism are explained in the Appendix.
2.1 Metabolic Model Validation The baseline performance of the preliminary L. starkeyi metabolic model was evaluated by the simulation of growth on glucose minimal media with excess nitrogen and other nutrients. This was followed by comparison with experimental data from a study of L. starkeyi growth kinetics performed within a 30 liter bioreactor at PNNL during FY13. The experimental data were drawn from a log-phase growth interval that spanned from 37 to 47 hours after inoculation of the bioreactor, before the nitrogen in the culture medium was depleted and before log-phase lipid synthesis was fully underway in the L. starkeyi cells. The model simulation was performed using the Flux Balance Analysis (FBA) method (see Appendix), with the glucose uptake exchange flux constrained to 0.19 gram of glucose per gram of dry cell mass per hour (g/g DW/hr) to match the measured glucose consumption rate in the bioreactor experiment.
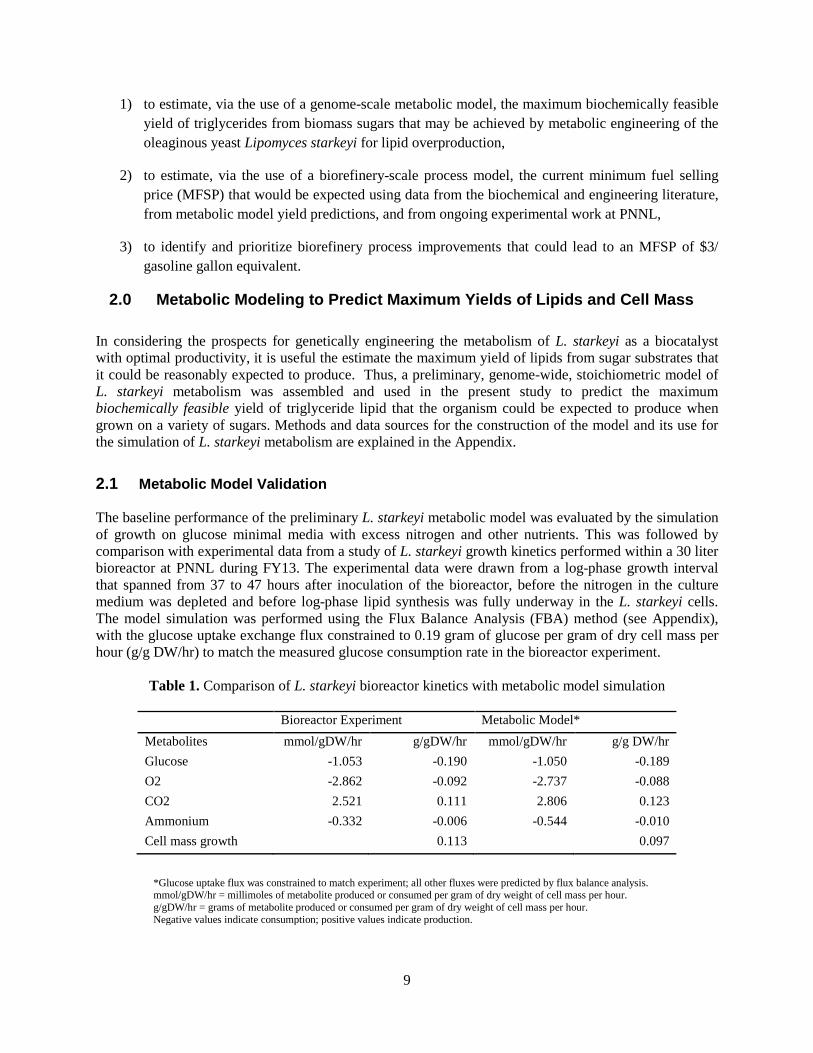
Table 1. Comparison of L. starkeyi bioreactor kinetics with metabolic model simulation
Bioreactor Experiment Metabolic Model* Metabolites mmol/gDW/hr g/gDW/hr mmol/gDW/hr g/g DW/hr Glucose -1.053 -0.190 -1.050 -0.189 O2 -2.862 -0.092 -2.737 -0.088 CO2 2.521 0.111 2.806 0.123 Ammonium -0.332 -0.006 -0.544 -0.010 Cell mass growth 0.113 0.097
*Glucose uptake flux was constrained to match experiment; all other fluxes were predicted by flux balance analysis. mmol/gDW/hr = millimoles of metabolite produced or consumed per gram of dry weight of cell mass per hour. g/gDW/hr = grams of metabolite produced or consumed per gram of dry weight of cell mass per hour. Negative values indicate consumption; positive values indicate production.
10
As shown above in Table 1, the preliminary metabolic model predicted a log-phase growth rate of 0.097 grams per gram of dry weight of cell mass per hour (g/gDW/hr), whereas the bioreactor predicted a higher growth rate of 0.113 g/gDW/hr. The respiratory quotient (moles CO2/moles O2) predicted by the model, however, is 1.025, which is close to what would be expected for a yeast growing on a pure carbohydrate energy source under aerobic conditions, and lends credence to the internal consistency of the model (Horvath, Franzen et al. 2003). The bioreactor cell mass yield was 0.59 g /g sugar, whereas the model predicted a 13.6% lower cell mass yield of 0.51 g/g sugar. This difference in cell mass yield may be due in part to accuracy limitations associated with the instruments and methods used to collect the experimental data. The average accuracy and the relative standard deviation for 144 standards used in the HPLC assay of bioreactor residual sugar were calculated to be 9.8% and 3.8%, respectively. As such, the difference in experimental vs. model-predicted cell mass yields may be reduced in future work by improving the accuracy of sugar analysis methods. In addition, the accuracy of cell mass yield predictions from the metabolic model may be improved by further curation of its metabolic network, and by further experimental analysis of L. starkeyi physiology -- especially stable carbon isotope (fluxomic) studies that can reveal the activity and contribution of individual metabolic pathways to cell mass growth and lipid synthesis (Celton, Sanchez et al. 2012). The general agreement of the cell mass yields, however, was a positive indication that the preliminary metabolic model for L. starkeyi will prove itself useful for guiding metabolic engineering strategies to improve biocatalyst performance, and in setting reasonable upper limits for bioconversion yields and efficiencies.
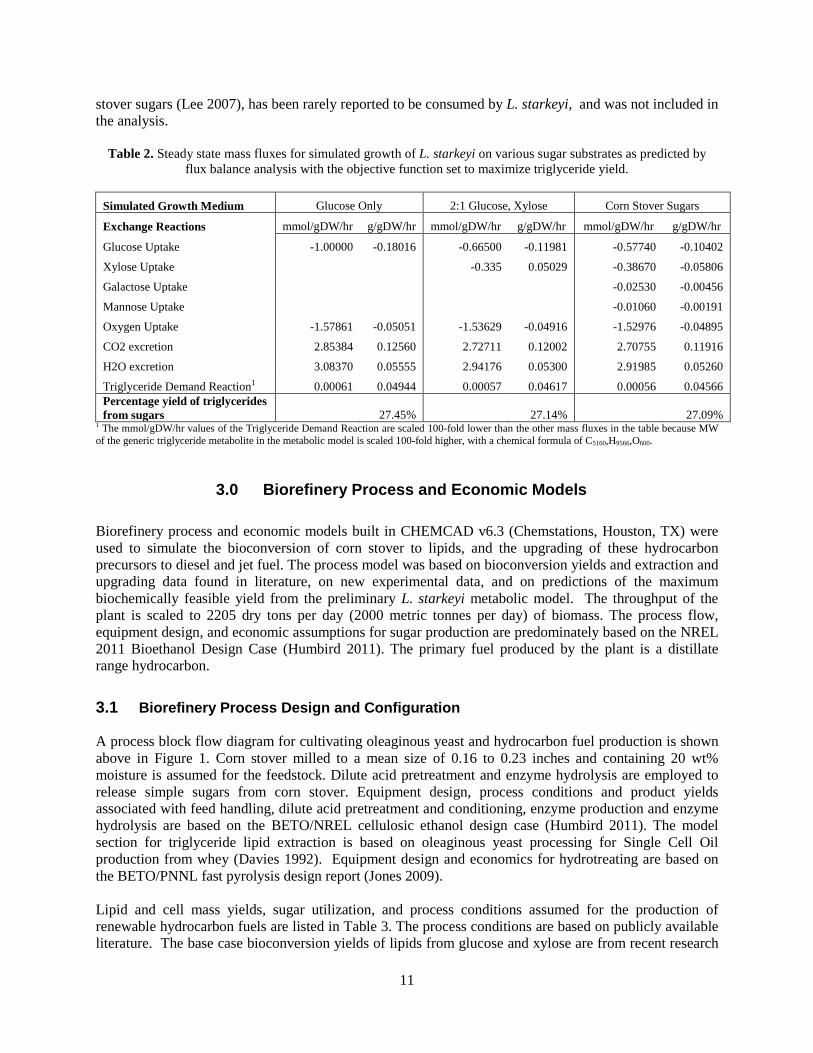
2.2 Metabolic Model Prediction of Maximum Triglyceride Yield The stoichiometrically maximum yield of lipids from glucose or xylose has been calculated to be 33%. (Ratledge and Cohen 2008, Papanikolaou and Aggelis 2011) This yield, however, does not account for chemical energy and reducing equivalents that are required for the production of lipids for biochemical conversion within a living cell. Nor does it account for the carbon substrate resources that must be invested into the growth of the cell itself. The actual, overall lipid yields from wild type oleaginous yeast grown on sugar substrates have been reported to be in the range of 16-22% (Ratledge and Cohen 2008, Wild, Patil et al. 2010, Hu, Wu et al. 2011, Lin, Shen et al. 2011, Papanikolaou and Aggelis 2011). A highly engineered strain of Yarrowia lipolytica, however, was recently reported to have achieved a 27% lipid yield from glucose during the nitrogen limited, lipid production phase of cultivation, although the overall lipid yield from the culture (including log phase growth of cell mass) was 19.5%, which is within the range of previously reported overall yields (Tai and Stephanopoulos 2013). Given that both Y. lipolytica and L. starkeyi are oleaginous yeasts within the Saccharomycotina subphylum, it is reasonable to assume that L. starkeyi may be similarly engineered for higher lipid yields as well. In the present study, the metabolic model for L. starkeyi was used to make predictions of the maximum triglyceride yield that may be reasonably expected from a highly engineered, metabolically optimized target strain of this organism when grown on glucose. Two scenarios were considered: a 2:1 molar glucose-xylose mixture, and a mixture of glucose, xylose, galactose, and mannose in proportions similar those of the major consumable sugar constituents in pretreated, hydrolyzed corn stover (Lee 2007). The resulting predictions are shown below in Table 2. Simulation methods and modifications to the L. starkeyi metabolic model required to make the maximum yield predictions (such as the creation of a triglyceride demand reaction and defining lipid production as the objective function) are explained in the Appendix. The simulated percentage yield of triglyceride from all three of the tested combinations of media sugar constituents were quite similar, ranging from 27.09% to 27.44%. The predicted similarity in lipid yields from growth on glucose, glucose and xylose, or the consumable corn stover sugars is consistent with experimental reports on the sugar substrate preferences and lipid yields of L. starkeyi yeast strains (Gong, Wang et al. 2012, Oguri, Masaki et al. 2012). Arabinose, which comprises on average 2.7% of corn
11
stover sugars (Lee 2007), has been rarely reported to be consumed by L. starkeyi, and was not included in the analysis.
Table 2. Steady state mass fluxes for simulated growth of L. starkeyi on various sugar substrates as predicted by flux balance analysis with the objective function set to maximize triglyceride yield.
Simulated Growth Medium Glucose Only 2:1 Glucose, Xylose Corn Stover Sugars
Exchange Reactions mmol/gDW/hr g/gDW/hr mmol/gDW/hr g/gDW/hr mmol/gDW/hr g/gDW/hr
Glucose Uptake -1.00000 -0.18016 -0.66500 -0.11981 -0.57740 -0.10402
Xylose Uptake
-0.335 0.05029 -0.38670 -0.05806
Galactose Uptake
-0.02530 -0.00456
Mannose Uptake
-0.01060 -0.00191
Oxygen Uptake -1.57861 -0.05051 -1.53629 -0.04916 -1.52976 -0.04895
CO2 excretion 2.85384 0.12560 2.72711 0.12002 2.70755 0.11916
H2O excretion 3.08370 0.05555 2.94176 0.05300 2.91985 0.05260
Triglyceride Demand Reaction1 0.00061 0.04944 0.00057 0.04617 0.00056 0.04566 Percentage yield of triglycerides from sugars 27.45% 27.14% 27.09%
1 The mmol/gDW/hr values of the Triglyceride Demand Reaction are scaled 100-fold lower than the other mass fluxes in the table because MW of the generic triglyceride metabolite in the metabolic model is scaled 100-fold higher, with a chemical formula of C5160,H9566,O600.
3.0 Biorefinery Process and Economic Models
Biorefinery process and economic models built in CHEMCAD v6.3 (Chemstations, Houston, TX) were used to simulate the bioconversion of corn stover to lipids, and the upgrading of these hydrocarbon precursors to diesel and jet fuel. The process model was based on bioconversion yields and extraction and upgrading data found in literature, on new experimental data, and on predictions of the maximum biochemically feasible yield from the preliminary L. starkeyi metabolic model. The throughput of the plant is scaled to 2205 dry tons per day (2000 metric tonnes per day) of biomass. The process flow, equipment design, and economic assumptions for sugar production are predominately based on the NREL 2011 Bioethanol Design Case (Humbird 2011). The primary fuel produced by the plant is a distillate range hydrocarbon.
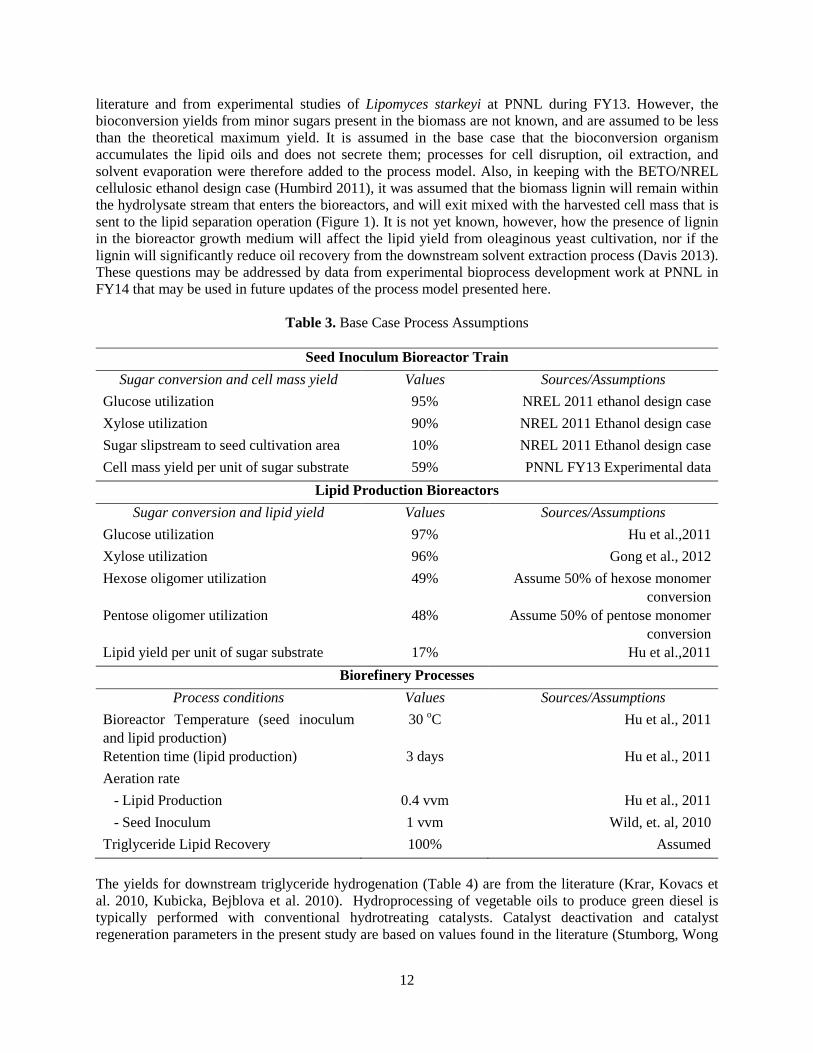
3.1 Biorefinery Process Design and Configuration A process block flow diagram for cultivating oleaginous yeast and hydrocarbon fuel production is shown above in Figure 1. Corn stover milled to a mean size of 0.16 to 0.23 inches and containing 20 wt% moisture is assumed for the feedstock. Dilute acid pretreatment and enzyme hydrolysis are employed to release simple sugars from corn stover. Equipment design, process conditions and product yields associated with feed handling, dilute acid pretreatment and conditioning, enzyme production and enzyme hydrolysis are based on the BETO/NREL cellulosic ethanol design case (Humbird 2011). The model section for triglyceride lipid extraction is based on oleaginous yeast processing for Single Cell Oil production from whey (Davies 1992). Equipment design and economics for hydrotreating are based on the BETO/PNNL fast pyrolysis design report (Jones 2009). Lipid and cell mass yields, sugar utilization, and process conditions assumed for the production of renewable hydrocarbon fuels are listed in Table 3. The process conditions are based on publicly available literature. The base case bioconversion yields of lipids from glucose and xylose are from recent research
12
literature and from experimental studies of Lipomyces starkeyi at PNNL during FY13. However, the bioconversion yields from minor sugars present in the biomass are not known, and are assumed to be less than the theoretical maximum yield. It is assumed in the base case that the bioconversion organism accumulates the lipid oils and does not secrete them; processes for cell disruption, oil extraction, and solvent evaporation were therefore added to the process model. Also, in keeping with the BETO/NREL cellulosic ethanol design case (Humbird 2011), it was assumed that the biomass lignin will remain within the hydrolysate stream that enters the bioreactors, and will exit mixed with the harvested cell mass that is sent to the lipid separation operation (Figure 1). It is not yet known, however, how the presence of lignin in the bioreactor growth medium will affect the lipid yield from oleaginous yeast cultivation, nor if the lignin will significantly reduce oil recovery from the downstream solvent extraction process (Davis 2013). These questions may be addressed by data from experimental bioprocess development work at PNNL in FY14 that may be used in future updates of the process model presented here.
Table 3. Base Case Process Assumptions
Seed Inoculum Bioreactor Train Sugar conversion and cell mass yield Values Sources/Assumptions
Glucose utilization 95% NREL 2011 ethanol design case Xylose utilization 90% NREL 2011 Ethanol design case Sugar slipstream to seed cultivation area 10% NREL 2011 Ethanol design case Cell mass yield per unit of sugar substrate 59% PNNL FY13 Experimental data
Lipid Production Bioreactors Sugar conversion and lipid yield Values Sources/Assumptions
Glucose utilization 97% Hu et al.,2011 Xylose utilization 96% Gong et al., 2012 Hexose oligomer utilization 49% Assume 50% of hexose monomer
conversion Pentose oligomer utilization 48% Assume 50% of pentose monomer
conversion Lipid yield per unit of sugar substrate 17% Hu et al.,2011
Biorefinery Processes Process conditions Values Sources/Assumptions
Bioreactor Temperature (seed inoculum and lipid production)
30 oC Hu et al., 2011
Retention time (lipid production) 3 days Hu et al., 2011 Aeration rate - Lipid Production 0.4 vvm Hu et al., 2011 - Seed Inoculum 1 vvm Wild, et. al, 2010 Triglyceride Lipid Recovery 100% Assumed
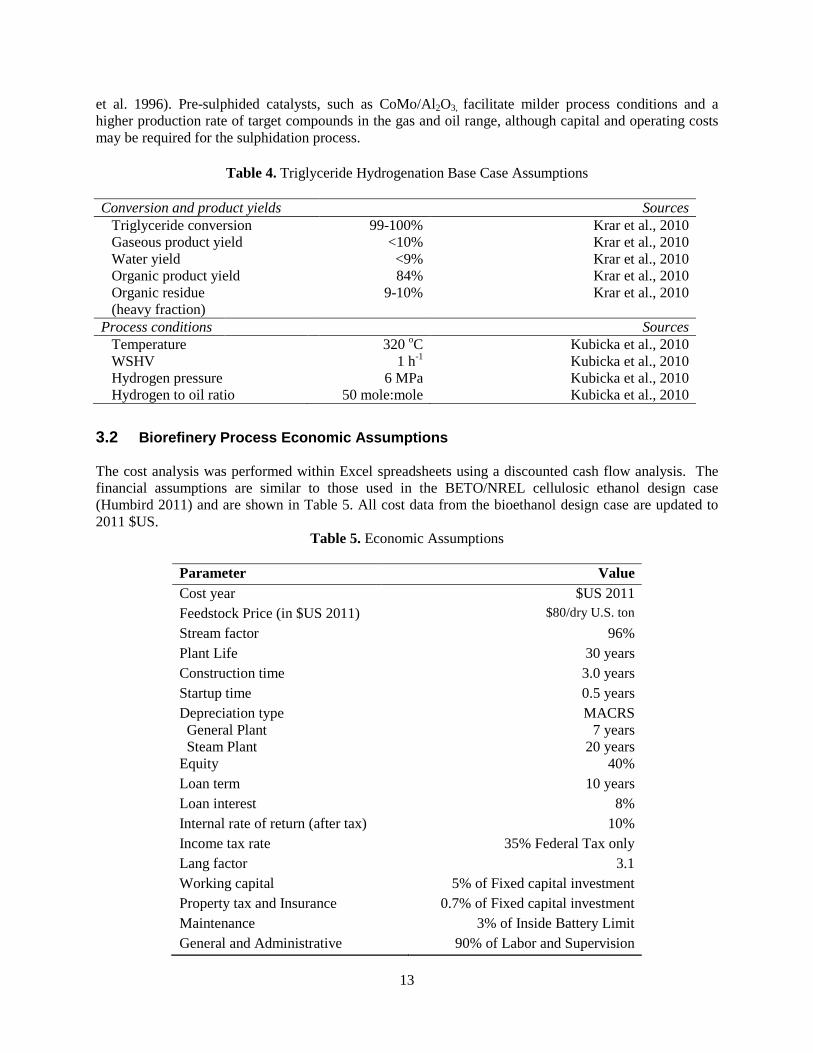
The yields for downstream triglyceride hydrogenation (Table 4) are from the literature (Krar, Kovacs et al. 2010, Kubicka, Bejblova et al. 2010). Hydroprocessing of vegetable oils to produce green diesel is typically performed with conventional hydrotreating catalysts. Catalyst deactivation and catalyst regeneration parameters in the present study are based on values found in the literature (Stumborg, Wong
13
et al. 1996). Pre-sulphided catalysts, such as CoMo/Al2O3, facilitate milder process conditions and a higher production rate of target compounds in the gas and oil range, although capital and operating costs may be required for the sulphidation process.
Table 4. Triglyceride Hydrogenation Base Case Assumptions
3.2 Biorefinery Process Economic Assumptions The cost analysis was performed within Excel spreadsheets using a discounted cash flow analysis. The financial assumptions are similar to those used in the BETO/NREL cellulosic ethanol design case (Humbird 2011) and are shown in Table 5. All cost data from the bioethanol design case are updated to 2011 $US.
Table 5. Economic Assumptions
Parameter Value Cost year $US 2011 Feedstock Price (in $US 2011) $80/dry U.S. ton Stream factor 96% Plant Life 30 years Construction time 3.0 years Startup time 0.5 years Depreciation type General Plant Steam Plant
MACRS 7 years
20 years Equity 40% Loan term 10 years Loan interest 8% Internal rate of return (after tax) 10% Income tax rate 35% Federal Tax only Lang factor 3.1 Working capital 5% of Fixed capital investment Property tax and Insurance 0.7% of Fixed capital investment Maintenance 3% of Inside Battery Limit General and Administrative 90% of Labor and Supervision
Conversion and product yields Sources Triglyceride conversion 99-100% Krar et al., 2010 Gaseous product yield <10% Krar et al., 2010 Water yield <9% Krar et al., 2010 Organic product yield 84% Krar et al., 2010 Organic residue (heavy fraction)
9-10% Krar et al., 2010
Process conditions Sources Temperature 320 oC Kubicka et al., 2010 WSHV 1 h-1 Kubicka et al., 2010 Hydrogen pressure 6 MPa Kubicka et al., 2010 Hydrogen to oil ratio 50 mole:mole Kubicka et al., 2010
14
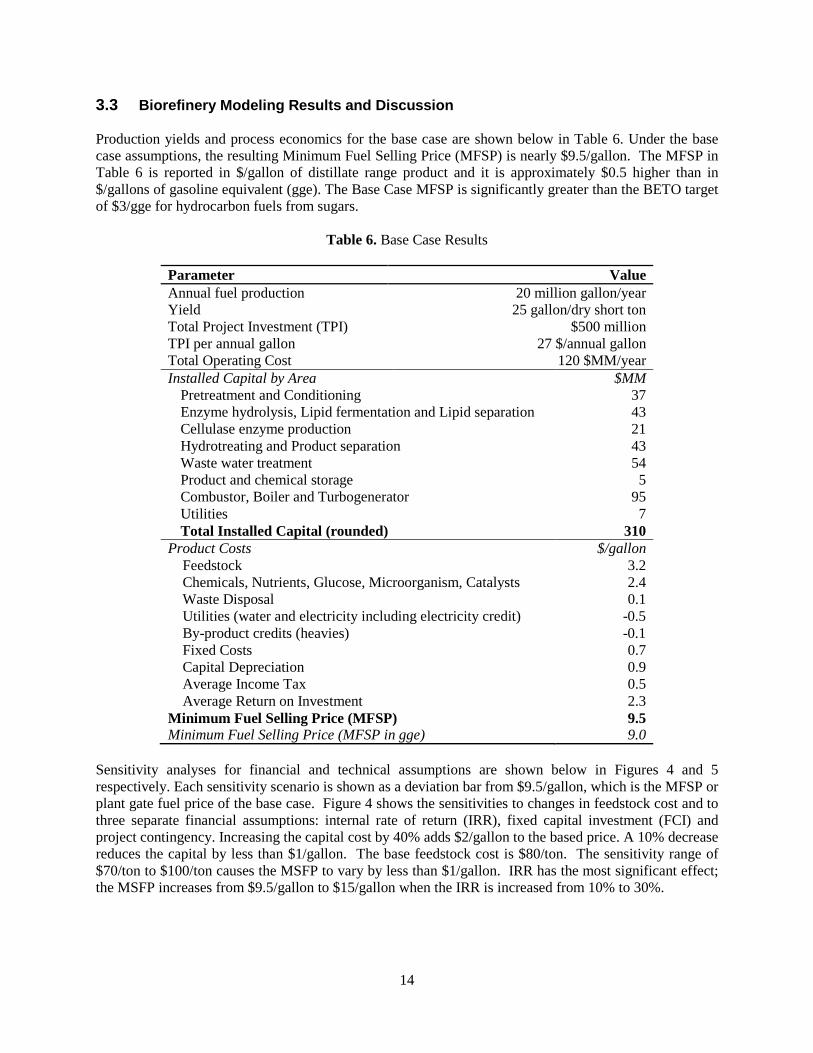
3.3 Biorefinery Modeling Results and Discussion Production yields and process economics for the base case are shown below in Table 6. Under the base case assumptions, the resulting Minimum Fuel Selling Price (MFSP) is nearly $9.5/gallon. The MFSP in Table 6 is reported in $/gallon of distillate range product and it is approximately $0.5 higher than in $/gallons of gasoline equivalent (gge). The Base Case MFSP is significantly greater than the BETO target of $3/gge for hydrocarbon fuels from sugars.
Table 6. Base Case Results
Parameter Value Annual fuel production 20 million gallon/year Yield 25 gallon/dry short ton Total Project Investment (TPI) $500 million TPI per annual gallon 27 $/annual gallon Total Operating Cost 120 $MM/year Installed Capital by Area $MM
Pretreatment and Conditioning 37 Enzyme hydrolysis, Lipid fermentation and Lipid separation 43 Cellulase enzyme production 21 Hydrotreating and Product separation 43 Waste water treatment 54 Product and chemical storage 5 Combustor, Boiler and Turbogenerator 95 Utilities 7 Total Installed Capital (rounded) 310
Product Costs $/gallon Feedstock 3.2 Chemicals, Nutrients, Glucose, Microorganism, Catalysts 2.4 Waste Disposal 0.1 Utilities (water and electricity including electricity credit) -0.5 By-product credits (heavies) -0.1 Fixed Costs 0.7 Capital Depreciation 0.9 Average Income Tax 0.5 Average Return on Investment 2.3 Minimum Fuel Selling Price (MFSP) Minimum Fuel Selling Price (MFSP in gge)
9.5 9.0
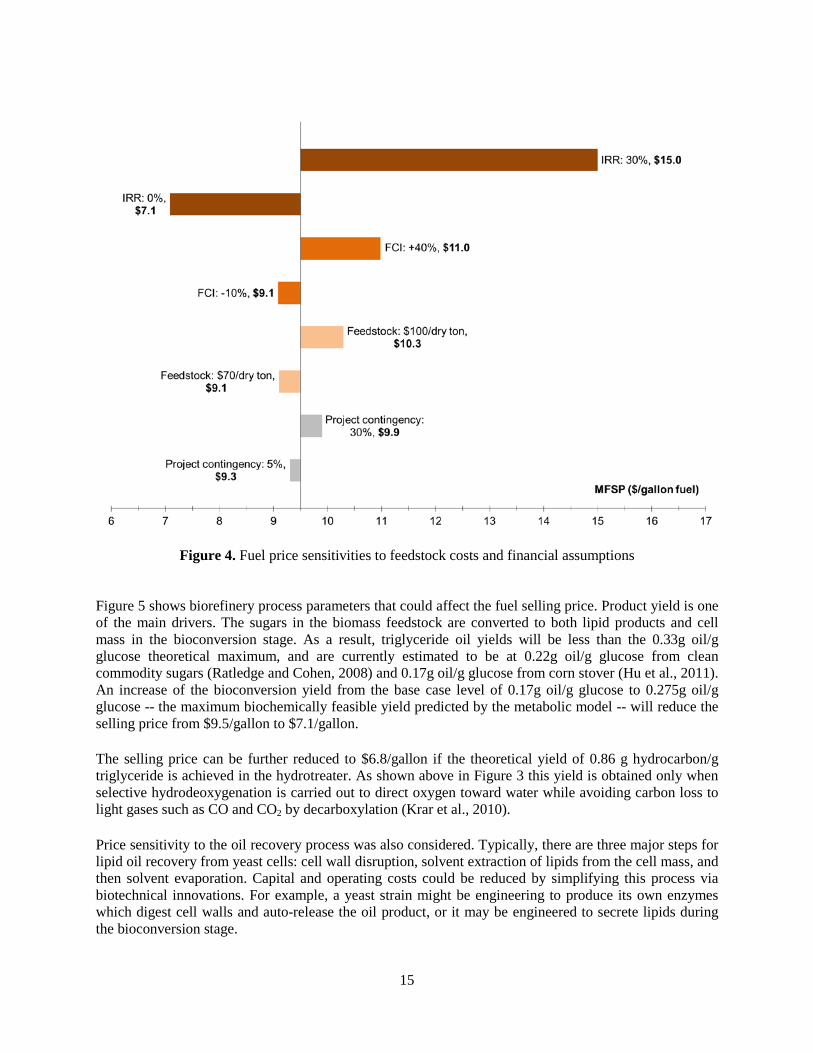
Sensitivity analyses for financial and technical assumptions are shown below in Figures 4 and 5 respectively. Each sensitivity scenario is shown as a deviation bar from $9.5/gallon, which is the MFSP or plant gate fuel price of the base case. Figure 4 shows the sensitivities to changes in feedstock cost and to three separate financial assumptions: internal rate of return (IRR), fixed capital investment (FCI) and project contingency. Increasing the capital cost by 40% adds $2/gallon to the based price. A 10% decrease reduces the capital by less than $1/gallon. The base feedstock cost is $80/ton. The sensitivity range of $70/ton to $100/ton causes the MSFP to vary by less than $1/gallon. IRR has the most significant effect; the MSFP increases from $9.5/gallon to $15/gallon when the IRR is increased from 10% to 30%.
15
Figure 4. Fuel price sensitivities to feedstock costs and financial assumptions
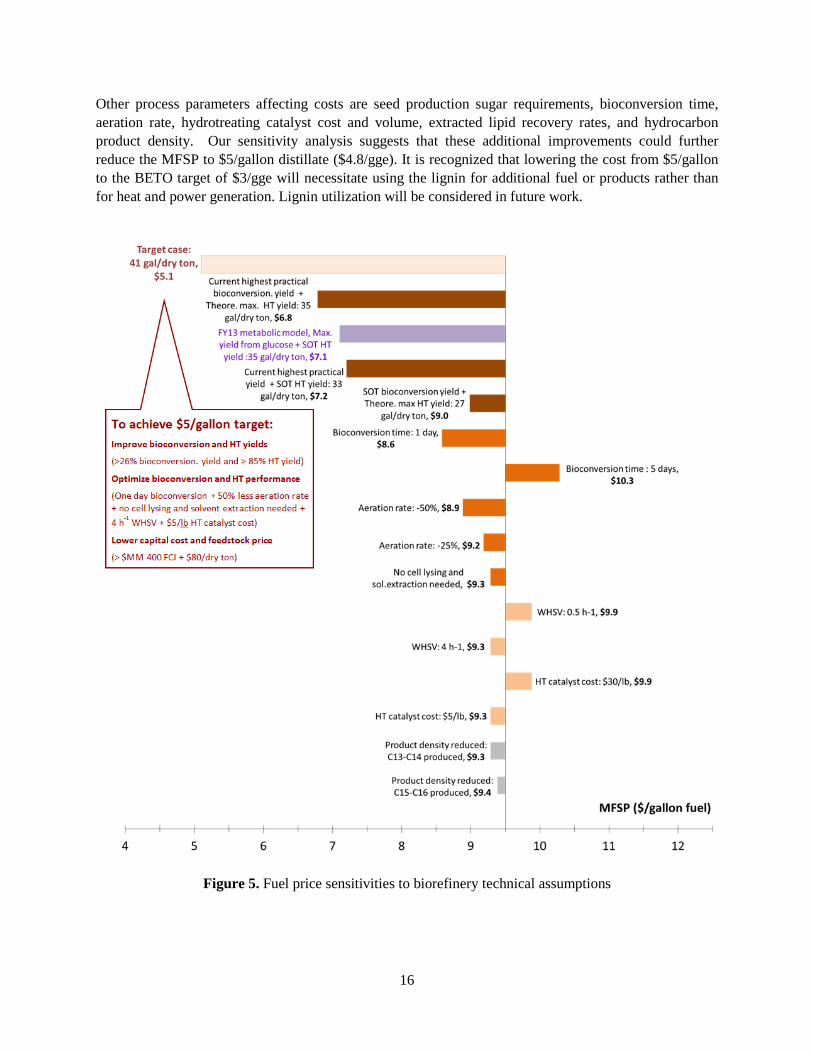
Figure 5 shows biorefinery process parameters that could affect the fuel selling price. Product yield is one of the main drivers. The sugars in the biomass feedstock are converted to both lipid products and cell mass in the bioconversion stage. As a result, triglyceride oil yields will be less than the 0.33g oil/g glucose theoretical maximum, and are currently estimated to be at 0.22g oil/g glucose from clean commodity sugars (Ratledge and Cohen, 2008) and 0.17g oil/g glucose from corn stover (Hu et al., 2011). An increase of the bioconversion yield from the base case level of 0.17g oil/g glucose to 0.275g oil/g glucose -- the maximum biochemically feasible yield predicted by the metabolic model -- will reduce the selling price from $9.5/gallon to $7.1/gallon. The selling price can be further reduced to $6.8/gallon if the theoretical yield of 0.86 g hydrocarbon/g triglyceride is achieved in the hydrotreater. As shown above in Figure 3 this yield is obtained only when selective hydrodeoxygenation is carried out to direct oxygen toward water while avoiding carbon loss to light gases such as CO and CO2 by decarboxylation (Krar et al., 2010). Price sensitivity to the oil recovery process was also considered. Typically, there are three major steps for lipid oil recovery from yeast cells: cell wall disruption, solvent extraction of lipids from the cell mass, and then solvent evaporation. Capital and operating costs could be reduced by simplifying this process via biotechnical innovations. For example, a yeast strain might be engineering to produce its own enzymes which digest cell walls and auto-release the oil product, or it may be engineered to secrete lipids during the bioconversion stage.
16
Other process parameters affecting costs are seed production sugar requirements, bioconversion time, aeration rate, hydrotreating catalyst cost and volume, extracted lipid recovery rates, and hydrocarbon product density. Our sensitivity analysis suggests that these additional improvements could further reduce the MFSP to $5/gallon distillate ($4.8/gge). It is recognized that lowering the cost from $5/gallon to the BETO target of $3/gge will necessitate using the lignin for additional fuel or products rather than for heat and power generation. Lignin utilization will be considered in future work.
Figure 5. Fuel price sensitivities to biorefinery technical assumptions
17
4.0 Conclusions and Future Work
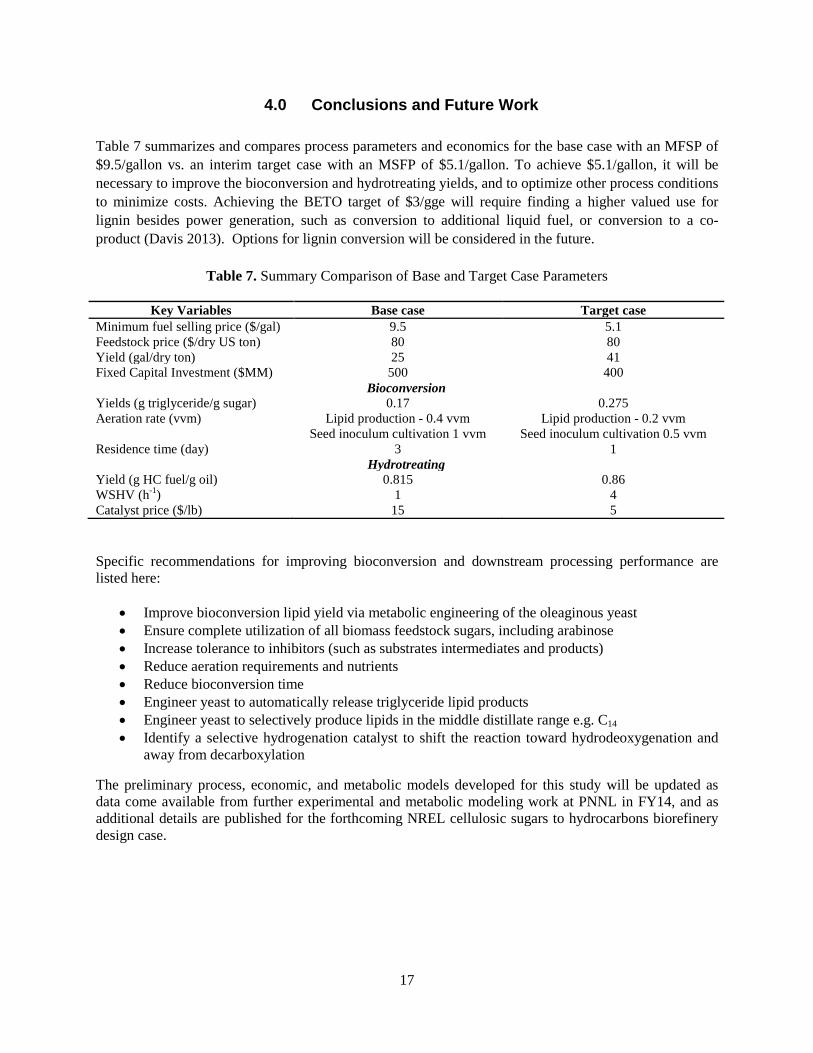
Table 7 summarizes and compares process parameters and economics for the base case with an MFSP of $9.5/gallon vs. an interim target case with an MSFP of $5.1/gallon. To achieve $5.1/gallon, it will be necessary to improve the bioconversion and hydrotreating yields, and to optimize other process conditions to minimize costs. Achieving the BETO target of $3/gge will require finding a higher valued use for lignin besides power generation, such as conversion to additional liquid fuel, or conversion to a co-product (Davis 2013). Options for lignin conversion will be considered in the future.
Table 7. Summary Comparison of Base and Target Case Parameters
Key Variables Base case Target case Minimum fuel selling price ($/gal) 9.5 5.1 Feedstock price ($/dry US ton) 80 80 Yield (gal/dry ton) 25 41 Fixed Capital Investment ($MM) 500 400
Bioconversion Yields (g triglyceride/g sugar) Aeration rate (vvm) Residence time (day)
0.17 Lipid production - 0.4 vvm
Seed inoculum cultivation 1 vvm 3
0.275 Lipid production - 0.2 vvm
Seed inoculum cultivation 0.5 vvm 1
Hydrotreating Yield (g HC fuel/g oil) WSHV (h-1) Catalyst price ($/lb)
0.815 1
15
0.86 4 5
Specific recommendations for improving bioconversion and downstream processing performance are listed here:
• Improve bioconversion lipid yield via metabolic engineering of the oleaginous yeast • Ensure complete utilization of all biomass feedstock sugars, including arabinose • Increase tolerance to inhibitors (such as substrates intermediates and products) • Reduce aeration requirements and nutrients • Reduce bioconversion time • Engineer yeast to automatically release triglyceride lipid products • Engineer yeast to selectively produce lipids in the middle distillate range e.g. C14 • Identify a selective hydrogenation catalyst to shift the reaction toward hydrodeoxygenation and
away from decarboxylation
The preliminary process, economic, and metabolic models developed for this study will be updated as data come available from further experimental and metabolic modeling work at PNNL in FY14, and as additional details are published for the forthcoming NREL cellulosic sugars to hydrocarbons biorefinery design case.
18
5.0 Appendix
5.1 Constraint-based Reconstruction and Analysis of Metabolic Networks The advent of inexpensive, high-throughput genome sequencing over the last two decades has enabled systems biologists to reconstruct the metabolic networks of many of the microbes used in industrial bioprocesses. Among the first genomes to be sequenced was for the yeast Saccharomyces cerevisiae (Cherry, Ball et al. 1997), which is used widely in the production of beer, wine, food, pharmaceuticals, chemicals, and fuels, and as a model organism for biomedical research. The genome sequence and the vast experimental literature on this organism have been organized into the highly structured Saccharomyces Genome Database, which is manually curated by a full-time staff of biologists at Stanford University (Engel and Cherry 2013). These resources facilitated the initial publication of a genome-scale metabolic network for S. cerevisiae in 2003 (Forster, Famili et al. 2003). “Genome-scale” in this sense means that entire genome is screened in an effort to identify all of the genes for enzymes within the organism; the enzymes are then placed into the pathways that comprise its currently understood intracellular metabolic network. The resulting genome-scale metabolic network is typically quite complex (even for unicellular organisms such as yeast) and may be comprised of hundreds of genes and thousands of metabolic and transport reactions that traverse multiple intracellular compartments. As such, the high quality reconstruction of an organism’s metabolic network may take many months or even years (Thiele and Palsson 2010). Moreover, the curation of metabolic networks is a continual, iterative process, since the functions of many of the genes and details of cell biology – even for model organisms such as E. coli - are still being discovered. Nonetheless, metabolic network reconstruction has in recent years facilitated the assembly of whole-cell mathematical models of intracellular metabolism that have begun to transform the practice of metabolic engineering for industrial bioprocesses (Osterlund, Nookaew et al. 2012, Huang, Li et al. 2013). One of the more widely applied methods of mathematical analysis enabled by genome-scale metabolic models is Flux Balance Analysis (FBA), which may be used to predict the optimal distribution of mass fluxes within a metabolic network that maximizes an objective function. The objective function most commonly chosen is the growth of cell mass, although the target production of specific metabolites may be simulated as well. In FBA, the global stoichiometry of all of the metabolic and transport reactions in the cell is organized into a system of linear equations. A particular reaction (or any combination of reactions) is then selected as the objective function. Specific nutrient uptake or metabolite excretion fluxes into and out of the cell (exchange fluxes) are then constrained to match specific experimental conditions. During FBA simulations, the exchange fluxes, as well as the “growth reaction” that describes the net accumulation of the molecules that comprise the total mass of the growing cell, are required to sum to zero under steady state conditions in a manner analogous to the calculations of mass balance that are employed in the simulation of chemical processes at the plant scale using programs such as Aspen or ChemCAD. The constraints on the metabolic model required by FBA reduce the number of feasible mass flux distributions within the cell so that an optimal distribution that maximizes the objective function may be reasonably predicted. FBA is one of many metabolism simulation methods within the area of Constraint-Based Reconstruction and Analysis (COBRA) which have been adapted to evaluate potential metabolic engineering strategies. An example of one such strategy is the intentional deletion of certain genes from an organism’s genome to maximize the yield of a valuable metabolite. Experiments to test this strategy may be computationally simulated by the serial deletion from the model of the individual metabolic reactions that are associated with each gene in the genome (Burgard, Pharkya et al. 2003). Similar strategies have been recently used in S. cerevisiae to increase the production of ethanol, purines, proline/pyrimidines, vanillin, and
19
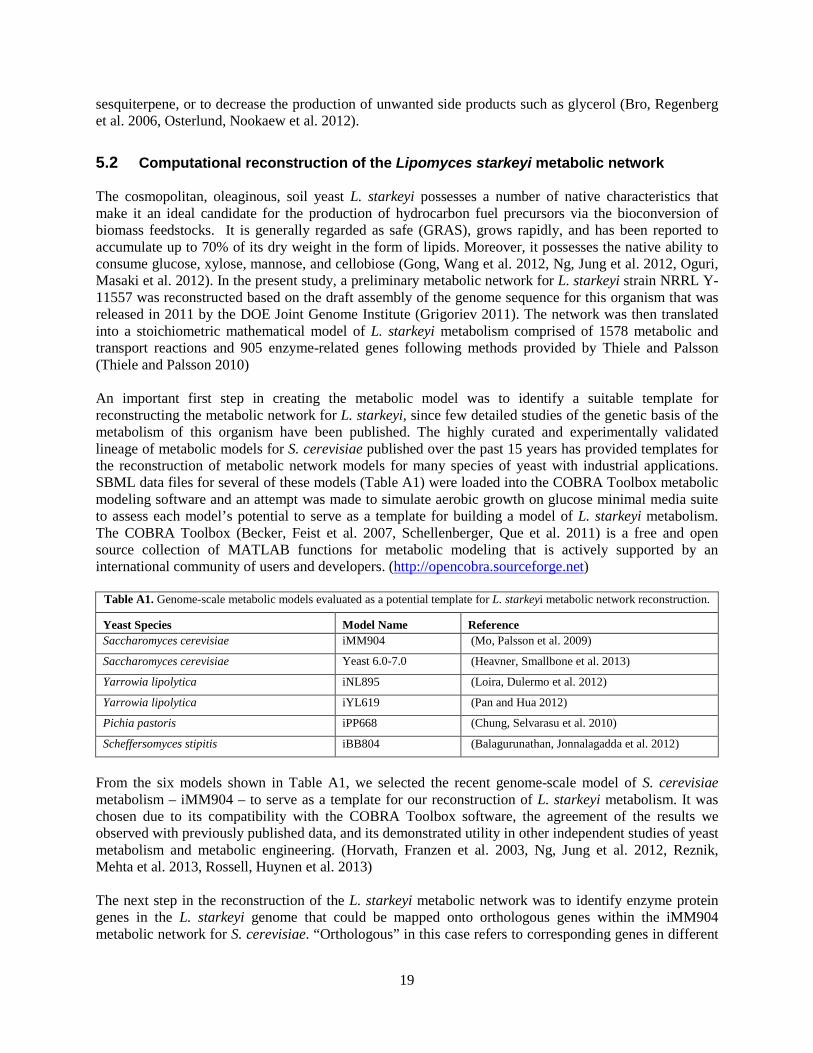
sesquiterpene, or to decrease the production of unwanted side products such as glycerol (Bro, Regenberg et al. 2006, Osterlund, Nookaew et al. 2012).
5.2 Computational reconstruction of the Lipomyces starkeyi metabolic network The cosmopolitan, oleaginous, soil yeast L. starkeyi possesses a number of native characteristics that make it an ideal candidate for the production of hydrocarbon fuel precursors via the bioconversion of biomass feedstocks. It is generally regarded as safe (GRAS), grows rapidly, and has been reported to accumulate up to 70% of its dry weight in the form of lipids. Moreover, it possesses the native ability to consume glucose, xylose, mannose, and cellobiose (Gong, Wang et al. 2012, Ng, Jung et al. 2012, Oguri, Masaki et al. 2012). In the present study, a preliminary metabolic network for L. starkeyi strain NRRL Y-11557 was reconstructed based on the draft assembly of the genome sequence for this organism that was released in 2011 by the DOE Joint Genome Institute (Grigoriev 2011). The network was then translated into a stoichiometric mathematical model of L. starkeyi metabolism comprised of 1578 metabolic and transport reactions and 905 enzyme-related genes following methods provided by Thiele and Palsson (Thiele and Palsson 2010) An important first step in creating the metabolic model was to identify a suitable template for reconstructing the metabolic network for L. starkeyi, since few detailed studies of the genetic basis of the metabolism of this organism have been published. The highly curated and experimentally validated lineage of metabolic models for S. cerevisiae published over the past 15 years has provided templates for the reconstruction of metabolic network models for many species of yeast with industrial applications. SBML data files for several of these models (Table A1) were loaded into the COBRA Toolbox metabolic modeling software and an attempt was made to simulate aerobic growth on glucose minimal media suite to assess each model’s potential to serve as a template for building a model of L. starkeyi metabolism. The COBRA Toolbox (Becker, Feist et al. 2007, Schellenberger, Que et al. 2011) is a free and open source collection of MATLAB functions for metabolic modeling that is actively supported by an international community of users and developers. (http://opencobra.sourceforge.net)
Table A1. Genome-scale metabolic models evaluated as a potential template for L. starkeyi metabolic network reconstruction.
Yeast Species Model Name Reference Saccharomyces cerevisiae iMM904 (Mo, Palsson et al. 2009)
Saccharomyces cerevisiae Yeast 6.0-7.0 (Heavner, Smallbone et al. 2013)
Yarrowia lipolytica iNL895 (Loira, Dulermo et al. 2012)
Yarrowia lipolytica iYL619 (Pan and Hua 2012)
Pichia pastoris iPP668 (Chung, Selvarasu et al. 2010)
Scheffersomyces stipitis iBB804 (Balagurunathan, Jonnalagadda et al. 2012)
From the six models shown in Table A1, we selected the recent genome-scale model of S. cerevisiae metabolism – iMM904 – to serve as a template for our reconstruction of L. starkeyi metabolism. It was chosen due to its compatibility with the COBRA Toolbox software, the agreement of the results we observed with previously published data, and its demonstrated utility in other independent studies of yeast metabolism and metabolic engineering. (Horvath, Franzen et al. 2003, Ng, Jung et al. 2012, Reznik, Mehta et al. 2013, Rossell, Huynen et al. 2013) The next step in the reconstruction of the L. starkeyi metabolic network was to identify enzyme protein genes in the L. starkeyi genome that could be mapped onto orthologous genes within the iMM904 metabolic network for S. cerevisiae. “Orthologous” in this case refers to corresponding genes in different
20
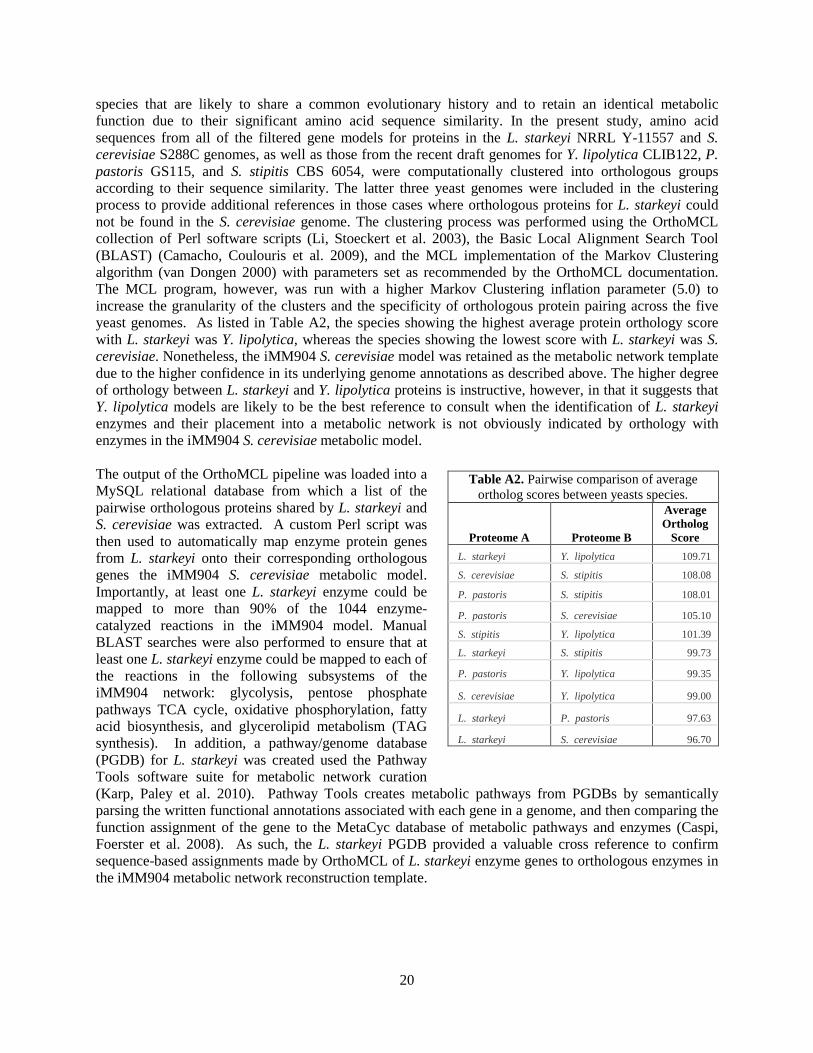
species that are likely to share a common evolutionary history and to retain an identical metabolic function due to their significant amino acid sequence similarity. In the present study, amino acid sequences from all of the filtered gene models for proteins in the L. starkeyi NRRL Y-11557 and S. cerevisiae S288C genomes, as well as those from the recent draft genomes for Y. lipolytica CLIB122, P. pastoris GS115, and S. stipitis CBS 6054, were computationally clustered into orthologous groups according to their sequence similarity. The latter three yeast genomes were included in the clustering process to provide additional references in those cases where orthologous proteins for L. starkeyi could not be found in the S. cerevisiae genome. The clustering process was performed using the OrthoMCL collection of Perl software scripts (Li, Stoeckert et al. 2003), the Basic Local Alignment Search Tool (BLAST) (Camacho, Coulouris et al. 2009), and the MCL implementation of the Markov Clustering algorithm (van Dongen 2000) with parameters set as recommended by the OrthoMCL documentation. The MCL program, however, was run with a higher Markov Clustering inflation parameter (5.0) to increase the granularity of the clusters and the specificity of orthologous protein pairing across the five yeast genomes. As listed in Table A2, the species showing the highest average protein orthology score with L. starkeyi was Y. lipolytica, whereas the species showing the lowest score with L. starkeyi was S. cerevisiae. Nonetheless, the iMM904 S. cerevisiae model was retained as the metabolic network template due to the higher confidence in its underlying genome annotations as described above. The higher degree of orthology between L. starkeyi and Y. lipolytica proteins is instructive, however, in that it suggests that Y. lipolytica models are likely to be the best reference to consult when the identification of L. starkeyi enzymes and their placement into a metabolic network is not obviously indicated by orthology with enzymes in the iMM904 S. cerevisiae metabolic model. The output of the OrthoMCL pipeline was loaded into a MySQL relational database from which a list of the pairwise orthologous proteins shared by L. starkeyi and S. cerevisiae was extracted. A custom Perl script was then used to automatically map enzyme protein genes from L. starkeyi onto their corresponding orthologous genes the iMM904 S. cerevisiae metabolic model. Importantly, at least one L. starkeyi enzyme could be mapped to more than 90% of the 1044 enzyme-catalyzed reactions in the iMM904 model. Manual BLAST searches were also performed to ensure that at least one L. starkeyi enzyme could be mapped to each of the reactions in the following subsystems of the iMM904 network: glycolysis, pentose phosphate pathways TCA cycle, oxidative phosphorylation, fatty acid biosynthesis, and glycerolipid metabolism (TAG synthesis). In addition, a pathway/genome database (PGDB) for L. starkeyi was created used the Pathway Tools software suite for metabolic network curation (Karp, Paley et al. 2010). Pathway Tools creates metabolic pathways from PGDBs by semantically parsing the written functional annotations associated with each gene in a genome, and then comparing the function assignment of the gene to the MetaCyc database of metabolic pathways and enzymes (Caspi, Foerster et al. 2008). As such, the L. starkeyi PGDB provided a valuable cross reference to confirm sequence-based assignments made by OrthoMCL of L. starkeyi enzyme genes to orthologous enzymes in the iMM904 metabolic network reconstruction template.
Table A2. Pairwise comparison of average
ortholog scores between yeasts species.
Proteome A Proteome B
Average Ortholog
Score L. starkeyi Y. lipolytica 109.71
S. cerevisiae S. stipitis 108.08
P. pastoris S. stipitis 108.01
P. pastoris S. cerevisiae 105.10
S. stipitis Y. lipolytica 101.39
L. starkeyi S. stipitis 99.73
P. pastoris Y. lipolytica 99.35
S. cerevisiae Y. lipolytica 99.00
L. starkeyi P. pastoris 97.63
L. starkeyi S. cerevisiae 96.70
21
5.3 Refinements to the L. starkeyi metabolic model based on experimental and literature evidence
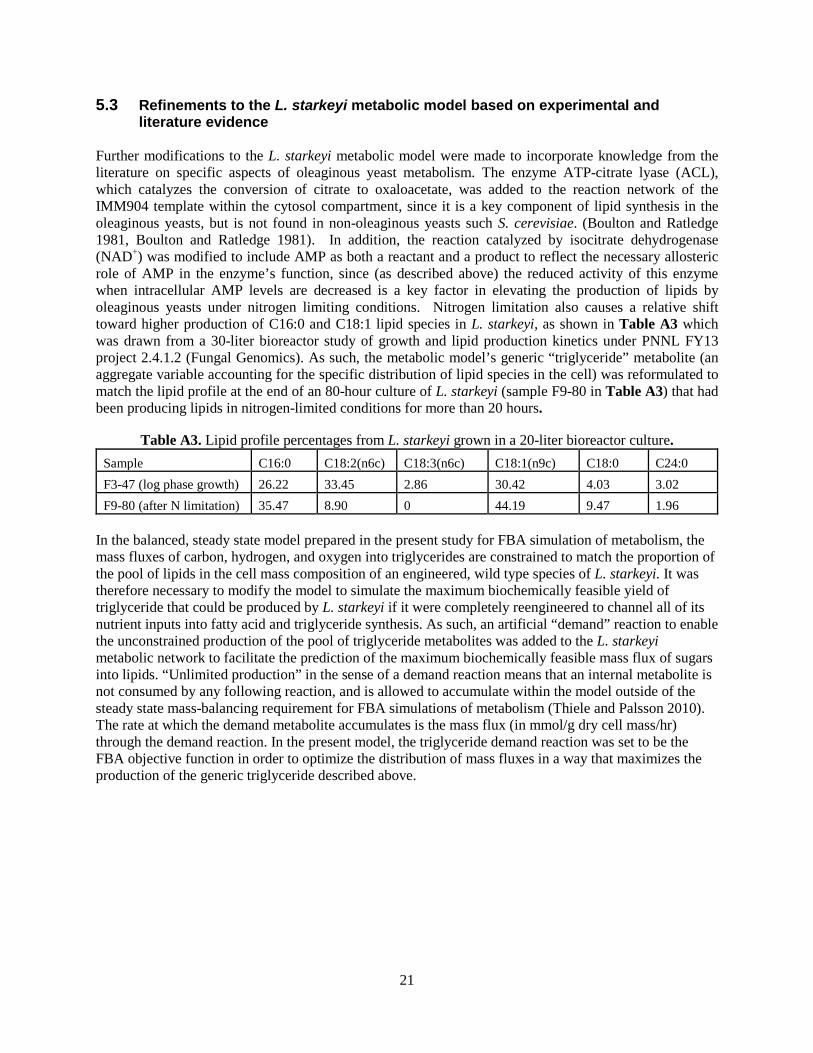
Further modifications to the L. starkeyi metabolic model were made to incorporate knowledge from the literature on specific aspects of oleaginous yeast metabolism. The enzyme ATP-citrate lyase (ACL), which catalyzes the conversion of citrate to oxaloacetate, was added to the reaction network of the IMM904 template within the cytosol compartment, since it is a key component of lipid synthesis in the oleaginous yeasts, but is not found in non-oleaginous yeasts such S. cerevisiae. (Boulton and Ratledge 1981, Boulton and Ratledge 1981). In addition, the reaction catalyzed by isocitrate dehydrogenase (NAD+) was modified to include AMP as both a reactant and a product to reflect the necessary allosteric role of AMP in the enzyme’s function, since (as described above) the reduced activity of this enzyme when intracellular AMP levels are decreased is a key factor in elevating the production of lipids by oleaginous yeasts under nitrogen limiting conditions. Nitrogen limitation also causes a relative shift toward higher production of C16:0 and C18:1 lipid species in L. starkeyi, as shown in Table A3 which was drawn from a 30-liter bioreactor study of growth and lipid production kinetics under PNNL FY13 project 2.4.1.2 (Fungal Genomics). As such, the metabolic model’s generic “triglyceride” metabolite (an aggregate variable accounting for the specific distribution of lipid species in the cell) was reformulated to match the lipid profile at the end of an 80-hour culture of L. starkeyi (sample F9-80 in Table A3) that had been producing lipids in nitrogen-limited conditions for more than 20 hours.
Table A3. Lipid profile percentages from L. starkeyi grown in a 20-liter bioreactor culture. Sample C16:0 C18:2(n6c) C18:3(n6c) C18:1(n9c) C18:0 C24:0 F3-47 (log phase growth) 26.22 33.45 2.86 30.42 4.03 3.02 F9-80 (after N limitation) 35.47 8.90 0 44.19 9.47 1.96
In the balanced, steady state model prepared in the present study for FBA simulation of metabolism, the mass fluxes of carbon, hydrogen, and oxygen into triglycerides are constrained to match the proportion of the pool of lipids in the cell mass composition of an engineered, wild type species of L. starkeyi. It was therefore necessary to modify the model to simulate the maximum biochemically feasible yield of triglyceride that could be produced by L. starkeyi if it were completely reengineered to channel all of its nutrient inputs into fatty acid and triglyceride synthesis. As such, an artificial “demand” reaction to enable the unconstrained production of the pool of triglyceride metabolites was added to the L. starkeyi metabolic network to facilitate the prediction of the maximum biochemically feasible mass flux of sugars into lipids. “Unlimited production” in the sense of a demand reaction means that an internal metabolite is not consumed by any following reaction, and is allowed to accumulate within the model outside of the steady state mass-balancing requirement for FBA simulations of metabolism (Thiele and Palsson 2010). The rate at which the demand metabolite accumulates is the mass flux (in mmol/g dry cell mass/hr) through the demand reaction. In the present model, the triglyceride demand reaction was set to be the FBA objective function in order to optimize the distribution of mass fluxes in a way that maximizes the production of the generic triglyceride described above.
22
6.0 References
Balagurunathan, B., S. Jonnalagadda, L. Tan and R. Srinivasan (2012). "Reconstruction and analysis of a genome-scale metabolic model for Scheffersomyces stipitis." Microbial Cell Factories 11(27).
Becker, S. A., A. M. Feist, M. L. Mo, G. Hannum, B. O. Palsson and M. J. Herrgard (2007). "Quantitative prediction of cellular metabolism with constraint-based models: the COBRA Toolbox." Nature Protocols 2(3): 727-738.
BETO. (2012). "Department of Energy Delivers on R&D Targets around Cellulosic Ethanol." from http://apps1.eere.energy.gov/successes/success_story.cfm/news_id=19231/prog=100.
BETO (2013). Bioenergies Technologies Office Multiyear Program Plan: May 2013. DOE/EE-0915. Washington, D.C., U.S. Department of Energy.
Boulton, C. A. and C. Ratledge (1981). "Atp - Citrate Lyase - the Regulatory Enzyme for Lipid Biosynthesis in Lipomyces-Starkeyi." Journal of General Microbiology 127(Dec): 423-426.
Boulton, C. A. and C. Ratledge (1981). "Correlation of Lipid-Accumulation in Yeasts with Possession of Atp-Citrate Lyase." Journal of General Microbiology 127(Nov): 169-176.
Bro, C., B. Regenberg, J. Forster and J. Nielsen (2006). "In silico aided metabolic engineering of Saccharomyces cerevisiae for improved bioethanol production." Metab Eng 8(2): 102-111.
Burgard, A. P., P. Pharkya and C. D. Maranas (2003). "Optknock: a bilevel programming framework for identifying gene knockout strategies for microbial strain optimization." Biotechnol. Bioeng. 84: 647-657.
Camacho, C., G. Coulouris, V. Avagyan, N. Ma, J. Papadopoulos, K. Bealer and T. L. Madden (2009). "BLAST plus : architecture and applications." Bmc Bioinformatics 10.
Caspi, R., H. Foerster, C. A. Fulcher, P. Kaipa, M. Krummenacker, M. Latendresse, S. Paley, S. Y. Rhee, A. G. Shearer, C. Tissier, T. C. Walk, P. Zhang and P. D. Karp (2008). "The MetaCyc Database of metabolic pathways and enzymes and the BioCyc collection of Pathway/Genome Databases." Nucleic Acids Research 36: D623-D631.
Celton, M., I. Sanchez, A. Goelzer, V. Fromion, C. Camarasa and S. Dequin (2012). "A comparative transcriptomic, fluxomic and metabolomic analysis of the response of Saccharomyces cerevisiae to increases in NADPH oxidation." Bmc Genomics 13.
Cherry, J. M., C. Ball, S. Weng, G. Juvik, R. Schmidt, C. Adler, B. Dunn, S. Dwight, L. Riles, R. K. Mortimer and D. Botstein (1997). "Genetic and physical maps of Saccharomyces cerevisiae." Nature 387(6632): 67-73.
23
Chung, B. K. S., S. Selvarasu, C. Andrea, J. Ryu, H. Lee, J. Ahn, H. Lee and D. Y. Lee (2010). "Genome-scale metabolic reconstruction and in silico analysis of methylotrophic yeast Pichia pastoris for strain improvement." Microbial Cell Factories 9(50).
Davies, R. (1992). Scale Up of Yeast Oil Technology. Industrial Application of Single Cell Oils. D. Kyle, Ratledge, C. Champaign, IL, AOCS.
Davis, R., Biddy, M., Tan E, Tao, L., Jones, S. (2013). Biological Conversion of Sugars to Hydrocarbons Technology Pathway. NREL/TP-5100-58054; PNNL-22318. Denver, CO, National Renewable Energy Laboratory and Pacific Northwest National Laboratory.
Engel, S. R. and J. M. Cherry (2013). "The new modern era of yeast genomics: community sequencing and the resulting annotation of multiple Saccharomyces cerevisiae strains at the Saccharomyces Genome Database." Database-the Journal of Biological Databases and Curation 2013: /database/bat012.
Forster, J., I. Famili, P. C. Fu, B. O. Palsson and J. Nielsen (2003). "Genome-Scale Reconstruction of the Saccharomyces cerevisiae Metabolic Network." Genome Research 13(2): 244 - 253.
Gong, Z. W., Q. Wang, H. W. Shen, C. M. Hu, G. J. Jin and Z. B. K. Zhao (2012). "Co-fermentation of cellobiose and xylose by Lipomyces starkeyi for lipid production." Bioresource Technology 117: 20-24.
Grigoriev, I. V., Jeffries, T. (2011). Lipomyces starkeyi Genome Sequence. 402433. Walnut Creek, CA, Joint Genome Institute
Heavner, B. D., K. Smallbone, N. D. Price and L. P. Walker (2013). "Version 6 of the consensus yeast metabolic network refines biochemical coverage and improves model performance." Database-the Journal of Biological Databases and Curation 2013: /database/bat059.
Horvath, I. S., C. J. Franzen, M. J. Taherzadeh, C. Niklasson and G. Liden (2003). "Effects of furfural on the respiratory metabolism of Saccharomyces cerevisiae in glucose-limited chemostats." Appl Environ Microbiol 69(7): 4076-4086.
Hu, C., S. Wu, Q. Wang, G. Jin, H. Shen and Z. K. Zhao (2011). "Simultaneous utilization of glucose and xylose for lipid production by Trichosporon cutaneum." Biotechnol Biofuels 4(1): 25.
Huang, D., S. S. Li, M. L. Xia, J. P. Wen and X. Q. Jia (2013). "Genome-scale metabolic network guided engineering of Streptomyces tsukubaensis for FK506 production improvement." Microbial Cell Factories 12(52).
Humbird, D., Davis, R., Tao, L., Kinchin, C., Hsu, D., Aden, A (2011). Process design and economics for biochemical conversion of lignocellulosic biomass to ethanol: dilute-acid pretreatment and enzymatic hydrolysis of corn stover. NREL/TP-5100-47764. Golden, CO, National Renewable Energy Laboratory.
Hydrocarbon-Processing (2006). "NExBTL: A biofuel for sensitive city environments and the premium quality market." Hydrocarbon Processing 85(3): Dd27-Dd28.
24
Jones, S., Valkenburg, C., Walton, C., Elliott, D., Holladay, J., Stevens, D., Kinchin, C., Czernik, S. (2009). Production of gasoline and diesel from biomass via fast pyrolysis, hydrotreating and hydrocracking: A design case. PNNL-18284. Richland, WA, Pacific Northwest National Laboratory.
Karp, P. D., S. M. Paley, M. Krummenacker, M. Latendresse, J. M. Dale, T. J. Lee, P. Kaipa, F. Gilham, A. Spaulding, L. Popescu, T. Altman, I. Paulsen, I. M. Keseler and R. Caspi (2010). "Pathway Tools version 13.0: integrated software for pathway/genome informatics and systems biology." Briefings in Bioinformatics 11(1): 40-79.
Kosa, M. and A. J. Ragauskas (2011). "Lipids from heterotrophic microbes: advances in metabolism research." Trends in Biotechnology 29(2): 53-61.
Krar, M., S. Kovacs, D. Kallo and J. Hancsok (2010). "Fuel purpose hydrotreating of sunflower oil on CoMo/Al2O3 catalyst." Bioresource Technology 101(23): 9287-9293.
Kubicka, D., M. Bejblova and J. Vlk (2010). "Conversion of Vegetable Oils into Hydrocarbons over CoMo/MCM-41 Catalysts." Topics in Catalysis 53(3-4): 168-178.
Lee, D., Owens, V.N., Boe, A., Jeranyama, P. (2007). Composition of Herbaceous Biomass Feedstocks. SGINC1-07. Brookings, SD, North Central Sun Grant Center, South Dakota State University.
Li, L., C. J. Stoeckert and D. S. Roos (2003). "OrthoMCL: Identification of ortholog groups for eukaryotic genomes." Genome Research 13(9): 2178-2189.
Lin, J. T., H. W. Shen, H. D. Tan, X. Zhao, S. G. Wu, C. M. Hu and Z. B. K. Zhao (2011). "Lipid production by Lipomyces starkeyi cells in glucose solution without auxiliary nutrients." Journal of Biotechnology 152(4): 184-188.
Loira, N., T. Dulermo, J. M. Nicaud and D. J. Sherman (2012). "A genome-scale metabolic model of the lipid-accumulating yeast Yarrowia lipolytica." BMC Syst Biol 6: 35.
Mo, M., B. Palsson and M. Herrgard (2009). "Connecting extracellular metabolomic measurements to intracellular flux states in yeast." BMC Systems Biology 3(1): 37.
Ng, C. Y., M. Y. Jung, J. Lee and M. K. Oh (2012). "Production of 2,3-butanediol in Saccharomyces cerevisiae by in silico aided metabolic engineering." Microbial Cell Factories 11(68).
Oguri, E., K. Masaki, T. Naganuma and H. Iefuji (2012). "Phylogenetic and biochemical characterization of the oil-producing yeast Lipomyces starkeyi." Antonie Van Leeuwenhoek International Journal of General and Molecular Microbiology 101(2): 359-368.
Osterlund, T., I. Nookaew and J. Nielsen (2012). "Fifteen years of large scale metabolic modeling of yeast: Developments and impacts." Biotechnology Advances 30(5): 979-988.
25
Pan, P. C. and Q. Hua (2012). "Reconstruction and In Silico Analysis of Metabolic Network for an Oleaginous Yeast, Yarrowia lipolytica." PLoS ONE 7(12).
Papanikolaou, S. and G. Aggelis (2011). "Lipids of oleaginous yeasts. Part I: Biochemistry of single cell oil production." European Journal of Lipid Science and Technology 113(8): 1031-1051.
POET-DSM. (2013). "Project Liberty: A decade of cellulosic research." Retrieved September 30, 2013, from http://poetdsm.com/liberty.
Ratledge, C. (2004). "Fatty acid biosynthesis in microorganisms being used for Single Cell Oil production." Biochimie 86(11): 807-815.
Ratledge, C. (2010). Single cell oils for the 21st century. . Single Cell Oils. Microbial and Algal Oils.2nd edition. Urbana, IL, AOCS Press.
Ratledge, C. and Z. Cohen (2008). "Microbial and algal oils: Do they have a future for biodiesel or as commodity oils?" Lipid Technology 20(7): 155-160.
Reznik, E., P. Mehta and D. Segre (2013). "Flux imbalance analysis and the sensitivity of cellular growth to changes in metabolite pools." PLoS Comput Biol 9(8): e1003195.
Rossell, S., M. A. Huynen and R. A. Notebaart (2013). "Inferring Metabolic States in Uncharacterized Environments Using Gene-Expression Measurements." PloS Computational Biology 9(3).
Schellenberger, J., R. Que, R. M. T. Fleming, I. Thiele, J. D. Orth, A. M. Feist, D. C. Zielinski, A. Bordbar, N. E. Lewis, S. Rahmanian, J. Kang, D. R. Hyduke and B. O. Palsson (2011). "Quantitative prediction of cellular metabolism with constraint-based models: the COBRA Toolbox v2.0." Nature Protocols 6(9): 1290-1307.
Serrano-Ruiz, J. C., E. V. Ramos-Fernandez and A. Sepulveda-Escribano (2012). "From biodiesel and bioethanol to liquid hydrocarbon fuels: new hydrotreating and advanced microbial technologies." Energy & Environmental Science 5(2): 5638-5652.
Stumborg, M., A. Wong and E. Hogan (1996). "Hydroprocessed vegetable oils for diesel fuel improvement." Bioresource Technology 56(1): 13-18.
Tai, M. and G. Stephanopoulos (2013). "Engineering the push and pull of lipid biosynthesis in oleaginous yeast Yarrowia lipolytica for biofuel production." Metabolic Engineering 15(0): 1-9.
Tang, W., S. F. Zhang, Q. Wang, H. D. Tan and Z. K. Zhao (2009). "The isocitrate dehydrogenase gene of oleaginous yeast Lipomyces starkeyi is linked to lipid accumulation." Canadian Journal of Microbiology 55(9): 1062-1069.
26
Tews, I., Jones, S.B., Santosa, D.M. , Dai, Z., Ramasamy, K., Zhu, Y. (2010). A Survey of Opportunities for Microbial Conversion of Biomass to Hydrocarbon Compatible Fuels. PNNL-19704. Richland, WA, Pacific Northwest National Laboratory.
Thiele, I. and B. O. Palsson (2010). "A protocol for generating a high-quality genome-scale metabolic reconstruction." Nat. Protocols 5(1): 93-121.
van Dongen, S. (2000). A cluster algorithm for graphs. Technical Report INS-R0010. Amsterdam, National Research Institute for Mathematics and Computer Science in the Netherlands.
Wild, R., S. Patil, M. Popovic, M. Zappi, S. Dufreche and R. Bajpai (2010). "Lipids from Lipomyces starkeyi." Food Technology and Biotechnology 48(3): 329-335.