Embed Size (px)
Citation preview

NASA Technical Memorandum 101702
i i
_",Preliminary Development .of anIntelligent Computer Assistantfor Engine Monitoring
James D. Disbrow, Eugene LoDuke, and Ronald J. Ray---- _lmmlE nL¢_m,'lul -inr _L--
LANGLEY RESEARCH CENTERAugust 1989 u_A_ NA._
t • HAMPTCkN, VIRGINIA
(_ASA-TM-IO170Z) p_,CLI_INA,R,Y J_V FL_PMcNI uFAN INTELLIGENT CC;_PUI_K AS _,rL_TANT FOR EI_GI N_-
Mq_,_TTC_,#,TNC {*_ASA) 17_ _ CSCL n9 _
N90-22322
N/L.¢/_National Aeronautics and
Space Administration
https://ntrs.nasa.gov/search.jsp?R=19900013006 2018-07-08T17:12:25+00:00Z

NASA Technical Memoradum 101702
_7
Preliminary Development of anIntelligent Computer Assistantfor Engine Monitoring
James D. DisbrowPRC Systems Services, Inc., Edwards, Califomia
Eugene L. Duke and Ronald J. RayAmes Research Center, Dryden Flight Research Facility, Edwards, California
1989
NASANational Aeronautics andSpace AdministrationAmes Research Center
Dryden Flight Research FacilityEdwards, California 93523-5000

PRELIMINARY DEVELOPMENT OF AN INTELLIGENT COMPUTER
ASSISTANT FOR ENGINE MONITORING
James D. Disbrow*
PRC Systems Services, Inc.
Aerospace Technologies DivisionEdwards, California
Abstract
Eugene L. Duke t and Ronald J. Ray t
NASA Ames Research Center
Dryden Flight Research FacilityEdwards, California
This paper presents the preliminary development of
a method for monitoring the propulsion system and
identifying correct recovery procedures for the F404
engine in support of the F-18 high-angle-of-attack re-
search vehicle program. By using artificial intelligence
techniques and modem display technology, we have
been able to design a system that aids in real-time
monitoring of propulsion systems. This expert sys-
tem is designed to operate as an "expert aid" to an en-
gineer with little or no experience in propulsion sys-
tem monitoring. The goals of this expert system de-
velopment project are to provide enhanced safety of
flight and to relieve the propulsion engineers of the
time-consuming but necessary task of propulsion sys-
tem monitoring on flight programs, particularly those
with nonexperimental engines. As telemetry data is
received, the results are continually being displayed
to the engineer in a unique manner. The engineer has
the choice of a number of different color graphical dis-
plays he may use. These include being able to moni-
tor the engine state, monitor individual parameters and
watch time histories or strip chart displays. When an
anomaly is identified, that information is displayed to
the engineer. Any additional information is also dis-
played, such as the procedures necessary to recover
from the anomaly.
*Research Engineer.tChief Engineer, member AIAA.
t Propulsion Engineer.
Copyright 1_1989 by the American Institute of Aeronautics and
Astronautics, Inc. No copyright is asserted in the United States
under Title 17, U.S. Code. The U.S. Government has a royalty-free
license to exercise all rights under the copyright claimed herein
for Governmental purposes. All other rights are reserved by the
copyright owner.
A8
CLIPS
CRT
E_Lube_P
ICAEM
LVDT
N1
N2
Nz
Ps0
Ps3
Pt5
PLA
ttl
tt5
Nomenclature
nozzle area, ft2
C Language Production System
cathode-ray tube
engine lubrication pressure
intelligent computer assistant for engine
monitoring
linear voltage differential transformer
rotational fan speed, percent or RPM
rotational compressor speed, percentor RPM
normal acceleration, g's
ambient static pressure, lbfm. 2
compressor discharge static pressure,lb/in. 2
turbine discharge total pressure, lb/in. 2
power lever angle position, deg
inlet total temperature, C°
turbine discharge total temperature, C*
Introduction
Propulsion system monitoring is a flight safety func-
tion that is often performed for aircraft operating with
experimental propulsion systems. Propulsion system
monitoring may also be a safety-of-flight requirement
for an aircraft performing extreme maneuvers or flying
near the boundaries of the normal operating envelope.
At the Dryden Flight Research Facility of the NASA
Ames Research Center, this monitoring function is
performed in the mission control center of the Western
Aeronautical Test Range. The task of propulsion sys-
tem monitoring is normally performed by an experi-
enced, senior-level propulsion system engineer famil-
iar with the specific aircraft and engine being flown us-
ing strip chart recorders, computer-formatted displays,
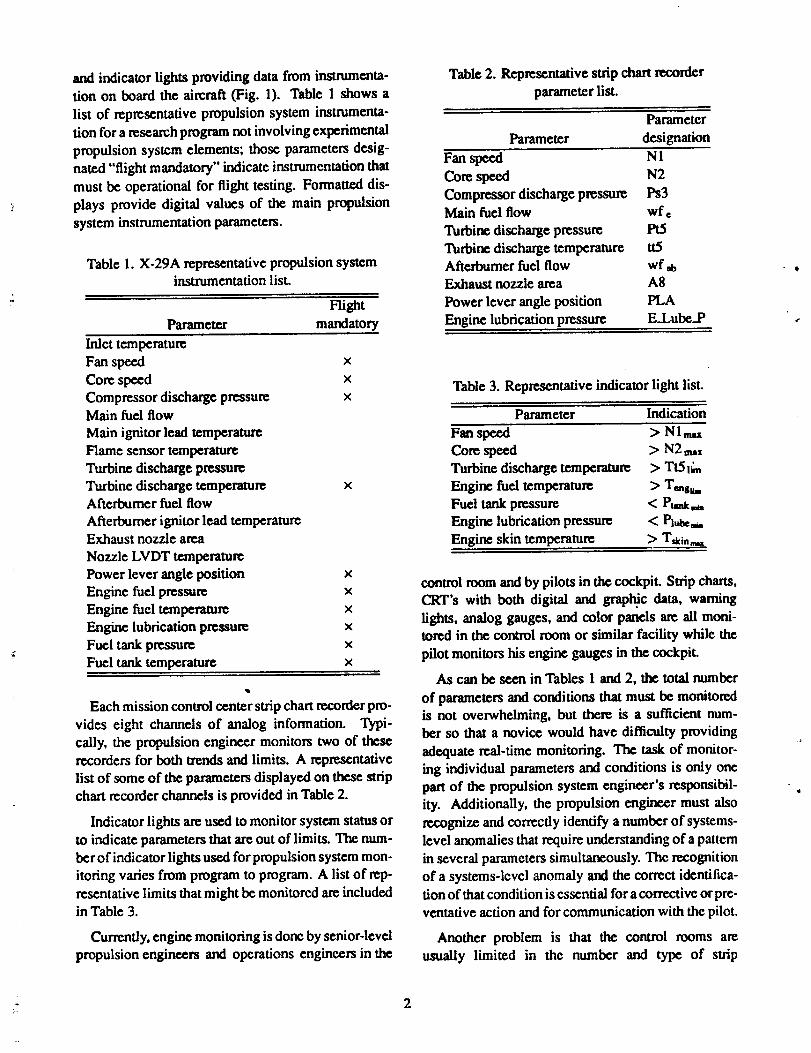
and indicator lights providing data from instrumenta-
tion on board the aircraft (Fig. 1). Table 1 shows a
list of representative propulsion system instrumenta-
tion for a research program not involving experimental
propulsion system elements; those parameters desig-
nated "flight mandatory" indicate instrumentation that
must be operational for flight testing. Formatted dis-
plays provide digital values of the main propulsion
system instrumentation parameters.
Table 1. X-29A representative propulsion systeminstnunentation list.
nightParameter mandatory
Inlet temperature
Fan speed ×
Core speed x
Compressor discharge pressure xMain fuel flow
Main ignitor lead temperature
Flame sensor temperature
Turbine discharge pressure
Turbine discharge temperature xAfterburner fuel flow
Afterburner ignitor lead temperatureExhaust nozzle area
Nozzle LVDT temperature
Power lever angle position x
Engine fuel pressure x
Engine fuel temperature x
Engine lubrication pressure x
Fuel tank pressure x
Fuel tank temperature x
Each mission control center strip chart recorder pro-
vides eight channels of analog information. Typi-
cally, the propulsion engineer monitors two of these
recorders for both trends and limits. A representative
list of some of the parameters displayed on these strip
chart recorder channels is provided in Table 2.
Indicator lights are used to monitor system status or
to indicate parameters that are out of limits. The num-
berof indicator lights used for propulsion system mon-
itoring varies from program to program. A list of rep-
resentative limits that might be monitored are includedin Table 3.
Currently, engine monitoring is done by senior-level
propulsion engineers and operations engineers in the
Table 2. Representative strip chart recorder
parameter list.
Parameter
Parameter designation
Fan speed NI
Core speed N2
Compr¢ssor discharge pressure Ps3Main fuel flow wf
Turbine discharge pressure Pt5
Turbine discharge temperature tt5Afterburner fuel flow wf.b
Exhaust nozzle area A8
Power lever angle position PLA
Engine lubrication pressure E_Lube.P
Table 3. Representative indicator light list.
Parameter Indication
Fan speed
Core speed
Turbine discharge temperature
Engine furl temperature
Fuel tank pressure
Engine lubrication pressure
Engine skin temperature
> Nlmsx
> N2max
> TtSl.n
> Teas...
< Pu_k..,.
< Plob,_
> T_m,,_
control room and by pilots in the cockpit. Strip charts,
CRT's with both digital and graphi'c data, waming
lights, analog gauges, and color panels are all moni-tored in the control room or similar facility while the
pilot monitors his engine gauges in the cockpit.
As can be seen in Tables 1 and 2, the total number
of parameters and conditions that must be monitored
is not overwhelming, but there is a sufficient num-
ber so that a novice would have difficulty providing
adequatereal-time monitoring. The task ofmonitor-
ing individual parameters and conditions is only one
part of the propulsion system engineer's responsibil-
ity. Additionally, the propulsion engineer must also
recognize and correctly identify a number of systems-
level anomalies that require understanding of a pattern
in severalparameters simultaneously. The recognition
of a systems-level anomaly and the correct identifica-
tion of that condition is essential for a corrective or pre-
ventative acdon and for communication with the pilot.
Another problem is that the control rooms are
usually limited in the number and type of strip

• , J
charts, cathode-ray tube (CRT) displays, and warning
lights. As aircraft and engines increase in complexity,
changes nced to be made to these displays.
In order to ease some of the burden on the propulsion
engineer, the NASA Ames Research Center's Dryden
Flight Research Facility has been investigating meth-
ods to aid in the monitoring pmeess. Expert systems
provide a means of increasing the propulsion engi-
neer's productivity by taking over some of the mow
itoring ffmctions. By using expert system's technol-
ogy, the experience of several propulsion engineerscan be used.
This work was based on knowledge gained from
previous work done on an expert system flight statusmonitor 1-3 and is similar in function to the expert sys-
tem for shuttle mission control. The program docu-
mented here was developed to support the F-18 high-
angle-of-attack research vehicle program.
This paper describes a preliminary version of an ex-
pert system engine monitor that aids the propulsion en-
gineer with many monitoring tasks. In order to evalu-
ate the preliminary version, data from the F404 engine
in the X-29A forward-swept wing was used.
System Description
Engine Description
The F404 engine is a low bypass axial-flow turbo-
fan with afterburner. The three-stage fan (low pres-
sure compressor) is driven by a single-stage turbine.
Approximately one-third of the fan discharge air is
bypassed to the afterbumer for combustion and cool-
ing. The seven-stage, high-pressure compressor is also
driven by a single-stage turbine. The first- and second-
stage compressor stators'are variable. Fourth-stage
compressor air is used by the engine's anti-ice system.
A set of variable inlet guide vanes are mounted in front
of hoth the fan and compressor to direct the inlet air at
the best angle for the existing engine operation.
Atomized fuel and compressor discharge air is
mixed and ignited in the combustion chamber. These
ignited gases then pass through the compressor and
fan turbines and out the engine exhaust. Afterburner
operation uses added atomized fuel mixed with the
compressor discharge gases and the bypass fan dis-
charge air to produce additional thrust. The military
(nonafterbuming) thrust of each engine is approxi-
mately 10,700 lb with maximum afterburner thrust in
the 16,000-1b class.
The electrical control assembly, variable exhaust
nozzles, main fuel control, and afterburner control pro-
vide coordinated operation of the engine throughout
the flight envelope. The engine accessory gearbox,
driven by the compressor rotor, powers the lubrica-
tion and scavenge oil pumps, variable exhaust nozzle
power unit, alternator, main fuel pump and control, and
afterburner fuel pump and control.
During development there was no available F-18
data to test the intelligent computer assistant for en-
gine monitoring (ICAEM). The only F-404 engine dataavailable at the time was from the X-29. Since the
X-29 has only one engine as opposed to two engines
for an F-18, telemetry data was mapped to both en-
gine displays (Figs. 5-6). In this way actual flight data
could be used for testing ICAEM.
Current Monitoring System
Figure 2 shows how monitoring is currently being
done at Ames-Dryden. Radar tracking and teleme-
try tracking devices pass information to the telemetry
and radar acquisition processing system. Data is thentransmitted to the control room to drive CRT displays,
indicator lights, strip chart recorders, and color pan-els. There is much data, but little information. The
propulsion engineer is required to process the data into
useful information. Since the knowledge required to
transform the data into information is in the engineer's
mind. a senior-level propulsion engineer is required to
perform this task.
ICAEM Description
Figure 3 shows how monitoring is done with
ICAEM. Telemetry and radar information are received
as before. However, rather than having data sent to dif-
ferent devices as before, real-time data are lransrnitted
to a single workstation through a local area network
using a standard protocol.
There are many advantages to the new system. The
most important advantage is that the programmable
workstation has the capability to put some of the en-
gineers' knowledge into the system. This is clone
through the use of expert systems which use the declar-
ative knowledge contained in rules that evaluate the
system being monitored. In this way data, as well
as useful information, is displayed to the user. Also,
use of programmable workstations for graphic displays
substantially reduces the workload, allows for sophis-
ticated graphics without impacting the critical acqui-
sition software, and provides greater flexibility in dis-
play design and reconfiguration. 4

Description of Internal Structure of ICAEM
The overall internal structure of ICAEM is shown
in Fig. 4. The main portion of ICAEM is a program
that acts as an interface between the telemetry data be-
ing provided by way of Ethernet and the expert system.
Once given data, the expert system decides if any con-
dition exists that the engineer needs to know. If so, that
information is sent to another program that displays the
necessary information to the engineer.
When telemetry data is received, the main program
asserts a fact into a fact base in the expert system. Once
enough facts are generated to match the conditions of
a rule, the rule is "fired." For example, consider a rule
in the expert system such as one to monitor a potentialhung start:
If
Starting engine and
N2 is less than 60 percent and
N2 is not increasing for 1 sec and
PLA is greater than 14 and less than 24,
then
Engine state is Potential Hung Start.
or
If
Starting engine and
N2 is less than 60 percent for 35 sec,
then
Engine state is Potential Hung Start.
This warns the engineer of the danger of a hung start
before the hung start actually takes place. The main
program receives telemetry data for many parameters
including those needed for the above rules. It then as-
serts facts into the expert system fact base. The expert
system looks at all the facts being asserted, and if ev-
ery condition in the rulc is satisfied, it "fires" that rule.
The consequent of the rule is then passed to the display
program so that the engineer will receive the necessaryinformation. If any condition is not satisfied, the taleis not fired.
The expert system used in ICAEM is the C Lan-
guage Production System (CLIPS) inference engine
produced by the Mission Planning and Analysis Di-
rectorate of NASA's Johnson Space Center. 5 The pri-
mary representation methodology used in CLIPS is
a forward-chaining rule language based on the Retealgorithm. _ CLIPS was chosen because it was written
in the "C" language and was designed to be embedded
within an application. This is a very important featurefor this project because of the need to interface the in-
4
ference engine to a real-time application written in a
procedural language. Other expert systems exist but
provide no means of interfacing since they provide a"total environmenL"
Using the rule-based expert systems approach al-
lows gathering and implementing the propulsion en-
gineer's knowledge very quickly, which in turn allows
quick feedback on the quality of the knowledge cap-
tured in the expert system and quickly raises the qual-
ity level with just a few iterations.
Overview of ICAEM's Capabilities
Determining Engine Operational State
The main functions to be performed by the propul-
sion system expert system are monitoring, anomaly
classification, and both normal and recovery proce-
dun: aiding.
The monitoring task involves the followingfunctions:
. Determination of engine operating state
• Detection of parameters whose value has ex-ceeded limits
• Detection of the rates of change of parameters
• Prediction of trends
• Timing of duration of parameters outside of limits
This information is then used to identify any anoma-
lous system behavior (see Identification of Anomalies)
and, when this behavior corresponds to a predefined
pattern of behavior, to identify the type of anomalous
behavior being exhibited by the propulsion system.
Two types of anomalous behavior must be identi fled by
the system: single parameter and systematic. Single
parameter anomalies are those in which a parameter
exceeds a limit or exceeds a limit for too long a period.
Systematic anomalies are those in which the propul-
sion system exhibits anomalous behavior in multiple
parameters in some pattern.
The system is partitioned by engine states asfollows:
• Ground start
s Normal ground operation
s Take-off

• Normal flight operation
• Air_aR
Partitioning in this way allows partitioning the rules
in a similar manner so that only the rules within each
partition will fire at one time, thus significantly reduc-
ing the processing time for the expert system.
Within each of the above partitions, ICAEM mon-
itors only those parameters and rules associated with
that state. In the ground start state, for example,t.
ICAEM monitors for engine start, power level angle
(PLA) to ground idle, lite-off and normal start, hung
start, or hot start.
Given any state, ICAEM monitors only those pa-
rameters necessary. Some parameters, however, are
always monitored whether or not they are displayed.
For instance, engine lubrication pressure (E.Lube.P)
is a parameter that is always monitored, whereas Nz is
only monitored when E.Lube_P is out of limits (that
is, E_Lube_P is usually disregarded if Nz is less than
0.5 0's).
.... _dentification of Anomalies
The primary function of propulsion system moni-
3ring is the detection of system anomalies. These
nomalies faU into the categories of "'system anoma-
es" and "engine anomalies." System anomalies are
bnormal operation within the total propulsion system
_t external to the gas generator and afterburner. En-
ne anomalies are those that occur within the gas gen-
ator. Whenever any of these anomalies occur, they
ust be correctly identified and appropriate correctivefion taken.
The anomalous system _onditions that must be de-ted are:
) excessive engine fuel temperature
, high or low engine fuel pressure
engine compartment overheating
low or high oil pressure
excessive oil temperature
_e anomalous engine conditions that must be de-d are:
stagnation
s hot start
s hung start
• engine overtemp
• engine star
• engine failure
• engine overspeed
• afterburner malfunction
• engine flameout
Some of these anomalies are not presently moni-tored. Methods to monitor them are still in the devel-
opment stage. At present, monitoring is being done for
hot start, hung start, engine stall, and engine overtemp
for the engine anomalies, and low lubrication pressure
for the system anomalies.
Procedural Aiding
As stated earlier, it was convenient to distinguish
between five specific conditions: ground start, nor-
mal ground operation, take-off, normal flight oper-ation, and airstart. Associated with each of these
conditions or "modes" is a set of anomalous condi-
tions to watch for and a corresponding procedure for
each anomaly.
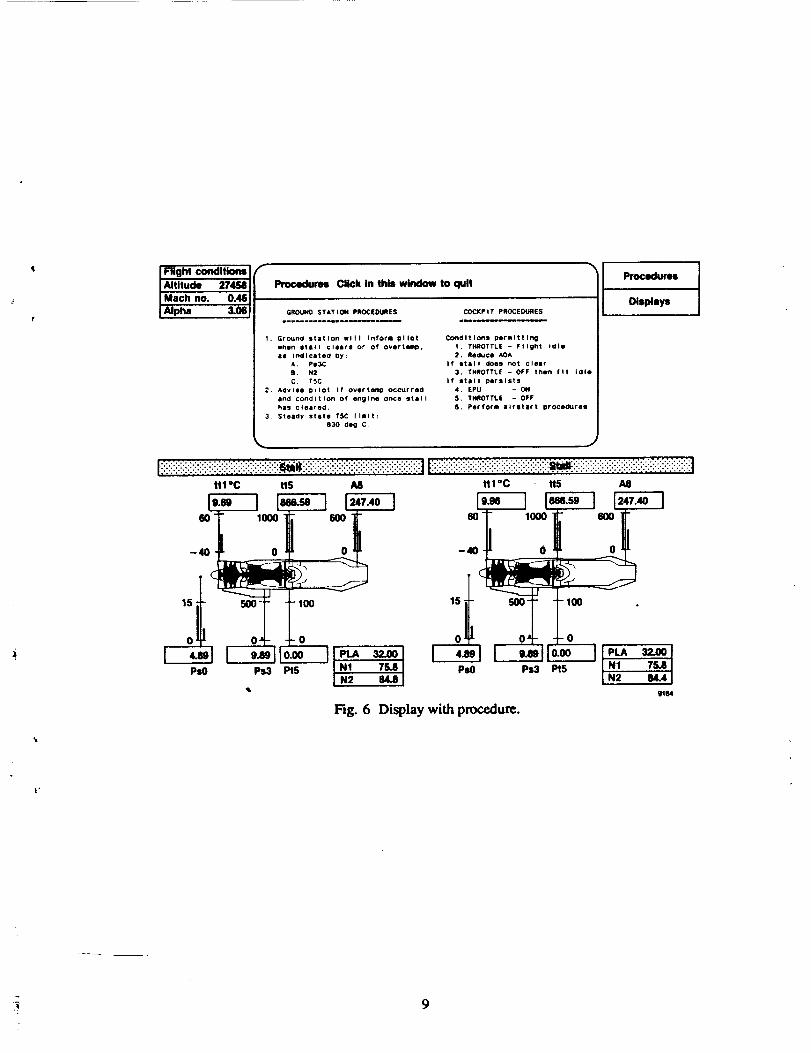
In the ground start mode, monitoring is being donefor a hot start and a hung start. If there is a hot start
or a hung start, a window will appear at the top of the
display containing two sets of procedures. One is a
ground station procedure for this particular condition
and the other is a cockpit procedure. These proce-
dures are taken directly from the flight manual. Fig-
ure 6 shows the procedures display for a stall. Besides
having the ability to bring up the procedures automat-
ically on an anomaly, the user also has the ability to
bring up any procedure he wishes in order to review it
at any time.
Information Displays
The display or user interface serves to enhance the
propulsion engineer's processing of data. Typically, a
propulsion engineer must process a textual data screen
from which a mental model of the corresponding sub-
systems is built. ICAEM reduces the mental process-
ing time and reduces the data monitoring load.
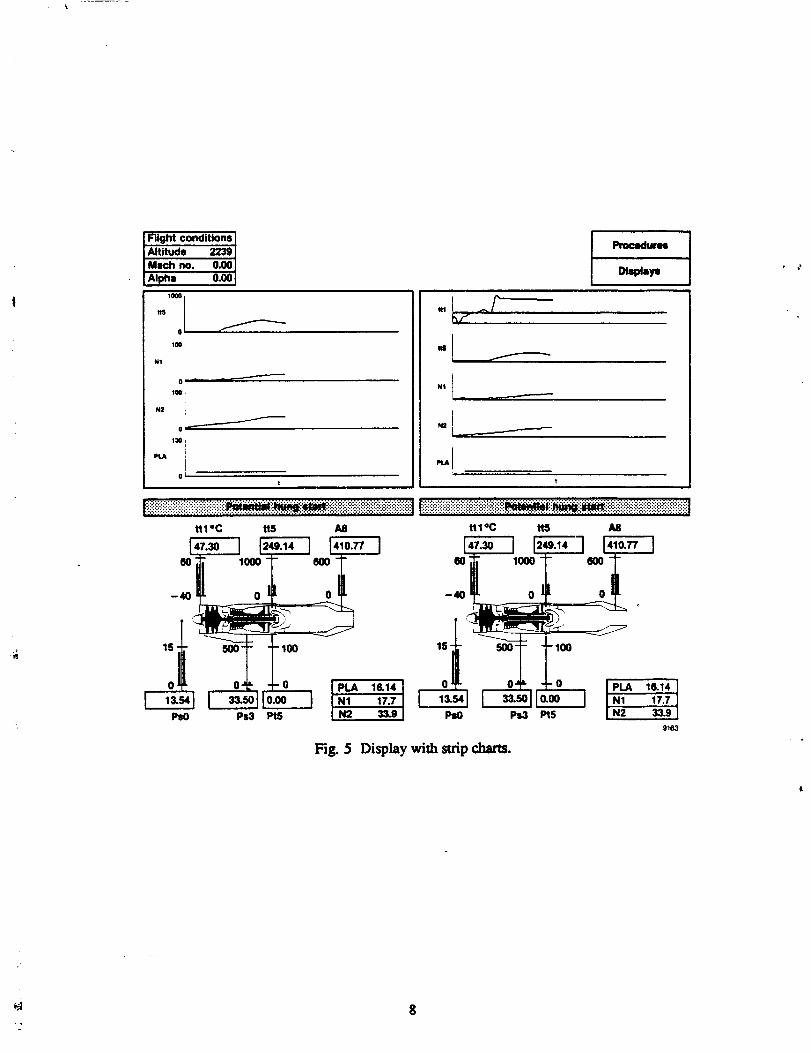
The ICAEM display is partitioned into three ma-
jor sections (Fig. 5). The bottom portion of the dis-
play shows a cross-sectional view of two engines--left

shows a cross-sectional view of two engines--left and
right. This section of the display shows parameters
that are always monitored. Thermometer-like displays
are at respective engine stations. The right vertical bar
(blue) indicates the actual value of a given parameterwhile the left vertical bar (green) indicates a predicted
value of the same parameter. This predicted value is
based on a number of previous data samples and in-
dicates a trend (for example, if the predicted value is
consistently higher than the actual value, it indicates
the value has been increasing). The box containing
digital data at each station will change to yellow when
the parameter is near a predetermined limit and will
turn red when the parameter reaches that limit.
The center display is two colored horizontal bars
containing text. These bars show the actual state of
the engine. Any nominal condition is displayed with a
green background, while a warning condition or a con-
dition of potential concern is displayed with a yellow
background. Any serious condition is displayed with
a red background. The center display is used to mon-
itor the status of the engine. As shown previously, in
a normal ground start the following statuses would be
shown as they occur:.
• Starting engine
• PLA to ground idle
• Lite-off
• Normal start
The top portion of the display is used to show user-
requested information. Using a mouse, the user may
request strip charts on any parameter desired and/or
pop up a display with a procedure on it, or turn off a
parameter believed to be an erroneous sensor or faulty
telemetry data.
The strip chart displays resemble conventional pen-
and-ink recorders (Fig. 5). The engineer may call
up as many parameters on this display as desired--
not just predetermined parameters as before. Signal
traces are displayed and tagged with limits. The strip
charts demonstrate how a current capability need not
be lost but can be provided in a better form while still
making use of the propulsion engineer's training and
experience.
The top portion of the display is also used for pro-
cedures (Fig. 6). At any time, the user may bring
up a display that shows the procedures required of
the engineer on the ground and the necessary proce-
dures required of the pilot in any given anomalous
situation. The procedural displays also pop-up au-
tomatically when an anomaly is encountered by the
expert system.
There are conceivably times when a propulsion en-
gineer is aware that some data must be disregarded.
It may be obvious from the data displayed that a cer-tain sensor is bad and the information received is er-
roneous. In that case, the engineer can, in effect, turn
off the sensor. The expert system stops using that pa-
rameter's information, and data for that parameter is
not displayed.
Conclusion
This document presents a preliminary version of a
propulsion system expert system that was developed
for monitoring and procedural aiding in support of the
F-18 high-angle-of-attack research vehicle program.
This expert system is designed to operate as an "ex-
pert aide" to an engineer with attic or no experience in
propulsion system monitoring. The goal of this expert
system development project is to relieve the propulsion
engineer of the time-consuming, but necessary, task of
propulsion system monitoring on flight programs with
nonexperimental engines. The intelligent computer as-sistant for engine monitoring provides a better moni-
toting environment because it uses the knowledge and
experience of several propulsion engineers. It is al-
ways attentive and never distracted as a human may
be. And the system displays information, not raw data,
therefore enhancing safety of flight and improving the
engineer's efficiency in propulsion system monitoring.
References
! Duke, Eugene L. and Regenie, Victoria L., De-
scription of an Experimental Expert System Flight Sta-
tus Monitor, NASA TM-86791, 1985.
2 Disbrow, James D., Duke, Eugene L., and Rege-
rile, Victoria L., Development of a Knowledge Acqui-
sition Tool for an Expert System Flight Status Monitor,
AIAA paper 86-0240, 1986.
3Regenie, Victoria A. and Duke, Eugene L., Design
of an Expert System Flight Status Monitor, NASA TM-
86739, 1985.
4Nesel, Michael C. and Hammonds, Kevin R., Real-
Time Test Data Distribution and Display, NASA TM-
100424, 1988.
6
• ¢

5 CLIPS Reference Manual Version 4.2 of CLIPS,
Artificial Intelligence Section, Lyndon B. Johnson
Space Center, JSC-22948, April 1988.
6 Forgy, Charles L., "Rete: A Fast Algorithm for the
Many Pattern/Many Object Pattern Match Problem,"
Artificial Intelligence 19 (1982), pp. 17-37.
Radar
tracking
Z_ Telemetrytracking
Telemetry and _ Ethemet Iradar acquisition se_er
system process
Left status I
III
II II
Right status I
I1 I
II IIWorkstation
Propulsion engineer
9161
Fig. 3 ICAEM system.
ECN 15891
Fig. 1 Control room.
i I
Telemetry
_/_ tracking I
-3.Radar
tracking
l CRT
formatted
displays CRT I
Iormatted
displays
Knowledge
Telemetry and
radar acquisition
system
Indicator Jlights
Strip charts J
Propulsion engineer9160
Fig. 2 Current system.
I Main I Etheme_ICAEM
program I
Fig. 4 Internal structure.
Telemetry I
and radar
computers
Time
historydata file
Used for
testing
9162
7
Flight conditions I
Altitude_ 2239 I
Mach no. 0,00 l
Ai_,, o._ I
100 q
oI -
1(10,
N2 i
0 _--r
I
0 _
N1 __ _
ttl *C ttS All
-40 0
-100
.o t, _1N1 17.7
PS0 PS3 Pt5 N2 33.9
it1 °C ItS A8
-__._ o, _._ .
15_ _---_ "_100
o'p -I-O I PLA 16.14
Ps0 Ps3 ItS I N2 33.9
9163
Fig. 5 Display with strip charm.

NASANIIIO'_ _=mnaul¢_ aria
Report Documentation Page
1. Report No.
NASA TM-101702
2. Government Ar._=_ No.
4. Title end Subtitle
Preliminary Development of an Intelligent Computer Assistant
for Engine Monitoring
7.
9,
12.
Author(=)
James D. Disbrow (PRC Systems, Inc.); Eugene L. Duke and
Ronald J. Ray (NASA Ames Research Center)
Performing Organization Name and Addmes
NASA Ames Research Center
Dryden Flight Research FacilityP.O. Box 273, Edwards, CA 93523-5000
Spon_ring Agency Name and Addm_
National Aeronautics and Space Administration
Washington, DC 20546
3. I_¢ioiem'= Catalo¢No.
5. Report DIeD
August 1989
6. Perfom_ng Orgimi_tion Code
8. PerformingOrpnizationReportNo.
H-1553
10. Work Unit No.
RTOP 505-66-71
11. Contract or Grant No.
13. Type of Report and Period Coveted
Technical Memorandum
14, Sponm)rblg Agency Code
15. Supp4ementary Notes
Prepared as AIAA 89-2539 for presentation at AIAA/ASME/SAE/ASEE Joint Propulsion Conference,
Monterey, California, July 10-12, 1989.
16. Abstract
This paper presents the preliminary development of a method for monitoring the propulsion system and
identifying correct recovery procedures for the F404 engine in support of the F-18 high-angle-of-attack
research vehicle program. By using artificial intelligence techniques and modem display technology, we
have been able to design a system that aids in real-time monitoring of propulsion systems. This expert
system is designed to operate as an "expert aid" to an engineer with little or no experience in propulsion
system monitoring. The goals of this expert system development project are to provide enhanced safety
of flight and to relieve the propulsion engineers of the time-consuming but necessary task of propulsion
system monitoring on flight programs, particularly those with nonexperimental engines. As telemetry data
is received, the results are continually being displayed to the engineer in a unique manner. The engineer
has the choice of a number of different color graphical displays he may use. These include being able to
monitor the engine state, monitor individual parameters and watch time histories or strip chart displays.
When an anomaly is identified, that information is displayed to the engineer. Any additional information is
also displayed, such as the procedures necessary to recover from the anomaly.
17. Key Words (Suggested by Author(l))
Expert systems
Propulsion monitoring
18. D,mtributlon Statement
Unclassified -- Unlimited
19. S,K;urity Clmmif. (of th.z report)
Unclassified20. Security Clam_. (of this page)
Unclassified
Subject category 63
21. No. of pages 22. Price
12 A02
NASA FORM 1826 OCT 86
cIAltitude 274581I Mach no. 0.45 I
IAI_, _U_!
Procedures Click in this window to quit
GROUNO STATION pROCEDURES
..........--....--.----..
1. Ground station will Inforl pilot
wheo stall clears or of oveFtaln_.
aa Indicated Py:
*. Ps3¢
8. N2
C. T$C
2. advise pilot if overtomO occurred
and condltton of engine once stall
his cleared.
3. Steady stats TSC limit:
830 dog C,
COCXPIT PROCEDURES
C_dltlons permittltlg
I. THROTTLE - Flight Idle
2. Reduce AOA
If Stall does not clear
3. THROTTLE - OFF then fit Idle
If stall persists
4. EPU - ON
S. THROTTLE - OFF
6. Perform aircraft proce4ures
Procedures
Displays
_!ii!iii!i!!ii_!_!!ii!_iiiiii!iii!iiii!!!i!i!i!!i_i_i_iiii!!!!!ii!i!iii!i!iii!iii!!!!ii!iii!ii_i_i_|Iiiiiiiiiiiii!i!iii!!!!ii!!_ii!!i!ii!!i!i!i!i_iiii_r.iii!iiiiiiii_ii!!iiiii_iiiiii!iii!!iii!i!iiiiiiii1t11°C it5 A8ttl °C itS All
-- -- 5PSO Ps0 Ps3 Pt5 N1 7_8
N2 8dL4
• 9164
Fig. 6 Display with procedure.
9

r
I
-L