Embed Size (px)
Citation preview
7/29/2019 Preliminary data 4Q12
http://slidepdf.com/reader/full/preliminary-data-4q12 1/2
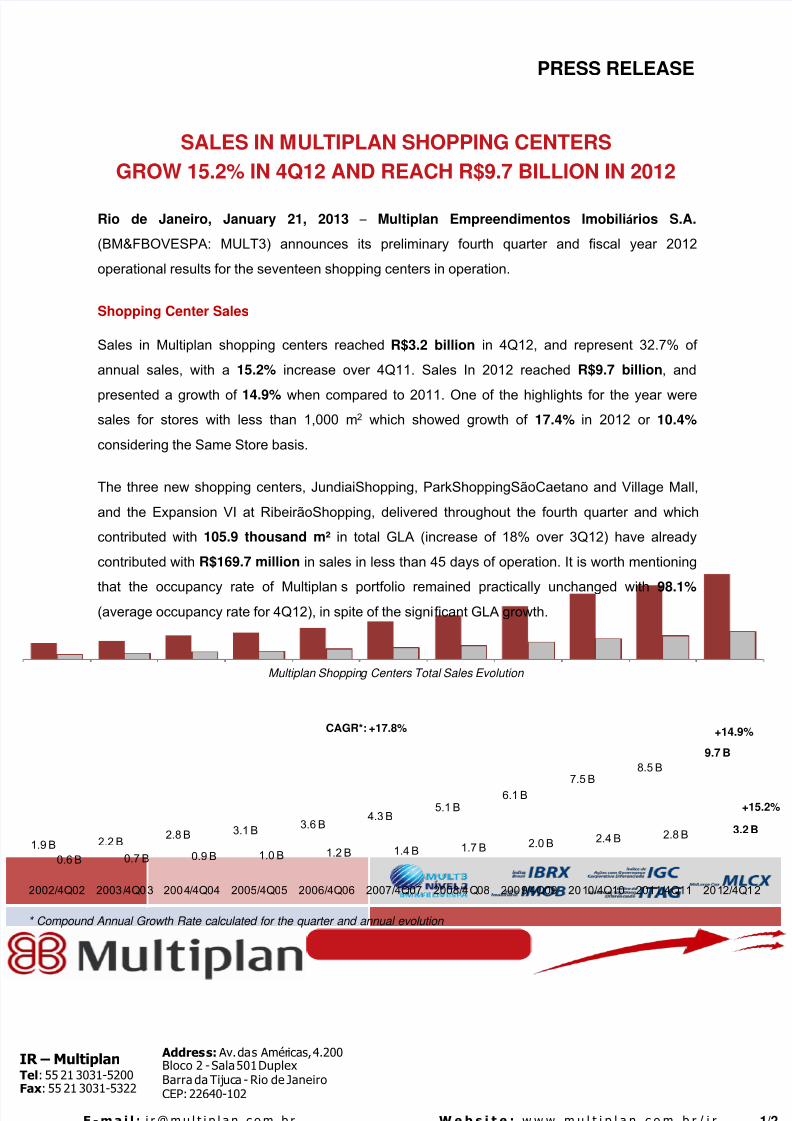
1.9 B 2.2 B2.8 B 3.1 B
3.6 B4.3 B
5.1 B6.1 B
7.5 B8.5 B
9.7 B
0.6 B 0.7 B 0.9 B 1.0 B 1.2 B 1.4 B 1.7 B 2.0 B 2.4 B 2.8 B 3.2 B
2002/4Q02 2003/4Q03 2004/4Q04 2005/4Q05 2006/4Q06 2007/4Q07 2008/4Q08 2009/4Q09 2010/4Q10 2011/4Q11 2012/4Q12
CAGR*: +17.8% +14.9%
+15.2%
Rio de Janeiro, January 21, 2013 – Multiplan Empreendimentos Imobiliários S.A.
(BM&FBOVESPA: MULT3) announces its preliminary fourth quarter and fiscal year 2012
operational results for the seventeen shopping centers in operation.
Shopping Center Sales
Sales in Multiplan shopping centers reached R$3.2 billion in 4Q12, and represent 32.7% of
annual sales, with a 15.2% increase over 4Q11. Sales In 2012 reached R$9.7 billion, and
presented a growth of 14.9% when compared to 2011. One of the highlights for the year were
sales for stores with less than 1,000 m2 which showed growth of 17.4% in 2012 or 10.4%
considering the Same Store basis.
The three new shopping centers, JundiaiShopping, ParkShoppingSãoCaetano and Village Mall,
and the Expansion VI at RibeirãoShopping, delivered throughout the fourth quarter and which
contributed with 105.9 thousand m² in total GLA (increase of 18% over 3Q12) have already
contributed with R$169.7 million in sales in less than 45 days of operation. It is worth mentioning
that the occupancy rate of Multiplan´s portfolio remained practically unchanged with 98.1%
(average occupancy rate for 4Q12), in spite of the significant GLA growth.
SALES IN MULTIPLAN SHOPPING CENTERS
GROW 15.2% IN 4Q12 AND REACH R$9.7 BILLION IN 2012
Multiplan Shopping Centers Total Sales Evolution
* Compound Annual Growth Rate calculated for the quarter and annual evolution
IR – MultiplanTel: 55 21 3031-5200Fax: 55 21 3031-5322
Address: Av. das Américas, 4.200Bloco 2 -Sala 501 DuplexBarra da Tijuca - Rio de JaneiroCEP: 22640-102
E -ma i l : i r @ m u l t i p l a n . c o m . b r We b s i t e : w w w . m u l t i p l a n . c o m . b r / i r 1/2
PRESS RELEASE
7/29/2019 Preliminary data 4Q12
http://slidepdf.com/reader/full/preliminary-data-4q12 2/2
Armando d’Almeida Neto
CFO and IRO
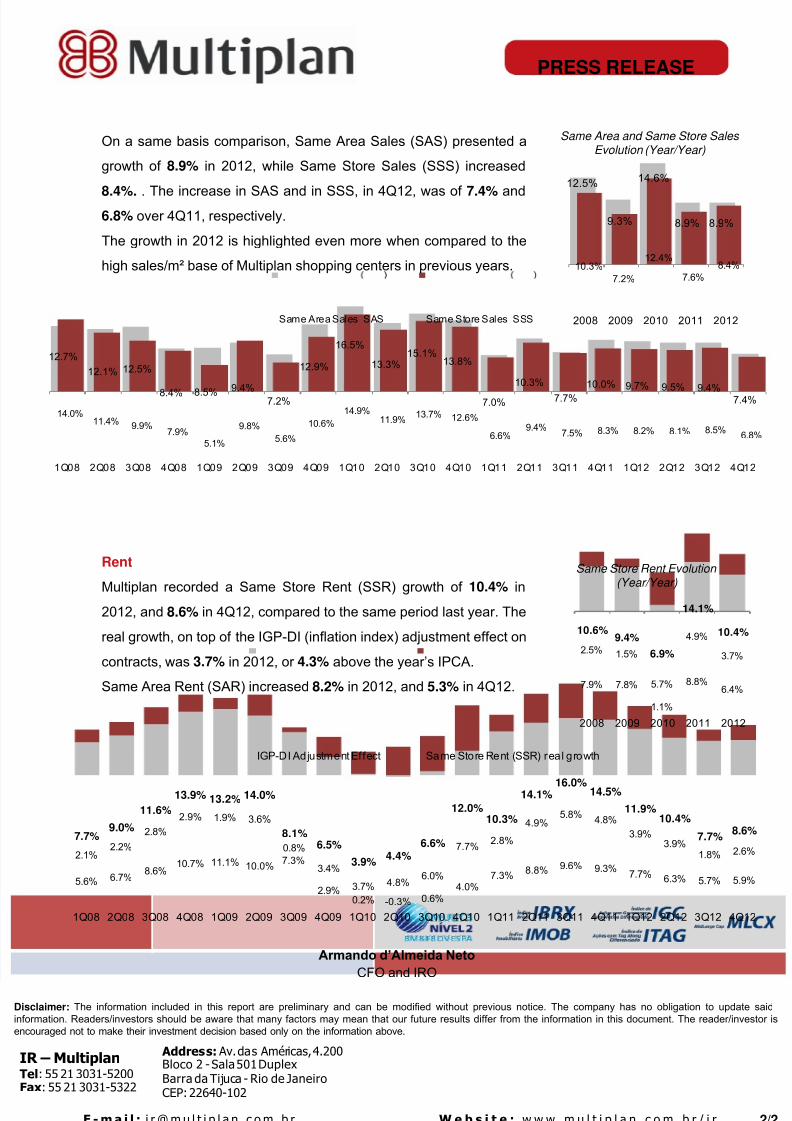
Rent
Multiplan recorded a Same Store Rent (SSR) growth of 10.4% in
2012, and 8.6% in 4Q12, compared to the same period last year. The
real growth, on top of the IGP-DI (inflation index) adjustment effect on
contracts, was 3.7% in 2012, or 4.3% above the year’s IPCA.
Same Area Rent (SAR) increased 8.2% in 2012, and 5.3% in 4Q12.
Same Store Rent Evolution (Year/Year)
IR – MultiplanTel: 55 21 3031-5200Fax: 55 21 3031-5322
Address: Av. das Américas, 4.200Bloco 2 -Sala 501 DuplexBarra da Tijuca - Rio de JaneiroCEP: 22640-102
E -ma i l : i r @ m u l t i p l a n . c o m . b r We b s i t e : w w w . m u l t i p l a n . c o m . b r / i r
Disclaimer: The information included in this report are preliminary and can be modified without previous notice. The company has no obligation to update said
nformation. Readers/investors should be aware that many factors may mean that our future results differ from the information in this document. The reader/investor is
encouraged not to make their investment decision based only on the information above.
On a same basis comparison, Same Area Sales (SAS) presented a
growth of 8.9% in 2012, while Same Store Sales (SSS) increased
8.4%. . The increase in SAS and in SSS, in 4Q12, was of 7.4% and6.8% over 4Q11, respectively.
The growth in 2012 is highlighted even more when compared to the
high sales/m² base of Multiplan shopping centers in previous years.
Same Area and Same Store Sales Evolution (Year/Year)
PRESS RELEASE
2/2
12.5%
9.3%
14.6%
8.9% 8.9%
10.3%
7.2%
12.4%
7.6%
8.4%
2008 2009 2010 2011 2012
12.7%
12.1% 12.5%
8.4% 8.5% 9.4% 7.2%
12.9%
16.5%
13.3%15.1%
13.8%
7.0%
10.3%
7.7%
10.0% 9.7% 9.5%9.4% 7.4%
14.0%11.4%
9.9%7.9%
5.1%
9.8%
5.6%
10.6%
14.9%11.9%
13.7% 12.6%
6.6%9.4%
7.5% 8.3% 8.2% 8.1% 8.5%6.8%
1Q08 2Q08 3Q08 4Q08 1Q09 2Q09 3Q09 4Q09 1Q10 2Q10 3Q10 4Q10 1Q11 2Q11 3Q11 4Q11 1Q12 2Q12 3Q12 4Q12
Same Area Sales SAS Same Store Sales SSS
7.9% 7.8%
1.1%
8.8%6.4%
2.5% 1.5%
5.7%
4.9%
3.7%
10.6%9.4%
6.9%
14.1%
10.4%
2008 2009 2010 2011 2012
5.6% 6.7%8.6%
10.7% 11.1% 10.0%7.3%
2.9%0.2% -0.3% 0.6%
4.0%7.3%
8.8% 9.6% 9.3%7.7% 6.3% 5.7% 5.9%
2.1%2.2%
2.8%
2.9% 1.9% 3.6%
0.8%
3.4%
3.7% 4.8%6.0%
7.7%2.8%
4.9%5.8%
4.8%
3.9%3.9%
1.8% 2.6%
7.7%9.0%
11.6%
13.9% 13.2% 14.0%
8.1%
6.5%
3.9%4.4%
6.6%
12.0%
10.3%
14.1% 16.0% 14.5%
11.9%10.4%
7.7%8.6%
1Q08 2Q08 3Q08 4Q08 1Q09 2Q09 3Q09 4Q09 1Q10 2Q10 3Q10 4Q10 1Q11 2Q11 3Q11 4Q11 1Q12 2Q12 3Q12 4Q12
IGP-DI Adjustment Effect Same Store Rent (SSR) real growth