Embed Size (px)
Citation preview
Nordisk kernesikkerhedsforskningNorrænar kjarnöryggisrannsóknir
Pohjoismainen ydinturvallisuustutkimusNordisk kjernesikkerhetsforskning
Nordisk kärnsäkerhetsforskningNordic nuclear safety research
NKS-97 ISBN 87-7893-156-8
Preliminary condensation pool experiments with steam using
DN80 and DN100 blowdown pipes
Jani Laine & Markku Puustinen Lappeenranta University of Technology, Finland
March 2004
Abstract The report summarizes the results of the preliminary steam blowdown experi-ments. Altogether eight experiment series, each consisting of several steam blows, were carried out in autumn 2003 with a scaled-down condensation pool test rig designed and constructed at Lappeenranta University of Technology. The main purpose of the experiments was to evaluate the capabilities of the test rig and the needs for measurement and visualization devices. The experiments showed that a high-speed video camera is essential for visual observation due to the rapid condensation of steam bubbles. Furthermore, the maximum measurement frequency of the current combination of instrumentation and data acquisition system is inadequate for the actual steam tests in 2004. Key words Steam blowdown experiments, SAFIR, Poolex, high-speed video camera NKS-97 ISBN 87-7893-156-8 Electronic report, March 2004 Published by NKS Secretariat NKS-775, Box 49 DK – 4000 Roskilde, Denmark Phone +45 4677 4045 Fax +45 4677 4046 www.nks.org e-mail [email protected]
1
PREFACE The condensation pool studies started in Nuclear Safety Research Unit at Lappeenranta University of Technology (LUT) in 2001 within the FINnish research programme on NUclear power plant Safety (FINNUS). The tests were designed to correspond to the conditions in the Finnish BWRs and the test programme was partially funded by Teollisuuden Voima Oy (TVO). In these tests, the formation, size and distribution of non-condensable gas bubbles in the condensation pool was studied experimentally with a scaled down pool test facility. Also the effect of non-condensable gas on the performance of an ECCS pump was examined. The test conditions were modeled with Fluent CFD-code at VTT. The Fluent simulations were utilized in the planning phase of the tests to select the position, size and number of blowdown pipes. The post-test calculations were carried out for code validation purposes. A new research project called condensation POOL EXperiments (POOLEX) started in 2003 within the SAfety of nuclear power plants - FInnish national Research programme (SAFIR). The POOLEX project continues the work done within the FINNUS programme [1]. In the new tests, steam instead of non-condensable gas is injected into the condensation pool test rig. This study is funded by the Ministry of Trade and Industry (KTM), TVO and Nordic nuclear safety research (NKS).
2
CONTENTS PREFACE NOMENCLATURE 1 INTRODUCTION.................................................................................................. 4 2 TEST FACILITY................................................................................................... 4
2.1 Water pool .................................................................................................... 5 2.2 Steam generator ............................................................................................ 6 2.3 Steam line ..................................................................................................... 6 2.4 Visual observation system ............................................................................ 7 2.5 Instrumentation ............................................................................................. 7
2.5.1 Strain gauges ............................................................................................ 7 2.6 Data acquisition ............................................................................................ 8
3 TEST PROGRAMME ........................................................................................... 9 4 ANALYSIS OF THE EXPERIMENTS............................................................... 11
4.1 Temperatures in the blowdown line ........................................................... 11 4.2 Temperatures in the pool ............................................................................ 12 4.3 Pressures ..................................................................................................... 13 4.4 Steam flow rate and velocity ...................................................................... 15 4.5 Pool water level .......................................................................................... 17 4.6 Strains ......................................................................................................... 17 4.7 Formation of bubbles.................................................................................. 18 4.8 Pool movements.......................................................................................... 19
5 ESTIMATION OF CAPABILITIES OF THE TEST POOL .............................. 20 6 DISCUSSION OF MEASUREMENT AND VISUALIZATION NEEDS ......... 22 7 SUMMARY AND CONCLUSIONS .................................................................. 23 REFERENCES APPENDIXES: Appendix 1: Drawings of the POOLEX test rig Appendix 2: Photographs of the test rig

3
NOMENCLATURE A area c thermal capacity E Young's modulus g gravitational constant k thermal conductivity l length p pressure Q volumetric flow rate Rm tensile strength Rp0.2 proof strength (causes irreversible 0.2%-strain) Rp1.0 proof strength (causes irreversible 1.0%-strain) T temperature v velocity Greek symbols α thermal expansion coefficient ∆ change ε strain ν Poisson's coefficient ρ density σ stress Abbreviations BWR boiling water reactor ECCS emergency core cooling system fps frames per second LOCA loss-of-coolant accident RHS round hollow section
4
1 INTRODUCTION During a possible loss-of-coolant accident (LOCA) a large amount of non-condensable (nitrogen) and condensable (steam) gas will be blown from the upper drywell of the containment to the suppression (condensation) pool through the blowdown pipes at the Olkiluoto type boiling water reactors (BWR). This causes both dynamic and structural loads to the suppression pool. There might also be a risk that the gas discharging to the pool could push its way to the emergency core cooling systems (ECCS) and undermine their performance. The main objective of the POOLEX project is to increase the understanding of different phenomena in the condensation pool during steam injection. These phenomena could be connected to bubble dynamics issues such as bubble growth, upward acceleration, detachment and break-up or to pressure oscillations due to rapid condensation. The investigation of the steam injection phenomenon requires, however, high-grade measuring techniques. For example, to estimate the loads on the pool structures by condensation pressure oscillations the frequency and the amplitude of the oscillations have to be measured. The needs and resources for instrumentation, data acquisition and visualization will be reviewed before detailed steam blowdown tests are planned and carried out. Also, the operational limits of the existing pool test facility have to be find out. A series of preliminary experiments has been carried out with the slightly modified pool test rig to investigate the needs for instrumentation and visualization. Also, the capabilities of the test rig have been evaluated. In this report, the results of the preliminary experiment series are summarized. Chapter two gives a short description of the test facility and its measurements as well as of the data acquisition system used. The test programme is introduced in chapter three. The results of the most interesting experiments are presented and shortly discussed in chapter four. Chapter five gives an estimation of the capabilities and safe operating limits of the test rig. Finally, the observed needs for measurements, data acquisition and visualization are discussed in chapter six.
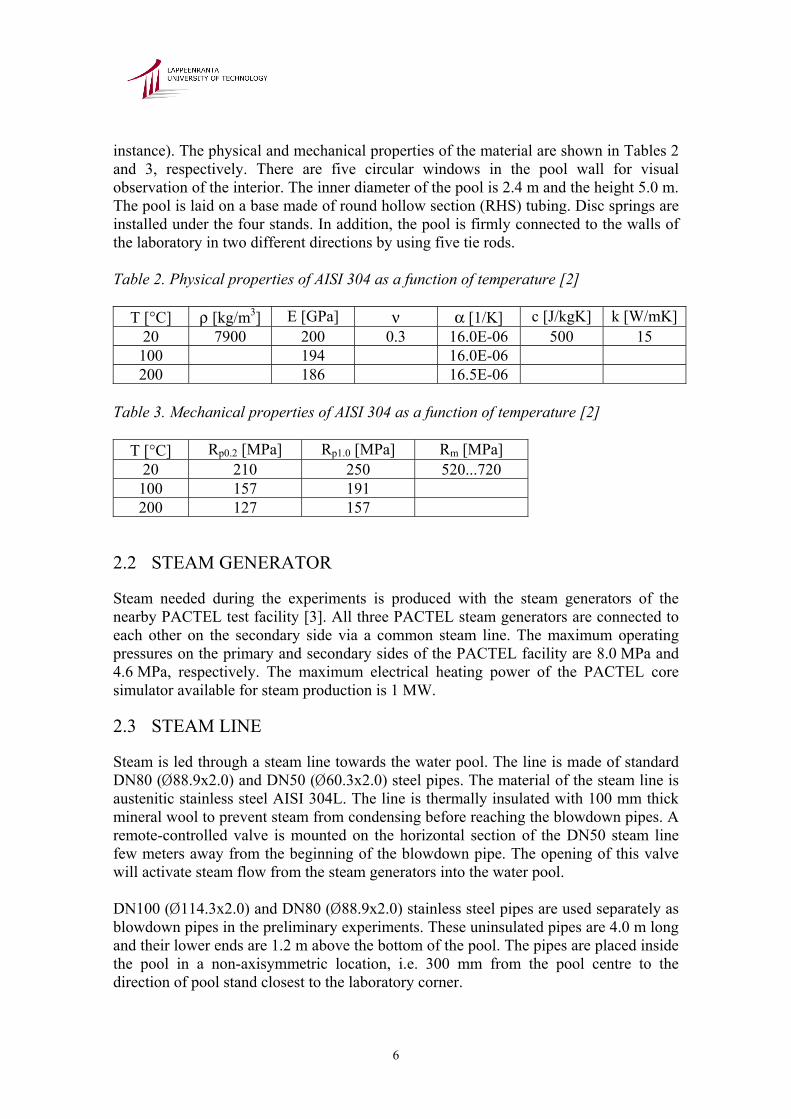
2 TEST FACILITY The main components of the condensation pool test facility are: a large water pool, a steam generator, a steam line, a blowdown pipe, measurement instrumentation and a data acquisition system. Table 1 shows the main dimensions of the test rig. A sketch of the test rig is presented in Figure 1 and all relevant design drawings in Appendix 1.
5
Table 1. Main dimensions of the test rig Steam generator: Maximum steam pressure: 4.6 MPa
Length: 4.0 m Blowdown pipes: Inner diameter (DN80 / DN100): 85 / 110 mm Height: 5.0 m Inner diameter: 2.4 m Total volume: 20.6 m3 Water volume at normal water level of 3.7 m from the bottom:
15.4 m3
Wall thickness: 4 mm
Water pool:
Bottom wall thickness: 5 mm
Steam line DN80
Steam line DN50
PACTEL steam generator
Water pool
Blowdown pipe DN80 or DN100
Vortex flow meter
Blowdown pipe support structure
Windows for visual observation
Throttle valve
Steam line valve
Figure 1. Condensation pool test rig.
2.1 WATER POOL
The test pool is a cylinder shaped pool with an open top and a conical bottom. The material of the pool is AISI 304 austenitic stainless steel (corresponds to EN 1.4301, for
6
instance). The physical and mechanical properties of the material are shown in Tables 2 and 3, respectively. There are five circular windows in the pool wall for visual observation of the interior. The inner diameter of the pool is 2.4 m and the height 5.0 m. The pool is laid on a base made of round hollow section (RHS) tubing. Disc springs are installed under the four stands. In addition, the pool is firmly connected to the walls of the laboratory in two different directions by using five tie rods. Table 2. Physical properties of AISI 304 as a function of temperature [2]
T [°C] ρ [kg/m3] E [GPa] ν α [1/K] c [J/kgK] k [W/mK] 20 7900 200 0.3 16.0E-06 500 15 100 194 16.0E-06 200 186 16.5E-06
Table 3. Mechanical properties of AISI 304 as a function of temperature [2]
T [°C] Rp0.2 [MPa] Rp1.0 [MPa] Rm [MPa] 20 210 250 520...720 100 157 191 200 127 157
2.2 STEAM GENERATOR
Steam needed during the experiments is produced with the steam generators of the nearby PACTEL test facility [3]. All three PACTEL steam generators are connected to each other on the secondary side via a common steam line. The maximum operating pressures on the primary and secondary sides of the PACTEL facility are 8.0 MPa and 4.6 MPa, respectively. The maximum electrical heating power of the PACTEL core simulator available for steam production is 1 MW.
2.3 STEAM LINE
Steam is led through a steam line towards the water pool. The line is made of standard DN80 (¯88.9x2.0) and DN50 (¯60.3x2.0) steel pipes. The material of the steam line is austenitic stainless steel AISI 304L. The line is thermally insulated with 100 mm thick mineral wool to prevent steam from condensing before reaching the blowdown pipes. A remote-controlled valve is mounted on the horizontal section of the DN50 steam line few meters away from the beginning of the blowdown pipe. The opening of this valve will activate steam flow from the steam generators into the water pool. DN100 (¯114.3x2.0) and DN80 (¯88.9x2.0) stainless steel pipes are used separately as blowdown pipes in the preliminary experiments. These uninsulated pipes are 4.0 m long and their lower ends are 1.2 m above the bottom of the pool. The pipes are placed inside the pool in a non-axisymmetric location, i.e. 300 mm from the pool centre to the direction of pool stand closest to the laboratory corner.
7
2.4 VISUAL OBSERVATION SYSTEM
The visual observation system consists of PAL standard devices: four video cameras, two digital videocassette recorders, a quad processor and a color TV. The video cameras are Sony digital video cameras (model SSC-DC318P) at 25 frames per second (fps). The camera views are displayed on 28" color TV. By using a digital color quad processor it is possible to divide the TV screen to four equal size parts and look at the view of four cameras on the same screen. Camera views can be recorded in digital video (DV) format. A video camera - laser pointer system is used for registering the movements (swing, vibration) of the pool. This system is installed to the upper edge of the pool. It consists of two video cameras, two laser pointers and two measuring scale papers.
2.5 INSTRUMENTATION
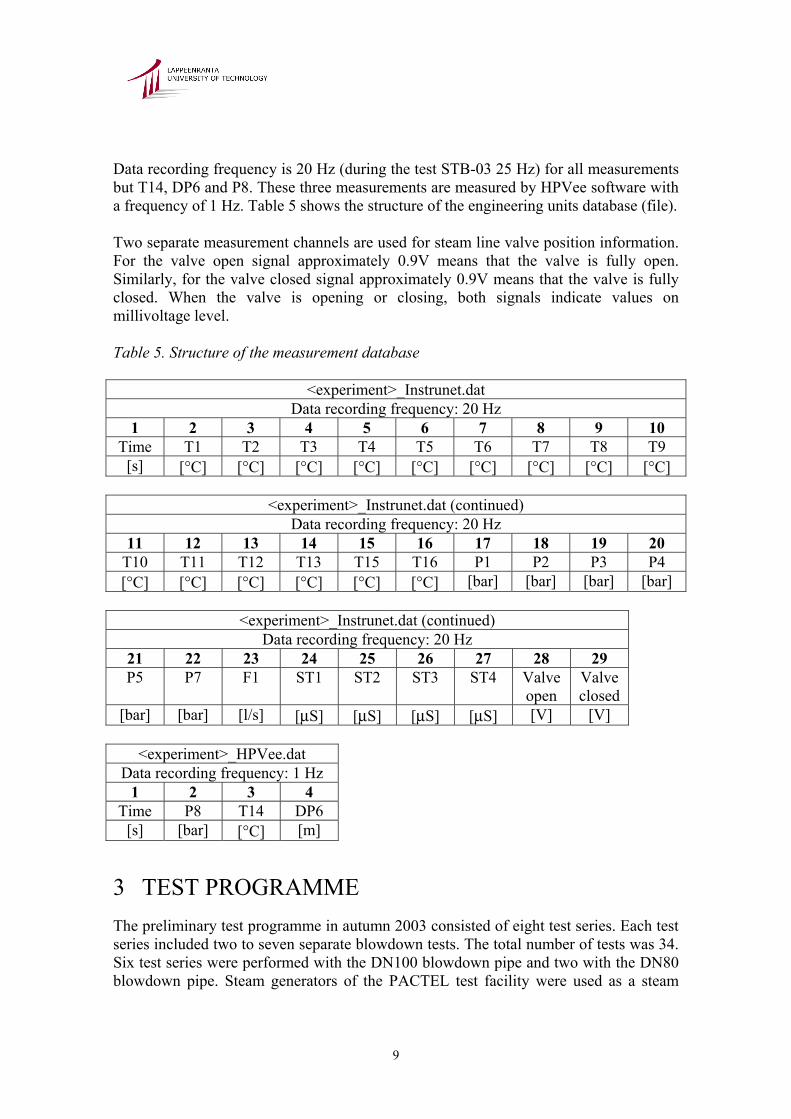
The test facility is equipped with several thermocouples for measuring steam and pool water temperatures (T), with seven absolute pressure transducers (P) for observing pressure behavior in the blowdown pipe and around the pool and with one pressure difference transducer (DP) for detecting water level in the pool. Steam flow rate is measured with a vortex flow meter in the DN50 steam line. Additional instrumentation includes four strain gauges (ST) and valve position sensors. Table 4 lists the identification codes, the locations and the accuracies of the measurements. In appendix 1, the exact locations of all measurements are given. Water level in the pool is calculated from measured pressure difference and water density. The density of water is determined on the basis of temperature measurement T14 at the bottom of the pool.
2.5.1 Strain gauges
Uniaxial foil strain gauges are attached with glue onto the outside wall of the pool, both above and below the rounding between the pool wall and bottom. The gauge length and width are 5.0 mm and 1.4 mm, respectively. Two of the gauges measure strains in circumferential direction and two in axial direction. A photograph of the strain gauge installation can be found in Appendix 2. The strain is defined as follows:
ll∆=ε , (1)
where ∆l is the change in length and l is the initial length. According to Hooke's law stress values can be solved: εσ E= , (2)
8
where E is Young's modulus (200 GPa for the pool material at 20°C, see Table 2). Table 4. Measurement instrumentation Code Location Accuracy T1 Blowdown pipe ±3.6°C T2 Blowdown pipe ±3.6°C T3 Blowdown pipe ±3.6°C T4 Pool ±3.6°C T5 Pool ±3.6°C T6 Pool ±3.6°C T7 Pool ±3.6°C T8 Pool ±3.6°C T9 Pool ±3.6°C T10 Pool ±3.6°C T11 Pool ±3.6°C T12 Pool ±3.6°C T13 Steam line ±3.6°C T14 Pool ±2.7°C T15 Pool bottom ±3.6°C T16 Pool outer wall ±2.7°C P1 Blowdown pipe ±9 kPa P2 Blowdown pipe ±9 kPa P3 Blowdown pipe ±9 kPa P4 Pool wall ±9 kPa P5 Pool ±2 kPa
DP6 Pool ±0.06 m P7 Steam line ±94 kPa P8 Steam generator ±60 kPa F1 Steam line ±4.9 l/s
ST1 Pool bottom Not defined ST2 Pool bottom Not defined ST3 Pool bottom Not defined ST4 Pool bottom Not defined
2.6 DATA ACQUISITION
The MS Windows based data acquisition program InstruNet stores measured signals as volts. During the experiments also DasyLab software is needed for the monitoring of the test facility. Separate HPVee based software is used for monitoring and recording the essential measurements of the PACTEL facility producing the steam. After the experiments, the voltage readings are converted to engineering units by using special conversion software.
9
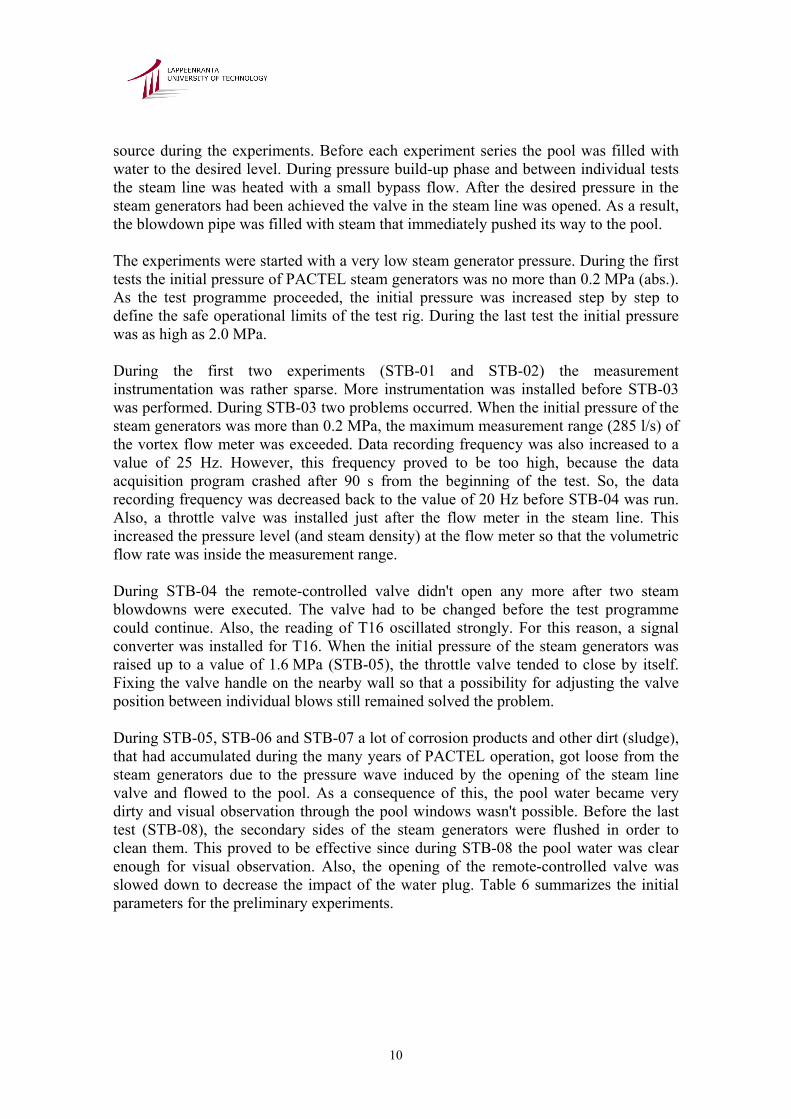
Data recording frequency is 20 Hz (during the test STB-03 25 Hz) for all measurements but T14, DP6 and P8. These three measurements are measured by HPVee software with a frequency of 1 Hz. Table 5 shows the structure of the engineering units database (file). Two separate measurement channels are used for steam line valve position information. For the valve open signal approximately 0.9V means that the valve is fully open. Similarly, for the valve closed signal approximately 0.9V means that the valve is fully closed. When the valve is opening or closing, both signals indicate values on millivoltage level. Table 5. Structure of the measurement database
<experiment>_Instrunet.dat Data recording frequency: 20 Hz
1 2 3 4 5 6 7 8 9 10 Time T1 T2 T3 T4 T5 T6 T7 T8 T9
[s] [°C] [°C] [°C] [°C] [°C] [°C] [°C] [°C] [°C]
<experiment>_Instrunet.dat (continued) Data recording frequency: 20 Hz
11 12 13 14 15 16 17 18 19 20 T10 T11 T12 T13 T15 T16 P1 P2 P3 P4 [°C] [°C] [°C] [°C] [°C] [°C] [bar] [bar] [bar] [bar]
<experiment>_Instrunet.dat (continued)
Data recording frequency: 20 Hz 21 22 23 24 25 26 27 28 29 P5 P7 F1 ST1 ST2 ST3 ST4 Valve
open Valve closed
[bar] [bar] [l/s] [µS] [µS] [µS] [µS] [V] [V]
<experiment>_HPVee.dat Data recording frequency: 1 Hz
1 2 3 4 Time P8 T14 DP6
[s] [bar] [°C] [m]
3 TEST PROGRAMME The preliminary test programme in autumn 2003 consisted of eight test series. Each test series included two to seven separate blowdown tests. The total number of tests was 34. Six test series were performed with the DN100 blowdown pipe and two with the DN80 blowdown pipe. Steam generators of the PACTEL test facility were used as a steam
10
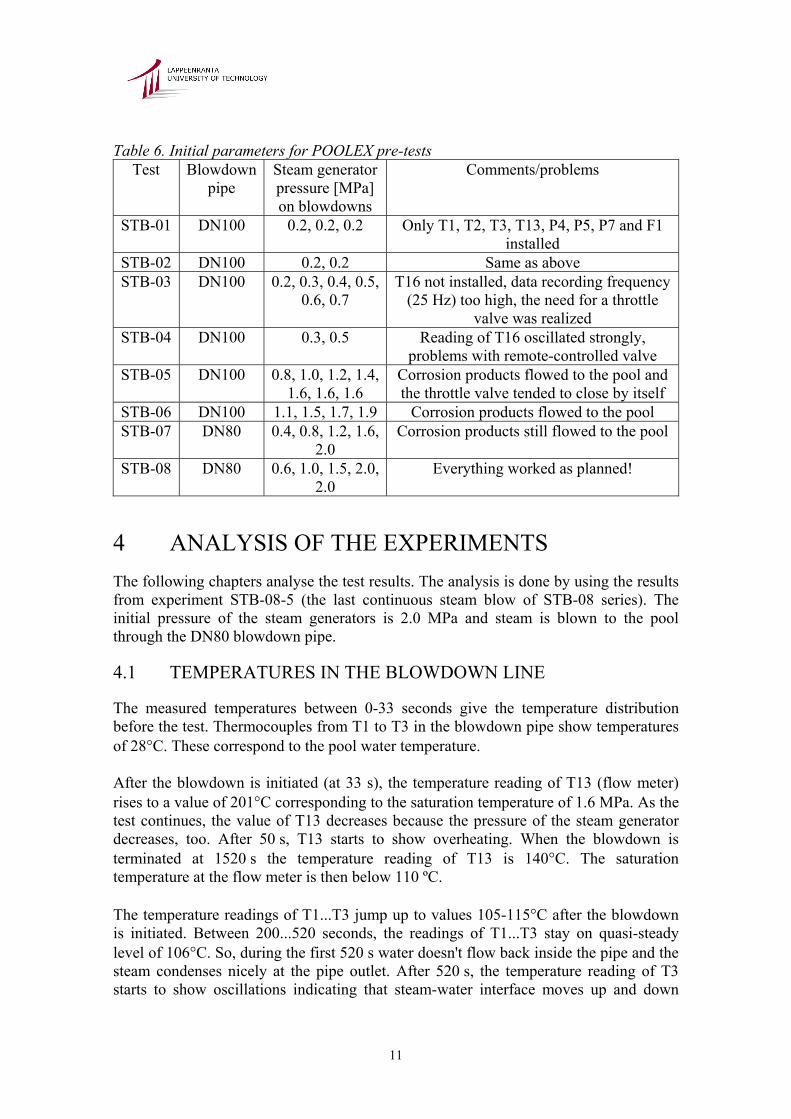
source during the experiments. Before each experiment series the pool was filled with water to the desired level. During pressure build-up phase and between individual tests the steam line was heated with a small bypass flow. After the desired pressure in the steam generators had been achieved the valve in the steam line was opened. As a result, the blowdown pipe was filled with steam that immediately pushed its way to the pool. The experiments were started with a very low steam generator pressure. During the first tests the initial pressure of PACTEL steam generators was no more than 0.2 MPa (abs.). As the test programme proceeded, the initial pressure was increased step by step to define the safe operational limits of the test rig. During the last test the initial pressure was as high as 2.0 MPa. During the first two experiments (STB-01 and STB-02) the measurement instrumentation was rather sparse. More instrumentation was installed before STB-03 was performed. During STB-03 two problems occurred. When the initial pressure of the steam generators was more than 0.2 MPa, the maximum measurement range (285 l/s) of the vortex flow meter was exceeded. Data recording frequency was also increased to a value of 25 Hz. However, this frequency proved to be too high, because the data acquisition program crashed after 90 s from the beginning of the test. So, the data recording frequency was decreased back to the value of 20 Hz before STB-04 was run. Also, a throttle valve was installed just after the flow meter in the steam line. This increased the pressure level (and steam density) at the flow meter so that the volumetric flow rate was inside the measurement range. During STB-04 the remote-controlled valve didn't open any more after two steam blowdowns were executed. The valve had to be changed before the test programme could continue. Also, the reading of T16 oscillated strongly. For this reason, a signal converter was installed for T16. When the initial pressure of the steam generators was raised up to a value of 1.6 MPa (STB-05), the throttle valve tended to close by itself. Fixing the valve handle on the nearby wall so that a possibility for adjusting the valve position between individual blows still remained solved the problem. During STB-05, STB-06 and STB-07 a lot of corrosion products and other dirt (sludge), that had accumulated during the many years of PACTEL operation, got loose from the steam generators due to the pressure wave induced by the opening of the steam line valve and flowed to the pool. As a consequence of this, the pool water became very dirty and visual observation through the pool windows wasn't possible. Before the last test (STB-08), the secondary sides of the steam generators were flushed in order to clean them. This proved to be effective since during STB-08 the pool water was clear enough for visual observation. Also, the opening of the remote-controlled valve was slowed down to decrease the impact of the water plug. Table 6 summarizes the initial parameters for the preliminary experiments.
11
Table 6. Initial parameters for POOLEX pre-tests Test Blowdown
pipe Steam generator pressure [MPa] on blowdowns
Comments/problems
STB-01 DN100 0.2, 0.2, 0.2 Only T1, T2, T3, T13, P4, P5, P7 and F1 installed
STB-02 DN100 0.2, 0.2 Same as above STB-03 DN100 0.2, 0.3, 0.4, 0.5,
0.6, 0.7 T16 not installed, data recording frequency
(25 Hz) too high, the need for a throttle valve was realized
STB-04 DN100 0.3, 0.5 Reading of T16 oscillated strongly, problems with remote-controlled valve
STB-05 DN100 0.8, 1.0, 1.2, 1.4, 1.6, 1.6, 1.6
Corrosion products flowed to the pool and the throttle valve tended to close by itself
STB-06 DN100 1.1, 1.5, 1.7, 1.9 Corrosion products flowed to the pool STB-07 DN80 0.4, 0.8, 1.2, 1.6,
2.0 Corrosion products still flowed to the pool
STB-08 DN80 0.6, 1.0, 1.5, 2.0, 2.0
Everything worked as planned!
4 ANALYSIS OF THE EXPERIMENTS The following chapters analyse the test results. The analysis is done by using the results from experiment STB-08-5 (the last continuous steam blow of STB-08 series). The initial pressure of the steam generators is 2.0 MPa and steam is blown to the pool through the DN80 blowdown pipe.
4.1 TEMPERATURES IN THE BLOWDOWN LINE
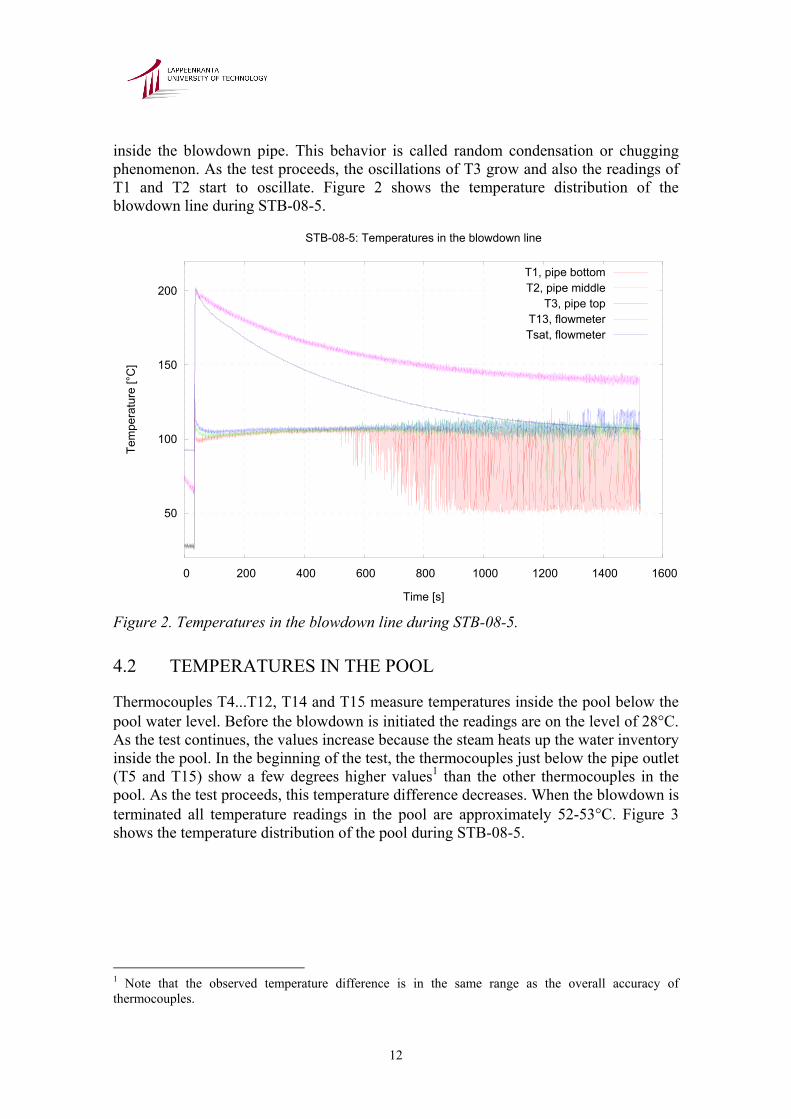
The measured temperatures between 0-33 seconds give the temperature distribution before the test. Thermocouples from T1 to T3 in the blowdown pipe show temperatures of 28°C. These correspond to the pool water temperature. After the blowdown is initiated (at 33 s), the temperature reading of T13 (flow meter) rises to a value of 201°C corresponding to the saturation temperature of 1.6 MPa. As the test continues, the value of T13 decreases because the pressure of the steam generator decreases, too. After 50 s, T13 starts to show overheating. When the blowdown is terminated at 1520 s the temperature reading of T13 is 140°C. The saturation temperature at the flow meter is then below 110 ºC. The temperature readings of T1...T3 jump up to values 105-115°C after the blowdown is initiated. Between 200...520 seconds, the readings of T1...T3 stay on quasi-steady level of 106°C. So, during the first 520 s water doesn't flow back inside the pipe and the steam condenses nicely at the pipe outlet. After 520 s, the temperature reading of T3 starts to show oscillations indicating that steam-water interface moves up and down
12
inside the blowdown pipe. This behavior is called random condensation or chugging phenomenon. As the test proceeds, the oscillations of T3 grow and also the readings of T1 and T2 start to oscillate. Figure 2 shows the temperature distribution of the blowdown line during STB-08-5.
50
100
150
200
0 200 400 600 800 1000 1200 1400 1600
Tem
pera
ture
[°C
]
Time [s]
STB-08-5: Temperatures in the blowdown line
T1, pipe bottomT2, pipe middle
T3, pipe topT13, flowmeterTsat, flowmeter
Figure 2. Temperatures in the blowdown line during STB-08-5.
4.2 TEMPERATURES IN THE POOL
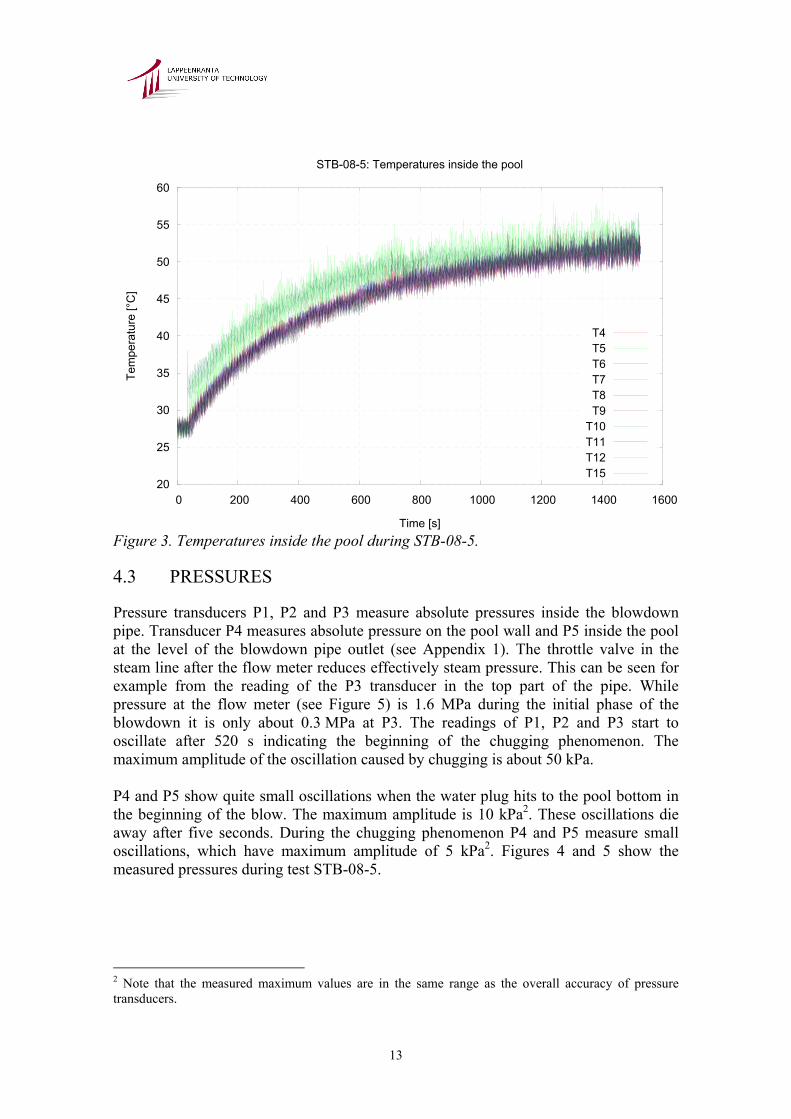
Thermocouples T4...T12, T14 and T15 measure temperatures inside the pool below the pool water level. Before the blowdown is initiated the readings are on the level of 28°C. As the test continues, the values increase because the steam heats up the water inventory inside the pool. In the beginning of the test, the thermocouples just below the pipe outlet (T5 and T15) show a few degrees higher values1 than the other thermocouples in the pool. As the test proceeds, this temperature difference decreases. When the blowdown is terminated all temperature readings in the pool are approximately 52-53°C. Figure 3 shows the temperature distribution of the pool during STB-08-5.
1 Note that the observed temperature difference is in the same range as the overall accuracy of thermocouples.
13
20
25
30
35
40
45
50
55
60
0 200 400 600 800 1000 1200 1400 1600
Tem
pera
ture
[°C
]
Time [s]
STB-08-5: Temperatures inside the pool
T4T5T6T7T8T9
T10T11T12T15
Figure 3. Temperatures inside the pool during STB-08-5.
4.3 PRESSURES
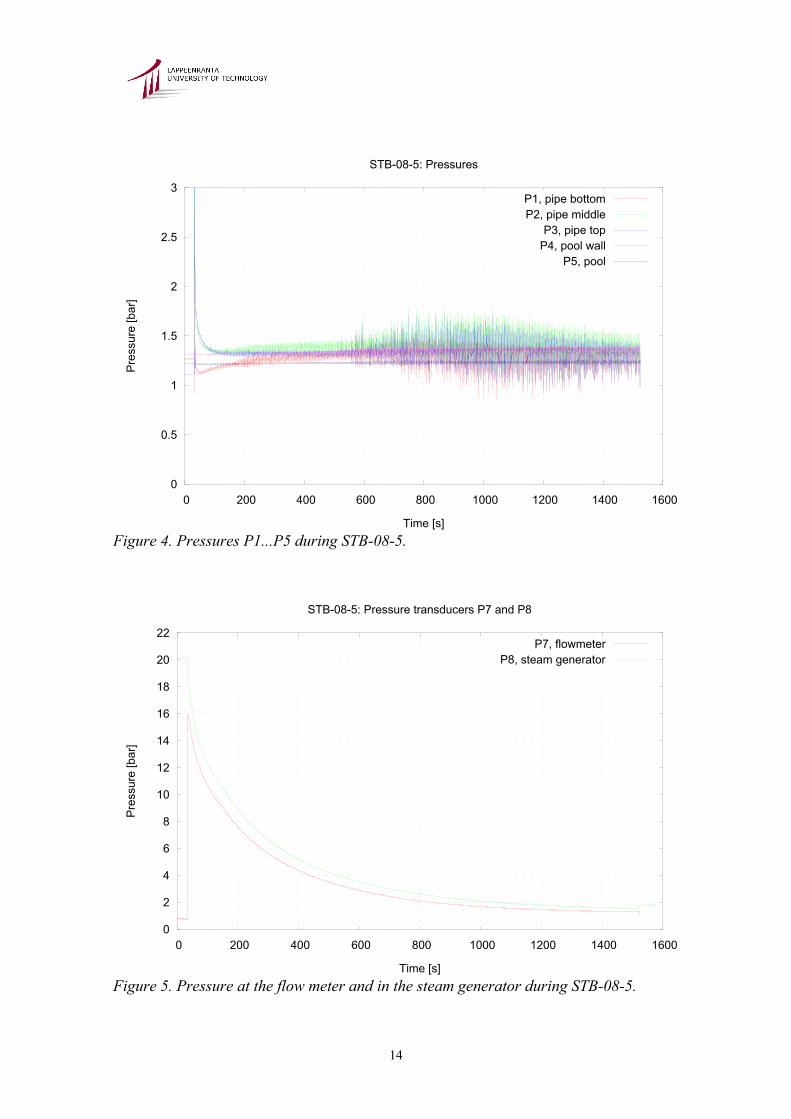
Pressure transducers P1, P2 and P3 measure absolute pressures inside the blowdown pipe. Transducer P4 measures absolute pressure on the pool wall and P5 inside the pool at the level of the blowdown pipe outlet (see Appendix 1). The throttle valve in the steam line after the flow meter reduces effectively steam pressure. This can be seen for example from the reading of the P3 transducer in the top part of the pipe. While pressure at the flow meter (see Figure 5) is 1.6 MPa during the initial phase of the blowdown it is only about 0.3 MPa at P3. The readings of P1, P2 and P3 start to oscillate after 520 s indicating the beginning of the chugging phenomenon. The maximum amplitude of the oscillation caused by chugging is about 50 kPa. P4 and P5 show quite small oscillations when the water plug hits to the pool bottom in the beginning of the blow. The maximum amplitude is 10 kPa2. These oscillations die away after five seconds. During the chugging phenomenon P4 and P5 measure small oscillations, which have maximum amplitude of 5 kPa2. Figures 4 and 5 show the measured pressures during test STB-08-5.
2 Note that the measured maximum values are in the same range as the overall accuracy of pressure transducers.
14
0
0.5
1
1.5
2
2.5
3
0 200 400 600 800 1000 1200 1400 1600
Pre
ssur
e [b
ar]
Time [s]
STB-08-5: Pressures
P1, pipe bottomP2, pipe middle
P3, pipe topP4, pool wall
P5, pool
Figure 4. Pressures P1...P5 during STB-08-5.
0
2
4
6
8
10
12
14
16
18
20
22
0 200 400 600 800 1000 1200 1400 1600
Pre
ssur
e [b
ar]
Time [s]
STB-08-5: Pressure transducers P7 and P8
P7, flowmeterP8, steam generator
Figure 5. Pressure at the flow meter and in the steam generator during STB-08-5.
15
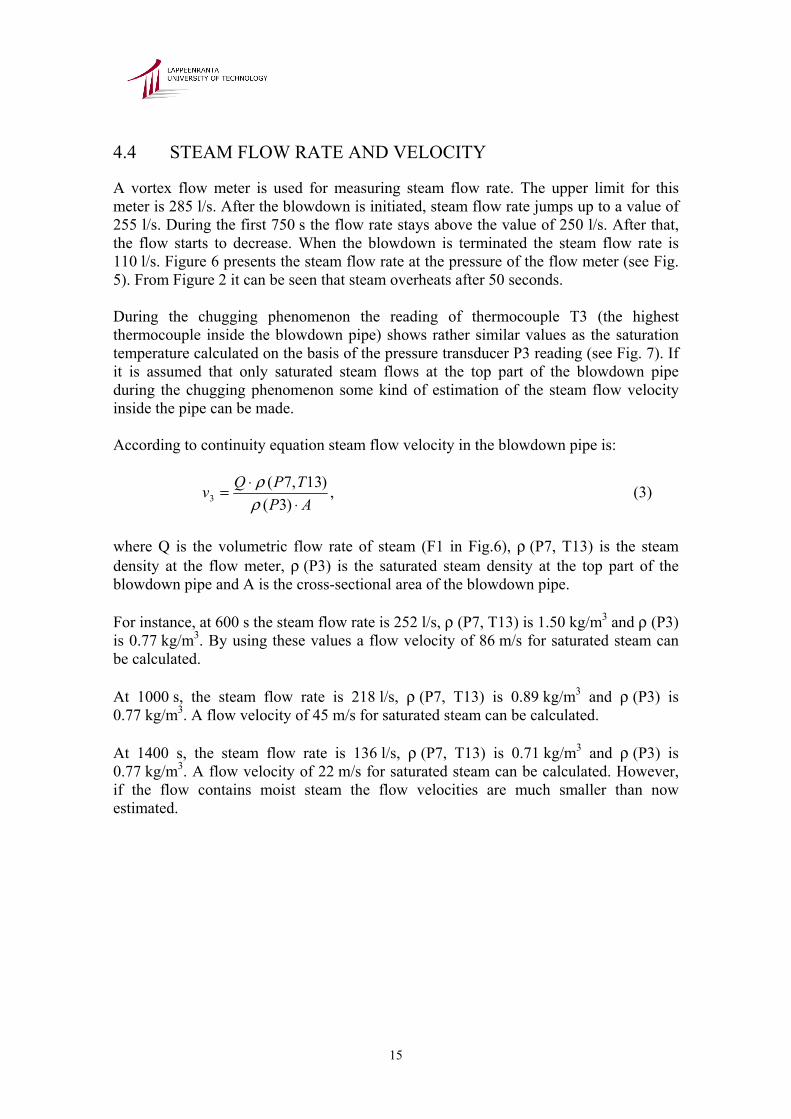
4.4 STEAM FLOW RATE AND VELOCITY
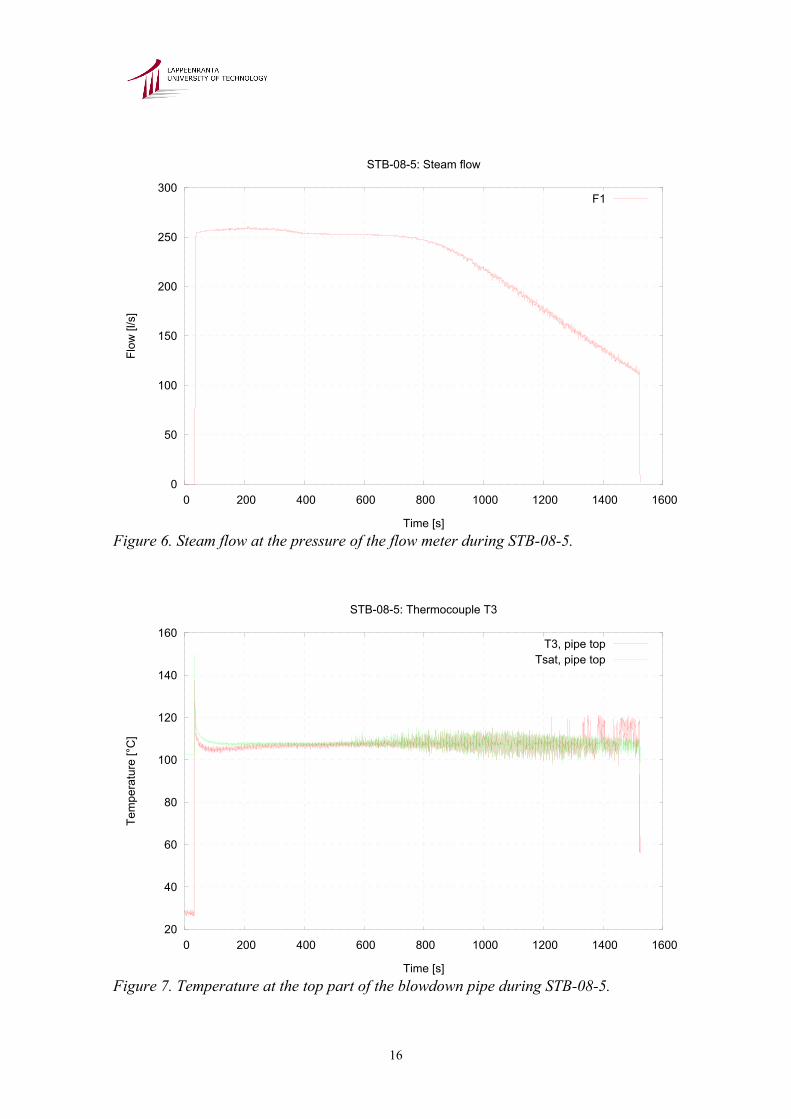
A vortex flow meter is used for measuring steam flow rate. The upper limit for this meter is 285 l/s. After the blowdown is initiated, steam flow rate jumps up to a value of 255 l/s. During the first 750 s the flow rate stays above the value of 250 l/s. After that, the flow starts to decrease. When the blowdown is terminated the steam flow rate is 110 l/s. Figure 6 presents the steam flow rate at the pressure of the flow meter (see Fig. 5). From Figure 2 it can be seen that steam overheats after 50 seconds. During the chugging phenomenon the reading of thermocouple T3 (the highest thermocouple inside the blowdown pipe) shows rather similar values as the saturation temperature calculated on the basis of the pressure transducer P3 reading (see Fig. 7). If it is assumed that only saturated steam flows at the top part of the blowdown pipe during the chugging phenomenon some kind of estimation of the steam flow velocity inside the pipe can be made. According to continuity equation steam flow velocity in the blowdown pipe is:
,)3(
)13,7(3 AP
TPQv⋅
⋅=ρρ (3)
where Q is the volumetric flow rate of steam (F1 in Fig.6), ρ (P7, T13) is the steam density at the flow meter, ρ (P3) is the saturated steam density at the top part of the blowdown pipe and A is the cross-sectional area of the blowdown pipe. For instance, at 600 s the steam flow rate is 252 l/s, ρ (P7, T13) is 1.50 kg/m3 and ρ (P3) is 0.77 kg/m3. By using these values a flow velocity of 86 m/s for saturated steam can be calculated. At 1000 s, the steam flow rate is 218 l/s, ρ (P7, T13) is 0.89 kg/m3 and ρ (P3) is 0.77 kg/m3. A flow velocity of 45 m/s for saturated steam can be calculated. At 1400 s, the steam flow rate is 136 l/s, ρ (P7, T13) is 0.71 kg/m3 and ρ (P3) is 0.77 kg/m3. A flow velocity of 22 m/s for saturated steam can be calculated. However, if the flow contains moist steam the flow velocities are much smaller than now estimated.
16
0
50
100
150
200
250
300
0 200 400 600 800 1000 1200 1400 1600
Flow
[l/s
]
Time [s]
STB-08-5: Steam flow
F1
Figure 6. Steam flow at the pressure of the flow meter during STB-08-5.
20
40
60
80
100
120
140
160
0 200 400 600 800 1000 1200 1400 1600
Tem
pera
ture
[°C
]
Time [s]
STB-08-5: Thermocouple T3
T3, pipe topTsat, pipe top
Figure 7. Temperature at the top part of the blowdown pipe during STB-08-5.
17
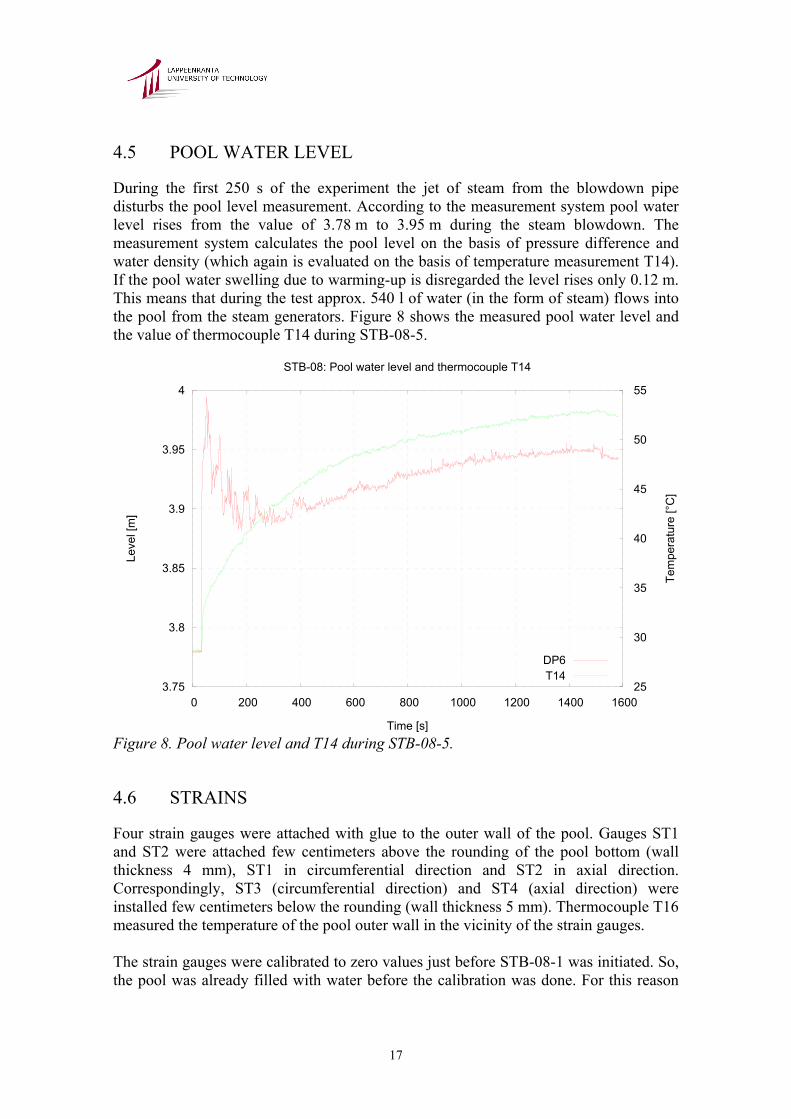
4.5 POOL WATER LEVEL
During the first 250 s of the experiment the jet of steam from the blowdown pipe disturbs the pool level measurement. According to the measurement system pool water level rises from the value of 3.78 m to 3.95 m during the steam blowdown. The measurement system calculates the pool level on the basis of pressure difference and water density (which again is evaluated on the basis of temperature measurement T14). If the pool water swelling due to warming-up is disregarded the level rises only 0.12 m. This means that during the test approx. 540 l of water (in the form of steam) flows into the pool from the steam generators. Figure 8 shows the measured pool water level and the value of thermocouple T14 during STB-08-5.
3.75
3.8
3.85
3.9
3.95
4
0 200 400 600 800 1000 1200 1400 1600 25
30
35
40
45
50
55
Leve
l [m
]
Tem
pera
ture
[°C
]
Time [s]
STB-08: Pool water level and thermocouple T14
DP6T14
Figure 8. Pool water level and T14 during STB-08-5.
4.6 STRAINS
Four strain gauges were attached with glue to the outer wall of the pool. Gauges ST1 and ST2 were attached few centimeters above the rounding of the pool bottom (wall thickness 4 mm), ST1 in circumferential direction and ST2 in axial direction. Correspondingly, ST3 (circumferential direction) and ST4 (axial direction) were installed few centimeters below the rounding (wall thickness 5 mm). Thermocouple T16 measured the temperature of the pool outer wall in the vicinity of the strain gauges. The strain gauges were calibrated to zero values just before STB-08-1 was initiated. So, the pool was already filled with water before the calibration was done. For this reason
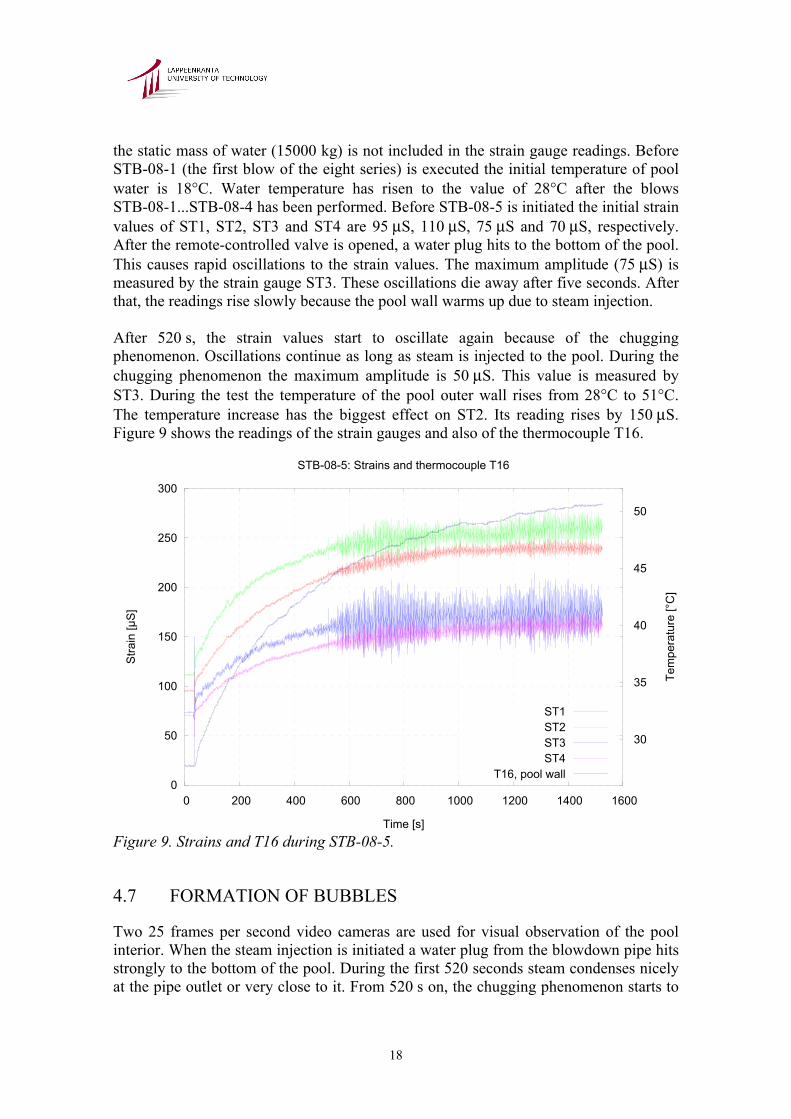
18
the static mass of water (15000 kg) is not included in the strain gauge readings. Before STB-08-1 (the first blow of the eight series) is executed the initial temperature of pool water is 18°C. Water temperature has risen to the value of 28°C after the blows STB-08-1...STB-08-4 has been performed. Before STB-08-5 is initiated the initial strain values of ST1, ST2, ST3 and ST4 are 95 µS, 110 µS, 75 µS and 70 µS, respectively. After the remote-controlled valve is opened, a water plug hits to the bottom of the pool. This causes rapid oscillations to the strain values. The maximum amplitude (75 µS) is measured by the strain gauge ST3. These oscillations die away after five seconds. After that, the readings rise slowly because the pool wall warms up due to steam injection. After 520 s, the strain values start to oscillate again because of the chugging phenomenon. Oscillations continue as long as steam is injected to the pool. During the chugging phenomenon the maximum amplitude is 50 µS. This value is measured by ST3. During the test the temperature of the pool outer wall rises from 28°C to 51°C. The temperature increase has the biggest effect on ST2. Its reading rises by 150 µS. Figure 9 shows the readings of the strain gauges and also of the thermocouple T16.
0
50
100
150
200
250
300
0 200 400 600 800 1000 1200 1400 1600
30
35
40
45
50
Stra
in [µ
S]
Tem
pera
ture
[°C
]
Time [s]
STB-08-5: Strains and thermocouple T16
ST1ST2ST3ST4
T16, pool wall
Figure 9. Strains and T16 during STB-08-5.
4.7 FORMATION OF BUBBLES
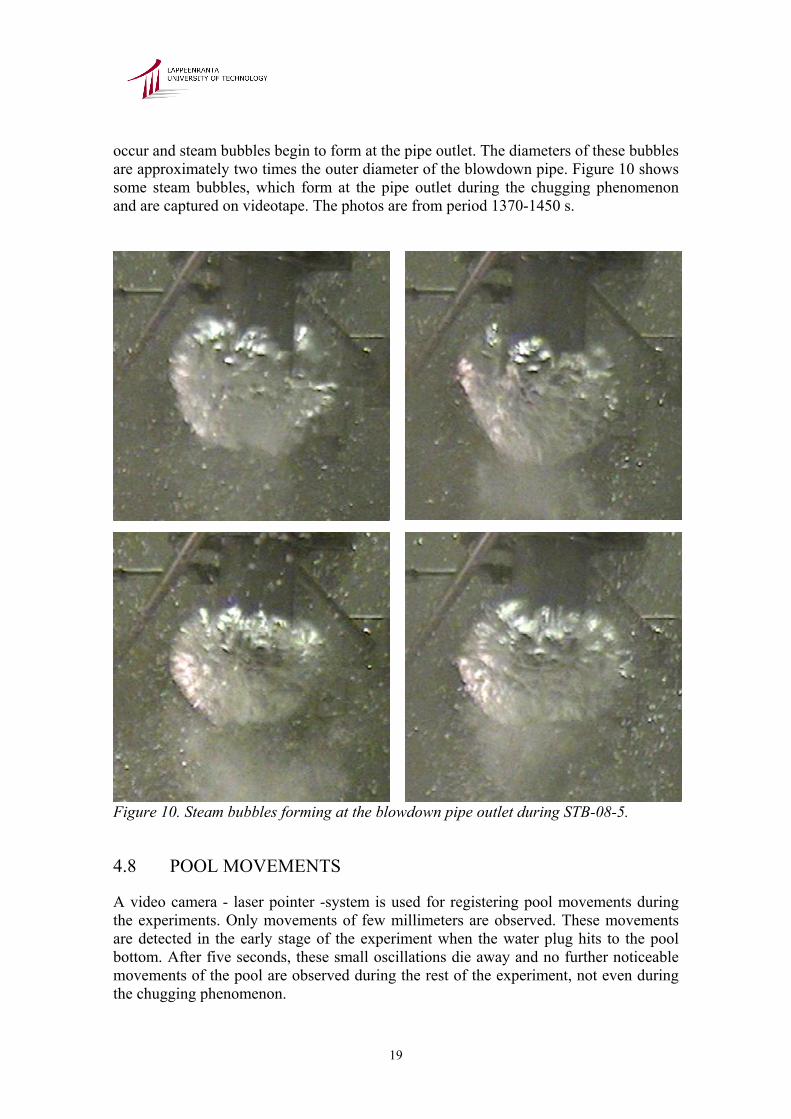
Two 25 frames per second video cameras are used for visual observation of the pool interior. When the steam injection is initiated a water plug from the blowdown pipe hits strongly to the bottom of the pool. During the first 520 seconds steam condenses nicely at the pipe outlet or very close to it. From 520 s on, the chugging phenomenon starts to
19
occur and steam bubbles begin to form at the pipe outlet. The diameters of these bubbles are approximately two times the outer diameter of the blowdown pipe. Figure 10 shows some steam bubbles, which form at the pipe outlet during the chugging phenomenon and are captured on videotape. The photos are from period 1370-1450 s.
Figure 10. Steam bubbles forming at the blowdown pipe outlet during STB-08-5.
4.8 POOL MOVEMENTS
A video camera - laser pointer -system is used for registering pool movements during the experiments. Only movements of few millimeters are observed. These movements are detected in the early stage of the experiment when the water plug hits to the pool bottom. After five seconds, these small oscillations die away and no further noticeable movements of the pool are observed during the rest of the experiment, not even during the chugging phenomenon.
20
5 ESTIMATION OF CAPABILITIES OF THE TEST POOL
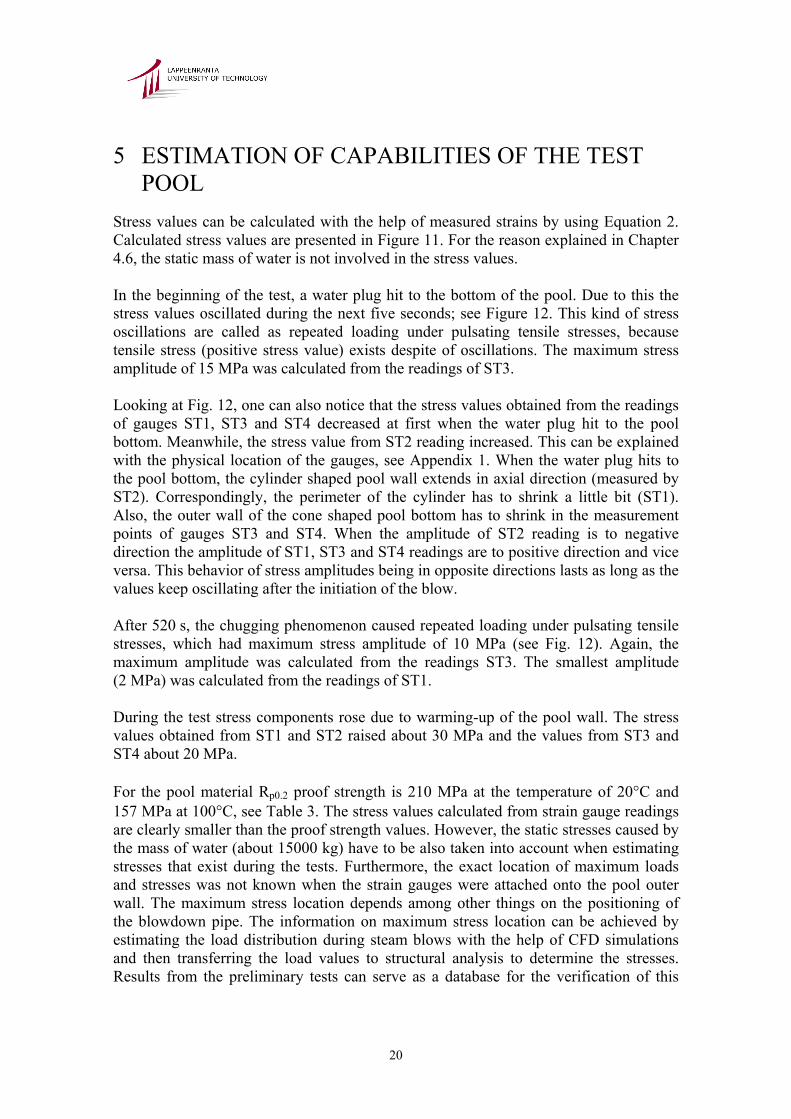
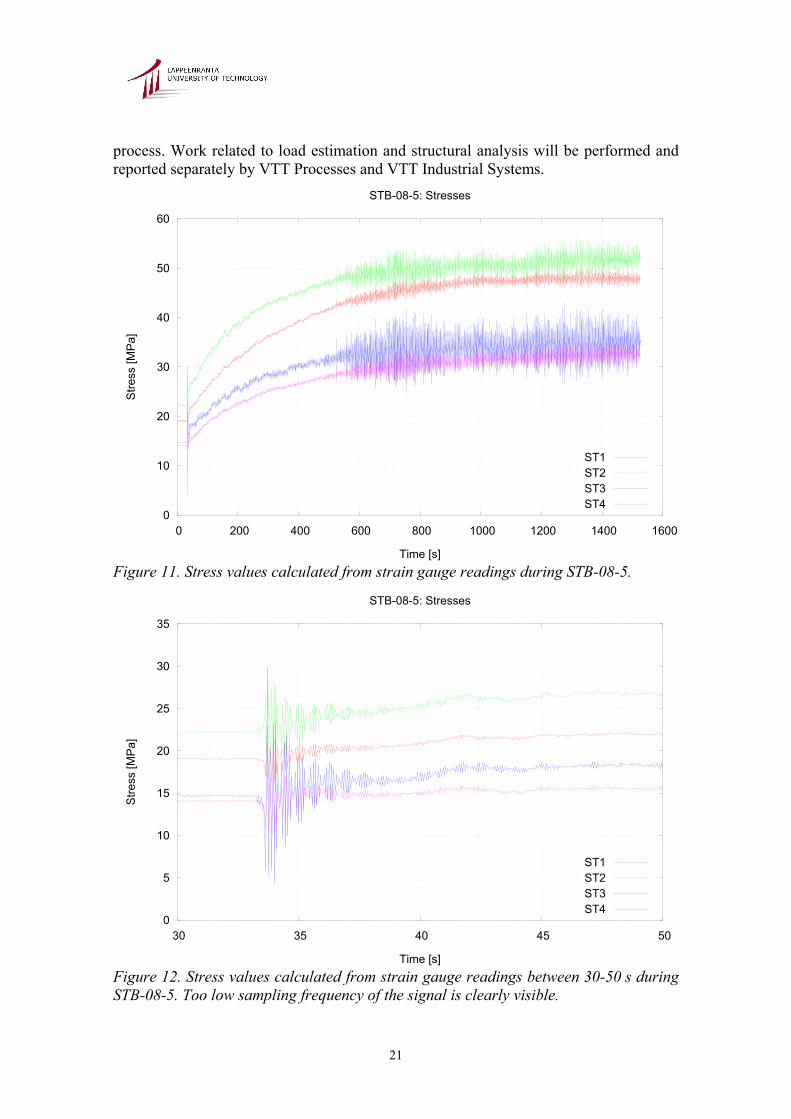
Stress values can be calculated with the help of measured strains by using Equation 2. Calculated stress values are presented in Figure 11. For the reason explained in Chapter 4.6, the static mass of water is not involved in the stress values. In the beginning of the test, a water plug hit to the bottom of the pool. Due to this the stress values oscillated during the next five seconds; see Figure 12. This kind of stress oscillations are called as repeated loading under pulsating tensile stresses, because tensile stress (positive stress value) exists despite of oscillations. The maximum stress amplitude of 15 MPa was calculated from the readings of ST3. Looking at Fig. 12, one can also notice that the stress values obtained from the readings of gauges ST1, ST3 and ST4 decreased at first when the water plug hit to the pool bottom. Meanwhile, the stress value from ST2 reading increased. This can be explained with the physical location of the gauges, see Appendix 1. When the water plug hits to the pool bottom, the cylinder shaped pool wall extends in axial direction (measured by ST2). Correspondingly, the perimeter of the cylinder has to shrink a little bit (ST1). Also, the outer wall of the cone shaped pool bottom has to shrink in the measurement points of gauges ST3 and ST4. When the amplitude of ST2 reading is to negative direction the amplitude of ST1, ST3 and ST4 readings are to positive direction and vice versa. This behavior of stress amplitudes being in opposite directions lasts as long as the values keep oscillating after the initiation of the blow. After 520 s, the chugging phenomenon caused repeated loading under pulsating tensile stresses, which had maximum stress amplitude of 10 MPa (see Fig. 12). Again, the maximum amplitude was calculated from the readings ST3. The smallest amplitude (2 MPa) was calculated from the readings of ST1. During the test stress components rose due to warming-up of the pool wall. The stress values obtained from ST1 and ST2 raised about 30 MPa and the values from ST3 and ST4 about 20 MPa. For the pool material Rp0.2 proof strength is 210 MPa at the temperature of 20°C and 157 MPa at 100°C, see Table 3. The stress values calculated from strain gauge readings are clearly smaller than the proof strength values. However, the static stresses caused by the mass of water (about 15000 kg) have to be also taken into account when estimating stresses that exist during the tests. Furthermore, the exact location of maximum loads and stresses was not known when the strain gauges were attached onto the pool outer wall. The maximum stress location depends among other things on the positioning of the blowdown pipe. The information on maximum stress location can be achieved by estimating the load distribution during steam blows with the help of CFD simulations and then transferring the load values to structural analysis to determine the stresses. Results from the preliminary tests can serve as a database for the verification of this
21
process. Work related to load estimation and structural analysis will be performed and reported separately by VTT Processes and VTT Industrial Systems.
0
10
20
30
40
50
60
0 200 400 600 800 1000 1200 1400 1600
Stre
ss [M
Pa]
Time [s]
STB-08-5: Stresses
ST1ST2ST3ST4
Figure 11. Stress values calculated from strain gauge readings during STB-08-5.
0
5
10
15
20
25
30
35
30 35 40 45 50
Stre
ss [M
Pa]
Time [s]
STB-08-5: Stresses
ST1ST2ST3ST4
Figure 12. Stress values calculated from strain gauge readings between 30-50 s during STB-08-5. Too low sampling frequency of the signal is clearly visible.
22
6 DISCUSSION OF MEASUREMENT AND VISUALIZATION NEEDS
The InstruNet data acquisition program measured and stored 29 measurement channels in the preliminary steam blow tests. With this number of channels a 20 Hz data recording frequency was achieved. By tuning up the current system and by reducing considerably the number of measured channels higher recording frequencies might be obtained. However, investment in a new, faster data acquisition system should be considered. The inadequacy of the current instrumentation and data acquisition system for capturing high frequency phenomena can be observed easily for example from Figure 12. When a short time interval of measured data is plotted to reveal the details of the curves one can see that they start aliasing [4]. This is a result of the insufficient sampling rate of the measurement signal compared to the frequency of the investigated phenomenon. Regarding the measurement sensors/transducers used in the preliminary tests one can conclude that 0.5 mm thermocouples are probably fast enough for the purpose. However, some problems may arise from the quite large amount of noise in the temperature measurement signal. The measurement frequency of the pressure sensors used is, on the other hand, too low. Measured maximum values of the pressure spikes experienced during the initial hit of the water plug or during the rapid condensation of steam bubbles is thus not accurate. The highest peaks of the curve could have been cut off. New, faster sensors with appropriate measurement range have to be purchased before actual steam blowdown tests. The vortex flow meter in the steam line seems to work properly and no need for replacing it has occurred. Strain gauge measurements are ideal for estimating loads in different parts of the pool wall. However, the lack of own amplifiers needed with the gauges has been causing time schedule problems since, so far, the amplifiers must have been borrowed from other department of the university for the tests. Purchasing own amplifiers for the research group should be considered before proceeding to actual steam blowdown tests. During the blows PAL standard 25 fps video cameras were used for visual observation of the steam bubbles. The 25 fps speed was not enough since during the chugging phenomenon the bubbles could totally condense and disappear between two video frames. So, for better observation of the bubbles a high-speed video camera (at least 500-1000 fps with a decent resolution) is essential. The pool movements were observed by using a video camera - laser pointer -system that was installed close to the top brim of the pool. This system showed with reasonable accuracy that the pool oscillated few millimeters when a water plug hit to the bottom of the pool in the beginning of the test. If more accurate values of pool movements are wanted, a totally different kind of measurement system has to be developed for that purpose.
23
7 SUMMARY AND CONCLUSIONS During autumn 2003 eight experiment series, each consisting of several individual blows, were carried out with a scaled down test facility designed and constructed at Lappeenranta University of Technology to investigate steam injection into the large water pool. The initial system pressure of the steam source (the nearby PACTEL facility) before the blows ranged from 0.2 MPa to 2.0 MPa. Two different blowdown pipe diameters (DN80 and DN100) were used in the tests. A video camera-laser pointer -system showed that the pool oscillated few millimeters at the most when a water plug from the blowdown pipe hit strongly to the pool bottom in the beginning of the test. These oscillations were also registered by the strain gauges on the pool outer wall as repeated loading under pulsating tensile stresses with a maximum amplitude of 15 MPa and by the pressure transducer on the pool inner wall with a maximum amplitude of 10 kPa. After five seconds into the experiments, the oscillations were negligible. As long as steam flow rate was high enough to prevent water ingress into the blowdown pipe steam condensed nicely at the pipe outlet and no pressure loads were observed on the pool walls. Random condensation or chugging phenomenon (steam-water interface moving up and down inside the blowdown pipe) was observed several times during the preliminary test series as the steam flow rate decreased enough to allow water ingress into the blowdown pipe. Both pressure and temperature measurements inside the blowdown pipe showed oscillating behavior when this happened. Steam bubbles with a diameter about two times the DN80 pipe diameter formed at the pipe outlet. The chugging phenomenon caused small pressure loads on the pool wall with maximum amplitude of 5 kPa. Also, the strain gauges registered the chugging oscillations as repeated loading under pulsating tensile stresses with maximum amplitude of 10 MPa. The stress values calculated from the strain gauge readings were clearly under the proof strength values of the pool material in the temperature range experienced during the tests. During the experiments the temperature of the pool wall rose more than 20°C due to steam injection. This caused a 30 MPa of tension stress on the outer wall of the pool. During the chugging phenomenon the steam bubbles condensed rapidly between two frames of the 25 fps video capture. For this reason a high-speed video camera is necessary for more accurate observation of steam bubbles in the future tests. The results of the preliminary tests indicate that the maximum measurement frequency of the current combination of instrumentation and data acquisition system is not adequate to be used in the actual steam tests in 2004, especially when used for the model development. The InstruNet data acquisition program was able to record 29 channels with a frequency of 20 Hz. The fast pressure oscillations caused by rapid condensation of steam bubbles, for example, can be captured only partially with the current system. However, the current data acquisition system has been sufficient for
24
controlling of the experiments and for obtaining coarse data to help to estimate the operating limits of the pool test rig. One more preliminary test series, with a DN200 blowdown pipe, is planned to be carried out in the spring of 2004. The test configuration and boundary conditions for the actual steam tests to be performed later in 2004 will then be chosen. Based on the results and experience gained from the preliminary tests a detailed test plan and an instrumentation proposal will be written.
REFERENCES 1. Laine, J., Condensation Pool Experiments with Non-condensable Gas. Lappeen-
ranta: LTKK, 2002. (Research Report TOKE-2/2002). 2. Standards: SFS-EN 10088-1 and SFS-EN 10088-2, 1995. 3. Tuunanen, J., Kouhia, J., Purhonen, H., Riikonen, V., Puustinen, M., Semken, R. S.,
Partanen, H., Saure, I., Pylkkö, H., General description of the PACTEL test facility. Espoo: VTT. 1998. (VTT Research Notes 1929). ISBN 951-38-5338-1.
4. http://www.kostic.niu.edu/aliasing.htm
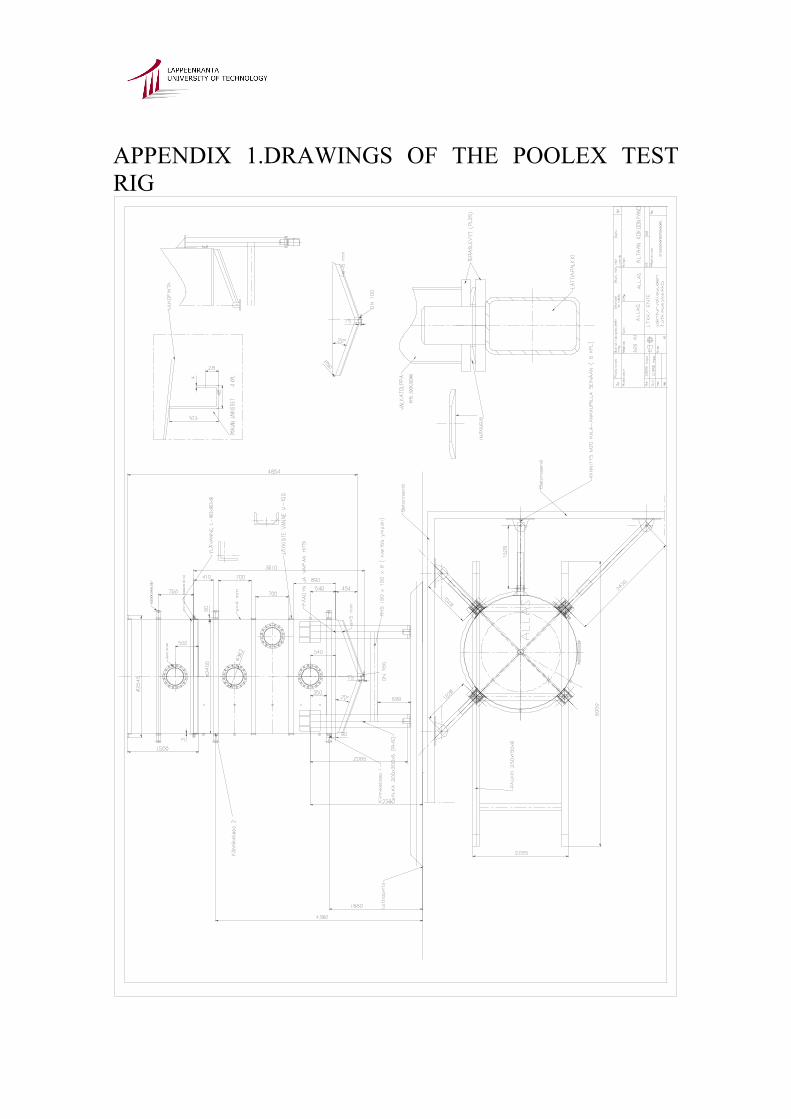
APPENDIX 1.DRAWINGS OF THE POOLEX TEST RIG
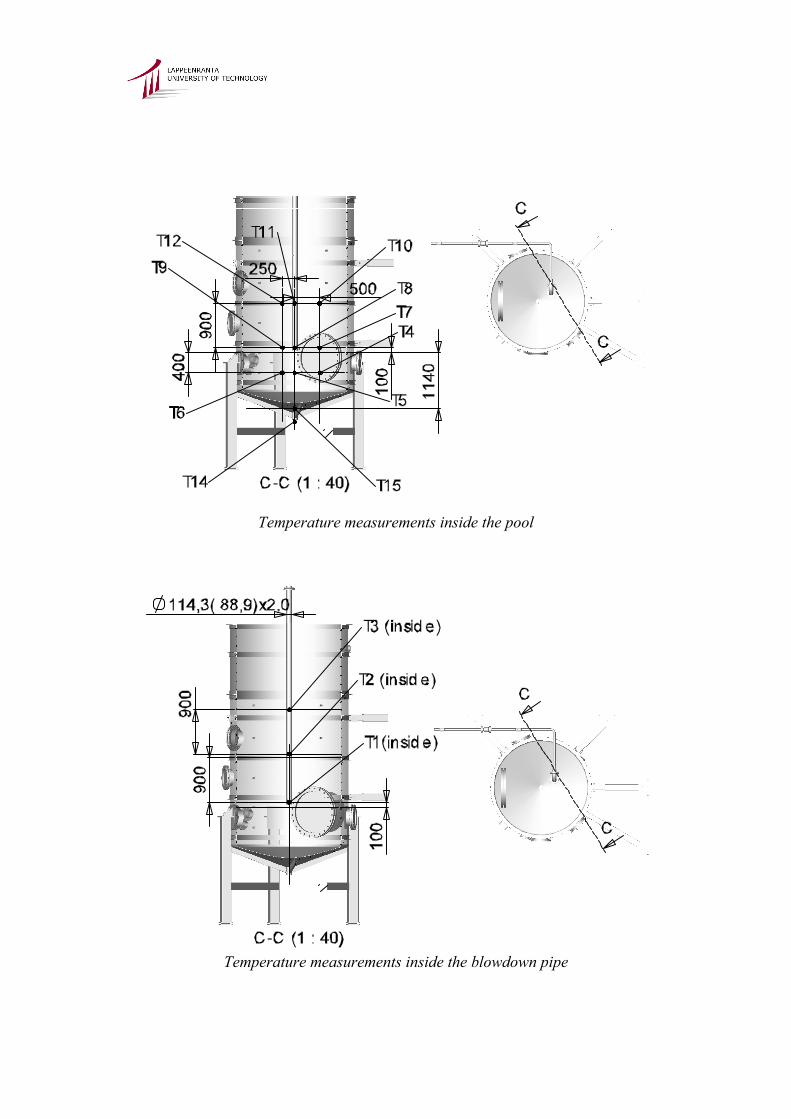
Temperature measurements inside the pool
Temperature measurements inside the blowdown pipe
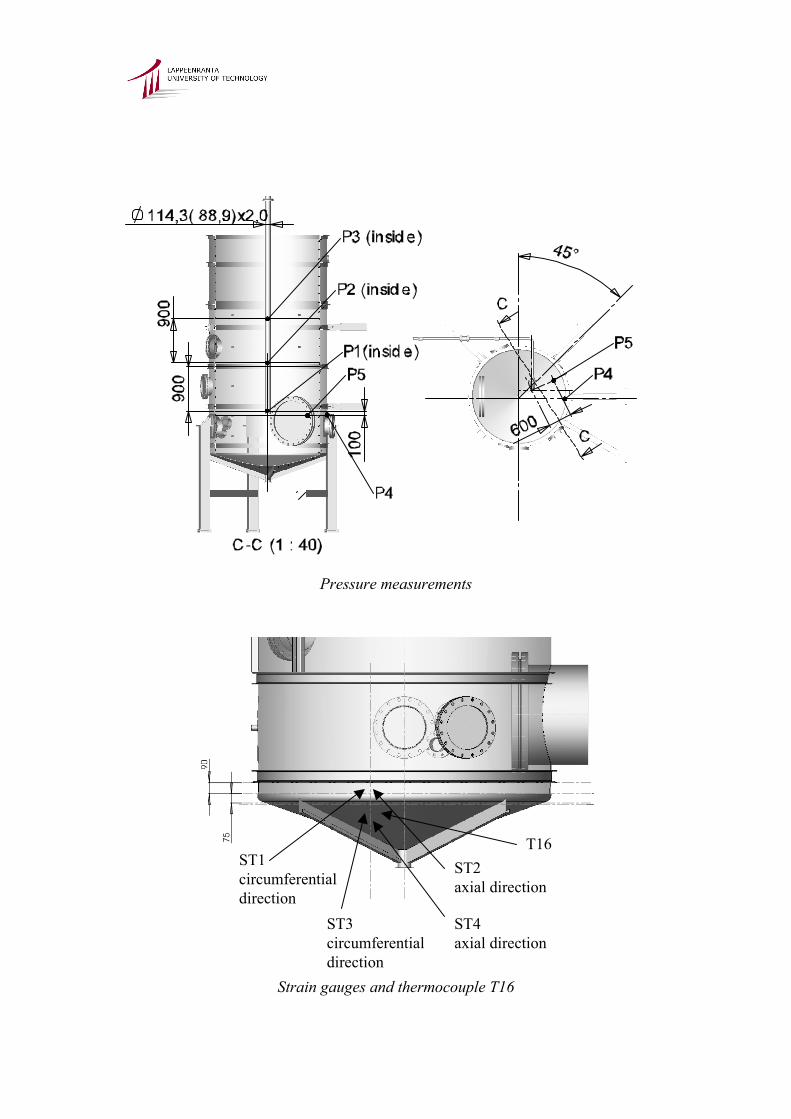
Pressure measurements
T16ST1circumferential direction
ST2axial direction
ST3circumferential direction
ST4axial direction
Strain gauges and thermocouple T16
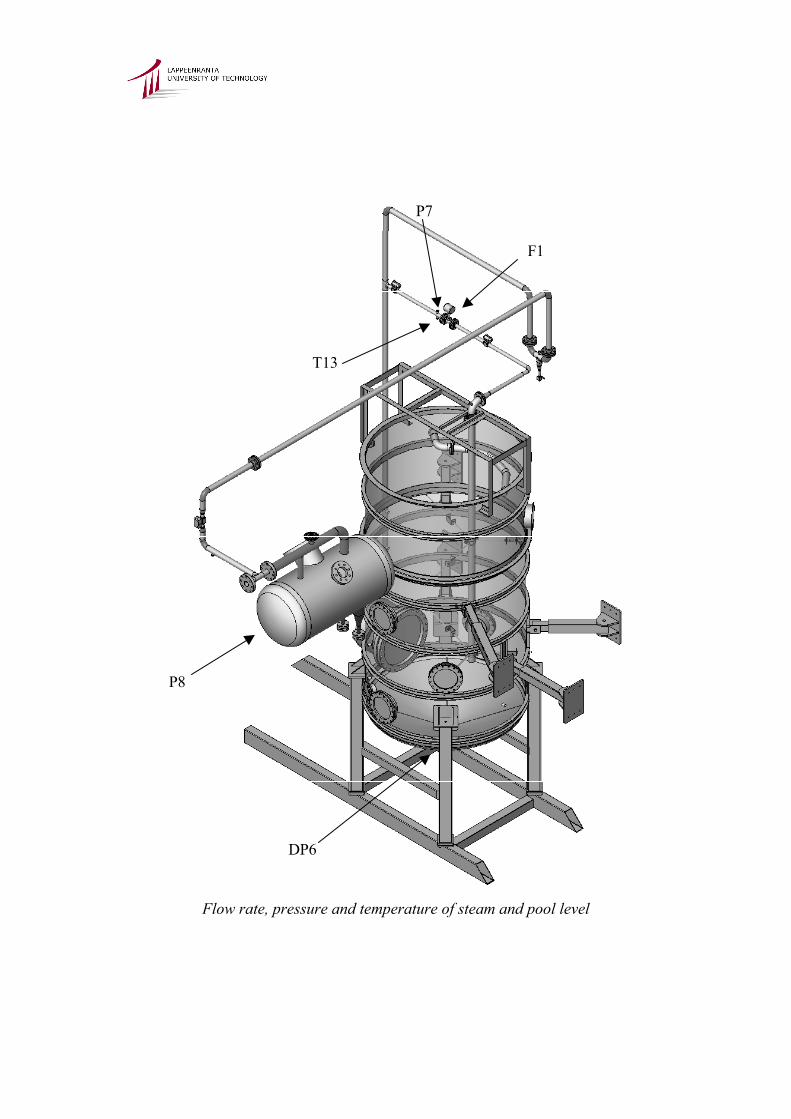
F1
P7
T13
P8
DP6
Flow rate, pressure and temperature of steam and pool level
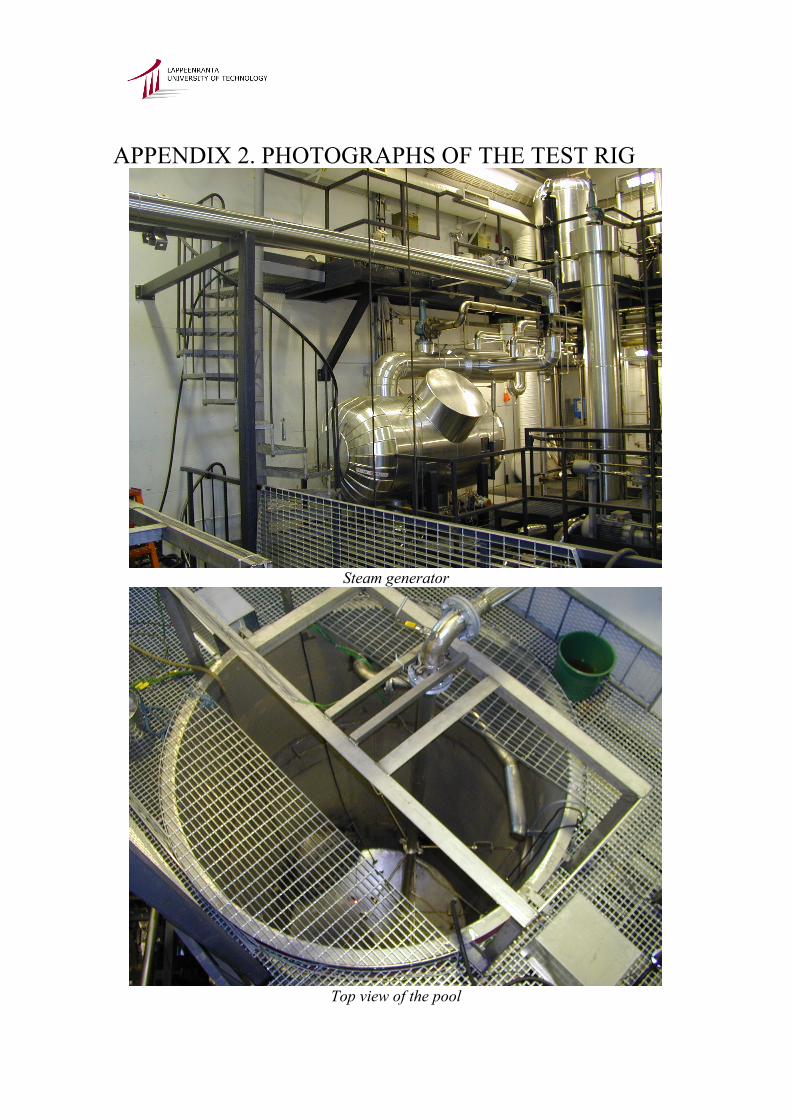
APPENDIX 2. PHOTOGRAPHS OF THE TEST RIG
Steam generator
Top view of the pool
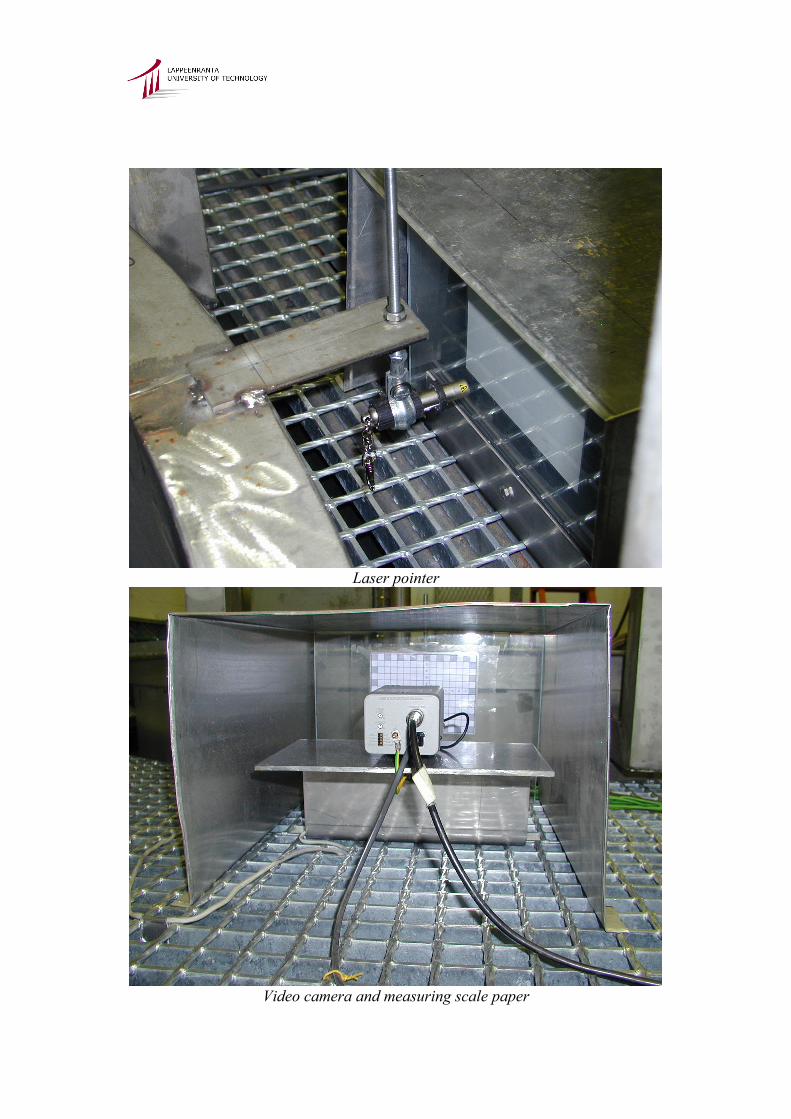
Laser pointer
Video camera and measuring scale paper
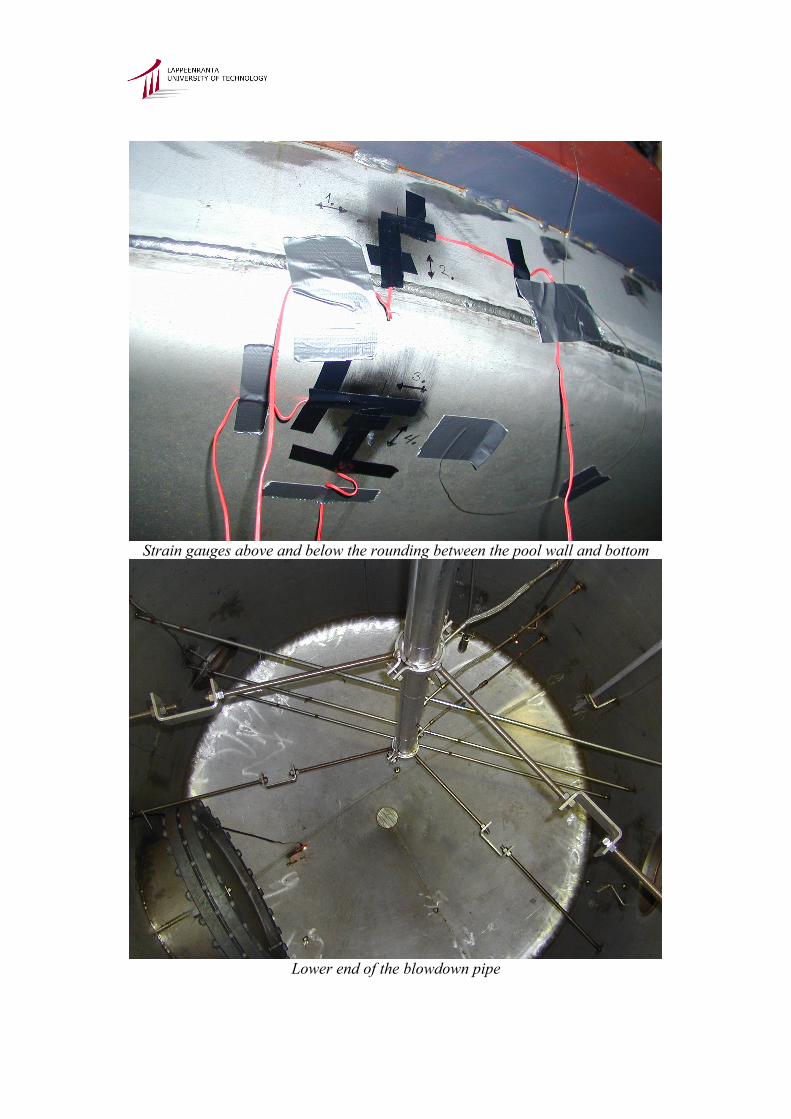
Strain gauges above and below the rounding between the pool wall and bottom
Lower end of the blowdown pipe
Bibliographic Data Sheet NKS-97 Title Preliminary condensation pool experiments with steam using DN80
and DN100 blowdown pipes
Author(s) Jani Laine & Markku Puustinen
Affiliation(s) Lappeenranta University of Technology, Finland
ISBN 87-7893-156-8 (Electronic report)
Date March 2004
Project NKS_R_2002_01
No. of pages 31
No. of tables 6
No. of illustrations 24
No. of references 6
Abstract The report summarizes the results of the preliminary steam blowdown experiments. Altogether eight experiment series, each consisting of several steam blows, were carried out in autumn 2003 with a scaled-down condensation pool test rig designed and constructed at Lappeenranta University of Technology. The main purpose of the experiments was to evaluate the capabilities of the test rig and the needs for measurement and visualization devices. The experiments showed that a high-speed video camera is essential for visual observation due to the rapid condensation of steam bubbles. Furthermore, the maximum measurement frequency of the current combination of instrumentation and data acquisition system is inadequate for the actual steam tests in 2004.
Key words Steam blowdown experiments, SAFIR, Poolex, high-speed video camera
Available on request from the NKS Secretariat, P.O.Box 30, DK-4000 Roskilde, Denmark. Phone (+45) 4677 4045, fax (+45) 4677 4046, e-mail [email protected], www.nks.org