Embed Size (px)
Citation preview

Ministry of Energy, Mines and Petroleum Resources 99
PRELIMINARY ANALYSES OF COAL REFUSE MATERIAL FROM VANCOUVER ISLAND
Barry Ryan1
ABSTRACT
waste material from the coal cleaning accumulated in a number of areas along the east coast of Vancouver
Ryan, B., (2008): Preliminary Analyses of Coal Refuse Material from Vancouver Island; Geoscience Reports 2008, B.C. Ministry of Energy, Mines and Petroleum Resources, pages 99-118.
1Resource Development and Geosciences Branch; Oil and Gas Division; BC Ministry of Energy, Mines and Petroleum Resources; 250-952-0377; [email protected]. Key Words: Waste coal, trace metals, coal refuse, Vancouver Island.
THE EARLY VANCOUVER ISLAND COAL INDUSTRY
Coal mining on Vancouver Island started in 1847 near Port Hardy on the northeast coast. Subsequently mining moved south to the Nanaimo and Cumberland areas, where activity continued until 1967. This early period of coal min-ing activity has left a legacy of coal mine waste. There are a number of coal refuse piles on Vancouver Island, especially in the Nanaimo area, and the total accumulation may be as high as 2.5 million tonnes (Gardner 1997).
The early mines removed rock from raw coal using simple wash plants and hand picking tables to remove large rock fragments. This produced a waste product composed of large fragments of rock and high-ash coal and referred to as coarse rejects. In some areas where clean coal was being loaded onto barges, some fell off conveyors or trains
Coal waste in the Ladysmith area originates from the Extension Mine, which opened in the 1890s as an extension of the Wellington Mine. Workers were moved to the new town of Oyster Harbour, later to be called Ladysmith. A wash plant was built in the area, and waste from the plant now forms Slag Point. Coal from the wash plant was shipped out from the harbour.
THE ENVIRONMENTAL HAZARDS OF COAL REFUSE
Coal in situ contains varying amounts of rock and wa-ter in addition to the organic carbon and associated volatile
rock and report a weight percent, so the organic material is burnt off and the remaining weight reported as percent ash, which is a bit less than the original weight of included rock. Thermal coals are shipped, after removal of rock, at ash concentrations up to about 15%. Coking coals (metal-lurgical coals), which are made into coke (the fuel in blast furnaces), are washed to ash contents generally less than
over about 50% ash is not considered coal. This means that most coal mines, whether they are mining thermal or cok-ing coal, have to process the coal to remove included rock. These wash plants usually produce two streams of waste material—coarse reject (greater than 0.6 mm) and tailings (less than 0.6 mm). Generally, modern wash plants have a yield of 65% to 85%, which means that 35% to15% of the weight of raw material entering the wash plant becomes waste material dumped somewhere close to the mining ac-tivity. It is usually buried or re-contoured and vegetated, but it does represent a concentration of material from a

100 Geoscience Reports 2008
Most of the concern about coal waste involves the pos-sibility that the coal waste is leaching harmful trace metals into the environment. Coal itself is composed of environ-mentally benign organic carbon; unfortunately, coal and the rock closely associated with coal seams often contain appreciable amounts of sulphides and some trace elements. Sulphide minerals, predominantly pyrite (FeS2), often contain trace amounts of elements other than iron and will oxidize to produce acidic water that releases and mobilizes these elements. There may also be increased concentrations of certain trace elements in rock material associated with coal, which was deposited in conjunction with vegetation
some trace elements are bound in insoluble forms and con-centrated in this type of environment.
It is important to clarify the terms trace metals and trace elements as they are used in literature. The term trace metal may refer either to a metal (element) that is indeed rare or to the amount that occurs in a particular environ-ment. The term is often applied to metallic elements such as iron, magnesium, zinc, copper, chromium, nickel, cobalt, vanadium, arsenic, molybdenum, and selenium. Possibly only selenium and vanadium are actually rare in overall terms. In contrast, the term trace element is broader and generally is used to refer to any element that occurs in very small concentrations in a particular environment.
In 2007, BC coal mines were expected to produce over 25 million tonnes of clean coal and over 5 million tonnes of
sequestered within mine lease areas in such a way as to not cause environmental problems. The record for safe disposal of this material is good based on the fact that there
has been large-scale surface coal mining in BC for the last 40 years without major environmental problems related to coal waste handling.
STUDY AREAS
Samples were collected in 3 areas along the east coast of Vancouver Island, including Union Bay, Cedar Cove (Canary Cove and Clam Bay), and Ladysmith Slag Point areas (Figure 1). Union Bay was the site of the major wash plant and load-out for coal mined in the Cumberland area. Mining started in the area in 1869 when Baynes Sound Coal Company started operations in the Tsable River area; how-ever, most of the activity soon moved to the Cumberland area, where mining continued until 1953. The Tsable River
mine pillars, until 1967, when it closed as the last operating coal mine on the island.
SAMPLING AND ANALYSIS
Samples were collected from beaches, exposed banks of waste material, and from the top surface of piles of waste
and the mass of each sample collected varied based on frag-ment size and ranged from less than 1 kg to about 5 kg. Wherever possible, shallow holes up to 1 m deep were dug so that one or two samples could be collected to represent a simple stratigraphic section. On beaches, this required digging a hole up to 1 m deep (Figure 2). In some banks it was possible to sample a section up to 2 m thick (Figure

Ministry of Energy, Mines and Petroleum Resources 101
3). In some places (Union Bay intertidal zone), there was a heavy iron staining (Figure 4). A total of 43 samples were collected (Table 1). Larger samples were split, with one
sized samples. Inspection of samples provided some information on
amount of coal in samples, and those that were noticeably
-ble 2). Other samples not visibly coal-rich were sent for ash, XRF (Table 3), and ICP-MS (using a hot aqua-regia digestion; Table 4) analyses.
The XRF analysis provides a good estimate of the amount of organic matter in samples because samples are fused prior to analysis and the loss of weight is a measure of organic carbon and the remaining weight correlates closely to American Society for Testing and Materials (ASTM) ash measurements (Figure 5). It appears that ash concentration determined by XRF is about 0.5% lower, but the correlation between the 2 methods is generally very good.
ocation 662.
heavy iron staining on surface.

102 Geoscience Reports 2008
TABLE 1: SAMPLE LOCATIONS AND DESCRIPTIONS.

Ministry of Energy, Mines and Petroleum Resources 103
ECONOMIC CONSIDERATIONS
There are a number of coal refuse piles on Vancouver Island, especially in the Nanaimo area, and the total ton-nage may be as high as 2.5 million tonnes (Gardner 1997). Portable wash plants exist that can upgrade the material by removing some of the ash until the remaining product has a useable heat value. Generally this means reducing the ash content to less than 15%. A number of companies have investigated the possibility of upgrading material to a marketable thermal coal product, but at present there are no
measure of coal rheology) or free-swelling index (FSI) are lost as the coal weathers or ages at surface, so that there is no possibility of processing refuse piles to produce a coking coal product.
Most of the samples collected for this study have high ash contents (Table 3) with the exception of samples col-lected at Cedar Cove. It should be remembered that when
Figure 5: Correlation of ash determined by ASTM standard method and by XRF.

104 Geoscience Reports 2008
TABLE 3: XRF MAJOR OXIDE ANALYSES.

Ministry of Energy, Mines and Petroleum Resources 105

106 Geoscience Reports 2008
a sample is ashed, there is a loss of weight from the mineral matter, so that a concentration of approximately 85% ash corresponds to a mineral matter concentration of 100% (i.e., no organic carbon content).
RESULTS AND DISCUSSION
Sulphur occurs in coal as sulphides, as sulphates, or as organic sulphur. Trace metals may be associated with sul-phur if the sulphur is present as sulphides. These sulphides may be dispersed in coal or associated with ash. Sulphur has a negative correlation with ash and no correlation with Fe (Figure 6), indicating that a lot of the sulphur is occur-ring as organic or sulphate sulphur associated with the coal. This is probably because sulphides originally present in the coal waste have oxidized and released SO3. Trace metals would also be released and mobilized by the acidic water.
One of the advantages of pairing XRF and ICP-MS analyses is that it provides information on what proportion of major elements may be in a soluble form. XRF measures the total amount present, whereas ICP-MS measures the amount that is soluble in a hot acid leach. The amount of Fe detected by ICP-MS is similar to that detected by XRF, indicating that most of the iron is probably soluble and probably occurs in sulphides, carbonates, or hydroxides. A similar comparison for Ca, K, and Na indicates that lower percentages of these elements are potentially soluble and mobile (Figure 7).
As a starting point, it is important to understand how trace elements are distributed in coal. Coal is not 100% organic carbon—even when washed it contains an amount of included mineral matter analysed as ash. Con-sequently concentrations of trace elements in coal can have
the picture further, a lot of trace elements are associated with sulphide minerals in coal, and these sulphide minerals (mainly pyrite) may be associated with ash in the seam or with coal in the seam. In coals with varying ash contents,
to either the organic material, the ash, or the sulphides (if present in reasonable amounts). Average trace element concentrations in shales and continental crust are shown in Figure 8. There are some data for coals from Vancou-ver Island (Van De Flier-Keller and Dumais 1988) and for coals from northeastern and southeastern British Columbia (Grieve 1991) (Figure 9). It is obvious from Figures 8 and 9 that the distribution of trace elements in crustal rocks,
Union Bay, Cedar Cove, and Slag Point.
shales, and coals is similar. It appears that average element concentrations for coal waste are generally similar to world coal values (Figure 9) and a bit higher than Vancouver Is-land fresh coal values. The waste coal material has much higher ash concentrations than these suites of coal samples and probably should be compared to the average shale data (Figure 8).
There is no evidence of major enrichment or depletion of elements in the waste coal material, except for possibly enrichment in copper and chromium, which are both higher than the average values for Vancouver Island and world coals (Figure 9).
The association of trace elements for the various areas is demonstrated using linear correlation matrixes. This works well in most cases but can be misleading when the data contain a few very high or low values that overly in-
-structed for the 3 study areas—Union Bay, Cedar Cove, and Ladysmith (Tables 5, 6, and 7). These tables help identify elements that have an ash association or a sulphur (possibly pyrite) association. Most of the elements have a negative association with ash, indicating a coal or sulphide associa-tion. Plots for copper (Figure 10) indicate that copper has a weak negative correlation with ash and a correlation with sulphur that is possibly positive at low concentrations but negative at high concentrations (secondary sulphate sul-phur). Copper also has no correlation with iron (Figure 10), which does not support a sulphide association. The association of copper in samples is therefore not clear, but it may have been released from sulphides and since bound to the organic material. The association of chromium is not

Ministry of Energy, Mines and Petroleum Resources 107
clear; it has a negative correlation with ash and no correla-tion with sulphur (Tables 5 and 6), though it does correlate with other trace metals. Copper may have been bound to the organic material after being released from sulphides.
Mercury is a trace element of general concern; how-ever, in this study only 2 analyses were above the detection limit of 10 ppb, and they were both less than 20 ppb.
Arsenic is often associated with pyrite, and in this study there is no correlation with ash and, except for the 2 high values for samples 664 and 665 (Table 4), only a weak correlation with sulphur (Figure 11). There is no explana-tion for the 2 high arsenic values.
Only 2 elements (chromium and copper) are above both world averages (Clarke and Sloss 1992) and values from the Nanaimo and Comox Basins (Van Der Flier-Kel-ler and Dumais 1988) (Figure 9). These elements do not correlate with sulphur or ash but appear to correlate with other trace metals (Tables 5, 6, and 7). It appears that they are not present in sulphides but may be bound to the organic material.

108 Geoscience Reports 2008
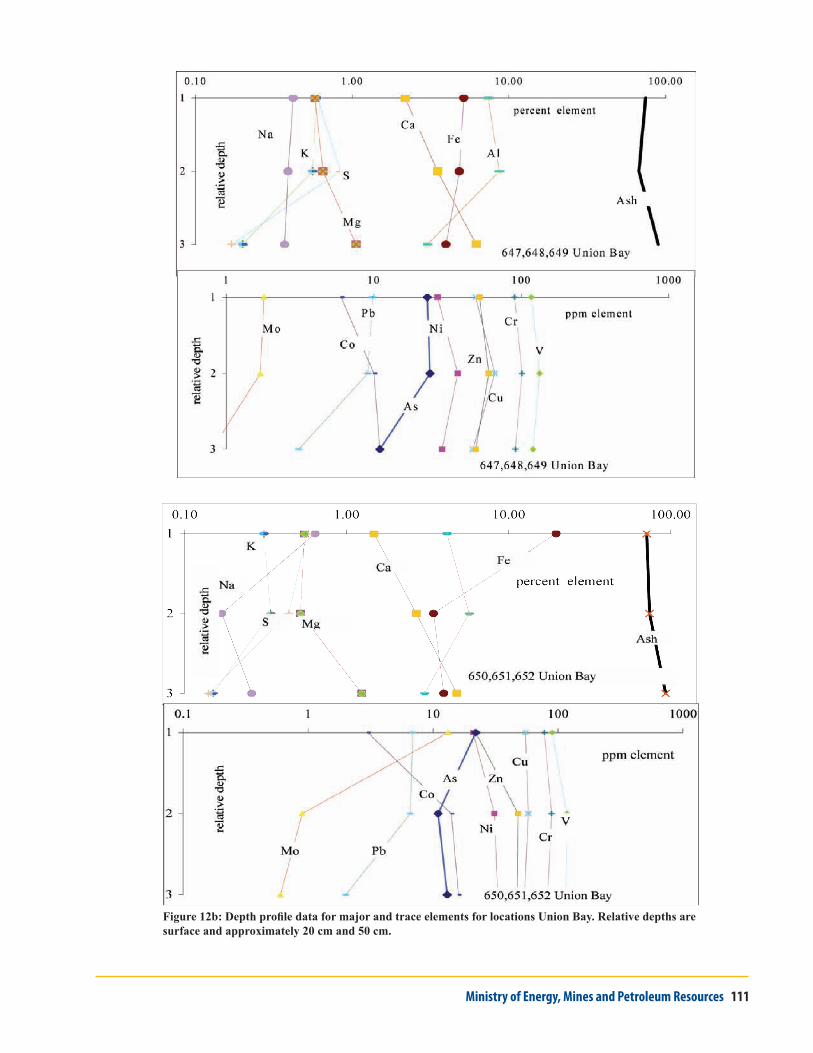
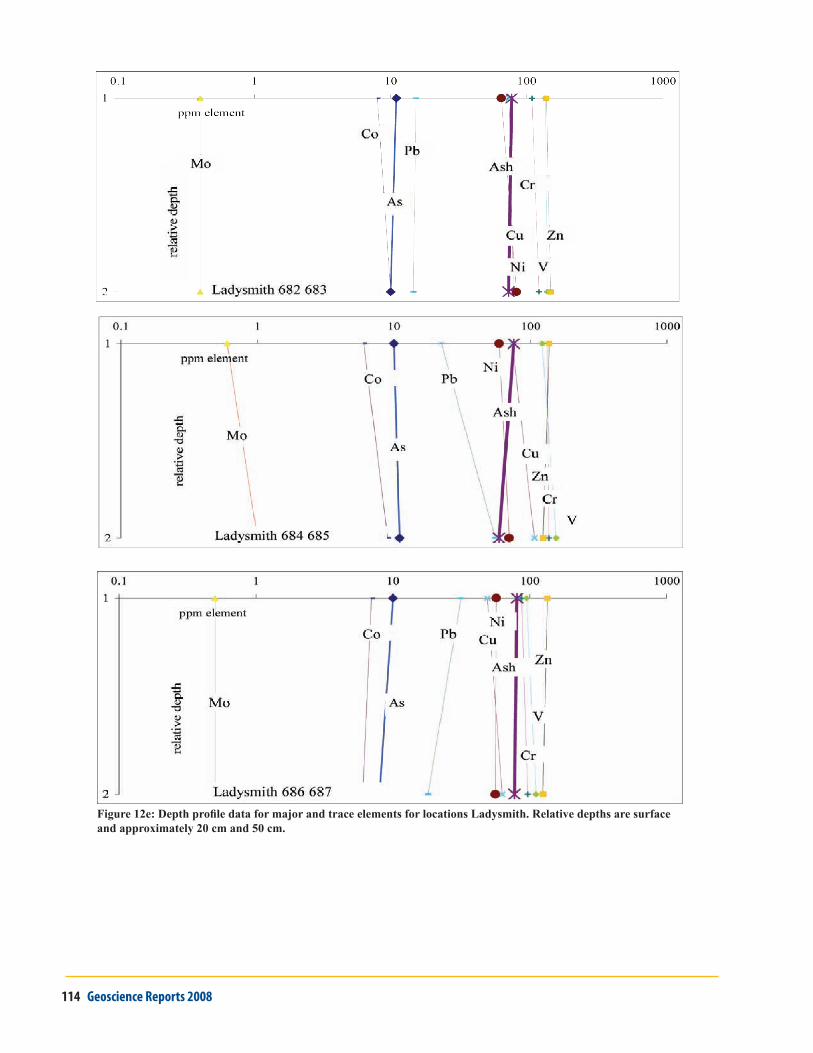
A number of small trench samples were collected at Union Bay, Cedar Cove, and Ladysmith. At each location a sample was collected at surface, a second at about 20 cm, and sometimes a third at about 50 cm depth. Data available for the sets of samples include total ash, major oxide, and trace metal concentrations. The data from Union Bay are displayed in a number of plots (Figure 12 a, b, c, d, and e).
are concentrations determined by ICP-MS and therefore represent the soluble component of the total concentration. Comparing the total concentration of iron and calcium (by XRF) to the ICP-MS concentration does not indicate a change in concentrations with depth or a change in the proportions extracted by acid leach and ICP-MS analysis
Figure 8: Average trace element data from Clark and Sloss
Figure 9: Trace elements concentrations in coals and waste
(Figure 7). For both elements, most of the iron and calcium is acid-leacheable. Trace element concentrations do not vary much with depth, indicating a lack of mobility or that any mobile component has already moved on. Ash contents of all samples are high, with little variation with depth.
Figure 11: Relationship of arsenic with ash and sulphur.

Ministry of Energy, Mines and Petroleum Resources 109
TABLE 7: CORRELATION MATRIX FOR TRACE ELEMENTS, LADYSMITH AREA.
TABLE 5: CORRELATION MATRIX FOR TRACE ELEMENTS, UNION BAY AREA.
TABLE 6: CORRELATION MATRIX FOR TRACE ELEMENTS, CEDAR COVE AREA.

110 Geoscience Reports 2008
Ministry of Energy, Mines and Petroleum Resources 111

112 Geoscience Reports 2008

Ministry of Energy, Mines and Petroleum Resources 113
114 Geoscience Reports 2008

Ministry of Energy, Mines and Petroleum Resources 115
Union Bay beach is characterized by heavy iron stain-ing and samples (644, 645, 646) (647, 648, 649), and (650, 651, 652) were collected at different depths in 3 test holes dug on this beach. There are no major changes in trace or major element chemistry with depth down to about 0.7 m at the bottom of the holes. Samples of the heavily rust-stained section at the surface have higher concentrations of iron and
depth. The material is weathered refuse from which most of the pyrite probably has been oxidized to yield sulphates and iron oxides. Samples generally have high ash contents,
-tions in terms of comparisons to coal with less ash. Swaine (1990) provides a table of average trace element concentra-tion in coal, soils, and shale, and Van Der Flier-Keller and Goodarzi (1992) provide average trace element and major oxide contents for coals from the Comox and Nanaimo
-age data from Union Bay (Figure 13). It is apparent that the Union Bay data plot in between average coal and average shale and have higher contents of most elements than do the Nanaimo and Comox coals. This is probably because the Union Bay samples have higher ash contents, which range from 30% to 94% and are generally higher than the coal samples analysed by Van Der Flier-Keller and Goodarzi (1992).
Figure 13: Comparison of trace metal data for Union Bay and Comox and Nanaimo coals.
Sized Data
A number of samples were split, and one split from
were analysed by XRF and ICP-MS. Comparing analyses -
dications of fractionation of elements by particle size and
Data (Figure 14 a and b) do not indicate any consistent pat-tern of element distribution. Major element concentrations change little from the original split (numbered 1 on the x
more variable but still do not provide a consistent pattern.
Heat Value
The heat value of coal is dependent on organic carbon and volatile matter contents of samples. It decreases with oxidation of coal and destruction of volatile matter, but generally the decrease is not large. In this study, the heat value of the samples has not been degraded, based on a plot
-ure 15), which compares heat values for fresh coals from
1992) to the samples in this study. The zero-ash heat value for all samples averages about 7929 kcal/kg, compared to 7993 kcal/kg for fresh coal samples from Nanaimo and Co-
are ash and moisture contents. A sample with 20% ash (dry
of 5555 kcal/kg (Figure 15). This is a useable heat value, though the ash chemistry becomes important, because boil-
slag. As an aside, it is important to understand the difference
between measured heat values (gross as-received, or GAR) and useable heat (net as-received, or NAR). In a power plant, the moisture associated with the coal is heated and then converted to steam when the coal is burnt. This heat is generally lost, and this is part of the reason that NAR heating value is less than GAR heating value. A gram of water at 20 ºC will require 620 calories if it is heated and turned into steam. Consequently, coal with 10% moisture will lose, when burnt, about 62 calories because of water. This means that a 40% ash sample with about 5000 kcal/kg air-dried basis (adb) will actually have about 6% less use-able heat, in part because there is 10% less material and in part because of the lost 62 calories.
Tidal samples from Union Bay appear to have higher heat values than other samples at comparable ash contents (Figure 15). These samples (644, 645, and 646) were col-
recent organic matter.

116 Geoscience Reports 2008

Ministry of Energy, Mines and Petroleum Resources 117
Figure 15: Heat value of fresh Vancouver Island coals and weathered samples from Union Bay, Cedar Cove, and Ladysmith Slag Point.

118 Geoscience Reports 2008
CONCLUSIONS
The data provide some background information on the major and trace element chemistry of the coal refuse mate-rial on and near beaches along the east coast of Vancouver Island. Generally, coal waste is fairly benign, unless it contains high concentrations of pyrite that can release trace metals and generate acid-rock drainage. Samples collected in this study generally do not have abnormally high con-centrations of trace metals or high concentrations of pyrite. There is no indication that they are releasing metals into the environment. It is possible that all or most of the pyrite is already oxidized and trace metals released and migrated out of the samples.
ACKNOWLEDGEMENTS
Samples were collected in conjunction with a study by Remi Odense, Risk Assessment and Remediation, Min-istry of the Environment, BC Government. Warren Walsh
helped with sample preparation.
REFERENCES
Clarke, L.B. and Sloss, L.L. (1992): Trace elements emissions
Agency (IEA) Coal Research Publication 49.
British Columbia Ministry of Energy, Mines and Petroleum Resources, Information Circular 1992-20.
Gardner, S.L. (1997): Coal Resources and Coal Mining on Van-couver Island; British Columbia Ministry of Employment and Investment
Grieve, D.A. and Goodarzi, F. (1994): Trace elements in coals British Co-
lumbia; British Columbia Ministry of Energy, Mines and Petroleum Resources
Swaine, D.J. (1990): Trace Elements in Coal; Butterworths, Lon-don. 1-273.
Van Der Flier-Keller, E. and Dumais, S. (1988): Inorganic mat-ter content and specialized element potential of the Nanaimo
British Co-lumbia Ministry of Energy, Mines and Petroleum Resources, Geological Fieldwork 1987, pages 435–439.
Van Der Flier-Keller, E. and Goodarzi, F. (1992): Regional vari-ations in coal quality in the Canadian Cordillera; Geological Society of America; Special Paper 267, pages 165–175.