Embed Size (px)
Citation preview
U.S. Department of EducationED Pubs8242-B Sandy CourtJessup, MD 20794-1398
Official BusinessPenalty for Private Use, $300
U.S. POSTAGE PAIDU.S. DEPARTMENTOF EDUCATION
PERMIT NO. G-17
Prekind
erg
arte
n in U.S. Pub
lic Sc
hoo
ls: 2000-20012003
Prekindergarten in U.S. Public Schools:2000-2001
U.S. Department of EducationInstitute of Education SciencesNCES 2003-019
Statistical Analysis Report
Prekindergarten in U.S. Public Schools: 2000–2001
Publication Title
U.S. Department of Education Institute of Education Sciences NCES 2003-019
Statistical Analysis Report
March 2003
Timothy Smith Anne Kleiner Basmat Parsad Elizabeth Farris Westat
Bernard Greene Project Officer National Center for Education Statistics
U.S. Department of Education Rod Paige Secretary
Institute of Education Sciences Grover J. Whitehurst Director
National Center for Education Statistics Val Plisko Associate Commissioner The National Center for Education Statistics (NCES) is the primary federal entity for collecting, analyzing, and reporting data related to education in the United States and other nations. It fulfills a congressional mandate to collect, collate, analyze, and report full and complete statistics on the condition of education in the United States; conduct and publish reports and specialized analyses of the meaning and significance of such statistics; assist state and local education agencies in improving their statistical systems; and review and report on education activities in foreign countries. NCES activities are designed to address high priority education data needs; provide consistent, reliable, complete, and accurate indicators of education status and trends; and report timely, useful, and high quality data to the U.S. Department of Education, the Congress, the states, other education policymakers, practitioners, data users, and the general public. We strive to make our products available in a variety of formats and in language that is appropriate to a variety of audiences. You, as our customer, are the best judge of our success in communicating information effectively. If you have any comments or suggestions about this or any other NCES product or report, we would like to hear from you. Please direct your comments to:
National Center for Education Statistics Institute of Education Sciences U.S. Department of Education 1990 K Street NW Washington, DC 20006
March 2003 The NCES World Wide Web Home Page is: http://nces.ed.gov The NCES World Wide Web Electronic Catalog is: http://nces.ed.gov/pubsearch Suggested Citation U.S. Department of Education, National Center for Education Statistics. Prekindergarten in U.S. Public Schools: 2000–2001, NCES 2003-019, by Timothy Smith, Anne Kleiner, Basmat Parsad, and Elizabeth Farris. Project Officer: Bernard Greene. Washington, DC: 2003. Contact: Bernie Greene (202) 502-7348 email: [email protected]
iii
EXECUTIVE SUMMARY
Background Research on the relationship between children’s early care and education and school readiness has shown the potential importance of enriching learning experiences for young children and, in particular, the positive outcomes of early intervention for educationally disadvantaged children (Love, Schochet, and Meckstroth 1996; Barnett 1995; Haskins 1989). In fact, the National Research Council suggests that a finding that young children who are at risk of school failure have a greater likelihood of success if they attend high-quality early childhood programs seems to emerge across studies of early care and education (Bowman, Donovan, and Burns 2001). In recent years, renewed attention has focused on the role that public schools might play in providing high-quality programs for prekinder-garten children (Saluja, Early, and Clifford 2001; Hinkle 2000). Educators and policymakers have considered the possibility of public schools drawing upon existing resources to expand and improve prekindergarten programs and thereby help prepare young children for school (Dwyer, Chait, and McKee 2000; Hinkle 2000). Unfortunately, data on the role public schools play in providing early childhood education are limited and are sometimes clouded by a lack of common terminology. Most of the available data do not differentiate public school programs from other early childhood education programs; the data often include programs offered by private schools, public and private day care centers, and Head Start classes operating outside of the public school system. In response to the lack of current data on public elementary school prekindergarten programs, the National Center for Education Statistics (NCES) used its Fast Response Survey System (FRSS) to conduct the “Survey of Classes That Serve
Children Prior to Kindergarten in Public Schools : 2000–2001,” FRSS 78, 2001. The survey gathered information on characteristics of the prekinder-garten classes to answer questions such as the following: • What percentage of public elementary schools
nationwide had prekindergarten classes? What percentage offered general education and special education prekindergarten classes?
• How many children were enrolled in prekindergarten classes at public elementary schools? What were the age, racial, and ethnic characteristics of these children?
• How many prekindergarten classes were offered in public elementary schools , and how were they distributed between general education and special education? What was the average size of these classes?
• How many teachers were responsible for teaching prekindergarten classes, and what was their education level? How did their pay compare with that of other teachers in the school district?
• What percentage of public elementary schools reported that prekindergarten children received transportation, meals, and extended day care services, and what percentage of prekindergarten children received those services?
The results presented in this report are based on questionnaire data from 1,843 public elementary schools in the United States. The data provide national estimates representing all special education and regular elementary and combined public schools in the nation.
iv
Key Findings Public Schools With Prekindergarten Classes During the 2000–2001 school year, there were about 19,900 public elementary schools with prekindergarten classes. This represents 35 percent of all regular and special education public elementary schools in the country. Results from the 2001 FRSS survey indicate the following: • There was a positive relationship between
public elementary schools offering prekinder-garten classes and school size,1 ranging from 28 percent of small schools to 42 percent of large schools (table 2).
• Schools in the Southeast were most likely to offer prekindergarten classes. Forty-six percent of these elementary schools offered prekindergarten compared with between 30 and 35 percent of public elementary schools in other regions (table 2).
• The likelihood that public schools offered prekindergarten classes varied by poverty concentration.2 About half (51 percent) of elementary schools with the highest poverty concentration offered prekindergarten. One-quarter (25 percent) of elementary schools with the lowest poverty concentration offered prekindergarten. It is important to note that prekindergarten programs have tended to target at-risk children, including children from low-income families (table 2).
• General education prekindergarten classes were offered by 28 percent of public elementary schools; 15 percent offered special education prekindergarten classes (table 2).
1 School size is defined as small (enrollments of less than 300
students), midsized (300 to 599 students), and large (600 or more students).
2 Poverty concentration is based on the number of students eligible to receive free or reduced-price lunch. The categories used in this report are less than 35 percent of students eligible, 35 to 49 percent eligible, 50 to 74 percent eligible, and 75 percent or more eligible.
Prekindergarten Children in Public Schools Responses to the survey revealed that approximately 822,000 children, categor ized as younger than 3 years, 3 years, 4 years, and 5 years or older, were enrolled in public elementary school prekindergarten classes (table 4). As of October 1, 2000, 20 percent of the children were 3-year-olds and 68 percent were 4-year-olds (figure 2). Larger percentages of children enrolled in special education prekindergarten classes were younger than 3 years, 3 years, or 5 years or older, compared with those in general education prekindergarten classes. The survey also asked about the racial and ethnic background of public school prekindergarten children.3 About half (49 percent) of the children were White, 24 percent were Hispanic, 23 percent were Black, 3 percent were Asian, and 2 percent were American Indian/Alaska Native (table 6). Nationwide, 61 percent of all public school students are White, 17 percent are Hispanic, 17 percent are Black, 4 percent are Asian, and 1 percent are American Indian/Alaska Native.4 Other findings on the racial and ethnic background of public school prekindergarten children include the following: • In city schools, 28 percent of the prekinder-
garten children were White, 35 percent were Hispanic, and 33 percent were Black (table 6). In contrast, in rural/small town schools, 74 percent of the prekindergarten children were White, 10 percent were Hispanic, and 12 percent were Black. Among all public
3 Race and ethnicity were reported on the questionnaire using five
categories: American Indian/Alaska Native; Asian; Black, non-Hispanic; Hispanic; and White, non-Hispanic. To improve readability, the following labels are used throughout the remainder of this report: American Indian/Alaska Native; Asian; Black; Hispanic; and White.
4 National Center for Education Statistics, Common Core of Data 2000–2001, Public Elementary/Secondary School Universe Survey (NCES 2002–362). U.S. Department of Education. Washington, DC: National Center for Education Statistics, unpublished tabulations. Data are based on all public regular and special education, vocational education, and alternative education schools.
v
school students in city schools nationwide, 37 percent are White, 27 percent are Hispanic, and 30 percent are Black. Nationwide, 79 percent of all rural/small town public school students are White, 7 percent are Hispanic, and 10 percent are Black.5
• Forty-seven percent of public school prekindergarten children were Hispanic at schools in the West, compared with 9 percent at schools in the Southeast (table 6). Thirty-three percent of all public school students in the West were Hispanic, as were 7 percent of students in the Southeast.6
• In schools with the lowest level of poverty, 79 percent of the prekindergarten children were White, 8 percent were Hispanic, and 7 percent were Black (table 6). In schools with the highest level of poverty, 22 percent of the prekindergarten children were White, 39 percent were Hispanic, and 36 percent were Black. Nationwide, 79 percent of all students in public schools with the lowest level of poverty were White and 8 percent were Black. In schools with the highest level of poverty, 15 percent of students were White and 39 percent were Black.7
There are federal and state programs designed to provide limited English proficient (LEP) children,8 low-income children,9 and children with disabilities with early childhood education experiences, such as Title I programs, Head Start, Even Start, and the Preschool Grants Program. Public school programs for children prior to kindergarten also receive funds from state initiatives for enhancing school readiness.
5 See footnote 4. 6 See footnote 4. 7 See footnote 4.
8 For this study, these children were defined as those “whose native or dominant language is other than English, and whose skills in listening to, speaking, reading, or writing English are such that he/she derives little benefit from school instruction in English.”
9 For this study, these children were defined as those eligible to receive free or reduced-price lunch.
For this survey, public school officials were asked to report the number of LEP prekindergarten children, low-income prekindergarten children, and prekindergarten children with Individua lized Education Programs (IEPs) in their schools. Findings from the FRSS survey show the following: • Fifteen percent of public elementary school
prekindergarten children were LEP (table 7). This percentage varied by school size, locale, and region. Nationwide, 9 percent of all public school students received LEP services.10
• Sixty-one percent of prekindergarten children were low income (table 7). This percentage varied by school size, locale, region, and percent minority enrollment. Forty-five percent of all students attending elementary schools that participate in the National School Lunch Program were eligible to receive free or reduced-price lunch during the 1998–99 school year (Fox et al. 2001).
• Thirty percent of the children enrolled in public elementary school prekindergarten classes had IEPs (table 7). This varied by percent minority enrollment and poverty concentration. Nationwide, about 13 percent of all public school students had IEPs.11
Prekindergarten Classes in Public Schools During the 2000–2001 school year, about 58,500 prekindergarten classes were offered in U.S. public elementary schools (table 8). About two-thirds (67 percent) of these classes were general education classes; 33 percent were special education classes (table 9). Study results also indicate the following:
10National Center for Education Statistics, Common Core of Data
2000–2001, Local Education Agency Survey: School Year 2000–2001 (NCES 2002–360). U.S. Department of Education. Washington, DC: National Center for Education Statistics, unpublished tabulations.
11See footnote 10.
vi
• The percentage of special education prekinder-garten classes was higher in schools with the lowest poverty concentration than in schools with the highest poverty concentration (40 percent compared with 23 percent, respectively) (table 9).
• Overall, public elementary schools that offered prekindergarten averaged 2.9 pre-kindergarten classes per school (table 10). City schools averaged 3.4 classes per school, whereas rural/small town schools averaged 2.4 classes per school. The average also varied by region, minority enrollment, and poverty concentration.
• The average public elementary school prekindergarten class had 14 children (table 11). The average number of children per general education prekindergarten class was higher than the average for special education classes, with 17 children per class among general education classes compared with 9 children per class among special education classes.12
• Thirty-two percent of the classes followed full-day schedules, and 68 percent followed half-day schedules (table 12). This distribution varied by several school characteristics. For example, 77 percent of the classes in schools in the Southeast were on full-day schedules, compared with 13 percent of the classes in the Central region.
Prekindergarten Teachers in Public Schools School officials were asked to report the number of teachers who taught prekindergarten during the 2000–2001 school year. In addition, they were asked to provide basic information on the teachers’ educational backgrounds and the pay scale used to determine their salaries. Results of the FRSS survey indicate the following:
12Among the sampled schools responding to this survey, the average
number of children per prekindergarten class ranged from 2 to 48 overall for general education classes. For special education classes, the average ranged from 2 to 35 children per prekindergarten class.
• Nearly 46,000 teachers taught prekindergarten classes in public schools during the 2000–2001 school year (table 13).
• Eighty-six percent of the prekindergarten teachers had a bachelor’s or higher degree (table 14). Prekindergarten teachers in city schools, and in schools in the Northeast and Central regions, were more likely than their counterparts in other locales and regions to have a bachelor’s or higher degree.
• The majority (82 percent) of public elementary school prekindergarten teachers were paid using the public elementary school teacher pay scale (table 14). This likelihood varied by school size, locale, region, and poverty concentration.
Support Services Offered to Prekindergarten Children in Public Schools Public elementary school prekindergarten children and their families receive various support services. The survey asked about three of these services: transportation, meals,13 and extended day care. The survey asked schools to report the number of prekindergarten children who received the service during the 2000–2001 school year. The study findings indicate the following: • Prekindergarten children in 79 percent of
schools with prekindergarten classes received transportation services (table 15), and 52 percent of all prekindergarten children received this service (table 16). These percentages varied by several school characteristics.
• Seventy-four percent of schools with pre-kindergarten classes provided meals to prekindergarten children (table 15), and 64 percent of all prekindergarten children received meals at school (table 16). These distributions also varied by school characteristics.
13Schools were instructed to exclude snacks.
vii
• Extended day care was offered by 18 percent of public elementary schools with prekinder-garten classes (table 15), and 5 percent of all prekindergarten children received this service (table 16).
Prekindergarten Funding Sources in Public Schools Public elementary schools use a varie ty of funding sources to support prekindergarten classes. The survey gathered information on the use of various sources: state or local education funds; federal or local programs for children with disabilities; Title I, Part A; Head Start; child care funds through a state or local agency; and Title I, Part B. Study findings indicate that 80 percent of public elementary schools used state or local education funds and 51 percent used funds from federal or local programs for children with disabilities (table 17). The likelihood that schools used the latter source was higher in rural/small town schools (56 percent) than in city schools (42 percent). Receipt of Title I, Part A funds for prekindergarten classes was reported by 25 percent of public elementary schools with prekindergarten classes, and
13 percent reported receipt of Head Start funds. Eleven percent of schools used child care funds through a state or local agency, and 4 percent used Title 1, Part B funds for prekindergarten classes. In conclus ion, the results from this survey offer an overview of public school prekindergarten classes in the United States. During the 2000–2001 school year, approximately 822,000 children were enrolled in 58,500 public elementary school prekindergarten classes nationwide. These classes were offered in about 19,900 public elementary schools, roughly one-third of public elementary schools in the country. Approximately 45,900 prekindergarten teachers instructed these classes. Many characteristics of the prekindergarten classes varied by school characteristics (including school size, locale, region, percent minority enrollment, and poverty concentration). The findings from this FRSS survey provide unique and important contextual information on public elementary schools with prekindergarten classes and the children who were enrolled in those classes.

viii
ix
ACKNOWLEDGMENTS
The authors wish to thank the many individuals who contributed to the development of the survey and this report. The survey was requested by Naomi Karp, Former Director, National Institute on Early Childhood Development and Education, Office of Educational Research and Improvement. James Griffin14 of the Early Childhood Institute, Diane Early and Gitanjali Saluja 15 at the University of North Carolina, Chapel Hill, and Jerry West in the Early Childhood, International, and Crosscutting Studies Division, NCES, provided valuable input into the development of the survey. Dr. West also contributed greatly during the preparation of the survey report. At Westat, Debbie Alexander directed the data collection efforts, assisted by Ratna Basavaraju. Alla Belenky was the programmer. Carol Litman
14Dr. Griffin is currently with the Executive Office of the President,
Office of Science and Technology Policy. 15Dr. Saluja is currently with the National Institute for Child Health
and Human Development, Division of Epidemiology.
edited the report, which was formatted by Sylvie Warren. Additional word processing support was provided by Catherine Marshall. Numerous NCES staff reviewed the report and made constructive comments and suggestions, including Stephen Broughman, Shelley Burns, Elvira Germino-Hausken, Arnold Goldstein, William Hussar, Val Plisko, John Ralph, Marilyn Seastrom, and Bruce Taylor. Reviewers from outside of NCES were Margaret Burchinal, University of North Carolina, Chapel Hill; W. Steven Barnett, Rutgers University; Stephanie Cronen and Lawrence Lanahan, American Institutes for Research, Education Statistics Services Institute; and Robert Pianta, University of Virginia.

x
xi
Table of Contents
Section Page
Executive Summary......................................................................................................... iii Acknowledgments ........................................................................................................... ix
1 Introduction .................................................................................................................... 1 Definitional Issues........................................................................................................... 2 Participation in Public School Prekindergarten .................................................................. 2 About This Study............................................................................................................. 3 Organization of This Report ............................................................................................. 5 2 Public Schools with Prekindergarten Classes ..................................................................... 7 Overall Prevalence of Public Schools With Prekindergarten Classes ................................... 7 Prevalence of Public Schools With General Education or Special Education
Prekindergarten Classes ................................................................................................ 10 Prevalence of Public Schools With Only Full-Day, Only Half-Day, or Both Types of
Prekindergarten Classes ................................................................................................ 12 3 Prekindergarten Children in Public Schools ....................................................................... 15 Number of Prekindergarten Children in Public Schools ...................................................... 15 Age of Prekindergarten Children in Public Schools ............................................................ 18 Racial/Ethnic Backgrounds of Prekindergarten Children in Public Schools .......................... 19 Public School Prekindergarten Children Who Were Limited English Proficient ................... 21 Public School Prekindergarten Children Who Were Low Income........................................ 21 Public School Prekindergarten Children With Individualized Education Programs ............... 23 4 Prekindergarten Classes in Public Schools ......................................................................... 25 Number of Prekindergarten Classes .................................................................................. 25 Average Number of Children Per Prekindergarten Class in Public Schools .......................... 31 Prekindergarten Class Schedules in Public Schools ............................................................ 33 5 Prekindergarten Teachers in Public Schools ...................................................................... 37 Number of Prekindergarten Teachers in Public Schools...................................................... 37 Public School Prekindergarten Teachers’ Educational Background ..................................... 37 Prekindergarten Teacher Salaries in Public Schools ........................................................... 40 6 Support Services Offered to Prekindergarten Children in Public Schools ............................. 41 Public Schools Offering Support Services to Prekindergarten Children ............................... 41 Prekindergarten Children Receiving Support Services in Public Schools ............................. 43
xii
Table of Contents (continued)
Section Page 7 Public School Prekindergarten Funding Sources ................................................................ 47 8 Summary ........................................................................................................................ 51 References ...................................................................................................................... 55
List of Appendices
Appendix A Survey Methodology........................................................................................................ A-1 B Standard Error Tables ...................................................................................................... B-1 C Survey Questionnaire....................................................................................................... C-1
List of Text Tables
Text Table Page 1 Number and percentage distribution of public elementary schools and elementary
schools with prekindergarten classes, by selected school characteristics: 2000–2001........... 8 2 Number of public elementary schools, number and percent of elementary schools with
prekindergarten classes, and percent of elementary schools with general education and special education prekindergarten classes: 2000–2001........................................................ 9
3 Percent of public elementary schools offering full-day only, half-day only, both types,
or no prekindergarten classes, by selected school characteristics: 2000–2001. ...................... 12 4 Number and percentage distribution of public elementary school prekindergarten
children, by selected school characteristics: 2000–2001...................................................... 16 5 Number of public elementary school prekindergarten children and of those, percent in
general education and special education classes, by selected school characteristics: 2000–2001 ...................................................................................................................... 17
6 Number and percent of public elementary school prekindergarten children of various
racial/ethnic backgrounds, by selected school characteristics: 2000–2001............................ 20
xiii
Table of Contents (continued)
List of Text Tables (continued)
Text Table Page 7 Percent of all public elementary school prekindergarten children who were limited
English proficient, percent who were low income, and percent with Individualized Education Programs, by selected school characteristics: 2000–2001.................................... 22
8 Number and percentage distribution of public elementary school prekindergarten classes,
by selected school characteristics: 2000–2001 ................................................................... 26 9 Number of public elementary school prekindergarten classes, and of those, percent that are
general education and special education classes, by selected school characteristics: 2000–2001 ...................................................................................................................... 29
10 Average number of public elementary school prekindergarten classes per school, overall
and by type of class, by selected school characteristics: 2000–2001 .................................... 30 11 Average number of public elementary school prekindergarten children per class, overall
and by type of class, by selected school characteristics: 2000–2001 .................................... 32 12 Percent of public elementary school prekindergarten classes, by type of class schedule,
by days per week, by selected school characteristics: 2000–2001........................................ 34 13 Number and percentage distribution of public elementary school prekindergarten
classroom teachers, by selected school characteristics: 2000–2001...................................... 38 14 Percent of public elementary school prekindergarten teachers with a bachelor’s or higher
degree and percent paid using lower, the same, or higher salary scales than those of other public elementary school teachers, by selected school characteristics: 2000–2001................ 39
15 Percent of public elementary schools with prekindergarten classes indicating that at least
one prekindergarten child received various services, by type of class schedule, by selected school characteristics: 2000–2001..................................................................................... 42
16 Percent of public elementary school prekindergarten children who received various
services, by selected school characteristics: 2000–2001...................................................... 44 17 Percent of public elementary schools with prekindergarten classes indicating receipt of
money for prekindergarten services from various sources, by selected school characteristics: 2000–2001 ...................................................................................................................... 48
xiv
Table of Contents (continued)
List of Figures
Figure Page 1 Percent of public elementary schools with general education prekindergarten classes
only, with special education prekindergarten classes only, with both types of classes, and with no prekindergarten classes: 2000–2001 ...................................................................... 11
2 Percent of public elementary school prekindergarten children by age, overall and by type
of class: 2000–2001 ......................................................................................................... 18 3 Percent of public elementary schools with prekindergarten classes, by the number of
classes offered: 2000–2001 .............................................................................................. 27 4 Percent of public elementary schools with prekindergarten classes, by the number of
general education prekindergarten classes offered: 2000–2001 ........................................... 27 5 Percent of public elementary schools with prekindergarten classes, by the number of
special education prekindergarten classes offered: 2000–2001 ............................................ 28 6 Percent of public elementary schools with prekindergarten classes indicating receipt of
money, nonreceipt, or uncertainty of receipt for prekindergarten services from various sources: 2000–2001 ......................................................................................................... 49
1
1. INTRODUCTION
Research on the relationship between children’s early care and education and school readiness1 has shown the potential importance of enriching learning experiences for young children, and the positive outcomes of early intervention for educationally disadvantaged children in particular2 (Bowman, Donovan, and Burns 2001; Barnett 1995; Haskins 1989). Although the literature is not without controversy (Gomby et al. 1995), and the influence of nonprogram factors (e.g., family background) on children’s school readiness cannot be ruled out, a finding seems to emerge across studies: children in high-quality early childhood programs tend to develop better social and academic skills than their counterparts in poor-quality programs (Bowman, Donovan, and Burns 2001; Love, Schochet, and Meckstroth 1996). In addition, new research on kindergartners underscores the importance of enriching early learning experiences for children from disadvantaged backgrounds. In particular, while children from disadvantaged backgrounds catch up with peers from more advantaged backgrounds on basic early literacy skills such as letter knowledge during the kindergarten year, the gap between these two groups widens on measures of more sophisticated knowledge and skills in reading (e.g., ending sounds) and math (solving simple addition and subtraction problems) (West, Denton, and Reaney 2000). In recent years, attention has focused on how the public school system could increase its involvement in making high-quality programs available for prekindergarten children (Hinkle
1 As used here, school readiness includes physical well-being and
motor development, social and emotional development, cognitive general knowledge, approaches to learning, and language development. Federal and state/school district initiatives (e.g., Head Start and prekindergarten classes) focus primarily on school readiness.
2 These outcomes include enhanced school achievement, improved social skills, reduced likelihood of placement in special education classes or retention in grade during elementary and secondary grades, and general well-being (Schulman, Blank, and Ewen 1999).
2000). This attention on public schools is partially based on the assumption that in addition to a vested interest in school readiness, public schools have tremendous potential for drawing on existing resources to expand and improve prekindergarten programs (Dwyer, Chait, and McKee 2000; Hinkle 2000). Public schools have access to several federally and state funded programs focused on the needs of at-risk children, including those whose families do not speak English at home, who come from low-income households, or who have other special needs that place them at serious disadvantage when entering schools (Hinkle 2000). Under the Individuals with Disabilities Education Act (IDEA), public schools have access to federal preschool grants to make a range of education and related services available to children with disabilities. Title I of the Elementary and Secondary Education Act, designed to aid educationally disadvantaged children, can also be used by education agencies and schools to improve the teaching and learning of young children in high-poverty schools and those who are at most risk of school failure. The largest federal program for young children from disadvantaged backgrounds—Head Start—is designed to better prepare poor children for school by providing free education and support services to children whose families are below the federal poverty level. Although the vast majority of Head Start programs either operate independently of the school and school district or collaborate with other community-based agencies in private settings, some may be located at school facilities and offered through school districts or state agencies3 (Clifford, Early, and Hills 1999; U.S. General Accounting Office 1999). Public school programs for children prior to kindergarten also receive funds from state
3 Some Head Start Programs located at public school facilities may
lease space from the school and operate as completely independent entities outside of the public school system.
2
initiatives for enhancing school readiness. State initiatives differ in the age groups that are served. In a 1999 review of state -level programs, 31 state initiatives were found to serve both 3- and 4-year-olds, 18 states limited their programs to 1 year prior to kindergarten, and 8 states had programs that served children from birth to age 5 (Schumacher, Greenberg, and Lombardi 2001). This 1999 review found that states also differ in how they involve public schools in their early education initiatives. Although the majority of states opened up funds to a broad range of providers (including Head Start, public schools, and child care centers), 14 states restricted their initiatives either wholly or primarily to public schools. In many states, public schools, Head Start, and other early care and education providers partner to provide services to the children in the state (Schulman, Blank, and Ewen 1999; Schumacher, Greenberg, and Lombardi 2001). Despite the increased interest in the role of public schools in preparing children for kindergarten entry (Saluja, Early, and Clifford 2001), there is little information that differentiates public school programs from other early childhood education programs, including private schools, public and private day care centers, and Head Start programs. This is partly because there is no centralized repository of prekindergarten data for classes in public or nonpublic schools,4 and there is no common terminology for the various types of early education programs. Consequently, the existing data about public school involvement in early education programs are not uniform and often are clouded by varying definitions of programs and the age groups included in different data sources.
4 Public elementary and secondary education is administered by state
and local boards of education, and traditionally a great deal of basic information has been gathered and reported about these schools and students (e.g., the Common Core of Data, Schools and Staffing Survey). Programs for children prior to kindergarten, however, have been provided by diverse groups and organizations, including public schools, private schools, churches, public and private day care centers, and Head Start programs. Although Kisker et al. (1991) examined early education settings in 1990, there has been no means for ongoing collection of data across the various providers.
Definitional Issues Public school prekindergarten is part of a fragmented array of early care and education programs that vary widely in focus, quality, content, organization, source of funding, relationship to the public school system, and government regulation (Bowman, Donovan, and Burns 2001). Many terms have been used interchangeably and/or inconsistently across studies to describe these various programs. Most researchers in the field use the term “center-based” programs to refer to all types of public and private programs that provide children with care and education in nonresidential settings during the years prior to kindergarten—including prekinder-garten, Head Start, preschool, nursery school, day care centers, and other early childhood care (Hofferth et al. 1998). However, terms such as prekindergarten, preschool, and preprimary are sometimes used in a generic fashion to cover all or some center-based programs that serve children ages 3 to 5 who have not yet entered kindergarten. For the purpose of reviewing existing data on the role of public school involvement in early childhood education in this report, the term “public school prekindergarten” will refer to programs housed in public schools and/or classes at public schools that primarily serve children ages 3 to 4 who have yet to enter kindergarten. This definition is partially based on prekindergarten’s primary focus on school readiness and the initiatives taken by many states to extend their programs to serve 3- and 4-year-olds (and, in some cases, 5-year-olds) who have not yet entered kindergarten. Based on their diverse needs, these children may be enrolled in either a program of general education or special education, or in some states, in a prekindergarten program that collabor-ates with Head Start. Participation in Public School Prekindergarten Most of the existing data on public school prekindergarten consist of estimates that do not differentiate prekindergarten from other early education programs and are based on surveys that
3
collect information from parents. Federal surveys that collect periodic data on early education programs include the Current Population Survey (CPS), the Survey of Income and Program Participation (SIPP), and the National Household Education Survey (NHES). Because the focus of these national surveys on early childhood education has been broad and a common terminology is lacking, it is difficult to get a clear picture of public school prekindergarten. Information from the providers of public school prekindergarten classes—schools or school districts—has been made available through other U.S. Department of Education surveys. The NCES annual Common Core of Data (CCD) surveys, for instance, routinely collect grade-specific information on enrollment in public schools. Based on state-level CCD data, Young (2002) reported that about 796,000 prekinder-garten children were enrolled in public schools in the fall of 2000. These estimates were not comparable to earlier data on prekindergarten enrollment because of changes in reporting practices. For example, public schools in some states do not report the children enrolled in classes prior to kindergarten. In most of these cases, the classes are not usually referred to as prekinder-garten; they may be funded and/or offered independently of the school; 5 or they may be funded by a combination of sources. The existing information on early childhood education is inadequate for describing public school prekindergarten classes. Most of the data depend on reports from parents of children rather than agencies—schools, school districts, and state education agencies—that are in the best position to provide program information. In addition, information on public school prekindergarten is often combined with data from other early education programs, such as Head Start, that may operate outside of the public school system, and
5 This was very noticeable during the preliminary work for this study
(e.g., feasibility calls, pretests, and pilot study). The Public Universe file of the CCD defines prekindergarten as a group or class that is part of a public school program, and is taught during the year or years preceding kindergarten (Bairu 2001). Based on this definition, some schools may not report classes or students prior to kindergarten because those classes may operate independently of the school.
from other center-based programs. Moreover, even the existing data that focus specifically on prekindergarten enrollment in public schools (e.g., CCD) are limited in that they do not provide key information about class or student characteristics. The limitations in these data sources underscore the need for information that quantifies the role of public schools in educating children prior to kindergarten (see methodology in appendix A for additional detail). About This Study In response to the lack of current data about prekindergarten classes in public schools and the children who are enrolled in such classes, the National Center for Education Statistics (NCES) conducted the Survey of Classes That Serve Children Prior to Kindergarten in Public Schools for the Early Childhood Institute. This study, the first national data collection focused exclusively on prekindergarten classes offered by U.S. public elementary schools,6 provides basic information on prekindergarten enrollment and more detailed information on student and class characteristics. These data may help to inform policy about public school involvement in the education of the nation’s youngest citizens. The study addressed several key questions: • What percentage of public elementary schools
nationwide had prekindergarten classes? What percentage offered general education and special education prekindergarten classes?
• How many children were enrolled in prekindergarten classes at public elementary schools? What were the age, racial, and ethnic characteristics of these children?
• How many prekindergarten classes were offered in public elementary schools , and how were they distributed between general
6 Public special education and regular elementary and combined
schools were included in the study sample. These schools are referred to as public elementary schools throughout this report. See methodology in appendix A for a detailed description of school types.
4
education and special education? What was the average size of these classes?
• How many teachers were responsible for teaching prekindergarten classes, and what was their education level? How did their pay compare with that of other teachers in the school district?
• What percentage of public elementary schools provided transportation, meals, and extended day care to prekindergarten children, and what percentage of prekindergarten children received those services?
This study defines prekindergarten as public school classes that serve children prior to kindergarten entry, regardless of whether those classes were referred to as prekindergarten, preschool, or some other name. The classes included special education and general education classes.7 To capture the broad range of classes that serve children prior to kindergarten in public schools, some of the information (e.g., student enrollment by age) was collected according to two broad and mutually exclusive types of classes: • General education classes for children prior
to kindergarten, including combined/inclusive classes,8 Title I classes, Head Start classes that were part of a district-administered program, and any other classes primarily for 3- or 4-year-olds prior to kindergarten.
• Special education classes for children prior to kindergarten, including classes with 5-year-olds that had not yet entered kindergarten; for this study, special education classes were defined as classes that serve only children with Individualized Education Programs (IEPs).
7 To improve readability, the term “general education classes” will be
used throughout the report to refer to all classes that serve children prior to kindergarten, except special education classes (i.e., classes that serve only children with Individualized Education Programs (IEPs)).
8 Combined or inclusive classes have both general and special education students. In addition, some general education classes may include students who are at risk of developing a disability but do not yet have IEPs.
Classes that were primarily for children who were younger than 3 years and Head Start classes that were not administered by the school district were excluded (see methodology in appendix A for rationale). The separation of selected survey questions by class type was based on the assumption that special education prekindergarten classes and children would differ from general education prekindergarten classes and children. For example, it was assumed that special education classes would be smaller and the children would tend to be slightly older. This assumption was based, in part, on pretest findings. Some pretest respondents, using a preliminary study definition of prekindergarten classes (i.e., classes primarily for 3- or 4-year-olds prior to kindergarten), excluded some special education classes prior to kindergarten because the classes enrolled children who were primarily 5 years or older. The study was conducted through the NCES Fast Response Survey System (FRSS) during spring 2001. Approximately 2,000 public elementary schools 9 were included in the study sample. Questionnaires were mailed to the principal of each sampled school, with a letter requesting that the questionnaire be completed by the school staff member who was most knowledgeable about the classes offered for children prior to kindergarten. A total of 1,843 schools responded to the survey, for a weighted response rate of 94 percent. The questionnaire responses were weighted to produce national estimates that represent all special education and regular elementary and combined public schools in the United States. All comparative statements in this report have been tested for statistical significance using trend tests or t-tests adjusted for multiple comparisons,10 and are significant at the 0.05 level. However, not all
9 The sample of schools was drawn from the 1998–99 NCES CCD
School Universe file. Therefore, only classes conducted in public school buildings—not those operated by public school systems but conducted outside of school buildings (e.g., those conducted in leased space at community centers or at private schools)—were included in the sampling frame.
10The Bonferroni adjustment was used to adjust for multiple comparisons.
5
the significant differences are reported, because some are not of substantive interest or importance. In this report, some differences that appear large may not be statistically significant, due in part to the relatively large standard errors surrounding the estimates because of the small sample size. Appendix A provides a detailed discussion of the sample and survey methodology. Most survey estimates presented in this report are shown at the national level and by selected school characteristics—school enrollment size, locale (i.e., city, urban fringe/large town, rural/small town), region (i.e., Northeast, Southeast, Central, West), percent minority enrollment, and poverty concentration (as defined by the percentage of students eligible to receive free or reduced-price lunch). These characteristics are fully described in appendix A. It should be noted that percent minority enrollment and poverty concentration are based on school-level data, not on data from the prekindergarten classes that are the focus of this report. Also, it is important to note that many of the school characteristics used for independent analyses may be related to each other. For example, school size and locale are related, with city schools typically being larger than rural schools. Similarly, poverty concentration and minority enrollment are related, with schools with a high minority enrollment also more likely to have a high concentration of poverty. Other relationships between analysis variables may exist. Because of the relatively small sample size used in this study, it is difficult to separate the
independent effects of these variables. Their existence, however, should be considered in the interpretation of the data presented in this report. Organization of This Report This report presents information about general and special education prekindergarten classes in public elementary schools in 2000–2001. The discussion is divided into chapters that reflect the major topics addressed in the questionnaire. Chapter 2 highlights the characteristics of public schools that offered prekindergarten classes, and chapter 3 describes the children who were enrolled in those public school classes. Characteristics of the public school prekindergarten classes are presented in chapter 4, including information on the number of classes offered, the class schedule (e.g., full day versus half day), and the number of children enrolled in each type of class. Chapter 5 reports on the number of public school prekindergarten teachers and their credentials and salaries. Chapter 6 describes the student support services that public school prekindergarten children receive (e.g., school meals, transportation). Funding sources for public school prekindergarten classes are described in chapter 7. The concluding chapter summarizes the findings of the study. A detailed survey methodology (appendix A) and tables of standard errors for all data presented in this report (appendix B) are included as technical appendices. The questionnaire is presented in appendix C.

6
7
2. PUBLIC SCHOOLS WITH PREKINDERGARTEN CLASSES
This survey is the first to characterize public elementary school11 prekindergarten classes nationwide. The data provide an overview of the schools with prekindergarten classes and describe several features of the classes. For example, • What percentage of public elementary schools
nationwide has prekindergarten classes? Does the percentage of schools vary by school characteristics?
• What percentage of public elementary schools offers only general education prekindergarten classes? What percentage of schools offers only special education prekindergarten classes? What percentage of schools offers both types of classes?
• What percentage of public elementary schools offers only full-day prekindergarten classes? What percentage of schools offers only half-day prekindergarten classes? What percentage of schools offers both types of classes?
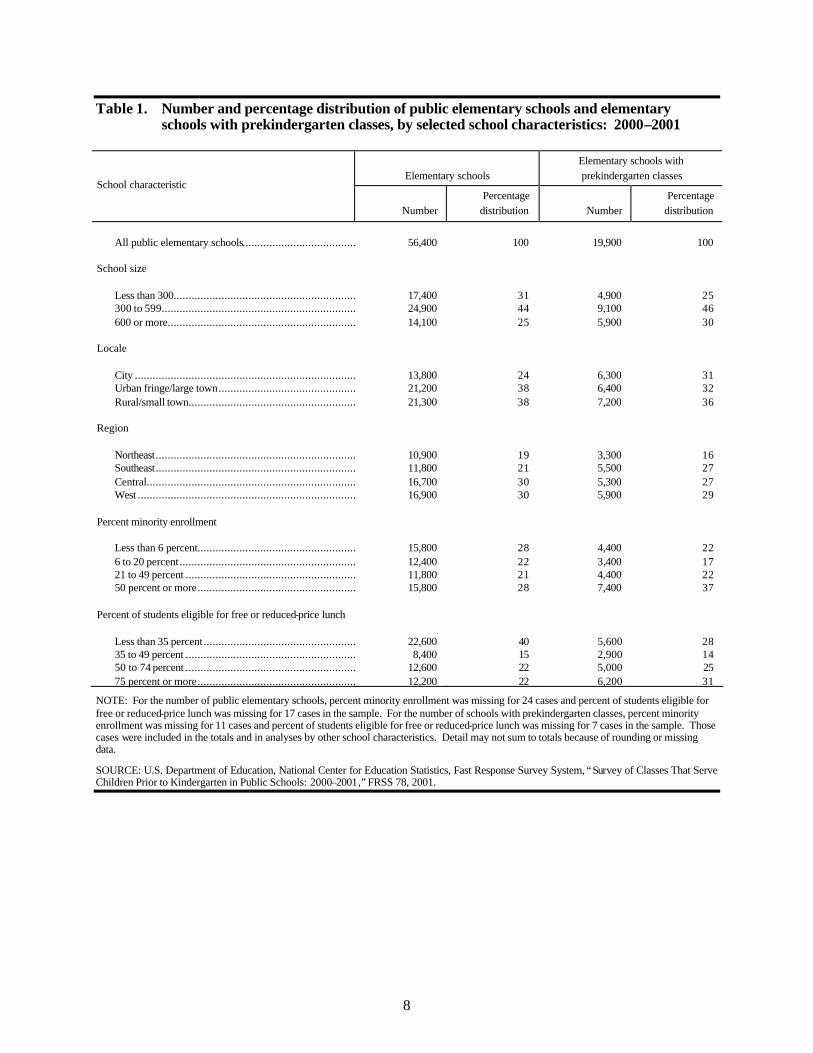
Overall Prevalence of Public Schools With Prekindergarten Classes During the 2000–2001 school year, there were about 56,400 public elementary schools, 19,900 (35 percent) of which had prekindergarten classes (tables 1 and 2). Table 1 shows the distribution of public elementary schools (column 2) and the distribution of public elementary schools with prekindergarten classes (column 4).12 As can be 11For this study, “public elementary school” refers to public special
education and regular elementary and combined schools. A school was defined as an elementary school if the lowest grade was less than or equal to grade 3 and the highest grade was less than or equal to grade 8. Combined schools contain both elementary and secondary grades (e.g., K to 12 or 1 to 9). See appendix A for a detailed description of school types.
12For similar percentage distributions, see the following, tables: Table 4. Number and percentage distribution of public elementary
seen, 31 percent of all public elementary schools were small (enrollments of less than 300 students), 44 percent were midsized (300 to 599 students), and 25 percent were large (600 or more students); 25 percent of the schools with prekindergarten classes were small, 46 percent were midsized, and 30 percent were large. In addition, 22 percent of the public schools with prekindergarten classes had minority enrollments of less than 6 percent, 17 percent of the schools had minority enrollments of 6 to 20 percent, 22 percent of the schools had minority enrollments of 21 to 49 percent, and 37 percent of the schools had minority enrollments of 50 percent or more. Among the 19,900 public schools with prekindergarten classes during the 2000–2001 school year, the likelihood of elementary schools offering prekindergarten classes increased with school size: 28 percent of small elementary schools had a prekindergarten program, whereas 36 percent of midsized and 42 percent of large elementary schools had prekindergarten classes (table 2). City schools were more likely than urban fringe/large town schools or rural/small town schools to have prekindergarten classes. The classes were offered in 45 percent of city elementary schools, compared with 30 percent of urban fringe/large town schools and 34 percent of rural/small town schools. The percentage of public elementary schools with prekindergarten classes varied by region, with the Southeast being most likely to offer prekinder-garten. Almost half (46 percent) of elementary schools in the Southeast offered prekindergarten; the likelihood of these classes in the Northeast, Central, and West was 30 percent, 32 percent, and 35 percent, respectively.
school prekindergarten children, by selected school characteristics: 2000–2001; Table 8. Number and percentage distribution of public elementary school prekindergarten classes, by selected school characteristics: 2000–2001; and Table 13. Number and percentage distribution of public elementary school prekindergarten classroom teachers, by selected school characteristics: 2000–2001.
8
Table 1. Number and percentage distribution of public elementary schools and elementary schools with prekindergarten classes, by selected school characteristics: 2000–2001
Elementary schools Elementary schools with prekindergarten classes
School characteristic
Number Percentage
distribution Number Percentage
distribution
All public elementary schools..........................................................56,400 100 19,900 100
School size
Less than 300................................................................ 17,400 31 4,900 25 300 to 599.....................................................................................24,900 44 9,100 46 600 or more................................................................ 14,100 25 5,900 30
Locale
City ..............................................................................................13,800 24 6,300 31 Urban fringe/large town................................................................21,200 38 6,400 32 Rural/small town................................................................ 21,300 38 7,200 36
Region
Northeast.......................................................................................10,900 19 3,300 16 Southeast.......................................................................................11,800 21 5,500 27 Central..........................................................................................16,700 30 5,300 27 West .............................................................................................16,900 30 5,900 29
Percent minority enrollment
Less than 6 percent................................................................ 15,800 28 4,400 22 6 to 20 percent................................................................ 12,400 22 3,400 17 21 to 49 percent ................................................................ 11,800 21 4,400 22 50 percent or more................................................................ 15,800 28 7,400 37
Percent of students eligible for free or reduced-price lunch
Less than 35 percent................................................................ 22,600 40 5,600 28 35 to 49 percent ................................................................ 8,400 15 2,900 14 50 to 74 percent ................................................................ 12,600 22 5,000 25 75 percent or more................................................................ 12,200 22 6,200 31
NOTE: For the number of public elementary schools, percent minority enrollment was missing for 24 cases and percent of students eligible for free or reduced-price lunch was missing for 17 cases in the sample. For the number of schools with prekindergarten classes, percent minority enrollment was missing for 11 cases and percent of students eligible for free or reduced-price lunch was missing for 7 cases in the sample. Those cases were included in the totals and in analyses by other school characteristics. Detail may not sum to totals because of rounding or missing data.
SOURCE: U.S. Department of Education, National Center for Education Statistics, Fast Response Survey System, “Survey of Classes That Serve Children Prior to Kindergarten in Public Schools: 2000–2001,” FRSS 78, 2001.
9
Table 2. Number of public elementary schools, number and percent of elementary schools with prekindergarten classes, and percent of elementary schools with general education and special education prekindergarten classes: 2000–2001
Elementary schools with prekindergarten classes
Percent of elementary schools with
School characteristic Number of elementary
schools
Number Percent
General education
prekindergarten classes
Special education
prekindergarten classes
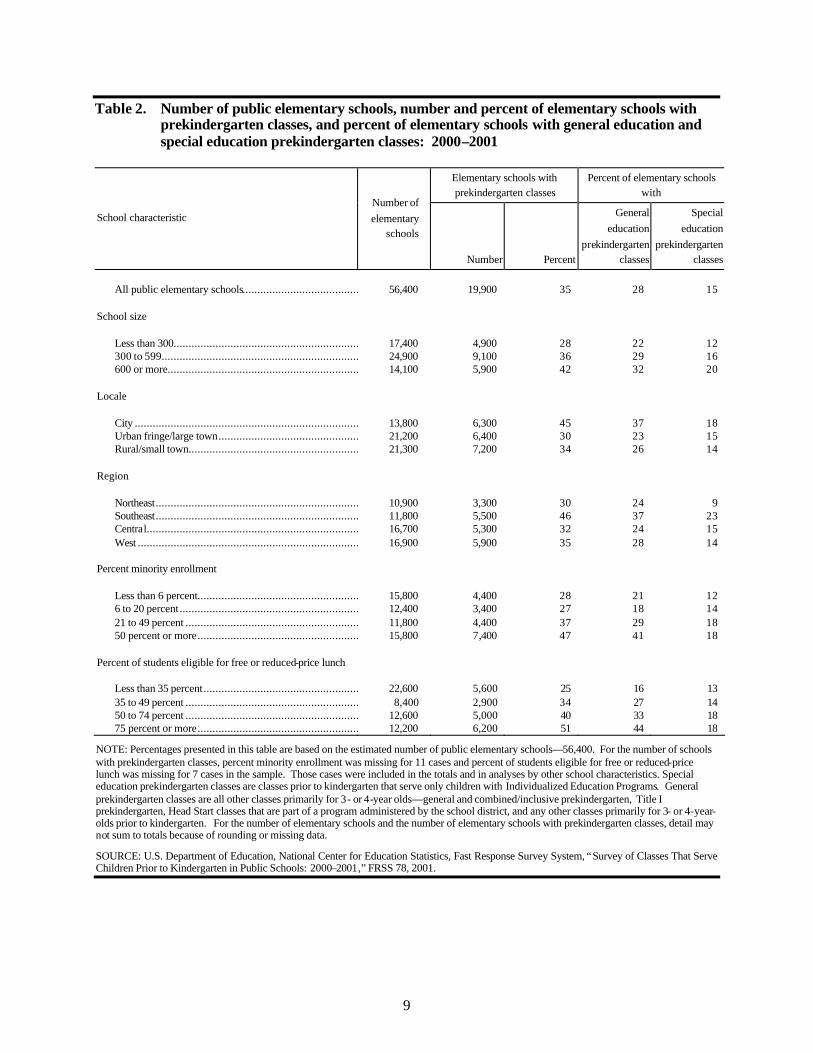
All public elementary schools..........................................................56,400 19,900 35 28 15
School size
Less than 300................................................................ 17,400 4,900 28 22 12 300 to 599.....................................................................................24,900 9,100 36 29 16 600 or more................................................................ 14,100 5,900 42 32 20
Locale
City ..............................................................................................13,800 6,300 45 37 18 Urban fringe/large town................................................................21,200 6,400 30 23 15 Rural/small town................................................................ 21,300 7,200 34 26 14
Region
Northeast.......................................................................................10,900 3,300 30 24 9 Southeast.......................................................................................11,800 5,500 46 37 23 Central..........................................................................................16,700 5,300 32 24 15 West .............................................................................................16,900 5,900 35 28 14
Percent minority enrollment
Less than 6 percent................................................................15,800 4,400 28 21 12 6 to 20 percent................................................................ 12,400 3,400 27 18 14 21 to 49 percent ................................................................ 11,800 4,400 37 29 18 50 percent or more................................................................15,800 7,400 47 41 18
Percent of students eligible for free or reduced-price lunch
Less than 35 percent................................................................ 22,600 5,600 25 16 13 35 to 49 percent ................................................................ 8,400 2,900 34 27 14 50 to 74 percent ................................................................ 12,600 5,000 40 33 18 75 percent or more................................................................ 12,200 6,200 51 44 18
NOTE: Percentages presented in this table are based on the estimated number of public elementary schools—56,400. For the number of schools with prekindergarten classes, percent minority enrollment was missing for 11 cases and percent of students eligible for free or reduced-price lunch was missing for 7 cases in the sample. Those cases were included in the totals and in analyses by other school characteristics. Special education prekindergarten classes are classes prior to kindergarten that serve only children with Individualized Education Programs. General prekindergarten classes are all other classes primarily for 3- or 4-year olds—general and combined/inclusive prekindergarten, Title I prekindergarten, Head Start classes that are part of a program administered by the school district, and any other classes primarily for 3- or 4-year-olds prior to kindergarten. For the number of elementary schools and the number of elementary schools with prekindergarten classes, detail may not sum to totals because of rounding or missing data.
SOURCE: U.S. Department of Education, National Center for Education Statistics, Fast Response Survey System, “Survey of Classes That Serve Children Prior to Kindergarten in Public Schools: 2000–2001,” FRSS 78, 2001.
10
The likelihood of public schools offering prekindergarten classes also was positively related to minority enrollment and poverty concentration. Overall, as percent minority enrollment increased, the likelihood of offering prekindergarten increased—from 27 percent in schools with 6 to 20 percent minority enrollment to 47 percent in schools where minority enrollment was 50 percent or more. Twenty-five percent of elementary schools with the lowest poverty concentration (less than 35 percent of students eligible for free or reduced-price lunch) offered prekindergarten. Despite the fact that early childhood education programs have often targeted the needs of children from low-income families, 51 percent of the schools with the highest poverty concentration (75 percent or more of students eligible) offered such classes. Prevalence of Public Schools With General Education or Special Education Prekindergarten Classes Among public elementary schools nationwide, 28 percent offered general education prekinder-garten classes (table 2). There was a positive relationship between school size and the likelihood that a school would offer general education prekinder-garten classes, ranging from 22 percent of small schools to 32 percent of large schools. City schools were more likely to offer this type of class than were schools in urban fringe/large towns or rural/small towns (37 percent versus
23 and 26 percent, respectively). The likelihood also varied by region: schools in the Southeast (37 percent) were more likely to offer these classes than schools in any other region (28 percent in the West and 24 percent in both the Northeast and Central regions). The likelihood that schools offered general education classes also tended to increase with percent minority enrollment (ranging from 18 to 41 percent) and poverty concentration (ranging from 16 to 44 percent). Fifteen percent of public elementary schools offered special education prekindergarten classes (table 2). Variation by school characteristic s was similar to the variation found in the percentage of schools that offered general education prekinder-garten classes. For example, the likelihood of schools offering special education prekindergarten classes was positively related to school size, with 12 percent of small schools, 16 percent of midsized schools, and 20 percent of large schools offering this type of class. There were no differences in the likelihood that schools offered this type of class based on locale. However, schools in the Southeast were again more likely to offer these classes than schools in any other region: 23 percent in the Southeast compared with 9 percent in the Northeast, 14 percent in the West, and 15 percent in the Central region. The likelihood that schools offered special education classes also tended to increase with percent minority enrollment (ranging from 12 to 18 percent).
11
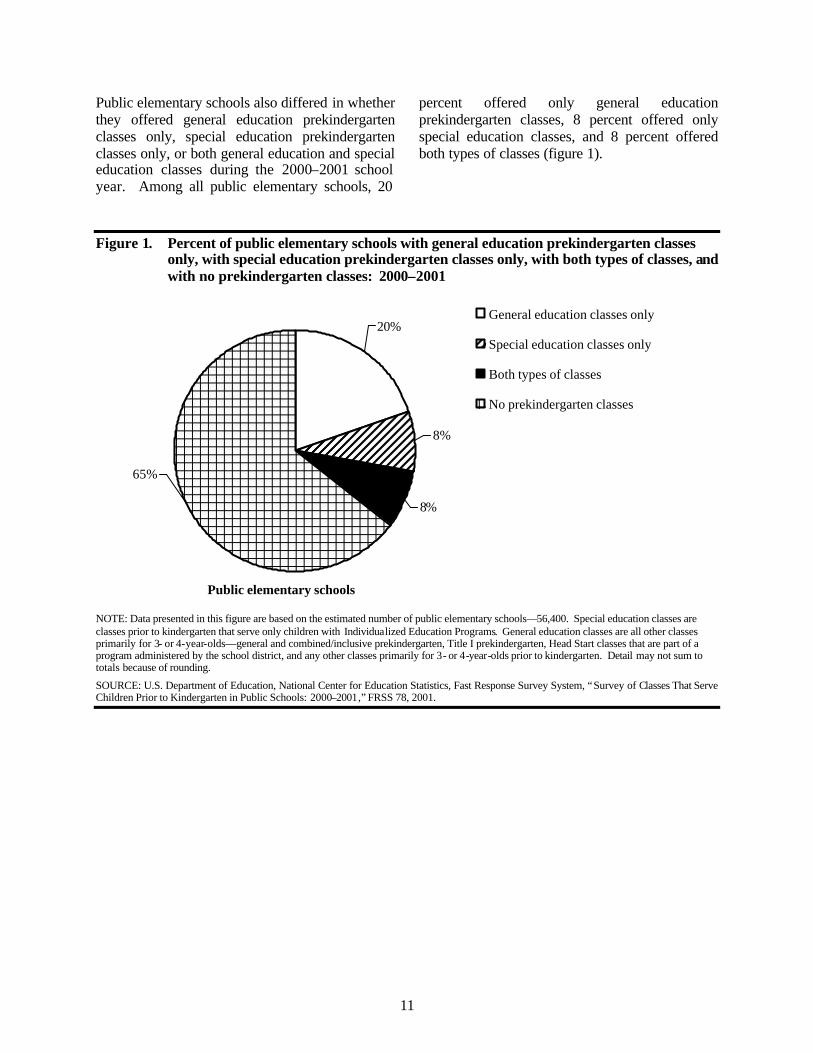
Public elementary schools also differed in whether they offered general education prekindergarten classes only, special education prekindergarten classes only, or both general education and special education classes during the 2000–2001 school year. Among all public elementary schools, 20
percent offered only general education prekindergarten classes, 8 percent offered only special education classes, and 8 percent offered both types of classes (figure 1).
Figure 1. Percent of public elementary schools with general education prekindergarten classes only, with special education prekindergarten classes only, with both types of classes, and with no prekindergarten classes: 2000–2001
8%
8%
20%
65%
General education classes only
Special education classes only
Both types of classes
No prekindergarten classes
Public elementary schools
NOTE: Data presented in this figure are based on the estimated number of public elementary schools—56,400. Special education classes are classes prior to kindergarten that serve only children with Individualized Education Programs. General education classes are all other classes primarily for 3- or 4-year-olds—general and combined/inclusive prekindergarten, Title I prekindergarten, Head Start classes that are part of a program administered by the school district, and any other classes primarily for 3- or 4-year-olds prior to kindergarten. Detail may not sum to totals because of rounding.
SOURCE: U.S. Department of Education, National Center for Education Statistics, Fast Response Survey System, “Survey of Classes That Serve Children Prior to Kindergarten in Public Schools: 2000–2001,” FRSS 78, 2001.
12
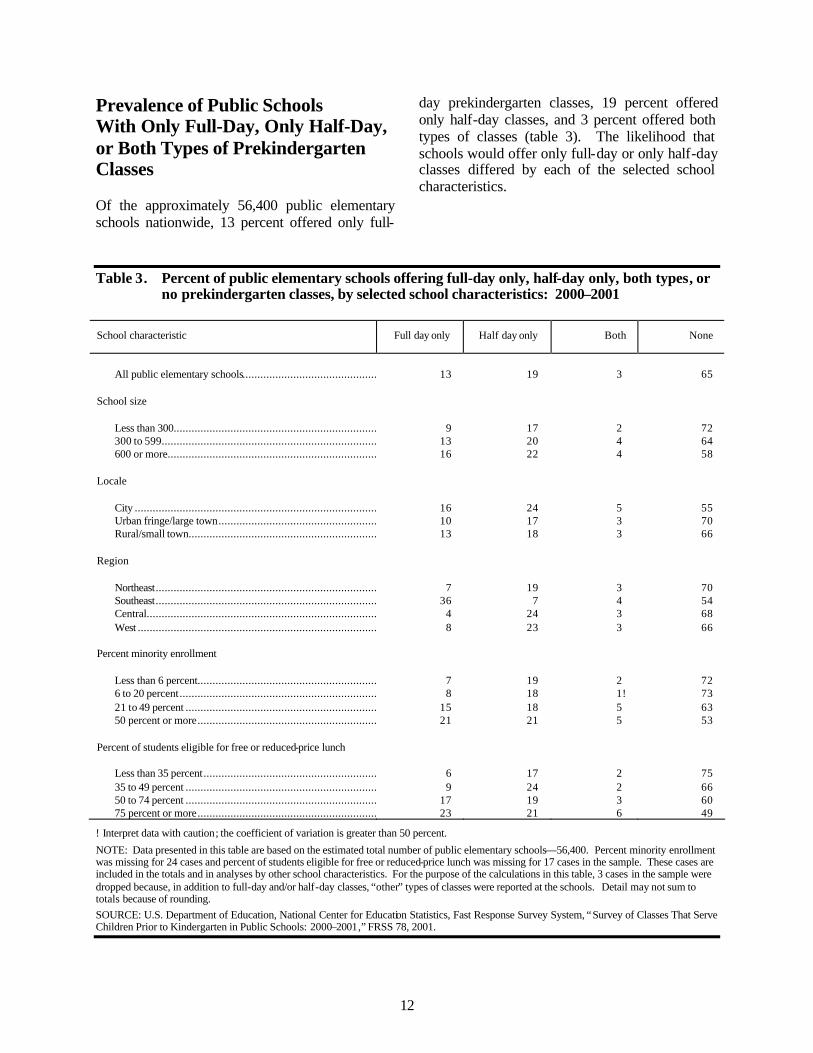
Prevalence of Public Schools With Only Full-Day, Only Half-Day, or Both Types of Prekindergarten Classes Of the approximately 56,400 public elementary schools nationwide, 13 percent offered only full-
day prekindergarten classes, 19 percent offered only half-day classes, and 3 percent offered both types of classes (table 3). The likelihood that schools would offer only full-day or only half-day classes differed by each of the selected school characteristics.
Table 3. Percent of public elementary schools offering full-day only, half-day only, both types, or no prekindergarten classes, by selected school characteristics: 2000–2001
School characteristic Full day only Half day only Both None
All public elementary schools.......................................................... 13 19 3 65
School size
Less than 300................................................................................. 9 17 2 72 300 to 599..................................................................................... 13 20 4 64 600 or more................................................................................... 16 22 4 58
Locale
City .............................................................................................. 16 24 5 55 Urban fringe/large town................................................................ 10 17 3 70 Rural/small town................................................................ 13 18 3 66
Region
Northeast....................................................................................... 7 19 3 70 Southeast....................................................................................... 36 7 4 54 Central.......................................................................................... 4 24 3 68 West ............................................................................................. 8 23 3 66
Percent minority enrollment
Less than 6 percent................................................................ 7 19 2 72 6 to 20 percent............................................................................... 8 18 1! 73 21 to 49 percent ................................................................ 15 18 5 63 50 percent or more................................................................ 21 21 5 53
Percent of students eligible for free or reduced-price lunch
Less than 35 percent................................................................ 6 17 2 75 35 to 49 percent ................................................................ 9 24 2 66 50 to 74 percent ................................................................ 17 19 3 60 75 percent or more................................................................ 23 21 6 49
! Interpret data with caution; the coefficient of variation is greater than 50 percent.
NOTE: Data presented in this table are based on the estimated total number of public elementary schools—56,400. Percent minority enrollment was missing for 24 cases and percent of students eligible for free or reduced-price lunch was missing for 17 cases in the sample. These cases are included in the totals and in analyses by other school characteristics. For the purpose of the calculations in this table, 3 cases in the sample were dropped because, in addition to full-day and/or half-day classes, “other” types of classes were reported at the schools. Detail may not sum to totals because of rounding. SOURCE: U.S. Department of Education, National Center for Education Statistics, Fast Response Survey System, “Survey of Classes That Serve Children Prior to Kindergarten in Public Schools: 2000–2001,” FRSS 78, 2001.
13
There was a positive relationship between public school size and the likelihood of offering only full-day prekindergarten classes, ranging from 9 percent of small schools to 16 percent of large schools. No significant differences by school size were detected in the likelihood of offering only half-day classes. City schools were more likely than urban fringe/large town schools to offer only full-day and to offer only half-day prekindergarten classes. Sixteen percent of city schools offered only full-day classes and 24 percent offered only half-day classes; 10 percent of urban fringe/large town schools offered only full-day classes and 17 percent offered only half-day classes. City schools also were more likely than rural/small town schools to offer only half-day prekindergarten classes (24 versus 18 percent, respectively). Thirty-six percent of public elementary schools in the Southeast offered only full-day pre-
kindergarten classes, compared with 7 percent of schools in the Northeast, 4 percent in the Central region, and 8 percent in the West. The schools in the Southeast were least likely to offer only half-day classes (7 percent, versus 19 to 24 percent). As percent minority enrollment increased, so did the likelihood that public schools offered only full-day prekindergarten classes. The likelihood ranged from 7 percent of schools with the lowest minority enrollment offering only full-day classes to 21 percent of schools with the highest minority enrollment. There also was a positive relationship between poverty concentration and the likelihood of offering only full-day prekindergarten classes, ranging from 6 percent of schools with the lowest poverty concentration offering only full-day classes to 23 percent of schools with the highest poverty concentration offering only such classes.

14
15
3. PREKINDERGARTEN CHILDREN IN PUBLIC SCHOOLS
Results from the survey provide information on the children who were enrolled in prekindergarten classes offered by regular and special education public elementary schools during the 2000–2001 school year. The data address questions such as: • What was the age distribution of
prekindergarten children, and was there a difference in the distribution between children enrolled in general education and those enrolled in special education prekindergarten classes?
• What was the racial and ethnic make-up of prekindergarten enrollment?
• How many prekindergarten children were LEP?
• How many were low income?
• How many had IEPs?
Number of Prekindergarten Children in Public Schools
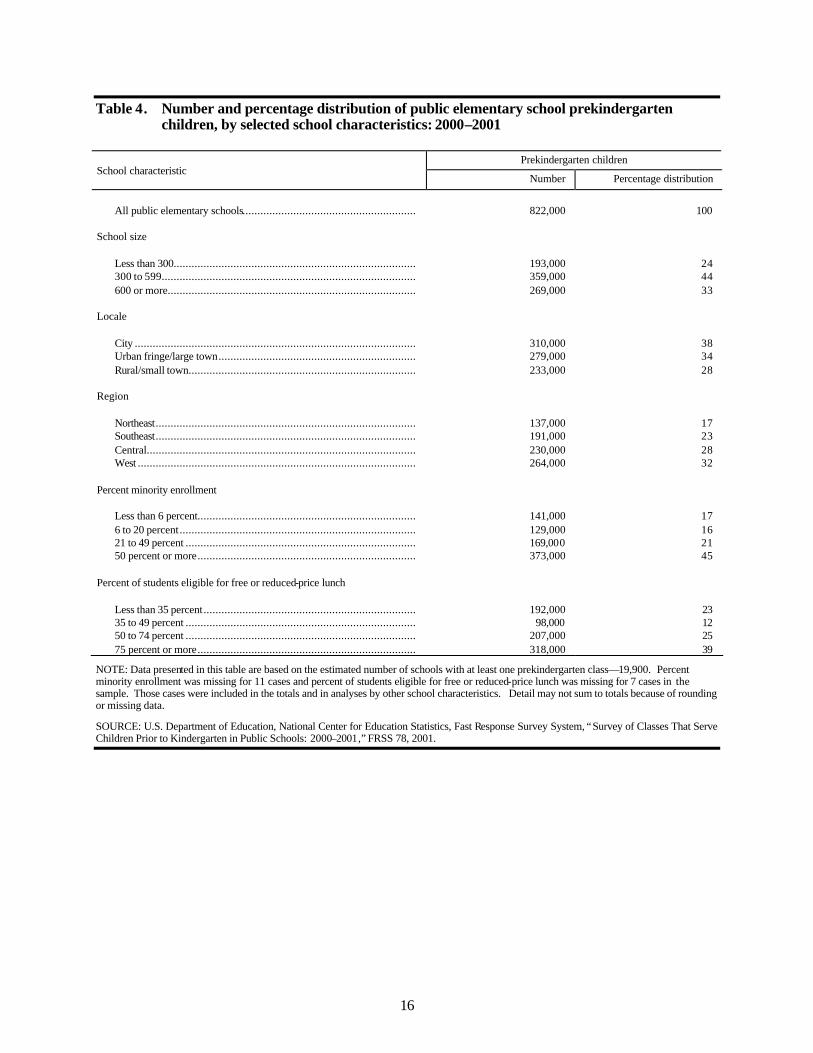
During the 2000–2001 school year, approximately 822,000 children were enrolled in public elementary school prekindergarten classes (table 4).13 As a group, they comprised about
13For similar percentage distributions, see the following tables: Table
1. Number and percentage distribution of public elementary schools and elementary schools with prekindergarten classes, by selected school characteristics: 2000–2001; Table 8. Number and percentage distribution of public elementary school prekindergarten classes, by selected school characteristics: 2000–2001; and Table 13. Number and percentage distribution of public elementary school prekindergarten classroom teachers, by selected school characteristics: 2000–2001.
9 percent of 3- and 4-year-old children nationwide: 4 percent of 3-year-olds and 14 percent of 4-year-olds.14, 15 To put these numbers in context, data from the U.S. Department of Education indicated that in 1999, about 54 percent of 3- and 4-year-olds nationwide were enrolled in some form of preprimary educational program in public elementary schools or in some other setting (Snyder 2001).16 Table 4 shows the distribution of prekindergarten children by selected characteristics of the public schools offering their classes. One-third (33 percent) of the prekindergarten children attended large elementary schools, 44 percent attended midsized schools, and 24 percent attended small schools. Almost half (45 percent) of prekindergarten children attended public schools with minority enrollment of 50 percent or more. Among the 822,000 children enrolled in public school prekindergarten classes,17 79 percent were enrolled in general education classes and 21 percent were enrolled in special education
14These percentages are based on counts of 3- and 4-year-olds
published by the U.S. Bureau of the Census (2001). 15The questionnaire collected data on the number of prekindergarten
children by age, including the number who were 5 years or older. Since this category is unbounded (i.e., 6-year-olds could be included), no meaningful contextual data could be presented. Therefore, this discussion focuses on 3- and 4-year-olds (88 percent of all public elementary school prekindergarten children).
16This percentage is based on data from the U.S. Department of Education, National Center for Education Statistics, Preprimary Enrollment, various years; and U.S. Department of Commerce, Bureau of the Census, Current Population Survey, reported in Table 45 of the Digest of Education Statistics 2000 , unpublished tabulations.
17In accordance with the Individuals with Disabilities Education Act (IDEA), special education placement options for prekindergarten children with IEPs are also located in settings other than public elementary schools. Additional information about children with disabilities can be found at www.ideadata.org
16
Table 4. Number and percentage distribution of public elementary school prekindergarten children, by selected school characteristics: 2000–2001
Prekindergarten children
School characteristic Number Percentage distribution
All public elementary schools.......................................................... 822,000 100
School size
Less than 300................................................................................. 193,000 24 300 to 599..................................................................................... 359,000 44 600 or more................................................................................... 269,000 33
Locale
City .............................................................................................. 310,000 38 Urban fringe/large town.................................................................. 279,000 34 Rural/small town............................................................................ 233,000 28
Region
Northeast....................................................................................... 137,000 17 Southeast....................................................................................... 191,000 23 Central.......................................................................................... 230,000 28 West ............................................................................................. 264,000 32
Percent minority enrollment
Less than 6 percent......................................................................... 141,000 17 6 to 20 percent............................................................................... 129,000 16 21 to 49 percent ............................................................................. 169,000 21 50 percent or more......................................................................... 373,000 45
Percent of students eligible for free or reduced-price lunch
Less than 35 percent....................................................................... 192,000 23 35 to 49 percent ............................................................................. 98,000 12 50 to 74 percent ............................................................................. 207,000 25 75 percent or more......................................................................... 318,000 39
NOTE: Data presented in this table are based on the estimated number of schools with at least one prekindergarten class—19,900. Percent minority enrollment was missing for 11 cases and percent of students eligible for free or reduced-price lunch was missing for 7 cases in the sample. Those cases were included in the totals and in analyses by other school characteristics. Detail may not sum to totals because of rounding or missing data.
SOURCE: U.S. Department of Education, National Center for Education Statistics, Fast Response Survey System, “Survey of Classes That Serve Children Prior to Kindergarten in Public Schools: 2000–2001,” FRSS 78, 2001.
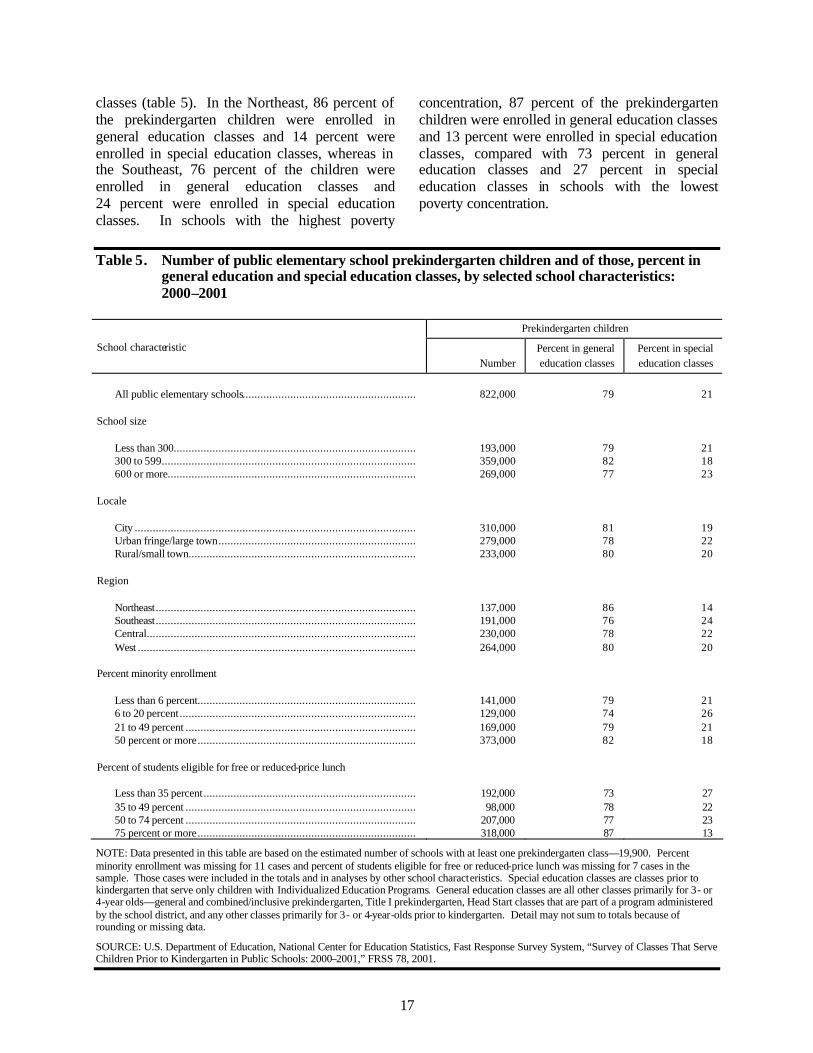
17
classes (table 5). In the Northeast, 86 percent of the prekindergarten children were enrolled in general education classes and 14 percent were enrolled in special education classes, whereas in the Southeast, 76 percent of the children were enrolled in general education classes and 24 percent were enrolled in special education classes. In schools with the highest poverty
concentration, 87 percent of the prekindergarten children were enrolled in general education classes and 13 percent were enrolled in special education classes, compared with 73 percent in general education classes and 27 percent in special education classes in schools with the lowest poverty concentration.
Table 5. Number of public elementary school prekindergarten children and of those, percent in general education and special education classes, by selected school characteristics: 2000–2001
Prekindergarten children
School characteristic Number
Percent in general education classes
Percent in special education classes
All public elementary schools.......................................................... 822,000 79 21
School size
Less than 300................................................................................. 193,000 79 21 300 to 599..................................................................................... 359,000 82 18 600 or more................................................................................... 269,000 77 23
Locale
City .............................................................................................. 310,000 81 19 Urban fringe/large town.................................................................. 279,000 78 22 Rural/small town............................................................................ 233,000 80 20
Region
Northeast....................................................................................... 137,000 86 14 Southeast....................................................................................... 191,000 76 24 Central.......................................................................................... 230,000 78 22 West ............................................................................................. 264,000 80 20
Percent minority enrollment
Less than 6 percent......................................................................... 141,000 79 21 6 to 20 percent............................................................................... 129,000 74 26 21 to 49 percent ............................................................................. 169,000 79 21 50 percent or more......................................................................... 373,000 82 18
Percent of students eligible for free or reduced-price lunch
Less than 35 percent....................................................................... 192,000 73 27 35 to 49 percent ............................................................................. 98,000 78 22 50 to 74 percent ............................................................................. 207,000 77 23 75 percent or more......................................................................... 318,000 87 13
NOTE: Data presented in this table are based on the estimated number of schools with at least one prekindergarten class—19,900. Percent minority enrollment was missing for 11 cases and percent of students eligible for free or reduced-price lunch was missing for 7 cases in the sample. Those cases were included in the totals and in analyses by other school characteristics. Special education classes are classes prior to kindergarten that serve only children with Individualized Education Programs. General education classes are all other classes primarily for 3- or 4-year olds—general and combined/inclusive prekindergarten, Title I prekindergarten, Head Start classes that are part of a program administered by the school district, and any other classes primarily for 3- or 4-year-olds prior to kindergarten. Detail may not sum to totals because of rounding or missing data.
SOURCE: U.S. Department of Education, National Center for Education Statistics, Fast Response Survey System, “Survey of Classes That Serve Children Prior to Kindergarten in Public Schools: 2000–2001,” FRSS 78, 2001.
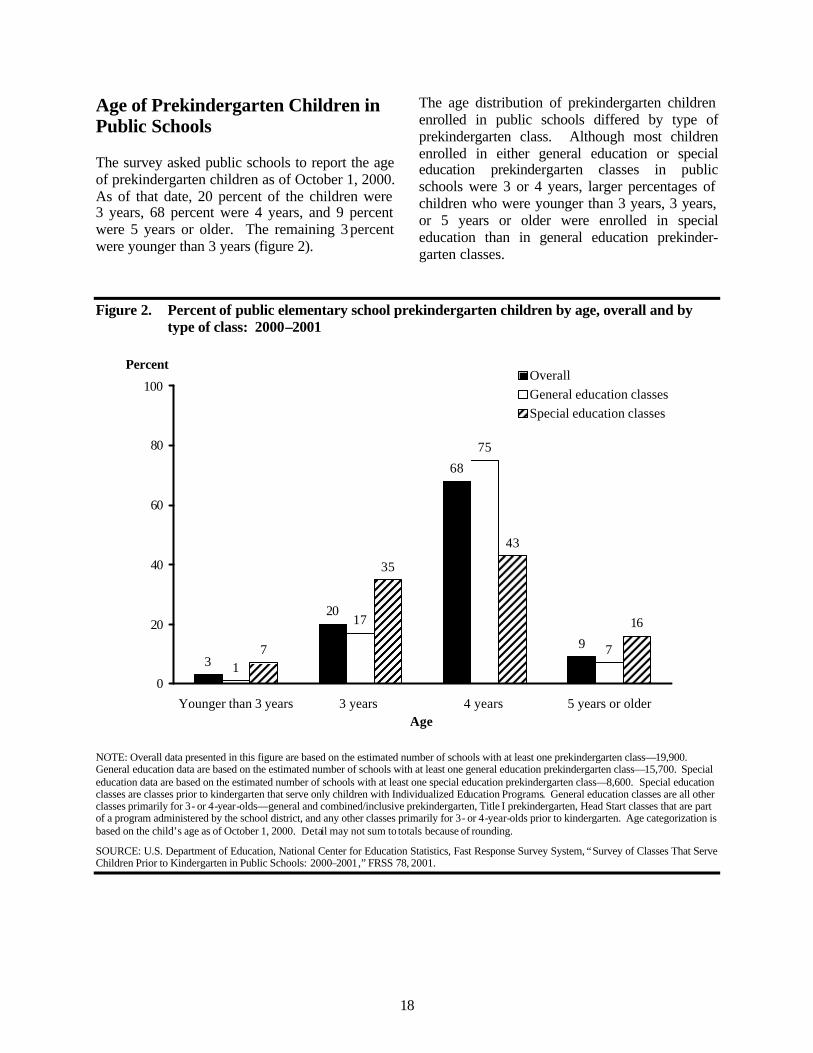
18
Age of Prekindergarten Children in Public Schools The survey asked public schools to report the age of prekindergarten children as of October 1, 2000. As of that date, 20 percent of the children were 3 years, 68 percent were 4 years, and 9 percent were 5 years or older. The remaining 3 percent were younger than 3 years (figure 2).
The age distribution of prekindergarten children enrolled in public schools differed by type of prekindergarten class. Although most children enrolled in either general education or special education prekindergarten classes in public schools were 3 or 4 years, larger percentages of children who were younger than 3 years, 3 years, or 5 years or older were enrolled in special education than in general education prekinder-garten classes.
Figure 2. Percent of public elementary school prekindergarten children by age, overall and by
type of class: 2000–2001
3
20
68
9
1
17
75
77
35
43
16
0
20
40
60
80
100
Younger than 3 years 3 years 4 years 5 years or older
OverallGeneral education classesSpecial education classes
Percent
Age
NOTE: Overall data presented in this figure are based on the estimated number of schools with at least one prekindergarten class—19,900. General education data are based on the estimated number of schools with at least one general education prekindergarten class—15,700. Special education data are based on the estimated number of schools with at least one special education prekindergarten class—8,600. Special education classes are classes prior to kindergarten that serve only children with Individualized Education Programs. General education classes are all other classes primarily for 3- or 4-year-olds—general and combined/inclusive prekindergarten, Title I prekindergarten, Head Start classes that are part of a program administered by the school district, and any other classes primarily for 3- or 4-year-olds prior to kindergarten. Age categorization is based on the child’s age as of October 1, 2000. Detail may not sum to totals because of rounding.
SOURCE: U.S. Department of Education, National Center for Education Statistics, Fast Response Survey System, “Survey of Classes That Serve Children Prior to Kindergarten in Public Schools: 2000–2001,” FRSS 78, 2001.
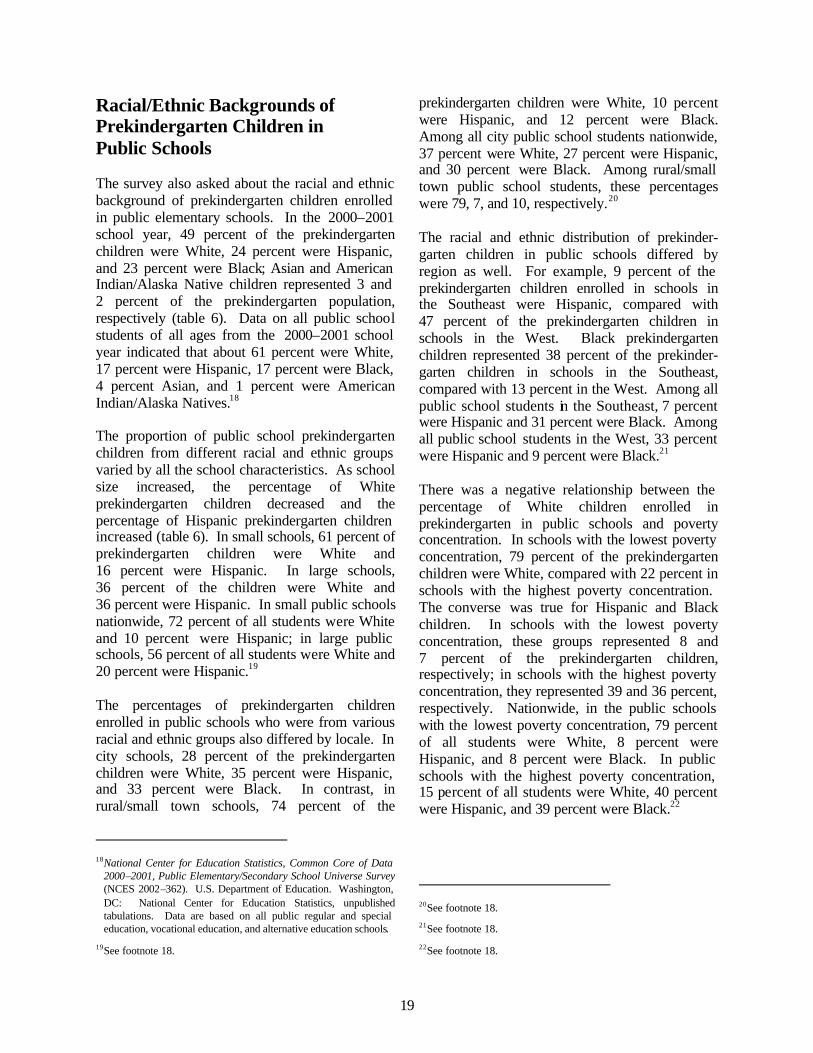
19
Racial/Ethnic Backgrounds of Prekindergarten Children in Public Schools The survey also asked about the racial and ethnic background of prekindergarten children enrolled in public elementary schools. In the 2000–2001 school year, 49 percent of the prekindergarten children were White, 24 percent were Hispanic, and 23 percent were Black; Asian and American Indian/Alaska Native children represented 3 and 2 percent of the prekindergarten population, respectively (table 6). Data on all public school students of all ages from the 2000–2001 school year indicated that about 61 percent were White, 17 percent were Hispanic, 17 percent were Black, 4 percent Asian, and 1 percent were American Indian/Alaska Natives.18 The proportion of public school prekindergarten children from different racial and ethnic groups varied by all the school characteristics. As school size increased, the percentage of White prekindergarten children decreased and the percentage of Hispanic prekindergarten children increased (table 6). In small schools, 61 percent of prekindergarten children were White and 16 percent were Hispanic. In large schools, 36 percent of the children were White and 36 percent were Hispanic. In small public schools nationwide, 72 percent of all students were White and 10 percent were Hispanic; in large public schools, 56 percent of all students were White and 20 percent were Hispanic.19 The percentages of prekindergarten children enrolled in public schools who were from various racial and ethnic groups also differed by locale. In city schools, 28 percent of the prekindergarten children were White, 35 percent were Hispanic, and 33 percent were Black. In contrast, in rural/small town schools, 74 percent of the
18National Center for Education Statistics, Common Core of Data
2000–2001, Public Elementary/Secondary School Universe Survey (NCES 2002–362). U.S. Department of Education. Washington, DC: National Center for Education Statistics, unpublished tabulations. Data are based on all public regular and special education, vocational education, and alternative education schools.
19See footnote 18.
prekindergarten children were White, 10 percent were Hispanic, and 12 percent were Black. Among all city public school students nationwide, 37 percent were White, 27 percent were Hispanic, and 30 percent were Black. Among rural/small town public school students, these percentages were 79, 7, and 10, respectively.20 The racial and ethnic distribution of prekinder-garten children in public schools differed by region as well. For example, 9 percent of the prekindergarten children enrolled in schools in the Southeast were Hispanic, compared with 47 percent of the prekindergarten children in schools in the West. Black prekindergarten children represented 38 percent of the prekinder-garten children in schools in the Southeast, compared with 13 percent in the West. Among all public school students in the Southeast, 7 percent were Hispanic and 31 percent were Black. Among all public school students in the West, 33 percent were Hispanic and 9 percent were Black.21 There was a negative relationship between the percentage of White children enrolled in prekindergarten in public schools and poverty concentration. In schools with the lowest poverty concentration, 79 percent of the prekindergarten children were White, compared with 22 percent in schools with the highest poverty concentration. The converse was true for Hispanic and Black children. In schools with the lowest poverty concentration, these groups represented 8 and 7 percent of the prekindergarten children, respectively; in schools with the highest poverty concentration, they represented 39 and 36 percent, respectively. Nationwide, in the public schools with the lowest poverty concentration, 79 percent of all students were White, 8 percent were Hispanic, and 8 percent were Black. In public schools with the highest poverty concentration, 15 percent of all students were White, 40 percent were Hispanic, and 39 percent were Black.22
20See footnote 18. 21See footnote 18.
22See footnote 18.
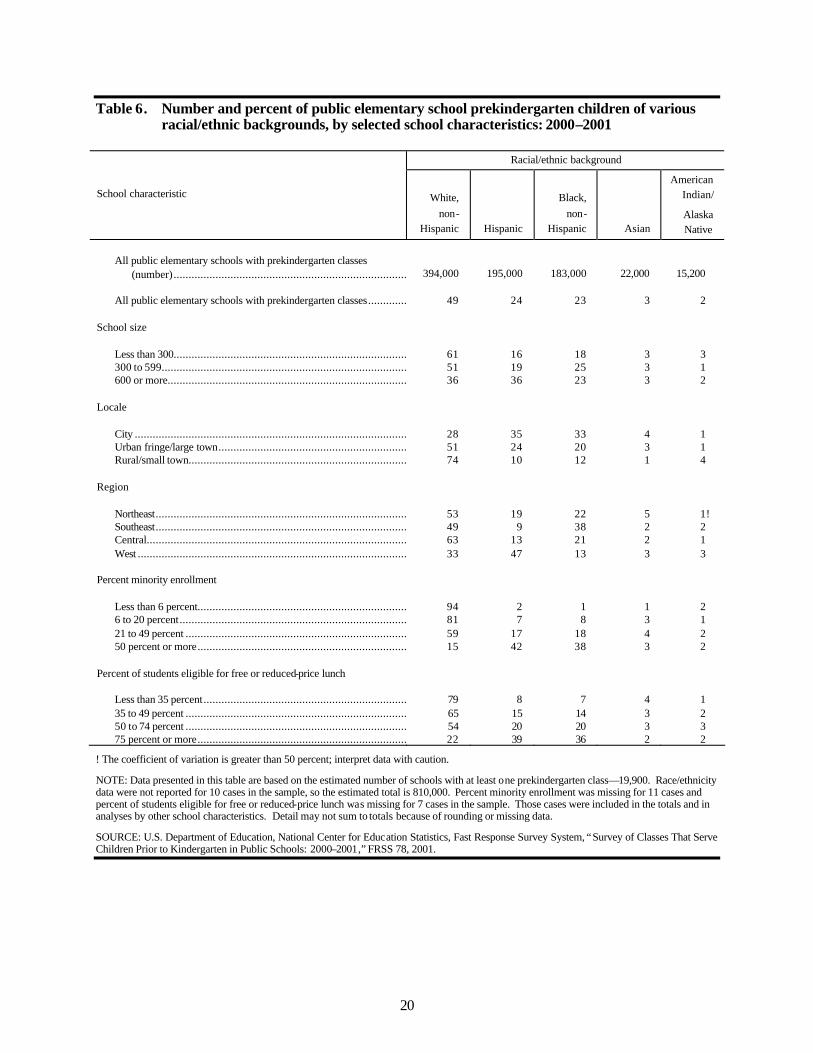
20
Table 6. Number and percent of public elementary school prekindergarten children of various racial/ethnic backgrounds, by selected school characteristics: 2000–2001
Racial/ethnic background
School characteristic White, non-
Hispanic Hispanic
Black, non-
Hispanic Asian
American Indian/
Alaska Native
All public elementary schools with prekindergarten classes
(number)................................................................................. 394,000 195,000 183,000 22,000 15,200 All public elementary schools with prekindergarten classes................ 49 24 23 3 2
School size
Less than 300................................................................................. 61 16 18 3 3 300 to 599..................................................................................... 51 19 25 3 1 600 or more................................................................................... 36 36 23 3 2
Locale
City .............................................................................................. 28 35 33 4 1 Urban fringe/large town................................................................ 51 24 20 3 1 Rural/small town............................................................................ 74 10 12 1 4
Region
Northeast....................................................................................... 53 19 22 5 1! Southeast....................................................................................... 49 9 38 2 2 Central.......................................................................................... 63 13 21 2 1 West ............................................................................................. 33 47 13 3 3
Percent minority enrollment
Less than 6 percent......................................................................... 94 2 1 1 2 6 to 20 percent............................................................................... 81 7 8 3 1 21 to 49 percent ............................................................................. 59 17 18 4 2 50 percent or more......................................................................... 15 42 38 3 2
Percent of students eligible for free or reduced-price lunch
Less than 35 percent....................................................................... 79 8 7 4 1 35 to 49 percent ............................................................................. 65 15 14 3 2 50 to 74 percent ............................................................................. 54 20 20 3 3 75 percent or more......................................................................... 22 39 36 2 2
! The coefficient of variation is greater than 50 percent; interpret data with caution.
NOTE: Data presented in this table are based on the estimated number of schools with at least one prekindergarten class—19,900. Race/ethnicity data were not reported for 10 cases in the sample, so the estimated total is 810,000. Percent minority enrollment was missing for 11 cases and percent of students eligible for free or reduced-price lunch was missing for 7 cases in the sample. Those cases were included in the totals and in analyses by other school characteristics. Detail may not sum to totals because of rounding or missing data.
SOURCE: U.S. Department of Education, National Center for Education Statistics, Fast Response Survey System, “Survey of Classes That Serve Children Prior to Kindergarten in Public Schools: 2000–2001,” FRSS 78, 2001.
21
Public School Prekindergarten Children Who Were Limited English Proficient The survey also asked about the number of public school prekindergarten children who were limited English proficient. For this survey, a child who was LEP (or “English language learners”) was defined as one “whose native or dominant language is other than English, and whose skills in listening to, speaking, reading, or writing English are such that he/she derives little benefit from school instruction in English.” Under this definition, 15 percent of prekindergarten children were LEP (table 7). Data on the percentage of public elementary school students overall indicate that about 9 percent of all students received LEP services.23 The percentage of public school prekindergarten children who were LEP varied by school characteristics. There was a positive relationship between the percentage of prekindergarten children who were LEP and school size, ranging from 10 percent in small schools to 22 percent in large schools. In city schools, 22 percent of prekindergarten children were LEP; in rural/small town schools, 6 percent were LEP. In schools in the West, 30 percent of prekindergarten children were LEP, whereas the percentage ranged from 7 to 9 percent in other regions. There also were positive relationships between the percentage of public school prekindergarten children who were LEP and percent minority enrollment and poverty concentration. The percentage of children who were LEP ranged from less than 0.5 percent in schools with the lowest percent minority enrollment to 26 percent in schools with the highest percent minority enrollment. It ranged from 5 percent in schools with the lowest poverty concentration to 25 percent in schools with the highest poverty concentration.
23National Center for Education Statistics, Common Core of Data
2000–2001, Local Education Agency Survey: School Year 2000–2001 (NCES 2002–360). U.S. Department of Education. Washington, DC: National Center for Education Statistics, unpublished t abulations.
Public School Prekindergarten Children Who Were Low Income Public schools that participate in the National School Lunch Program (NSLP) provide meals free of charge or at a reduced price to students from low-income families (Fox et al. 2001). Throughout this chapter, eligibility for free or reduced-price meal benefits is used as a proxy to describe students from low-income families. Data from the School Nutrition Dietary Assessment Study II (SNDA-II) indicated that on an average day in the study target week during the 1998–1999 school year, 45 percent of students attending public elementary schools that participate in the NSLP were low income (Fox et al. 2001). The FRSS survey asked public schools to report the number of prekindergarten children and the percentage of students in all grades who were eligible for free and reduced-price lunch benefits during the 2000-01 school year.24 It is important to remember that prekindergarten programs have tended to target at-risk children, including low-income children. Table 7 shows that 61 percent of prekindergarten children were low income. This percentage was higher than the percentage of all public elementary school children who were low income (47 percent) (not shown in table).25 There was a positive relationship between the percentage of public school prekindergarten children who were low income and the size of the school, ranging from 54 percent in small schools to 68 percent in large schools. The percentage of prekindergarten children who were low income also varied by locale and region. In city schools with prekindergarten classes, a higher percentage of prekindergarten children were low income than in urban fringe/large town schools or rural/ small town schools with prekindergarten classes
24The item nonresponse rat e for the number of prekindergarten
children who were low income was 5.6 percent. As a result, the survey estimate may be somewhat different from the actual percentage of students eligible to receive the benefits.
25Since the number of students eligible for free and reduced-price lunch was missing for 17 schools and enrollment was missing for 8 schools (both data elements were missing for one school), this percentage was based on 99 percent of public elementary schools.
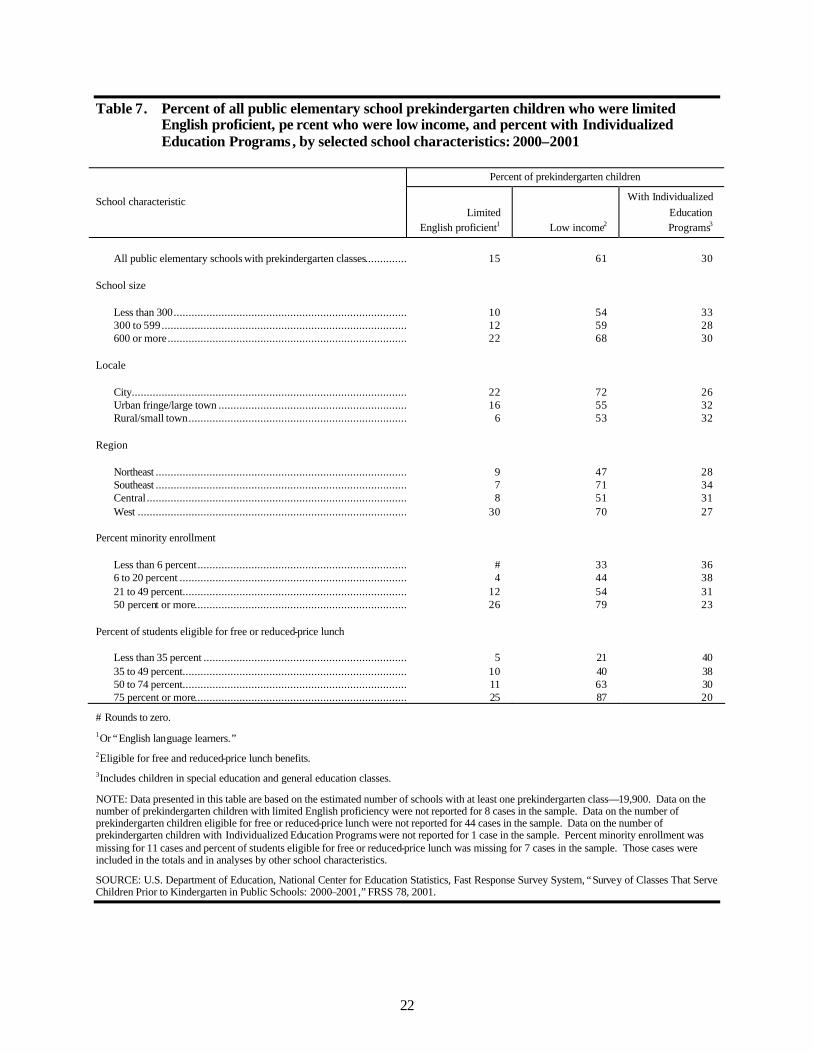
22
Table 7. Percent of all public elementary school prekindergarten children who were limited English proficient, pe rcent who were low income, and percent with Individualized Education Programs , by selected school characteristics: 2000–2001
Percent of prekindergarten children
School characteristic Limited
English proficient1 Low income2
With Individualized Education Programs3
All public elementary schools with prekindergarten classes................. 15 61 30
School size
Less than 300................................................................................. 10 54 33 300 to 599..................................................................................... 12 59 28 600 or more................................................................................... 22 68 30
Locale
City............................................................................................... 22 72 26 Urban fringe/large town ................................................................ 16 55 32 Rural/small town............................................................................ 6 53 32
Region
Northeast ....................................................................................... 9 47 28 Southeast ....................................................................................... 7 71 34 Central.......................................................................................... 8 51 31 West ............................................................................................. 30 70 27
Percent minority enrollment
Less than 6 percent......................................................................... # 33 36 6 to 20 percent ............................................................................... 4 44 38 21 to 49 percent.............................................................................. 12 54 31 50 percent or more.......................................................................... 26 79 23
Percent of students eligible for free or reduced-price lunch
Less than 35 percent ....................................................................... 5 21 40 35 to 49 percent.............................................................................. 10 40 38 50 to 74 percent.............................................................................. 11 63 30 75 percent or more.......................................................................... 25 87 20
# Rounds to zero. 1Or “English language learners.” 2Eligible for free and reduced-price lunch benefits. 3Includes children in special education and general education classes.
NOTE: Data presented in this table are based on the estimated number of schools with at least one prekindergarten class—19,900. Data on the number of prekindergarten children with limited English proficiency were not reported for 8 cases in the sample. Data on the number of prekindergarten children eligible for free or reduced-price lunch were not reported for 44 cases in the sample. Data on the number of prekindergarten children with Individualized Education Programs were not reported for 1 case in the sample. Percent minority enrollment was missing for 11 cases and percent of students eligible for free or reduced-price lunch was missing for 7 cases in the sample. Those cases were included in the totals and in analyses by other school characteristics.
SOURCE: U.S. Department of Education, National Center for Education Statistics, Fast Response Survey System, “Survey of Classes That Serve Children Prior to Kindergarten in Public Schools: 2000–2001,” FRSS 78, 2001.
23
(72 percent versus 55 and 53 percent, respectively). The percentages of prekindergarten children who were low income were higher in the Southeast and West than in the Northeast and Central regions (71 and 70 percent versus 47 and 51 percent, respectively). In addition, in public elementary schools with prekindergarten classes, there was a positive relationship between the percentage of prekindergarten children who were low income and percent minority enrollment, ranging from 33 percent in schools with the lowest percent minority enrollment to 79 percent in schools with the highest percent minority enrollment. Public School Prekindergarten Children With Individualized Education Programs Nationwide, about 13 percent of all public school students had IEPs during the 2000–2001 school year.26 Overall, 30 percent of children enrolled in public elementary school prekindergarten classes during the 2000–2001 school year had IEPs (table 7).27, 28 Sixty-nine percent of prekinder-garten children with IEPs were enrolled in special education prekindergarten classes, and 31 percent were enrolled in general education prekindergarten classes (not shown in table). By definition, for this study all children enrolled in special education classes had to have IEPs.
26See footnote 23. 27This may be indicative of the traditional focus of prekindergarten
programs on at -risk children, including those with disabilities.
28See footnote 17.
No significant differences were detected in the percentages of public school prekindergarten children with IEPs by school size, locale, or region. However, the percentage of prekinder-garten children with IEPs generally tended to be higher in schools with lower percent minority enrollment. In schools with the lowest percent minority enrollment, 36 percent of the prekinder-garten children had IEPs, and in schools with 6 to 20 percent minority enrollment, 38 percent of the prekindergarten children had IEPs. In schools with 50 percent or more minority enrollment, the percentage of prekindergarten children with IEPs was 23 percent. The percentage of public school prekindergarten children with IEPs decreased as poverty concentration increased. In schools with the lowest poverty concentration, 40 percent of prekindergarten children had IEPs, whereas in schools with the highest poverty concentration, 20 percent had IEPs. This may be due to the relationship between early childhood education programs and income. Since prekindergarten programs have tended to target at-risk children, including children from low-income families, prekindergarten classes in schools with low poverty concentrations may attract children at risk for other reasons (e.g., having an IEP) (Hinkle 2000; U.S. General Accounting Office 1999).

24
25
4. PREKINDERGARTEN CLASSES IN PUBLIC SCHOOLS
The survey examined characteristics of prekindergarten classes in regular and special education public elementary schools. Results from the survey addressed questions such as the following: • How many prekindergarten classes were
offered in public elementary schools , and how were they distributed between general education and special education?
• What was the average number of prekinder-garten classes offered by public elementary schools?
• What was the average size of these classes? How did this differ by type of class?
• How many prekindergarten classes were on a full-day schedule and how many were on a half-day schedule? What percentage of the classes was offered 5 days per week?
Number of Prekindergarten Classes During the 2000–2001 school year, approximately 58,500 prekindergarten classes were offered in regular and special education public elementary schools. Thirty-one percent of the classes were offered in schools in the West, 29 percent in the Central region, 22 percent in the Southeast, and 18 percent in the Northeast (table 8).29 The majority of public schools with prekindergarten classes offered at least two 29For similar percentage distributions, see the following tables: Table
1. Number and percentage distribution of public elementary schools and elementary schools with prekindergarten classes, by selected school characteristics: 2000–2001; Table 4. Number and percentage distribution of public elementary school prekindergarten children, by selected school characteristics: 2000–2001; and Table 13. Number and percentage distribution of public elementary school prekindergarten classroom teachers, by selected school characteristics: 2000–2001.
classes; 38 percent offered two classes, and 37 percent offered three or more classes (figure 3). During the 2000–2001 school year, among elementary schools with prekindergarten classes, 23 percent offered one general education prekindergarten class, 34 percent offered two classes, and 22 percent offered three or more classes (figure 4). Eighteen percent offered one special education prekindergarten class, 16 percent offered two classes, and 9 percent offered three or more classes (figure 5). Sixty-seven percent of the prekindergarten classes offered during the 2000–2001 school year were general education classes, and 33 percent were special education classes (table 9). This distribu-tion varied by poverty concentration. Among public schools with the lowest poverty concen-tration, 60 percent of the prekindergarten classes were general education classes and 40 percent were special education classes; among schools with the highest poverty concentration, 77 percent were general education classes and 23 percent were special education classes. Overall, public elementary schools that offered prekindergarten classes averaged 2.9 prekinder-garten classes per school during the 2000–2001 school year (table 10). Nationwide, public elementary schools averaged two general education prekindergarten classes and one special education prekindergarten class. The overall average differed by locale and region. Among the public elementary schools that offered prekindergarten classes, city schools averaged 3.4 prekindergarten classes and urban fringe/large town schools averaged 3.1 classes per school; rural/small town schools averaged 2.4 classes per school. Public elementary schools in the
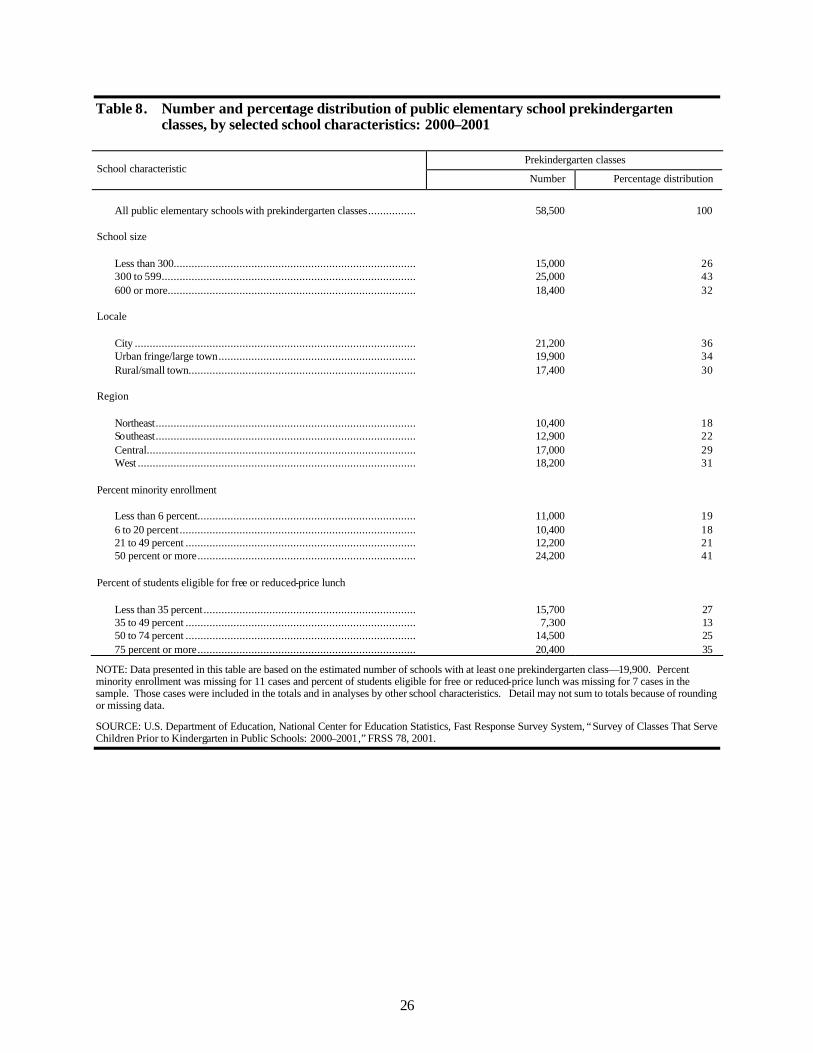
26
Table 8. Number and percentage distribution of public elementary school prekindergarten classes, by selected school characteristics: 2000–2001
Prekindergarten classes
School characteristic Number Percentage distribution
All public elementary schools with prekindergarten classes................ 58,500 100
School size
Less than 300................................................................................. 15,000 26 300 to 599..................................................................................... 25,000 43 600 or more................................................................................... 18,400 32
Locale
City .............................................................................................. 21,200 36 Urban fringe/large town.................................................................. 19,900 34 Rural/small town............................................................................ 17,400 30
Region
Northeast....................................................................................... 10,400 18 Southeast....................................................................................... 12,900 22 Central.......................................................................................... 17,000 29 West ............................................................................................. 18,200 31
Percent minority enrollment
Less than 6 percent......................................................................... 11,000 19 6 to 20 percent............................................................................... 10,400 18 21 to 49 percent ............................................................................. 12,200 21 50 percent or more......................................................................... 24,200 41
Percent of students eligible for free or reduced-price lunch
Less than 35 percent....................................................................... 15,700 27 35 to 49 percent ............................................................................. 7,300 13 50 to 74 percent ............................................................................. 14,500 25 75 percent or more......................................................................... 20,400 35
NOTE: Data presented in this table are based on the estimated number of schools with at least one prekindergarten class—19,900. Percent minority enrollment was missing for 11 cases and percent of students eligible for free or reduced-price lunch was missing for 7 cases in the sample. Those cases were included in the totals and in analyses by other school characteristics. Detail may not sum to totals because of rounding or missing data.
SOURCE: U.S. Department of Education, National Center for Education Statistics, Fast Response Survey System, “Survey of Classes That Serve Children Prior to Kindergarten in Public Schools: 2000–2001,” FRSS 78, 2001.
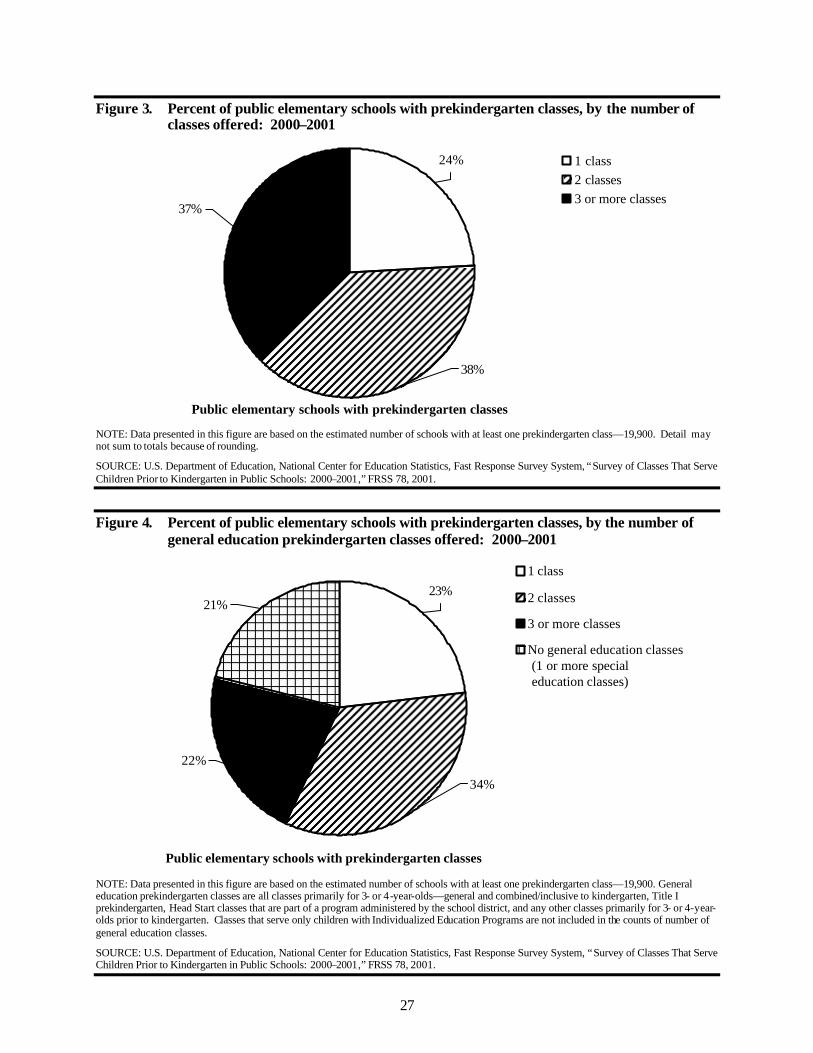
27
Figure 3. Percent of public elementary schools with prekindergarten classes, by the number of classes offered: 2000–2001
37%
38%
24% 1 class2 classes3 or more classes
Public elementary schools with prekindergarten classes NOTE: Data presented in this figure are based on the estimated number of schools with at least one prekindergarten class—19,900. Detail may not sum to totals because of rounding.
SOURCE: U.S. Department of Education, National Center for Education Statistics, Fast Response Survey System, “Survey of Classes That Serve Children Prior to Kindergarten in Public Schools: 2000–2001,” FRSS 78, 2001.
Figure 4. Percent of public elementary schools with prekindergarten classes, by the number of general education prekindergarten classes offered: 2000–2001
23%
34%
22%
21%
1 class
2 classes
3 or more classes
No general education classes
Public elementary schools with prekindergarten classes
(1 or more special education classes)
NOTE: Data presented in this figure are based on the estimated number of schools with at least one prekindergarten class—19,900. General education prekindergarten classes are all classes primarily for 3- or 4-year-olds—general and combined/inclusive to kindergarten, Title I prekindergarten, Head Start classes that are part of a program administered by the school district, and any other classes primarily for 3- or 4-year-olds prior to kindergarten. Classes that serve only children with Individualized Education Programs are not included in the counts of number of general education classes.
SOURCE: U.S. Department of Education, National Center for Education Statistics, Fast Response Survey System, “Survey of Classes That Serve Children Prior to Kindergarten in Public Schools: 2000–2001,” FRSS 78, 2001.
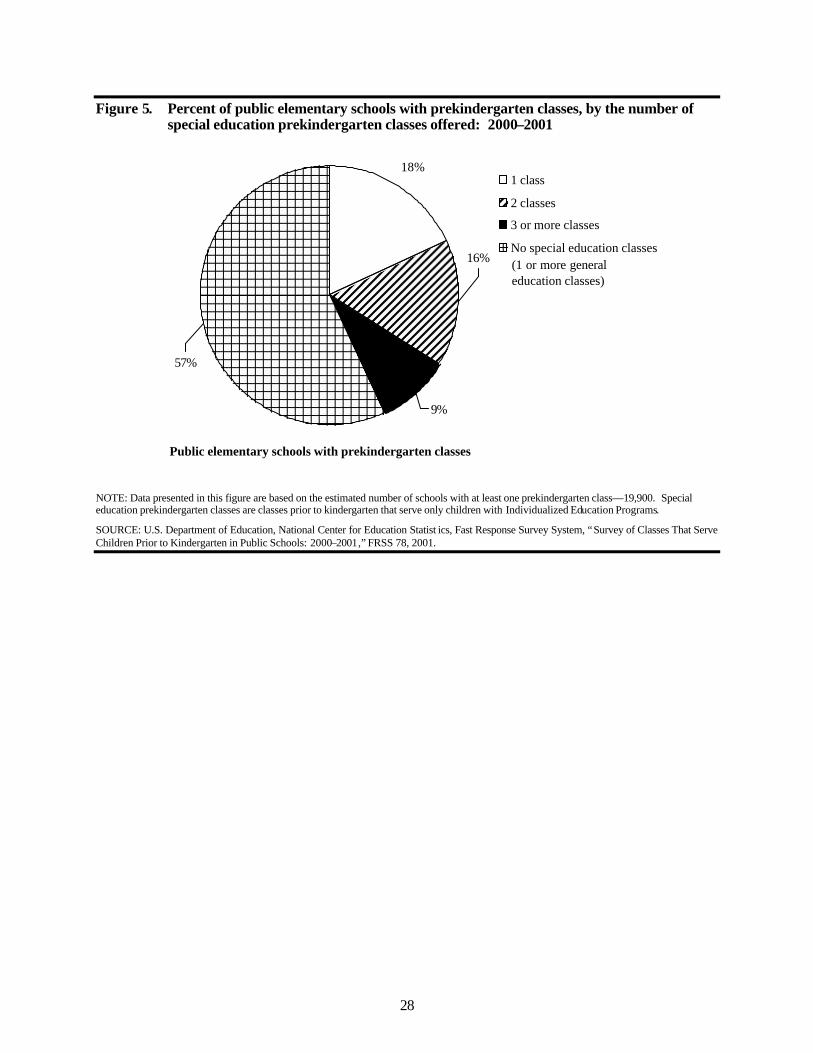
28
Figure 5. Percent of public elementary schools with prekindergarten classes, by the number of special education prekindergarten classes offered: 2000–2001
Public elementary schools with prekindergarten classes
57%
9%
16%
18%1 class
2 classes
3 or more classes
No special education classes(1 or more general education classes)
NOTE: Data presented in this figure are based on the estimated number of schools with at least one prekindergarten class—19,900. Special education prekindergarten classes are classes prior to kindergarten that serve only children with Individualized Education Programs.
SOURCE: U.S. Department of Education, National Center for Education Statist ics, Fast Response Survey System, “Survey of Classes That Serve Children Prior to Kindergarten in Public Schools: 2000–2001,” FRSS 78, 2001.
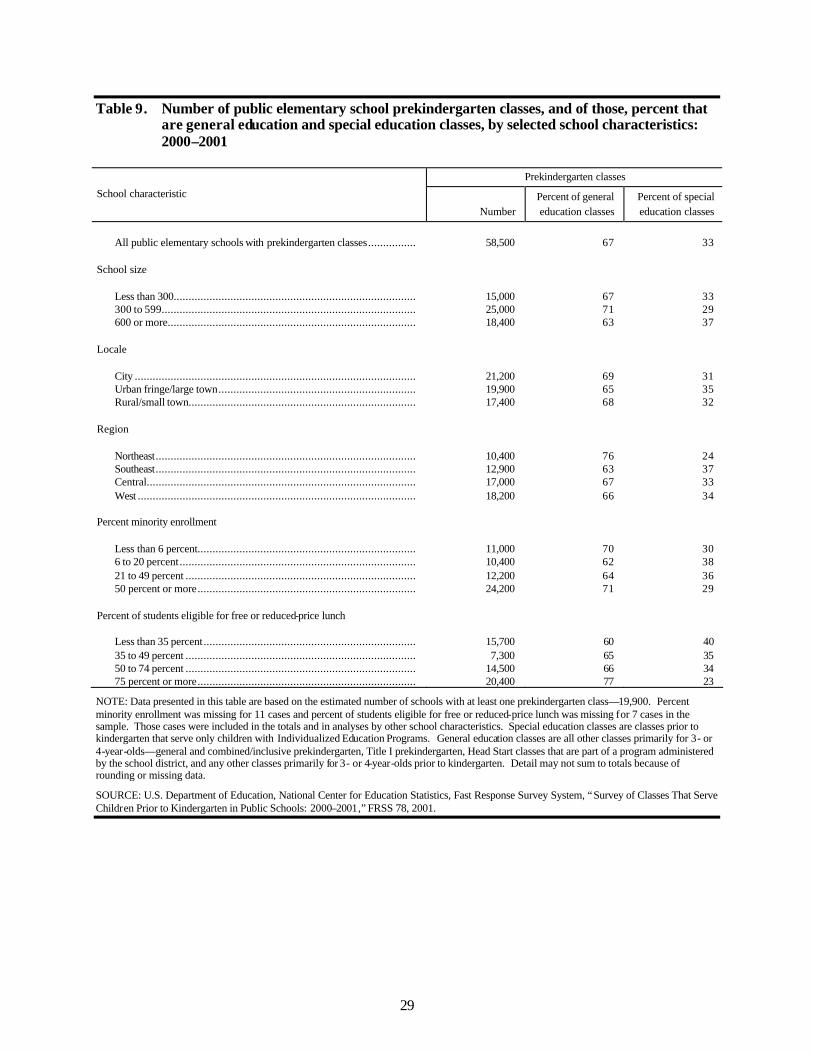
29
Table 9. Number of public elementary school prekindergarten classes, and of those, percent that are general education and special education classes, by selected school characteristics: 2000–2001
Prekindergarten classes
School characteristic
Number Percent of general education classes
Percent of special education classes
All public elementary schools with prekindergarten classes................ 58,500 67 33
School size
Less than 300................................................................................. 15,000 67 33 300 to 599..................................................................................... 25,000 71 29 600 or more................................................................................... 18,400 63 37
Locale
City .............................................................................................. 21,200 69 31 Urban fringe/large town.................................................................. 19,900 65 35 Rural/small town............................................................................ 17,400 68 32
Region
Northeast....................................................................................... 10,400 76 24 Southeast....................................................................................... 12,900 63 37 Central.......................................................................................... 17,000 67 33 West ............................................................................................. 18,200 66 34
Percent minority enrollment
Less than 6 percent......................................................................... 11,000 70 30 6 to 20 percent............................................................................... 10,400 62 38 21 to 49 percent ............................................................................. 12,200 64 36 50 percent or more......................................................................... 24,200 71 29
Percent of students eligible for free or reduced-price lunch
Less than 35 percent....................................................................... 15,700 60 40 35 to 49 percent ............................................................................. 7,300 65 35 50 to 74 percent ............................................................................. 14,500 66 34 75 percent or more......................................................................... 20,400 77 23
NOTE: Data presented in this table are based on the estimated number of schools with at least one prekindergarten class—19,900. Percent minority enrollment was missing for 11 cases and percent of students eligible for free or reduced-price lunch was missing for 7 cases in the sample. Those cases were included in the totals and in analyses by other school characteristics. Special education classes are classes prior to kindergarten that serve only children with Individualized Education Programs. General education classes are all other classes primarily for 3- or 4-year-olds—general and combined/inclusive prekindergarten, Title I prekindergarten, Head Start classes that are part of a program administered by the school district, and any other classes primarily for 3- or 4-year-olds prior to kindergarten. Detail may not sum to totals because of rounding or missing data.
SOURCE: U.S. Department of Education, National Center for Education Statistics, Fast Response Survey System, “Survey of Classes That Serve Children Prior to Kindergarten in Public Schools: 2000–2001,” FRSS 78, 2001.
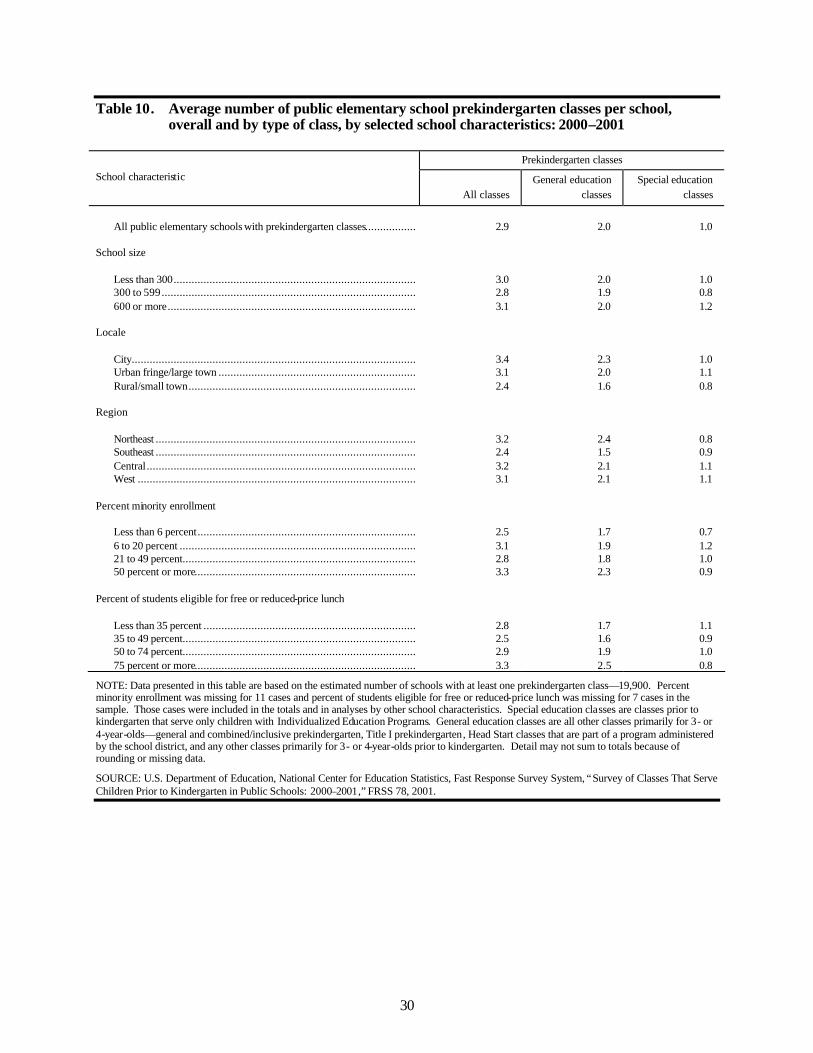
30
Table 10. Average number of public elementary school prekindergarten classes per school, overall and by type of class, by selected school characteristics: 2000–2001
Prekindergarten classes
School characteristic
All classes General education
classes Special education
classes
All public elementary schools with prekindergarten classes................. 2.9 2.0 1.0
School size
Less than 300................................................................................. 3.0 2.0 1.0 300 to 599..................................................................................... 2.8 1.9 0.8 600 or more................................................................................... 3.1 2.0 1.2
Locale
City............................................................................................... 3.4 2.3 1.0 Urban fringe/large town .................................................................. 3.1 2.0 1.1 Rural/small town............................................................................ 2.4 1.6 0.8
Region
Northeast ....................................................................................... 3.2 2.4 0.8 Southeast ....................................................................................... 2.4 1.5 0.9 Central.......................................................................................... 3.2 2.1 1.1 West ............................................................................................. 3.1 2.1 1.1
Percent minority enrollment
Less than 6 percent......................................................................... 2.5 1.7 0.7 6 to 20 percent ............................................................................... 3.1 1.9 1.2 21 to 49 percent.............................................................................. 2.8 1.8 1.0 50 percent or more.......................................................................... 3.3 2.3 0.9
Percent of students eligible for free or reduced-price lunch
Less than 35 percent ....................................................................... 2.8 1.7 1.1 35 to 49 percent.............................................................................. 2.5 1.6 0.9 50 to 74 percent.............................................................................. 2.9 1.9 1.0 75 percent or more.......................................................................... 3.3 2.5 0.8
NOTE: Data presented in this table are based on the estimated number of schools with at least one prekindergarten class—19,900. Percent minority enrollment was missing for 11 cases and percent of students eligible for free or reduced-price lunch was missing for 7 cases in the sample. Those cases were included in the totals and in analyses by other school characteristics. Special education classes are classes prior to kindergarten that serve only children with Individualized Education Programs. General education classes are all other classes primarily for 3- or 4-year-olds—general and combined/inclusive prekindergarten, Title I prekindergarten, Head Start classes that are part of a program administered by the school district, and any other classes primarily for 3- or 4-year-olds prior to kindergarten. Detail may not sum to totals because of rounding or missing data.
SOURCE: U.S. Department of Education, National Center for Education Statistics, Fast Response Survey System, “Survey of Classes That Serve Children Prior to Kindergarten in Public Schools: 2000–2001,” FRSS 78, 2001.
31
Southeast that offered prekindergarten classes offered fewer of them on average than did schools in the Northeast or Central regions:30 2.4 classes per school in the Southeast compared with 3.2 classes per school in both the Northeast and Central regions. The average number of classes offered also differed by percent minority enrollment and poverty concentration. Public schools with the lowest percent minority enrollment averaged 2.5 classes per school, whereas schools with the highest percent minority enrollment averaged 3.3 classes per school. Schools with 35 to 49 percent of students eligible to receive free or reduced-price lunch averaged 2.5 classes per school, whereas schools with 75 percent or more students eligible to receive free or reduced-price lunch averaged 3.3 classes per school. There were similar differences in the average number of general education prekindergarten classes offered by public schools. City schools offered a higher average number of general education prekindergarten classes than rural/small town schools: 2.3 classes per school versus 1.6 classes per school. Elementary schools in the Southeast offered an average of 1.5 classes compared with 2.1 to 2.4 classes per school in other regions. Schools with the lowest minority enrollment averaged 1.7 general education prekindergarten classes per school; schools with the highest minority enrollment averaged 2.3 classes per school. Finally, there were differences in the average number of general education classes by poverty concentration. Public schools with the highest poverty concentration averaged 2.5 classes per school, compared with 1.7 to 1.9 classes in schools with lower levels of poverty.
30However, schools in the Southeast were most likely to have
prekindergarten classes. Almost half (46 percent) of elementary schools in the Southeast offered prekindergarten; the percentages in the Northeast, Central, and West were 30 percent, 32 percent, and 35 percent, respectively.
Average Number of Children Per Prekindergarten Class in Public Schools The survey collected data necessary to calculate the average number of children enrolled in public elementary school prekindergarten classes overall, as well as in general prekindergarten classes and special education prekindergarten classes. On average, there were 14 children in each public elementary school prekindergarten class during the 2000–2001 school year (table 11). The average number of children per general education prekindergarten class was higher than the average for special education classes—17 children in general education classes compared with 9 children in special education classes. Results from the 1999–2000 Schools and Staffing Survey indicated that in public elementary schools nationwide, the average class size in self-contained classes was 21 students per class (Gruber et al. 2002). The overall average number of children per prekindergarten class in small schools was lower than the average in other schools. Small schools averaged 13 children per class, compared with 14 and 15 children per class in midsized and large schools, respectively. The average also was lower in rural/small town public schools than in city schools (13 versus 15 children per class, respectively). In addition, class sizes were lower in public schools in the Northeast (13 children per class) than in schools in the Southeast (15 children per class). Average prekindergarten class sizes were lower in public schools with lower percent minority enrollment and lower poverty concentrations than in schools with the highest percent minority enrollment and higher poverty concentrations. In schools with 50 percent or more minority enrollment, the average prekindergarten class size was 15 children, compared with 13 children in schools with less than 6 percent minority enrollment and 12 children in schools with 6 to 20 percent minority enrollment. There was an average of 12 children per prekindergarten class in schools with less than 35 percent of students
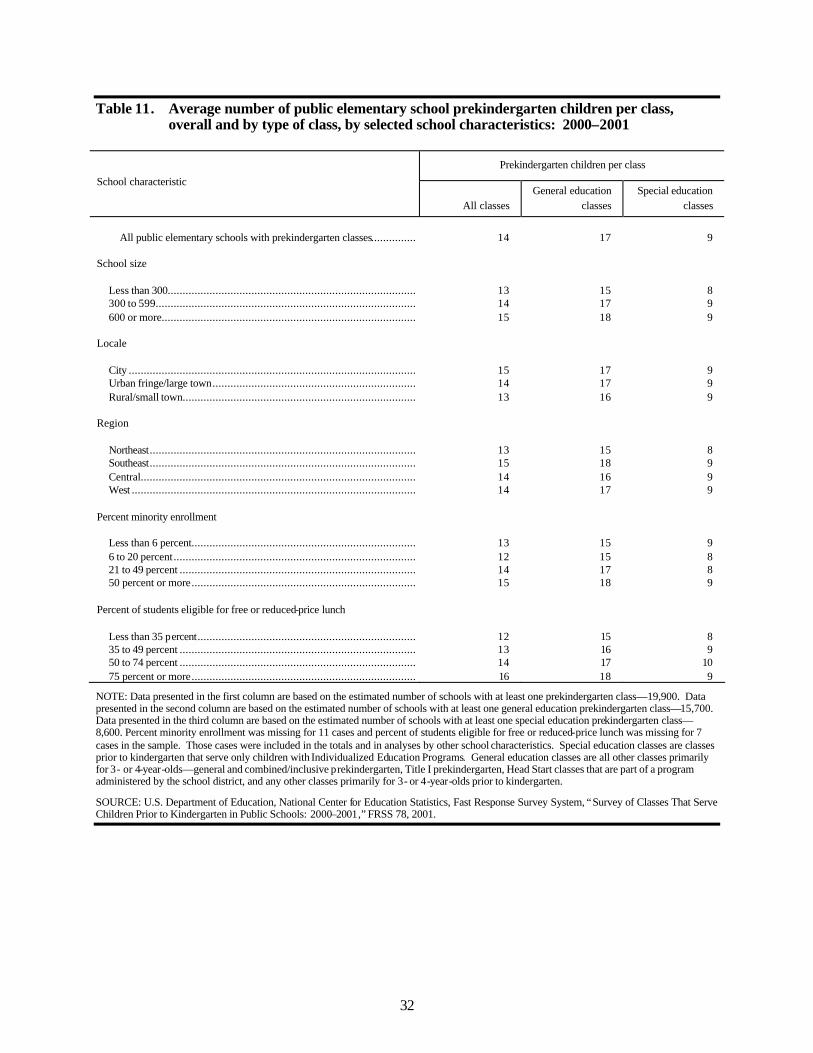
32
Table 11. Average number of public elementary school prekindergarten children per class, overall and by type of class, by selected school characteristics: 2000–2001
Prekindergarten children per class
School characteristic
All classes General education
classes Special education
classes
All public elementary schools with prekindergarten classes............... 14 17 9 School size Less than 300................................................................................... 13 15 8 300 to 599....................................................................................... 14 17 9 600 or more..................................................................................... 15 18 9 Locale City ................................................................................................ 15 17 9 Urban fringe/large town.................................................................... 14 17 9 Rural/small town.............................................................................. 13 16 9 Region Northeast......................................................................................... 13 15 8 Southeast......................................................................................... 15 18 9 Central............................................................................................ 14 16 9 West ............................................................................................... 14 17 9 Percent minority enrollment Less than 6 percent........................................................................... 13 15 9 6 to 20 percent................................................................................. 12 15 8 21 to 49 percent ............................................................................... 14 17 8 50 percent or more........................................................................... 15 18 9 Percent of students eligible for free or reduced-price lunch Less than 35 percent......................................................................... 12 15 8 35 to 49 percent ............................................................................... 13 16 9 50 to 74 percent ............................................................................... 14 17 10 75 percent or more........................................................................... 16 18 9
NOTE: Data presented in the first column are based on the estimated number of schools with at least one prekindergarten class—19,900. Data presented in the second column are based on the estimated number of schools with at least one general education prekindergarten class—15,700. Data presented in the third column are based on the estimated number of schools with at least one special education prekindergarten class—8,600. Percent minority enrollment was missing for 11 cases and percent of students eligible for free or reduced-price lunch was missing for 7 cases in the sample. Those cases were included in the totals and in analyses by other school characteristics. Special education classes are classes prior to kindergarten that serve only children with Individualized Education Programs. General education classes are all other classes primarily for 3- or 4-year-olds—general and combined/inclusive prekindergarten, Title I prekindergarten, Head Start classes that are part of a program administered by the school district, and any other classes primarily for 3- or 4-year-olds prior to kindergarten.
SOURCE: U.S. Department of Education, National Center for Education Statistics, Fast Response Survey System, “Survey of Classes That Serve Children Prior to Kindergarten in Public Schools: 2000–2001,” FRSS 78, 2001.
33
eligible to receive free or reduced-price lunch, compared with 14 children in schools with 50 to 74 percent of eligible students and 16 children in schools with 75 percent or more eligible students. Prekindergarten Class Schedules in Public Schools The survey also gathered information on the schedule of public school prekindergarten classes in terms of the length of the school day and the number of days per week that the classes met. During the 2000–2001 school year, 32 percent of the prekindergarten classes were full-day classes and 68 percent were half-day classes (table 12). Most full-day classes (84 percent) met 5 days per week. Among the half-day classes, 51 percent met 5 days per week. The likelihood that prekindergarten classes would be full day varied by each of the public school characteristics. Twenty-six percent of prekindergarten classes offered in small schools were full-day classes, compared with 36 percent of the classes offered in midsized schools. Prekindergarten classes in rural/small town schools were more likely to be full-day classes than those in urban fringe/large town schools: 38 percent of the classes offered in rural/small town schools were full-day classes, compared with 28 percent of classes offered in urban fringe/large town schools. In addition, there were differences in the percentages of full-day prekindergarten classes among schools in different regions of the country. About three-fourths (77 percent) of the classes offered in schools in the Southeast were full-day classes, compared with 23 percent of the classes in schools in the Northeast and the West, and 13 percent of the classes in schools in the Central region. The type of schedule followed by prekindergarten classes in public schools also varied by percent minority enrollment and poverty concentration in the school. Twenty-four percent of the
prekindergarten classes in schools with less than 6 percent minority enrollment were full-day classes, as were 19 percent of classes in schools with 6 to 20 percent minority enrollment. However, 38 percent of classes in schools with 21 to 49 percent minority enrollment and 40 percent of classes in schools with 50 percent or more minority enrollment were full-day classes. The likelihood that full-day prekindergarten classes were offered increased as poverty concentration increased, ranging from 17 percent of the classes at schools with the lowest poverty concentration to 42 percent of classes at schools with the highest poverty concentration. Among the prekindergarten classes that were full-day classes (32 percent), the likelihood that they were held 5 days each week increased with public school size, ranging from 74 percent in small schools to 91 percent in large schools. Full-day classes in city schools were nearly always held 5 days each week (97 percent), as were classes in urban fringe/large town schools (89 percent). However, 66 percent of the full-day classes in rural/small town schools were held that often. Full-day classes offered at schools in the Central region were less likely to take place 5 days per week than full-day classes in other regions— 56 percent in the Central region compared with 84 to 93 percent in other regions. In addition, there was a positive relationship between the likelihood that full-day prekindergarten classes would meet 5 days per week and percent minority enrollment. In schools with the lowest percent minority enrollment, 45 percent of the full-day classes met 5 days per week, whereas the percentages in schools with higher percent minority enrollment ranged from 75 to 93 percent. Most of the same distribution patterns were found among the 68 percent of prekindergarten classes that were half-day classes. However, no significant relationship was detected between school size and the likelihood that half-day classes met 5 days per week. Half-day classes offered at
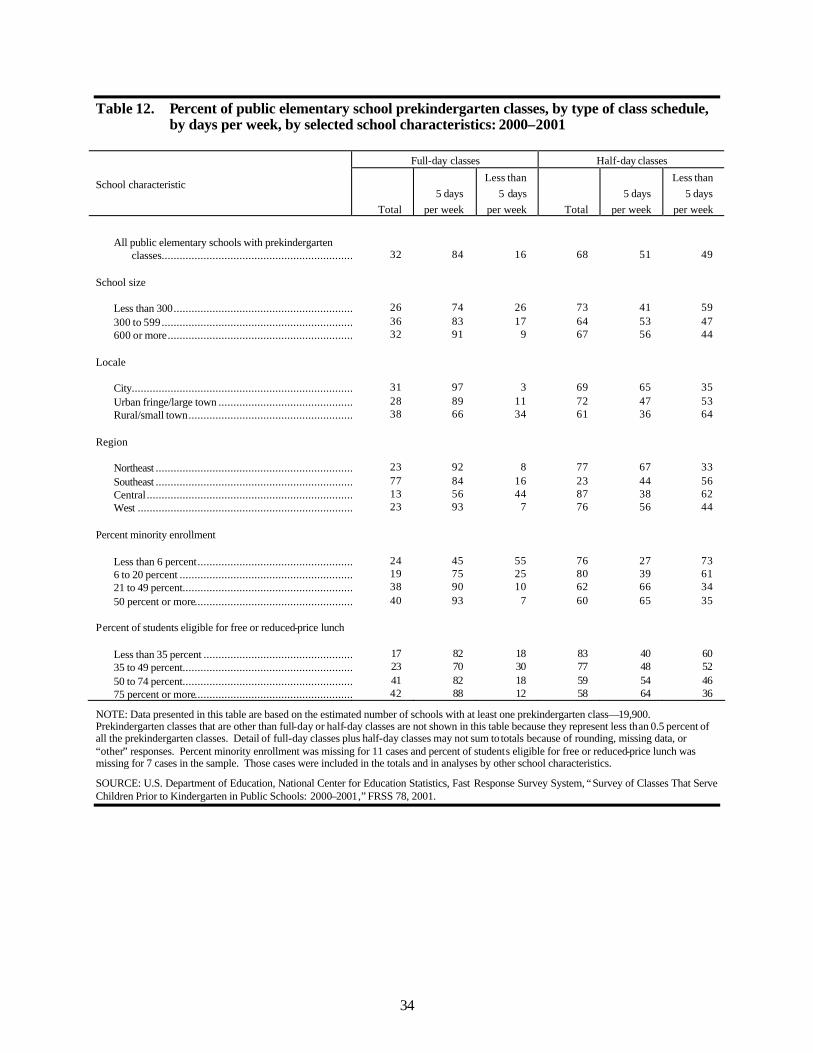
34
Table 12. Percent of public elementary school prekindergarten classes, by type of class schedule, by days per week, by selected school characteristics: 2000–2001
Full-day classes Half-day classes
School characteristic
Total 5 days
per week
Less than 5 days
per week Total 5 days
per week
Less than 5 days
per week
All public elementary schools with prekindergarten
classes................................................................ 32 84 16 68 51 49 School size
Less than 300................................................................ 26 74 26 73 41 59 300 to 599................................................................ 36 83 17 64 53 47 600 or more................................................................ 32 91 9 67 56 44
Locale
City...............................................................................................31 97 3 69 65 35 Urban fringe/large town ................................................................28 89 11 72 47 53 Rural/small town................................................................ 38 66 34 61 36 64
Region
Northeast .......................................................................................23 92 8 77 67 33 Southeast .......................................................................................77 84 16 23 44 56 Central..........................................................................................13 56 44 87 38 62 West .............................................................................................23 93 7 76 56 44
Percent minority enrollment
Less than 6 percent................................................................ 24 45 55 76 27 73 6 to 20 percent ................................................................ 19 75 25 80 39 61 21 to 49 percent................................................................ 38 90 10 62 66 34 50 percent or more................................................................ 40 93 7 60 65 35
Percent of students eligible for free or reduced-price lunch
Less than 35 percent ................................................................ 17 82 18 83 40 60 35 to 49 percent................................................................ 23 70 30 77 48 52 50 to 74 percent................................................................ 41 82 18 59 54 46 75 percent or more................................................................ 42 88 12 58 64 36
NOTE: Data presented in this table are based on the estimated number of schools with at least one prekindergarten class—19,900. Prekindergarten classes that are other than full-day or half-day classes are not shown in this table because they represent less than 0.5 percent of all the prekindergarten classes. Detail of full-day classes plus half-day classes may not sum to totals because of rounding, missing data, or “other” responses. Percent minority enrollment was missing for 11 cases and percent of students eligible for free or reduced-price lunch was missing for 7 cases in the sample. Those cases were included in the totals and in analyses by other school characteristics.
SOURCE: U.S. Department of Education, National Center for Education Statistics, Fast Response Survey System, “Survey of Classes That Serve Children Prior to Kindergarten in Public Schools: 2000–2001,” FRSS 78, 2001.
35
schools in the Central region were less likely to take place 5 days per week than half-day classes in the Northeast (38 versus 67 percent, respectively), but unlike full-day classes, no other differences by region were detected. There also were differences by poverty concentra-tion. As poverty concentration increased, the
likelihood that half-day classes met 5 days per week increased; the likelihood ranged from 40 percent of the half-day classes in schools with the lowest poverty concentration to 64 percent in public schools with the highest poverty concentration.

36

37
5. PREKINDERGARTEN TEACHERS IN PUBLIC SCHOOLS
The survey asked schools to report the number of public elementary school teachers who taught prekindergarten classes during the 2000–2001 school year. In addition, schools were asked to report on the credentials of the prekindergarten teachers and to compare their salaries with those of teachers who taught other elementary school grades (e.g., K–5, 1–6, K–8). The resulting data provide information on questions such as the following: • How many teachers are responsible for
teaching prekindergarten classes, and what are the characteristics of the schools in which they work?
• What percentage of prekindergarten teachers have bachelor’s degrees or more advanced degrees?
• Are prekindergarten teachers paid using the same pay scale as elementary school teachers?
Number of Prekindergarten Teachers in Public Schools During the 2000–2001 school year, nearly 46,000 public school teachers taught prekindergarten classes (table 13).31 Twenty-five percent of those prekindergarten teachers taught in small schools, 44 percent taught in midsized schools, and 31 percent taught in large schools. Seventeen percent of prekindergarten teachers taught in schools with the lowest percent minority
31For similar percentage distributions, see the following t ables: Table
1. Number and percentage distribution of public elementary schools and elementary schools with prekindergarten classes, by selected school characteristics: 2000–2001; Table 4. Number and percentage distribution of public elementary school prekindergarten children, by selected school characteristics: 2000–2001; and Table 8. Number and percentage distribution of public elementary school prekindergarten classes, by selected school characteristics: 2000–2001.
enrollment, 16 percent taught in schools with 6 to 20 percent minority enrollment, 22 percent taught in schools with 21 to 49 percent minority enrollment, and 44 percent taught in schools with the highest percent minority enrollment. Public School Prekindergarten Teachers’ Educational Background Nationwide, nearly all full-time and part-time public school teachers in regular elementary, middle, and high schools had a bachelor’s degree, and 45 percent held a master’s degree (Parsad, Lewis, and Farris 2001). The NCES Early Childhood Longitudinal Study, Kindergarten Class of 1998–99 base year study found that approximately 100 percent of kindergarten teachers had at least a bachelor’s degree (West 2002). The results of this FRSS survey indicate that 86 percent of prekindergarten teachers had a bachelor’s or higher degree (table 14). The likelihood that a prekindergarten teacher had at least a bachelor’s degree varied by school characteristics. • Prekindergarten teachers in city schools were
more likely to have at least a bachelor’s degree than were prekindergarten teachers in urban fringe/large town schools or rural/ small town schools (91 percent versus 84 and 83 percent, respectively).
• Higher percentages of prekindergarten teachers in the Northeast and Central regions had at least a bachelor’s degree than prekindergarten teachers in the West and in the Southeast (95 and 92 percent versus 84 and 79 percent, respectively).
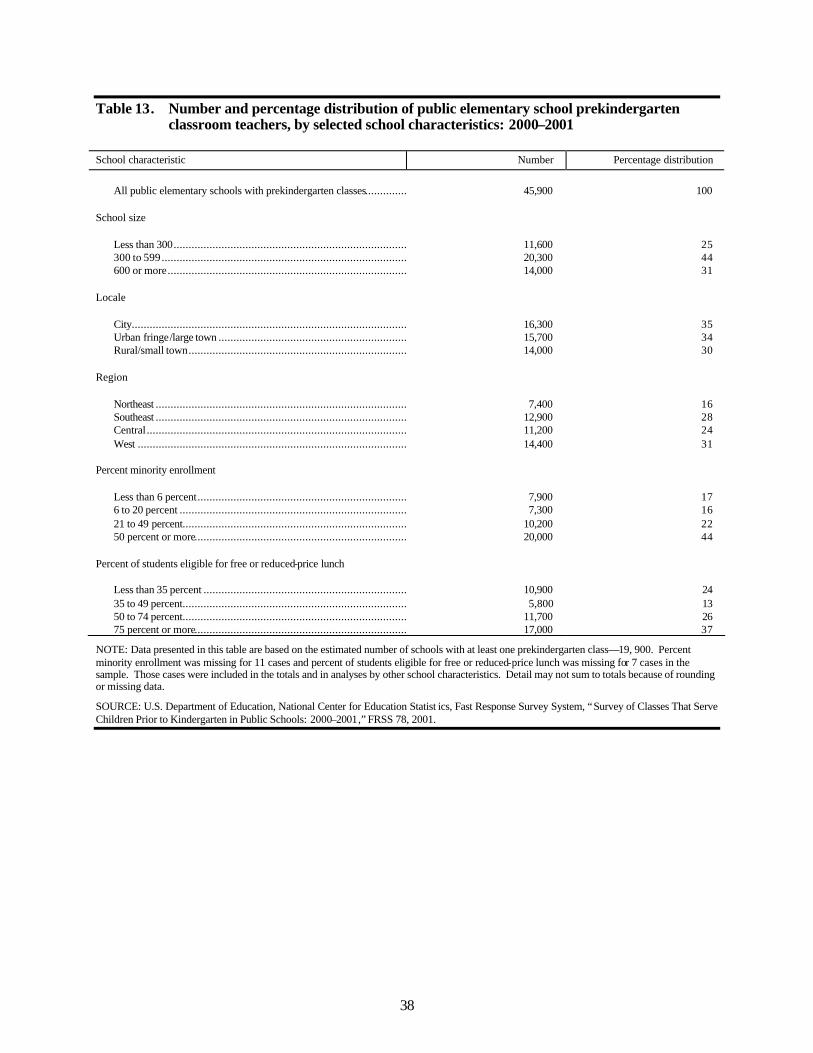
38
Table 13. Number and percentage distribution of public elementary school prekindergarten classroom teachers, by selected school characteristics: 2000–2001
School characteristic Number Percentage distribution
All public elementary schools with prekindergarten classes................. 45,900 100
School size
Less than 300................................................................................. 11,600 25 300 to 599..................................................................................... 20,300 44 600 or more................................................................................... 14,000 31
Locale
City............................................................................................... 16,300 35 Urban fringe/large town ................................................................ 15,700 34 Rural/small town............................................................................ 14,000 30
Region
Northeast ....................................................................................... 7,400 16 Southeast ....................................................................................... 12,900 28 Central.......................................................................................... 11,200 24 West ............................................................................................. 14,400 31
Percent minority enrollment
Less than 6 percent......................................................................... 7,900 17 6 to 20 percent ............................................................................... 7,300 16 21 to 49 percent.............................................................................. 10,200 22 50 percent or more.......................................................................... 20,000 44
Percent of students eligible for free or reduced-price lunch
Less than 35 percent ....................................................................... 10,900 24 35 to 49 percent.............................................................................. 5,800 13 50 to 74 percent.............................................................................. 11,700 26 75 percent or more.......................................................................... 17,000 37
NOTE: Data presented in this table are based on the estimated number of schools with at least one prekindergarten class—19, 900. Percent minority enrollment was missing for 11 cases and percent of students eligible for free or reduced-price lunch was missing for 7 cases in the sample. Those cases were included in the totals and in analyses by other school characteristics. Detail may not sum to totals because of rounding or missing data.
SOURCE: U.S. Department of Education, National Center for Education Statist ics, Fast Response Survey System, “Survey of Classes That Serve Children Prior to Kindergarten in Public Schools: 2000–2001,” FRSS 78, 2001.
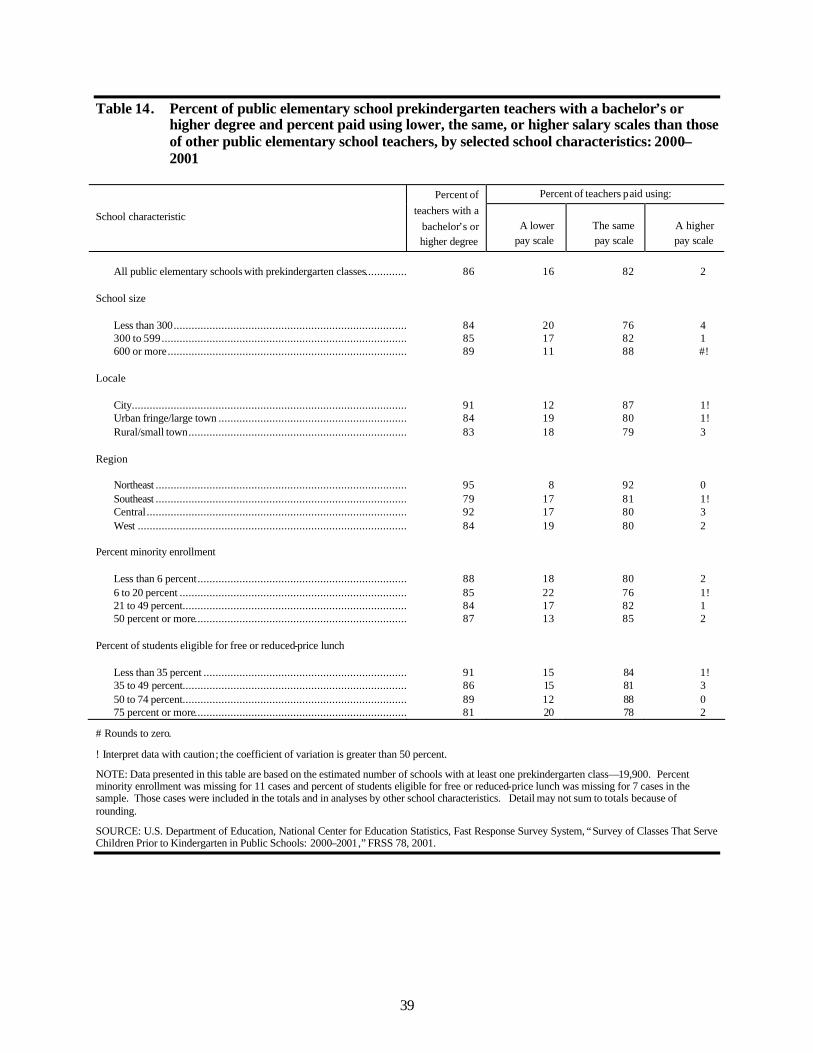
39
Table 14. Percent of public elementary school prekindergarten teachers with a bachelor’s or higher degree and percent paid using lower, the same, or higher salary scales than those of other public elementary school teachers, by selected school characteristics: 2000–2001
Percent of teachers paid using:
School characteristic
Percent of teachers with a
bachelor’s or higher degree
A lower pay scale
The same pay scale
A higher pay scale
All public elementary schools with prekindergarten classes................. 86 16 82 2
School size
Less than 300................................................................................. 84 20 76 4 300 to 599..................................................................................... 85 17 82 1 600 or more................................................................................... 89 11 88 #!
Locale
City............................................................................................... 91 12 87 1! Urban fringe/large town ................................................................ 84 19 80 1! Rural/small town............................................................................ 83 18 79 3
Region
Northeast ....................................................................................... 95 8 92 0 Southeast ....................................................................................... 79 17 81 1! Central.......................................................................................... 92 17 80 3 West ............................................................................................. 84 19 80 2
Percent minority enrollment
Less than 6 percent......................................................................... 88 18 80 2 6 to 20 percent ............................................................................... 85 22 76 1! 21 to 49 percent.............................................................................. 84 17 82 1 50 percent or more.......................................................................... 87 13 85 2
Percent of students eligible for free or reduced-price lunch
Less than 35 percent ....................................................................... 91 15 84 1! 35 to 49 percent.............................................................................. 86 15 81 3 50 to 74 percent.............................................................................. 89 12 88 0 75 percent or more.......................................................................... 81 20 78 2
# Rounds to zero.
! Interpret data with caution; the coefficient of variation is greater than 50 percent.
NOTE: Data presented in this table are based on the estimated number of schools with at least one prekindergarten class—19,900. Percent minority enrollment was missing for 11 cases and percent of students eligible for free or reduced-price lunch was missing for 7 cases in the sample. Those cases were included in the totals and in analyses by other school characteristics. Detail may not sum to totals because of rounding.
SOURCE: U.S. Department of Education, National Center for Education Statistics, Fast Response Survey System, “Survey of Classes That Serve Children Prior to Kindergarten in Public Schools: 2000–2001,” FRSS 78, 2001.
40
• Prekindergarten teachers in schools with the highest poverty concentration were less likely to hold at least a bachelor’s degree than were prekindergarten teachers in schools with the lowest poverty concentration (81 percent versus 91 percent).
Prekindergarten Teacher Salaries in Public Schools Another topic addressed in the survey was the pay scale used for public elementary school prekindergarten teachers. The majority (82 percent) of public elementary school prekindergarten teachers were paid using the elementary school teacher pay scale for their districts (table 14). Sixteen percent were paid less than they would have been and 2 percent were paid more than they would have been had the same scale been used. The likelihood that the same pay scale was used varied by school size, locale, region, and poverty
concentration. Seventy-six percent of prekinder-garten teachers in small schools were paid using the elementary school teacher pay scale, compared with 88 percent of prekindergarten teachers in large schools. In addition, 20 percent of pre-kindergarten teachers in small schools were paid less than they would have been had the same pay scale been used, as was the case for 11 percent of prekindergarten teachers in large schools. Eighty-seven percent of prekindergarten teachers in city schools were paid using the same pay scale, compared with 79 percent of prekindergarten teachers in rural/small town schools. Although 92 percent of prekindergarten teachers in schools in the Northeast were paid using the same pay scale, 80 to 81 percent of prekindergarten teachers in schools from other regions were paid using the same pay scale. Eighty-eight percent of prekinder-garten teachers in schools with 50 to 74 percent of students eligible for free or reduced-price lunch were paid using the same pay scale, although 78 percent of the prekindergarten teachers in schools with higher poverty concentrations were paid using the same pay scale.
41
6. SUPPORT SERVICES OFFERED TO PREKINDERGARTEN CHILDREN
IN PUBLIC SCHOOLS
The survey gathered information on the provision of three student support services—transportation, meals, and extended day care—to prekindergarten children at regular and special education public elementary schools. The resulting data address questions such as the following: • What percentage of public elementary schools
with prekindergarten classes offered these services to prekindergarten children during the 2000–2001 school year?
• What percentage of prekindergarten children received the services?
Public Schools Offering Support Services to Prekindergarten Children Preliminary analysis of the survey data indicated that the likelihood of public schools providing these support services to prekindergarten children was related to several school characteristics (e.g., school size, locale, region, and percent minority enrollment) and also to prekindergarten class schedule. Regression analysis was conducted to determine the nature of these relationships. Of the 19,900 public elementary schools with prekindergarten classes during the 2000–2001 school year, 79 percent reported that prekindergarten children received transportation services32 (table 15). Overall, prekindergarten children in 84 percent of small schools and 82 percent of midsized schools received transportation services, compared with children in 72 percent of large schools. This overall
32Schools were asked to report the number of children receiving each
service. A school is considered to have prekindergarten children receiving the service if at least one child received the service during the 2000–2001 school year.
relationship, however, varied by class schedule. Among schools with full-day prekindergarten classes only, no significant differences by school size were observed (85 percent of small schools, 78 percent of midsized schools, and 81 percent of large schools). However, among schools with half-day prekindergarten classes only, the likelihood that prekindergarten children in the school received transportation declined as school size increased (ranging from 86 percent among small schools to 62 percent among large schools).33 The percentage of public schools with prekindergarten children receiving transportation services also varied by locale: 91 percent of rural/small town schools and 84 percent of urban fringe/large town schools reported that prekindergarten children received transportation services, compared with 60 percent of city schools. Public schools in the Southeast (89 percent) and Central region (83 percent) were more likely to report prekindergarten children receiving transportation services than public schools in the Northeast and the West (71 percent for both). Moreover, among the schools that offered full-day prekindergarten classes only, those in the Northeast were least likely to report that prekindergarten children received transportation services (48 percent compared with 78 percent in the West, 81 percent in the Central region, and 87 percent in the Southeast). Among schools with half-day prekindergarten classes only, schools in the West were less likely than those in the Central
33It is important to note that school size and locale are related, with
city schools typically being larger than rural schools. Because of the relatively small sample size used in this study, it is difficult to separate the independent effects of these variables. Their existence, however, should be considered in the interpretation of these data.
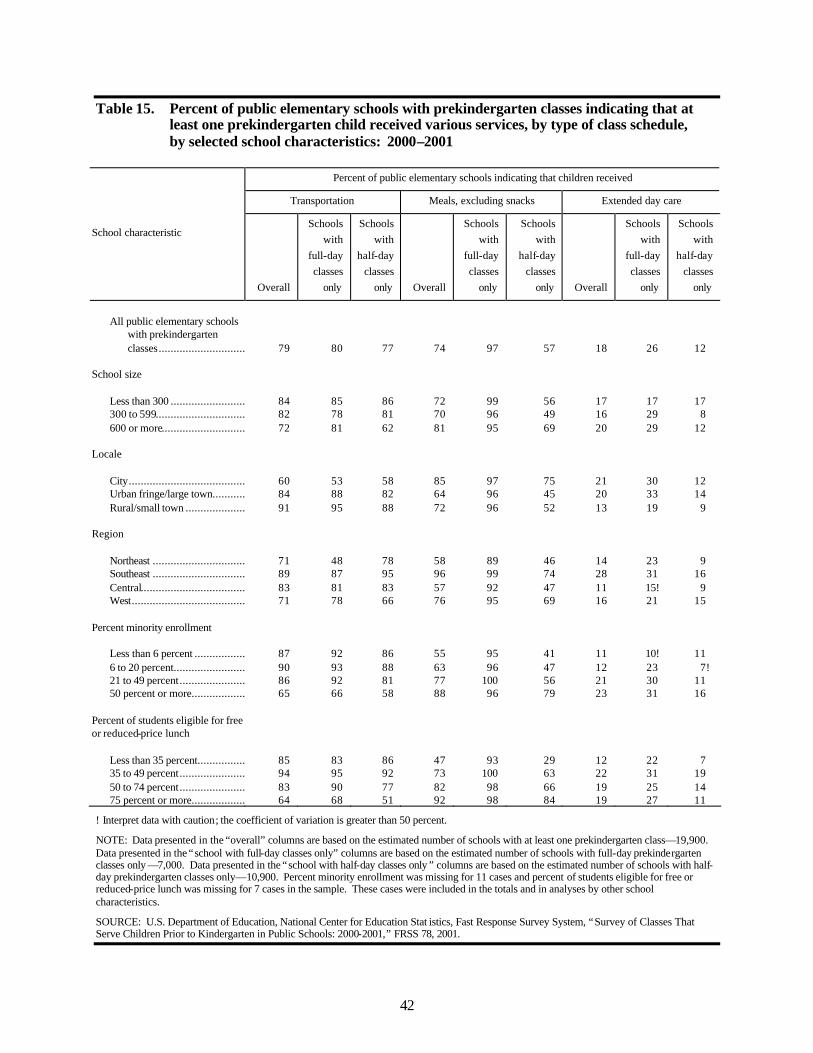
42
Table 15. Percent of public elementary schools with prekindergarten classes indicating that at least one prekindergarten child received various services, by type of class schedule, by selected school characteristics: 2000–2001
Percent of public elementary schools indicating that children received
Transportation Meals, excluding snacks Extended day care
School characteristic
Overall
Schools with
full-day classes
only
Schools with
half-day classes
only Overall
Schools with
full-day classes
only
Schools with
half-day classes
only Overall
Schools with
full-day classes
only
Schools with
half-day classes
only
All public elementary schools
with prekindergarten classes................................ 79 80 77 74 97 57 18 26 12
School size
Less than 300 ................................ 84 85 86 72 99 56 17 17 17 300 to 599................................ 82 78 81 70 96 49 16 29 8 600 or more................................ 72 81 62 81 95 69 20 29 12
Locale
City................................................................60 53 58 85 97 75 21 30 12 Urban fringe/large town................................84 88 82 64 96 45 20 33 14 Rural/small town ................................91 95 88 72 96 52 13 19 9
Region
Northeast ................................ 71 48 78 58 89 46 14 23 9 Southeast ................................ 89 87 95 96 99 74 28 31 16 Central................................................................83 81 83 57 92 47 11 15! 9 West................................................................71 78 66 76 95 69 16 21 15
Percent minority enrollment
Less than 6 percent ................................87 92 86 55 95 41 11 10! 11 6 to 20 percent................................ 90 93 88 63 96 47 12 23 7! 21 to 49 percent................................ 86 92 81 77 100 56 21 30 11 50 percent or more................................65 66 58 88 96 79 23 31 16
Percent of students eligible for free or reduced-price lunch
Less than 35 percent................................85 83 86 47 93 29 12 22 7 35 to 49 percent................................ 94 95 92 73 100 63 22 31 19 50 to 74 percent................................ 83 90 77 82 98 66 19 25 14 75 percent or more................................64 68 51 92 98 84 19 27 11
! Interpret data with caution; the coefficient of variation is greater than 50 percent.
NOTE: Data presented in the “overall” columns are based on the estimated number of schools with at least one prekindergarten class—19,900. Data presented in the “school with full-day classes only” columns are based on the estimated number of schools with full-day prekindergarten classes only —7,000. Data presented in the “school with half-day classes only ” columns are based on the estimated number of schools with half-day prekindergarten classes only—10,900. Percent minority enrollment was missing for 11 cases and percent of students eligible for free or reduced-price lunch was missing for 7 cases in the sample. These cases were included in the totals and in analyses by other school characteristics.
SOURCE: U.S. Department of Education, National Center for Education Stat istics, Fast Response Survey System, “Survey of Classes That Serve Children Prior to Kindergarten in Public Schools: 2000-2001,” FRSS 78, 2001.
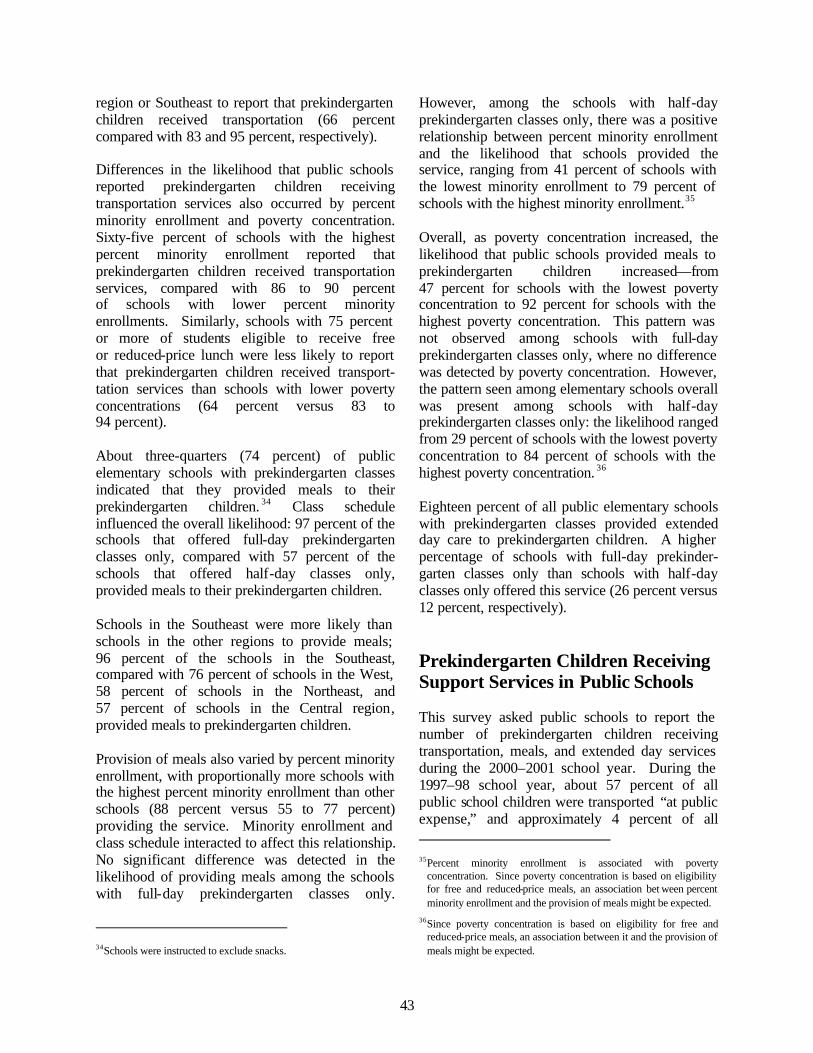
43
region or Southeast to report that prekindergarten children received transportation (66 percent compared with 83 and 95 percent, respectively). Differences in the likelihood that public schools reported prekindergarten children receiving transportation services also occurred by percent minority enrollment and poverty concentration. Sixty-five percent of schools with the highest percent minority enrollment reported that prekindergarten children received transportation services, compared with 86 to 90 percent of schools with lower percent minority enrollments. Similarly, schools with 75 percent or more of students eligible to receive free or reduced-price lunch were less likely to report that prekindergarten children received transport-tation services than schools with lower poverty concentrations (64 percent versus 83 to 94 percent). About three-quarters (74 percent) of public elementary schools with prekindergarten classes indicated that they provided meals to their prekindergarten children. 34 Class schedule influenced the overall likelihood: 97 percent of the schools that offered full-day prekindergarten classes only, compared with 57 percent of the schools that offered half-day classes only, provided meals to their prekindergarten children. Schools in the Southeast were more likely than schools in the other regions to provide meals; 96 percent of the schools in the Southeast, compared with 76 percent of schools in the West, 58 percent of schools in the Northeast, and 57 percent of schools in the Central region, provided meals to prekindergarten children. Provision of meals also varied by percent minority enrollment, with proportionally more schools with the highest percent minority enrollment than other schools (88 percent versus 55 to 77 percent) providing the service. Minority enrollment and class schedule interacted to affect this relationship. No significant difference was detected in the likelihood of providing meals among the schools with full-day prekindergarten classes only.
34Schools were instructed to exclude snacks.
However, among the schools with half-day prekindergarten classes only, there was a positive relationship between percent minority enrollment and the likelihood that schools provided the service, ranging from 41 percent of schools with the lowest minority enrollment to 79 percent of schools with the highest minority enrollment.35 Overall, as poverty concentration increased, the likelihood that public schools provided meals to prekindergarten children increased—from 47 percent for schools with the lowest poverty concentration to 92 percent for schools with the highest poverty concentration. This pattern was not observed among schools with full-day prekindergarten classes only, where no difference was detected by poverty concentration. However, the pattern seen among elementary schools overall was present among schools with half-day prekindergarten classes only: the likelihood ranged from 29 percent of schools with the lowest poverty concentration to 84 percent of schools with the highest poverty concentration. 36 Eighteen percent of all public elementary schools with prekindergarten classes provided extended day care to prekindergarten children. A higher percentage of schools with full-day prekinder-garten classes only than schools with half-day classes only offered this service (26 percent versus 12 percent, respectively). Prekindergarten Children Receiving Support Services in Public Schools This survey asked public schools to report the number of prekindergarten children receiving transportation, meals, and extended day services during the 2000–2001 school year. During the 1997–98 school year, about 57 percent of all public school children were transported “at public expense,” and approximately 4 percent of all 35Percent minority enrollment is associated with poverty
concentration. Since poverty concentration is based on eligibility for free and reduced-price meals, an association bet ween percent minority enrollment and the provision of meals might be expected.
36Since poverty concentration is based on eligibility for free and reduced-price meals, an association between it and the provision of meals might be expected.
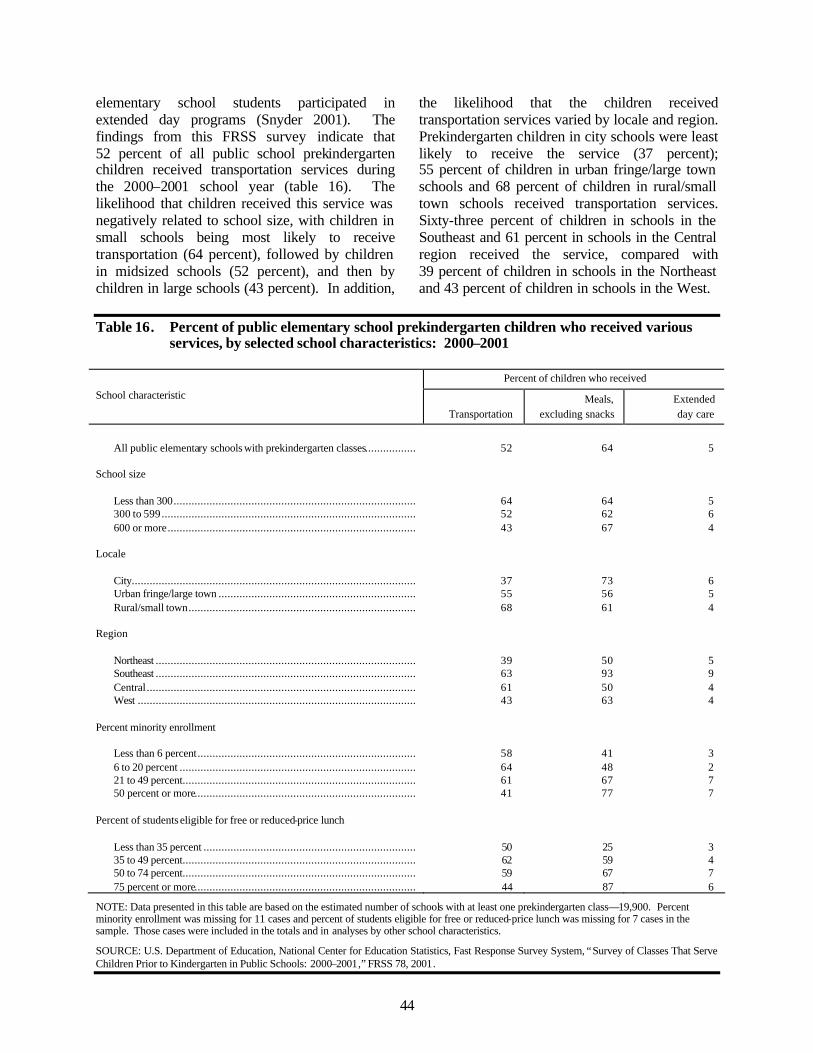
44
elementary school students participated in extended day programs (Snyder 2001). The findings from this FRSS survey indicate that 52 percent of all public school prekindergarten children received transportation services during the 2000–2001 school year (table 16). The likelihood that children received this service was negatively related to school size, with children in small schools being most likely to receive transportation (64 percent), followed by children in midsized schools (52 percent), and then by children in large schools (43 percent). In addition,
the likelihood that the children received transportation services varied by locale and region. Prekindergarten children in city schools were least likely to receive the service (37 percent); 55 percent of children in urban fringe/large town schools and 68 percent of children in rural/small town schools received transportation services. Sixty-three percent of children in schools in the Southeast and 61 percent in schools in the Central region received the service, compared with 39 percent of children in schools in the Northeast and 43 percent of children in schools in the West.
Table 16. Percent of public elementary school prekindergarten children who received various services, by selected school characteristics: 2000–2001
Percent of children who received
School characteristic
Transportation Meals,
excluding snacks Extended day care
All public elementary schools with prekindergarten classes................. 52 64 5
School size
Less than 300................................................................................. 64 64 5 300 to 599..................................................................................... 52 62 6 600 or more................................................................................... 43 67 4
Locale
City............................................................................................... 37 73 6 Urban fringe/large town .................................................................. 55 56 5 Rural/small town............................................................................ 68 61 4
Region
Northeast ....................................................................................... 39 50 5 Southeast ....................................................................................... 63 93 9 Central.......................................................................................... 61 50 4 West ............................................................................................. 43 63 4
Percent minority enrollment
Less than 6 percent......................................................................... 58 41 3 6 to 20 percent ............................................................................... 64 48 2 21 to 49 percent.............................................................................. 61 67 7 50 percent or more.......................................................................... 41 77 7
Percent of students eligible for free or reduced-price lunch
Less than 35 percent ....................................................................... 50 25 3 35 to 49 percent.............................................................................. 62 59 4 50 to 74 percent.............................................................................. 59 67 7 75 percent or more.......................................................................... 44 87 6
NOTE: Data presented in this table are based on the estimated number of schools with at least one prekindergarten class—19,900. Percent minority enrollment was missing for 11 cases and percent of students eligible for free or reduced-price lunch was missing for 7 cases in the sample. Those cases were included in the totals and in analyses by other school characteristics.
SOURCE: U.S. Department of Education, National Center for Education Statistics, Fast Response Survey System, “Survey of Classes That Serve Children Prior to Kindergarten in Public Schools: 2000–2001,” FRSS 78, 2001.
45
Percent minority enrollment and poverty concentration also were related to the likelihood that prekindergarten children received trans-portation services. Forty-one percent of the prekindergarten children in schools with the highest percent minority enrollment received transportation services; the percentage of children in other schools receiving this service ranged from 58 percent to 64 percent. Forty-four percent of the prekindergarten children in schools with the highest poverty concentration received trans-portation services, whereas 62 percent of children in schools with 35 to 49 percent of students eligible for free or reduced-price lunch received transportation services. A program fact sheet published by the U.S. Department of Agriculture indicates that during fiscal year 2000, the National School Lunch Program provided lunch to about 27.4 million public and private school students nationwide including full-price, reduced-price, and free lunches (U.S. Department of Agriculture 2001). NCES reported that 46.9 million students attended public schools (Bairu 2001) and 5.2 million attended private schools (Broughman and Colaciello 2001) during the 1999–2000 school year. Therefore, roughly 53 percent of all public and private school students received lunch through the National School Lunch Program. This FRSS survey found that 64 percent of public school prekindergarten children received meals at
school, and the likelihood that children received meals varied by all the school characteristics except school size. Seventy-three percent of children in city schools compared with 56 percent of children in urban fringe/large town schools received meals. Children in schools in the Southeast were more likely than children in any other region to receive meals at school (93 percent compared with 50 to 63 percent). The greater the percent minority enrollment at the school, the more likely prekindergarten children were to receive meals, ranging from 41 percent in schools with the lowest percent minority enrollment to 77 percent in schools with the highest percent minority enrollment. There was a similar relationship between poverty concentration and receipt of meals; the likelihood of prekindergarten children receiving meals at school ranged from 25 percent in schools with the lowest poverty concentration to 87 percent in schools with the highest poverty concentration. Overall, 5 percent of prekindergarten children in public schools received extended day care at school. Prekindergarten children from schools with percent minority enrollment between 6 and 20 percent were less likely to receive extended day care than were children from schools with 21 to 49 percent minority enrollment and schools with 50 percent or more minority enrollment (2 percent versus 7 percent).

46
47
7. PUBLIC SCHOOL PREKINDERGARTEN FUNDING SOURCES
Public schools were asked to indicate whether or not they received funding from various sources for their prekindergarten classes37 during the 2000–2001 school year. Sources listed in the questionnaire included state or local education funds; Head Start; Title I, Part A;38 Title I, Part B (Even Start);39 federal or local programs for children with disabilities; child care funds through a state or local agency; and other sources. The survey data describe the percentage of public elementary schools that received funds from each source to support their prekindergarten classes. As shown in table 17, public schools received funding for their prekindergarten classes from a variety of sources. State or local education funds were the most frequently identified source of prekindergarten funding (80 percent of schools), followed by funding from federal or local programs for children with disabilities (51 percent)
37The questionnaire asked about funding for prekindergarten services
(i.e., prekindergarten classes) as opposed to funding for support services such as transportation, meals, and extended day care.
38Title I is designed to support state and local school reform efforts tied to challenging state academic standards in order to reinforce and amplify efforts to improve teaching and learning for students farthest from meeting state standards. Individual schools with 50 percent or more of the students eligible to receive free or reduced-price lunch may use Title I funds, along with other federal, state, and local funds, to operate a “school-wide program” to upgrade the instructional program for the whole school. Schools with poverty rates below 50 percent, or those choosing not to operate a school-wide program, offer a “targeted assistance program” in which the school identifies students who are failing, or most at risk of failing, to meet the state’s challenging performance standards, then designs, in consultation with parents, staff, and district staff, an instructional program to meet the needs of those students.
39Currently Title I, Part B (Even Start) provides formula grants to states, discretionary statewide family literacy initiative grants, and discretionary grants to migratory workers, Indian tribes and tribal organizations, and a prison that houses women and children. Even Start’s core services have four components, as specified in the legislation: adult education and adult literacy; parenting education; early childhood education (e.g., developmentally appropriate educational services for children designed to prepare them for success in regular school programs); and interactive parent and child literacy activities.
and Title I, Part A (25 percent). Thirteen percent of the schools received Head Start funds, and 11 percent received child care funds through a state or local agency for their prekindergarten classes. Title I, Part B funds were received by 4 percent of schools with prekindergarten classes. There were some differences by public school characteristics in the likelihood that schools received funding from these sources. For example: • Fifty-six percent of rural/small town schools
received funds from federal or local programs for children with disabilities, compared with 42 percent of city schools.
• More city schools and rural/small town schools received Title I, Part A funds than did urban fringe/large town schools (33 and 27 percent versus 16 percent, respectively). In addition, schools in the West were more likely to have received funding from this source than were schools in the Central region or in the Northeast (33 percent versus 20 and 18 per-cent, respectively).
• Poverty concentration was positively related to the likelihood that schools received Title I, Part A funds and the likelihood that they received child care funds through a state or local agency for prekindergarten. As poverty concentration increased, the likelihood that schools received Title I, Part A funds increased from 8 percent to 40 percent; the likelihood that they received child care funds increased from 7 percent to 15 percent.
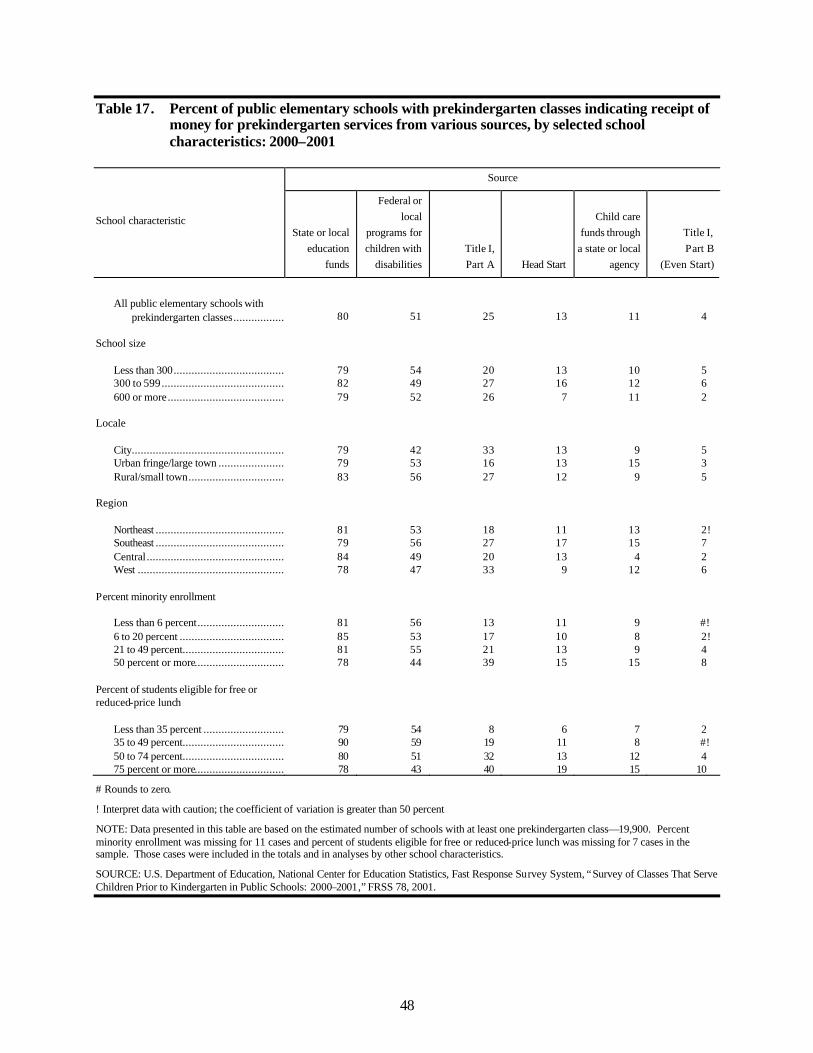
48
Table 17. Percent of public elementary schools with prekindergarten classes indicating receipt of money for prekindergarten services from various sources, by selected school characteristics: 2000–2001
Source
School characteristic State or local
education funds
Federal or local
programs for children with
disabilities Title I, Part A Head Start
Child care funds through
a state or local agency
Title I, Part B
(Even Start)
All public elementary schools with
prekindergarten classes................................ 80 51 25 13 11 4 School size
Less than 300................................................................79 54 20 13 10 5 300 to 599................................................................82 49 27 16 12 6 600 or more................................................................79 52 26 7 11 2
Locale
City................................................................ 79 42 33 13 9 5 Urban fringe/large town ................................ 79 53 16 13 15 3 Rural/small town................................................................83 56 27 12 9 5
Region
Northeast ................................................................81 53 18 11 13 2! Southeast ................................................................79 56 27 17 15 7 Central................................................................84 49 20 13 4 2 West ................................................................ 78 47 33 9 12 6
Percent minority enrollment
Less than 6 percent................................ 81 56 13 11 9 #! 6 to 20 percent ................................................................85 53 17 10 8 2! 21 to 49 percent................................................................81 55 21 13 9 4 50 percent or more................................ 78 44 39 15 15 8
Percent of students eligible for free or reduced-price lunch
Less than 35 percent ................................ 79 54 8 6 7 2 35 to 49 percent................................................................ 90 59 19 11 8 #! 50 to 74 percent................................................................ 80 51 32 13 12 4 75 percent or more................................ 78 43 40 19 15 10
# Rounds to zero.
! Interpret data with caution; the coefficient of variation is greater than 50 percent
NOTE: Data presented in this table are based on the estimated number of schools with at least one prekindergarten class—19,900. Percent minority enrollment was missing for 11 cases and percent of students eligible for free or reduced-price lunch was missing for 7 cases in the sample. Those cases were included in the totals and in analyses by other school characteristics.
SOURCE: U.S. Department of Education, National Center for Education Statistics, Fast Response Survey System, “Survey of Classes That Serve Children Prior to Kindergarten in Public Schools: 2000–2001,” FRSS 78, 2001.
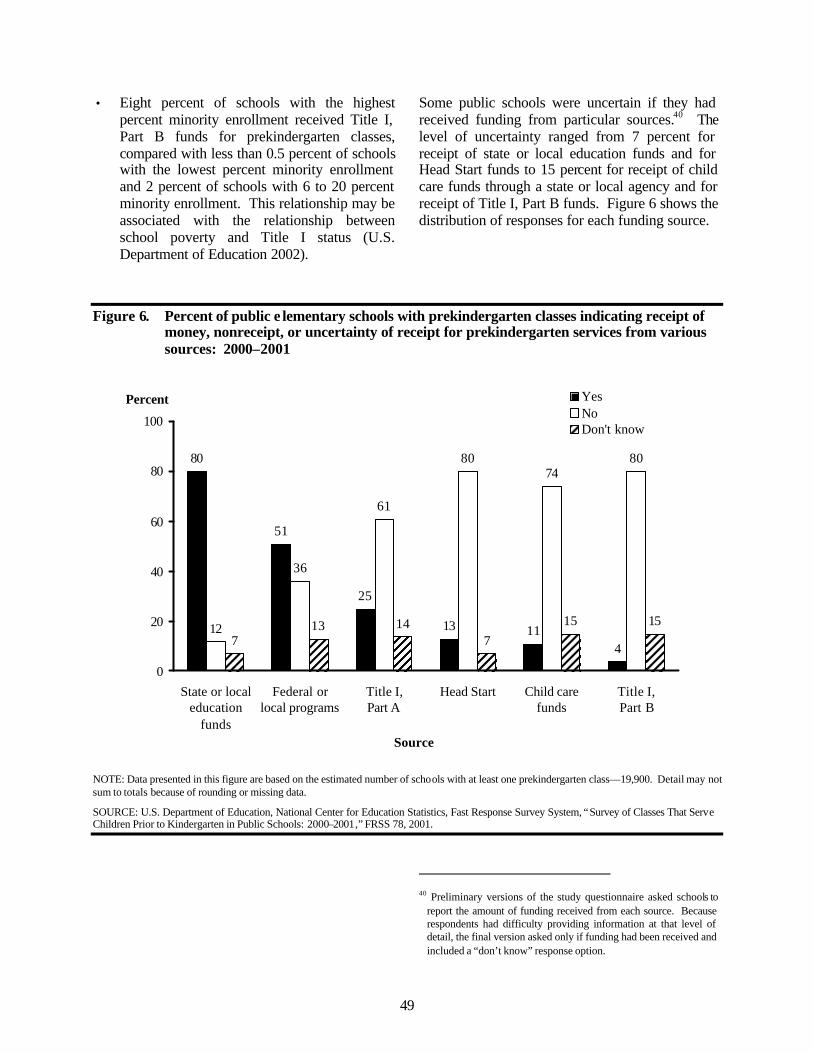
49
• Eight percent of schools with the highest percent minority enrollment received Title I, Part B funds for prekindergarten classes, compared with less than 0.5 percent of schools with the lowest percent minority enrollment and 2 percent of schools with 6 to 20 percent minority enrollment. This relationship may be associated with the relationship between school poverty and Title I status (U.S. Department of Education 2002).
Some public schools were uncertain if they had received funding from particular sources.40 The level of uncertainty ranged from 7 percent for receipt of state or local education funds and for Head Start funds to 15 percent for receipt of child care funds through a state or local agency and for receipt of Title I, Part B funds. Figure 6 shows the distribution of responses for each funding source.
40 Preliminary versions of the study questionnaire asked schools to
report the amount of funding received from each source. Because respondents had difficulty providing information at that level of detail, the final version asked only if funding had been received and included a “don’t know” response option.
Figure 6. Percent of public e lementary schools with prekindergarten classes indicating receipt of money, nonreceipt, or uncertainty of receipt for prekindergarten services from various sources: 2000–2001
80
51
25
13 114
12
36
61
8074
80
713 14
715 15
0
20
40
60
80
100
State or localeducation
funds
Federal orlocal programs
Title I,Part A
Head Start Child carefunds
Title I,Part B
YesNo Don't know
Percent
Source
NOTE: Data presented in this figure are based on the estimated number of schools with at least one prekindergarten class—19,900. Detail may not sum to totals because of rounding or missing data.
SOURCE: U.S. Department of Education, National Center for Education Statistics, Fast Response Survey System, “Survey of Classes That Serve Children Prior to Kindergarten in Public Schools: 2000–2001,” FRSS 78, 2001.

50
51
8. SUMMARY
The National Center for Education Statistics has collected extensive information on grades 1–12 and postsecondary education for several decades and, through the Early Childhood Longitudinal Survey, Kindergarten Class of 1998–99, has more recently begun to collect information on the characteristics of kindergarten classes nationwide. The Survey of Classes That Serve Children Prior to Kindergarten in Public Schools, undertaken by NCES using its Fast Response Survey System, was the first national data collection that focused exclusively on classes offered by U.S. public elementary schools41 for children prior to kindergarten. Findings from this study complement our understanding of the educational structure and programs across the entire spectrum from preschool through postsecondary levels. This survey is the first to characterize public elementary school prekindergarten classes nationwide. Results from the survey provide information on the public schools that offered prekindergarten classes and describe characteristics of prekindergarten children and their teachers. For example, there were about 19,900 public elementary schools (35 percent) with prekindergarten classes during the 2000–2001 school year (table 1); 28 percent of all public elementary schools offered general education prekindergarten classes, and 15 percent offered special education prekindergarten classes (table 2). During the 2000–2001 school year, approximately 822,000 children were enrolled in public elementary school prekindergarten classes (table 4). As of October 1, 2000, 3 percent of these children were younger than 3 years, 20 percent were 3 years, 68 percent were 4 years, and 9 percent were 5 years or older (figure 2). Forty-nine percent of the children were White,
41Public special education and regular elementary and combined
schools were included in the study sample. These schools are referred to as public elementary schools throughout this report. See methodology in appendix A for a detailed description of school types.
24 percent were Hispanic, and 23 percent were Black (table 6). Asian and American Indian/Alaska Native children represented 3 and 2 percent of the prekindergarten population, respectively (table 6). Additional information from the study describes the number of prekindergarten children who were LEP, the number who were low income, and the number with IEPs. Approximately 58,500 prekindergarten classes were offered in regular and special education public elementary schools during the 2000–2001 school year (table 8). Overall, public elementary schools that offered prekindergarten classes averaged 2.9 prekindergarten classes per school (table 10). On average, there were 14 children enrolled in each class (table 11). Sixty-seven percent of the prekindergarten classes were general education classes, and 33 percent were special education classes (table 9). Nationwide, public elementary schools averaged two general education prekindergarten classes and one special education prekindergarten class (table 10). The survey also collected information on the length of the school day and number of days per week that prekindergarten classes were offered in public schools. Thirty-two percent of the classes were full-day classes, and most (84 percent) of these full-day classes met 5 days per week (table 12). Sixty-eight percent of the prekindergarten classes were half-day classes; 51 percent of these half-day classes met 5 days per week (table 12). Nearly 46,000 public school teachers taught prekindergarten classes in public schools during the 2000–2001 school year (table 13). Eighty-six percent of the teachers had a bachelor’s or higher degree (table 14). The majority (82 percent) of public elementary school prekindergarten teachers were paid using the elementary school teacher pay scale for their districts, although the likelihood varied by school size, locale, region, and poverty concentration (table 14).
52
Of the 19,900 public elementary schools with prekindergarten classes, 79 percent indicated that prekindergarten children received transportation services, 74 percent provided meals to prekindergarten children, and 18 percent provided extended day care (table 15). The likelihood that schools reported prekindergarten children receiving transportation services varied by school size, locale, region, percent minority enrollment, and poverty concentration. The likelihood of providing meals was higher in the Southeast than in other regions and also varied by percent minority enrollment and poverty concentration. Schools that offered full-day prekindergarten classes only were more likely to provide extended day care services to prekindergarten children than schools that offered half-day classes only. In addition to indicating whether they provided these support services to prekindergarten children, the public schools reported the number of prekindergarten children who received each service. Study results show that 52 percent of prekindergarten children received transportation services, 64 percent received meals, and 5 percent participated in extended day care programs (table 16). Dissimilarities between prekindergarten classes become evident when examined by various public school characteristics. For example, differences appear between prekindergarten classes in city schools and rural/small town schools, and between schools in different regions. Traditional aspects of prekindergarten classes (e.g., targeting low-income and disabled children) may contribute to the apparent relationships between public school characteristics and the relationships reported below. Comparisons of public school prekindergarten classes in city schools with those in rural/small town schools show the following differences: • A higher percentage of city schools (45
percent) offered prekindergarten classes than did rural/small town schools (34 percent). City schools also were more likely to offer general education prekindergarten classes (37 percent) than were rural/small town schools (26 percent) (table 2).
• The composition of public elementary school prekindergarten enrollment was more racially and ethnically diverse in city schools than in rural/small town schools (table 6). In city schools, 28 percent of the prekindergarten children were White, 35 percent were Hispanic, and 33 percent were Black. In contrast, in rural/small town schools, 74 percent of the children were White, 10 percent were Hispanic, and 12 percent were Black.
• The percentage of prekindergarten children who were LEP was higher in city schools than in rural/small town public elementary schools (22 versus 6 percent, respectively) (table 7).
• The average prekindergarten class size was lower in rural/small town public elementary schools than in city public elementary schools (13 versus 15 children per class, respectively) (table 11).
• Prekindergarten teachers in city schools (91 percent) were more likely to have a bachelor’s or higher degree than were prekindergarten teachers in rural/small town schools (83 percent) (table 14). The city school prekindergarten teachers also were more likely to be paid using the elementary school teacher pay scale for their districts than were rural/small town prekindergarten teachers (87 percent compared with 79 percent) (table 14).
• Rural/small town schools were more likely than city schools to report that prekindergarten children received transportation services (91 percent versus 60 percent) (table 15).
Comparisons between public school prekindergarten classes in different regions showed differences as well. For example: • A higher percentage of schools in the
Southeast (46 percent) offered prekindergarten classes than did schools in the West (35 percent), and also were more likely to offer general education prekindergarten classes (37 percent versus 28 percent, respectively) (table 2). In addition, 23 percent
53
of schools in the Southeast offered special education prekindergarten classes, compared with 14 percent of schools in the West.
• The racial and ethnic composition of public elementary school prekindergarten enrollment in the Southeast was different than in the West (table 6). In the Southeast, 9 percent were Hispanic and 38 percent were Black. In the West, 47 percent of the children were Hispanic and 13 percent were Black.
• In public elementary schools in the West, 30 percent of the prekindergarten children were LEP, compared with 7 percent in the Southeast (table 7).
• Schools in the Southeast were more likely than schools in the West to report that prekindergarten children received transport-tation services and meals (table 15). Eighty-nine percent of schools in the Southeast reported that prekindergarten children received transportation services, whereas 71 percent of schools in the West reported that children received this service. Ninety-six percent of schools in the Southeast offered meals, compared with 76 percent of schools in the West.
Public school prekindergarten class characteristics also varied by school poverty concentration. For this survey, school poverty concentration was based on the number of students eligible to receive free or reduced-price lunch. Examples of differences between schools at two levels of poverty—schools with the highest poverty concentration (75 percent or more students eligible for free or reduced-price lunch) and schools with the lowest poverty concentration (less than 35 percent of students eligible)—include the following: • A higher percentage of schools with the
highest level of poverty (51 percent) offered prekindergarten classes than did schools with the lowest level of poverty (25 percent) (table 2). Schools with the highest poverty concentration also were more likely to offer general education prekindergarten classes (44
percent) than were schools at the lowest level (16 percent).
• The racial and ethnic composition of public elementary school prekindergarten enrollment in schools with the highest poverty concentration was different from that in schools with the lowest poverty concentration (table 6). In schools with the highest poverty concentration, 22 percent of the prekinder-garten children were White, 39 percent were Hispanic, and 36 percent were Black. In contrast, in schools with the lowest poverty concentration, 79 percent of the children were White, 8 percent were Hispanic, and 7 percent were Black.
• There was a positive relationship between school poverty concentration and the percentage of prekindergarten children who were LEP (table 7). The percentage of these children ranged from 5 percent in schools with the lowest poverty concentration to 25 percent in schools with the highest poverty concentration.
• The average prekindergarten class size was lower in public elementary schools with the lowest level of poverty than in public elementary schools with the highest level (12 versus 16 children per class, respectively) (table 11).
• Prekindergarten teachers in schools with the lowest level of poverty (91 percent) were more likely to have a bachelor’s or higher degree than were prekindergarten teachers in schools with the highest level (81 percent) (table 14).
• Schools with the highest level of poverty were less likely than schools with the lowest level of poverty to report that prekindergarten children received transportation services; however, the schools with the highest level of poverty were more likely to provide meals and extended day care services (table 15). Sixty-four percent of schools with the highest level of poverty reported that prekindergarten children received transportation services. Eighty-five percent of schools with the lowest level of poverty reported children receiving
54
this service. Ninety-two percent of schools with the highest level of poverty offered meals to their prekindergarten children, compared with 47 percent of schools with the lowest level.
This profile of public elementary school prekindergarten classes nationwide provides important new information on the nature of prekindergarten classes—the number of children enrolled in both general education and special education, the age and racial/ethnic background of
the children, the educational background and pay scales of the classroom teachers, and the funding sources for prekindergarten classes. The study was not intended to address their curricula, instructional approaches, or the effect they have on school readiness. Nor was the study designed to gather detailed financial information such as the relative percentages of budget or the support per child provided by specific funding sources. Such topics may be covered in future NCES research.
55
REFERENCES
Bairu, G. (2001). Public School Student, Staff, and Graduate Counts by State, School Year 1999–2000 (NCES 2001–326R). U.S. Department of Education. Washington, DC: National Center for Education Statistics.
Barnett, S. (1995). Long-Term Effects on Cognitive Development and School Success. The Future of Children, 5(3): 25-50.
Bowman, B., Donovan, M., and Burns, M. (Eds.). (2001). Eager to Learn: Educating Our Preschoolers. Washington, DC: National Academy Press.
Broughman, S., and Colaciello, L. (2001). Private School Universe Survey, 1999–2000 (NCES 2001–330). U.S. Department of Education. Washington, DC: National Center for Education Statistics.
Clifford, R.M., Early, D.M., and Hills, T.W. (1999). Almost a Million Children in School Before Kindergarten: Who is Responsible for Early Childhood Services? Young Children, 54(5): 48-51.
Dwyer, M., Chait, R., and McKee, P. (2000). Building Strong Foundations for Early Learning: The U.S. Department of Education’s Guide to High-Quality Early Childhood Education Programs. U.S. Department of Education. Washington, DC: Office of Educational Research and Improvement.
Fox, M.K., Crepinsek, M.K., Connor, P., and Battaglia, M. (2001). School Nutrition Dietary Assessment Study-II Final Report. U.S. Department of Agriculture. Washington, DC: Food and Nutrition Service, Office of Analysis, Nutrition and Evaluation.
Gomby, D., Lewit, J., Behrman, R., Larner, M., and Stevenson, C. (1995). Long-Term Outcomes of Early Childhood Programs: Analysis and Recommendations. The Future of Children, 5(3): 6–24.
Gruber, K.J., Wiley, S.D., Broughman, S.P., Strizek, G.A., and Burian-Fitzgerald, M. (2002). Schools and Staffing Survey, 1999–2000: Overview of the Data for Public, Private, Public Charter, and Bureau of Indian Affairs Elementary and Secondary Schools (NCES 2002-313). U.S. Department of Education. Washington, DC: National Center for Education Statistics.
Haskins, R. (1989). Beyond Metaphor: The Efficacy of Early Childhood Education. American Psychologist, 44(2): 274-282.
Hinkle, D. (2000). School Involvement in Early Childhood. U.S. Department of Education, National Institute for Early Childhood Development and Education. Washington, DC: U.S. Government Printing Office.
Hofferth, S.L., Shauman, K.A., Henke, R.R., and West, J. (1998). Characteristics of Children’s Early Care and Education Programs: Data from the 1995 National Household Education Survey (NCES 98–128). U.S. Department of Education. Washington, DC: National Center for Education Statistics.
Kisker, E.E., Hofferth, S., Phillips, D., and Farquhar, E. (1991). A Profile of Child Care Settings: Early Education and Care in 1990. Vol. 1. Princeton, NJ: Mathematica Policy Research, Inc.
56
Love, M., Schochet, P., Meckstroth, A. (1996). Are They in Any Real Danger: What Research Does—and Doesn’t—Tell Us About Child Care Quality and Children’s Well Being. Princeton, NJ: Mathematica Policy Research, Inc.
Parsad, B., Lewis, L., and Farris, F. (2001). Teacher Preparation and Professional Development: 2000 (NCES 2001–088). U.S. Department of Education. Washington, DC: National Center for Education Statistics.
Saluja, G., Early, D., and Clifford, R. (2001). Public School Prekindergarten: Does It Make a Difference? Principal, 80(5): 18–21.
Schulman, K., Blank, H., and Ewen, D. (1999). Seed of Success: State Prekindergarten Initiatives. 1998–1999. Washington, DC: Children’s Defense Fund.
Schumacher, R., Greenberg, M., and Lombardi, J. (2001). State Initiatives to Promote Early Learning: Next Steps in Coordinating Subsidized Child Care, Head Start, and State Prekindergarten. Washington, DC: Center for Law and Social Policy.
Snyder, T.D. (2001). Digest of Education Statistics 2000 (NCES 2001–034). U.S. Department of Education. Washington, DC: National Center for Education Statistics.
U.S. Bureau of the Census. (2001). Statistical Abstract of the United States, 2000: The National Data Book. U.S. Department of Commerce. Washington, DC: Bureau of the Census. This document is available online (http://www.census.gov/statab/www/).
U.S. Department of Agriculture, Food and Nutrition Service. (2001). About the National School Lunch Program. Alexandria, VA: U.S. Department of Agriculture. This document is available online (http://www.fns.usda.gov/cnd/Lunch/AboutLunch/faqs.htm).
U.S. Department of Education, Office of the Under Secretary. (2002). State ESEA Title I Participation Information for 1999–00:Final Summary Report (Doc. Number 2002-11). Washington, DC: U.S. Department of Education.
U.S. General Accounting Office. (1999). Education and Care: Early Childhood Programs and Services for Low-Income Families. Washington, DC: U.S. General Accounting Office
West, J. E-mail correspondence regarding unpublished results from the Early Childhood Longitudinal Study, Kindergarten Class of 1998–99, 12 March, 2002. Data are available from ECLS-K Base Year Public -Use Data File, Kindergarten Class of 1998–99: Data Files and Electronic Code Book, Release Date: December 1, 2000.
West, J., Denton, K., and Reaney, L. (2000). The Kindergarten Year (NCES 2001–023). U.S. Department of Education, National Center for Education Statistics. Washington, DC: U.S. Government Printing Office.
Young, B. (2002) National Center for Education Statistics, Common Core of Data, Common Core of Data 2000–2001, State Nonfiscal Survey of Public Elementary and Secondary Education (NCES 2002-363). U.S. Department of Education. Washington, DC: National Center for Education Statistics.
A-1
Appendix A
Survey Methodology

A-2
A-3
Table of Contents
Section Page Fast Response Survey System.................................................................................. A-5 Sample Selection .................................................................................................... A-5 Respondent and Response Rates .............................................................................. A-7 Sampling and Nonsampling Errors........................................................................... A-8 Definitions of Analysis Variables ............................................................................ A-10 Definitions of Questionnaire Terminology................................................................ A-11 Survey Sponsorship and Acknowledgments.............................................................. A-12
List of Appendix Tables Table A-1 Distribution of regular and special education schools by status of prekindergarten
enrollment in the 1998–99 NCES Common Core of Data (CCD) Public Elementary and Secondary School Universe file ......................................................................... A-6
A-2 Number and percentage distribution of regular elementary and special education
public schools in the respondent sample, estimated number and percentage distribution of regular elementary and special education public schools in the nation, number and percentage distribution of regular elementary and special education public schools with prekindergarten classes in the respondent sample, and estimated number and percentage distribution of regular elementary and special education public schools with prekindergarten classes in the nation: 2000–2001 ........ A-9

A-4
A-5
Fast Response Survey System The Fast Response Survey System (FRSS) was established in 1975 by the National Center for Education Statistics (NCES), U.S. Department of Education. FRSS is designed to collect issue-oriented data within a relatively short timeframe. To ensure minimal burden on respondents, the surveys are generally limited to three pages of questions, with a response burden of about 30 minutes per respondent. Sample sizes are relatively small (usually about 1,000 to 1,500 respondents per survey) so that data collection can be completed quickly. Data are weighted to produce national estimates of the sampled education sector. The sample size permits limited breakouts by classification variables. However, as the number of categories within the classification variables increases, the sample size within categories decreases, which results in larger sampling errors for the breakouts by classification variables. FRSS collects data from state education agencies, local education agencies, public and private elementary and secondary schools, public school teachers, and public libraries. Sample Selection The sample for the FRSS Survey of Classes That Serve Children Prior to Kindergarten in Public Schools consisted of 2,044 regular and special education public schools in the 50 states and the District of Columbia. The sample contained 1,801 regular elementary schools, 150 regular combined schools, and 93 special education schools. It was selected from the 1998–99 NCES Common Core of Data (CCD) School Universe file (see table A-1). Regular middle and high schools were not eligible for the survey. Also excluded from the sampling frame were vocational and alternative/other schools, schools in the territories,
and Department of Defense and Bureau of Indian Affairs schools. A school was defined as an elementary school if the lowest grade was less than or equal to grade 3 and the highest grade was less than or equal to grade 8. A middle school was defined as having a low grade of 4 or more and a high grade of 9 or less. A high school was defined as having a low grade of 9 or more and a high grade of 10 or more. Combined schools contain both elementary and secondary grades (e.g., K to 12 or 1 to 9). The sample design was guided by the study’s focus on classes that serve children prior to kindergarten entry in public schools. The 1998–99 CCD frame indicates that of the nation’s 85,000 regular and special education schools, approximately one-third of the elementary and special education schools reported having either prekindergarten children or a prekindergarten grade (table A-1). By definition, middle and high schools do not offer elementary grades and are therefore not expected to offer prekindergarten classes. The 1998–99 CCD indicates that very few middle and secondary schools reported prekindergarten children or grade. Although this does not necessarily imply that the “true” incidence of prekindergarten classes in these schools is 0, it does seem likely that the incidence of such classes is very low. Moreover, information from a variety of sources (e.g., pretests, feasibility calls, pilot study) suggests it is highly likely that prekindergarten classes in middle and high schools were established to serve the needs of older students (e.g., as laboratories for students’ on-the-job-training or as day care for the children of high school students). Thus, only the approximately 51,000 elementary schools, 5,000 combined schools, and 2,000 special education schools were included in the frame for the survey.
A-6
Table A-1. Distribution of regular and special education schools by status of prekindergarten enrollment in the 1998–99 NCES Common Core of Data (CCD) Public Elementary and Secondary School Universe file
Status of prekindergarten enrollment in school as
reported in 1998–99 CCD
Type of school 1 or more
prekindergarten students
No prekindergarten children but reports
a prekindergarten grade
No prekindergarten children or grade Total1
Total, all schools................................................... 16,441 1,712 66,898 85,051
Regular2
Elementary ........................................................... 15,395 1,368 34,102 50,865 Middle ................................................................. 24 0 15,384 15,408 Secondary............................................................. 70 0 11,661 11,731 Combined............................................................. 431 238 4,409 5,078
Special education....................................................... 521 106 1,342 1,969 Total, eligible for survey3............................................ 16,347 1,712 39,853 57,912
1 Counts exclude regular schools with a high grade of UG (ungraded) or 00. 2 Elementary schools are defined to be those schools with low grade of 3 or less and a high grade of 8 or less. Middle schools are defined to be those with a low grade of 4 or more and a high grade of 9 or less. Secondary schools are those with a low grade of 9 or more and a high grade of 10 or more. All other schools are referred to as “combined” schools as they contain both elementary and secondary grades (e.g., K to 12, or 1 to 9). 3Counts exclude regular middle and secondary schools.
The sample design was also informed by results from a pilot study of over 300 schools that was conducted in November 2000 to obtain relevant information about the presence and nature of prekindergarten classes in public schools. The pilot study was necessary because the information in the CCD file underreported prekindergarten enrollment; for example, some states, such as California, Alabama, and Kentucky, did not report any prekindergarten classes or students to CCD. Feasibility calls and pretests suggested several reasons for the underreporting of prekindergarten children to CCD. For example, some schools did not refer to their classes for children preceding kindergarten as prekindergarten classes, and other schools did not report prekindergarten children if the prekindergarten class funds were kept separately from school funds. For these and other reasons, it was believed that a portion of the schools that reported no prekindergarten children or grade in CCD actually had some type of program for children prior to kindergarten entry.
The classes include general prekindergarten/ preschool, special education, Title I, Head Start administered by the school district, and any other classes that serve children prior to kindergarten entry, regardless of whether the schools referred to those classes as prekindergarten or preschool or some other name. Thus, the pilot was designed to (1) identify definitional issues and develop a working definition of prekindergarten, and (2) inform the study’s sample design by answering What percentage of public schools listed in CCD as not having prekindergarten classes actually have classes that serve children prior to kindergarten entry? The pilot study indicated that information available in the CCD file about the presence of students/classes prior to kindergarten was imperfect and could not be used to exclude schools without such programs from the main study sample. As a result, to avoid bias associated with undercoverage, it was necessary to include in the
A-7
sample schools that reported no prekindergarten students/classes in CCD. The 1998–99 CCD School Universe file contained information on approximately 58,000 potentially eligible public elementary schools. According to that file, 31 percent (about 18,000) of the schools had prekindergarten children/grades; 69 percent (about 40,000) of the schools did not have such children/grades. Based on pilot study findings, however: • An estimated 20 percent of schools that CCD
indicated as having prekindergarten classes (about 3,600 of the 18,000) did not offer such classes.
• An estimated 19 percent that CCD indicated as not having prekindergarten classes (about 5,700 of the 40,000) did offer such classes.
Overall, the pilot study results estimated that 38 percent of the 58,000 potentially eligible public schools had classes for children prior to kindergarten entry, regardless of whether the schools referred to those classes as prekindergarten or preschool or some other name.42 For the main study, a stratified sample of 2,044 schools was selected from the 1998–99 CCD School Universe file. Information from the pilot study was used to guide the allocation of the total sample to various subsets of schools—schools with one or more prekindergarten children, schools with a prekindergarten grade but no prekindergarten children, and schools with no prekindergarten children or grade. Within each subset, schools were further stratified by poverty concentration (based on the percentage of students who are eligible for free or reduced-price lunch) and enrollment size. Stratification by poverty concentration was designed to ensure that sufficient numbers of high-poverty schools were selected for analysis purposes. Within each poverty group, the sample was allocated to size strata in rough proportion to the aggregate square root of the enrollment in the stratum. Such an
42A statement was added to the questionnaire describing the survey
focus as being on “classes that serve children prior to kindergarten, regardless of whether your school refers to those classes as prekindergarten, preschool, or some other name.”
allocation was expected to yield relatively precise estimates of percentages (e.g., the percentage of schools with prekindergarten classes that have a specified characteristic), as well as aggregative measures related to prekindergarten enrollment (e.g., the number of classes or students enrolled in prekindergarten classes). Finally, schools in the sampling frame were sorted by type of locale (city, urban fringe, town, rural) and region (Northeast, Southeast, Central, West) to induce additional implicit stratification. Within each sampling stratum, schools were selected systematically and with equal probabilities. Respondent and Response Rates Questionnaires and cover letters for the study were mailed to the principal of each sampled school in early March 2001. The letter introduced the study and requested that the questionnaire be completed by the person at the school who was most knowledgeable about prekindergarten classes. Telephone follow up was conducted from late March 2001 through May 2001 with principals who did not respond to the initial questionnaire mailing. Of the 2,044 schools in the sample, 50 were found to be out of the scope of the survey, usually because they were administrative centers or closed schools. This left a total of 1,994 eligible schools in the sample. Completed questionnaires were received from 1,843 schools, or 92 percent of the eligible schools (table A-2). The weighted response rate was 94 percent. Roughly 80 percent (1,593) of the eligible cases required telephone follow up to obtain their participation. Among the respondents, 41 percent completed the questionnaire by mail, 43 percent completed it by telephone, and 15 percent provided their answers by fax. With the exception of the question on the number of prekindergarten children eligible for free and reduced-price lunch (which had an item nonresponse rate of 5.6 percent), weighted item nonresponse rates ranged from 0 percent to 1.2 percent.
A-8
The responses were weighted to produce national estimates (see table A-2). The weights were designed to adjust for the variable probabilities of selection and differential nonresponse. The probabilities of selection varied by type of school (e.g., regular vs. special education), enrollment size, and whether or not the school enrolled prekindergarten students as recorded in the CCD frame. Nonresponse adjustments were made to reflect differential response rates by poverty status, in addition to type and size of school, and presence of prekindergarten students. Sampling and Nonsampling Errors The findings in this report are estimates based on the sample selected and, consequently, are subject to sampling variability. The standard error is a measure of the variability of estimates due to sampling. It indicates the variability of a sample estimate that would be obtained from all possible samples of a given design and size. Standard errors are used as a measure of the precision expected from a particular sample. If all possible samples were surveyed under similar conditions, intervals of 1.96 standard errors below to 1.96 standard errors above a particular statistic would include the true population parameter being estimated in about 95 percent of the samples. This is a 95 percent confidence interval. For example, the estimated percentage of public elementary schools with prekindergarten classes is 35.3 percent, and the estimated standard error is 0.96 percent. The 95 percent confidence interval for the statistic extends from [35.3 – (0.96 times 1.96)] to [35.3 + (0.96 times 1.96)], or from 33.4 to 37.2 percent. The coefficient of variation (“c.v.,” also referred to as the “relative standard error”) of an estimate (y) is defined as c.v. = (s.e. / y) x 100, where s.e. is the standard error of the estimate y. Throughout this report, any estimate with a c.v. higher than 50 percent is flagged with the note that the estimate should be interpreted with caution because the value of the estimate is very unstable. Estimates of standard errors were computed using a technique known as jackknife replication. As with any replication method, jackknife replication
involves constructing a number of subsamples (replicates) from the full sample and computing the statistic of interest for each replicate. The mean square error of the replicate estimates around the full sample estimate provides an estimate of the variances of the statistics. To construct the replications, 50 stratified subsamples of the full sample were created and then dropped one at a time to define 50 jackknife replicates. A computer program (WesVar) was used to calculate the estimates of standard errors. The test statistics used in the analysis were calculated using the jackknife variances and thus appropriately reflected the complex nature of the sample design. Bonferroni adjustments were made to control for multiple comparisons where appropriate. For example, for an “experiment-wise” comparison involving g pairwise comparisons, each difference was tested at the 0.05/g significance level to control for the fact that g differences were simultaneously tested. The Bonferroni adjustment results in a more conservative critical value being used when judging statistical significance. This means that comparisons that would have been significant with an unadjusted critical value of 1.96 may not be significant with the more conservative critical value. For example, the critical value for comparisons between any two of the four categories of poverty concentration is 2.64 rather than 1.96. When comparing percentage estimates across a family of three or more ordered categories (e.g., categories defined by percent minority enrollment), however, a trend analysis was used rather than a series of paired comparisons. The trend test involved estimating a simple linear regression model with the ordered categories as the independent variable and the (dichotomous) outcome of interest (e.g., whether or not the school offered prekindergarten classes) as the dependent variable. The slope of the line (regression coefficient) describing the relationship between the independent and dependent variables was estimated using generalized weighted least squares. The corresponding standard error was estimated using jackknife replication methods. The t statistic used to assess the significance of the
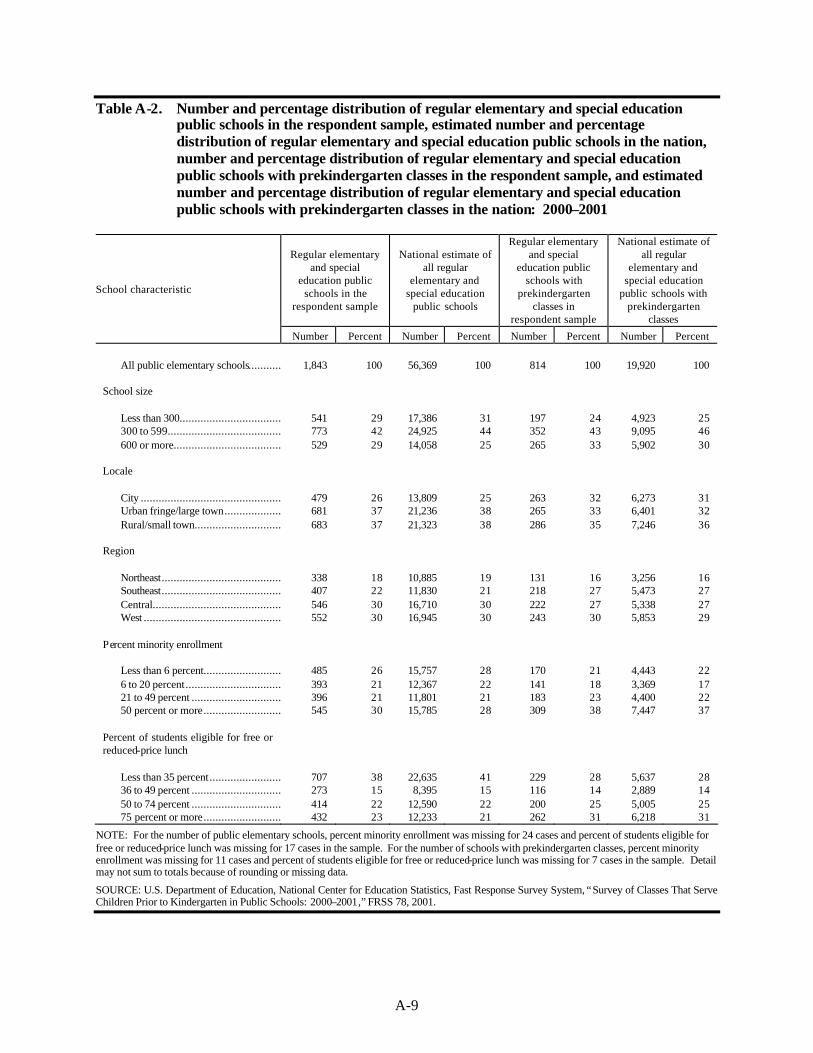
A-9
Table A-2. Number and percentage distribution of regular elementary and special education public schools in the respondent sample, estimated number and percentage distribution of regular elementary and special education public schools in the nation, number and percentage distribution of regular elementary and special education public schools with prekindergarten classes in the respondent sample, and estimated number and percentage distribution of regular elementary and special education public schools with prekindergarten classes in the nation: 2000–2001
Regular elementary and special
education public schools in the
respondent sample
National estimate of all regular
elementary and special education
public schools
Regular elementary and special
education public schools with
prekindergarten classes in
respondent sample
National estimate of all regular
elementary and special education
public schools with prekindergarten
classes
School characteristic
Number Percent Number Percent Number Percent Number Percent
All public elementary schools................................1,843 100 56,369 100 814 100 19,920 100
School size
Less than 300................................................................541 29 17,386 31 197 24 4,923 25 300 to 599................................................................773 42 24,925 44 352 43 9,095 46 600 or more................................................................529 29 14,058 25 265 33 5,902 30
Locale
City ................................................................479 26 13,809 25 263 32 6,273 31 Urban fringe/large town................................681 37 21,236 38 265 33 6,401 32 Rural/small town................................ 683 37 21,323 38 286 35 7,246 36
Region
Northeast................................................................338 18 10,885 19 131 16 3,256 16 Southeast................................................................407 22 11,830 21 218 27 5,473 27 Central................................................................546 30 16,710 30 222 27 5,338 27 West ................................................................552 30 16,945 30 243 30 5,853 29
Percent minority enrollment
Less than 6 percent................................ 485 26 15,757 28 170 21 4,443 22 6 to 20 percent................................ 393 21 12,367 22 141 18 3,369 17 21 to 49 percent ................................ 396 21 11,801 21 183 23 4,400 22 50 percent or more................................ 545 30 15,785 28 309 38 7,447 37
Percent of students eligible for free or reduced-price lunch
Less than 35 percent................................ 707 38 22,635 41 229 28 5,637 28 36 to 49 percent ................................ 273 15 8,395 15 116 14 2,889 14 50 to 74 percent ................................ 414 22 12,590 22 200 25 5,005 25 75 percent or more................................ 432 23 12,233 21 262 31 6,218 31
NOTE: For the number of public elementary schools, percent minority enrollment was missing for 24 cases and percent of students eligible for free or reduced-price lunch was missing for 17 cases in the sample. For the number of schools with prekindergarten classes, percent minority enrollment was missing for 11 cases and percent of students eligible for free or reduced-price lunch was missing for 7 cases in the sample. Detail may not sum to totals because of rounding or missing data.
SOURCE: U.S. Department of Education, National Center for Education Statistics, Fast Response Survey System, “Survey of Classes That Serve Children Prior to Kindergarten in Public Schools: 2000–2001,” FRSS 78, 2001.
A-10
linear model was calculated as the ratio of the estimated regression coefficient to its standard error. If t was greater than 1.96 (the critical value of t with “infinite” degrees of freedom at a significance level of 0.05), there was evidence of a linear relationship between the two variables. Regression models were also used to test the significance of combinations of independent variables (e.g., school size and prekindergarten class schedule) on a reported characteristic of interest. In particular, logistic regression methods allow the estimation of the probability of an event (e.g., the provision of meals) as a function of a number of independent variables and their interactions. To account for the complex sample design used in the study, jackknife replication was used to estimate the standard errors of the regression coefficients and to develop the corresponding statistical tests. An independent variable in the model was deemed to be statistically significant if the p-value associated with the test was less than 0.05. The survey estimates are also subject to nonsampling errors that can arise because of nonobservation (nonresponse or noncoverage) errors, errors of reporting, and errors made in data collection. These errors can sometimes bias the data. Nonsampling errors may include such problems as misrecording of responses; incorrect editing, coding, and data entry; differences related to the particular time the survey was conducted; or errors in data preparation. Although general sampling theory can be used in part to determine how to estimate the sampling variability of a statistic, nonsampling errors are not easy to measure and, for measurement purposes, usually require that an experiment be conducted as part of the data collection procedures or that data external to the study be used. To minimize the potential for nonsampling errors, the questionnaire was pretested with respondents like those who completed the survey. During the design of the survey, the survey pretest, and the pilot study, an effort was made to check for consistency of interpretation of questions and to eliminate ambiguous items. The questionnaire and instructions were extensively reviewed by the National Center for Education Statistics and the
Early Childhood Institute, U.S. Department of Education. 43 Manual and machine editing of the questionnaire responses were conducted to check the data for accuracy and consistency. Cases with missing or inconsistent items were recontacted by telephone. Data were keyed with 100 percent verification. Definitions of Analysis Variables School size – total number of students enrolled in the school based on data from the 1998–99 CCD School Universe file.
Less than 300 students 300 to 599 students 600 or more students
Enrollment data were missing for eight schools. However, the information needed was obtained through telephone contact with the schools, or through accessing the school data contained in the 1997–98 CCD file. Once this information was obtained, the eight schools were assigned to the appropriate enrollment size category. Locale – as defined in the 1998–99 CCD School Universe file.
City – a large or midsize central city of a Consolidated Metropolitan Statistical Area (CMSA) or Metropolitan Statistical Area (MSA). Urban fringe/large town – urban fringe is a place within a CMSA or MSA of a large or midsize central city, but not primarily its central city; large town is an incorporated place not within a CSMA or MSA, with a population greater than or equal to 25,000. Small town/rural – small town is an incorporated place not within a CMSA or MSA, with a population less than 25,000 and greater than or equal to 2,500; rural is a
43The survey questionnaire was also reviewed and approved by the
Office of Management and Budget (OMB). The OMB clearance number was 1850-0733.
A-11
place either outside or within a CMSA or MSA of a large or midsize city, and defined as rural by the U.S. Bureau of the Census.
Geographic region – one of four regions used by the Bureau of Economic Analysis of the U.S. Department of Commerce, the National Assessment of Educational Progress, and the National Education Association. Obtained form the 1998–99 CCD School Universe file.
Northeast – Connecticut, Delaware, District of Columbia, Maine, Maryland, Massachusetts, New Hampshire, New Jersey, New York, Pennsylvania, Rhode Island, and Vermont. Southeast – Alabama, Arkansas, Florida, Georgia, Kentucky, Louisiana, Mississippi, North Carolina, South Carolina, Tennessee, Virginia, and West Virginia. Central – Illinois, Indiana, Iowa, Kansas, Michigan, Minnesota, Missouri, Nebraska, North Dakota, Ohio, South Dakota, and Wisconsin. West – Alaska, Arizona, California , Colorado, Hawaii, Idaho, Montana, Nevada, New Mexico, Oklahoma, Oregon, Texas, Utah, Washington, and Wyoming.
Percent minority enrollment – The percent of students enrolled in the school whose race or ethnicity is classified as one of the following: American Indian or Alaska Native, Asian, Black, or Hispanic, based on data in the 1998–99 CCD School Universe file. The data were missing for 24 schools in the respondent sample.
Less than 6 percent 6 to 20 percent 21 to 50 percent 50 percent or more
Percent of students eligible for free or reduced-price lunch – This was based on information collected from the schools during the survey. The data were missing from 201 questionnaires. Data
for 184 of these schools were obtained from the 1998–99 CCD School Universe file, leaving 17 schools for which the data were missing. This item served as the measurement of the concentration of poverty at the school.
Less than 35 percent 35 to 49 percent 50 to 74 percent 75 percent or more
Definitions of Questionnaire Terminology Children who are limited English proficient (LEP) – Children whose native or dominant language is other than English, and whose skills in listening to, speaking, reading, or writing English are such that they derive little benefit from school instruction in English. General education classes for children prior to kindergarten – Includes combined/inclusive classes, Title I classes, Head Start classes that were part of a district-administered program, and any other classes primarily for 3- or 4-year-olds prior to kindergarten. Public elementary school – Refers to public special education and regular elementary and combined schools. A school was defined as an elementary school if the lowest grade was less than or equal to grade 3 and the highest grade was less than or equal to grade 8. Combined schools contain both elementary and secondary grades (e.g., K to 12 or 1 to 9). See the “Sample Selection” section of this appendix for a detailed description of school types. Special education classes for children prior to kindergarten – Includes classes that serve only children with Individualized Education Programs (IEPs).
A-12
Survey Sponsorship and Acknowledgments The survey was performed under contract with Westat. Bernie Greene was the NCES Project Officer. The data were requested by the National Institute on Early Childhood Development and Education, Office of Education Research and Improvement, U.S. Department of Education. This report was reviewed by the following individuals:
Outside NCES
• Margaret Burchinal, University of North Carolina, Chapel Hill
• W. Steven Barnett, Rutgers University
• Stephanie Cronen, American Institutes for Research, Education Statistics Services Institute
• Lawrence Lanahan, American Institutes for Research, Education Statistics Services Institute
• Robert Pianta, University of Virginia
Inside NCES
• Stephen Broughman, Elementary/Secondary and Libraries Studies Division
• Shelley Burns, Early Childhood, International, and Crosscutting Studies Division
• Elvira Germino-Hausken, Early Childhood, International, and Crosscutting Studies Division
• Arnold Goldstein, Assessment Division
• William Hussar, Early Childhood, International, and Crosscutting Studies Division
• Val Plisko, Associate Commissioner, Early Childhood, International, and Crosscutting Studies Division
• John Ralph, Early Childhood, International, and Crosscutting Studies Division
• Marilyn Seastrom, Chief Statistician, Statistical Standards Program, Office of the Deputy Commissioner
• Bruce Taylor, Statistical Standards Program, Office of the Deputy Commissioner
For more information about the survey, contact Bernie Greene, Early Childhood, International, and Crosscutting Studies Division, National Center for Education Statistics, Institute for Education Sciences U.S. Department of Education, 1990 K Street, NW, Washington, DC 20006, e-mail: [email protected], telephone (202) 502-7348.

B-1
Appendix B
Standard Error Tables

B-2
B-3
Table of Contents
Tables of Standard Errors
Table Page B-1 Standard errors for table 1: Number and percentage distribution of public elementary
schools and elementary schools with prekindergarten classes, by selected school characteristics: 2000–2001 ........................................................................................... B-5
B-2 Standard errors for table 2: Number of public elementary schools, number and percent
of elementary schools with prekindergarten classes, and percent of elementary schools with general education and special education prekindergarten classes: 2000–2001 ........... B-6
B-3 Standard errors for table 3: Percent of public elementary schools offering full-day
only, half-day only , both types, or no prekindergarten classes, by selected school characteristics: 2000–2001 ........................................................................................... B-7
B-4 Standard errors for table 4: Number and percentage distribution of public elementary
school prekindergarten children, by selected school characteristics: 2000–2001 ................ B-8 B-5 Standard errors for table 5: Number of public elementary school prekindergarten
children and of those, percent in general education and special education classes, by selected school characteristics: 2000–2001 ............................................................... B-9
B-6 Standard errors for table 6: Number and percent of public elementary school
prekindergarten children of various racial/ethnic backgrounds, by selected school characteristics: 2000–2001 ........................................................................................... B-10
B-7 Standard errors for table 7: Percent of all public elementary school prekindergarten
children who were limited English proficient, percent who were low income, and percent with Individualized Education Programs, by selected school characteristics: 2000–2001 ................................................................................................................... B-11
B-8 Standard errors for table 8: Number and percentage distribution of public elementary
school prekindergarten classes, by selected school characteristics: 2000–2001.................. B-12 B-9 Standard errors for table 9: Number of public elementary school prekindergarten
classes, and of those, percent that are general education and special education classes, by selected school characteristics: 2000–2001 .................................................................... B-13
B-10 Standard errors for table 10: Average number of public elementary school
prekindergarten classes per school, overall and by type of class, by selected school characteristics: 2000–2001 ........................................................................................... B-14
B-11 Standard errors for table 11: Average number of public elementary school
prekindergarten children per class, overall and by type of class, by selected school characteristics: 2000–2001 ........................................................................................... B-15
B-12 Standard errors for table 12: Percent of public elementary school prekindergarten
classes, by type of class schedule, by days per week, by selected school characteristics: 2000–2001 ................................................................................................................... B-16
B-4
Table of Contents (continued)
Tables of Standard Errors (continued)
Table Page B-13 Standard errors for table 13: Number and percentage distribution of public elementary
school prekindergarten classroom teachers, by selected school characteristics: 2000–2001 ............................................................................................................................ B-17
B-14 Standard errors for table 14: Percent of public elementary school prekindergarten
teachers with a bachelor’s or higher degree and percent paid using lower, the same, or higher salary scales than those of other public elementary school teachers, by selected school characteristics: 2000–2001.................................................................................. B-18
B-15 Standard errors for table 15: Percent of public elementary schools with prekindergarten
classes indicating that at least one prekindergarten child received various services, by type of class schedule, by selected school characteristics: 2000–2001.............................. B-19
B-16 Standard errors for table 16: Percent of public elementary school prekindergarten
children who received various services, by selected school characteristics: 2000–2001..... B-20 B-17 Standard errors for table 17: Percent of public elementary schools with prekindergarten
classes indicating receipt of money for prekindergarten services from various sources, by selected school characteristics: 2000–2001 ................................................................ B-21
B-18 Standard errors for the figures and for data not shown in tables: 2000–2001 .................... B-22
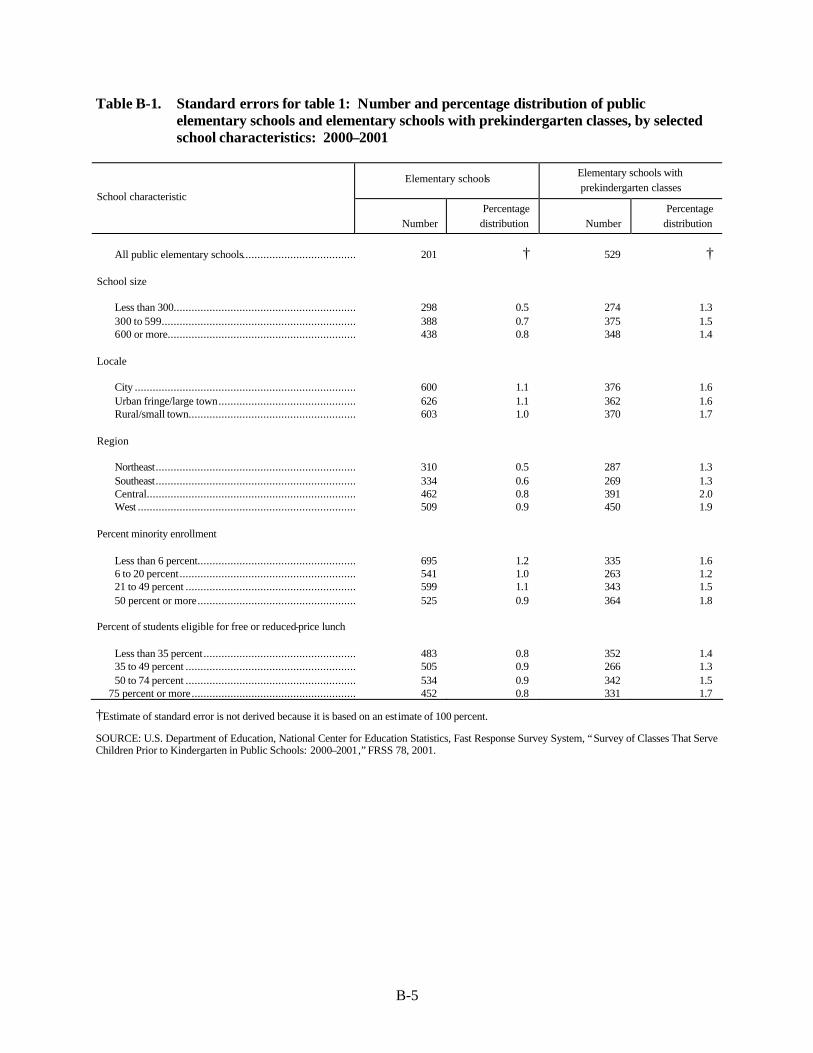
B-5
Table B-1. Standard errors for table 1: Number and percentage distribution of public elementary schools and elementary schools with prekindergarten classes, by selected school characteristics: 2000–2001
Elementary schools Elementary schools with prekindergarten classes
School characteristic
Number Percentage
distribution Number Percentage
distribution
All public elementary schools.......................................................... 201 † 529 †
School size
Less than 300................................................................ 298 0.5 274 1.3 300 to 599..................................................................................... 388 0.7 375 1.5 600 or more................................................................ 438 0.8 348 1.4
Locale
City .............................................................................................. 600 1.1 376 1.6 Urban fringe/large town................................................................ 626 1.1 362 1.6 Rural/small town................................................................ 603 1.0 370 1.7
Region
Northeast....................................................................................... 310 0.5 287 1.3 Southeast....................................................................................... 334 0.6 269 1.3 Central.......................................................................................... 462 0.8 391 2.0 West ............................................................................................. 509 0.9 450 1.9
Percent minority enrollment
Less than 6 percent................................................................ 695 1.2 335 1.6 6 to 20 percent................................................................ 541 1.0 263 1.2 21 to 49 percent ................................................................ 599 1.1 343 1.5 50 percent or more................................................................ 525 0.9 364 1.8
Percent of students eligible for free or reduced-price lunch
Less than 35 percent................................................................ 483 0.8 352 1.4 35 to 49 percent ................................................................ 505 0.9 266 1.3 50 to 74 percent ................................................................ 534 0.9 342 1.5
75 percent or more................................................................ 452 0.8 331 1.7
†Estimate of standard error is not derived because it is based on an estimate of 100 percent.
SOURCE: U.S. Department of Education, National Center for Education Statistics, Fast Response Survey System, “Survey of Classes That Serve Children Prior to Kindergarten in Public Schools: 2000–2001,” FRSS 78, 2001.
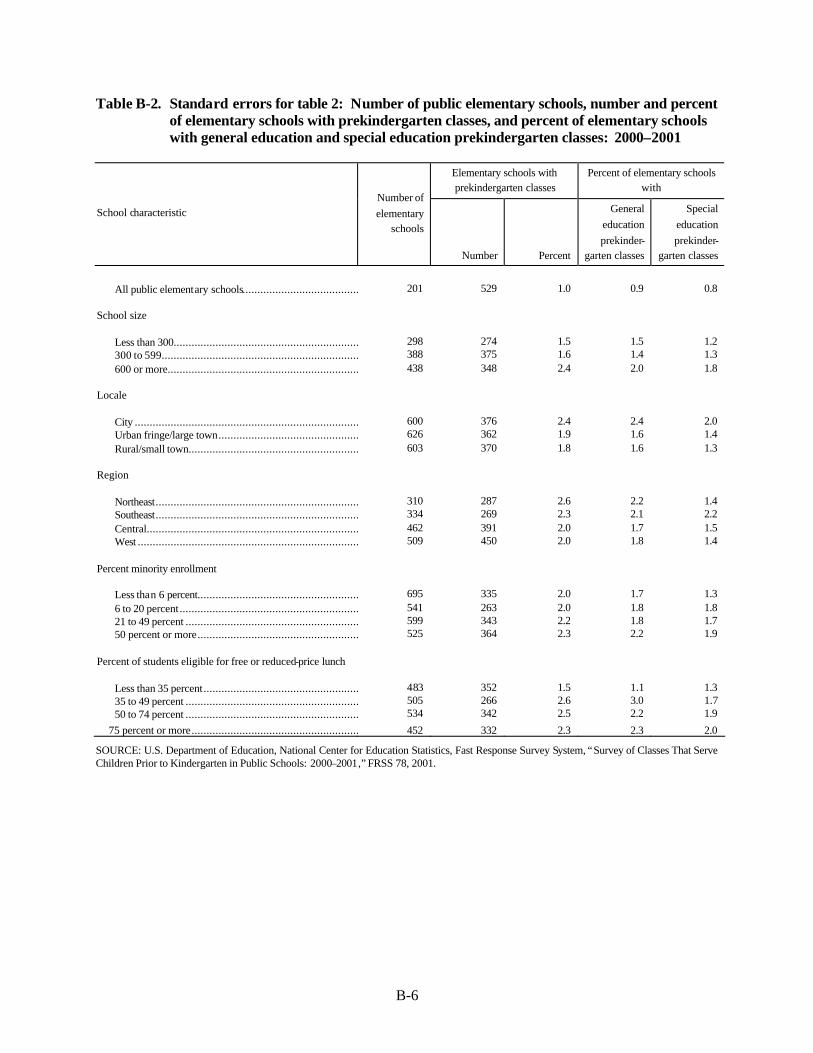
B-6
Table B-2. Standard errors for table 2: Number of public elementary schools, number and percent of elementary schools with prekindergarten classes, and percent of elementary schools with general education and special education prekindergarten classes: 2000–2001
Elementary schools with prekindergarten classes
Percent of elementary schools with
School characteristic Number of elementary
schools
Number Percent
General education prekinder-
garten classes
Special education prekinder-
garten classes
All public elementary schools..........................................................201 529 1.0 0.9 0.8
School size
Less than 300................................................................ 298 274 1.5 1.5 1.2 300 to 599.....................................................................................388 375 1.6 1.4 1.3 600 or more................................................................ 438 348 2.4 2.0 1.8
Locale
City ..............................................................................................600 376 2.4 2.4 2.0 Urban fringe/large town................................................................626 362 1.9 1.6 1.4 Rural/small town................................................................ 603 370 1.8 1.6 1.3
Region
Northeast.......................................................................................310 287 2.6 2.2 1.4 Southeast.......................................................................................334 269 2.3 2.1 2.2 Central..........................................................................................462 391 2.0 1.7 1.5 West .............................................................................................509 450 2.0 1.8 1.4
Percent minority enrollment
Less than 6 percent................................................................ 695 335 2.0 1.7 1.3 6 to 20 percent................................................................ 541 263 2.0 1.8 1.8 21 to 49 percent ................................................................ 599 343 2.2 1.8 1.7 50 percent or more................................................................ 525 364 2.3 2.2 1.9
Percent of students eligible for free or reduced-price lunch
Less than 35 percent................................................................ 483 352 1.5 1.1 1.3 35 to 49 percent ................................................................ 505 266 2.6 3.0 1.7 50 to 74 percent ................................................................ 534 342 2.5 2.2 1.9
75 percent or more................................................................ 452 332 2.3 2.3 2.0
SOURCE: U.S. Department of Education, National Center for Education Statistics, Fast Response Survey System, “Survey of Classes That Serve Children Prior to Kindergarten in Public Schools: 2000–2001,” FRSS 78, 2001.
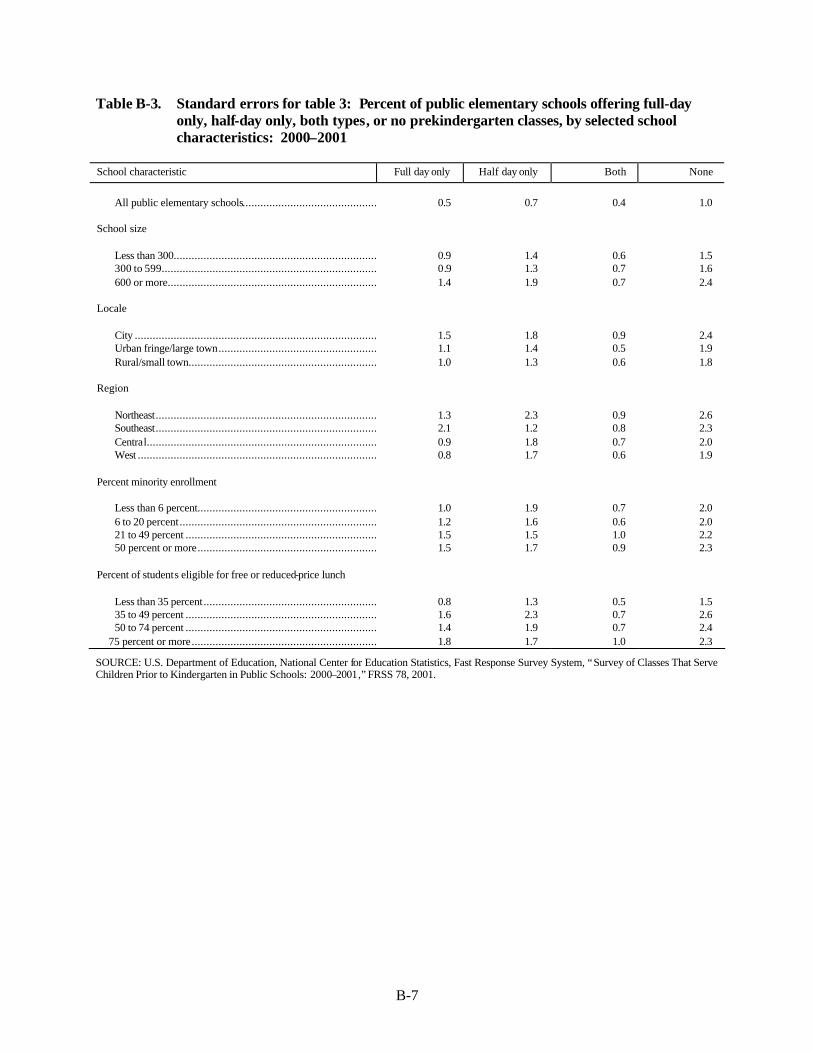
B-7
Table B-3. Standard errors for table 3: Percent of public elementary schools offering full-day only, half-day only, both types, or no prekindergarten classes, by selected school characteristics: 2000–2001
School characteristic Full day only Half day only Both None
All public elementary schools.......................................................... 0.5 0.7 0.4 1.0
School size
Less than 300................................................................................. 0.9 1.4 0.6 1.5 300 to 599..................................................................................... 0.9 1.3 0.7 1.6 600 or more................................................................................... 1.4 1.9 0.7 2.4
Locale
City .............................................................................................. 1.5 1.8 0.9 2.4 Urban fringe/large town................................................................ 1.1 1.4 0.5 1.9 Rural/small town................................................................ 1.0 1.3 0.6 1.8
Region
Northeast....................................................................................... 1.3 2.3 0.9 2.6 Southeast....................................................................................... 2.1 1.2 0.8 2.3 Central.......................................................................................... 0.9 1.8 0.7 2.0 West ............................................................................................. 0.8 1.7 0.6 1.9
Percent minority enrollment
Less than 6 percent................................................................ 1.0 1.9 0.7 2.0 6 to 20 percent............................................................................... 1.2 1.6 0.6 2.0 21 to 49 percent ................................................................ 1.5 1.5 1.0 2.2 50 percent or more................................................................ 1.5 1.7 0.9 2.3
Percent of students eligible for free or reduced-price lunch
Less than 35 percent................................................................ 0.8 1.3 0.5 1.5 35 to 49 percent ................................................................ 1.6 2.3 0.7 2.6 50 to 74 percent ................................................................ 1.4 1.9 0.7 2.4
75 percent or more................................................................ 1.8 1.7 1.0 2.3
SOURCE: U.S. Department of Education, National Center for Education Statistics, Fast Response Survey System, “Survey of Classes That Serve Children Prior to Kindergarten in Public Schools: 2000–2001,” FRSS 78, 2001.
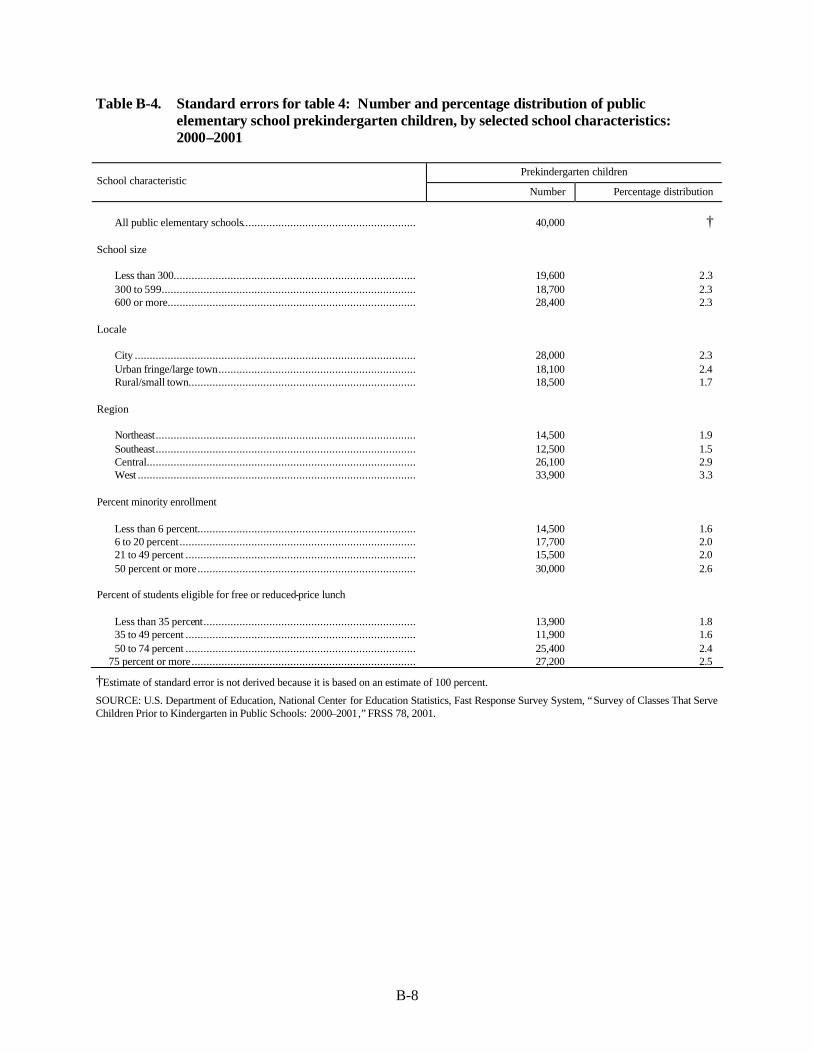
B-8
Table B-4. Standard errors for table 4: Number and percentage distribution of public elementary school prekindergarten children, by selected school characteristics: 2000–2001
Prekindergarten children
School characteristic Number Percentage distribution
All public elementary schools.......................................................... 40,000 †
School size
Less than 300................................................................................. 19,600 2.3 300 to 599..................................................................................... 18,700 2.3 600 or more................................................................................... 28,400 2.3
Locale
City .............................................................................................. 28,000 2.3 Urban fringe/large town.................................................................. 18,100 2.4 Rural/small town............................................................................ 18,500 1.7
Region
Northeast....................................................................................... 14,500 1.9 Southeast....................................................................................... 12,500 1.5 Central.......................................................................................... 26,100 2.9 West ............................................................................................. 33,900 3.3
Percent minority enrollment
Less than 6 percent......................................................................... 14,500 1.6 6 to 20 percent............................................................................... 17,700 2.0 21 to 49 percent ............................................................................. 15,500 2.0 50 percent or more......................................................................... 30,000 2.6
Percent of students eligible for free or reduced-price lunch
Less than 35 percent....................................................................... 13,900 1.8 35 to 49 percent ............................................................................. 11,900 1.6 50 to 74 percent ............................................................................. 25,400 2.4
75 percent or more........................................................................... 27,200 2.5
†Estimate of standard error is not derived because it is based on an estimate of 100 percent.
SOURCE: U.S. Department of Education, National Center for Education Statistics, Fast Response Survey System, “Survey of Classes That Serve Children Prior to Kindergarten in Public Schools: 2000–2001,” FRSS 78, 2001.
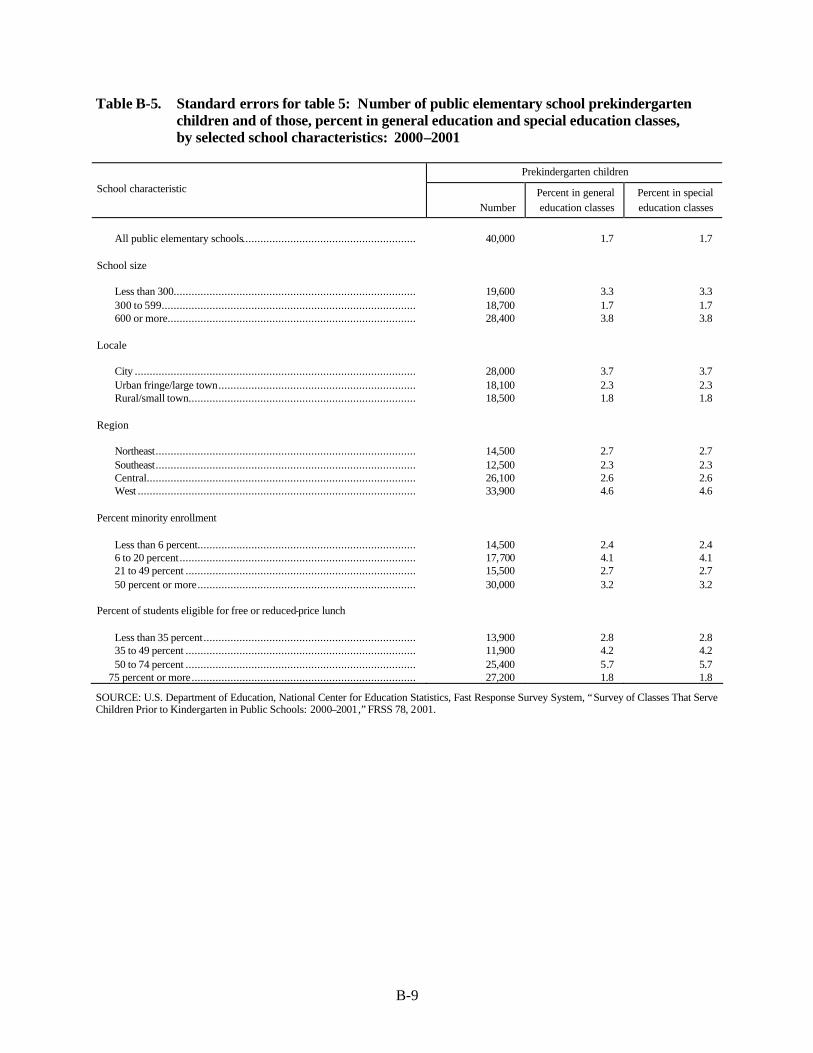
B-9
Table B-5. Standard errors for table 5: Number of public elementary school prekindergarten children and of those, percent in general education and special education classes, by selected school characteristics: 2000–2001
Prekindergarten children
School characteristic
Number Percent in general education classes
Percent in special education classes
All public elementary schools.......................................................... 40,000 1.7 1.7
School size
Less than 300................................................................................. 19,600 3.3 3.3 300 to 599..................................................................................... 18,700 1.7 1.7 600 or more................................................................................... 28,400 3.8 3.8
Locale
City .............................................................................................. 28,000 3.7 3.7 Urban fringe/large town.................................................................. 18,100 2.3 2.3 Rural/small town............................................................................ 18,500 1.8 1.8
Region
Northeast....................................................................................... 14,500 2.7 2.7 Southeast....................................................................................... 12,500 2.3 2.3 Central.......................................................................................... 26,100 2.6 2.6 West ............................................................................................. 33,900 4.6 4.6
Percent minority enrollment
Less than 6 percent......................................................................... 14,500 2.4 2.4 6 to 20 percent............................................................................... 17,700 4.1 4.1 21 to 49 percent ............................................................................. 15,500 2.7 2.7 50 percent or more......................................................................... 30,000 3.2 3.2
Percent of students eligible for free or reduced-price lunch
Less than 35 percent....................................................................... 13,900 2.8 2.8 35 to 49 percent ............................................................................. 11,900 4.2 4.2 50 to 74 percent ............................................................................. 25,400 5.7 5.7
75 percent or more........................................................................... 27,200 1.8 1.8
SOURCE: U.S. Department of Education, National Center for Education Statistics, Fast Response Survey System, “Survey of Classes That Serve Children Prior to Kindergarten in Public Schools: 2000–2001,” FRSS 78, 2001.
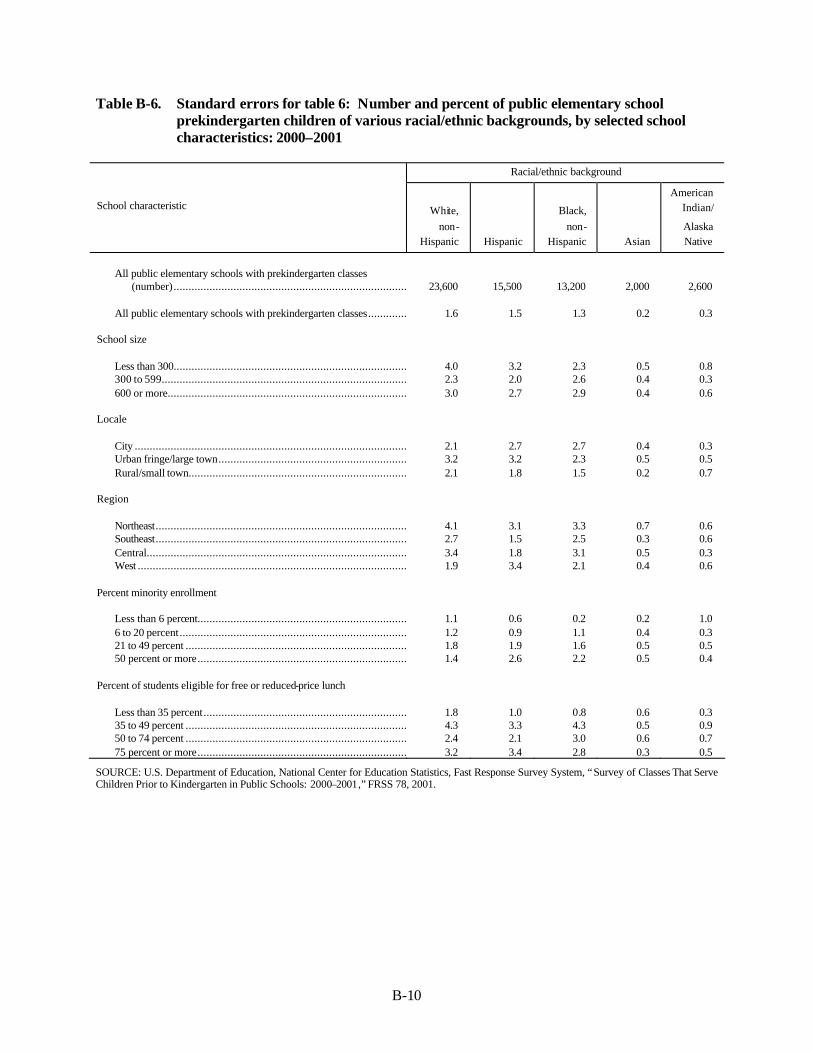
B-10
Table B-6. Standard errors for table 6: Number and percent of public elementary school prekindergarten children of various racial/ethnic backgrounds, by selected school characteristics: 2000–2001
Racial/ethnic background
School characteristic White, non-
Hispanic Hispanic
Black, non-
Hispanic Asian
American Indian/
Alaska Native
All public elementary schools with prekindergarten classes
(number)................................................................................. 23,600 15,500 13,200 2,000 2,600 All public elementary schools with prekindergarten classes................ 1.6 1.5 1.3 0.2 0.3
School size
Less than 300................................................................................. 4.0 3.2 2.3 0.5 0.8 300 to 599..................................................................................... 2.3 2.0 2.6 0.4 0.3 600 or more................................................................................... 3.0 2.7 2.9 0.4 0.6
Locale
City .............................................................................................. 2.1 2.7 2.7 0.4 0.3 Urban fringe/large town................................................................ 3.2 3.2 2.3 0.5 0.5 Rural/small town............................................................................ 2.1 1.8 1.5 0.2 0.7
Region
Northeast....................................................................................... 4.1 3.1 3.3 0.7 0.6 Southeast....................................................................................... 2.7 1.5 2.5 0.3 0.6 Central.......................................................................................... 3.4 1.8 3.1 0.5 0.3 West ............................................................................................. 1.9 3.4 2.1 0.4 0.6
Percent minority enrollment
Less than 6 percent......................................................................... 1.1 0.6 0.2 0.2 1.0 6 to 20 percent............................................................................... 1.2 0.9 1.1 0.4 0.3 21 to 49 percent ............................................................................. 1.8 1.9 1.6 0.5 0.5 50 percent or more......................................................................... 1.4 2.6 2.2 0.5 0.4
Percent of students eligible for free or reduced-price lunch
Less than 35 percent....................................................................... 1.8 1.0 0.8 0.6 0.3 35 to 49 percent ............................................................................. 4.3 3.3 4.3 0.5 0.9 50 to 74 percent ............................................................................. 2.4 2.1 3.0 0.6 0.7 75 percent or more......................................................................... 3.2 3.4 2.8 0.3 0.5
SOURCE: U.S. Department of Education, National Center for Education Statistics, Fast Response Survey System, “Survey of Classes That Serve Children Prior to Kindergarten in Public Schools: 2000–2001,” FRSS 78, 2001.
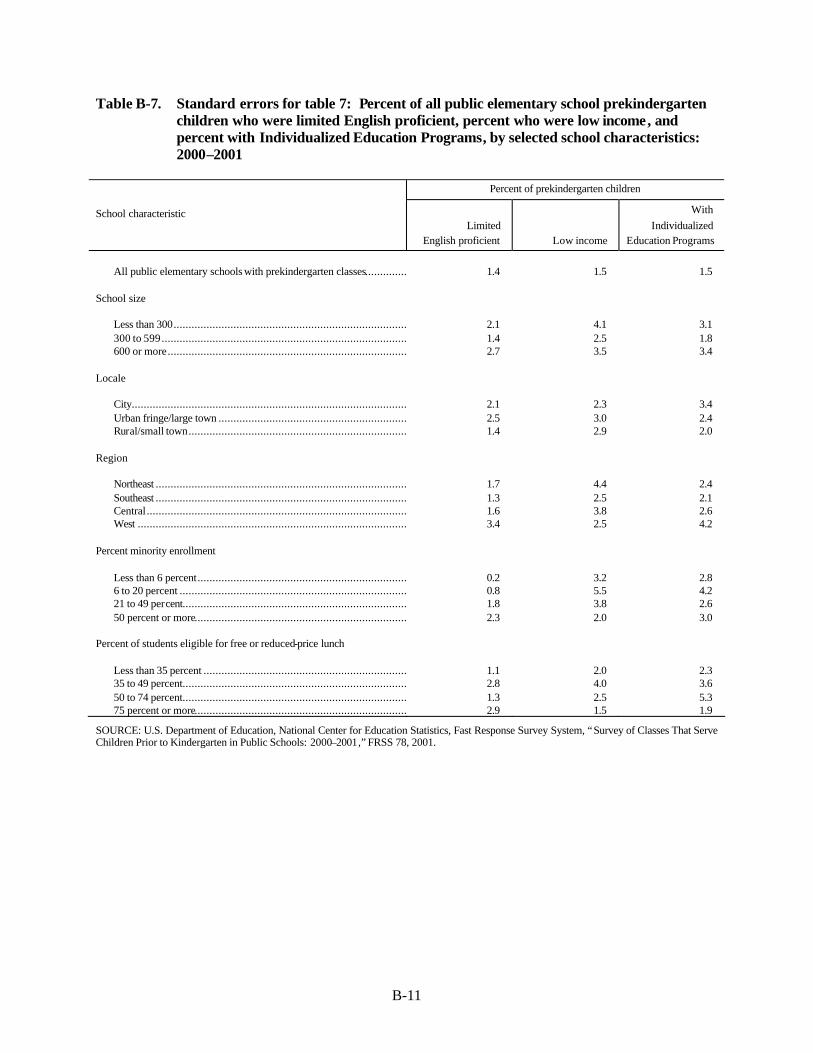
B-11
Table B-7. Standard errors for table 7: Percent of all public elementary school prekindergarten children who were limited English proficient, percent who were low income, and percent with Individualized Education Programs, by selected school characteristics: 2000–2001
Percent of prekindergarten children
School characteristic Limited
English proficient Low income
With Individualized
Education Programs
All public elementary schools with prekindergarten classes................. 1.4 1.5 1.5
School size
Less than 300................................................................................. 2.1 4.1 3.1 300 to 599..................................................................................... 1.4 2.5 1.8 600 or more................................................................................... 2.7 3.5 3.4
Locale
City............................................................................................... 2.1 2.3 3.4 Urban fringe/large town ................................................................ 2.5 3.0 2.4 Rural/small town............................................................................ 1.4 2.9 2.0
Region
Northeast ....................................................................................... 1.7 4.4 2.4 Southeast ....................................................................................... 1.3 2.5 2.1 Central.......................................................................................... 1.6 3.8 2.6 West ............................................................................................. 3.4 2.5 4.2
Percent minority enrollment
Less than 6 percent......................................................................... 0.2 3.2 2.8 6 to 20 percent ............................................................................... 0.8 5.5 4.2 21 to 49 percent.............................................................................. 1.8 3.8 2.6 50 percent or more.......................................................................... 2.3 2.0 3.0
Percent of students eligible for free or reduced-price lunch
Less than 35 percent ....................................................................... 1.1 2.0 2.3 35 to 49 percent.............................................................................. 2.8 4.0 3.6 50 to 74 percent.............................................................................. 1.3 2.5 5.3 75 percent or more.......................................................................... 2.9 1.5 1.9
SOURCE: U.S. Department of Education, National Center for Education Statistics, Fast Response Survey System, “Survey of Classes That Serve Children Prior to Kindergarten in Public Schools: 2000–2001,” FRSS 78, 2001.
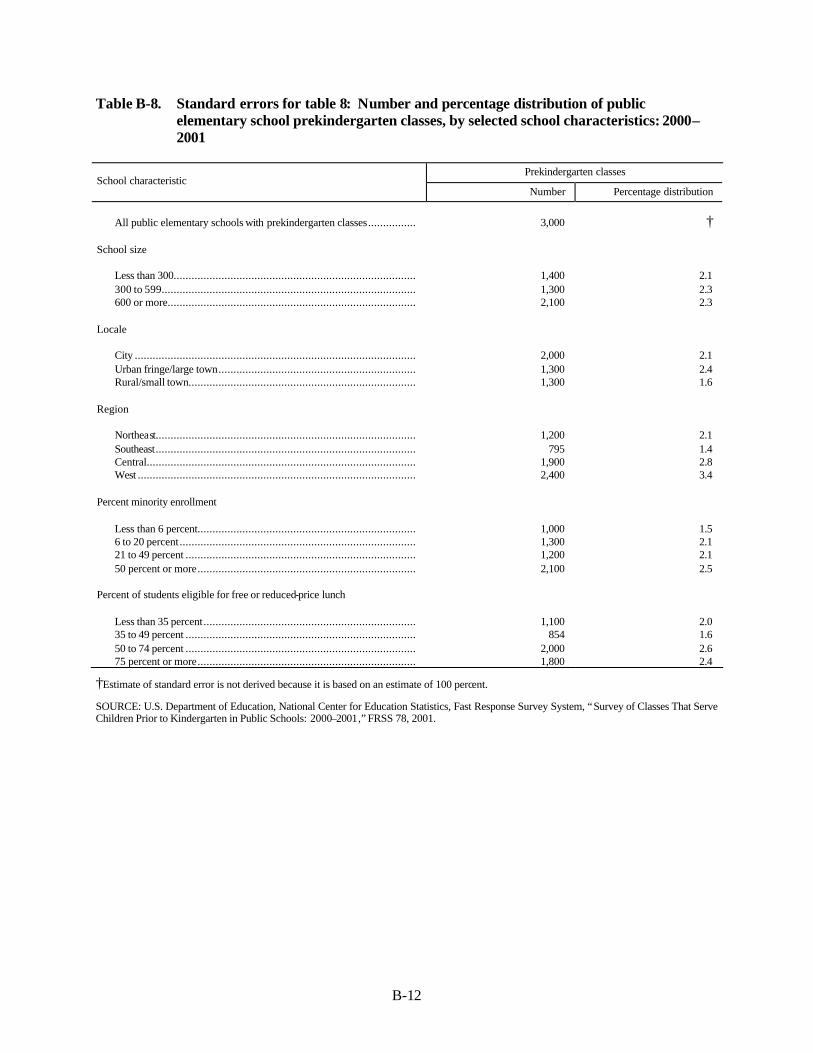
B-12
Table B-8. Standard errors for table 8: Number and percentage distribution of public elementary school prekindergarten classes, by selected school characteristics: 2000–2001
Prekindergarten classes
School characteristic Number Percentage distribution
All public elementary schools with prekindergarten classes................ 3,000 †
School size
Less than 300................................................................................. 1,400 2.1 300 to 599..................................................................................... 1,300 2.3 600 or more................................................................................... 2,100 2.3
Locale
City .............................................................................................. 2,000 2.1 Urban fringe/large town.................................................................. 1,300 2.4 Rural/small town............................................................................ 1,300 1.6
Region
Northeast....................................................................................... 1,200 2.1 Southeast....................................................................................... 795 1.4 Central.......................................................................................... 1,900 2.8 West ............................................................................................. 2,400 3.4
Percent minority enrollment
Less than 6 percent......................................................................... 1,000 1.5 6 to 20 percent............................................................................... 1,300 2.1 21 to 49 percent ............................................................................. 1,200 2.1 50 percent or more......................................................................... 2,100 2.5
Percent of students eligible for free or reduced-price lunch
Less than 35 percent....................................................................... 1,100 2.0 35 to 49 percent ............................................................................. 854 1.6 50 to 74 percent ............................................................................. 2,000 2.6 75 percent or more......................................................................... 1,800 2.4
†Estimate of standard error is not derived because it is based on an estimate of 100 percent.
SOURCE: U.S. Department of Education, National Center for Education Statistics, Fast Response Survey System, “Survey of Classes That Serve Children Prior to Kindergarten in Public Schools: 2000–2001,” FRSS 78, 2001.
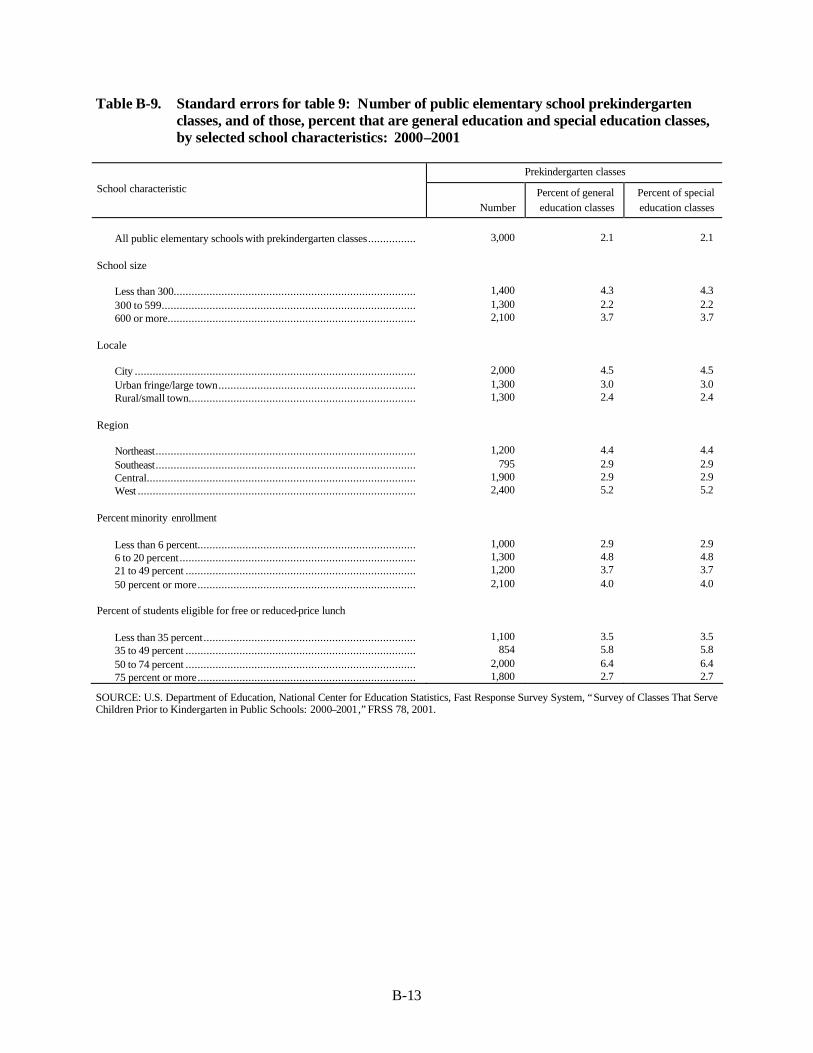
B-13
Table B-9. Standard errors for table 9: Number of public elementary school prekindergarten classes, and of those, percent that are general education and special education classes, by selected school characteristics: 2000–2001
Prekindergarten classes
School characteristic
Number Percent of general education classes
Percent of special education classes
All public elementary schools with prekindergarten classes................ 3,000 2.1 2.1
School size
Less than 300................................................................................. 1,400 4.3 4.3 300 to 599..................................................................................... 1,300 2.2 2.2 600 or more................................................................................... 2,100 3.7 3.7
Locale
City .............................................................................................. 2,000 4.5 4.5 Urban fringe/large town.................................................................. 1,300 3.0 3.0 Rural/small town............................................................................ 1,300 2.4 2.4
Region
Northeast....................................................................................... 1,200 4.4 4.4 Southeast....................................................................................... 795 2.9 2.9 Central.......................................................................................... 1,900 2.9 2.9 West ............................................................................................. 2,400 5.2 5.2
Percent minority enrollment
Less than 6 percent......................................................................... 1,000 2.9 2.9 6 to 20 percent............................................................................... 1,300 4.8 4.8 21 to 49 percent ............................................................................. 1,200 3.7 3.7 50 percent or more......................................................................... 2,100 4.0 4.0
Percent of students eligible for free or reduced-price lunch
Less than 35 percent....................................................................... 1,100 3.5 3.5 35 to 49 percent ............................................................................. 854 5.8 5.8 50 to 74 percent ............................................................................. 2,000 6.4 6.4 75 percent or more......................................................................... 1,800 2.7 2.7
SOURCE: U.S. Department of Education, National Center for Education Statistics, Fast Response Survey System, “Survey of Classes That Serve Children Prior to Kindergarten in Public Schools: 2000–2001,” FRSS 78, 2001.
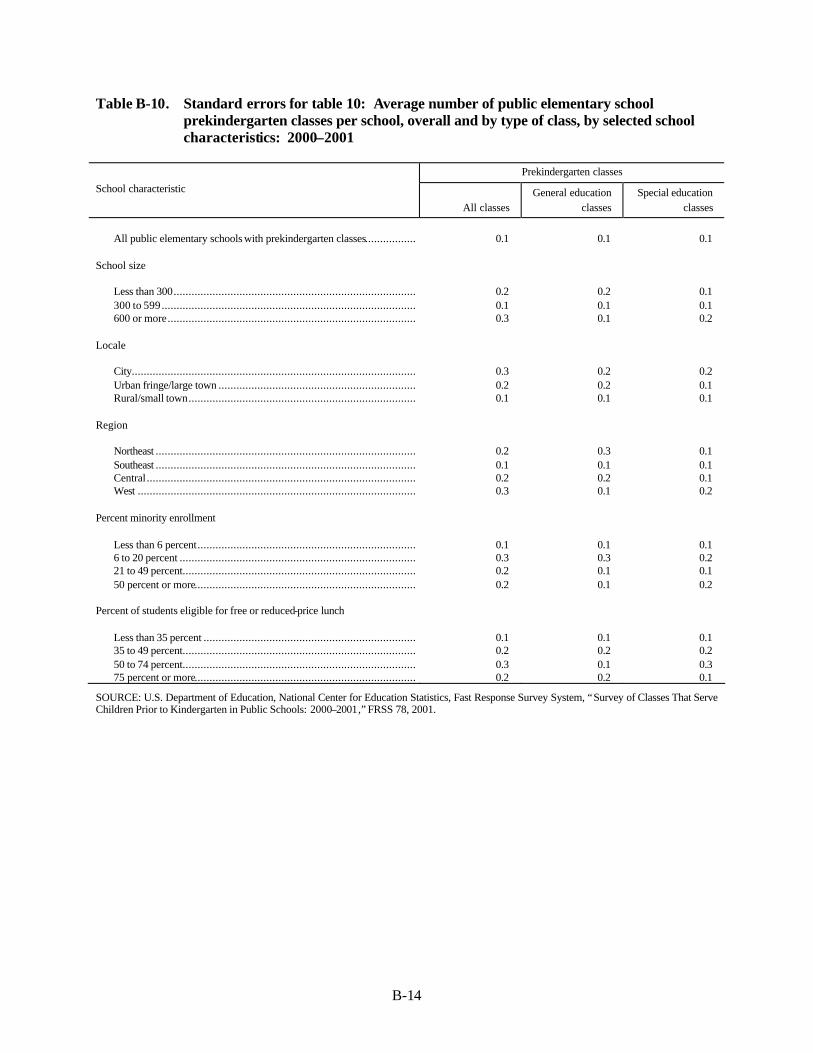
B-14
Table B-10. Standard errors for table 10: Average number of public elementary school prekindergarten classes per school, overall and by type of class, by selected school characteristics: 2000–2001
Prekindergarten classes
School characteristic
All classes General education
classes Special education
classes
All public elementary schools with prekindergarten classes................. 0.1 0.1 0.1
School size
Less than 300................................................................................. 0.2 0.2 0.1 300 to 599..................................................................................... 0.1 0.1 0.1 600 or more................................................................................... 0.3 0.1 0.2
Locale
City............................................................................................... 0.3 0.2 0.2 Urban fringe/large town .................................................................. 0.2 0.2 0.1 Rural/small town............................................................................ 0.1 0.1 0.1
Region
Northeast ....................................................................................... 0.2 0.3 0.1 Southeast ....................................................................................... 0.1 0.1 0.1 Central.......................................................................................... 0.2 0.2 0.1 West ............................................................................................. 0.3 0.1 0.2
Percent minority enrollment
Less than 6 percent......................................................................... 0.1 0.1 0.1 6 to 20 percent ............................................................................... 0.3 0.3 0.2 21 to 49 percent.............................................................................. 0.2 0.1 0.1 50 percent or more.......................................................................... 0.2 0.1 0.2
Percent of students eligible for free or reduced-price lunch
Less than 35 percent ....................................................................... 0.1 0.1 0.1 35 to 49 percent.............................................................................. 0.2 0.2 0.2 50 to 74 percent.............................................................................. 0.3 0.1 0.3 75 percent or more.......................................................................... 0.2 0.2 0.1
SOURCE: U.S. Department of Education, National Center for Education Statistics, Fast Response Survey System, “Survey of Classes That Serve Children Prior to Kindergarten in Public Schools: 2000–2001,” FRSS 78, 2001.
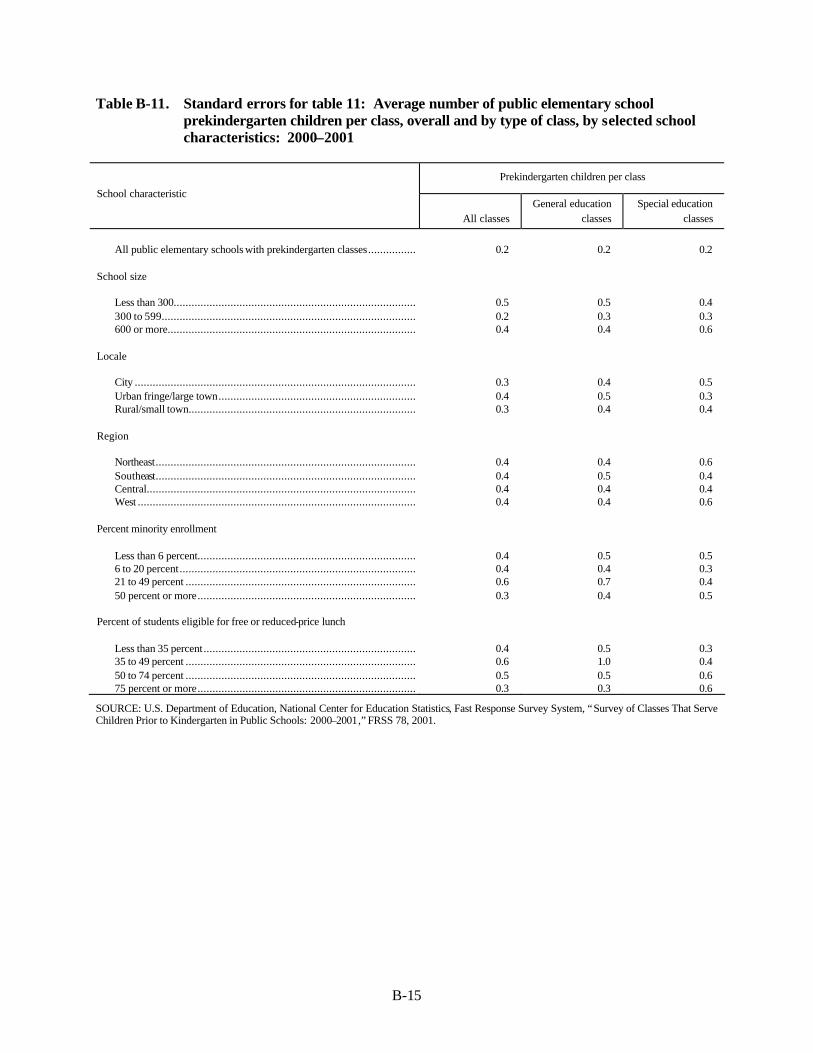
B-15
Table B-11. Standard errors for table 11: Average number of public elementary school prekindergarten children per class, overall and by type of class, by selected school characteristics: 2000–2001
Prekindergarten children per class
School characteristic
All classes General education
classes Special education
classes
All public elementary schools with prekindergarten classes................ 0.2 0.2 0.2
School size
Less than 300................................................................................. 0.5 0.5 0.4 300 to 599..................................................................................... 0.2 0.3 0.3 600 or more................................................................................... 0.4 0.4 0.6
Locale
City .............................................................................................. 0.3 0.4 0.5 Urban fringe/large town.................................................................. 0.4 0.5 0.3 Rural/small town............................................................................ 0.3 0.4 0.4
Region
Northeast....................................................................................... 0.4 0.4 0.6 Southeast....................................................................................... 0.4 0.5 0.4 Central.......................................................................................... 0.4 0.4 0.4 West ............................................................................................. 0.4 0.4 0.6
Percent minority enrollment
Less than 6 percent......................................................................... 0.4 0.5 0.5 6 to 20 percent............................................................................... 0.4 0.4 0.3 21 to 49 percent ............................................................................. 0.6 0.7 0.4 50 percent or more......................................................................... 0.3 0.4 0.5
Percent of students eligible for free or reduced-price lunch
Less than 35 percent....................................................................... 0.4 0.5 0.3 35 to 49 percent ............................................................................. 0.6 1.0 0.4 50 to 74 percent ............................................................................. 0.5 0.5 0.6 75 percent or more......................................................................... 0.3 0.3 0.6
SOURCE: U.S. Department of Education, National Center for Education Statistics, Fast Response Survey System, “Survey of Classes That Serve Children Prior to Kindergarten in Public Schools: 2000–2001,” FRSS 78, 2001.
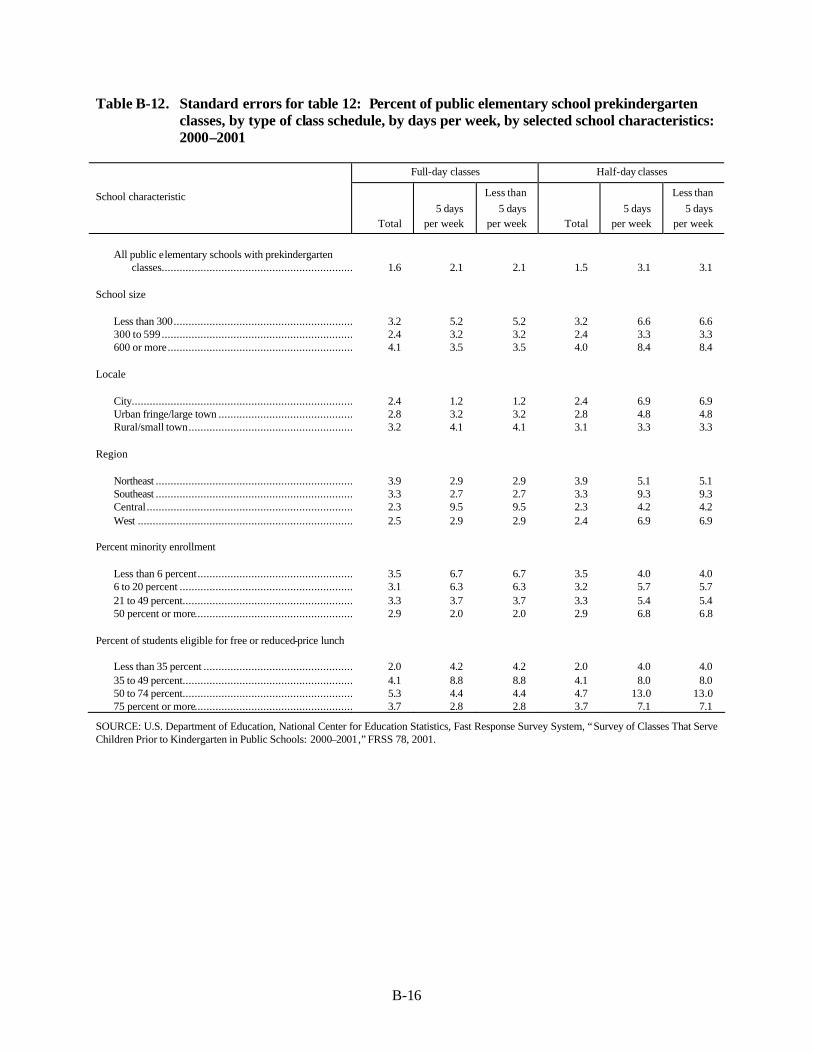
B-16
Table B-12. Standard errors for table 12: Percent of public elementary school prekindergarten classes, by type of class schedule, by days per week, by selected school characteristics: 2000–2001
Full-day classes Half-day classes
School characteristic
Total 5 days
per week
Less than 5 days
per week Total 5 days
per week
Less than 5 days
per week
All public elementary schools with prekindergarten
classes................................................................ 1.6 2.1 2.1 1.5 3.1 3.1 School size
Less than 300................................................................ 3.2 5.2 5.2 3.2 6.6 6.6 300 to 599................................................................ 2.4 3.2 3.2 2.4 3.3 3.3 600 or more................................................................ 4.1 3.5 3.5 4.0 8.4 8.4
Locale
City...............................................................................................2.4 1.2 1.2 2.4 6.9 6.9 Urban fringe/large town ................................................................2.8 3.2 3.2 2.8 4.8 4.8 Rural/small town................................................................ 3.2 4.1 4.1 3.1 3.3 3.3
Region
Northeast .......................................................................................3.9 2.9 2.9 3.9 5.1 5.1 Southeast .......................................................................................3.3 2.7 2.7 3.3 9.3 9.3 Central..........................................................................................2.3 9.5 9.5 2.3 4.2 4.2 West .............................................................................................2.5 2.9 2.9 2.4 6.9 6.9
Percent minority enrollment
Less than 6 percent................................................................3.5 6.7 6.7 3.5 4.0 4.0 6 to 20 percent ................................................................ 3.1 6.3 6.3 3.2 5.7 5.7 21 to 49 percent................................................................ 3.3 3.7 3.7 3.3 5.4 5.4 50 percent or more................................................................ 2.9 2.0 2.0 2.9 6.8 6.8
Percent of students eligible for free or reduced-price lunch
Less than 35 percent ................................................................2.0 4.2 4.2 2.0 4.0 4.0 35 to 49 percent................................................................ 4.1 8.8 8.8 4.1 8.0 8.0 50 to 74 percent................................................................ 5.3 4.4 4.4 4.7 13.0 13.0 75 percent or more................................................................ 3.7 2.8 2.8 3.7 7.1 7.1
SOURCE: U.S. Department of Education, National Center for Education Statistics, Fast Response Survey System, “Survey of Classes That Serve Children Prior to Kindergarten in Public Schools: 2000–2001,” FRSS 78, 2001.
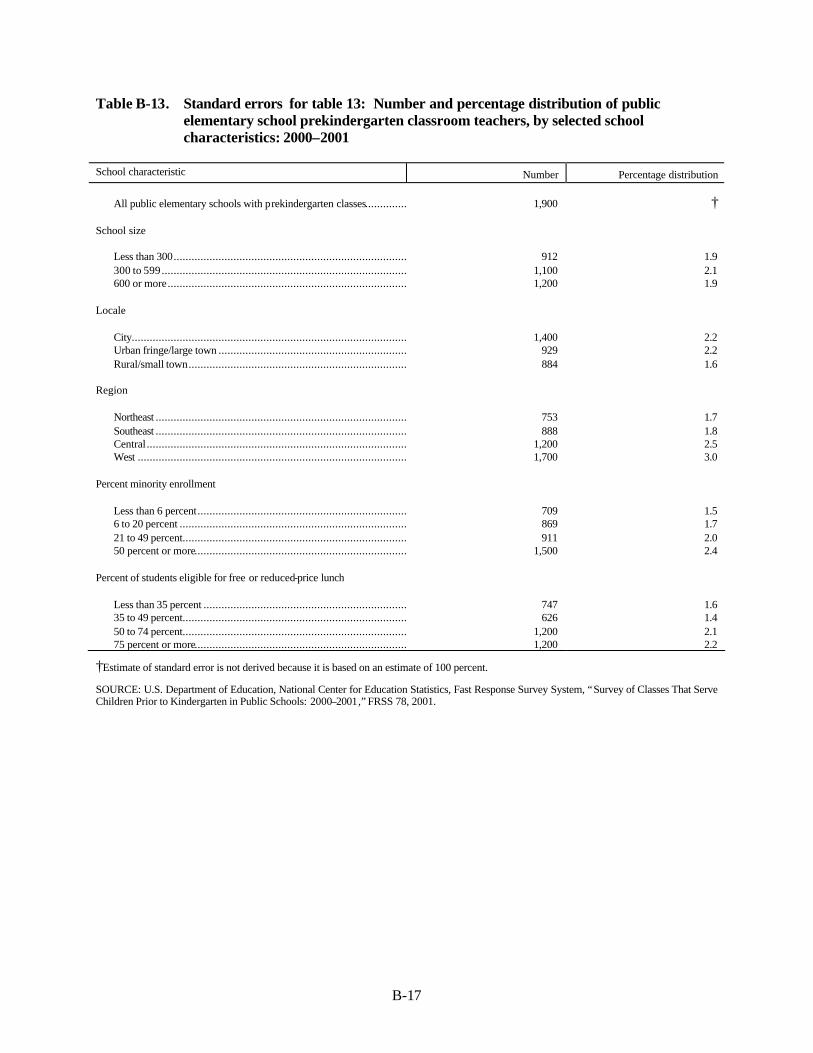
B-17
Table B-13. Standard errors for table 13: Number and percentage distribution of public elementary school prekindergarten classroom teachers, by selected school characteristics: 2000–2001
School characteristic Number Percentage distribution
All public elementary schools with prekindergarten classes................. 1,900 † School size
Less than 300................................................................................. 912 1.9 300 to 599..................................................................................... 1,100 2.1 600 or more................................................................................... 1,200 1.9
Locale
City............................................................................................... 1,400 2.2 Urban fringe/large town ................................................................ 929 2.2 Rural/small town............................................................................ 884 1.6
Region
Northeast ....................................................................................... 753 1.7 Southeast ....................................................................................... 888 1.8 Central.......................................................................................... 1,200 2.5 West ............................................................................................. 1,700 3.0
Percent minority enrollment
Less than 6 percent......................................................................... 709 1.5 6 to 20 percent ............................................................................... 869 1.7 21 to 49 percent.............................................................................. 911 2.0 50 percent or more.......................................................................... 1,500 2.4
Percent of students eligible for free or reduced-price lunch
Less than 35 percent ....................................................................... 747 1.6 35 to 49 percent.............................................................................. 626 1.4 50 to 74 percent.............................................................................. 1,200 2.1 75 percent or more.......................................................................... 1,200 2.2
†Estimate of standard error is not derived because it is based on an estimate of 100 percent.
SOURCE: U.S. Department of Education, National Center for Education Statistics, Fast Response Survey System, “Survey of Classes That Serve Children Prior to Kindergarten in Public Schools: 2000–2001,” FRSS 78, 2001.

B-18
Table B-14. Standard errors for table 14: Percent of public elementary school prekindergarten teachers with a bachelor’s or higher degree and percent paid using lower, the same, or higher salary scales than those of other public elementary school teachers, by selected school characteristics: 2000–2001
Percent distribution of teachers paid using:
School characteristic
Percent of teachers with a
bachelor’s or higher degree
A lower pay scale
The same pay scale
A higher pay scale
All public elementary schools with prekindergarten classes................. 1.5 1.3 1.4 0.5
School size
Less than 300................................................................................. 3.4 2.9 3.2 3.7 300 to 599..................................................................................... 1.9 2.1 2.0 1.1 600 or more................................................................................... 2.2 2.1 2.3 0.3
Locale
City............................................................................................... 1.6 2.1 2.2 0.6 Urban fringe/large town ................................................................ 2.2 2.5 2.5 0.9 Rural/small town............................................................................ 2.4 2.4 2.4 1.2
Region
Northeast ....................................................................................... 2.1 2.6 2.6 0.0 Southeast ....................................................................................... 2.9 2.8 2.8 0.8 Central.......................................................................................... 2.0 2.6 2.9 1.3 West ............................................................................................. 2.5 2.3 2.5 0.7
Percent minority enrollment
Less than 6 percent......................................................................... 2.6 3.2 3.3 1.0 6 to 20 percent ............................................................................... 2.8 3.8 4.0 1.0 21 to 49 percent.............................................................................. 3.1 3.1 3.3 0.4 50 percent or more.......................................................................... 2.1 2.0 2.2 0.8
Percent of students eligible for free or reduced-price lunch
Less than 35 percent ....................................................................... 2.0 2.6 2.8 0.6 35 to 49 percent.............................................................................. 3.1 3.1 3.3 1.0 50 to 74 percent.............................................................................. 2.2 2.5 2.5 0.0 75 percent or more.......................................................................... 2.4 2.5 2.5 1.1
SOURCE: U.S. Department of Education, National Center for Education Statistics, Fast Response Survey System, “Survey of Classes That Serve Children Prior to Kindergarten in Public Schools: 2000–2001,” FRSS 78, 2001.
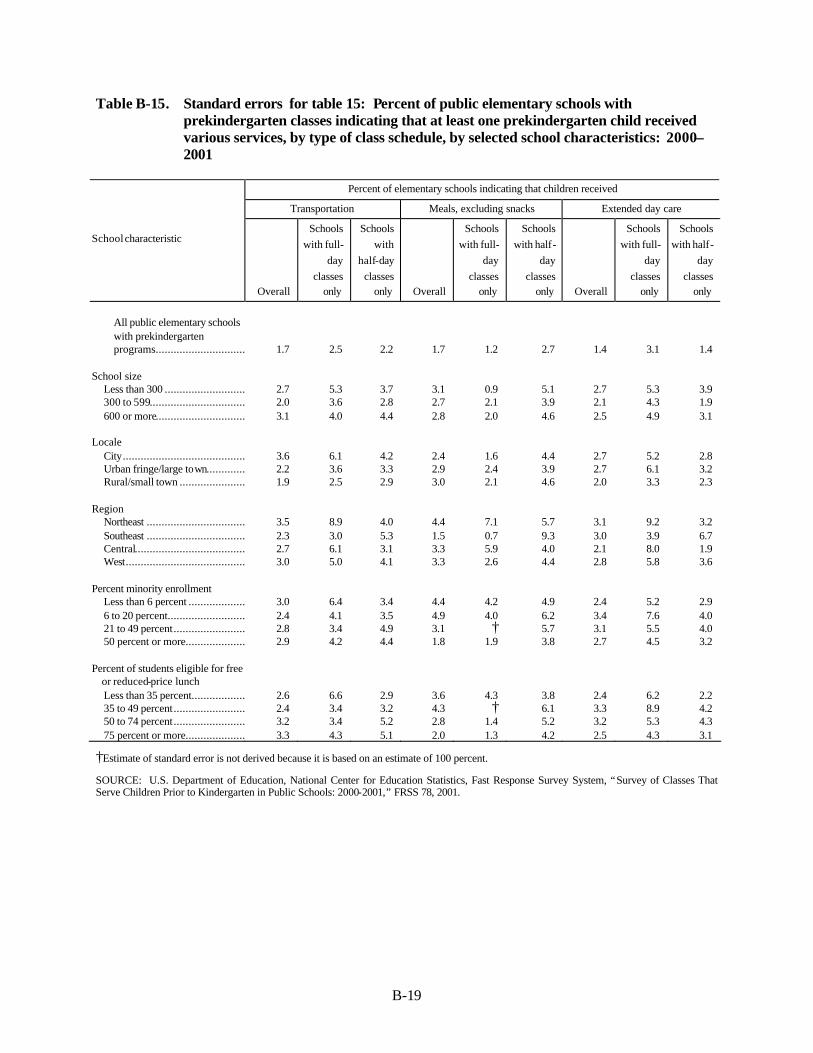
B-19
Table B-15. Standard errors for table 15: Percent of public elementary schools with prekindergarten classes indicating that at least one prekindergarten child received various services, by type of class schedule, by selected school characteristics: 2000–2001
Percent of elementary schools indicating that children received
Transportation Meals, excluding snacks Extended day care
School characteristic
Overall
Schools with full-
day classes
only
Schools with
half-day classes
only Overall
Schools with full-
day classes
only
Schools with half-
day classes
only Overall
Schools with full-
day classes
only
Schools with half-
day classes
only
All public elementary schools
with prekindergarten programs................................ 1.7 2.5 2.2 1.7 1.2 2.7 1.4 3.1 1.4
School size Less than 300 ................................ 2.7 5.3 3.7 3.1 0.9 5.1 2.7 5.3 3.9 300 to 599................................ 2.0 3.6 2.8 2.7 2.1 3.9 2.1 4.3 1.9 600 or more................................ 3.1 4.0 4.4 2.8 2.0 4.6 2.5 4.9 3.1 Locale City................................................................3.6 6.1 4.2 2.4 1.6 4.4 2.7 5.2 2.8 Urban fringe/large town................................2.2 3.6 3.3 2.9 2.4 3.9 2.7 6.1 3.2 Rural/small town ................................ 1.9 2.5 2.9 3.0 2.1 4.6 2.0 3.3 2.3 Region Northeast ................................................................3.5 8.9 4.0 4.4 7.1 5.7 3.1 9.2 3.2 Southeast ................................................................2.3 3.0 5.3 1.5 0.7 9.3 3.0 3.9 6.7 Central................................................................2.7 6.1 3.1 3.3 5.9 4.0 2.1 8.0 1.9 West................................................................3.0 5.0 4.1 3.3 2.6 4.4 2.8 5.8 3.6 Percent minority enrollment Less than 6 percent ................................3.0 6.4 3.4 4.4 4.2 4.9 2.4 5.2 2.9 6 to 20 percent................................ 2.4 4.1 3.5 4.9 4.0 6.2 3.4 7.6 4.0 21 to 49 percent................................ 2.8 3.4 4.9 3.1 † 5.7 3.1 5.5 4.0 50 percent or more................................2.9 4.2 4.4 1.8 1.9 3.8 2.7 4.5 3.2 Percent of students eligible for free
or reduced-price lunch Less than 35 percent................................2.6 6.6 2.9 3.6 4.3 3.8 2.4 6.2 2.2 35 to 49 percent................................ 2.4 3.4 3.2 4.3 † 6.1 3.3 8.9 4.2 50 to 74 percent................................ 3.2 3.4 5.2 2.8 1.4 5.2 3.2 5.3 4.3 75 percent or more................................3.3 4.3 5.1 2.0 1.3 4.2 2.5 4.3 3.1
†Estimate of standard error is not derived because it is based on an estimate of 100 percent.
SOURCE: U.S. Department of Education, National Center for Education Statistics, Fast Response Survey System, “Survey of Classes That Serve Children Prior to Kindergarten in Public Schools: 2000-2001,” FRSS 78, 2001.
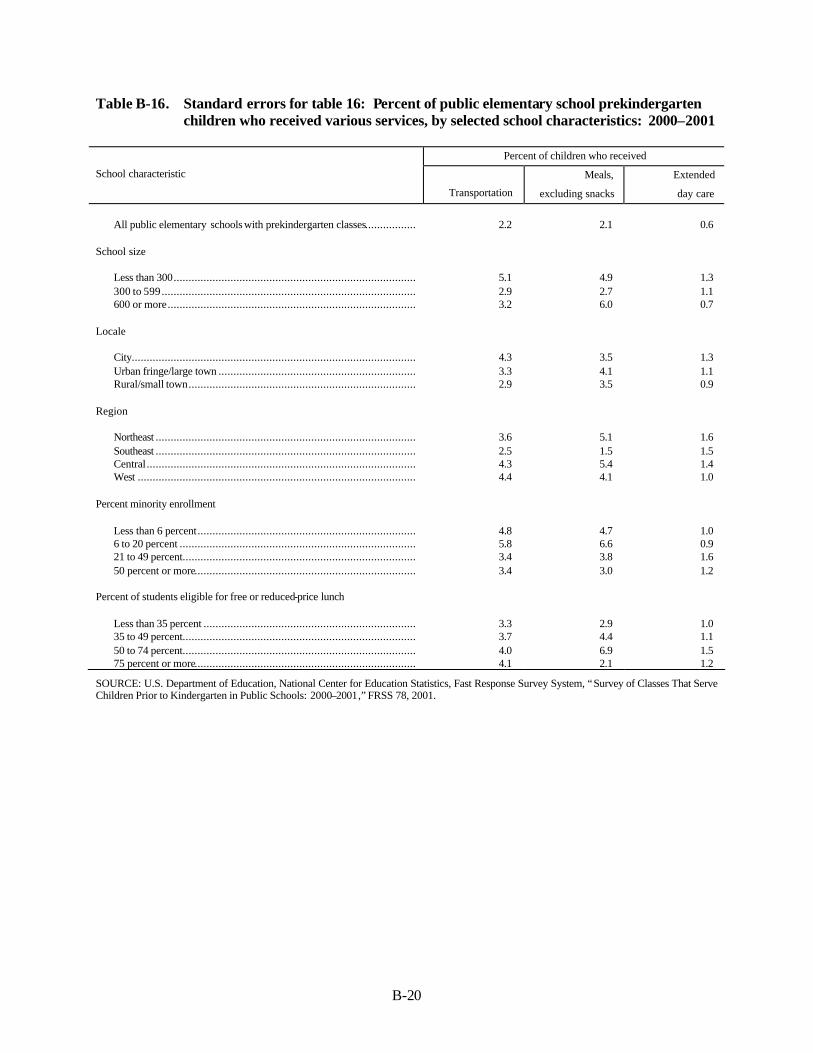
B-20
Table B-16. Standard errors for table 16: Percent of public elementary school prekindergarten children who received various services, by selected school characteristics: 2000–2001
Percent of children who received
School characteristic
Transportation
Meals,
excluding snacks
Extended
day care
All public elementary schools with prekindergarten classes................. 2.2 2.1 0.6
School size
Less than 300................................................................................. 5.1 4.9 1.3 300 to 599..................................................................................... 2.9 2.7 1.1 600 or more................................................................................... 3.2 6.0 0.7
Locale
City............................................................................................... 4.3 3.5 1.3 Urban fringe/large town .................................................................. 3.3 4.1 1.1 Rural/small town............................................................................ 2.9 3.5 0.9
Region
Northeast ....................................................................................... 3.6 5.1 1.6 Southeast ....................................................................................... 2.5 1.5 1.5 Central.......................................................................................... 4.3 5.4 1.4 West ............................................................................................. 4.4 4.1 1.0
Percent minority enrollment
Less than 6 percent......................................................................... 4.8 4.7 1.0 6 to 20 percent ............................................................................... 5.8 6.6 0.9 21 to 49 percent.............................................................................. 3.4 3.8 1.6 50 percent or more.......................................................................... 3.4 3.0 1.2
Percent of students eligible for free or reduced-price lunch
Less than 35 percent ....................................................................... 3.3 2.9 1.0 35 to 49 percent.............................................................................. 3.7 4.4 1.1 50 to 74 percent.............................................................................. 4.0 6.9 1.5 75 percent or more.......................................................................... 4.1 2.1 1.2
SOURCE: U.S. Department of Education, National Center for Education Statistics, Fast Response Survey System, “Survey of Classes That Serve Children Prior to Kindergarten in Public Schools: 2000–2001,” FRSS 78, 2001.
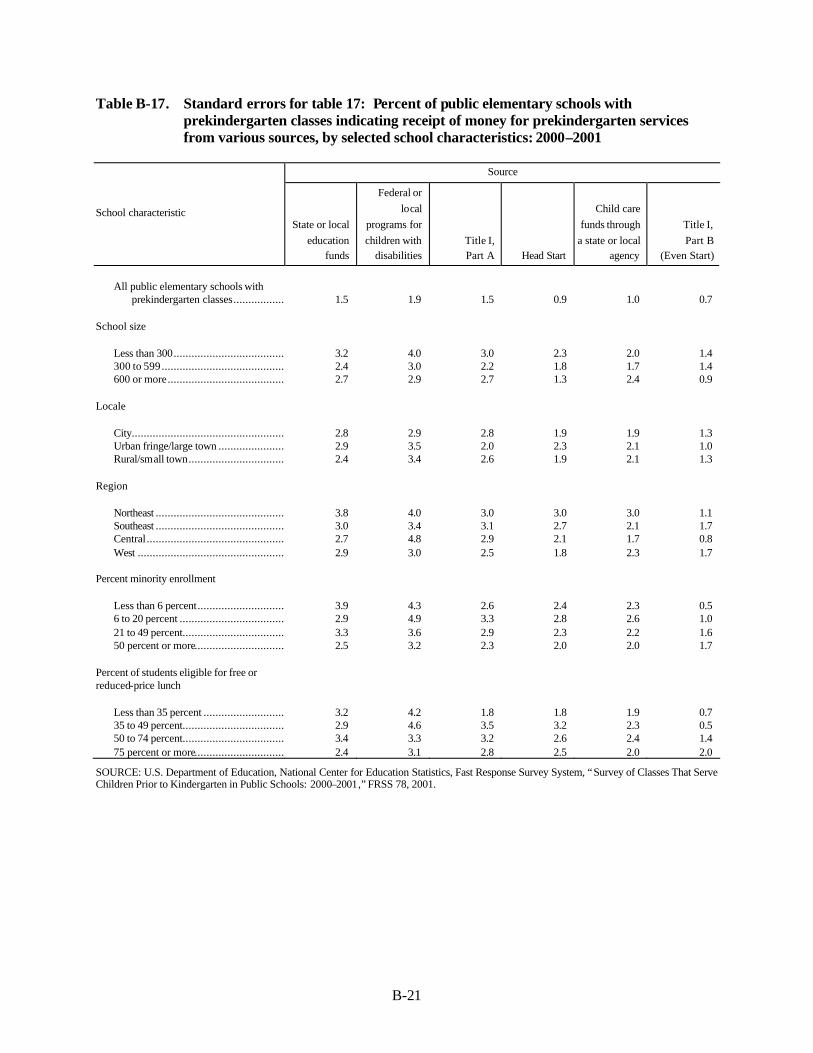
B-21
Table B-17. Standard errors for table 17: Percent of public elementary schools with prekindergarten classes indicating receipt of money for prekindergarten services from various sources, by selected school characteristics: 2000–2001
Source
School characteristic State or local
education funds
Federal or local
programs for children with
disabilities Title I, Part A Head Start
Child care funds through
a state or local agency
Title I, Part B
(Even Start)
All public elementary schools with
prekindergarten classes................................ 1.5 1.9 1.5 0.9 1.0 0.7 School size
Less than 300................................................................3.2 4.0 3.0 2.3 2.0 1.4 300 to 599................................................................2.4 3.0 2.2 1.8 1.7 1.4 600 or more................................................................2.7 2.9 2.7 1.3 2.4 0.9
Locale
City................................................................ 2.8 2.9 2.8 1.9 1.9 1.3 Urban fringe/large town ................................ 2.9 3.5 2.0 2.3 2.1 1.0 Rural/small town................................................................2.4 3.4 2.6 1.9 2.1 1.3
Region
Northeast ................................................................3.8 4.0 3.0 3.0 3.0 1.1 Southeast ................................................................3.0 3.4 3.1 2.7 2.1 1.7 Central................................................................2.7 4.8 2.9 2.1 1.7 0.8 West ................................................................ 2.9 3.0 2.5 1.8 2.3 1.7
Percent minority enrollment
Less than 6 percent................................ 3.9 4.3 2.6 2.4 2.3 0.5 6 to 20 percent ................................................................2.9 4.9 3.3 2.8 2.6 1.0 21 to 49 percent................................................................3.3 3.6 2.9 2.3 2.2 1.6 50 percent or more................................ 2.5 3.2 2.3 2.0 2.0 1.7
Percent of students eligible for free or reduced-price lunch
Less than 35 percent ................................ 3.2 4.2 1.8 1.8 1.9 0.7 35 to 49 percent................................................................2.9 4.6 3.5 3.2 2.3 0.5 50 to 74 percent................................................................3.4 3.3 3.2 2.6 2.4 1.4 75 percent or more................................ 2.4 3.1 2.8 2.5 2.0 2.0
SOURCE: U.S. Department of Education, National Center for Education Statistics, Fast Response Survey System, “Survey of Classes That Serve Children Prior to Kindergarten in Public Schools: 2000–2001,” FRSS 78, 2001.
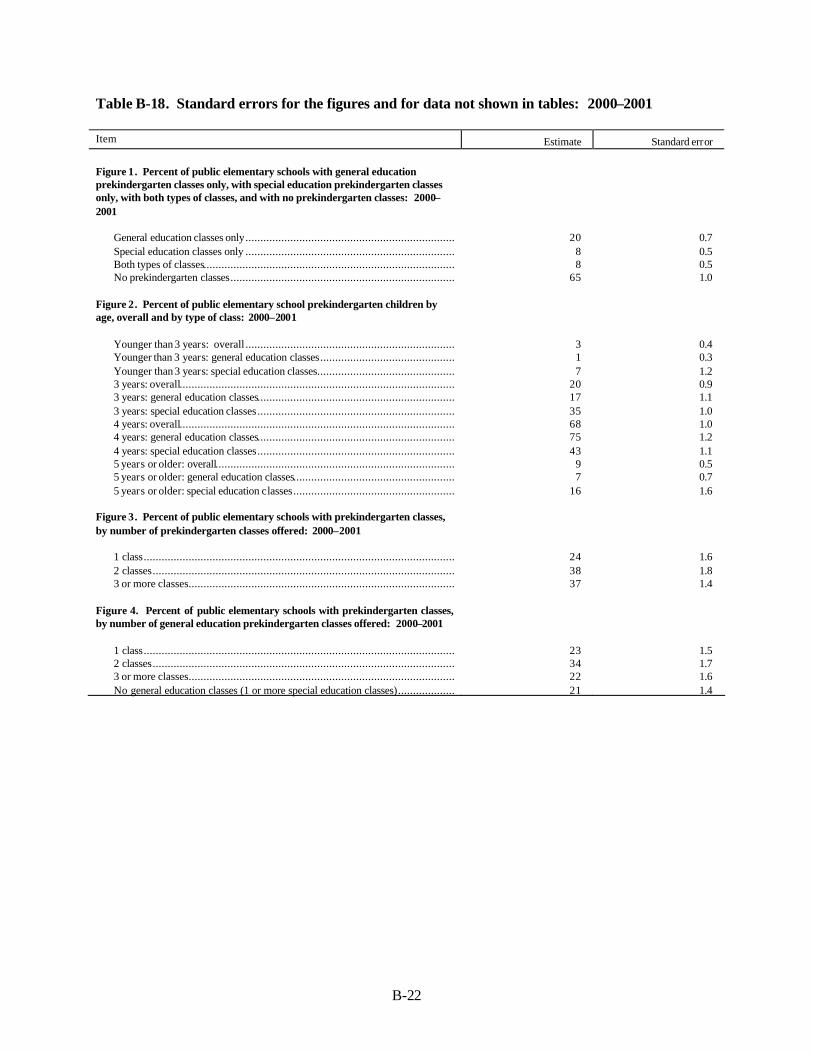
B-22
Table B-18. Standard errors for the figures and for data not shown in tables: 2000–2001 Item Estimate Standard error Figure 1. Percent of public elementary schools with general education prekindergarten classes only, with special education prekindergarten classes only, with both types of classes, and with no prekindergarten classes: 2000–2001
General education classes only...................................................................... 20 0.7 Special education classes only ...................................................................... 8 0.5 Both types of classes.................................................................................... 8 0.5 No prekindergarten classes........................................................................... 65 1.0
Figure 2. Percent of public elementary school prekindergarten children by age, overall and by type of class: 2000–2001
Younger than 3 years: overall ...................................................................... 3 0.4 Younger than 3 years: general education classes............................................. 1 0.3 Younger than 3 years: special education classes.............................................. 7 1.2 3 years: overall............................................................................................ 20 0.9 3 years: general education classes.................................................................. 17 1.1 3 years: special education classes.................................................................. 35 1.0 4 years: overall............................................................................................ 68 1.0 4 years: general education classes.................................................................. 75 1.2 4 years: special education classes.................................................................. 43 1.1 5 years or older: overall................................................................................ 9 0.5 5 years or older: general education classes...................................................... 7 0.7 5 years or older: special education classes...................................................... 16 1.6
Figure 3. Percent of public elementary schools with prekindergarten classes, by number of prekindergarten classes offered: 2000–2001
1 class........................................................................................................ 24 1.6 2 classes..................................................................................................... 38 1.8 3 or more classes......................................................................................... 37 1.4
Figure 4. Percent of public elementary schools with prekindergarten classes, by number of general education prekindergarten classes offered: 2000–2001
1 class........................................................................................................ 23 1.5 2 classes..................................................................................................... 34 1.7 3 or more classes......................................................................................... 22 1.6 No general education classes (1 or more special education classes)................... 21 1.4
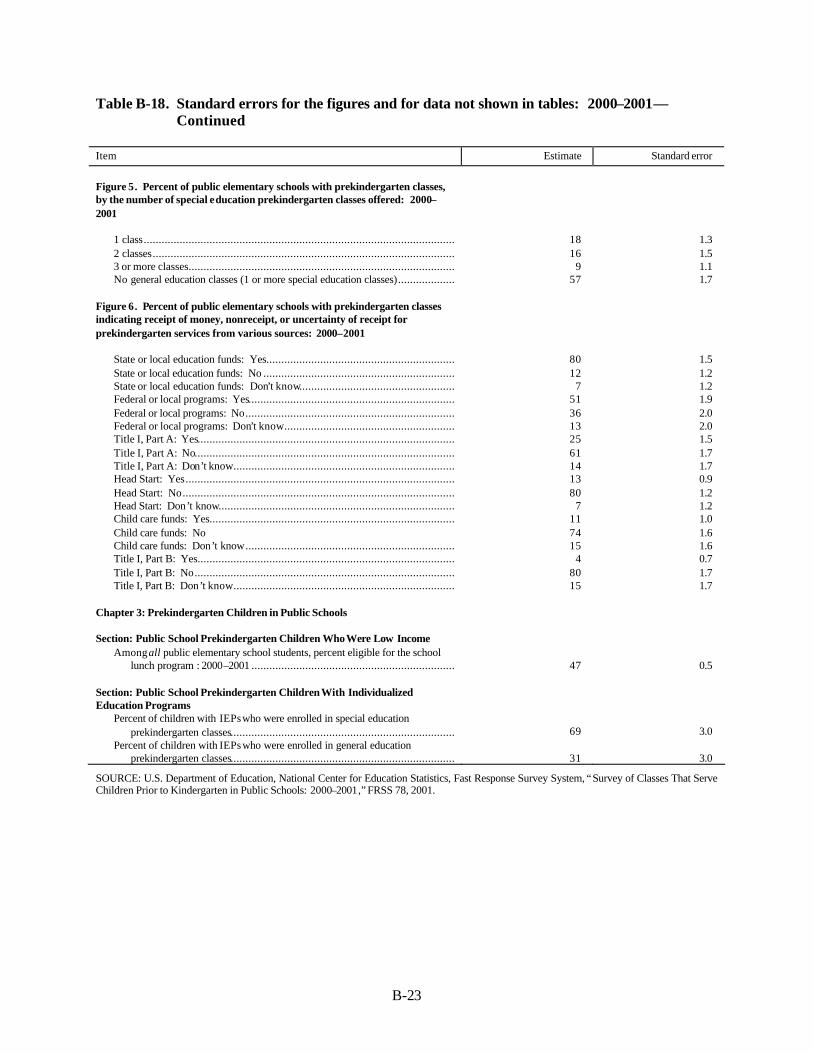
B-23
Table B-18. Standard errors for the figures and for data not shown in tables: 2000–2001—Continued
Item Estimate Standard error
Figure 5. Percent of public elementary schools with prekindergarten classes, by the number of special education prekindergarten classes offered: 2000–2001
1 class........................................................................................................ 18 1.3 2 classes..................................................................................................... 16 1.5 3 or more classes......................................................................................... 9 1.1 No general education classes (1 or more special education classes)................... 57 1.7
Figure 6. Percent of public elementary schools with prekindergarten classes indicating receipt of money, nonreceipt, or uncertainty of receipt for prekindergarten services from various sources: 2000–2001
State or local education funds: Yes............................................................... 80 1.5 State or local education funds: No ................................................................ 12 1.2 State or local education funds: Don’t know.................................................... 7 1.2 Federal or local programs: Yes..................................................................... 51 1.9 Federal or local programs: No...................................................................... 36 2.0 Federal or local programs: Don’t know......................................................... 13 2.0 Title I, Part A: Yes...................................................................................... 25 1.5 Title I, Part A: No....................................................................................... 61 1.7 Title I, Part A: Don’t know.......................................................................... 14 1.7 Head Start: Yes.......................................................................................... 13 0.9 Head Start: No........................................................................................... 80 1.2 Head Start: Don’t know............................................................................... 7 1.2 Child care funds: Yes.................................................................................. 11 1.0 Child care funds: No 74 1.6 Child care funds: Don’t know...................................................................... 15 1.6 Title I, Part B: Yes...................................................................................... 4 0.7 Title I, Part B: No....................................................................................... 80 1.7 Title I, Part B: Don’t know.......................................................................... 15 1.7
Chapter 3: Prekindergarten Children in Public Schools Section: Public School Prekindergarten Children Who Were Low Income
Among all public elementary school students, percent eligible for the school lunch program : 2000–2001 .................................................................... 47 0.5
Section: Public School Prekindergarten Children With Individualized Education Programs
Percent of children with IEPs who were enrolled in special education prekindergarten classes........................................................................... 69 3.0
Percent of children with IEPs who were enrolled in general education prekindergarten classes........................................................................... 31 3.0
SOURCE: U.S. Department of Education, National Center for Education Statistics, Fast Response Survey System, “Survey of Classes That Serve Children Prior to Kindergarten in Public Schools: 2000–2001,” FRSS 78, 2001.

B-24
C-1
Appendix C
Survey Questionnaire

C-2
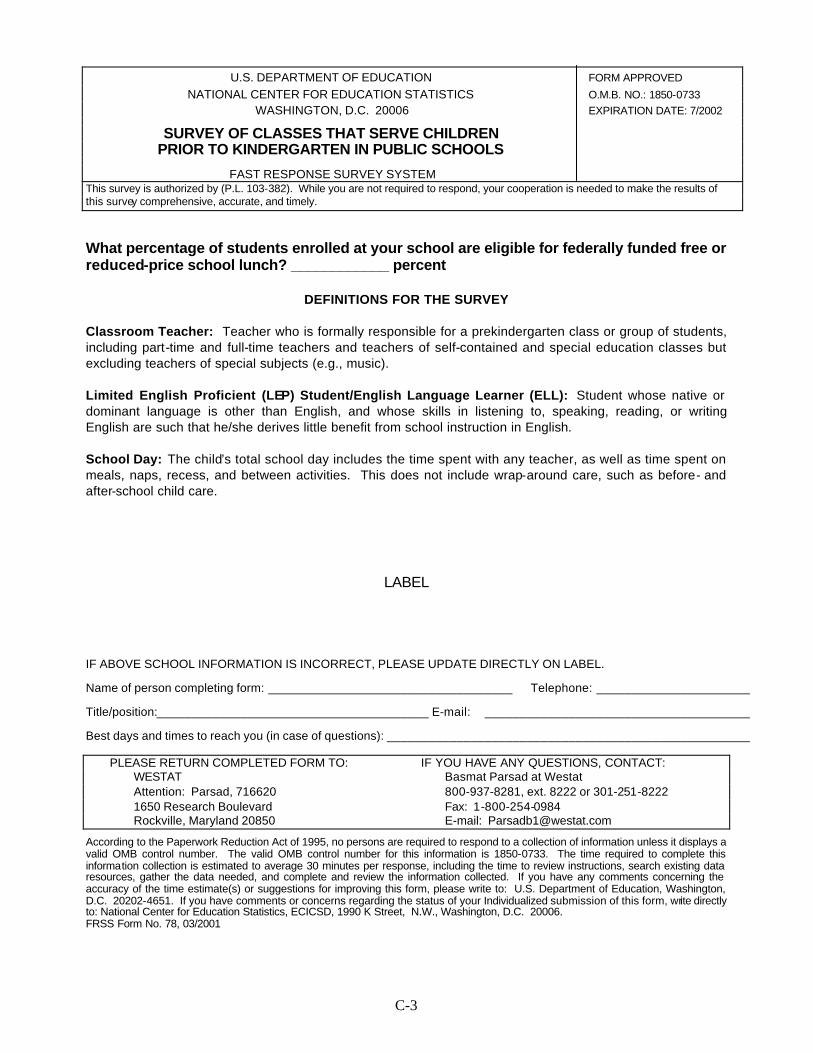
C-3
U.S. DEPARTMENT OF EDUCATION FORM APPROVED NATIONAL CENTER FOR EDUCATION STATISTICS O.M.B. NO.: 1850-0733 WASHINGTON, D.C. 20006 EXPIRATION DATE: 7/2002 SURVEY OF CLASSES THAT SERVE CHILDREN PRIOR TO KINDERGARTEN IN PUBLIC SCHOOLS FAST RESPONSE SURVEY SYSTEM This survey is authorized by (P.L. 103-382). While you are not required to respond, your cooperation is needed to make the results of this survey comprehensive, accurate, and timely.
What percentage of students enrolled at your school are eligible for federally funded free or reduced-price school lunch? ____________ percent
DEFINITIONS FOR THE SURVEY
Classroom Teacher: Teacher who is formally responsible for a prekindergarten class or group of students, including part-time and full-time teachers and teachers of self-contained and special education classes but excluding teachers of special subjects (e.g., music). Limited English Proficient (LEP) Student/English Language Learner (ELL): Student whose native or dominant language is other than English, and whose skills in listening to, speaking, reading, or writing English are such that he/she derives little benefit from school instruction in English. School Day: The child’s total school day includes the time spent with any teacher, as well as time spent on meals, naps, recess, and between activities. This does not include wrap-around care, such as before- and after-school child care.
LABEL
IF ABOVE SCHOOL INFORMATION IS INCORRECT, PLEASE UPDATE DIRECTLY ON LABEL. Name of person completing form: ___________________________________ Telephone: ______________________ Title/position:_______________________________________ E-mail: ______________________________________ Best days and times to reach you (in case of questions): ____________________________________________________
PLEASE RETURN COMPLETED FORM TO: IF YOU HAVE ANY QUESTIONS, CONTACT: WESTAT Basmat Parsad at Westat Attention: Parsad, 716620 800-937-8281, ext. 8222 or 301-251-8222 1650 Research Boulevard Fax: 1-800-254-0984 Rockville, Maryland 20850 E-mail: [email protected] According to the Paperwork Reduction Act of 1995, no persons are required to respond to a collection of information unless it displays a valid OMB control number. The valid OMB control number for this information is 1850-0733. The time required to complete this information collection is estimated to average 30 minutes per response, including the time to review instructions, search existing data resources, gather the data needed, and complete and review the information collected. If you have any comments concerning the accuracy of the time estimate(s) or suggestions for improving this form, please write to: U.S. Department of Education, Washington, D.C. 20202-4651. If you have comments or concerns regarding the status of your Individualized submission of this form, write directly to: National Center for Education Statistics, ECICSD, 1990 K Street, N.W., Washington, D.C. 20006. FRSS Form No. 78, 03/2001
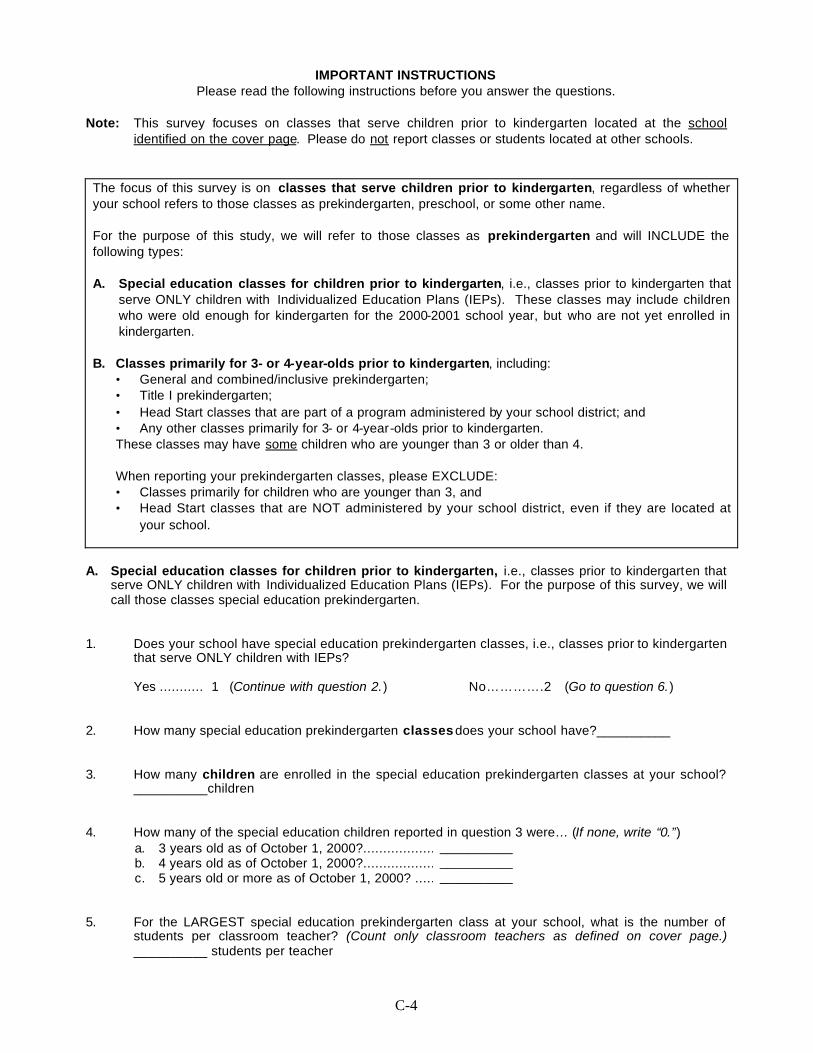
C-4
IMPORTANT INSTRUCTIONS Please read the following instructions before you answer the questions.
Note: This survey focuses on classes that serve children prior to kindergarten located at the school
identified on the cover page. Please do not report classes or students located at other schools.
The focus of this survey is on classes that serve children prior to kindergarten, regardless of whether your school refers to those classes as prekindergarten, preschool, or some other name. For the purpose of this study, we will refer to those classes as prekindergarten and will INCLUDE the following types: A. Special education classes for children prior to kindergarten, i.e., classes prior to kindergarten that
serve ONLY children with Individualized Education Plans (IEPs). These classes may include children who were old enough for kindergarten for the 2000-2001 school year, but who are not yet enrolled in kindergarten.
B. Classes primarily for 3- or 4-year-olds prior to kindergarten, including:
• General and combined/inclusive prekindergarten; • Title I prekindergarten; • Head Start classes that are part of a program administered by your school district; and • Any other classes primarily for 3- or 4-year-olds prior to kindergarten. These classes may have some children who are younger than 3 or older than 4.
When reporting your prekindergarten classes, please EXCLUDE: • Classes primarily for children who are younger than 3, and • Head Start classes that are NOT administered by your school district, even if they are located at
your school.
A. Special education classes for children prior to kindergarten, i.e., classes prior to kindergarten that
serve ONLY children with Individualized Education Plans (IEPs). For the purpose of this survey, we will call those classes special education prekindergarten.
1. Does your school have special education prekindergarten classes, i.e., classes prior to kindergarten
that serve ONLY children with IEPs? Yes ........... 1 (Continue with question 2.) No………….2 (Go to question 6.)
2. How many special education prekindergarten classes does your school have?__________ 3. How many children are enrolled in the special education prekindergarten classes at your school?
__________children 4. How many of the special education children reported in question 3 were… (If none, write “0.”)
a. 3 years old as of October 1, 2000?................................__________ b. 4 years old as of October 1, 2000?................................__________ c. 5 years old or more as of October 1, 2000? ................................__________
5. For the LARGEST special education prekindergarten class at your school, what is the number of
students per classroom teacher? (Count only classroom teachers as defined on cover page.) __________ students per teacher
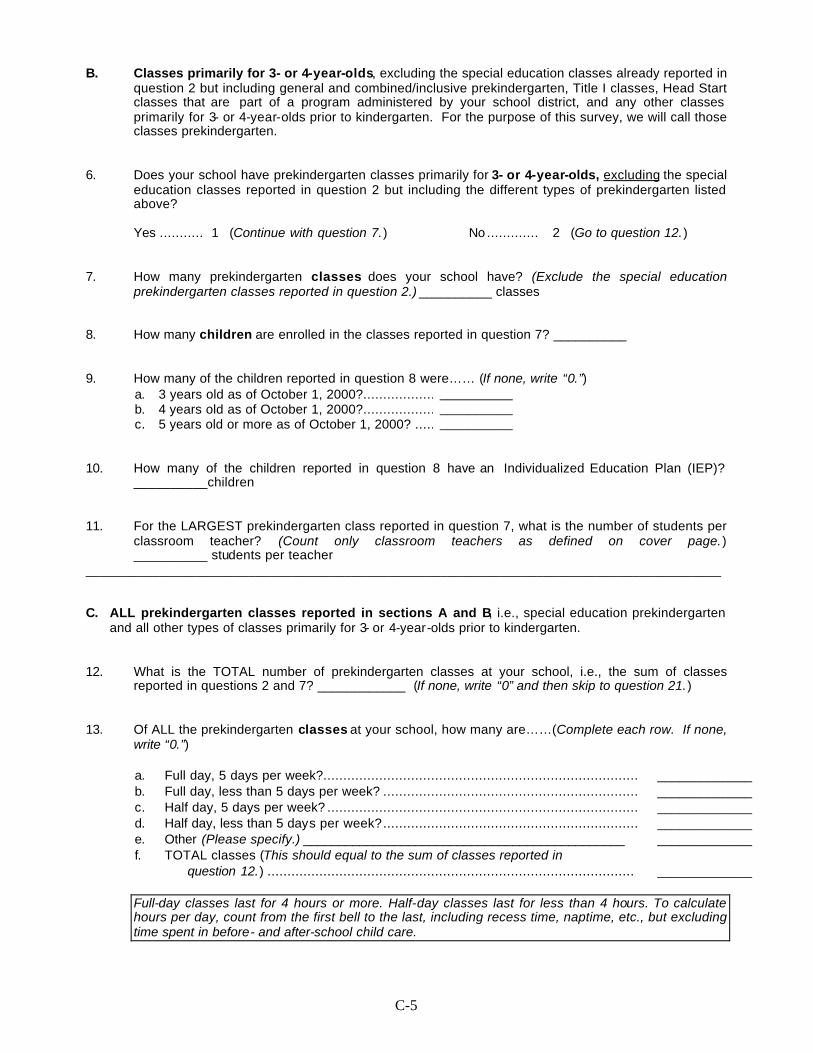
C-5
B. Classes primarily for 3- or 4-year-olds, excluding the special education classes already reported in question 2 but including general and combined/inclusive prekindergarten, Title I classes, Head Start classes that are part of a program administered by your school district, and any other classes primarily for 3- or 4-year-olds prior to kindergarten. For the purpose of this survey, we will call those classes prekindergarten.
6. Does your school have prekindergarten classes primarily for 3- or 4-year-olds, excluding the special
education classes reported in question 2 but including the different types of prekindergarten listed above? Yes ........... 1 (Continue with question 7.) No ............. 2 (Go to question 12.)
7. How many prekindergarten classes does your school have? (Exclude the special education
prekindergarten classes reported in question 2.) __________ classes 8. How many children are enrolled in the classes reported in question 7? __________ 9. How many of the children reported in question 8 were…… (If none, write “0.”)
a. 3 years old as of October 1, 2000?................................__________ b. 4 years old as of October 1, 2000?................................__________ c. 5 years old or more as of October 1, 2000? ................................__________
10. How many of the children reported in question 8 have an Individualized Education Plan (IEP)?
__________children 11. For the LARGEST prekindergarten class reported in question 7, what is the number of students per
classroom teacher? (Count only classroom teachers as defined on cover page.) __________ students per teacher
______________________________________________________________________________________ C. ALL prekindergarten classes reported in sections A and B, i.e., special education prekindergarten
and all other types of classes primarily for 3- or 4-year-olds prior to kindergarten. 12. What is the TOTAL number of prekindergarten classes at your school, i.e., the sum of classes
reported in questions 2 and 7? ____________ (If none, write “0” and then skip to question 21.) 13. Of ALL the prekindergarten classes at your school, how many are……(Complete each row. If none,
write “0.”)
a. Full day, 5 days per week?............................................................................... _____________ b. Full day, less than 5 days per week? ................................................................ _____________ c. Half day, 5 days per week? .............................................................................. _____________ d. Half day, less than 5 days per week?................................................................ _____________ e. Other (Please specify.) ______________________________________________ _____________ f. TOTAL classes (This should equal to the sum of classes reported in
question 12.) ............................................................................................
_____________
Full-day classes last for 4 hours or more. Half-day classes last for less than 4 hours. To calculate hours per day, count from the first bell to the last, including recess time, naptime, etc., but excluding time spent in before- and after-school child care.
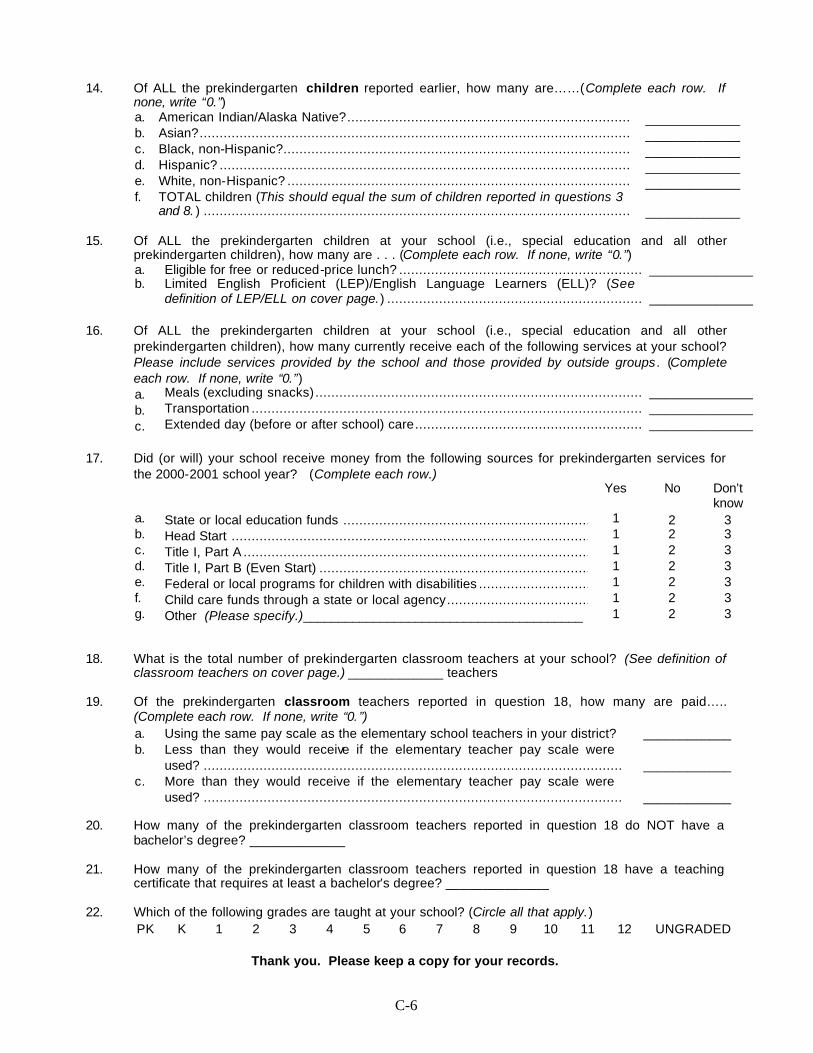
C-6
14. Of ALL the prekindergarten children reported earlier, how many are……(Complete each row. If
none, write “0.”) a. American Indian/Alaska Native?....................................................................... _____________ b. Asian?............................................................................................................ _____________ c. Black, non-Hispanic?....................................................................................... _____________ d. Hispanic? ....................................................................................................... _____________ e. White, non-Hispanic? ...................................................................................... _____________ f. TOTAL children (This should equal the sum of children reported in questions 3
and 8. ) ........................................................................................................... _____________ 15. Of ALL the prekindergarten children at your school (i.e., special education and all other
prekindergarten children), how many are . . . (Complete each row. If none, write “0.”) a. Eligible for free or reduced-price lunch? ................................................................______________ b. Limited English Proficient (LEP)/English Language Learners (ELL)? (See
definition of LEP/ELL on cover page.) ................................................................ ______________
16. Of ALL the prekindergarten children at your school (i.e., special education and all other
prekindergarten children), how many currently receive each of the following services at your school? Please include services provided by the school and those provided by outside groups. (Complete each row. If none, write “0.”) a. Meals (excluding snacks).................................................................................. ______________ b. Transportation .................................................................................................. ______________ c. Extended day (before or after school) care......................................................... ______________
17. Did (or will) your school receive money from the following sources for prekindergarten services for
the 2000-2001 school year? (Complete each row.) Yes No Don’t
know a. State or local education funds .............................................................. 1 2 3 b. Head Start .......................................................................................... 1 2 3 c. Title I, Part A ....................................................................................... 1 2 3 d. Title I, Part B (Even Start) .................................................................... 1 2 3 e. Federal or local programs for children with disabilities ............................ 1 2 3 f. Child care funds through a state or local agency..................................... 1 2 3 g. Other (Please specify.)________________________________________ 1 2 3 18. What is the total number of prekindergarten classroom teachers at your school? (See definition of
classroom teachers on cover page.) _____________ teachers 19. Of the prekindergarten classroom teachers reported in question 18, how many are paid…..
(Complete each row. If none, write “0. ”) a. Using the same pay scale as the elementary school teachers in your district? ____________ b. Less than they would receive if the elementary teacher pay scale were
used? .........................................................................................................
____________ c. More than they would receive if the elementary teacher pay scale were
used? .........................................................................................................
____________ 20. How many of the prekindergarten classroom teachers reported in question 18 do NOT have a
bachelor’s degree? _____________ 21. How many of the prekindergarten classroom teachers reported in question 18 have a teaching
certificate that requires at least a bachelor’s degree? ______________ 22. Which of the following grades are taught at your school? (Circle all that apply.)
PK K 1 2 3 4 5 6 7 8 9 10 11 12 UNGRADED
Thank you. Please keep a copy for your records.


![[XLS] · Web view2001 2 2003 4 2004 1 2006 1 1995 1 1990 1993 1998 1999 1999 1999 1999 2000 2000 2000 2000 2000 2001 2001 2001 2001 2001 2001 2001 2001 2001 2001 2001 2001 2001 2002](https://img.pdfslide.us/doc/110x75/5bdc2d6f09d3f2bc1c8d6ace/xls-web-view2001-2-2003-4-2004-1-2006-1-1995-1-1990-1993-1998-1999-1999-1999.jpg)