Embed Size (px)
Citation preview

SUMMARY OF VITAL STATISTICS 2010THE CITY OF NEW YORK
BUREAU OF VITAL STATISTICS, NEW YORK CITY DEPARTMENT OF HEALTH AND MENTAL HYGIENE 125 WORTH STREET, CN 7, NEW YORK, NEW YORK 10013
PREGNANCY OUTCOMES
1898 1912 1926 1940 1954 1968 1982 1996 2010
Year
10
15
20
25
30
35
40
Bir t
h R a
te p
er 1
, 000
Pop
u lat
ion
Michael R. Bloomberg, Mayor Thomas Farley, MD, MPH, Commissioner
SUMMARY OF VITAL STATISTICS 2010THE CITY OF NEW YORKPREGNANCY OUTCOMES
New York City Department of Health and Mental Hygiene
Division of EpidemiologyCarolyn Greene, MD, Deputy Commissioner
Bureau of Vital StatisticsElizabeth Begier, MD, MPH, Assistant Commissioner
Regina Zimmerman, PhD, MPH, Director, Office of Vital StatisticsSteven Schwartz, PhD, Registrar
Kevin Koshar, MPP, Director, Office of Vital RecordsWenhui Li, PhD, Director, Statistical Analysis and Reporting Unit
Flor Betancourt, MA, CHES, Director, Birth and Death Registration UnitTara Das, PhD, MPH, Director, Office of the Registrar
Ann Madsen, PhD, MPH, Director, Quality Assurance Unit
December 2011
This report was prepared by the Statistical Analysis and Reporting and Quality Improvement Units of the Bureau of Vital Statistics: Melissa Gambatese, MPH, Darlene Kelley, Joseph Kennedy, MPH, Wenhui Li, PhD, Ann Madsen, PhD, MPH, Gil Maduro, PhD, Meredith Rossi, MPH, Maegan Sinclair, MPH, and Ying Sun, PhD. Copy and design were produced by Kelly Davis, MPA. The data are derived from vital event certificates filed with and processed by the staff of the Bureau of Vital Statistics.
This publication is available online at http://www.nyc.gov/vitalstats.

2
Pregnancy OutcOmes cOntents
Page
Live Births Overview 3 Live Births Table PO1. Live Births by Borough of Birth and Institution, New York City, 2010 ............................................................................4 Table PO2. Live Births by Ancestry of Mother and Borough of Residence, New York City, 2010 .....................................................5 Table PO3. Live Births by Mother’s Racial/Ethnic Group and Age, New York City, 2010 .................................................................5 Table PO4. Selected Characteristics of Live Births, Overall and by Age of Mother, New York City, 2010 .........................................6 Table PO5. Selected Characteristics of Live Births by Mother’s Racial/Ethnic Group, New York City, 2010 .....................................7 Table PO6. Live Births by Selected Characteristics and Mother’s Ancestry, New York City, 2010 .....................................................8 Table PO7. Live Births by Selected Characteristics and Community District of Residence, New York City, 2010 ..............................9 Table PO8. Live Births by Mother’s Birthplace and Borough of Residence, New York City, 2010 ...................................................10 Table PO9. Live Births by Mother’s Birthplace and Age, New York City, 2010 ...............................................................................10 Figure PO1. Percent of Live Births Covered by Medicaid, New York City, 2001-2010 .....................................................................11 Figure PO2. Percent of Multiple Live Births by Mother’s Age, New York City, 2001-2010 ...............................................................11 Figure PO3. Live Births by Mother’s Racial/Ethnic Group, New York City, 2001-2010 ....................................................................12 Figure PO4. Percent of Live Births With Specified Characteristics, New York City, 2001-2010 ........................................................12 Map PO1. Percent of Low Birthweight (<2,500 grams) Live Births by Community District of Residence, New York City, 2010 ...................................................................................................................................13 Map PO2. Percent of Live Births to Foreign-born Mothers by Community District of Residence, New York City, 2010 ...................................................................................................................................13 Map PO3. Percent of Live Births to Teenagers (Age<20 Years) by Community District of Residence, New York City, 2008-2010 ...........................................................................................................................14 Map PO4. Percent of Pre-pregnancy Obesity by Community District of Residence, New York City, 2010 ....................................14
teen Pregnancy Table PO10. Live Births, Spontaneous Terminations, Induced Terminations, and Pregnancy Rates to Teenagers (Age 15-19 Years) by Racial/Ethnic Group and Borough of Residence, New York City, 2010 ........................15 Figure PO5. Percent and Rate of Live Births to Teenagers by Borough of Residence, New York City, 2008-2010 ...........................................................................................................................16 Table PO11. Live Births to Teenagers (Age<20 Years), Overall and by Selected Characteristics, New York City, 2006-2010 ....................................................................................................................................................16 Table PO12. Live Births to Teenagers (Age<20 Years) by Selected Characteristics and Community District of Residence, New York City, 2008-2010......................................................................................................17
induced and sPOntaneOus terminatiOns Of Pregnancy Figure PO6. Number of Live Births, Induced Terminations, and Spontaneous Terminations of Pregnancy, New York City, 2001-2010 ...........................................................................................................................18 Figure PO7. Live Births, Induced Terminations, and Spontaneous Terminations of Pregnancy by Age of Woman, New York City, 2010 ....................................................................................................................................18 Table PO13. Live Births, Spontaneous Terminations, and Induced Terminations of Pregnancy, Overall and by Borough of Residence and Age of Woman, New York City, 2010 ......................................................19 Table PO14. Spontaneous Terminations of Pregnancy by Gestational Age and Age of Woman, New York City, 2010 .....................19 Table PO15. Selected Characteristics of Spontaneous Terminations of Pregnancy, ≥ 28 Weeks Gestation, Overall and by Age of Woman, New York City, 2010 ...................................................................................20 Table PO16. Selected Characteristics of Spontaneous Terminations of Pregnancy, ≥ 28 Weeks Gestation, Overall and by Racial/Ethnic Group of Woman, New York City, 2010 ..........................................................20 Table PO17. Live Births, Spontaneous Terminations ≥ 28 Weeks Gestation, and Induced Terminations of Pregnancy, by Borough of Residence and Occurrence, New York City, 2010 ...............................................21 Table PO18. Induced Terminations of Pregnancy by Selected Characteristics and Age of Woman, New York City, 2010 ....................................................................................................................................22 Table PO19. Induced Terminations of Pregnancy by Woman’s Marital Status, Age, and Racial/Ethnic Group, New York City, 2006-2010 ...........................................................................................................................22

3
Pregnancy OutcOmes
All pregnancies are reportable in New York City, whether they result in a live birth or a spontaneous or induced termination. This report is a compilation of the information reported about these events and is prepared to monitor trends in the health of women and their infants in New York City.
Select Key Findings From This Report:
• Overall, 124,791 live births occurred citywide during 2010, down 1.6% from 126,774 in 2009 (Figure PO3).
• The number of live births has remained relatively stable from 2001 to 2010, ranging from a high of 128,961 in 2007 to a low of 122,937 in 2002 (Figure PO3).
• Births to all racial/ethnic groups have declined within the last 10 years, with the exception of Asians and Pacific Islanders and women of multiple races (Figure PO3).
• From 2001 to 2010, the percentage of live births to teenagers decreased 29.8%, from 8.4% to 5.9%. (Figure PO4).
• The number of induced terminations of pregnancy has been declining in the last three years, down 7.8% from 90,870 in 2007 to 83,750 in 2010 (Figure PO6).
Additional birth trend data are available in the New York City Birth and Infant Mortality Trend Report, available online at http://nyc.gov/html/doh/html/ms/ms-bimt.shtml.

4
Table PO1. Live Births by Borough of Birth* and Institution, New York City, 2010
70
Borough and Institution BirthsManhattan
Allen Hospital . . . . . . . . . . . . . . . . . . . . . . . . . . . . . . . . . . . . . . . . . . . . . . . . 2,314Bellevue Hospital Center . . . . . . . . . . . . . . . . . . . . . . . . . . . . . . . . . . . . . . . . 1,888Beth Israel Medical Center . . . . . . . . . . . . . . . . . . . . . . . . . . . . . . . . . . . . . . . 3,940Columbia Presbyterian Medical Center . . . . . . . . . . . . . . . . . . . . . . . . . . . . . . 4,474Harlem Hospital Center . . . . . . . . . . . . . . . . . . . . . . . . . . . . . . . . . . . . . . . . . 1,146Lenox Hill Hospital . . . . . . . . . . . . . . . . . . . . . . . . . . . . . . . . . . . . . . . . . . . . 3,970Metropolitan Hospital Center . . . . . . . . . . . . . . . . . . . . . . . . . . . . . . . . . . . . . 1,447Mount Sinai Hospital . . . . . . . . . . . . . . . . . . . . . . . . . . . . . . . . . . . . . . . . . . . 6,244New York Downtown Hospital . . . . . . . . . . . . . . . . . . . . . . . . . . . . . . . . . . . 2,428New York Weill Cornell Medical Center . . . . . . . . . . . . . . . . . . . . . . . . . . . . 5,868NYU Hospital Center - Tisch Hospital . . . . . . . . . . . . . . . . . . . . . . . . . . . . . . 4,558St. Luke's - Roosevelt Hospital Center / Roosevelt Hospital Division. . . . . . . . 6,475St. Vincent's Hospital Manhattan . . . . . . . . . . . . . . . . . . . . . . . . . . . . . . . . . . 453Places other than a hospital or home**. . . . . . . . . . . . . . . . . . . . . . . . . . . . . . 22Home† . . . . . . . . . . . . . . . . . . . . . . . . . . . . . . . . . . . . . . . . . . . . . . . . . . . . . . 139
BronxBronx Lebanon Hospital Center . . . . . . . . . . . . . . . . . . . . . . . . . . . . . . . . . . . 2,541Jack D. Weiler Hospital of the Albert Einstein College of Medicine . . . . . . . . 4,308Jacobi Medical Center . . . . . . . . . . . . . . . . . . . . . . . . . . . . . . . . . . . . . . . . . . 2,229Lincoln Medical and Mental Health Center . . . . . . . . . . . . . . . . . . . . . . . . . . 2,548Montefiore Medical Center, Henry & Lucy Moses Division . . . . . . . . . . . . . . 4Montefiore Medical Center, North Division. . . . . . . . . . . . . . . . . . . . . . . . . . . 2,567North Central Bronx Hospital . . . . . . . . . . . . . . . . . . . . . . . . . . . . . . . . . . . . . 1,709St. Barnabas Hospital . . . . . . . . . . . . . . . . . . . . . . . . . . . . . . . . . . . . . . . . . . . 1,139Women's Health & Birthing Pavilion . . . . . . . . . . . . . . . . . . . . . . . . . . . . . . . 55Places other than a hospital or home**. . . . . . . . . . . . . . . . . . . . . . . . . . . . . . 21Home† . . . . . . . . . . . . . . . . . . . . . . . . . . . . . . . . . . . . . . . . . . . . . . . . . . . . . . 83
BrooklynBeth Israel, Kings Highway Division. . . . . . . . . . . . . . . . . . . . . . . . . . . . . . . . 2Brookdale University Hospital and Medical Center . . . . . . . . . . . . . . . . . . . . 1,608Brooklyn Birthing Center . . . . . . . . . . . . . . . . . . . . . . . . . . . . . . . . . . . . . . . . 106Brooklyn Hospital Center . . . . . . . . . . . . . . . . . . . . . . . . . . . . . . . . . . . . . . . . 2,330Coney Island Hospital . . . . . . . . . . . . . . . . . . . . . . . . . . . . . . . . . . . . . . . . . . 1,289Kings County Hospital Center . . . . . . . . . . . . . . . . . . . . . . . . . . . . . . . . . . . . . 2,723Kingsbrook Jewish Medical Center. . . . . . . . . . . . . . . . . . . . . . . . . . . . . . . . . 1Long Island College Hospital . . . . . . . . . . . . . . . . . . . . . . . . . . . . . . . . . . . . . 1,641Lutheran Medical Center . . . . . . . . . . . . . . . . . . . . . . . . . . . . . . . . . . . . . . . . 4,163Maimonides Medical Center . . . . . . . . . . . . . . . . . . . . . . . . . . . . . . . . .. . . . . 7,753New York Methodist Hospital . . . . . . . . . . . . . . . . . . . . . . . . . . . . . . . . . . . . 5,243University Hospital of Brooklyn . . . . . . . . . . . . . . . . . . . . . . . . . . . . . . . . . . . 1,585Woodhull Medical and Mental Health Center . . . . . . . . . . . . . . . . . . . . . . . . 2,164Wyckoff Heights Medical Center . . . . . . . . . . . . . . . . . . . . . . . . . . . . . . . . . . 1,498Places other than a hospital or home**. . . . . . . . . . . . . . . . . . . . . . . . . . . . . . 32Home† . . . . . . . . . . . . . . . . . . . . . . . . . . . . . . . . . . . . . . . . . . . . . . . . . . . . . . 375Foundling‡ . . . . . . . . . . . . . . . . . . . . . . . . . . . . . . . . . . . . . . . . . . . . . . . . . . . 1
QueensElmhurst Hospital Center . . . . . . . . . . . . . . . . . . . . . . . . . . . . . . . . . . . . . . . . 3,805Flushing Hospital Medical Center . . . . . . . . . . . . . . . . . . . . . . . . . . . . . . . . . . 2,723Forest Hills Hospital . . . . . . . . . . . . . . . . . . . . . . . . . . . . . . . . . . . . . . . . . . . . 2,284Jamaica Hospital Medical Center . . . . . . . . . . . . . . . . . . . . . . . . . . . . . . . . . . 2,646Long Island Jewish Medical Center . . . . . . . . . . . . . . . . . . . . . . . . . . . . . . . . . 4,870Peninsula Hospital Center. . . . . . . . . . . . . . . . . . . . . . . . . . . . . . . . . . . . . . . . 1New York Hospital Medical Center of Queens . . . . . . . . . . . . . . . . . . . . . . . . 4,102Queens Hospital Center . . . . . . . . . . . . . . . . . . . . . . . . . . . . . . . . . . . . . . . . . 2,080St. John's Episcopal Hospital . . . . . . . . . . . . . . . . . . . . . . . . . . . . . . . . . . . . . . 874Places other than a hospital or home**. . . . . . . . . . . . . . . . . . . . . . . . . . . . . . 28Home† . . . . . . . . . . . . . . . . . . . . . . . . . . . . . . . . . . . . . . . . . . . . . . . . . . . . . . 110
Staten IslandRichmond University Medical Center . . . . . . . . . . . . . . . . . . . . . . . . . . . . . . . 3,101Staten Island University Hospital . . . . . . . . . . . . . . . . . . . . . . . . . . . . . . . . . . 3,064Places other than a hospital or home**. . . . . . . . . . . . . . . . . . . . . . . . . . . . . . 7Home† . . . . . . . . . . . . . . . . . . . . . . . . . . . . . . . . . . . . . . . . . . . . . . . . . . . . . . 12
New York City Total . . . . . . . . . . . . . . . . . . . . . . . . . . . . . . . . . . . . . . . . . . . . . . . . 124,791* Live births are presented by borough of birth beginning 2010; in prior years they were reported by borough of report. ** Places other than a hospital or home include ambulances, taxis, and airplanes.† See Technical Notes: Geographical Units, Place of Birth.‡ Abandoned infant whose record of birth was filed by the Administration for Children's Services.

5
Table PO2. Live Births by Ancestry of Mother and Borough of Residence, New York City, 2010
71
Borough of ResidenceStaten Non- Residence
Ancestry of Mother Total Manhattan Bronx Brooklyn Queens Island Residents Unknown
Total . . . . . . . . . . . . . . . . . . . . . . . . . . . . . . . . . . . . . . . 124,791 19,646 21,258 41,469 26,955 5,580 9,879 4
Hispanic
Colombian . . . . . . . . . . . . . . . . . . . . . . . . . . . . . . . . . . 1,204 93 62 138 778 35 98 –Cuban . . . . . . . . . . . . . . . . . . . . . . . . . . . . . . . . . . . . . 281 66 44 73 50 4 44 –Dominican . . . . . . . . . . . . . . . . . . . . . . . . . . . . . . . . . . 10,960 2,443 4,973 1,555 1,468 98 423 –Ecuadorian . . . . . . . . . . . . . . . . . . . . . . . . . . . . . . . . . . 3,396 193 447 582 2,050 46 78 –Mexican . . . . . . . . . . . . . . . . . . . . . . . . . . . . . . . . . . . . 8,294 912 1,871 2,602 2,353 482 74 –Puerto Rican . . . . . . . . . . . . . . . . . . . . . . . . . . . . . . . . . 9,581 1,175 3,987 2,324 1,205 502 387 1Other Hispanic . . . . . . . . . . . . . . . . . . . . . . . . . . . . . . . 5,629 603 1,250 1,352 1,864 221 339 –
North American and the Caribbean
African American . . . . . . . . . . . . . . . . . . . . . . . . . . . . . 15,721 1,594 3,806 6,706 2,415 526 673 1American . . . . . . . . . . . . . . . . . . . . . . . . . . . . . . . . . . . 9,333 2,120 267 3,577 1,098 946 1,325 –Guyanese . . . . . . . . . . . . . . . . . . . . . . . . . . . . . . . . . . . 1,587 26 141 464 881 6 69 –Haitian . . . . . . . . . . . . . . . . . . . . . . . . . . . . . . . . . . . . . 1,678 55 60 1,045 375 20 123 –Jamaican . . . . . . . . . . . . . . . . . . . . . . . . . . . . . . . . . . . 2,157 59 544 786 610 17 141 –Trinidadian . . . . . . . . . . . . . . . . . . . . . . . . . . . . . . . . . . 923 15 55 427 371 12 43 –Other North American and the Caribbean . . . . . . . . . . 1,839 212 275 892 301 31 128 –
European
English . . . . . . . . . . . . . . . . . . . . . . . . . . . . . . . . . . . . . 1,681 782 48 470 120 11 250 –German . . . . . . . . . . . . . . . . . . . . . . . . . . . . . . . . . . . . 913 322 19 220 105 53 194 –Irish . . . . . . . . . . . . . . . . . . . . . . . . . . . . . . . . . . . . . . . 2,142 581 75 464 339 203 480 –Italian . . . . . . . . . . . . . . . . . . . . . . . . . . . . . . . . . . . . . . 3,631 669 161 778 439 905 679 –Polish . . . . . . . . . . . . . . . . . . . . . . . . . . . . . . . . . . . . . . 1,291 201 15 365 489 101 120 –Russian . . . . . . . . . . . . . . . . . . . . . . . . . . . . . . . . . . . . . 1,744 292 27 811 315 128 171 –Other European . . . . . . . . . . . . . . . . . . . . . . . . . . . . . . 4,354 1,018 289 1,455 790 271 531 –
Asian
Asian Indian . . . . . . . . . . . . . . . . . . . . . . . . . . . . . . . . . 2,096 373 78 201 912 58 474 –Bangladeshi . . . . . . . . . . . . . . . . . . . . . . . . . . . . . . . . . 1,771 49 294 402 983 5 38 –Chinese . . . . . . . . . . . . . . . . . . . . . . . . . . . . . . . . . . . . 8,058 1,425 75 3,515 2,468 136 438 1Filipino . . . . . . . . . . . . . . . . . . . . . . . . . . . . . . . . . . . . . 930 145 51 112 401 56 165 –Korean . . . . . . . . . . . . . . . . . . . . . . . . . . . . . . . . . . . . . 1,171 326 23 121 526 19 156 –Pakistani. . . . . . . . . . . . . . . . . . . . . . . . . . . . . . . . . . . . 1,439 54 82 636 482 72 113 –Other Asian . . . . . . . . . . . . . . . . . . . . . . . . . . . . . . . . . 4,854 913 280 1,659 1,437 194 371 –
Other
Jewish or Hebrew. . . . . . . . . . . . . . . . . . . . . . . . . . . . . 6,732 599 65 5,115 291 94 568 –Other or not stated . . . . . . . . . . . . . . . . . . . . . . . . . . . . 9,401 2,331 1,894 2,622 1,039 328 1,186 1
Note: See Technical Notes: Demographic Characteristics of Vital Events: Race, Ancestry, and Ethnic Group.
Table PO3. Live Births by Mother’s Racial/Ethnic Group and Age, New York City, 2010
71
Age of Mother (Years)
Ethnic Group Total <15 15-17 18-19 20-24 25-29 30-34 35-39 ≥40 Not Stated
Total . . . . . . . . . . . . . . . . . . . . . . . . . . . . . . . 124,791 102 2,193 5,014 23,888 31,826 34,567 20,781 6,419 1
Puerto Rican . . . . . . . . . . . . . . . . . . . . . . . . . 9,581 16 420 890 2,789 2,467 1,839 897 263 –Other Hispanic. . . . . . . . . . . . . . . . . . . . . . . . 29,764 46 929 1,877 7,389 8,117 6,838 3,566 1,002 –Asian and Pacific Islander . . . . . . . . . . . . . . . 18,047 2 35 139 2,105 5,454 5,975 3,460 877 –Non-Hispanic white. . . . . . . . . . . . . . . . . . . . 37,780 2 91 434 4,940 8,156 12,795 8,579 2,783 –Non-Hispanic black. . . . . . . . . . . . . . . . . . . . 26,635 35 687 1,578 6,233 6,917 6,195 3,694 1,296 –Non-Hispanic other. . . . . . . . . . . . . . . . . . . . 320 – 3 11 80 89 79 43 15 –Non-Hispanic of two or more races . . . . . . . . 2,399 – 22 67 289 559 787 505 170 –Not stated* . . . . . . . . . . . . . . . . . . . . . . . . . . 265 1 6 18 63 67 59 37 13 1
* See Technical Notes: Births, Birth Data Quality.

6
72
Age of Mother (Years) Not
Total <15 15-17 18-19 20-24 25-29 30-34 35-39 ≥40 StatedTotal Live Births . . . . . . . . . . . . . . . . . . . . . . . . . . . . . . . . . . 124,791 102 2,193 5,014 23,888 31,826 34,567 20,781 6,419 1Sex
Male . . . . . . . . . . . . . . . . . . . . . . . . . . . . . . . . . . . . . . . . . 64,076 56 1,136 2,570 12,173 16,284 17,780 10,768 3,309 –Female . . . . . . . . . . . . . . . . . . . . . . . . . . . . . . . . . . . . . . . 60,715 46 1,057 2,444 11,715 15,542 16,787 10,013 3,110 1
First Live Birth* Yes. . . . . . . . . . . . . . . . . . . . . . . . . . . . . . . . . . . . . . . . . . . 56,559 100 2,068 4,175 14,151 13,678 13,656 6,686 2,045 –No. . . . . . . . . . . . . . . . . . . . . . . . . . . . . . . . . . . . . . . . . . . 68,121 2 123 833 9,719 18,115 20,887 14,074 4,368 –Unknown. . . . . . . . . . . . . . . . . . . . . . . . . . . . . . . . . . . . . . 111 – 2 6 18 33 24 21 6 1
Pre-pregnancy Body Mass Index (BMI)Underweight (BMI<18.5) . . . . . . . . . . . . . . . . . . . . . . . . . 6,542 10 160 323 1,519 1,790 1,665 892 183 –Normal weight (18.5≤BMI<25). . . . . . . . . . . . . . . . . . . . 66,186 61 1,173 2,602 12,075 16,400 19,008 11,471 3,396 –Overweight (25≤BMI<30). . . . . . . . . . . . . . . . . . . . . . . . 29,034 19 515 1,170 5,621 7,550 7,813 4,757 1,589 –Obese (BMI≥30). . . . . . . . . . . . . . . . . . . . . . . . . . . . . . . . 20,738 10 283 785 4,139 5,513 5,558 3,308 1,142 –Unknown. . . . . . . . . . . . . . . . . . . . . . . . . . . . . . . . . . . . . . 2,291 2 62 134 534 573 523 353 109 1
Birthweight at Delivery (Grams) <1500 . . . . . . . . . . . . . . . . . . . . . . . . . . . . . . . . . . . . . . . 2,014 2 40 82 361 430 579 364 156 –1500-2499 . . . . . . . . . . . . . . . . . . . . . . . . . . . . . . . . . . . . 8,923 11 189 372 1,661 2,040 2,365 1,634 651 –2500-3999 . . . . . . . . . . . . . . . . . . . . . . . . . . . . . . . . . . . . 106,057 87 1,890 4,374 20,693 27,366 29,239 17,257 5,151 –≥4000 . . . . . . . . . . . . . . . . . . . . . . . . . . . . . . . . . . . . . . . 7,795 2 74 186 1,173 1,989 2,384 1,526 461 –Not stated . . . . . . . . . . . . . . . . . . . . . . . . . . . . . . . . . . . . . 2 – – – – 1 – – – 1
Gestational Age (Weeks)† <32 . . . . . . . . . . . . . . . . . . . . . . . . . . . . . . . . . . . . . . . . . 2,144 1 49 91 407 441 631 375 149 –32-36 . . . . . . . . . . . . . . . . . . . . . . . . . . . . . . . . . . . . . . . . 9,807 12 181 368 1,688 2,242 2,658 1,881 777 –≥37 . . . . . . . . . . . . . . . . . . . . . . . . . . . . . . . . . . . . . . . . . 112,791 89 1,962 4,551 21,782 29,126 31,269 18,519 5,493 –Unknown . . . . . . . . . . . . . . . . . . . . . . . . . . . . . . . . . . . . . 49 – 1 4 11 17 9 6 – 1
PluralitySingle . . . . . . . . . . . . . . . . . . . . . . . . . . . . . . . . . . . . . . . . 119,822 100 2,169 4,909 23,284 30,773 33,075 19,611 5,901 –Twin . . . . . . . . . . . . . . . . . . . . . . . . . . . . . . . . . . . . . . . . . 4,754 2 21 99 589 1,012 1,424 1,116 491 –Triplet . . . . . . . . . . . . . . . . . . . . . . . . . . . . . . . . . . . . . . . . 190 – 3 6 15 33 56 50 27 –Quadruplet . . . . . . . . . . . . . . . . . . . . . . . . . . . . . . . . . . . . 22 – – – – 7 11 4 – –Sextuplet . . . . . . . . . . . . . . . . . . . . . . . . . . . . . . . . . . . . . . 1 – – – – – 1 – – –Unknown/not stated . . . . . . . . . . . . . . . . . . . . . . . . . . . . . 2 – – – – 1 – – – 1
Apgar Score at 5 Minutes≤6 . . . . . . . . . . . . . . . . . . . . . . . . . . . . . . . . . . . . . . . . . . 995 1 25 64 198 210 274 163 60 –7 . . . . . . . . . . . . . . . . . . . . . . . . . . . . . . . . . . . . . . . . . . . 943 2 18 50 191 210 254 153 65 –8 . . . . . . . . . . . . . . . . . . . . . . . . . . . . . . . . . . . . . . . . . . . 4,942 2 116 211 1,029 1,139 1,271 825 349 –9 . . . . . . . . . . . . . . . . . . . . . . . . . . . . . . . . . . . . . . . . . . . 114,938 94 1,972 4,566 21,867 29,484 31,992 19,150 5,813 –10 . . . . . . . . . . . . . . . . . . . . . . . . . . . . . . . . . . . . . . . . . . 2,677 3 56 114 538 697 702 449 118 –Not stated . . . . . . . . . . . . . . . . . . . . . . . . . . . . . . . . . . . . . 296 – 6 9 65 86 74 41 14 1
Method of DeliveryVaginal . . . . . . . . . . . . . . . . . . . . . . . . . . . . . . . . . . . . . . . 81,368 86 1,748 3,869 17,545 21,626 21,755 11,787 2,952 –Vaginal after any prior C-section . . . . . . . . . . . . . . . . . . . . 2,046 – 6 24 299 569 605 407 136 –Primary C-section . . . . . . . . . . . . . . . . . . . . . . . . . . . . . . . 26,066 16 416 975 4,401 6,046 7,299 4,874 2,039 –Repeat C-section . . . . . . . . . . . . . . . . . . . . . . . . . . . . . . . . 14,918 – 15 132 1,568 3,472 4,815 3,643 1,273 –Unknown . . . . . . . . . . . . . . . . . . . . . . . . . . . . . . . . . . . . . 393 – 8 14 75 113 93 70 19 1
Place of Birth Home . . . . . . . . . . . . . . . . . . . . . . . . . . . . . . . . . . . . . . . . 719 – 5 9 79 180 240 146 60 –Voluntary hospital . . . . . . . . . . . . . . . . . . . . . . . . . . . . . . . 100,757 62 1,493 3,391 17,572 25,311 29,357 18,053 5,518 –Municipal hospital . . . . . . . . . . . . . . . . . . . . . . . . . . . . . . . 23,025 40 692 1,605 6,178 6,250 4,883 2,541 836 –Birthing center . . . . . . . . . . . . . . . . . . . . . . . . . . . . . . . . . . 176 – 1 7 33 46 56 30 3 –Other . . . . . . . . . . . . . . . . . . . . . . . . . . . . . . . . . . . . . . . . 114 – 2 2 26 39 31 11 2 1
Attendant Physician . . . . . . . . . . . . . . . . . . . . . . . . . . . . . . . . . . . . . . 112,835 82 1,858 4,212 20,725 28,546 31,920 19,459 6,033 –Certified nurse midwife . . . . . . . . . . . . . . . . . . . . . . . . . . . 11,493 20 325 783 3,058 3,150 2,525 1,268 364 –Other . . . . . . . . . . . . . . . . . . . . . . . . . . . . . . . . . . . . . . . . 463 – 10 19 105 130 122 54 22 1
Primary Payer for this Birth‡ Medicaid/Family Plus/Child Health Plus B/Other govt.. . . . 74,537 89 1,896 4,473 20,458 21,651 15,612 8,014 2,344 –Private . . . . . . . . . . . . . . . . . . . . . . . . . . . . . . . . . . . . . . . . 46,715 6 169 311 2,628 9,278 18,112 12,294 3,917 –Self-pay . . . . . . . . . . . . . . . . . . . . . . . . . . . . . . . . . . . . . . . 1,868 3 74 131 480 476 400 230 74 –Other. . . . . . . . . . . . . . . . . . . . . . . . . . . . . . . . . . . . . . . . . 857 2 25 39 142 245 236 126 42 –Not stated . . . . . . . . . . . . . . . . . . . . . . . . . . . . . . . . . . . . . 814 2 29 60 180 176 207 117 42 1
First Visit for Prenatal Care First trimester (1-3 months) . . . . . . . . . . . . . . . . . . . . . . . . 85,578 33 932 2,568 14,443 21,657 25,632 15,606 4,707 –Second trimester (4-6 months) . . . . . . . . . . . . . . . . . . . . . . 26,767 40 797 1,554 6,334 6,999 6,196 3,638 1,209 –Late (7-9 months) . . . . . . . . . . . . . . . . . . . . . . . . . . . . . . . . 7,948 19 307 590 1,976 2,080 1,733 950 293 –No care . . . . . . . . . . . . . . . . . . . . . . . . . . . . . . . . . . . . . . . 823 1 39 73 214 204 151 100 41 –Not stated . . . . . . . . . . . . . . . . . . . . . . . . . . . . . . . . . . . . . 3,675 9 118 229 921 886 855 487 169 1
Marital Status of Mother§ Not married . . . . . . . . . . . . . . . . . . . . . . . . . . . . . . . . . . . . 54,628 102 2,125 4,413 15,598 14,647 10,423 5,462 1,857 1Married . . . . . . . . . . . . . . . . . . . . . . . . . . . . . . . . . . . . . . . 70,163 – 68 601 8,290 17,179 24,144 15,319 4,562 –
Education Level 11th grade or less/12th grade no diploma . . . . . . . . . . . . . 29,726 102 1,963 2,577 7,729 7,839 5,574 3,008 934 –High school graduate or GED . . . . . . . . . . . . . . . . . . . . . . 27,950 – 210 1,757 8,061 7,658 5,899 3,293 1,072 –Some college/associate degree . . . . . . . . . . . . . . . . . . . . . 26,610 – 7 644 6,391 7,945 6,726 3,740 1,157 –Bachelor's degree. . . . . . . . . . . . . . . . . . . . . . . . . . . . . . . . 22,221 – – 12 1,288 5,433 8,558 5,341 1,589 –Master's degree or higher . . . . . . . . . . . . . . . . . . . . . . . . . 17,770 – – – 300 2,821 7,691 5,316 1,642 –Not stated . . . . . . . . . . . . . . . . . . . . . . . . . . . . . . . . . . . . . 514 – 13 24 119 130 119 83 25 1
Birthplace of MotherUnited States, including its territories . . . . . . . . . . . . . . . . 61,410 75 1,628 3,472 13,478 13,860 16,114 9,757 3,025 1Foreign . . . . . . . . . . . . . . . . . . . . . . . . . . . . . . . . . . . . . . . 63,347 27 565 1,538 10,397 17,959 18,448 11,020 3,393 –Not stated . . . . . . . . . . . . . . . . . . . . . . . . . . . . . . . . . . . . . 34 – – 4 13 7 5 4 1 –
* See Technical Notes: Births, Birth Data Quality.† See Technical Notes: Gestational Age.‡ See Technical Notes: Births, Birth Reporting.§ See Technical Notes: Mother's Marital Status.
Table PO4. Selected Characteristics of Live Births, Overall and by Age of Mother, New York City, 2010

7
Table PO5. Selected Characteristics of Live Births by Mother’s Racial/Ethnic Group, New York City, 2010
73
Racial/Ethnic Group of Mother* Non-Hispanic,
Puerto Other Non-Hispanic Non-Hispanic Two or NotTotal Rican Hispanic Asian White Black Other More Races Stated
Total Live Births . . . . . . . . . . . . . . . . . . . . . . . . . . . . . . . . . . . . . 124,791 9,581 29,764 18,047 37,780 26,635 320 2,399 265Sex Male . . . . . . . . . . . . . . . . . . . . . . . . . . . . . . . . . . . . . . . . . . . . 64,076 4,912 15,103 9,387 19,478 13,658 153 1,240 145 Female . . . . . . . . . . . . . . . . . . . . . . . . . . . . . . . . . . . . . . . . . . 60,715 4,669 14,661 8,660 18,302 12,977 167 1,159 120First Live Birth† Yes . . . . . . . . . . . . . . . . . . . . . . . . . . . . . . . . . . . . . . . . . . . . . 56,559 4,255 12,487 9,090 17,581 11,632 144 1,271 99 No . . . . . . . . . . . . . . . . . . . . . . . . . . . . . . . . . . . . . . . . . . . . . 68,121 5,320 17,253 8,947 20,185 14,958 176 1,124 158 Unknown . . . . . . . . . . . . . . . . . . . . . . . . . . . . . . . . . . . . . . . . 111 6 24 10 14 45 – 4 8Pre-pregnancy Body Mass Index (BMI) Underweight (BMI<18.5) . . . . . . . . . . . . . . . . . . . . . . . . . . . . 6,542 336 859 2,085 2,219 869 26 140 8 Normal weight (18.5≤BMI<25) . . . . . . . . . . . . . . . . . . . . . . 66,186 3,783 14,021 12,096 24,777 9,860 145 1,431 73 Overweight (25≤BMI<30). . . . . . . . . . . . . . . . . . . . . . . . . . . 29,034 2,618 8,682 2,786 6,721 7,631 78 478 40 Obese (BMI≥30). . . . . . . . . . . . . . . . . . . . . . . . . . . . . . . . . . . 20,738 2,736 5,438 916 3,567 7,665 67 320 29 Unknown. . . . . . . . . . . . . . . . . . . . . . . . . . . . . . . . . . . . . . . . . 2,291 108 764 164 496 610 4 30 115Birthweight at Delivery (grams) <1500 . . . . . . . . . . . . . . . . . . . . . . . . . . . . . . . . . . . . . . . . . . 2,014 185 345 217 381 826 10 39 11 1500-2499 . . . . . . . . . . . . . . . . . . . . . . . . . . . . . . . . . . . . . . . 8,923 799 1,752 1,318 2,223 2,566 36 209 20 2500-3999 . . . . . . . . . . . . . . . . . . . . . . . . . . . . . . . . . . . . . . . 106,057 8,038 25,637 15,802 32,246 21,873 267 1,977 217 ≥4000 . . . . . . . . . . . . . . . . . . . . . . . . . . . . . . . . . . . . . . . . . . 7,795 559 2,030 710 2,930 1,370 7 174 15 Not stated . . . . . . . . . . . . . . . . . . . . . . . . . . . . . . . . . . . . . . . . 2 – – – – – – – 2Gestational Age (weeks)‡ <32 . . . . . . . . . . . . . . . . . . . . . . . . . . . . . . . . . . . . . . . . . . . . 2,144 223 392 215 418 842 11 34 9 32-36 . . . . . . . . . . . . . . . . . . . . . . . . . . . . . . . . . . . . . . . . . . . 9,807 925 2,150 1,272 2,471 2,717 49 201 22 ≥37 . . . . . . . . . . . . . . . . . . . . . . . . . . . . . . . . . . . . . . . . . . . . 112,791 8,429 27,205 16,556 34,886 23,064 260 2,163 228 Unknown . . . . . . . . . . . . . . . . . . . . . . . . . . . . . . . . . . . . . . . . 49 4 17 4 5 12 – 1 6Plurality Single . . . . . . . . . . . . . . . . . . . . . . . . . . . . . . . . . . . . . . . . . . . 119,822 9,181 29,014 17,507 35,696 25,613 303 2,256 252 Twin . . . . . . . . . . . . . . . . . . . . . . . . . . . . . . . . . . . . . . . . . . . . 4,754 382 730 511 1,988 975 17 140 11 Triplet . . . . . . . . . . . . . . . . . . . . . . . . . . . . . . . . . . . . . . . . . . . 190 18 20 29 81 39 – 3 – Quadruplet . . . . . . . . . . . . . . . . . . . . . . . . . . . . . . . . . . . . . . . 22 – – – 14 8 – – – Sextuplet . . . . . . . . . . . . . . . . . . . . . . . . . . . . . . . . . . . . . . . . . 1 – – – 1 – – – – Unknown/not stated. . . . . . . . . . . . . . . . . . . . . . . . . . . . . . . . . 2 – – – – – – – 2Apgar Score at 5 Minutes ≤6 . . . . . . . . . . . . . . . . . . . . . . . . . . . . . . . . . . . . . . . . . . . . . 995 92 188 110 200 373 4 23 5 7 . . . . . . . . . . . . . . . . . . . . . . . . . . . . . . . . . . . . . . . . . . . . . . . 943 87 164 95 233 335 5 23 1 8 . . . . . . . . . . . . . . . . . . . . . . . . . . . . . . . . . . . . . . . . . . . . . . . 4,942 470 1,037 503 1,233 1,567 17 107 8 9 . . . . . . . . . . . . . . . . . . . . . . . . . . . . . . . . . . . . . . . . . . . . . . . 114,938 8,661 27,585 16,875 35,343 23,759 284 2,194 237 10 . . . . . . . . . . . . . . . . . . . . . . . . . . . . . . . . . . . . . . . . . . . . . . 2,677 246 719 447 722 478 9 47 9 Not stated . . . . . . . . . . . . . . . . . . . . . . . . . . . . . . . . . . . . . . . . 296 25 71 17 49 123 1 5 5Method of Delivery Vaginal . . . . . . . . . . . . . . . . . . . . . . . . . . . . . . . . . . . . . . . . . . . 81,368 6,179 19,655 11,731 25,679 16,195 200 1,564 165 Vaginal after any prior C-section . . . . . . . . . . . . . . . . . . . . . . . 2,046 121 466 275 748 399 2 31 4 Primary C-section . . . . . . . . . . . . . . . . . . . . . . . . . . . . . . . . . . . 26,066 2,066 5,530 3,825 7,556 6,412 67 551 59 Repeat C-section . . . . . . . . . . . . . . . . . . . . . . . . . . . . . . . . . . . 14,918 1,182 4,023 2,093 3,741 3,551 48 249 31 Unknown . . . . . . . . . . . . . . . . . . . . . . . . . . . . . . . . . . . . . . . . . 393 33 90 123 56 78 3 4 6Place of Birth Home . . . . . . . . . . . . . . . . . . . . . . . . . . . . . . . . . . . . . . . . . . . 719 38 78 36 376 156 2 29 4 Voluntary hospital . . . . . . . . . . . . . . . . . . . . . . . . . . . . . . . . . . 100,757 7,515 20,260 15,467 36,100 18,905 282 1,998 230 Municipal hospital . . . . . . . . . . . . . . . . . . . . . . . . . . . . . . . . . 23,025 1,998 9,359 2,533 1,210 7,500 36 362 27 Birthing center . . . . . . . . . . . . . . . . . . . . . . . . . . . . . . . . . . . . 176 21 36 4 66 39 – 8 2 Other . . . . . . . . . . . . . . . . . . . . . . . . . . . . . . . . . . . . . . . . . . . 114 9 31 7 28 35 – 2 2Attendant Physician . . . . . . . . . . . . . . . . . . . . . . . . . . . . . . . . . . . . . . . . 112,835 8,511 26,102 17,188 34,599 23,839 299 2,063 234 Certified nurse midwife . . . . . . . . . . . . . . . . . . . . . . . . . . . . . . 11,493 1,022 3,547 828 3,098 2,627 20 326 25 Other . . . . . . . . . . . . . . . . . . . . . . . . . . . . . . . . . . . . . . . . . . . 463 48 115 31 83 169 1 10 6Primary Payer for this Birth§ Medicaid/Family Plus/Child Health Plus B/Other govt. . . . . . . 74,537 6,828 24,008 10,835 12,766 18,806 176 942 176 Private . . . . . . . . . . . . . . . . . . . . . . . . . . . . . . . . . . . . . . . . . . . 46,715 2,449 4,887 6,934 24,422 6,423 133 1,405 62 Self-pay . . . . . . . . . . . . . . . . . . . . . . . . . . . . . . . . . . . . . . . . . . 1,868 182 456 140 280 756 7 31 16 Other . . . . . . . . . . . . . . . . . . . . . . . . . . . . . . . . . . . . . . . . . . . 857 75 168 77 176 353 1 7 – Not stated . . . . . . . . . . . . . . . . . . . . . . . . . . . . . . . . . . . . . . . . 814 47 245 61 136 297 3 14 11First Visit for Prenatal Care First trimester (1-3 months) . . . . . . . . . . . . . . . . . . . . . . . . . . . 85,578 6,129 19,135 12,709 29,601 15,801 190 1,887 126 Second trimester (4-6 months) . . . . . . . . . . . . . . . . . . . . . . . . . 26,767 2,334 7,370 3,970 6,084 6,546 97 307 59 Late (7-9 months) . . . . . . . . . . . . . . . . . . . . . . . . . . . . . . . . . . 7,948 642 2,118 957 1,270 2,787 17 125 32 No care . . . . . . . . . . . . . . . . . . . . . . . . . . . . . . . . . . . . . . . . . . 823 62 236 74 131 297 1 17 5 Not stated . . . . . . . . . . . . . . . . . . . . . . . . . . . . . . . . . . . . . . . . 3,675 414 905 337 694 1,204 15 63 43Marital Status of Mother|| Not married . . . . . . . . . . . . . . . . . . . . . . . . . . . . . . . . . . . . . . 54,628 7,298 19,954 3,313 4,535 18,565 126 663 174 Married . . . . . . . . . . . . . . . . . . . . . . . . . . . . . . . . . . . . . . . . . . 70,163 2,283 9,810 14,734 33,245 8,070 194 1,736 91Education Level 11th grade or less/12th grade, no diploma . . . . . . . . . . . . . . . 29,726 3,280 12,334 4,477 3,078 6,213 52 227 65 High school graduate or GED . . . . . . . . . . . . . . . . . . . . . . . . . 27,950 2,473 7,221 3,303 7,247 7,201 101 371 33 Some college/associate degree . . . . . . . . . . . . . . . . . . . . . . . . 26,610 2,720 6,419 2,717 5,931 8,211 92 488 32 Bachelor's degree . . . . . . . . . . . . . . . . . . . . . . . . . . . . . . . . . . 22,221 709 2,509 4,386 10,639 3,242 47 672 17 Master's degree or higher . . . . . . . . . . . . . . . . . . . . . . . . . . . . 17,770 387 1,182 3,146 10,788 1,583 27 634 23 Not stated . . . . . . . . . . . . . . . . . . . . . . . . . . . . . . . . . . . . . . . . 514 12 99 18 97 185 1 7 95Birthplace of Mother United States, including its territories . . . . . . . . . . . . . . . . . . . 61,410 9,522 7,078 1,713 26,184 15,133 107 1,493 180 Foreign . . . . . . . . . . . . . . . . . . . . . . . . . . . . . . . . . . . . . . . . . . 63,347 56 22,682 16,333 11,587 11,494 213 906 76 Not stated . . . . . . . . . . . . . . . . . . . . . . . . . . . . . . . . . . . . . . . . 34 3 4 1 9 8 – – 9
* See Technical Notes: Demographic Characteristics of Vital Events, Birthplace. † See Technical Notes: Births, Birth Data Quality.‡ See Technical Notes: Births, Gestational Age.§ See Technical Notes: Births, Birth Reporting.|| See Technical Notes: Mother's Marital Status.

8
Table PO6. Live Births by Selected Characteristics and Mother’s Ancestry, New York City, 2010
74
Percent of Total Live Births with Specified CharacteristicsForeign- First Low Birth Preterm Late or No Mother Pre- Teenage
Live born* Live Weight Birth† Prenatal Not On pregnancy MotherAncestry of Mother Births Mother Birth (<2,500 Grams) (<37 Weeks) Care Married Medicaid‡ Obesity§ (<20 Years)Total. . . . . . . . . . . . . . . . . . . . . . . . . . . . . . . . 124,791 50.8 45.4 8.8 9.6 7.2 43.8 60.1 16.9 5.9
HispanicColombian. . . . . . . . . . . . . . . . . . . . . . . . . . . 1,204 70.2 54.4 6.3 8.0 6.1 49.5 58.7 14.1 6.6Cuban. . . . . . . . . . . . . . . . . . . . . . . . . . . . . . . 281 17.8 52.7 8.2 11.7 4.4 43.1 38.1 21.9 4.3Dominican. . . . . . . . . . . . . . . . . . . . . . . . . . . 10,960 70.5 48.4 7.8 8.7 8.6 68.0 79.3 19.2 10.4Ecuadorian. . . . . . . . . . . . . . . . . . . . . . . . . . . 3,396 84.8 36.5 5.1 7.3 9.4 58.0 84.7 15.3 7.5Mexican. . . . . . . . . . . . . . . . . . . . . . . . . . . . . 8,294 88.8 33.5 6.1 7.8 8.0 76.4 93.2 18.9 11.2Puerto Rican. . . . . . . . . . . . . . . . . . . . . . . . . . 9,581 0.6 44.4 10.3 12.0 7.7 76.2 71.6 28.9 13.8Other Hispanic. . . . . . . . . . . . . . . . . . . . . . . . 5,629 67.8 42.1 8.4 10.1 7.4 61.9 72.8 20.6 7.7
North America and the CaribbeanAfrican American. . . . . . . . . . . . . . . . . . . . . . 15,721 15.2 45.6 13.4 13.9 9.8 78.4 71.6 31.6 11.9American. . . . . . . . . . . . . . . . . . . . . . . . . . . . 9,333 5.9 49.0 7.4 8.1 3.3 18.3 29.5 11.5 2.5Guyanese. . . . . . . . . . . . . . . . . . . . . . . . . . . . 1,587 93.1 40.4 14.4 13.4 6.4 44.3 62.4 18.6 3.9Haitian. . . . . . . . . . . . . . . . . . . . . . . . . . . . . . 1,678 82.7 45.0 12.2 14.7 15.1 46.7 68.2 25.2 2.3Jamaican. . . . . . . . . . . . . . . . . . . . . . . . . . . . . 2,157 93.2 41.6 12.3 14.2 14.3 65.4 66.2 28.2 4.5Trinidadian. . . . . . . . . . . . . . . . . . . . . . . . . . . 923 93.6 42.0 14.1 13.0 12.1 54.9 70.3 21.7 4.8Other North America and the Caribbean. . . . . 1,839 85.9 48.8 9.8 11.0 14.3 50.5 55.5 24.0 3.0
EuropeanEnglish. . . . . . . . . . . . . . . . . . . . . . . . . . . . . . 1,681 27.6 62.4 6.6 7.1 2.3 10.2 6.0 4.1 0.1German. . . . . . . . . . . . . . . . . . . . . . . . . . . . . 913 21.0 59.8 7.6 8.1 1.6 10.7 9.0 6.7 0.7Irish. . . . . . . . . . . . . . . . . . . . . . . . . . . . . . . . 2,142 10.9 57.4 7.0 8.0 2.6 14.8 12.0 9.1 0.7Italian. . . . . . . . . . . . . . . . . . . . . . . . . . . . . . . 3,631 7.0 52.6 8.2 10.1 2.7 16.6 14.5 15.7 1.3Polish. . . . . . . . . . . . . . . . . . . . . . . . . . . . . . . 1,291 68.6 53.7 7.8 7.8 2.7 17.3 38.4 7.3 0.6Russian. . . . . . . . . . . . . . . . . . . . . . . . . . . . . . 1,744 80.3 52.3 7.5 7.7 4.3 20.9 37.6 6.4 0.7Other European. . . . . . . . . . . . . . . . . . . . . . . 4,354 63.6 52.3 6.4 7.3 4.6 15.1 33.4 8.1 1.0
AsianAsian Indian. . . . . . . . . . . . . . . . . . . . . . . . . . 2,096 83.9 55.4 11.7 9.0 5.3 9.6 34.5 7.4 0.6Bangladeshi. . . . . . . . . . . . . . . . . . . . . . . . . . 1,771 98.3 37.8 13.4 10.2 9.6 9.0 83.6 10.3 1.2Chinese. . . . . . . . . . . . . . . . . . . . . . . . . . . . . 8,058 91.8 51.3 6.0 6.8 3.6 24.7 69.7 1.6 0.6Filipino. . . . . . . . . . . . . . . . . . . . . . . . . . . . . . 930 77.4 55.8 12.2 11.8 6.0 21.3 24.0 6.8 1.9Korean. . . . . . . . . . . . . . . . . . . . . . . . . . . . . . 1,171 84.1 62.8 5.6 6.1 4.2 10.8 36.2 2.2 0.2Pakistani. . . . . . . . . . . . . . . . . . . . . . . . . . . . . 1,439 94.5 40.5 9.8 10.6 10.9 5.6 80.1 13.1 1.8Other Asian. . . . . . . . . . . . . . . . . . . . . . . . . . 4,854 88.1 45.8 7.4 7.3 9.0 13.8 54.2 7.5 2.8
OtherJewish or Hebrew. . . . . . . . . . . . . . . . . . . . . . 6,732 16.4 29.6 5.9 5.8 2.1 3.7 61.3 9.5 1.5Other or Not Stated. . . . . . . . . . . . . . . . . . . . . 9,401 51.3 41.6 9.3 10.2 11.5 30.9 51.0 17.0 2.4Note: See Technical Notes: Demographic Characteristics of Vital Events: Race, Ancestry, and Ethnic Group.* Beginning in 2006, US Virgin Islands and Guam are not included in the Foreign-born Mother category.† Clinical gestational age <37 completed weeks. ‡ Due to revision of the birth certificate, since 2008 "On Medicaid" also includes Family Health Plus, Other government, and Child Health Plus B. § See Technical Notes: Births, Birth Data Quality.

9
75
Percent of Total Live Births With Specified Characteristics
Foreign- First Low Preterm Late or No Pre- Live Hispanic Born Live Birthweight Birth ‡ Prenatal On pregnancy
Community District of Residence Births Rate* Mother Mother † Birth (<2,500 Grams) (<37 Weeks) Care Medicaid§ ObesityNEW YORK CITY . . . . . . . . . . . . . . . . 124,791 15.3 35.0 50.8 45.4 8.8 9.6 7.2 60.1 16.9MANHATTAN . . . . . . . . . . . . . . . . . . . 19,502 12.3 31.6 42.9 57.6 8.7 9.1 5.3 38.1 11.1Battery Park, Tribeca (01). . . . . . . . . . . 1,086 17.8 8.8 41.3 62.4 8.5 8.1 2.7 5.8 2.4Greenwich Village, SOHO (02). . . . . . 814 9.0 6.3 41.5 64.3 6.0 5.8 3.1 14.1 1.5Lower East Side (03). . . . . . . . . . . . . . . 1,807 11.1 24.5 56.8 52.2 6.5 7.6 4.7 68.6 11.2Chelsea, Clinton (04). . . . . . . . . . . . . . 921 8.9 17.2 39.6 66.1 8.9 9.7 5.3 23.7 6.2Midtown Business District (05). . . . . . . 569 11.0 8.2 44.8 68.5 8.4 8.6 3.0 9.0 3.6Murray Hill (06). . . . . . . . . . . . . . . . . . 1,268 8.9 8.9 37.4 67.1 8.0 7.3 3.7 6.2 3.4Upper West Side (07). . . . . . . . . . . . . . 2,833 13.5 15.9 32.6 59.7 8.3 8.4 3.2 13.3 5.2Upper East Side (08). . . . . . . . . . . . . . . 2,759 12.5 7.6 32.9 63.0 9.2 9.2 3.3 7.1 3.5Manhattanville (09). . . . . . . . . . . . . . . . 1,369 12.4 56.2 53.8 53.1 8.7 9.1 6.6 65.9 19.8Central Harlem (10). . . . . . . . . . . . . . . 1,716 14.8 25.4 37.8 48.1 11.4 11.6 11.2 65.6 24.8East Harlem (11). . . . . . . . . . . . . . . . . . 1,708 14.2 59.3 38.9 45.6 10.7 12.5 8.2 71.6 26.0Washington Heights (12). . . . . . . . . . . 2,652 14.0 81.8 59.4 55.4 8.1 8.8 6.5 69.8 16.3BRONX . . . . . . . . . . . . . . . . . . . . . . . . 21,402 15.5 60.8 50.2 43.4 9.8 10.2 11.4 78.5 24.9Mott Haven (01). . . . . . . . . . . . . . . . . . 1,716 18.8 72.0 43.5 40.1 9.7 10.1 9.9 87.1 26.5Hunts Point (02). . . . . . . . . . . . . . . . . . 962 18.4 72.1 44.6 40.2 10.0 9.7 13.2 83.7 27.5Morrisania (03). . . . . . . . . . . . . . . . . . . 1,476 18.5 56.2 40.3 41.8 9.6 9.8 12.5 84.7 27.8Concourse, Highbridge (04). . . . . . . . . 2,774 18.9 64.6 61.2 41.9 9.8 10.2 11.1 82.7 27.0University/Morris Heights (05). . . . . . . 2,430 19.0 68.5 56.3 43.8 9.8 10.8 11.2 82.8 24.3East Tremont (06). . . . . . . . . . . . . . . . . 1,427 17.1 67.6 38.5 38.4 10.4 10.4 11.7 85.9 26.5Fordham (07). . . . . . . . . . . . . . . . . . . . 2,372 17.0 70.2 58.6 42.0 9.1 10.8 8.8 80.4 24.3Riverdale (08). . . . . . . . . . . . . . . . . . . . 1,247 12.3 64.8 49.5 48.0 8.1 8.2 6.6 54.5 16.1Unionport, Soundview (09). . . . . . . . . 2,623 15.2 60.0 45.7 44.0 9.8 10.1 12.2 77.0 24.7Throgs Neck (10). . . . . . . . . . . . . . . . . 1,006 8.4 51.8 37.3 48.6 10.4 11.3 10.3 60.8 23.3Pelham Parkway (11). . . . . . . . . . . . . . 1,343 11.9 52.5 52.8 47.4 8.3 10.0 11.3 70.2 19.7Williamsbridge (12). . . . . . . . . . . . . . . 2,025 13.3 28.1 52.3 46.4 11.6 10.9 16.4 77.1 28.3BROOKLYN . . . . . . . . . . . . . . . . . . . . 41,469 16.6 25.0 48.1 41.6 8.4 9.4 6.2 68.0 17.2Williamsburg, Greenpoint (01). . . . . . . 3,314 19.1 27.4 21.1 36.4 4.9 5.2 3.8 67.2 12.1Fort Greene, Brooklyn Heights (02). . . 1,580 15.9 15.0 27.9 60.9 8.6 9.2 3.4 25.6 10.6Bedford Stuyvesant (03). . . . . . . . . . . . 2,434 15.9 24.4 28.4 37.8 10.7 12.3 8.7 75.4 24.5Bushwick (04). . . . . . . . . . . . . . . . . . . . 1,934 17.2 76.8 57.2 41.8 7.7 9.8 7.2 84.1 23.8East New York (05). . . . . . . . . . . . . . . . 2,808 15.4 39.0 45.6 39.2 10.1 11.8 9.0 80.8 27.9Park Slope (06). . . . . . . . . . . . . . . . . . . 1,806 17.2 18.7 24.2 57.4 8.4 8.7 2.9 19.5 9.5Sunset Park (07). . . . . . . . . . . . . . . . . . 2,926 23.2 38.1 76.4 45.9 6.0 7.1 3.3 80.2 9.3Crown Heights North (08). . . . . . . . . . 1,408 14.6 13.9 39.6 46.0 11.2 12.8 7.4 63.5 23.6Crown Heights South (09). . . . . . . . . . . 1,678 17.0 9.8 49.3 44.0 8.3 9.3 7.6 71.5 20.3Bay Ridge (10). . . . . . . . . . . . . . . . . . . 1,723 13.8 20.7 59.6 46.8 8.2 8.6 5.9 55.4 11.7Bensonhurst (11). . . . . . . . . . . . . . . . . . 2,322 12.8 21.8 74.2 44.6 7.5 8.1 4.7 67.4 11.7Borough Park (12). . . . . . . . . . . . . . . . . 5,276 27.6 19.1 39.5 29.7 4.7 5.3 2.9 79.9 9.9Coney Island (13). . . . . . . . . . . . . . . . . 1,234 11.8 28.8 60.7 42.9 9.7 11.3 8.2 72.7 18.2Flatbush, Midwood (14). . . . . . . . . . . . 2,728 17.0 22.8 59.1 40.7 9.3 10.2 6.7 68.5 16.8Sheepshead Bay (15). . . . . . . . . . . . . . . 2,063 12.9 13.7 63.8 42.3 7.5 7.3 5.5 58.5 11.6Brownsville (16). . . . . . . . . . . . . . . . . . 1,445 16.7 20.8 31.1 38.5 14.6 15.7 10.5 81.6 29.6East Flatbush (17). . . . . . . . . . . . . . . . . 2,205 14.2 8.0 63.7 42.1 12.7 14.4 13.0 74.7 29.5Canarsie (18). . . . . . . . . . . . . . . . . . . . . 2,585 13.4 10.1 50.9 41.5 10.9 12.3 9.1 58.7 24.5QUEENS . . . . . . . . . . . . . . . . . . . . . . . 26,955 12.1 37.2 69.6 45.0 8.2 9.2 8.7 67.3 15.6Astoria, Long Island City (01). . . . . . . . 2,014 10.5 33.8 62.3 53.7 7.8 9.1 14.3 58.9 15.0Sunnyside, Woodside (02). . . . . . . . . . 1,583 14.0 39.2 73.8 53.9 7.1 8.3 10.4 60.3 10.4Jackson Heights (03). . . . . . . . . . . . . . . 2,885 16.8 75.9 83.2 40.3 6.0 7.4 11.5 83.9 14.8Elmhurst, Corona (04). . . . . . . . . . . . . . 2,840 16.5 61.9 89.3 42.8 7.0 8.2 10.0 86.2 12.7Ridgewood, Glendale (05). . . . . . . . . . 2,065 12.2 46.5 63.2 45.7 6.8 7.3 7.4 62.6 14.1Rego Park, Forest Hills (06). . . . . . . . . . 1,257 11.1 14.6 71.9 53.0 6.6 6.1 4.2 34.3 7.5Flushing (07). . . . . . . . . . . . . . . . . . . . . 2,499 10.1 20.5 82.2 48.0 6.2 8.1 4.5 70.1 6.4Fresh Meadows, Briarwood (08). . . . . . 1,699 11.2 19.5 67.8 44.6 9.1 10.3 6.3 55.3 13.1Woodhaven (09). . . . . . . . . . . . . . . . . . 1,927 13.4 48.2 69.0 42.0 8.6 9.5 6.3 71.5 17.8Howard Beach (10). . . . . . . . . . . . . . . . 1,345 11.0 29.6 64.8 43.1 10.0 10.3 6.8 63.3 18.6Bayside (11). . . . . . . . . . . . . . . . . . . . . 691 5.9 15.0 66.4 43.6 6.9 7.7 3.7 44.2 9.6Jamaica, St. Albans (12). . . . . . . . . . . . 3,069 13.6 23.6 58.5 41.0 11.6 12.4 9.5 73.2 25.4Queens Village (13). . . . . . . . . . . . . . . 1,721 9.1 12.9 61.0 44.2 11.6 10.9 9.1 59.5 22.0The Rockaways (14). . . . . . . . . . . . . . . 1,352 11.8 27.0 35.1 39.3 10.0 11.8 12.4 68.5 25.9STATEN ISLAND . . . . . . . . . . . . . . . . . 5,580 11.9 25.9 35.4 40.4 8.4 9.7 3.8 43.0 20.9Port Richmond (01). . . . . . . . . . . . . . . . 2,602 14.8 37.9 40.0 38.6 9.2 9.9 4.9 58.0 24.1Willowbrook, South Beach (02). . . . . . 1,388 10.5 19.8 43.4 42.9 7.9 9.3 3.3 40.2 18.5Tottenville (03). . . . . . . . . . . . . . . . . . . 1,577 9.8 10.9 20.7 41.3 7.6 10.0 2.6 21.2 17.8NEW YORK CITY RESIDENTS. . . . . . . 114,908 14.1 36.4 52.0 45.4 8.7 9.4 7.5 63.5 17.4NON-RESIDENTS. . . . . . . . . . . . . . . . . 9,879 - 17.4 36.2 45.4 10.0 11.1 4.7 20.5 11.5RESIDENCE UNKNOWN. . . . . . . . . . . 4 - - - - - - - - -
Note: Borough totals may be higher than the sum of the community districts as they may include some live births whose community district could not be determined.* Rate per 1,000 population. For population information, see Technical Notes: Geographical Units, Community District.† See Technical Notes: Birthplace.‡ Clinical gestational age <37 completed weeks. § Due to revision of the birth certificate, since 2008 "On Medicaid" also includes Family Health Plus, Other government, and Child Health Plus B.
Table PO7. Live Births by Selected Characteristics and Community District of Residence, New York City, 2010

10
Table PO8. Live Births by Mother’s Birthplace and Borough of Residence, New York City, 2010
76
Borough of Residence Non- ResidenceBirthplace Total Manhattan Bronx Brooklyn Queens Staten Island Residents UnknownUnited States. . . . . . . . . . . . . . . . . . . . . . . . . . . 59,936 11,016 9,875 21,212 8,042 3,551 6,237 3Dominican Republic. . . . . . . . . . . . . . . . . . . . . 7,782 1,677 3,646 1,148 992 55 264 –Mexico. . . . . . . . . . . . . . . . . . . . . . . .. . . . . . . . 7,407 797 1,648 2,289 2,174 448 51 –China. . . . . . . . . . . . . . . . . . . . . . . . . . . . . . . . . 6,893 1,129 58 3,190 2,141 90 285 –Ecuador. . . . . . . . . . . . . . . . . . . . . . . . . . . . . . . 2,910 148 360 490 1,847 28 37 –Jamaica . . . . . . . . . . . . . . . . . . . . . . . . . . . . . . . 2,862 65 729 1,098 766 26 178 –Guyana. . . . . . . . . . . . . . . . . . . . . . . . . . . . . . . 1,868 31 152 648 940 11 86 –Bangladesh. . . . . . . . . . . . . . . . . . . . . . . . . . . . 1,762 51 295 406 973 6 31 –Haiti. . . . . . . . . . . . . . . . . . . . . . . . . . . . . . . . . . 1,569 40 44 1,057 314 13 101 –India. . . . . . . . . . . . . . . . . . . . . . . . . . . . . . . . . 1,546 188 60 125 749 51 373 –Puerto Rico. . . . . . . . . . . . . . . . . . . . . . . . . . . . 1,474 191 713 299 155 55 61 –Trinidad and Tobago. . . . . . . . . . . . . . . . . . . . . 1,438 32 77 786 467 26 50 –Pakistan. . . . . . . . . . . . . . . . . . . . . . . . . . . . . . . 1,334 49 77 595 451 67 95 –Israel. . . . . . . . . . . . . . . . . . . . . . . . . . . . . . . . . 1,032 201 13 546 128 31 113 –Russia. . . . . . . . . . . . . . . . . . . . . . . . . . . . . . . . 972 144 19 480 167 77 85 –Korea. . . . . . . . . . . . . . . . . . . . . . . . . . . . . . . . . 952 234 19 85 482 15 117 –Poland. . . . . . . . . . . . . . . . . . . . . . . . . . . . . . . . 889 66 8 254 449 69 43 –Colombia. . . . . . . . . . . . . . . . . . . . . . . . . . . . . . 852 68 41 91 569 24 59 –Ukraine. . . . . . . . . . . . . . . . . . . . . . . . . . . . . . . 830 70 13 527 65 81 74 –El Salvador. . . . . . . . . . . . . . . . . . . . . . . . . . . . . 808 48 89 182 409 13 67 –Honduras. . . . . . . . . . . . . . . . . . . . . . . . . . . . . . 786 40 362 172 170 23 19 –Philippines. . . . . . . . . . . . . . . . . . . . . . . . . . . . . 742 77 50 77 367 47 124 –Ghana. . . . . . . . . . . . . . . . . . . . . . . . . . . . . . . . 687 28 502 67 39 25 26 –Canada. . . . . . . . . . . . . . . . . . . . . . . .. . . . . . . . 646 246 12 252 48 4 84 –Yemen Arab Republic. . . . . . . . . . . . . . . . . . . . 634 69 111 299 132 18 5 –Other or Not Stated. . . . . . . . . . . . . . . . . . . . . . 16,180 2,941 2,285 5,094 3,919 726 1,214 1Total. . . . . . . . . . . . . . . . . . . . . . . . . . . . . . . . . 124,791 19,646 21,258 41,469 26,955 5,580 9,879 4
Table PO9. Live Births by Mother’s Birthplace and Age, New York City, 2010
76
Age of Mother (Years)Birthplace Total <20 20-24 25-29 30-34 35-39 ≥40 UnknownUnited States. . . . . . . . . . . . . . . . . . . . . . . . . . . 59,936 5,016 13,107 13,492 15,775 9,578 2,967 1Dominican Republic. . . . . . . . . . . . . . . . . . . . . 7,782 568 1,874 2,138 1,894 983 325 –Mexico. . . . . . . . . . . . . . . . . . . . . . . .. . . . . . . . 7,407 561 1,962 2,311 1,665 753 155 –China. . . . . . . . . . . . . . . . . . . . . . . . . . . . . . . . . 6,893 36 973 2,622 1,948 1,067 247 –Ecuador. . . . . . . . . . . . . . . . . . . . . . . . . . . . . . . 2,910 173 576 811 734 465 151 –Jamaica . . . . . . . . . . . . . . . . . . . . . . . . . . . . . . . 2,862 127 525 767 743 488 212 –Guyana. . . . . . . . . . . . . . . . . . . . . . . . . . . . . . . 1,868 59 328 502 549 330 100 –Bangladesh. . . . . . . . . . . . . . . . . . . . . . . . . . . . 1,762 18 320 638 514 213 59 –Haiti. . . . . . . . . . . . . . . . . . . . . . . . . . . . . . . . . . 1,569 24 167 365 508 382 123 –India. . . . . . . . . . . . . . . . . . . . . . . . . . . . . . . . . 1,546 4 145 490 631 232 44 –Puerto Rico. . . . . . . . . . . . . . . . . . . . . . . . . . . . 1,474 159 371 368 339 179 58 –Trinidad and Tobago. . . . . . . . . . . . . . . . . . . . . 1,438 51 268 441 388 203 87 –Pakistan. . . . . . . . . . . . . . . . . . . . . . . . . . . . . . . 1,334 21 233 512 378 147 43 –Israel. . . . . . . . . . . . . . . . . . . . . . . . . . . . . . . . . 1,032 8 125 257 338 245 59 –Russia. . . . . . . . . . . . . . . . . . . . . . . . . . . . . . . . 972 3 117 258 349 184 61 –Korea. . . . . . . . . . . . . . . . . . . . . . . . . . . . . . . . . 952 1 15 160 392 319 65 –Poland. . . . . . . . . . . . . . . . . . . . . . . . . . . . . . . . 889 7 70 269 347 153 43 –Colombia. . . . . . . . . . . . . . . . . . . . . . . . . . . . . . 852 43 127 202 253 172 55 –Ukraine. . . . . . . . . . . . . . . . . . . . . . . . . . . . . . . 830 10 76 249 297 165 33 –El Salvador. . . . . . . . . . . . . . . . . . . . . . . . . . . . . 808 41 156 237 224 121 29 –Honduras. . . . . . . . . . . . . . . . . . . . . . . . . . . . . . 786 38 167 245 209 91 36 –Philippines. . . . . . . . . . . . . . . . . . . . . . . . . . . . . 742 13 41 154 267 192 75 –Ghana. . . . . . . . . . . . . . . . . . . . . . . . . . . . . . . . 687 5 64 157 220 148 93 –Canada. . . . . . . . . . . . . . . . . . . . . . . .. . . . . . . . 646 6 74 107 240 163 56 –Yemen Arab Republic. . . . . . . . . . . . . . . . . . . . 634 67 184 158 124 56 45 –Other or Not Stated. . . . . . . . . . . . . . . . . . . . . . 16,180 250 1,823 3,916 5,241 3,752 1,198 –Total. . . . . . . . . . . . . . . . . . . . . . . . . . . . . . . . . 124,791 7,309 23,888 31,826 34,567 20,781 6,419 1

11
Figure 4.1 Percent of Live Births Covered by MedicaidNew York City, 2001-2010
'01 '02 '03 '04 '05 '06 '07 '08 '09 '10
Year
0
10
20
30
40
50
60
70
80
90
100
Perc
e nt
Hispanic Asian and Pacific Islander Non-Hispanic white Non-Hispanic black
Figure 4.2 Percent of Multiple Births by Mother's AgeNew York City, 2001-2010
'01 '02 '03 '04 '05 '06 '07 '08 '09 '10
Year
0
1
2
3
4
5
6
7
8
9
10
Perc
e nt
Age <20 years Age 20-29 years Age 30-39 years Age >= 40 years
• Beginning 2008, percent of live births covered by Medicaid includes births covered by Family Health Plus, Child Health Plus B, and other government insurance as well as Medicaid enrollees be-cause of a change in the way this information is collected on the birth certificate. This led to the appearance of a large increase in reported Medicaid coverage in 2008.
• From 2001 to 2010, the per-centage of live births covered by Medicaid increased most in non-Hispanic whites. The percentage of live births covered by Medicaid increased 16% since the 2008 birth certificate change and 25% during the preceding seven years (2001 to 2007).
• Multiple births include twins, triplets, and higher order multiples.
• The percentage of multiple live births has remained rela-tively stable for women aged 40 years and older since 2002 in contrast to the sharp increase for this age group in the previous two decades due to advances in reproductive technology.
• The percentage of multiple live births increased in women aged 30-39 years (2%) and 20-29 years (15%) from 2001 to 2010.
• During the same time pe-riod, the percentage of multiple live births decreased slightly among women younger than 20 years.
Figure PO1. Percent of Live Births Covered by Medicaid, New York City, 2001-2010
Figure PO2. Percent of Multiple Live Births by Mother’s Age, New York City, 2001-2010

12 78
'01 '02 '03 '04 '05 '06 '07 '08 '09 '10
Year
0
20
40
60
80
100
120
140
Thou
s and
s
Total Live Births Hispanic Asian & Pacific IslanderNon-Hispanic white Non-Hispanic black Other & Unknown
'01 '02 '03 '04 '05 '06 '07 '08 '09 '10
Year
0
2
4
6
8
10
12
Perc
e nt
Births to Teenagers (<20 years)Low Birthweight (<2,500 grams)
Preterm (<37 weeks)
Non Hispanic-Black
Figure 4.4 Percent of Live Births with Specified Characteristics New York City, 2001-2010
Figure 4.3 Live Births by Mother's Ethnic Group New York City, 2001-2010
• Overall, 124,791 live births occurred citywide during 2010, down 1.6% from 126,774 in 2009.
• The number of live births has remained relatively stable from 2001 to 2010, rang-ing from a high of 128,961 in 2007 to a low of 122,937 in 2002.
• Over the past decade, the number of live births to non-Hispanic blacks has decreased by 17%. Non-Hispanic black women accounted for 21.3% of all live births in New York City in 2010, down from 25.9% in 2001.
• From 2001 to 2010, the number of live births among Asian and Pacific Islanders in-creased by 23.1%. This racial/ethnic group accounted for 14.5% of all live births in 2010 versus 11.8% in 2001.
78
'01 '02 '03 '04 '05 '06 '07 '08 '09 '10
Year
0
20
40
60
80
100
120
140
Thou
s and
s
Total Live Births Hispanic Asian & Pacific IslanderNon-Hispanic white Non-Hispanic black Other & Unknown
'01 '02 '03 '04 '05 '06 '07 '08 '09 '10
Year
0
2
4
6
8
10
12
Perc
e nt
Births to Teenagers (<20 years)Low Birthweight (<2,500 grams)
Preterm (<37 weeks)
Non Hispanic-Black
Figure 4.4 Percent of Live Births with Specified Characteristics New York City, 2001-2010
Figure 4.3 Live Births by Mother's Ethnic Group New York City, 2001-2010
• From 2001 to 2010, the percent-age of live births to teenagers decreased steadily and significantly, showing a 29.8% decline. Teenage mothers ac-counted for 5.9% of all live births in 2010, down from 8.4% in 2001.
• During the same period, the percent-age of infants born at a low birthweight (<2,500 grams) was relatively stable and ranged slightly from 2001 (8.5%) to 2010 (8.8%).
• Similar to low birthweight births, the percentage of infants born preterm (<37 weeks) changed slightly between a high of 10.1% in 2005 and a low of 9.4% in 2003.
Figure PO3. Live Births by Mother’s Racial/Ethnic Group, New York City, 2001-2010
Figure PO4. Percent of Live Births With Specified Characteristics, New York City,
2001-2010

13
• Nearly 51% of live births in New York City in 2010 were to foreign-born women.
• The five community districts with the highest percentage of births to foreign-born women were Elmhurst, Corona (89.3%), Jackson Heights (89.2%), Flushing (82.2%), Sunset Park (76.4%), and Bensonhurst (74.2%).
• The five community districts that had less than 30% of their births to foreign-born women included: Tottenville (20.7%), Williamsburg, Greenpoint (21.1%), Park Slope (24.2%), Fort Greene, Brooklyn Heights (27.9%), and Bed-ford Stuyvesant (28.4%).
• See Table P7 for additional percentages.
Percent of Live Birthsto Foreign-born Mothers
63.9 - 89.357.3 - 63.844.7 - 57.237.9 - 44.620.7 - 37.8
Map PO2. Percent of Live Births to Foreign-born Mothers by Community District of Residence,
New York City, 2010
Map PO1. Percent of Low Birthweight (<2,500 Grams) Live Births by Community District
of Residence, New York City, 2010
Percent of Live Births <2500 Grams
10.5 - 14.6
9.3 - 10.4
8.4 - 9.2
7.2 - 8.3
4.7 - 7.1
• Citywide, 8.8% of all infants born in 2010 were low birthweight (<2,500 grams).
• The community districts with the high-est percentage of low birthweights included: Brownsville (14.6%), East Flatbush (12.7%), Williamsbridge (11.6%), Jamaica, St. Albans (11.6%), and Queens Village (11.6%).
• The five community districts with the lowest percentage of low-weight births were Williamsburg, Greenpoint (4.9%), Greenwich Village, SoHo (6.0%), Sunset Park (6.0%), Jackson Heights (6.0%), and Flushing (6.2%).
• See Table P7 for additional percentages.

14
• More than 25% of mothers were obese in 12 of New York City’s community districts; those community districts with the highest pre-pregnancy obesity were Brownsville (29.6%), followed by East Flatbush (29.5%), Williamsbridge (28.3%), East New York (27.9%), and Concourse/Highbridge (27.8%).
• The community district with the lowest percent of pre-pregnancy obesity was Green-wich Village/SoHo (1.5%). Other community districts with less than 4% pre-pregnancy obe-sity included: Battery Park/Tribeca, Murray Hill, the Upper East Side, and Midtown Busi-ness District.
• See Table P7 for additional percentages.
Map PO4. Percent of Pre-pregnancy Obesity by Community District of Residence, New York City, 2010
Percent Pre-pregnancyObesity
25.5 - 29.620.4 - 25.414.9 - 20.39.7 - 14.81.5 - 9.6
Percent of Live Births to Teenagers (Age<20 Years)
10.7 - 14.1
7.7 - 10.6
5.0 - 7.6
2.8 - 4.9
0.2 - 2.7
• The five community districts with the highest percentage of births to teenagers were Mott Haven (14.1%), East Tremont (14.0%), Morrisania (13.3%), Brownsville (13.3%), and Hunts Point (12.6%).
• In the following community districts, births to teenagers accounted for less than 1% of all live births: Battery Park/Tribeca, Green-wich Village/SoHo, Murray Hill, the Upper East Side, and Rego Park/Forest Hills.
• See Table P12 for additional percentages.
Map PO3. Percent of Live Births to Teenagers (Age<20 Years) (Rolling Three-year Averages) by Community District of Residence, New York City, 2008-2010
Note: Three-year averages were used in this map because of the small number of births annually to teenage mothers in some community districts.

15
Table PO10. Live Births, Spontaneous Terminations, Induced Terminations, and Pregnancy Rates* to Teenagers (Age 15-19 Years) by Racial/Ethnic Group
and Borough of Residence, New York City, 2010
81
PregnancyAge of Woman Spontaneous Induced Population Birth Rate per Rate per
(Years) Live Births Terminations Terminations (Women) 1,000 Women 1,000 WomenNew York City † 15-17 2,193 273 4,561 151,723 14.5 46.3
18-19 5,014 574 7,578 112,295 44.7 117.2Age 15-19 7,207 847 12,139 264,018 27.3 76.5
Ethnic Group†Hispanic 15-17 1,349 119 1,756 55,002 24.5 58.6
18-19 2,767 208 2,843 38,721 71.5 150.3Age 15-19 4,116 327 4,599 93,723 43.9 96.5
Asian and Pacific Islander 15-17 35 3 105 16,545 2.1 8.618-19 139 16 270 12,941 10.7 32.8
Age 15-19 174 19 375 29,486 5.9 19.3Non-Hispanic White 15-17 91 15 237 32,058 2.8 10.7
18-19 434 47 522 27,413 15.8 36.6Age 15-19 525 62 759 59,471 8.8 22.6
Non-Hispanic Black 15-17 687 88 2,335 43,204 15.9 72.018-19 1,578 224 3,621 29,626 53.3 183.0
Age 15-19 2,265 312 5,956 72,830 31.1 117.2NYC Events to NYC Residents‡ 15-17 2,158 270 4,228 151,723 14.2 43.9
18-19 4,874 561 6,989 112,295 43.4 110.6Age 15-19 7,032 831 11,217 264,018 26.6 72.3
Ethnic Group‡Hispanic 15-17 1,335 118 1,643 55,002 24.3 56.3
18-19 2,718 207 2,704 38,721 70.2 145.4Age 15-19 4,053 325 4,347 93,723 43.2 93.1
Asian and Pacific Islander 15-17 34 3 97 16,545 2.1 8.118-19 138 15 239 12,941 10.7 30.3
Age 15-19 172 18 336 29,486 5.8 17.8Non-Hispanic White 15-17 88 14 185 32,058 2.7 9.0
18-19 393 43 422 27,413 14.3 31.3Age 15-19 481 57 607 59,471 8.1 19.3
Non-Hispanic Black 15-17 672 87 2,191 43,204 15.6 68.318-19 1,534 218 3,356 29,626 51.8 172.4
Age 15-19 2,206 305 5,547 72,830 30.3 110.6Borough of Residence Manhattan 15-17 250 35 571 18,966 13.2 45.1
18-19 619 83 1,014 21,579 28.7 79.5Age 15-19 869 118 1,585 40,545 21.4 63.4
Bronx 15-17 716 69 1,243 33,081 21.6 61.318-19 1,496 139 1,922 23,130 64.7 153.8
Age 15-19 2,212 208 3,165 56,211 39.4 99.4 Brooklyn 15-17 678 96 1,388 49,866 13.6 43.4
18-19 1,583 200 2,262 34,102 46.4 118.6Age 15-19 2,261 296 3,650 83,968 26.9 73.9
Queens 15-17 416 55 861 40,062 10.4 33.218-19 995 114 1,531 27,188 36.6 97.1
Age 15-19 1,411 169 2,392 67,250 21.0 59.1 Staten Island 15-17 98 15 165 9,748 10.1 28.5
18-19 181 25 260 6,296 28.7 74.0Age 15-19 279 40 425 16,044 17.4 46.4
NYC Events to Non-NYC Residents 15-17 35 3 314 – N.A. N.A.18-19 140 12 540 – N.A. N.A.
Age 15-19 175 15 854 – N.A. N.A.* Population data used to calculate rates are from 2010 Census. See Technical Notes: Population. † Includes all events occurring in NYC regardless of residence; other/unknown ethnicities are not presented.‡ Numbers and rates are limited to events occurring in NYC to NYC residents only; other/unknown ethnicities are not presented.N.A. Not applicable.

1682
Figure 4.5 Percent and Rate of Live Births to Teenagers by Borough of ResidenceNew York City, 2008-2010
4.8
11.1
6.15.5 5.4
23.0
42.0
29.4
22.018.9
Manhattan Bronx Brooklyn Queens Staten Island
Borough of Residence
0.0
2.0
4.0
6.0
8.0
10.0
12.0
14.0
Perc
e nt o
f Liv
e Bi
rths
to T
eena
gers
(Age
<2 0
Yea
rs)
0.0
10.0
20.0
30.0
40.0
50.0 Birth Rate per 1,000 Wom
en (Age 15-19 Years)
Percent, Left Y-Axis** Rate, Right Y-Axis**
Citywide Percent 6.2
• Citywide, the percent of all live births to teenagers (age <20 years)was 6.2% in 2008-2010.
• The three-year 2008 to 2010 av-erage percentage of births to teenag-ers was highest in the Bronx (11.1%). This was almost twice as high as the percent of live births to teenagers in Brooklyn (6.1%) and approximately twice as high as Queens (5.5%) and Staten Island (5.4%). The percent of live births to teens in Manhattan was 4.8% during this period.
• The teenage (age 15-19 years)birth rate followed a different pat-tern. The rate was highest in the Bronx (42.0), followed by Brooklyn (29.4), Manhattan (23.0), Queens (22.0), and Staten Island (18.9).
Figure PO5. Percent and Rate of Live Births to Teenagers by Borough of Residence,
New York City, 2008-2010*
Table PO11. Live Births to Teenagers (Age <20 Years), Overall and by Selected Characteristics, New York City, 2006-2010
82
Year2006 2007 2008 2009 2010
Total Live Births . . . . . . . . . . . . . . . . . . . . . . . . . 125,506 128,961 127,680 126,774 124,791Percent to Teenagers . . . . . . . . . . . . . . . . . . . . . . 6.9 6.6 6.6 6.2 5.9Population* (Female Age 15-19) . . . . . . . . . . . . . 262,407 264,464 265,935 265,904 262,878Birth Rate† (Age 15-19) . . . . . . . . . . . . . . . . . . . . 32.7 32.1 31.2 28.9 27.4Births to Teenagers . . . . . . . . . . . . . . . . . . . . . . . 8,695 8,569 8,423 7,806 7,309Percent of Births with Specified Characteristics: Hispanic . . . . . . . . . . . . . . . . . . . . . . . . . . . . . 56.9 58.1 59.6 59.7 59.4 Foreign-born Mother . . . . . . . . . . . . . . . . . . . . 34.0 33.2 31.2 29.2 29.2 First Live Birth . . . . . . . . . . . . . . . . . . . . . . . . . 85.8 85.7 86.2 86.2 86.9 <2,500 grams . . . . . . . . . . . . . . . . . . . . . . . . 10.5 10.2 10.6 9.8 9.5 Preterm‡. . . . . . . . . . . . . . . . . . . . . . . . . . . . . 10.4 10.2 10.4 10.0 9.6 Prenatal Care in First or Second Trimester of Pregnancy . . . . . . . . . . . . . . . . . 88.2 88.7 § § 85.2 Not Married . . . . . . . . . . . . . . . . . . . . . . . . . . 89.0 89.5 90.1 90.6 90.8 On Medicaid|| . . . . . . . . . . . . . . . . . . . . . . . . 80.8 80.1 87.4 88.8 89.5 Pre-pregnancy Obesity . . . . . . . . . . . . . . . . . . N/A N/A 14.7 15.5 15.2Infant Mortality Rate¶. . . . . . . . . . . . . . . . . . . . . . 7.4 6.8 7.6 8.5 8.1* For denominator information, see Technical Notes: Population.† Per 1,000 women age 15-19 years.‡ Clinical gestational age <37 completed weeks. § Due to data quality issue, no prenatal care variables are available for the years of 2008-2009.|| See Technical Notes: Births, Birth Reporting.¶ Infant mortality rate per 1,000 live births to teenagers.
* Three years of data were combined due to the relatively small number of live births to teenage mothers.**Computation of birth rate requires a population denominator appropriate for teenage years; this coincides with the census population age category of 15-19.

17
Table PO12. Live Births to Teenagers (Age <20 Years) by Selected Characteristics and Community District of Residence, New York City, 2008-2010*
83
Percent of Total Live Births with Specified Characteristics
Percent of Mother's Foreign First Low Birth Preterm Mother Live Total Live Ancestry Born Live Weight Birth Not On
Community District of Residence Births Births Hispanic Mother Birth† (<2,500 Grams) (<37 Weeks) Married Medicaid‡NEW YORK CITY . . . . . . . . . . . . . . . . . 23,538 6.2 59.6 29.9 86.6 10.0 10.0 90.5 88.5MANHATTAN . . . . . . . . . . . . . . . . . . . 2,830 4.8 70.7 29.6 86.9 9.9 10.7 94.4 90.7Battery Park, Tribeca (01). . . . . . . . . . . . 7 0.2 33.3 42.9 85.7 14.3 14.3 100.0 71.4Greenwich Village, SoHo (02). . . . . . . . 9 0.3 62.5 44.4 100.0 0.0 11.1 100.0 88.9Lower East Side (03). . . . . . . . . . . . . . . . 251 4.1 66.7 18.4 86.1 8.0 9.2 93.2 92.7Chelsea, Clinton (04). . . . . . . . . . . . . . . 74 2.7 59.7 13.5 89.2 4.1 8.1 97.3 87.7Midtown Business District (05). . . . . . . . 29 1.7 44.8 20.7 79.3 3.4 3.4 93.1 86.2Murray Hill (06). . . . . . . . . . . . . . . . . . . 20 0.5 50.0 10.0 85.0 20.0 10.0 90.0 83.3Upper West Side (07). . . . . . . . . . . . . . . 148 1.8 67.6 15.5 87.2 9.5 12.2 97.3 91.0Upper East Side (08). . . . . . . . . . . . . . . . 75 0.9 47.1 18.7 88.0 10.7 6.7 97.3 90.7Manhattanville (09). . . . . . . . . . . . . . . . 383 9.1 74.5 37.3 86.9 9.4 9.2 93.7 90.6Central Harlem (10). . . . . . . . . . . . . . . . 488 9.4 39.8 18.1 86.7 11.1 12.3 94.3 88.5East Harlem (11). . . . . . . . . . . . . . . . . . . 593 11.5 70.3 20.6 85.0 12.8 12.8 94.9 90.5Washington Heights (12). . . . . . . . . . . . 753 9.4 95.7 49.9 88.7 8.4 9.8 93.6 92.7BRONX . . . . . . . . . . . . . . . . . . . . . . . . 7,220 11.1 71.6 25.6 86.1 10.4 9.4 94.6 89.1Mott Haven (01). . . . . . . . . . . . . . . . . . . 733 14.1 76.2 23.0 84.0 10.0 9.5 96.9 91.6Hunts Point (02). . . . . . . . . . . . . . . . . . . 371 12.6 78.4 24.0 82.7 11.6 9.4 96.5 90.5Morrisania (03). . . . . . . . . . . . . . . . . . . . 580 13.3 68.0 16.6 86.4 11.4 10.2 95.2 88.9Concourse, Highbridge (04). . . . . . . . . . 913 10.8 76.5 33.6 85.9 9.9 10.2 94.6 87.4University/Morris Heights (05). . . . . . . . 913 12.4 77.2 31.3 84.5 9.3 8.8 95.0 89.1East Tremont (06). . . . . . . . . . . . . . . . . . 623 14.0 74.5 20.9 85.5 11.7 11.4 95.5 89.5Fordham (07). . . . . . . . . . . . . . . . . . . . . 715 9.9 83.8 31.0 83.8 10.5 8.8 93.4 88.7Riverdale (08). . . . . . . . . . . . . . . . . . . . 207 5.6 87.2 26.7 89.9 9.7 7.2 92.8 87.1Unionport, Soundview (09). . . . . . . . . . 858 10.6 71.7 21.8 87.3 10.6 8.5 94.5 91.1Throgs Neck (10). . . . . . . . . . . . . . . . . . 233 7.6 61.6 20.3 93.1 10.7 9.4 91.0 87.5Pelham Parkway (11). . . . . . . . . . . . . . . 357 8.3 64.8 24.9 89.9 9.2 8.7 89.9 90.2Williamsbridge (12). . . . . . . . . . . . . . . . 716 11.7 40.1 23.8 88.5 10.8 8.9 95.1 86.6BROOKLYN . . . . . . . . . . . . . . . . . . . . . 7,558 6.1 45.0 28.4 86.6 9.9 10.3 86.9 90.5Williamsburg, Greenpoint (01). . . . . . . . 429 4.3 65.5 13.1 88.8 7.7 6.8 69.9 90.2Fort Greene, Brooklyn Heights (02) . . . . 178 4.1 40.9 15.7 84.8 7.3 8.5 92.1 90.9Bedford Stuyvesant (03). . . . . . . . . . . . . 773 10.5 35.7 14.1 84.9 11.5 12.8 91.8 89.6Bushwick (04). . . . . . . . . . . . . . . . . . . . 656 11.2 82.5 36.9 82.5 11.0 9.9 94.7 92.9East New York (05). . . . . . . . . . . . . . . . 1,010 11.7 42.2 22.7 86.8 10.1 10.2 95.1 88.4Park Slope (06). . . . . . . . . . . . . . . . . . . . 165 3.2 58.5 12.7 91.5 7.3 9.1 92.7 86.0Sunset Park (07). . . . . . . . . . . . . . . . . . . 487 5.4 85.2 48.7 85.0 7.8 8.8 85.6 93.0Crown Heights North (08). . . . . . . . . . . 307 7.1 16.4 20.2 86.1 11.7 10.4 93.5 88.8Crown Heights South (09). . . . . . . . . . . 264 5.2 17.0 33.0 90.5 9.5 11.7 96.6 89.8Bay Ridge (10). . . . . . . . . . . . . . . . . . . . 152 2.9 51.4 47.3 83.4 11.8 6.6 66.4 92.7Bensonhurst (11). . . . . . . . . . . . . . . . . . 232 3.3 57.6 50.9 85.8 12.5 12.5 75.0 92.7Borough Park (12). . . . . . . . . . . . . . . . . 462 2.9 60.9 39.0 88.5 5.6 6.5 47.8 90.9Coney Island (13). . . . . . . . . . . . . . . . . . 316 8.6 56.1 26.9 86.1 8.5 9.5 87.7 93.7Flatbush, Midwood (14). . . . . . . . . . . . . 387 4.7 50.3 47.8 87.9 9.8 11.9 86.6 89.2Sheepshead Bay (15). . . . . . . . . . . . . . . 238 3.9 32.2 43.9 85.3 8.4 6.7 62.6 89.0Brownsville (16). . . . . . . . . . . . . . . . . . . 593 13.3 23.1 13.3 86.3 10.8 10.8 97.3 90.8East Flatbush (17). . . . . . . . . . . . . . . . . . 482 7.1 12.5 33.6 90.2 12.9 13.5 96.7 91.4Canarsie (18). . . . . . . . . . . . . . . . . . . . . 427 5.5 16.5 21.8 87.3 10.8 13.3 93.2 89.5QUEENS . . . . . . . . . . . . . . . . . . . . . . . . 4,500 5.5 60.1 41.6 87.2 9.1 9.5 89.2 87.3Astoria, Long Island City (01). . . . . . . . . 319 5.2 65.3 34.6 87.1 9.7 9.1 90.9 88.0Sunnyside, Woodside (02). . . . . . . . . . . 147 3.2 86.2 59.2 92.5 5.4 6.1 83.7 91.0Jackson Heights (03). . . . . . . . . . . . . . . . 667 7.8 92.7 65.2 85.8 6.9 8.1 89.1 92.9Elmhurst, Corona (04). . . . . . . . . . . . . . 528 6.1 88.7 58.7 86.7 5.1 8.1 91.9 93.1Ridgewood, Glendale (05). . . . . . . . . . . 312 4.9 77.7 38.1 89.4 9.0 8.7 84.6 88.7Rego Park, Forest Hills (06). . . . . . . . . . 35 0.9 45.2 57.1 94.3 5.7 8.6 62.9 80.0Flushing (07). . . . . . . . . . . . . . . . . . . . . 192 2.4 67.6 53.1 87.5 5.7 8.9 88.5 88.5Fresh Meadows, Briarwood (08). . . . . . . 144 2.7 50.4 33.3 91.0 11.8 10.4 79.2 79.1Woodhaven (09). . . . . . . . . . . . . . . . . . 387 6.6 73.1 44.0 88.6 8.8 7.8 84.8 87.0Howard Beach (10). . . . . . . . . . . . . . . . 221 5.1 42.2 39.8 89.1 10.4 10.0 81.4 80.2Bayside (11). . . . . . . . . . . . . . . . . . . . . . 22 1.1 38.1 31.8 86.4 4.5 9.1 77.3 63.6Jamaica, St. Albans (12). . . . . . . . . . . . . 783 8.5 29.0 27.7 85.2 10.7 10.5 92.6 85.4Queens Village (13). . . . . . . . . . . . . . . . 299 5.7 17.2 30.5 87.6 11.4 10.0 94.6 82.3The Rockaways (14). . . . . . . . . . . . . . . . 444 10.4 32.1 15.5 86.0 14.2 14.2 94.1 83.2STATEN ISLAND . . . . . . . . . . . . . . . . . . 923 5.4 52.5 26.1 84.0 11.4 11.5 91.0 76.9Port Richmond (01). . . . . . . . . . . . . . . . 701 9.0 55.1 27.2 83.2 12.4 12.1 93.3 78.0Willowbrook, South Beach (02). . . . . . . 154 3.5 50.3 27.9 85.7 9.1 11.7 83.8 73.2Tottenville (03). . . . . . . . . . . . . . . . . . . . 67 1.4 28.6 10.4 88.1 6.0 4.5 85.1 74.2NEW YORK CITY RESIDENTS. . . . . . . . 23,031 6.6 59.9 30.2 86.5 10.0 9.9 90.8 88.9NON-RESIDENTS. . . . . . . . . . . . . . . . . 506 1.6 43.3 18.0 89.9 11.5 13.0 74.7 69.4RESIDENCE UNKNOWN. . . . . . . . . . . . 1 - - - - - - - -
Note: Borough totals may be higher than the sum of the community districts, as they may include some live births whose community district could not be determined. Map of percent of live births to teenagers by community district of residence is presented on page 14 (Map PO3).*Three years of data were combined because of the relatively small number of live births per year for teenage mothers. † See Technical Notes: Birth Data Quality.‡ Due to revision of the birth certificate, since 2008, "On Medicaid" also includes Family Health Plus, Other government, and Child Health Plus B.

18
Figure PO7. Live Births, Induced Terminations, and Spontaneous Terminations of Pregnancy by Age of Woman, New York City, 2010
Figure PO6. Number of Live Births, Induced Terminations, and Spontaneous Terminations of
Pregnancy, New York City, 2001-2010
84
'01 '02 '03 '04 '05 '06 '07 '08 '09 '10
Year
0
50
100
150
200
250
Thou
sand
s Induced Terminations
Spontaneous Terminations
Live Births
Figure 4.6 Number of Live Births, Induced Terminations, and Spontaneous Terminations New York City, 2001-2010
!!!
!
!!
!
!
! !! ! ! ! ! !!
!!
!
!
!!
!
Und
er 1
5
15-1
7
18-1
9
20-2
4
25-2
9
30-3
4
35-3
9
40 &
Ove
r0
5
10
15
20
25
30
35
40
Num
ber
of E
vent
s in
Tho
usan
ds
Figure 4.7 Live Births, Induced Terminations, and Spontaneous Terminations of Pregnancy by Age of Woman, New York City, 2010
Live Births
Induced Terminations
Spontaneous Terminations
Age of Woman
Total Pregnancies
• The total number of reported New York City pregnancies (the sum of all live births and spontaneous and induced terminations) decreased by 2.7% from 2001 to 2010.
• The number of induced termina-tions of pregnancy has been declin-ing in the last three years, down 7.8% from 90,870 in 2007 to 83,750 in 2010.
• Spontaneous terminations in-creased 21.0% from 2009 to 2010 due, in part, to the New York City Health Department’s increased out-reach to reporters of these events.
• Over 220,000 pregnancy out-comes were reported in New York City in 2010. Approximately 56% were live births, 38% were induced terminations, and 6% were spontane-ous terminations.
• For women aged 25 years and older, more pregnancies resulted in a live birth rather than induced or spon-taneous terminations.
• For younger women (<25 years), 52.2% of pregnancies ended in in-duced terminations, 43.5% resulted in live births, and 4.4% concluded in spontaneous terminations.

19
Table PO13. Live Births, Spontaneous Terminations, and Induced Terminations of Pregnancy, Overall and by Borough of Residence and Age of Woman, New York City, 2010
85
Age of Woman (Years)Unknown
Borough of Residence / or Pregnancy Outcome Total <15 15-17 18-19 20-24 25-29 30-34 35-39 ≥40 Not Stated
NEW YORK CITY . . . . . . . . . . . . . . . . 222,598 559 7,027 13,166 51,037 55,521 51,871 31,683 11,276 458 Live Births . . . . . . . . . . . . . . . . . . . 124,791 102 2,193 5,014 23,888 31,826 34,567 20,781 6,419 1 Spontaneous Terminations . . . . . . 14,057 26 273 574 2,251 2,988 3,295 2,855 1,658 137 Induced Terminations . . . . . . . . . . 83,750 431 4,561 7,578 24,898 20,707 14,009 8,047 3,199 320
MANHATTAN . . . . . . . . . . . . . . . . . . 33,017 52 856 1,716 6,119 6,816 8,913 6,170 2,301 74 Live Births . . . . . . . . . . . . . . . . . . . 19,646 9 250 619 2,412 3,662 6,542 4,601 1,551 – Spontaneous Terminations . . . . . . 2,040 4 35 83 257 329 497 499 320 16 Induced Terminations . . . . . . . . . . 11,331 39 571 1,014 3,450 2,825 1,874 1,070 430 58
BRONX . . . . . . . . . . . . . . . . . . . . . . . 43,082 155 2,028 3,557 11,963 11,221 8,216 4,302 1,550 90
Live Births . . . . . . . . . . . . . . . . . . . 21,258 37 716 1,496 5,567 5,785 4,574 2,350 733 –
Spontaneous Terminations . . . . . . 2,377 4 69 139 456 569 520 377 218 25
Induced Terminations . . . . . . . . . . 19,447 114 1,243 1,922 5,940 4,867 3,122 1,575 599 65
BROOKLYN . . . . . . . . . . . . . . . . . . . . 72,147 181 2,162 4,045 17,607 19,008 16,027 9,600 3,350 167 Live Births . . . . . . . . . . . . . . . . . . . 41,469 31 678 1,583 9,272 11,380 10,493 6,190 1,842 – Spontaneous Terminations . . . . . . 4,729 10 96 200 841 1,056 1,071 890 515 50 Induced Terminations . . . . . . . . . . 25,949 140 1,388 2,262 7,494 6,572 4,463 2,520 993 117
QUEENS . . . . . . . . . . . . . . . . . . . . . . 47,472 108 1,332 2,640 10,635 12,584 11,278 6,541 2,285 69 Live Births . . . . . . . . . . . . . . . . . . . 26,955 18 416 995 4,976 7,630 7,563 4,148 1,209 – Spontaneous Terminations . . . . . . 3,238 6 55 114 530 750 782 638 338 25 Induced Terminations . . . . . . . . . . 17,279 84 861 1,531 5,129 4,204 2,933 1,755 738 44
STATEN ISLAND . . . . . . . . . . . . . . . . 8,892 27 278 466 1,713 2,283 2,358 1,328 421 18 Live Births . . . . . . . . . . . . . . . . . . . 5,580 4 98 181 805 1,552 1,786 903 251 – Spontaneous Terminations . . . . . . 704 1 15 25 88 139 170 163 93 10 Induced Terminations . . . . . . . . . . 2,608 22 165 260 820 592 402 262 77 8
NON-RESIDENTS . . . . . . . . . . . . . . . 17,446 35 352 692 2,796 3,480 5,009 3,692 1,352 38 Live Births . . . . . . . . . . . . . . . . . . . 9,879 3 35 140 854 1,816 3,609 2,588 833 1 Spontaneous Terminations . . . . . . 959 1 3 12 77 142 254 286 174 10 Induced Terminations . . . . . . . . . . 6,608 31 314 540 1,865 1,522 1,146 818 345 27
RESIDENCE UNKNOWN . . . . . . . . . . 542 1 19 50 204 129 70 50 17 2 Live Births . . . . . . . . . . . . . . . . . . . 4 – – – 2 1 – 1 – – Spontaneous Terminations . . . . . . 10 – – 1 2 3 1 2 – 1 Induced Terminations . . . . . . . . . . 528 1 19 49 200 125 69 47 17 1
Note: See Technical Notes: Induced and Spontaneous Terminations of Pregnancy.
Table PO14. Spontaneous Terminations of Pregnancy by Gestational Age and Age of Woman, New York City, 2010
85
Age of Woman (Years)Unknown or
Gestational Age (Weeks) Total <15 15-17 18-19 20-24 25-29 30-34 35-39 ≥40 Not Stated
Total . . . . . . . . . . . . . . . . . . . . . . . . . 14,057 26 273 574 2,251 2,988 3,295 2,855 1,658 137
<13 . . . . . . . . . . . . . . . . . . . . . . . . . 11,014 21 209 430 1,729 2,265 2,576 2,276 1,405 10313-15 . . . . . . . . . . . . . . . . . . . . . . . . . 843 2 24 33 136 193 183 174 96 216-19 . . . . . . . . . . . . . . . . . . . . . . . . . 932 1 12 31 153 237 246 186 64 220-27 . . . . . . . . . . . . . . . . . . . . . . . . . 726 1 17 44 138 172 173 137 42 2≥28 . . . . . . . . . . . . . . . . . . . . . . . . . 373 1 7 19 73 90 93 62 26 2Not stated . . . . . . . . . . . . . . . . . . . . . 169 – 4 17 22 31 24 20 25 26
Note: See Technical Notes: Induced and Spontaneous Terminations of Pregnancy.

20
Table PO15. Selected Characteristics of Spontaneous Terminations of Pregnancy, ≥28 Weeks Gestation, Overall and by Age of Woman, New York City, 2010
86
Age of Woman (Years) Not
Total <15 15-17 18-19 20-24 25-29 30-34 35-39 ≥40 StatedTotal . . . . . . . . . . . . . . . . . . . . . . . . . . . . . . . . . . . . . . . . . . . 373 1 7 19 73 90 93 62 26 2Sex Male . . . . . . . . . . . . . . . . . . . . . . . . . . . . . . . . . . . . . . . . . 184 – 4 10 32 51 51 28 8 – Female . . . . . . . . . . . . . . . . . . . . . . . . . . . . . . . . . . . . . . . . 176 1 2 8 40 37 37 33 17 1 Undetermined . . . . . . . . . . . . . . . . . . . . . . . . . . . . . . . . . . 13 – 1 1 1 2 5 1 1 1Weight at Delivery (grams) <500 . . . . . . . . . . . . . . . . . . . . . . . . . . . . . . . . . . . . . . . . 9 – – 2 1 – 3 1 2 – 500-999 . . . . . . . . . . . . . . . . . . . . . . . . . . . . . . . . . . . . . . . 30 – 1 2 6 8 4 7 2 – 1,000-1,499 . . . . . . . . . . . . . . . . . . . . . . . . . . . . . . . . . . . . 49 1 – 2 16 11 11 4 4 – 1,500-1,999 . . . . . . . . . . . . . . . . . . . . . . . . . . . . . . . . . . . . 60 – 1 1 13 15 13 13 4 – 2,000-2,499 . . . . . . . . . . . . . . . . . . . . . . . . . . . . . . . . . . . . 66 – – 4 11 18 18 10 5 – ≥2,500 . . . . . . . . . . . . . . . . . . . . . . . . . . . . . . . . . . . . . . . 127 – 4 8 22 31 35 19 8 – Not stated . . . . . . . . . . . . . . . . . . . . . . . . . . . . . . . . . . . . . 32 – 1 – 4 7 9 8 1 2
Note: See Technical Notes: Induced and Spontaneous Terminations of Pregnancy.
Table PO16. Selected Characteristics of Spontaneous Terminations of Pregnancy, ≥28 Weeks Gestation, Overall and by Racial/Ethnic Group of Woman, New York City, 2010
86
Racial/Ethnic Group of WomanPuerto Other Asian and Non-Hispanic Non-Hispanic Not
Total Rican Hispanic Pacific Islander White Black Other Stated Total . . . . . . . . . . . . . . . . . . . . . . . . . . . . . . . . . . . . . . . . . 373 19 88 41 96 115 2 12 Sex Male . . . . . . . . . . . . . . . . . . . . . . . . . . . . . . . . . . . . . . . 184 10 44 21 46 60 – 3 Female . . . . . . . . . . . . . . . . . . . . . . . . . . . . . . . . . . . . . 176 9 41 19 47 50 2 8 Undetermined . . . . . . . . . . . . . . . . . . . . . . . . . . . . . . . 13 – 3 1 3 5 – 1 Weight at Delivery (grams) <500 . . . . . . . . . . . . . . . . . . . . . . . . . . . . . . . . . . . . . . 9 1 2 – 2 4 – – 500-999 . . . . . . . . . . . . . . . . . . . . . . . . . . . . . . . . . . . . 30 1 6 2 10 10 – 1 1,000-1,499 . . . . . . . . . . . . . . . . . . . . . . . . . . . . . . . . . 49 2 8 7 11 17 – 4 1,500-1,999 . . . . . . . . . . . . . . . . . . . . . . . . . . . . . . . . . 60 3 17 9 14 17 – – 2,000-2,499 . . . . . . . . . . . . . . . . . . . . . . . . . . . . . . . . . 66 2 12 5 22 22 – 3 ≥2,500 . . . . . . . . . . . . . . . . . . . . . . . . . . . . . . . . . . . . 127 9 38 12 26 40 2 – Not stated . . . . . . . . . . . . . . . . . . . . . . . . . . . . . . . . . . . 32 1 5 6 11 5 – 4Note: See Technical Notes: Induced and Spontaneous Terminations of Pregnancy.

21
Table PO17. Live Births, Spontaneous Terminations of ≥28 Weeks Gestation, and Induced Terminations of Pregnancy, by Borough of Residence and Occurrence, New York City, 2010
87
Borough of Residence / Borough of Occurrence
Pregnancy Outcome Total Manhattan Bronx Brooklyn Queens Staten Island
NEW YORK CITY . . . . . . . . . . . . . . . . . . . . . . . . . . . . 208,914 74,506 30,511 55,324 42,146 6,427 Live Births . . . . . . . . . . . . . . . . . . . . . . . . . . . . . . . 124,791 45,403 17,196 32,546 23,465 6,181 Spontaneous Terminations . . . . . . . . . . . . . . . . . . . 373 128 62 94 69 20 Induced Terminations . . . . . . . . . . . . . . . . . . . . . . . 83,750 28,975 13,253 22,684 18,612 226
MANHATTAN . . . . . . . . . . . . . . . . . . . . . . . . . . . . . . . 31,030 27,872 1,282 1,290 571 15 Live Births . . . . . . . . . . . . . . . . . . . . . . . . . . . . . . . 19,646 18,824 400 269 139 14 Spontaneous Terminations . . . . . . . . . . . . . . . . . . . 53 50 1 – 1 1 Induced Terminations . . . . . . . . . . . . . . . . . . . . . . . 11,331 8,998 881 1,021 431 –
BRONX . . . . . . . . . . . . . . . . . . . . . . . . . . . . . . . . . . . . 40,776 12,207 26,998 742 816 13 Live Births . . . . . . . . . . . . . . . . . . . . . . . . . . . . . . . 21,258 5,243 15,661 163 179 12 Spontaneous Terminations . . . . . . . . . . . . . . . . . . . 71 11 60 – – – Induced Terminations . . . . . . . . . . . . . . . . . . . . . . . 19,447 6,953 11,277 579 637 1
BROOKLYN . . . . . . . . . . . . . . . . . . . . . . . . . . . . . . . . 67,546 16,277 397 46,083 3,580 1,209 Live Births . . . . . . . . . . . . . . . . . . . . . . . . . . . . . . . 41,469 9,765 135 29,160 1,214 1,195 Spontaneous Terminations . . . . . . . . . . . . . . . . . . . 128 29 – 91 2 6 Induced Terminations . . . . . . . . . . . . . . . . . . . . . . . 25,949 6,483 262 16,832 2,364 8
QUEENS . . . . . . . . . . . . . . . . . . . . . . . . . . . . . . . . . . . 44,303 8,125 321 3,660 32,158 39 Live Births . . . . . . . . . . . . . . . . . . . . . . . . . . . . . . . 26,955 5,206 125 1,858 19,728 38 Spontaneous Terminations . . . . . . . . . . . . . . . . . . . 69 13 – 2 54 – Induced Terminations . . . . . . . . . . . . . . . . . . . . . . . 17,279 2,906 196 1,800 12,376 1
STATEN ISLAND. . . . . . . . . . . . . . . . . . . . . . . . . . . . . 8,203 1,258 58 1,870 133 4,884 Live Births . . . . . . . . . . . . . . . . . . . . . . . . . . . . . . . 5,580 316 15 565 22 4,662 Spontaneous Terminations . . . . . . . . . . . . . . . . . . . 15 2 – – – 13 Induced Terminations . . . . . . . . . . . . . . . . . . . . . . . 2,608 940 43 1,305 111 209
NON-RESIDENTS . . . . . . . . . . . . . . . . . . . . . . . . . . . . 16,524 8,655 1,433 1,632 4,537 267 Live Births . . . . . . . . . . . . . . . . . . . . . . . . . . . . . . . 9,879 6,048 859 529 2,183 260 Spontaneous Terminations . . . . . . . . . . . . . . . . . . . 37 23 1 1 12 – Induced Terminations . . . . . . . . . . . . . . . . . . . . . . . 6,608 2,584 573 1,102 2,342 7
RESIDENCE UNKNOWN . . . . . . . . . . . . . . . . . . . . . . 532 112 22 47 351 – Live Births . . . . . . . . . . . . . . . . . . . . . . . . . . . . . . . 4 1 1 2 – – Spontaneous Terminations . . . . . . . . . . . . . . . . . . . – – – – – – Induced Terminations . . . . . . . . . . . . . . . . . . . . . . . 528 111 21 45 351 –
Note: See Technical Notes: Induced and Spontaneous Terminations of Pregnancy.

22
88
Age of Woman (Years) Not
Total <15 15-17 18-19 20-24 25-29 30-34 35-39 ≥40 Stated
Induced Termination of Pregnancy, All . . . . . . 83,750 431 4,561 7,578 24,898 20,707 14,009 8,047 3,199 320Racial/Ethnic Group
Hispanic . . . . . . . . . . . . . . . . . . . . . . . . . . . . 27,112 169 1,756 2,843 8,738 6,592 4,156 2,075 679 104Asian and Pacific Islander . . . . . . . . . . . . . . . 4,761 11 105 270 1,037 1,193 1,020 746 355 24Non-Hispanic white . . . . . . . . . . . . . . . . . . . 9,220 26 237 522 2,451 2,430 1,684 1,230 592 48Non-Hispanic black . . . . . . . . . . . . . . . . . . . 38,574 218 2,335 3,621 11,349 9,502 6,447 3,580 1,392 130Other . . . . . . . . . . . . . . . . . . . . . . . . . . . . . . 607 4 40 46 182 127 105 71 31 1Unknown . . . . . . . . . . . . . . . . . . . . . . . . . . . 3,476 3 88 276 1,141 863 597 345 150 13
Marital Status Married . . . . . . . . . . . . . . . . . . . . . . . . . . . . . 11,391 11 47 173 1,583 2,782 3,146 2,422 1,175 52Not married . . . . . . . . . . . . . . . . . . . . . . . . . 69,106 410 4,446 7,128 22,225 17,106 10,363 5,316 1,900 212Unknown . . . . . . . . . . . . . . . . . . . . . . . . . . . 3,253 10 68 277 1,090 819 500 309 124 56
Gestational Age (weeks) ≤6 . . . . . . . . . . . . . . . . . . . . . . . . . . . . . . . . 28,850 88 1,050 2,059 8,086 7,820 5,326 2,993 1,306 1227 - 8 . . . . . . . . . . . . . . . . . . . . . . . . . . . . . . . 24,921 104 1,227 2,144 7,165 6,319 4,389 2,561 932 809 - 10 . . . . . . . . . . . . . . . . . . . . . . . . . . . . . . 13,321 61 807 1,358 4,301 3,102 2,047 1,189 401 5511 - 12 . . . . . . . . . . . . . . . . . . . . . . . . . . . . . 6,000 41 501 714 1,970 1,261 834 448 212 1913 - 15 . . . . . . . . . . . . . . . . . . . . . . . . . . . . . 3,889 28 337 466 1,313 797 501 316 115 1616 - 20 . . . . . . . . . . . . . . . . . . . . . . . . . . . . . 4,137 58 405 552 1,306 839 542 289 134 12≥21. . . . . . . . . . . . . . . . . . . . . . . . . . . . . . . . 1,857 48 205 229 560 376 234 144 50 11Unknown . . . . . . . . . . . . . . . . . . . . . . . . . . . 775 3 29 56 197 193 136 107 49 5
Type of Termination Procedure Suction curettage . . . . . . . . . . . . . . . . . . . . . 61,473 275 3,190 5,353 17,993 15,313 10,551 6,141 2,442 215Sharp curettage / D+C . . . . . . . . . . . . . . . . . 1,643 4 76 99 380 363 350 227 125 19Dilatation and evacuation . . . . . . . . . . . . . . . 9,097 126 880 1,143 2,925 1,840 1,186 672 294 31Intrauterine instillation . . . . . . . . . . . . . . . . . 19 – 1 1 7 3 4 1 2 –Hysterotomy / hysterectomy . . . . . . . . . . . . . 2 – – 1 – – 1 – – –Medical (non-surgical) . . . . . . . . . . . . . . . . . . 11,154 25 388 957 3,475 3,092 1,870 971 322 54Other . . . . . . . . . . . . . . . . . . . . . . . . . . . . . . 7 – 1 – 1 – 1 3 1 –Unknown . . . . . . . . . . . . . . . . . . . . . . . . . . . 355 1 25 24 117 96 46 32 13 1
Note: See Technical Notes: Induced and Spontaneous Terminations of Pregnancy.
Table PO19. Induced Terminations of Pregnancy by Woman’s Marital Status, Age, and Racial/Ethnic Group, New York City, 2006-2010
Table PO18. Induced Terminations of Pregnancy by Selected Characteristics and Age of Woman, New York City, 2010
88
2006 2007 2008 2009 2010Marital Status (Percent) Married . . . . . . . . . . . . . . . . . . . . . . . 14.2 13.9 14.2 14.2 13.6 Not married . . . . . . . . . . . . . . . . . . . . 83.6 83.6 83.3 83.6 82.5 Unknown . . . . . . . . . . . . . . . . . . . . . . 2.2 2.5 2.6 2.2 3.9Age of Woman (Years) <15 . . . . . . . . . . . . . . . . . . . . . . . . . . 472 470 457 461 431 15 - 19 . . . . . . . . . . . . . . . . . . . . . . . . 15,058 14,844 14,276 13,577 12,139 20 - 24 . . . . . . . . . . . . . . . . . . . . . . . . 26,105 26,529 25,998 25,365 24,898 25 - 29 . . . . . . . . . . . . . . . . . . . . . . . . 22,303 22,389 21,949 21,702 20,707 30 - 34 . . . . . . . . . . . . . . . . . . . . . . . . 14,183 14,171 14,459 14,330 14,009 35 - 39 . . . . . . . . . . . . . . . . . . . . . . . . 8,538 8,802 8,665 8,324 8,047 ≥40 . . . . . . . . . . . . . . . . . . . . . . . . . . 3,119 3,242 3,247 3,176 3,199 Unknown . . . . . . . . . . . . . . . . . . . . . . 379 423 418 338 320Ethnic Group Hispanic . . . . . . . . . . . . . . . . . . . . . . . 29,678 28,896 28,921 28,364 27,112 Asian and Pacific Islander . . . . . . . . . . 4,959 5,444 5,557 5,212 4,761 Non-Hispanic white . . . . . . . . . . . . . . 9,781 10,221 10,451 9,853 9,220 Non-Hispanic black . . . . . . . . . . . . . . 42,289 42,814 41,857 40,798 38,574 Other . . . . . . . . . . . . . . . . . . . . . . . . . 635 518 396 349 607 Unknown . . . . . . . . . . . . . . . . . . . . . . 2,815 2,977 2,287 2,697 3,476Total . . . . . . . . . . . . . . . . . . . . . . . . . . . 90,157 90,870 89,469 87,273 83,750
Note: See Technical Notes: Induced and Spontaneous Terminations of Pregnancy.

23 78
Rates and Ratios Defined
The numerators of the rates in these tables are events occurring in New York City and reported during the year, unless otherwise specified. The denominator is theresident population figure, including all ages and both sexes, unless otherwise specified.
Live Birth Rate - The number of live births per 1,000 population. Perinatal Mortality Ratio - The number of fetal deaths of 28 weeks gestation and Live Births x 1,000 greater plus the number of early neonatal (under seven days) deaths per 1,000 fetal Population deaths of 28 weeks gestation and greater plus live births.
( Fetal Deaths 28 Weeks and Over + Infant Deaths Under 7 Days ) x 1,000Marriage Rate - The number of marriages per 1,000 population. Fetal Deaths 28 Weeks and Over + Live Births Marriages x 1,000 Population Death Rate, all causes - The number of deaths per 1,000 population.
Deaths All Causes x 1,000Infant Mortality Rate - The number of infant (under one year of age) deaths Populationper 1,000 live births.Neonatal Mortality Rate - The number of neonatal (under 28 days) deaths per Death Rate, specified causes The number of deaths due to a specified cause1,000 live births. per 100,000 population.Post-neonatal Mortality Rate - The number of post-neonatal (28 days to under Death Rate, age and sex specific The number of deaths of persons of specifiedone year of age) deaths per 1,000 live births. age and sex per 1,000 population of the specified age and sex. Infant Deaths x 1,000 Death Rate, age, sex and race adjusted - The number of deaths per 100,000 standard Live Births population. Age, sex and race specific death rates are applied to a standard population
eliminating the effect of differences in population composition, and allowingFetal Death Ratio - The number of fetal deaths of 28 weeks gestation and comparisons over time or between geographic areas.over per 1,000 live births. Maternal Mortality Ratio - The number of deaths due to complications of pregnancy, Fetal Deaths 28 Weeks and Over x 1,000 childbirth and the puerperium occurring within 42 days of delivery per 100,000 live Live Births births.
Fertility Rate - Live births per 1,000 women aged 15-44 years. Fetal-infant Mortality Rate The number of fetal deaths of 24 weeks gestation and Live Births x 1,000 greater plus infant deaths per 1,000 live births and fetal deaths, excluding weight at Female Population Aged 15-44 delivery less than 500 grams.
(Fetal Deaths 24 Weeks and Over+Infant Deaths) x 1,000 (Fetal Deaths 24 Weeks and Over+Live Births)

24
VITAL EVENT REPORTINGData on births and induced and spontaneous terminations of pregnancy are based on certificates filed with the New York City Department of Health and Mental Hygiene (DOHMH). In 2010, most (99.6%) birth certificates were filed electronically through the Electronic Vital Events Registration System (EVERS). All induced and spontaneous terminations, regardless of gestational age or weight, are reported and filed on paper. Vital event data are based on the year they occurred in New York City to both residents and non-residents. Any events registered after file closure are excluded from this report. Such late registrations are rare.
POPULATION
citywide
The New York City Department of City Planning (DCP) provides the Bureau of Vital Statistics with Census Data based on the United States Census as of April 1, 2010 and updated intercensal population estimates as of July 1 for 2001-2010. The US Census population count for New York City is 8,175,133 in 2010. Smaller geographical areas and demographic groups are derived by DCP using population data files from the 2010 Census. In the 2010 Summary of Vital Statistics, tables or figures with single-year data use the 2010 Census population count; tables and figures with trend data use updated intercensal population estimates. See the 2010 Annual Summary Historical Technical Notes table for population data used before 2010.
race/ethnicity categOries
Beginning with the 2000 Census, respondents could describe themselves and household members as being of more than one race, selecting at least one of six race categories: white, black, American Indian and Alaska Native, Asian, Native Hawaiian and other Pacific Islander, and some other race(s). These categories yield 63 possible combinations. Respondents also were asked if they were of Hispanic origin. The resulting responses could be organized into 64 groups. DCP collapses these groups into seven categories: Hispanic origin, non-Hispanic white, non-Hispanic black, non-Hispanic Asian or Pacific Islander, non-Hispanic American Indian and Alaska Native, non-Hispanic of some other race, and non-Hispanic of two or more races, which the DCP refers to as “mutually exclusive race and Hispanic categories. The first four of these categories are reflected in the Vital Statistics Summary variable “ethnic group,” with a 5th that combines non-Hispanic American Indian and Alaska Native, non-Hispanic of some other race, non-Hispanic of two or more races, and other or multiple race. For more information, see “Race, Ancestry, and Ethnic Group.”
cOmmunity district
In 2010, Community District population data are provided by DCP. In 2008-2009, Community District population estimates used the United States (US) Census Bureau Population Estimate Program and housing unit data from DCP. The “housing unit method” of estimation allocates the population to Community Districts. The method multiplies the estimated number of households in a given area by an estimate of the population per household. In the intercensal context, housing unit growth, measured by housing permit data, determines the locations of growth. Because these estimates are calibrated to equal US Census-borough-specific population totals, the borough population per household is fixed. New population estimates are derived using the iterative proportional fitting procedure (IPFP) implemented in SAS® version 9.2. The validity of these estimates depends on vacancy rates, housing unit loss rates, percentage of permits actually constructed, and time to complete construction, which is assumed consistent at the borough level and thus has no effect on the allocation of growth. The method is sensitive to the quality of the housing permit data, which does not identify residential conversions to multiple units. Demographic characteristics are allocated assuming those at the location of growth. Therefore, this approach does not capture intercensal demographic change at the neighborhood level, including change due to migration.
age categOries
Before 2010, in order to calculate the rates of teen events, population estimates are derived for each intercensal year using the housing unit method of estimation (see Community District, above) for 22 age groups, as opposed to the standard 18 age groups. In 2010, rates of teen events are calculated by using 2010 Census single-year population data.
DEMOGRAPHIC CHARACTERISTICS OF VITAL EVENTS
race, ancestry, and ethnic grOuP
Race and ancestry are two separate items on the certificates. Parents report this information on the birth certificate. As of 2008, the birth certificate allows for the selection of multiples races. Responses are coded following rules from the National Center for Health Statistics (NCHS). The ordered selection rules for defining ethnic group first assign Puerto Rican or other Hispanic ethnicities based on ancestry, regardless of race. Then, those of other or unknown ancestries are classified by race as Asian, non-Hispanic white, non-Hispanic black, and other/multiple race/unknown.
Ancestry is defined by NCHS as the nationality, lineage, or country where the subject’s ancestors were born before their arrival in the US. If a religious group is reported, NCHS instructions are to ask for the country of origin or nationality. New York City receives enough certificates with ancestry reported as Jewish or Hebrew to warrant inclusion in these tables, notwithstanding the religious meaning of the terms. Persons whose race is black and whose ancestry is American are classified as being of African American ancestry.
PREGNANCY OUTCOMES, TECHNICAL NOTES, 2010
25
BirthPLace
Starting in 2007, mother’s birthplace is categorized as: “United States, including its territories,” “Foreign,” and “Not stated.” “United States, including its territories” includes Puerto Rico, the US Virgin Islands, and Guam. If mother’s birthplace is classified by country-specific categories, Puerto Rico is categorized apart from the US.
GEOGRAPHICAL UNITS
data PresentatiOn
Tables that stratify by location of residence (e.g., borough) separate data for non-residents and residence-unknown categories. Tables that do not stratify by location of residence combine all vital events registered in New York City, regardless of residence.
Vital events that occurred to New York City residents while outside of New York City are not included in this report.
PLace Of Birth
Since 1996, home births in Tables PO4 and PO5 include all events for which “Home” was selected as the “Type of Place” regardless of whether the certificate was filed through a hospital. Home births in Table PO1 include events for which “home” was selected as “Type of Place” and the certificate was not filed by an institution; typically, these events were filed by the person who attended to the birth at home.
Table PO1 described the live births according to the borough in which the birth occurred. Prior to 2010, Table PO1 reported births according to the borough in which the reporting office was located. This primarily affects the frequency of “places other than a hospital or home” and “home births,” which occur citywide but are frequently reported by the Bureau of Vital Statistics in Manhattan.
BOrOugh Of residence
Borough of residence and other geographic classifications are based on the usual residence reported on the certificate.
cOmmunity district (cd) Community districts were established by City Charter in 1969 for the delivery of city services. Population figures for these districts are compiled by DCP from census tract and census block data. The sum of the community district populations in each borough may not equal the borough population or the citywide population because Community Districts may cross borough boundaries. Since 1985, assignments to geographic areas smaller than borough, such as community district, are made through the Geosupport Program, which is developed and maintained by the DCP. Additional information on community district geography can be found at www.nyc.gov/dcp.
BIRTHS
Birth rePOrting
All births must be filed within five business days of the event. Data are generally collected using two worksheets: mother/parent and facility worksheets. Guides for the completion of the birth certificate and data entry can be found at http://www.nyc.gov/evers. Effective January 2008, BVS requires all hospitals registering more than 100 births per year to use the Electronic Birth Registration System (EBRS); in 2010, 99.6% of all births were registered electronically.
data PresentatiOn
Starting with the 2007 summary, items with unknown/not stated values are excluded from the denominator when calculating percentages. This affects Tables PO6, PO7, PO11, PO12 and Maps: PO1, PO2, PO3, and PO4.
Birth data QuaLity
Data quality improved in 2010, allowing ‘Late or No Prenatal Care’ to be reported for the first time since 2007.
The increasing number of women reporting “unknown” race is reflected in the ethnicity “not stated” categories in Tables PO3 and PO5. This increase began with electronically filed records. In Tables PO2 and PO6, the number of women categorized as reporting “other” ancestry has increased due to data entry errors. This slightly affected the overall distribution of live births by ancestry. In Figure PO3, “Other or Unknown” includes “two or more races.”
mOther’s maritaL status
The New York City DOHMH is prohibited by local law from recording mother’s marital status on the record or report of birth. For this Summary of Vital Statistics, these data are estimated and should be interpreted with caution. Since 1997, marital status is computed using the following algorithm: certificates without the father’s name and those with the father’s name that are accompanied by an Acknowledgment of Paternity are categorized as non-married; all others are categorized as married.
teen Births
Teen birth counts include all births occurring to women under the age of 20 years (see Tables PO11 and PO12). Teen birth rates are limited to teens aged 15 to 19 years (Tables PO10 and PO11) for whom population denominators can be applied to compute a reliable rate.
PREGNANCY OUTCOMES, TECHNICAL NOTES, 2010 (CONTINUED)

26
gestatiOnaL age
Gestational age, or clinical estimate of gestation, is defined as the best obstetric estimate of the infant’s gestation in completed weeks based on the birth attendant’s final estimate of gestation. Characteristics of live births and/or infant deaths in the Tables PO4-PO7, PO11, PO12, and Figure PO4, respectively, include either gestational age categories or a dichotomous indicator of preterm (<37 weeks gestation) birth. In 2007, the range for valid gestational age was changed from 20-44 weeks to 17-47 weeks.
INDUCED AND SPONTANEOUS TERMINATIONS OF PREGNANCYinduced and sPOntaneOus terminatiOns Of Pregnancy rePOrting
By law, all terminations must be reported. However, the number of induced and spontaneous terminations filed depends to some extent on the outreach conducted by BVS. Spontaneous and induced terminations reported for a given year include events occurring in the year of report and registered prior to the official closing date for that year of report.
27
new yOrk city certificates Of Birth, sPOntaneOus terminatiOn and induced terminatiOn Of Pregnancy
The paper Birth, Spontaneous Termination, and Induced Termination Certificate forms are shown below. A birth or termination of pregnancy certificate must be filed for each pregnancy, regardless of gestational age attained.
Birth certificate The birth certificate comprises two parts: the certificate of birth and the confidential medical report of birth. The current revision of the birth certificate, implemented in 2008, is based on the recommended 2003 US Standard Certificate of Live Birth (http://www.cdc.gov/nchs/data/dvs/birth11-03final-ACC.pdf). The 2008 revision coincided with the January 2008 electronic filing requirement. For detailed information on birth certificate revisions, please see Technical Notes from the 2008 Summary of Vital Statistics (http://www.nyc.gov/html/doh/downloads/pdf/vs/2008sum.pdf.)
The certificate of birth is the legal record. Each certificate is authenticated by the medical provider (physician or midwife) or his or her representative and filed with the New York City Department of Health and Mental Hygiene.
The confidential medical report, used for the compilation of public health statistics and scientific purposes, includes parents’ demographic information, mother’s prenatal history and care, information on financial coverage, maternal morbidity, labor and delivery, and condition and treatment of the infant during, and immediately after, birth. These data are collected from the mother, the mother’s and infant’s medical records, and medical providers.
sPOntaneOus terminatiOn Of Pregnancy certificateLike the birth certificate, the spontaneous termination of pregnancy certificate has two parts, the certificate and the confidential medical report. The certificate is available to the mother. The confidential medical report information is collected for the compilation of public health statistics and scientific purposes.
.
induced terminatiOn Of Pregnancy certificateInduced certificate of pregnancy certificates are not issued. Data are collected for the compilation of public health statistics and scientific purposes.

28

29

30
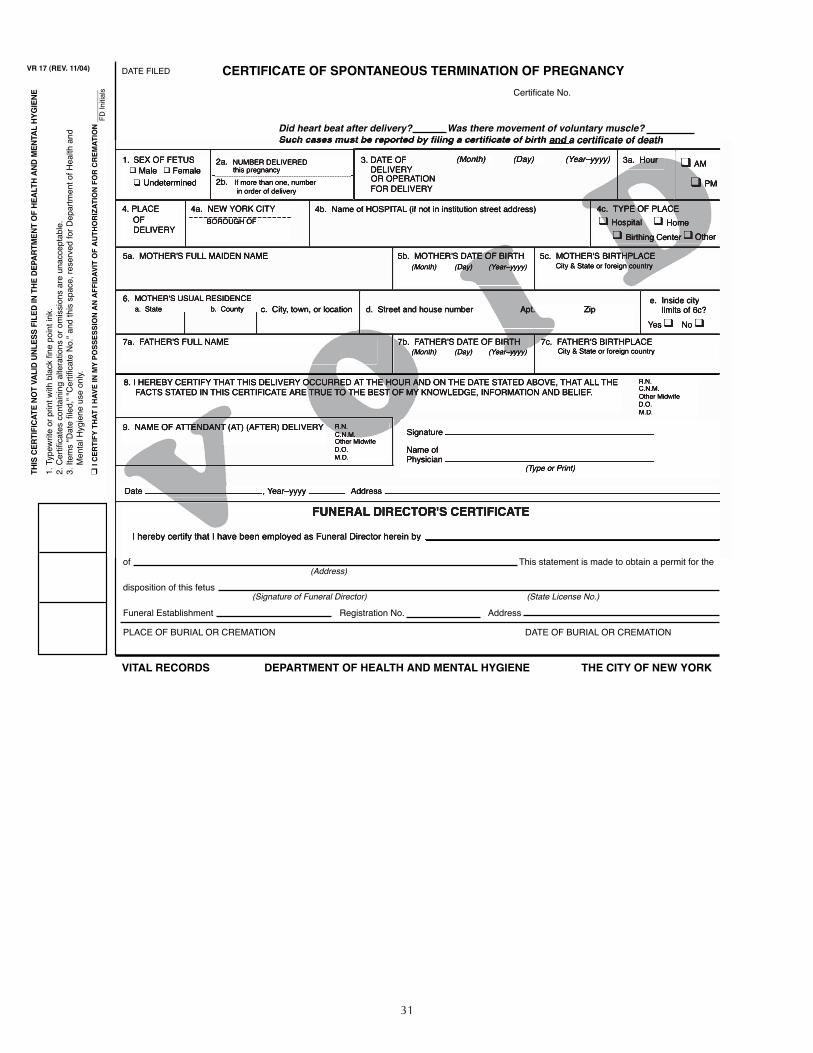
31
� AM
� PM
4c. TYPE OF PLACE� Hospital � Home
� Birthing Center � Other
3. DATE OFDELIVERYOR OPERATIONFOR DELIVERY
CERTIFICATE OF SPONTANEOUS TERMINATION OF PREGNANCYCertificate No.
DATE FILED
1. SEX OF FETUS� Male � Female
� Undetermined
(Month) (Day) (Year–yyyy) 3a. Hour2a. NUMBER DELIVEREDthis pregnancy
2b. If more than one, numberin order of delivery
4. PLACEOFDELIVERY
4a. NEW YORK CITYBOROUGH OF
4b. Name of HOSPITAL (if not in institution street address)
5a. MOTHER'S FULL MAIDEN NAME 5b. MOTHER'S DATE OF BIRTH(Month) (Day) (Year–yyyy)
5c. MOTHER'S BIRTHPLACECity & State or foreign country
6. MOTHER'S USUAL RESIDENCEa. State b. County c. City, town, or location d. Street and house number Apt. Zip
e. Inside citylimits of 6c?
Yes � No �
7a. FATHER'S FULL NAME
9. NAME OF ATTENDANT (AT) (AFTER) DELIVERY
7b. FATHER'S DATE OF BIRTH (Month) (Day) (Year–yyyy)
7c. FATHER'S BIRTHPLACECity & State or foreign country
R.N.C.N.M.Other MidwifeD.O.M.D.
Signature
Name ofPhysician
(Type or Print)
Did heart beat after delivery? Was there movement of voluntary muscle?Such cases must be reported by filing a certificate of birth and a certificate of death
8. I HEREBY CERTIFY THAT THIS DELIVERY OCCURRED AT THE HOUR AND ON THE DATE STATED ABOVE, THAT ALL THEFACTS STATED IN THIS CERTIFICATE ARE TRUE TO THE BEST OF MY KNOWLEDGE, INFORMATION AND BELIEF.
R.N.C.N.M.Other MidwifeD.O.M.D.
Date , Year–yyyy Address
FUNERAL DIRECTOR'S CERTIFICATE
I hereby certify that I have been employed as Funeral Director herein by
of This statement is made to obtain a permit for the
disposition of this fetus
Funeral Establishment Registration No. Address
PLACE OF BURIAL OR CREMATION DATE OF BURIAL OR CREMATION
VITAL RECORDS DEPARTMENT OF HEALTH AND MENTAL HYGIENE THE CITY OF NEW YORK
THIS
CER
TIFI
CATE
NO
T VA
LID
UNLE
SS F
ILED
IN T
HE D
EPAR
TMEN
T O
F HE
ALTH
AND
MEN
TAL
HYG
IENE
1. T
ypew
rite
or p
rint w
ith b
lack
fine
poi
nt in
k.2.
Cer
tific
ates
con
tain
ing
alte
ratio
ns o
r om
issi
ons
are
unac
cept
able
.3.
Item
s "D
ate
filed
," "C
ertif
icat
e N
o." a
nd th
is s
pace
, res
erve
d fo
r Dep
artm
ent o
f Hea
lth a
nd
Men
tal H
ygie
ne u
se o
nly.
� I
CER
TIFY
TH
AT I
HAV
E IN
MY
POSS
ESSI
ON
AN
AFF
IDAV
IT O
F A
UTH
OR
IZAT
ION
FO
R C
REM
ATIO
N _
____
___
VR 17 (REV. 11/04)
(Address)
(Signature of Funeral Director) (State License No.)
FD In
itial
s

32
CONFIDENTIAL MEDICAL REPORTOnly for scientific purposes approved by the Commissioner. Not open to inspection or subject to subpoena
SURNAME OF MOTHER: ____________________________________________________________ CERTIFICATE NO.
16. Last NormalMenses BeganMo./Day/Yr-yyyy a. Total Previous
PregnanciesNumber ____
None �
b. Now LivingNumber ____None �
c. Now DeadNumber ____None �
d. Under 13 WksNumber ____None �
g. Under 13 WksNumber ____None �
e. 13 to 19 WksNumber ____None �
h. 13 to 19 WksNumber ____None �
f. 20 Wks or moreNumber ____None �
i. 20 Wks or moreNumber ____None �
17. Previous Pregnancies (Complete all sections)Born Alive Spontaneous Terminations Induced Terminations
18. Weight at Delivery
_______lbs _______ ozs (1)OR
______________ grams (2)� Not Weighed (3)
19. Autopsy performed
1 � Yes 2 � No
20. Clinical Estimate of Gestation
________________Weeks
21. Fetus Died:
Before During At UnknownLabor Labor Delivery
1 � 2 � 3 � 4 �
22. This Termination of Pregnancy was caused by Fetal or Maternal
a. Immediate Cause
b. Due to
c. Due to
PART 2. Other significant conditions of conceptus or mother
PART
1
FOR GESTATION OF 20 WEEKS OR MORE REMAINDER OF CERTIFICATE MUST BE COMPLETED
MEDICAL RISK FACTORSFOR THIS PREGNANCY
(Check all that apply)
01 � Anemia (Hct. < 30/Hgb. < 10)02 � Cardiac disease03 � Acute or chronic lung disease
Diabetes04 � Gestational05 � Chronic06 � Genital herpes07 � Other STD08 � Hydramnios/Oligohydramnios09 � Hemoglobinopathy10 � Hepatitis
Hypertension11 � Chronic12 � Pregnancy-associated13 � Preeclampsia14 � Eclampsia15 � Incompetent cervix16 � Previous infant 4000 + grams17 � Previous preterm or small-for-
gestational-age infant18 � Renal disease19 � Rh sensitization
Uterine bleeding21 � Trimester – 122 � Trimester – 223 � Trimester – 300 � None24 � Other
OTHER RISK FACTORSFOR THIS PREGNANCY
(Check all that apply)
a. Tobacco use during pregnancy 1 � Yes � No
Average number of cigarettes per day
Alcohol use during pregnancy 2 � Yes � No
Average number of drinks per week
Heroin 3 � Yes � NoCocaine 4 � Yes � NoMethadone 5 � Yes � NoMarijuana 6 � Yes � NoSedatives, Tranquilizers,AnticonvulsantsSpecify 7Other DrugsSpecify 8
0 � None of the above
b. WeightPrepregnancy Weight
Weight gained during pregnancy
c. Radiation exposure during pregnancy?0 � No 1 � YesIf yes specify Trimester and Type
COMPLICATIONS OF LABORAND/OR DELIVERY(Check all that apply)
01 � Anesthetic complications02 � Abruptio placenta03 � Placenta previa04 � Other excessive bleeding05 � Cord Prolapse06 � Conditions of Cord07 � Fetal distress08 � Cephalopelvic disproportion09 � Chorioamnionitis10 � Meconium staining11 � Premature rupture of
membranes (> 12 hours)12 � Seizures during labor13 � Precipitous labor (< 3 hours)14 � Prolonged labor (> 20 hours)15 � Failure to Progress16 � Breech/Malpresentation17 � Febrile (> 100°F. or > 38°C)00 � None18 � OtherSpecify
OBSTETRIC PROCEDURES(Check all that apply)
a. Amniocentesis01 � Genetic02 � Maturity03 � Stress Test04 � Non Stress Test
Electronic Fetal Monitoring05 � Internal06 � External07 � Scalp Sampling08 � Tocolysis09 � Other
Specify ________________________00 � None
01 � b. Induction02 � Stimulation03 � Both00 � Neither
Indication for Induction or StimulationSpecify ________________________
c. Ultrasonography examsNumber ______
0 � None
39 Other Procedures Performed at DeliverySpecify __________________________
0 � None
METHOD OF DELIVERY(Check all that apply)
01 � Vaginal02 � Vaginal after any prior C-section03 � Primary C-section04 � Repeat C-section05 � Breech Extraction06 � Mid Forceps07 � Low Forceps08 � Vacuum09 � Other, Specify
34. Prior C-section0 � No 1 � Yes
37. Indication for C-sectionSpecify
31. Was Hospital Of This Delivery a:1 � Prelabor Referral for High Risk2 � Emergency Transfer Prior To DeliverySpecify Transfer From0 � Neither
25. Mother'sBloodGroupand Rh
c. Total NumberOf Visits toAll Providers
0 � NONE
b. ProvidersCheck all that apply
1 � Hosp. 4 � SHF2 � MIC 5 � Pvt Phy
6 � Other3 � Other Clinic
a. DateFirst VisitTo Any Provider
Month Day Year-yyyy
30. Mother Was
1 � Private Physician's Patient
2 � General Services Patient
29. During This Pregnancy Did MotherParticipate in:1 � WIC 4 � AFDC2 � PCAP 5 � Other3 � MOMS Specify
0 � None
28. Primary FinancialCoverage This Pregnancy1 � Medicaid2 � HMO3 � Other 3rd Party4 � Self
23. Pregnancy History DateMonth Year-yyyy
a. First Live Birth
b. Last Live Birth
c. Last Other Termination
26. Congenital Anomalies Spec-ify
27a. Type of Anesthesia Specify
b. Type of Analgesia Specify
Prenatal Care24.
32. 33. 35.
38.
36.
VR 17 (REV. 11/04)
10. Race-White, Black,American Indian,Chinese, AsianIndian, Other specify
13. Occupation:Mother, most recentFather, usual
14. Kind ofbusiness orindustry
15. EmployedDuringThis Pregnancy
11. Ancestry (African -AmericanChinese, Cuban, GermanItalian, Puerto Rican etc.)
12. Education (Record highestyear completed)
Elem/Secondary0 - 12
College1-4 or 5 +
MOTHER
FATHER
10a.
10b.
11a.
11b.
12a.
12b.
13a.
13b.
14a.
14b.
15a. 1 � Yes0 � No
95

33
INST.
B
R
A
E
1. PLACE OF TERMINATION (Name and address of doctorʼs office, hospital,or other facility)
11. PREVIOUS PREGNANCIES (Complete all sections)
4. PATIENT'S DATE OF BIRTHMonth Day Year–yyyy
3a. LAST NAMEFirst Two Letters
6. PATIENT'S USUAL RESIDENCE (Check only one)
a. NEW YORK CITY(Check one)1 � Manhattan2 � Bronx3 � Brooklyn4 � Queens5 � Staten Island
12. DATE LAST NORMAL MENSES BEGANMonth Day Year–yyyy
13. CLINICAL ESTIMATE OF GESTATION
Weeks
14. SONOGRAM PERFORMED
1 � Yes 2 � No
15. PRIMARY FINANCIAL COVERAGE THIS TERMINATION (Check only one)
1 � Medicaid 2 � Other Insurance 3 � Patient Pay
PRESENT TERMINATION
BORN ALIVE OTHER TERMINATIONSPrevious Pregnancies
a. None �
NOW LIVING
b. Number
None �
NOW DEAD
c. Number
None �
SPONTANEOUS
d. Number
None �
INDUCED
e. Number
None �
10. EDUCATION (Record ONLY highest year completed)
Elem/Secondary College0–12 1–4 or 5+
9. ANCESTRY (African-American, Chinese, Cuban,German, Italian, Puerto Rican, etc.)
7. PATIENT'S BIRTHPLACE (City & State OR Foreign Country)
5. MARRIED
1 � Yes 2 � No
8. PATIENT'S RACE � White � Black � Asian� Other
b. NEW YORK STATE OUTSIDE NEW YORK CITY(Including Nassau, Suffolk, Westchester)
6 � Specify County
Specify City, Town, or Location
c. OUTSIDE NEW YORK STATEUS City and State (Specify)
8 �ORForeign Country (Specify)
8 �
PatientʼsZip Code
2. DATE OF PROCEDURE FOR TERMINATION
Month Day Year–yyyy
CERTIFICATE NO.(For Health Dept. Use Only)
156 —
1 � In-Patient 2 � Out-Patient
16. TYPE OF TERMINATION PROCEDURES(Check only one)
10 � Suction Curettage
20 � Sharp Curettage (D&C)
30 � Dilation and Evacuation (D&E)
40 � Intra-Uterine Instillation (Saline or Prostaglandin)
50 � Hysterotomy/Hysterectomy
65 � Medical (Nonsurgical)
Specify Medication(s)
80 � Other (Specify)
PHYSICIAN'S NAME, ADDRESS (Type, Print, Stamp)
DATE
PHYSICIAN'S SIGNATURE
I HEREBY CERTIFY THAT I ATTENDED THIS PATIENT (AT) (AFTER) THIS TERMINATION AND THAT ALL THE FACTS STATED IN THISCERTIFICATE ARE TRUE TO THE BEST OF MY KNOWLEDGE, INFORMATION AND BELIEF.
b. FIRST NAMEFirst Two Letters
CERTIFICATE OF INDUCED TERMINATION OF PREGNANCYUse this form ONLY for induced terminations whether surgical or medical
Only for scientific purposes approved by the Commissioner of Health and Mental Hygiene:not open to inspection or subject to subpoena
DATE FILED (For Health Dept. Use Only)
OFFICE OF VITAL RECORDS DEPARTMENT OF HEALTH AND MENTAL HYGIENE THE CITY OF NEW YORKVR-18 (Inst. # X988)(REV. 11/04)
}
� M.D.� D.O.
(Month/Day/Year–yyyy)


![[XLS]Permit Statistical Report - Welcome to NYC.gov | City of …home.nyc.gov/html/dob/downloads/excel/per092411.xls · Web viewNASIR COBAJ EUROCON GROUP CORP 32 GRAMERCY PARK SOUTH](https://img.pdfslide.us/doc/110x75/5ad6d24d7f8b9a32618b8d21/xlspermit-statistical-report-welcome-to-nycgov-city-of-homenycgovhtmldobdownloadsexcel.jpg)