Embed Size (px)
Citation preview

Healthy life expectancy: technical paper
Version 10: December 2016
1 of 25
Contents
Background and publication history...................................................................................3
Acknowledgements............................................................................................................3
Contacts.............................................................................................................................4
1 Methodology and source data.........................................................................................5
1.1 General methodology..............................................................................................51.2 Population estimates...............................................................................................51.3 Deaths.....................................................................................................................5
1.3.1 Imputation of ‘area of residence’ for death records..........................................51.4 Self-assessed health (SAH)....................................................................................6
1.4.1 Comparison of SAH in 2001 Census and Scottish Household Survey (SHoS) 2001.......................................................................................................................... 71.4.2 SHoS weighting revision...................................................................................81.4.3 SHoS SAH question change............................................................................8
1.5 Life tables..............................................................................................................111.6 Reliability of the data for HLE calculations............................................................121.7 Differences in methodology for calculating LE and HLE between ScotPHO and other organisations......................................................................................................13
2. Data availability and size of sub-groups within Scotland.............................................14
2.1 Intermediate geography........................................................................................153. General caution............................................................................................................15
4. Communal establishments...........................................................................................15
5. Recommendations for further work..............................................................................16
6. Geographical notes......................................................................................................16
7. References...................................................................................................................18
Appendix A: Publication Pre-release Access...................................................................19
Appendix B: December 2016 publication metadata summary table.................................20
Appendix C: Use of the HLE information.........................................................................23
2 of 25

Background and publication historyThis technical paper was written to accompany the ScotPHO website topic healthy life expectancy (HLE).
ISD staff who are a part of the ScotPHO collaboration produce this Official Statistics publication on behalf of ScotPHO. The ultimate responsibility for the publication lies with ISD’s Head of Profession.
ScotPHO is a collaboration led by ISD and NHS Health Scotland, and includes the Glasgow Centre for Population Health, National Records of Scotland (NRS) and Health Protection Scotland. ScotPHO’s aim is to make public health information more accessible and usable to improve health and reduce inequalities in Scotland. For further information on ScotPHO, including the National Statistics accreditation of certain topics, see the About ScotPHO page which will be updated when topics are accredited.
It should be noted that whilst ScotPHO ISD publishes Scotland's definitive HLE estimates (alongside corresponding LE estimates for the same time-periods and geographies, to allow an estimation of the time expected to be spent in 'not healthy' health), the Office for National Statistics publishes the definitive Scotland-level LE estimates (based on interim life tables) on behalf of NRS. NRS publishes definitive estimates of LE for areas within Scotland.
Publication history
The topic and technical paper were first published on 16 December 2008.
For further details of current and historic releases of the HLE webpage content please see the ScotPHO Healthy Life Expectancy Archive page.
For further details of the latest publication see Appendices A and B of this document.
AcknowledgementsWe are very grateful to David Clark, Amy McKeon, Matt Sutton and Rachael Wood, and members of the 2004 HLE Measurement in Scotland Steering Group, who produced the first healthy life expectancy estimates for Scotland in 2004.
In updating and expanding upon that work, we would like to thank National Records of Scotland (NRS) and the Scottish Government for supplying the raw data (population estimates; death registrations; and self-assessed health data from the Scottish Household Survey, Scottish Health Survey and Scotland Census). NRS also provided the LE estimates for deprivation deciles in 2004-06, 2006-08, 2008-10 and 2010-12.
We are also indebted to a number of people in the Information Services Division (ISD) of NHS National Services Scotland, Fife NHS Board, the Medical Research Council Social and Public Health Sciences Unit, NRS, the Scottish Government, EurOHex (formerly the European Health Expectancy Monitoring Unit) and the Office for National Statistics (ONS). They provided invaluable advice on methodology and/or comments on drafts of both the healthy life expectancy web pages and this technical paper. Any error or lack of clarity that remains is, however, our own.
3 of 25

ContactsVictoria ElliottPrincipal Information [email protected]: 0131 275 7446
Scottish Public Health Observatory (ScotPHO)Health Improvement TeamNHS Information Services (ISD)Gyle Square1 South Gyle CrescentEdinburgh EH12 9EBUK
4 of 25

1 Methodology and source data
1.1 General methodology
Two types of data are required to calculate life expectancy (LE); population estimates and deaths. A third component, health status (for example self-assessed general health) is also required to calculate healthy life expectancy (HLE).
1.2 Population estimates
Mid-year population estimates from National Records of Scotland (NRS) were used in all analyses. Population estimates for all sub-groups within Scotland except NHS Board and local authority area were based on aggregates of data zones (for further details, see section 6.)
This might lead to a few slight differences in the LE and HLE estimates for coterminous areas such as the island NHS Boards and the corresponding local authority areas (e.g. Orkney). In addition, for the LE and/or HLE results by local authority area and deprivation decile, the populations for the 5-year period 1994-1998 were estimated from the 1996 figures multiplied by 5 (Population estimates based on aggregates of data zones were not available for 1994 and 1995.) As the NHS Board analyses for 1994-1998 used NHS Board population estimates which were available for each year, this might also result in a few slight differences in the LE and HLE estimates for coterminous areas such as the island NHS Boards and corresponding local authority areas.
Additionally, there may be an effect on LE and HLE of rebasing population estimates in the light of new releases of Census populations. The LE and HLE figures for Scotland from 2011 onwards use the mid-year population estimates based on the 2011 Census populations.
In August 2013, the published 2011 LE and HLE figures based on rebased population estimates, were compared with the figures which would have been obtained had the original (2001-Census based) mid-year estimates been used. The results indicated a small difference of up to 0.1 years; LE at birth was published as 76.6 years (males) and 80.9 years (females) compared with 76.5 years (males) and 81.0 years (females) using the original 2001 mid-year estimates. Similarly, HLE at birth was published as 60.4 years (males) and 62.7 years (females) compared with 60.3 years (males) and 62.7 years (females) using the original 2001 mid-year estimates.
1.3 Deaths
Death registration records were provided by National Records of Scotland (NRS). For consistency with LE analyses by other organisations, the LE and HLE analyses were based on year of registration, not year of death. (This makes only a small difference as most deaths are registered in the same year as the death occurred.) Note that a very small number of death records had to be excluded as their date of birth was missing or ‘unknown’ (e.g. over the period 1994-2005, out of 703,111 death records, 11 were excluded for this reason). In 2007 and 2009, a total of 4 death records for newborn babies had sex recorded as ‘unspecified’; these were assumed to be male.
1.3.1 Imputation of ‘area of residence’ for death records
The death records used in the analyses included residents of Scotland dying in Scotland, plus non-residents of Scotland dying in Scotland. This ensured consistency with the NRS published statistics which are of all deaths which occurred, and were registered, in Scotland (see for example NRS vital events reference tables, Section 5).
Less than 1% of total deaths in Scotland are to non-residents. Records of Scottish residents dying outwith Scotland are not available because there is no comprehensive system to collect them, but the number of such records is assumed to be very small relative to the number of deaths occurring in Scotland. Therefore, including deaths of non-residents who die in Scotland, and excluding
5 of 25

deaths of Scottish residents dying outwith Scotland, is likely to have little effect on the LE and HLE estimates.
Clearly, non-residents (such as tourists or other visitors) who die in Scotland do not have an area of residence within Scotland. For analyses of sub-groups within Scotland, the ‘pseudo area of residence’ of the non-residents was imputed based on the known areas of residence of the residents dying in Scotland. The imputation technique assigned the required 'pseudo area of residence' to the relevant death records, based on the pro-rata expected numbers for each time period, age and sex. It is considered that this approach is preferable to either omitting the non-resident deaths (which would then over-estimate LE) or assigning them to their place of death in Scotland. Assigning to place of death would distort LE for areas with a particularly low or high death rate for non-residents.
A similar procedure was used to assign non-residents to ‘pseudo deprivation level’ or ‘pseudo urban rural classification’.
The use of imputation on death records is another reason why there may be a few slight differences in LE and HLE estimates for coterminous areas such as the island NHS Boards and corresponding local authority areas (e.g. Orkney).
1.4 Self-assessed health (SAH)
This measure of health status is taken from the Scotland Census (2001 or 2011) and/or a household survey. The Census provides the most robust data on SAH to estimate HLE, but unfortunately the Census does not provide consistent data for time trends as the SAH question was not asked in 1991 and changed in 2011.
Household surveys can provide SAH data to estimate HLE for sufficiently large geographies (Scotland overall and its deprivation quintiles), and time trends are possible. The General Household Survey (now known as the General Lifestyle Survey) was used to estimate HLE up until 1998. The Scottish Household Survey (SHoS) started in 1999 and was used to assess HLE time trends from then on as it has a larger sample size (although the question on SAH was unfortunately not asked in 2003 or 2004). Also, please note that there is a discontinuity in time trends using 2009 data (see section 1.4.3).
For the HLE data presented on the website up to 2008, the question on SAH was identical in the General Household Survey, SHoS and 2001 Census:
“Over the last twelve months would you say your health has on the whole been:Good? Fairly good? Not good?”
For the purposes of defining ‘healthy’ and calculating HLE, the ‘good’ and ‘fairly good’ categories were aggregated into a single ‘healthy’ category, while the ‘not good’ category was assigned to a ‘not healthy’ category.
Whereas the Census covered all ages, the household surveys only obtained SAH data for those aged 16 years and over. Therefore, survey data for 16-19-year-olds was used for the 15-19 year age group. In addition, for analyses based on the General Household Survey, SAH data for the age groups under 15 were approximated by using the data for those aged 16-19 years. For analyses based on the SHoS up to 2008, SAH data for age groups under 15 were taken from the 2001 Census. For analyses based on the SHoS from 2009, SAH data for age groups under 15 were taken from the Scottish Health Survey for the relevant years as both sources used the ‘new’ EU SAH question (see section 1.4.3).
6 of 25
1.4.1 Comparison of SAH in 2001 Census and Scottish Household Survey (SHoS) 2001
Charts T1 (males) and T2 (females) show SAH by age group in Scotland in 2001, as measured by the percentage of respondents self-reporting their health as ‘not good’ over the last 12 months (i.e. those assigned to the ‘not healthy’ category). Results from the Census (4,976,005 records for both sexes) are compared with the SHoS (14,643 records for both sexes, using the new weightings).
Chart T1
Chart T1 shows that for males, the SHoS gave a similar pattern for the prevalence of ‘not healthy’ health across age groups to the Census (with the exception of the 15-19 and 80-84 years age groups). This similarity led in turn to the similarity of the two HLE estimates presented in Chart 1 on the Scotland data page on the website: HLE based on a single year of data and SAH from the SHoS (66.3 years); and HLE based on the 5-year period 1999-2003 and SAH from the 2001 Census (66.3 years). Chart T2
7 of 25

Chart T2 shows that for females, the SHoS gave a consistently higher percentage of respondents in ‘not healthy’ health across age groups when compared with the Census (with the exception of those aged 80+ years where there was good agreement). This difference in the younger age groups led in turn to the difference in the two HLE estimates presented in Chart 2 on the Scotland data page on the website: HLE based on a single year of data and SAH from the SHoS (69.2 years) was lower than HLE based on the 5-year period 1999-2003 and SAH from the 2001 Census (70.2 years).
Clark et al (2004) [pdf file, 324Kb] also found that there was a tendency to underestimate HLE at birth when using SAH from the SHoS (in 2000) compared with the 2001 Census, particularly for females.
1.4.2 SHoS weighting revision
In autumn 2009, the Scottish Government released revised weightings (calibrated against official population estimates) for all years of data in the SHoS. Previously the survey data were weighted only for local authority representation and household size. The new weighting strategy accounts for any non-response bias within the survey, better addressing the demographics which will have been subject to under- and over-reporting previously. The revised SAH data were used to recalculate all HLE data based on the SHoS for the November 2009 HLE publication, and are used in the SAH comparison above.
The weighting revision had only a minor effect on estimates of HLE at birth, altering the previously published estimates by less than 0.1 years (Scotland) and less than 0.4 years (deprivation quintiles).
1.4.3 SHoS SAH question change
A joint World Health Organization and European Union recommendation on the measurement of self-assessed health has been developed to provide consistency across European countries (Robine et al, 2003). This led to the SAH question in the SHoS changing in 2009 from the 3-point question outlined in section 1.4 above, to the EU 5-point question:
“How is your health in general? Would you say that it was……very good, good, fair, bad, or very bad?”
An identical question has been used in the Scottish Health Survey (SHeS) since it started in 1995, and was used in the 2011 Census.
According to the EU harmonised definition to dichotomise the data, the ‘very good’ and ‘good’ response categories are aggregated into a single ‘healthy’ category, while the ‘fair’, ‘bad’ and ‘very bad’ response categories are assigned to the ‘not healthy’ category. This definition has been shown to improve identification of underlying inequality in health at a sub-national level and is currently used for cross-national comparisons of self-reported general health within the EU (Smith and White, 2009 [pdf file, 275Kb]).
There are three major differences between the SAH results based on the original question and the EU question:
a) the number of response categories increases from three to five b) the reference to a period of 12 months is excluded in the EU question c) the cut-off between ‘healthy’ and ‘not healthy’ moves towards the ‘good health’ end of the
scale. This decreases the percentage of respondents assigned to the ‘healthy’ category and increases the percentage assigned to the ‘not healthy’ category.
The latter point is illustrated in Chart T3 (males) and T4 (females), with ‘not healthy’ health from the SHoS 2009 based on the EU SAH question compared with 2008 results based on the old 3-point SAH question, shown by age group. Also shown for comparison are results from the SHeS 2008 and 2009, which are based on the EU SAH question. It can be seen that, for each age group,
8 of 25

changing from the old to the EU SAH question increases the percentage of respondents with ‘not healthy’ health.
Chart T3
Scotland males: Percentage of respondents with 'not healthy' health, by age group and data source
0%
5%
10%
15%
20%
25%
30%
35%
40%
45%
50%
55%
60%
0 1-4 5-9 10-14 15-19 20-24 25-29 30-34 35-39 40-44 45-49 50-54 55-59 60-64 65-69 70-74 75-79 80-85 85+Age group (years)
% 'n
ot h
ealth
y' h
ealth
2009 Scottish Household Survey *2009 Scottish Health Survey *2008 Scottish Health Survey *2008 Scottish Household Survey ^
* Using EU 5-point self-assessed health question. 'Not healthy' comprises 'fair', 'bad' and 'very bad' categories.^ Using old 3-point self-assessed health question. 'Not healthy' comprises the 'not good' category only.
Chart T4
Scotland females: Percentage of respondents with 'not healthy' health, by age group and data source
0%
5%
10%
15%
20%
25%
30%
35%
40%
45%
50%
55%
0 1-4 5-9 10-14 15-19 20-24 25-29 30-34 35-39 40-44 45-49 50-54 55-59 60-64 65-69 70-74 75-79 80-85 85+Age group (years)
% 'n
ot h
ealth
y' h
ealth
2009 Scottish Household Survey *2009 Scottish Health Survey *2008 Scottish Health Survey *2008 Scottish Household Survey ^
* Using EU 5-point self-assessed health question. 'Not healthy' comprises 'fair', 'bad' and 'very bad' categories.^ Using old 3-point self-assessed health question. 'Not healthy' comprises the 'not good' category only.
As expected, the increased percentage of ‘not healthy’ health in the SHoS 2009 compared with 2008 translates into lower HLE at birth estimates in 2009 (see Charts T5 (males) and T6 (females)). HLE estimates based on the SHeS are also shown for comparison.
9 of 25

Chart T5
Scotland MALES: Life expectancy (LE) and healthy life expectancy (HLE) at birth, 1980-2009, by data source
52
54
56
58
60
62
64
66
68
70
72
74
76
7819
80
1981
1982
1983
1984
1985
1986
1987
1988
1989
1990
1991
1992
1993
1994
1995
1996
1997
1998
1999
2000
2001
2002
2003
2004
2005
2006
2007
2008
2009
Year
LE o
r HLE
(yea
rs)
LEHLE (using SAH from household surveys^)HLE (using SAH from Scottish Health Survey*)95% confidence limit
^ General Household Survey 1980 - 1998 and Scottish Household Survey (SHoS) 1999 - 2008 used old 3-point self-assessed health (SAH) question. SHoS 2009 used EU 5-point SAH question.* Scottish Health Survey (all years) used EU 5-point SAH question.
Chart T6
Scotland FEMALES: Life expectancy (LE) and healthy life expectancy (HLE) at birth, 1980-2009, by data source
56
58
60
62
64
66
68
70
72
74
76
78
80
82
1980
1981
1982
1983
1984
1985
1986
1987
1988
1989
1990
1991
1992
1993
1994
1995
1996
1997
1998
1999
2000
2001
2002
2003
2004
2005
2006
2007
2008
2009
Year
LE o
r HLE
(yea
rs)
LEHLE (using SAH from household surveys^)HLE (using SAH from Scottish Health Survey*)95% confidence limit
^ General Household Survey 1980 - 1998 and Scottish Household Survey (SHoS) 1999 - 2008 used old 3-point self-assessed health (SAH) question. SHoS 2009 used EU 5-point SAH question.* Scottish Health Survey (all years) used EU 5-point SAH question.
Charts T5 and T6 show that: The HLE at birth estimates based on the EU SAH question (whole SHeS time trend and
SHoS point for 2009) are lower than those based on the old question (SHoS up to 2008) by over 8 years.
As was the case in the SHoS-based trend up to 2008, there is still an underlying trend of an increase in HLE at birth over time as demonstrated by the SHeS results. There is, however,
10 of 25

an inevitable discontinuity in the HLE time series based on the SHoS due to the SAH question change.
HLE confidence intervals are tighter using SHoS than SHeS because the number of respondents is approximately 50% larger. For this reason, and the fact that the SHeS is not available for as many years as the SHoS, the SHoS is still the preferred source for SAH data and definitive HLE estimates for Scotland.
Although there is an unavoidable discontinuity in the HLE time series for Scotland, with the addition of the 2015 data (in December 2016) the trend line recommences from 2009 onwards. A similar situation arises for the deprivation quintile 2-year period estimates of HLE based on survey SAH data; the December 2011 site update added the 2009-10 data points based on the new EU SAH question, and these are also much lower than the previous (2007-08) estimates.
For smaller geographies such as deprivation deciles, NHS Boards, local authority areas, and the urban-rural classification, SAH data are taken from the Census as available survey data do not have a large enough sample. The Census also changed to the new EU SAH question in 2011 and there is a similar discontinuity between HLE estimates for 2001 and 2011 for these geographies.
In terms of UK statistics, a similar drop in HLE estimates due to the move to the new EU question can also be seen in estimates published by ONS [Excel file, 3197Kb] for the UK and constituent countries including Scotland. (These estimates previously used SAH from the General Household Survey but now use the cross-sectional sample of the General Lifestyle module (GLF) of the Integrated Household Survey.)
1.5 Life tables
The calculations of period LE and HLE use the population, deaths and SAH data described above in abridged life tables (age groups 0, 1-4, 5-9, 10-14…80-84, 85+). LE and HLE estimates from 2014 onwards use an upper age limit of 90+. LE is based on Chiang (II) methodology (Chiang, 1984). HLE is calculated using the Sullivan method (Sullivan, 1971) which applies the prevalence of the ‘healthy’ category (from SAH data) in each age group to the expected number of years lived, to obtain the expected number of years lived in a ‘healthy’ state.
The original spreadsheet with the life table covering the calculation of LE was provided by the Office for National Statistics (ONS) in 2002; Clark et al (2004) added the HLE calculations. An updated version of the Excel calculation workbook was provided by ONS in November 2016, which takes into account the new upper age limit of 90+. More information is available in the ONS paper “Method changes to life and health state expectancies”.
The ScotPHO website HLE analyses follow the European Health Expectancy Monitoring Unit (EHEMU) methodology recommended by Jagger et al (2006), with a few small exceptions. These relate to the treatment of the data for age 0 for statistics ax (the fraction of the age interval lived by those in the cohort who die in the interval), qx (the conditional probability that an individual entering the age interval will die in the age interval) and Lx (number of years lived during the age interval). The effect has been found to be very small (e.g. only seen in the fourth decimal place in the LE figure) so has been ignored.
In calculating 95% confidence intervals, the ScotPHO methodology takes into account the variance resulting from SAH, but not the variance resulting from mortality (which is very small by comparison, at least for SAH based on the SHoS). A similar finding was shown by Jagger et al (2006) (example 4).
Whereas annual life tables are used for Scotland overall, longer periods are used to increase the numbers for smaller geographies (e.g. 2-year periods for deprivation quintiles; 5-year periods for NHS Boards, local authority areas, intermediate geographies, deprivation deciles and the urban rural classification). The life tables use deaths and population estimates and household survey SAH data aggregated for the relevant number of years, but single year data in the case of the 2001 and 2011 Census SAH.
11 of 25

1.6 Reliability of the data for HLE calculations
ISD does not collect or produce the raw data used in the calculation of period LE and HLE (population estimates, death registrations, and SAH data from surveys or the Census) but these are considered to come from reliable sources. NRS's publications on populations, deaths and LE, for example, have gained UKSA National Statistics accreditation. ISD independently quality assures the data supplied, by running checks on the raw data, and for example this has previously identified a few death records with gender or age missing which were queried with NRS – see section 1.3 above. The limitations of the SAH data are discussed above (section 1.4).
In producing analyses of LE and HLE, ISD checks time trends and consistency of patterns in the results for characteristics such as gender, different geographies and deprivation groups. LE and HLE results are compared with any produced by NRS or ONS. We would query any anomalies with the relevant organisation. Additionally, ISD and NRS give each other pre-release access to text and data for quality assurance before publication of LE or HLE results.
Methodological issues such as imputation of deaths (section 1.3.1) and changes in Scottish geographical units, are regularly discussed at meetings between NRS and ISD, and also, where relevant, ONS.
12 of 25

1.7 Differences in methodology for calculating LE and HLE between ScotPHO and other organisations
There are some differences in the methodology used in the ScotPHO LE and HLE analyses compared to the previous (2004) ISD methodology and the LE methodology employed by the NRS. These differences are shown in Table T2.
Table T2. Differences in methodology for calculating LE and HLE
Component Aspect ScotPHO analyses Previous Scotland analyses (Clark et al, 2004)
NRS (formerly GROS) (LE calculations only)
Deaths Dates Use date of registration (except date of death used for old Scotland-level analyses up to 1998)
Use date of death Use date of registration
Non-residents of Scotland
Use imputation to assign to geography of ‘residence’ (see section 1.3.1 above)
Non-residents of Scotland assigned to place of death in Scotland
Most analyses: non-residents of Scotland assigned to place of death in Scotland
SAH from Scottish Household Survey (SHoS)
Does not cover 0-15 years
1) Use data for 16-19-year-olds for 15-19 yr age group -2) For the relevant geography and sex for age groups 0, 1-4, 5-9 and 10-14, “patch” as follows:a) Up until 2008, use 2001 Scotland Census SAH data b) from 2009, use Scottish Health Survey data for relevant year
2) For the relevant geography, sex and time period for age groups 0-2, 3-4, 5-9 and 10-14, “patch” with 16-19 years SHoS data
-
Data weighting
Use data weighted for non-response bias, local authority representation and household size for calculating HLE, but unweighted data to calculate confidence intervals (as recommended by Jagger et al, 2006)
Use unweighted data -
Question change in 2009
Use old 3-point question up to 2008; from 2009 use new EU 5-point question and harmonised definition of ‘not healthy’ health.(See text at section 1.4.3 above.)
Use old 3-point question
-
Life table Length of time period (= no. of years of population and deaths data used)
Analyses using SAH from SHoS:1-year – Scotland analyses 2-year – deprivation quintiles
1-year and 2-year Most analyses:3-year
Analyses using SAH from 2001 Census:5-year – all analyses
Age groups 0, 1-4, 5-9, 10-14…80-84, 85-89, 90+
0-2, 3-4, 5-9, 10-14… 80-84, 85-89, 90+
0, 1-4, 5-9, 10-14…80-84, 85-89, 90+
Deprivation quintiles and deciles
Class- ification
Based on the appropriate version of the Scottish Index of Multiple Deprivation (SIMD) (not weighted for population). See section 6.
Based on Carstairs Index 2001
Based on SIMD (not weighted for population)
In November 2016 NRS published a paper called Life Expectancy for Scotland: Methodology Guide which describes the methodology used to produce life expectancy figures by the National Records of Scotland (NRS) for areas within Scotland..
13 of 25

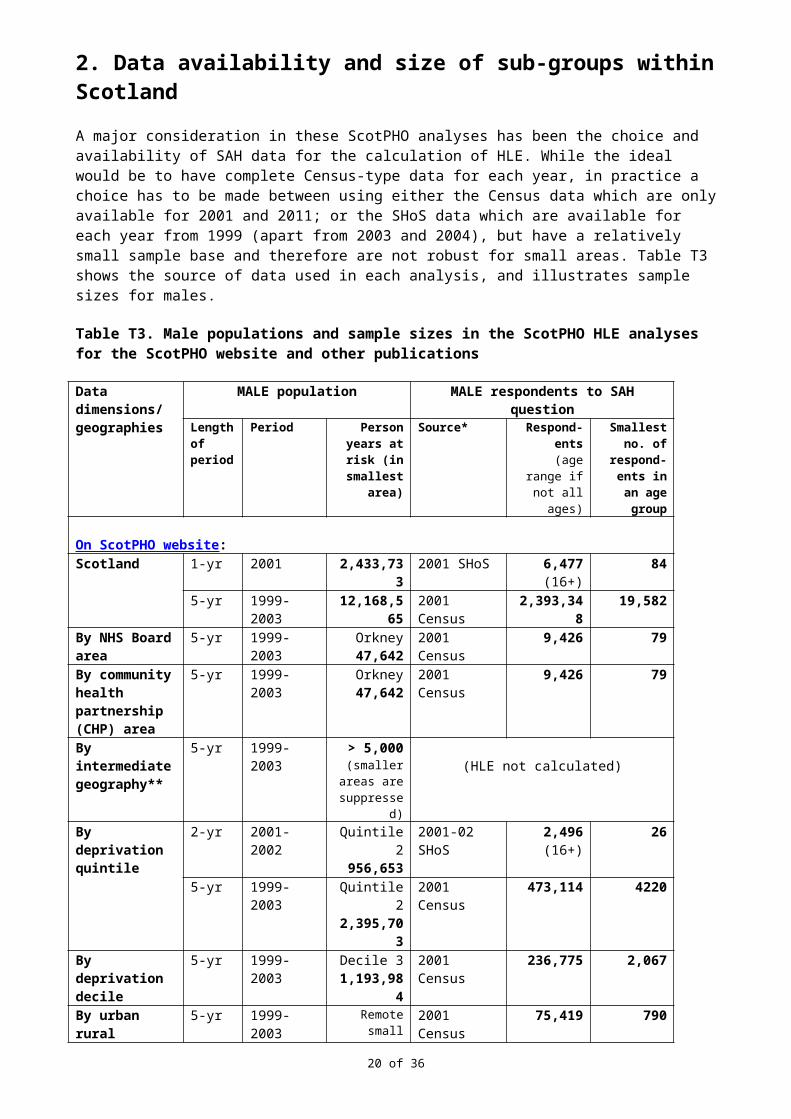
2. Data availability and size of sub-groups within ScotlandA major consideration in these ScotPHO analyses has been the choice and availability of SAH data for the calculation of HLE. While the ideal would be to have complete Census-type data for each year, in practice a choice has to be made between using either the Census data which are only available for 2001 and 2011; or the SHoS data which are available for each year from 1999 (apart from 2003 and 2004), but have a relatively small sample base and therefore are not robust for small areas. Table T3 shows the source of data used in each analysis, and illustrates sample sizes for males.
Table T3. Male populations and sample sizes in the ScotPHO HLE analyses for the ScotPHO website and other publications
Data dimensions/ geographies
MALE population MALE respondents to SAH questionLength of period
Period Person years at risk (in
smallest area)
Source* Respond- ents
(age range if not all ages)
Smallest no. of
respond- ents in an age group
On ScotPHO website:Scotland 1-yr 2001 2,433,733 2001 SHoS 6,477
(16+)84
5-yr 1999-2003 12,168,565 2001 Census 2,393,348 19,582By NHS Board area
5-yr 1999-2003 Orkney 47,642
2001 Census 9,426 79
By community health partnership (CHP) area
5-yr 1999-2003 Orkney 47,642
2001 Census 9,426 79
By intermediate geography**
5-yr 1999-2003 > 5,000(smaller
areas are suppressed)
(HLE not calculated)
By deprivation quintile
2-yr 2001-2002 Quintile 2 956,653
2001-02 SHoS
2,496(16+)
26
5-yr 1999-2003 Quintile 2 2,395,703
2001 Census 473,114 4220
By deprivation decile
5-yr 1999-2003 Decile 31,193,984
2001 Census 236,775 2,067
By urban rural classification
5-yr 1999-2003 Remote small towns
383,352
2001 Census 75,419 790
In 2011 Long-term monitoring of health inequalities report:By IEI deprivation decile***
2-yr 2001-2002 Decile 1 472,332
2001-02 SHoS
1,200 (16+)
17
* SHoS = Scottish Household Survey.** Intermediate geography: see text at 2.1 below.*** IEI deprivation decile = Income-employment index deprivation decile (derived from SIMD2006 by the Scottish Government).
Table T3 shows that the smallest number of male respondents in an age group fell as low as 26 in the 2-year period deprivation quintile analysis, and just 17 in the IEI deprivation decile analysis. Clearly these small numbers, and the even smaller sub-sets of respondents reporting ‘good’ or ’fairly good’ (i.e. ‘healthy’) health, lack robustness. These analyses should therefore be treated with particular caution.
It was not considered advisable to use the 2-year period SHoS SAH data on smaller geographies than quintiles and deciles. As an experiment, it was tried on NHS Board data, but for Orkney (the smallest of the 14 boards) the total number of male respondents in 2001-02 aged 16+ was 53, and the smallest number in an age group was just 1. Therefore these data are not reported.
14 of 25

2.1 Intermediate geography
Note that due to the severe instability of very small numbers at very small geographical levels, HLE was not calculated for intermediate geography (for definitions see section 6). For most of these areas, data are presented for LE at birth, for 5-year periods. However, LE by sex and area is not presented where:
a) the 5-year total population for that sex is less than 5,000 people; and/or b) there are fewer than 40 deaths for that sex over the 5-year period.
Rule a) has also been recommended previously by ONS (Toson and Baker, 2003) and SEPHO (2005). Rule b) was devised after considering how feasible the initial results were for LE at birth.
In addition, for a small number of intermediate geographies, LE could not be calculated because an age group had a zero population estimate or no deaths had occurred in the oldest (85+ years) age group. Both these situations illustrate the limitations of the data for such small geographies.
3. General cautionThere may be some unexpected trends in the LE and HLE data presented, due to random fluctuations in variables such as the number of deaths and age at death (and SAH estimates in the case of HLE). The results should therefore be interpreted as providing a general indication of LE and HLE estimates for the various geographies/sub-groups and over time, rather than precise and robust figures. The 95% confidence intervals give some indication of the stability of the estimates.
Note also that in a life table, an age group in which there are no deaths does not contribute to the standard error, and therefore the confidence interval will be underestimated. The risk of this occurring is reduced by the decision outlined in section 2.1 not to present LE where the population or number of deaths is considered too small.
4. Communal establishments As the population estimates and deaths data relate to the entire population including people resident in communal establishments (such as nursing homes), LE will also relate to the entire population.
As far as SAH is concerned, all data sources used (the General Household Survey, SHoS, SHeS, and the Scotland Census) relate only to household residents. This means that it is valid to compare SAH results for household residents between these four sources.
However, as the resultant HLE estimates are based on SAH for household residents only, and as residents of communal establishments tend to be less healthy than the general population, our HLE estimates for the entire population are probably slightly overestimated. The effect of excluding SAH in communal establishments when estimating HLE was found to be very small by Clark et al (2004) when they tested it on 2001 Census data. (It resulted in 0.1 years overestimation of HLE for males at birth and 0.2 years for females at birth). Therefore, since we were using both household survey and Census SAH data in the current analyses (and comparing them), no attempt was made to correct for the likely slight overestimation in HLE.
Note that a communal establishment adjustment is included in the official ONS HLE estimates for the UK and its constituent countries published annually.
15 of 25

5. Recommendations for further workBased on this work, ISD should:
Maintain and update the life expectancy (LE) and healthy life expectancy (HLE) time trends for Scotland for single years, and for deprivation quintiles for 2-year periods, based on the SHoS/SHeS self-assessed health (SAH) data.
Continue to contribute to discussions UK-wide to work towards a consistent
methodology in estimating LE and HLE, whilst also maintaining consistency with European methodology.
Consider developing LE and HLE estimates for minority ethnic groups in Scotland.
Consider analysing health expectancy based on limiting long-term illness from the Census, to get time trends based on 1991, 2001, and 2011, within Scotland which are comparable with international figures.
In addition, we recommend that, for any organisation working on HLE estimates in Scotland:
The SHoS SAH data should not be used to calculate HLE for NHS Board areas or smaller geographies, or for the urban rural classification, as they are insufficiently robust. Also, these SAH data should only be used with considerable caution for estimating HLE for income-employment index deprivation deciles.
6. Geographical notesData zone: a relatively stable small area geography comprising an aggregation of census output areas. Data Zones were created in 2004 and were based on the 2001 Census. There were originally 6,505 ‘2001 Data Zones’ in Scotland.
The Scottish Government (SG) have redrawn Data Zone boundaries based on the 2011 Census to take into account changes in population since the first edition. 2011 Data Zones were released on 6 November 2014. Following the redraw, there are 6,976 ‘2011 Data Zones’ in Scotland.
Following the approach adopted in the Scottish Health and Wellbeing profiles, data zones are used in the LE and HLE analyses as the ‘building blocks’ for intermediate geographies, and also for deprivation quintiles, deprivation deciles and the urban rural classification.
Except for Scotland, NHS Board areas and local authority areas, the population estimates used in the analyses are aggregations of data zone populations.
All analyses up to and including 2014 are based on the 2001 data zones.
Intermediate geography: Intermediate Zones (IZs) were also created in 2004 and are a composite geography created from Data Zone aggregates. There were originally 1,235 ‘2001 Intermediate Zones’ in Scotland.
The Scottish Government (SG) have redrawn Intermediate Zone boundaries based on the 2011 Census to take into account changes in population since the first edition. 2011 Intermediate Zones were released on 6 November 2014. Following the redraw, there are 1,279 ‘2011 Intermediate Zones’:
The intermediate geography was introduced as not all statistics are suitable for release at the data zone level because of the sensitive nature of the statistics or for reasons of reliability, and a statistical geography between data zone and local authority was required.
16 of 25

All analyses up to and including 2014 are based on the 2001 intermediate zones.
Local authority: the analyses are based on the 32 local authority areas (council areas) within Scotland; these are co-terminous with NHS Board boundaries.
NHS Board: the analyses are based on the 14 NHS Board structure in Scotland resulting from Argyll and Clyde NHS Board being split and allocated to Highland and Greater Glasgow NHS Boards on 1st April 2006.
Deprivation quintiles: defined by the Scottish Government as fifths of the data zones in Scotland when ranked from most to least deprived. Quintile 1 is the most deprived group; quintile 5 the least deprived. Deprivation is measured by the Scottish Index of Multiple Deprivation (SIMD), not weighted for population size.
There have been several versions of SIMD. The most recent used here, SIMD 2012, combines 38 indicators across seven domains: Income; Access; Education; Housing; Crime; Employment; and Health. SIMD 2006 was broadly similar, but based on 37 indicators.
The data zone deprivation mosaic within Scotland is likely to change to some extent between versions of SIMD, due to population movement, real changes in deprivation levels, and methodological changes in deprivation indicators. For example, 12% of data zones in the most deprived quintile in SIMD 2006 were no longer in the most deprived quintile in SIMD 2009 v2. For the ScotPHO LE and HLE analyses by deprivation quintile, SIMD 2006 was used for estimates up to 2007-08, SIMD 2009 v2 from 2009-10, SIMD 2012 from 2010-14 and SIMD2016 for period 2015-2016 (for more details on methodological changes – see section 1.4.3). This means that the geographical areas within a deprivation quintile were held constant for LE and HLE estimates up to 2007-08, but then had the possibility of changing from the 2009-10 estimates onwards.
As these are high-level LE and HLE analyses (at Scotland level), the change in SIMD version was not considered to be a problem when looking at time trends. Users of the data should be aware that the change occurred, with estimates up to 2007-08 relating to constant areas on the ground, then from 2009-10 to a more recent assessment and classification of deprivation level.
Changing versions of SIMD provides a better estimate of LE or HLE by deprivation quintile for a given time point than does holding the version constant over time. However, the first published SIMD version (2004) was not used for the early periods of the LE and HLE analyses as it was not available at the time of analysis. Users of the data should be aware that the most deprived quintile in, say 1999-2000, will not contain the 20% most deprived data zones in Scotland at that time.
For further details of SIMD, see the Scottish Government’s website.
Deprivation deciles: similar to deprivation quintiles described above, but tenths of the data zones in Scotland rather than fifths. Decile 1 is the most deprived group; decile 10 the least deprived. For the charts of LE and HLE at birth by deprivation decile published on the ScotPHO website, SIMD 2006 was used for estimates up to 2004-06, and SIMD 2009 v2 from 2006-08 to 2008-10, and SIMD 2012 for period 2010-14.
Urban rural classification: the 6-fold classification is used here. It was devised by the Scottish Government from two main criteria: 2001 settlement size (as defined by NRS); and accessibility based on drive time analysis to differentiate between accessible and remote areas. Data zones are assigned to the 6-fold classification on a ‘best fit’ basis, according to where the majority of their census output areas lie. The Scottish Government Urban Rural Classification provides a standard definition of rural areas in Scotland. This classification is updated every two years to incorporate the most recent Small Area Population Estimates (SAPE) produced by National Records of Scotland (NRS) and Royal Mail Postcode Address File (PAF).
17 of 25

7. ReferencesChiang CL. The life table and its applications. Malabar, Florida: Robert E Krieger Publ Co, 1984.
Clark D, McKeon A, Sutton M, Wood R. Healthy life expectancy in Scotland. Information and Statistics Division, Common Services Agency, NHS Scotland, 2004. [pdf file, 324Kb]
Jagger C, Cox B, Le Roy S. Health expectancy calculation by the Sullivan method: a practical guide. Third edition. European Health Expectancy Monitoring Unit technical report, 2006.
Robine J_M, Jagger C and The Euro-REVES Group. Creating a coherent set of indicators to monitor health across Europe. The Euro-REVES project. European Journal of Public Health 2009; 13 ( supplement 1 ), 6-14.
Scottish Government. Long-term Monitoring of Health Inequalities - Headline Indicators - October 2015.
Scottish Government. Scotland performs (website).
Scottish Government. Scottish Index of Multiple Deprivation (website).
Statistics.gov.scot (formerly Scottish Neighbourhood Statistics (website).
Scottish Public Health Observatory. Healthy life expectancy (website topic). ScotPHO, Information Services Division (ISD), NHS National Services Scotland.
Scottish Public Health Observatory. Scottish health and wellbeing profiles. ScotPHO, Information Services Division (ISD), NHS National Services Scotland (accessible from the ScotPHO website).
Smith M and White C. An investigation into the impact of question change on estimates of General Health Status and Healthy Life Expectancy. Office for National Statistics. Health Statistics Quarterly 2009; 41 , 28-41. [pdf file, 275Kb]
South East England Public Health Observatory. Technical report: Calculating life expectancy in small areas. Oxford: SEPHO, 2005.
Sullivan DF. A single index of mortality and morbidity. HSMHA Health Reports 1971; 86:347-354.
Toson B, Baker A. Life expectancy at birth: methodological options for small populations. National Statistics Methodological Series No. 33, 2003.
18 of 25

Appendix A: Publication Pre-release Access
Healthy Life Expectancy in Scotland: Update of trends to 2016 (Publication date 12 December 2017)
Early Access details (including Pre-Release Access)
Pre-Release Access Under terms of the "Pre-Release Access to Official Statistics (Scotland) Order 2008", ISD are obliged to publish information on those receiving Pre-Release Access ("Pre-Release Access" refers to statistics in their final form prior to publication). The standard maximum Pre-Release Access is five working days. Shown below are details of those receiving standard Pre-Release Access.
Standard Pre-Release Access: • Scottish Government Health Department (Analytical Services Division) • NHS Board Chief Executives • NHS Board Communication leads
Early Access for Quality AssuranceThese statistics will also have been made available to those who needed access to help quality assure the publication:
• National Records of Scotland
19 of 25
Appendix B: December 2016 publication metadata summary tableMetadata indicator Description
Publication title Healthy Life Expectancy in Scotland: Update of trends to 2016
Description Annual update of the ScotPHO website topic Healthy Life Expectancy, including estimates of both life expectancy (LE) and healthy life expectancy (HLE) for Scotland.
Theme Health and Social Care
Topic Health of the Population
Format Web pages
Data source(s) NRS death records; NRS population estimates; self-assessed health from surveys. For estimates of HLE at Scotland level, the General Household Survey was used from 1980 to 1998. The Scottish Household Survey was used from 1999 onwards, with data for younger ages from the 2001/2011 Census or Scottish Health Survey.
Date that data are acquired New data acquired November 2017.
Release date 12 December 2017
Frequency Annual
Timeframe of data and timeliness
Data include time trends for LE and HLE, starting in 1980 (for some geographies) and extending up to 2016 where possible.
Continuity of data No estimates of HLE are available for 1997 (when the General Household Survey was not run) and 2003 and 2004 (when the self-assessed health question was not asked in the Scottish Household Survey). Also, there is a major discontinuity in the HLE series between 2008 and 2009 due to a change in methodology regarding self-assessed health, in order to align with the European Union. This results in estimates of HLE at birth from 2009 onwards being over eight years lower for each sex. These new estimates form the start of a new time trend. Section 1.4.3 of this technical paper provides further details.Additionally, there may be an effect on LE and HLE of rebasing population estimates in the light of new releases of Census populations. The December 2013 HLE topic update presented new data on LE and HLE for Scotland for 2012 using 2011 and 2012 mid-year population estimates for Scotland rebased in the light of the 2011 Census populations. However, the LE and HLE figures for 2002 to 2010 included in that topic update were still based on population estimates based on the 2001 Census, because rebased estimates were not yet available. Section 1.2 provides further details.
20 of 25

Revisions Statement See the ISD revisions policy at: http://www.isdscotland.org/About-ISD/About-Our-Statistics/
Revisions relevant to this publication
See section 1.4.2 of this technical paper.
Concepts and definitions HLE at birth is a theoretical measure of the number of years that a newborn baby would live in a ‘healthy’ state if they experienced the death rates and levels of general health of the local population at the time of their birth, throughout their life. It is unlikely to be a true prediction of HLE for any individual, since death rates may increase or decrease during a person’s lifetime, and people may move to areas with different mortality risks and views of their own health.
LE and HLE estimates should be interpreted as providing a general indication of these measures over time, rather than precise and robust figures. The results include 95% confidence intervals to give some indication of the stability of the estimates.
The ScotPHO website HLE introduction page and section 1 of this technical paper provide further details on methodology.
Relevance and key uses of the statistics
HLE is a key summary measure of a population's health. HLE can be used to look at health trends over time and to compare the health of different populations and population sub-groups. It is useful in resource allocation, planning of health and other services, and in evaluation of health outcomes.
Accuracy The information is taken from reputable data sources, and reputable published sources. See also “Completeness” below.
Completeness NRS death records for deaths occurring in Scotland (by year of registration) are considered to be virtually 100% complete.
NRS population estimates are based on the Census and birth, death and migration data sources to ensure a high quality.
Self-assessed health from the 2011 Census will be the most accurate and complete data available for that time point, but surveys also have to be used for other time periods. The Scottish Household Survey started in 1999 and has been used in preference to the General Household Survey from then on as it is based on a larger sample of people.
See also section 1.3.1 of this technical paper on the imputation of area of residence for certain death records.
Comparability UK and international comparisons are included in the website topic.
Accessibility See ScotPHO accessibility statement: http://www.scotpho.org.uk/about-us/scotpho-website-policies-and-statements/accessibility
Coherence and clarity The sections of the ScotPHO website are laid out in a common format to ease navigation.
Value type and unit of LE and HLE estimates are expressed in years.
21 of 25

measureDisclosure The ISD protocol on Statistical Disclosure Protocol is followed.
Official Statistics designation Official Statistics.
UK Statistics Authority Assessment
Assessed by UK Statistics Authority – see Statistics on Public and Mental Health in Scotland (report number 260) at http://www.statisticsauthority.gov.uk/assessment/assessment/assessment-reports/index.html
Last published December 2016
Next published December 2018
Date of first publication 16 December 2008
Help email [email protected]
Date form completed 12 December 2017
22 of 25

Appendix C: Use of the HLE informationScottish Government:The Scottish Government uses HLE provided by ScotPHO ISD for a variety of purposes, including analytical support, briefing and advice to policy, ministerial and press colleagues, and to support the development, implementation and monitoring of policy and performance.
HLE estimates are used to measure progress against a Scotland Performs high level purpose target (Government Economic Strategy Target 4): "To match average European (EU15) population growth over the period from 2007 to 2017, supported by increased healthy life expectancy in Scotland over the period from 2007 to 2017."
LE and HLE estimates by income-employment index decile are included in time trends in the Scottish Government's Long-term Monitoring of Health Inequalities reports.
LE and HLE time trends are included in High Level Summary of Statistics: Population and Migration, which are published on both the Scottish Government (SG) and National Records of Scotland (NRS) websites.
The HLE estimates highlight issues and raise the profile of life spent in good health. For example, the Annual Report of the Chief Medical Officer 2009 highlighted the reducing gap between men and women in HLE, and speculated on reasons for this.
ScotPHO ISD supports the SG in research/developmental work involving HLE, including:
Reshaping Services for Older People: Healthy Life Expectancy - Healthy/Independent Ageing (one of 8 primary work streams).
Modelling HLE and LE for Scotland, and producing projections for male and female LE and HLE at birth for 2028 and 2033 (used to look at future changes in health status and whether an expansion of morbidity is likely).
When should the state pension age increase to 66? (DWP, 2010) - call for evidence. Examining likely impact on HLE estimates of the change in the self-assessed question in
Census 2011 and Scottish Household Survey 2009. A Gender Audit of Statistics: Comparing the Position of Women and Men in Scotland
(2007).
NHS Boards:NHS Boards have used the HLE estimates as evidence of inequalities in their joint health improvement plans: for example NHS Lothian (Making Edinburgh Healthier). Borders NHS Board’s Director of Public Health’s Annual Report 2009/2010 includes Interpretation and graphs of HLE by NHS Board.
ScotPHO:ScotPHO ISD and NRS liaise to improve the quality and consistency of LE/HLE estimates for Scotland, and consistency with estimates for the UK and its constituent countries produced by the Office for National Statistics (ONS).
A ScotPHO presentation on “Healthy Life Expectancy in Scotland” was given at the 2009 REVES International Network on Health Expectancy conference in Copenhagen, to a largely academic audience.
A member of ScotPHO ISD staff sits on the inHALE (Inequalities in Healthy Active Life Expectancy) Advisory Group which advises on international research projects on health expectancies and is led by the Institute for Ageing and Health, Newcastle University.
23 of 25
Others:The HLE work is also used in work by other organisations and to respond to Parliamentary Questions and queries from a range of individuals in local authorities, universities, other NHS organisations (e.g. Health Scotland), Audit Scotland, the media, etc. Examples include:
Audit Scotland report Health inequalities in Scotland (Dec 2012) uses the HLE data, e.g. p7 (incl Exhibit 1) and p8
Articles based on ScotPHO HLE releases in newspapers, e.g.Scotsman, 29 March 2011:http://www.scotsman.com/news/women-face-almost-two-decades-of-poor-health-in-a-lifetime-1-1559959Scotsman, 21 December 2011:http://www.scotsman.com/news/health/twenty-years-of-ill-health-the-grim-cost-of-deprivation-1-2017799
Parliamentary questions such as:Question S3W-30862: Marlyn Glen, North East Scotland, Scottish Labour, Date Lodged: 19/01/2010 - To ask the Scottish Executive what the estimated healthy life expectancy is at (a) birth and (b) age 65 in each community health partnership area, also broken down by gender.Question S3W-38218: Mary Scanlon, Highlands and Islands, Scottish Conservative and Unionist Party, Date Lodged: 09/12/2010 - To ask the Scottish Executive how health inequalities are (a) measured and (b) monitored and what progress has been made in reducing such inequalities since 2007.
HLE analyses identify geographical areas where the population has poor overall health. Planners use this knowledge to improve access to local services and target geographically the funding and resources for specific services, e.g. through the KeepWell Project.
Graphs of HLE by CHP in Understanding Glasgow. This website includes a set of health and well-being or ‘progress’ indicators which will help in the monitoring of the effectiveness of Glasgow’s Health Commission’s recommendations, measure progress, and encourage civic engagement in the cross-cutting issues that face the city.
HLE by deprivation level is included in Life and Health: An evidence review and synthesis and the Equality and Human Rights Commission’s Triennial Review 2010 (section 4.3.7a).
Users’ viewsDuring development of the website topic in 2008, a range of knowledgeable individuals in different organisations, including Universities, were asked for their comments and quality assurance (QA) input. When major updates are produced, a smaller multi-agency group of individuals is given pre-release access for QA purposes, and their comments are taken into consideration.
All comments from users of the HLE information on the ScotPHO website are taken into consideration. For example, after queries from users, the website pages were made more explicit about the reliance of the HLE estimates by NHS Board, local authority area, deprivation decile and urban rural classification on Census self-assessed health data. Hence the next set of figures for these geographies, produced in 2015, used results from the 2011 Census. This is explained in the Section update box on Key points page. In the ‘Rate this Publication’ responses and comments left on the ISD website (which would presumably reflect the HLE publication summary rather than the full ScotPHO topic), between 25 May 2011 and 22 February 2013 there were two respondents. The 5 questions covered: meeting the user’s needs, data presentation, interpretation, timeliness and frequency. The responses to individual questions ranged from “neither good nor poor” to “very good” but clearly the number of respondents was limiting.
LE and HLE at birth for males and females are included when available in the ScotPHO Health and Wellbeing profiles which provide a set of around 64 indicators that are reported at small area level (down to intermediate geography). They are widely used by NHS Boards and local authorities, as well as academics and the media. They are also being increasingly used by councillors and local community groups. Data from the profiles are used to help understand local health variations, plan local services and support proposals for service development and health improvement initiatives. The evaluation of the 2008 profiles produced 136 responses, mostly from CHPs, NHS Boards and
24 of 25

local authorities, with 92% of respondents finding the profiles useful or very useful. Feedback included comments such as: “Extremely useful in benchmarking communities locally, also used in support of a number of funding bids, assessing health status - contributing to wider partnership forums e.g. community planning partners”. Examples of the types of decisions the profiles inform can be found on the NHS Health Scotland web page.
25 of 25