Embed Size (px)
Citation preview

SCOR inFORM - November 2012
Preferred Risk in Life Insurance

© November 2012 - ISSN: in process - All rights reserved. No part of this publication may be reproduced in any form without the prior permissionof the publisher. SCOR has made all reasonable efforts to ensure that information provided through its publicationsis accurate at the time of inclusion and accepts no liability for inaccuracies or omissions.
Preferred Risk in Life Insurance
AuthorsMatthew HUGHESSCOR Global Life Americas
EditorBérangère MainguyTel: +33 (0)1 58 44 70 00Fax: +33 (0)1 58 44 85 17
PublisherGilles Meyer
3
SCOR inFORM - November 2012
Life insurers have understood for a long time that certain differences among the population lead some groups to exhibit more favorable mortality than others. All other things being equal, females outlive males; tobacco use is detrimental to health and adversely affects mortality. But formal preferred programs – life insurers selecting among standard risk applicants and offering premium discounts to the best risks – did not begin to develop until the HIV/AIDS scare in the 1980s. Carriers began to demand blood samples to determine whether the applicant was HIV-positive. Blood (and later, other fluid) panels reveal a wealth of information about a person’s wellbeing, which underwriters use to assess mortality risk.
Prior to the introduction of preferred programs, companies offered a single premium rate for each age and sex cohort (some with discounts for nonsmokers). A 45 year-old male who qualified for coverage paid a premium rate identical to any other 45-year-old male. As a result, the industry experienced pooling of risks – those with more favorable mortality offsetting costs of those with impaired mortality. With the introduction of preferred programs insureds pay rates more in line with their risk profile, reducing premium cross-subsidization. A very competitive market allows customers to comparison shop, and forces companies to cost compete.
Life insurance underwriting – whether on a group or individual basis – is an act of risk-based discrimination. Preferred programs necessarily elevate this discrimination due to multiple mortality classes being offered. If a customer wants the best rate for the best class of life insurance he must undergo a fully underwritten process that can be more invasive, time consuming and expensive, investigating an applicant’s medical and non-medical history.
The goal of preferred programs is to offer equitable premium rates – that is, rates that reflect the applicant’s overall risk of untimely death. By design these programs operate effectively only on an individual basis. In much of the rest of the world group life (using a community, non-medical rating) has been more prominent in life insurance sales historically. While market forces may be a factor in this preference for group life over individual life products, cultural orientation (i.e., valuing collective vs. individual benefits) also plays a part.
Preferred Risk in Life Insurance
4
Preferred Risk in Life Insurance
A thorough discussion of all of the aspects of preferred mor-tality programs is beyond the scope of this paper. We intro-duce the basic concepts of preferred programs in life insur-ance, outlining the primary principles that allow a preferred program to be effective. The report examines the current US life insurance market and explains why a carrier risks being marginalized if it does not offer a preferred program. Discus-sion extends to some of the unintended consequences relat-ed to the development of preferred mortality risk. The paper looks into the near future, highlighting some opportunities and hurdles. We discuss the general unpopularity of preferred risk in other life insurance markets and the factors that con-tribute to its failure to launch effectively.
What is Preferred Mortality Risk?
Preferred mortality risk focuses on an applicant’s application information, family and personal medical history, and the ap-plicant’s occupation and avocations. Certain physiological at-tributes can lead to more (or less) favorable mortality for a group of otherwise like risks. Family medical history – a record of medical conditions such as heart disease, cancer or obesity prevalent in the applicant’s family – provides a reliable but
not certain indicator of an applicant’s predisposition towards similar conditions. An applicant’s personal medical history can justify or mitigate these concerns. The applicant’s occupation or avocations (e.g. employment by the military, police or fire department, or participation in activities such as private avia-tion, base-jumping or SCUBA diving) can indicate whether the applicant is more likely to suffer an accident.
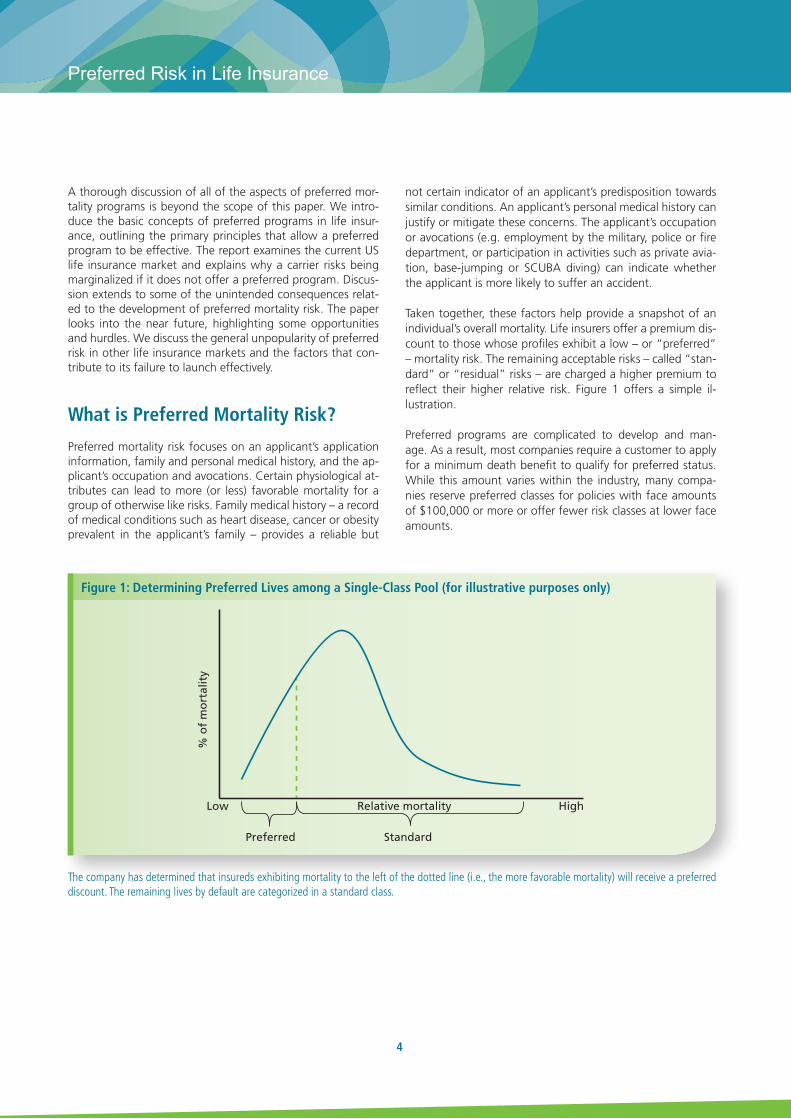
Taken together, these factors help provide a snapshot of an individual’s overall mortality. Life insurers offer a premium dis-count to those whose profiles exhibit a low – or “preferred” – mortality risk. The remaining acceptable risks – called “stan-dard” or “residual” risks – are charged a higher premium to reflect their higher relative risk. Figure 1 offers a simple il-lustration.
Preferred programs are complicated to develop and man-age. As a result, most companies require a customer to apply for a minimum death benefit to qualify for preferred status. While this amount varies within the industry, many compa-nies reserve preferred classes for policies with face amounts of $100,000 or more or offer fewer risk classes at lower face amounts.
Figure 1: Determining Preferred Lives among a Single-Class Pool (for illustrative purposes only)
The company has determined that insureds exhibiting mortality to the left of the dotted line (i.e., the more favorable mortality) will receive a preferred discount. The remaining lives by default are categorized in a standard class.
% o
f m
ort
alit
y
Low HighRelative mortality
Preferred Standard
5
SCOR inFORM - November 2012
Underwriters examine both medical and non-medical factors. Among the primary medical conditions underwriters assess are build, blood pressure, cholesterol and HDL cholesterol ratio. Non-medical criteria can include driving history, recre-ational drug/alcohol use, avocations, travel and financial his-tory.
How Does Preferred Work?
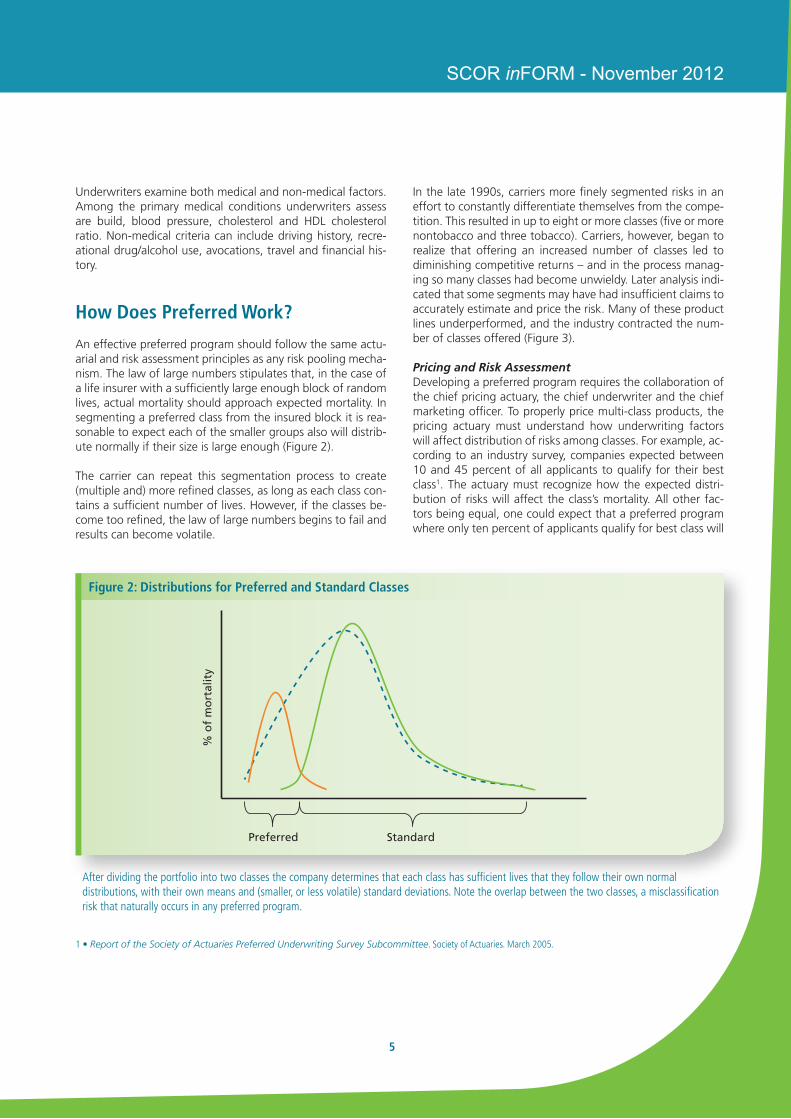
An effective preferred program should follow the same actu-arial and risk assessment principles as any risk pooling mecha-nism. The law of large numbers stipulates that, in the case of a life insurer with a sufficiently large enough block of random lives, actual mortality should approach expected mortality. In segmenting a preferred class from the insured block it is rea-sonable to expect each of the smaller groups also will distrib-ute normally if their size is large enough (Figure 2).
The carrier can repeat this segmentation process to create (multiple and) more refined classes, as long as each class con-tains a sufficient number of lives. However, if the classes be-come too refined, the law of large numbers begins to fail and results can become volatile.
1 • Report of the Society of Actuaries Preferred Underwriting Survey Subcommittee. Society of Actuaries. March 2005.
Figure 2: Distributions for Preferred and Standard Classes
After dividing the portfolio into two classes the company determines that each class has sufficient lives that they follow their own normal distributions, with their own means and (smaller, or less volatile) standard deviations. Note the overlap between the two classes, a misclassification risk that naturally occurs in any preferred program.
Preferred Standard
% o
f m
ort
alit
yIn the late 1990s, carriers more finely segmented risks in an effort to constantly differentiate themselves from the compe-tition. This resulted in up to eight or more classes (five or more nontobacco and three tobacco). Carriers, however, began to realize that offering an increased number of classes led to diminishing competitive returns – and in the process manag-ing so many classes had become unwieldy. Later analysis indi-cated that some segments may have had insufficient claims to accurately estimate and price the risk. Many of these product lines underperformed, and the industry contracted the num-ber of classes offered (Figure 3).
Pricing and Risk AssessmentDeveloping a preferred program requires the collaboration of the chief pricing actuary, the chief underwriter and the chief marketing officer. To properly price multi-class products, the pricing actuary must understand how underwriting factors will affect distribution of risks among classes. For example, ac-cording to an industry survey, companies expected between 10 and 45 percent of all applicants to qualify for their best class1. The actuary must recognize how the expected distri-bution of risks will affect the class’s mortality. All other fac-tors being equal, one could expect that a preferred program where only ten percent of applicants qualify for best class will
6
Preferred Risk in Life Insurance
exhibit more favorable mortality than a preferred structure that expects 30 percent to qualify. Preferred premium rate discounts must correlate to the expected overall risk profile of the best class.
The underwriters in turn must understand how selection deci-sions outside the agreed-upon bounds (i.e., exceptions) can affect the distribution of risks and therefore profitability. If they apply underwriting criteria (e.g., body mass) relatively liberally, more applicants than expected may qualify for a best class. Conversely, if underwriting guidelines are too stringent, the premium rate can be set too high relative to the risk, po-tentially driving away those applicants the preferred class was designed to attract. Sales must understand what these under-writing standards are when developing marketing strategies to help the firm meet and manage its expected risk distribu-tion. In other words, top-line sales goals must be in balance with the firm’s bottom-line profitability expectations.
If the pricing actuary changes a mortality assumption he must communicate that change to the underwriter so that the un-
derwriter can make proper adjustments to the risk selection process. Likewise, the underwriter must report any changes to acceptable underwriting guidelines to the actuary so the actuary can determine the change’s effect on risk distribution and pricing.
It is important to note that while almost all companies offer-ing preferred programs use the same criteria in their preferred programs (build, blood pressure, family history, avocations, etc.), there is no industry standard for the values that compa-nies may use to qualify a risk as “preferred.” One company’s preferred program may have qualifying values that resemble another company’s standard risk criteria values. The accept-able levels of blood pressure, cholesterol or even acceptable hobbies vary from company to company. Some carriers will accept medical factors that fall within the parameters for ap-plicants under treatment regimens (such as statins for cho-lesterol control). Others carriers will only accept the same ap-plicant at a standard or lower class. The lack of a universal definition of preferred risk can be confusing for consumers and financially challenging for carriers.
Given the complexity, can a carrier opt to not offer a preferred product?
The introduction of preferred mortality risk programs in the US has changed the landscape of the life insurance industry. Preferred programs originated with longer-duration term life products (10-, 20- and 30-year term), but now are available on permanent life insurance products as well. Preferred pro-grams have made life insurance coverage more affordable for all individuals. This is especially true for the term life market, which has experienced substantial growth and declining pre-mium rates since the introduction of preferred risk classes.
In a market where companies continually compete for the best risks, a company with a single standard class will find itself at a severe competitive disadvantage against companies with multi-class structures (figure 4, next page). If a carrier offers a single class product, the premium rates end up being higher for all customers except those with the worst prob-able mortality. Customers with more favorable mortality will choose firms offering preferred classes, leaving the standard-class-only carrier with worse overall mortality.
This creates a vicious circle:• The single-class carrier offers higher rates, which drives
the more favorable risks to carriers offering preferred rates
Category % of Responses
2NT, 1T 12%
3NT, 1T 14
4NT, 1T 4
2NT, 2T 4
3NT, 2T 43
4NT, 27 18
>4NT, >2T 4
# Respondents 49
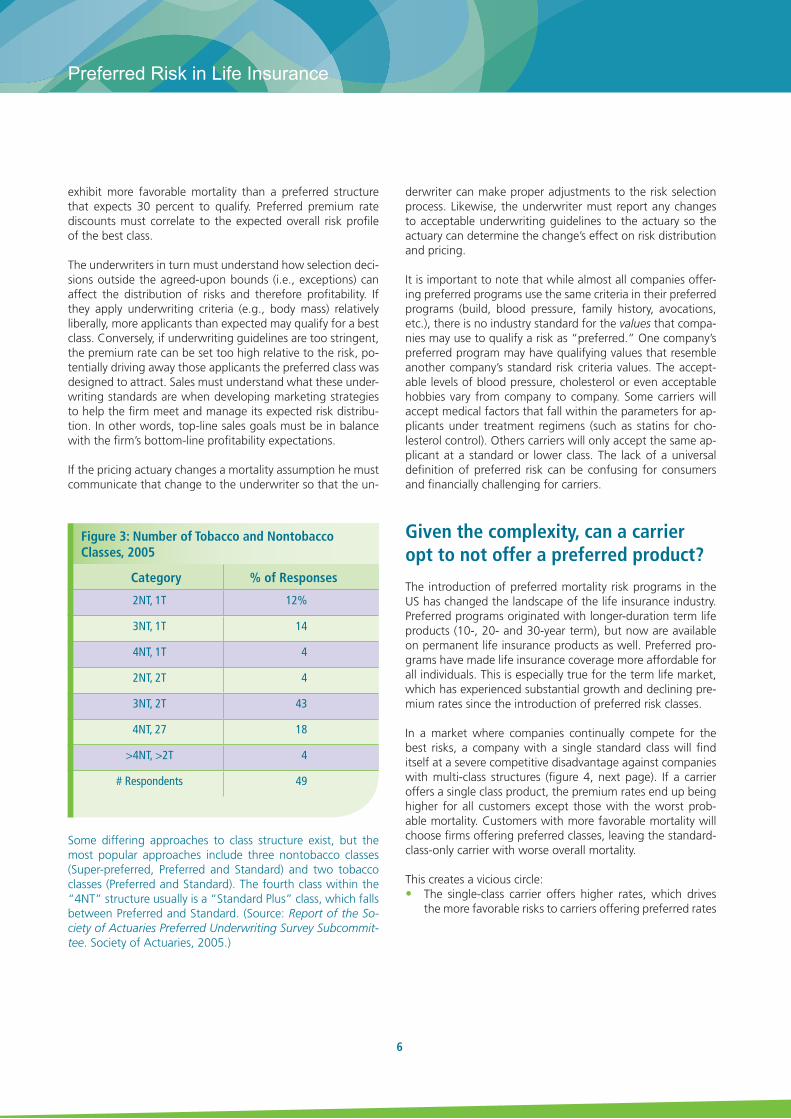
Figure 3: Number of Tobacco and Nontobacco Classes, 2005
Some differing approaches to class structure exist, but the most popular approaches include three nontobacco classes (Super-preferred, Preferred and Standard) and two tobacco classes (Preferred and Standard). The fourth class within the “4NT” structure usually is a “Standard Plus” class, which falls between Preferred and Standard. (Source: Report of the So-ciety of Actuaries Preferred Underwriting Survey Subcommit-tee. Society of Actuaries, 2005.)

7
SCOR inFORM - November 2012
• By removing the best risks from the pool of applicants, the single-class life insurer’s mortality continues to deteriorate
• The life insurer must respond by increasing rates, which continues to drive favorable risks away
As a result, the introduction of the first preferred class led to a rush by other carriers to offer preferred classes of their own. A carrier does not need to be the first company to offer a preferred program2, but it cannot afford to be the last com-pany to introduce such a structure, especially in a competitive individual life market like that in the US.
What have been the unintended consequences?
Preferred programs resulted in challenges that were underap-preciated when carriers first introduced them. Key challenges include increased adverse selection, the need for stringent
underwriting, the need for constant monitoring and a short shelf life.
Adverse selectionBecause no standard set of criteria values exists for determin-ing a preferred risk, the risk of adverse selection is more pro-nounced. Adverse selection results when the buyer (the ap-plicant) knows more about the underlying risk than the seller (the carrier).3 Producers4, whether captive or independent, are motivated to help their customers find the best coverage at the most affordable price. Producers have become experts in understanding the life insurance market, companies’ pre-ferred programs and risk criteria, and which companies will place their client in the best class possible at a competitive price.
Comparing the applicant’s medical information to multiple carriers’ acceptable preferred criteria values is a key compo-nent to the producer selection process. Figure 5 illustrates the maximum allowable total cholesterol for a male, age 45. The
Single-Class carrier o�ers same rate to
all customers regardless of risk.
coverage fro
m o
ther
car
riers
.
Better risks buy m
ore a�
orda
ble
pref
erre
dby raising rates.
Carrier responds to worse mortality
2 • Indeed, prudence may dictate that a carrier have a good understanding of its risk portfolio before offering a preferred program.3 • Skipper, Harold D., Jr. International Risk and Insurance: An Environmental-Managerial Approach. Irwin McGraw-Hill, 1998.4 • “Producer” is a common US term to describe all authorized insurance sales forces, including agents, brokers and independent financial advisers.
Figure 4: Pitfalls of not Offering Preferred Class in Multi-class Market
Companies that decide not to offer a preferred risk class in a market where competitors do offer preferred discounts risk building a block of business whose mortality continues to deteriorate.
8
Preferred Risk in Life Insurance
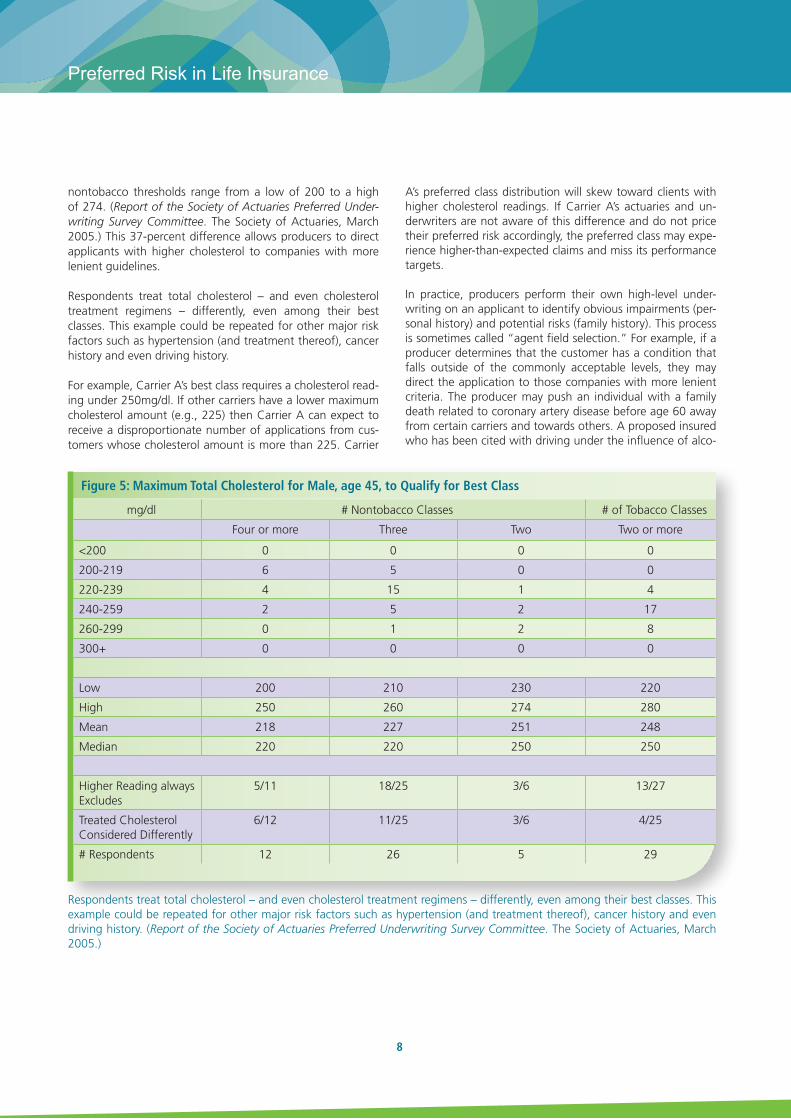
nontobacco thresholds range from a low of 200 to a high of 274. (Report of the Society of Actuaries Preferred Under-writing Survey Committee. The Society of Actuaries, March 2005.) This 37-percent difference allows producers to direct applicants with higher cholesterol to companies with more lenient guidelines.
Respondents treat total cholesterol – and even cholesterol treatment regimens – differently, even among their best classes. This example could be repeated for other major risk factors such as hypertension (and treatment thereof), cancer history and even driving history.
For example, Carrier A’s best class requires a cholesterol read-ing under 250mg/dl. If other carriers have a lower maximum cholesterol amount (e.g., 225) then Carrier A can expect to receive a disproportionate number of applications from cus-tomers whose cholesterol amount is more than 225. Carrier
A’s preferred class distribution will skew toward clients with higher cholesterol readings. If Carrier A’s actuaries and un-derwriters are not aware of this difference and do not price their preferred risk accordingly, the preferred class may expe-rience higher-than-expected claims and miss its performance targets.
In practice, producers perform their own high-level under-writing on an applicant to identify obvious impairments (per-sonal history) and potential risks (family history). This process is sometimes called “agent field selection.” For example, if a producer determines that the customer has a condition that falls outside of the commonly acceptable levels, they may direct the application to those companies with more lenient criteria. The producer may push an individual with a family death related to coronary artery disease before age 60 away from certain carriers and towards others. A proposed insured who has been cited with driving under the influence of alco-
Figure 5: Maximum Total Cholesterol for Male, age 45, to Qualify for Best Class
mg/dl # Nontobacco Classes # of Tobacco Classes
Four or more Three Two Two or more
<200 0 0 0 0
200-219 6 5 0 0
220-239 4 15 1 4
240-259 2 5 2 17
260-299 0 1 2 8
300+ 0 0 0 0
Low 200 210 230 220
High 250 260 274 280
Mean 218 227 251 248
Median 220 220 250 250
Higher Reading always Excludes
5/11 18/25 3/6 13/27
Treated Cholesterol Considered Differently
6/12 11/25 3/6 4/25
# Respondents 12 26 5 29
Respondents treat total cholesterol – and even cholesterol treatment regimens – differently, even among their best classes. This example could be repeated for other major risk factors such as hypertension (and treatment thereof), cancer history and even driving history. (Report of the Society of Actuaries Preferred Underwriting Survey Committee. The Society of Actuaries, March 2005.)
9
SCOR inFORM - November 2012
hol five years ago can have his application submitted to com-panies who consider only a three-year motor vehicle history. A life insurer that is known to conservatively rate avocations is less likely to receive applications from customers who skydive. This highlights the natural tension that producers face as ad-vocates for the customer who are compensated by the carrier.
Stringent UnderwritingRisk selection under a single standard-class structure was fairly cut and dry – either an applicant qualified for coverage or not. Preferred risk programs require more information about the applicant’s medical and non-medical history for proper risk classification. A typical blood panel provides a wealth of infor-mation about an applicant’s overall health profile: cholesterol, liver function tests, blood sugar levels and the presence or absence of certain proteins or pathogens are very informative.
However, traditional underwriting expands well beyond a blood sample:• The initial application is usually about 15 pages of small-
type questions• Use of tele-interviews to seek clarification or additional
information about application with drill-down questions, has increased
• Medical exams, including a complete medical record, must be released to the insurer
• Attending physician statements and other medical tests (e.g. stress treadmill/EKG) must be scheduled and can fur-ther delay approval
• Family and financial questions can be sensitive in nature and/or inaccurate
For individuals seeking the best rate for large face amounts, underwriting can be an invasive, time-intensive process, and the cost is reflected in the premium. On average policy issue can take 45-60 days and cost the insurer up to $1,0005– and policy acceptance at the best class is not guaranteed.
Short Shelf LifeCarriers began to offer multiple risk classes in part to differ-entiate themselves from a large number of providers offering a fairly homogeneous product. Companies spent substantial amounts of time and money to develop these programs. But the shelf life for innovation in the life insurance industry is very short. This was evident in the early to mid-2000s, when term rates in particular were in constant decline, forcing com-
panies to reprice frequently. This trend was amplified by a competitive reinsurance environment. Since the beginning of the recession, the frequency of premium rate decreases has slowed. Some companies over the past couple of years have slightly increased rates.
Introducing a preferred program is not a once-and-done ex-ercise. Various market forces will affect the type of business a preferred product will attract. Companies must constantly analyze placed case distribution, pricing assumptions and changes to underwriting guidelines to ensure it is attracting and writing the proper risks and not falling behind their com-petitors who are going after the same ideal risk.
Making changes to pricing or risk criteria must be considered carefully. A company needs sufficient claims data to confirm whether a preferred program is performing as expected. This data can take years to collect. In the meantime both internal factors (pricing or underwriting) and external forces (competi-tion, regulatory changes) will affect a product’s performance. In other words, introducing a preferred class is just the be-ginning of a long and laborious exercise, requiring constant monitoring and tweaking.
What is the state of the preferred market in the US today, and where might it be headed?
Preferred programs in mortality risk have led to several posi-tive byproducts:
• Risk-based pricing at the policy level. Customers pay clos-er to their “fair share.”
• Longer-duration term life offerings. Before preferred pro-grams, annual renewable and short-term products domi-nated the term life market,6 which itself was a small por-tion of life insurance sales. Today, 20-year term is the most popular product,7 and most companies offer coverage up to 30 years.
• Extension of preferred risk concepts to permanent life in-surance products. This includes popular variable universal life, indexed universal life and term/universal life hybrid products.8
5 • Scism, Leslie, and Mark Maremont. “Insurers Test Data Profiles to Identify Risky Clients.” Wall Street Journal, 11/18/2010.6 • See, for example, “Individual Life Product Update,” Record of the Society of Actuaries. January 1991.7 • Durham, Ashley. Individual Life Buyers in the United States (2009). LIMRA International, 2010.8 • Term/UL is permanent coverage that has pricing characteristics similar to term life. While it is a permanent product, most carriers expect policyowners to use it for a fixed period
of coverage. Preferred programs in the US life insurance industry are isolated to mortality and morbidity risk products. No company offers preferred programs for annuities in the US, e.g.
10
Preferred Risk in Life Insurance
Increased Research into Alternative Mortality MarkersCarriers are researching and investing in technologies that balance simplicity, ease and convenience with proper risk se-lection. Medical directors, labs and underwriters continue to seek ways to collect applicant information that require less in-vasive procedures, take less time, and are less expensive. Ap-pendix A highlights some of the approaches that hold prom-ise in mortality risk selection, including the use of alternative mortality markers, predictive modeling, and prescription drug databases.
Life insurers historically have relied on labs to analyze blood panels and provide results. Labs are increasing their roles in providing underwriting solutions to their clients. The labs have aggregated their data and compared the criteria values (cholesterol levels, HDL ratio, etc.) against the Social Security Administration’s Death Master File. Using proprietary algo-rithms, the labs determine a mortality risk “score” for associ-ated values. Labs such as Exam One and CRL now are work-ing with life insurers to compare their scores to actual insured population data.
Carriers may find some resistance in adopting the labs’ scor-ing technologies, however, from their reinsurers. As par-ticipants on the risk, the reinsurers want to understand the decision process that their clients use to place cases. The pro-prietary, “black box” nature of the lab algorithms inhibits this understanding. Reinsurer resistance may be the biggest im-pediment to carriers’ further acceptance of lab services.
The Need for DataA profitable preferred program relies on effective data capture and management. Life insurers historically have been paper-driven entities.9 Over the past decade carriers have invested heavily in technologies to make their firms more effective at data capture. Companies first applied these investments to in-house information that, though readily available on paper, had never been electronically captured on a wholesale basis. Now firms increasingly are contracting with outside vendors to more deeply data mine applicants’ background informa-tion for better risk assessment. Actuaries and underwriters can use electronic data to feed studies that assess a preferred program’s effectiveness (e.g., actual-to-expected studies, pro-tective value studies, claims audits), and more quickly address any fundamental weaknesses than in the past paper-driven environment.
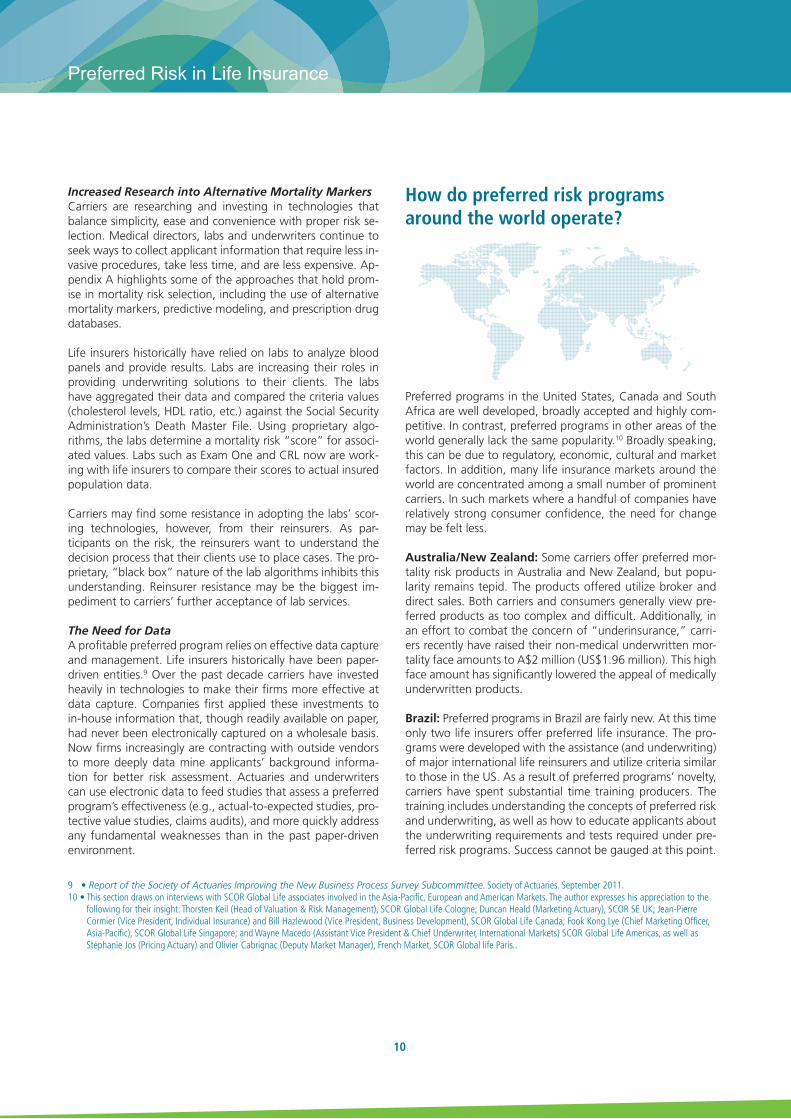
How do preferred risk programs around the world operate?
Preferred programs in the United States, Canada and South Africa are well developed, broadly accepted and highly com-petitive. In contrast, preferred programs in other areas of the world generally lack the same popularity.10 Broadly speaking, this can be due to regulatory, economic, cultural and market factors. In addition, many life insurance markets around the world are concentrated among a small number of prominent carriers. In such markets where a handful of companies have relatively strong consumer confidence, the need for change may be felt less.
Australia/New Zealand: Some carriers offer preferred mor-tality risk products in Australia and New Zealand, but popu-larity remains tepid. The products offered utilize broker and direct sales. Both carriers and consumers generally view pre-ferred products as too complex and difficult. Additionally, in an effort to combat the concern of “underinsurance,” carri-ers recently have raised their non-medical underwritten mor-tality face amounts to A$2 million (US$1.96 million). This high face amount has significantly lowered the appeal of medically underwritten products.
Brazil: Preferred programs in Brazil are fairly new. At this time only two life insurers offer preferred life insurance. The pro-grams were developed with the assistance (and underwriting) of major international life reinsurers and utilize criteria similar to those in the US. As a result of preferred programs’ novelty, carriers have spent substantial time training producers. The training includes understanding the concepts of preferred risk and underwriting, as well as how to educate applicants about the underwriting requirements and tests required under pre-ferred risk programs. Success cannot be gauged at this point.
9 • Report of the Society of Actuaries Improving the New Business Process Survey Subcommittee. Society of Actuaries. September 2011.10 • This section draws on interviews with SCOR Global Life associates involved in the Asia-Pacific, European and American Markets. The author expresses his appreciation to the
following for their insight: Thorsten Keil (Head of Valuation & Risk Management), SCOR Global Life Cologne; Duncan Heald (Marketing Actuary), SCOR SE UK; Jean-Pierre Cormier (Vice President, Individual Insurance) and Bill Hazlewood (Vice President, Business Development), SCOR Global Life Canada; Fook Kong Lye (Chief Marketing Officer, Asia-Pacific), SCOR Global Life Singapore; and Wayne Macedo (Assistant Vice President & Chief Underwriter, International Markets) SCOR Global Life Americas, as well as Stéphanie Jos (Pricing Actuary) and Olivier Cabrignac (Deputy Market Manager), French Market, SCOR Global life Paris..

11
SCOR inFORM - November 2012
Canada: Preferred programs in Canada strongly resemble the structures and principles that are used in the US. Most car-riers offer preferred life insurance products, starting at face amounts of C$250,000. Canadian preferred programs have gravitated toward five classes (three nonsmoker, two smoker), with some companies treating occasional pipe or cigar smok-ing differently. The favorable rates available for preferred risks have driven the market.
EU (ex-France/UK/Ireland): Preferred products have been introduced in many markets in the EU, with smoking status being the primary selection factor. Some companies have in-troduced medical and non-medical preferred criteria, but with little success. However, popularity remains low for various rea-sons, including:• The prevalence of group versus individual coverage• A strong social safety net, which alleviates the need for
final expense coverage• Strict privacy rules that may extend beyond the applicant
(limiting, e.g., access to medical and/or family history)• A history of tariffed premium rates – i.e., rates which
must be approved by the government, similar to auto and homeowners rates in the US
• Differing motivations for purchasing coverage (seen more as tax-sheltered savings than risk transfer)
• The prevalence of bank distribution in some markets, which is more conducive to transactional-based sales
France: Preferred programs in France are not as developed as in US, with preferred mortality programs being quite new to market overall. Risk selection focusing on lifestyle choices is quite common (tobacco use, profession, avocations, etc.), However interest and sales trends are very positive and the increasing competition in some product lines may accelerate innovation. Products most appealing for applying preferred mortality risk practices include individual protection insurance and credit life insurance.
United Kingdom/Ireland: Within the EU, Britain and Ireland have the most accommodating markets in which to develop preferred programs: the markets are highly competitive; indi-vidual life is very prominent using effective distribution chan-nels; and the social safety net is low relative to most of the rest of Europe. While segmentation based on tobacco/nico-tine use is fairly common, more formal preferred mortality risk remains underdeveloped compared to Canada, South Af-
rica and the US. Receptiveness of such products is universally limited: producers do not wish to investigate an applicant’s medical history (and consumers are reluctant to provide such information), and carrier interest in pursuing more advanced risk segmentation is limited.
Hong Kong: The city of Hong Kong has the most developed preferred life insurance market in Asia. As in the US, carriers are at a distinct competitive disadvantage if they do not offer preferred programs for their life insurance products. Struc-ture, pricing and underwriting guidelines are thorough, re-sembling those used in the US.
Japan: The Japanese life insurance market introduced pre-ferred programs in the late 1990s, but preferred programs have mostly failed to gain traction in the market. Most carri-ers believe that offering preferred premium rates may detri-mentally affect profitability. Additionally, they see little benefit from a differentiation perspective: other major carriers will in-troduce their own products immediately, limiting any oppor-tunity to gain market share. Smaller foreign insurers primarily offer preferred risk programs, though their size and lack of reputation limit popularity.
Mexico: Many companies in Mexico offer variants on pre-ferred programs that avoid many of the complexities found in US preferred programs. Preferred programs usually include two to three classes (Preferred Nontobacco, Standard Nonto-bacco, Standard Tobacco). Key criteria include tobacco use, cholesterol, HDL/LDL cholesterol ratio and build. Companies designed these programs, like those starting in Brazil, to at-tract offshore life insurance sales. The simplified approach has received appreciable acceptance from Mexican applicants.
South Korea: The Korean market introduced basic preferred mortality programs in the late 1990s. The greatest challenge lies in rate regulation: life insurers cannot charge a higher premium rate for standard risks. The Korean life insurance market is concentrated among a small group of large carri-ers (the top three carriers control 50 percent of the market in 2010).11 Oligopolistic behaviors – with carriers unwilling to challenge pricing or product rules – can inhibit product in-novation. Smaller foreign companies are researching ways to offer preferred programs to differentiate themselves from the large domestic carriers, but the regulatory limitations on pric-ing remain a key hurdle.
11 • “I-5: Income Statement of Life Insurance Company (FY 2010),” Korean Life Insurance Association.
12
Preferred Risk in Life Insurance
South Africa: Outside Canada and the US, South Africa has perhaps the most robust preferred mortality risk program in the world. The first preferred products were introduced in the 1980s – before they became popular in the US. Key criteria focus on socioeconomic status (family status, education, pro-fession, income) and smoking status.
Taiwan: The Taiwanese market has introduced preferred programs that mirror those in Canada and the US in their complexity. US reinsurer participation and assistance helps explain this level of complexity. Underwriting criteria include tobacco use, blood pressure, blood (cholesterol, glucose, he-moglobin A1C, etc.) and urine (nicotine and drug presence) panels. Companies also factor family history, occupation and avocations. As with many markets in Asia, consumer interest in preferred products currently is low.
Differing Approaches, Similar GoalsPreferred programs around the world – where they exist – have many similarities and a few (major) differences. Most importantly, all preferred programs are discriminatory by defi-nition, with the most favorable mortality being discriminated in favor of better rates.
In general preferred programs factor “consumer choice” be-haviors – smoking, drinking, engaging in risky avocations – into the risk assessment process. However, medical criteria may be a more sensitive topic in some jurisdictions. For some, family medical history may be seen as an accident of birth over which the applicant had no control.
For countries with a greater traditional use of group coverage, using criteria in risk selection that are outside the control of the applicant – in particular, medical information – may seem unfair. While the applicant may have made a conscious choice to actively SCUBA dive or smoke cigars, the applicant had no choice in a parent dying of stroke at age 55, e.g. Group cover-age relies on a collective risk pooling and cross-subsidization – each insured pays the same amount as any other insured (perhaps controlling for age).
Canadian and the US companies offer preferred programs exclusively on an individual basis.12 An applicant is classified with similar risks in a pool and pays a rate that reflects the ap-plicant’s overall propensity (or risk) of receiving a benefit pre-maturely. Under such a program each insured pays rates that
12 • Indeed, the discriminatory nature of risk selection practically demands that each mortality risk be weighed in isolation
reflect his own overall risk. Medical history – of the applicant and his family – plays a prominent role in risk classification.
Philosophical and cultural differences will influence how pre-ferred mortality risk will develop in individual countries and how acceptable the concept will be to consumers. Differing approaches should not be viewed through the prism of right or wrong, especially if such preferred programs conform more closely to local expectations. However, pricing assumptions must reflect the level of underwriting the culture allows for a preferred program to be effective.

13
SCOR inFORM - November 2012
Carriers, producers and consumers alike have benefitted from the introduction of preferred programs. They have shared in the challenges as well. For carriers, the introduction of preferred programs opened the industry’s eyes to the wealth of information it has available to measure and assess mortality. Risk segmentation has aligned the premium rate carriers charge to an applicant’s actual risk. However, the lack of an industry standard for preferred risk can lead to adverse selection. Offering preferred programs requires constant monitoring to maintain the program’s integrity, a complex and costly effort.
Producers and financial advisors see the lack of industry standardization as an opportunity for business. They have become the most knowledgeable source for market information, and can use this intelligence to direct an applicant to companies with the most accommodating underwriting criteria. But the sales process is long and complex. The more complicated an application, or the longer the turnaround from application to issue, the greater the risk that the customer will just walk away. As a result, producers must invest significant effort to keep the applicant involved to increase sales success.
Consumers benefit from the greater choice that preferred programs helped create, including product design and duration, as well as different rates. Competition in the preferred risk market has been fierce, forcing carriers to continuously compete on cost. Life insurance coverage has never been as affordable as it is today – especially for preferred risks. But these lower premium rates come at a price, primarily through a more thorough underwriting process.
Given the success factors needed to offer preferred life products, it is unlikely that these programs will become as popular in other parts of the world as they are in the US. Reasons vary by market, and in time these markets may become more receptive to some form of risk segmentation. But for now the popularity is quite limited outside the US.
In the US, however, the benefits of preferred programs outweigh the challenges. As long as carriers continue to apply sound actuarial and risk assessment procedures, preferred mortality risk will remain a key product feature for consumers, producers and life insurers.
Conclusion

14
Preferred Risk in Life Insurance
APPENDIX A – The Quest for Alternative Markers
Researchers continue to assess the value of the presence or absence of sufficient levels of proteins in blood panels. One protein marker – NTproBNP – has shown promising value as a marker for cardiovascular health in older-age applicants, po-tentially reducing the need (and risk) of subjecting an elderly applicant to a stress treadmill test. Hemoglobin A1C holds promise as an effective marker for diabetes.
Genetic testing has been a topic of discussion and debate of decades. Such tests have become very inexpensive and are simple to administer – a single strand of hair can provide suf-ficient genetic information. It also has been controversial. Re-quiring testing as part of the application process could reveal information to the applicant that might be traumatic.
Some carriers doubt what additional information could be gleaned from a genetic test that is not already revealed sat-isfactorily through part of the application requesting family history (the source of the gene path). But genetic testing may result in time and cost savings.
More labs offer genetic tests directly to the public, bypassing the physician. Sufficient concern over selection exists as indi-viduals become more informed about their risk than the life insurer can through the application.
Predictive Modeling. Predictive modeling, long used in prop-erty-casualty insurance, identifies and assesses a set of un-related but highly correlated data points to determine an applicant’s risk profile. For example, in auto insurance credit history long has been proven to be highly correlated with an individual’s probability of loss.
On the mortality side, the predictive values that perhaps hold most promise are healthy habits.1 The concept proposes that applicants who demonstrate certain positive patterns of be-havior (brushing teeth at least twice a day, wearing a seatbelt, etc.) will be more likely to adhere to other positive mortality-related behaviors (exercise, routine taking of medication, rea-sonable or low alcohol consumption). Use as a surrogate for existing tests and quantification of these behaviors, however, remains a challenge.
Pharmaceutical Data. Using pharmaceutical data for mortality risk assessment shows immense potential. Most major pre-scription drug plans in the US now utilize databases to track issue, dosage and refill activity, as well as the prescribing phy-sician.
Life insurers have begun to access these databases for sev-eral uses. At the most basic level, a review of an applicant’s prescription drug history can help affirm personal medical history information provided in the application, reducing the need for follow-up. More companies today are applying these databases more thoroughly. The presence of certain prescriptions (for example, statins for cholesterol control) may automatically disqualify an applicant from the best class. For other carriers, the applicant may qualify if prescription history shows consistent dosage and refill activity, and the resulting condition is within preferred levels as treated. Figure 5 illus-trates this difference in approach (in the case of cholesterol treatment).
The most robust systems recognize that many prescriptions are multi-use. A beta-blocker may be prescribed for a number of medical conditions – some innocuous, some serious. The systems will look for other drugs commonly taken in conjunc-tion with such prescriptions to treat particularly critical medi-cal conditions, and flag these concerns for additional review.2 In most cases this entire process is technology-enabled and can take mere minutes to process.
1 • For more information, see Risk Selection: Considering New Mortality Markers available on SCOR’s website.2 • For more information on VELOGICA®, see SCOR’s website.

15
SCOR inFORM - November 2012

SCOR Global Life5 avenue Kléber75795 Paris Cedex 16Francewww.scor.com