Embed Size (px)
Citation preview

6
Preface
This Ph.D. thesis contains the result of research undertaken at the Department of Spatial Economics of the VU University Amsterdam. This research was realized within the framework of the Programme: MOZAIEK, funded by the Dutch Organization of Scientific Research (NWO). Certainly, I would have never reached the point of finishing my dissertation without the help and support of others.
These four years have been a challenging trip, with both ups and downs. Fortunately, I was not alone on this road, but accompanied by an extended team of experts, always willing to coach, sponsor, help, and motivate me. For this, I would like to kindly thank them.
My most important coach throughout all these years was Peter Nijkamp: “You are full of knowledge and ideas, you are eager to share them and were always ready to find time for me disregarding your busy schedule. Thank you so much for always being there for me, in times of when the research was going to plan, but also in stressful periods, for your understanding and emotional support during my PhD dips”. Furthermore, I would like to thank my other promoters Tuzin Baycan and Enno Masurel for their comments and suggestions on my work and their continuous support. Thanks for always taking the time to discuss problems with me. Tuzin: “Especially in the beginning of my journey you introduced me to the thesis writing process, and guided me through the world of science”. Enno: “You were very open and clear in your supervision, which made the cooperation with you very enjoyable. I would like to truly thank you for that”. I am grateful to my promoters, who have given me the opportunity and freedom to determine the direction of my research, along the lines that I thought was best.
I would also like to thank Piet Rietveld and Peter Nijkamp for giving me the opportunity to work at the Department of Spatial Economics. Many thanks for your support and belief. I owe appreciation to the secretaries of the department, in particular to Elfie Bonke, Ellen Woudstra, Jenny Wiersema and Mariska van den Berg, who have been a great support during this period.
Many thanks to my fellow researchers. During my stay at the department, I shared an office with Maureen Lankhuizen, Gert-Jan Linders, Mark van Duijn, Faroek Lazrak, and Alex Halsema. I very much enjoyed our daily exchange of ideas and thoughts, and the fun moments together.
Special thanks go to all other people who have worked with me over the years, in particular the co-authors Alina Todiras, Bart Neuts, Marius Rietdijk, Soushi Suzuki, and Christiaan Behrens.
I would like to thank my colleagues and friends at the department: Ahu Gülümser, Patricia van Hemert, Bahar Kaynar and Eveline van Leeuwen for many useful discussions, comments and suggestions.

7
Thanks and love to my father Cafer and my mother Cennet, who is unfortunately not among us anymore, for their encouragement and support; to my brother Mehmet and his wife Bahar. Thanks to my mother-in-law Hüsniye, father-in-law Enver, Ayse, Hakan, Cengiz, Oktay, Egemen, and all my other relatives. Undoubtedly, my husband Gökhan deserves a special word of appreciation for his moral support, for his patience and love.
Many thanks also to the members of my promotion committee for spending time on evaluating my thesis, and for providing useful comments and suggestions.
Mediha Sahin
8
CHAPTER 1 MIGRANT ENTREPRENEURSHIP: AIMS AND SCOPE OF THE STUDY
1. ENTREPRENEURIAL HEROES AND NEW ENTREPRENEURSHIP
The old American myth praises the entrepreneur, who has built his business from scratch, as a hero who embodies the values of freedom and creativity. The ‘entrepreneurial heroes’ are those who come up with new ideas, and then – despite much resistance – turn them into reality. They take the initiative, are proactive, come up with technological and organizational innovations, and find new solutions to old problems. They are the architects of vibrant new companies and the rescuers of the failing ones. The term ‘entrepreneurial hero’ has been persistently used in the small and medium-size enterprise (SME) literature, even though it has also been questioned whether it is an appropriate term describing the struggle of a single man or a collective force (Reich, 1987). Various scholars have agreed on the idea that, rather than giving praise to the individual, more focus should be on collective entrepreneurship, since the whole of the effort is greater than the sum of individual contributions (Cooney and Bygrave, 1997).
‘Entrepreneurial heroes’ are not born in a passive environment, but are the offspring of challenging conditions that facilitate and induce new business activities. Such conditions may partly be found in competitive local situations, but also in socio-economic background factors (e.g. unemployment, social exclusion) that prompt economic actors to look for alternative and daring endeavours. Especially in an age of mass migration – often into metropolitan areas – many newcomers are encouraged or forced to become self-employed or to start their own business. There is an increasing body of literature on the implications of cultural, ethnic or migrant diversity for new business formation (for a review, see Baycan-Levent, 2010).
The concepts of ‘ethnic entrepreneurs’, ‘ethnic minority entrepreneurs’, ‘migrant entrepreneurs’ and ‘new entrepreneurs’ are often used interchangeably (van den Tillaart, 2007). Light and Gold (2000) speak in this context of ‘the ethnic economy’, which they define as any ethnic or immigrant’s self-employed group, its employers, their co-ethnic employees, and their unpaid family workers. Ethnic entrepreneurship can then be defined as “a set of connections and regular patterns of interaction among people sharing a common national background or migration experiences” (Waldinger et al., 1990).

9
An alternative term to ‘ethnic’ that is used is ‘immigrant entrepreneurs’, but this only includes individuals who have actually immigrated over the past few decades. This definition therefore excludes those members of ethnic minority groups who have been living in a country for several centuries, such as Afro-Americans in the US, Jews in Europe, or aboriginals in Australia. In our study, however, we use these terms ‘ethnic’ and ‘immigrant’ interchangeably.
The present study has a specific and novel focus: it addresses the differences in the economic performance of migrant entrepreneurs from the perspective of both internal and contextual determinants. It does so by adopting a micro-based approach to the attitude and behaviour of individual migrant entrepreneurs. To that end, a new model, called the GALAXY model, was designed and estimated. The focus of this study is more on a disparity analysis of distinct categories of migrant entrepreneurs, and less on a comparison between Dutch and foreign entrepreneurs, although some evidence on these differences will also be provided.
In this introductory chapter we provide a concise general orientation on entrepreneurship, followed by a focus on migrant entrepreneurship, which is the subject matter of the present study. The aim of the present chapter is not to provide a comprehensive overview of the literature, because such overviews and critical evaluations of the field of migrant entrepreneurship are already contained in the subsequent chapters which address various key aspects of migrant entrepreneurship. This introduction highlights the economic relevance of migrant entrepreneurship, and then outlines the research focus and research relevance of our study. After a description of the aims and scope of our research, the methodological approach and organization of this thesis are presented.
2. ENTREPRENEURSHIP: ORIENTATION
Entrepreneurship has been the subject of numerous debates and investigations over the last few decades. It has gained a wealth of attention, and it has become an important factor in the organization of economies and the creation of innovations. According to Audretsch and Thurik (2004, p. 144): “Entrepreneurship has emerged as the engine of economic and social development throughout the world.” Entrepreneurship is recognized as a source of economic growth through job creation, knowledge spillovers, the stimulation of competition, etc. The rise of interest in entrepreneurship over the last decades has been caused by multiple factors, among which are globalization, ICT revolutions, flexibilization and decentralization, etc.
Entrepreneurship in the classical sense refers to the combining of resources in novel ways so as to create something of value (Aldrich and Waldinger, 1990). Another definition of an entrepreneur is “someone who specializes in taking responsibility for and making judgemental decisions that affect the location, form and the use of goods, resources and institutions” (Hébert and Link, 1982). This definition is based on a more economic point of view. The importance of entrepreneurship as a strategic tool for economic growth has been clearly recognized for many decades by politicians and policy makers. However, it was not until the mid-1970s that entrepreneurship was given due attention; until then the dominant form of organization was
10
mainly the large enterprise characterized by mass production and economies of scope. A dramatic shift toward smaller enterprises has occurred as a result of the joint effect of globalization and the ICT revolution, which subsequently reduced the cost of moving capital and information to low-cost locations outside Europe and North America, and which also offered new and unprecedented opportunities for local economic vitality.
Entrepreneurship has clearly evolved into an imperative element in the organization and restructuring of economies. It has been further fostered by the deregulation and privatization process in many Western countries. Furthermore, governments have acknowledged and started to promote the role of entrepreneurship in stimulating economic growth and development. However, entrepreneurship has not emerged concurrently in all countries and regions: North America was far ahead of Europe in ‘embracing the entrepreneurial energy’ and absorbing its merits (Thurik, 2009). Currently, the European Union regards entrepreneurship as a central driver for an innovation economy. Multiple EU programmes for building and fostering a climate in which entrepreneurial initiatives and business activities can thrive are being put in place.
There is an abundance of definitions for the term ‘entrepreneurship’, but, despite that, there is no generally accepted definition. Most of the definitions, however, converge at certain points, and thus it can be said that the main key drivers of entrepreneurial activity according to various definitions are the sensing of opportunities, risk-taking propensity, efficient use of scarce resources, and innovative activities (Knight, 1921; Kirzner, 1973; Schumpeter, 1934; Sharma and Chrisman, 1999; Kuratko and Hodgetts, 2001). As there is no commonly agreed definition of entrepreneurship, there is also ambiguity about the functional definition of ‘entrepreneur’. However, from the key drivers of entrepreneurship listed above, we can form the profile of an entrepreneur. Thus, the entrepreneur is an individual able to recognize business opportunities, willing to take a risk despite often encountering high degrees of uncertainty; he must also possess the ability and resources to follow the recognized opportunities rather than opting for employment or unemployment positions (Thurik, 2009). Schumpeter (1934) emphasized the role of the entrepreneur as an innovator who creatively destroys existing market structures. In his view, entrepreneurs do not only invent things but rather also exploit the existing ones by introducing new processes and new types of organization, by identifying new markets and sources of supply, etc. According to Schumpeter (1934), these entrepreneurs can be found mainly in small firms, and they can evolve into entrepreneurial managers (intrapreneurs), or choose to start new ventures (serial entrepreneurs) (Carree and Thurik, 2010).
The main determinants of entrepreneurial activity can range from psychological, demographic and social to economic determinants. Verheul et al. (2001) have combined these perspectives in a structured framework on entrepreneurship. According to their framework, entrepreneurship may be analysed on three different levels: the micro-, industry and macro- level. At the micro-level we refer to the decision process and the motivation to become self-employed. Here, we also look at the entrepreneur’s personal factors, psychological traits, age,
11
education, work experience, financial assets, etc. At the industry level, we consider market determinants, such as profit opportunities, competition, business networks, etc. The third level is the macro-level, which covers environmental factors, policy factors, and technological, economic, and cultural variables.
Carree and Thurik (2010) present a rather comprehensive definition of entrepreneurship; according to them it is ‘the manifest ability and willingness of individuals, on their own, in teams, within and outside existing organizations to perceive and create new economic opportunities and to introduce their ideas to the market in the face of uncertainty and other obstacles by making decisions on location, form, and the use of resources and institutions’. Porter (1990) realized early on that entrepreneurship is at the heart of national advantage, being a catalyst for new firm formation, innovations, and market rivalry. Furthermore, these authors consider that market rivalry is more conducive to knowledge externalities than local monopolies (Jacobs, 1969; Porter, 1990). Acs et al. (2006) also emphasize that there is a strong relationship between knowledge spillover and entrepreneurial activity. Therefore, one way in which entrepreneurship capital generates economic growth is by knowledge spillover, when firms can appropriate some of the returns by taking advantage of the investments made externally (Cohen and Levinthal, 1989). Another way is by increasing the number of firms, which in turn augments the competition for new ideas, and facilitates the entry of new firms specializing in a particular new product niche (Thurik, 2009). Entrepreneurship can also generate economic growth by promoting diversity among firms. Another important contribution could be the element of ‘newness’, through the transformation of inventions and ideas into economically-viable entities (Carree and Thurik, 2010).
3. A NOVEL PHENOMENON: MIGRANT ENTREPRENEURSHIP
Over the past decades, we have thus clearly witnessed a significant shift in the orientation of migrant groups: namely, towards self-employment (Baycan-Levent et al., 2003). This movement has prompted the rise of migrant entrepreneurship (van Delft et al., 2000; Masurel and Nijkamp, 2003; Waldinger et al., 1990). The latter phenomenon distinguishes itself from ‘normal’ entrepreneurship through its orientation on migrant products, on migrant market customers, or on indigenous migrant business strategies (Choenni, 1997). Migrant entrepreneurship is also generally regarded as an important self-organizing principle, by means of which migrant minorities are able to improve their weak socio-economic position (Baycan-Levent et al., 2003) (for a further comprehensive explanation, see Dana, 2007, the Handbook of Ethnic Entrepreneurship).
In the ‘age of migration’ many migrants of foreign origin have thus had to resort to starting their own business. A tendency over the last decades has also been the choice of migrants to become self-employed, which has led to the emergence of the term ‘migrant entrepreneurship’. Kloosterman and Rath (2003) suggest that self-employed migrants play an important role in the emergence of small firms. In most of the cases, they are pushed to engage

12
in entrepreneurial activities due to restricted access to jobs and blocked opportunities for upward social mobility. Numerous studies attest that most of the entrepreneurial activity of migrants takes place in the traditional labour-intensive industries, e.g. retail, catering, hospitality, which have lower access barriers and require fewer skills (Sahin et al., 2012; Baycan-Levent et al., 2009; Hermes and Leicht, 2010). Hermes and Leicht (2010) argue that the more advanced is a country’s economic development, the higher the probability of migrant entrepreneurial activity in simple routine services. However, self-employment rates vary more between countries than between migrants and natives (Tubergen, 2004).
The level of entrepreneurship varies substantially between different countries, and, furthermore, between different populations within countries. These levels of both native and migrant entrepreneurship within countries are influenced, on the one hand, by the opportunity structures on the demand side and, on the other, by the talents of entrepreneurs and their resources or individual capital on the supply side (Hermes and Leicht, 2010). The opportunities in small business are usually available for both native and migrant entrepreneurs, but the latter group experiences various restrictions, and consequently develops different strategies (Waldinger et al., 1990). Therefore, the migrants have a different self-employment trajectory than the natives, one of the most obvious being the divergence in sectoral choice.
The merits of migrant entrepreneurs have been recognized by many host societies, which have subsequently introduced various policy measures to stimulate self-employment among migrants and create a business environment where ethnic enterprises can thrive. Among the most well-known merits of migrant entrepreneurship is the stimulation of economic growth, new job creation, and promotion of diversity, which, according to Jacobs (1969), is the main cause of the prosperity of urban economies. Furthermore, immigrant entrepreneurship may especially improve the economic position of immigrants from non-Western countries and support the general integration of these immigrant groups in the host society. Therefore, the field of migrant entrepreneurship calls for more research and insight into the main motives to become self-employed and the success factors for the survival of the migrant enterprises.
In Europe, the main reason for migration has usually been employment-seeking in established industries in host countries. However, because of the present adverse economic conditions, high unemployment, restrictions and limited opportunities, many immigrants have chosen to become entrepreneurs. The main perspective from which migrant entrepreneurship has been studied in the past decades is the sociological perspective, which revolves around the ethno-cultural characteristics of the ethnic populations.
Currently, in many European countries, the number of immigrants starting their own businesses surpasses that of the self-employed native population. The European Commission attests to the fact that ethnic minorities exhibit a great entrepreneurial capacity and potential (European Commission, 2011). The European immigrants have freedom of establishment within the EU, and, moreover, their qualifications are more easily recognized, whereas the non-EU immigrants have to face a complex set of barriers when setting up a business (institutional and legal barriers, acknowledgement of qualifications). Immigrants to Europe are often

13
characterized by lower educational attainment, and this disadvantage coupled with limited access to labour market, pushes them into self-employment in marginal positions. The immigrant businesses are thus concentrated in less attractive and more labour-intensive sectors such as retail, hospitality, catering, etc. Hermes and Leicht (2010) argue that the more advanced a country’s economy, the higher is the self-employment rate of immigrants in traditional sectors. While members of the majority population or host society are self-employed in modern employment sectors and serve the mainstream market with a mainstream product, ethnic entrepreneurs are entrenched in ethnic enclaves. On the supply side, the immigrants can benefit from their ethnic resources: social networks, ethnic labour force, and ethnic products. On the demand side, ethnic entrepreneurs serve a predominantly ethnic clientele. However, the opportunity structures for immigrants also develop outside their own ethnic enclaves: and some manage to ‘break out’ in the mainstream market which satisfies the needs of the majority of the population.
One of the countries that has witnessed a large influx of migrant entrepreneurs is the Netherlands. In that country, most of the immigrants originate from non-EU countries. These people belong to the first-generation migrants if born outside the Netherlands, and to second-generation migrants if at least one of their parents is of foreign descent. Furthermore, a distinction is made between Western (European countries, North America, Oceania, Japan and Indonesia – including the former Dutch East Indies) and non-Western immigrants (Turkey and all countries in Africa, Latin America, and Asia – excluding Japan and Indonesia (CBS, 2001). Table 1: Share of non-Western and Western entrepreneurs in the population, according to the generation of ethnic entrepreneurs in the Netherlands, 2000-2007
Year
Non-western Western
1st generation 2nd generation 1st generation 2nd generation
2000 30% 4% 24% 43% 2001 31% 5% 23% 41% 2002 32% 5% 23% 40% 2003 33% 5% 22% 40% 2004 33% 6% 22% 39% 2005 33% 6% 22% 39% 2006 33% 7% 23% 38% 2007 33% 7% 23% 36% Source: Bleeker et al., 2011.
Table 1 provides the share of Western and non-Western ethnic entrepreneurs in the total population of ethnic entrepreneurs. We can see that the second-generation Western entrepreneurs (36 per cent) and the first-generation non-Western entrepreneurs (33 per cent) in 2007 have the largest share in the population of ethnic entrepreneurs. The proportion of
14
non-Western ethnic entrepreneurs has increased from 34 per cent in 2000 to over 40 per cent in 2007 (Bleeker et al., 2011).
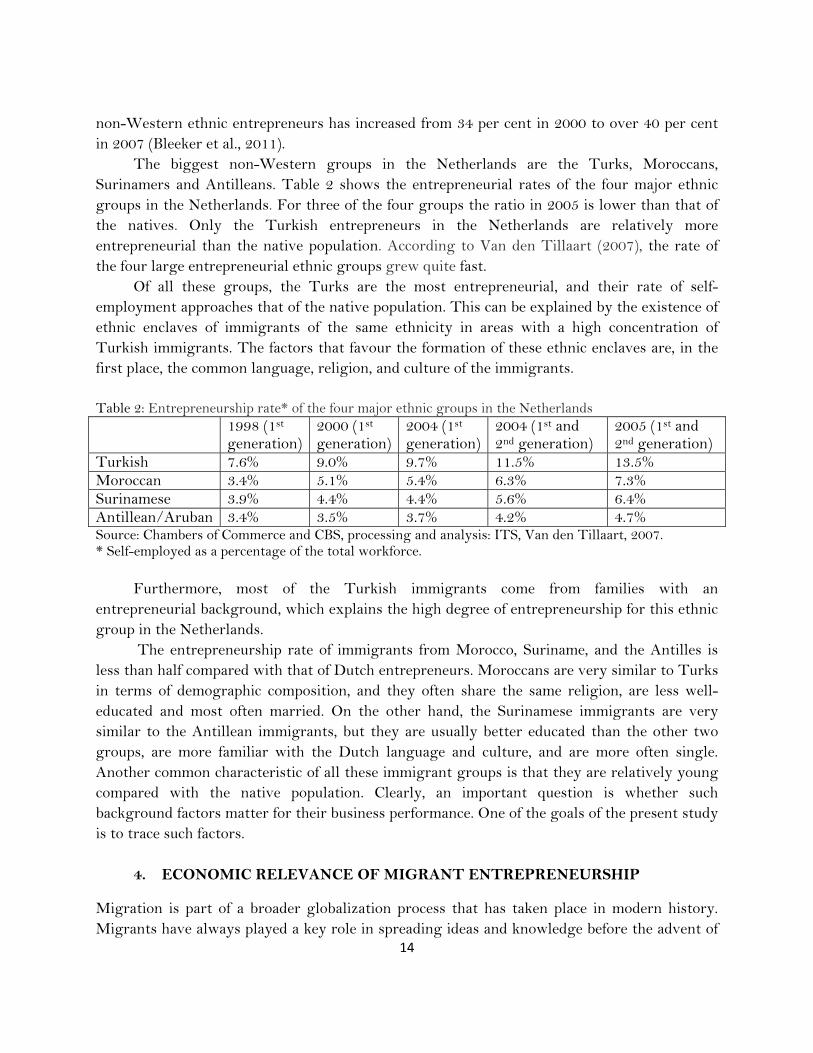
The biggest non-Western groups in the Netherlands are the Turks, Moroccans, Surinamers and Antilleans. Table 2 shows the entrepreneurial rates of the four major ethnic groups in the Netherlands. For three of the four groups the ratio in 2005 is lower than that of the natives. Only the Turkish entrepreneurs in the Netherlands are relatively more entrepreneurial than the native population. According to Van den Tillaart (2007), the rate of the four large entrepreneurial ethnic groups grew quite fast.
Of all these groups, the Turks are the most entrepreneurial, and their rate of self-employment approaches that of the native population. This can be explained by the existence of ethnic enclaves of immigrants of the same ethnicity in areas with a high concentration of Turkish immigrants. The factors that favour the formation of these ethnic enclaves are, in the first place, the common language, religion, and culture of the immigrants. Table 2: Entrepreneurship rate* of the four major ethnic groups in the Netherlands 1998 (1st
generation) 2000 (1st generation)
2004 (1st generation)
2004 (1st and 2nd generation)
2005 (1st and 2nd generation)
Turkish 7.6% 9.0% 9.7% 11.5% 13.5% Moroccan 3.4% 5.1% 5.4% 6.3% 7.3% Surinamese 3.9% 4.4% 4.4% 5.6% 6.4% Antillean/Aruban 3.4% 3.5% 3.7% 4.2% 4.7% Source: Chambers of Commerce and CBS, processing and analysis: ITS, Van den Tillaart, 2007. * Self-employed as a percentage of the total workforce.
Furthermore, most of the Turkish immigrants come from families with an entrepreneurial background, which explains the high degree of entrepreneurship for this ethnic group in the Netherlands.
The entrepreneurship rate of immigrants from Morocco, Suriname, and the Antilles is less than half compared with that of Dutch entrepreneurs. Moroccans are very similar to Turks in terms of demographic composition, and they often share the same religion, are less well-educated and most often married. On the other hand, the Surinamese immigrants are very similar to the Antillean immigrants, but they are usually better educated than the other two groups, are more familiar with the Dutch language and culture, and are more often single. Another common characteristic of all these immigrant groups is that they are relatively young compared with the native population. Clearly, an important question is whether such background factors matter for their business performance. One of the goals of the present study is to trace such factors.
4. ECONOMIC RELEVANCE OF MIGRANT ENTREPRENEURSHIP
Migration is part of a broader globalization process that has taken place in modern history. Migrants have always played a key role in spreading ideas and knowledge before the advent of
15
modern communication technologies. Migrant (or ethnic) entrepreneurs have become a relatively new species in the urban economy of modern cities in the developed world. They have to find a new niche in the complex socio-economic ramifications of a modern city, where survival is the main business challenge in a competitive environment characterized by cultural diversity and risky economic investments. The current urban system in the Western world is increasingly faced with cultural diversity as a result of international migration. Clearly, diversity is not a problem in itself and is increasingly also valued as a positive developmental factor, while its social, cultural and economic benefits are broadly recognized (for a review, see Baycan-Levent, 2010). In recent decades, cultural diversity has become a key feature of an urbanized Western society. Like the US, several European countries (e.g. Germany, the Netherlands, Spain, the UK, Italy, or Sweden) have, over the years, increasingly attracted migrants from all over the world, be it for work purposes, family reunion, or on humanitarian grounds. It seems plausible, therefore, to state that we live in an age of foreign migration.
It is important to note that many migrants who are ‘on the move’ worldwide seem to be more inclined towards risk-taking behaviour in self-employment than the natives who remain in the original home country. They usually migrate with a strong desire for socio-economic advancement, and are thus more likely to take risks and become self-employed. In addition, the difficulty of finding a job in the regular economy of a host country has encouraged several migrants to set up their own business. Their geographic concentration in large urban agglomerations and their response to specific demands for ethnic products and services by their own ethnic or socio-cultural groups have enabled several migrant businesses to flourish, especially in urban areas. This has led to rising market shares of migrant entrepreneurs within the ethnic community itself, since migrant groups have specific needs and preferences that can be satisfied more easily by migrant entrepreneurs who know the preferences of their own ethnic community. Thus, there is sufficient scope for migrant business niches in a modern multicultural city.
Migrant entrepreneurship in modern cities provides opportunities for, and access to, economic growth, equal opportunities, and upward mobility for many of those who have traditionally been excluded from regular business (‘the stranger is the trader’). With the ongoing rise in ethnic minority populations, the economic power of these groups has become a visible fact that no urban policy can afford to ignore. Young people of ethnic origin are progressing more than ever before in education and the workforce (see Cormack and Niessen, 2002). Many successful self-employed migrants or minority business firms contribute to improved social and economic integration in the host society. The general major factors that are responsible for the development of migrant entrepreneurship are: labour market disadvantages, new opportunity structures, group resources, and local embeddedness. For a review of the opportunities of migrant (or ethnic) entrepreneurship, we refer, inter alia, to Baycan-Levent and Nijkamp (2009), Baycan-Levent et al. (2009), Dana (2007), and Sahin et al. (2007, 2009). It goes without saying that modern migrant entrepreneurship prompts a series of
16
fascinating research questions on the nature, drivers, and success factors of these ‘new entrepreneurial heroes’. These questions will be outlined in the next subsection.
5. AIMS AND SCOPE
5.1. Research focus In an open and global world characterized by rising urbanization, modern cities function as the habitat of international migrants and magnets of economic growth, in which small and medium-sized enterprises (SMEs) are a source of new jobs, business dynamism, and innovation. Migrant entrepreneurs form a significant part of the SME sector in our cities, and may hence be important vehicles for urban vitality. Usually, these migrant entrepreneurs have to work in an unfamiliar and risky business environment. Consequently, they may be less entrepreneurially-oriented in terms of risk attitudes concerning undertaking innovative business activities, and they usually concentrate on their own socio-cultural group.
The Netherlands is a good illustration of the above megatrends. The steady influx of immigrants since the 1960s has led to a diverse ethnic composition in the Netherlands, mainly in its major cities. Cities like Amsterdam, The Hague, Rotterdam and Utrecht are the breeding grounds of multicultural activity (Van den Tillaart, 2007). This ethnic diversity in the city tends to lead to an enrichment of social and economic opportunities, and a higher variation in the range of talents in employment, which thus improves creativity. Ethnic (or, perhaps better, migrant) entrepreneurship is a visible manifestation of ethnic and cultural diversity, where work is provided for precisely those groups where unemployment is relatively high, because immigrants are often low-skilled. This can also lead to a further integration of immigrants into the official labour market and social cohesion, and, at the same time, it also contributes to the strengthening of the urban economy. Immigrant entrepreneurship not only provides employment and economic growth but also makes the city more vibrant.
Entrepreneurship among immigrants is of great importance to cities for economic, political, and social reasons. The contribution of immigrants to employment creation is not limited to ethnic and niche markets, but is increasingly expanding into new sectors (‘break-out strategies'), for example, the creative industries. Moreover, their behaviour has significantly contributed to urban economic growth in recent years. Urban diversity is thus important, for both business facilities, and knowledge-sharing. Diversity will therefore lead to new and innovative combinations, which in turn will attract new businesses and talent. Because of their diversity, immigrant entrepreneurs tend to develop a differentiated urban economy, and thus contribute to stimulating its further growth (see Sahin et al., 2007). More and more districts in the Netherlands are coming to have a multicultural character. The presence of ethnic shops and restaurants brings vibrancy and diversity and can also enrich the neighbourhoods. In these ethnically colourful neighbourhoods, migrants can experience their own identity, express themselves and maintain their culture. They will find the necessary informal support, security and solidarity in social networks to pursue economic activities and to take some risks. These

17
areas therefore offer unique opportunities for immigrants to start their own business. Enterprising immigrants are of great importance for the economic potential of the city, and, in their own way, contribute to the diversity of the neighbourhood, and strengthen the local economy. Thanks to the positive development of immigrant entrepreneurship, these neighbourhoods are often now the scene of thriving enterprise and a good quality of life, enabling more customers (both locals and foreigners) to find and visit specific stores in a particular neighbourhood setting. In short, the economic potential in these areas, which is reflected in a growing immigrant entrepreneurship, is a source of creative possibilities for multicultural neighbourhoods.
Reliance on social networks of their own socio-cultural group may guarantee a certain market share, but may at the same time hamper an outreach strategy towards new and innovative markets (e.g. high-tech/ICT). Woolcock (1998) claimed that reliance on one’s own migrant group and its related network is both developmental and destructive. However, according to Menzies et al. (2003), an orientation on one’s own group can actually be a benefit to migrant entrepreneurs. And Portes and Jensen (1998) referred to the effects of some degree of monopolistic power in migrant entrepreneurship regarding better access to a relatively protected market. Nevertheless, Lyer and Shapiro (1999) have suggested that competition amongst migrant entrepreneurs serving the same limited market niche may also increase business failure, especially if the market size is relatively small. Thus, the empirical findings are not unambiguous, and call for more fundamental research. This study will investigate the relationship between culture and social networks, with a view to the identification of Critical Success Factors (CSFs) for business performance and entry into new business markets by migrant entrepreneurs of different ethnic origin in Dutch cities.
Migrant entrepreneurship is not only an intriguing phenomenon in the urban business sector, it also has a great socio-economic relevance. "Migrant entrepreneurship has rapidly risen to a factor of great importance for urban vitality. An important part of the urban SMEs in our country – especially in big cities – accounts for immigrant entrepreneurship. The associated cultural diversity leads to creative urban developments, new services, and original niche markets. The importance of immigrant entrepreneurship is now so great that a modern city without the input of business migrants is no longer imaginable” (Nijkamp et al., 2009).
Against the background of the above observation, this thesis serves to highlight the importance of migrant business in urban areas, and in particular investigates empirically the economic performance of migrant entrepreneurs in the high-skilled and high-tech sector in urban areas in the Netherlands. The thesis presents an empirical analysis of this phenomenon in the Netherlands, with specific emphasis on its CSFs. The focus is on the analysis of the business performance of migrant entrepreneurs in Dutch cities, against the background of differences in migrant characteristics, and in particular on those decisive factors that explain differences in economic performance in migrant business. A broadly-composed and modern methodological toolbox is employed in our study. To that end, we use, inter alia, Rough Set Data Analysis (RSDA), Data Envelopment Analysis (DEA), and Structural Equations
18
Modelling (SEM), in particular Analysis of Moment Structures (AMOS), which are applied to a sample of business firms in the FIRE (Finance, Insurance and Real Estate) and ICT (Information and Communication Technology), and other sectors in the Netherlands.
The research domain of ethnic migrant entrepreneurship has led to an avalanche of publications, often somewhat anecdotal or local in nature. Our study addresses in particular the drivers of this new entrepreneurship in order to explain its economic performance, and, therefore, the main research question of this study is:
Under which socio-cultural and economic conditions will migrant entrepreneurs develop a successful business, with a particular view to entering new market segments and contributing to a dynamic and innovative urban business climate?
The main challenge of our research is to explore the differences in the business performance factors of migrant entrepreneurs that are linked to their success and possible ‘break-out’ strategy towards new markets, given their socio-cultural background and network context. It is, therefore, also important to consider the following sub-questions:
To what extent do contextual and individual motivational factors influence the business performance of migrant entrepreneurs in a multicultural playing field?
Does the existence of migrant linkages and socio-cultural bonds in urban networks of migrants help to improve business performance and support conditions for entry into new markets in a competitive urban economic environment?
Before focusing attention on the substance and composition of our study on the drivers of successful ethnic entrepreneurship, next in Subsections 5.2. and 5.3. we address more explicitly the empirical and methodological context of our research.
5.2. Research relevance The phenomenon of ‘migrant entrepreneurship’ refers to business activities undertaken by migrants with a specific socio-cultural and ethnic background or migrant origin. Migrant entrepreneurs focus on migrant products, migrant market customers, or indigenous migrant business strategies. As mentioned, migrant entrepreneurship in itself is not a recent phenomenon. The study of migrant entrepreneurship started mainly in the US (Light, 1972), while later studies on this topic also emerged across Western Europe (Ward and Jenkins, 1984) for the United Kingdom and France (Simon, 1993), and in Israel (Razin, 1993). However, the European research interest in this topic lags far behind applied research in the US. Migrant entrepreneurship was already well-recognized in American cities from the 1960s: witness the pioneering publications by Glazer (1963), Jacobs (1961), and Light (1972), amongst others. It appeared in European cities only in more recent decades, as a result of the inflow of foreign migrants, first from the Mediterranean and from former colonies, and later on as a consequence of refugees and asylum seekers from various problem regions in the world. Even though foreign migrants do, in general, not have a demonstrable negative impact on the socio-economic conditions of indigenous people, there is still much concern worldwide about the possible negative consequences of the international migration wave. Against this background,
19
the phenomenon of migrant entrepreneurship has gained much popularity, as this type of self-employment has given a strong impetus to urban revitalization, while avoiding the negative impacts on the labour market that are often perceived (see, e.g., Bates 1997, Baycan-Levent et al., 2009; Cummings, 1980; Razin and Light, 1988). Since migrant entrepreneurship is often seen as a sign of hope for urban economies in decay, the phenomenon of ‘migrant entrepreneurship’ deserves careful scientific investigation on the basis of a comparative study, in terms of incubator conditions and the critical success factors for a promising business performance. Against this background, based on a blend of theoretical and applied research, our study examines the possible causes for significant differences in business performance, and attempt to identify the range of critical success factors and differences in entrepreneurial behaviour — both conceptually and empirically — for different groups of urban migrant entrepreneurs in the Netherlands. Personal and business characteristics, as well as participation in social networks, will be investigated in order to understand the differences in business performance and the critical conditions that improve business performance in a competitive urban economic environment. This thesis investigates both the motivation of different ethnic groups (Chapter 2, Chapter 5, Chapter 9) and the performance of ethnic businesses (Chapter 4, Chapter 6, Chapter 8).
This study begins with a broad literature survey, of both American and European origin, in order to: (a) develop a theoretical framework leading to hypotheses to identify the causes and background of possible differences in business performance of relevant migrant groups; and (b) conduct an experimental analysis to determine the extent to which factors related to culture and network constellations – as well as indigenious business features – influence business performance. The hypotheses concern, inter alia, socio-cultural drivers of different cultural or migrant groups, the specific conditions for urban business incubation, and the socio-cultural network support systems in urban communities. Using empirical fieldwork in Dutch cities, employing, inter alia, systematic micro-based survey questionnaires, various research hypotheses are tested. Sophisticated statistical tools are applied as well.
In this study we have four data sets. The first consists of 83 first- and second-generation entrepreneurs of Turkish, Moroccan, and Surinamese origin in the service- and retail sector in the Amsterdam area. The second data set comprises 23 second-generation Turkish entrepreneurs from the FIRE sector in the Netherlands. The third data set consist of 42 respondents of Korean, Vietnamese, and other origin in the service and retail sector in Fairfax, Virginia in the US. The fourth data set considers 50 entrepreneurs from the main ethnic groups in the high-tech and advanced business services sectors in the four biggest cities of the Netherlands (e.g. Amsterdam, Rotterdam, The Hague, and Utrecht). The subsequent data set is an extension of the previous one, from 50 to 212 ethnic entrepreneurs.
In this study, the literature concerning entrepreneurial characteristics, determinants and features of migrants is discussed. The findings of earlier research suggest that entrepreneurs’ success is affected by their personal characteristics. Our study utilizes personal and business characteristics that have been shown in the literature to be associated with business

20
performance. The conceptual framework in our study presents a hypothesized relationship between the personal and the business characteristics of the entrepreneur and his or her decision to participate in (in)formal networks and their influence on business performance. There are four interlinked categories; (i) personal characteristics; (ii) business characteristics; (iii) participation in social networks; and (iv) business performance. These categories are interlinked with each other in that they measure business performance in various ways. The literature suggests that individual characteristics will definitely influence entrepreneurial behaviour. In our research, emphasis will be placed on the personal and business characteristics that influence the business activity and outcomes of entrepreneurs. It is thus assumed that personal and business characteristics play an important role in determining the entrepreneurs’ participation in social networks and determining their business performance.
The present study analyses the perception and behaviour of both first- and second-generation migrant entrepreneurs, whose age-span covers people of between approximately 18 and 65 years of age. The first-generation group consists of traditional migrants who were directly recruited for employment reasons. Mostly, first-generation migrant entrepreneurs set up their own business impulsively without first considering the market potential. The second-generation group consists of young dependants born in the host countries. This group is generally found to be more ambitious and selective in choosing a job. The population in our research was restricted to four migrant groups of people who are originally from Turkey, Morocco, Surinam, and the Dutch Antilles, because of their large share in the service sector which was seleceted for analysis. This was in order to compare these groups with each other in terms of their entrepreneurial behaviour – with a focus on personal and business characteristics – and to find significant differences in their entrepreneurial behaviour, which can explain the differences in rates of entrepreneurship and their business performance.
Due insight into entrepreneurial motives and into the attitudes and behaviour of migrants is needed for developing an urban business culture in which migrants are less a source of (perceived) problems but of great socio-economic opportunities. This can be achieved by improving the position of the migrant groups concerned, and thus contributing to sustainable urban development in a multicultural society. This study addresses one target group, viz. ethnic entrepreneurs and traces the conditions for a successful performance of this group. This thesis contains a set of officially published studies on ethnic entrepreneurship. They shed light on the motives and backgrounds for successful entrepreneurship.
Using previous research findings concerning the business model of many migrant entrepreneurs, the empirical part of our study is based on the following conceptual proposition of the migrant business model. The business model of many migrant entrepreneurs is less likely to be determined by the ‘maximizer’ or ‘optimizer’ strategy of a Schumpeterian risk-seeking businessman (the ‘entrepreneurial animal spirit’), but tends rather to be governed by a ‘satisficer’ strategy, in which business strategies fall within predetermined frameworks deemed acceptable by migrant entrepreneurs from a ‘bounded rationality’ viewpoint (Dana, 2007). The migrant entrepreneur with a ‘satisficer’ strategy operates in a stable market, and has economic

21
results which are satisfactory in terms of earnings, profit, and market share at the moment, but such a strategy does not offer path-breaking perspectives for further or innovative development. These entrepreneurs tend to be risk-avoiding, and hence concentrate on traditional market segments (e.g. markets for ethnic products). The migrant entrepreneur with a ‘maximizer’ strategy chooses actions to grow, to be innovative, and to move out (break-out) from the boundaries of the ethnic market into a more dynamic market, where he or she develops new products or services.
The Dutch migrant groups investigated in this interconnected set of studies on migrant entrepreneurship comprise migrant entrepreneurs from the four main groups of Turkish, Moroccan, Surinamese and Antillean origin, who are involved in advanced economic sectors, mostly in the four largest cities in the Netherlands: namely, Amsterdam, Rotterdam, The Hague, and Utrecht. The four major cities have a share of 43 per cent of all foreign-owned companies: 19 per cent in Amsterdam, 11 per cent in Rotterdam, 10 per cent in the Hague, and 3 per cent in Utrecht. These cities are known as concentration areas with breeding grounds for most of the immigrant entrepreneurial activity (van den Tillaart, 2007). The above-mentioned migrant groups have been selected on the basis of their size and presence in the more advanced of these urban economies.
5.3. Organization of the research
This thesis is based on a set of interconnected studies on migrant entrepreneurship that have been undertaken over the past years. These have been published (or will soon be published) in the international refereed literature. The main constituents of the present study can be summarized as follows: Part A: Exploratory analysis; Part B: Qualitative pattern analysis; Part C: Entrepreneurial performance analysis; Part D: Explanatory analysis; the GALAXY model.
Each of these parts contains two or three distinct chapters that address more specific questions related to the part concerned. The various chapters each separately offer a new perspective on migrant business in Dutch cities. They are like a prism with different angles. But they also show quite some variation in terms of the composition or size of the sample, the specific aim of the study, or the methodology used (see Table 3 for a summary). Consequently, there is no single, unambiguous research hypothesis to be tested throughout the thesis, but a series of mutually complementary and interlinked hypotheses, each using its own frame of reference, database, methodology, or application field. The logical structure of the connection between the various parts A–D in this study is illustrated by means of a Venn diagram in Figure 1, and by means of a survey table (see Table 3).
Figure 1 illustrates that the four parts of this study are interlinked; they have a partly overlapping and partly distinct character in terms of focus, analytical approach, methodology, sample, and research aim. As the figure shows, Parts A and B are similar in their focus on both

22
motivation and performance, while A and C use partly the same sample. The same applies to Part B in relation to Part C. Furthermore, Parts B and D correspond in their common focus on performance assessment. Lastly, Parts C and D are partly similar in the methodological approach applied.
In our study the construct of business performance is based on an objective and subjective definition of business performance, which is linked to economic success. In this case, objective business performance refers to the change in turnover, net and gross profit, personal income, and market share, while subjective business performance refers to the entrepreneurs’ opinion about the success of their business and their satisfaction with their achieved results and business performance.
Figure 1: A Venn diagram on the interlinked parts (A–D) of the thesis
Introduction
Ch 1
Conclusion
Ch 12

23
Besides these variables, we also include internal and external success factors to measure the drivers of the business performance of migrant entrepreneurs.
In conclusion, migrants are a significant part of the urban population in the Netherlands, and their business is critical for the urban economic development of Dutch cities, especially because of their large share in Small and Medium-sized Enterprises (SMEs). SMEs are often seen as a source of new jobs, business dynamism, and innovation, and hence are engines of economic growth. The relevance of this phenomenon is high: in recent years, self-employment among migrant minorities has increased significantly in the Netherlands.
The recent literature has even documented that migrant businesses are one of the fastest growing sectors in the Dutch economy. Despite the fast growth of migrant entrepreneurship in the country, there is less empirical information that documents entrepreneurial differences in business performance among various migrant minority groups. Moreover, the knowledge on the success conditions for migrant entrepreneurs is also lagging far behind the rapid growth of migrant entrepreneurs. Previous research has mainly focused on descriptive knowledge of native entrepreneurs that forms useful information for Dutch policy, education, and research. But nowadays, there is a clear need for quantitative analysis of migrant entrepreneurship, in combination with modern innovation theory, the role of informal network support systems, and the potential for further development of firms instead of considering only start-ups.
6. SUMMARY OF THE CHAPTERS IN THE THESIS
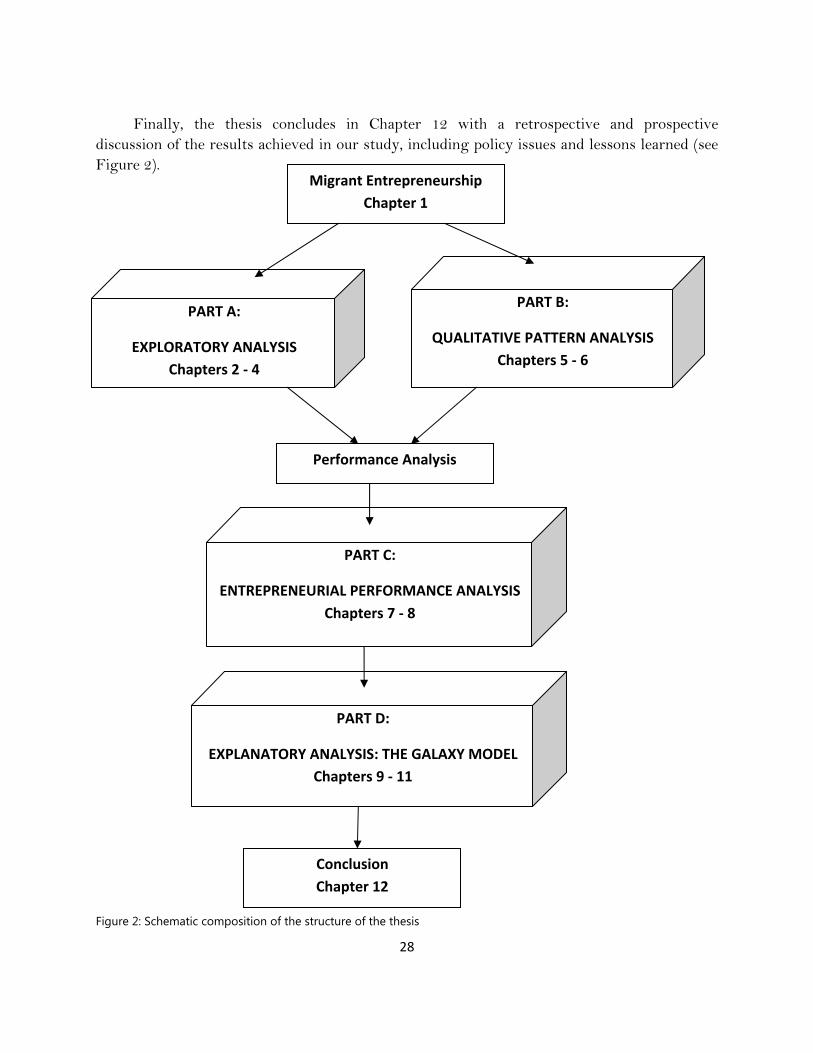
This thesis comprises four interconnected and mutually complementary parts. The contributions in part A review and evaluate migrant entrepreneurship from different perspectives. Part B employs quantitative pattern analysis for qualitative data analysis, in the form of Rough Set Data Analysis, to investigate the behaviour of migrant entrepreneurs. Part C aims to assess the efficiency profile of migrant businesses with Data Envelopment Analysis (DEA). And, finally, Part D introduces the GALAXY model to study migrant entrepreneurs’ business performance. The study will be concluded with a retrospective and prospective review. We will now briefly outline the organization and main substance of our research. For a schematic representation of the structure of this thesis, see Figure 2.
6.1. Exploratory analysis
Exploratory study is a valuable means of seeking new insights and asking questions in order to assess a phenomena in a new light. It is principally useful for clarifying the understanding of a particular problem, such as when the precise nature of the problem is uncertain (Saunders, 2006). The main ways of conducting an exploratory study are: searching the literature, interviewing ‘experts’ in the subject, and conducting focus group interviews. Adams and Schvaneveldt (1991) imply that the focus of an exploratory study is initially broad, but it becomes progressively narrower as the research advances.
24
The chapters in Part A review and evaluate migrant entrepreneurship from different perspectives. The first study, in Chapter 2 highlights the cultural diversity in migrant entrepreneurship, by investigating the key socio-economic and cultural aspects of different migrant groups of entrepreneurs in the Netherlands. We identify significant similarities and differences in migrant entrepreneurship behaviour and outcome of the main migrant groups in the Netherlands.
A general characteristic for all groups is that first-generation migrants are far more entrepreneurial than the second-generation. In terms of gender participation, we witnessed that, in the case of Moroccan and Turkish entrepreneurs, both first- and second-generation men are relatively more entrepreneurial, whereas the Surinamese and Antillean first-generation entrepreneurs have a relatively even gender distribution and the second-generation women are more entrepreneurial.
By looking at the profit of migrant business, we find that both first- and second-generation Surinamese and Antillean entrepreneurs have almost the same profit rate, while in the case of Turkish and Moroccan entrepreneurs these rates are higher for the first generation.
In Chapter 3 we examine the new external orientations in migrant entrepreneurship by looking at the motivation, sectoral choice, business goals, and strategies of second-generation Turkish entrepreneurs in the Netherlands. The results show that an external orientation of this migrant group is the result of both personal characteristics and previous working experience. Furthermore, our results show that this group is less oriented to ethnic co-clientele and more embedded in formal networks.
In Chapter 4, we analyse the main background factors which influence the success and failure of migrant entrepreneurs. Our results show that personality, work discipline, and business ambition are the critical success factors for a good business performance of migrant entrepreneurs.
6.2. Qualitative pattern analysis
The qualitative method penetrates every observation in a deeper way, focusing on variables that are harder to classify and quantify. The main purpose of a qualitative research study is to obtain a more profound knowledge through, for example, interviews (Strauss and Corbin, 1998). In a qualitative approach it is the researcher’s understanding or interpretation of the information that is vital (Holme and Solvang, 1997).
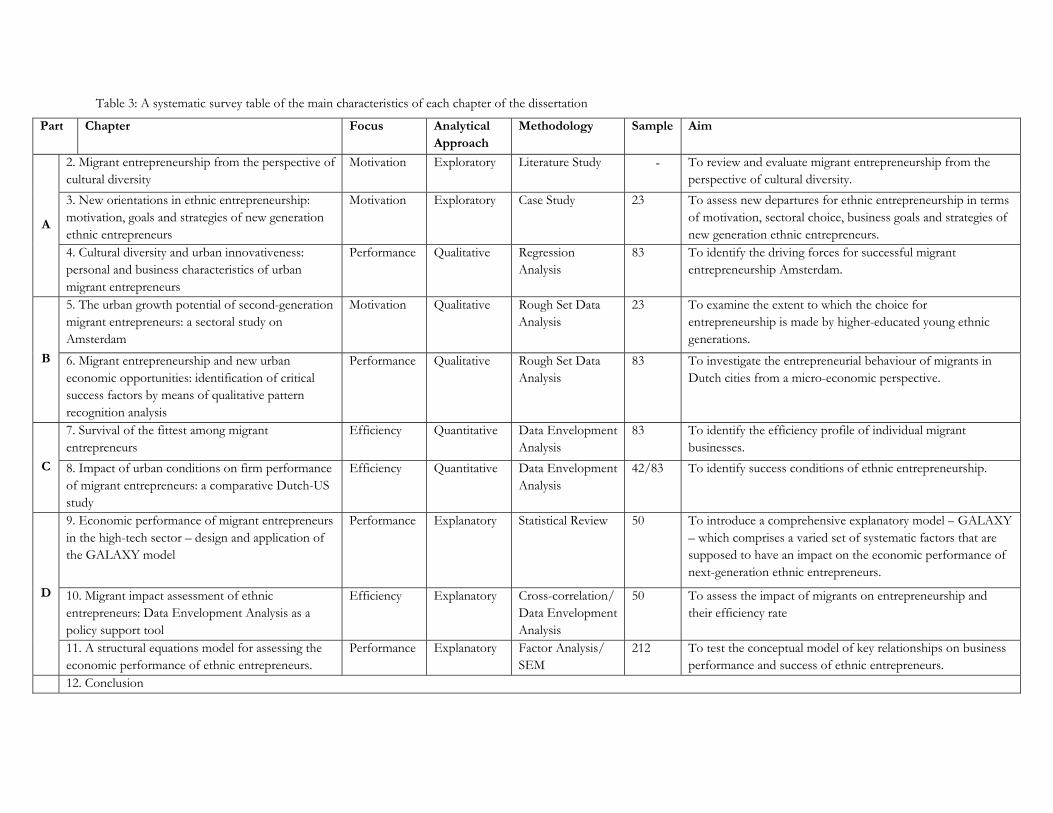
Table 3: A systematic survey table of the main characteristics of each chapter of the dissertation
Part Chapter Focus Analytical Approach
Methodology Sample Aim
A
2. Migrant entrepreneurship from the perspective of cultural diversity
Motivation Exploratory Literature Study ‐ To review and evaluate migrant entrepreneurship from the perspective of cultural diversity.
3. New orientations in ethnic entrepreneurship: motivation, goals and strategies of new generation ethnic entrepreneurs
Motivation Exploratory Case Study 23 To assess new departures for ethnic entrepreneurship in terms of motivation, sectoral choice, business goals and strategies of new generation ethnic entrepreneurs.
4. Cultural diversity and urban innovativeness: personal and business characteristics of urban migrant entrepreneurs
Performance Qualitative RegressionAnalysis
83 To identify the driving forces for successful migrant entrepreneurship Amsterdam.
B
5. The urban growth potential of second-generation migrant entrepreneurs: a sectoral study on Amsterdam
Motivation Qualitative Rough Set Data Analysis
23 To examine the extent to which the choice for entrepreneurship is made by higher-educated young ethnic generations.
6. Migrant entrepreneurship and new urban economic opportunities: identification of critical success factors by means of qualitative pattern recognition analysis
Performance Qualitative Rough Set Data Analysis
83 To investigate the entrepreneurial behaviour of migrants in Dutch cities from a micro-economic perspective.
C
7. Survival of the fittest among migrant entrepreneurs
Efficiency Quantitative Data Envelopment Analysis
83 To identify the efficiency profile of individual migrant businesses.
8. Impact of urban conditions on firm performance of migrant entrepreneurs: a comparative Dutch-US study
Efficiency Quantitative Data Envelopment Analysis
42/83 To identify success conditions of ethnic entrepreneurship.
D
9. Economic performance of migrant entrepreneurs in the high-tech sector – design and application of the GALAXY model
Performance Explanatory Statistical Review 50 To introduce a comprehensive explanatory model – GALAXY – which comprises a varied set of systematic factors that are supposed to have an impact on the economic performance of next-generation ethnic entrepreneurs.
10. Migrant impact assessment of ethnic entrepreneurs: Data Envelopment Analysis as a policy support tool
Efficiency Explanatory Cross-correlation/ Data Envelopment Analysis
50 To assess the impact of migrants on entrepreneurship and their efficiency rate
11. A structural equations model for assessing the economic performance of ethnic entrepreneurs.
Performance Explanatory Factor Analysis/ SEM
212 To test the conceptual model of key relationships on business performance and success of ethnic entrepreneurs.
12. Conclusion

26
In Part B we employ a specific qualitative technique, originating from the artificial intelligence literature, viz. Rough Set Data Analysis, to investigate the motivation, goals and strategies of migrant entrepreneurs and assess the conditions for successful entrepreneurship of migrants. Rough Set theory can classify cases into groups with similar properties by considering multiple dimensions that help reduce the unobserved heterogeneity. We first focus our research in Chapter 5, on a sample of second-generation Turkish entrepreneurs in the ICT and FIRE (Finance, Insurance, and Real Estate) sector in the Netherlands. Our results show that these entrepreneurs increasingly choose to orient towards new and non-traditional sectors like the ICT and FIRE sectors, instead of staying in the traditional hospitality sector, which is still the most popular among Turkish entrepreneurs.
In Chapter 6, we analyse the critical success conditions for the business performance of three dominant migrant groups in the Netherlands. We find that the critical success factors in business performance vary substantially among different migrant groups. Our comparative evaluation shows that there are clear culture-based differences among the respondents in their perception of business and in the success factors that determine their performance level.
6.3. Business performance analysis The intention of the quantitative method is to examine a cluster of observation by using statistical models. Data that can be referred to as quantifying or descriptive data are suitable for the quantitative method, due to the ease of transforming such data into numbers. Quantitative data can be collected through a wide range of processes. A frequently utilized process is questionnaires. The questions asked are often how common a particular behavior, is or how often the behaviour occurs (Thomas, 2003). The questionnaire is normally constructed with a number of multiple-choice questions. Often the quantitative method attempts to deal with information about people’s daily lifestyle. The aim is to determine general conclusions for a population based on the results of the statistical analysis (Holme and Solvang, 1997). The contributions in Part C aim to assess the efficiency profile of migrant businesses by applying the research tool of Data Envelopment Analysis (DEA). In general, DEA models assess the (in)efficiency of a decision-making unit (DMU) on the basis of the actual economic distance to the production frontier that gives the highest possible efficiency. The efficiency analysis developed by Charnes et al. (1978) aims to maximize production efficiency in terms of the ratio of total weighted output to total weighted input, subject to the condition that in all circumstances this efficiency measure is smaller than or equal to 1. Thus, the distance to the maximum value 1 is then seen as a measure of inefficiency.
In Chapter 7 we investigate the entrepreneurial performance of the main migrant groups in Amsterdam and seek to identify relative efficiency differences between distinct categories of migrant entrepreneurs. Our results reveal that Moroccan-owned businesses have the highest efficiency rates, not, as we expected, the Turkish-owned ones. Furthermore, we find that businesses owned by migrant entrepreneurs in the age range of 26 to 30 have both the highest rate of efficiency and the highest rate of failure.
27
In Chapter 8 we highlight the impact of social and human capital on business performance by undertaking empirical studies in the Netherlands and in the US. The results of our analysis, based on DEA analysis, show that the performance of migrant entrepreneurs may differ based on their efficiency rate.
6.4. The GALAXY model
Explanatory research concerns studies that establish causal relationships between variables. Therefore, the focus is on studying a problem in order to explain the relationship between variables. This type of research requires that quantitative data is collected and analysed, or that the data is subjected to statistical tests. Furthermore, this data could be supplemented with qualitative data to explain the problem under study (Saunders, 2006). The studies in the final part (Part D) provide a modelling-based contribution on the drivers of business performance among migrant entrepreneurs in the Netherlands. We develop a new explanatory model, which we call ‘GALAXY’, which serves as a framework for better understanding the influence of the various factors that are believed to have an impact on the economic performance of the second-generation ethnic entrepreneurs active in the high-tech and advanced business services sectors. First, in Chapter 9, we present extensive theoretical insights into these factors which are combined into four components: motivational factors; socio-economic contextual factors; policy factors; and business environment. Next, we supplement our theoretical study with empirical data from a survey questionnaire collected from a sample of 50 migrant entrepreneurs in the high-tech sector who originate from three main ethnic groups in four large cities in the Netherlands. This helped us to create their profile; hence, most of our respondents are in the age range between 41 and 50; they are predominantly male; and in most cases they have a higher vocational education level. As expected, our data reveal the predominance of second-generation entrepreneurs in the high-tech and advanced business services sectors and their high participation rates in network and branch organizations.
The second GALAXY study in Chapter 10 aims to assess the impact of migrants on entrepreneurship through cross-analysis and Data Envelopment Analysis (DEA). The results of the DEA analysis show that only 8 out of 50 migrant business were operating efficiently. In the final stage, this chapter also attempts to pinpoint the main reasons for the low efficiency rate of various migrant enterprises.
While the first and the second study in Part D provide a more general overview of the migrant entrepreneurs from the biggest ethnic groups in Netherlands and the efficiency rates of their businesses, the final modelling study in Chapter 11 aims to provide a more integral test of the GALAXY model. For that we have extended the sample to 212 respondents in order to increase the validity of our results. We first perform a factor analysis, followed by an application of regression analysis, while, in the final stage we test the significance of our model with the help of structural equations modelling (SEM) using the AMOS software.
28
Finally, the thesis concludes in Chapter 12 with a retrospective and prospective discussion of the results achieved in our study, including policy issues and lessons learned (see Figure 2).
Figure 2: Schematic composition of the structure of the thesis
Migrant Entrepreneurship
Chapter 1
PART A:
EXPLORATORY ANALYSIS
Chapters 2 ‐ 4
PART B:
QUALITATIVE PATTERN ANALYSIS
Chapters 5 ‐ 6
Performance Analysis
PART C:
ENTREPRENEURIAL PERFORMANCE ANALYSIS
Chapters 7 ‐ 8
PART D:
EXPLANATORY ANALYSIS: THE GALAXY MODEL
Chapters 9 ‐ 11
Conclusion
Chapter 12
29
This study explores new ground. It seeks to emphasize the economic importance of migrant entrepreneurship in large cities. More in particular, it makes a unique attempt to explore the mechanisms for business success of migrant entrepreneurs by uncovering their hitherto largely unkown motivational and contextual determinants of their business. Information on such issues – often individual in nature and sometimes delicate – is very hard to obtain from this population group. The structural model – the GALAXY model – developed in the course of our research turns out to be a very promising and effective vehicle for a better understanding and statistical assessment of the business performance of migrant entrepreneurs in the Netherlands. References Acs, Z. J., Audretsch, D. B., Braunerhjelm, P. and Carlsson, B. (2006). “The Knowledge
Spillover Theory of Entrepreneurship”, Center for Economic Policy Research, London, UK, December No. 5326.
Adams, G. and Schvaneveldt, J. (1991). Understanding Research Methods, Longman: New York. Aldrich, H.E. and Waldinger, R. (1990). “Ethnicity and Entrepreneurship”, Annual Review of
Sociology,16: 111-135. Audretsch, D. and Thurik, R. (2004). “The Model of the Entrepreneurial Economy”,
International Journal of Entrepreneurship Education, 2(2): 143-166. Bates, T. (1997). “Financing Small Business Creation: The Case of Chinese and Korean
Immigrant Entrepreneurs”, Journal of Business Venturing, 12: 109-124. Baycan-Levent, T. (2010). “Diversity and Creativity as Seedbeds for Urban and Regional
Dynamics”, European Planning Studies, 18(4): 565-594. Baycan-Levent, T. and Nijkamp, P. (2009). “Characteristics of Migrant Entrepreneurship in
Europe”, Entrepreneurship and Regional Development, 27(4): 375-397. Baycan-Levent, T., Masurel, E. and Nijkamp, P. (2003). “Diversity in Entrepreneurship: Ethnic
and Female Roles in Urban Economic Life”, International Journal of Social Economics, 30(11-12): 1131-1161.
Baycan-Levent, T., Nijkamp, P. and Sahin, M. (2009). “New Orientations in Ethnic Entrepreneurship: Motivation, Goals and Strategies of New Generation Ethnic Entrepreneurs”, International Journal of Foresight and Innovation Policy, 5: 83-111.
Bleeker, D., Bruins, A. and Braaksma, R. (2011). “Monitor Vrouwelijk en Ethnisch Ondernemerschap 2010”, EIM. Zoetermeer.
Carree, M. A. and Thurik, A.R. (2010). “The Impact of Entrepreneurship on Economic Growth”. In: Z.J. Acs and D.B. Audretsch, (eds), Handbook of Entrepreneurship Research, International Handbook Series on Entrepreneurship, Springer: New York.
CBS (2001). Allochtonen in Nederland. Voorburg/Heerlen. Charnes, A., Cooper, W.W. and Rhodes, E. (1978). “Measuring the Efficiency of Decision
Making Units”, European Journal of Operational Research, 2: 429-444. Choenni, A. (1997). Veelsoortig Assortiment. Het Spinhuis: Amsterdam.
30
Cohen, W. and Levinthal, D. (1989). “Innovation and Learning: the Two Faces of R&D”, Economic Journal, 99: 569-596.
Cooney, T. M. and Bygrave, W. D. (1997). “The Evolution of Structure and Strategy in Fast-Growth Firms Founded by Entrepreneurial Teams”. Working Paper presented at the Babson Entrepreneurship Conference.
Cormack, J. and Niessen, J. (2002). “Supplier Diversity, The Case of Immigrant and Ethnic Minority Enterprises”, Background paper prepared for the Transatlantic Round Table on Supplier Diversity, Brussels.
Cummings, S. (ed.) (1980). Self-Help in Urban America, Kenikart Press: New York. Dana, L. P. (ed.) (2007). Handbook of Research on Ethnic Minority Entrepreneurship, Edward Elgar:
Cheltenham. Delft, H. van, Gorter, C. and Nijkamp, P. (2000). “In Search of Migrant Entrepreneurship
Opportunities in The City: A Comparative Policy Study”, Environment and Planning C: Government and Policy, 18: 429-451.
European Commission (2011). “Small and Medium-Sized Enterprises (SMEs), Migrant Entrepreneurs / Ethnic Minority Entrepreneurs”, http://ec.europa.eu/enterprise/policies/sme/promoting-entrepreneurship/migrants-ethnic-minorities/index_en.htm
Glazer, R. (1963). “Instructional Technology and the Measurement of Learning Outcomes: Some Questions”, American Psychologist, 18: 519-21.
Hébert, R. F. and Link, A.N. (1982), The Entrepreneur, New York: Praeger. Hermes, K. and Leicht, R. (2010). “Scope and Characteristics of Immigrant Entrepreneurship in
Europe: A Cross-National Comparison of European Countries”, Working Paper, Macquarie University, Australia.
Holme, I. and Solvang, B. (1997). Forskningsmetodik: om kvalitativa och kvantitativa metoder. Lund: Studentlitteratur.
Jacobs, J. (1961). The Death and Life of Great American Cities, Vintage Books: New York. Jacobs, J. (1969). The Economy of Cities, Random House: New York. Kirzner, I. (1973). Competition and Entrepreneurship, University of Chicago Press: Chicago. Kloosterman, R. and Rath, J. (eds) (2003). Immigrant Entrepreneurs. Venturing abroad in The Age
of Globalization. Oxford/New York:Berg: 213-231. Knight, F. (1921). Risk, Uncertainty and Profit, Houghton Mifflin: New York. Kuratko, D.F. and Hodgetts, R.M. (2001). Entrepreneurship: A Contemporary Approach, The
Dryden Press, Harcourt Brace College Publishers: Orlando, FL. Light, I. (1972). Migrant Enterprises in America, University of California Press: Berkeley. Light, I. and Gold, S.J. (2000). Ethnic Economies, Academic Press: San Diego. Lyer, G.R. and Shapiro, J.M. (1999). “Ethnic Entrepreneurial and Marketing Systems:
Implications for the Global Economy”, Journal of International Marketing 7: 83-110.
31
Masurel, E. and Nijkamp, P. (2003). “Allochtoon Ondernemerschap”. In: P. Risseeuw and R. Thurik (eds), Handboek Ondernemers en Adviseurs: Management en Economie van het Midden – en Klein Bedrijf, Kluwer: Dordrecht, pp. 207-216.
Menzies, T.V., Brenner, G.A. and Filion, L.J. (2003). “Social Capital, Networks and Ethnic Minority Entrepreneurs: Transnational Entrepreneurship and Bootstrap Capitalism”. In: H. Etemad and R.W. Wright (eds), Globalisation and Entrepreneurship: Policy and Strategy Perspectives, Edward Elgar: Northampton, MA. pp. 125-151.
Nijkamp, P., Baycan-Levent, T., Gheasi, M., Longhi, S., Masurel, E., Ozgen, C., Poot, J. and Sahin, M. (2009). Migration Impact Assessment: An Overview, Tentative Findings and a Framework; A Quick Scan Document Commissioned by FORUM, Utrecht.
Porter, M. (1990). The Competitive Advantage of Nations. The Free Press: New York, NY. Portes, A. and Jensen, L. (1989). “The Enclave and the Entrants”, American Sociological Review,
54: 929-949. Razin, E. (1993). “Immigrant Entrepreneurs in Israel, Canada and California, Immigration and
Entrepreneurship, Culture, Capital, and Migrant Networks”. In: I. Light and P. Bhachu (eds), Transaction Publishers: New Brunswick, pp. 111-132.
Razin, E. and Light, I. (1988). “Ethnic Entrepreneurship in America’s Largest Metropolitan Areas”, Urban Affairs Review, 33: 332-360.
Reich, R.B. (1987). “Entrepreneurship Reconsidered: The Team as Hero”, Harvard Business Review, 3: 77-83.
Sahin M., Nijkamp, P. and Rietdijk, M. (2009). “Cultural Diversity and Urban Innovativeness: Personal and Business Study on the Performance of Migrant Workers in the Dutch Service Sector”, Studies in Regional Science, 37 (2): 535-552.
Sahin, M., Nijkamp, P. and Baycan-Levent, T. (2007). “Multicultural Diversity and Migrant Entrepreneurship: The Case of the Netherlands, ITU A/Z, 4(1): 22-46.
Sahin, M., Todiras, A. and Nijkamp, P. (2012). “An Explanatory Model for the Economic Performance of Migrant Entrepreneurs in the High-tech Sector”. In: P. Nijkamp, J. Poot and M. Sahin (eds), Migration Impact Assessment: New Horizons, Edward Elgar: Cheltenham (forthcoming).
Saunders, M., Lewis, P. and Thornhill, A. (2006). Research methods for business students, Harlow: Prentice Hall.
Schumpeter, J.A. (1934). The Theory of Economic Development, Harvard University Press: Cambridge Mass.
Sharma, P. and Chrisman, J. J. (1999). “Toward a Reconciliation of the Definitional Issues in the Field of Corporate Entrepreneurship”, Entrepreneurship Theory and Practice, 23(3): 11-27.
Simon, G. (1993). “Immigrant Entrepreneurs in France”. In: I. Light and P. Bhachu (eds), Immigration and Entrepreneurship. Culture, Capital and Migrant Networks, Transaction Publishers: London, pp. 125-139.
Strauss, A. and Corbin, J. (1998). Basics of Qualitative Research. Thousand Oaks, Calif. : SAGE, cop.
32
Thomas, R. M. (2003). Blending Qualitative and Quantitative Research Methods in Theses and Dissertations. Corwin: Thousand Oaks, CA.
Thurik, A. R. (2009). “Entreprenomics: Entrepreneurship, Economic Growth and Policy”. In: Z.J. Acs, B. Audretsch and R. Strom (eds), Entrepreneurship, Growth, and Public Policy, Cambridge University Press: Cambridge, pp. 219-249.
Tubergen F. van (2004). The Integration of Immigrants in Cross-National Perspective, Origin, Destination, and Community Effects, Utrecht: ICS.
Van den Tillaart, H. (2007). "Etnisch Ondernemerschap in Nederland: Ontwikkelingen en Perspectieven", Migrantenstudies, 23(2): 76-98
Verheul, I., Wennekers, S., Audretsch, D. and Thurik, R. (2001). “An Eclectic Theory of Entrepreneurship: Policies, Institutions and Culture”, Research Report 0012, EIM, Zoetermeer.
Waldinger, R., Aldrich, H. and Ward R. (eds) (1990). Ethnic Entrepreneurs, Sage Publishers: Newbury Park, CA.
Ward, R. and Jenkins, R. (1984). Ethnic Communities in Business: Strategies for Economic Survival, Cambridge University Press.
Woolcock, M. (1998). “Social Capital and Economic Development: Toward a Theoretical Synthesis and Policy Framework”, Theory and Society, 27: 151-208.

33

34
PART A
EXPLORATORY
ANALYSIS

35

36
CHAPTER 2*
MIGRANT ENTREPRENEURSHIP FROM THE PERSPECTIVE OF CULTURAL DIVERSITY
Abstract
The phenomenon of ‘migrant entrepreneurship’ refers to business activities undertaken by migrants with a specific socio-cultural and ethnic background or migrant origin. The studies on migrant entrepreneurship in both the US and Europe have recognized the significant share of immigrants in SME activities. In the context of migrant entrepreneurship several scholars have highlighted the impact of different migrant group cultures on entrepreneurship. They emphasize the importance of values like social or business attitude, close family and religious ties and trust, which enable some immigrant groups to compete successfully in business. Against this background, the aim of this paper is to review and evaluate migrant entrepreneurship from the perspective of cultural diversity. The paper investigates key socio-economic and cultural aspects of migrant entrepreneurship and next addresses different migrant group entrepreneurs in the Netherlands in order to compare the differences between various migrant groups and to explore cultural diversity in migrant entrepreneurship.
KEY WORDS: Entrepreneurship, Migrant Entrepreneurship, Cultural Diversity
JEL Classification: A13, E24
*Source: Sahin, M., Nijkamp, P. and Baycan-Levent, T., (2007). Migrant Entrepreneurship from the Perspective of Cultural Diversity. In: L.P. Dana (ed.), Handbook of Research on Ethnic Minority Entrepreneurship – A Co-evolutionary View on Resource Management, Edward Elgar, Cheltenham UK, pp. 99-113.
37
1. MIGRATION IN A MODERN SOCIETY
Modern cities mirror the openness of an industrialized global society, as they have become a meeting place of people from different national, cultural and migrant origin. In the past decades, most cities in the industrialized world and especially metropolitan areas in many countries have seen a huge influx of people with a different socio-cultural or migrant origin (Cross, 1992; Esping-Andersen, 1993; Massey et al., 1993). In an era of mass migration, migrant workers will be found in many different segments of the labour market, depending on their wage level and professional qualifications. In economic terms, their individual marginal productivity will determine which position they assume on the labour market (Sahin et al., 2006). Since entrepreneurship is one of the frequently used ways to escape unemployment in a host country, it is expected that migrants will attempt to choose self-employment. Entrepreneurship affects the economy both directly and indirectly, and at various levels, through innovation, competition and restructuring (Wennekers et al., 1999). Empirical research has shown that both a higher rate of new business start-ups and a higher rate of turbulence (the sum of start-ups and closures) enhance, after a certain time lag, economic growth and job creation (Carree et al., 2003).
The study of migrant entrepreneurship started preponderantly in the USA (Light, 1972), while later studies on this topic also emerged across Western Europe (Ward and Jenkins, 1984) for the United Kingdom and France (Simon, 1993) and in Israel (Razin, 1993). These studies recognized the significant share of migrants in SME activities. Research on migrant entrpreneurship in Europe, lags behind research in the US (Le, 1999). Recent papers in the rising literature on this issue in Europe and the US, and other immigration countries include Taylor (1996 and 2001), Blanchflower et al. (2004), Verheul et al. (2001), Audretsch (2002), Constant et al. (2003) and Masurel et al. (2005).
Since the early 1980s, self-employment among migrant minorities has increased significantly in Europe and migrant entrepreneurship has become an important topic in the EU, with a great impact on micro, meso and macro levels of development. The booming economy in Europe and the available opportunities in various market niches appear to have led to the emergence of a new breed of migrant entrepreneurs. The migrant minorities in Europe are expected to continue growing and thereby the business ownership among these migrant groups will grow as well. It is generally found that contemporary migrant communities generate entrepreneurs able to contribute more and more to economic growth and the welfare of the host countries (Rettab, 2001). Migrant entrepreneurs make a variety of contributions to the economic environment of their host and home countries. At the micro-level, migrant entrepreneurs help to satisfy a variety of migrant needs and wants for both migrant and non-migrant consumers (Super, 2005). More entrepreneurship is not only desirable and attractive, but also unavoidable. The most important reason is that because of globalization and increasing competition there is an enforced tendency towards more flexible job relations in the business.

38
With the advent of the era of mass migration in Europe, the issue of cultural diversity has gained increasingly societal and political interest, unfortunately often from a negative perspective. It has even become a source of big concern in European societies. Generally speaking, migrant minorities are found to have lower labour force participation rates, lower employment rates, to be less qualified, to accept relatively less skilled jobs, and are particularly specialized in production. The majority of migrant minorities tend to earn relatively less than the population as a whole.
Cultural Diversity is the variety of human cultures in a specific region, or in the world as a whole (Wikipedia, 2006). In the context of migrant entrepreneurship, several scholars have highlighted the impact of different ethnic group cultures on entrepreneurship. They emphasize the importance of values like social or business attitude, close family and religious ties, and trust, which enable some migrant groups to compete successfully in business (Ward, 1983; Werbner, 1990; Waldinger et al., 1990). The literature also points out differences in entrepreneurial abilities; some people are more entrepreneurial than others. There are several reasons - like economic and psychological motives (profit, propensity to take risk, a spirit of adventure, access to information or knowledge and desire to innovate) - why migrants opt for self-employment. The interaction between culture and migrant entrepreneurship is complex (Basu et al., 2002). Cultural and socio-psychological attributes of different migrant groups affect their entrepreneurial behaviour. Ethnic minorities may differ in terms of their reasons for migration, their religion, their language, their educational attainment, their demographic background (whether other relatives are in business or not) and their access to family business networks. Some of these differences reflect cultural diversity among the relevant groups concerned. Culture, in the form of a family tradition in business and strong family ties, has an impact on business entry motives, on the financing of new start-ups and on the nature of business chosen. Some aspects of culture like family tradition seem to have greater impact on entrepreneurship than others like religion (Basu et al., 2002). It is still a source of debate in the literature whether specific forms of a religion do exert an influence on entrepreneurial behaviour. Furthermore, there is some evidence suggests that the interaction between culture and entrepreneurship may change over time, that is between business entry and later business operations.
Against this background, the aim of this paper is to evaluate migrant entrepreneurship from the perspective of cultural diversity. The paper investigates the socio-economic and cultural aspects of migrant entrepreneurship and addresses next different migrant group entrepreneurs in the Netherlands in order to compare the differences between various migrant groups and to explore the cultural diversity in migrant entrepreneurship. The next section examines the basic concepts of entrepreneurship and migrant entrepreneurship on the basis of main characteristics and a range of determinants from psychological and sociological to economic and demographic ones and evaluates migrant entrepreneurship from socio-economic and cultural diversity perspective. Section 3 evaluates the development of migrant entrepreneurship in the Netherlands since the 1960s. The following section, Section 4,

39
addresses four active and dominant migrant groups viz. Turks, Morrocans, Surinamese, and Antilleans in the Netherlands and compares these groups with each other as well as with native Dutch group in terms of their entrepreneurial behaviour and performance. Therefore, the section highlights the socio-economic and cultural differences among these groups. The last section concludes with recommendations for future research in this field.
2. ENTREPRENEURSHIP AND MIGRANT ENTREPRENEURSHIP: A SOCIO-ECONOMIC AND CULTURAL DIVERSITY PERSPECTIVE
2.1 Basic concepts of entrepreneurship and migrant entrepreneurship Entrepreneurship is a multidimensional concept, the definition depends largely on the focus of the research undertaken (Verheul et al., 2001). Entrepreneurship or self-employment normally involves setting up a new business or buying an existing business. Some people are more entrepreneurial than others. Entrepreneurship in the classical sense refers to the combining of resources in novel ways so as to create something of value (Aldrich and Waldinger, 1990). Another definition of an entrepreneur is “someone who specializes in taking responsibility for and making judgemental decisions that affect the location, form and the use of goods, resources and institutions” (Hébert et al., 1984). This definition is more from an economic point of view.
In a textbook on economics (Stiglitz et al., 2000), the entrepreneur is defined as a person who creates new businesses, brings new products to market, or develops new processes of production. In literature the following four characteristics and main issues centring on entrepreneurship are also examined (Hébert et al., 1982 and Van Praag 1996): i) The position of the entrepreneur both in the surrounding economic system and within his own corporate organization; ii) The identification of the economic tasks of the entrepreneur; iii) The financial remuneration of the entrepreneur for his risk-taking activities, based on his economic motives; iv) The dynamics in (local and global) markets, seen from the perspective of the entrepreneur.
These four attributes of an entrepreneur show up with varying intensities in the literature on the essence of entrepreneurship. There are scientific contributions on entrepreneurship offered by Cantillon, Say, Marshall, Schumpeter, Knight and Kirzner, respectively. The pioneering study of Cantillon (1931) on the role of entrepreneurship made a main distinction between the following economic agents: i) land owners who were financially independent: ii) ‘arbitrageurs (entrepreneurs) who were involved in risk taking activities with a view to profit-making, and; iii) ‘servants’ who were ensured of a fairly stable income by means of a labour contract. In Cantillon’s view, the market economy was a ‘self-regulating network of reciprocal exchange arrangements’ which were able to produce equilibrium prices through free entry and exit of business firms. In Cantillon’s perception of entrepreneurship, the mediating role of the economic actor, who needs to anticipate uncertain future events and to see uncertainty as an economic opportunity, is more important than his innovative attitude. The
40
‘survival of the fittest’ would be best guaranteed by those entrepreneurs who know how to handle risk situations properly.
Different determinants of entrepreneurship, which combine various factors into an eclectic framework, have been defined by Verheul et al. (2001): i) Psychological determinants; focus on motives and character traits; ii) Sociological determinants; focus on the collective background of entrepreneurs; iii) Economic determinants; focus on the impact of the economic climate and technological development; iv) Demographic determinants; focus on the impact of demographic composition on entrepreneurship.
In the literature we observe also a broader treatment of business activities by migrant people. In recent years we have observed a significant shift in the orientation of migrant groups, namely towards self-employment (Baycan-Levent et al., 2003). This movement is generally referred to as migrant entrepreneurship (Van Delft et al., 2000, Masurel et al., 2002, Waldinger et al. 1990, Ward et al., 1984). The latter phenomenon distinguishes itself from ‘normal’ entrepreneurship through its orientation on migrant products, on migrant market customers or on indigenous migrant business strategies (Choenni, 1997). Migrant entrepreneurship is also generally regarded as an important self-organizing principle through which migrant minorities are able to improve their weak socio-economic position (Baycan-Levent et al., 2003). There is a significant difference among various migrant groups.
Chaganti et al., (2000) make the following distinction into three groups of migrant businessmen: i) Immigrant entrepreneurs; immigrant entrepreneurs are individuals who, as recent arrivals in the country, have had to start a business as a means of economic survival (Butler et al., 1997); ii) Migrant entrepreneurs; migrant entrepreneurs are united by a set of socio cultural connections and regular patterns of interaction among people sharing a common national background or migration experiences (Waldinger et al, 1990); iii) Minority entrepreneurs; minority entrepreneurs are business owners who are not of the majority population (US Department of Commerce, 1997).
The literature mentions both culture and the disadvantage context in explaining why migrants become self-employed (Johnson, 2000). Some migrants left their own country in the first place to start their own business in the host country, because they had no opportunity to do this in their own country (Choenni, 1997). This phenomenon stimulates the growth of self-employment drastically (Rath, 1998). According to Lee et al., (1997) there is a 'social resources explanation'; the success of migrant minority businesses can in part be explained by the existence of such social resources as rotating credits, a protected market and a labour source. Another explanation and argument that migrant minorities are more likely to become entrepreneurs in comparison with native people can be related to the margination theory, stating the importance of an (negative) event, triggering the start-up of new firms (Verheul et al., 2001). According to this theory, the creation of an enterprise is not always the result of a deliberate and intentional act or a result of rational decision making. For most people, starting a business begins with the shattering of a previous life pattern. After this general overview of the concept of migrant entrepreneurship, we will investigate now migrant entrepreneurship

41
from socio-economic perspective, including the main characteristics of migrant entrepreneurs, their motivation and performance.
2.2 Migrant entrepreneurship from a socio-economic perspective Within the literature migrant entrepreneurs are characterized by certain general features. These features of course do not apply to all migrant entrepreneurs; it is merely an indication of what the migrant entrepreneur is, and in what way they do differ from the regular entrepreneur. For individuals or people who are unable to adapt to a social system, such as migrant and migrant minority groups, their marginal social position is a driving force to become self-employed. Self-employment in this case is not only a means of earning a living; it is also a way of recognition and social acceptance (Veciana, 1999). Motivation is an important aspect of any form of entrepreneurship, but especially in migrant entrepreneurship (Masurel et al., 2005). Cantillon and Marx emphasised that profit may motivate people towards business entry and self-employment. The desire to take risk and a spirit of adventure may be another motive (Knight, 1921). Some have greater access to information or knowledge and wish to exploit that advantage (Kirzner, 1973). The entrepreneur may be driven not only by economic motives but also by psychological motives like the desire to innovate and create new products (Schumpeter, 1934).
There is also a negative and a positive view in motivation of migrant entrepreneurship. Within the negative view migrant entrepreneurship exists because of forcefully reasons, such as high unemployment rates and discrimination. Kloosterman (1998) stressed the fact that high levels of unemployment provide the motivation for migrants to become entrepreneurs. In countries with a high unemployment rate among natives, migrants are pushed out of the labour market and become entrepreneurs (Tubergen, 2004). It is argued that migrants opt for self-employment in order to avoid racial discrimination in the host country’s labour market, which forces them to accept low-paid jobs and blocks upward mobility (Ram, 1994). Some individuals may even have no other option but to choose self-employment. This is frequently advanced in the context of migrant entrepreneurship.
Recently, attention has been paid to monitoring the social and economic position of minorities. The latter has been found to be weak as compared to the native people. Migrant workers have a lower level of education, and their children exhibit higher dropout rates (Tesser, 1999). They often occupy unskilled and simple or very simple jobs (Veenman, 1999). Their unemployment rates are higher and their average incomes are lower in comparison with the native workers (Kee, 1993; Rettab, 1995). The level of education of these new entrants is a variable for which contrasting results have been obtained. The results vary on the existence of a significant impact and nature of this impact. Among the studies finding that education has a significant impact, the nature of impact varies from study to study. Some find a positive relation, while others find a negative one. Cooper et al., (1987) and Robinson and Sexton (1994) shows that the self-employment decision is influenced by educational attainment. However, a study at the macro level by Uhlaner and Thurik (2004) shows that a higher level of education

42
in a country is accompanied by a lower self-employment rate. Wit and van Winden (1989) reports that education is positively correlated with self-employment in the US, but negatively in the EU.
Migrant minorities consist of two types of migrants. One is the first-generation group, consisting of traditional migrants who were directly recruited for employment reasons. This group is less educated, with most education being achieved in the country of origin. The second group is the second generation, consisting of young dependants born in the host countries, where their entire education has been attained. This group masters the language of the host country better than the first generation does, and is relatively more qualified and acquainted with the local labour market. Not surprisingly, this group is generally found to be more ambitious and selective in choosing a job.
Mostly first generation migrant entrepreneurs undertake their own business impulsively without first deciding a good-stock taking market. As a consequence of this start they serve the same customers-group with the same products and service as their competitors without any distinguishing. This leads to enormous prize competition, a falling behind in entrepreneur’s income and a high fall out percentage amongst young migrant businesses. Masurel et al., (2003) distinguish some general features that are typically applicable to migrant entrepreneurs, like informal and formal networks, clients, business financing, workforce and geographic clustering. In cases of information gathering or help in certain situations migrant make use of their own migrant groups. This is also referred to as the ‘own group’. Usually, migrant entrepreneurs find a niche in their migrant community and start up in an ethically well-defined market, so as to provide typical services and products. An enclave economy can then positively affect the perspective of migrant entrepreneurs. Migrant groups that produce a strong entrepreneurial group can be of great economic significance for the migrant business community as well as for the total community, through job and opportunity creation (Rettab, 2001). Besides co-migrant clients, the migrant entrepreneur is also close to his own migrant group when it comes to the work force, or business financing. The social networks offer a flexible and efficient opportunity to recruit employees. Migrant entrepreneurs prefer hiring and supporting other migrants in their economic ventures as they enjoy privileged access to the migrant labour and can frequently employ paternalistic arrangements to extract more labour, as well as pay lower wages (Razin, 1989). Migrant entrepreneurs can satisfy special needs of co-migrant clients, since both share the same language, culture and religion and therefore communicate better. The migrant entrepreneur can also acquire financial capital and loan production resources from the informal networks. While native entrepreneur usually loan their starting capital from the bank, migrant entrepreneurs are less likely to receive bank funding than native entrepreneurs are (Rath, 2000), and therefore often lend capital from family or other group members.
Migrant entrepreneurs usually join up less with native formal networks, like retailer groups, trade associations and franchise organizations. Foreign activities are usually concentrated in certain geographic clusters. Especially in the bigger cities we can find this

43
geographical concentration, because migrants start their businesses in places where already a large population of people live with the same migrant background. Foreign activities are usually concentrated in certain geographic clusters, since migrants start their businesses in places where already a large population of people live with the same migrant background.
If migrant businesses remain limited to the migrant market, their potential for growth is sharply circumscribed (Aldrich et al., 1990). The obstacle to growth is the migrant market itself, which can support only a restricted number of businesses, because it is quantitatively small and because the migrant population is often too impoverished to generate sufficient buying power to fuel growth (Aldrich et al., 1990). Rath (2000) emphasized that the opportunities and strategies of entrepreneurs are closely linked to their embeddedness in the economic, political-institutional, and social environments; these external factors, such as social embeddedness, also have a great influence on the start and development of migrant businesses. It is important to identify the causes and backgrounds of differences in performance of these groups, seen against the background of mainly American experiences. Are migrant entrepreneurs a “sign of hope” for social cohesion problems in the city? Migrant groups that produce a strong entrepreneurial group can be of great economic significance for the migrant business community as well as for the total community, through job and opportunity creation (Rettab, 2001). Van Delft et al (2000) revealed that migrant-related social networks may provide several advantages: they appear to be multifaceted and flexible, and offer good possibilities for the efficient recruitment of personnel and capital. The major advantage of migrant entrepreneurship may however be the fact that it may contribute to resolving the problematic employment situation of young people in migrant segments of the urban economy (Masurel et al. 2005).
2.3 Migrant entrepreneurship from a cultural diversity perspective Culture can be described as the values, norms and attitudes in a group (Verheul et al., 2001). As mentioned before, cultural diversity is the variety of human cultures in a specific region, or in the world as a whole (Wikipedia). The phenomenon of cultural diversity has been extensively investigated by Hofstede (1991, 2001). He interprets culture as a collective and interactive set of common identity values that are decisive for a group response (or behaviour) vis-à-vis its external environment. Cultural differences are the result of national, regional, migrant, social class, religious, gender, and language variations. Culture manifests itself in different appearances in relation to geographic location, physical environment, nation, history, socio-economic traditions and conditions, political systems, religious circumstances, common language or dialect, technologies and work modes, or education and deeds. Clearly, culture is not always an unambiguous concept and may often be fuzzy in nature. Consequently, cross-cultural research is often based on qualitative characteristics of the target group and not so easy to quantify. The great merit of the work of Hofstede is that he has managed to design quantifiable indicators for cross-cultural comparison. His research has prompted an avalanche of interesting research on cultural diversity, with a particular view to the development of cross-

44
cultural comparative studies in industrial organizations and management practices. Interesting follow-up of his work can be found inter alia in Trompenaars (1994), Milberg et al. (1995), Verbeke (2000), Ardichvili et al. (2002), Christie et al. (2003), Shulruf et al. (2003), McSweeney (2002), Ronald et al. (2004), Stephen et al. (2004) and Bergeron et al. (2005). The economic benefits of cultural diversity in the city may be manifold, as this may enrich the socio-economic opportunity base, create a varied supply of talents on the labour market, or enhance the creativity possibilities in the city (Jacobs, 1961; Florida, 2002). In the context of migrant entrepreneurship, several scholars have highlighted the impact of different migrant group cultures on entrepreneurship. The international literature on entrepreneurship and innovation pays much attention to the importance of cultural diversity in business behaviour.
In the recent literature on cultural diversity we can observe two major strands (see for an interesting overview Vermeij 2006), viz. the assimilation perspective and the identity perspective. The assimilation perspective takes for granted that interaction between different cultural or migrant groups may ultimately eliminate cultural boundaries (see Alba et al., 1997). The identity perspective on the other hand assumes that belonging to a migrant culture may have an indigenous meaning, as it creates a support system based on group identity (see Nagel 2002). Three environmental factors may be distinguished that impact on someone’s migrant positioning: economic or socio-cultural competitive conditions (e.g., labour market, life style) (see e.g. Olzak 1992), resource mobilization (e.g. due to the strength or size of a specific population group) (see e.g. Moghaddam et al., 1992) or social identity (on the basis of e.g. positive role models, high self-esteem or a high social status of some group members) (see e.g. Austin et al., 1979).
The assimilation-identity dilemma is not only – and perhaps not predominantly – determined by socio-cultural and migrant factors, but also – and perhaps mainly – by the economic context of migrants. In many cases, it turns out to be difficult for migrant groups to enter the regular labour market due to language deficiencies, low skills, lack of network relations etc. This may easily create a dual labour market system, in which migrant groups are condemned to the lowest segment as a result of filtering-down phenomena. This will not stimulate assimilation. Those who feel the drive to climb higher up the socio-economic ladder may then be forced to become self-employed and start their own business as a migrant entrepreneur, especially in those cases where the migrant market has a sufficiently large critical mass (cf. Halter, 2000). This may be another from of lack of assimilation (or group identity formation), although an expanding migrant business may again lead to more assimilation after a break-out strategy.
In conclusion, cultural diversity is an essential component of the study of migrant entrepreneurship. Differences in culture − interpreted in a broad sense − may prompt different types of economic behaviour and entrepreneurship. The driving forces and the conditional framework of cultural diversity call for further empirical work. In the sequel we will illustrate a few of the above mentioned arguments by a reference to some facts in the Netherlands.
45
3 MIGRANT ENTREPRENEURSHIP IN THE NETHERLANDS
In the 1960s, the Netherlands mainly recruited low-skilled workers from Spain, Italy and Greece, while later on guest-workers were acquired from Turkey and Morocco. Before the arrival of the first-generation migrants from Turkey, Morocco, Italy and Spain, the indigenous working population in the Netherlands had largely quit working in the industries. Therefore the arrival of these migrant groups was required to meet the need for low-skilled workers in the industrial sector. From 1956 till 1963 different industries also recruited workers from Surinam, but this recruitment stopped because of negative experiences with this group (Rath, 1998). Also large inflows of people from the Dutch Antilles could be observed. The sixties were remarkable for the large-scale labour migration from countries from around the Mediterranean. At the beginning of the seventies people thought the bigger part of the foreign workers should stay in the Netherlands only temporary, but after a couple years it became clear that many migrants would settle here definitely. And finally, due to war conditions in various parts of the world in the past decade – both inside and outside Europe – asylum seekers and refugees entered the Dutch society, e.g. from Yugoslavia, Somalia, Afghanistan and Iran.
The Netherlands has shown a remarkable openness vis-à-vis foreigners, a situation that can clearly be observed in the history of Amsterdam. At present, the share of migrants in Dutch society is approx. 20 percent, while the share of non-western migrants is about 10 percent (CBS 2003, 2004). From the non-western migrant population, three groups have a dominant position (namely approx. 60 percent), viz. Turks, Moroccans and Surinamese. It is noteworthy that migrant entrepreneurship is typically occurring in the city. Amsterdam, for instance, has a rich variety of migrant entrepreneurs. For a long time Amsterdam was the place of settlement for major migrant groups of different national and cultural origin. Jewish people were a driving force, but not the only entrepreneurial group in the city (Lucassen et al., 1994); other examples of early entrepreneurial groups were Belgian manufacturers of straw heads, German bakeries and breweries, and Italian plaster sculpture sellers (Henkes, 1995; Miellet, 1987; Schrover, 1996).
The rich history of the city of Amsterdam has clearly demonstrated that a large influx of dedicated and professional migrants from several countries has generated new production modes and innovations, which have contributed significantly to the wealth and international position of the city. According to Hessels et al. (2005) more highly educated people form a majority of those involved in early-stage entrepreneurial activity in the Netherlands. They also have a more positive perception of setting up their own firm compared to people with a more limited education and are comparatively often active in business services and consumer-oriented sectors. If their skill levels are below average Dutch standards, they may most likely be found in lower segments of the labour market (Borjas, 1995). In general, their wages turn out to be lower than the Dutch average (de Graaff, 2002), but there is also a great variation in wage levels among different migrant groups.
46
The tendency or ability to become self-employed differs also between native people and migrants; immigration involves taking risks and this is also the case for entrepreneurship. Migrants are therefore considered to have an appropriate attitude or set of mind to start a business (Verheul et al, 2001). Jansen et al., (2003) concluded that, despite certain disadvantages compared with the native Dutch population, migrants from Turkey show the same rate of entrepreneurship. This group is definitely not afraid of taking any risks. In their eyes if it works out well, it is great. If not, it is just seen as a misfortune and they are helped and supported by family and friends to set up a new business when they go bankrupt. The Dutch are careful when compared with the Turks as they think ten times before starting off. The Turkish entrepreneurs on the other hand do believe in their motto ‘Pratik zeka’ which stands for ‘practical mind’. The next section will compare and evaluate in a more detailed way the entrepreneurial behaviour of different migrant groups in the Netherlands in order to highlight the socio-economic and cultural differences among them.
3.1 Socio-economic and cultural diversity in migrant entrepreneurship: evidence from the Netherlands In order to evaluate migrant entrepreneurship from the perspective of cultural diversity, in this section we address different migrant group entrepreneurs in the Netherlands, we compare the socio-economic and cultural differences between these migrant groups, therefore we aim to highlight the cultural diversity in migrant entrepreneurship. We focus mainly on four active and dominant migrant groups viz. Turks, Moroccans, Surinamese, and Antilleans in the Netherlands and we compare these groups with each other as well as with native Dutch group in terms of their entrepreneurial behaviour and performance. Our comparison and evaluation are, of course, limited with the available data.
Since 1970, the number of migrants in the Netherlands has shown a rapid increase. Most migrants into the Netherlands originate from non-western countries (Jansen et al., 2003), from Turkey, Morocco, Surinam and the Antilles. Table 1 illustrates in absolute figures the number of migrant individuals living in the Netherlands. We can see that the Turkish migrant group is the biggest group among the four migrant groups. The population increased each year for each group.
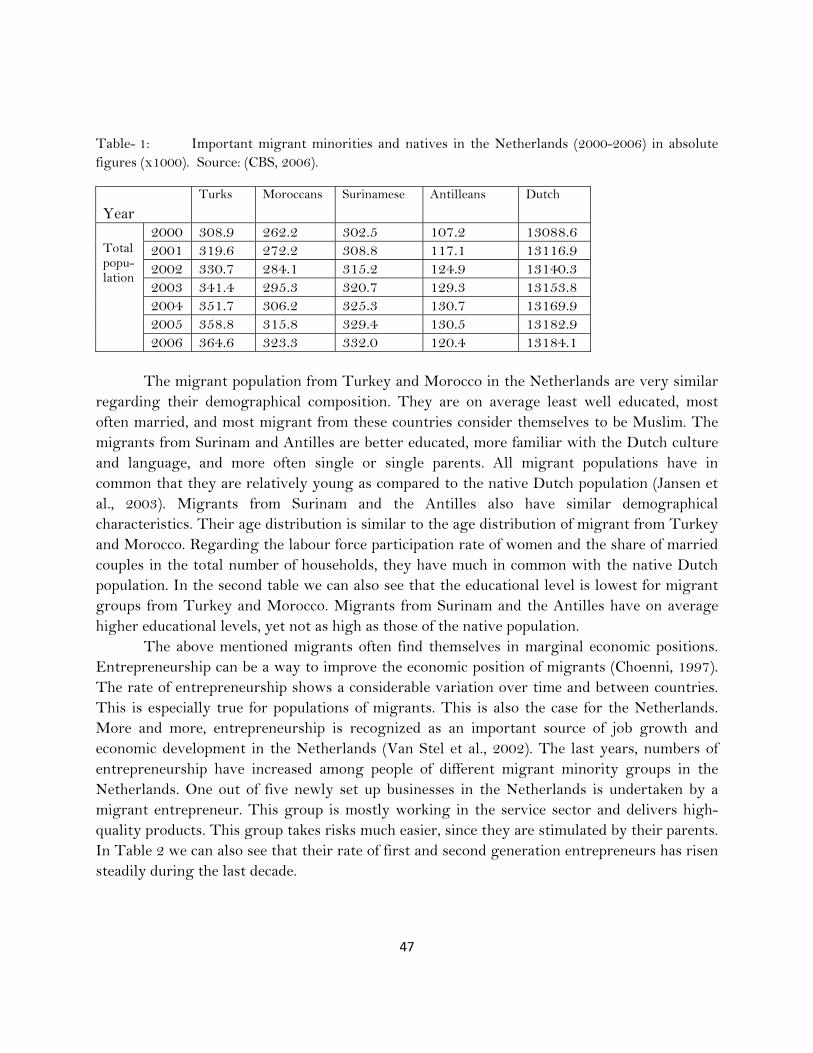
47
Table- 1: Important migrant minorities and natives in the Netherlands (2000-2006) in absolute figures (x1000). Source: (CBS, 2006).
Year
Turks Moroccans Surinamese Antilleans Dutch
Total popu- lation
2000 308.9 262.2 302.5 107.2 13088.6 2001 319.6 272.2 308.8 117.1 13116.9 2002 330.7 284.1 315.2 124.9 13140.3 2003 341.4 295.3 320.7 129.3 13153.8 2004 351.7 306.2 325.3 130.7 13169.9 2005 358.8 315.8 329.4 130.5 13182.9 2006 364.6 323.3 332.0 120.4 13184.1
The migrant population from Turkey and Morocco in the Netherlands are very similar
regarding their demographical composition. They are on average least well educated, most often married, and most migrant from these countries consider themselves to be Muslim. The migrants from Surinam and Antilles are better educated, more familiar with the Dutch culture and language, and more often single or single parents. All migrant populations have in common that they are relatively young as compared to the native Dutch population (Jansen et al., 2003). Migrants from Surinam and the Antilles also have similar demographical characteristics. Their age distribution is similar to the age distribution of migrant from Turkey and Morocco. Regarding the labour force participation rate of women and the share of married couples in the total number of households, they have much in common with the native Dutch population. In the second table we can also see that the educational level is lowest for migrant groups from Turkey and Morocco. Migrants from Surinam and the Antilles have on average higher educational levels, yet not as high as those of the native population.
The above mentioned migrants often find themselves in marginal economic positions. Entrepreneurship can be a way to improve the economic position of migrants (Choenni, 1997). The rate of entrepreneurship shows a considerable variation over time and between countries. This is especially true for populations of migrants. This is also the case for the Netherlands. More and more, entrepreneurship is recognized as an important source of job growth and economic development in the Netherlands (Van Stel et al., 2002). The last years, numbers of entrepreneurship have increased among people of different migrant minority groups in the Netherlands. One out of five newly set up businesses in the Netherlands is undertaken by a migrant entrepreneur. This group is mostly working in the service sector and delivers high-quality products. This group takes risks much easier, since they are stimulated by their parents. In Table 2 we can also see that their rate of first and second generation entrepreneurs has risen steadily during the last decade.

48
Table- 2: Distribution of main migrant entrepreneurs in the Netherlands (1999-2003) in absolute (x1000) and relative figures. Source: (CBS, 2006).
Year
Turks Moroccans Surinamese Antilleans t m f t m f t m f t m f
first generation entrepre-neurs
‘99 7.2 5.9 1.3 2.5 2.2 0.3 5.1 3.5 1.6 1.1 0.7 0.4 % 91 92 87 89 92 75 80 80 80 70 70 80 ‘00 8.2 6.8 1.4 3.0 2.6 0.4 5.6 3.9 1.7 1.2 0.8 0.4 % 88 89 82 88 90 80 79 80 77 67 67 67 ‘01 9.6 8.0 1.6 3.5 3.1 0.4 6.2 4.4 1.8 1.4 1.0 0.4 % 87 88 84 88 89 80 79 81 75 71 71 67 ‘02 9.9 8.3 1.6 3.7 3.3 0.4 6.2 4.3 1.9 1.4 0.9 0.5 % 86 87 84 88 89 80 78 78 76 64 64 67 ‘03 10.2 8.6 1.6 3.9 3.4 0.5 6.3 4.3 2.0 1.5 1.0 0.5 % 86 87 80 89 89 83 79 78 80 71 71 71
Second generation entrepre-neurs
‘99 0.8 0.6 0.2 0.3 0.2 0.1 1.2 0.8 0.4 0.5 0.3 0.2 % 10 9 13 11 8 25 19 19 20 33 30 40 ‘00 1.0 0.8 0.2 0.4 0.3 0.1 1.4 0.9 0.5 0.6 0.4 0.2 % 11 11 12 12 10 20 20 19 23 33 33 33 ‘01 1.3 1.0 0.3 0.4 0.3 0.1 1.6 1.1 0.5 0.6 0.4 0.2 % 12 11 16 10 9 20 21 20 21 30 29 33 ‘02 1.5 1.2 0.3 0.5 0.4 0.1 1.8 1.2 0.6 0.7 0.5 0.2 % 13 13 16 12 11 20 22 22 24 33 36 29 ‘03 1.7 1.3 0.4 0.5 0.4 0.1 1.8 1.2 0.6 0.7 0.5 0.2 % 14 13 20 11 11 17 23 22 24 33 35 29
Total of entrepre-neurs
‘99 7.9 6.4 1.5 2.8 2.4 0.4 6.4 4.4 2.0 1.5 1.0 0.5 ‘00 9.3 7.6 1.7 3.4 2.9 0.5 7.1 4.9 2.2 1.8 1.2 0.6 ‘01 11.0 9.1 1.9 4.0 3.5 0.5 7.8 5.4 2.4 2.0 1.4 0.6 ‘02 11.5 9.5 1.9 4.2 3.7 0.5 8.0 5.5 2.5 2.1 1.4 0.7 ‘03 11.9 9.9 2.0 4.4 3.8 0.6 8.0 5.5 2.5 2.1 1.4 0.7
Legend: Percentage mean: the share of migrant entrepreneurs of a generation cohort in the total of migrant entrepreneurs of the total population category concerned.
From the figures in Table 2 we can conclude that first generation migrants are far more entrepreneurial than the second generation migrants. Among the Turkish and Moroccan migrant groups it can be seen that men are relatively more entrepreneurial. The other two major groups of migrants from Suriname and the Dutch Antilles show that entrepreneurship is more or less evenly distributed among male and female. When considering the second generation migrants from the Turkish and Moroccan groups it can be seen that male entrepreneurs are relatively more present than female entrepreneurs. With the Surinamese and Antillean groups it can be seen that second generation women are more entrepreneurial.

49
The net gender effect is very strong for the Surinamese population within the Netherlands. The labour force participation rate in general is relatively high for female migrants from Suriname. However, besides the relative high labour force participation rate, there is still a relative low entrepreneurship rate for female Surinamese migrants when compared to the native female Dutch population. On the other hand, the entrepreneurship rates for female Surinamese are still somewhat higher than entrepreneurship rates for female Turkish and Moroccan migrants. Female migrants from Turkey and Morocco are far less entrepreneurial than for instance the native Dutch females. This is probably related to cultural and/or religious differences. Besides entrepreneurship rates, labour force participation rates are also much lower than of native Dutch women. The combination of high labour force participation rate and a low rate of entrepreneurship for female Surinamese migrants may be related to the relatively high share of single parent families for this migrant group (assuming that most of the single parents are women). Antilleans and Surinamese seem very successful in Table 3 and the second generation entrepreneurs in these groups have almost the same rate of profit with the first generation. When we looked at the migrants from Turkey and Morocco, the profit of the first generation entrepreneurs is much higher than the second generation. Although the Surinamese and Antillean group are much smaller than the other two groups, they have a higher profit. This may be caused by differences in their entrepreneurial behaviour.
Table -3: Profit of migrant entrepreneurs in the Netherlands (1999-2003) in absolute figures (x1000). Source: (CBS, 2006).
Year
Turks (€)
Moroccans (€)
Surinamese (€)
Antilleans (€)
Profit of first generation entrepreneurs
‘99 18.0 15.5 19.2 22.0 ‘00 21.0 19.4 21.4 22.3 ‘01 19.3 17.2 21.4 21.8 ‘02 19.2 18.0 22.9 24.1 ‘03 18.0 17.0 21.9 23.1
Profit of second generation entrepreneurs
‘99 13.9 12.2 21.2 18.8 ‘00 14.9 15.7 23.0 19.4 ‘01 14.0 12.7 20.9 19.7 ‘02 13.8 15.2 22.2 22.2 ‘03 12.8 12.6 20.7 22.1
Profit of total entrepreneurs
‘99 17.6 15.2 19.6 21.0 ‘00 20.3 19 21.7 21.3 ‘01 18.7 16.7 21.3 21.1 ‘02 18.5 17.6 22.7 23.4 ‘03 17.2 16.4 21.6 22.7

50
4 RETROSPECT AND PROSPECT
With the advent of the era of mass migration in Europe, the issue of cultural diversity has gained increasingly societal and political interest, unfortunately often from a negative perspective. It has even become a source of big concern in European societies. Modern societies in the western world are increasingly faced with cultural diversity as a result of international migration. Diversity is increasingly valued and its social, cultural and economic benefits are recognized. Modern cities mirror the openness of an industrialized global society, as they have become a meeting place of people from different national, cultural and migrant origin. For example, an open city like Amsterdam will soon have a majority of people from a different migrant origin than the indigenous Dutch population.
In order to evaluate migrant entrepreneurship from the perspective of cultural diversity, in this section we addressed different migrant group entrepreneurs in the Netherlands, we compared the socio-economic and cultural differences between these migrant groups. We focused mainly on four active and dominant migrant groups viz. Turks, Moroccans, Surinamese, and Antilleans in the Netherlands and we compared these groups with each other as well as with native Dutch group in terms of their entrepreneurial behaviour and performance. The migrant population from Turkey and Morocco in the Netherlands are very similar regarding their demographical composition. They are on average least well educated and most often married. The migrants from Surinam and Antilles are better educated, more familiar with the Dutch culture and language, and more often single or single parents. Migrants from Surinam and the Antilles also have similar demographical characteristics. Regarding the labour force participation rate of women and the share of married couples in the total number of households, they have much in common with the native Dutch population. The educational level is lowest for migrant groups from Turkey and Morocco. Migrants from Surinam and the Antilles have on average higher educational levels, yet not as high as those of the native population.
The above mentioned migrants often find themselves in marginal economic positions. Entrepreneurship can be a way to improve the economic position of migrants (Choenni, 1997). The last years, numbers of entrepreneurship have increased among people of different migrant minority groups in the Netherlands. We can conclude that first generation migrants are far more entrepreneurial than the second generation migrants. Among the Turkish and Moroccan migrant groups it can be seen that men are relatively more entrepreneurial. The other two major groups of migrants from Suriname and the Dutch Antilles show that entrepreneurship is more or less evenly distributed among male and female. When considering the second generation migrants from the Turkish and Moroccan groups it can be seen that male entrepreneurs are relatively more present than female entrepreneurs. With the Surinamese and Antillean groups it can be seen that second generation women are more entrepreneurial. Antilleans and Surinamese seem very successful and the second generation entrepreneurs in these groups have almost the same rate of profit with the first generation. When we looked at

51
the migrants from Turkey and Morocco, the profit of the first generation entrepreneurs is much higher than the second generation. Although the Surinamese and Antillean group are much smaller than the other two groups, they have a higher profit. This may be caused by differences in their entrepreneurial behaviour.
All in all, migrant entrepreneurs deserve more attention. In order to succeed in the current business climate it is essential that businesses recognize that customers all over the world have choice and consumers have to be targeted for their business. Working with migrant minority businesses offers the opportunity to do just that. Migrant minorities are usually a highly motivated and qualified entrepreneurial group. Migrant minority businesses mostly fall into the category of Small and Medium-sized Enterprises (SMEs). Small and medium sized enterprises play a significant role in the domestic economies of most countries. Each and every successful self-employed migrant or minority business contributes to improved social and economic integration. A growing migrant economy creates a virtuous circle: business success gives rise to a distinctive motivational structure, breeding a community-wide orientation towards entrepreneurship.
Migrant entrepreneurs deserve also more attention, since this group not only has to deal with arbitrary problems of entrepreneurship, but also with specific problems that occur among these group members. Firstly, communication is an important aspect which needs attention. One of the main problems is the distance in approach and the loads of information send via letters and on internet. This type of communication is not effective among migrant entrepreneurs, since they would consider the personal approach. Secondly, the fact that most migrant entrepreneurs are uninformed and have a limited network is a main problem. Most of the time they are unaware of the issuing of the rules and the facilities which are provided. Rarely do they have a business plan which causes an unprepared start. Developing roll models would help in this case. Finally, the minimum contact between entrepreneurs and advice organizations such as business associations, Chambers of Commerce and native entrepreneurs is a problem as well. One important consequence is that migrant entrepreneurs do not make use of the information/ support/ assistance possibilities. It is striking, that this is a demanding need in this group. Motives of not making use of the facilities are unfamiliarity, communicational problems, and limited access to information.
REFERENCES
Alba, R. and V. Nee (1997), “Rethinking Assimilation Theory for a New Era of Immigration”, International Migration Review, 31, pp. 826-874.
Aldrich, H.E. and R. Waldinger (1990), “Migrantity and Entrepreneurship”, Annual Review of Sociology,16, pp. 111-135.
52
Ardichvili A. and K.P. Kuchinke (2002), “Leadership Styles and Work-Related Values of Managers and Employees of Manufacturing Enterprises in Post-Communist Countries”, Human Resource Development Quarterly, 12, pp. 363-383.
Austin, W.G. and S. Worchel (eds.) (1979), The Social Psychology of Intergroup Relations, Brooks/Cole, Monterey, Cal., pp. 33-47.
Basu, A. and E. Altinay (2002), “The Interaction Between Culture And Entrepreneurship In Londen’s Immigrant Businesses”, International Small Business Journal, 20, pp. 371-393.
Baycan-Levent T., E. Masurel and P. Nijkamp (2003), “Diversity in Entrepreneurship: Migrant and Female Roles in Urban Economic Life”, International Journal of Social Economics, 30, pp. 1131-1161.
Berdowski, Z. (1994), Ouderen in Amsterdam 1993. Amsterdam: Koordinatie Kommissie Onderzoek van de Gemeente Amsterdam.
Bergeron N. and B.H. Schneider (2005), “Explaining Cross-National Differences in Peer-Directed Aggression: A Quantitative Synthesis”, Aggressive Behavior, 31, pp. 116-137.
Borjas, G. (1995), “Migrantity, Neighbourhoods, and Human-Capital Externalities”, American Economic Review, 85, pp. 365-90.
Bosma, N. (2002), Global Entrepreneurship Monitor 2002, Zoetermeer:EIM.
Butler, J.S. and P.G. Greene (1997), Migrant Entrepreneurship: The Continuous Rebirth of American Entrepreneurship, (in: D.L. Sexton and R.W. Smilor (eds.), Entrepreneurship 2000), Chicago, IL, Upstart Publishing, pp 267-289.
Carree, M.A. and A.R. Thurik (2003), The Impact of Entrepreneurship on Economic Growth. (In: Z.J. Acs and D.B. Audretsch (eds.), Handbook of Entrepreneurship Research), Kluwer, pp. 437-471.
CBS (Central Bureau of Statistics) (2003, 2004, 2006), Allochtonen in Nederland 2003, Voorburg.
Chaganti, R. and P.G. Greene (2000), “Who are Migrant Entrepreneurs? A Study of Entrepreneurs’ Migrant Involvement and Business Characteristics”, Journal of Small Business Management, 40, pp. 126-143.
Cooper, A.C. and W.C. Dunkelberg (1987), “Entrepreneurial Research: Old Questions, New Answers And Methodological Issues”, American Journal of Small Businesses, 1, pp. 11-23.

53
Cormack, J. and J. Niessen (2002), “Supplier Diversity, The Case of Immigrant and Ethnic Minority Enterprises”,Background paper prepared for the Transatlantic Round Table on Supplier Diversity, Brussel.
Christie, P.M.J., I.W.G. Kwan, P.A. Stoebel and R. Baumhaut (2003), “A Cross-Cultural Comparison of Ethical Attitudes of Business Managers”, Journal of Business Ethics, 46, pp. 263-287.
Cross, M. (ed.) (1992), Migrant Minorities and Industrial Change in Europe and North America, Cambridge University Press, Cambridge.
Van Delft, H. C. Gorter and P. Nijkamp (2000), “In search of migrant entrepreneurship
Opportunities in the city: A comparative policy study”, Environment and Planning C: Government and Policy, 18, pp. 429-451.
Esping-Andersen, G. (ed.) (1993), Changing Classes. Stratification and Mobility in Post-Industrial Societies, Sage, London.
Florida, R. (2002), The Rise of Creative Class, New York: Basic Books.
De Graaff, T. (2002), Migration, Migrant Minorities and Network Externalities, Thela Thesis, Amsterdam.
Halter, M. (2000), Shopping For Identity, Schoiken, New York.
Hébert, R. F. and A. N. Link, 1982, The Entrepreneur, New York: Praeger.
Henkes, B. (1995), Heimat in Holland, Duitse Dienstmeisjes, 1920-1950, Amsterdam; Babylon-De Geus.
Hessels, J., N. Bosma, and S. Wennekers, (2005), Nieuw Ondernemerschap in Herstel, Zoetermeer.
Hofstede, G. (1991), Cultures Organization, Software of the Mind; Intercultural Cooperation and Its Importance for Survival. London: Mc Graw-Hill.
Hofstede, G. (2001), Culture’s Consequences: Comparing Values, Behaviors, Institutions, and Organizations across Nations, Thousand Oaks, London, New Delhi: Sage Publications.
Jacobs, J. (1961), The Life and Death of Great American Cities, New York: Random House.
Jansen, M., J. de Kok, J. Spronsen, and S. Willemsen, (2003), Immigrant Entrepreneurship in the Netherlands – Demographic Determinants of Entrepreneurship of Immigrants from Non-Western Countries’– Scales, Zoetermeer.
54
Johnson, P.J. (2000), “Migrant Differences in Self-Employment among Southeast Asian Refugees in Canada”. Journal of Small Business Management, 38, pp. 78-86.
Kee, P. (1993), The Economic Status of Male Immigrants in the Netherlands (diss.), University of Amsterdam.
Kirzner, I. M. (1973), Competition and Entrepreneurship. Chicago: University of Chicago Press.
Kloosterman, R. (1997), Face 2 Face. (In: M. Hajer en F. Halsema (red.). Land in zicht!) Amsterdam: Bert Bakker/WBS, pp.163-179.
Kloosterman, R. (1998), Immigrant Entrepreneurship and the Welfare State, (in: J. Rath (ed.), Immigrant Businesses on the Urban Economic Fringe. A Case for Interdisciplinary Analysis. Houndmills, Basingstoke, Hampshire: Macmillan Press.
Kloosterman, R., J. van der Leun, and J. Rath (1998), “Across the Border: Immigrants' Economic Opportunities, Social Capital and Informal Business Activities”, Journal of Migrant and Migration Studies, 4, pp. 249-268.
Knight, F. H. (1921), Risk, Uncertainty and Profit. New York: Houghton Miffin.
Lamont, M. and V. Molnár (2002), “The Study of Boundaries in The Social Sciences”, Annual Review of Sociology, 28, pp. 167-195.
Larsen, P. (1995), “Hebben Nederlanders dan geen Cultuur? Een Beschouwing over Nederlands Onderzoek naar ‘Etnisch Ondernemerschap”, Migrantenstudies, 11, pp. 30-38.
Light, I. (1972), Migrant Enterprises in America, University of California Press, Berkeley.
Lee, Y., T. Cameroen, P. Schaeffer and C.G. Schmidt (1997), “Migrant Minority Small Business: A Comparative Analysis of Restaurants in Denver”, Urban Geography, 18, pp. 591-621.
Lucassen, L. and R. Penninx (1994), Nieuwkomers, Nakomelingen, Nederlanders. Immigranten in Nederland 1550-1993, MES-Reeks 1. Amsterdam: Het Spinhuis.
Massey, D.S. and N.A. Denton (1993), American Apartheid: Segregation and the Making of the Underclass, Harvard University Press, Cambridge, MA.
Masurel, E., P. Nijkamp, M. Tastan and G. Vindigni (2002), “Motivations and Performance Conditions For Migrant Entrepreneurship”, Growth & Change, 33, pp. 238-260.
Masurel, E. and P. Nijkamp (2003), Allochtoon Ondernemerschap, (in: P. Risseeuw and R. Thurik, Handboek Ondernemers en Adviseurs; Management en Economie van het Midden- en Klein Bedrijf), Kluwer, ch11.
55
Masurel, E. and P. Nijkamp (2005), Migrant Minority Entrepreneurs and Their Lack of Institutional Collaboration Reasons and Perceptions in the Franchise Sector, Tinbergen Institute, Amsterdam.
McSweeney, B. (2002), “Hofstede’s Model of National Cultural Differences and their Consequences: A Triumph of Faith – A Failure of Analysis”, Human Relations, 55, pp. 89-118.
Miellet, R.L. (1987), “Immigratie van Katholieke Westfalers en de Modernisering van de Nederlandse Detailhandel”, Tijdschrift voor Geschiedenis, 100, pp. 374-393.
Milberg, S.J., S.J. Burke, H.J. Smith and E.A. Kallman (1995), “Values, Personal Information, Privacy and Regulatory Approaches”, Communications of the ACM, 38, pp. 65-74.
Moghaddam, F.M. and S. Perrault (1992), “Individual and Collective Mobility Strategies among Minority Group Members”, Journal of Social Psychology, 132, pp. 343-358.
Nagel, C. (2002), “Constructing Difference and Sameness”, Migrant and Racial Studies, 25, pp. 258-287.
Olzak, S. (1992), The Dynamics of Migrant Competition and Conflict, Stanford University Press, Stanford.
Van Praag, C.M. (1996), Determinants of Successful Entrepreneurship. Amsterdam: Thesis Publishers.
Ram, M. (1994), Managing to Survive: Working Lives in Small Firms, Oxford: Blackwell.
Rath, J. (1998), Een Etnische Stoelendans in Mokum. Over de Economische Incorporatie van Immigranten en hun Nakomelingen in Amsterdam, pp. 235-249, (in: A. Gevers (ed.), Uit de Zevende. 50 Jaar Sociaal-Culturele Wetenschappen aan de Universiteit van Amsterdam), Amsterdam: Het Spinhuis, 1998.
Rath, J. (2000), Introduction; Immigrant Business and the Economic, Politico-Institutional and Social Environment, (in: J. Rath (ed.), Immigrant Business: The Economic, Political and Social Environment), London: Macmillan Press, pp1-19.
Razin, E. (1989), “Relating Theories of Entrepreneurship Among Ethnic Groups and Entrepreneurship in Space - The Case of the Jewish Population in Israel”, Geografiska Annaler, 71, pp. 167-181. Razin, E. (1993), “Immigrant Entrepreneurs in Israel, Canada and California, Immigration and Entrepreneurship, Culture, Capital, and Migrant Networks”, (in: I. Light and P. Bhachu (eds.), Transaction Publishers), New Brunswick, pp. 111-132.
56
Rettab, B. (2001), The Emergence of Migrant Entrepreneurship – A Conceptual Framework,EIM/Business and Policy Research, Zoetermeer.
Rettab, B. (1995), Economic Performance of the Immigrant Workforce: Case Study of the Netherlands, EUR Proefschrift.
Sahin, M., M. Rietdijk and P. Nijkamp (2006), “Ethnic Employees’ Behaviour Vis-a-Vis Customers in the Service Sector”, Research Memorandum, 2006-2.
Schrover, M. (1996), Omlopers in de Keulse potten en pottentrienen uit het Westerwald, pp. 101-120, (in: M. ’t Hart, J. Lucassen and H. Schmal (eds.), Nieuwe Nederlanders. Vestiging van Migranten door de Eeuwen Heen), Amsterdam: Stichting Beheer IISG en SISWO/Instituut voor Maatschappijwetenschappen.
Schumpeter, J. A. (1934), The Theory of Economic Development. Translated by R. Opie from the second German edition [1926]. Cambridge: Harvard University Press.
Shulruf, B., J. Hattie and R. Dixon (2003), “Development of a New Measurement Tool for Individualism and Collectivism”, paper presented at the NZARE/AARE Joint Conference 2003, Auckland, New Zealand.
Simon, G. (1993), Immigrant Entrepreneurs in France, pp. 125-139, (in: I. Light and P. Bhachu, Immigration and Entrepreneurship. Culture, Capital and Migrant Networks), London: Transaction Publishers.
Stephen W.L., J.C. Crotts, and F.L. Hefner (2004), “Cross-Cultural Tourist Behaviour: a Replication and Extension Involving Hofstede's Uncertainty Avoidance Dimension”, International Journal of Tourism Research, 6, pp. 29-37.
Stiglitz, J.E. and J. Driffill (2000), Economics, New York: W.W. Norton & Company.
Super, I. (2005), Country of Origin as a Source of Opportunity, Master Thesis, RSM Erasmus University, Rotterdam.
Tuna, G. (2006), Ethnic Entrepreneurship: A Research in Entrepreneurial Attitude between People Originally From Turkey and Morocco, Master Thesis, Free University Amsterdam.
Thomas, A. S. and S.L. Mueller (2000), “A Case for Comparative Entrepreneurship: Assessing the Relevance of Culture”, Journal of International Business Studies, 31, pp. 287-301.
Tesser, P.T.M., J.G.F. Merens and C.S. van Praag (1999), Rapportage Minderheden 1999, Positie in het Onderwijs en op de Arbeidsmarkt, Sociaal en Cultureel Planbureau, The Hague.
57
Trompenaars, F. (1993), Riding the Waves of Culture: Understanding Cultural Diversity in Business, London: Nicholas Brealey.
Uhlaner, L. and A.R. Thurik (2004), “Post-materialism: A Cultural Factor Influencing Total Entrepreneurial Activity across Nations”, Papers on Entrepreneurship, Growth and Public Policy no 70-2004. Max Planck Institute of Economics, Jena, Germany.
Van Stel, A., S. Wennekers, R. Thurik, P. Reynolds and G. de Wit (2003), “Explaining Nascent Entrepreneurship Across Countries”, Paper presented at the BKERC Conference, Babson College, 4-7 June 2003. Van Tubergen F. (2004), The integration of immigrants in cross-national perspective, Wageningen: Ponsen & Looijen b.v. Veciana, J.M., (1999), “Entrepreneurship as a Scientific Research Programme”, Revista Europea de Dirrecion y Economia de la Empresa 8, pp. 2-10.
Veenman, J. (1999), Participatie en Perspectief, Verleden en Toekomst van Etnische Minderheden in Nederland, Lelystad: K.V. bv.
Verbeke, W. (2000), “A Revision of Hofstede et al.'s (1990) Organizational Practices Scale”, Journal of Organizational Behavior, 21, pp. 587-602.
Verheul, I., S. Wennekers, D. Audretsch and R. Thurik (2001), “An Eclectic Theory of Entrepreneurship: Policies, Institutions and Culture”, Research Report 0012, EIM, Zoetermeer. Vermeulen, H. and R. Penninx (eds.) (2002), Immigrant Integration, Het Spinhuis, Amsterdam. Verweij, C. (2006), What is Cooking?, Ph.D Thesis, University, Utrecht.
Waldinger, R., Aldrich, H., Ward, R., & Associates. (1990), Ethnic Entrepreneurs. London: Sage.
Waldinger, R.D., H.E. Aldrich, R. Ward and J. Blaschke (1990), Migrant Entrepreneurs; Immigrant Business in Industrial Societies, Sage Publications, Newbury Park, CA.
Waldinger, R. (1996), Still the Promised City? African-Americans and New Immigrants in Postindustrial New York. Cambridge, MA: Harvard University Press.
Ward, R. (1983), “Ethnic Communities and Ethnic Business: An Overview”, New Community, 11, pp. 1-9.
Werbner, P. (1990), “Renewing an Industrial Past: British Pakistani Entrepreneurship in Manchester”, Migration, 8, pp. 7-41.

58
Wennekers, S. and R. Thurik (1999), “Linking Entrepreneurship and Economic Growth”, Small Business Economics 13, pp. 27-55. De Wit, G. and F.A.A.M. van Winden (1989), “An Empirical Analysis of Self-Employment in the Netherlands”, Small Business Economic, 1, pp. 263-272.
Wikipedia (2006), The Free Encylopedia.

59
60
CHAPTER 3*
NEW ORIENTATIONS IN ETHNIC ENTREPRENEURSHIP: MOTIVATION, GOALS AND STRATEGIES OF NEW GENERATION ETHNIC ENTREPRENEURS
Abstract
The literature on ethnic entrepreneurship has identified a blend of structural and cultural factors that influence the step towards ethnic entrepreneurship. An important issue is whether ethnic entrepreneurs produce for their own ethnic niches or whether they try to cover a wider market of customers. This difference between so-called internal and external orientation has been the subject of many recent empirical investigations. An internal orientation may offer a more protected market, but will never lead to market expansion (‘break-out strategy’). An external orientation requires more skills, diversified communication channels and access to government policy support measures. The concentration of ethnic entrepreneurs in traditional sectors has led many studies to focus mainly on this internal orientation, while there is a limited number of studies that address non-traditional sectors and external orientations of ethnic entrepreneurs. Against this background, the present study aims to deal with new departures for ethnic entrepreneurship in terms of motivation, sectoral choice, business goals and strategies of new generation ethnic entrepreneurs. What is the motivation and orientation of new generation ethnic entrepreneurs? How far are new generation ethnic entrepreneurs from their ethnic groups or their ethnic niches in the market? Can an innovative orientation –external orientation- help to break out from the local ethnic dependency or to escape from a lock-in situation in an ethnic enclave? Can the different motivations and orientations of new generation ethnic entrepreneurs help in realizing effective break-out strategies? In order to answer these questions the study focuses on external orientations of new generation ethnic entrepreneurs, while it addresses in particular the way -and the extent to which- the choice for entrepreneurship is made by higher educated ethnic young generations.
*Source: Baycan-Levent, T., Nijkamp, P. and Sahin, M., (2009). New Orientations in Ethnic Entrepreneurship: Motivation, Goals and Strategies of New Generation Ethnic Entrepreneurs, International Journal Foresight and Innovation Policy, Vol. 5, No. 1/2/3, pp. 83-111.

61
1. INTRODUCTION
In recent years, we have witnessed two important changes in ethnic entrepreneurship, viz. the fact that many ethnic entrepreneurs set up businesses in other than traditional markets (e.g. the hotel and catering industry) and the growing number of second generation immigrants who decide to become self-employed (EIM, 2004; Ram and Smallbone, 2001; Rusinovic, 2006; van den Tillaart, 2001). Although the hospitality industry is still most popular among the first generation, it is noteworthy that in recent years -due to the increasing pressure on and high competitiveness in traditional areas- this share has declined considerably. Instead, the first generation has become more often active in other sectors like producer services which include finance, insurance, real estate and business-related professional services, such as accounting, consulting, marketing, engineering or design, most of which employ a high share of technical, professional and managerial jobs. In other words, the process of sectoral change is multi-faceted, while given the increasing pressure on traditional areas, equally new niches are developing. Generational change is also contributing to the emergence of new areas of immigrant business activity such as business and professional services, hospitality and entertainment, ICT and creative industries. The second generation is predominantly represented in these newly developing niches like the producer services sector. As a result, the sectoral distribution of the second generation entrepreneurs has become more similar to the native entrepreneurs than the first generation.
However, the existing literature on ethnic entrepreneurship still mainly focuses on first-generation ethnic entrepreneurs who are still predominantly active in the traditional low-skilled and labor-intensive activities. Clearly, in recent studies we find contributions that focus on the labour market position of the second generation, but in general studies on second-generation immigrants who are self-employed or entrepreneur remain limited. On the other hand, the concentration of ethnic entrepreneurs in traditional sectors -in other words, internal orientations of ethnic entrepreneurs- have led many studies to focus on these traditional sectors or on this internal orientation. There is a limited number of studies that address non-traditional sectors and external orientations of ethnic entrepreneurs.
Given this imbalance in ethnic entrepreneurship analyses, From this need, the present study aims to investigate new orientations in ethnic entrepreneurship in terms of motivation, sectoral choice, business goals and strategies of ethnic entrepreneurs. What is the motivation and orientation of the new generation of ethnic entrepreneurs? How far are new generation ethnic entrepreneurs from their ethnic groups or their ethnic niches in the market? Can a new orientation –external orientation- help to break out from the ethnic dependency or to escape from the situation of being an ethnic enclave? Can the different motivations and orientations of new generation ethnic entrepreneurs help in breaking-out strategies? In order to answer these questions the study focuses on external orientations of the new generation of ethnic entrepreneurs while addressing in particular the way -and the extent to which- the choice for entrepreneurship is made by higher educated young ethnic generations. Our study analyses in

62
particular the motivation, goals and strategies of the second generation Turkish entrepreneurs in the ICT and FIRE sector in the Netherlands. The next section will investigate the generational differences and new (external) orientations in etnic entrepreneurship. Section 3 will examine immigrants and entrepreneurship in the Netherlands on the basis of different groups as well as the differences between the first and the second generation of ethnic entrepreneurs. Section 4 will analyse new orientations of the second generation Turkish entrepreneurs in the Netherlands in terms of their motivation, sectoral choice and goals and strategies of entrepreneurial activities. The last section will conclude with a general evaluation of the external orientation of the second generation ethnic entrepreneurs.
2. GENERATIONAL DIFFERENCES AND NEW (EXTERNAL) ORIENTATIONS IN ETHNIC ENTREPRENEURSHIP
The empirical results of many case studies show that ethnic entrepreneurs usually set up their business in the sectors where informal production would give them a competitive advantage and where the network of ethnic people provides them an opportunity for an informal way of doing business and exchanging information. Normally, ethnic enterprises start with a focus on clients from their own ethnic group, with traditional products, services and communication channels. Therefore, the orientation for the majority of ethnic entrepreneurs is internal in the beginning. This internal orientation and the mutual trust within the ethnic network provides on the one hand, rotating credits, a protected market and a proper labor force (Basu, 1998; Deakins et al., 1997; Deakins, 1999; Kloosterman et al., 1998; Lee et al., 1997; Rettab, 2001), while on the other hand it creates a more than average loyalty between the ethnic firm and his clients (Dyer and Ross, 2000). Therefore, it can be said that the traditional business strategies including internal orientation, traditional sectors, ethnic employees and ethnic customers may give the impression of a ‘safe haven’.
An important issue in ethnic entrepreneurship is whether ethnic entrepreneurs produce for their own ethnic niches or whether they try to cover a wider market of customers. This difference between so-called internal and external orientation has been the subject of many recent empirical investigations (see, e.g., Choenni 1997; Tillaert and Poutsma, 1998). Concentration of a large number of ethnic entrepreneurs, producing and selling similar products and services, in a limited market, combined with a high unemployment rate and low purchasing power in the neighbourhood, could have severe implications for the degree of competition and survival rates of the enterprises. If ethnic business remains limited to the ethnic market, their potential for growth is sharply circumscribed (Aldrich and Waldinger, 1990). Rath (2000) emphasised that the opportunities and strategies of entrepreneurs are closely linked to their embeddedness in the economic, political-institutional, and social environments; these external factors, such as social embeddedness, also have great influence on the start and development of ethnic business. An internal orientation may offer a more protected market, but will never lead to market expansion (‘break-out strategy’). An external
63
orientation requires more skills, diversified communication channels and access to government policy support measures (see, e.g., Bates 1997, Deakins et al. 1997, van Delft et al. 2000, Light and Bhachu 1993).
A break-out strategy in ethnic entrepreneurship can be defined as a strategy to get away from the situation in which own ethnic groups dominate such factors as capital, clients and employees (Baycan-Levent et al. 2005). In other words, a break-out strategy is a strategy to escape from internal orientation or from being an ‘ethnic enclave’ in some stage in order to orient to external markets. However, breaking out from this ethnic dependency may not be possible due to the special relationships between ethnic entrepreneurs and their ethnic niches. The advantages of an internal orientation may create also many disadvantages when a number of ethnic entrepreneurs seeks to expand their market domain by offering products and services for a broader group of clients, outside their own ethnic group. An exclusive focus on a limited market in the beginning can pose a serious threat to the future of many ethnic minority firms. The ‘safe haven’ conditions do not create promising opportunities for economic expansion of the firms concerned. Therefore, when they want a market expansion, a number of ethnic entrepreneurs succeeds in this goal and thus brings their firms in a next development stage, but a number of them does not succeed in this breaking-out strategy and is left to the commercial constraints of their own group. A number of the latter deliberately chooses to stay in this market niche. Although the own ethnic group offers the entrepreneurs certain advantages in terms of customer loyalty, it seems that this focus makes them vulnerable and withholds opportunities for expansion. So there is a paradox concerning the ethnic minority entrepreneur and his ethnic group: there is both a strength and a weakness, but in the end it seems to be a life-threatening weakness for many ethnic firms.
Although an internal orientation is the main feature of ethnic entrepreneurship, it is observed that there are different motivations for different generations of immigrants, as the profile of ethnic people is developing over time. This development is heavily related to the educational opportunities. Chiswick and Miller (1994) found that age at arrival varies negatively with post-immigration educational attainment. They emphasized that the determinant and nature of human capital accumulation after arrival is an important step towards understanding the immigrant’s adjustment process. Therefore, the age at arrival is the most important determinant to define first-generation and second-generation immigrants and also entrepreneurs in terms of their background. Although several definitions are used especially for second-generation immigrants, generally persons who were born in the host country or immigrant to the host country at an age younger than six, can be classified as second-generation.
In general, the first-generation entrepreneurs entail more push factors, whereas the second generation may exhibit more pull factors. First-generation ethnic entrepreneurs are more motivated by discrimination, problems with the transferability of their diplomas and obtaining status, compared with their second-generation counterparts. The latter group derives more motivation from blocked promotion to start their own business. Not surprisingly, this group is
64
generally found to be more ambitious and selective in choosing a job. In other words, while first-generation immigrants may be more frequently ‘forced entrepreneurs’, second-generation immigrants may act more frequently as ‘voluntary entrepreneurs’. The results of recent case study researches (see e.g. Masurel and Nijkamp, 2004; Rusinovic, 2006) show that the younger generation is more open and looks for new opportunities outside the traditional markets. They often have more experience with non-ethnic situations and more often embedded in mainstream markets and formal networks. Therefore, an orientation to non-traditional markets may help especially the younger generation of entrepreneurs in breaking out strategies.
3. IMMIGRANTS AND ENTREPRENEURSHIP IN THE NETHERLANDS
3.1. Immigrants in the Netherlands In the early 1960s, the Netherlands switched from emigration to immigration country. The increase in prosperity in the Netherlands reduced emigration and induced new immigration flows at the same time. Post-war immigrants can be distinguished in three main groups: immigrants from former colonies, those who were recruited for unskilled jobs (so-called guest workers), and more recently refugees (see for immigration flows in different periods Kraal and Zorlu, 1998; Lucassen and Penninx, 1997; Zorlu and Hartog, 2001).
The flow of large numbers of ‘guest workers’ created an immigration surplus in the Netherlands. During the long post-war boom, the demand for workers for unskilled jobs increased while the supply of unskilled Dutch workers was decreasing. The shortage of unskilled labourers was compensated by the inflow of Mediterranean workers (Hartog and Vriend, 1990). Workers were actively recruited or came spontaneously from countries like Italy, Spain, Portugal, Turkey, Greece, Morocco, Yugoslavia and Tunisia. The recruitment policy stopped during the first oil crisis but the immigration from the recruitment countries continued as a chain-migration, at first in the form of family reunification throughout the 1970s and later on in the form of family formation in the 1980s and 1990s. Between 1982 and 1983 the immigration flow stagnated and even dropped almost to the level of emigration, no doubt as a reaction to the deep recession of the Dutch economy after the second oil crisis in 1979. The increase of immigration in the second half of the 1980s was dominated by family formation/re-union of ‘guest workers’. Additionally, the flow of political refugees and asylum seekers, from politically unstable areas in the world, has also increased. While the chain-migration from Turkey and Morocco has continued during the last two decades, the number of south European immigrants did not grow much after the end of formal recruitment, and even experienced a decrease. In the end, Surinamese, Antilleans, Turks and Moroccans became the largest migrant minority groups and this group is gradually growing due to a combination of continuous immigration and a relatively high birth rate. Immigration streams are now increasingly dominated by political refugees and asylum seekers.
According to Dutch statistics, a person is considered an immigrant either if they and at least one of their parents were born outside the Netherlands or if they themselves were born in

65
the Netherlands out of at least one foreign-born parent. Dutch statistics draw also a distinction between Western and non-Western immigrants. In 2006, more than 3 million people in the Netherlands were considered as ‘immigrant’ and 1.7 million immigrants are non-Western immigrants. The three largest groups of non-Western immigrants in the Netherlands are Turks, Surinamese and Morroccans (Table 1).
Table 1 Demographic development of Dutch population 1996-2006 (CBS, 2007)
1996 2000 2006
Total population
Native
Immigrants (absolute numbers)
Immigrants (percentage)
Total first-generation immigrants
Western immigrants
Non-Western immigrants, including:
Moroccans
Antilleans
Surinamese
Turks
Other non-Western immigrants
Total second-generation immigrants*
Western immigrants
Non-Western immigrants, including:
Moroccans
Antilleans
Surinamese
Turks
15,493,889
12,995,174
2,498,715
16.1
1,284,106
522,554
761,552
140,572
55,808
179,266
167,248
218,658
1,214,609
805,048
409,561
84,516
31,016
101,349
104,266
15,863,950
13,088,648
2,775,302
17.5
1,431,122
544,890
886,232
152,540
69,266
183,249
177,754
303,423
1,344,180
821,645
522,535
109,681
37,931
119,265
131,136
16,334,210
13,186,595
3,147,615
19.3
1,604,259
584,268
1,019,991
168,504
80,102
187,483
195,711
388,191
1,543,356
843,297
700,059
154,735
49,581
144,407
168,622

66
Other non-Western immigrants 88,414 124,522 182,714
* Second-generation immigrants were born in the Netherlands, from at least one of their parents was born elsewhere.
According to the study of Garssen and Zorlu (2005) since 1972, the number of non-Western immigrants in the Netherlands has multiplied by ten, while the non-Western population increased with 1.5 million between 1972 and 2005, the total Dutch population increased by three million in the same period. Therefore, in the past three decades non-Western immigrants were responsible for half of the population growth in the Netherlands. Garssen and Zorlu have also emphasized that the increase of non-Western immigrants is partially caused by the growing share of the second generation immigrants. According to the latest data of CBS (2007), in the last ten years, since 1996, the sharpest rise in absolute number of the second generation immigrants was among Moroccans with 70,219 and among Turks with 64,356 second generation immigrants (Table 1).
The increasing number of the first and the second generation non-Western immigrants in Dutch society has drawn attention to the position and socio-cultural and structural integration of immigrants (see Bijl et al., 2005; Dagevos et al., 2003). A comparative evaluation between the first and the second generation within the different immigrant groups show that the dominant trend is a greater degree of socio-cultural integration among the second generation immigrants. Members of the second generation have more contacts with native Dutch persons, have a better command of the Dutch language and more modern opinions in comparison to the first generation (Dagevos et al., 2003). Table 2 shows the share of immigrants spending most free time with people who have the same ethnic background. As can be clearly seen from Table 2 the percentages among all ethnic groups in spending free time with their own ethnic group decreased sharply among the second generation. Gender and education level play also an important role in immigrants’ choice in spending free time. While females and less educated immigrants are more oriented to their own ethnic group in their relationships, contrary males and higher educated immigrants are less oriented to their own ethnic group.
Table 2 Share of immigrants spending most free time with people who have the same ‘ethnic’ background (in percentages) (SCP/LAS, 2004/2005)
Turks Moroccans Antilleans Surinamese
Total
Male
Female
64
60
69
50
49
53
35
29
41
35
35
35

67
Age
15-24 year
25-44 year
45-65 year
Education
VBO/MAVO
MBO/HAVO/VWO
HBO/WO
Generation
1st generation
2nd generation
61
61
75
60
55
53
70
53
42
51
64
47
37
36
56
34
36
32
40
39
28
26
41
11
35
36
34
35
34
24
38
29
* Second-generation immigrants were born in the Netherlands, from at least one of their parents was born elsewhere.
On the other hand, the level of education also differs considerably between the first and the second generation immigrants. Among the first generation immigrants the level of education is lower compared to native Dutch whereas the level of education of the second generation immigrants does not differ significantly from native Dutch (Zorlu and Traag, 2005). Depending on their better educational level the second generation immigrants in general have a better position in the labor market than the first generation. However, in 2004, after years of economic recession, the labor market participation among immigrants has decreased to 48 percent and the unemployment rate was 16 percent among immigrants, three times higher compared to native Dutch (Zorlu and Traag, 2005). This has led to the increasing numbers of the first and the second generation immigrants choose to become self-employed.
After this historical overview of the immigration and the current situation of immigrants in the Netherlands, we will discuss in the next sub-section the labour market positions of different migrant groups and ethnic/migrant entrepreneurship in the Netherlands.
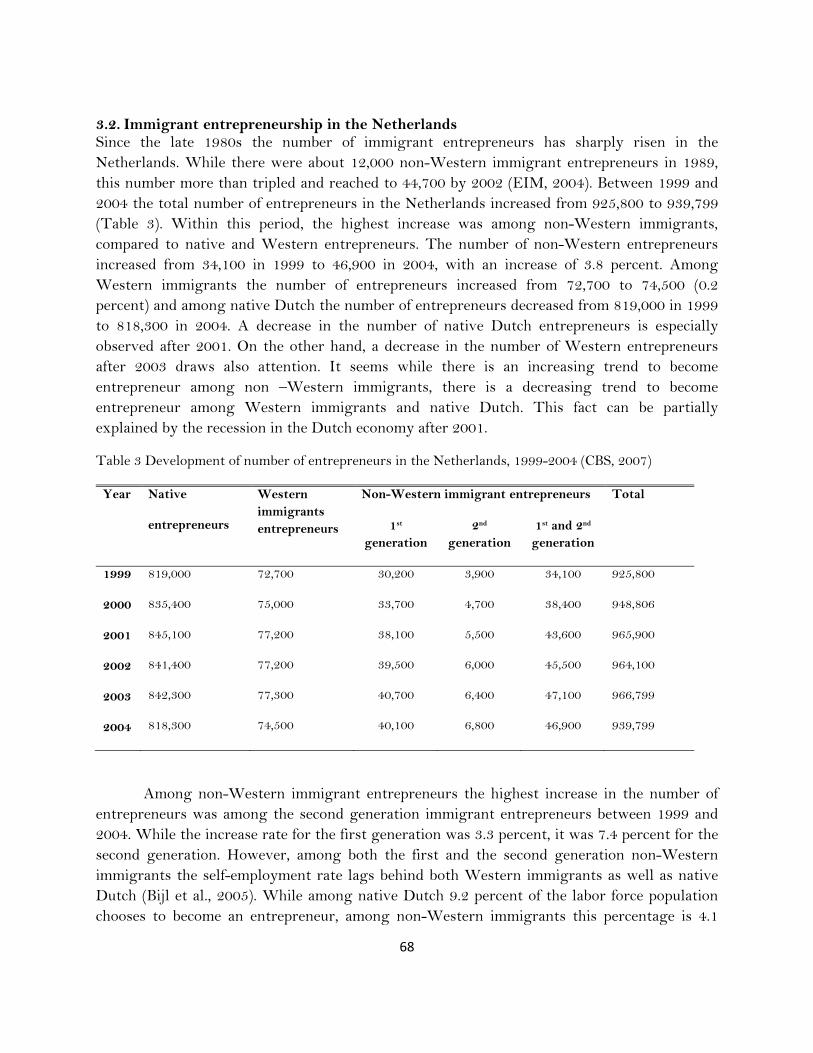
68
3.2. Immigrant entrepreneurship in the Netherlands Since the late 1980s the number of immigrant entrepreneurs has sharply risen in the Netherlands. While there were about 12,000 non-Western immigrant entrepreneurs in 1989, this number more than tripled and reached to 44,700 by 2002 (EIM, 2004). Between 1999 and 2004 the total number of entrepreneurs in the Netherlands increased from 925,800 to 939,799 (Table 3). Within this period, the highest increase was among non-Western immigrants, compared to native and Western entrepreneurs. The number of non-Western entrepreneurs increased from 34,100 in 1999 to 46,900 in 2004, with an increase of 3.8 percent. Among Western immigrants the number of entrepreneurs increased from 72,700 to 74,500 (0.2 percent) and among native Dutch the number of entrepreneurs decreased from 819,000 in 1999 to 818,300 in 2004. A decrease in the number of native Dutch entrepreneurs is especially observed after 2001. On the other hand, a decrease in the number of Western entrepreneurs after 2003 draws also attention. It seems while there is an increasing trend to become entrepreneur among non –Western immigrants, there is a decreasing trend to become entrepreneur among Western immigrants and native Dutch. This fact can be partially explained by the recession in the Dutch economy after 2001.
Table 3 Development of number of entrepreneurs in the Netherlands, 1999-2004 (CBS, 2007)
Year Native
entrepreneurs
Western immigrants entrepreneurs
Non-Western immigrant entrepreneurs Total
1st generation
2nd generation
1st and 2nd generation
1999
2000
2001
2002
2003
2004
819,000
835,400
845,100
841,400
842,300
818,300
72,700
75,000
77,200
77,200
77,300
74,500
30,200
33,700
38,100
39,500
40,700
40,100
3,900
4,700
5,500
6,000
6,400
6,800
34,100
38,400
43,600
45,500
47,100
46,900
925,800
948,806
965,900
964,100
966,799
939,799
Among non-Western immigrant entrepreneurs the highest increase in the number of entrepreneurs was among the second generation immigrant entrepreneurs between 1999 and 2004. While the increase rate for the first generation was 3.3 percent, it was 7.4 percent for the second generation. However, among both the first and the second generation non-Western immigrants the self-employment rate lags behind both Western immigrants as well as native Dutch (Bijl et al., 2005). While among native Dutch 9.2 percent of the labor force population chooses to become an entrepreneur, among non-Western immigrants this percentage is 4.1

69
percent (Table 4). Nevertheless, between 1999 and 2003 the self-employment rate increased more rapidly among non-Western immigrants than among native Dutch and Western immigrants.
Table 4 Development of self-employment rate among native Dutch, Western and non-Western immigrants, 1999-2003 (Bijl et al., 2005)
1999 2003
Native Dutch entrepreneurs
Western immigrant entrepreneurs
Non-Western immigrant entrepreneurs, including :
-First-generation immigrants
-Second-generation immigrants
Total
8.9
7.1
3.6
3.9
2.5
8.3
9.2
7.2
4.1
4.5
2.8
8.5
In absolute numbers the largest group of immigrant entrepreneurs in the Netherlands, among both the first and the second generation originate from Turkey and Surinam (Table 5). However, in the period 1999-2004 the sharpest rise was among Moroccan entrepreneurs, namely 64 percent.
Table 5 Number of entrepreneurs (x1,000)*, 1999-2004 (CBS, 2007)
Year Turkey Morocco Netherlands/
Antilles
Surinam
1999
2000
2001
2002
2003
2004
7.9
9.2
11.0
11.5
11.9
11.8
2.8
3.3
4.0
4.3
4.4
4.6
1.5
1.8
2.0
2.1
2.2
2.1
6.4
7.1
7.8
7.9
8.0
7.7
*This table includes both first- and second-generation immigrant entrepreneurs
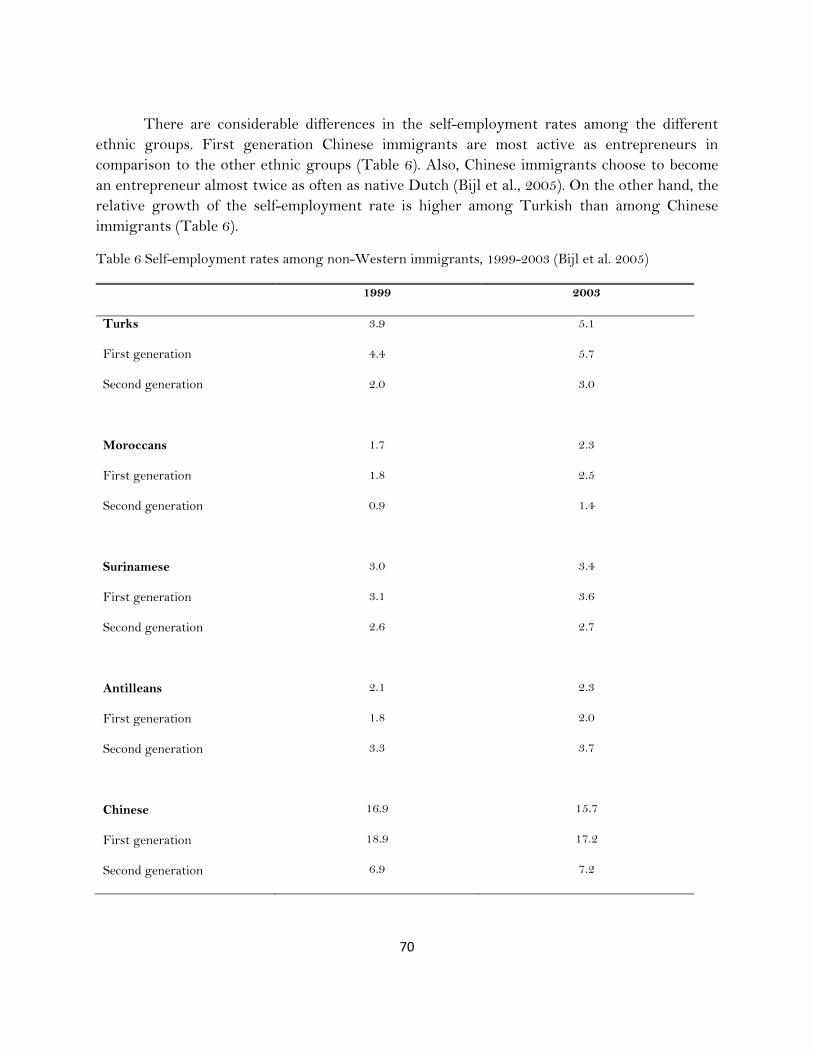
70
There are considerable differences in the self-employment rates among the different ethnic groups. First generation Chinese immigrants are most active as entrepreneurs in comparison to the other ethnic groups (Table 6). Also, Chinese immigrants choose to become an entrepreneur almost twice as often as native Dutch (Bijl et al., 2005). On the other hand, the relative growth of the self-employment rate is higher among Turkish than among Chinese immigrants (Table 6).
Table 6 Self-employment rates among non-Western immigrants, 1999-2003 (Bijl et al. 2005)
1999 2003
Turks
First generation
Second generation
Moroccans
First generation
Second generation
Surinamese
First generation
Second generation
Antilleans
First generation
Second generation
Chinese
First generation
Second generation
3.9
4.4
2.0
1.7
1.8
0.9
3.0
3.1
2.6
2.1
1.8
3.3
16.9
18.9
6.9
5.1
5.7
3.0
2.3
2.5
1.4
3.4
3.6
2.7
2.3
2.0
3.7
15.7
17.2
7.2

71
With regard to the sectors in which immigrant entrepreneurs set up their businesses, it appears that in the past decade immigrants more often set up businesses other than traditional sectors (EIM, 2004; CBS, 2007). Although the hotel and catering industry is still most popular among the first generation, the percentage has declined considerably. Instead, the first generation chooses more often to become active in other sectors like business in the business or producer services which include finance, insurance, real estate and business related professional services, such as accounting, consulting, marketing, engineering, or design, most of which employ a high quotient of technical, professional and managerial jobs. The second generation is predominantly represented in the producer services sector. In 2002, one-quarter of the second generation start a business in this sector. As a result, the sectoral distribution of the second generation has become more similar to the native Dutch entrepreneurs than the first generation.
Table 7 Sectoral distribution among first and second-generation non-Western immigrant entrepreneurs, 1999-2002 (in percentages) (EIM, 2004)
First generation Second generation
1999 2002 1999 2002
Sector
Agriculture / fishing
Minerals / industry/ energy
Building industry
Trade and reparation business
Hotel and catering industry
Transportation, storage and communication
Financial institutions
Producer services / business to business
Public administration / education
Healthcare and public welfare
Other services
Total
2
5
3
26
35
3
1
12
3
3
7
100
2
4
5
25
31
5
1
15
3
3
8
100
3
3
6
22
14
6
3
22
3
6
14
100
2
4
7
21
12
7
2
25
2
5
14
100
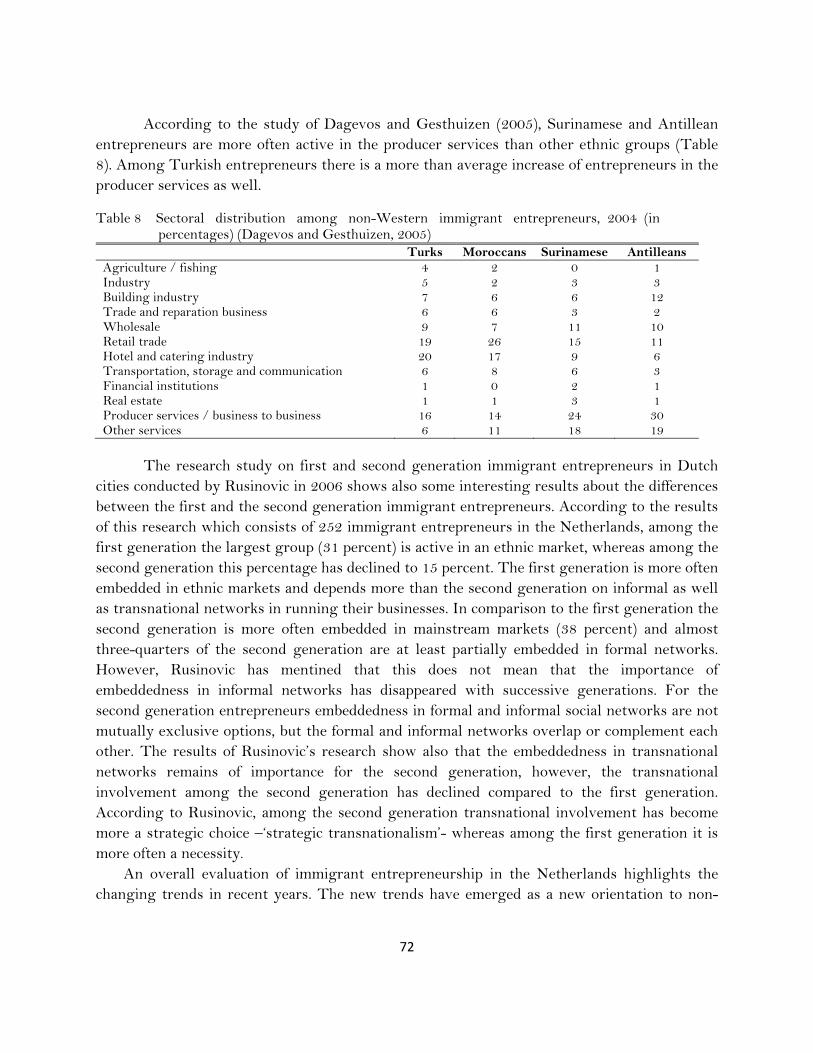
72
According to the study of Dagevos and Gesthuizen (2005), Surinamese and Antillean entrepreneurs are more often active in the producer services than other ethnic groups (Table 8). Among Turkish entrepreneurs there is a more than average increase of entrepreneurs in the producer services as well.
Table 8 Sectoral distribution among non-Western immigrant entrepreneurs, 2004 (in percentages) (Dagevos and Gesthuizen, 2005)
Turks Moroccans Surinamese Antilleans Agriculture / fishing 4 2 0 1 Industry 5 2 3 3 Building industry 7 6 6 12 Trade and reparation business 6 6 3 2 Wholesale 9 7 11 10 Retail trade 19 26 15 11 Hotel and catering industry 20 17 9 6 Transportation, storage and communication 6 8 6 3 Financial institutions 1 0 2 1 Real estate 1 1 3 1 Producer services / business to business 16 14 24 30 Other services 6 11 18 19
The research study on first and second generation immigrant entrepreneurs in Dutch
cities conducted by Rusinovic in 2006 shows also some interesting results about the differences between the first and the second generation immigrant entrepreneurs. According to the results of this research which consists of 252 immigrant entrepreneurs in the Netherlands, among the first generation the largest group (31 percent) is active in an ethnic market, whereas among the second generation this percentage has declined to 15 percent. The first generation is more often embedded in ethnic markets and depends more than the second generation on informal as well as transnational networks in running their businesses. In comparison to the first generation the second generation is more often embedded in mainstream markets (38 percent) and almost three-quarters of the second generation are at least partially embedded in formal networks. However, Rusinovic has mentined that this does not mean that the importance of embeddedness in informal networks has disappeared with successive generations. For the second generation entrepreneurs embeddedness in formal and informal social networks are not mutually exclusive options, but the formal and informal networks overlap or complement each other. The results of Rusinovic’s research show also that the embeddedness in transnational networks remains of importance for the second generation, however, the transnational involvement among the second generation has declined compared to the first generation. According to Rusinovic, among the second generation transnational involvement has become more a strategic choice –‘strategic transnationalism’- whereas among the first generation it is more often a necessity.
An overall evaluation of immigrant entrepreneurship in the Netherlands highlights the changing trends in recent years. The new trends have emerged as a new orientation to non-

73
traditional sectors or sectoral change in immigrant entrepreneurship towards especially to producer services and as an increasing number of second generation immigrant entrepreneurs.
3.3. Turkish entrepreneurship in the Netherlands The first wave of Turkish immigration to the Netherlands took place in the 1960s and 1970s. The shortage of unskilled labourers led the Dutch government to sign a treaty with the Turkish government for the immigration of what are known as ‘guest labourers’. According to Dieleman (1993) many immigrants came to the Netherlands in the 1960s and 1970s to work in the old industries. Dutch companies recruited these people for heavy, unskilled work (Houtzager and Rodrigues, 2002). As elsewhere, they filled the demand for workers at the bottom of the job market. The Netherlands went through a long period of economic growth during these years, and the number of Turkish immigrants grew strongly. The first oil crisis was the end of the official recruitment of Turkish guest workers, and the number of entrants decreased. The occurrence of the second oil crisis caused an economic crisis and a decrease in the demand for workers. A long-term unemployment became a serious problem. After this period, migration from Turkey almost solely existed of family reunification (bringing wife and children to the Netherlands), family formation (bringing in a marriage partner from their country of origing) and asylum migration. Both the Turkish guest workers and the Dutch government thought their stay would be temporary at first. After a brief working they planned to return to their home country with the savings in the Netherlands. Nevertheless, most of the Turkish guest workers decided to stay and brought their wives and children to the Netherlands. Many people came to the country because of this family reunification and the Turks became permanents habitants of the Netherlands. As the economic crisis hit the Dutch economy in 1970s, especially the old industries, many immigrants faced with exclusion from new job opportunities in the restructured urban economy (e.g., in the service sector), a number of them tried to make a niche as small business entrepreneurs.
Nowadays, the Turks are the major immigrant group in the country. In 2004, about 350 000 first and second generation Turks lived in the Netherlands, which is about 2.2% of the Dutch population (Euwals et al. 2007). Turkish immigrants in the Netherlands are on average younger than the natives, and they have more often children, and usually they have a lower level of education. The participation in the labour market lags significantly behind that of the native Dutch population in the Netherlands. The employment rate for Turkish men is 23% points lower than for native men (Euwals et al. 2007). The relatively low level of education of Turkish immigrants in the Netherlands may be a reason for a less favourable labour market position of Turkish immigrants in the Netherlands.
Choenni (1997) noted that more than 10% of the Turkish working population in Amsterdam consists of entrepreneurs, and they constitute about 20% of all ethnic entrepreneurs in Amsterdam. The hospitality sector (restaurants, cafés, bars) is an important domain for Turkish entrepreneurs. Recent research indicates that, in relation to the total population, Turkish entrepreneurs account for the highest percentage of start-ups among all

74
groups (including the native Dutch) in the Netherlands: 11.5% of the Turkish working population started their own firm in 2000, versus 6.5% of all other groups (www.kvk.nl). Jansen et al. (2003) mentioned that, despite certain disadvantages compared with the native Dutch population, immigrants from Turkey show the same rate of entrepreneurship. Although the Turkish immigrants show similar characteristics to other immigrants (from Morocco, Suriname and the Antilles), their rate of entrepreneurship is much higher. According to Masurel and Nijkamp (2003), Turkish entrepreneurs account for the highest percentage of start-ups among all groups, in relation to the total population (including the Dutch native population).
Today, Turks are the largest entrepreneurial group in the country. The relative growth of the entrepreneurship rate is higher among Turkish immigrants, in relation to other non-western groups. Between 1999 and 2004 the total number of Turkish entrepreneurs in the Netherlands increased from 7,900 to 11,700 (see Table 8). Among Turkish immigrant entrepreneurs there is an increasing group of second-generation immigrants. In 1999, out of the 7,900 Turkish entrepreneurs, 800 were of second-generation whereas in 2004 out of the 11,700 Turkish entrepreneurs, 1,800 consist of second-generation immigrant entrepreneurs. While the increase rate for the first generation was 1.4 percent, it was 2.3 percent for the second generation.
Table 9 Development of Turkish entrepreneurship in the Netherlands (CBS, 2007)
1999 2000 2001 2002 2003 2004
First generation 7,100 8,200 9,600 10,000 10,200 9,900
Second generation 800 1,000 1,300 1,500 1,700 1,800
Total 7,900 9,200 10,900 11,500 11,900 11,700
Most Turkish entrepreneurs are working in the hospitality sector (bars, cafes, restaurants), but nowadays, we can see a shift to different sectors (see Table 8). According to Dagevos and Gesthuizen (2005), there is a more than average increase of entrepreneurs in the producer services (finance, insurance, real-estate, and business related professional services). Therefore, the next section will investigate the motivation, driving forces and goals and strategies of Turkish entrepreneurs in these new sectors.
75
4. NEW ORIENTATIONS OF TURKISH ENTREPRENEURS IN THE NETHERLANDS
4.1. Prefatory Remarks Our study aims to investigate the new orientations in ethnic entrepreneurship in terms of motivation, sector choice, goals and strategies of new generation ethnic entrepreneurs. What is the motivation and orientation of new generation ethnic entrepreneurs? How far are new generation ethnic entrepreneurs from their ethnic groups or their ethnic niches in the market? Can a new orientation –external orientation- help to break out from the ethnic dependency or to escape from the situation of being an ethnic enclave? Can the different motivation and orientation of new generation ethnic entrepreneurs help in breaking out strategies? In order to answer these questions our study focuses on external orientations of new generation ethnic entrepreneurs while addressing in particular the way and the extent to which the choice for entrepreneurship is made by higher educated ethnic young generation.
Our study analyses the motivation, goals and strategies of the second generation Turkish entrepreneurs in the ICT and FIRE sector in the Netherlands. The sample of our study consists of totally 23 Turkish entrepreneurs that of 16 are active in ICT sector and 7 are active in FIRE sector. Our sample considers three groups of companies/entrepreneurs in the ICT sector: automation companies, software computer programming companies and internet service provider companies and in the FIRE sector: finance, insurance, real estate, consulting and accountancy companies that require a higher educational level and skills and that is very far from any ethnic niche in terms of products, services and communication channels. The empirical data of our research are based on in-depth personal interviews held in the first half of 2007. Much information about the entrepreneurs was provided first from the Turkish businesses website “Webisrehberi” for the contact addresses and then during the survey in an informal way using both the ethnic and business networks and relations among entrepreneurs.
In the present section we will evaluate the empirical results of our case study research in three parts. In Sub-section 4.2. we will examine the profile of the second generation Turkish entrepreneurs in terms of personal characteristics, motivation, driving force and entrepreneurial family tradition. And next, in Sub-section 4.3. we will examine the profile of Turkish enterprises in ICT and FIRE sector in terms of enterprise features, performance, profiles of employees and clients and goals and strategies. After this evaluation of the empirical results of our case study research, we will discuss and evaluate the new orientation of the second generation Turkish entrepreneurs in Sub-section 4.4.
4.2. Profile of Turkish entrepreneurs in ICT and FIRE sector The Dutch Central Bureau of Statistics (CBS) defines the second generation immigrants as persons who were born in the Netherlands from at least one parent who was born abroad (CBS, 2007). However, some researches argue that age at arrival may also play a role with post-immigration educational attainment (Chiswick and Miller, 1994; Masurel and Nijkamp, 2004;

76
Veenman, 1996). According to these researches the important question is not where one is born but formation and education are at least equally important. From this approach Veenman (1996) defines the second generation as all children from foreign migrants who are born in the Netherlands or immigrant to the Netherlands at an age of younger than six. Masurel and Nijkamp (2004) add an alternative definition while taking the age of twelve years or the border between primary and secondary education. In this study, we will follow the alternative definition developed by Masurel and Nijkamp and we will put more emphasis on the educational attainment in defining the second generation Turkish entrepreneurs. Personal characteristics An examination of the personal characteristics of Turkish entrepreneurs in ICT and FIRE sector (Table 10) shows that the majority of the entrepreneurs (74%) falls between the age 30 and 49, and that most of them are married (65%) with children (78%). When the arrival year is taken into consideration we see that more than half of the entrepreneurs (52%) came between 1971 and 1980 (when they were younger than twelve years) whereas 22% were born in the Netherlands. Therefore, the majority (74%) of the entrepreneurs falls in the category of the second generation with their educational attainment (83%) in the Netherlands. While the majority (61%) graduated from higher vocational schools and universities, the rest (39%) graduated from middle vocational or secondary schools. Depending on their arrival year and educational attainment in the Netherlands all of them can speak Dutch fluently or good and most of them (83%) can speak English fluently or good as well. An overall evaluation of personal characteristics of the second generation Turkish entrepreneurs draws attention to their higher educational level and language ability. Motivation, driving force and entrepreneurial tradition When we look at the position, the previous experience and the previous sector of Turkish entrepreneurs before the start (Table 11), we see that the majority (78%) of the entrepreneurs was employed, 13% was student and 9% was already active as an entrepreneur in their previous position. While in general unemployment is observed as a driving force to become entrepreneur for many immigrants, in our case unemployment was not found as a driving force. On the contrary, it seems previous experience of entrepreneurs through employment and entrepreneurship (82%), moreover the obtaining way of this experience as an employee and entrepreneur in the same sector (69%) create a pulling effect to become entrepreneur. The sector choice of entrepreneurs supports also this pulling effect. Almost 40% of the entrepreneurs have oriented to this sector because of the big demand or the gap in the sector whereas the other 40% of the entrepreneurs have choosen this sector because of their work experience and 20% because of their education. The current situation of the sector was evaluated by the majority of the entrepreneurs (52%) as a growing sector, while emphasizing the existence of a lot of changes (17%) as well as a high competition (17%) in the sector. This growing and promising sector structure can be another pull effect for entrepreneurs. The
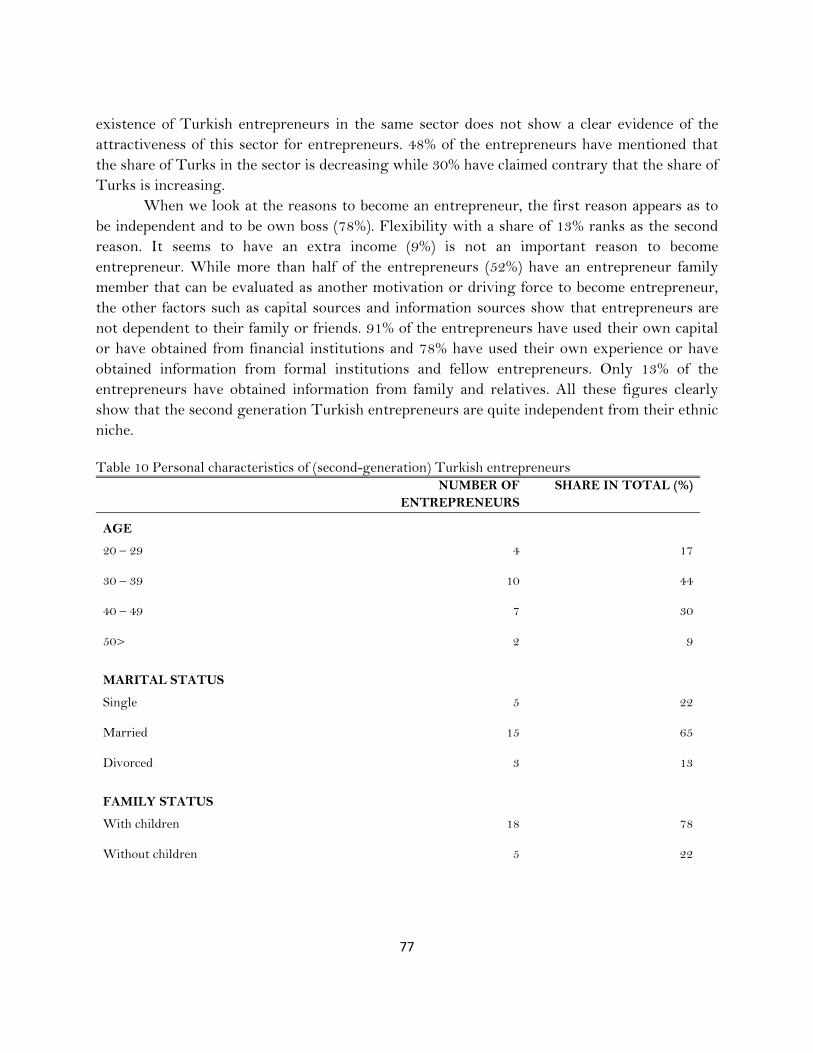
77
existence of Turkish entrepreneurs in the same sector does not show a clear evidence of the attractiveness of this sector for entrepreneurs. 48% of the entrepreneurs have mentioned that the share of Turks in the sector is decreasing while 30% have claimed contrary that the share of Turks is increasing.
When we look at the reasons to become an entrepreneur, the first reason appears as to be independent and to be own boss (78%). Flexibility with a share of 13% ranks as the second reason. It seems to have an extra income (9%) is not an important reason to become entrepreneur. While more than half of the entrepreneurs (52%) have an entrepreneur family member that can be evaluated as another motivation or driving force to become entrepreneur, the other factors such as capital sources and information sources show that entrepreneurs are not dependent to their family or friends. 91% of the entrepreneurs have used their own capital or have obtained from financial institutions and 78% have used their own experience or have obtained information from formal institutions and fellow entrepreneurs. Only 13% of the entrepreneurs have obtained information from family and relatives. All these figures clearly show that the second generation Turkish entrepreneurs are quite independent from their ethnic niche. Table 10 Personal characteristics of (second-generation) Turkish entrepreneurs NUMBER OF
ENTREPRENEURS SHARE IN TOTAL (%)
AGE
20 – 29 4 17
30 – 39 10 44
40 – 49 7 30
50> 2 9
MARITAL STATUS
Single 5 22
Married 15 65
Divorced 3 13
FAMILY STATUS
With children 18 78
Without children 5 22
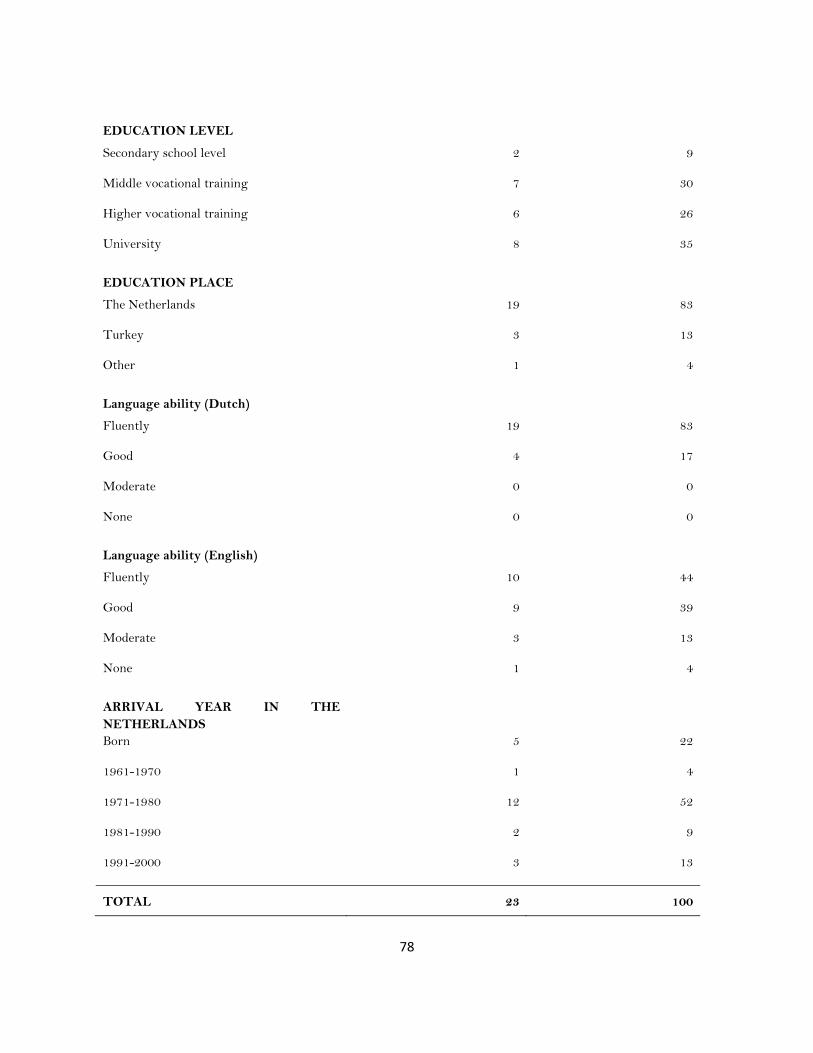
78
EDUCATION LEVEL
Secondary school level 2 9
Middle vocational training 7 30
Higher vocational training 6 26
University 8 35
EDUCATION PLACE
The Netherlands 19 83
Turkey 3 13
Other 1 4
Language ability (Dutch)
Fluently 19 83
Good 4 17
Moderate 0 0
None 0 0
Language ability (English)
Fluently 10 44
Good 9 39
Moderate 3 13
None 1 4
ARRIVAL YEAR IN THE NETHERLANDS
Born 5 22
1961-1970 1 4
1971-1980 12 52
1981-1990 2 9
1991-2000 3 13
TOTAL 23 100

79
Table 11 Motivation and driving forces of (second-generation) Turkish entrepreneurs
NUMBER OF ENTREPRENEURS
SHARE IN TOTAL (%)
POSITION BEFORE STARTING
Employed 18 78
Unemployed 0 0
Entrepreneur 2 9
Student 3 13
PREVIOUS EXPERIENCE
Through employment 15 65
Through entrepreneurship 4 17
Through school or study 4 17
Previous sector
Employee in the same sector 15 65
Employee in different sector 1 4
Entrepreneur in the same sector 1 4
Entrepreneur in different sector 4 17
Student 2 9
Sector choice
GAP/Big demand 9 39
Work experience 9 39
Education 5 22
Situation of the sector
Growing/increasing 12 52
Smaller/decreasing 3 13
Changes a lot 4 17
High competition 4 17
Turks in the sector
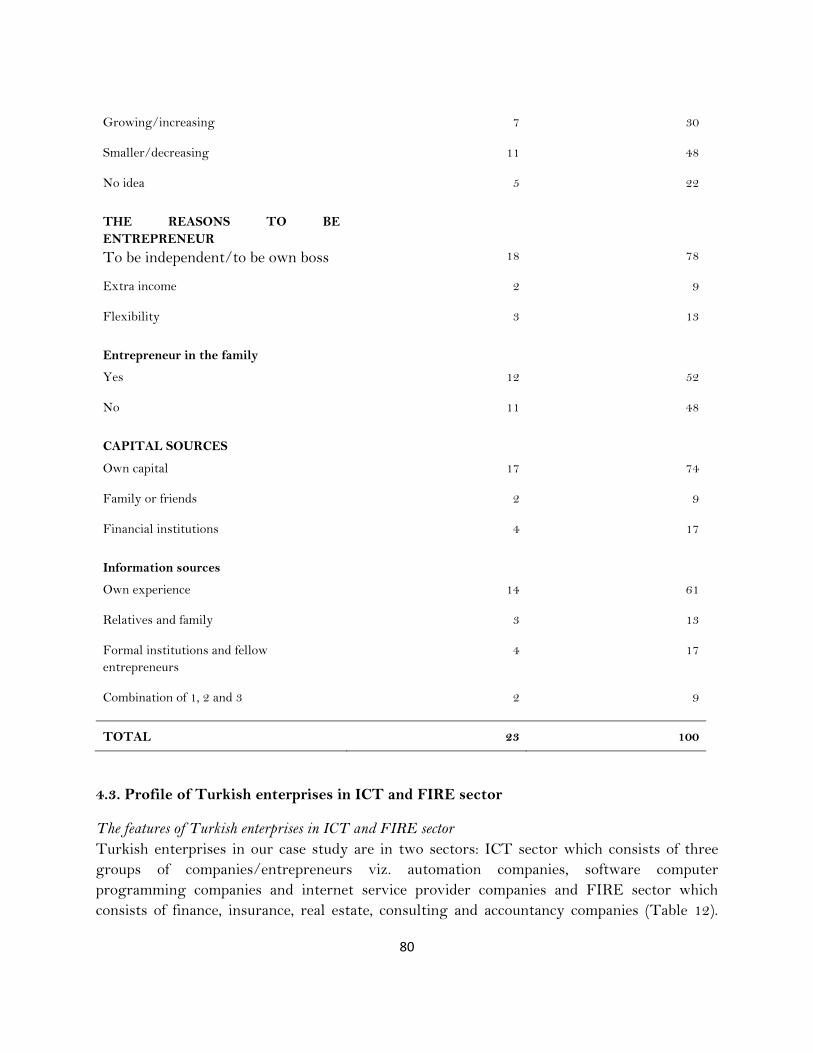
80
Growing/increasing 7 30
Smaller/decreasing 11 48
No idea 5 22
THE REASONS TO BE ENTREPRENEUR
To be independent/to be own boss 18 78
Extra income 2 9
Flexibility 3 13
Entrepreneur in the family
Yes 12 52
No 11 48
CAPITAL SOURCES
Own capital 17 74
Family or friends 2 9
Financial institutions 4 17
Information sources
Own experience 14 61
Relatives and family 3 13
Formal institutions and fellow entrepreneurs
4 17
Combination of 1, 2 and 3 2 9
TOTAL 23 100
4.3. Profile of Turkish enterprises in ICT and FIRE sector
The features of Turkish enterprises in ICT and FIRE sector Turkish enterprises in our case study are in two sectors: ICT sector which consists of three groups of companies/entrepreneurs viz. automation companies, software computer programming companies and internet service provider companies and FIRE sector which consists of finance, insurance, real estate, consulting and accountancy companies (Table 12).
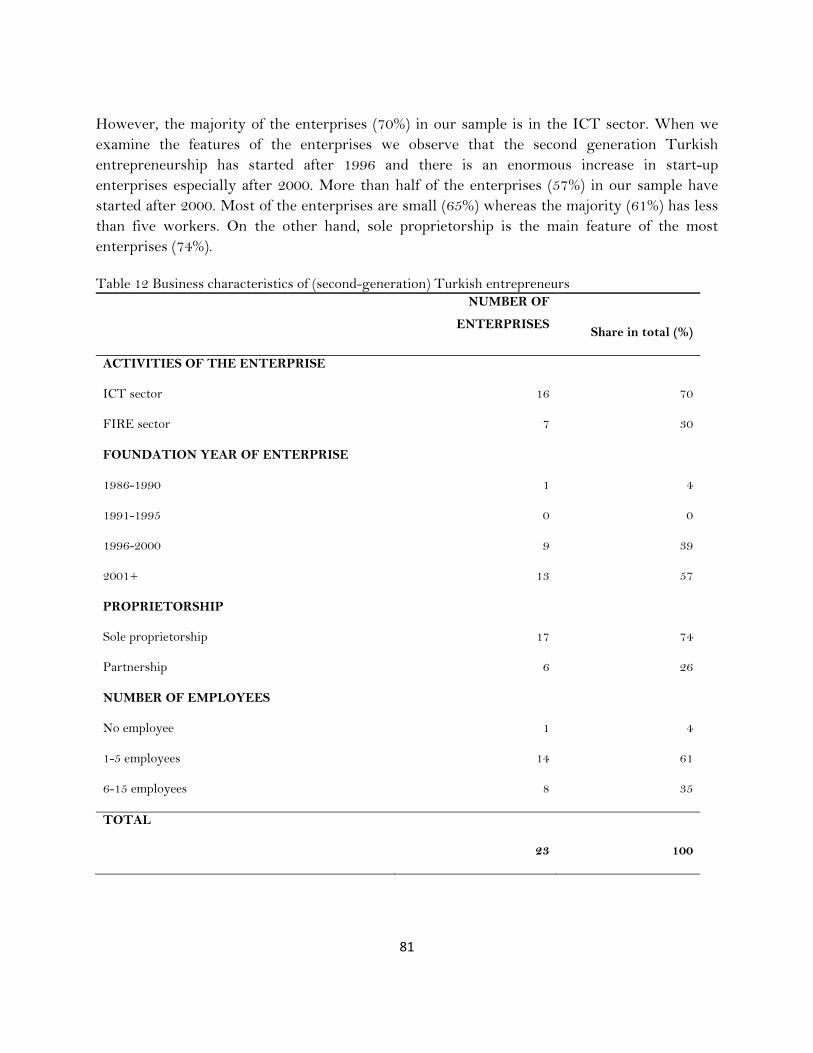
81
However, the majority of the enterprises (70%) in our sample is in the ICT sector. When we examine the features of the enterprises we observe that the second generation Turkish entrepreneurship has started after 1996 and there is an enormous increase in start-up enterprises especially after 2000. More than half of the enterprises (57%) in our sample have started after 2000. Most of the enterprises are small (65%) whereas the majority (61%) has less than five workers. On the other hand, sole proprietorship is the main feature of the most enterprises (74%). Table 12 Business characteristics of (second-generation) Turkish entrepreneurs NUMBER OF
ENTERPRISES
Share in total (%)
ACTIVITIES OF THE ENTERPRISE
ICT sector 16 70
FIRE sector 7 30
FOUNDATION YEAR OF ENTERPRISE
1986-1990 1 4
1991-1995 0 0
1996-2000 9 39
2001+ 13 57
PROPRIETORSHIP
Sole proprietorship 17 74
Partnership 6 26
NUMBER OF EMPLOYEES
No employee 1 4
1-5 employees 14 61
6-15 employees 8 35
TOTAL
23
100

82
Performance of Turkish Enterprises in ICT and FIRE sector When the development of sales and the profit of last year are examined for Turkish enterprises in ICT and FIRE sector in terms of their performance, 91% of the enterprises had an increase in sales, while the rest 9% had about the same level (Table 13). The profit of last year shows the same success level, while 87% of the entrepreneurs had a positive profit, 13% had the same profit. There are no decrease in development of sales and no negative profit at all. These figures show a very high economic performance.
Table 13 Performance of (second-generation) Turkish entrepreneurs
NUMBER OF
ENTERPRISES
Share in total (%)
DEVELOPMENT OF SALES
Increase 21 91
Decrease 0 0
Same 2 9
PROFIT LAST YEAR
Positive 20 87
Negative 0 0
Same 3 13
TOTAL
23
100
Profile of employees and clients of Turkish enterprises in ICT and FIRE sector When we examine the number and the composition of employees, we see that 23 Turkish enterprises in ICT and FIRE sector provide an employment opportunity for 111 persons of which 64% from their own ethnic group (Table 14). Although Turkish entrepreneurs exhibit an independent profile on the basis of motivation and driving forces as well as capital and information sources, here interestingly we observe a relatively high dependency to own ethnic group in terms of hiring employees. While 22% of the entrepreneurs have explained this fact by a need for Turkish employees because of their Turkish clients, 13% have clearly mentioned that they prefer Turkish employees for many reasons. However, more than half of the entrepreneurs (57%) have mentioned that they prefer to hire Dutch employees. These figures show that the highest dependency to own ethnic group when compared with the other factors appears in the composition of employees. However, these figures can be also evaluated as a sign of
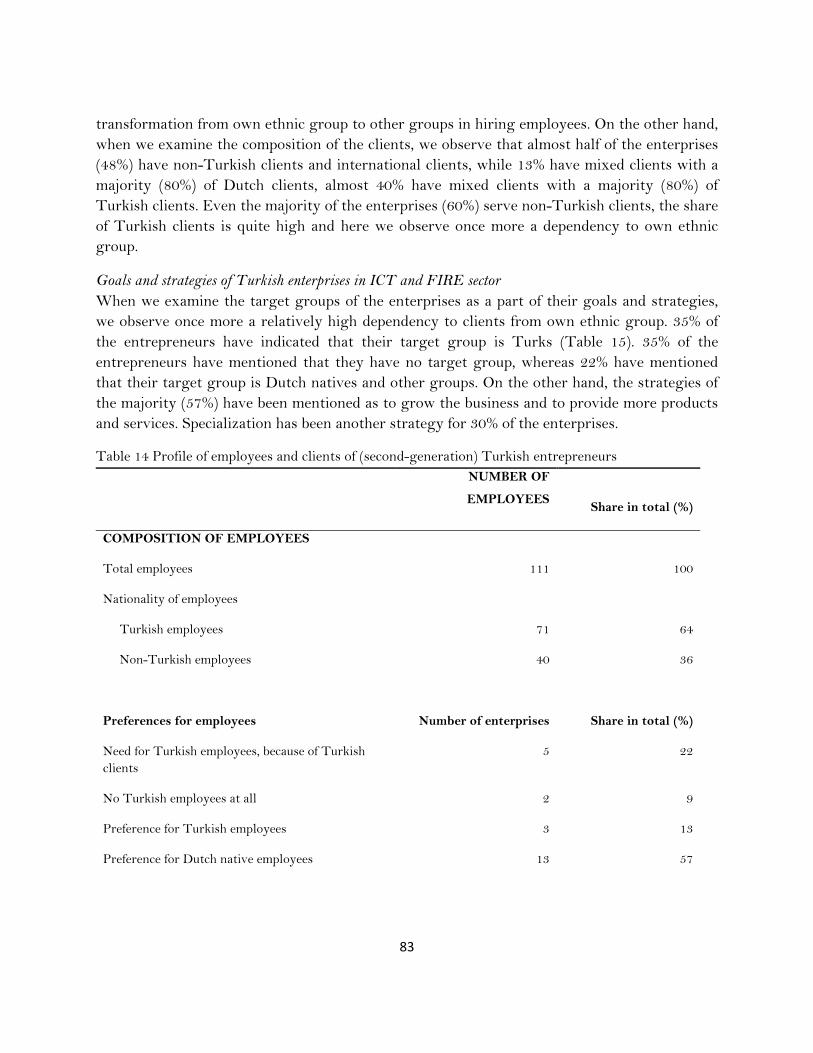
83
transformation from own ethnic group to other groups in hiring employees. On the other hand, when we examine the composition of the clients, we observe that almost half of the enterprises (48%) have non-Turkish clients and international clients, while 13% have mixed clients with a majority (80%) of Dutch clients, almost 40% have mixed clients with a majority (80%) of Turkish clients. Even the majority of the enterprises (60%) serve non-Turkish clients, the share of Turkish clients is quite high and here we observe once more a dependency to own ethnic group.
Goals and strategies of Turkish enterprises in ICT and FIRE sector When we examine the target groups of the enterprises as a part of their goals and strategies, we observe once more a relatively high dependency to clients from own ethnic group. 35% of the entrepreneurs have indicated that their target group is Turks (Table 15). 35% of the entrepreneurs have mentioned that they have no target group, whereas 22% have mentioned that their target group is Dutch natives and other groups. On the other hand, the strategies of the majority (57%) have been mentioned as to grow the business and to provide more products and services. Specialization has been another strategy for 30% of the enterprises.
Table 14 Profile of employees and clients of (second-generation) Turkish entrepreneurs
NUMBER OF
EMPLOYEES
Share in total (%)
COMPOSITION OF EMPLOYEES
Total employees 111 100
Nationality of employees
Turkish employees 71 64
Non-Turkish employees 40 36
Preferences for employees
Number of enterprises
Share in total (%)
Need for Turkish employees, because of Turkish clients
5 22
No Turkish employees at all 2 9
Preference for Turkish employees 3 13
Preference for Dutch native employees 13 57
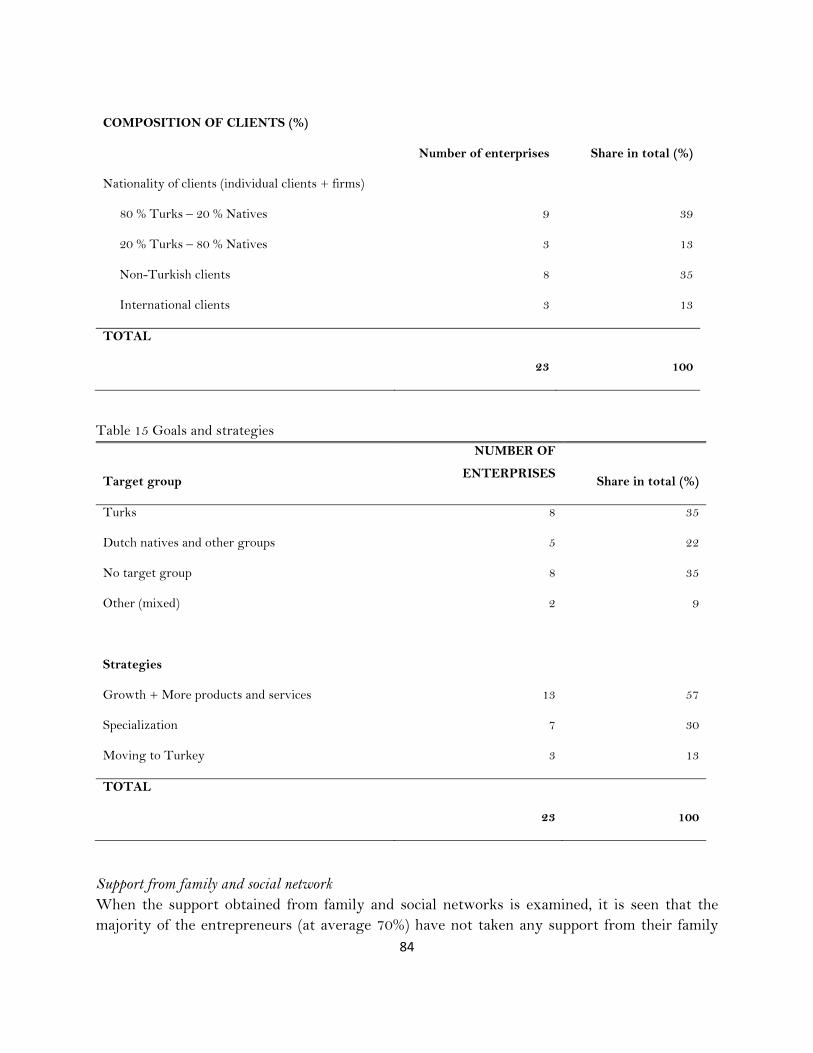
84
COMPOSITION OF CLIENTS (%)
Number of enterprises
Share in total (%)
Nationality of clients (individual clients + firms)
80 % Turks – 20 % Natives 9 39
20 % Turks – 80 % Natives 3 13
Non-Turkish clients 8 35
International clients 3 13
TOTAL
23
100
Table 15 Goals and strategies
Target group
NUMBER OF
ENTERPRISES
Share in total (%)
Turks 8 35
Dutch natives and other groups 5 22
No target group 8 35
Other (mixed) 2 9
Strategies
Growth + More products and services 13 57
Specialization 7 30
Moving to Turkey 3 13
TOTAL
23
100
Support from family and social network When the support obtained from family and social networks is examined, it is seen that the majority of the entrepreneurs (at average 70%) have not taken any support from their family

85
and social networks (Table 16). The highest rates appear in obtaining financial support with a rate of 35% and operationally support with a rate of 39%. However, these figures cannot be evaluated as an ethnic dependency as in general many of the entrepreneurs who are owner of the small enterprises obtain similar supports from family members.
Table 16 Support from family and social networks
NUMBER OF
ENTERPRISES
Share in total (%)
Financial support from family
Yes 8 35
No 15 65
Managerially support from family
Yes 2 9
No 21 91
Operationally support from family
Yes 9 39
No 14 61
Support from social network
Yes 7 30
No 16 70
Total
23
100
86
4.4. Evaluation of the new orientation of Turkish entrepreneurs In this section we will evaluate the empirical results of our case study research and we will try to answer the research questions that we raised.
An overall evaluation of the empirical results of our case study research shows that the second generation Turkish entrepreneurship in the Netherlands has started after 1996 and there has been an enormous increase in start-up enterprises especially after 2000. Depending on the arrival year of the Turkish immigrants in the Netherlands we may expect this increase in start-up second generation enterprises to continue in the future. We may also expect that the sector choice of the second generation Turkish entrepreneurs will be different than the first generation, probably will be more oriented to non-traditional, new developing and promising sectors such as ICT, FIRE or may be education and health sectors where immigrant employment is becoming increasingly significant (between 20% and 30% of immigrants work is in one of these two sectors in Finland, Switzerland, Sweden and the UK (OECD, 2006)) in many European countries nowadays. What is the motivation and orientation of new generation ethnic entrepreneurs? The results of our investigation demonstrate that the motivation and driving forces of the second generation Turkish entrepreneurs are stemming from both their personal characteristics shaped by their higher educational level and language ability and their previous working experience as an employee or entrepreneur in the same sector. The demand for and a gap in the sector as well as the growing and promising structure of the sector seem to play an important role in pulling the second generation Turkish immigrants to become entrepreneur. As a summary, we can say that the motivation and driving forces of the second generation Turkish immigrants can be explained by the pull factors. While their main motivation to become entrepreneur appears as to be independent and flexible, the other reason can be an entrepreneurial spirit which is stemming from entrepreneurial family tradition as more than half of the entrepreneurs have an entrepreneur family member.
How far are new generation ethnic entrepreneurs from their ethnic groups or their ethnic niches in the market? The results of our study show that the second generation Turkish entrepreneurs are quite independent from their own ethnic group in terms of obtaining capital and information. They tend to use their own capital and own knowledge and experience and when necessary they tend to apply to formal and financial institutions. We can say that their approach and behaviour differently than their first generation counterparts are formal. This clearly shows that the second generation Turkish entrepreneurs are quite independent from their ethnic niche. However, when the number and the composition of employees and clients are examined this picture changes a little bit. Although the second generation Turkish entrepreneurs exhibit an independent profile on the basis of motivation and driving forces as well as capital and information sources, here a relatively high dependency to own ethnic group in terms of hiring
87
employees and serving clients draw attention. A relatively higher rate of Turkish clients as a target group also highlights a relatively high dependency to clients from own ethnic group. This fact can be explained by a reason to benefit from both own ethnic group and the other groups in the market. Why to escape from potential and ready clients from own ethnic group? From this perspective, a relatively higher level of employees and clients cannot be seen as an ethnic dependency. Contrary, this can be evaluated as a way in expanding the market and a transformation period from an internal orientation to an external orientation. Can a new orientation –external orientation- help to break out from the ethnic dependency or to escape from the situation of being an ethnic enclave? Can the different motivation and orientation of new generation ethnic entrepreneurs help in breaking out strategies? The results of our investigation show that a new orientation to non-traditional sector or in other words, an external orientation with a combination of personal characteristics, skills and experience may cause a very high economic performance and success level of the second generation Turkish entrepreneurs. Therefore, this new orientation may also help in escaping from the situation of being an ethnic enclave and breaking out the ethnic dependency. This external orientation on the other hand may help in expanding the market. However, this external orientation never neglects to benefit from the own ethnic group. 5. CONCLUDING REMARKS
A growing number of the second generation migrant entrepreneurs and an orientation to non-traditional sectors have become the new trends in migrant entrepreneurship in recent years. Although traditional sectors are still most popular among the first generation migrant entrepreneurs, due to the increasing pressure and high competitiveness in traditional areas, new niches are developing and while the first generation has more often become active in these new areas like producer services which include finance, insurance, real estate and business related professional services, the second generation have contributed to the emergence of new areas of immigrant business activity such as ICT and creative industries.
Similar trends are also observed in the Netherlands. A general evaluation of immigrant entrepreneurship in the Netherlands highlights a sectoral change in immigrant entrepreneurship towards especially to producer services and an increasing number of second generation immigrant entrepreneurs in these sectors.
Our study investigated the new –external- orientations in immigrant entrepreneurship in terms of motivation, sector choice, goals and strategies of the second generation immigrant entrepreneurs while addressing the second generation Turkish entrepreneurs in ICT and FIRE sector in the Netherlands. The results of our study show that the second generation Turkish entrepreneurship in the Netherlands has started after 1996 and there has been an enormous increase in start-up enterprises especially after 2000. The results of our study show also that the motivation and driving forces of the second generation Turkish entrepreneurs are stemming from both their personal characteristics shaped by their higher educational level and

88
language ability and their previous working experience as an employee or entrepreneur in the same sector. The demand for and a gap in the sector as well as the growing and promising structure of the sector play also an important role in pulling the second generation Turkish immigrants to become entrepreneur in these new sectors. The results of our study show on the other hand that the second generation Turkish entrepreneurs are less oriented to ethnic co-clientele, more embedded in formal networks while keeping their informal networks as a complementary option.
References
Aldrich, H.E., R. Waldinger (1990). Ethnicity and Entrepreneurship. Annual Review of Sociology 16: 111-135.
Basu, A. (1998). An Exploration of Entrepreneurial Activity among Asian Small Businesses in Britain. Small Business Economics 10: 313-326.
Bates, T. (1997). Financing Small Business Creation: The Case of Chinese and Korean Immigrant Entrepreneurs. Journal of Business Venturing 12: 109-124.
Baycan-Levent, T., E. Masurel, P. Nijkamp (2005). Break-Out Strategies of Ethnic Entrepreneurs. In: T.N. Vaz, E.J. Morgan, P. Nijkamp (Eds) The New European Rurality; Strategies for Small Firms. Ashgate, Aldershot, 143-156.
Bijl, R.V., A. Zorlu, A.S. van Rijn, R.P.W. Jeenissen, M. Blom (2005). The Integration Monitor 2005: The social integration of migrants monitored over time: trend and cohort analyses. Ministry of Justice Research and Documentation Centre and Statistics Netherlands
Centraal Bureau voor de Statistiek (CBS) (2007). http://www.cbs.nl 2007
Chiswick, B.R., P.W. Miller (1994). The Determinants of Post-Immigration Investments in Education. Economics of Education Review 13(2): 163-177.
Choenni, A. (1997). Veelsoortig Assortiment. Het Spinhuis, Amsterdam 1997
Dagevos, J., M. Gijsberts, C van Praag (2003). Rapportage minderheden 2003: onderwijs, arbeid en sociaal-culturele integratie. Den Haag: SCP
Dagevos, J., M. Gesthuizen (2005). Niet-westerse allochtonen met een stabiele arbeidsmarktpositie: aantallen en ontwikkelingen. SCP: Sociaal en Cultureel Planbureau, Den Haag, November 2005.
Deakins, D. (1999). Entrepreneurship and Small Firms. Second Edition, McGrawHill, London.
Deakins, D., M. Majunder, A. Paddison (1997). Developing Success Strategies for Ethnic Minorities in Business: Evidence from Scotland. New Community 23: 325-342.
89
Delft, H. van, C. Gorter, P. Nijkamp (2000). In Search of Ethnic Entrepreneurship in the City. Environmental Planning C 18: 429-451.
Dieleman, F. (1993). Multicultural Holland: Myth or Reality? In: R. King (Ed) Mass Migrations in Europe: The Legacy and the Future. Belhaven Press, London, 118-135.
Dyer, L.M., C.A. Ross (2000). Ethnic Enterprises and their Clientele. Journal of Small Business Management 38(2): 48-66.
EIM (2004). Monitor Etnisch Ondernemerschap 2004. Onderzoek voor Bedrijf & Beleid, Zoetermeer: Ministerie van Economische Zaken, November 2004.
Euwals, R., J. Dagevos, M. Gijsberts and H. Roodenburg (2007). Immigration, Integration and the Labour Market: Turkish Immigrants in Germany and the Netherlands. Discussion Paper Series, IZA DP No. 2677
Garssen, J., A. Zorlu (2005). Demografie. In: Jaarrapport Integratie 2005. Den Haag, Voorburg: SCP / WODC / CBS: 14-27
Hartog, J., N. Vriend (1990). Young Mediterraneans in the Dutch labour market: A Comparative Analysis of Allocation and Earnings. Oxford Economic Papers 42: 379- 401.
Houtzager, D., P.R. Rodrigues (2002). Migrants, Minorities and Employment in the Netherlands; Exlusion, Disrcimination and Anti-discrimination. Raxen 3 Report to the European Monitoring Centre on Racism and Xenophobia (EUMC).
Kloosterman, R.C., J. van der Leun, J. Rath (1998). Across the Border; Economic Opportunities, Social Capital and Informal Businesses Activities of Immigrants. Journal of Ethnic Migration Studies 24: 367-376.
Kraal, K., A. Zorlu (1998). City Template Amsterdam. Basic Information on Ethnic Minorities and Their Participation. Report According to the Grid for City Templates of the MPMC Project, Amsterdam: IMES.
Lee, Y., T. Cameroen, P. Schaeffer, C.G. Schmidt (1997). Ethnic Minority Small Business: A Comparative Analysis of Restaurants in Denver. Urban Geography 18(7): 591-621.
Light, I., P. Bhacku (Eds.) (1993). Immigration and Entrepreneurship, Culture, Capital and Ethnic Networks. Transaction Books, New Brunswick, N.J.
Lucassen, L., R. Penninx (1997). Newcomers. Immigrants and their Descendants in the Netherlands 1550-1995. Amsterdam: Het Spinhuis (published originally in Dutch in 1994: Nieuwkomers, Nakomelingen, Nederlanders).

90
Masurel, E., P. Nijkamp (2004). Differences between first-generation and second-generation ethnic start-ups: Implications for a new support policy. Environment and Planning C: Government and Policy 22(5): 721-737.
OECD (2006). International Migration Outlook. SOPEMI 2006 Edition, OECD: Paris
Ram, M., D. Smallbone (2001). Ethnic Minority Enterprise: Policy in Practice. Final Report prepared for the Small Business Service, June 2001.
Rath, J. (2000). Introduction: immigrant business and the economic, politico-institutional and social environment. In: J. Rath (Ed) Immigrant Business: The Economic, Political and Social Environment. Macmillan Press, London, 1-19.
Rettab, B. (2001). The Emergence of Ethnic Entrepreneurship – A Conceptual Framework. EIM/Business & Policy Research. Zoetermeer
Rusinovic, K. (2006). Dynamic Entrepreneurship: First and second-generation immigrant entrepreneurs in Dutch cities. IMISCOE Dissertations, Amsterdam University Press
Tillaart, H. van den, E. Poutsma (1998). Een factor van betekenis: zelfstandig ondernemerschap van allochtonen in Nederland. ITS, Nijmegen.
Veenman, J. (1996). Keren de kansen? De tweede-generatie allochtonen in Nederland. Van Gorcum, Assen.
Zorlu, A., J. Hartog (2001). Migration and Immigrants: The case of the Netherlands. Prepared for Migration Policy and The Economy: International Experiences, Munchen: Hans Seidel Stiftung.
Zorlu, A., T. Traag (2005). Opleidingsniveau en taalvaardigheid. In: Jaarrapport Integratie 2005. Den Haag, Voorburg: SCP / WODC / CBS: 44-56.

91
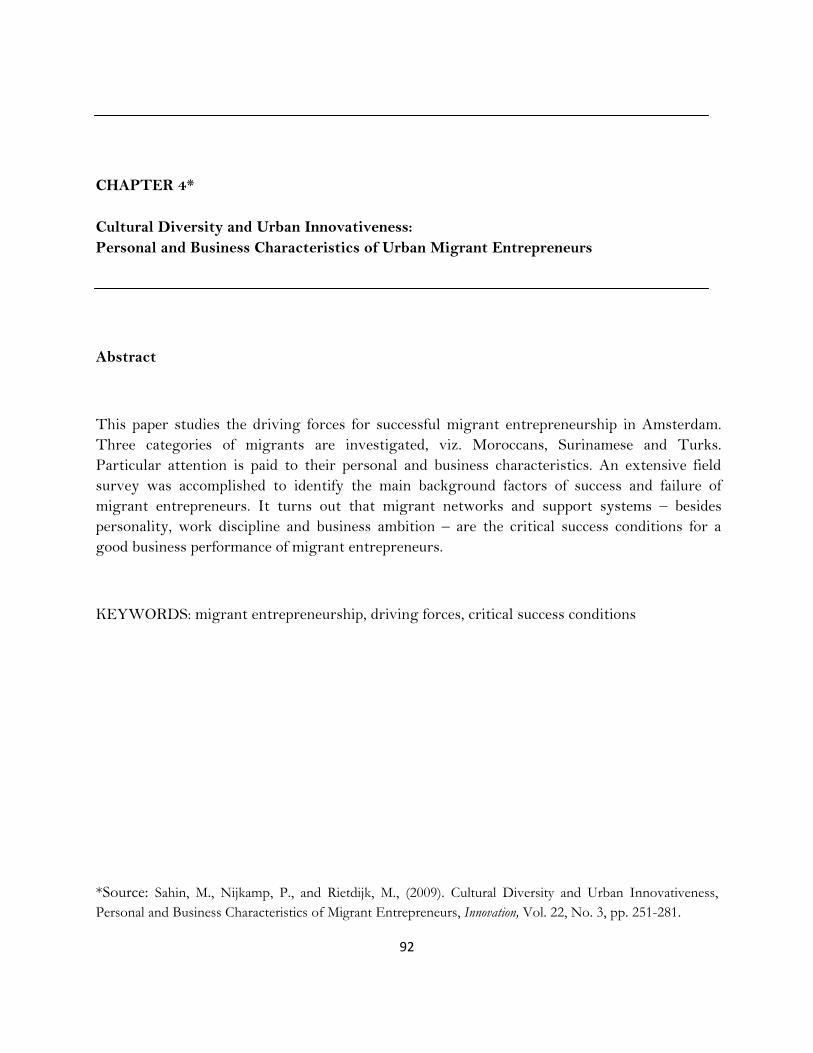
92
CHAPTER 4* Cultural Diversity and Urban Innovativeness: Personal and Business Characteristics of Urban Migrant Entrepreneurs
Abstract
This paper studies the driving forces for successful migrant entrepreneurship in Amsterdam. Three categories of migrants are investigated, viz. Moroccans, Surinamese and Turks. Particular attention is paid to their personal and business characteristics. An extensive field survey was accomplished to identify the main background factors of success and failure of migrant entrepreneurs. It turns out that migrant networks and support systems – besides personality, work discipline and business ambition – are the critical success conditions for a good business performance of migrant entrepreneurs.
KEYWORDS: migrant entrepreneurship, driving forces, critical success conditions
*Source: Sahin, M., Nijkamp, P., and Rietdijk, M., (2009). Cultural Diversity and Urban Innovativeness, Personal and Business Characteristics of Migrant Entrepreneurs, Innovation, Vol. 22, No. 3, pp. 251-281.

93
1. PREFATORY REMARKS
In an open and global space-economy characterized by a rising urbanization degree, modern cities function as the habitat of international migrants and magnets of economic growth, in which small and medium-sized enterprises (SMEs) are a source of new jobs, business dynamics and innovation. Migrants are a significant part of the urban population and ad hence be important vehicles for urban vitality in modern cities. Their `businesses are critical for urban economic development of cities, especially because of their large share in SMEs. SME are often seen as a source of new jobs, business dynamics and innovation. A positive and significant correlation between entrepreneurship and economic performance has /often been found in terms of growth, firm survival, innovation, employment creation, technological change, productivity increases and exports (Audretsch, 2002).
In recent years self-employment among migrants minorities has increased significantly in the Netherlands and in other countries, and migrant entrepreneurs have been the subject of rising interest. Encouraging migrants to become self-employed has been an important feature of national and local policymaking in the past years. Recent literature has documented that migrant businesses are one of the fastest growing sectors in the Dutch economy. The entrepreneurship rate of migrants is growing far more rapidly than among natives. Despite the fast growth of migrant entrepreneurship in the country, empirical Information that documents socio-economic differences in business performance of migrant entrepreneurs is lagging far behind the rapid growth of migrant entrepreneurs. Previous empirical research has mainly focused on knowledge about native entrepreneurs as strategic input for Dutch policy, education and research. It is noteworthy that the rate of participation in entrepreneurship differs greatly among the various migrant populations (Kloosterman et al., 1999). Successfulness in estab-lishing their own enterprise is clearly different among various minority groups. When comparing the migrant origin of active migrant entrepreneurs from Turkish, Moroccan and Surinamese ethnic origin in the Netherlands, we can see that the biggest group is formed by Turkish entrepreneurs (Sahin et al., 2006). But are they also the strongest entrepreneurial group with a higher rate of business performance in accordance to their higher rate in entrepreneurship?
The focus of this paper will be on the business performance of urban migrant entrepreneurs in order to explore and review significant difference in business performance between the above mentioned three entrepreneurial migrant groups in the Netherlands. The difference in business performance will be explained in terms of their personal and business characteristics, as well as their participation in social networks on the basis of a sample of the migrant population in the city of Amsterdam. Based on a blend of theoretical and applied research our study will address the question: are there significant differences in business performance between distinct groups of migrant entrepreneurs in the service sector (notably, tax and consultancy offices) in the city of Amsterdam, and – if so – can these differences be explained by their personal and business characteristics and by their degree of participation in (in)formal network support systems?
94
We will first discuss some key aspects of migrant entrepreneurs in the Netherlands, which includes explanations of the different patterns of self-employment among migrant groups – particularly Turkish, Moroccan and Surinamese entrepreneurs – regarding their personal (e.g., age, marital status, education, traits) and business characteristics (e.g., experience, the role of the family in the business), as well as their participation in social networks (in particular, the role of business support agencies and others in the development of their businesses).
Our study will comprise a broad literature search in order to (a) develop a theoretical framework leading to appropriate hypotheses to identify the causes and backgrounds of possible differences in business performance of relevant migrant groups, and (b) an experimental analysis to analyze the extent to which factors related to ethnic network constellations influence the business performance. The hypotheses will inter alia concern the specific personal and business characteristics for urban business incubation, and the social network support systems in urban communities. This study is based on primary data collected in 2006 in the city of Amsterdam. Using empirical fieldwork in the city of Amsterdam, through survey questionnaires, the research hypotheses will be tested. The basic premise is that significant differences will emerge in the individual and business characteristics between those groups that do participate in social networks and those that do not. This paper is structured as follows. First, we will provide a brief overview of the literature on migrant entrepreneurship. Next, we will outline the conceptualization of the selected variables and present a review of the personal and business characteristics of successful entrepreneurs from the literature. This section also details the moderating influence of participation in social networks of the native and migrant entrepreneurs in the Netherlands. The next section examines the backgrounds and the development of migrant entrepreneurship in the Netherlands and compares the main migrant groups, viz. Turks, Moroccans and Surinamese, in terms of their entrepreneurial behaviour. Finally, the last section concludes with a discussion on differences in entrepreneurial behaviour and business performance and with recommendations for further research in this field.
2. MIGRANT ENTREPRENEURSHIP
The phenomenon of ‘migrant entrepreneurship’ refers to business activities undertaken by migrants with a specific socio-cultural and ethnic background or migrant origin. Migrant entrepreneurship distinguishes itself from ‘normal’ entrepreneurship through its orientation on migrant products, on migrant market customers or on indigenous migrant business strategies (Choenni, 1997). There are several reasons why migrants opt for entrepreneurship. Jenkins (1984) has identified three basic explanatory models of ethnic involvement in business. These three basic explanatory models refer to: (i) the economic opportunity model; (ii) the culture model; and (iii) the reaction model. The economic opportunity model regards migrant minority

95
businesses as relying on the market for its fortunes. The culture model assumes that some cultures predispose group members towards the successful pursuit of entrepreneurial goals.
The reaction model assumes that self-employment among members of migrant minority groups is a reaction against racism and blocked avenues of social mobility, a means of surviving at the margins of a white-dominated society. Metcalfe et al. (1996), and Clark and Drinkwater (1998) identified the desire to avoid labour market discrimination in the form of low-paid jobs as a principal explanation for the entry of migrants into self-employment. They claimed that there is a substantial variation between migrant groups in self-employment, but in general they earn less than whites, even whites with similar characteristics. According to Waldinger et al. (1990) migrant minority businesses are a product of the interplay of opportunity structures, groups characteristics and strategies for adapting to the environment. Many migrants prefer the independence of entrepreneurship to a poorly paid job at the bottom of the labour market ladder. With the starting up of a new enterprise, these people hope to increase their incomes and climb up the social ladder.
A prominent characteristic of migrant entrepreneurship is the influence of family and co-ethnic labour on the business. Co-ethnic labour is a critical source of competitive advantage for migrant business, since it is cheap and the problem of supervision is made easier (Mitter, 1986). A consistent finding on previous research on migrant minority businesses is their low propensity to use mainstream business support agencies, often relying instead on self-help and informal sources of assistance (see Deakins et al., 1997, Ram and Smallbone, 2004, Carter and Jones, 2006). The low propensity of migrant entrepreneurs to use mainstream business support is caused by demand and supply side considerations. Demand side issues refer to a low level of perceived need or a lack of interest in receiving external assistance. Supply-side issues refer to the inability to reach out to other firms, to the inadequate database and to the inappropriateness of the product-oriented approaches used by many support agencies. Migrant entrepreneurs usually participate less in formal native networks, like retailer groups, trade associations and franchise organizations.
Although migrant groups are not uniform and display a great variation in motives, attitudes and behaviour, migrant enterprises and migrant entrepreneurs have some similar characteristics (CEEDR, 2000; Deakins, 1999; Kloosterman et al., 1998; Lee et al., 1997; Masurel et al., 2002; Ram, 1994). Baycan-Levent et al., (2003) have made an in-depth study of entrepreneurship diversities. They investigated migrant differences in enterprises and entrepreneurs’ characteristics between male and female natives and non-natives. The following is based on their findings on the issue of migrant entrepreneurship. Migrant and native entrepreneurs differ in: (i) personal characteristics (migrant entrepreneurs are younger than their native counterparts,); (ii) experience (migrant entrepreneurs have less formal or enterprise-related education or prior work experience than natives, and they have less entrepreneurial or management experience than natives); (iii) sector preferences and fields of interest (migrant entrepreneurs are less likely to own enterprises in goods-producing industries than native entrepreneurs); (iv) enterprises’ features (migrant minorities-owned

96
enterprises are somewhat smaller and somewhat younger than native-owned enterprises); (v) networks (migrant entrepreneurs use less formal business support organizations than natives); (vi) management styles (migrant entrepreneurs have specific management methods and enterprise structures); and (vii) training (migrant minorities tend to prefer less formal, experienced-based training, and to learn from their community-based informal networks, to be helped or mentored by this network).
The difference in entrepreneurial attitude and behaviour among the different groups and among different migrant populations in the Netherlands may have various causes. Different determinants of entrepreneurship, which combine various factors into an eclectic framework, have been defined by Verheul et al. (2001): i) psychological determinants: focus on motives and character traits; ii) sociological determinants: focus on the collective background of entrepreneurs; iii) economic determinants: focus on the impact of the economic climate and technological development; and iv) demographic determinants: focus on the impact of demographic composition on entrepreneurship. It is possible that certain migrant groups show more significance regarding some attributes of these four determinants, which will increase the chances of an individual to develop entrepreneurial behaviour. For instance, within the economic determinants it can be said that whenever high unemployment rates and low average incomes are highly applicable to a certain migrant group, this group will contain more individuals who are ‘pushed’ towards entrepreneurship in order to escape from the poor unemployment situation. In this case, many attributes may be applicable from these for determinants, which can explain the cause of strong or weak entrepreneurial behaviour. Chaganti and Greene (2002) showed several significant differences between natives and migrants on variables relating to the entrepreneurs’ background characteristics, business-related goals, cultural values, business strategies, and business performance. Given the growing importance of entrepreneurship, there is practical value in being able to identify entrepreneurial characteristics. Due insight into entrepreneurial behaviour of migrants is needed in developing an urban business culture in which migrants are no longer a source of problems but of great socio-economic opportunities, for both the migrant groups concerned and the urban vitality. Strategic information will also be necessary for a promising urban policy development and will bring to light what kind of policy strategies can be envisaged for enhancing the participation of traditionally less privileged groups and for improving their business performance potential. The following section continues gith the selected entrepreneurial traits and findings about their influence on business performance.
3. THEORETICAL FRAMEWORK: METHODOLOGY AND HYPOTHESES
Entrepreneurship is about success. The success of a business is due to many factors, but the greatest determinant of business success is the entrepreneur himself. The diplomas, education, and business knowledge of the entrepreneur play an important role, but the personality of the entrepreneur is even more important. There are often difficult situations that entrepreneurs

97
must deal with, and not everyone is able to cope with complex situations. People who start up and run a business need to know their own strengths and weaknesses, because ‘entrepreneurship involves the ability to build a founding team with complementary skills and talents’ (Timmons, 1994).
3.1. Personal and Business Characteristics Personality characteristics are formed by the interplay between the individual and the environment. In this interplay, the life situation, experiences and changes in the individual’s life play a central role (see Rotter, 1966, 1990; Littunen, 2000). Some attributes occur frequently in studies on entrepreneurship. The two most common theoretical and methodological approaches used to investigate the characteristics of entrepreneurs are demographic patterns, such as gender, birth order, marital status, role models, previous work experience (Aldrich, 1989; Brockhaus, 1982; Saffu 2003), and personality theory emphasizing personal traits and natural tendencies (Carland and Carland, 1993; Hansemark, 1998; Johnson, 1990; McClelland, 1961; Saffu, 2003). Studies with a focus on migrants’ positions report that higher educational qualifications enhance both the likelihood of being an entrepreneur (Hirsch and Brush, 1986) and also the chances for greater success (Basu, 1998; Bates, 1997). Daly (1991a) analyses the marital status of the self-employed and the importance of dependent children in determining self-employment rates. There is little difference between men with and those without dependent children. Women with dependent children are more likely to be self-employed. According to Daly (1991a) the self-employment rate is much lower for single people than it is for married, widowed, divorced or separated people. This reflects in fact that successful people below the age of 25 are less likely to be married than those in the older categories (Carter and Jones-Evans, 2006). Marriage seems to provide support in establishing a successful enterprise. There are few differences in gender. Divorced men have higher self-employment rates than divorced women. This is probably caused by the dominant role mf the man playing in many of the family partnerships. The level of achieved education of the entrepreneur has for long been seen as a crucial factor in determining both the actual entry into self-employment, and the longer-term success of the business (Carter and Jones-Evans, 2006). The results of studies to analyze these factors over the past years, have brought to light an interesting inconsistency. Entrepreneurs with employees are more likely to have formal qualifications than those without employees. Daly (1991a) found that, generally, entrepreneurs appear to have a higher level of educational achievement than employees.
Furthermore, in studies of entrepreneurship it is possible to differentiate between two schools of thought: one based on the trait model and the other on contingency thinking (Littunen, 2000). The trait approach focuses on personal characteristics and has been used to find out why some individuals become entrepreneurs and others do not, and to determine whether strengths of individuals’ characteristics could predict entrepreneurial behaviour (Brockhaus, 1982; McClelland, 1961, 1965). In these studies the personality traits of the successful entrepreneur are not looked at in the context of the prevailing situation. On the

98
other hand, following the models based on contingency thinking, the characteristics needed in entrepreneurship are bound up with the firms’ environment and the prevailing situation (Gilad and Levine, 1986). According to Hornaday and Aboud (1971) and Timmons (1978) successful entrepreneurs have different characteristics (Saffu, 2003). According to Brockhaus (1982) locus of control, risk taking propensity and achievement motivation are important factors in the decision to start a business. The theory of the need to achieve suggests that individuals with a strong need to achieve often find their way to entrepreneurship and succeed better than others as entrepreneurs. McClelland (1961) determined that those high in need for achievement tended to exhibit the following behavioural traits; they take personal responsibility for finding solutions to problems, set moderate goals and take calculated risks, and want feedback regarding performance. McClelland (1965) claimed that these behaviours correlate strongly with entrepreneurial success. According to Rotter’s (1966) theory the individual’s locus of control varies along the internal/external divide. The following features have been listed as the characteristics of an entrepreneur: (i) need for achievement; (ii) need for autonomy; (iii) dominance; (iv) high energy level; and (v) persistence. As we mentioned above, a large number of traits or characteristics has been proposed to describe entrepreneurs. We will describe the three most important individual characteristics that are supposedly related to entrepreneurs: (i) need for achievement; (ii) locus of control; and (iii) risk-taking propensity. In our study we will also include personal characteristics regarding their age, ethnic origin, marital status, children, and education to investigate the influence on their business performance.
(i) Need for Achievement Achievement motivation is prevalent among entrepreneurs. Achievement motivation can be defined as “behaviour towards competition with a standard of excellence” (McClelland, 1953). According to McClelland (1961), need for achievement is a strong psychological driving force behind human action and has been for long proposed as a factor influencing entrepreneurial behaviour. People who have high levels of achievement motivation tend to set challenging goals, and try to achieve these goals. It is also believed that individuals with a high need for achievement have a strong desire to be successful and are consequently more likely to behave entrepreneurially. These people value feedback and use it to assess their accomplishments. They have a strong desire for self-efficacy and persist on a task only if they believe they are likely to succeed. Individuals who are high achievers will choose a situation characterized by: (i) individual responsibility; (ii) moderate risk taking as a function of skill; (iii) knowledge of results of decisions; (iv) novel instrumental activity; and (v) anticipation of future possibilities. Achievement motivation is accepted as an important characteristic of the individual and influences work behaviour to a great extent (Lumpkin and Erdogan, 2000). Recently, Miner unfolded McClelland’s theory by developing five motivational patterns instead of the single achievement motive. This theory suggests that it is not possible to predict behaviour or performance on the basis of a single value, but that performance can be predicted by a complex

99
set of values or motive patterns. Miner’s five motive patterns that form an overall index of task motivation are: (i) self-achievement; (ii) risk-taking; (iii) feedback of results; (iv) personal innovation; and (v) planning for the future (Miner et al.).
(ii) Locus of Control The locus of control theory is the most commonly applied theory in research on entrepreneurship (Littunen, 2000). It has had a central position in personality research since the 1960s. The locus of control is a psychological factor which has been presumed to explain success as an entrepreneur, and to differentiate between entrepreneurs and other people (Aldrich and Zimmer, 1986; Chell et al., 1991). It refers to the perceived control over the events in one’s life (Rotter, 1966). A person believing that the achievement of a goal is dependent on his own behaviour or individual characteristics believes in internal control. If a person believes that an achievement is the result of luck and external factors, they believe in external control. Therefore, locus of control is conceived as one determinant of the expectancy of success (Weiner, 1992). People’s beliefs in personal control over their lives influence their perception of important events, their attitude towards life, and their work behaviours. Internal locus of control of the founders is associated with company performance (Boone et al., 1996). Overall, external control may be viewed as either positive or negative control. Positive external control supports and co-operates with personal control, increasing the expectancy of success. Negative external control hinders or limits personal control, decreasing the expectancy of success. Brockhaus (1982) suggested also that locus of control could distinguish entrepreneurs who are successful from those who are unsuccessful.
Research indicates that people with higher degrees of internal locus of control tend to monitor the environment to obtain information (Van Zuuren and Wolfs, 1991). This tendency may be the result of a desire to act on the environment. Internal locus of control may also be related to risk-taking orientation. Research shows that internals tend to estimate probability of failure as lower and decide in favor of risky options (Hendrickx et al., 1992). As an example of this tendency, internals are found to plan for expansions of their businesses even when unemployment rates are high (Ward, 1993). These results show that firms in which founders have higher internal locus of control may be more risk taking. In Levinson’s (1981) application locus of control has three dimensions which measure respectively an individuals belief in internal control, in control by others, or in control by chance, fate etc. The entrepreneur’s locus of control was measured by three different dimensions (Levenson, 1974): internal attributing, chance attributing and powerful others.
(iii) Risk-taking propensity Risk-taking propensity is defined as “the perceived probability of receiving rewards associated with the success of a situation that is required by the individual before he or she will subject him or herself to the consequences associated with failure, the alternative situation providing
100
less reward as well as less severe consequences than the proposed situation” (Brockhaus, 1982). A person’s risk-taking propensity can be defined as his or her orientation towards taking chances in uncertain decision-making contexts. Mill (1984) suggested that risk bearing is the key factor in distinguishing entrepreneurs from managers. Palmer (1971), Liles (1974) and Sarachek (1978) have suggested that the entrepreneurial function primarily involves risk measurement and risk taking. Risk taking is identified as a trait that distinguishes entrepreneurs from non-entrepreneurs and managers (Shane, 1996; Miner et al., 1989). Risk-taking propensity of the entrepreneur is expected to be related to the risk-taking level of the entrepreneurial firm. When entrepreneurs have the ability to influence the actions of the organization with their personal decisions, their personal characteristics may be reflected in the actions of the organization, while as a result the organization may be more risk taking. Risk-taking propensity may positively influence innovativeness, especially product innovativeness. Product innovativeness requires a certain degree of tolerance or predisposition for taking risks, because innovativeness benefits from a willingness to take risks and tolerance failures. The risk-taking propensity of the entrepreneurs will positively influence innovative attempts of the employees and as a result the organization may adopt an innovative orientation to face the competition.
Studies in entrepreneurship taking the context into consideration have found that risk taking was dependent on the entrepreneur’s age, motivation, business experience, number of years in business and education (Schwer and Yucelt, 1984). According to Basu (1998) business experience is also an important factor, which also leads to self-employment.
3.2. Participation in Social Networks The development of networking of entrepreneurs has attracted increasing attention for studies of (migrant) entrepreneurship, and network theories are increasingly applied to entrepreneurship research (Low and MacMillan 1988). Within the entrepreneurship literature the term ‘network’ has been used to describe the notion of entrepreneurial networks with reference to industrial districts (e.g., Saxenian, 1990), support structures (e.g., Chaston, 1995) and the personal contacts of entrepreneurs (e.g., Birley, 1985, Aldrich and Zimmer, 1986). The social network has a wider cultural dimension. Culturally induced values, attitudes and behaviours are of prime importance in explaining the nature of relationships. There is a difference between networking and social network perspective. The network perspective can be used to study the network of relationships between individuals, groups and organizations, the social network perspective focuses on the relationships between individuals. ‘Networks’ and ‘Networking’ can also be distinguished. Research has highlighted the importance of social networks and networking as an entrepreneurial tool for contributing to the establishment, development and growth of SMEs. The social networks of entrepreneurs play a number of important roles: (i) they generate social support for the actions of the entrepreneurs; (ii) they help extend the strategic competence of the entrepreneur in response to opportunities and
101
threats; and (iii) they supplement the often very limited resources of the entrepreneur (Johannisson and Peterson, 1984). The networks are also very important for the innovation process of businesses. Furthermore, entrepreneurial networks can be categorized into two types derived from differential sources; informal and formal networks (Birley, 1985; Littunen, 2000). Informal entrepreneurial networks consist of personal relationships, families and business contacts. Formal networks consist of venture capitalists, banks, accountants, creditors, lawyers, trade associations, licensing agreements and supply-chain linkages with either suppliers or users (Carter and Jones-Evans, 2006; Das and Teng, 1997). A key distinction between informal and formal network relationships is based on the role of trust (Birley, 1985). Some scholars suggests that social networks assist small firms in their acquisition of information and advice, in their development of innovative products and in their ability to compete (Birley, 1985; Rothwell, 1991; Brown and Butler, 1995; Carson et al., 1995; Conway, 1997, Shaw, 1997, 1998; Chell and Baines, 2000; Freel, 2000). The studies of entrepreneurial and small firm networks, generally, highlight the importance of family and friends, particularly during the early phase of entrepreneurial activity. An entrepreneur acts in interaction with the environment and when personal networks decrease or increase markedly, it is possible that such changes may also influence the motives, values, attitudes or personal characteristics of an entrepreneur (Littunen, 2000). According to Marlow (1992), migrant entrepreneurs did not appear to be benefiting from, or even using, formal networks, which is an important obstacle to business formation and growth. Migrant entrepreneurs generally had fewer opportunities to develop relevant experience, had fewer contacts, and had greater difficulty in assembling information resources in a majority-dominated environment (Brush, 1992; Carter and Rosa, 1998). The family is an important financial and human resource for a migrant entrepreneur as a source for unpaid or underpaid employees. The utilization of family resources made businesses more successful (Butler, 1991) and also associated them with long-term growth (Upton and Heck, 1997). According to Shoobridge (2006), (i) the support networks among majority and minority firms is vital for business success; (ii) ethnic minority networks tend to differ from those of the majority; (iii) ethnic minority networks tend to experience more obstacles to access networks; (iv) the reviewed studies tend to be descriptive and do not link the use of formal and informal networks to other important factors influencing firm performance; and (v) the independent variables, associated with ethnic business and information support networks, have not been linked to business performance, and have not been compared to the performance of majority businesses.
3.3. Business Performance Business performance is an essential concept in any study on entrepreneurship and entrepreneurial behaviour. The business performance of SMEs has been a source of an important policy and academic debate. Accurate and appropriate measurement of performance is critical in the entrepreneurship literature (Murphy et al., 1996). Without suitable means of
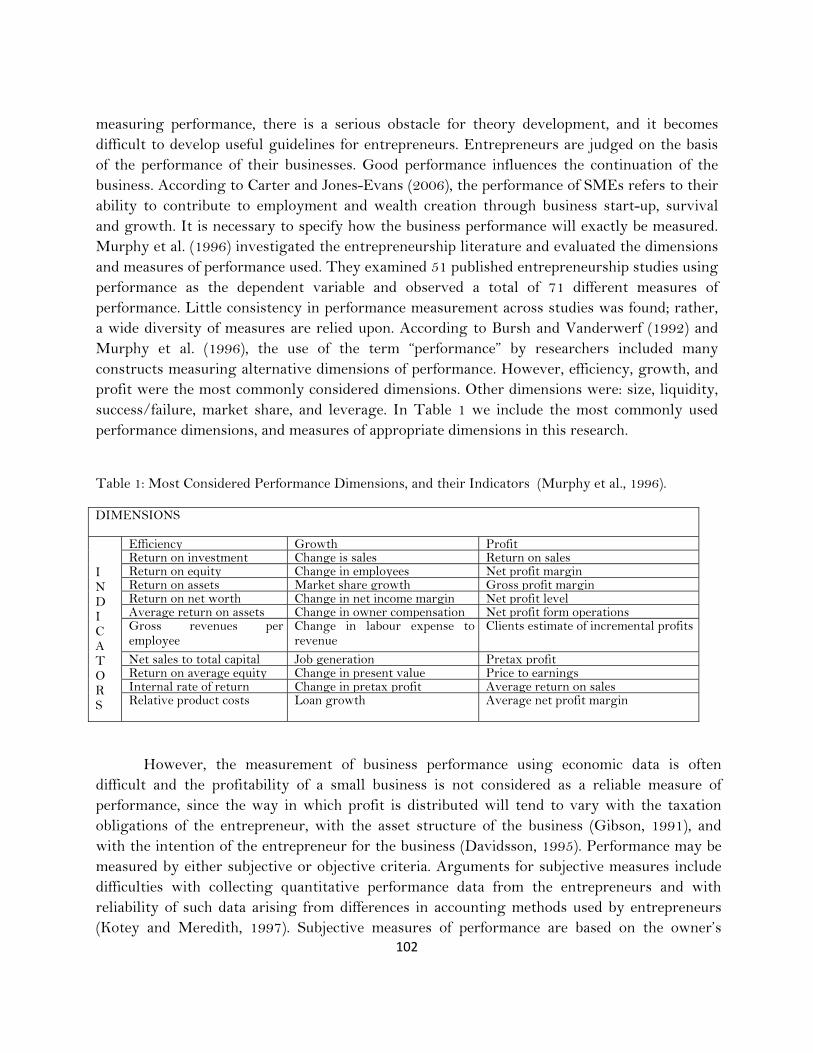
102
measuring performance, there is a serious obstacle for theory development, and it becomes difficult to develop useful guidelines for entrepreneurs. Entrepreneurs are judged on the basis of the performance of their businesses. Good performance influences the continuation of the business. According to Carter and Jones-Evans (2006), the performance of SMEs refers to their ability to contribute to employment and wealth creation through business start-up, survival and growth. It is necessary to specify how the business performance will exactly be measured. Murphy et al. (1996) investigated the entrepreneurship literature and evaluated the dimensions and measures of performance used. They examined 51 published entrepreneurship studies using performance as the dependent variable and observed a total of 71 different measures of performance. Little consistency in performance measurement across studies was found; rather, a wide diversity of measures are relied upon. According to Bursh and Vanderwerf (1992) and Murphy et al. (1996), the use of the term “performance” by researchers included many constructs measuring alternative dimensions of performance. However, efficiency, growth, and profit were the most commonly considered dimensions. Other dimensions were: size, liquidity, success/failure, market share, and leverage. In Table 1 we include the most commonly used performance dimensions, and measures of appropriate dimensions in this research.
Table 1: Most Considered Performance Dimensions, and their Indicators (Murphy et al., 1996).
DIMENSIONS
I N D I C A T O R S
Efficiency Growth Profit Return on investment Change is sales Return on sales Return on equity Change in employees Net profit margin Return on assets Market share growth Gross profit margin Return on net worth Change in net income margin Net profit level Average return on assets Change in owner compensation Net profit form operations Gross revenues per employee
Change in labour expense to revenue
Clients estimate of incremental profits
Net sales to total capital Job generation Pretax profit Return on average equity Change in present value Price to earnings Internal rate of return Change in pretax profit Average return on sales Relative product costs Loan growth Average net profit margin
However, the measurement of business performance using economic data is often difficult and the profitability of a small business is not considered as a reliable measure of performance, since the way in which profit is distributed will tend to vary with the taxation obligations of the entrepreneur, with the asset structure of the business (Gibson, 1991), and with the intention of the entrepreneur for the business (Davidsson, 1995). Performance may be measured by either subjective or objective criteria. Arguments for subjective measures include difficulties with collecting quantitative performance data from the entrepreneurs and with reliability of such data arising from differences in accounting methods used by entrepreneurs (Kotey and Meredith, 1997). Subjective measures of performance are based on the owner’s
103
perception, so they increase the possibility of measurement error and the potential for bias (Delaney and Huselid, 1996). Objective performance measures include indicators such as profit growth, cash flows, earning, net earnings per Euro of assets employed, capital productivity, capital output ratio, rate of return on investment, revenue growth, expense/revenue ratio growth, total assets and employment (Kent et al. 1982). Profit is a commonly used objective measure of performance, as it is seen as an overriding business goal (Thomas and Evanson, 1987). Both absolute and relative profit values are used (Thomas and Evanson, 1987), although often relative measures of profit are preferred, because they take account of the scale of business (Kent et al., 1982). Performance is also measured in terms of growth. Examples of growth measures include changes in profit and sales. Growth − or the lack of it − provides an indication of improvement or impairment to financial performance (Kent et al., 1994).
Postma and Zwart (2001) argued that in order to measure the multidimensional performance construct, both objective and subjective measures should be included in the measurement instrument. The correct performance measures might be influenced by the size of the business and the ambition of the entrepreneur. Venkatraman and Ramanujam (1986) have pointed out that firm performance is a multidimensional construct. They proposed the following proxies for firm and business performance: (i) financial performance refers to return on assets (ROA), return on sales (ROS), and return on equity (ROE); (ii) business performance measures market-related items such as market share, growth, diversication, and product development (Gray, 1997); (iii) organizational effectiveness measures refer to employee satisfaction, quality and social responsibility. According to Madsen (1987) and Matthyssens and Pauwels (1996), all measures of overall business performance can be grouped into distinct well-defined performance categories, representing financial, nonfinancial and composite scales. These are the following: (i) the “sales” category includes measures of the absolute volume of sales, export sales, or the export intensity; (ii) the “profit” category consists of absolute measures of overall export profitability and relative measures such as export profit divided by total profit or by domestic market profit; (iii) the “growth” measures refer to changes in export sales or profit over a period of time (whereas the “sales” and “profit” measures are static); (iv) the “success” category comprises measures such as the managers’ belief that export contributes to a firm’s overall profitability and reputation (see e.g., Raven et al., 1994); (v) the “satisfaction” indicators refer to the managers’ overall contentment with the company’s export performance (e.g., Evangelista, 1994); (vi) the “goal achievement” measures refer to the managers’ assessment of performance compared to objectives (e.g., Katsikeas et al., 1996); (vii) finally, “Composite Scales” refer to measures that are based on overall scores of a variety of performance measures. To evaluate business performance, Shoobridge (2006) proposes the use of universal “financial indicators” such as: profits per employee, return on total assets, return on shareholders funds, return on capital employed, profit margin percentage, interest cover, liquidity ratio, and solvency ratio.
The businesses of migrants are perceived as smaller and less likely to grow (Butler and Greene, 1997a). There are two explanations for this: (i) migrant entrepreneurs tend to enter

104
fragmented business sectors defined by low barriers to entry, intense competition, low profit margins and low liquidity, which are survival mechanisms and therefore not initially designed for significant levels of growth; (ii) migrant businesses, especially those existing in an ethnic enclave, are perceived as serving largely a co-ethnic community and therefore potentially bounded by a niche market demand. Other influential authors linking ethnic minorities to business performance are Hartenian and Gudmundson (2000); they linked cultural diversity in small business in terms of the firm’s overall number of employees with the firm’s performance. They also focused on the business and managerial characteristics and its impact on the firm’s level of workforce diversity. They concluded that firms that had more diverse workforces reported higher level of business performance.
3.4. Research Hypotheses In our study the construct of business performance is based on an objective and subjective definition of business performance, which is linked to success. In this case objective business performance refers to the change in turnover, net and gross profit, personal income, and market share, while the subjective business performance refers to entrepreneur’s opinion about the successfulness in their business and their satisfaction with the achieved results and business performance. Besides these variables, we also include internal and external success factors to measure business performance of migrant entrepreneurs. Finally, in accordance with the previous review of the literature, the following hypotheses will be tested. Hypothesis 1
Based on these previous research findings on personal and business characteristics and participation in (informal) networks, the main hypothesis of this study will be tested on the basis of the following statement:
“Personal and business characteristics and participation in (in)formal networks have a significant influence on business performance”.
H0: There is no significant relationship between personal and business characteristics, and participation in (in)formal networks and business performance.
H1: There is a significant relationship between personal and business characteristics, and participation in (in)formal networks and business performance.
Hypothesis 2
Based on the theory of need for achievement, locus of control and risk-taking propensity and the previous research findings that successful entrepreneurs are high achievers, prefer to take and hold unmistakable command instead of leaving things to external factors, and that risk-taking is

105
a major entrepreneurial characteristic, this study postulates the following statement as a hypothesis:
“Migrant entrepreneurs with a higher score on personal characteristics have a higher business performance compared to migrant entrepreneurs with a lower score on personal characteristics”.
H0: Turkish entrepreneurs have no higher score on personal characteristics than Moroccan and Surinamese entrepreneurs.
H1: Turkish entrepreneurs have a higher score on personal characteristics than Moroccan and Surinamese entrepreneurs.
This hypothesis is put forward as a result of the following argument:
a) Turkish entrepreneurs have a higher level of need for achievement than Moroccan and Surinamese entrepreneurs.
b) Turkish entrepreneurs have a higher level of locus of control than Moroccan and Surinamese entrepreneurs.
c) Turkish entrepreneurs have a higher level of risk-taking propensity than Moroccan and Surinamese entrepreneurs.
Hypothesis 3
Based on the previous research findings that business characteristics are of significant importance for business performance, this study postulates the following statement as a hypothesis:
“Migrant entrepreneurs with a higher score on business characteristics have a higher business performance compared to migrant entrepreneurs with a lower score on business characteristics”.
H0: Turkish entrepreneurs have no higher score on business characteristics than Moroccan and Surinamese entrepreneurs.
H1: Turkish entrepreneurs have a higher score on business characteristics than Moroccan and Surinamese entrepreneurs.
This hypothesis is seems plausible as a result of the following consideration:
a) Turkish entrepreneurs have more business experience than Moroccan and Surinamese entrepreneurs.
b) Turkish entrepreneurs have a higher level of innovation than Moroccan and Surinamese entrepreneurs.

106
c) Turkish entrepreneurs have a larger size of business than Moroccan and Surinamese entrepreneurs.
Hypothesis 4
Based on the network theory and the previous research findings that networking is an important tool for contributing to the establishment, development and growth of SMEs, this study postulates the following statement and hypothesis:
“Migrant entrepreneurs with a higher participation rate in social networks have a higher business performance compared to migrant entrepreneurs with a lower participation rate in social networks”.
H0: Turkish entrepreneurs do not have a higher participation rate in social networks than Moroccan and Surinamese entrepreneurs.
H1: Turkish entrepreneurs have a higher participation rate in social networks than Moroccan and Surinamese entrepreneurs.
Hypothesis 5
Based on the previous research findings that business performance influences the successful continuation of the business, this study postulates the following hypothesis:
H0: Turkish entrepreneurs do not have a higher level of business performance than Moroccan and Surinamese entrepreneurs.
H1: Turkish entrepreneurs have a higher level of business performance than Moroccan and Surinamese entrepreneurs.
The findings of earlier research suggest that successfulness of entrepreneurs is affected by their characteristics. Our study utilized personal and business characteristics that have been shown in the literature to be associated with business performance. In our study we investigate how the entrepreneurs investigated measure success in their businesses, and whether they are satisfied with the success of their businesses. In the next section we will discuss the backgrounds and the development of migrant entrepreneurship in the Netherlands since 1960s and compare the main migrant groups, viz. Turks, Moroccans, and Surinamese in terms of their entrepreneurial behaviour. The results of the research will be handled in the statistical data processing program of SPSS. All our analyses are performed with a confidence interval of 95%. According to the outcomes of our research, the above mentioned hypotheses will be tested.

107
4. MIGRANT ENTREPRENEURSHIP IN THE NETHERLANDS
4.1. General Data on Migrants in the Netherlands The Netherlands has shown a remarkable openness vis-à-vis foreigners, a situation that can clearly be observed in the history of the cities in the country. At present, the share of migrants from the western world in Dutch society is approx. 20 percent, while the share of non-western migrants is about 10 percent (CBS 2003, 2004). From the non-western migrant population, three groups have a dominant position (namely approx. 60 percent), viz. Turks, Moroccans and Surinamese. The Netherlands is increasingly faced with cultural and ethnic diversity as a result of international migration. International migration – either voluntary or forced – has changed the demographic face of cities in the country. Table 2: Main Migrant Groups and Natives in the Largest Cities in the Netherlands.
Year (x1000) Natives Turks Moroccans Surinamese
2002 13140.3 330.7 284.1 315.2
2003 13153.8 341.4 295.3 320.7
2004 13169.9 351.7 306.2 325.3
2005 13182.9 358.8 315.8 329.4
2006 13184.1 364.6 323.3 332.0
Migrant Groups (%) Netherlands Amsterdam Rotterdam The Hague
Moroccans 1.04 8.8 6.3 5.3
Turks 1.30 5.0 7.5 6.6
Surinamese 0.98 9.5 8.7 9.6
Others 2.40 9.5 9.3 8.3
Total of Migrants 6.32 34.3 35.1 32.1
Total of Natives 93.68 65.7 64.9 67.9
Total 100.0 100.0 100.0 100.0
Source: (CBS, O+S, COS, 2004, 2006).
The migrant populations from Turkey and Morocco in the Netherlands are very similar regarding their demographic composition. They are, on average, the least well-educated and most likely to be married, and most migrants from these countries consider themselves to be Muslim. The migrants from Surinam and Antilles are better educated, more familiar with the Dutch culture and language, and more often single or single parents. All migrant populations
108
have in common that they are relatively young as compared to the native Dutch population (Jansen et al., 2003). Migrants from Suriname and the Antilles also have similar demographic characteristics. Their age distribution is similar to the age distribution of migrants from Turkey and Morocco. Regarding the labour force participation rate of women and the share of married couples in the total number of households, they have much in common with the native Dutch population (Jansen et al., 2003).
The above-mentioned migrants find themselves often in marginal economic positions. The low qualification level of migrant minorities causes disadvantages in job level, participation level and earnings, in addition to unemployment. Migrants’ low-level jobs can be explained by their personal characteristics like sex, family background and experience. Migrant minorities have a disadvantaged position in the Netherlands concerning their participation and unemployment rates as well as their earnings. The labour market position of the disadvantaged varies across migrant minority groups within this group, related to their migration history. According to Zorlu (2001), migrant minorities from Turkey and Morocco have the poorest labour market position. The Surinamese and Antilleans have a relatively better labour market position than Turks and Moroccans. The Surinamese and Antilleans share a common history with Dutch people, and people from this group speak Dutch often as a mother tongue. Considering the household income, the higher percentage of Surinamese, Antilleans, Turks and Moroccans in the lowest income category is remarkable as well as the low percentage of Surinamese and Antillean women and Turkish and Moroccan men in the highest income category.
In the middle of the year 2000, there were 36.461 economically active migrant enterprises within the Netherlands. The number of starting migrant entrepreneurs has strongly increased since the beginning of 2004. In 2003, there were 10.700 migrant entrepreneurs. In 2004, there were 12800 migrant entrepreneurs and in 2005, this had risen to 14.900. This was an increase of approximately 40 per cent in two years time. This concerns moreover persons who are not born in the Netherlands. From the 14900 starting migrant entrepreneurs, 4600 belong to the traditional large migrant group from Morocco, Turkey, Surinam, the Antilles and Aruba (KvK, 2006).
Migrant entrepreneurs have some distinct features. Migrant enterprises are usually found at the bottom of the market, where less financial capital and specific knowledge is required and entry barriers are thus relatively lower (Rath and Kloosterman, 1998). These markets are characterized by strong competition, mostly from co-migrants and based on price instead of quality, and the entrepreneurs often have to accept small profit margins, while relatively many are forced to close down after a short time (Rettab, 2001; Maas, 2004). In the Netherlands, approximately 60 per cent of all migrant entrepreneurs are found in the more traditional sectors such as wholesale, retail and catering industry (Tillaart, 2001). Furthermore, they make use of their social networks to acquire employees, informal credit and information, and also in their offer they are often primarily targeting the own migrant community (Choenni,

109
1998, Tillaart and Poutsma, 1998). In particular, family and migrant networks are considered to be a crucial part of entrepreneurial success among migrants (Delft et al., 2000).
While native entrepreneurs within the Netherlands usually loan their starting capital from the bank, migrant entrepreneurs usually get this starting capital from their relatives. We can think in this case of parents, brothers, sisters, uncles and aunts. Family members often invest in the business, and therefore it also in the interest of the family to make the business a success. Also personal money from the entrepreneur itself is a widely used financial source. It is still common that migrant people will less easily get a loan from the bank in comparison with their natives. Successful Turkish entrepreneurs within the Netherlands have often reached their success on their own or with the help of their family and friends.
Migrant enterprises are less equally spread across the population in comparison with other enterprises. They are particularly found in urban areas and moreover in the western part of the country, where one also can find the bigger clustering of migrant populations. It appears that migrant enterprises provide a better understanding of the needs and wants of the ‘own group’. Also the role of family bonds and informal networks is important in this respect, as well as from a financial and personal perspective. Usually, migrant entrepreneurs find a niche in their immigrant community and start up in a culturally well-defined market, so as to provide typical ethnic services and products. An enclave economy can then positively affect the perspective of migrant entrepreneurs. Immigrant groups that produce a strong entrepreneurial group can be of great significance for the migrant business community, through job and opportunity creation. Thus, besides co-migrant clients, the migrant entrepreneur is close to his own migrant group when it comes to the work force, business financing or even informal networks for information gathering. Migrant entrepreneurs are even literally close to each other in the case of geographical clustering, since many migrant entrepreneurs start their enterprises in areas where already a large population is living with the same migrant background.
4.2 Data Collecting: Procedure and Database The procedure for collecting the data was as follows; survey questionnaires have been conducted in the city of Amsterdam among migrant entrepreneurs of different ethnic origin in the service sector. First the entrepreneurs were asked if they were from Turkish, Moroccan, and Surinamese origin. In case of an affirmative reply, they were asked if they would like to participate in our investigation. If they would not like to participate, the reason for this was noted. The non-response rate was very low. From the sample 2 Turkish entrepreneurs, and 5 Moroccan entrepreneurs did not participate, because they had no time and 1 Turkish entrepreneur was not interested in the investigation. In this study, survey questionnaires appeared to be preferable to other methods, because of the large sample we needed.
Our study seeks to analyze the behaviour of first- and second-generation migrant entrepreneurs, within the set of an age-span on people between approximately 18 and 65 years old. Since the aim of our research is the judgment of migrant entrepreneurs in the service
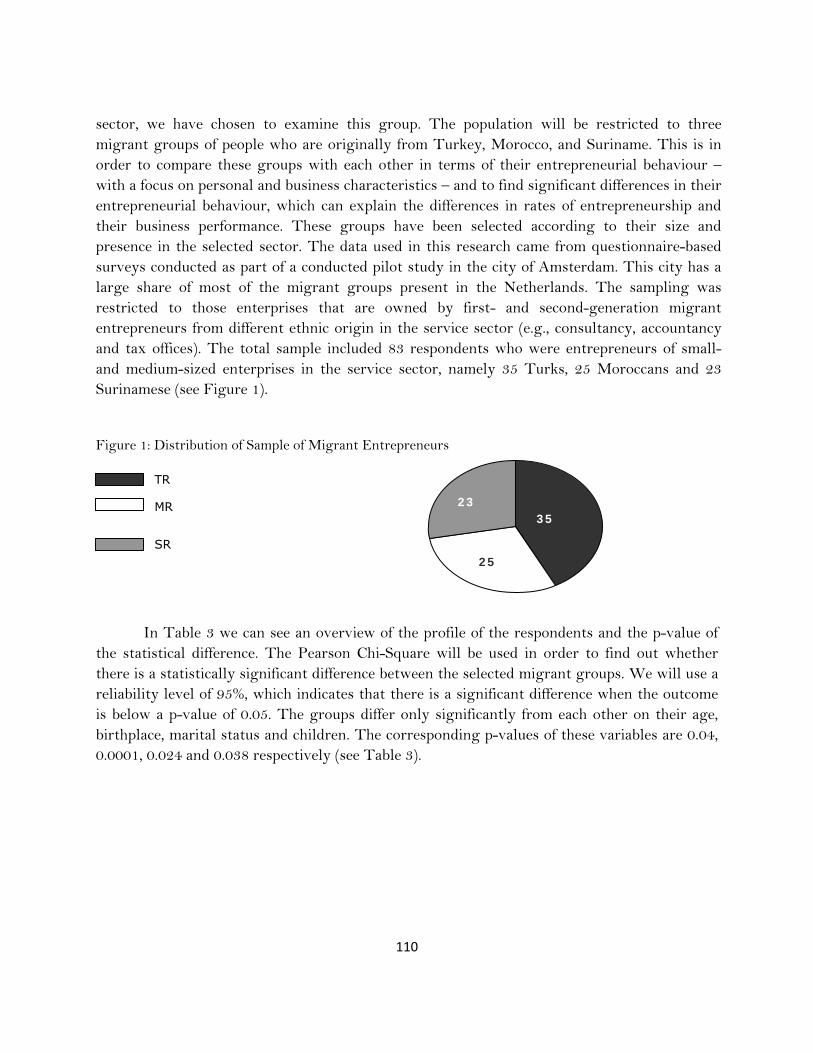
110
sector, we have chosen to examine this group. The population will be restricted to three migrant groups of people who are originally from Turkey, Morocco, and Suriname. This is in order to compare these groups with each other in terms of their entrepreneurial behaviour – with a focus on personal and business characteristics – and to find significant differences in their entrepreneurial behaviour, which can explain the differences in rates of entrepreneurship and their business performance. These groups have been selected according to their size and presence in the selected sector. The data used in this research came from questionnaire-based surveys conducted as part of a conducted pilot study in the city of Amsterdam. This city has a large share of most of the migrant groups present in the Netherlands. The sampling was restricted to those enterprises that are owned by first- and second-generation migrant entrepreneurs from different ethnic origin in the service sector (e.g., consultancy, accountancy and tax offices). The total sample included 83 respondents who were entrepreneurs of small- and medium-sized enterprises in the service sector, namely 35 Turks, 25 Moroccans and 23 Surinamese (see Figure 1).
Figure 1: Distribution of Sample of Migrant Entrepreneurs
In Table 3 we can see an overview of the profile of the respondents and the p-value of the statistical difference. The Pearson Chi-Square will be used in order to find out whether there is a statistically significant difference between the selected migrant groups. We will use a reliability level of 95%, which indicates that there is a significant difference when the outcome is below a p-value of 0.05. The groups differ only significantly from each other on their age, birthplace, marital status and children. The corresponding p-values of these variables are 0.04, 0.0001, 0.024 and 0.038 respectively (see Table 3).
SR 25
TR
MR 23 35
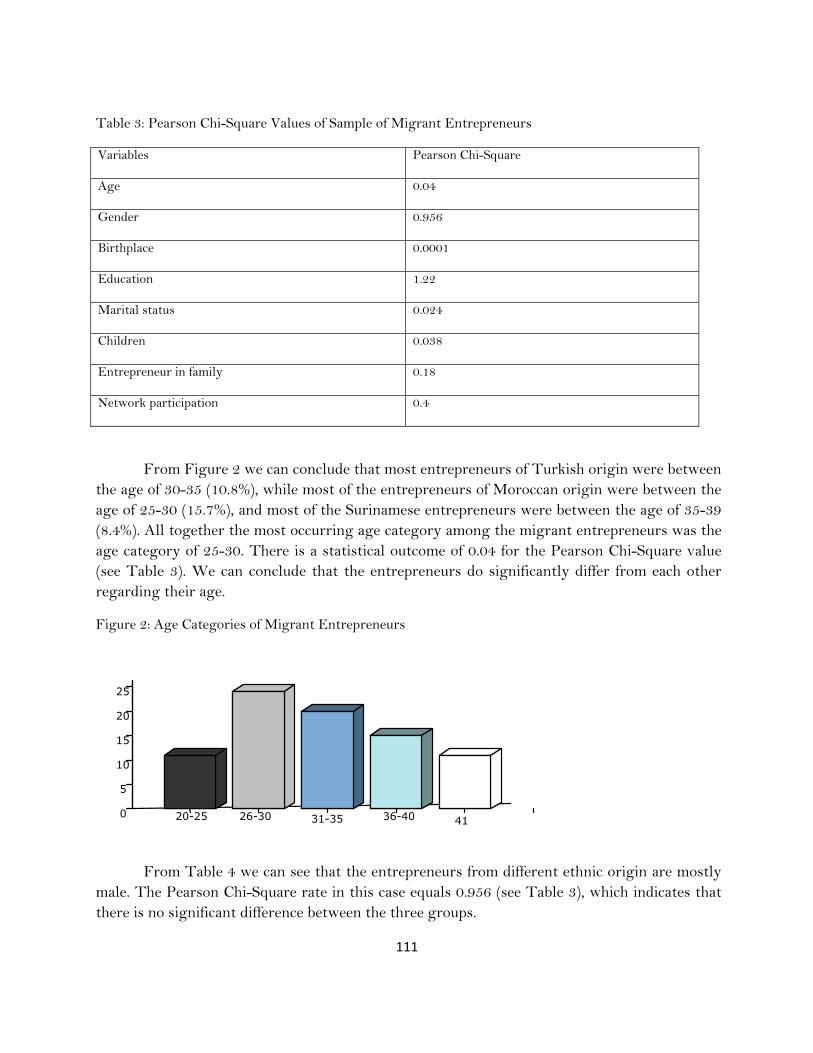
111
Table 3: Pearson Chi-Square Values of Sample of Migrant Entrepreneurs
Variables Pearson Chi-Square
Age 0.04
Gender 0.956
Birthplace 0.0001
Education 1.22
Marital status 0.024
Children 0.038
Entrepreneur in family 0.18
Network participation 0.4
From Figure 2 we can conclude that most entrepreneurs of Turkish origin were between the age of 30-35 (10.8%), while most of the entrepreneurs of Moroccan origin were between the age of 25-30 (15.7%), and most of the Surinamese entrepreneurs were between the age of 35-39 (8.4%). All together the most occurring age category among the migrant entrepreneurs was the age category of 25-30. There is a statistical outcome of 0.04 for the Pearson Chi-Square value (see Table 3). We can conclude that the entrepreneurs do significantly differ from each other regarding their age.
Figure 2: Age Categories of Migrant Entrepreneurs
From Table 4 we can see that the entrepreneurs from different ethnic origin are mostly male. The Pearson Chi-Square rate in this case equals 0.956 (see Table 3), which indicates that there is no significant difference between the three groups.
4136-4026-30 20-25
25
20
15
10
5
0 31-35
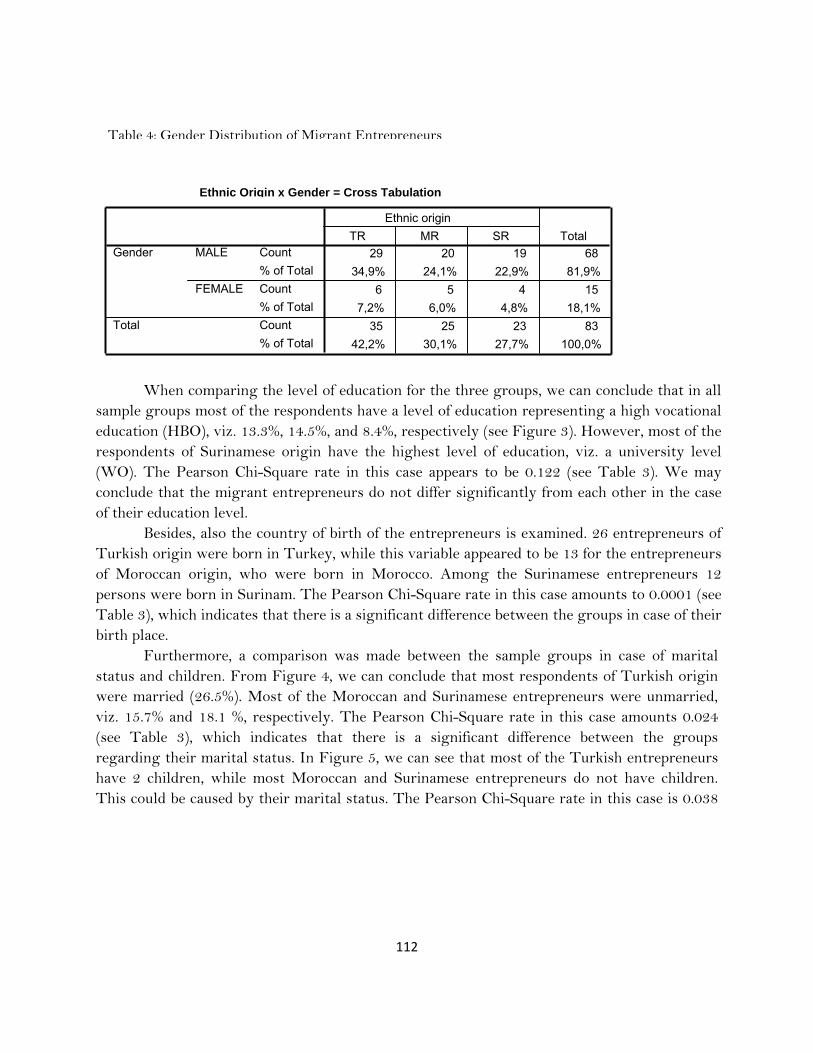
112
When comparing the level of education for the three groups, we can conclude that in all sample groups most of the respondents have a level of education representing a high vocational education (HBO), viz. 13.3%, 14.5%, and 8.4%, respectively (see Figure 3). However, most of the respondents of Surinamese origin have the highest level of education, viz. a university level (WO). The Pearson Chi-Square rate in this case appears to be 0.122 (see Table 3). We may conclude that the migrant entrepreneurs do not differ significantly from each other in the case of their education level.
Besides, also the country of birth of the entrepreneurs is examined. 26 entrepreneurs of Turkish origin were born in Turkey, while this variable appeared to be 13 for the entrepreneurs of Moroccan origin, who were born in Morocco. Among the Surinamese entrepreneurs 12 persons were born in Surinam. The Pearson Chi-Square rate in this case amounts to 0.0001 (see Table 3), which indicates that there is a significant difference between the groups in case of their birth place.
Furthermore, a comparison was made between the sample groups in case of marital status and children. From Figure 4, we can conclude that most respondents of Turkish origin were married (26.5%). Most of the Moroccan and Surinamese entrepreneurs were unmarried, viz. 15.7% and 18.1 %, respectively. The Pearson Chi-Square rate in this case amounts 0.024 (see Table 3), which indicates that there is a significant difference between the groups regarding their marital status. In Figure 5, we can see that most of the Turkish entrepreneurs have 2 children, while most Moroccan and Surinamese entrepreneurs do not have children. This could be caused by their marital status. The Pearson Chi-Square rate in this case is 0.038
Table 4: Gender Distribution of Migrant Entrepreneurs
Ethnic Origin x Gender = Cross Tabulation
29 20 19 68
34,9% 24,1% 22,9% 81,9% 6 5 4 15
7,2% 6,0% 4,8% 18,1%
35 25 23 83
42,2% 30,1% 27,7% 100,0%
Count
% of Total
Count
% of Total
Count
% of Total
MALE
FEMALE
Gender
Total
TR MR SR
Ethnic origin
Total
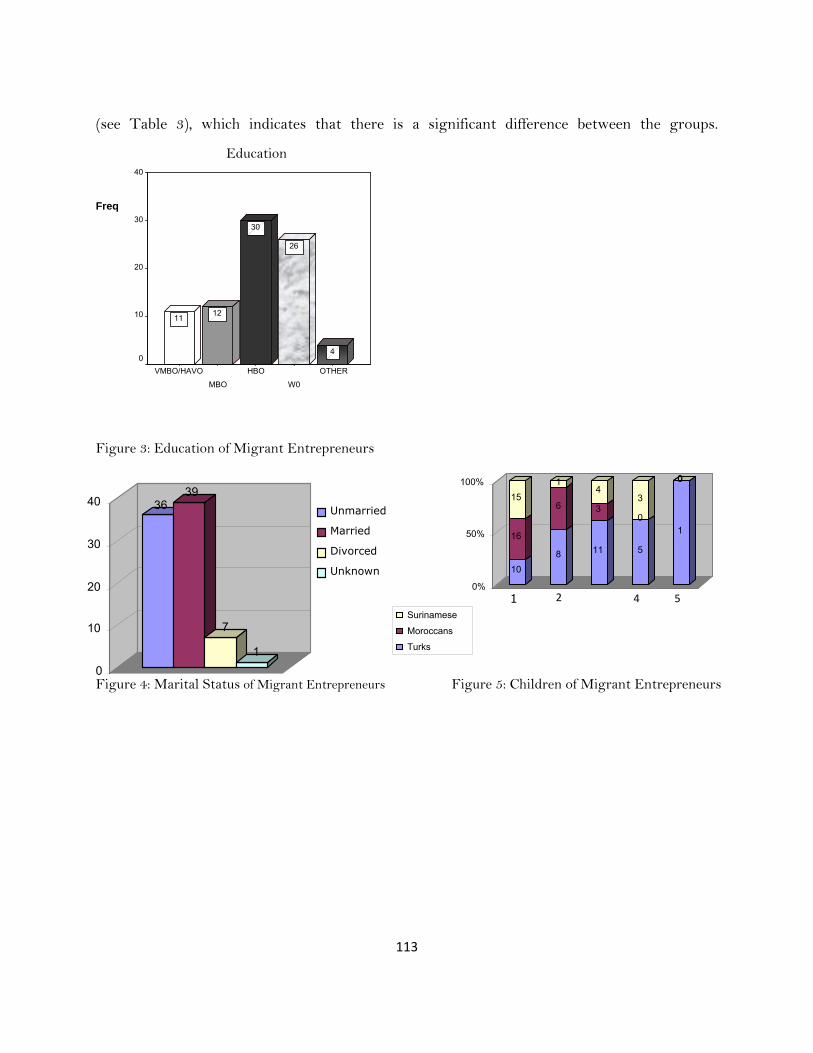
113
(see Table 3), which indicates that there is a significant difference between the groups.
Figure 3: Education of Migrant Entrepreneurs
Figure 4: Marital Status of Migrant Entrepreneurs Figure 5: Children of Migrant Entrepreneurs
Education
OTHER
W0 HBO
MBO
VMBO/HAVO
Freq
40
30
20
10
04
26
30
12 11
36 39
7
1
0
10
20
30
40 Unmarried
Married
Divorced
Unknown 10
16
15
8
6
1
11
3
4
5
0
3
1
00
0%
50%
100%
2
1 4 5
Surinamese
Moroccans
Turks
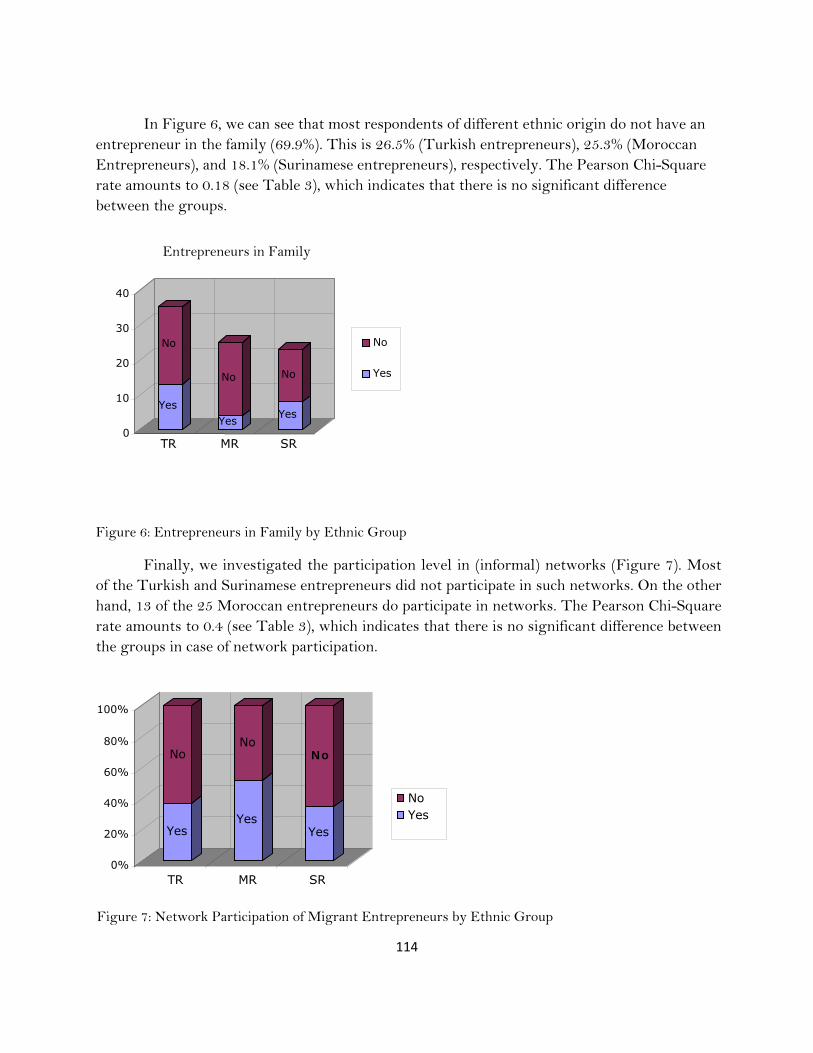
114
In Figure 6, we can see that most respondents of different ethnic origin do not have an entrepreneur in the family (69.9%). This is 26.5% (Turkish entrepreneurs), 25.3% (Moroccan Entrepreneurs), and 18.1% (Surinamese entrepreneurs), respectively. The Pearson Chi-Square rate amounts to 0.18 (see Table 3), which indicates that there is no significant difference between the groups.
Figure 6: Entrepreneurs in Family by Ethnic Group
Finally, we investigated the participation level in (informal) networks (Figure 7). Most of the Turkish and Surinamese entrepreneurs did not participate in such networks. On the other hand, 13 of the 25 Moroccan entrepreneurs do participate in networks. The Pearson Chi-Square rate amounts to 0.4 (see Table 3), which indicates that there is no significant difference between the groups in case of network participation.
Entrepreneurs in Family
Yes
No
Yes
No
Yes
No
0
10
20
30
40
No
Yes
TR MR SR
Yes
No
Yes
No
Yes
No
0%
20%
40%
60%
80%
100%
TR MR SR
NoYes
Figure 7: Network Participation of Migrant Entrepreneurs by Ethnic Group
115
Our research is quantitative in nature and is based on survey questionnaires handed out to the respondents. The research questionnaire included open-ended and closed questions to collect the needed information. It comprised five sections and was designed to encapsulate personal features, business characteristics, entrepreneurial behaviour, participation in social networks and business performance of each respondent. The respondents are segmented in our research according to their ethnic origin, viz. Turkish, Moroccan, and Surinamese origin. Their ethnic origin is confirmed by the country of birth of the parents, as well as the respondent him or herself.
The first part starts with general demographic characteristics of the respondents, such as: (i) ethnic origin (in this case the option is Turkish, Moroccan, or Surinamese); (ii) age; (iii) education level (this option can vary between secondary education, higher education, university or something else); (iv) country of birth of the parents and the respondent (this is in order to classify to which generation of migrants the respondent belongs); (v) whether there is an entrepreneur in the family (this is in order to find out to what extent this option may influence the entrepreneurial attitude of a person); and (vi) besides these questions in general, the respondents were tested on personal characteristics based on three attributes commonly attributed to entrepreneurs (see Table 5).
Next, we can examine the profile composed of the main constructs: personal characteristics variable (PC.AVE), business characteristics (BC.AVE), and business performance (BP.AVE). The independent PC.AVE is constructed from 15 items about the need for achievement, locus of control, and risk-taking propensity. This variable consists of 15 items taken primarily from the E-Scan of Driessen and Zwart (2004). These characteristics are used in this study, because they were the most frequently investigated and cited characteristics of the entrepreneur found in the reviewed entrepreneurship literature, and they shown a significant relation to entrepreneurship across several studied (Carland and Carland, 1993; Hansemark, 1998; Johnson, 1990).
The independent variable BC.AVE is constructed from11 items about business experience, branch experience, innovation, total number of people working in the enterprise, funding, and items about the strategy of the business. The 15 and 11 items are each recomputed to one variable. During the development of the main constructs we performed a reliability analysis to investigate if we could use the constructs for further analysis. We measured these items by means of Cronbach’s alpha and used a value of 0.6 or higher. The Cronbach’s alpha for both items were sufficient to use for further research for the influence on business performance of migrant entrepreneurs.
Finally, the construct BP.AVE is based on objective and subjective business performance, which is linked to success. The objective criteria refer to market share, turnover, and profitability (e.g., net and gross profit). The subjective criteria refer to the entrepreneur’s opinion about the successfulness in his/her business and the satisfaction about the achieved results and business performance. Besides these variables we included also internal and external success factors, such as productivity, costs, stability, growth, business culture, reliability,
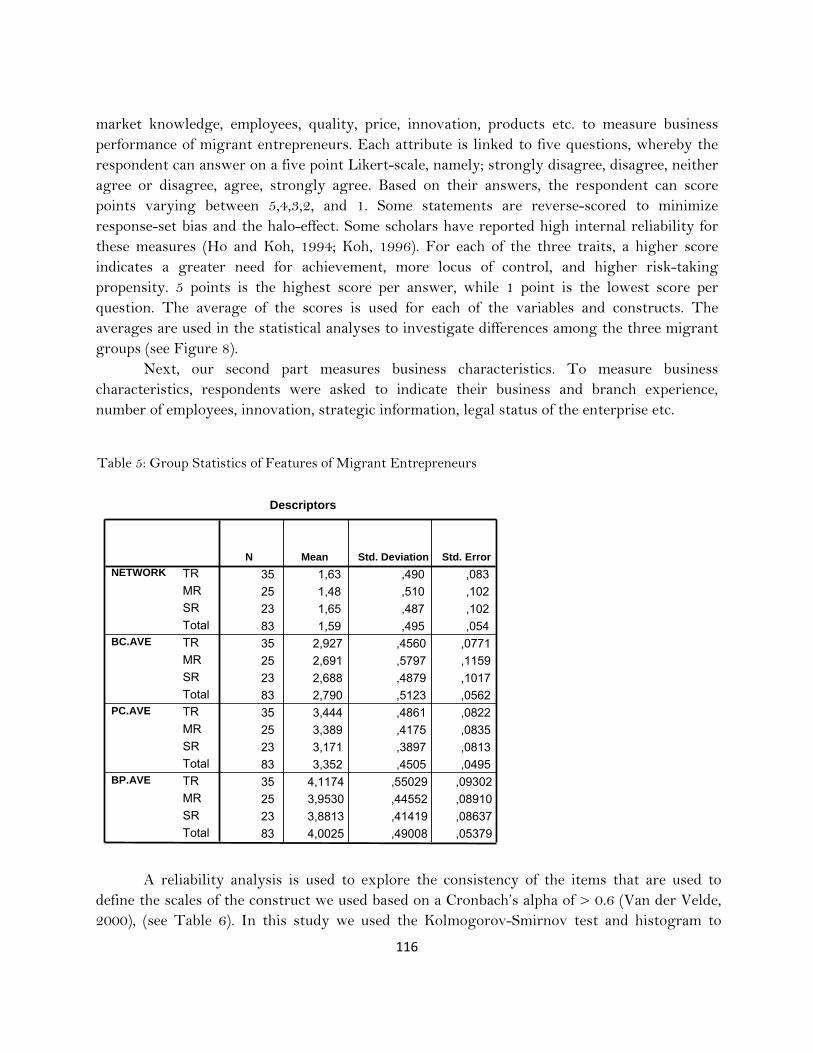
116
market knowledge, employees, quality, price, innovation, products etc. to measure business performance of migrant entrepreneurs. Each attribute is linked to five questions, whereby the respondent can answer on a five point Likert-scale, namely; strongly disagree, disagree, neither agree or disagree, agree, strongly agree. Based on their answers, the respondent can score points varying between 5,4,3,2, and 1. Some statements are reverse-scored to minimize response-set bias and the halo-effect. Some scholars have reported high internal reliability for these measures (Ho and Koh, 1994; Koh, 1996). For each of the three traits, a higher score indicates a greater need for achievement, more locus of control, and higher risk-taking propensity. 5 points is the highest score per answer, while 1 point is the lowest score per question. The average of the scores is used for each of the variables and constructs. The averages are used in the statistical analyses to investigate differences among the three migrant groups (see Figure 8).
Next, our second part measures business characteristics. To measure business characteristics, respondents were asked to indicate their business and branch experience, number of employees, innovation, strategic information, legal status of the enterprise etc.
A reliability analysis is used to explore the consistency of the items that are used to define the scales of the construct we used based on a Cronbach’s alpha of > 0.6 (Van der Velde, 2000), (see Table 6). In this study we used the Kolmogorov-Smirnov test and histogram to
Table 5: Group Statistics of Features of Migrant Entrepreneurs
Descriptors
35 1,63 ,490 ,083
25 1,48 ,510 ,102
23 1,65 ,487 ,102
83 1,59 ,495 ,054
35 2,927 ,4560 ,0771
25 2,691 ,5797 ,1159
23 2,688 ,4879 ,1017
83 2,790 ,5123 ,0562
35 3,444 ,4861 ,0822
25 3,389 ,4175 ,0835
23 3,171 ,3897 ,0813
83 3,352 ,4505 ,0495
35 4,1174 ,55029 ,09302
25 3,9530 ,44552 ,08910
23 3,8813 ,41419 ,08637
83 4,0025 ,49008 ,05379
TR
MR
SR Total TR
MR
SR Total TR
MR
SR Total TR
MR
SR Total
NETWORK
BC.AVE
PC.AVE
BP.AVE
N Mean Std. Deviation Std. Error
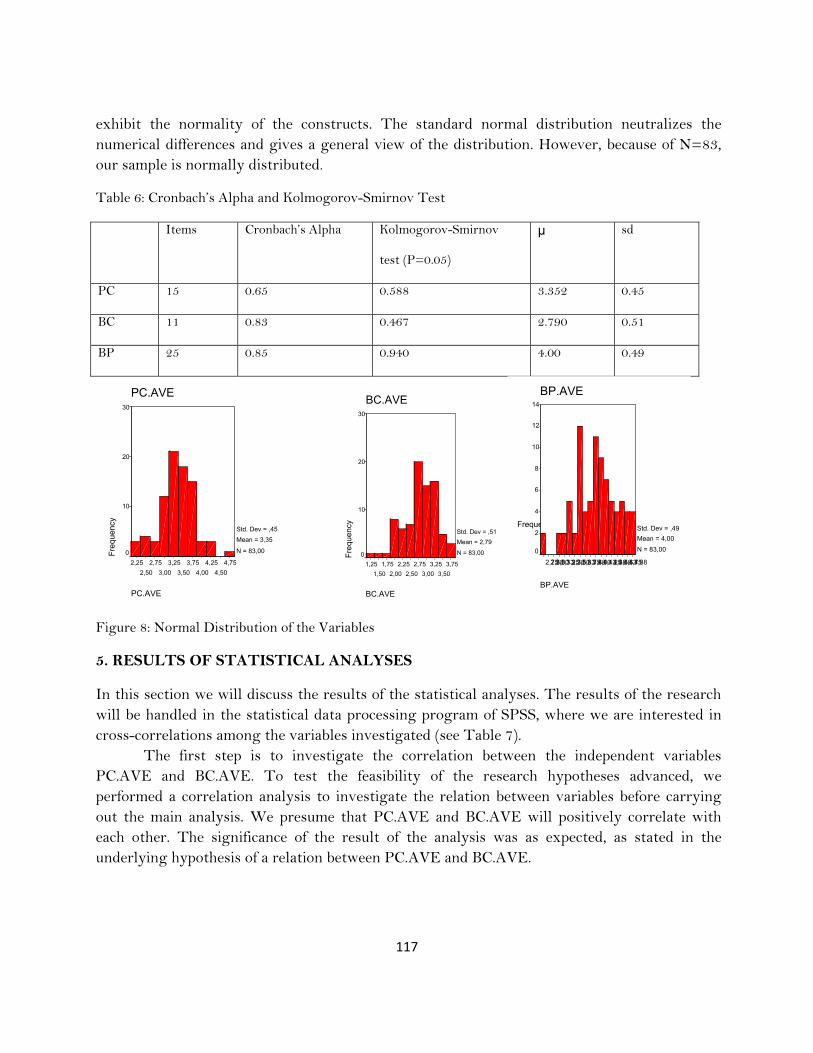
117
exhibit the normality of the constructs. The standard normal distribution neutralizes the numerical differences and gives a general view of the distribution. However, because of N=83, our sample is normally distributed.
Table 6: Cronbach’s Alpha and Kolmogorov-Smirnov Test
Items Cronbach’s Alpha Kolmogorov-Smirnov
test (P=0.05)
μ sd
PC 15 0.65 0.588 3.352 0.45
BC 11 0.83 0.467 2.790 0.51
BP 25 0.85 0.940 4.00 0.49
PC.AVE
4,75
4,50
4,25
4,00
3,75
3,50
3,25
3,00
2,75
2,50
2,25
PC.AVE
Fre
quen
cy
30
20
10
0
Std. Dev = ,45
Mean = 3,35
N = 83,00
BC.AVE
3,75
3,50
3,25
3,00
2,75
2,50
2,25
2,00
1,75
1,50
1,25
BC.AVE
Fre
qu
en
cy
30
20
10
0
Std. Dev = ,51
Mean = 2,79
N = 83,00
Figure 8: Normal Distribution of the Variables
5. RESULTS OF STATISTICAL ANALYSES
In this section we will discuss the results of the statistical analyses. The results of the research will be handled in the statistical data processing program of SPSS, where we are interested in cross-correlations among the variables investigated (see Table 7).
The first step is to investigate the correlation between the independent variables PC.AVE and BC.AVE. To test the feasibility of the research hypotheses advanced, we performed a correlation analysis to investigate the relation between variables before carrying out the main analysis. We presume that PC.AVE and BC.AVE will positively correlate with each other. The significance of the result of the analysis was as expected, as stated in the underlying hypothesis of a relation between PC.AVE and BC.AVE.
BP.AVE
4,88 4,75 4,634,504,384,254,13 4,00 3,88 3,753,633,50 3,38 3,25 3,13 3,002,882,75
BP.AVE
Frequency
14
12
10
8
6
4
2
0
Std. Dev = ,49
Mean = 4,00
N = 83,00

118
We observed a significant positive, but weak correlation between PC.AVE and BC.AVE (0.072). There was no observed significant correlation with the social network participation.
To estimates the strength of a modeled relationship between the independent variables
PC.AVE and BC.AVE, and the dependent variable BP.AVE a regression analysis is constructed. The regression analysis results for the effect of PC and BC on BP indicate that there is a positive relationship between these constructs. This means that if the migrant entrepreneur has the appropriate personal and business characteristics, they will also have a higher score on business performance. Besides these positive relationships, the variable network participation has no positive or negative influence on BP. To confirm the goodness of fit of this analysis of the model and the statistical significance of the estimated parameters we include the R-square values. This is the proportion of variability in a data set that is accounted for by a statistical model (see Table 8). R-square increases as we increase the number of variables in the mode (R-square will not decrease), so is also important to look for adjusted R-square. The adjusted R-Square penalizes R-square by the number of variables used in the model. Finally, R2 is often interpreted as the proportion of response variation "explained" by the regressors in the model. Thus, in this case the R2 value indicates approximately 35 percent of the variation in the response variable can be explained by the variable.
Table 7: Correlation of the Independent Variables
1 ,198 ,538 ** -,077,072 ,000 ,488
83 83 83 83,198 1 ,322 ** -,097,072 ,003 ,383
83 83 83 83,538 ** ,322 ** 1 -,028,000 ,003 ,801
83 83 83 83-,077 -,097 -,028 1 ,488 ,383 ,801
83 83 83 83
Pearson CorrelationSig. (2-tailed)N Pearson CorrelationSig. (2-tailed)N Pearson CorrelationSig. (2-tailed)N Pearson CorrelationSig. (2-tailed)N
BC.AVE
PC.AVE
BP.AVE
NETWORK
BC.AVE PC.AVE BP.AVE NETWORK
Correlation is significant at the 0.01 level (2-tailed).**.
Table 8: R-Square and the Adjusted R-Square; Statistical Model
,581 a ,337 ,321 ,40386
Model1
R R SquareAdjustedR Square
Std. Error ofthe Estimate
Predictors: (Constant), PC.AVE, BC.AVEa.
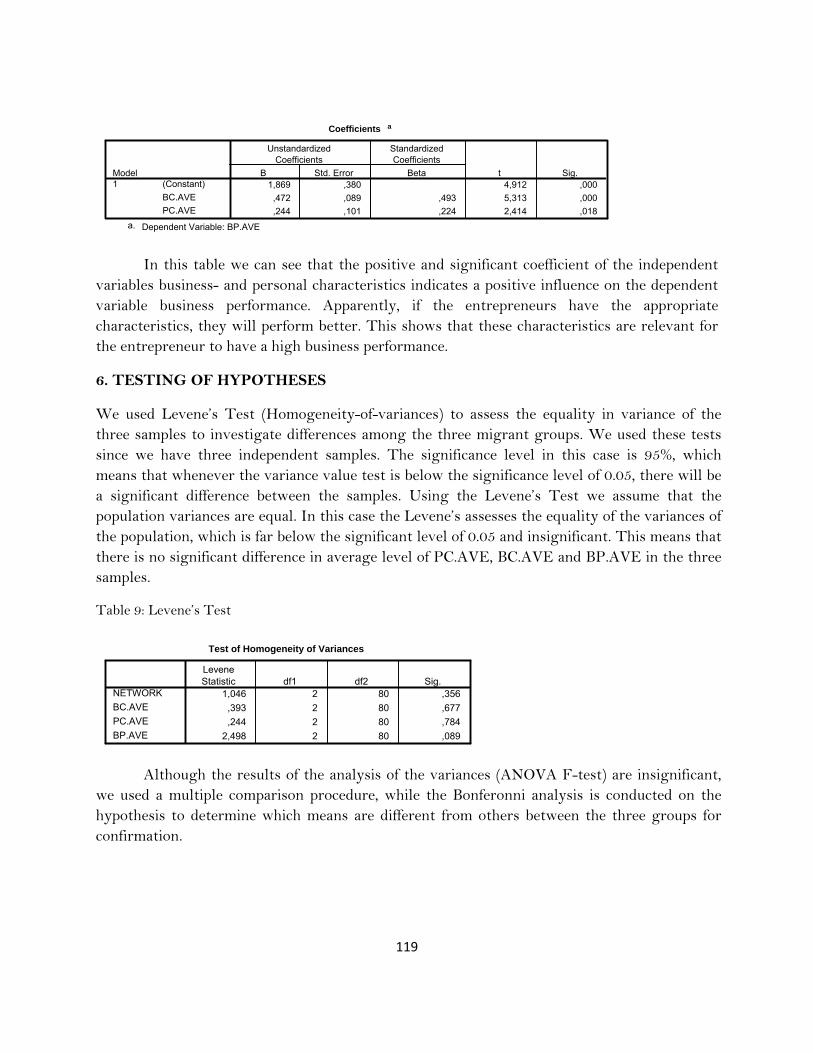
119
Coefficients a
1,869 ,380 4,912 ,000
,472 ,089 ,493 5,313 ,000
,244 ,101 ,224 2,414 ,018
(Constant)
BC.AVE
PC.AVE
Model1
B Std. Error
UnstandardizedCoefficients
Beta
StandardizedCoefficients
t Sig.
Dependent Variable: BP.AVEa.
In this table we can see that the positive and significant coefficient of the independent variables business- and personal characteristics indicates a positive influence on the dependent variable business performance. Apparently, if the entrepreneurs have the appropriate characteristics, they will perform better. This shows that these characteristics are relevant for the entrepreneur to have a high business performance.
6. TESTING OF HYPOTHESES
We used Levene’s Test (Homogeneity-of-variances) to assess the equality in variance of the three samples to investigate differences among the three migrant groups. We used these tests since we have three independent samples. The significance level in this case is 95%, which means that whenever the variance value test is below the significance level of 0.05, there will be a significant difference between the samples. Using the Levene’s Test we assume that the population variances are equal. In this case the Levene’s assesses the equality of the variances of the population, which is far below the significant level of 0.05 and insignificant. This means that there is no significant difference in average level of PC.AVE, BC.AVE and BP.AVE in the three samples.
Table 9: Levene’s Test
Test of Homogeneity of Variances
1,046 2 80 ,356
,393 2 80 ,677
,244 2 80 ,784
2,498 2 80 ,089
NETWORK
BC.AVE
PC.AVE
BP.AVE
LeveneStatistic df1 df2 Sig.
Although the results of the analysis of the variances (ANOVA F-test) are insignificant, we used a multiple comparison procedure, while the Bonferonni analysis is conducted on the hypothesis to determine which means are different from others between the three groups for confirmation.

120
Hypothesis 1 H1: There is a significant relationship between personal and business characteristics, and participation in (in)formal networks and business performance.
Based on the regression analysis we can conclude that there is a significant relationship between the construct PC.AVE, BC.AVE and BP.AVE. Hypothesis 2 H1: Turkish entrepreneurs have a higher score on personal characteristics than
Moroccan and Surinamese entrepreneurs. This hypothesis is represented by the construct PC.AVE. The significance level accounts 0.71. This is far beyond the significance level of 0.05. We can conclude that there is no significant difference in average level of PC between the samples. The Turkish entrepreneurs do not show a higher score on personal characteristics than the other two groups of entrepreneurs. Hypothesis 3 H1: Turkish entrepreneurs have a higher score on business characteristics than
Moroccan and Surinamese entrepreneurs. This hypothesis is represented by the construct BC.AVE. The significance level accounts 0.232. This is far beyond the significance level of 0.05. We can conclude that there is no significant difference in average level BC between the samples. The Turkish entrepreneurs do not show a higher score on business characteristics than Moroccan and Surinamese entrepreneurs. Hypothesis 4 H1: Turkish entrepreneurs have a higher participation rate in social networks
than Moroccan and Surinamese entrepreneurs. The significant level accounts far beyond the significance level of 0.05. We can conclude that there is no significant difference in participation in social networks rate between the three samples. The Turkish entrepreneurs do not show a higher score participation rate in social networks than Moroccan and Surinamese entrepreneurs.
Hypothesis 5 H1: Turkish entrepreneurs have a higher level of business performance than Moroccan and Surinamese entrepreneurs.
This hypothesis is represented by the construct of BP.AVE. The significance level accounts 0.127, which is far beyond the significance level of 0.05. Finally, we can conclude that there is no significant difference between the samples. The Turkish do not show a higher score business performance than Moroccan and Surinamese entrepreneurs.
From these data we can see that there is no significance difference between the attitudinal entrepreneurial features in the three samples of entrepreneurs from Turkish, Moroccan and Surinamese ethnic origin on none of the three variables.
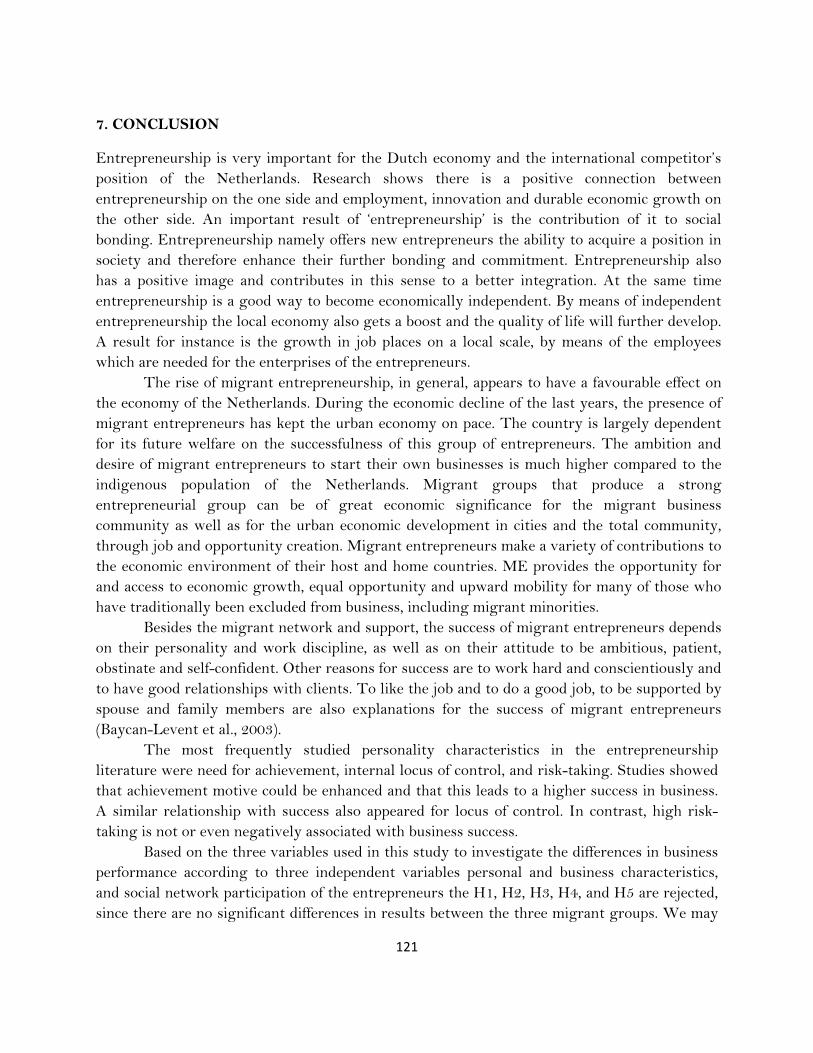
121
7. CONCLUSION
Entrepreneurship is very important for the Dutch economy and the international competitor’s position of the Netherlands. Research shows there is a positive connection between entrepreneurship on the one side and employment, innovation and durable economic growth on the other side. An important result of ‘entrepreneurship’ is the contribution of it to social bonding. Entrepreneurship namely offers new entrepreneurs the ability to acquire a position in society and therefore enhance their further bonding and commitment. Entrepreneurship also has a positive image and contributes in this sense to a better integration. At the same time entrepreneurship is a good way to become economically independent. By means of independent entrepreneurship the local economy also gets a boost and the quality of life will further develop. A result for instance is the growth in job places on a local scale, by means of the employees which are needed for the enterprises of the entrepreneurs.
The rise of migrant entrepreneurship, in general, appears to have a favourable effect on the economy of the Netherlands. During the economic decline of the last years, the presence of migrant entrepreneurs has kept the urban economy on pace. The country is largely dependent for its future welfare on the successfulness of this group of entrepreneurs. The ambition and desire of migrant entrepreneurs to start their own businesses is much higher compared to the indigenous population of the Netherlands. Migrant groups that produce a strong entrepreneurial group can be of great economic significance for the migrant business community as well as for the urban economic development in cities and the total community, through job and opportunity creation. Migrant entrepreneurs make a variety of contributions to the economic environment of their host and home countries. ME provides the opportunity for and access to economic growth, equal opportunity and upward mobility for many of those who have traditionally been excluded from business, including migrant minorities.
Besides the migrant network and support, the success of migrant entrepreneurs depends on their personality and work discipline, as well as on their attitude to be ambitious, patient, obstinate and self-confident. Other reasons for success are to work hard and conscientiously and to have good relationships with clients. To like the job and to do a good job, to be supported by spouse and family members are also explanations for the success of migrant entrepreneurs (Baycan-Levent et al., 2003).
The most frequently studied personality characteristics in the entrepreneurship literature were need for achievement, internal locus of control, and risk-taking. Studies showed that achievement motive could be enhanced and that this leads to a higher success in business. A similar relationship with success also appeared for locus of control. In contrast, high risk-taking is not or even negatively associated with business success.
Based on the three variables used in this study to investigate the differences in business performance according to three independent variables personal and business characteristics, and social network participation of the entrepreneurs the H1, H2, H3, H4, and H5 are rejected, since there are no significant differences in results between the three migrant groups. We may
122
therefore assume that although the Turkish entrepreneurs form the biggest entrepreneurial group, they may not be the strongest entrepreneurial group, since the different migrant groups did not significantly differ from each other when considering their level of business performance and entrepreneurial characteristics.
The data for testing the above hypotheses were drawn from a sample of migrant-owned businesses in Amsterdam. This sampling frame was constructed from multiple sources: CBS, KvK and an own survey. Our database contains information on three migrant groups; Turks, Moroccans and Surinamese. The big cities in the Netherlands have a rich variety of migrant entrepreneurs. A significant part of these migrant enterprises and entrepreneurs are situated in the four main cities of the Netherlands, Amsterdam, Rotterdam, The Hague and Utrecht. Nowadays, an increasing group of migrants become more and more entrepreneurial and they do not seek anymore for a paid job in the labour market. Based on the statistical analysis and the rejected hypotheses it can be seen that the Turkish entrepreneurs do not have higher score on business performance with respect to the Moroccan and Surinamese entrepreneurs. This means that there are no significant differences in business performance between the migrant entrepreneurs in business performance in the service sector in the city of Amsterdam, that can be explained by their personal and business characteristics and their participation in (in)formal network support systems. Thus, in conclusion it can be said that since the Turkish entrepreneurs are the biggest entrepreneurial group, we would assume that there are also score higher on the level of their business performance. However, this is not the case. The results from our research on risks and ethnic entrepreneurs are mixed, but apparently the knowledge and situational characteristics are a more important determinant of risk-taking than personality (Carter and Jones-Evans, 2006). In this study we included locus of control in the construct of personal characteristics to investigate the influence on business performance. But, in organizational psychology, the concept and measurement of locus of control has been heavily criticized (Furnham and Steele, 1993). According to some scholars the locus of control is a concept which should probably not be included in future empirical research on entrepreneurial behaviour.
References
Aldrich, H.E. 1989. Networking among Women Entrepreneurs, in O. Hagen, C. Rivchum and D. Sexton (eds.), Women Owned Businesses, New York: Praeger, 103-132.
Aldrich, H.E. and C. Zimmer. 1986. Entrepreneurship through Social Networks, in D.L. Sexton and R.W. Wilson (eds.), The Art and Science of Entrepreneurship, Mass: Ballinger, 154-167.
Audretsch, D.B. 2002. “Entrepreneurship: A Survey of the Literature”, Prepared for the European Commission, Enterprise Directorate General, Brussels, July.
123
Baycan-Levent, T., E. Masurel and P. Nijkamp. 2003. “Diversity in Entrepreneurship: Migrant and Female Roles in Urban Economic Life”. International Journal of Social Economics. 30: 1131-1161.
Birley, S. 1985. “The Role of Networks in the Entrepreneurial Process”, Journal of Business Venturing, 1: 107-117.
Basu, A. 1998. “An Exploration of Entrepreneurial Activity among Asian Small Business in Britain”. Small Business Economics. 10: 313-326.
Bates, T. 1997. “ Race, Self-Employment and Upward Mobility”, Johns Hopkins University Press, Baltimore. 25-48.
Boone, C., B. Brabander and A. Van Witteloostuijn. 1996. “CEO Locus of Control and Small Firm Performance: An Integrative Framework and Empirical Test”, Journal of Management Studies, 33: 667-699.
Brockhaus, R.H. 1982. The Psychology of the entrepreneur, in C.A. Kent, D.L. Sexton and K.L. Vesper (eds.), Encyclopedia of Entrepreneurship, Englewoods Cliffs, NJ: Prentice-Hall.
Brown, B. and J.E. Butler. 1995. “Competitors as Allies: A Study of the Entrepreneurial Networks in the US Wine Industry”, Journal of Small Business Management, 33(3): 57-66.
Brush, C.G. 1992. “Research on Women Business Owners: Past Trends, a New Perspective and Future Directions”. Entrepreneurship Theory and Practice. 16: 5-30.
Brush, C.G. and P.A. Vanderwerf. 1992. “A Comparison of Methods and Sources for Obtaining Estimates of New Venture Performance”. Journal of Business Venturing. 7 (3):157-170.
Butler, J.S. 1991. “Entrepreneurship and Self-help among Black Americans: A Reconsiderations of Race and Ethnicity”, New York: State University of New York Press.
Butler, J.S. and P.G. Greene.1997. “Ethnic Entrepreneurship: the continuous rebirth of American Entrepreneurship”, in Entrepreneurship 2000 Eds D L Sexton, R.W. Smilor (Upstart Publishing, Chicago, IL) 267-289.
Carland, J. and J.C. Carland. 1993. “The Role of Personality in New Venture Creation”. Entrepreneurship, Innovation and Change. 2(2): 129-140.
Carson, D., S. Cromie, P. McGowan and J. Hill.1995. Marketing and Entrepreneurship in SMEs: AnInnovative Approach. Prentice Hall International.
Carter and Jones. 2006. “Enterprise and Small Business, Principles, Practice and Policy”. 2nd edition, Prentice Hall, Edinburgh Gate, Harlow.

124
Carter, S. and P. Rose. 1998. “The Financing of Male-and Female-Owned Businesses”, Entrepreneurship and Regional Development,10 (3): 225-241.
Chaston, I. 1995. Small Firm Growth through the Creation of Value-added Networks, Proceedings of the 18th ISBA National Small Firms Policy and Research Conference, Paisley, 45-57.
CEEDR. 2000. “Young Entrepreneurs, Women Entrepreneurs, Ethnic Minority Entrepreneurs and Co–Entrepreneurs in the European Union and Central and Eastern Europe”, Final Report to the European Commission, DG Enterprise, Centre for Enterprise and Economic Development Research (CEEDR) Middlesex University Business School, UK.
Chell, E., and J.M. Haworth. 1992. “A Typology of Business Owners and Their Orientation Towards Growth”, In. K. Caley, E. Chell, F. Crittenden and C. Mason (eds.), Small Enterprise Development. Policy and Practice in Action, 96-105, Paul Chapman Publishing, London.
Chaganti, R. and P.G. Greene. 2000 “Who are Migrant Entrepreneurs? A Study of Entrepreneurs’ Migrant Involvement and Business Characteristics”. Journal of Small Business Management. 40: 126-143.
Choenni, A. 1997. Veelsoortig Assortiment, Amsterdam: Het Spinhuis.-273.
Clark, K. and S. Drinkwater. 1998. “Ethnicity and Self-Employment in Britain”. Oxford Bulletin of Economies and Statistics. 60: 383-407.
Conway, S. 1997. Informal Networks of Relationships in Successful Small Firm Innovation, in D. Jones-Evans and M. Klofsten (eds.). Technology, Innovation and Enterprise: The European Experience, MacMillan, 236-271.
Daly, M. 1991. “The 1980s, A Decade of Growth in Enterprise”, Employment Gazette, March, 109-134.
Das, T.K., and B.S. Teng. 1997. “Time and Entrepreneurial Risk Behavior”, Entrepreneurship Theory and Practice, 22(2): 69-88.
Davidsson, P. 1995. “Determinants of Entrepreneurial Intentions”, Paper presented at the Rent IX Conference, Piacenza, Italy.
Deakins, D. 1999. “Entrepreneurship and Small Firms”, 2nd edition, McGrawHill: London.
Deakins, D. Majmudar, M. & Paddison, A. 1997. “Developing Success Strategies for Ethnic Minorities in Business: Evidence from Scotland”. New Community. 23 (3): 325-342
Delaney, J.T., and Huselid, M.A. 1996. The Impact of Human Resource Management Practices on Perceptions of Organizational Performance. Academy of Management Journal. 39(4): 949-969.

125
Evangelista, F.U. 1994. “Export Performance and its Determinants: Some Empirical Evidence from Australian Manufacturing Firms”. Advances in International Marketing. 6: 207.
Freel, M. 2000. “External Linkages and Product Innovation in Small Manufacturing Firms”. Entrepreneurship and Regional Development. 12: 245-266
Gibson, D. 1991. “Technology Companies and Global Markets: Programs, Policies and Strategies to Accelerate Innovation and Entrepreneurship”. Rowan and Littlefield.
Gilad, B. and P. Levine. 1986. “A Behavior Model of Entrepreneurial Supply”. Journal of Small Business Management. 24: 45-51.
Hansemark, O. 1998. “The Effects of an Entrepreneurship Programme on Need for Achievement and Locus of Control of Reinforcement”. International Journal of Entrepreneurial Behaviour and Research. 4(1): 28-50.
Hartenian, L.S. and D.E. Gudmundson. 2000. “Cultural Diversity in Small Business: Implications for Firm Performance”. Journal of Development Entrepreneurship. 5(3): 209.
Hendrickx, L., C. Vlek and H. Calje. 1992. “Effects of Frequency and Scenario Information on the Evaluation of Large-Risks”. Organizational Behaviour and Human Decision Processes. 52: 256-275.
Ho, T.S. and H.C. Koh. 1992. “Differences in Psychological Characteristics between Entrepreneurially Inclined and Non-entrepreneurially Inclined Accounting Graduates in Singapore”. Entrepreneurship, Innovation and Change: An International Journal. 1: 243-54.
Hornaday, J. and J. Aboud. 1971. “Characteristics of Successful Entrepreneurs”. Personnel Psychology. 24: 141-153.
Jenkins S.P. “Winners and Losers: A Portrait of the UK Income Distribution of Swansea Department of Economics”. Discussion Paper. No 94-97. Johannisson, B. and R. Peterson. 1984. “The Personal Networks of Entrepreneurs”, paper presented at the Third Canadian Conference of the International Council for Small Business, Toronto, 23-25 May.
Johnson, B.R. 1990. “Toward a Multidimensional Model of Entrepreneurship: The Case of Achievement Motivation and the Entrepreneur”. Entrepreneurship Theory and Practice. pp. 39-54.
Katsikeas, C.S., N.F. Piercy and C. Ioannidis. 1996. “Determinants of Export Performance in a European Context”. European Journal of Marketing. 30(6): 6.

126
Kent, C., Sexton, D. & Vesper K. (Eds.). 1982. The Encyclopedia of Entrepreneurship. Prentice Hall, Engelewood Cliffs.
Kloosterman, R. 1999. ‘Immigrant Entrepreneurship and the Institutional Context. A Theoretical Exploration’, in J. Rath (ed.), Immigrant Businesses. An Exploration of their Embeddedness in the Economic, Politico-Institutional and Social Environment. Houndmills, Basingstoke, Hampshire: Macmillan Press. (Forthcoming).
Kloosterman, R. 1998. “Immigrant Entrepreneurship and the Welfare State”, (in: J. Rath (ed.), Immigrant Businesses on the Urban Economic Fringe. A Case for Interdisciplinary Analysis). Houndmills, Basingstoke, Hampshire: Macmillan Press.
Kloosterman, R., J. van der Leun and J. Rath. 1998. “Across the Border: Immigrants’ Economic Opportunities, Social Capital and Informal Business Activities”. Journal of Migrant and Migration Studies. 4: 249-268.
Koh, A.C. and R.A. Robicheaux. 1988. “Variatons in Export Performance due to Differences in Export Marketing Strategy: Implications for Industrial Marketers”. Journal of Business Research. 17 (3): 249.
Kotey, B. and. Meredith, G.G. 1997. Relationship among Owner/manager Personal Values and Perceptions, Business Strategies, and Enterprise Performance. Journal of Small Business Management. 35 (2): 37-64.
Lee, Y., T. Cameroen, P. Schaeffer and C.G. Schmidt. 1997. “Migrant Minority Small Business: A Comparative Analysis of Restaurants in Denver”. Urban Geography. 18: 591-621.
Levenson, H. 1974. “Activism and Powerful Others: Distinctions within the Concept of Internal-external Locus of Control, Journal of Personality Assessment, 33: 377-383.
Liles, P.R. 1974. “New Business Ventures and the Entrepreneur”, Richard D. Irwin, Homewood, IL.
Littunen, H. 2000. “Entrepreneurship and The Characteristics of the Entrepreneurial Personality”. International Journal of Entrepreneurial Behaviour & Research. 6(6): 295-309.
Low, M.B. and MacMillan, I.C. 1980. “Entrepreneurship: Post Research and Future Challengs”. Journal of Management. 14 (2): 139-161.
Lumpkin, G.T., & B. Erdogan. 1999. “If Not Entrepreneurship, Can Psychological Characteristics Predict Entrepreneurial Orientation?—A Pilot Study.” Working paper, University of Illinios at Chicago, Chicago, IL.
127
Madsen, T.K. 1987. “Empirical Export Performance studies: A Review of Conceptualisations and Findings”. Advanced in International Marketing. 2: 177-198.
Marlow, S. 1992. “The Take-up of Business Growth Training Schemes by Ethnic Minority-owned Firms in Britain”. International Small Business Journal. 10 (4): 34-47.
Masurel, E., P. Nijkamp, M. Tastan and G. Vindigni. 2002. “Motivations and Performance Conditions for Migrant Entrepreneurship”. Growth & Change. 33: 238-260.
Matthyssens, P. and P. Pauwels. 1996. “Assessing Export Performance Measurement”. Advances in International Marketing. 8: 85.
McClelland, D.C. 1961. “The Achieving Society”, Van Nostrand, New York, NY.
McClelland D.C. and D.G. Winter. 1971. Motivating Economic Achievement, Free Press, New York.
Metcalfe, H., T. Modood and S. Virdee. 1996. “Asian Self-Employment; The Interaction of Culture and Economics in England”, London: Policy Studies Institute.
Mill, J.S. 1984. “Principles of Political Economy with Some Applications to Social Philosophy”, John W. Parker, London.
Miner, J.B., N.R. Smith and J.S. Bracker. 1989. “Role of Entrepreneurial Task Motivation in the Growth of Technologically Innovative Firms”. Journal of Applied Psychology. 74 (4): 554-560.
Mitter, S. 1986. Industrial Restructuring and Manufacturing Homework. Capital and Class. 27: 37-80.
Murphy, G.B., J.W. Trailer and R.C. Hill. 1996. “Measuring Performance in Entrepreneurship Research”. Journal of Business Research. 36: 15-23.
Palmer, M. 1971. “The application of psychological testing to entrepreneurial potential”. California Management Review. 13: 32-38.
Postma, Th.J.B.M. and Zwart, P.S. 2001. Strategic Research and Performance of SMEs. Journal of Small Business Strategy.12 (2): 52-64.
Ram, M. 1994. “Managing to Survive: Working Lives in Small Firms”, Oxford: Blackwell.
Ram, M., D. Smallbone. 2001. “Ethnic Minority Enterprise: Policy in Practice”,. Final Report prepared for the Small Business Service, June 2001.
Rauch, A. and M. Frese. 2000. “Psychological Approaches to Entrepreneurial Success: A General Model and an Overview of Findings”, In: Cooper C.L. and I.T. Robertson (eds.)
128
International Review of Industrial and Organizational Psychology, 2000. Wiley, Chichester, UK, 104-141.
Raven, P.V., J.M. McCullough and P.S. Tansuhaj. 1994. “Environmental Influences and Decision-making Uncertainty in Export Channels: Effects on Satisfaction and Performance”, Journal of International Marketing, 2 (3): 37.
Rotter, J.B. 1966. “Generalized Expectancies for Internal versus External Locus of Control of Reinforcement”. Psychological Monographs: General and Applied, Serial Number 609, 80: 1-28.
Rothwell, R. 1991. “External Networking and Innovation in Small and Medium- Sized Manufacturing Firms in Europe“. Technovation, 11(2): 93-111.
Saffu, K. 2003. “The Bole and Impact of Culture on South Pacific Island Entrepreneurs”. International Journal of Entrepreneurial Behaviour & Research. 9(2): 55-73.
Sahin, M., M, Rietdijk and P. Nijkamp. 2004. “Migrant Employees’ Behaviour Vis-a-Vis Customers in the Service Sector”, Studies in Regional Sciences (forthcoming).
Sahin, M., P. Nijkamp and T. Baycan-Levent. 2006. Migrant Entrepreneurship from the Perspective of Cultural Diversity, In: L.P. Dana (ed.), Handbook of Research on Ethnic Minority Entrepreneurship – A Co-evolutionairy View on Resource Management, Edward Elgar, Cheltenham UK, pp. 99-113.
Sarachek, B. 1978. “American entrepreneurs and the Horatio Alger myth”. Journal of Economic History. 38: 439-56.
Saxenian, A.L. 1990. “Regional Networks and the Resurgence of Silicon Valley“. Californian Management Review. 33(1): 89-112.
Schwer, R.K. and U. Yucelt. 1984. “A Study of Risk-taking Propensities among Small Business Entrepreneurs and Managers: An Empirical Evaluation”. American Journal of Small Businesses. 8(3): 31-40.
Shane, S. 1996. “Explaining Variation in Rates of Entrepreneurship in the United States: 1899-1988”. Journal of Management. 22 (5): 747-781.
Shaw, E. 1997. “The Real Networks of Small Firms”, in D. Deakins, P. Jennings and C. Mason (eds.), Small Firms, Entrepreneurship in the 1990s, London: Paul Chapman Publishing.
Shaw, E. 1997. “Social Networks: Their Impact on the Innovative Behaviour of Small Service Firms”. International Journal of Innovation Management. 2(2): 201-222
129
Shoobridge G.E. 2006. Multi-Ethnic Workforce and Business Performance: Review and Synthesis of the Empirical Literature. Human Resource Development Review. 5 (1): 92-137.
Timmons, J.A. 1994. “New Venture Creation: Entrepreneurship for the 21st Century”, 4th ed., Illinois: Irwin.
Thomas, J. and Evanson, R.V. 1987. An Empirical Investigation of the Association between Financial Ratio Use and Small Business Success. Journal of Business Finance and Accounting. 14 (4): 555.
Upton, N.B. and R.K.Z. Heck. 1997. “The Family Business Dimensions of Entrepreneurship”, In. D.L. Sexton and R.W. Smilor (Eds.), Entrepreneurship 2000 (243-266), Chicago: Upstart.
Van Zuuren, F.J. and H.M. Wolfs. 1991. “Styles of Information Seeking under Threat: Personal and Situational Aspects of Monitoring and Blunting”. Personality and Individual Differences, 12 (2): 141-149.
Venkatraman , N. and V. Ramanujam. 1987. “Measurement of Business Economic Performance: An Examination of Method Convergence”. Journal of Management, 13(1): 109-122.
Verheul, I., S. Wennekers, D. Audretsch and R. Thurik. 2001. “An Eclectic Theory of Entrepreneurship: Policies, Institutions and Culture”, Research Report 0012, EIM, Zoetermeer.
Waldinger, R.D., Aldrich, H.E. and Ward, R. Blaschke, J (1990),”Ethnic Entrepreneurs: Immigrant Business in Industrial Societies”, Sage Publications, Newbury Park, CA
Waldinger, R, H. Aldrich and R. Ward, Associates. 1990. “Ethnic Entrepreneurs”, London: Sage.
Ward, E.A. 1993. “Motivation of Expansion Plans of Entrepreneurs and Small Business Managers (Measuring Locus of Control)”. Journal of Small Business Management, 33: 32-38.
Weiner, B. 1992. “Human Motivations: Metaphors, Theories, and Research”, Newbury Park, California: Sage Publications, Inc.
Zorlu, A. 2002. Absorption of immigrants in European labour markets. The Netherlands, UnitedKingdom and Norway, Ph.D Thesis, University of Amsterdam. Tinbergen Institute Research Series 279.

130
Multiple Comparisons
Dependent Variable: AANSLUITING BIJ EEN BRANCHEVERENIGING/NETWERKORG.
Bonferroni
,15 ,130 ,766 -,17 ,47
-,02 ,133 1,000 -,35 ,30
-,15 ,130 ,766 -,47 ,17
-,17 ,143 ,698 -,52 ,18
,02 ,133 1,000 -,30 ,35
,17 ,143 ,698 -,18 ,52
(J) AFKOMST VADERMR
SR
TR
SR
TR
MR
(I) AFKOMST VADERTR
MR
SR
MeanDifference
(I-J) Std. Error Sig. Lower Bound Upper Bound
95% Confidence Interval

131

132
PART B
QUALITATIVE
PATTERN
ANALYSIS

133
134
CHAPTER 5*
THE URBAN GROWTH POTENTIAL OF SECOND-GENERATION MIGRANT ENTREPRENEURS: A SECTORAL STUDY ON AMSTERDAM
Abstract
A rise in second-generation migrant entrepreneurs and an increasing focus on modern economic sectors have become new trends in migrant entrepreneurship in recent years. Although traditional sectors are still the most popular among the first-generation migrant entrepreneurs, because of the increasing pressure and their high competitiveness in traditional areas, nowadays new market niches are rapidly developing. While the first generation has more often become active in new areas such as the producer services sector which includes finance, insurance, real estate and business-related professional services, the second generation has contributed to the emergence of new areas of immigrant business activity such as the ICT sector and the creative industries.
Against this background, this study focuses on the external orientations of the second-generation migrant entrepreneurs by addressing in particular the way – and the extent to which – the choice for entrepreneurship is made by higher-educated young ethnic generations. This is a new field of entrepreneurship research in many European countries. The empirical data of our study is based on in-depth personal interviews held in the first half of 2007. We employed a recently developed multivariate qualitative calissification method, coined rough set analysis, in order to investigate the motivation, goals and strategies of second generation Turkish entrepreneurs in the ICT and the financial services sector in the Netherlands.
The results of our study show that the second generation Turkish entrepreneurs in the Netherlands have started to be involved in new and non-traditional sectors like ICT and financial services sectors. The motivation and driving forces of the second-generation Turkish entrepreneurs are stemming from both their personal characteristics shaped by their higher educational level and their previous working experience as an employee or entrepreneur in the same sector. The demand for and a gap in the sector as well as the growing and promising structure of the sector play also an important role in pulling the second generation Turkish immigrants to become entrepreneur in these new sectors.
Keywords: second generation migrant entrepreneurs, sectoral change in migrant entrepreneurship, Turkish migrant entrepreneurs, ICT and FIRE sector, Amsterdam
*Source: Baycan-Levent, T., Nijkamp, P. and Sahin, M., (2009). The Urban Growth Potential of Second-Generation Migrant Entrepreneurs – A Sectoral Study on Amsterdam, International Business Review (Accepted).
135
1. THE NEW DEMOGRAPHY AS AN ENTREPRENEURIAL DRIVER
Innovation ─ a significant improvement (and market acceptance) of (part of) our production or governance systems ─ has been a central instrument of any market-driven economy since the early history of mankind. It has been a focal point of economic theory and applied economic research since the postwar period, with different cycles of interest in the past sixty years. A first wave of economic interest can be found in Schumpeterian theory on innovation and entrepreneurship (see Schumpeter 1957). Next, the recession in the beginning of the 1980s prompted a new phase of interest instigated by a revival of long wave (Kondratieff) theory (see Kleinknecht 1982). And finally, in recent years we have witnessed another wave of interest in innovation and entrepreneurship, mainly as a result of global competition on the one hand and reinforcement of local growth potentials on the other (see de Groot et al. 2004).
The competition dynamics in different parts of the world and with multiple stakeholders has shifted the attention from conventional market pull versus technology push dilemma’s towards the acceptance of a Triple Helix paradigm, in which the interface between industry, knowledge institutions and governance agencies has become a central field of attention (see Leydesdorff and Etzkowitz, 1998). In this context, new economic analysis frameworks ─ in particular, endogenous growth (see Aghion, 2002; Lucas, 1988; Nijkamp and Poot 1998; Romer 1990), the new economic geography (Fujita and Krugman, 2004), and evolutionary economics (see e.g. Boschma and Lambooy, 2001; Nelson and Winter, 1982; and Van den Bergh et al. 2007) have highlighted the importance of strategic behaviour of economic actors and entrepreneurs at a micro scale on a local or regional level.
Economic analysis of spatial-economic dynamics and innovation has mainly centered around new technological regimes, market regimes and institutional regimes. Far less attention has been given to demographic regimes (see Poot 2007 for an interesting exception). But it ought to be recognized that demographic forces ─ mainly as a result of international migration ─ exert a significant impact on economic development and innovative potential of countries and regions. For example, a large share of the innovation success of the USA can be ascribed to the influx of foreigners who created an innovative spirit in an uncertain economic climate.
In an open and globalizing world it seems plausible that international mobility will be on a rising edge, starting from the business, R&D and knowledge sector, but increasingly spreading out to other sectors of the economy (e.g., medical care, consultancy etc.). The entry into the labour market of host countries by foreign workers is often fraught with many problems (due to the existence of language, institutional and cultural barriers), and hence many migrants are stimulated to seek for self-employment. Self-employed migrants are increasingly resorting to so-called ethnic (or migrant) entrepreneurship (see Baycan-Levent et al., 2003 and 2006; Jones and Ram, 2007; Rath, 2000; Stiles and Galbraith, 2004; Waldinger et al., 1990; Ward and Jenkins, 1984). A wealth of scientific contributions and reviews on ethnic entrepreneurship can be found in Dana (2007). Migrant entrepreneurs are typically found in traditional sectors of the urban economy, for instance, in the retail, hospitality and repair
136
sector. But in recent years, we have observed a gradual upgrading of these entrepreneurs towards higher levels, e.g., consultancy, ICT services, legal services and so forth, in particular by second-generation migrant entrepreneurs. This stepping-stone effect of migrant entrepreneurship will most likely lead to drastic changes in the composition and performance of migrant entrepreneurs. The present study is mainly exploratory in nature and will address the urban growth potential of the next generation of migrant entrepreneurs. Thus, our paper will offer a novel addition to the extant literature on entrepreneurship by migrants by tracing the conditions for business performance.
The present paper aims to address the shift in migrant entrepreneurship towards promising and modern urban economic sectors. It takes for granted the proposition that business involvement in modern or high-tech sectors will prompt an upgrading of migrant entrepreneurs, which may lead to socio-economic emancipation. As an example, we will take the involvement of migrant entrepreneurs in the ICT and the financial services sector in the city of Amsterdam. We will offer an analysis of critical success conditions and barriers for these businesses, based on extensive structured interviews with these entrepreneurs. The ─ mainly qualitative ─ information from these interviews will be systematically integrated in a coded nominal (alpha-numerical) survey table, which will be further analyzed by means of a rather novel technique from the artificial intelligence literature, viz. rough set analysis. This exploratory study aims to lay the foundation for a novel analysis of the ‘next-gen’ growth potential of migrant entrepreneurs in cities. The paper will be concluded with some retrospective and prospective remarks.
2. THE SECOND CYCLE IN MIGRANT ENTREPRENEURSHIP
Europe has become an 'epicentre' of immigration (Van de Kaa, 1996). European cities have demonstrated a remarkable demographic change, with a large influence of foreign migrants in the past decades. Between 1975 and 2000, the population of Europe grew from 349 to 375 million (Brücker et al., 2002). Several districts in European cities have nowadays a majority of foreigners and within two decades several European cities will have a majority of first and second-generation migrants. European cities tend to become cultural melting pots (see Jacobs, 1961).
The influx of many migrants into the urban economies of many European countries has led to a socio-economic differentiation accompanied by persistent disparities on urban labor markets that is mirrored by (i) relatively high unemployment rates of migrants and (ii) a concentration of migrant workers in lower segments of the labor market leading to a dual labor market (see Piore and Sabel, 1984). Many migrants do not appear to meet the requirements for professional human capital in a modern economy and hence are condemned to resort to lower qualified types of jobs. However, next to professional human capital, any developed economy also needs entrepreneurial human capital (see Iyigun and Owen, 1998). However, entrepreneurial spirit is a scarce good that can be acquired by training, education or learning
137
mechanisms through the pressure of economic circumstances (as is also witnessed in the resource dependence theory). There is an abundance of literature on entrepreneurship (see for surveys Audretsch and Thurik, 2001; Hébert and Link, 1989; Lumpkin and Dess, 1996; Wennekers and Thurik, 1999). In general, creativeness, risk-taking behavior, courage, technological and market knowledge as well as human and social skills are usually regarded as necessary background factors for successful entrepreneurship.
In the modern literature on entrepreneurship we sometimes come across the term ‘entrepreneurial hero’, suggesting that successful entrepreneurial behavior presupposes jumps leading to high performance. However, some realism is needed here, as most business innovations are incremental in nature (see Kassichieh et al., 2002). In many cases, successful business-making is only based on variational imitation, where certain products or services in a new domain are offered as a variant to a new or existing product or service (see Iyigun and Owen, 1998). Thus, one may acquire that incremental innovations are mainly taking place under conditions of monopolistic competition. It is obvious that risk attitudes and avoidance are key ingredients of an entrepreneurship culture present on a monopolistic competition market (Hofstede, 1991).
Many migrant entrepreneurs have their roots in a local, small-scale and network-based culture ─ and are thus dependent on socio-cultural urban incubation climate ─ and will often be inclined to start up a new business from a risk-avoiding attitude (see e.g. the mixed embeddedness perspective, advocated by Kloosterman and Rath 2001). This explains their presence in traditional markets where there is still a sufficient critical mass of demand for indigenous ethnic products or services, without a requirement for knowledge-intensive products or services (the ‘pizza’ phenomenon). But with mass competition and the introduction of new products ─ and thus more market opportunities ─ there will be a trend towards new and more promising SME market niches, especially by second-generation migrants (see also Cooper, 2003; Malecki, 1997).
Consequently, we observe the emergence of a second cycle where migrant entrepreneurs penetrate increasingly a new knowledge-intensive product or service market. This requires an upscaling of human capital, with more competition outside the traditional ethnic domain. This prompts diversity in the supply of products and services and leads to more competitive marketing actions. This transition will also challenge the traditional network cooperation model of migrant entrepreneurs in their own ethnic or socio-cultural niche. Simultaneous competition and cooperation will become the new features of the markets for migrant entrepreneurs, where local embeddedness and sector-specific innovative cultures are key ingredients (see Markusen 1996). This emerging case of monopolistic competition is already visible in new knowledge-intensive fields like ICT, consultancy, export services, marketing etc. It may seem realistic that this second phase of knowledge-intensive entrepreneurship may pave the road towards the final stage of mature entrepreneurship, viz. a break-out towards entirely new and modern markets.

138
In the sequel of this paper, we will investigate the second cycle of migrant entrepreneurship in the ICT and the financial services sector in Amsterdam. The next section will be devoted to an overview of migrants and entrepreneurship in the Netherlands.
3. MIGRANTS AND ENTREPRENEURSHIP IN THE NETHERLANDS
3.1. Migration and immigrants: the case of the Netherlands The Netherlands has a long international and national migration history (see for a discussion of immigration flows in different periods Kraal and Zorlu, 1998; Lucassen and Penninx, 1997; Zorlu and Hartog, 2001). In the post-War period, political processes and economic developments determined migration to the Netherlands and the country switched from an emigration into an immigration country. By the mid-1950s, the Dutch economy began to grow and this led to a labor shortage of unskilled workers in certain sectors, such as industry and mining. The demand for workers for unskilled jobs increased, while the supply of unskilled Dutch workers was decreasing. The shortage of unskilled workers was compensated by an inflow of Mediterranean workers (Hartog and Vriend, 1990). Guest workers were actively recruited from Mediterranean countries; Italy, Spain, Portugal, Turkey, Greece, Morocco, Yugoslavia, and Tunisia. The recruitment policy stopped during the first oil crisis, but the immigration from the recruitment countries continued as chain-migration in the form of family reunification (1970s) and family formation (1980s and 1990s). In addition, the flow of political refugees and asylum seekers, from politically unstable areas in the world, also increased in this period. Therefore, in only three decades, the non-Western population grew from 160,000 in 1972, to 1.7 million in 2004 (Tillie and Slijper, 2006). Ultimately, Surinamese, Antilleans, Turks, and Moroccans became the largest migrant minority groups, and this group is gradually growing as a result to a combination of continuous immigration and a relatively high birth rate. Nevertheless, immigration streams are now increasingly dominated by political refugees and asylum seekers.
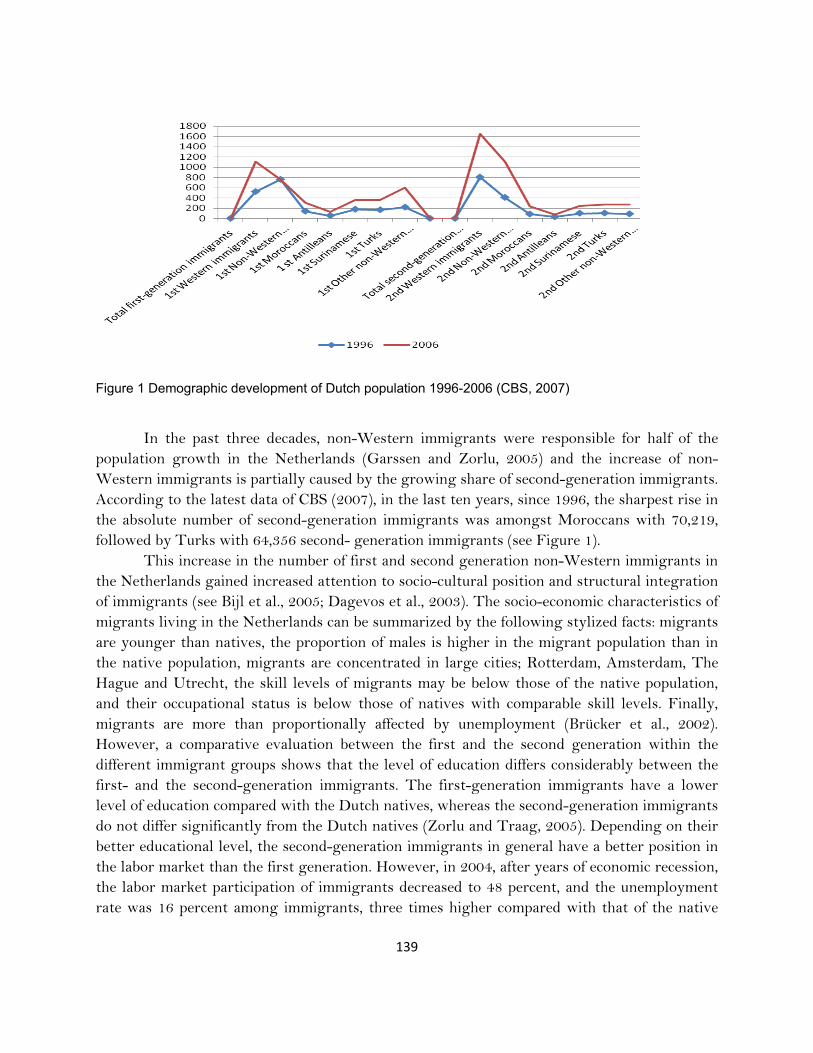
139
Figure 1 Demographic development of Dutch population 1996-2006 (CBS, 2007)
In the past three decades, non-Western immigrants were responsible for half of the population growth in the Netherlands (Garssen and Zorlu, 2005) and the increase of non-Western immigrants is partially caused by the growing share of second-generation immigrants. According to the latest data of CBS (2007), in the last ten years, since 1996, the sharpest rise in the absolute number of second-generation immigrants was amongst Moroccans with 70,219, followed by Turks with 64,356 second- generation immigrants (see Figure 1).
This increase in the number of first and second generation non-Western immigrants in the Netherlands gained increased attention to socio-cultural position and structural integration of immigrants (see Bijl et al., 2005; Dagevos et al., 2003). The socio-economic characteristics of migrants living in the Netherlands can be summarized by the following stylized facts: migrants are younger than natives, the proportion of males is higher in the migrant population than in the native population, migrants are concentrated in large cities; Rotterdam, Amsterdam, The Hague and Utrecht, the skill levels of migrants may be below those of the native population, and their occupational status is below those of natives with comparable skill levels. Finally, migrants are more than proportionally affected by unemployment (Brücker et al., 2002). However, a comparative evaluation between the first and the second generation within the different immigrant groups shows that the level of education differs considerably between the first- and the second-generation immigrants. The first-generation immigrants have a lower level of education compared with the Dutch natives, whereas the second-generation immigrants do not differ significantly from the Dutch natives (Zorlu and Traag, 2005). Depending on their better educational level, the second-generation immigrants in general have a better position in the labor market than the first generation. However, in 2004, after years of economic recession, the labor market participation of immigrants decreased to 48 percent, and the unemployment rate was 16 percent among immigrants, three times higher compared with that of the native
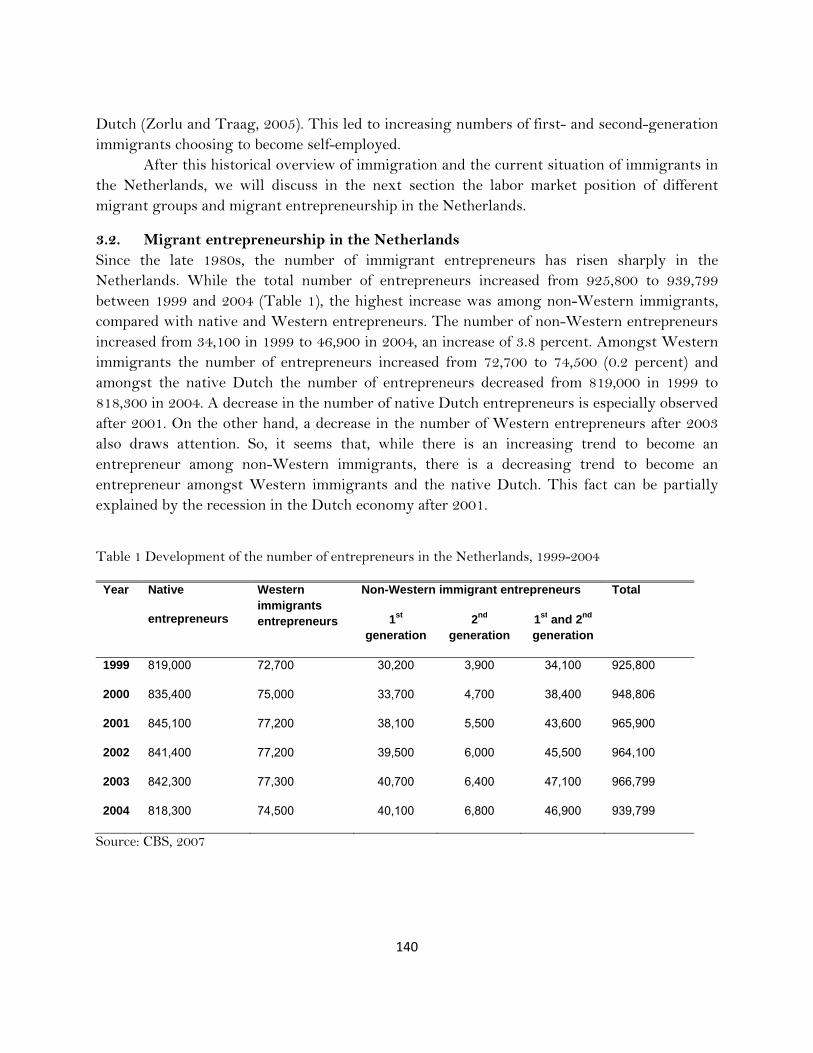
140
Dutch (Zorlu and Traag, 2005). This led to increasing numbers of first- and second-generation immigrants choosing to become self-employed.
After this historical overview of immigration and the current situation of immigrants in the Netherlands, we will discuss in the next section the labor market position of different migrant groups and migrant entrepreneurship in the Netherlands.
3.2. Migrant entrepreneurship in the Netherlands Since the late 1980s, the number of immigrant entrepreneurs has risen sharply in the Netherlands. While the total number of entrepreneurs increased from 925,800 to 939,799 between 1999 and 2004 (Table 1), the highest increase was among non-Western immigrants, compared with native and Western entrepreneurs. The number of non-Western entrepreneurs increased from 34,100 in 1999 to 46,900 in 2004, an increase of 3.8 percent. Amongst Western immigrants the number of entrepreneurs increased from 72,700 to 74,500 (0.2 percent) and amongst the native Dutch the number of entrepreneurs decreased from 819,000 in 1999 to 818,300 in 2004. A decrease in the number of native Dutch entrepreneurs is especially observed after 2001. On the other hand, a decrease in the number of Western entrepreneurs after 2003 also draws attention. So, it seems that, while there is an increasing trend to become an entrepreneur among non-Western immigrants, there is a decreasing trend to become an entrepreneur amongst Western immigrants and the native Dutch. This fact can be partially explained by the recession in the Dutch economy after 2001.
Table 1 Development of the number of entrepreneurs in the Netherlands, 1999-2004
Year Native
entrepreneurs
Western immigrants entrepreneurs
Non-Western immigrant entrepreneurs Total
1st
generation 2nd
generation 1st and 2nd generation
1999
2000
2001
2002
2003
2004
819,000
835,400
845,100
841,400
842,300
818,300
72,700
75,000
77,200
77,200
77,300
74,500
30,200
33,700
38,100
39,500
40,700
40,100
3,900
4,700
5,500
6,000
6,400
6,800
34,100
38,400
43,600
45,500
47,100
46,900
925,800
948,806
965,900
964,100
966,799
939,799
Source: CBS, 2007

141
Amongst non-Western immigrant entrepreneurs, the highest increase in the number of entrepreneurs was amongst the second-generation immigrant entrepreneurs between 1999 and 2004. While the rate of increase for the first generation was 3.3 percent, it was 7.4 percent for the second generation. However, amongst both the first- and the second-generation non-Western immigrants the self-employment rate lags behind both Western immigrants, as well as the native Dutch (Bijl et al., 2005). While amongst the native Dutch 9.2 percent of the labor force chose to become an entrepreneur in this period, amongst the non-Western immigrants this percentage was 4.1 percent. Nevertheless, between 1999 and 2003 the self-employment rate of non-Western immigrants increased more rapidly than among native Dutch and Western immigrants. In absolute numbers the largest group of immigrant entrepreneurs in the Netherlands, from both the first and the second generation, originate from Turkey and Surinam (Table 2). However, in the period 1999-2004 the sharpest rise was among Moroccan entrepreneurs: namely, 64 percent.
Table 2 Number of entrepreneurs (x1,000)*, 1999-2004
Year Turkey Morocco Netherlands/
Antilles
Surinam
1999
2000
2001
2002
2003
2004
7.9
9.2
11.0
11.5
11.9
11.8
2.8
3.3
4.0
4.3
4.4
4.6
1.5
1.8
2.0
2.1
2.2
2.1
6.4
7.1
7.8
7.9
8.0
7.7
Source: CBS (2007).
Note: This table includes both first- and second-generation immigrant entrepreneurs.
There are considerable differences in the self-employment rates among the different ethnic groups. First-generation Chinese immigrants are most active as entrepreneurs in comparison with the other ethnic groups. Furthermore, Chinese immigrants choose to become an entrepreneur almost twice as often as the native Dutch (Bijl et al., 2005). On the other hand, the relative growth of the self-employment rate is higher for Turkish immigrants than it is for Chinese immigrants.
With regard to the sectors in which immigrant entrepreneurs set up their businesses, it appears that, in the past decade, immigrants have more often set up businesses in sectors other than the traditional ones (EIM, 2004; CBS, 2007). Although the hotel and catering industry is still most popular with the first generation, the percentage choosing to set up business in this

142
industry has declined considerably. Instead, the first generation prefers more often to become active as entrepreneurs in other sectors like the business or producer services sectors which include finance, insurance, real estate and business related professional services, such as accounting, consulting, marketing, engineering, or design, most of which provide a high quotient of technical, professional and managerial jobs. The second generation is predominantly represented in the producer services sector. In 2002, one-quarter of the second generation started a business in this sector. As a result, the sectoral distribution of the second generation has become more similar to the native Dutch entrepreneurs than the first generation.
According to the study of Dagevos and Gesthuizen (2005), Surinamese and Antillean entrepreneurs are more often active in producer services than other ethnic groups (Table 3). Among Turkish entrepreneurs there is also an above-average increase of entrepreneurs in the producer services.
Table 3 Sectoral distribution among first and second-generation non-Western immigrant entrepreneurs, 1999-2002 (in percentages)
First generation Second generation
1999 2002 1999 2002
Sector
Agriculture / fishing
Minerals / industry/ energy
Building industry
Trade and reparation business
Hotel and catering industry
Transportation, storage and communication
Financial institutions
Producer services / business to business
Public administration / education
Health care and public welfare
Other services
Total
2
5
3
26
35
3
1
12
3
3
7
100
2
4
5
25
31
5
1
15
3
3
8
100
3
3
6
22
14
6
3
22
3
6
14
100
2
4
7
21
12
7
2
25
2
5
14
100
Source: EIM, 2004.

143
The research study on first- and second-generation immigrant entrepreneurs in Dutch cities conducted by Rusinovic in 2006 also shows some interesting results about the differences between the first- and the second-generation immigrant entrepreneurs. According to the results of this research, which consists of 252 immigrant entrepreneurs in the Netherlands, the first generation the largest group (31 percent) is active in an ethnic market, whereas amongst the second generation this percentage has declined to 15 percent. The first generation is more often embedded in ethnic markets and depends more than the second generation on informal as well as on transnational networks in running their businesses. Compared with the first generation, the second generation is more often embedded in mainstream markets (38 percent) and almost three-quarters of the second generation are at least partially embedded in formal networks. However, Rusinovic has mentioned that this does not mean that the importance of embeddedness in informal networks has disappeared with successive generations. For the second generation entrepreneurs embeddedness in formal and informal social networks are not mutually exclusive options, but the formal and informal networks overlap or complement each other. The results of Rusinovic’s research also show that the embeddedness in transnational networks still remains of importance for the second generation, but the transnational involvement of the second generation has declined compared with that of the first generation. According to Rusinovic, for the second generation transnational involvement has become more a strategic choice – ‘strategic transnationalism’ − whereas for the first generation it is more often a necessity.
Is the Netherlands offering a solid basis for comparative migrant entrepreneurship research? Although many European countries are facing mass immigration flows, the Netherlands has been one of the first recipients where foreign migrants could enter rather freely, given the tolerant political character of the country. Under such conditions, new forms of entreperneurship may likely flourish, especially of the first transition problems are overcome. The Dutch situation is not entirely typical of European entrepreneurship conditions, but it offers new insight from a country where openness and entrepreneurship has always been regarded as an asset.
An overall evaluation of immigrant entrepreneurship in the Netherlands highlights the changing trends in recent years. The new trends have emerged as: i) a new orientation to non-traditional sectors; ii) sectoral change in immigrant entrepreneurship especially towards producer services; and, iii) an increasing number of second-generation immigrant entrepreneurs. In the sequel of this paper, we will investigate the critical success conditions (and failure conditions) that are decisive for the economic performance of migrant entrepreneurs in the ICT and the FIRE sector in Amsterdam (see also van Oort and Atzema 2004). The ICT market is seen here as a new market (second cycle) for innovative migrant entrepreneurs. The next section will be devoted to a concise description of our database.
144
4. TURKISH ENTREPRENEURS IN THE ICT AND THE FIRE SECTOR IN AMSTERDAM: PROFILE AND DATA BASE
4.1. A sketch of Turkish entrepreneurship in the Netherlands The first wave of Turkish immigration to the Netherlands took place in the 1960s and 1970s. The shortage of unskilled laborers led the Dutch government to sign a treaty with the Turkish government for the immigration of what are known as ‘guest laborers’. According to Dieleman (1993), many immigrants came to the Netherlands in the 1960s and 1970s to work in the old industries. Dutch companies recruited these people for heavy, unskilled work (Houtzager and Rodrigues, 2002). As elsewhere, they filled the demand for workers at the bottom of the job market. The Netherlands went through a long period of economic growth during these years, and the number of Turkish immigrants grew strongly. The first oil crisis was the end of the official recruitment of Turkish guest workers, and the number of entrants decreased. The occurrence of the second oil crisis caused an economic crisis and a decrease in the demand for workers. Long-term unemployment became a serious problem. After this period, migration from Turkey almost solely consisted of family reunification (bringing wife and children to the Netherlands), family formation (bringing in a marriage partner from their country of origin), and asylum migration. At first, both the Turkish guest workers and the Dutch government thought their stay would be temporary. After a brief working period, they planned to return to their home country with the savings in the Netherlands. Nevertheless, most of the Turkish guest workers decided to stay and then brought their wives and children to the Netherlands. Many people came to the country because of this family reunification and the Turks became permanent habitants of the Netherlands. As the economic crisis hit the Dutch economy in the 1970s, especially the old industries, many immigrants were faced with exclusion from new job opportunities in the restructured urban economy (e.g. in the services sector), and a number of them tried to make a niche as small business entrepreneurs.
Nowadays, the Turks are the major immigrant group in the country. In 2004, about 350,000 first-and second-generation Turks lived in the Netherlands, which is about 2.2 percent of the Dutch population (Euwals et al. 2007). Turkish immigrants in the Netherlands are on average younger than the native Dutch population; they often have more children; and usually they have a lower level of education. Their participation in the labor market lags significantly behind that of the native Dutch population in the Netherlands. The employment rate for Turkish men is 23 percent points lower than it is for native men (Euwals et al., 2007). The relatively low level of education of Turkish immigrants in the Netherlands may be a reason for the less favorable labor market position of Turkish immigrants in the Netherlands.
Choenni (1997) noted that more than 10 percent of the Turkish working population in Amsterdam consists of entrepreneurs, and they constitute about 20 percent of all ethnic entrepreneurs in Amsterdam. The hospitality sector (restaurants, cafés, bars) is an important domain for Turkish entrepreneurs. Recent research indicates that, in relation to the total population, Turkish entrepreneurs account for the highest percentage of start-ups amongst all

145
groups (including the native Dutch) in the Netherlands: 11.5 percent of the Turkish working population started their own firm in 2000, versus 6.5 percent of all other groups (www.kvk.nl). Jansen et al. (2003) mentioned that, despite certain disadvantages compared with the native Dutch population, immigrants from Turkey show the same rate of entrepreneurship. Although the Turkish immigrants show similar characteristics to other immigrants (from Morocco, Suriname and the Antilles), their rate of entrepreneurship is much higher. According to Masurel and Nijkamp (2004), Turkish entrepreneurs account for the highest percentage of start-ups amongst all groups, in relation to the total population (including the Dutch native population).
Today, Turks are the largest entrepreneurial group in the country. Furthermore, the relative growth of the entrepreneurship rate is higher among Turkish immigrants, in relation to other non-western groups. Between 1999 and 2004 the total number of Turkish entrepreneurs in the Netherlands increased from 7,900 to 11,700 (see Table 4). Among Turkish immigrant entrepreneurs there is an increasing group second-generation immigrants. In 1999, out of the 7,900 Turkish entrepreneurs, 800 were of second-generation whereas in 2004 out of the 11,700 Turkish entrepreneurs, 1,800 were of second-generation immigrant entrepreneurs. While rate of increase for the first generation was 1.4 percent, it was 2.3 percent for the second generation.
Table 4 Development of Turkish entrepreneurship in the Netherlands
1999 2000 2001 2002 2003 2004
First generation 7,100 8,200 9,600 10,000 10,200 9,900
Second generation 800 1,000 1,300 1,500 1,700 1,800
Total 7,900 9,200 10,900 11,500 11,900 11,700
Source: CBS (2007).
Most Turkish entrepreneurs work in the hospitality sector (bars, cafes, restaurants), but nowadays, we can see a shift to different sectors. According to Dagevos and Gesthuizen (2005), there is an above-average increase of entrepreneurs in the producer services (finance, insurance, real-estate, and business- related professional services). Therefore, the next section will investigate the motivation, driving forces, goals and strategies of Turkish entrepreneurs in these new sectors.
4.2. Profile of Turkish entrepreneurs in the ICT and the FIRE sector In our study we aim to explain the qualitative performance or output indicators of Turkish entrepreneurs in the ICT and the financial services sector in the city of Amsterdam. The sample of our study consists of a total of 23 Turkish entrepreneurs of whom 16 are active in the ICT sector and 7 are active in the FIRE sector. Clearly, this is not a large sample. But the
146
number of Turkish firms in the upcoming ICT and FIRE market is still relatively small, while various Turkish businessmen did not want to participate in an interview because of fear of disclosure of confidential information. Thus, the present sample was the most reasonable set that could be found with a reasonable effort under the present conditions. But the information obtained during the interviews was based on trust and uncovered many interesting details. It was also felt that a desperate search for more candidate-interviewees would not bring about additional new information. Our sample considers three groups of companies/entrepreneurs in the ICT sector: automation; software computer programming and Internet service provider companies, and in the FIRE sector: finance, insurance, real estate, consulting and accountancy companies that require a higher educational level and skills and that are very far from any ethnic niche in terms of products, services and communication channels. The empirical data of our research are based on in-depth personal interviews held in the first half of 2007. Much information about the entrepreneurs was provided first from the Turkish businesses website “Webisrehberi” for the contact addresses and then during the survey in an informal way using both the ethnic and business networks and personal contacts with entrepreneurs. The interviews were held on a personal basis, by a bilingual (Turkish and Dutch speaking) interviewer, which created a confidence from the side of the interviewee. The interviewees could sometimes take more than an hour. Sufficient consideration was given to the credibility, transferability and dependability of the research (Guba and Lincoln, 1989).
In the present section we examine the profile of the Turkish entrepreneurs in the ICT and FIRE sector in terms of personal characteristics, motivation, driving force and entrepreneurial family tradition. An examination of the personal characteristics of Turkish entrepreneurs in the ICT and the FIRE sector shows that the majority of the entrepreneurs (74 percent) fall between the age 30 and 49. When the arrival year is taken into consideration we see that more than half of the entrepreneurs (52 percent) came between 1971 and 1980 (when they were younger than 12 years old), whereas 22 percent were born in the Netherlands. Therefore, the majority (74 percent) of the entrepreneurs fall in the category of the second-generation with their educational attainment (83 percent) achieved in the Netherlands. While the majority (56 percent) graduated from middle and higher vocational schools, the rest (35 percent) graduated from universities. Depending on their arrival year and educational attainment in the Netherlands, all of them can speak Dutch fluently or quite well and most of them (83 percent) can also speak English fluently or quite as well. An overall evaluation of personal characteristics of the second-generation Turkish entrepreneurs draws attention to their higher educational level and language ability (see Table 5).

147
Table 5 Profile of Turkish entrepreneurs in the ICT and the FIRE sector
Share in total (%)
PERSONAL CHARACTERISTICS
Age
Education
Arrival year
Motivation and driving forces
30-49
vocational (middle and higher)
university
education place (NL)
language ability (Dutch)
born
1971-1980
74
56
35
83
83
22
52
Position before start
Previous sector
Sector choice
Situation of the sector
employed
entrepreneur
employee in the same sector
entrepreneur in the same sector
employee in a different sector
GAP/big demand
experience
education
growing/increasing
78
9
65
4
17
39
39
22
52

148
Turks in the sector
The reason to be entrepreneur
Entrepreneur in the family
Capital sources
Information sources
growing/increasing
smaller/decreasing
to be independent/to be own boss
flexibility
yes
own capital
own experience
30
48
78
13
52
74
61
When we look at the labor market position, the previous experience and the previous
sector of Turkish entrepreneurs before the start of their present business (Table 5), we see that the majority (78 percent) of the entrepreneurs were employed and 9 percent were already active as an entrepreneur in their previous labor market position. While, in general, unemployment is observed as a driving force to become entrepreneur for many immigrants, in our case unemployment was not found to be a driving force. On the contrary, it seems there is a pulling-effect to become an entrepreneur as a result of previous experience of being entrepreneurs through employment and/or entrepreneurship, and moreover the actual way that this experience was obtained as an employee and entrepreneur in the same sector (69 percent). The sector choice of entrepreneurs also supports this pulling effect. Almost 40 percent of the entrepreneurs have oriented to this sector because of the high demand or the gap in the sector whereas the other 40 percent of the entrepreneurs have chosen this sector because of their work experience and 20 percent because of their education. The current situation of the sector was evaluated by the majority of the entrepreneurs (52 percent) as a growing sector, while emphasizing the existence of a lot of changes, as well as intense competition in the sector. This growing and promising sector structure can be another pull-effect for entrepreneurs. The existence of Turkish entrepreneurs in the same sector does not show clear evidence of the attractiveness of this sector for entrepreneurs: 48 percent of the entrepreneurs mentioned that the share of Turks in the sector is decreasing, while 30 percent claimed, on the contrary, that the share of Turks is increasing.
When we look at the reasons to become an entrepreneur, the first reason appears as ‘to be independent’ and ‘to be one’s own boss’ (78 percent). ‘Flexibility’ with a share of 13 percent ranks as the second reason. It seems that to have an extra income is not an important reason to
149
become an entrepreneur. While more than half of the entrepreneurs (52 percent) have an entrepreneur family member, which could be evaluated as another motivation or driving force to become entrepreneur, the other factors such as capital sources and information sources show that entrepreneurs are not dependent on their family or friends. 74 percent of the entrepreneurs have used their own capital and 61 percent used their own experience (see Table 5). All these figures clearly show that the second-generation Turkish entrepreneurs are quite independent of their ethnic niche.
4.3. Profile of Turkish enterprises in the ICT and the FIRE sector In this section, we examine the profile of Turkish enterprises in the ICT and the FIRE sector in terms of enterprise features, performance, profiles of employees and clients and goals and strategies. Turkish enterprises in our case study are in two sectors: the ICT sector which consists of three groups of companies/entrepreneurs viz. automation companies; software computer programming companies; and Internet service provider companies and the FIRE sector which consists of finance, insurance, real estate, consulting and accountancy companies (Table 6). However, the majority of the enterprises (70 percent) in our sample are in the ICT sector. When we examine the features of the enterprises we observe that the second-generation Turkish entrepreneurship started after 1996, and there is an enormous increase in start-up enterprises especially after 2000. More than half of the enterprises (57 percent) in our sample have started after 2000. Most of the enterprises are small whereas the majority (61 percent) has less than five workers.

150
Table 6 Profile of Turkish enterprises in the ICT and the FIRE sector
Share in total (%)
BUSINESS CHARACTERISTICS
Activities of the enterprise
Foundation year of the enterprise
Number of employees
Performance
Development of sales
Profit last year
Profile of employees and clients
Nationality of employees
Preferences for employees
Composition of clients
Goals and strategies
ICT sector
FIRE sector
1996-2000
2001+
1-5
6-15
increase
positive
Turkish employees
need for Turkish employees, because of Turkish clients
preference for Dutch native employees
80 % Turks – 20 % Natives
Non-Turkish clients
70
30
39
57
61
35
91
87
64
22
57
39
35

151
Target group
Strategies
Turks
Dutch natives and other groups
no target group
growth and more products and services
specialization
35
22
35
57
30
When the development of sales and the profit of the previous year are examined for
Turkish enterprises in the ICT and the FIRE sectors as of their performance, 91 percent of the enterprises had an increase in sales, while the rest 9 percent had about the same level (Table 6). The profit of the previous year shows the same success level, while 87 percent of the entrepreneurs had a positive profit, 13 percent had the same profit. There has been no decrease in the development of sales and no negative profit at all. These figures show a very high economic performance.
When we examine the number and the composition of employees, we see that 23 Turkish enterprises in the ICT and the FIRE sectors provide an employment opportunity for 111 persons of whom 64 percent are from their own ethnic group (Table 6). Although Turkish entrepreneurs have an independent profile on the basis of motivation and driving forces, as well as capital and information sources, here interestingly we observe a relatively high dependency on the entrepreneurs’ own ethnic group in terms of hiring employees. While 22 percent of the entrepreneurs explained that they needed to have Turkish employees because of their Turkish clients, 13 percent clearly mentioned that they prefer Turkish employees for many other reasons. Nevertheless, more than half of the entrepreneurs (57 percent) mentioned that they actually preferred to hire Dutch employees.
These figures show that the highest dependency on the entrepreneurs’ own ethnic group when compared with the other factors is shown by the composition of employees. However, some of these figures can also be evaluated as a sign of transformation from the entrepreneurs’ own ethnic group to other groups when hiring employees. On the other hand, when we examine the composition of the clients, we observe that 35 percent of the enterprises have non-Turkish clients, while almost 40 percent have a mixed clientele with a majority (80 percent) of Turkish clients. Although the majority of the enterprises serve non-Turkish clients, the share of Turkish clients is quite high, and here we observe once more a dependency on the entrepreneurs’ own ethnic group.
When we examine the target groups of the enterprises as a part of their goals and strategies, we observe once more a relatively high dependency on clients from the entrepreneurs’ own ethnic group. 35 percent of the entrepreneurs have indicated that their target group is Turks (Table 6). 35 percent of the entrepreneurs mentioned that they had no

152
target group, while 22 percent mentioned that their target group is Dutch natives and other groups. On the other hand, the stated strategies of the majority (57 percent) were to grow the business and to provide more products and services. Specialization was another strategy for 30 percent of the enterprises.
An overall evaluation of the profile of Turkish entrepreneurs and enterprises in the ICT and the FIRE sector shows that the second-generation Turkish entrepreneurship in the Netherlands started after 1996, and there has been an enormous increase in start-up enterprises especially after 2000. Depending on the arrival year of the Turkish immigrants in the Netherlands, we may expect this increase in start-up second-generation enterprises to continue in the future. We may also expect that the sector choice of the second generation Turkish entrepreneurs will be different from that of the first generation, and will probably be more oriented to non-traditional, new developing and promising sectors such as ICT, FIRE or maybe to the education and health sectors where nowadays in many European countries immigrant employment is becoming increasingly significant (between 20 and 30 percent of immigrants work in one of these two sectors in Finland, Switzerland, Sweden and the UK (OECD, 2006)).
The results of our investigation demonstrate that the motivation and driving forces of the second-generation Turkish entrepreneurs stem from both their personal characteristics, shaped by their higher educational level and language ability, and their previous working experience as an employee or entrepreneur in the same sector. The demand for, and a gap in, the sector, as well as the growing and promising structure of the sector seem to play an important role in pulling the second-generation Turkish immigrants to become entrepreneurs. In summary, we can say that the motivation and driving forces of the second-generation Turkish immigrants can be explained by the pull factors. While their main motivation to become entrepreneurs appears to be independent and flexible, the other reason could be that they posses an entrepreneurial spirit which comes from entrepreneurial family tradition, as more than half of the entrepreneurs have an entrepreneur family member.
The results of our study show that the second-generation Turkish entrepreneurs are quite independent on their own ethnic group in terms of obtaining capital and information. They tend to use their own capital and own knowledge and experience and when necessary they tend to apply to formal and financial institutions. We can say that their approach and behaviour is different from their first generation counterparts: it is more formal. This clearly shows that the second-generation Turkish entrepreneurs are quite independent from their ethnic niche. However, when the number and the composition of employees and clients are examined, this picture changes slightly. Although the second-generation Turkish entrepreneurs exhibit an independent profile on the basis of motivation and driving forces, as well as capital and information sources, it is noticeable that there is still a relatively high dependency on their own ethnic group in terms of hiring employees and serving clients. Their relatively higher rate of having Turkish clients as a target group also highlights a relatively high dependency on clients from their own ethnic group. They adopt this strategy in order to

153
benefit from both their own ethnic group and the other groups in the market. Why would they wish to escape from potential and available clients from their own ethnic group? From this perspective, a relatively higher level of employees and clients cannot be seen as an ethnic dependency. On the contrary, this can be evaluated as a way of expanding the market and a transformation period from an internal orientation to an external orientation.
5. KEY FACTORS OF ENTREPRENEURIAL PERFORMANCE AMONG TURKISH ENTERPRISES IN THE ICT AND THE FIRE SECTOR
In this section, we will analyze in more detail the most prominent key factors of entrepreneurial performance among Turkish enterprises in the ICT and the FIRE sector by using a multivariate qualitative classification method, coined rough set analysis. We will first explain rough set analysis that originates from the artificial intelligence methodology. Then in the next section we will evaluate the empirical results of the rough set analysis that enable us to identify the new orientations in migrant entrepreneurship in terms of motivation, sectoral choice, goals and strategies of second generation migrant entrepreneurs.
5.1. Rough set analysis: an introduction The rough set theory developed by Pawlak (1991) has emerged as a major mathematical method to manage uncertainties from inexact, noisy and incomplete information. The applications of rough set theory to solving specific complex problems have been an attractive research topic in recent years and a large number of rough set theory applications has been reported in various fields such as medicine, economics, finance, business, environmental engineering, intelligent control, signal and image analysis, software engineering, decision analysis, social sciences, molecular biology and pharmacy (see for a comprehensive review of the available literature on applications of the rough set theory Wu et al., 2004). Rough set theory is an extension of set theory; it can effectively handle discrete variables with multilevel categories. A rough set provides a representation of a given set using lower and upper approximations when the available information is not sufficient for determining the exact value of the set. The main objective of rough set analysis is to synthesize the approximation of concepts from the acquired data. It is non-parametric and instead of null hypothesis of significance testing, rough set theory provides an alternative way to evaluate the importance of factors. Furthermore, rough set theory can classify cases into groups with similar properties by considering multiple dimensions that help reduce the unobserved heterogeneity.
Rough set data analysis (RSDA) is a classification method for the analysis and classification of non-stochastic (including qualitative and nominal) information. RSDA is an application of Knowledge Discovery in Databases which is concerned with extracting useful information from a complex multivariate data base (Fayyad et al., 1996). The rough set methodology for knowledge discovery provides a powerful tool for knowledge discovery from large and incomplete data set. The purpose of rough set is to find models that describe or

154
classify measurement data. This task falls into an extensive category of pattern recognition, which, broadly speaking, can be said to be the science of constructing models that describe or classify measurements. Rough set data analysis is based on minimal model assumptions in terms of formal causal specifications and admits ignorance when no proper conclusion can be drawn from the data at hand (Ziarco, 1998). Hence, it is more exploratory and heuristic in nature, and aims to generate conditional statements on classified data. It is particularly suitable for qualitative multi-dimensional case study research, where the aim is more to highlight salient features in causal pattern recognition than to extract representative statistical outcomes.
RSDA draws all its information from the a priori given data set. In RSDA, there is no numerical system that is different from the operationalisation of the observed data, and there are no outside parameters to be chosen, nor is there any deductive statistical model to be fitted. RSDA can be viewed as a preprocessing device to recognize the potentially important explanatory variables. Data reduction is the main feature of RSDA, as it allows to represent hidden structures in the database. The final outcome of the data base is a decision table from which decision rules can be inferred by using rough set analysis. The rules are logical statements (if…then) which represent the relationship between the description of objects and their assignment to particular classes (see Pawlak 1991; 1992). Details on rough set analysis both from a methodological and from an applied perspective can inter alia be found in Degoun et al., 1997; Famili et al., 1997; Fayyad et al., 1996; Pawlak, 1991, 1992; Slowinski, 1995; van den Bergh et al., 1998; Wu et al., 2004 and Ziarco, 1998. The reader is referred to these studies for more details.
The rough set analysis in our study is carried out with the help of the computer program Rough Set Data Explorer (ROSE). We use the ROSE software here to identify the new orientations in migrant entrepreneurship in terms of motivation, sectoral choice, goals and strategies. The rough set theory allows us to analyze the new orientations in multiple dimensions and to highlight the most prominent factors behind the new sectors in our case ICT and FIRE sector and sectoral choice of migrant entrepreneurs. In our study, the data system on Turkish entrepreneurs in ICT and FIRE sector is often of a categorical nature, for instance, nominal data (e.g., generation, education etc.) or ordinal (e.g., rank order data on age categories etc.) therefore it is suitable for classification and explanation. Rough set analysis acts then as a specific multidimensional classification approach that appears to be able to identify various important factors in orientation of migrant entrepreneurs. In the next sub-section, we will describe in some more detail the data base used in our study.
5.2. Results of rough set analysis The application of rough set analysis proceeds in two successive steps; (i) the construction of an information survey, and (ii) the classification of information contained in the survey. In our case, the information survey consists of entrepreneurial characteristics of migrant entrepreneurs in terms of their motivation and orientation (Table 7). As can be seen in Table 7,

155
our rough set framework consists of 17 variables under three categories viz. personal characteristics (e.g., age, generation, education level), motivation and driving forces (e.g., position before start, previous experience, entrepreneur family member) and orientation (e.g., nationality of employees, nationality of clients, target group). In our rough set framework we used all variables as conditional attributes and two variables including A8(D2) sectoral choice and A17(D1) sector as decision attributes as well. Therefore, we deployed the rough set analysis separately for both the sector and sectoral choice as decision variables to highlight the characteristics of the sectors (ICT and FIRE) investigated and the factors which are determinant in sectoral choice and orientation of migrant entrepreneurs. Table 7 Classification of explanatory variables/attributes
ATTRIBUTES*
PERSONAL CHARACTERISTICS
A7. Previous sector ORIENTATION
A1. Age 1 = Employee in the same sector A13. Nationality of employees
1 = 20-29 2 = Employee in a different sector 1 = Only Turks
2 = 30-39 3 = Entrepreneur in the same sector 2 = Only Dutch natives
3 = 40-49 4 = Entrepreneur in a different sector 3 = More Turks than Dutch natives
4 = 50> 5 = Student 4 = More Dutch natives than Turks
A2. Generation A8(D2). Sectoral choice 5 = Other
1 = First generation 1 = GAP/Big demand A14. Trust
2 = Second generation 2 = Sufficient knowledge/info; work experience
1 = Need for Turkish employees
A3. Education Level 3 = Sufficient knowledge/info; education 2 = No Turkish employees at all
1 = Secondary education A9. Situation of the sector 3 = Preference for Turkish employees
2 = Middle vocational training 1 = Growing/increasing 4 = Preference for Dutch native employees
3 = High vocational training 2 = Smaller/decreasing A15. Nationality of clients
4 = University 3 = Changes a lot 1 = Only Turks
A4. Education Place 4 = High competition 2 = Only Dutch natives
1 = The Netherlands A10. Turks in the sector 3 = More Turks than Dutch natives
2 = Turkey 1 = Growing/increasing 4 = More Dutch natives than Turks
3 = Other 2 = Smaller/decreasing 5 = Other
MOTIVATION AND DRIVING FORCES
3 = No idea A16. Target group
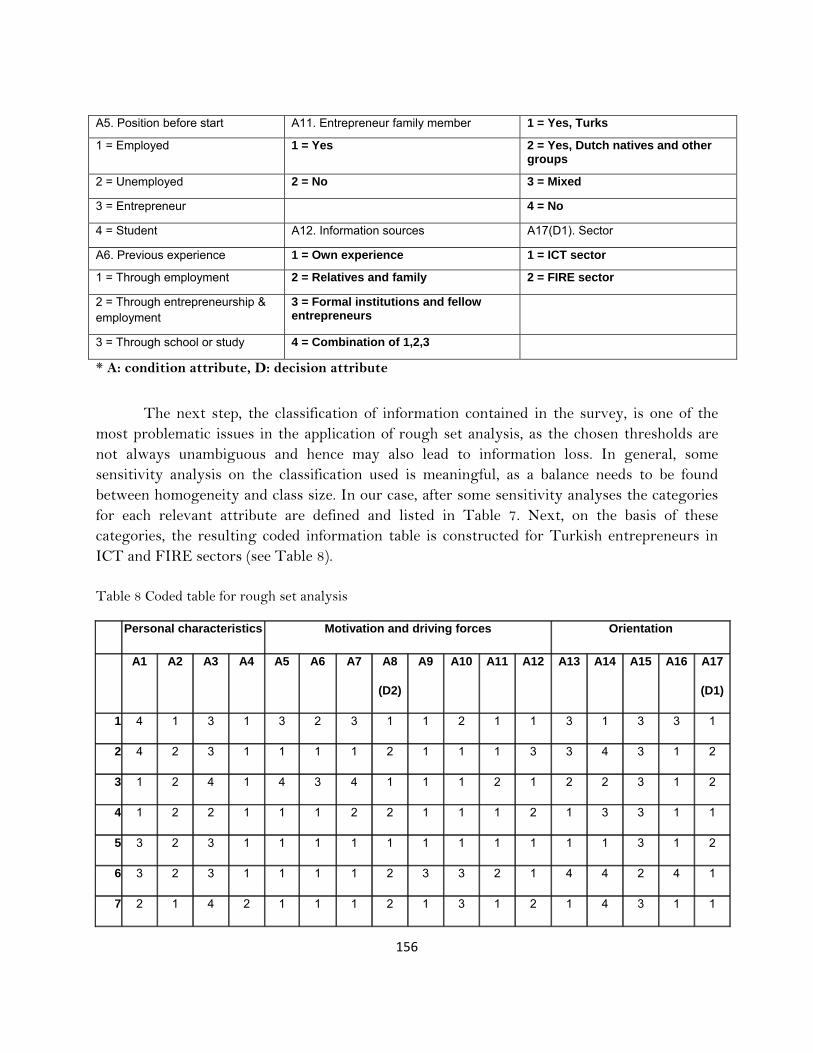
156
A5. Position before start A11. Entrepreneur family member 1 = Yes, Turks
1 = Employed 1 = Yes 2 = Yes, Dutch natives and other groups
2 = Unemployed 2 = No 3 = Mixed
3 = Entrepreneur 4 = No
4 = Student A12. Information sources A17(D1). Sector
A6. Previous experience 1 = Own experience 1 = ICT sector
1 = Through employment 2 = Relatives and family 2 = FIRE sector
2 = Through entrepreneurship & employment
3 = Formal institutions and fellow entrepreneurs
3 = Through school or study 4 = Combination of 1,2,3
* A: condition attribute, D: decision attribute
The next step, the classification of information contained in the survey, is one of the
most problematic issues in the application of rough set analysis, as the chosen thresholds are not always unambiguous and hence may also lead to information loss. In general, some sensitivity analysis on the classification used is meaningful, as a balance needs to be found between homogeneity and class size. In our case, after some sensitivity analyses the categories for each relevant attribute are defined and listed in Table 7. Next, on the basis of these categories, the resulting coded information table is constructed for Turkish entrepreneurs in ICT and FIRE sectors (see Table 8).
Table 8 Coded table for rough set analysis
Personal characteristics Motivation and driving forces Orientation
A1 A2 A3 A4 A5 A6 A7 A8
(D2)
A9 A10 A11 A12 A13 A14 A15 A16 A17
(D1)
1 4 1 3 1 3 2 3 1 1 2 1 1 3 1 3 3 1
2 4 2 3 1 1 1 1 2 1 1 1 3 3 4 3 1 2
3 1 2 4 1 4 3 4 1 1 1 2 1 2 2 3 1 2
4 1 2 2 1 1 1 2 2 1 1 1 2 1 3 3 1 1
5 3 2 3 1 1 1 1 1 1 1 1 1 1 1 3 1 2
6 3 2 3 1 1 1 1 2 3 3 2 1 4 4 2 4 1
7 2 1 4 2 1 1 1 2 1 3 1 2 1 4 3 1 1

157
8 3 1 4 2 1 1 1 2 3 2 2 3 1 4 5 4 1
9 1 2 1 3 1 1 4 1 4 2 1 1 3 4 4 4 1
10 3 2 2 1 1 2 4 1 1 1 2 4 3 1 3 1 2
11 2 2 3 1 1 2 1 2 4 2 1 1 1 4 4 4 1
12 2 2 2 1 1 2 4 1 4 3 2 1 4 4 4 4 2
13 2 2 4 1 4 3 5 2 1 3 1 1 4 4 2 4 1
14 2 2 4 1 1 1 1 1 2 2 1 1 1 1 3 1 2
15 3 2 1 1 1 1 1 2 2 2 2 1 1 3 2 2 1
16 2 2 2 1 1 1 1 2 3 2 2 1 1 1 2 3 1
17 3 2 2 1 1 1 1 2 3 2 2 1 1 4 4 2 1
18 3 2 4 1 1 1 1 2 1 1 2 3 2 4 2 2 1
19 2 2 4 1 4 3 5 2 4 3 1 4 2 4 5 4 1
20 2 1 2 1 1 1 1 2 2 2 2 2 3 4 4 2 1
21 2 1 3 1 1 1 1 2 1 2 1 1 5 4 4 2 1
22 1 2 2 1 4 3 1 1 1 1 1 3 2 2 5 4 1
23 2 1 4 2 1 1 1 1 1 2 2 1 1 3 3 1 1
In the technical application of the rough set analysis, three main sets of indicators and
outputs, viz. (i) the reducts and the core, (ii) the lower and upper approximation, and (iii) rules, can next be calculated.
1. The reduct -in other words, a minimal set of attributes- is the least minimal subset which ensures the same quality of classification as the set of all attributes. Intersection of all reducts/minimal (in other words, an attribute that appears in all minimal sets) is defined as the core. The core is a collection of the most significant attributes for the classification in the system. For our data set, no core attribute is found and with a limitation on the number - in order to get the more concise results - ten sets of reducts are found for sector and sectoral choice of migrant entrepreneurs. The reducts for each set of data on the basis of the decision variable for sector and sectoral choice are given in Table 9. Next, the relative frequencies of appearance of the condition attributes in the reducts for each data set are given in Table 10.

158
Table 9 Found reducts for sector and sectoral choice
Sector Sectoral Choice
1 {A9, A10, A11, A14} 1 {A4, A13, A14, A17}
2 {A4, A8, A14, A16} 2 {A9, A10, A13, A14}
3 {A8, A13, A14, A16} 3 {A7, A14, A15}
4 {A9, A13, A14, A16} 4 {A10, A13, A14, A15, A16}
5 {A6, A8, A12, A14, A16} 5 {A11, A13, A14, A15}
6 {A3, A14, A16} 6 {A12, A13, A15}
7 {A4, A11, A14, A15, A16} 7 {A7, A14, A16}
8 {A10, A14, A15, A16} 8 {A10, A13, A14, A16, A17}
9 {A11, A12, A14, A15, A16} 9 {A11, A13, A14, A16, A17}
10 {A13, A14, A15, A16} 10 {A12, A13, A16, A17}
Table 10 Frequency of attributes in reducts for sector and sectoral choice
Sector Sectoral Choice
Attribute Frequency
(#)
Frequency
(%)
Attribute Frequency
(#)
Frequency
(%)
A3 1 10 A4 1 10
A4 2 20 A7 2 20
A6 1 10 A9 1 10
A8 3 30 A10 3 30
A9 2 20 A11 2 20
A10 2 20 A12 2 20
A11 3 30 A13 8 80
A12 2 20 A14 8 80

159
A13 3 30 A15 4 40
A14 10 100 A16 5 50
A15 4 40 A17 4 40
A16 9 90
Legend:
A3: Education level A11: Entrepreneur family member
A4: Education place A12: Information sources
A6: Previous experience A13: Nationality of employees
A7: Previous sector A14: Preferences for employees
A8: Sectoral choice A15: Nationality of clients
A9: Situation of the sector A16: Target group
A10: Turks in the sector A17: Sector
When we examine the relative frequencies of appearance of the condition attributes in reducts for sector and sectoral choice, the results show that three factors/attributes viz. A13 (nationality of employees), A14 (preferences for employees) and A16 (target group) appear as relatively important attributes with higher frequency rates. This means that these attributes strongly influence the sector structure and sectoral choice of Turkish entrepreneurs.
2. The lower and upper approximation -and derived accuracy of relationships for each value class of the decisional variable- is another indicator from a rough set analysis. The latter is the lower divided by the upper approximation of each class. Accuracy and quality of classification can also be derived from the choice of thresholds. Accuracy and quality of the classification for sector and sectoral choice are given in Table 11. For all classes of sector and sectoral choice the accuracy appears to be 1. Also the accuracy and quality of classification are equal to 1. This value is the maximum value in all these cases. This means on the basis of the chosen sector and sectoral choice variables in our sample are fully discernible regarding the classes of decision variables.
Table 11 Accuracy and quality of the classification for sector and sectoral choice
Sector
Class Accuracy Lower approximation Upper approximation
ICT 1 17 17
FIRE 1 6 6
Accuracy of classification: 1
Quality of classification: 1

160
Sectoral Choice
Class Accuracy Lower approximation Upper approximation
Demand 1 9 9
Education&Experience 1 14 14
Accuracy of classification: 1
Quality of classification: 1
NOTE: The accuracy for each class is the lower divided by the upper approximation.
3. The rules -exact or approximate relationships between explanatory variables and dependent variables- offer the possibilities to extract conditional causal structures from our data set. Decision rules are conditional statements that are expressed in the form of “if-then” statements. A rule may be exact or approximate. An exact rule (or deterministic) guarantees that a particular combination of categories of the condition attributes results in only one particular category of the decision attribute (same conditions, same decisions). An approximate rule (or non-deterministic), on the other hand, states that a particular combination of categories of the condition attributes corresponds to more than one category of the decision attribute (same conditions, different decisions). Therefore, only in the case of exact rules, using the information contained in the decision table, it is always possible to state with certainty whether an object belongs to a certain class of the decision variable. The quality of the decision rule is indicated by its strength. The strength of a rule represents the number of observations or cases that are in accordance with that rule. Table 12 shows the rules and their strengths that can be generated from our data set for Turkish entrepreneurs. We only use the rules with strength of three or more. This means that the relation described in the rule appears at least three times in the data set, but in some cases it also appears eight or nine times. Therefore, we selected the most significant rules which have a higher strength that means the number of cases matching the rule. This information enables us to classify the important factors behind the orientation and sectoral choice of migrant entrepreneurs.
Table 12 Rules generated by the rough set analysis for sector and sectoral choice
Rules Description of rules Strength
(#)
Strength
(%)
Sector
rule 1 (A7 = 1) & (A11 = 2) => (D1 = 1) 8 47.06
rule 2 (A1 = 2) & (A8 = 2) => (D1 = 1) 7 41.18
rule 3 (A1 = 1) & (A11 = 1) => (D1 = 1) 3 17.65
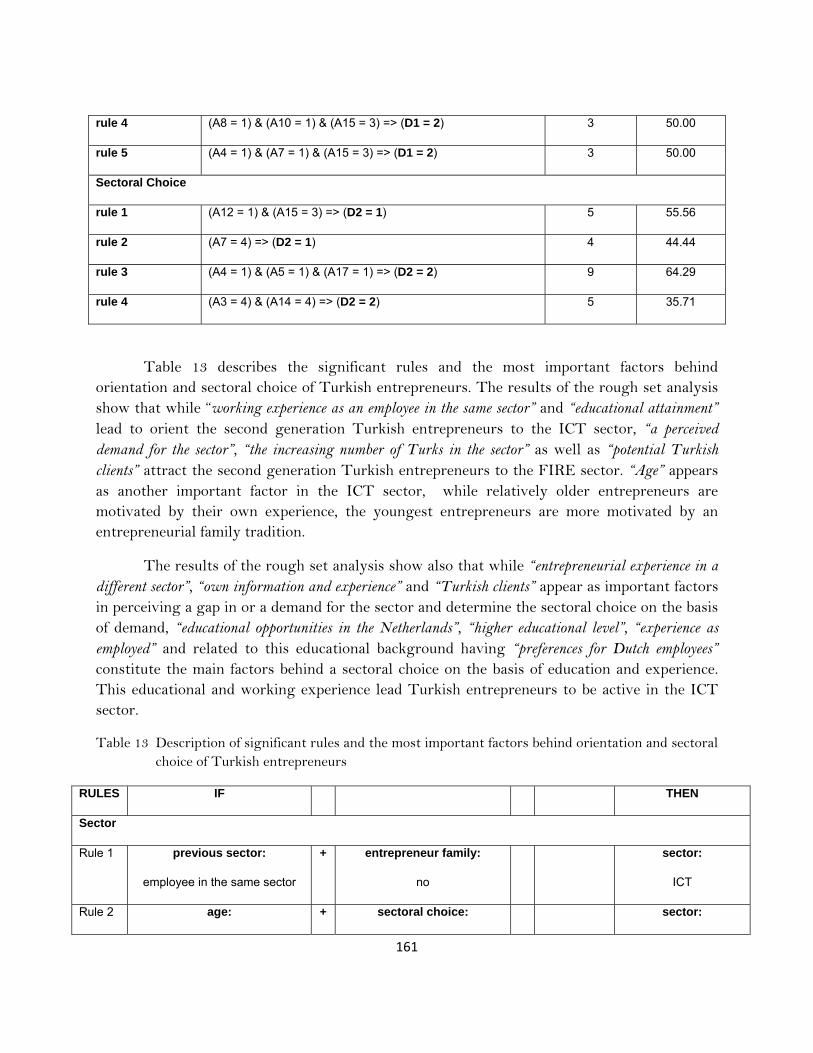
161
rule 4 (A8 = 1) & (A10 = 1) & (A15 = 3) => (D1 = 2) 3 50.00
rule 5 (A4 = 1) & (A7 = 1) & (A15 = 3) => (D1 = 2) 3 50.00
Sectoral Choice
rule 1 (A12 = 1) & (A15 = 3) => (D2 = 1) 5 55.56
rule 2 (A7 = 4) => (D2 = 1) 4 44.44
rule 3 (A4 = 1) & (A5 = 1) & (A17 = 1) => (D2 = 2) 9 64.29
rule 4 (A3 = 4) & (A14 = 4) => (D2 = 2) 5 35.71
Table 13 describes the significant rules and the most important factors behind orientation and sectoral choice of Turkish entrepreneurs. The results of the rough set analysis show that while “working experience as an employee in the same sector” and “educational attainment” lead to orient the second generation Turkish entrepreneurs to the ICT sector, “a perceived demand for the sector”, “the increasing number of Turks in the sector” as well as “potential Turkish clients” attract the second generation Turkish entrepreneurs to the FIRE sector. “Age” appears as another important factor in the ICT sector, while relatively older entrepreneurs are motivated by their own experience, the youngest entrepreneurs are more motivated by an entrepreneurial family tradition.
The results of the rough set analysis show also that while “entrepreneurial experience in a different sector”, “own information and experience” and “Turkish clients” appear as important factors in perceiving a gap in or a demand for the sector and determine the sectoral choice on the basis of demand, “educational opportunities in the Netherlands”, “higher educational level”, “experience as employed” and related to this educational background having “preferences for Dutch employees” constitute the main factors behind a sectoral choice on the basis of education and experience. This educational and working experience lead Turkish entrepreneurs to be active in the ICT sector.
Table 13 Description of significant rules and the most important factors behind orientation and sectoral choice of Turkish entrepreneurs
RULES IF THEN
Sector
Rule 1 previous sector:
employee in the same sector
+ entrepreneur family:
no
sector:
ICT
Rule 2 age: + sectoral choice: sector:
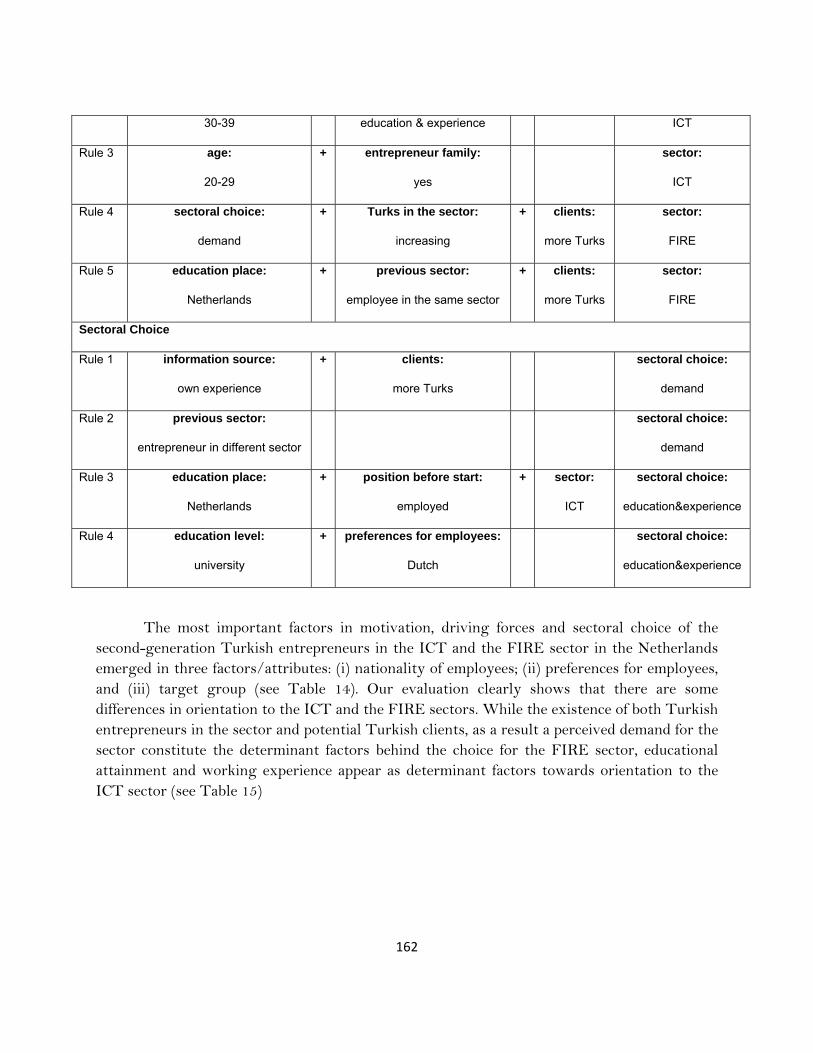
162
30-39 education & experience ICT
Rule 3 age:
20-29
+ entrepreneur family:
yes
sector:
ICT
Rule 4 sectoral choice:
demand
+ Turks in the sector:
increasing
+ clients:
more Turks
sector:
FIRE
Rule 5 education place:
Netherlands
+ previous sector:
employee in the same sector
+ clients:
more Turks
sector:
FIRE
Sectoral Choice
Rule 1 information source:
own experience
+ clients:
more Turks
sectoral choice:
demand
Rule 2 previous sector:
entrepreneur in different sector
sectoral choice:
demand
Rule 3 education place:
Netherlands
+ position before start:
employed
+ sector:
ICT
sectoral choice:
education&experience
Rule 4 education level:
university
+ preferences for employees:
Dutch
sectoral choice:
education&experience
The most important factors in motivation, driving forces and sectoral choice of the second-generation Turkish entrepreneurs in the ICT and the FIRE sector in the Netherlands emerged in three factors/attributes: (i) nationality of employees; (ii) preferences for employees, and (iii) target group (see Table 14). Our evaluation clearly shows that there are some differences in orientation to the ICT and the FIRE sectors. While the existence of both Turkish entrepreneurs in the sector and potential Turkish clients, as a result a perceived demand for the sector constitute the determinant factors behind the choice for the FIRE sector, educational attainment and working experience appear as determinant factors towards orientation to the ICT sector (see Table 15)

163
Table 14 Most important factors in motivation, driving forces and sectoral choice of the second-generation Turkish entrepreneurs in the ICT and the FIRE sector
Rank of order ICT/FIRE sector
1 Nationality of employees
2 Preferences of employees
3 Target group
Table 15 Determinant factors for sectoral choice
ICT sector FIRE sector
Education attainment Existence of Turkish entrepreneurs in the sector
Working experience Existence of potential Turkish clients
Perceived demand
6. RETROSPECT AND PROSPECT
A growing number of the second generation migrant entrepreneurs and an orientation to non-traditional sectors have become the new trends in migrant entrepreneurship in recent years. The second generation have contributed to the emergence of new areas of immigrant business activity such as ICT and creative industries. Similar trends, a sectoral change in immigrant entrepreneurship towards especially to producer services and an increasing number of second generation immigrant entrepreneurs in these sectors, are also observed in the Netherlands.
Our study investigated the new –external- orientations in migrant entrepreneurship in terms of motivation, sectoral choice, goals and strategies of the second generation migrant entrepreneurs while addressing the second generation Turkish entrepreneurs in the ICT and the FIRE sector in the Netherlands. The results of our investigation show that a new orientation to the non-traditional sector or in other words, an external orientation with a combination of personal characteristics, skills and experience may produce a very high economic performance and success level of the second-generation Turkish entrepreneurs. Therefore, this new orientation may also help them to escape from the ethnic enclave and breake out from their ethnic dependency. Moreover, this external orientation may also help them to expand their market. However, this external orientation does not mean that they will not also continue to benefit from their own ethnic group. The results of our study show that the motivation and driving forces of the second generation Turkish entrepreneurs are stemming from both their personal characteristics shaped by their higher educational level and
164
their previous working experience as an employee or entrepreneur in the same sector. The demand for and a gap in the sector as well as the growing and promising structure of the sector play also an important role in pulling the second generation Turkish immigrants to become entrepreneur in these new sectors.
The results of our study by means of the rough set analysis show that the most important factors in motivation, driving forces and sectoral choice of the second generation Turkish entrepreneurs in the ICT and FIRE sector in the Netherlands have emerged in three factors/attributes:
• Nationality of employees • Preferences for employees • Target group
The results of the rough set analysis show also that there are some differences in orientation to the ICT and the FIRE sectors. While educational attainment and working experience appear as determinant factors towards orientation to the ICT sector, the existence of both Turkish entrepreneurs in the sector and potential Turkish clients, as a result a perceived demand for the sector constitute the determinant factors behind the choice for the FIRE sector. An overall evaluation shows that Turkish entrepreneurs in the ICT sector exhibit a more independent feature than that in the FIRE sector. FIRE sector seems to be more dependent to ethnic market and ethnic niche. However, the general results of our study show that the second generation Turkish entrepreneurs in the Netherlands have started to orient to new and non-traditional sectors like ICT and FIRE sectors instead of staying in traditional hospitality sector which is popular among Turkish entrepreneurs.
Our findings brought to light new patterns in business performance of ethnic entrepreneurs. It turns out that the business profile of migrant entrepreneurship is changing from the first generation to the next one. This ‘break-out’ strategy positions migrant entrepreneurs in a mature competitive context, and herhalds essentially a socio-economic emancipation of this class of entrepreneurs. Our study has indentified the success conditions for business performance of this new class of migrant entrepreneurs.
References
Aghion, P. (2002) ‘Schumpeterian Growth Theory and the Dynamics of Income Inequality’, Econometrica, 70(3): 855–882.
Audretsch, D.B., Thurik, A.R. (2001) ‘What's New about the New Economy? Sources of Growth in the Managed and Entrepreneurial Economies’, Industrial and Corporate Change, 1(10): 267-315.

165
Baycan-Levent, T., Masurel, E., Nijkamp, P. (2003) ‘Diversity in Entrepreneurship: Ethnic and Female Roles in Urban Economic Life’, International Journal of Social Economics, 30(11-12): 1131-1161.
Baycan-Levent, T., Masurel, E., Nijkamp, P. (2006) ‘Gender Differences in Ethnic Entrepreneurship’, International Journal of Entrepreneurship and Innovation Management, 6(3): 173-190.
Bergh, J.C.J.M. van den, Button, K., Nijkamp, P., Pepping, G. (1998) Meta-analysis in Environmental Economics. Dordrecht: Kluwer.
Bergh, J.C.J.M. van den, Faber, A., Idenburg, A.M., Oosterhuis, F.J. (2007) Evolutionary Economics and Environmental Policy: Survival of the Greenest. Cheltenham: Edward Elgar.
Bijl, R.V., Zorlu, A., van Rijn, A.S., Jeenissen, R.P.W., Blom, M. (2005) The Integration Monitor 2005: The social integration of migrants monitored over time: trend and cohort analyses. Ministry of Justice Research and Documentation Centre and Statistics Netherlands.
Boschma, R.A., Lambooy, J.G. (2001) ‘Evolutionary economics and regional policy’, The Annals of Regional Science, 35(1): 113-131.
Brücker, H., Epstein, G.S., McCormick, B., Saint-Paul, G., Venturini, A., Zimmermann, K. (2002) ‘Managing migration in the European welfare state’, in Boeri, T., Hanson, G. and McCormick, B. (eds) Immigration policy and the welfare system. Oxford: OUP.
Centraal Bureau voor de Statistiek (CBS) (2007) http://www.cbs.nl
Choenni, A. (1997) Veelsoortig Assortiment. Amsterdam: Het Spinhuis.
Cooper, R.S. (2003) ‘Purpose and Performance of the Small Business Innovation Research (SBIR) Program’, Small Business Economics, 20(2): 137-151.
Dagevos, J., Gijsberts, M., van Praag, C. (2003) Rapportage minderheden 2003: onderwijs, arbeid en sociaal-culturele integratie. Den Haag: SCP.
Dana, L.P. (ed.) (2007) ‘Handbook of Research on Ethnic Minority Entrepreneurship, Edward Elgar, Cheltenham.
Deogun J., Raghavan, V., Sarkar, A., Sever, H. (1997) ‘Data Mining: Trends in Research and Development’, in Lin, T.Y. and Cercone, N. (eds) Rough Sets and Data Mining. Analysis for Imprecise Data. Dordrecht: Kluwer, 4-46.
Dieleman, F. (1993) ‘Multicultural Holland: Myth or Reality?’, in King, R. (ed) Mass Migrations in Europe: The Legacy and the Future. London: Belhaven Press, 118-135.

166
EIM (2004) Monitor Etnisch Ondernemerschap 2004. Onderzoek voor Bedrijf & Beleid, Zoetermeer: Ministerie van Economische Zaken, November 2004.
Euwals, R., Dagevos, J., Gijsberts M., Roodenburg, H. (2007) Immigration, Integration and the Labour Market: Turkish Immigrants in Germany and the Netherlands. Discussion Paper Series, IZA DP No. 2677.
Famili A., Shen, W.M., Weber, R., Simoudis, E. (1997) ‘Data Preprocessing and Intelligent Data Analysis’, Intelligent Data Analysis, 1(1): 33-47.
Fayyad, U., Piatetsky-Shapiro, G., Smyth, P. (1996) ‘From Data Mining to Knowledge
Discovery: An Overview’, Artificial Intelligence Magazine, 17: 37-54.
Fujita, M., Krugman, P. (2004) ‘The New Economic Geography: Past, Present and the Future’, in Florax, R.J.G.M. and Plane, D. (eds) Fifty Years of Regional Science. Heidelberg: Springer.
Garssen, J., Zorlu, A. (2005) ‘Demografie’, in Jaarrapport Integratie 2005. Voorburg: Den Haag, SCP/ WODC / CBS, 14-27.
Groot, H.L.F. de, Nijkamp, P., Stough, R. (2004) Entrepreneurship and Regional Economic Development: A Spatial Perspective. Cheltenham: Edward Elgar.
Guba, E., Lincoln, Y. (1989), Fourth Generation Evaluation, Beverly Hills, Sage, Ca.
Hartog, J., Vriend, N. (1990) ‘Young Mediterraneans in the Dutch labour market: A Comparative Analysis of Allocation and Earnings’, Oxford Economic Papers, 42: 379-401.
Hébert, R.F., Link, A.N. (1989) ‘In Search of the Meaning of Entrepreneurship’, Small Business Economics, 1: 39-49.
Hofstede, G. (1991) Cultures and Organizations: Software of the Mind. London: McGraw-Hill.
Houtzager, D., Rodrigues, P.R. (2002) Migrants, Minorities and Employment in the Netherlands; Exclusion, Discrimination and Anti-discrimination. Raxen 3 Report to the European Monitoring Centre on Racism and Xenophobia (EUMC).
Iyigun, M.F., Owen, A.L. (1998) ‘Risk, Entrepreneurship and Human-capital Accumulation’, American Economic Review, 88(2): 454-457.
Jacobs, J. (1961) The Life and Death of Great American Cities. New York: Random House.

167
Jansen, M., de Kok, J., Spronsen, J., Willemsen, S. (2003) Immigrant Entrepreneurship in the Netherlands –Demographic Determinants of Entrepreneurship of Immigrants from Non-Western Countries’– Scales. Zoetermeer.
Jones, T., Ram, M. (2007), Re-embedding the Ethnic Business Agenda, Work, Employment and Society, 21(3): 439-457.
Kaa, van de D.J. (1996) ‘International Mass Migration: A Threat to Europe's Borders and Stability?’ De Economist, 144(2):
Kamer van Koophandel (2006) www.kvk.nl
Kassichieh, S.K., Kirchhoff, B.A., Walsh, S.T., McWorter, P.J. (2002) ‘The Role of Small Firms in the Transfer of Disruptive Technologies’, Technovation, 22: 667-674.
Kleinknecht, R.A. (1982) ‘The Origins and Remission of Fear in a Group of Tarantula Enthusiasts’, Behaviour Research and Therapy, 20: 437–443.
Kloosterman, R.C., Rath, J. (2001) ‘Immigrant Entrepreneurs in Advanced Economics, Journal of Ethnic and Migration Studies, 27(2): 189-201.
Kraal, K., Zorlu, A. (1998) City Template Amsterdam. Basic Information on Ethnic Minorities and Their Participation. Report According to the Grid for City Templates of the MPMC Project, Amsterdam: IMES.
Leydesdorff, L., Etzkowitz, H. (1998) ‘The Triple Helix as a Model for Innovation Studies (Conference Report)’, Science & Public Policy, 25(3): 195-203.
Lucas R.E. (1988) ‘On the Mechanics of Economic Development’, Journal of Monetary Economics, 22(1): 3-42.
Lucassen, L., Penninx, R. (1997) Newcomers. Immigrants and their Descendants in the Netherlands 1550-1995. Amsterdam: Het Spinhuis (published originally in Dutch in 1994: Nieuwkomers, Nakomelingen, Nederlanders).
Lumpkin, G.T., Dess, G.G. (1996) ‘Clarifying the Entrepreneurial Orientation and Linking it to Performance’, Academy of Management Review, 21: 135-152.
Malecki, E.J. (1997) Technology & Economic Development: The Dynamics of Local Regional and National Competitiveness. Harlow: Addison Wesley Longman.
Markusen, A. (1996) ‘Sticky Spaces in Slippery Space: A Typology of Industrial Districts’, Economic Geography, 72: 293-313.
168
Nelson, R., Winter, S. (1982) An Evolutionary Theory of Economic Change. Cambridge, MA: Belknap Press of Harvard University.
Masurel, E., Nijkamp, P. (2004) ‘Differences between First-generation and Second-generation Ethnic Start-ups: Implications for a New Support Policy’, Environment and Planning C: Government and Policy; 22(5): 721-737.
Nijkamp, P., Poot, J. (1998) ‘Spatial Perspectives on New Theories of Economic Growth’, Annals of Regional Science, 32(1): 7-37.
Oort, F.J. van, Atzema, O.A.L.C. (2004) ‘On the Conceptualization of Agglomeration Economics: The Case of New Firm Formation in the Dutch ICT Sector’, Annals of Regional Science, 38: 263-290.
OECD (2006) International Migration Outlook. SOPEMI 2006 Edition, OECD, Paris.
Pawlak, Z. (1991) Rough Sets. Dordrecht: Kluwer.
Pawlak, Z. (1992) ‘Rough Sets: Introduction’, in R. Slowinski (ed) Intelligent Decision Support - Handbook of Applications and Advances of the Rough Set Theory. Dordrecht: Kluwer,1-2.
Piore, M.J., Sabel, C.F. (1984) ‘The Second Industrial Divide’ in Possibilities for Prosperity. New York: Basic Books.
Poot, J. (2007) Demographic Change and Regional Competitiveness: The Effects of Immigration and Ageing. Population Studies Centre, Discussion Papers, No. 64.
Rath, J. (ed.) (2000), Immigrant Business, MacMillan, Baringstoke.
Romer, P.M. (1990) ‘Endogenous Technological Change’, Journal of Political Economy, 98(5): S71-S102.
Rusinovic, K. (2006) Dynamic Entrepreneurship: First and second-generation immigrant entrepreneurs in Dutch cities. IMISCOE Dissertations, Amsterdam University Press.
Schumpeter, J. A. (1957) Economic Doctrine and Method. London: Allen & Unwin.
Slowinski, R. (1995) Intelligent Decision Support: Handbook of Applications and Advances of Rough Set Theory. Dordrecht: Kluwer. Sociaal Cultureel Planbureau (SCP)/LAS (2004/2005).
Stiles, C., Galbraith, C. (eds.) (2004), Ethnic Entrepreneurship, Elsevier, Oxford.

169
Tillie, J., Slijper, B. (2006) ‘Immigrant Political Integration and Ethnic Civic Communities in Amsterdam’, in Benhabib, S. and Shapiro, I. (eds) Identities, Affiliations, and Allegiances. Cambridge University Press.
Waldinger, R., Aldrich H., Ward R. (eds) (1990) Ethnic Entrepreneurs. Newbury Park, Ca.: Sage Publishers.
Ward, R., Jenkins, R. (eds) (1984) Ethnic Communities in Business. Cambridge: Cambridge University Press.
Wennekers, S., Thurik, A.R. (1999) ‘Linking Entrepreneurship and Economic Growth’, Small Business Economics, 13(1): 27-55.
Wu, W., Zhang, W. (2004) ‘Constructive and Axiomatic Approaches of Fuzzy Approximation Operators’, Information Sciences, 159(3-4): 233-254.
Ziarco, W. (1998) ‘Rough Set as a Methodology for Data Mining’, in Skowron, A. and Polkowski, L. (eds) Rough Set in Knowledge Discovering. Heidelberg: Physica Verlag, 554-576.
Zorlu, A., Hartog, J. (2001) Migration and Immigrants: The case of the Netherlands. Prepared for Migration Policy and the Economy: International Experiences, Munchen: Hans Seidel Stiftung.
Zorlu, A., Traag, T. (2005) ‘Opleidingsniveau en taalvaardigheid, in Jaarrapport Integratie 2005. Den Haag, Voorburg: SCP / WODC / CBS, 44-56.
170
MIGRANT ENTREPRENEURSHIP AND NEW URBAN ECONOMIC OPPORTUNITIES – IDENTIFICATION OF CRITICAL SUCCESS FACTORS BY MEANS OF QUALITATIVE PATTERN RECOGNITION ANALYSIS
Abstract
Nowadays, migrants form a significant share of the urban population, and their business is critical for urban economic growth. This paper addresses the key factors determining the position of migrant entrepreneurs in the urban economy in the Netherlands. In order to develop a solid assessment of CSFs for migrant entrepreneurs, and to understand business performance in a competitive urban environment, this study will investigate the entrepreneurial behaviour of migrants in Dutch cities from a micro-economic perspective by paying attention to the entrepreneurial behaviour of migrants, the role of their social networks, and the innovative potential of new growth markets in a city. Our research employs a comparative statistical analysis of empirical findings in order to map out opportunities, success conditions and bottlenecks for migrant entrepreneurs. Given our largely categorical database, we will employ a qualitative causal pattern recognition technique, viz. rough set analysis, to systematically assess the conditions for successful entrepreneurship of migrants.
KEY WORDS: Migrant entrepreneurship, rough set analysis, critical success factors, categorical pattern recognition analysis
*Source: Nijkamp, P., Sahin, M., and Baycan-Levent, T. (2010), Migrant Entrepreneurship and New Urban Economic Opportunities – Identification of Critical Success Factors by Means of Qualitative Pattern Recognition Analysis, Journal of Economic and Social Geography (TESG), Vol. 101, No. 4, pp. 371-391.

171
1. MIGRANTS IN BUSINESS
Our globalizing world is increasingly showing the footprints of the high geographic mobility of people, ideas, information, capital and goods. This high degree of geographic interaction and spatial dynamics is clearly mirrored in recent high migration rates across national borders. Immigration towards large cities is indeed a contemporary and clearly visible phenomenon of growing socio-demographic importance in many countries. However, the influx of many foreign migrants is fraught with serious social tensions in various host countries caused by a wide variety of negative socio-cultural and economic externalities. Hence, we witness an increasing pressure to limit foreign migration on the grounds that the absorption capacity of host countries has been reached (see, e.g., Borjas, 2005; Dustmann and Glitz, 2005; Longhi et al., 2007). These negative externalities hold for both the housing market and the labour market in large agglomerations. Consequently, there is a tendency to see migrants more as a source of problems than as a source of new opportunities for the urban economy.
In an open and globalized world characterized by an increasing degree of urbanization, modern cities function as the habitat of international migrants whose involvement in the small and medium-sized enterprise (SME) sector creates a source of new jobs, business dynamism and innovation. Migrant entrepreneurs form a significant part of the SME sector in our cities and may hence be important vehicles for urban vitality. Usually, these migrant entrepreneurs have to work in an unfamiliar and risky business environment. Often, they tend to be risk-avoiding and hence concentrate on traditional market segments (e.g. markets for ethnic products). Consequently, they may be less entrepreneurially-oriented in terms of attitudes to risk concerning undertaking innovative business activities. Reliance on the social networks of their own socio-cultural group may guarantee a certain market share, but may at the same time hamper an outreach strategy towards new and innovative markets (e.g. high-tech/ICT). Woolcock (1998) claimed that the entrepreneurs reliance on their own migrant group and its related network is both developmental and destructive. According to Menzies et al. (2003), an orientation on their own group is actually mainly a benefit to migrant entrepreneurs. And Portes and Jensen (1989) referred to the positive effects of some degree of monopolistic power in migrant entrepreneurship stemming from better access to a relatively protected market. Nevertheless, Lyer and Shapiro (1999) suggested that competition amongst migrant entrepreneurs serving the same limited market niche may increase business failure, especially if the market size is relatively small. It is evident that in recent years the awareness has grown that migrants may contribute
significantly to economic vitality – especially of urban economies − if they are self-employed and innovative. And, therefore, we observe a rising interest in urban migrant (or ethnic)
entrepreneurship. Several scholars − mainly in North-America − have studied the success conditions for entrepreneurs and the interplay between migrant entrepreneurship and its economic impact on cities (for earlier qualitative and anecdotical studies, see Jacobs, 1961). Most of these studies were carried out in the market-oriented system that prevails in the USA,
172
but, in contrast to the USA far less empirical information is available on the success conditions for migrant entrepreneurs in European cities. Our study aims to fill this gap, by paying attention to cultural backgrounds, the role of social networks, and the innovative potential of new growth markets in a city. Besides this, many past studies on migrant entrepreneurship are generally based on small sample surveys, secondary databases, and case studies. There is a clear need for more comprehensive, solid quantitative empirical research in this field based on a larger sample of entrepreneurs, as well as for advanced research into the relative weight of critical success factors (CSFs) for business performance and entry conditions for growth markets amongst migrant entrepreneurs. Clearly, this type of research is not easy, as it is very difficult to obtain trust, cooperation and proper information from migrant entrepreneurs. According to Menzies et al. (2003), they are not predisposed to participation in (survey) research.
So, the main research question in the present paper is under which socio-cultural and economic conditions migrant entrepreneurs can develop a successful business by entering new market segments and hence contributing to a dynamic and innovative urban business climate, a situation that has been emerging already for some time in the US. A creative ‘break-out’ action line may strengthen the economic position of migrants and also contribute to urban vitality by offering new opportunities to cities in multicultural societies in the Netherlands. According to Baycan-Levent et al. (2004) a ‘break-out’ strategy in migrant entrepreneurship can be conceived of as a strategy to escape from the lock-in situation of a relatively small market niche in which a certain migrant group has a dominant socio-economic position regarding several strategic business factors (e.g. capital, clients, and employees). Although migrant entrepreneurship has received quite some attention in the international literature, there is still a need for a thorough and comprehensive quantitative study into the drivers of this phenomenon in modern European cities. This paper aims to investigate the relationship between culture and social networks with a view to the identification of CSFs for business performance and entry into new business markets of migrant entrepreneurs of different ethnic origin in Amsterdam. This study is therefore, employing approaches from different disciplines, such as business administration, urban economics, geography, and the social sciences. It will be based on a broad survey questionnaire distributed to migrant entrepreneurs in the service sector in Amsterdam.
The present paper is organized as follows. Section 2 is devoted to a brief presentation of some key issues in migrant (or ethnic) entrepreneurship. Then, in Section 3 we will describe the empirical database resulting from a survey questionnaire distributed to entrepreneurs in Amsterdam. Section 4 then provides the statistical results from this investigation. Next, in Section 5 we present a recent technique from the artificial intelligence literature, viz. rough set analysis (RSA), in order to offer an explanatory non-parametric and qualitative model for dealing with causalities among categorically measured variables. Section 6 then assesses the results of our RSA for the CSFs for migrant entrepreneurship. Finally, Section 7 makes some retrospective and prospective research comments are offered.
173
2. ETHNIC ENTREPRENEURSHIP: A NEW PANACEA FOR URBAN DECAY
Many cities in Europe have become pluriform and multicultural societies as a result of the structural influx of foreign migrants in the recent decades. In some cities in Europe, ethnic minorities are even tending to become a majority. Guest workers from the Mediterranean countries, refugees and asylum seekers from the Balkans, and economic migrants from Central and Eastern Europe have created a drastic change in the face of modern European cities (see Gorter et al., 1998). The influx of foreign migrants has certainly brought about economic advantages (e.g. the fulfillment of structural vacancies in various segments of the labour market), but it has also caused a multiplicity of social and economic tensions (e.g. in the local housing market, ghetto formation in cities, differences in lifestyle and behaviour, and socio-cultural stress situations) (see, e.g. Borjas 1990; Kloosterman et al., 1998; Pahl 1984; Pinch, 1993; Piore and Sabel, 1984). With only a few exceptions, ethnic groups belong in general to the lower socio-economic segment of European cities, mainly because these groups lack education and skills. Their lower position on the socio-economic ladder has prompted them to search for other socio-economic possibilities, in particular self-employment. It is this movement that is generally referred to as ’ethnic (or migrant) entrepreneurship’ (see, e.g., van Delft et al., 2000; Masurel et al., 2002; Min, 1987; Waldinger et al., 1990; Ward and Jenkins, 1984). After the first wave of orientation towards ethnic products, ethnic markets and customers, or indigenous ethnic business strategies, in recent years ethnic entrepreneurs have gradually become an indigenous and significant part of the local economy, especially in the big cities and metropolises, since an expansion of their market potential towards a much broader coverage of urban demand has occurred (see, e.g., Baycan-Levent et al., 2003; Choenni, 1997; van Delft et al., 2000; Greenwood, 1994; Masurel et al., 2002; Nijkamp, 2003; Min, 1987; Waldinger et al., 1990; Ward and Jenkins 1984). Ethnic entrepreneurs with their untapped job-creating potential offer, on the one hand, different approaches and management styles within urban economic life, which reflect their cultural diversity, and, on the other hand, many opportunities for urban revitalization/development of local economies, thereby increasing economic and cultural diversity, reducing unemployment and social exclusion, mitigating the problematic employment situation of young people in the ethnic segment, and raising living standards in ethnic groups that often belong to the more disadvantaged segments in the urban economy.
Migrant entrepreneurs are a heterogeneous group of businessmen and women and may differ in orientation, motivation and economic performance. Migrants are motivated to opt for entrepreneurship: to be independent, to be their own boss (propensity to take risks), to have extra income (profit), to gain some work experience, or to maintain family tradition; or they are dissatisfied with their previous job, need flexibility, want to make a career, or have ideological reasons (desire to innovate) or leadership qualities (Baycan-Levent et al., 2003). The most relevant personal characteristics mentioned in many studies to explain why migrants become self-employed are: their lower education level, their less favoured position as a result of low
174
education and lack of skills, and, as a result, their high level of unemployment. The existence of migrant and social networks also plays a major role in their motivation, because it encourages migrants to start their own businesses.
Different migrant groups and different cultures can also show different features in terms of driving forces, motivation, performance, and success conditions. In the context of migrant entrepreneurship, several researchers have already highlighted the impact of different migrant group cultures on entrepreneurship. The cultural, socio-economic and psychological attributes of different migrant groups affect their entrepreneurial behaviour. Migrant minorities may differ in terms of their reasons for migration, their religion, their language, their educational attainment, their demographic background (whether other relatives are in business or not) and their access to family business networks. However, the interaction between culture and migrant entrepreneurship is complex. Culture, in the form of a family tradition in business and strong family ties, has an impact on business entry motives, on the financing of new start-ups, and on the nature of the business chosen. Some aspects of culture like family tradition seem to have greater impact on entrepreneurship than others like religion (Basu and Altinay, 2002). Furthermore, there is some evidence to suggest that the interaction between culture and entrepreneurship may change over time, that is, between business entry and later business operations.
Although migrant groups display a great variation in motives, attitudes and behaviour, migrant enterprises and migrant entrepreneurs tend to have some similar characteristics (CEEDR, 2000; Deakins, 1999; Kloosterman et al., 1998; Lee et al., 1997; Masurel et al., 2002; Ram 1994). Researchers like Brush (1992), Buttner and Moore (1997), Fagenson (1993), Fischer et al. (1993) and Baycan-Levent et al. (2003) have investigated the individual characteristics of migrant entrepreneurs, such as their demographic background, motivations or educational and occupational experience as entrepreneurs. These studies show that, although there are some similarities in demographic and educational characteristics, and problems they have to cope with, there are also some differences in educational background, work experience, skills, business goals, and management styles.
The aspects of migrant entrepreneurs that have been most extensively studied in the literature are their motivations, the entrepreneurs’ relationships with clients, and their acquisition of capital and labour. Masurel et al. (2003) distinguish some general features that are typically applicable to migrant entrepreneurs, e.g. informal and formal networks, clients, business financing, and workforce and geographical clustering. The most significant characteristics of migrant entrepreneurship in general are their client orientation and their access to capital and labour (Deakins, 1999). Generally speaking, migrant entrepreneurs are found to be small in terms of start-up capital, utilized labour, growth capital and turnover. These enterprises operate mainly in markets characterized by easy entry and strong competition (Rettab, 2001). In cases of information gathering or help in certain situations migrants make use of their own migrant groups. This is also referred to as their ‘own group’. Usually, migrant entrepreneurs find a niche in their migrant community and start up in an

175
ethically well-defined market, so as to provide typical services and products. An enclave economy can then positively affect the prospects of migrant entrepreneurs.
Besides having co-migrant clients, the migrant entrepreneur also has close relations with his/her own migrant group when it comes to the workforce, or business financing. Migrant entrepreneurs prefer hiring and supporting other migrants in their economic ventures as these entrepreneurs enjoy privileged access to the migrant labour and can frequently employ paternalistic arrangements to extract more labour, as well as pay lower wages (Razin, 1989). The migrant entrepreneur is also able to acquire financial capital and loan production resources from the informal networks. While native entrepreneurs usually borrow their starting capital from the bank, migrant entrepreneurs are less likely to receive bank funding than native entrepreneurs (Rath, 2000), and therefore often borrow capital from family or other group members. Migrant entrepreneurs usually less inclined to join up with native formal networks, like retailer groups, trade associations and franchise organizations. Within a city, foreign activities are usually concentrated in certain geographical clusters. We can find this geographical concentration especially in the bigger cities, because migrants start their businesses in places where there is already a large resident population of people with the same migrant background. This also holds for the Netherlands.
Since the early 1980s, self-employment has increased significantly amongst people of different migrant minority groups in the Netherlands. One out of five new businesses in the Netherlands is set up by a migrant entrepreneur. This group mostly works in the service sector and delivers high-quality products. This group takes risk more easily, since they are supported by their parents. Important facts about the increased (migrant) entrepreneurship in the Netherlands are as follows: (i) there are relatively more migrant entrepreneurs within the Netherlands than native entrepreneurs; (ii) between 1999 and 2004 the number of migrants with their own enterprise grew enormously by 44 percent. In comparison, the number of native entrepreneurs within the same period only grew by 2 percent; (iii) in the period 1999-2004 within the Netherlands the number of enterprises started by migrants was 15,000; (iv) in 1998 the number of enterprises led by migrants was still only 4,000, while in 2003 this number had increased to 10,000; (v) according to the Monitor Ethnic Entrepreneurship (Monitor Etnisch Ondernemerschap), in there were approximately 5,000 ethnic entrepreneurs (including one-man businesses), of whom nearly 10 percent belonged to the second generation; (vi) 15 percent of all the ethnic enterprises are situated in the retail and catering sectors. In mid-2004, there were 124,500 entrepreneurs active in the retail industry, which includes 18,070 ethnic entrepreneurs; (vii) all together these nearly 125,000 entrepreneurs run 92,500 enterprises. Of these, approximately 16,200 enterprises can be described as ethnic enterprises. Migrant entrepreneurs are a rapidly growing group of businessmen in modern urban economies and may contribute significantly to the vitality of cities. But what is their socio-economic performance? In which market niches are they successful? And which CSFs are responsible for their socio-economic position and business performance? This will be

176
investigated later in this paper. But, first, the next section will briefly describe our empirical data on migrant entrepreneurs in Amsterdam.
3. DATABASE ON MIGRANT ENTREPRENEURS IN AMSTERDAM
The sampling was restricted to those enterprises that are owned by first- and second-generation migrant entrepreneurs of different ethnic origin in the service sector in Amsterdam (e.g. consultancy, accountancy and tax offices). Due to privacy regulations it is not easy to identify in a formal way migrant entrepreneurs. The total sample included 83 respondents who were entrepreneurs of small and medium-sized enterprises in the service sector: namely, 35 Turks, 25 Moroccans and 23 Surinamese (see Table 1). Tables 1 and 2 show personal and entrepreneurial characteristics. In Table 3 we present an overview of the profile of the respondents and the Pearson Chi-Square (p-value) of the statistical difference.
Table 1: Personal characteristics of migrant entrepreneurs NUMBER OF
ENTREPRENEURS
SHARE IN TOTAL (%)
ETHNIC ORIGIN
Moroccan 25 30
Surinamese 23 28
Turkish 35 42
AGE
20 – 25 11 13
26 – 30 24 29
31 – 35 20 24
36 – 40 15 18
41- 13 16
GENDER
Female 15 18
Male 68 82
EDUCATION LEVEL
Secondary school level 11 13
Middle vocational training 12 14

177
Higher vocational training 30 37
University 26 31
Other 4 5
MARITAL STATUS
Unmarried 36 43
Married 39 47
Divorced 7 9
Unknown 1 1
FAMILY STATUS
With children 42 51
Without children 41 49
TOTAL 83 100
From Table 1, we can see that most entrepreneurs were in the age group of 26-30 (29 percent). However, this percentage was different for each migrant group. Most entrepreneurs of Turkish origin were in the age group 30-35 (11 percent), while most of the entrepreneurs of Moroccan origin were in the age group 25-30 (16 percent), and most of the Surinamese entrepreneurs were in the age group 35-39 (8 percent). We find a statistical outcome of 0.04 for the Pearson Chi-Square value (see Table 3), so that we may conclude that the entrepreneurs do differ significantly from each other regarding their age. From this table, we can also derive that the entrepreneurs from different ethnic origin are mostly male (82 percent). The Pearson Chi-Square value in this case amounts to 0.956 (see Table 3), which indicates that there is no significant difference between the three groups investigated. Furthermore, we can derive that 37 percent of the respondents (total sample) have a high vocational education level. If we look at the University level, we can derive that 31 percent of the approached migrant entrepreneurs have a University level diploma. This means that, all together, most respondents went to a school with a high education level. When comparing the level of education for the three groups, in particular, we can conclude that in all groups most of the respondents have a level of education representing a high vocational education. For example, of the respondents 13.3 percent of the Turkish entrepreneurs, 15 percent of Moroccan entrepreneurs, and 8 percent of the Surinamese entrepreneurs, have a high vocational education level. However, if we only look at University education, we can conclude that most of the respondents of Surinamese origin went to University and have the highest level of education, viz. a university degree. The Pearson Chi-Square rate in this case appears to be 0.122 (see Table 3). We may thus conclude

178
that overall the migrant entrepreneurs do not differ significantly from each other with respect to their education level.
In addition, the country of birth of the entrepreneurs was examined. 26 entrepreneurs of Turkish origin were born in Turkey, 13 entrepreneurs of Moroccan origin were born in Morocco, and 12 Surinamese entrepreneurs were born in Surinam. The Pearson Chi-Square value in this case is 0.0001 (see Table 3), which indicates that there is a significant difference between the groups in terms of their birthplace. Furthermore, a comparison was made between the sample groups regarding their marital status and children. From Table 1, we can conclude that most respondents were married and have one child. Most of the Moroccan and Surinamese entrepreneurs were unmarried, viz. 16 percent and 18 percent, respectively. The Pearson Chi-Square value in this case is 0.024 (see Table 3), which indicates that there is a significant difference between the groups regarding their marital status. Most of the Turkish entrepreneurs have 2 children, while most Moroccan and Surinamese entrepreneurs do not have children. This could be caused by their marital status. The Pearson Chi-Square value in this case is 0.038 (see Table 3), which indicates that there is a significant difference between the groups.
Table 2 shows entrepreneurs in the family by ethnic group. We can see that 58 respondents of different ethnic origin do not have an entrepreneur in the family (70 percent). Of these, 22 (26 percent) are Turkish entrepreneurs, 21 (25 percent) are Moroccan entrepreneurs, and 15 (18 percent) are Surinamese entrepreneurs. Only 25 (30 percent) of the entrepreneurs of different ethnic origin do have an entrepreneur in the family. Of these 13 are Turkish entrepreneurs, 4 are Moroccan entrepreneurs, and 8 are Surinamese entrepreneurs. The Pearson Chi-Square value is 0.18 (see Table 3), which indicates that there is no significant difference between the groups.
Table 2: Entrepreneurial characteristics of migrant entrepreneurs SHARE IN TOTAL (%)
ENTREPRENEURS IN FAMILY Yes No
Total sample 30 70
ENTREPRENEURS IN FAMILY BY
ETHNIC GROUP
Moroccans 16 84
Surinamese 35 65
Turkish
37 63

179
NETWORK PARTICIPATION
Total sample 37 63
Network participation of migrant entrepreneurs by ethnic group
Moroccans 52 48
Surinamese 30 70
Turkish 31 69
Finally, we investigated the participation level in formal business networks (see also Table 2). Most of the Turkish and Surinamese entrepreneurs did not participate in such networks. On the other hand, 13 of the 25 Moroccan entrepreneurs did participate in such networks. The Pearson Chi-Square value amounts to 0.4 (see Table 3), which indicates that there is no significant difference between the groups in the case of formal business network participation.
Trust in migrant networks is a subject worth examining further. For example: Why is the participation rate for migrant entrepreneurs relatively low with regard to formal networks such as franchise organizations? Whereas such organizations play an important role for native entrepreneurs, migrant entrepreneurs usually do not participate in them. It could be that ‘trust’ plays a role in this issue, but this is merely an assumption. We can explain the migrant dependency by trust. Clients from their own migrant group play a major role for migrant entrepreneurs. It is possible to reverse this notion and ask ourselves the question: ‘Why do migrant customers prefer a service from the migrant entrepreneur?’ The reason may be that both share the same language, culture and religion and can therefore communicate better. This brings about a closer bonding with each other, through which the aspect of ‘trust’ can be understood. Hereby the migrant entrepreneur can also satisfy the special needs of these types of customers, since they have a better knowledge than their native peers about which specific products are most appreciated by migrant customers.
Table 3: Pearson Chi-Square values of sample
Variables Pearson Chi-Square
Age 0.04
Gender 0.956

180
Birthplace 0.0001
Education 1.22
Marital status 0.024
Children 0.038
Entrepreneur in family 0.18
Network participation 0.4
Table 3 presents an overview of the profile of the respondents and the Pearson Chi-Square (p-value) of the statistical difference. The Pearson Chi-Square value is used here in order to find out whether there is a statistically significant difference between the selected migrant groups. We will use a reliability level of 95%, which indicates that there is a significant difference when the outcome is below a p-value of 0.05. The groups only differ significantly from each other in terms of their age, birthplace, marital status and children. The corresponding p-values of these variables are contained in Table 3.
4. STATISTICAL RESULTS ON MIGRANT ENTREPRENEURS IN AMSTERDAM
In this section various results from standard statistical analyses will be presented. These results originate from a straightforward SPSS application, where we are interested in cross-correlations among the variables investigated (see Table 4).
Table 4: Group statistics of characteristics of migrant entrepreneurs
PC* (3.35) BC* (2.79) NP* (1.59) BP* (4.00)
TR MR SR TR MR SR TR MR SR TR MR SR
N 35 25 23 35 25 23 35 25 23 35 25 23
Mean 3.44 3.39 3.17 2.93 2.69 2.69 1.63 1.48 1.65 4.12 3.95 3.88
Sd .49 .42 .39 .47 .58 .49 .49 .51 .49 .55 .45 .41
PC*: Personal Characteristics NP*: Network Participation N = 83
BC* Business Characteristics BP*: Business Performance
The first step is to investigate the correlation between the independent explanatory variables personal characteristics (PC) and business characteristics (BC). We performed a correlation analysis to investigate the relation between variables before carrying out the main regression analysis to investigate the influence of these variables on the dependent variable BP. We presume that PC and BC will positively correlate with each other. The significance of the

181
results of an analysis was as expected; we observed a significant positive, but weak correlation between PC and BC of 0.072 (see Table 5). There was no observed significant correlation with network participation.
Next, we are interested in the causality relation between the explanatory variables BC, PC and network participation (NP), on the one hand, and the dependent variable business performance (BP), on the other. To estimate the strength of a modelled relationship between the independent variables PC and BC, and the dependent variable BP a regression analysis was carried out. The regression analysis results for the effect of PC and BC on BP indicate that there is a positive relationship between these constructs. This means that, if the migrant entrepreneur has the appropriate personal and business characteristics, he or she will also have a higher score on business performance.
Table 5: Correlation between Explanatory Variables
Besides these positive relationships, the variable network participation has no significant (positive or negative) influence on BP (see also Table 6), while BC and PC have a significant impact (given the standard errors or t-values). To confirm the goodness of fit of this model and the statistical significance of the estimated parameters, we may examine the R-square (R2) values. This is the proportion of variability in a data set that is accounted for by our statistical model. The R2 increases as we increase the number of variables, and so it is also important to look for the adjusted R2 that corrects the R2 for the number of variables used in the model. The (adjusted) R2 values are relatively low which is clearly due to the variability in our (relatively small) sample.
1 ,198 **,072 ,000 ,488
83 83 83 83
1 ,322** -,097
,003 ,383
83 83 83
1 -,028
,801
83 83
1
83 83
Pearson Correlation
Sig. (2-tailed)
N
Pearson Correlation
Sig. (2-tailed)
N
Pearson Correlation
Sig. (2-tailed)
N
Pearson Correlation
Sig. (2-tailed)
N
BC
PC
BP
NP
BC PC BP NP
Note: **.Correlation is significant at the 0.01 level (2-tailed).
-,077 ,538
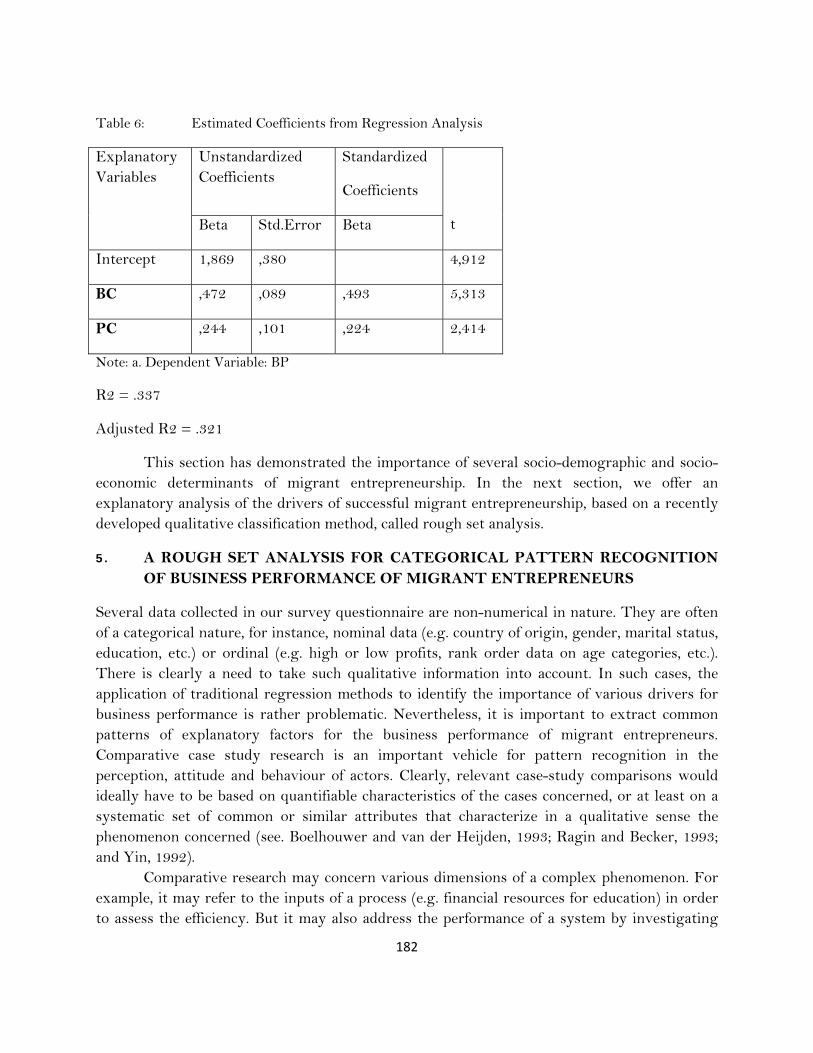
182
Table 6: Estimated Coefficients from Regression Analysis
Explanatory Variables
Unstandardized Coefficients
Standardized
Coefficients
t Beta Std.Error Beta
Intercept 1,869 ,380 4,912
BC ,472 ,089 ,493 5,313
PC ,244 ,101 ,224 2,414
Note: a. Dependent Variable: BP
R2 = .337
Adjusted R2 = .321
This section has demonstrated the importance of several socio-demographic and socio-economic determinants of migrant entrepreneurship. In the next section, we offer an explanatory analysis of the drivers of successful migrant entrepreneurship, based on a recently developed qualitative classification method, called rough set analysis.
5. A ROUGH SET ANALYSIS FOR CATEGORICAL PATTERN RECOGNITION OF BUSINESS PERFORMANCE OF MIGRANT ENTREPRENEURS
Several data collected in our survey questionnaire are non-numerical in nature. They are often of a categorical nature, for instance, nominal data (e.g. country of origin, gender, marital status, education, etc.) or ordinal (e.g. high or low profits, rank order data on age categories, etc.). There is clearly a need to take such qualitative information into account. In such cases, the application of traditional regression methods to identify the importance of various drivers for business performance is rather problematic. Nevertheless, it is important to extract common patterns of explanatory factors for the business performance of migrant entrepreneurs. Comparative case study research is an important vehicle for pattern recognition in the perception, attitude and behaviour of actors. Clearly, relevant case-study comparisons would ideally have to be based on quantifiable characteristics of the cases concerned, or at least on a systematic set of common or similar attributes that characterize in a qualitative sense the phenomenon concerned (see. Boelhouwer and van der Heijden, 1993; Ragin and Becker, 1993; and Yin, 1992). Comparative research may concern various dimensions of a complex phenomenon. For example, it may refer to the inputs of a process (e.g. financial resources for education) in order to assess the efficiency. But it may also address the performance of a system by investigating

183
output indicators (e.g. the success rate of medical treatment). And finally, comparative research may address the impacts of policies (e.g. the effects of training programmes on labour market participation). In all such studies, the main aim is to identify causal or explanatory patterns in the functioning of a common family of complex systems which exhibit considerable variation in space and time (see Pickvance 2001). Comparative study may originate from various sources of interest, such as testing a causal relationship, identifying whether a proposition in one given study is also applicable in other studies, exploring whether a critical condition in a given case result also holds somewhere else, or whether there are commonalities in causal structures and in empirical results in different case studies. According to Pickvance (2001), there is a variety of comparative analyses, such as individualizing comparison (searching for contrasts), universalizing comparison (seeking common elements), variation-finding comparison (searching for systematic differences), and encompassing comparison (searching for attributes as a function of varying relationships in the entire system). At the same time, there are also various caveats in using comparative analysis, in particular the need for conceptual equivalence (looking for commensurable rather than identical objects), the need to find a blend between the identification of the uniqueness and the generality of objects, and the need for a largely similar research design and methodology to be used (see Bal and Nijkamp, 2000).
In recent decades, a wide variety of methods for exploratory or explanatory categorical data analysis have been developed, such as rank-order correlation methods, discrete choice models, qualitative multicriteria models, ordinal correspondence analysis, and so forth. In our study, we use rough set analysis (RSA) as a tool for analysing the categorical data from our survey questionnaire distributed to migrant entrepreneurs.
RSA originates from the family of artificial intelligence methods and aims to identify regularities (or patterns) in the simultaneous occurrence of events (or phenomena) characterized by categorical information on distinct characterizing attributes. Detailed treatment of RSA can be found, inter alia, in Pawlak (1991, 2001). RSA is a qualitative modelling tool that serves to identify under what conditions (i.e. qualitative states of attributes of a phenomenon) a certain qualitative outcome (often called the ‘decision variable’) will result. Thus, RSA is essentially based on a set of conditional (‘predictive’) statements of an ‘if…, then’ nature. RSA is a deterministic classification method to convert imprecise or incomplete information (often alpha-numerical or nominal) into structured knowledge based on a classification of attributes and decision variables into distinct classes which may have a varying degree of ‘granularity’ (see Pawlak, 1991, 2001; Slowinski, 1993). The notion of ‘granularity’ refers to the width (or ‘refinedness’) of a class of characterizing features (e.g. small-large versus small-medium-large), as classification results (in an exploratory or explanatory sense) may be sensitive to class widths.
RSA has a series of technical terms (such as equivalence, indiscernibility, reducts, lower and upper approximation, core, multi-attribute sorting) which will only be very briefly be described here. Objects in RSA are regarded as similar (or indiscernable), if their characteristic

184
features (attributes) all fall in the same distinct equivalence class (‘granules’). Two concepts are often used in RSA, viz. lower and upper approximation. The lower approximation of a set S is the union of all elementary sets that are a subset of S. In contrast, the upper approximation is the union of all elementary sets that have a non-empty intersection with S.
The main question is now whether it is possible to use an ‘attribute reduction’ in order to identify a smaller set of attributes that have the same classificatory power as the original set of attributes. Here two concepts are important, viz. a core and a reduct. A reduct is a subset of attributes and may be interpreted as necessary part of the subset of all attributes that enables us to discern all objects in our set. This means that adding another attribute to a reduct does not imply a better classification of objects In other words, the reducts represent all combinations of explanatory variables (attributes) which completely determine the variation in the dependent variable (decision variable). A core is a common item across all reducts and thus shows up in all classifications. The core thus represent the set of all variables (attributes) that show up in all reducts. We may then try to reduce the information table encompassing all objects, their attributes (independent explanatory variables) and the decision variable (dependent variable to be explained) in order to construct decision rules which link the classified (nominally coded) attributes to the presence of a given decision variable in a pre-coded class.
We may now try to identify combinations of classified attributes from our sample that are necessary for the existence of a decision variable in a coded form. This cross-classification can be represented in ‘if….then……’ statements which are nothing else than conceptual-qualitative causal predictive statements. It is evident that attributes present in the core of an RSA have the highest explanatory value, as these are in all cases necessary to understand or highlight the variation in the classification of decision variables. Thus, the frequency of appearance of attributes in decision rules (i.e., in ‘if….then….’ statements) is an indication of the causal explanatory power of the attributes concerned.
RSA has been applied on several occasions for comparative purposes in social science research. Examples can be found in, inter alia, Baaijens and Nijkamp (2000), Baycan-Levent and Nijkamp (2007a,b), van den Bergh et al. (1998), Nijkamp and Pepping (1998a, 1998b), and Nijkamp et al. (2002a, 2002b). In the present paper, which is to a devoted to comparative assessment of the performance of migrant entrepreneurs, we employ RSA, in particular, since many of our interview data are nominal in nature.
6. Assessment of Critical Success Factors by Means of Rough Set Analysis The application of rough set analysis proceeds in two steps: (i) the construction of an information survey; and (ii) the classification of information contained in the survey. In our case, the information survey consisted of the entrepreneurial characteristics of migrant entrepreneurs of Moroccan, Surinamese and Turkish origin in terms of their motivation factor, business characteristics, internal and external success conditions, and performance (Table 7). In our analysis, we are particularly interested in the question whether the three dominant migrant

185
entrepreneurship groups (Moroccans, Surinamese and Turks) have significant differences in critical success conditions for their business performance. Hence, we present the RSA results for each of these distinct groups. The next step, the classification of information contained in the survey, is one of the most problematic issues in the application of rough set analysis, as the chosen thresholds are not always unambiguous, and hence may also lead to information loss. In general, some sensitivity analysis on the classification used is meaningful, as a balance needs to be found between homogeneity and class size. In our case, after some sensitivity analyses the categories for each relevant attribute were defined, and these are listed in Table 7. Next, on the basis of these categories, the resulting coded information table was constructed for Moroccan, Surinamese and Turkish entrepreneurs (see tables in Annex I).
As can be seen in Table 7, our rough set framework consists of 29 variables of which 28 are attribute (conditional) variables, and only 1 of them is a decision variable. The performance variable is used as a decision variable, which refers to market share, growth in turnover and profit of the entrepreneur. The attributes of the migrant entrepreneurs include: their personal characteristics (e.g. age, gender, generation, education level); motivation factors (e.g. need for achievement, locus of control, risk-taking propensity); size of enterprise (number of full-time and part-time employees); internal success conditions (e.g. commitment/dedication, culture of enterprise, administration, reliability, market knowledge, customer service, personnel, quality); external success conditions (e.g. applicable products and services (P&S), availability of finance, market expectations, innovation); and leadership (negotiation skills, communication skills, managerial skills, customer relationships, financial knowledge, market orientation).
The motivation factors refer to need for achievement, locus of control, and risk-taking propensity. According to McClelland (1961), achievement motivation is a strong psychological driving force behind human action, and it can be defined ‘as behaviour towards competition with a standard of excellence’. The motivation factor locus of control refers to the perceived control over the events in one’s life (Rotter, 1966). An entrepreneur’s risk-taking propensity can be defined as his or her orientation towards taking chances and risks in uncertain decision-making contexts. In this case, the motivation factor has three dimensions, which measure, respectively, an entrepreneur’s belief in this attribute by asking him or her to rate the importance of need for achievement, locus of control, and risk-taking propensity. The importance of the attributes motivation factor and leadership are measured by presenting entrepreneurs different propositions about the attributes with respect to three different dimensions: agree, neutral, and disagree. The attributes internal success conditions and external success conditions are measured by presenting entrepreneurs different propositions about these attributes with the three dimensions: important, neutral, and unimportant.

186
Table 7: Classification of explanatory variables/attributes
ATTRIBUTES*
PERSONAL CHARACTERISTICS A10. Number of part-timers A20. Availability of finance
A1. Ethnic Origin 1 = no employee 1 = unimportant
TR: Turkish 2 = 1 – 5 2 = neutral
MR: Moroccan 3 = 6 – 25 3 = important
SR: Surinamese 4 = 26 > A21. Market expectations
A2. Age 1 = unimportant
1 = <20 INTERNAL SUCCESS FACTORS 2 = neutral
2 = 21-30 A11. Commitment/dedication 3 = important
3 = 31-40 1 = unimportant A22. Innovation
4 = 41> 2 = neutral 1 = unimportant
A3. Gender 3 = important 2 = neutral
1= male A12. Culture of enterprise 3 = important
2= female 1 = unimportant
A4. Generation 2 = neutral LEADERSHIP
1 = first generation 3 = important A23. Negotiation skills
2 = second generation A13. Administration 1 = disagree
A5. Education Level 1 = unimportant 2 = neutral
1 = elementary school 2 = neutral 3 = agree
2 = secondary education 3 = important A24. Communication skills
3 = MBO (vocational) A14. Reliability 1 = disagree
4 = HBO(high vocational) 1 = unimportant 2 = neutral
5 = university 2 = neutral 3 = agree
3 = important A25. Managerial skills
MOTIVATION FACTORS A15. Market Knowledge 1 = disagree
A6. Need for Achievement 1 = unimportant 2 = neutral
1 = disagree 2 = neutral 3 = agree
2 = neutral 3 = important A26. Customer Relationships

187
3 = agree A16. Customer Service 1 = disagree
A7. Locus of Control 1 = unimportant 2 = neutral
1 = disagree 2 = neutral 3 = agree
2 = neutral 3 = important A27. Financial Knowledge
3 = agree A17. Personnel 1 = disagree
A8. Risk-taking Propensity 1 = unimportant 2 = neutral
1 = disagree 2 = neutral 3 = agree
2 = neutral 3 = important A28. Market Orientation
3 = agree A18. Quality 1 = disagree
1 = unimportant 2 = neutral
SIZE OF ENTERPRISE 2 = neutral 3 = agree
A9. Number of full-timers 3 = important
1 = no employee PERFORMANCE
2 = 1 – 5 EXTERNAL SUCCESS FACTORS D1. Market; Growth; Profit
3 = 6 – 25 A19. Applicable P&S 1 = decreased
4 = 26 > 1 = unimportant 2 = stable
2 = neutral 3 = increased
3 = important
Note: * A: condition attribute, D: decision attribute.
The ROSE software is used for each of these decision and attribute variables independently, and the results of the analysis are evaluated on the basis of these decision variables in order to highlight the determining factors (conditional attribute variables) behind the business performance of migrant entrepreneurs of Moroccan, Surinamese and Turkish origin. Although the ROSE software is used independently for each group, the results of the rough set analysis are given in the same tables in order to see the results together and to compare the similarities and differences between the groups.
Next, in the technical application of the rough-set analysis, we calculated three main sets of indicators and outputs, viz. (i) the reducts and the core; (ii) the lower and upper approximation; and (iii) rules.
1. The reduct — in other words, a minimal set of attributes — is the smallest minimal subset which ensures the same quality of classification as the set of all attributes. The intersection of all reducts/minimal subset (in other words, an attribute that appears in all minimal sets) is defined as the core. The core is a collection of the most significant attributes

188
for the classification in the system. For our data set, no core attribute is found, and with a limitation on the number — in order to get the most concise results — ten sets of reducts were found for each group of migrant entrepreneurs. The reducts for each set of data on the basis of the decision variable for Moroccan, Surinamese and Turkish entrepreneurs are given in Table 8. Next, the relative frequencies of appearance of the condition attributes in the reducts for each data set are given in Table 9.
When we examine the relative frequencies of appearance of the condition attributes in the reducts for each group, the results show that there are some similarities but also some differences between the groups. The relative frequencies of appearance of the condition attributes in the reducts for the data set on Moroccan entrepreneurs show that A25 (managerial skills), A23 (negotiation skills), A22 (innovation), A27 (financial knowledge) and A24 (communication skills) appear as relatively important attributes with higher frequency rates. This means that these attributes strongly influence the performance and success level of Moroccan entrepreneurs. The relative frequencies of appearance of the condition attributes in the reducts for the data set on Surinamese entrepreneurs show that A23 (negotiation skills), A28 (market orientation), A25 (managerial skills), and A22 (innovation) appear as relatively important attributes with higher frequency rates that strongly influence the performance and success level of Surinamese entrepreneurs, whereas the relative frequencies of appearance of the condition attributes in the reducts for the data set on Turkish entrepreneurs show that A26 (customer relationships), A10 (number of part-time employees), A13 (administration), A23 (negotiation skills) and A25 (managerial skills) appear as relatively important attributes with higher frequency rates that strongly influence the performance and success level of Turkish entrepreneurs.
A comparative evaluation of the results show that two conditional attributes A23 (negotiation skills) and A25 (managerial skills) are common, and the most important, attributes for all three groups with very high frequencies of appearance. A22 (innovation) appears as another common attribute for Moroccan and Surinamese entrepreneurs. Besides these common attributes that influence the performance and success level of three groups of migrant entrepreneurs, there are some different attributes that seem to be important for each group. These different attributes are of special importance as they reflect the cultural differences, priorities, and different value systems between the groups. While A24 (communication skills) and A27 (financial knowledge) are important attributes for Moroccan entrepreneurs, A28 (market orientation) is of importance for Surinamese entrepreneurs and A10 (number of part-time employees), A13 (administration), and A26 (customer relationships) appear as important attributes for Turkish entrepreneurs. It seems Moroccan and Surinamese entrepreneurs are much more oriented to the market situation, as well as to the external success factors and leadership, whereas Turkish entrepreneurs are much more oriented to internal success factors such as the management of the relationships with employees and customers. As an indicator of external success, innovation is an important factor for Moroccan and Surinamese entrepreneurs, whereas Turkish entrepreneurs do not show any orientation towards innovation.

189
2. The lower and upper approximation — and derived accuracy of relationships for each value class of the decision variable — is another indicator from a rough set analysis. This indicator is the lower divided by the upper approximation of each class. Accuracy and quality of classification can also be derived from the choice of thresholds. The accuracy and quality of the classification for Moroccan, Surinamese and Turkish entrepreneurs are given in Table 10.
For all classes of performance for Moroccan and Surinamese entrepreneurs, the accuracy appears to be 1. Also the accuracy and quality of classification are equal to 1. This value is the maximum value in all these cases. This means that, on the basis of the chosen performance or success factor, the variables in our sample for Moroccan and Surinamese entrepreneurs are completely clear regarding the classes of decision variables. However, the accuracy and quality of classification for the performance of Turkish entrepreneurs appears different from 1. This stems from the attribute A23 (negotiation skills) that determines both increase in the performance and stable situation, two different categories, for Turkish entrepreneurs (see the rules below).
3. The rules — exact or approximate relationships between explanatory variables and dependent variables — offer the possibilities to extract conditional causal structures from our data set. Decision rules are conditional statements that are expressed in the form of ‘if-then’ statements. A rule may be exact or approximate. An exact (or deterministic) rule guarantees that a particular combination of categories of the condition attributes results in only one particular category of the decision attribute (same conditions, same decisions). An approximate (or non-deterministic) rule, on the other hand, states that a particular combination of categories of the condition attributes corresponds to more than one category of the decision attribute (same conditions, different decisions). Therefore, only in the case of exact rules, using the information contained in the decision table, is it always possible to state with certainty whether an object belongs to a certain class of the decision variable. The quality of the decision rule is indicated by its strength. The strength of a rule represents the number of observations or cases that are in accordance with that rule. Table 11 shows the rules and their strengths that can be generated from our data set for Moroccan, Surinamese and Turkish entrepreneurs. We only use the rules with strength of 4 or more. This means that the relation described in the rule appears at least 4 times in the data set, but in some cases it also appears 7 or 12 times. Therefore, we selected the most significant rules, i.e. those that have a higher strength in terms of the number of cases matching the rule. This information enables us to classify migrant entrepreneurs according to conditions under which they are successful and which kind of similarities and differences can be found between them.

190
Table 8: Found reducts for Moroccan, Surinamese and Turkish entrepreneurs
Moroccan Entrepreneurs Surinamese Entrepreneurs Turkish Entrepreneurs
1: {A11, A19, A25, A26} 1: {A17, A21, A22, A23, A27, A28} 1: {A10, A13, A23, A24, A25, A26}
2: {A19, A20, A23, A25, A26} 2: {A13, A14, A22, A23} 2: {A10, A13, A18, A23, A25, A26}
3: {A19, A21, A22, A23, A25, A27} 3: {A13, A18, A22, A23, A25, A28} 3: {A10, A13, A21, A23, A26, A28}
4: {A10, A21, A22, A23, A25, A27} 4: {A13, A22, A23, A24, A25, A28} 4: {A10, A13, A22, A23, A26}
5: {A19, A21, A23, A25, A26} 5: {A16, A22, A23, A25, A28} 5: {A10, A13, A17, A24, A25, A26}
6: {A12, A14, A24, A25, A26} 6: {A17, A22, A23, A25, A28} 6: {A9, A17, A21, A22, A25, A26, A28}
7: {A11, A22, A24, A25, A27} 7: {A12, A23, A25, A28} 7: {A10, A13, A17, A25, A26, A27}
8: {A12, A22, A23, A24, A25, A27} 8: {A13, A23, A25, A27, A28} 8: {A10, A13, A23, A25, A26, A27}
9: {A20, A22, A23, A24, A25, A27} 9: {A16, A23, A25, A27, A28} 9: {A9, A17, A22, A23, A25, A26}
10: {A21, A22, A23, A24, A25, A27} 10: {A17, A23, A25, A27, A28} 10: {A10, A13, A23, A26, A27, A28}
Table 9: Frequency of attributes in reducts for Moroccan, Surinamese and Turkish entrepreneurs
Moroccan entrepreneurs Surinamese entrepreneurs Turkish entrepreneurs
Attribute Frequency
(#)
Frequency
(%)
Attribute Frequency
(#)
Frequency
(%)
Attribute Frequency
(#)
Frequency
(%)
A11 2 20.00 A17 3 30.00 A10 8 80.00
A19 4 40.00 A21 1 10.00 A13 8 80.00
A25 10 100.00 A22 6 60.00 A23 7 70.00
A26 4 40.00 A23 10 100.00 A24 2 20.00
A20 2 20.00 A27 4 40.00 A25 7 70.00
A23 7 70.00 A28 9 90.00 A26 10 100.00
A21 4 40.00 A13 4 40.00 A18 1 10.00
A22 6 60.00 A14 1 10.00 A21 2 20.00
A27 6 60.00 A18 1 10.00 A28 3 30.00
A10 1 10.00 A25 8 80.00 A22 3 30.00
A12 2 20.00 A24 1 10.00 A17 4 40.00
A14 1 10.00 A16 2 20.00 A9 2 20.00
A24 5 50.00 A12 1 10.00 A27 3 30.00

191
Legend:
A9: Number of full-timers A17: Personnel A24: Communication skills
A10: Number of part-timers A18: Quality A25: Managerial skills
A11: Commitment/dedication A19: Applicable P&S A26: Customer relationships
A12: Culture of enterprise A20: Availability of finance A27: Financial knowledge
A13: Administration A21: Market expectations A28: Market orientation
A14: Reliability A22: Innovation
A16: Market knowledge A23: Negotiation skills
Note: Bold print in the table indicates the most important attributes for success.
Moroccan entrepreneurs
Class Accuracy Lower approximation Upper approximation
1 1 1 1
2 1 9 9
3 1 15 15
Accuracy of classification: 1
Quality of classification: 1
Surinamese entrepreneurs
Class Accuracy Lower approximation Upper approximation
1 1 2 2
2 1 8 8
3 1 13 13
Accuracy of classification: 1
Quality of classification: 1
Turkish entrepreneurs
Class Accuracy Lower approximation Upper approximation
1 -1.0000 0 0
2 0.8333 10 12
3 0.9200 23 25

192
Table 10: Accuracy and quality of the classification for Moroccan, Surinamese and Turkish entrepreneurs
Table 11: Rules generated by the rough set analysis for Moroccan, Surinamese and Turkish entrepreneurs
Accuracy of classification: 0.8919
Quality of classification: 0.9429
NOTE: The accuracy for each class is the lower divided by the upper approximation. The accuracy and quality of classification for Turkish entrepreneurs is different from 1 because the attribute A23 determines both an increase in the performance and a stable situation, two different categories, see the rules in Tables 11 and 12 below.
Rules Description of rules Strength
(#)
Strength
(%)
Moroccan entrepreneurs
rule 1 (A5 = 3) & (A21 = 3) => (Dec1 = 2) 5 55.56
rule 2 (A23 = 2) & (A25 = 2) => (Dec1 = 2) 4 44.44
rule 3 (A11 = 3) & (A19 = 3) & (A26 = 3) => (Dec1 = 3) 12
80.00
Surinamese entrepreneurs
rule 1 (A8 = 3) & (A10 = 1) => (Dec1 = 2)
5 62.50
rule 2 (A4 = 2) & (A6 = 3) & (A17 = 3) => (Dec1 = 3) 7
53.85
rule 3 (A2 = 3) & (A3 = 1) & (A12 = 3) => (Dec1 = 3) 6
46.15
Turkish entrepreneurs
rule 1 (A9 = 3) & (A23 = 3) => (Dec1 = 2) 4
36.36
rule 2 (A4 = 1) & (A13 = 3) & (A26 = 3) => (Dec1 = 3) 7
29.17
rule 3 (A17 = 3) & (A22 = 2) => (Dec1 = 3) 6
25.00
rule 4 (A10 = 2) & (A12 = 3) & (A18 = 3) => (Dec1 = 3) 7 29.17
rule 5 (A7 = 1) & (A14 = 3) & (A23 = 3) => (Dec1 = 3) 7
29.17
193
Table 12 describes the significant rules and the level of performance of Moroccan, Surinamese and Turkish entrepreneurs. When we evaluate the rules generated by the rough set analysis for each group, an overall evaluation of the decision rules for Moroccan entrepreneurs shows that especially seven condition attributes, viz., A5 (education level), A11 (commitment/dedication), A19 (applicable products and services), A21 (expectations of market), A23 (negotiation skills), A25 (managerial skills) and A26 (customer relationships) determine the performance and success level of Moroccan entrepreneurs. On the one hand, a combination of: the importance given to (i) commitment/dedication, (ii) applicable products and services and (iii) customer relationships lead to an increase in the performance and success level of Moroccan entrepreneurs in terms of market share, growth in turnover and profit. On the other hand, a combination of: (i) a medium vocational level of education, as well as (ii) importance given to expectations of the market and a neutral approach to (iii) negotiation skills and (iv) managerial skills lead to a stable situation in the market.
An overall evaluation of the decision rules for Surinamese entrepreneurs shows that especially eight condition attributes, viz., A2 (age), A3 (gender), A4 (generation), A6 (need for achievement), A8 (risk propensity), A10 (number of part-time employees), A12 (culture of enterprise) and A17 (personnel) determine the performance and success level of Surinamese entrepreneurs. On the one hand, a combination of: (i) being in the age category of 31-40, (ii) being male, (iii) belonging to the second generation, (iv) being motivated by the need for achievement, (v) importance given to culture of enterprise and (vi) importance given to personnel lead to an increase in the performance and success level of Surinamese entrepreneurs in terms of market share, growth in turnover and profit. On the other hand, a combination of: (i) have a motivation of risk propensity and (ii) having no employees lead to a stable situation in the market.
However, an overall evaluation of the decision rules for Turkish entrepreneurs shows that especially 12 condition attributes, viz., A4 (generation), A7 (have a motivation of locus of control), A9 (number of full-time employees), A10 (number of part-time employees), A12 (culture of enterprise), A13 (administration), A14 (reliability), A17 (personnel), A18 (quality), A22 (innovation), A23 (negotiation skills) and A26 (customer relationships) determine the performance and success level of Turkish entrepreneurs. On the one hand, a combination of: (i) belonging to the first generation, (ii) being motivated by having locus of control, (iii) having part-time employees, importance given to (iv) culture of enterprise, (v) administration, (vi) reliability, (vii) personnel, (viii) quality, (ix) innovation, (x) negotiation skills, and (xi) customer relationships lead to an increase in the performance and success level of Turkish entrepreneurs in terms of market share, growth in turnover and profit. On the other hand, a combination of: (i) having 6-25 full-time employees, and (ii) having negotiation skills lead to a stable situation in the market. Here this stable situation should be seen as a positive and a successful situation in the market.
When we evaluate the performance and success level of Moroccan, Surinamese and Turkish entrepreneurs in a comparative way, first we can say that these 3 groups are quite different from each other in terms of both their success level and critical success conditions. In general, there is no big failure in terms of a decrease in the performance level of three groups in
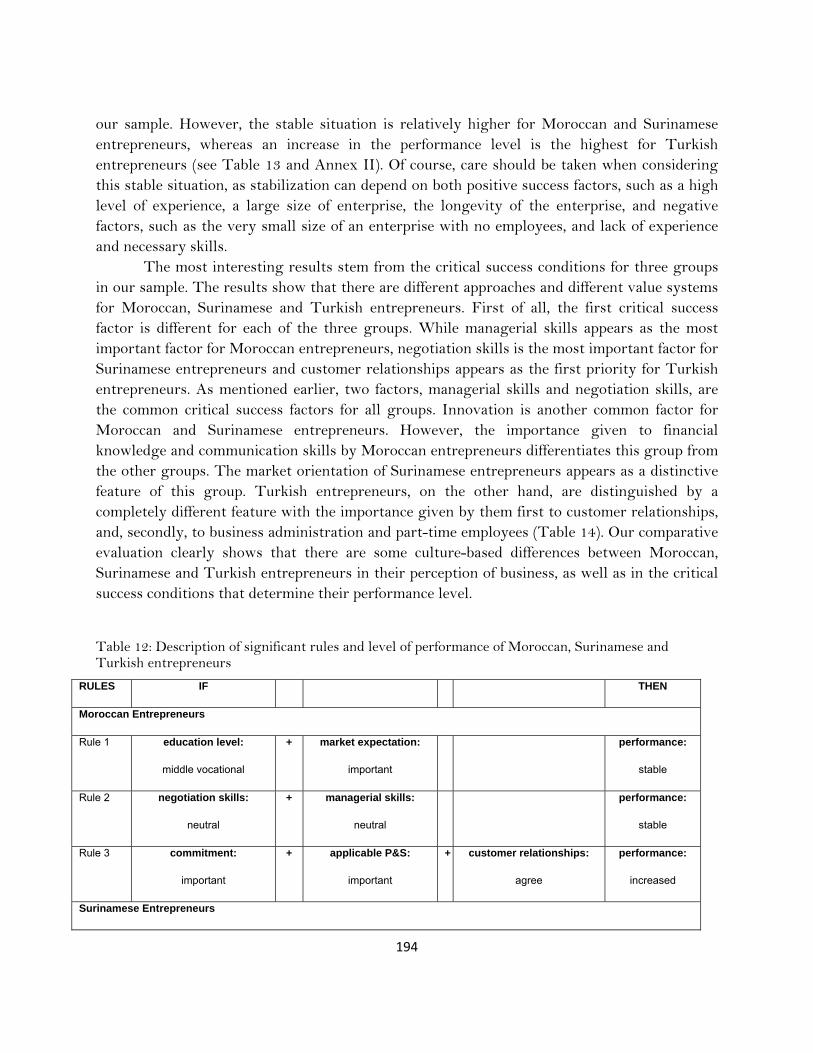
194
our sample. However, the stable situation is relatively higher for Moroccan and Surinamese entrepreneurs, whereas an increase in the performance level is the highest for Turkish entrepreneurs (see Table 13 and Annex II). Of course, care should be taken when considering this stable situation, as stabilization can depend on both positive success factors, such as a high level of experience, a large size of enterprise, the longevity of the enterprise, and negative factors, such as the very small size of an enterprise with no employees, and lack of experience and necessary skills.
The most interesting results stem from the critical success conditions for three groups in our sample. The results show that there are different approaches and different value systems for Moroccan, Surinamese and Turkish entrepreneurs. First of all, the first critical success factor is different for each of the three groups. While managerial skills appears as the most important factor for Moroccan entrepreneurs, negotiation skills is the most important factor for Surinamese entrepreneurs and customer relationships appears as the first priority for Turkish entrepreneurs. As mentioned earlier, two factors, managerial skills and negotiation skills, are the common critical success factors for all groups. Innovation is another common factor for Moroccan and Surinamese entrepreneurs. However, the importance given to financial knowledge and communication skills by Moroccan entrepreneurs differentiates this group from the other groups. The market orientation of Surinamese entrepreneurs appears as a distinctive feature of this group. Turkish entrepreneurs, on the other hand, are distinguished by a completely different feature with the importance given by them first to customer relationships, and, secondly, to business administration and part-time employees (Table 14). Our comparative evaluation clearly shows that there are some culture-based differences between Moroccan, Surinamese and Turkish entrepreneurs in their perception of business, as well as in the critical success conditions that determine their performance level.
Table 12: Description of significant rules and level of performance of Moroccan, Surinamese and Turkish entrepreneurs
RULES IF THEN
Moroccan Entrepreneurs
Rule 1 education level:
middle vocational
+ market expectation:
important
performance:
stable
Rule 2 negotiation skills:
neutral
+ managerial skills:
neutral
performance:
stable
Rule 3 commitment:
important
+ applicable P&S:
important
+ customer relationships:
agree
performance:
increased
Surinamese Entrepreneurs

195
Rule 1 risk-taking propensity:
agree
+ number of part-timers:
no part-timers
performance:
stable
Rule 2 generation:
second
+ need for achievement:
agree
+ personnel:
important
performance:
increased
Rule 3 age:
31-40
+ gender:
male
+ culture of enterprise:
important
performance:
increased
Turkish Entrepreneurs
Rule 1 number of full-timers:
6-25
+ negotiation skills:
agree
performance:
stable
Rule 2 generation:
first
+ administration:
important
+ customer relationships:
agree
performance:
increased
Rule 3 personnel:
important
+ innovation:
neutral
performance:
increased
Rule 4 number of part-timers:
1-5
+ culture of enterprise:
important
+ quality:
important
performance:
increased
Rule 5 locus of control:
disagree
+ reliability:
important
+ negotiation skills:
agree
performance:
increased
Table 13: Performance and success level of 3 migrant entrepreneur groups
Performance level (market share, growth in turnover, profit) Moroccan Surinamese Turkish
Decrease 1 (4%) 2 (9%) 0 (0%)
Stable 9 (36%) 8 (35%) 11 (31%)
Increase 15 (60%) 13 (56%) 24 (69%)
Table 14: Critical success conditions for 3 migrant entrepreneur groups
Rank order of critical
Success conditions
Moroccan Surinamese Turkish
1 managerial skills negotiation skills customer relationships
2 negotiation skills market orientation part-time employees
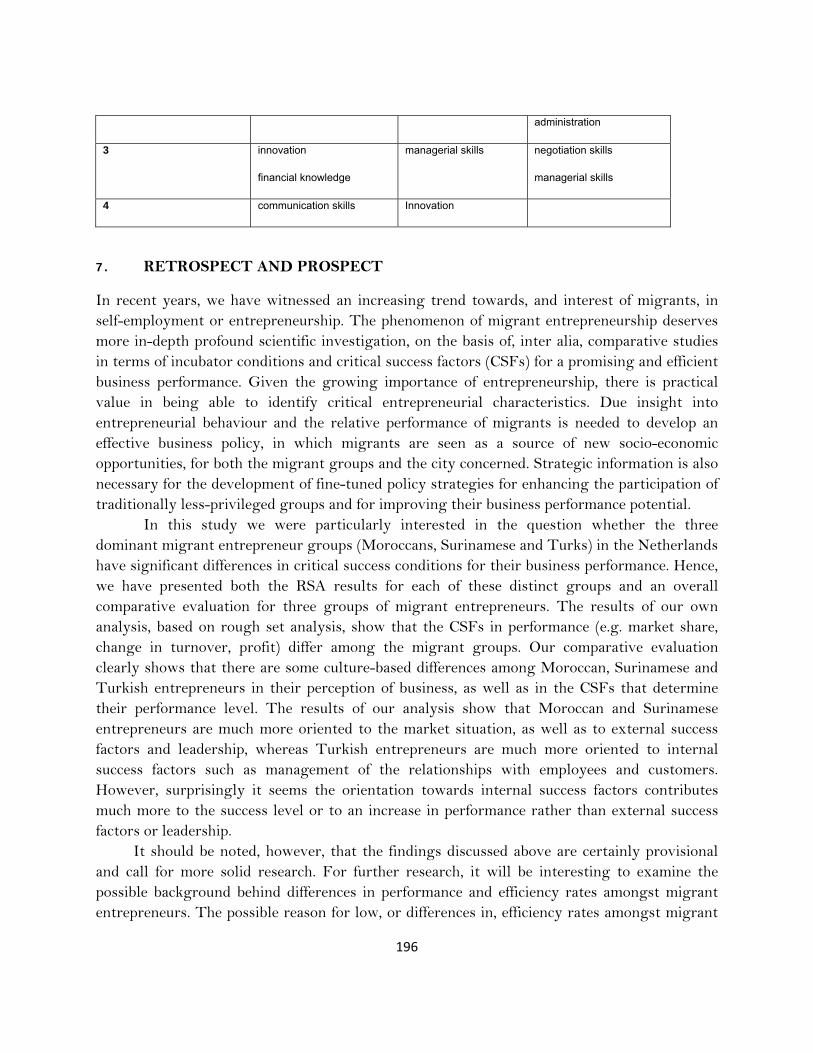
196
administration
3 innovation
financial knowledge
managerial skills negotiation skills
managerial skills
4 communication skills Innovation
7. RETROSPECT AND PROSPECT
In recent years, we have witnessed an increasing trend towards, and interest of migrants, in self-employment or entrepreneurship. The phenomenon of migrant entrepreneurship deserves more in-depth profound scientific investigation, on the basis of, inter alia, comparative studies in terms of incubator conditions and critical success factors (CSFs) for a promising and efficient business performance. Given the growing importance of entrepreneurship, there is practical value in being able to identify critical entrepreneurial characteristics. Due insight into entrepreneurial behaviour and the relative performance of migrants is needed to develop an effective business policy, in which migrants are seen as a source of new socio-economic opportunities, for both the migrant groups and the city concerned. Strategic information is also necessary for the development of fine-tuned policy strategies for enhancing the participation of traditionally less-privileged groups and for improving their business performance potential.
In this study we were particularly interested in the question whether the three dominant migrant entrepreneur groups (Moroccans, Surinamese and Turks) in the Netherlands have significant differences in critical success conditions for their business performance. Hence, we have presented both the RSA results for each of these distinct groups and an overall comparative evaluation for three groups of migrant entrepreneurs. The results of our own analysis, based on rough set analysis, show that the CSFs in performance (e.g. market share, change in turnover, profit) differ among the migrant groups. Our comparative evaluation clearly shows that there are some culture-based differences among Moroccan, Surinamese and Turkish entrepreneurs in their perception of business, as well as in the CSFs that determine their performance level. The results of our analysis show that Moroccan and Surinamese entrepreneurs are much more oriented to the market situation, as well as to external success factors and leadership, whereas Turkish entrepreneurs are much more oriented to internal success factors such as management of the relationships with employees and customers. However, surprisingly it seems the orientation towards internal success factors contributes much more to the success level or to an increase in performance rather than external success factors or leadership.
It should be noted, however, that the findings discussed above are certainly provisional and call for more solid research. For further research, it will be interesting to examine the possible background behind differences in performance and efficiency rates amongst migrant entrepreneurs. The possible reason for low, or differences in, efficiency rates amongst migrant
197
entrepreneurs may be the limited potential for growth of their market niches, because they appear to operate in limited markets. Other reasons for their low efficiency rate may be less labour (-market) experience and lack of entrepreneurial experience. Moreover, they are most often not aware and do not make use, of support facilities provided by the Dutch government.
A way to improve possibilities for migrant entrepreneurs in Amsterdam is for them to go beyond their own ethnic frontiers and expand their activities into broader and other market segments and business lines, competing or associating with the native Dutch entrepreneur in their own markets. This new strategy may need improvement of their skills and knowledge of the Dutch language. Here established associations can play a role in order to improve the relationship between migrant entrepreneurs and private and public institutions in the Netherlands.
References
Baaijens, S. and Nijkamp, P. (2002), Meta-Analytic Methods for Comparative and Exploratory Policy Research. Journal of Policy Modeling 22 (7): 821-858. Bal, F. and Nijkamp, P. (2000), A New Scientific Challenge in Economics: Theory Building via Synthesis, In: C. Bhagwan Dahiya (ed.), The Current State of Economic Science, Spellbound Press, Rohtak, pp. 101-115. Basu, A. and Altinay, E. (2002), The Interaction Between Culture and Entrepreneurship in London’s, Immigrant Businesses, International Small Business Journal 20: 371-393.
Baycan-Levent, T., Masurel, E. and Nijkamp, P. (2003), Diversity in Entrepreneurship: Ethnic and Female Roles in Urban Economic Life. International Journal of Social Economics 30(11): 1131-1161. Baycan-Levent, T. Masurel, E. and Nijkamp, P. (2004) ‘Trends in Break-out Strategies of Ethnic Entrepreneurs’. In:T.Vaz, E. Morgan and P. Nijkamp, The New European Rurality; Strategies for Small Firms. Ashgate, Aldershot, pp. 143-156.
Baycan-Levent, T. and Nijkamp, P. (2007a), Migrant Female Entrepreneurship: Driving Forces, Motivation and Performance. In: S. Desai, P. Nijkamp and R. Stough (eds), New Dimensions in Regional Economic Development: The Role of Entrepreneurship Research, Practice and Policy. Edward Elgar, Cheltenham, UK (forthcoming)
Baycan-Levent, T. and Nijkamp, P. (2007b), Planning and Management of Urban Green Spaces in Europe: A Comparative Analysis. Journal of Urban Planning and Development. (forthcoming).

198
Bergh, J.C.J.M. van den, Button, K., Nijkamp, P. and Pepping, G. (1997), Meta-Analysis of Environmental Economics, Kluwer, Dordrecht.
Boelhouwer, P. and Heijden, H. van der, (1993), Methodological Trends in International Comparative Research. Netherlands Journal of Housing and the Built Environment 8: 371-382. Borjas, G.J. (1990), Friends or Strangers: The Impact of Immigrants on the US Economy, Basic Books, New York. Borjas, G.J. (2005), Native Internal Migration and the Labour Market Impact of Immigration. NBER Working Paper no. 11610. NBER, Washington DC. Brush, C.G. (1992), Research on Women Business Owners: Past Trends, a New Perspective and Future Directions. Entrepreneurship Theory and Practice 17 (4): 5-30.
Buttner, E.H. and Moore, D.P. (1997), Women’s Organizational Exodus to Entrepreneurship: Self-Reported Motivations and Correlates with Success. Journal of Small Business Management 35 (1): 34-46.
CEEDR (2000), Young Entrepreneurs, Women Entrepreneurs, Ethnic Minority Entrepreneurs and Co–Entrepreneurs in the European Union and Central and Eastern Europe. Final Report to the European Commission, DG Enterprise, Centre for Enterprise and Economic Development Research (CEEDR) Middlesex University Business School, UK.
Choenni, A. (1997), Veelsoortig Assortiment, Het Spinhuis, Amsterdam.
Deakins, D. (1999), Entrepreneurship and Small Firms. 2nd edition, McGrawHill; London.
Delft, H. van, Gorter, C. and Nijkamp, P. (2000), In Search of Ethnic Entrepreneurship in the City. Environment & Planning C 18: pp. 429-451. Dustmann, C. and Glitz, A. (2005), Immigration, Jobs and Wages, Centre for Economic Policy Research, London. Fagenson, E.A. (1993), Personal Value Systems of Men and Women Entrepreneurs Versus Managers. Journal of Business Venturing 8: 409-430.
Fischer, E.M., Reuber, A.R. and Dyke, L.S. (1993), A Theoretical Overview and Extension of Research On Sex, Gender, and Entrepreneurship. Journal of Business Venturing 8 (2): 151-168.
Gorter, C., Nijkamp, P. and Poot J. (eds) (1998), Crossing Borders, Ashgate, Aldershot.
Greenwood, M.J. (1994), Potential Channels of Immigrants Influence on the Economy of the

199
Receiving Country. Papers in Regional Science 73: 211-240. Jacobs, J. (1961), The Life and Death of Great American Cities, Random House; New York.
Kloosterman, R.C., Leun, J. van der and Rath, J. (1998), Across the Border; Economic Opportunities, Social Capital and Informal Businesses Activities of Immigrants. Journal of Ethnic Migration Studies 24: 367-376. Lee, Y., Cameroen, T. Schaeffer, P. and Schmidt, C.G. (1997), Migrant Minority Small Business: A Comparative Analysis of Restaurants in Denver. Urban Geography 18: 591-621. Longhi, S., Nijkamp, P. and Poot, J. (2007), The Fallacy of ‘Job Robbing’. Journal of Migration and Refugee Issues 1(4): 131-152. Lyer, G.R. and Shapiro, J.M. (1999), Ethnic Entrepreneurial and Marketing Systems: Implications for the Global Economy. Journal of International Marketing 7: 83-110.
Masurel, E., Nijkamp, P., Tastan, M. and Vindigni, G. (2002), Motivations and Performance Conditions for Ethnic Entrepreneurship. Growth & Change 33(2): 238-260. Masurel, E. and Nijkamp, P. (2003), Allochtoon Ondernemerschap, In: P. Risseeuw and R. Thurik (eds) Handboek Ondernemers en Adviseurs; Management en Economie van het Midden- en Klein Bedrijf, Kluwer, Dordrecht, Ch.11.
McClelland, D.C. (1961), The Achieving Society, Van Nostrand, New York, NY.
Menzies, T.V., Brenner, G.A. and Filion, L.J. (2003), Social Capital, Networks and Ethnic Minority Entrepreneurs: Transnational Entrepreneurship and Bootstrap Capitalism’. In: H. Etemad and R.W. Wright (eds),Globalization and Entrepreneurship: Policy and Strategy Perspectives. Edward Elgar Publishing, Northampton, MA, pp.125-151. Min, P.G. (1987), Factors Contributing to Ethnic Business: A Comprehensive Synthesis. International Journal of Comparative Sociology 28 (3/4): 173-193. Nijkamp, P. (2003), Entrepreneurship in a Modern Network Economy. Regional Studies 37(4): 395-405. Nijkamp, P. and Pepping, G. (1998a), Levies for sustainable agriculture? A meta-analytic exploration of different pesticide price elasticities in agriculture. Journal of Environmental Systems 26 (1): 1-25.

200
Nijkamp. P. and Pepping, G. (1998b), Meta-Analysis for Explaining the Variance in Public Transport Demand Elasticies. Journal of Transportation and Statistics 4 (1): 1-14.
Nijkamp, P., Rodenburg, C.A. and Wagtendonk, A.J. (2002a), Success Factors for Sustainable Urban Brownfield Development. Ecological Economics 40: 235-252.
Nijkamp, P., Burch, M. van den and Vindigni, G. (2002b ), A Comparative Institutional Evaluation of Public-Private Partnerships in Dutch Urban Land-Use and Revitalization Projects. Urban Studies 39 (10): 1865-1880.
Pahl, R. (1984), Division of Labour. Basil Blackwell, Oxford.
Pawlak, Z. (1991), Rough Sets. Kluwer, Dordrecht.
Pawlak, Z. (2001), Al Intelligent Industrial Application. Cybernetics and Systems,. 31: 227-252.
Pickvance, C.G. (2001), Four Variations of Comparative Analysis. Journal of Housing and the Built Environment 16: 7-28. Pinch, S. (1993), Social Polarization: A Comparison of Evidence from Britain and the United States. Environment and Planning A 25: 779-795. Piore, M. and Sabel, C. (1984), The Second Industrial Divide, Basic Books, New York.
Portes A. and Jensen, L. (1989), The Enclave and the Entrants. American Sociological Review 54: 929-949.
Ragin, C.C. and Becker, H.S. (eds, 1993), What is a Case?, Cambridge University Press, Cambridge. Ram, M. (1994), Managing to Survive: Working Lives in Small Firms. Blackwell, Oxford.
Rath, J. (2000), Introduction; Immigrant Business and the Economic, Politico-Institutional and Social Environment, In: J. Rath (ed.), Immigrant Business: The Economic, Political and Social Environment, Macmillan Press, London, pp 1-19.
Razin, E. (1989), Relating Theories of Entrepreneurship Among Ethnic Groups and Entrepreneurship in Space – The Case of the Jewish Population in Israel. Geografiska Annaler. 71:167-181
Rettab, B. (2001), The Emergence of Migrant Entrepreneurship – A Conceptual Framework. EIM/Business and Policy Research. Zoetermeer.

201
Rotter, J.B. (1966), Generalized Expectancies for Internal versus External Locus of Control of Reinforcement. Psychological Monographs: General and Applied (80): 1-28.
Slowinski, R. (ed.) (1993), Intelligent Decision Support, Kluwer, Dordrecht.
Waldinger, R. Aldrich, H. and Ward, R. (eds) (1990), Ethnic Entrepreneurs. Sage Publishers. Newbury Park, Ca. Ward, R., and Jenkins, R. (eds) (1984), Ethnic Communities in Business. Cambridge University Press. Cambridge. Woolcock, M. (1998), Social Capital and Economic Development: Toward a Theoretical Synthesis and Policy Framework. Theory and Society 27: 151-208.
Yin, R. (1992), Case Study Research. Sage Publications Newbury Park, California.

202
PART C
ENTREPRENEURIAL
PERFORMANCE
ANALYSIS

203
204
CHAPTER 7*
SURVIVAL OF THE FITTEST AMONG MIGRANT ENTREPRENEURS – A STUDY ON EFFICIENCY PERFORMANCE OF MIGRANT ENTREPRENEURS IN AMSTERDAM BY MEANS OF DATA ENVELOPMENT ANALYSIS
Abstract
In our modern world with intensifying business competition, there has been an increasing interest in innovative entrepreneurial activity as an engine for economic growth. The economic performance of firms (or organizations) can be measured by, inter alia, innovation indicators, market shares, birth/death rates, investment rates and the like, while there is also a great variety of underlying key factors for explaining business performance, such as work attitude, quality and level of education, access to capital, spatial accessibility, network usage, etc. In the last few decades, migrant entrepreneurs have adopted a prominent place in the SME sector in many cities in developed countries, with varying degrees of success. Our paper aims to identify the efficiency profile of individual migrant business firms on the basis of a quantitative measurement of their performance. In the present study we will address in particular the drivers and barriers for the efficiency strategies of these entrepreneurs. As well as traditional regression methods, a modern operational technique to make a comparative study of quantitative efficiency differences between individual decision-making units (DMUs) is Data Envelopment Analysis (DEA). In this paper, DEA will be employed in order to identify relative efficiency differences between distinct categories of migrant entrepreneurs in the city of Amsterdam. A wealth of relevant data has been collected by systematic survey questionnaires, and these contain a variety of efficiency-oriented indicators, on both the input and the output side. Several sensitivity analyses – using cross-analysis methods – are then carried out to test the robustness of our findings by, inter alia, investigating the dependence of our results on socio-cultural ethnic groups, levels of education, first- and second-generation migrants, and age. The paper ends with some retrospective and prospective conclusions.
Key words: Data Envelopment Analysis, migrant entrepreneurship, efficiency performance
*Source: Sahin, M, Nijkamp, P., and Suzuki, S. (2009), Survival of the Fittest among Migrant Entrepreneurs – A Study on Efficiency Performance of Migrant Entrepreneurs in Amsterdam by Means of Data Envelopment Analysis, Regional Studies (conditionally accepted).*
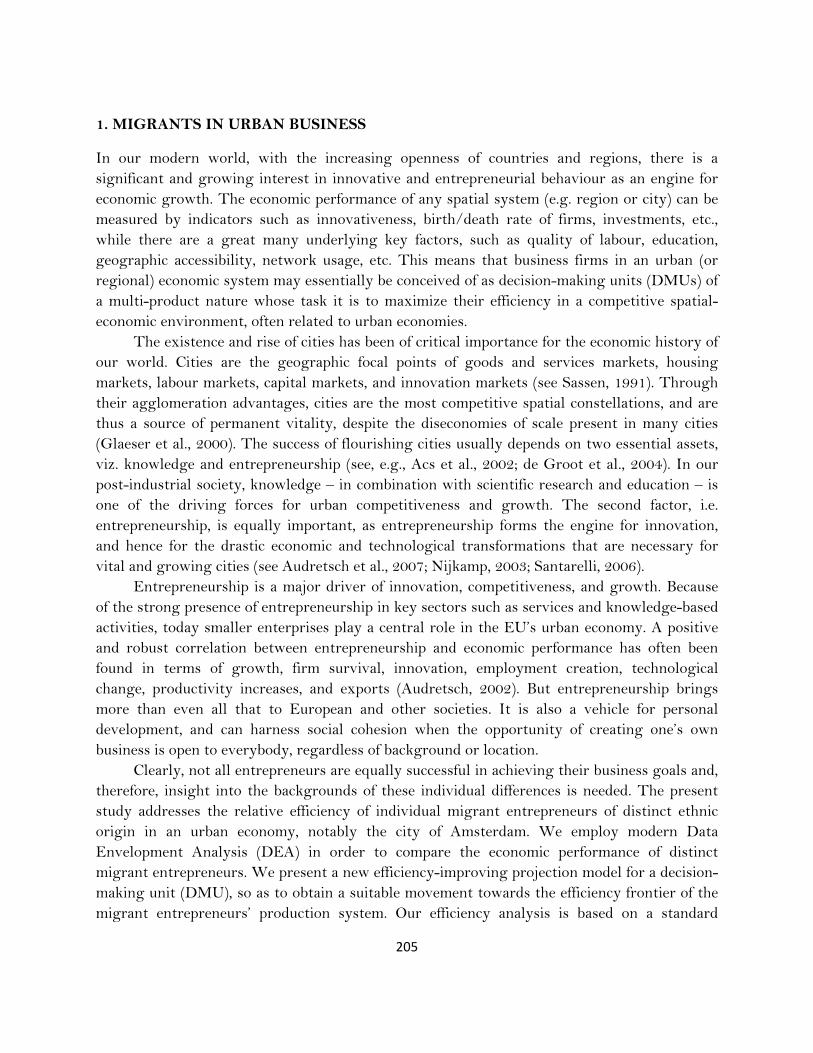
205
1. MIGRANTS IN URBAN BUSINESS
In our modern world, with the increasing openness of countries and regions, there is a significant and growing interest in innovative and entrepreneurial behaviour as an engine for economic growth. The economic performance of any spatial system (e.g. region or city) can be measured by indicators such as innovativeness, birth/death rate of firms, investments, etc., while there are a great many underlying key factors, such as quality of labour, education, geographic accessibility, network usage, etc. This means that business firms in an urban (or regional) economic system may essentially be conceived of as decision-making units (DMUs) of a multi-product nature whose task it is to maximize their efficiency in a competitive spatial-economic environment, often related to urban economies.
The existence and rise of cities has been of critical importance for the economic history of our world. Cities are the geographic focal points of goods and services markets, housing markets, labour markets, capital markets, and innovation markets (see Sassen, 1991). Through their agglomeration advantages, cities are the most competitive spatial constellations, and are thus a source of permanent vitality, despite the diseconomies of scale present in many cities (Glaeser et al., 2000). The success of flourishing cities usually depends on two essential assets, viz. knowledge and entrepreneurship (see, e.g., Acs et al., 2002; de Groot et al., 2004). In our post-industrial society, knowledge – in combination with scientific research and education – is one of the driving forces for urban competitiveness and growth. The second factor, i.e. entrepreneurship, is equally important, as entrepreneurship forms the engine for innovation, and hence for the drastic economic and technological transformations that are necessary for vital and growing cities (see Audretsch et al., 2007; Nijkamp, 2003; Santarelli, 2006).
Entrepreneurship is a major driver of innovation, competitiveness, and growth. Because of the strong presence of entrepreneurship in key sectors such as services and knowledge-based activities, today smaller enterprises play a central role in the EU’s urban economy. A positive and robust correlation between entrepreneurship and economic performance has often been found in terms of growth, firm survival, innovation, employment creation, technological change, productivity increases, and exports (Audretsch, 2002). But entrepreneurship brings more than even all that to European and other societies. It is also a vehicle for personal development, and can harness social cohesion when the opportunity of creating one’s own business is open to everybody, regardless of background or location.
Clearly, not all entrepreneurs are equally successful in achieving their business goals and, therefore, insight into the backgrounds of these individual differences is needed. The present study addresses the relative efficiency of individual migrant entrepreneurs of distinct ethnic origin in an urban economy, notably the city of Amsterdam. We employ modern Data Envelopment Analysis (DEA) in order to compare the economic performance of distinct migrant entrepreneurs. We present a new efficiency-improving projection model for a decision-making unit (DMU), so as to obtain a suitable movement towards the efficiency frontier of the migrant entrepreneurs’ production system. Our efficiency analysis is based on a standard

206
assumption in DEA that the DMU is essentially a multi-product firm with multiple production inputs (e.g. labour, socio-cultural network access) and multiple production outputs (e.g. profits, market share, socio-economic recognition, etc.).
Our study investigates the entrepreneurial performance of migrants – with a focus on personal characteristics, socio-cultural bonds, and managerial skills – from a multicultural urban perspective, in order to perform a quantitative assessment of critical success factors (CSFs) with the aim of assessing or improving business performance in a competitive urban environment. Such empirical insight into the entrepreneurial motives and achievements of migrants is also desirable for enhancing the socio-economic vitality of the city, in particular for developing promising policies in a modern urban melting pot of varied cultures. Our approach is applied to an extensive data set on the motives, CSFs, and cultural backgrounds of a sample of migrant entrepreneurs in Amsterdam. The data have been collected from recent survey questionnaires distributed among three dominant groups of migrant entrepreneurs in this city, viz. Moroccans, Surinamese, and Turks. The paper is organized as follows. We first offer a concise overview of issues and trends in migrant entrepreneurship. Then we briefly describe the main features of migrant entrepreneurs in the Netherlands, and in Amsterdam in particular. The next section briefly justifies the use of the DEA model employed in our empirical application. Following this, we describe the fieldwork and our database, and the subsequent section is devoted to a presentation and interpretation of the various results obtained. Finally, the last section makes some concluding remarks.
2. IMMIGRANTS AND ENTREPRENEURSHIP IN MODERN CITIES
In a globalized world, modern cities are increasingly becoming the habitat of international migrants and magnets of economic growth, in which small and medium-sized enterprises (SMEs) and innovative entrepreneurship play a key role in creative urban economic development. Modern cities house many migrant entrepreneurs who have a big, but often unknown, impact on the urban economy. Migrants make up a significant part of the urban population, and their business is critical for the economic development of cities, especially because of their large share in running SMEs.
SMEs have, in general, a significant position in the urban economies of most countries. A dynamic economy depends to a large extent on the experimental and innovative role of new and small firms. A changing set of new small firms provides an essential source of new ideas and experiments that would otherwise remain untapped in the economy. From this perspective, migrant entrepreneurship generates many advantages on the basis of suitable market niches and helps to reinforce the SME sector as a complement to bigger mainstream companies. Clearly, mainstream business can also benefit from the experience and knowledge of minority businesses that emerge as a consequence of the formation of migrant communities, with their sheltered markets and networks of mutual support. As the migrant share expands and

207
diversifies, the opportunities for related migrant suppliers and customers will also grow (Cormack and Niessen, 2002).
In recent decades, many cities have indeed experienced a process of radical change as a result of a significant influx of migrants, often with different cultures and behaviour compared with the native population. This has prompted many socio-cultural tensions in modern cities, but has also offered new opportunities for business life in the city. In particular, the phenomenon of ethnic or migrant entrepreneurship is nowadays often seen as a great chance to revitalize urban economic life. The seminal work of Waldinger has been particularly instrumental in this context (see, e.g., Waldinger, 1988; Waldinger et al., 1990; Waldinger, 1996).
There has been a fundamental discussion in the literature on the economic impact of migrants, especially at local and regional levels (see, e.g., Borjas, 1991; de Graaff and de Groot, 2004; de Graaff and Nijkamp et al., 2010; Greenwood, 1994; and Longhi et al., 2007). Despite the fact that foreign migrants do not, in general, have a demonstrable negative impact on the socio-economic conditions of native people, there is still much concern worldwide for the possible negative consequences of the international migration wave. Against this background, the phenomenon of migrant entrepreneurship has gained much popularity, as this type of self-employment has given a strong impetus to urban revitalization, while avoiding the negative impacts on the labour market that are often perceived (see, e.g., Bates, 1997; Baycan-Levent et al., 2009; Cummings, 1980, or Razin and Light, 1988). Migrant entrepreneurship is frequently seen as a sign of hope for urban economies in decay. But what do we know about the performance of migrant entrepreneurs? There is indeed a need for solid applied research.
However, it is important to note that migrants seem to be more inclined towards risk-taking in self-employment than those people who remain in the home country. They usually migrate with a strong desire for social advancement, and are thus more likely to take business risks and become self-employed. The difficulty of getting work has encouraged several migrants to set up their own business. Migrant minorities usually appear to be a highly motivated and qualified entrepreneurial group. Ethnic or migrant entrepreneurship in cities provides the opportunities for, and access to, economic growth, equal opportunities, and upward mobility for many of those who have traditionally been excluded from business, including migrant minorities.
Kloosterman and Rath (2001) find that the distinctive traits of ethnic entrepreneurship when compared with native entrepreneurship are: the origins of the entrepreneurs; the management strategies; the products and services; the personnel and the customers, which, in most of the cases, are both of ethnic origin. Therefore, ethnic entrepreneurs often have no contact outside their own immigrant group; this is mainly caused by the lack of knowledge of the language of the host country and also of the preferences and needs of the locals (Rusinovic, 2008). Therefore, the main issue related to ethnic entrepreneurship is the predominance of informal networks or mixed embeddedness, as Kloosterman et al. (1999) propose to call it, which, in many cases, they consider to have a positive effect on the survival rate of ethnic firms.

208
With the ongoing rise in ethnic minority populations, the economic power of these groups has become a visible fact that no urban policy can afford to ignore. According to Kloosterman and Rath (2001) ethnic entrepreneurs ‘can stretch or even challenge the conventional meaning of entrepreneurship’. Young people of ethnic origin are progressing more than ever before in education and the workforce (Cormack and Niessen, 2002). Therefore, although previously considered to lack financial and educational resources, the immigrants from less-developed countries nowadays present a different pattern, being often highly-educated and skilled (Kloosterman and Rath, 2001).
Each successful self-employed migrant or minority business firm contributes to improved social and economic integration. A growing migrant economy creates a virtuous circle: business success gives rise to a distinctive motivational structure which breeds a community-wide orientation towards entrepreneurship. General major factors that are responsible for the development of migrant and ethnic entrepreneurship are: labour market disadvantages; opportunity structures; group resources; and embeddedness.
Clearly, entrepreneurship, in general, may be defined in various ways (Verheul et al., 2001). Here we define entrepreneurship as the risky and creative execution and strategic management of business ownership, where business refers to firms with and without employees. According to Choenni (1997), this phenomenon refers to business activities undertaken by migrants with a specific socio-cultural and ethnic background or migrant origin, and it distinguishes itself from ‘normal’ entrepreneurship through its orientation on: migrant products; migrant market customers; or indigenous migrant business strategies. Migrant entrepreneurship is also generally regarded as an important self-organizing principle through which migrant minorities are able to improve their weak socio-economic position (Baycan-Levent et al., 2003). According to Waldinger et al. (1990), migrant minority businesses are a product of the interplay of opportunity structures, group characteristics, and strategies for adapting to the environment.
There are several other reasons why migrants opt for entrepreneurship: to be independent or to be their own boss; earn extra income; gain some work experience; maintain family tradition; are dissatisfied with their previous job; need flexibility; want to make a career; like a business job; or have ideological reasons and leadership qualities (Baycan-Levent et al., 2003). Jenkins (1984) has identified three basic explanatory models of ethnic involvement in business, viz. (i) the economic opportunity model; (ii) the culture model; and (iii) the reaction model. The economic opportunity model regards migrant minority businesses as relying on the market for their fortunes. The culture model assumes that some cultures predispose group members to the successful pursuit of entrepreneurial goals. The reaction model assumes that self-employment amongst members of migrant minority groups is a reaction against racism and blocked avenues of social mobility, a means of surviving in the margins of a white-dominated society. Metcalf et al. (1996) and Clark and Drinkwater (1998) identified the desire to avoid labour market discrimination in the form of low-paid jobs as a principal explanation for the entry of migrants into self-employment. They claimed that there is a substantial variation between migrant

209
groups in self-employment, but, in general, they earn less than whites, even whites with similar characteristics. Many migrants prefer the independence of entrepreneurship to a poorly paid job at the bottom of the labour market ladder. Starting-up a new enterprise, these people hope to increase their incomes and climb up the social ladder.
Chaganti and Greene (2000) showed several significant differences between natives and migrants with regard to the variables relating to the entrepreneurs’ background characteristics, business-related goals, cultural values, business strategies, and business performance. A prominent characteristic of migrant entrepreneurship is the influence of family and co-ethnic labour on the business. Co-ethnic labour is a critical source, of competitive advantage for migrant business, since it is cheap, and the problem of supervision is made easier (Mitter, 1986). Surveys conducted in different European countries show that most migrant businesses have been established with the financial and human capital support of their families. Migrant entrepreneurs regularly do not have sufficient security to be able to obtain capital via banks, so they often appeal to their own families or friends to finance their enterprises. They also often apply for relatively small loans, which are less interesting for banks, since the same fixed costs are attached to the provision of a small loan as to larger loans. In addition, many migrants do not seem to know how to approach banks, and are not always familiar with the criteria applicable for loan applications.
A consistent finding from previous research on migrant minority businesses is their low propensity to use mainstream business support agencies, often relying instead on self-help and informal sources of assistance (see Deakins et al., 1997; Ram and Jones-Evans, 1998; Ram and Smallbone, 2002; Carter and Jones-Evans, 2006). The low propensity of migrant entrepreneurs to use mainstream business support is caused by demand- and supply-side considerations. Demand-side issues refer to a low level of perceived need of (or a lack of interest in) receiving external assistance. Supply-side issues refer to: the inability to reach out to other firms; inadequate information systems; and the inappropriateness of the product-oriented approaches used by many support agencies. However, it was recently shown that second-generation entrepreneurs of different ethnic origin have less difficulty in approaching banks (Rusinovic, 2006), and make less use of financial capital from their own group, because they have the abilities and skills to make use of Dutch institutions for vocational guidance. Migrant entrepreneurs usually participate less in formal native networks, such as retailer groups, trade associations, and franchise organizations.
In recent years, an avalanche of literature has been published on migrant entrepreneurship, too much to be covered and reviewed in this present article. For more recent overviews, we refer to Kloosterman and Rath (2001), Oliveira and Rath (2008), Baycan-Levent et al. (2004), and Sahin et al. (2007, 2009). Migrant entrepreneurship research in many countries − including the Netherlands − is nowadays on a rising curve. Next, in Section 3, we provide a brief overview of issues involved with migrant entrepreneurship in the Netherlands, especially in the bigger cities (with a focus on Amsterdam).

210
3. MIGRANTS AS ENTREPRENEURIAL HEROES IN THE NETHERLANDS
Currently, the Netherlands has a total migrant population above 2,000,000, of which 51.9 per cent are first-generation immigrants. Furthermore, 40 per cent of the total migrant population live in the four biggest cities of the Netherlands (Rotterdam, Amsterdam, The Hague and Utrecht) (Tillie and Slijper, 2006). The larger migrant groups are of Turkish, Moroccan, and Surinamese origin.
The last three decades have been marked by a constant increase in the number of migrant entrepreneurs in the Netherlands. Between 1999 and 2002, the total number of entrepreneurs in the Netherlands increased from 925,800 to 967,500. Within this period, the highest increase was among non-Western immigrants, compared with native and Western entrepreneurs (EIM, 2004). The number of non-Western entrepreneurs increased from 34,000 in 1999 to 44,700 in 2002. Among Western immigrants the number of entrepreneurs increased from 72,600 to 77,300 (6.5 per cent), and among native Dutch the number of entrepreneurs increased by 3.2 per cent (EIM, 2004; Rusinovic, 2008). The major cities in the Netherlands certainly have a rich variety of migrant entrepreneurs. As mentioned earlier, a large part of these migrant enterprises and entrepreneurs are situated in the four big cities, Amsterdam, Rotterdam, The Hague, and Utrecht. Furthermore, entrepreneurship among migrants is not only concentrated geographically, but it also has concentrations in certain sectors. However, it is noteworthy that the entrepreneurship rate varies between countries, as well as between different populations within countries. This is especially the case for migrant groups in the Netherlands. Many migrants in the Netherlands originate from non-Western countries: from Turkey, Morocco, Surinam, and the Dutch Antilles. Migrant entrepreneurs are not homogeneous groups, but are composed of people with rather different socio-economic and cultural backgrounds. As a consequence, the success in establishing their own enterprise and their business performance/efficiency are clearly different among various minority groups. Moreover, the entrepreneurship rates of the Turkish and Moroccan entrepreneurs are quite different. The explanation may be related to the cultural background of the migrants. Whereas many first-generation migrants from Turkey already had an entrepreneurial background in their country of birth, migrants from Morocco showed considerable lower entrepreneurial rates. Hence, the later Turkish generations already stem from families with an entrepreneurial background, which may also cause the differences in motivation and orientation.
Migrant minorities consist of two types of migrants. One is the first-generation group, consisting of traditional migrants who were directly recruited for employment reasons. This group is less educated, and have acquired most of their education in their country of origin. The second group is the second generation, consisting of young dependants born in the host countries where they have had their entire education. This group masters the language of the host country better than the first generation, and is relatively more qualified and acquainted with the local labour market. Not surprisingly, this group is generally found to be more ambitious and selective in choosing a job. Mostly, first-generation migrant entrepreneurs undertake their

211
own business on impulse, without first making a detailed study of the market prospects. As a consequence of this start, they serve the same customer-group with the same products and services as their competitors, without any distinction. This may lead to enormous price competition, a falling behind in entrepreneur’s income, and a high fall-out percentage amongst young migrant businesses.
Migrant entrepreneurs in the Netherlands are not a uniform business group. They have different ethnic origins, network relationships, cultural adjustment patterns, business styles, and so forth. Consequently, it might be interesting to test whether distinct migrant groups have significant differences in their economic performance. As can be seen from Table 1, the rates of entrepreneurship are quite divergent among different groups. There is also a difference in the sectoral choice of first- and second-generation migrants. The former more often choose to become self-employed in the traditional sectors, i.e. retail, hotels, and catering. On the other hand, the second-generation entrepreneurs are predominantly active in the business and producer services sector. Therefore, the sectoral choice of these second-generation entrepreneurs rather resembles that of the natives, more than that of their forerunners.
Figure 1 shows the differences in profit of first- and second-generation migrant entrepreneurs from the four main groups in the Netherlands. T1 and T2 refer, respectively, to first- and second-generation Turkish entrepreneurs. M1 and M2 refer, respectively, to first- and second-generation Moroccan entrepreneurs. S1 and S2 refer, respectively, to first- and second-generation Surinamese entrepreneurs, and A1 and A2 refer to first- and second-generation Antillean entrepreneurs.
Table 1. Number of entrepreneurs (x1,000), 1999-2004 (CBS, 2007)
Year Turks Moroccans Netherlands/
Antilles
Surinamese
1999
2000
2001
2002
2003
2004
7.9
9.2
11.0
11.5
11.9
11.8
2.8
3.3
4.0
4.3
4.4
4.6
1.5
1.8
2.0
2.1
2.2
2.1
6.4
7.1
7.8
7.9
8.0
7.7
Figure 2 indicates that the Antilleans and Surinamese seem very successful; the second-generation entrepreneurs in these groups have almost the same rate of profit as those of the first generation. But, when we look at the migrants from Turkey and Morocco, the profit of the

212
first-generation entrepreneurs is much higher than that of the second generation. Although the Surinamese and Antillean groups are much smaller than the other two groups, they have a higher profit. This may be caused by differences in their entrepreneurial behaviour. In our empirical research, we use a modern research tool to assess individual performance differences among DMUs, based on DEA.
Figure 1: Distribution of profit among first- and second-generation migrant entrepreneurs
Source: CBS, 2004.
The most prominent advantage of ethnic entrepreneurship is its contribution to reducing social exclusion and raising living standards in groups that can often be among the most disadvantaged in society. Migrant entrepreneurs contribute to the supply of a more diversified range of products, thus raising competition and, indirectly, the quality of products. Furthermore, the benefits of ethnic entrepreneurship consist of social bonds in a cultural network. This network creates flexible ways to attract personnel and capital, and the capacity to generate market niches for specific cultural goods (e.g. music and food). In countries like the Netherlands and the US, migrant entrepreneurship has proven to be an efficient means of socio-economic integration contributing significantly to the overall economic growth and development of the area concerned. Ethnic entrepreneurship has a social, as well as an economic, impact on a society’s development in both short-term and long-term perspectives (Teder and Golik, 2006). Exploring the phenomenon of ethnic entrepreneurs is thus highly important, for both social and economic reasons. In the next section we introduce our empirical research.
4. RESEARCH DESIGN AND DATABASE
4.1. Research approach As mentioned before, our aim is to undertake an efficiency analysis among individual migrant entrepreneurs who belong to three main ethnic groups in the city of Amsterdam. The migrant entrepreneurship segment is gaining considerable importance in the business system of this city, but also has several weaknesses with various degrees of economic success. Hence, we are
0
5000
10000
15000
20000
25000
€
1999 2000 2001 2002 2003
years
Profit of Migrant Entrepreneurs
T1 T2 M1 M2 S1 S2 A1 A2
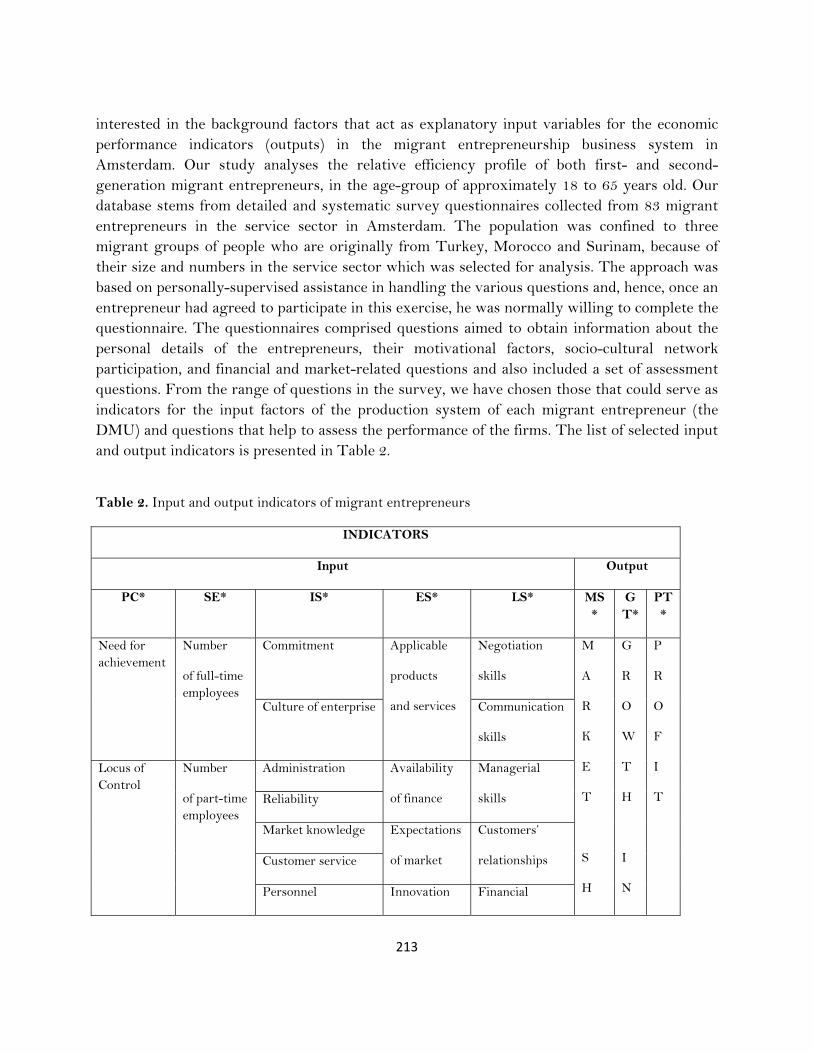
213
interested in the background factors that act as explanatory input variables for the economic performance indicators (outputs) in the migrant entrepreneurship business system in Amsterdam. Our study analyses the relative efficiency profile of both first- and second-generation migrant entrepreneurs, in the age-group of approximately 18 to 65 years old. Our database stems from detailed and systematic survey questionnaires collected from 83 migrant entrepreneurs in the service sector in Amsterdam. The population was confined to three migrant groups of people who are originally from Turkey, Morocco and Surinam, because of their size and numbers in the service sector which was selected for analysis. The approach was based on personally-supervised assistance in handling the various questions and, hence, once an entrepreneur had agreed to participate in this exercise, he was normally willing to complete the questionnaire. The questionnaires comprised questions aimed to obtain information about the personal details of the entrepreneurs, their motivational factors, socio-cultural network participation, and financial and market-related questions and also included a set of assessment questions. From the range of questions in the survey, we have chosen those that could serve as indicators for the input factors of the production system of each migrant entrepreneur (the DMU) and questions that help to assess the performance of the firms. The list of selected input and output indicators is presented in Table 2.
Table 2. Input and output indicators of migrant entrepreneurs
INDICATORS
Input Output
PC* SE* IS* ES* LS* MS*
GT*
PT*
Need for achievement
Number
of full-time employees
Commitment Applicable
products
and services
Negotiation
skills
M
A
R
K
E
T
S
H
G
R
O
W
T
H
I
N
P
R
O
F
I
T
Culture of enterprise Communication
skills
Locus of Control
Number
of part-time employees
Administration Availability
of finance
Managerial
skills Reliability
Market knowledge Expectations
of market
Customers’
relationships Customer service
Personnel Innovation Financial
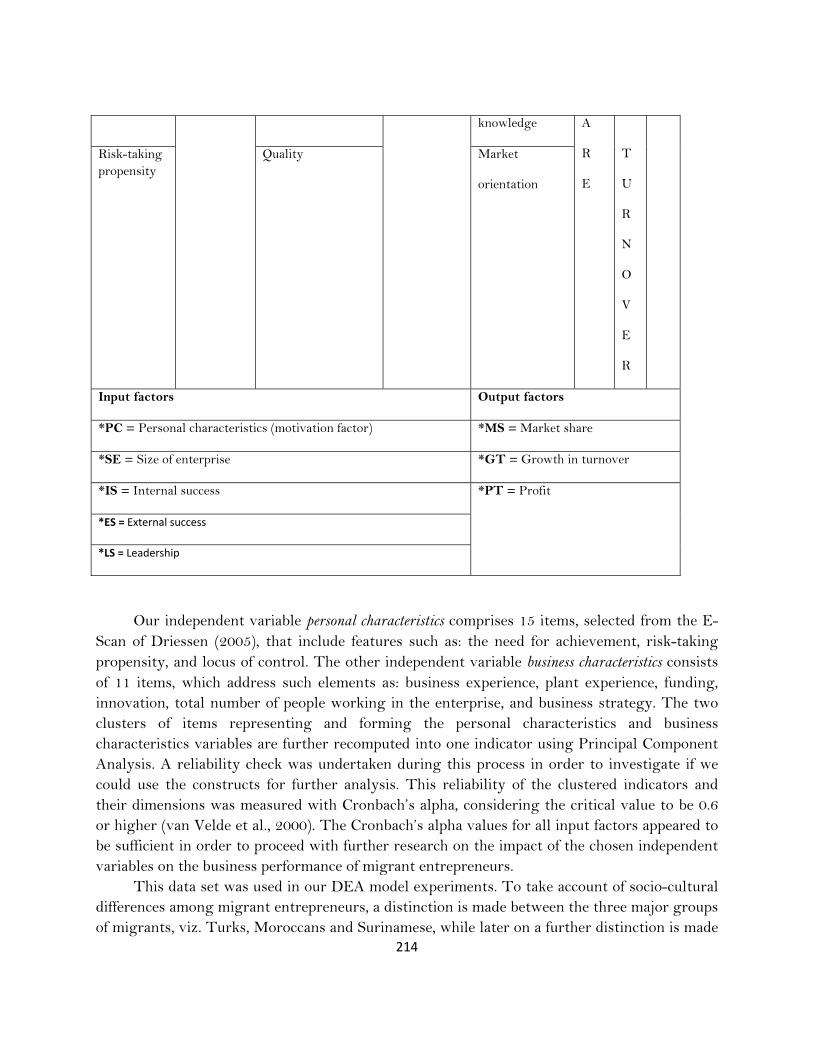
214
knowledge A
R
E
T
U
R
N
O
V
E
R
Risk-taking propensity
Quality Market
orientation
Input factors Output factors
*PC = Personal characteristics (motivation factor) *MS = Market share
*SE = Size of enterprise *GT = Growth in turnover
*IS = Internal success *PT = Profit
*ES = External success
*LS = Leadership
Our independent variable personal characteristics comprises 15 items, selected from the E-Scan of Driessen (2005), that include features such as: the need for achievement, risk-taking propensity, and locus of control. The other independent variable business characteristics consists of 11 items, which address such elements as: business experience, plant experience, funding, innovation, total number of people working in the enterprise, and business strategy. The two clusters of items representing and forming the personal characteristics and business characteristics variables are further recomputed into one indicator using Principal Component Analysis. A reliability check was undertaken during this process in order to investigate if we could use the constructs for further analysis. This reliability of the clustered indicators and their dimensions was measured with Cronbach’s alpha, considering the critical value to be 0.6 or higher (van Velde et al., 2000). The Cronbach’s alpha values for all input factors appeared to be sufficient in order to proceed with further research on the impact of the chosen independent variables on the business performance of migrant entrepreneurs.
This data set was used in our DEA model experiments. To take account of socio-cultural differences among migrant entrepreneurs, a distinction is made between the three major groups of migrants, viz. Turks, Moroccans and Surinamese, while later on a further distinction is made

215
according to age, and first- or second-generation migrant education level. The results are presented in Section 6.
4.2. Database on migrant entrepreneurs in the service sector in Amsterdam Migrant entrepreneurs often have to work in an unfamiliar and risky business environment in the Netherlands. Some may tend to be risk-avoiding and hence concentrate on traditional market segments (e.g. markets for ethnic products). Consequently, they may be less entrepreneurially-oriented in terms of risk attitudes concerning undertaking innovative business activities. Many migrant entrepreneurs appear to operate in limited markets with products oriented towards their own ethnic or socio-cultural group. In such a captive market the prospects for break-outs to be able to serve the wider community are almost nil, as these markets are, by definition, limited and competitive (the ‘ethnic mobility trap’: see Wiley, 1970).
Migrant entrepreneurs’ reliance on social networks of their own socio-cultural group may guarantee a certain market share, but may at the same time hamper an outreach strategy towards new and innovative markets (e.g. high-tech/ICT). A creative ‘break-out’ action line may strengthen the economic position of migrants and also contribute to urban vitality by bringing new opportunities to the multicultural Dutch cities in the Netherlands. According to Baycan-Levent et al. (2004), a ‘break-out’ strategy in migrant entrepreneurship can be conceived of as a strategy to escape from the lock-in situation of a relatively small market niche in which a certain migrant group has a dominant socio-economic position regarding several strategic business factors (e.g. capital, clients, and employees).
The figures presented above reveal a few interesting facts: (i) migrant entrepreneurship is on a rising curve, especially in the large cities in the Netherlands; and (ii) most migrant entrepreneurs are found in traditional, low-growth branches of the Dutch economy, without a clear trend towards break-out strategies. In the major Dutch cities, migrant entrepreneurs have gained a prominent position. It seems, however, plausible that they confirm the hypothesis of Light and Roach (1996) that they earn − despite their involvement in traditional branches − more than their fellow workers in paid jobs (‘the self-employment bonus’).
Despite the rise of entrepreneurs in Dutch cities with a migrant background, it is still an open question whether these entrepreneurs are innovative in the Schumpeterian sense (see also Engelen, 2002; O’Sullivan, 2000). Are their business competences higher than those of native entrepreneurs in the Netherlands (where competences refer to organizational and management skills, proper strategies for coping with market and technical uncertainties, an innovative attitude associated with ‘animal spirits’, and network participation; see also Cooke and Morgan, 1998; Whitley, 2000)? According to Lin et al. (2006), there is no single route to entrepreneurial success or failure; successful entrepreneurs are those who can adjust their entrepreneurial strategies according to their social capabilities. Which factors determine the performance of migrant business firms? To that end, we present an explanatory migrant business system which maps out the various forces at work in a competitive urban business environment. This framework provides our testable model (see Figure 2).

216
Figure 2: Framework of determinants of migrant entrepreneurship
Our study primarily addresses the entrepreneurial behaviour of migrants in the city of Amsterdam – with a focus on personal characteristics, socio-cultural bonds, and managerial skills – from a multicultural urban perspective, in order to perform a quantitative assessment of critical success factors (CSFs) for migrant entrepreneurs in a cultural network context, with the aim of improving business performance in a competitive urban environment. Figure 2 shows the relationship between culture and social networks with a view to the identification of critical success factors (CSFs) for the business performance of migrant entrepreneurs. Those factors are linked to their success and entry into new business markets of migrant entrepreneurs of different ethnic origin in Dutch cities. To that end, it is important to specify relevant input factors that may explain quantitatively the performance (output factors) of these entrepreneurs. Our approach will be applied to an extensive data set on the motives, CSFs, and cultural backgrounds of a sample of migrant entrepreneurs in Amsterdam. The methodology for examining such an analytical model in a quantitative sense, based on DEA, is now be explained in Section 5.
5. DATA ENVELOPMENT ANALYSIS AS AN ASSESSMENT TOOL FOR BUSINESS EFFICIENCY
Data Envelopment Analysis (DEA) has over the past years become an appropriate “data-oriented” approach for estimating quantitatively the comparative performance of a set of peer entities called Decision-Making Units (DMUs) which convert multiple inputs into multiple outputs. In recent years DEA has been extensively applied to operational efficiency problems in public and private sector agencies.
In our study, DEA has been applied in order to analyse the efficiency rates of individual entrepreneurs. The general idea is that the production process of a DMU can be described by a generalized production function which may contain multiple input and multiple output factors. The most efficient production technology of such a composite production process can be
Critical
success
factors
Size of
enterprise
External
success
factors
Business
performance
Internal success
factors
217
described by means of the production possibility frontier, while the actual position of a firm − in terms of its realized efficiency or relative use of input factors to achieve a certain output (or a set of outputs) − can be represented by a point in either the input space or the output space.
A major advantage of DEA is that it does not require any a-priori-specified functional form of the production technology, since it is generated from empirical data on observed performance measures (both inputs and outputs). In general, DEA models assess the (in)efficiency of a DMU on the basis of the actual economic distance to the production frontier that gives the highest possible efficiency. The efficiency analysis developed by Charnes et al. (1978) aims to maximize production efficiency in terms of the ratio of total weighted output to total weighted input, subject to the condition that in all circumstances this efficiency measure is smaller than or equal to 1. Thus, the distance to the maximum value 1 is then seen as a measure of inefficiency.
A standard approach in DEA is the estimation of weights, which are calculated normally by specifying a multiple objective maximization model (in case of multiple outputs). In that case the weights are determined through a maximization exercise faced by each DMU. The following steps are normally undertaken (for more details, see Cracolici and Nijkamp, 2006; Suzuki et al., 2010a). We start with a specification of a fractional maximization problem by each DMU (in terms of ratios of weighted outputs to weighted inputs) with the aim to identify the optimal weights. There then follows a transformation of the above nonlinear maximization problem into a standard linear programming problem in order to compute the input and output weights. This primal linear programming model represents an output-oriented approach, while its dual formulation indicates an input orientation (for a given level of outputs, inputs are minimized). If the solution to the maximization problem leads to a value 1 for some DMU, then this DMU is efficient (i.e. a case of a non-dominated solution), while a value below 1 indicates a case of inefficiency. Clearly, all points on the efficiency frontier have a value of 1. If one or more inputs or outputs are added to the DEA method, this will affect the selection and the number of efficiently operating DMUs. In general, if more relevant inputs are added, the number of efficient DMUs will rise. Thus, this is a clear reason to pay attention to the specification of the DEA model, while a sensitivity analysis regarding the choice of the inputs or outputs is also desirable.
In Suzuki et al. (2010a,b) a generalized DEA model has been designed, and this will be used in our application. Thus, this new DEA approach is the central tool for explaining differences in the performance of migrant entrepreneurs in Amsterdam, using recently developed software described in Suzuki et al. (2010a,b). The basic idea is that each migrant entrepreneur is a multi-product organization (DMU) that has a set of distinct input descriptors and a set of multiple output (or performance) indicators (see Table 2 for details). The relative efficiency in using inputs to generate outputs is then a measure for the economic success of a DMU, where the relative success performance ranges from 0 (i.e. totally inferior efficiency) to 1 (maximum efficiency). The individual results can then be summarized in an integrated survey table.
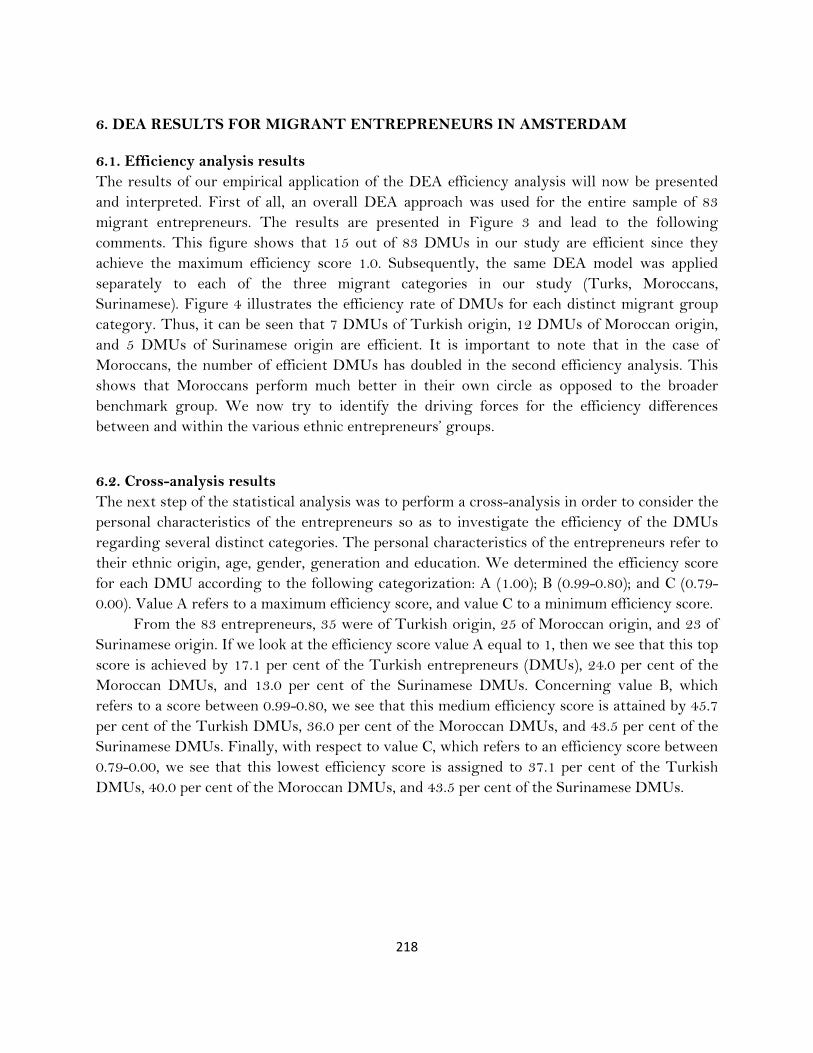
218
6. DEA RESULTS FOR MIGRANT ENTREPRENEURS IN AMSTERDAM
6.1. Efficiency analysis results The results of our empirical application of the DEA efficiency analysis will now be presented and interpreted. First of all, an overall DEA approach was used for the entire sample of 83 migrant entrepreneurs. The results are presented in Figure 3 and lead to the following comments. This figure shows that 15 out of 83 DMUs in our study are efficient since they achieve the maximum efficiency score 1.0. Subsequently, the same DEA model was applied separately to each of the three migrant categories in our study (Turks, Moroccans, Surinamese). Figure 4 illustrates the efficiency rate of DMUs for each distinct migrant group category. Thus, it can be seen that 7 DMUs of Turkish origin, 12 DMUs of Moroccan origin, and 5 DMUs of Surinamese origin are efficient. It is important to note that in the case of Moroccans, the number of efficient DMUs has doubled in the second efficiency analysis. This shows that Moroccans perform much better in their own circle as opposed to the broader benchmark group. We now try to identify the driving forces for the efficiency differences between and within the various ethnic entrepreneurs’ groups.
6.2. Cross-analysis results The next step of the statistical analysis was to perform a cross-analysis in order to consider the personal characteristics of the entrepreneurs so as to investigate the efficiency of the DMUs regarding several distinct categories. The personal characteristics of the entrepreneurs refer to their ethnic origin, age, gender, generation and education. We determined the efficiency score for each DMU according to the following categorization: A (1.00); B (0.99-0.80); and C (0.79-0.00). Value A refers to a maximum efficiency score, and value C to a minimum efficiency score.
From the 83 entrepreneurs, 35 were of Turkish origin, 25 of Moroccan origin, and 23 of Surinamese origin. If we look at the efficiency score value A equal to 1, then we see that this top score is achieved by 17.1 per cent of the Turkish entrepreneurs (DMUs), 24.0 per cent of the Moroccan DMUs, and 13.0 per cent of the Surinamese DMUs. Concerning value B, which refers to a score between 0.99-0.80, we see that this medium efficiency score is attained by 45.7 per cent of the Turkish DMUs, 36.0 per cent of the Moroccan DMUs, and 43.5 per cent of the Surinamese DMUs. Finally, with respect to value C, which refers to an efficiency score between 0.79-0.00, we see that this lowest efficiency score is assigned to 37.1 per cent of the Turkish DMUs, 40.0 per cent of the Moroccan DMUs, and 43.5 per cent of the Surinamese DMUs.
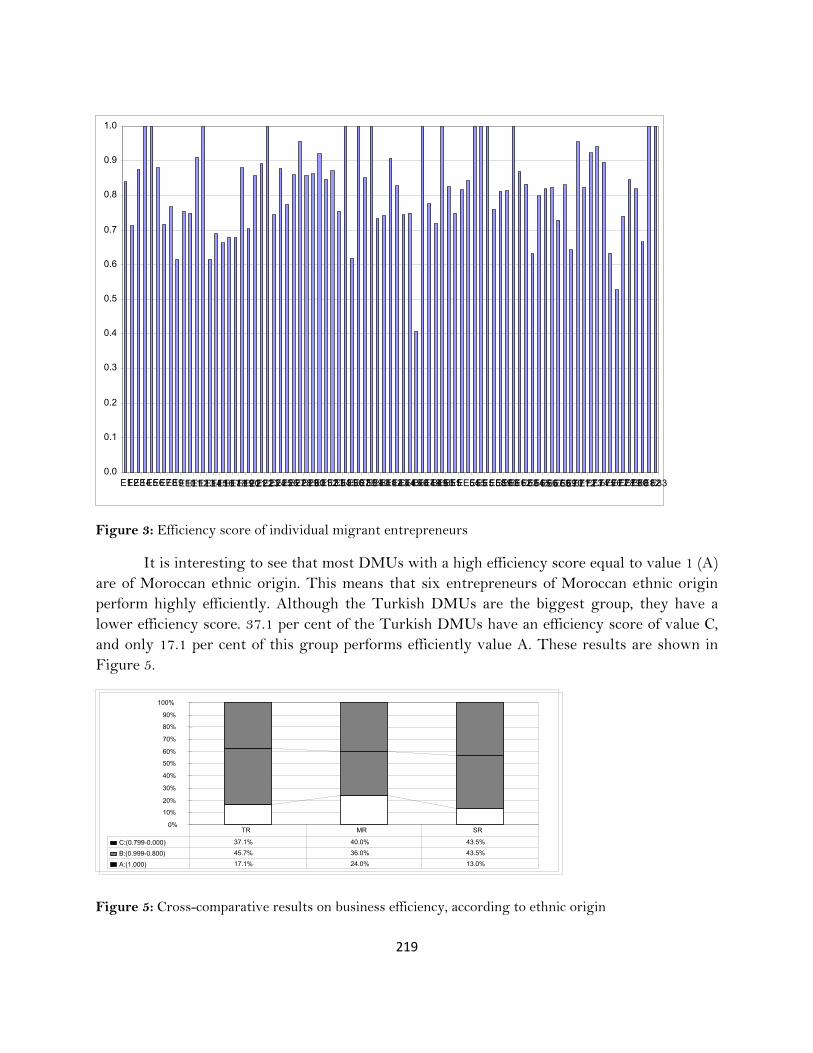
219
Figure 3: Efficiency score of individual migrant entrepreneurs
It is interesting to see that most DMUs with a high efficiency score equal to value 1 (A) are of Moroccan ethnic origin. This means that six entrepreneurs of Moroccan ethnic origin perform highly efficiently. Although the Turkish DMUs are the biggest group, they have a lower efficiency score. 37.1 per cent of the Turkish DMUs have an efficiency score of value C, and only 17.1 per cent of this group performs efficiently value A. These results are shown in Figure 5.
Figure 5: Cross-comparative results on business efficiency, according to ethnic origin
0% 10% 20% 30% 40% 50% 60% 70% 80% 90%
100%
C:(0.799-0.000) 37.1% 40.0% 43.5%
B:(0.999-0.800) 45.7% 36.0% 43.5%
A:(1.000) 17.1% 24.0% 13.0%
TR MR SR
0.0
0.1
0.2
0.3
0.4
0.5
0.6
0.7
0.8
0.9
1.0
E1E2 E3E4 E5E6E7E8 E9E10E11 E12 E13E14E15E16E17 E18E19E20E21 E22E23E24E25 E26 E27E28E29E30E31E32E33E34E35E36E37E38E39E40E41E42E43E44E45E46E47E48E49E50E51E5EE54E55E5E5E58E59E60E61E62E63E64E65E66E67E68E69E70E71E72E73E74E75E76 E77E78E79E80E81E82E83
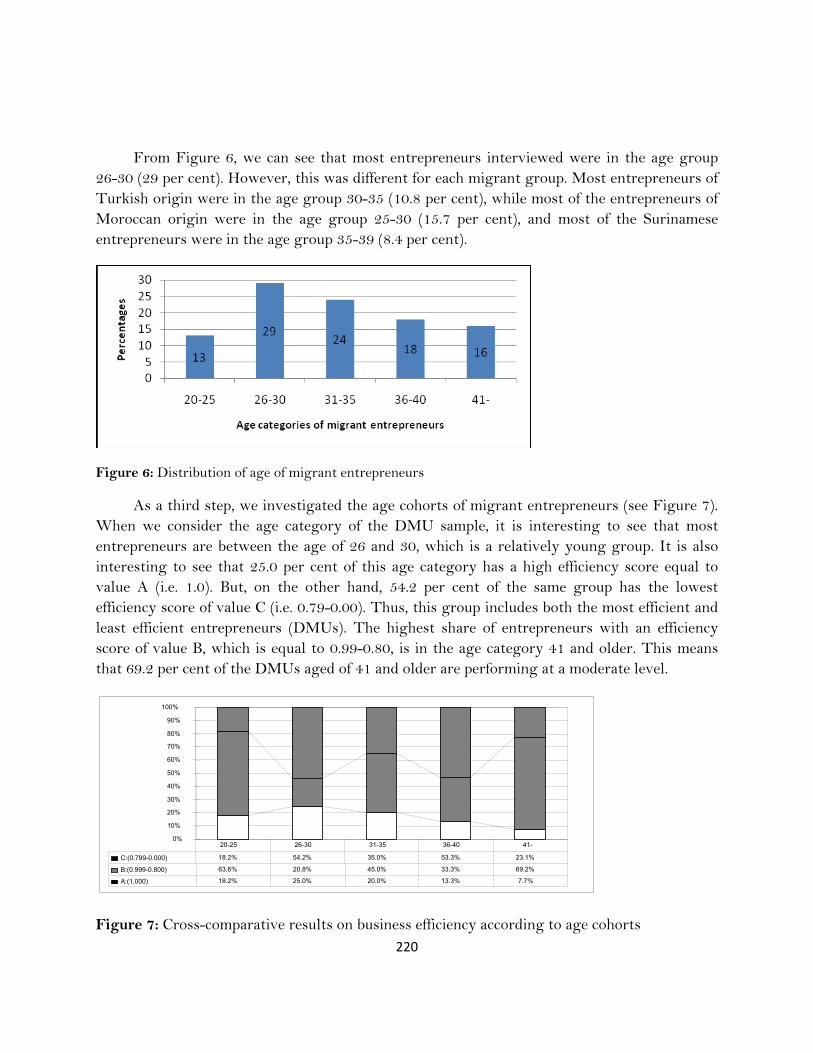
220
From Figure 6, we can see that most entrepreneurs interviewed were in the age group 26-30 (29 per cent). However, this was different for each migrant group. Most entrepreneurs of Turkish origin were in the age group 30-35 (10.8 per cent), while most of the entrepreneurs of Moroccan origin were in the age group 25-30 (15.7 per cent), and most of the Surinamese entrepreneurs were in the age group 35-39 (8.4 per cent).
Figure 6: Distribution of age of migrant entrepreneurs
As a third step, we investigated the age cohorts of migrant entrepreneurs (see Figure 7). When we consider the age category of the DMU sample, it is interesting to see that most entrepreneurs are between the age of 26 and 30, which is a relatively young group. It is also interesting to see that 25.0 per cent of this age category has a high efficiency score equal to value A (i.e. 1.0). But, on the other hand, 54.2 per cent of the same group has the lowest efficiency score of value C (i.e. 0.79-0.00). Thus, this group includes both the most efficient and least efficient entrepreneurs (DMUs). The highest share of entrepreneurs with an efficiency score of value B, which is equal to 0.99-0.80, is in the age category 41 and older. This means that 69.2 per cent of the DMUs aged of 41 and older are performing at a moderate level.
Figure 7: Cross-comparative results on business efficiency according to age cohorts
0% 10% 20% 30% 40% 50% 60% 70% 80% 90%
100%
C:(0.799-0.000) 18.2% 54.2% 35.0% 53.3% 23.1%
B:(0.999-0.800) 63.6% 20.8% 45.0% 33.3% 69.2%
A:(1.000) 18.2% 25.0% 20.0% 13.3% 7.7%
20-25 26-30 31-35 36-40 41-
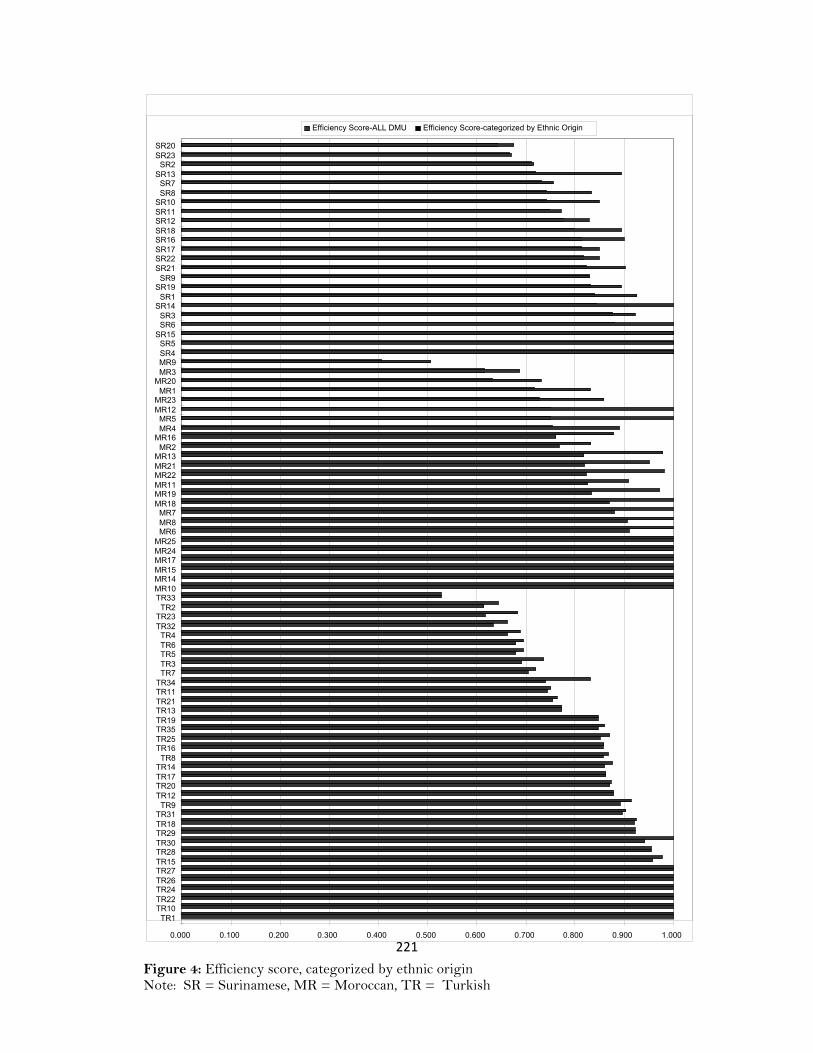
221
0.000 0.100 0.200 0.300 0.400 0.500 0.600 0.700 0.800 0.900 1.000
TR1TR10TR22TR24TR26TR27TR15TR28TR30TR29TR18TR31
TR9TR12TR20TR17TR14
TR8TR16TR25TR35TR19TR13TR21TR11TR34
TR7TR3TR5TR6TR4
TR32TR23
TR2TR33MR10 MR14 MR15 MR17 MR24 MR25
MR6 MR8 MR7
MR18 MR19 MR11 MR22 MR21 MR13
MR2 MR16
MR4 MR5
MR12 MR23
MR1 MR20
MR3 MR9 SR4SR5
SR15 SR6SR3
SR14 SR1
SR19 SR9
SR21 SR22 SR17 SR16 SR18 SR12 SR11 SR10
SR8SR7
SR13 SR2
SR23 SR20
Efficiency Score-ALL DMU Efficiency Score-categorized by Ethnic Origin
Figure 4: Efficiency score, categorized by ethnic origin Note: SR = Surinamese, MR = Moroccan, TR = Turkish
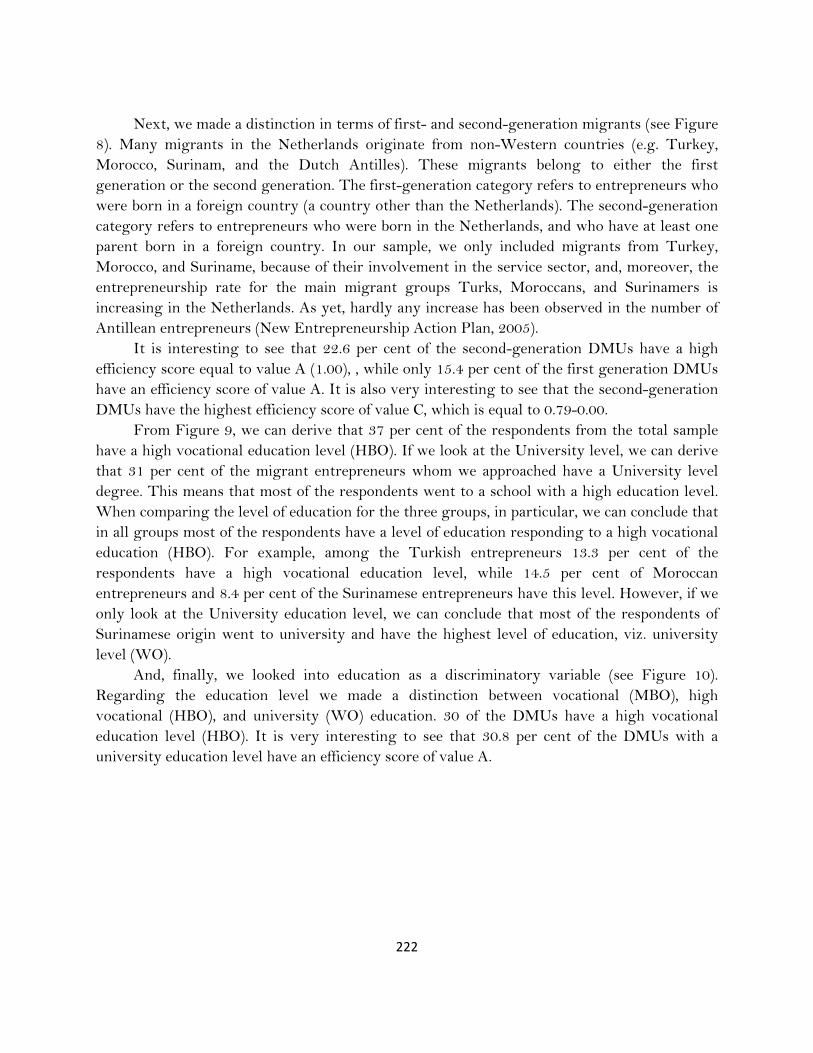
222
Next, we made a distinction in terms of first- and second-generation migrants (see Figure 8). Many migrants in the Netherlands originate from non-Western countries (e.g. Turkey, Morocco, Surinam, and the Dutch Antilles). These migrants belong to either the first generation or the second generation. The first-generation category refers to entrepreneurs who were born in a foreign country (a country other than the Netherlands). The second-generation category refers to entrepreneurs who were born in the Netherlands, and who have at least one parent born in a foreign country. In our sample, we only included migrants from Turkey, Morocco, and Suriname, because of their involvement in the service sector, and, moreover, the entrepreneurship rate for the main migrant groups Turks, Moroccans, and Surinamers is increasing in the Netherlands. As yet, hardly any increase has been observed in the number of Antillean entrepreneurs (New Entrepreneurship Action Plan, 2005).
It is interesting to see that 22.6 per cent of the second-generation DMUs have a high efficiency score equal to value A (1.00), , while only 15.4 per cent of the first generation DMUs have an efficiency score of value A. It is also very interesting to see that the second-generation DMUs have the highest efficiency score of value C, which is equal to 0.79-0.00.
From Figure 9, we can derive that 37 per cent of the respondents from the total sample have a high vocational education level (HBO). If we look at the University level, we can derive that 31 per cent of the migrant entrepreneurs whom we approached have a University level degree. This means that most of the respondents went to a school with a high education level. When comparing the level of education for the three groups, in particular, we can conclude that in all groups most of the respondents have a level of education responding to a high vocational education (HBO). For example, among the Turkish entrepreneurs 13.3 per cent of the respondents have a high vocational education level, while 14.5 per cent of Moroccan entrepreneurs and 8.4 per cent of the Surinamese entrepreneurs have this level. However, if we only look at the University education level, we can conclude that most of the respondents of Surinamese origin went to university and have the highest level of education, viz. university level (WO).
And, finally, we looked into education as a discriminatory variable (see Figure 10). Regarding the education level we made a distinction between vocational (MBO), high vocational (HBO), and university (WO) education. 30 of the DMUs have a high vocational education level (HBO). It is very interesting to see that 30.8 per cent of the DMUs with a university education level have an efficiency score of value A.

223
Figure 8: Cross-comparative results on business efficiency according to generation
Figure 9: Distribution of education level of migrant entrepreneurs
The most efficient DMUs have a university education level 30.8 per cent of the DMUs with a university education level have an efficiency score of value A, while no DMUs with a secondary and other education level have an efficiency score of value A. This means that their businesses are not performing efficiently. The other efficiently-performing group refers to DMUs with a high vocational education. 20.0 per cent of this group have an efficiency score of value A (1.00). We can conclude, therefore, that a higher level of education will improve the efficiency score of the DMUs.
0%
10%
20%
30%
40%
50%
60%
70%
80%
90%
100%
C:(0.799-0.000) 38.5% 41.9%
B:(0.999-0.800) 46.2% 35.5%
A:(1.000) 15.4% 22.6%
First Second
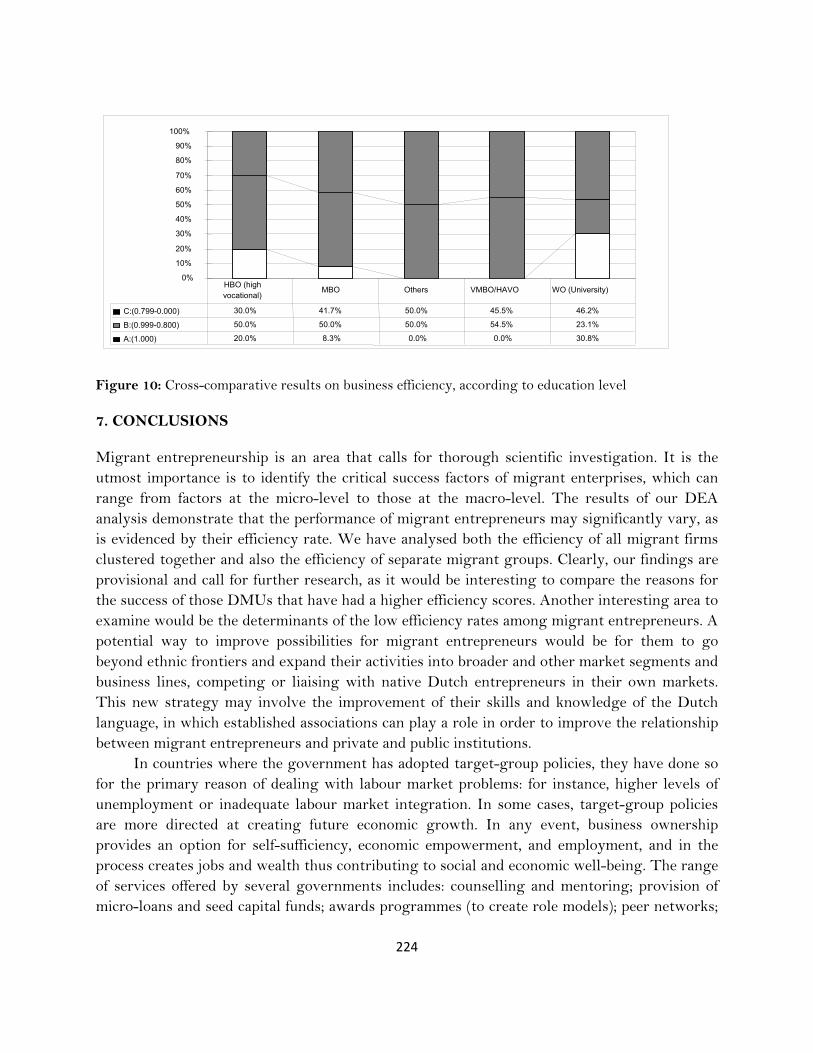
224
Figure 10: Cross-comparative results on business efficiency, according to education level
7. CONCLUSIONS
Migrant entrepreneurship is an area that calls for thorough scientific investigation. It is the utmost importance is to identify the critical success factors of migrant enterprises, which can range from factors at the micro-level to those at the macro-level. The results of our DEA analysis demonstrate that the performance of migrant entrepreneurs may significantly vary, as is evidenced by their efficiency rate. We have analysed both the efficiency of all migrant firms clustered together and also the efficiency of separate migrant groups. Clearly, our findings are provisional and call for further research, as it would be interesting to compare the reasons for the success of those DMUs that have had a higher efficiency scores. Another interesting area to examine would be the determinants of the low efficiency rates among migrant entrepreneurs. A potential way to improve possibilities for migrant entrepreneurs would be for them to go beyond ethnic frontiers and expand their activities into broader and other market segments and business lines, competing or liaising with native Dutch entrepreneurs in their own markets. This new strategy may involve the improvement of their skills and knowledge of the Dutch language, in which established associations can play a role in order to improve the relationship between migrant entrepreneurs and private and public institutions.
In countries where the government has adopted target-group policies, they have done so for the primary reason of dealing with labour market problems: for instance, higher levels of unemployment or inadequate labour market integration. In some cases, target-group policies are more directed at creating future economic growth. In any event, business ownership provides an option for self-sufficiency, economic empowerment, and employment, and in the process creates jobs and wealth thus contributing to social and economic well-being. The range of services offered by several governments includes: counselling and mentoring; provision of micro-loans and seed capital funds; awards programmes (to create role models); peer networks;
0%
10% 20% 30% 40% 50% 60% 70% 80% 90%
100%
C:(0.799-0.000) 30.0% 41.7% 50.0% 45.5% 46.2%
B:(0.999-0.800) 50.0% 50.0% 50.0% 54.5% 23.1%
A:(1.000) 20.0% 8.3% 0.0% 0.0% 30.8%
HBO (high vocational)
MBO Others VMBO/HAVO WO (University)

225
promotion of entrepreneurship as a promising option; and tailored information (e.g. in the language of the minority group).
Interesting and promising initiatives for stimulating entrepreneurship can be found in particular in the US. Almost 30 per cent of the US population consists of immigrants and ethnic minorities, the fastest growing segment of their labour force. The US is also the most advanced in terms of providing ‘full-service’ targeting of several underrepresented entrepreneurial groups. There are enterprise centres for women, native Indians, and ethnic minority groups. These are complemented with: special micro-loan funds; procurement ‘set-aside’ programmes; entrepreneurship award programmes; networking and mentoring programmes; SBIR regulations; and so forth. Indeed, a broadly developed business culture forms the seedbed for migrant entrepreneurship, especially in the SME sector.
The EU has committed itself to boost entrepreneurship as part of its strategy to transform its economy, and to build and reinforce its future economic and competitive strength. The EU has also called for action in favour of small enterprises and entrepreneurs by, inter alia, adopting the European Charter for Small Enterprises in 2000. Yet, despite several actions taken since then, the EU has so far not succeeded in narrowing the gap in GDP per capita with the US; in fact, the productivity gap is widening. Forward-looking studies indicate that, if Europe allows current economic trends to persist, its percentage share of world production will decline, even if absolute production increases, mainly because the emerging Asian economies are catching up. Europe clearly needs more entrepreneurship to strengthen its economic position.
There are about 20.5 million enterprises in the European Economic Space (including Switzerland) which altogether employ more than 122 million people. Approximately 93 per cent of these enterprises are very small (0-9 employees), 6 per cent are small (10-49), and less than 1 per cent are medium-sized (50-249), while only 0.2 per cent consist of big enterprises (with 250 or more employees). Most European companies are relatively small with an average size of six employees, whereas the average American company employs 19 people. Consequently, the SME sector represents only 46 per cent of the employment total in the US, while it represents over 66 per cent of the total employment in Europe. Differences in the average company size between European countries coincide with differences in economic structure and with institutional and historical barriers. It is noteworthy that countries with a higher GNP have a larger than average company size.
It is often argued that, to realize its full entrepreneurial potential, the EU must take serious steps to make Europe more attractive for business activity. But more is needed to fuel the entrepreneurial drive, viz. a clear entrepreneurial mindset. This means actively promoting entrepreneurial values to the widest possible audience of potential entrepreneurs, and addressing their fear of risk-taking. There are, however, fewer potential successors to take over the increasing number of SME businesses from entrepreneurs who are reaching retirement age. Entrepreneurship education is, therefore, an important way to create a proper entrepreneurial mindset among young people.
226
References
ACS Z.J., GROOT DE H.L.F. AND NIJKAMP P. (Eds) (2002) The Emergence of the Knowledge Economy. Springer Veilag, Berlin. AUDRETSCH D.B. (2002) Entrepreneurship: A Survey of the Literature. Report prepared for the European Commission, Enterprise Directorate General, Brussels.
AUDRETSCH D.B., GRILO I. AND THURIK A.R. (Eds) (2007) Handbook of Entrepreneurship Policy. Edward Elgar, Cheltenham. BATES T. (1997) Race, Self-Employment and Upward Mobility. Woodrow Wilson Center, Washington DC. BAYCAN-LEVENT T., MASUREL E. AND NIJKAMP P. (2003) Diversity in Entrepreneurship: Ethnic and Female Roles in Urban Economic Life. International Journal of Social Economics 30(11): 1131-1161. BAYCAN-LEVENT T., MASUREL E. AND NIJKAMP P. (2004) Trends in Break-out Strategies of Ethnic Entrepreneurs. In: Vaz T., Morgan E. and Nijkamp P. (Eds) The New European Rurality: Strategies for Small Firms. Ashgate, Aldershot, 143-156. BAYCAN-LEVENT T., NIJKAMP P. AND SAHIN (2009) New Orientations in Ethnic Entrepreneurship: Motivation, Goals and Strategies of New Generation Ethnic Entrepreneurs, In: International Journal Foresight and Innovation Policy 5: 83-111.
BORJAS G.J. (1991) The Economic Impact of Immigration. American Economic Review 81(2): 287-291. CARLAND J. AND CARLAND J.C. (1993) The Role of Personality in New Venture Creation. Entrepreneurship, Innovation and Change 2(2): 129-140. CARTER S. AND JONES-EVANS D. (Eds) (2006) Enterprise and Small Business; Principles, Practice and Policy, Prentice Hall, London.
CHARNES A., COOPER W.W. AND RHODES E. (1978) Measuring the Efficiency of Decision Making Units. European Journal of Operational Research 2: 429-444.

227
CRACOLICI M.F. AND NIJKAMP P. (2006) Competition among Tourist Destinations, Tourism and Regional Development. In: Giaoutzi M. and Nijkamp P. (Eds) Ashgate, Aldershot, 133-152. CHOENNI A. (1997) Veelsoortig Assortiment. Het Spinhuis, Amsterdam. CBS (Central Bureau of Statistics) (2004, 2007) Allochtonen in Nederland 2003, Voorburg.
CHAGANTI R. AND GREENE P.G. (2000) Who are Migrant Entrepreneurs? A Study of Entrepreneurs Migrant Involvement and Business Characteristics. Journal of Small Business Management 40: 126-143.
CLARK K. AND DRINKWATER S. (1998) Ethnicity and Self-Employment in Britain. Oxford Bulletin of Economies and Statistics 60: 383-407.
COOKE TH. AND MORGAN K. (1998) The Associational Economy. Oxford University Press, Oxford. CORMACK J. AND NIESSEN J. (2002) Supplier Diversity, The Case of Immigrant and Ethnic Minority Enterprises, Background paper prepared for the Transatlantic Round Table on Supplier Diversity, Brussels.
CUMMINGS S. (Ed) (1980) Self-Help in Urban America. Kenikart Press, New York.
DEAKINS D., MAJMUDAR M. AND PADDISON A. (1997) Developing Success Strategies for Ethnic Minorities in Business: Evidence from Scotland. New Community 23(3): 325-342.
DRIESSEN, M.P. (2005) E-Scan Ondernemerstest, Beoordeling en Ontwikkeling Ondernemerscompetentie, Dissertatie RUG, Groningen.
EIM (2004) Monitor Etnisch Ondernemerschap 2004. Onderzoek voor Bedrijf & Beleid, Zoetermeer: Ministerie van Economische Zaken, November 2004. ENGELEN E. (2002) How Innovative are Dutch Immigrant Entrepreneurs. International Journal of Entrepreneurial Behaviour & Research 8(1): 69-92. GLAESER E.L., LAIBSON D.K., SCHEINKMAN J.A. AND SOUTTER C.L. (2000)
Measuring Trust. Quarterly Journal of Economics 115(3): 811-46.
GRAAFF DE TH. AND GROOT DE H.L.F. (2004) Ethnic Concentration and Human Capital Formation. In: Capello R. and Nijkamp P. (eds), Urban Dynamics and Growth: Advances in Urban Economics, Elsevier, Amsterdam.

228
GRAAFF DE TH. AND NIJKAMP P. (2010) Socio-economic Impacts of Migrant Clustering on Dutch Neighborhoods: In Search of Optimal Migrant Diversity, Socio-Economic Planning Sciences 44: 231-239. GREENWOOD M.J. (1994) Potential Channels of Immigrants Influence on the Economy of the Receiving Country. Papers in Regional Science 73: 211-240. GROOT DE H.L.F., NIJKAMP P. AND STOUGH R. (Eds) (2004) Entrepreneurship and Regional Economic Development. Edward Elgar, Cheltenham. JENKINS S.P. (1984) Winners and Losers: A Portrait of the UK Income Distribution of Swansea Department of Economics, Discussion Paper, No 94-97. KLOOSTERMAN R., VAN DER LEUN J. AND RATH J. (1999) Mixed Embeddedness: (In)formal Economic Activities and Immigrant Businesses in the Netherlands. International Journal of Urban and Regional Research 23(2): 252-266.
KLOOSTERMAN R. AND RATH J. (2001) Immigrant Entrepreneurs in Advanced Economies: Mixed Embeddedness Further Explored. Journal of Ethnic and Migration Studies 27(2): 189-201. LIGHT I. AND ROACH E. (1996) Self-employment: Mobility Ladder or Economic Lifeboat, Ethnic Los Angeles. In: Waldinger R. and Bozorgmehr M. (Eds), Russell Sage Foundation, New York, 193-213. LIN B., LI P. AND CHEN J. (2006) Social Capital, and Entrepreneurial Strategies: A Study of Taiwanese High-Tech New Ventures. Technological Forecasting and Social Change 73(2): 168-181.
LONGHI S., NIJKAMP P. AND POOT J. (2007) The Fallacy of ‘Job Robbing’: A Meta- analysis of Estimates of the Effect of Immigration on Employment. Journal of Immigration and Refugee Studies 1(4): 131-152. METCALF H., MODOOD T. AND VIRDEE S. (1996) Asian Self-Employment; The Interaction of Culture and Economics in England. London: Policy Studies Institute.
MITTER S. (1986) Industrial Restructuring and Manufacturing Homework. Capital and Class 27: 37-80.
229
NIJKAMP P. (2003) Entrepreneurship in a Modern Network Economy. Regional Studies 37(4): 395-405. NIJKAMP P., SAHIN M. AND BAYCAN T. (2010) Migrant Entrepreneurship and New Urban Economic Opportunities – Identification of Critical Success Factors by Means of Qualitative Pattern Recognition Analysis. Journal of Economic and Social Geography (TESG), 101(4): 371-391. OLIVEIRA C.R. AND RATH J. (Eds.) (2008) Immigrant Entrepreneurship, Special issue Migrações Journal 3 (Oct.): 1-287.
O’SULLIVAN M. (2000) The Innovative Enterprise and Corporate Governance. Cambridge Journal of Economics 24: 393-416. RAM M. AND JONES T. (1998) Ethnic Minorities in Business, Milton Keynes: Open University Press.
RAM M. AND SMALLBONE D. (2002) Ethnic Minority Business Support in the Era of the Small Business Service, Environment and Planning C: Government and Policy 20: 235-249.
RAZIN E. AND LIGHT I. (1988) Ethnic Entrepreneurship in America’s Largest Metropolitan Areas. Urban Affairs Review 33: 332-360. RUSINOVIC K. (2006) Dynamic Entrepreneurship: First and Second-Generation Immigrant Entrepreneurs in Dutch Cities, Dissertation. RUSINOVIC K. (2008) Moving Between Markets? Immigrant Entrepreneurs in Different Markets. International Journal of Entrepreneurial Behaviour & Research 14(6): 440-454.
SAHIN M., NIJKAMP P. AND BAYCAN-LEVENT T. (2006) Migrant Entrepreneurship from the Perspective of Cultural Diversity. In: Dana L. P. (Ed.) Migrant Entrepreneurship. Edward Elgar, Aldershot, 99-113. SAHIN, M., RIETDIJK, M., AND NIJKAMP, P. (2007) Is Cultural Diversity a Socio-Economic Opportunity? – A Case Study on the Performance of Migrant Workers in the Dutch Service Sector, In: Studies in Regional Science 37 (2): 535-552. SAHIN, NIJKAMP, P., AND RIETDIJK, M. (2009) Cultural Diversity and Urban Innovativeness: Personal and Business Characteristics of Urban Migrant Entrepreneurs. In: Innovation ─ The European Journal of Social Science Research 22(3): 251-281.
230
SANTARELLI E. (ed.) (2006) Entrepreneurship, Growth, and Innovation, Springer-Verlag, Berlin.
SASSEN S. (1991) The Global City, Princeton University Press, Princeton, NJ.
SUZUKI S., NIJKAMP P., RIETVELD P. AND PELS E. (2010a) A Distance Friction Minimization Approach in Data Envelopment Analysis; An Application to Airport Performance. European Journal of Operational Research 207 (2): 1104-1115. SUZUKI S., NIJKAMP P. AND RIETVELD P. (2010b) Regional Efficiency Improvement by Means of Data Envelopment Analysis through Euclidean Distance Minimization Including Fixed Input Factors: An Application to Tourist Regions in Italy. Papers in Regional Science, 90(1): 67-89. TEDER AND GOLIK (2006) Ethnic Minorities and Entrepreneurship in Estonia, paper presented at the 14th Nordic Conference on Small Business Research, Stockholm: [http://www.ncsb2006.se/download_title.htm]. TILLIE J. AND SLIJPER B. (2006) Immigrant Political Integration and Ethnic Civic Communities in Amsterdam. In: Benhabib S. and Shapiro I. (eds), Identities, Allegiances and Affiliations, Cambridge University Press, Cambridge. VELDE VAN M.E.G., JANSEN P.G.W. AND TELTING I.A. (2000) Bedrijfswetenschappelijk Onderzoek: Van Probleemstelling tot Presentatie. Baarn: Nelissen. VERHEUL I., WENNEKERS S., AUDRETSCH D. AND THURIK R. (2001) An Eclectic Theory of Entrepreneurship: Policies, Institutions and Culture, Research Report 0012, EIM, Zoetermeer.
WALDINGER R. (1988) The Ethnic Division of Labour Transformed: Native Minorities and New Immigrants in Post-Industrial New York, New Community 14(3). WALDINGER R., ALDRICH H. AND WARD R. (eds) (1990) Ethnic Entrepreneurs. Sage Publishers. Newbury Park, Ca. WALDINGER R. (1996) Still the Promised City?, Harvard University Press, Cambridge MA.
WHITLEY R. (2000) The Institutional Structuring of Innovation Strategies, Organization Studies, 21(5), 855-886. WILEY N.F. (1970) The Ethnic Mobility Trap and Satisfaction Theory, The Study of Society (P.I. Rose, ed.), New York, 397-408.

231
232
CHAPTER 8*
IMPACT OF URBAN CONDITIONS ON FIRM PERFORMANCE OF MIGRANT ENTREPRENEURS – A COMPARATIVE DUTCH−US STUDY
Abstract
Recent studies on ethnic entrepreneurship have pointed at an increasing share of migrants in urban small- and medium-sized entrepreneurial businesses. These migrant activities are crucial to the urban economy in many countries, as they employ a significant part of the workforce. The main objective of our study is to identify success conditions of ethnic entrepreneurship by using concepts from social capital and human capital from the literature on empirical factors that are responsible for successful ethnic entrepreneurship. The empirical part of the paper is based on a survey questionnaire among migrant entrepreneurs in the city of Amsterdam in the Netherlands and in Fairfax, County in the state of Virginina in the US. We present an overview of cultural, ethno-psychological and motivational aspects that contribute to the understanding of similarities and differences between ethnic entrepreneurs in both locations. The analysis is structured around several dimensions of social and human capital including personal and business characteristics, and network participation for improving business performance. The findings of the two studies are compared to explore a possible correspondence in business performance patterns. The research tool used to assess performance is Data Envelopment Analysis (DEA), a technique for comparative efficiency analysis in various types of corporate organizations. Finally, concluding remarks are presented and possible extensions of the analysis are suggested.
Key words: Data Envelopment Analysis, migrant entrepreneurship, social and human capital
JEL classification codes: L 26, R 11
*Source: Sahin, M., Nijkamp, P., and Stough, R.R. (2010), Impact of Urban Conditions on Firm Performance of Migrant Entrepreneurs – A Comparative Dutch−US Study, Annals of Regional Science, Vol. 46, No. 3, pp. 661-689.

233
1. ENTREPRENEURIAL REGIONS IN MOTION
The past decades have shown a remarkable growth in entrepreneurship among migrants. Ethnic entrepreneurship has increasingly become an important feature of business life in urban areas. There are various studies on ethnic entrepreneurship that have identified both failure and success conditions for an ethnic entrepreneur (Baycan-Levent et al. 2003, CEEDR 2000, Choenni 1997, Delft et al. 2000, Greenwood 1994, Masurel et al. 2002, Min 1987, Nijkamp 2003, Sahin et al. 2006, Waldinger et al. 1990, Ward and Jenkins 1984). Various conceptual perspectives have been adopted to study ethnic entrepreneurship (Menzies et al. 2006) and recent studies appear to focus attention in particular on social, human and financial capital theory. For example, Butler and Green (1997) highlight the importance of a community dimension inherent in the business creation process and the significant contributions of community resources to the entrepreneurial performance of group members.
Creativeness, risk-taking behaviour, courage, technological and market knowledge as well as human and social capital and skills are usually regarded as important driving forces of successful entrepreneurship. Education, capital start-up, previous experience, and parent’s occupation (class resources) have been found to be more important in business success than ethnic involvement (Marger 1989), while highly successful entrepreneurs have been found to make less use of social capital (Shin and Han 1990). Others have analysed the relative contribution of immigrants to entrepreneurial activity in their host country (Light and Rosenstein 1995; Kim et al. 2003, Hammarstedt 2001, Levie et al. 2006). The general finding is that in many countries migrants are known to make a disproportionately quantitative contribution to new business activities (Keeble 1989, Keeble and Tyler 1995, Kalantardis and Bika 2006, Levie 2007). This paper is concerned with the performance conditions of ethnic (or migrant) entrepreneurship based on social and human capital assets. Its performance and successes are often ascribed to specific characteristics of migrant entrepreneurs (e.g., socio-cultural networks, community sense).
It is increasingly recognized that the wealth and progress of multicultural urban regions is not only influenced by an efficient usage of traditional production factors, but also – and in particular – by social and human factors (Putnam, 2000). This has prompted in recent years much research on both social capital (e.g., economic synergy through open multi-actor networks, cooperative modes of initiatives among stakeholders and business actors) and human capital (e.g., motivational incentives, leadership style, locus of control). Our paper addresses in particular the latter two categories as critical success factors for enhanced business performance in multicultural entrepreneurial regions, especially urban areas.
Ethnic entrepreneurship research studies are generally based on case studies, surveys with small samples, or utilize secondary databases. Obtaining respondent cooperation is particularly difficult as many ethnic groups members, especially visible minorities, may belong to the ‘grey sector’ and be less inclined to participate in survey research. While there is a growing literature on different aspects of ethnic entrepreneurship (Levie et al. 2006, Levie 2007), far less research
234
has been conducted on the comparison of the performance of businesses started by migrant entrepreneurs in the EU and the USA. We first offer an overview of some basics from the literature on social and human capital. Then we position these concepts in a general framework on modern regional/urban development, in which changing labour market conditions (with a multicultural dimension) and new entrepreneurship conditions (in particular, the emergence of urban/regional migrant entrepreneurship) play an important role.
2. THEORETICAL FRAMEWORK: SOCIAL AND HUMAN CAPITAL ASSETS Regional development is the outcome of socio-economic processes and decisions, in particular the intelligent combination of various production factors and local resources which are decisive for the productivity-enhancing potential of the business sector. The search for appropriate explanatory frameworks for strong business performance has uncovered in recent years an increasing interest in the contribution of ‘social capital’ to urban or regional development. Social capital was defined by Bourdieu (1986) as follows: “Social capital is an attribute of an individual in a social context”. One can acquire social capital though purposeful actions and can transform social capital into conventional economic gains. The ability to do so, however, depends on the nature of the social obligations, connections, and networks available to you” (p. 243). Social capital can assume different forms such as social skills, charisma, cooperative nature, or care for others which may create various benefits for the individual or his/her social environment. They are essentially a form of social externalities with positive revenues for most if not all actors involved (see Glaeser et al. 2000, Sobel 2002). Social capital is thus a productive resource at the interface of individual and collective interests (see Dasgupta and Serageldin 1999, Putnam 2000), and serves as an intangible (often hidden) source of well-being in an individualistic modern society.
Social capital is essentially based on the notion of community trust (see Fukuyama 1995) as introduced in the urban planning literature several decades ago by Jane Jacobs (1961). But it has emerged recently in a new form as a productive factor that may stimulate regional (or urban) development. Research from this perspective by Westlund and Bolton (2003) and Westlund and Nilsson (2005) concludes that social capital has several manifestations as:
Capital in an economic sense (with a productivity-enhancing potential, with a blend of supporting factors, with accumulation and deprecation features, with a mix of private and public goods characteristics, and with various spatial and group levels);
A generator of producer surplus (with a quality-generating potential, with an area-specific social benefit and with a decline in transaction costs); and,
A facilitator of entrepreneurship (with a combination of skills, risk-taking attitude, market insights, and goodwill trust). There is convincing evidence that social capital plays a prominent role in a networked
society, where reliability, trust, standardization and efficient inter-actor operations are the keys
235
to success and competitive performance (Sobel, 2002). Socio-economic interaction in networks and confidence and trust among network actors are closely related phenomena (see also Dyer 2000). In addition, during recent decades, considerable attention has been paid to the relationship between self-employment and social capital. Family-based social capital in the form of mutual obligation and trust encourages highly motivated and cooperative group efforts in the pursuit of common objectives (see Sanders and Nee 1996). There has been a rapidly rising volume of studies on social capital and trust, from the side of both economists and sociologists (see also Chou 2006). Unfortunately, the number of applied studies where trust and social capital are operationalized is disappointingly low. There is clearly a much needed scope for original empirical research on social capital, in particular in the context of regional development where local resources such as social capital appear to play a highly prominent role. Empirical research on the significance of social capital is once more warranted, as differences in social capital among regions may contribute to widening spatial disparities. Furthermore, social capital is often defined in terms of trust, information flows, and norms between individuals, both inside and outside a business, and has been categorized into structural, relational, and cognitive dimensions (see Nahapiet and Ghoshal 1998, De Carolis and Saparito 2006). Social capital factors that have been found or proposed to affect new venture performance (both positively and negatively) include interaction with local (see Mueller 2005, Bates 1999) and foreign business networks (Prashantham 2006). According to Fratoe (1988) and Holguin et al. (2007), social capital can be defined as the network of business associates, family members, customers and employees that can be highly important in starting a business and the development of new business. In the context of our study on migrant entrepreneurs we may interpret social capital as the set of facilitating network factors that include the use of co-ethnic markets, co-ethnic suppliers and employees, community sources of capital, advice and information, as well as membership in ethnic community organizations. The literature claims that the benefits derived from belonging to a particular ethnic group and the use of the associated networks greatly enhance the start-up and continuing business success of an ethnic business (Adler and Kwon, 2002, Menzies et al. 2003, Dyer and Ross 2000, Boubakri 1999, Iyer and Shapiro 1999, Werbner 1999, Dhaliwal 1998, Teixeira 1998, Deakins et al. 1997, Ram 1994, Peterson and Roquebert 1993, Waldinger 1988, Aldrich and Zimmer 1986, Light 1984, Bonacich et al. 1976). It is noteworthy that social capital also contributes to human capital. Human capital includes education, experience, the influence of one’s family influence, and age (Becker 1975, Oort and Atzema 2004).
The literature offers ample evidence of the importance of human capital, in the pursuit of self-employment (Sanders and Nee 1996). According to Sanders and Nee (1996) human capital refer to possession of skills, work experience, knowledge, and other useful characteristics (e.g., motivational incentives, leadership style, locus of control) that facilitate self-employment. Human capital factors that in recent studies have been found to affect new venture performance include age, gender, ethnicity (Cooper et al. 1994), education (Shepherd et al. 2000, Lee and Lee 2004, Lee and Chang 2005), relevant industry experience (Baum et al. 2001, Kakati 2003,

236
Florin et al. 2003, Lee and Chang 2005) and general management experience (Brown and Hanlon 2004). Human capital such as education and language proficiency enable immigrants to effectively deal with a range of challenges. Some scholars have claimed that the success of entrepreneurs can be attributed to their superior human capital rather than to business ownership (Sanders and Nee 1996, Borjas 1990). Bates (1994a, 1994b) has shown that human capital resources are positively related to business longevity and profits. Ethnic entrepreneurs with a higher educational qualification appear to have greater chances for success (Basu 1998, Bates 1994a, 1994b, Birley and Ghaie 1992). Anderson and Miller (2003) found that human and social capital assets of an entrepreneur had a major influence on the choice of industry and type of new business as well as its future potential for profitability. The most important indicators of the extent of the human and social capital assets of an entrepreneur were related to the socio-economic position into which the entrepreneur was born. Relatively low levels of human capital may limit the ability of migrant entrepreneurs to successfully run their businesses, and restricted access to financial capital may result in undercapitalized business. In the remainder of this paper, we investigate the critical success conditions (and failure conditions) that are decisive for the economic performance of migrant entrepreneurs in the service sector in two urban regions, viz. the Greater Amsterdam Area (the Netherlands) and Fairfax County (Virginia)1. Before we embark on the database employed in our study (Section 4), we offer a sketch of migrant entrepreneurship in both the Netherlands and the USA (Section 3).
3. IMMIGRANTS AND ENTREPRENEURSHIP: DUTCH AND US EVIDENCE Entrepreneurship is crucial to economic growth and urban regional development (Acs and
Audretsch 1993, Acs and Armington 2006, Yu and Stough, 2006): entrepreneurship contributes to competitiveness, new jobs, economic growth, and social cohesion. There is an abundance of literature on entrepreneurship (see for recent surveys by Audretsch and Thurik 2001, Hébert and Link 1989, Lumpkin and Dess 1996, and Wennekers and Thurik 1999). Many migrants appear to possess a strong potential and capacity for entrepreneurship, and they show particular dynamism in creating enterprises. They are even more likely to be self-employed than natives. For example, in the US, migrants are over-represented among self-employed workers (Tanaka and Krishnan 2006).
The most prominent advantage of ethnic entrepreneurship is its contribution to reducing social exclusion and raising living standards in groups that can often be among the most disadvantaged in society. Migrant entrepreneurs contribute to a more diversified range of products supplied, raising competition and indirectly the quality of products. Furthermore, the
1 The population size of the Greater Amsterdam Area is well above one million, while this area is part of the Dutch Randstad
with some 5 to 6 million people. Fairfax County has a population in excess of one million and is part of the U.S. National Capital
Region which is a market of about 5 million people.

237
benefits of ethnic entrepreneurship consist of social bonds in a cultural network, which create flexible ways to attract personal and capital, and the capacity of generate market niches for specific cultural goods (e.g. music and food). In countries like the Netherlands and the US migrant entrepreneurship has proven to be an efficient means of socio-economic integration contributing significantly to the overall economic growth and development of the area concerned. Ethnic entrepreneurship has a social as well as an economic impact on a society’s development in both short-term and long-term perspectives (Teder and Golik 2006). Exploring ethnic entrepreneurs is thus highly important, for both social and economic reasons.
3.1. Entrepreneurial Migrants in the Netherlands The Netherlands has a migrant population of over 2,800,000 or 17.4 percent of the total population). Of these, 51.9 percent is composed of first-generation migrants, while 40 percent of the migrants live in the four largest cities (Tillie and Slijper 2006). The influx of migrants and the selective outflow of natives have induced fast changes in ethnic composition of the four largest Dutch cities, where Surinamese, Antilleans, Turks and Moroccans are the largest migrant minority groups.
The socio-economic characteristics of migrants living in the Netherlands can be summarized as follows: migrants are younger than natives, the proportion of males is higher in the migrant population, migrants are concentrated in four large cities (Rotterdam, Amsterdam, The Hague and Utrecht), the skill levels of migrants is below that of the native population, and their occupational status is below that of natives with comparable skill levels. Finally, migrants have higher rates of unemployment (Brücker et al. 2002).
Since the late 1980s the number of migrant entrepreneurs has increasingly risen in the Netherlands. The number of non-Western entrepreneurs increased from 34,100 in 1999 to 46,900 in 2004, with an average annual increase of 3.8 percent. In 2004, after years of economic recession, the labour market participation among immigrants was only 48 percent, while the unemployment rate among immigrants was 16 percent, three times higher compared to the native Dutch population (Zorlu and Traag 2005). This has prompted an increasing number of immigrants to become self-employed.
It is noteworthy that among Western immigrants the number of entrepreneurs increased from 72,700 to 74,500 (0.2 percent annually), whereas among native Dutch the number of entrepreneurs decreased from 819,000 in 1999 to 818,300 in 2004. Thus, there is an increasing trend to become entrepreneur among non-Western immigrants, while there is a decreasing trend to becoming an entrepreneur among Western immigrants and native Dutch. In absolute numbers, the Turks and Surinamese are the largest group of migrant entrepreneurs in the Netherlands (Table 1). However, in the period 1999-2004 the sharpest increase was among Moroccan entrepreneurs, namely 64 percent.
There are considerable differences in the self-employment rates among the different ethnic groups in the Netherlands. Although the hotel and catering sector is still most popular among

238
the older immigrants (first generation), the percentage has declined considerably. Instead, the new generation chooses more often to become active in the business (or producer) services sector which includes finance, insurance, real estate and business related professional services, such as accounting, consulting, marketing, engineering, or design, most of which employ a high share of technical, professional and managerial jobs. The younger group of immigrants (second generation) is predominantly represented in the producer services sector. In 2002, one quarter of this group started its business in this sector. As a result, the sectoral distribution of the younger generation of migrant entrepreneurs has become more similar to the composition of the native Dutch entrepreneurs. According to the study of Dagevos and Gesthuizen (2005), Surinamese and Antillean entrepreneurs are more often active in the producer services than other ethnic groups (Table 2). Among Turkish entrepreneurs there is a more than average increase of entrepreneurs in the producer services as well.
Table 1. Number of entrepreneurs (x1,000), 1999-2004 (CBS, 2007)
Year Turks Moroccans Netherlands/
Antilles
Surinamese
1999
2000
2001
2002
2003
2004
7.9
9.2
11.0
11.5
11.9
11.8
2.8
3.3
4.0
4.3
4.4
4.6
1.5
1.8
2.0
2.1
2.2
2.1
6.4
7.1
7.8
7.9
8.0
7.7
Table 2. Sectoral distribution among non-Western immigrant entrepreneurs, 2004 (in percentages) (Dagevos and Gesthuizen, 2005) Turks Moroccans Surinamese Antilleans Agriculture / fishing 4 2 0 1 Industry 5 2 3 3 Building industry 7 6 6 12 Trade and reparation business 6 6 3 2 Wholesale 9 7 11 10 Retail trade 19 26 15 11 Hotel and catering industry 20 17 9 6 Transportation, storage and communication 6 8 6 3 Financial institutions 1 0 2 1 Real estate 1 1 3 1 Producer services / business to business 16 14 24 30 Other services 6 11 18 19

239
3.2. Entrepreneurial Migrants in the United States Self-employment continues to be an important source of jobs in the United States (US) (Hipple, 2004). Small- and medium-sized entrepreneurial businesses are vital to the US economy, as they employ more than half of the private sector workforce. Recent decades have experienced a large growth in entrepreneurship among migrants in the US. They have shown higher rates of entrepreneurship compared with the US born population (Torres 1988, Light 1984). In 1997, there were 615,200 minority-owned businesses in the US that, generated 87.4 percent of the total minority-owned business revenue of $591.3 billion. There were 1,199,900 Hispanic-owned businesses; 823,500 Black-owned businesses; 913,000 Asian-owned businesses; and 197,300 Native American-owned businesses in 1997. In the State of Virginia, self-employment increased by 12.4 percent, from 186,884 in 2002 to 210,013 in 2003. In 1997, there were 14,300 minority-owned businesses, and they generated 87.4 percent of the total minority-owned business revenue of $10.2 billion in Virginia. There were 13,700 Hispanic-owned businesses; 33,500 Black-owned businesses; 22,400 Asian-owned businesses; and 3,300 Native American-owned businesses (Richtmyer 2002). In short, this data suggests the disproportionately large participation in business development on the part of minority and ethnic groups of which a significant part are immigrants.
Table 3 shows that migrants own about 15 percent of total firms in the US, with Hispanics, Asians, Blacks, and American Natives owning 6 percent or less of the firms (Richtmyer 2002).
Table 3. Firms by race and ethnic origin
Number of firms
Percentage of firms
Total US firms 20,821,934 100 Non-minority firms 17,782,901 85.40 All Minority firms 3,039,033 14.60 Black-owned 823,499 3.96 Hispanic-owned 1,199,896 5.76 American Native-owned 197,300 0.94 Asian-owned 912,959 4.38
Note: The percentages may not sum to 100, because Hispanics may be of any race and may therefore be double counted
Source: US Department of Commerce, Bureau of the Census, SMBO, 1997.
Table 4 shows the percentage of minority-owned businesses by major industry. The Asian-owned firms are strongly represented in the services and retail industries. Hispanic-owned firms are concentrated in construction, retail, services, and unclassified. Blacked-owned firms are very similar to all firms, while native American-owned businesses are strongly represented in the unclassified, services and construction industries.

240
Table 5 shows the number of firms for the period 1982 - 1997. During this period minority-owned firms grew at a rate of 55 percent compared to nonminority-owned firms’ rate of 11 percent; in 1987-1992, minority-owned firms showed a 68 percent growth rate compared to a growth rate of non-minority-owned firms of 22 percent; and in 1992-1997, minority-owned firms continued to grow at a rate of 30 percent compared to nonminority-owned firms’ rate of four percent. In sum, minority-owned firms grew at much higher rates than majority-owned firms.
There are great variations in the self-employment rates of different immigrant and ethnic groups in the US. Research does not support a consensus in arguments for this variation, with some proposing that immigrant communities are themselves differential sources of entrepreneurial energy and others suggesting that it is the result of the human and/or financial capital of individual immigrants. Ethnic differences among entrepreneurs’ motivations can vary from one location to another, and depend on social class differences, opportunity structures, and ethnic group relations in a particular location. Statistical analyses conducted by Yuengert (1995) suggest that 62 percent of the immigrant self-employment business participation rates in the US may be explained by two rather more sophisticated features of immigrant communities. Immigrants from countries with high self-employment rates have higher than average self-employment rates in the U.S., perhaps because they are more likely to be experienced business people. Also, immigrants tend to concentrate in states with progressive tax and regulatory codes, which may act as incentives to pursue self-employment, with its greater opportunities for tax avoidance (Aronson 1997).
Table 4. Percentage of minority-owned firms by industry, 1997
Major industry Total (%)
Black (%)
Hispanic (%)
American native (%)
Asian (%)
All 3.95 5.76 0.95 4.38 Agriculture 2.38 1.51 3.34 4.53 1.42 Mining 0.61 0.03 0.16 0.48 0.07 Construction 11.21 6.86 12.72 13.91 3.04 Manufacturing 3.31 1.27 2.13 3.40 2.55 Transportation 4.42 8.69 7.05 3.19 4.11 Wholesale 3.83 0.99 2.62 2.21 5.52 Retail 13.87 10.63 12.92 7.49 21.43 Finance 10.75 4.61 4.72 2.34 7.53 Services 42.70 53.14 41.71 17.31 44.47 Unclassified 7.11 12.28 12.66 45.23 9.91
Note: A large number of unclassified businesses within the Native American group may be gambling businesses (Minorities in Business, 2001).
Source: Table derived from Richtmyer (2002)

241
Table 5. Growth in numbers of minority-owned firms (1982-1997)
Number of firms Growth rates (%) 1982 1987 1992 1997 ’82-‘87 ’87-‘92 ’92-97
All US firms 12,059,950 13,695,480 17,253,143 18,431,456 14 26 7
Nonminority firms 11,234,999 12,419,170 15,103,959 15,645,358 11 22 4 All Minority firms 824,951 1,343,910 2,149,184 2,786,098 55 68 30
Black-owned 308,260 424,165 620,912 780,770 38 46 26 Hispanic-owned 284,01 489,973 862,605 1,121,433 73 76 30
American Native-owned
17,100 24,931 102,271 187,921 46 310 84
Asian-owned 240,806 414,340 603,426 785,480 72 46 30
Source: Table derived from Richtmeyer (2002) U.S. Small Business Administration, Office of Advocacy, based on data from the U.S. Department of Commerce, Bureau of the Census, Survey of Minority-Owned Business Enterprises, Company Statistics Series 1982, 1987, 1992, and 1997.
Several scholars claim that migrants are more likely to express a desire and to try starting a business than natives, but are also more likely to fail (Kollinger and Minniti 2006). Studies in the US show that migrant entrepreneurs tend to have less personal funds available at start-up and are less likely to seek funding from formal sources than non-minority entrepreneurs. Studies on migrant entrepreneurship in the US rank the groups by the percent age of owners, by estimated employees, or by ethnic traits (Koreans, Asians, Indians, Japanese, Cuban, Chinese, Vietnamese, Filipino, Mexican, Puerto Rican, African Americans and Hawaiian; see Light and Gold 2000). According to Portes and Zhou (1992) and Light and Roach (1996), self-employed Cuban, Chinese, and Japanse and Korean entrepreneurs received higher incomes than their salaried co-ethnics in the general market. According to Bates (1994a), the high level of success of Koreans in the US vis-à-vis others is due to their educational levels and personal wealth or access to resources.
Robb and Fairlie (2007) found that Asians are the most educated racial group in the US. Other findings were that related to family business background of the owner, marriage is associated with business success. Spouses may provide financial assistance, paid or unpaid labour for the business, health insurance coverage, and other types of assistance useful for running a business (Robb and Fairlie 2007). They also argue that financial and human capital contribute to the relative success of Asian businesses. According to these scholars, Asian-owned businesses are more successful than white-owned businesses for two main reasons; Asian owners have high levels of human capital and their businesses have substantial start up capital. Bates (1994a) argues that Vietnamese business owners rely on co-ethnic customers and employees, but Asian business owners in general rely less on their co-ethnic group.

242
In the United States, migrants from India tend to dominate in the low-budget hotel business, Koreans specialize in retail businesses and Chinese run restaurants. Often, migrant entrepreneurs take over businesses that natives are leaving. In the United States an increasing number of farms are owned by Hispanic and Asian migrants, at a time when many older, native-born farmers are leaving farming altogether (Aronson 1997).
Bates’ (1994a) comparative studies of Korean immigrant-owned businesses with African American and non-minority owned businesses suggest that human and financial capital – and not social capital alone – are the key determinants of business activity. Korean entrepreneurs are more likely to have college degrees and more likely to have invested substantial personal assets in their businesses; their financial returns, however, tend to be significantly below those of African-American entrepreneurs, suggesting that the Koreans turned to self-employment because they faced barriers entering the labor market (Aronson 1997). Access to capital, networking, training, and support services are challenges that immigrant entrepreneurs often face. Immigrants need literacy, and job-training programs. All immigrant entrepreneurs with limited English proficiency bring home lower earnings than those with greater proficiency.
As a final caveat, it might to be recognized that ethnic entrepreneurship in the Netherlands and the US is showing strong growth, but self-employment rates in both countries differ across ethnic groups. We will describe the methodology for our empirical research and the empirical data base used to identify the importance of social and human capital factors in the next part of the paper.
4. METHODOLOGY: RESEARCH DESIGN AND DATABASE
Our study aims primarily to investigate the similarities and differences between ethnic entrepreneurs in the Greater Amsterdam Area (the Netherlands) and in Fairfax County (Virginia, US), in terms human and social capital described above. Figure 1 shows an analysis framework for empirical research that maps out how the social and human capital elements are related to entrepreneurship and entrepreneurial performance.

243
Figure 1. Entrepreneurial performance as a result of human and social capital
We will now empirically test the explanatory profile composed of three main constructs: social capital (e.g. network participation, other relatives as entrepreneur), human capital (personal and business characteristics), and business performance. To that end, we conducted a questionnaire for ethnic entrepreneurs in both Amsterdam and Fairfax. The questionnaires contain personal information questions (e.g., demographic and socio-economic data), but also questions pertaining to –motivation, business performance, socio-cultural network participation, financial and market and evaluation questions. From the full set of questions, we have selected those which may be interpreted as indicators for the input factors of the production system of each migrant entrepreneur, as well as questions which may be seen as typical for the performance of the firm concerned (see also Sahin et al. 2007). The following input and output indicators were selected (see Table 6).
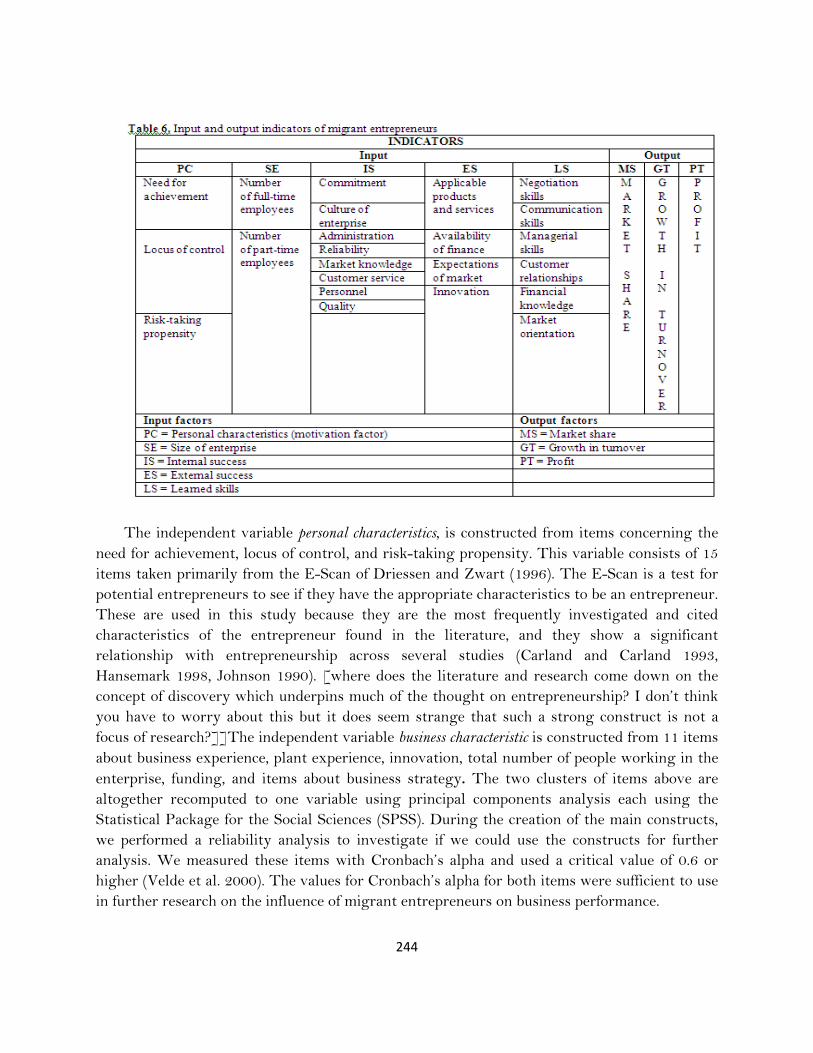
244
The independent variable personal characteristics, is constructed from items concerning the need for achievement, locus of control, and risk-taking propensity. This variable consists of 15 items taken primarily from the E-Scan of Driessen and Zwart (1996). The E-Scan is a test for potential entrepreneurs to see if they have the appropriate characteristics to be an entrepreneur. These are used in this study because they are the most frequently investigated and cited characteristics of the entrepreneur found in the literature, and they show a significant relationship with entrepreneurship across several studies (Carland and Carland 1993, Hansemark 1998, Johnson 1990). [where does the literature and research come down on the concept of discovery which underpins much of the thought on entrepreneurship? I don’t think you have to worry about this but it does seem strange that such a strong construct is not a focus of research?]]The independent variable business characteristic is constructed from 11 items about business experience, plant experience, innovation, total number of people working in the enterprise, funding, and items about business strategy. The two clusters of items above are altogether recomputed to one variable using principal components analysis each using the Statistical Package for the Social Sciences (SPSS). During the creation of the main constructs, we performed a reliability analysis to investigate if we could use the constructs for further analysis. We measured these items with Cronbach’s alpha and used a critical value of 0.6 or higher (Velde et al. 2000). The values for Cronbach’s alpha for both items were sufficient to use in further research on the influence of migrant entrepreneurs on business performance.
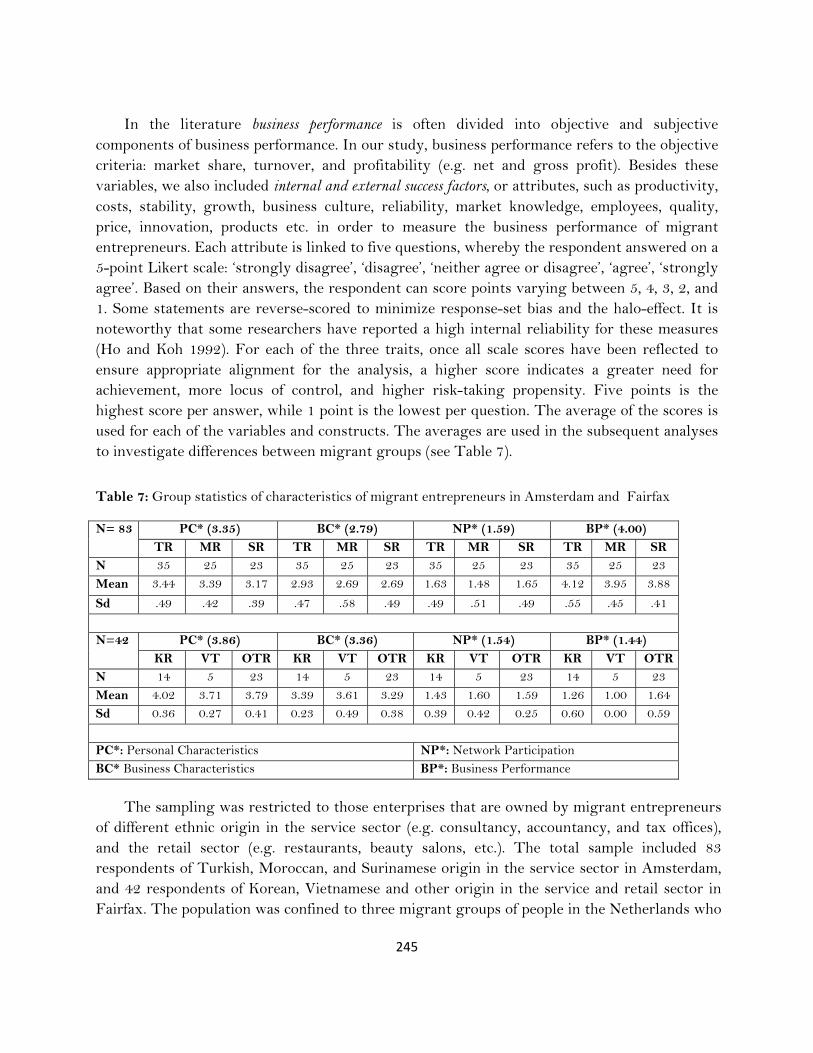
245
In the literature business performance is often divided into objective and subjective components of business performance. In our study, business performance refers to the objective criteria: market share, turnover, and profitability (e.g. net and gross profit). Besides these variables, we also included internal and external success factors, or attributes, such as productivity, costs, stability, growth, business culture, reliability, market knowledge, employees, quality, price, innovation, products etc. in order to measure the business performance of migrant entrepreneurs. Each attribute is linked to five questions, whereby the respondent answered on a 5-point Likert scale: ‘strongly disagree’, ‘disagree’, ‘neither agree or disagree’, ‘agree’, ‘strongly agree’. Based on their answers, the respondent can score points varying between 5, 4, 3, 2, and 1. Some statements are reverse-scored to minimize response-set bias and the halo-effect. It is noteworthy that some researchers have reported a high internal reliability for these measures (Ho and Koh 1992). For each of the three traits, once all scale scores have been reflected to ensure appropriate alignment for the analysis, a higher score indicates a greater need for achievement, more locus of control, and higher risk-taking propensity. Five points is the highest score per answer, while 1 point is the lowest per question. The average of the scores is used for each of the variables and constructs. The averages are used in the subsequent analyses to investigate differences between migrant groups (see Table 7).
Table 7: Group statistics of characteristics of migrant entrepreneurs in Amsterdam and Fairfax
N= 83 PC* (3.35) BC* (2.79) NP* (1.59) BP* (4.00) TR MR SR TR MR SR TR MR SR TR MR SR
N 35 25 23 35 25 23 35 25 23 35 25 23
Mean 3.44 3.39 3.17 2.93 2.69 2.69 1.63 1.48 1.65 4.12 3.95 3.88
Sd .49 .42 .39 .47 .58 .49 .49 .51 .49 .55 .45 .41
N=42 PC* (3.86) BC* (3.36) NP* (1.54) BP* (1.44) KR VT OTR KR VT OTR KR VT OTR KR VT OTR
N 14 5 23 14 5 23 14 5 23 14 5 23
Mean 4.02 3.71 3.79 3.39 3.61 3.29 1.43 1.60 1.59 1.26 1.00 1.64
Sd 0.36 0.27 0.41 0.23 0.49 0.38 0.39 0.42 0.25 0.60 0.00 0.59
PC*: Personal Characteristics NP*: Network Participation BC* Business Characteristics BP*: Business Performance
The sampling was restricted to those enterprises that are owned by migrant entrepreneurs of different ethnic origin in the service sector (e.g. consultancy, accountancy, and tax offices), and the retail sector (e.g. restaurants, beauty salons, etc.). The total sample included 83 respondents of Turkish, Moroccan, and Surinamese origin in the service sector in Amsterdam, and 42 respondents of Korean, Vietnamese and other origin in the service and retail sector in Fairfax. The population was confined to three migrant groups of people in the Netherlands who

246
are originally from Turkey, Morocco and Surinam, and to those migrant groups in the US who are originally from Korea, Vietnam and other countries, because of their size and numbers in the selected sectors. Our research used survey questionnaires handed out to the respondents. The research questionnaire included open-ended and closed questions to collect the necessary information. The respondents are segmented in our research according to their ethnic origin, viz. Turkish, Moroccan, and Surinamese, Korean, Vietnamese, or different origin. Their ethnic origin is confirmed by the country of birth of the parents, as well as by the individual respondent. The approach was based on personally-supervised assistance in obtaining the various questions and, hence, once an entrepreneur had agreed to participate in this exercise, he/she was normally willing to complete the questionnaire.
4.1. Database on Migrant Entrepreneurs in the Service Sector in the Amsterdam Area Tables 8 and 9 show personal and entrepreneurial characteristics of the relevant group in Amsterdam. In Table 8 we present an overview of the profile of the 83 respondents in the service sector in Amsterdam and the Pearson Chi-Square (p-value) of the statistical difference among the groups.
Most of the entrepreneurs were between the age of 26-30 (29%) (Table 8). However, this was different for each migrant group. Most entrepreneurs of Turkish origin were between the age of 30-35 (11%), while most of the entrepreneurs of Moroccan origin were between the age of 25-30 (16%), and most of the Surinamese entrepreneurs were between the age of 35-39 (8%). We find a statistical outcome of 0.04 for the Pearson Chi-Square value (see Table 10), so that we may conclude that the entrepreneurs from the three ethnic groups considered do differ significantly from each other regarding their age. From this table, we can also derive that the entrepreneurs from different ethnic origin are mostly male (82%). The Pearson Chi-Square rate in this case amounts to 0.956 (see Table 8), which indicates that there is no significant difference between the three groups investigated. Furthermore, we find that 37% of the respondents (of the total sample) have a high vocational education level. At the university level, 31% of the approached migrant entrepreneurs have a university level diploma. This means that altogether most respondents have a high education level of schooling. When comparing the level of education for the three groups, in particular, we find that in all groups most of the respondents have a high level of vocational education. For example, among the Turkish entrepreneurs 13.3% of the respondents have a high vocational education level, while these figures are 15% for the Moroccan entrepreneurs and 8% for the Surinamese entrepreneurs. However, if we only examine the university education level, we find that most of the respondents of Surinamese origin went to the University and have the highest level of education. The Pearson Chi-Square rate in this case appears to be 0.122 (see Table 10). We may thus conclude that overall the migrant entrepreneurs do not differ significantly from each other in regard to their education level.
26 entrepreneurs of Turkish origin were born in Turkey, 13 of the entrepreneurs of Moroccan origin, were born in Morocco and for the Surinamese entrepreneurs, 12 persons were

247
born in Surinam. The Pearson Chi-Square statistic, in this case is 0.0001 (see Table 10), which indicates that there is a significant difference between the groups in terms of their birth place. Furthermore, a comparison was made between the sample groups regarding their marital status and children. From Table 8, we can conclude that most respondents were married and have one child. Most of the Moroccan and Surinamese entrepreneurs were unmarried, viz. 16% and 18%, respectively. The Pearson Chi-Square rate in this case amounts 0.024 (see Table 10), which indicates that there is a significant difference between the groups regarding their marital status. Most of the Turkish entrepreneurs have 2 children, while most Moroccan and Surinamese entrepreneurs do not have children. The Pearson Chi-Square rate in this case is 0.038 (see Table 10), which indicates that there is a significant difference between the groups.
Table 9 shows entrepreneurs in the family by ethnic group. We can see that 58 respondents of different ethnic origin do not have an entrepreneur in the family (70%). This is 22 (26%) among Turkish entrepreneurs, while 21 (25%) among Moroccan entrepreneurs, and 15 (18%) for Surinamese entrepreneurs, respectively. Only 25 (30%) entrepreneurs of different ethnic origin do have an entrepreneur in the family. This is 13 (Turkish entrepreneurs), 4 (Moroccan entrepreneurs), and 8 (Surinamese entrepreneurs), respectively. The Pearson Chi-Square rate

248
amounts to 0.18 (see Table 10), which indicates that there is no significant difference between the groups.
Finally, we investigated the participation level in formal business networks (see Table 9). Most of the Turkish and Surinamese entrepreneurs did not participate in such networks. On the other hand, 13 of the 25 Moroccan entrepreneurs do participate in such networks. The Pearson Chi-Square rate amounts to 0.4 (see Table10), which indicates that there is no significant difference between the groups in case of formal business network participation.
Table 9. Entrepreneurial characteristics of migrant entrepreneurs (Amsterdam) NUMBER OF
ENTREPRENEURS SHARE IN TOTAL (%)
ENTREPRENEURS IN FAMILY Yes No Yes No
Total sample 25 58 30 70
ENTREPRENEURS IN FAMILY BY ETHNIC GROUP
Moroccans 4 21 16 84
Surinamese 8 15 35 65
Turkish 13 22 37 63
NETWORK PARTICIPATION
Total sample 31 52 37 63
Network participation of migrant entrepreneurs by ethnic group
Moroccans 13 12 52 48
Surinamese 7 16 30 70
Turkish 11 24 31 69
TOTAL 83 100
Trust in migrant networks is a subject worth examining further. For example: why is the participation rate for migrant entrepreneurs relatively low with regard to formal networks such as franchise organizations? Whereas such organizations play an important role for native entrepreneurs, migrant entrepreneurs usually do not participate in this. It can be that ‘trust’

249
plays a role in this issue, but this is for the time being speculative. We can nevertheless explain the migrant dependency by trust. Clients from the own migrant group play a major role for migrant entrepreneurs. It is possible to reverse this notion and ask ourselves the question: ‘Why do migrant customers prefer a service from the migrant entrepreneur?’ The cause may be in the fact that both share the same language, culture and religion and therefore communicate better. This brings a closer bonding to each other, through which the aspect of ‘trust’ can be understood. Hereby also the migrant entrepreneur can satisfy special needs of these types of customers, since they have a better knowledge than their native peers about specific products, which are appreciated by migrant customers.
Table 10 presents an overview of the profile of the respondents and the Pearson Chi-Square (p-value) of the statistical difference. The Pearson Chi-Square is used here in order to find out whether there is a statistically significant difference between the selected migrant groups. We use a reliability level of 95%, which indicates that there is a significant difference when the outcome is below a probability of 0.05. The groups differ only significantly from each other in terms of their age, birthplace, marital status and children. The corresponding p-values of these variables are contained in Table 10.
Table 10. Pearson Chi-Square values of sample of Dutch migrant entrepreneurs
Variables Pearson Chi-Square
Age 0.04*
Gender 0.956
Birthplace 0.0001*
Education 1.22
Marital status 0.024*
Children 0.038*
Entrepreneur in family 0.18
Network participation 0.4
*: significant
4.2. Database on Migrant Entrepreneurs in the Service and Retail Sector in Fairfax County Next, we present the profile of ethnic entrepreneurs in Fairfax County. Fairfax County is a county in Northern Virginia, in the US. The estimated population is 1,177,000. A county is a
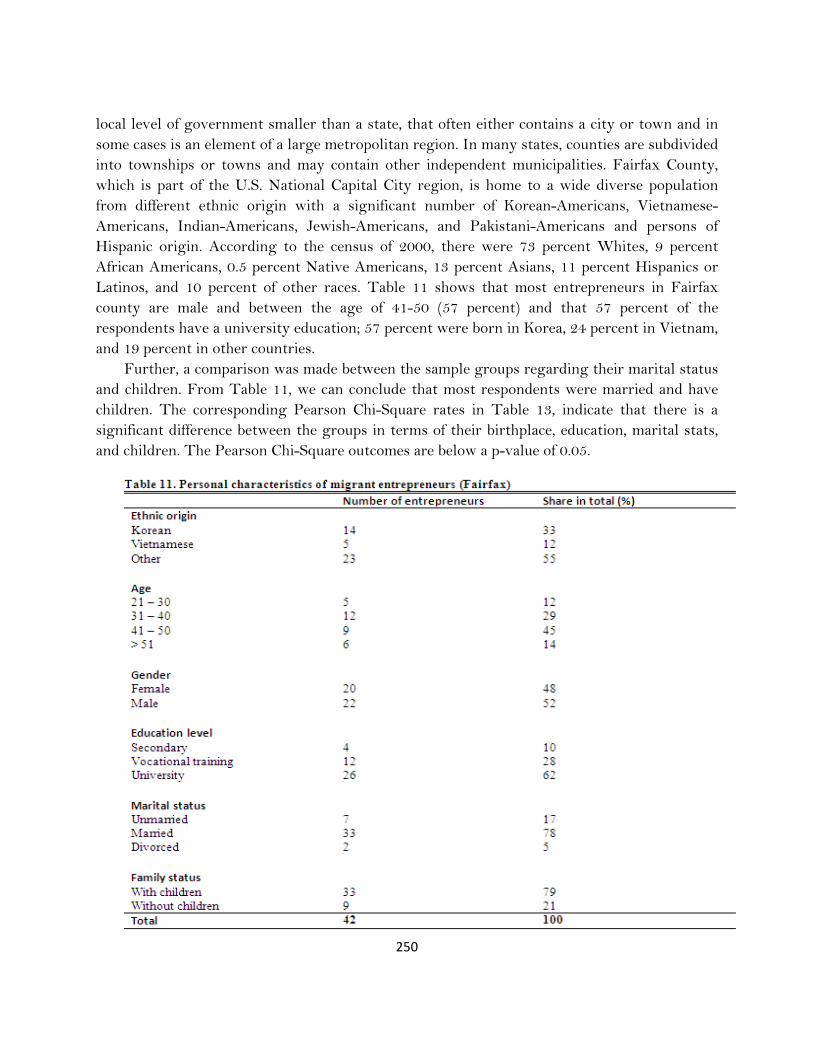
250
local level of government smaller than a state, that often either contains a city or town and in some cases is an element of a large metropolitan region. In many states, counties are subdivided into townships or towns and may contain other independent municipalities. Fairfax County, which is part of the U.S. National Capital City region, is home to a wide diverse population from different ethnic origin with a significant number of Korean-Americans, Vietnamese-Americans, Indian-Americans, Jewish-Americans, and Pakistani-Americans and persons of Hispanic origin. According to the census of 2000, there were 73 percent Whites, 9 percent African Americans, 0.5 percent Native Americans, 13 percent Asians, 11 percent Hispanics or Latinos, and 10 percent of other races. Table 11 shows that most entrepreneurs in Fairfax county are male and between the age of 41-50 (57 percent) and that 57 percent of the respondents have a university education; 57 percent were born in Korea, 24 percent in Vietnam, and 19 percent in other countries.
Further, a comparison was made between the sample groups regarding their marital status and children. From Table 11, we can conclude that most respondents were married and have children. The corresponding Pearson Chi-Square rates in Table 13, indicate that there is a significant difference between the groups in terms of their birthplace, education, marital stats, and children. The Pearson Chi-Square outcomes are below a p-value of 0.05.

251
Table 12 shows entrepreneurs in the family by ethnic group in Fairfax; 69 percent of the respondents have an entrepreneur in the family: 58 percent Korean, 80 percent Vietnamese, and 50 percent other, respectively. Most of the entrepreneurs in Fairfax appear to participate in formal business networks. The Pearson Chi-Square rate, in this case amounts to 0.4 (see Table 13), which indicates that there is no significant difference between the groups in case of formal business network participation.
Table 12. Entrepreneurial characteristics of migrant entrepreneurs in Fairfax County NUMBER OF
ENTREPRENEURS
SHARE IN TOTAL (%)
ENTREPRENEURS IN FAMILY Yes No Yes No
Total sample 29 13 69 31
ENTREPRENEURS IN FAMILY BY
ETHNIC GROUP
Korean 9 5 64 36
Vietnamese 4 1 80 20
Other 16 7 70 30
NETWORK PARTICIPATION
Total sample 26 16 64 36
Network participation of migrant entrepreneurs by ethnic group
Korean 11 3 79 21
Vietnamese 3 2 60 40
Other 12 11 52 48
TOTAL 42 100
The corresponding p-values of the above mentioned variables are contained in Table 13. We used a reliability level of 95%, which indicates that there is a significant difference when the outcome is below a p-value of 0.05.

252
Table 13. Pearson Chi-Square values of sample of migrant entrepreneurs in Fairfax
Variables Pearson Chi-Square
Age 0.08
Gender 0.758
Birthplace 0.003*
Education 0.0001*
Marital status 0.0001*
Children 0.0001*
Entrepreneur in family 0.123
Network participation 0.14
*: significant
5. DATA ENVELOPMENT ANALYSIS AS AN ASSESSMENT TOOL FOR BUSINESS EFFICIENCY
In the industrial organization literature of the past decades, a great deal of attention has been paid to the evaluation of efficiency differences among decision-making units (DMUs) involved in multi-product and multi-input activities. Data envelopment analysis (DEA) is an operational and quantitative, non-parametric method in production efficiency analysis that is generally used to judge the efficiency of firms or non-profit organizations. The general idea is that the production process of a DMU can be described by a generalized production function which may contain multiple input and multiple output factors. The most efficient production technology of such a composite production process can be described by means of the production possibility frontier, while the actual position of a firm − in terms of its realized efficiency or relative use of
input factors to achieve a certain output (or a set of outputs) − can be represented by a point in either the input space or the output space. DEA is based on the seminal work of Farrell (1957), later on extended by Charnes et al. (1978) and Banker et al. (1984). This method has been applied numerous times to operational efficiency problems in public sector agencies (schools, airports, hospitals etc.) as well as in private sector agencies (banks, hotels, airlines, etc.). A major advantage of DEA is that it does not require any a priori specified functional form of the production technology, since it is − in
contrast to traditional production theory − generated from empirical data on observed performance measures (both inputs and outputs). In general, DEA models assess the (in) efficiency of a DMU on the basis of the actual economic distance to the production frontier that gives the highest possible efficiency. The efficiency analysis developed by Charnes et al. (1978)

253
aims to maximize production efficiency in terms of the ratio of total weighted output to total weighted input, subject to the condition that in all circumstances this efficiency measure is smaller than or equal to 1. Thus, the distance to the maximum value 1 is then seen as a measure of inefficiency.
A standard approach in DEA is the estimation of weights, which are calculated in a standard way by specifying a multiple objective maximization model (in case of multiple outputs). In that case the weights are determined through a maximization exercise faced by each DMU. The following steps are normally undertaken (see also Cracolici and Nijkamp 2006; Suzuki et al. 2007).
Specification of a fractional maximization problem by each DMU (in terms of ratios of weighted outputs to weighted inputs) with the aim to identify the optimal weights.
Transformation of the above nonlinear maximization problem into a standard linear programming problem in order to compute the input and output weights. This primal linear programming model represents an output-oriented approach, while its dual formulation indicates an input orientation (for a given level of outputs, inputs are minimized).
If the solution to the maximization problem leads to a value 1 for some DMU, then this DMU is efficient (i.e., a case of a non-dominated solution), while a value below 1 indicates a case of inefficiency. Clearly, all points on the efficiency frontier have a value of 1.
If one or more inputs or outputs are added to the DEA method, this will affect the selection and the number of effectively operating DMUs. In general, if more relevant inputs are added, the number of efficient DMUs will rise. Thus, this is a clear reason to pay attention to the specification of the DEA model, while a sensitivity analysis regarding the choice of the inputs or outputs is also desirable.
The previous steps will also be used in our empirical analysis of the performance of migrant entrepreneurs in Amsterdam.
5.1. DEA Results for Migrant Entrepreneurs in Amsterdam and Fairfax We will now analyze the economic performance of our samples of migrant entrepreneurs. In our empirical assessment we use Data Envelopment Analysis (DEA) to judge the efficiency or performance level of the firms in our sample, for both Amsterdam and Fairfax. DEA has become an established quantitative research tool in efficiency analysis in corporate and other organizations (see Charnes et al. 1978, Nijkamp et al. 2008). DEA offers a measure of the relative efficiency of each decision making unit or agent considered, using the highest performing agent as a benchmark. The DEA approach was conducted for each of the two samples: 83 migrant entrepreneurs in Amsterdam and 42 migrant entrepreneurs in Fairfax (the results are given in Figures 2 and 3).

254
0,0
0,1
0,2
0,3
0,4
0,5
0,6
0,7
0,8
0,9
1,0E
1E
2E
3E
4E
5E
6E
7E
8E
9E
10E
11E
12E
13E
14E
15E
16E
17E
18E
19E
20E
21E
22E
23E
24E
25E
26E
27E
28E
29E
30E
31E
32E
33E
34E
35E
36E
37E
38E
39E
40E
41E
42E
43E
44E
45E
46E
47E
48E
49E
50E
51E
52E
53E
54E
55E
56E
57E
58E
59E
60E
61E
62E
63E
64E
65E
66E
67E
68E
69E
70E
71E
72E
73E
74E
75E
76E
77E
78E
79E
80E
81E
82E
83
Figure 2. Efficiency score of individual migrant entrepreneurs in Amsterdam
Figure 3. Efficiency score of individual migrant entrepreneurs in Fairfax
Figure 2 shows that 15 of the 83 entrepreneurs in the Amsterdam sample are efficient (they have relative efficiency scores of 1.00, which is maximum possible score). Next, a subdivision of the three migrant categories was carried out, and a DEA analysis was applied to each of the three migrant categories separately in our sample, viz. Turks, Moroccans, and Surinamese. The results are contained in Figure 4, which shows the efficiency scores of the entrepreneurs categorized by ethnic origin. 7 entrepreneurs of Turkish origin, 12 entrepreneurs of Moroccan origin and 5 entrepreneurs of Surinamese origin are efficient in their own group. Furthermore, it is interesting to see that in particular the number of efficient entrepreneurs of Moroccan origin has doubled in this second efficiency analysis categorized by ethnic origin, compared with the first analysis of the 83 entrepreneurs. In their own circle, Moroccan enterprises, according to the DEA analysis, perform well, but if we take the three groups together, the Moroccans perform less well compared to the broader reference group of all companies. Figure 3 shows that 12 of the 42 entrepreneurs in the Fairfax sample are efficient (they have relative efficiency scores of 1.00, which is maximum possible score).
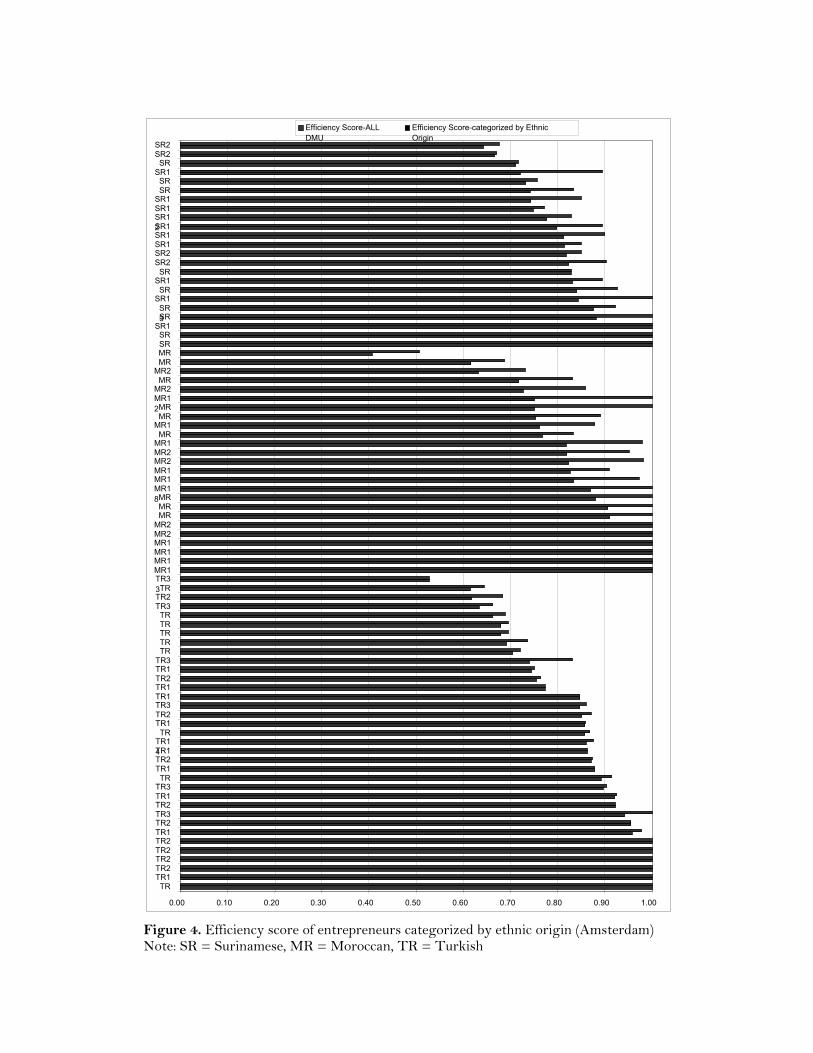
255
0.00 0.10 0.20 0.30 0.40 0.50 0.60 0.70 0.80 0.90 1.00
TRTR1TR2TR2TR2TR2TR1TR2TR3TR2TR1TR3TR
TR1TR2TR1TR14
TRTR1TR2TR3TR1TR1TR2TR1TR3TRTRTRTRTR
TR3TR2TR
TR33
MR1MR1MR1MR1MR2MR2
MRMRMR
MR18
MR1MR1MR2MR2MR1
MRMR1
MRMR
MR12
MR2MR
MR2MRMRSRSR
SR1SRSR3
SR1SR
SR1SR
SR2SR2SR1SR1SR1SR12
SR1SR1SRSR
SR1SR
SR2SR2
Efficiency Score-ALL DMU
Efficiency Score-categorized by Ethnic Origin
Figure 4. Efficiency score of entrepreneurs categorized by ethnic origin (Amsterdam) Note: SR = Surinamese, MR = Moroccan, TR = Turkish
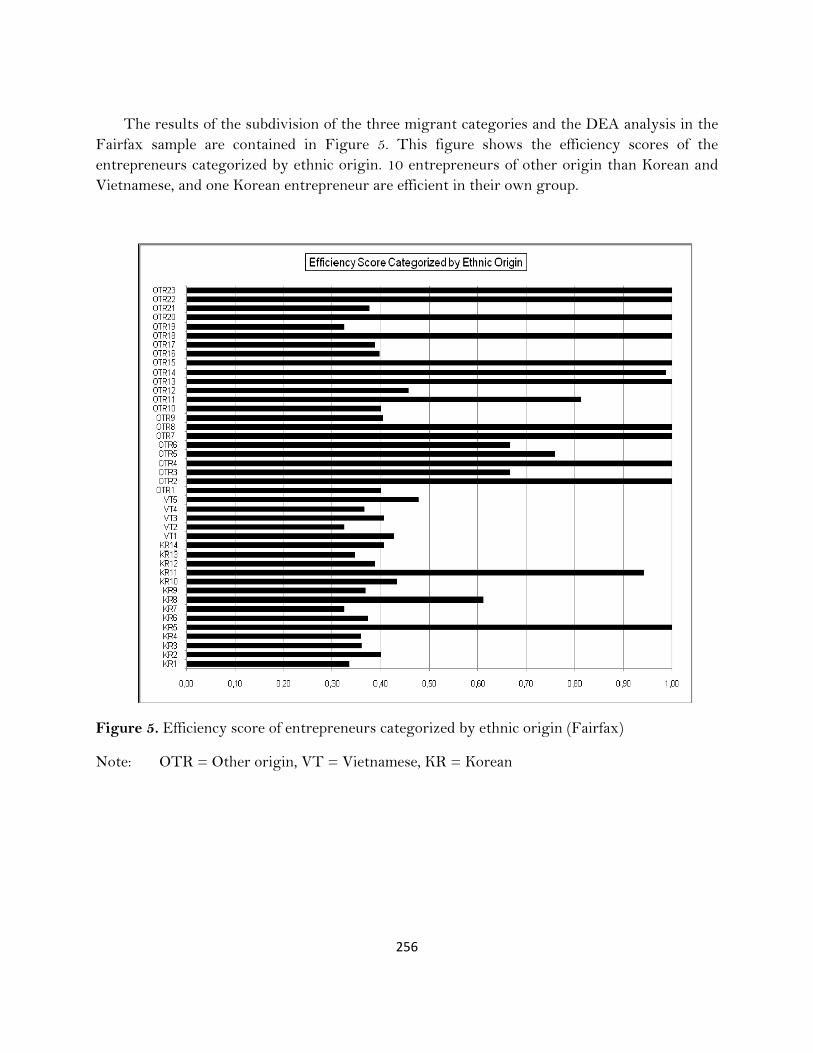
256
The results of the subdivision of the three migrant categories and the DEA analysis in the Fairfax sample are contained in Figure 5. This figure shows the efficiency scores of the entrepreneurs categorized by ethnic origin. 10 entrepreneurs of other origin than Korean and Vietnamese, and one Korean entrepreneur are efficient in their own group.
Figure 5. Efficiency score of entrepreneurs categorized by ethnic origin (Fairfax)
Note: OTR = Other origin, VT = Vietnamese, KR = Korean
257
6. CONCLUSIONS
It is noteworthy that the past decades have shown remarkable growth in entrepreneurship among migrants. Recent studies on ethnic entrepreneurship have observed an increasing share of migrants in urban small- and medium-sized entrepreneurial businesses. The phenomenon of migrant entrepreneurship deserves more in-depth scientific investigation, on the basis of, inter alia, comparative studies in terms of incubator conditions and critical success factors (CSFs) for a promising and efficient business performance. Given the growing importance of entrepreneurship, there is practical value in being able to identify CSFs. Due insight into entrepreneurial behaviour and the relative performance of migrants is needed in developing an effective business policy in which migrants are seen as a source of new socio-economic opportunities, for both the migrant groups and the city concerned. Strategic information will also be necessary for the development of fine-tuned policy strategies for enhancing the participation of traditionally less-privileged groups and for improving their business performance potential.
This paper next addresses in particular ethnic entrepreneurship as a major force field in the SME sector in many contemporary urban areas. The social and human capital factors involved are given due attention. This is followed by two empirical studies – one from the Netherlands and one from the US – which are presented to highlight the impact of social and human capital on business performance. Research studies on motivation and critical success conditions for ethnic entrepreneurs demonstrate that performance conditions vary across ethnic groups. The studies that consider differences by race and ethnicity find that human capital, access to finance, and industry structures may produce systematic differences (Bates, 1993; Fairlie, 1999, Butler and Greene, 1997).
Minority-owned businesses lag behind non-minority-owned businesses in terms of sales, profits, survivability, and employment; facing greater obstacles in obtaining financing for their business implies that an already difficult situation is growing worse. According to Holguin et al. (2007), there are several significant barriers that specifically are faced by some groups of ethnic entrepreneurs in the US. Access to financial capital, access to mentors and networks, access to labor pads, and barriers to marketplace are highly important to start a business and can discourage the development of the business. Studies of migrant and ethnic communities, in particular, show that minority businesses that are better embedded in the local community, serve a large share of area residents, and help their community as a whole do better than they might have otherwise.
The results of our analysis, based on DEA analysis, show that the performance of migrant entrepreneurs may differ based on their efficiency rate. The above findings are certainly provisional and call for more solid research on a large sample of migrant entrepreneurs. For further research it will be interesting to examine possible reasons for differences in performance and efficiency rates between migrant entrepreneurs. Possible reasons for low, or differences in, efficiency rates amongst migrant entrepreneurs may be caused by the limited

258
potential for growth of their market niches, because several of these entrepreneurs appear to operate in limited markets. Other reasons for their low efficiency rate may be less labour (-market) experience and lack of entrepreneurial experience.
For further research it will be also interesting to compute the proportion of space filled by the bars of the graphs in Figure 4 and 5 to the total space and to create a ratio of group-specific efficiency. Alternatively, it is possible to create a slope measure that is computed across the bars of each sub-graph. The steeper the slope the more efficient the group. Such measures could be used to compare relative group efficiencies. Such follow-up research could offer a new contribution to the literature on the DEA methodology and comparative efficiency analysis too.
Finally, we need some more analysis in order to make some conclusions. First, by using a group measure of efficiency as described above it is possible to create a new measure for group efficiency and to identify the importance of this for making inter-group comparisons. Secondly, running a regression analysis with as the dependent variable the efficiency score and as independent variables business inputs (both aggregate and for Amsterdam and Fairfax separately, and for the specific groups of entrepreneurs) to determine which independent variables are more important and how much consistency there is across groups is a relevant item for further research.
References
Acs, Z.J., and Armington, C., eds. (2006). Entrepreneurship, Geography, and American Economic Growth, Cambridge University Press, Cambridge.
Acs, Z.J., and Audretsch, D.B., eds. (1993). Small Firms and Entrepreneurship; An East-West Perspective, Cambridge University Press, Cambridge.
Adler, P.S., and Kwon, S.W., (2002). Social Capital: Prospects for a New Concept, Academy of Management Review, Vol. 27(1), pp. 17-40.
Aldrich, H.E., and Zimmer, C., (1986). Entrepreneurship through Social Networks, in: D.L. Sexton and R.W. Wilson (eds.), The Art and Science of Entrepreneurship, Ballinger, Mass, pp. 154-167.
Anderson, A.R., and Miller, C.J., (2003). Class Matters: Human and Social Capital in the Entrepreneurial Process, Journal of Socio-Economics, Vol.32(1), pp. 17–36.
Aronson, D., (1997). Research Perspectives on Migration, A Joint Project of the International Migration Policy Program of the Carnegie Endowment for International Peace and the Urban Institute, Vol. 1(2).
Audretsch, D.B., and Thurik, A.R., (2001). What's New about the New Economy? Sources of Growth in the Managed and Entrepreneurial Economies, Industrial and Corporate Change, Vol. 1(10), pp. 267-315.
Banker, R. D., Charnes, A., and Cooper, W.W., (1984). Some Models for Estimating Technical and Scale Inefficiencies in Data Envelopment Analysis, Management Science, Vol.30, pp. 1078-1092.

259
Basu, A., (1998). An Exploration of Entrepreneurial Activity among Asian Small Businesses in Britain, Small Business Economics, Vol. 10, pp. 313-326.
Bates, T., (1993). Assessment of State and Local Government Minority Business Development Programs, U.S. Department of Commerce, Washington, DC.
Bates, T., (1994a). An Analysis of Korean-Immigrant-Owned-Small-Business Start-Ups with Comparisons to African-American- And Nonminority-Owned Firms, Urban Affairs Quarterly, Vol. 30(2).
Bates, T., (1994b). Social Resources Generated by Group Support Networks May Not be Beneficial to Asian Immigrant-owned Small Businesses, Social Forces, Vol. 72(3), pp. 671-689.
Bates, T., (1999). Race, Self-Employment, and Upward Mobility: An Illusive American Dream; Response to John Sibley Butler's Review Essay, Small Business Economics, Springer, Vol. 12, pp. 189-190.
Baum, R.J., Locke, E.A., and Smith, K.G., (2001). A Multidimentional Model of Venture Growth, Academy of Management Journal, Vol. 44(2), pp. 292-303.
Baycan-Levent, T., Masurel, E., and Nijkamp, P., (2003). Diversity in Entrepreneurship: Ethnic and Female Roles in Urban Economic Life. International Journal of Social Economics, Vol. 30(11), pp. 1131-1161.
Becker, G.S., (1975). Human Capital – A Theoretical and Empirical analysis with Special Reference to Education, The Press of Chicago University, Chicago.
Birley, S., and Ghaie, S., (1992). Networking by the Indian Community in Northern Ireland, Working Paper. Imperial College, London.
Bonacich, E., Light, I., and Wong, C., (1976). Small business among Koreans in Los Angeles, in: Gee, E. (ed.), Counterpoint: Perspectives on Asian America, Asian American Studies Center, Los Angeles
Borjas, G., (1990). Friends or Strangers: The Impact of Immigrants on the U.S. Economy, Basic Books, NewYork.
Boubakri, H., (1999). Les Entrepreneurs Migrants d’Europe, Paris: Culture & Conflits, Sociologie Politique de l’International, Printemps-Été, Paris.
Bourdieu, P., (1986). The forms of capital, in: J.G. Richardson (ed.), Handbook for Theory and Research for the Sociology of Education, Greenwood, New York, pp. 241-258.
Brown, T.C., and Hanlon, D., (2004). Validation of Key Behaviours for Effective Entrepreneurship, Paper presented at the BKERC , Glasgow June 3-5.
Brücker, H., Epstein, G.S., McCormick, B., Saint-Paul, G., Venturini, A., Zimmermann, K.F., (2002). Managing Migration in the European Welfare State. in: Boeri, T., Hanson, G. and McCormick, B. (eds.), Immigration Policy and the Welfare System, Oxford University Press, Oxford, pp. 1-168.
Butler, J.S., and Greene, P.G., (1997). Ethnic Entrepreneurship: The Continuous Rebirth of American Entrepreneurship, in: Sexton D.L. and Smilor R.W. (eds.), Entrepreneurship 2000, Upstart Publishing, Chicago, pp. 267-289.
260
Carland, J., and Carland, J.C., (1993). The Role of Personality in New Venture Creation, Entrepreneurship, Innovation and Change. Vol. 2(2), pp. 129-140.
CEEDR (2000). Young Entrepreneurs, Women Entrepreneurs, Ethnic Minority Entrepreneurs and Co–Entrepreneurs in the European Union and Central and Eastern Europe. Final Report to the European Commission, DG Enterprise, Centre for Enterprise and Economic Development Research (CEEDR) Middlesex University Business School, UK.
Charnes, A., Cooper, W.W., Rhodes, E., (1978). Measuring the Efficiency of Decision Making Units, European Journal of Operational Research, Vol. 2, pp. 429-444.
Cracolici, M.F., and Nijkamp, P., (2006). Competition among Tourist Destinations, Tourism and Regional Development (M. Giaoutzi and P. Nijkamp, eds.), Ashgate, Aldershot, pp. 133-152.
Choenni, A., (1997). Veelsoortig Assortiment, Het Spinhuis, Amsterdam. Chou, Y.K., (2006). Three Simple Models of Social Capital and Economic Growth, Journal of
Socio-Economics, Vol.35(5), pp. 889-912. Cooper, A., Gimeno-Gascon, J., and Woo, C., (1994). Initial Human and Financial Capital as
Predictors of New Ventures Performance, Journal of Business Venturing, Vol. 9, pp. 371-395.
Dagevos, J., and Gesthuizen, M., (2005). Niet-westerse Allochtonen met een Stabiele Arbeidsmarktpositie: Aantallen en Ontwikkelingen, Sociaal en Cultureel Planbureau, Den Haag.
Dasgupta, P., and Serageldin, I., (eds) (1999). Social Capital. A Multifaceted perspective, The World Bank, Washington D.C.
De Carolis, D., and Saparito, P., (2006). Social Capital, Cognition and Entrepreneurial Opportunities: A Theoretical Framework, Entrepreneurship Theory and Practice, Vol. 30(1), pp. 41-56.
Deakins, D., Majunder, M., and Paddison, A., (1997). Developing Success Strategies for Ethnic Minorities in Business: Evidence from Scotland. New Community, Vol. 23, pp. 325-342.
Delft, H., van, Gorter, C., and Nijkamp, P., (2000). In Search of Ethnic Entrepreneurship in the City. Environment & Planning C, Vol 18, pp. 429-451.
Dhaliwal, S., (1998). Silent Contributors: Asian Female Entrepreneurs and Women in Business, Women's Studies International Forum, Vol. 21(5), pp. 463-474.
Driessen, M., and Zwart, P., (2006). De E-scan Ondernemerstest ter Beoordeling van Ondernemerschap. MAB, Vol. 80(7/8), pp. 382-391.
Dyer, L.M., and Ross C.A., (2000). Ethnic Enterprises and their Clientele, Journal of Small Business Management, Vol. 38(2), pp. 48-66.
Evans, M.D.R., (1989). Immigrant Entrepreneurship: Effects of Ethnic Market Size and Isolated Labor Pool, American Sociological Review, Vol. 54, pp. 950–962.
Fairlie, R.W., (1999). The Absence of the African-American Owned Business: An Analysis of the Dynamics of Self-Employment. Journal of Labor Economics, Vol. 17, pp. 80-108.

261
Farrell, M.J., (1957). The Measurement of Productive Efficiency. Journal of the Royal Statistical Society, Series A, Vol. 120, pp. 253–281. Florin, J., Lubatkin M., and Schulze, W., (2003). A Social Capital Model of High-Growth
Ventures, Academy of Management Journal, Vol. 46(3), pp. 374-384. Fratoe, F., (1988). Social capital and black business owners, The Review of Black Political Economy, Vol. 16(4), pp. 33–50. Fukuyama, F., (1995). Trust: Social Virtues and the Creation of Prosperity, Free Press, New York. Glaeser, E. L., Laibson, D.K., Scheinkman, J.A., and Soutter, C.L. (2000). Measuring Trust,
Quarterly Journal of Economics, Vol. 115(3), pp. 811-46. Greenwood, M.J., (1994). Potential Channels of Immigrants Influence on the Economy of the
Receiving Country. Papers in Regional Science, Vol 73, pp. 211-240. Hammarstedt, M., (2001). Immigrant Self-employment in Sweden – Its variation and some
possible determinants, Entrepreneurship & Regional Development, Vol. 13, pp. 147-161. Hansemark, O., (1998). The Effects of an Entrepreneurship Programme on Need for
Achievement and Locus of Control of Reinforcement, International Journal of Entrepreneurial Behaviour and Research, Vol. 4(1), pp. 28-50.
Hébert, R.F., and Link, A.N., (1989). In Search of the Meaning of Entrepreneurship, Small Business Economics, Vol. 1, pp. 39-49.
Hipple, S., (2004). Self-employment in the United States: An Update, Monthly Labor Review, Vol. 13, pp. 13.
Ho, T.S., and Koh, H.C., (1992). Differences in Psychological Characteristics between Entrepreneurially Inclined and Non-entrepreneurially Inclined Accounting Graduates in Singapore, Entrepreneurship, Innovation and Change: An International Journal, Vol. 1, pp. 243-254.
Holguin, J., Gamboa, E., and Hoy, F., (2006), Challenges and Opportunities for Hispanic Entrepreneurs in the United States, in: L. P. Dana (ed.), Migrant Entrepreneurship, Edward Elgar, Aldershot, pp. 99-113.
Iyer, G.R., and Shapiro, J. M., (1999). Ethnic Entrepreneurial and Marketing Systems: Implications for the Global Economy, Journal of International Marketing, Vol. 7(4), pp. 83-110.
Jacobs, J., (1961). The Life and Death of Great American Cities, Random House, New York. Johnson, B.R., (1990). Toward a Multidimensional Model of Entrepreneurship: The Case of
Achievement Motivation and the Entrepreneur, Entrepreneurship Theory and Practice, pp. 39-54.
Kakati, M., (2003) Success Criteria in High-tech New Firms, Technovation, Vol. 23, pp. 447-457. Kalantardis, C., and Bika, Z., (2006). In-migrant Entrepreneurship in Rural England: beyond
Local Embeddedness, Entrepreneurship & Regional Development, Vol. 18, pp. 109-131. Keeble, D., (1989). High Technology Industry and Regional Development in Britain: The Case
of the Cambridge Phenomenon, Government and Policy, Vol. 7, pp. 152-172.
262
Keeble, D., and Tyler, P., (1995). Enterprising Behaviour and the Urban-Rural Shift, Urban Studies, Vol. 32(6), pp. 975-997.
Kim, Ph. H., Aldrich, H.E., Keister, L.A., (2003). Access (Not) Denied: The Impact of Financial, Human and Cultural Capital on Entrepreneurial Entry in the United States, Small Business Economics Vol. 27(1), p. 5-22.
Köllinger, P., and Minniti, M., (2006). Not for a Lack of trying: American Entrepreneurship in Black and White, Small Business Economics, Vol. 27, pp. 59-79.
Lee, H.S., and Chang, S., (2005). Environmental Jolts, Internal Buffers, and Failures Versus Survivals of High-technology Based Ventures, Paper presented at BKERC, Boston, June 8-11.
Lee, J., and Lee, S., (2004) Failure Factors of New Technology-Based Ventures According to the Growth Stages, Frontiers of Entrepreneurship Research, Babson College, Wellesley MA, pp.1-14.
Levie, J., (2007). Immigration, In-migration, Ethnicity and Entrepreneurship: Insights from the GEM UK Database, Small Business Economics, Vol. 28(2), pp. 143-169.
Levie, J., and Smallbone, D., (2006). Entrepreneurship, Ethnicity and Migration: Current Trends and Future Directions. In: Minniti, M. (ed.), Perspectives on Entrepreneurship, Vol. 1, Praeger, Westport CT, pp. 157-180.
Light, I., (1984). Immigrant and Ethnic Enterprise in North America, Ethnic and Racial Studies, vol. 7, pp. 195-216.
Light, I, and Gold, S.J., (2000). Ethnic Economies, Academic Press , San Diego. Light, I., and Roach, E., (1996). Self-Employment: Mobility Ladder or Economic Lifeboat. In R.
Waldinger, and M. Bozorgmehr (Eds.), Ethnic Los Angeles (pp. 193-213). New York: Russell Sage Foundation.
Light, I., and Rosenstein, C., (1995). Race, Ethnicity and Entrepreneurship in Urban America, Aidine de Gruyter, New York.
Lumpkin, G.T., and Dess, G.G., (1996). Clarifying the Entrepreneurial Orientation and Linking it to Performance, Academy of Management Review, Vol. 21, pp. 135-152.
Marger, M., (1989). Business Strategies Among East-Indian Entrepreneurs in Toronto: The Role of Group Resources and Opportunity Structure, Ethnic and Racial Studies, Vol. 12, pp. 539-563.
Masurel, E., Nijkamp, P., Tastan, M., and Vindigni, G., (2002). Motivations and Performance Conditions for Ethnic Entrepreneurship. Growth & Change 33(2), pp. 238-260.
Menzies, T.V., Brenner G.A., and Filion, L.J., (2003). Social Capital, Networks and Ethnic Minority Entrepreneurs: Transnational Entrepreneurship and Bootstrap Capitalism, in: Etemad H. and Wright R.W. (eds.), Globalization and Entrepreneurship: Policy and Strategy Perspectives, Edward Elgar, Northampton MA, pp. 125-151.
Menzies, T.V., Doichon, M., Gasse, Y., and Elgie, S., (2006). A Longitudinal Study of the Characteristic, Business Creation Process and Outcome Differences of Canadian Female
263
vs. Male Nascent Entrepreneurs, International Entrepreneurship and Management Journal, Vol. 2, pp. 441–453.
Mesch, G.S., and Czamanski, D., (1997). Occupational Closure and Immigrant Entrepreneurship: Russian Jews in Israel. Journal of Socio-Economics, Vol. 26, pp. 597- 610.
Min, P.G., (1987). Factors Contributing to Ethnic Business: A Comprehensive Synthesis, International Journal of Comparative Sociology, Vol. 28(3/4), pp. 173-193.
Mueller, P., (2005). Exploring the Knowledge Filter - How Entrepreneurship and University-Industry Relations Drive Economic Growth, ERSA conference papers ersa05p610, European Regional Science Association.
Nahapiet, J., and Ghoshal, S., (1998). Social Capital, Intellectual Capital, and the Organizational Advantage, Academy of Management Review, Vol. 23(2), pp. 242-266.
Nijkamp, P., (2003). Entrepreneurship in a Modern Network Economy. Regional Studies 37(4), pp. 395-405.
Nijkamp, P., Sahin, M., and Suzuki, S., (2008). Migrant Entrepreneurs and the Struggle for Survival, A Comparative Study on the Efficiency Performance of Migrant Entrepreneurs in Amsterdam by Means of Data Envelopment Analysis, Regional Studies, (forthcoming).
Oort, F.J., van, and Atzema, O.A.L.C., (2004). On the Conceptualization of Agglomeration Economics: The Case of New Firm Formation in the Dutch ICT Sector, Annals of Regional Science, Vol. 38, pp. 263-290.
Peterson, M.F., and Roquebert, J., (1993). Success Patterns of Cuban-American Enterprises: Implications for Entrepreneurial Communities, Human Relations, Vol. 46, pp. 921-935.
Phizaklea, A., and Ram, M., (1996). Being Your Own Boss: Ethnic Minority Entrepreneurs in Comparative Perspective, Work, Employment and Society, Vol. 10(2).
Portes, A., and Zhou, M., (1996). Self-Employment and the Earnings of Immigrants, American Sociological Review, Vol. 61(2), pp.219-230.
Prashantham, S., (2006), Foreign Network Relationships and the Internationalization of Small Knowledge-Intensive Firms, International Journal of Entrepreneurship and Innovation Management, Vol. 6(6), pp. 542-553.
Putnam, R., (2000). Bowling alone: The collapse and Revival of American Community, Simon & Schuster, New York.
Ram, M., (1994), Managing to Survive: Working Lives in Small Firms, Blackwell, Oxford. Richtmyer, R., (2002). KEMET building ties with Japan, US Dept of Commerce, Bureau of the
Census. Robb, A., and Fairlie, R., (2007). Access to Financial Capital among U.S. Businesses: The Case
of African American firms. The Annals of the American Academy of Political and Social Science, no. 613, pp. 4-72.

264
Sahin, M., Nijkamp, P., and Baycan-Levent, T., ( 2006). Is Migrant Entrepreneurship from the Perspective of Cultural Diversity, in: L. P. Dana (ed.), Migrant Entrepreneurship, Edward Elgar, Aldershot, pp. 99-113.
Sahin, M., Nijkamp, P., and Baycan-Levent T (2007), Migrant Entrepreneurship from the Perspective of Cultural Diversity, in: Aktan C.C. (ed.), Advances in Business and Management, Cesme, Izmir, pp. 103-121.
Sanders, J. and Nee, V., (1996). Immigrant Self Employment: The Family as Social Capital and the Value of Human Capital, American Sociological Review, Vol. 61, pp. 231-249.
Shepherd, D.A., Douglas, E.J., and Shanley, M., (2000). New Venture Survival: Ignorance, External Shocks, and Risk Reduction Strategies, Journal of Business Venturing Vol. 15, pp. 393-410.
Shin, E., and Han, S., (1990). Korean Immigrant Small Businesses in Chicago: An Analysis of the Resource Mobilization Process, Amerasia Journal, Vol. 16(1), pp. 39-60.
Sobel., J., (2002). Can we Trust Social Capital? Journal of Economic Literature, Vol. XL, pp. 139-154.
Suzuki, S., Nijkamp, P., Rietveld, P., and Pels, E., (2007). Distance Friction Minimization Approach in Data Envelopment Analysis; An Application to Airport Performance. Tinbergen Institute Discussion Paper, TI 2009-024/3.
Tanaka, S., and Krishnan, A., (2006). Migration – Migrant entrepreneurship; Cities, Magnets of Hope, Habitat Debate, World Habitat Day, 2 October, 2006.
Teder, J., and Golik, M., (2006). Ethnic Minorities and Entrepreneurship in Estonia, paper presented at the 14th Nordic Conference on Small Business Research, Stockholm: [http://www.ncsb2006.se/download_title.htm].
Teixeira, C., (1998). Cultural Resources and Ethnic Entrepreneurship: A Case Study of the Portuguese Real Estate Industry in Toronto, The Canadian Geographer, Vol. 42(3), pp. 267-281.
Tillie, J., and Slijper, B., (2006). Immigrant Political Integration and Ethnic Civic Communities in Amsterdam. In: S. Benhabib and I. Shapiro (eds.), Identities, Allegiances and Affiliations, Cambridge University Press, Cambridge.
Torres, D.L., (1988). Success and the Mexican-American Businessperson, Research in the Sociology of Organizations, Vol. 6, pp. 313-334.
Velde, M.E.G., van, Jansen, P.G.W., and Telting, I.A., (2000). Bedrijfswetenschappelijk Onderzoek: Van Probleemstelling tot Presentatie”. Baarn: Nelissen.
Waldinger, R., (1988). The Ethnic Division of Labour Transformed: Native Minorities and New Immigrants in Post-Industrial New York, New Community, Vol. 14(3).
Waldinger, R., Aldrich, H., and Ward, R., (eds) (1990). Ethnic Entrepreneurs. Sage Publishers. Newbury Park, Ca.
Walton-Roberts, M., and Hiebert, D., (1997). Immigration, Entrepreneurship and the Family: Indo-Canadian Enterprise in the Construction Industry of Greater Vancouver, Canadian Journal of Regional Science, Vol. 20(1-2), pp. 119-140.
265
Ward, R., and Jenkins, R., (eds) (1984). Ethnic Communities in Business, Cambridge University Press. Cambridge.
Wennekers, S., and Thurik, A.R., (1999). Linking Entrepreneurship and Economic Growth, Small Business Economics, Vol. 13(1), pp. 27-55.
Werbner, P., (1999). What Colour 'Success’? Distorting Value in Studies of Ethnic Entrepreneurship, The Sociological Review, Vol. 47(3), pp. 548-579.
Westlund, H., and Bolton, R., (2003). Local Social Capital and Entrepreneurship, Small Business Economics, Vol. 21, pp. 77-113.
Westlund, H., and Nilsson, E., (2005). Measuring Enterprises: Investments in Social Capital, Regional Studies, Vol. 39(8), pp. 1079-1094.
Yu, J., and Stough, R.R., (2006). The Determinants of Entrepreneurship and Development in China, International Journal of Management and Entrepreneurship Development, Vol. 3(1/2), pp. 30-52.
Yuengert, A.M., (1995). Testing Hypotheses of Immigrant Self-Employment, The Journal of Human Resources, vol. XXX, no. 1.
Zorlu, A., and Traag, T., (2005). Opleidingsniveau en taalvaardigheid [Educational level and language proficiency], Jaarrapport Integratie 2005, SCP/WODC/CBS, The Hague.

266
PART D
EXPLANATORY
ANALYSIS:
THE GALAXY MODEL

267
268
CHAPTER 9*
ECONOMIC PERFORMANCE OF MIGRANT ENTREPRENEURS IN THE HIGH-TECH SECTOR: DESIGN AND APPLICATION OF THE GALAXY MODEL
Abstract Migrant entrepreneurs may contribute significantly to the vitality of the urban economy. Over the past decades we observe in many cities a trend among the next-generation migrant entrepreneurs to start business activities in the high-tech sector, for which they require a higher education level and various skills. Against this background, the present study aims to introduce a comprehensive explanatory model – called GALAXY − which comprises a varied set of systematic factors that are supposed to have an impact on the economic performance of the next-generation ethnic entrepreneurs. The overarching factors in the model are integrated in four components: motivational factors; socio-economic contextual factors; policy factors; and business environment. Our empirical study is concerned with the Netherlands, where a growing number of next-generation immigrants are orienting their business towards the high-tech sector, notably, the ICT sector (automation, software computer programming, and Internet service provider companies), the FIRE-sector (finance, insurance, real estate, consulting, accountancy companies), and the tourism sector (tour operators and travel agencies). This paper uses a database from a survey questionnaire obtained from a sample of migrant entrepreneurs originating from three main ethnic groups (Turks, Moroccans and Surinamese) in four large cities (Amsterdam, Rotterdam, Utrecht, and The Hague) in the Netherlands in order to explore the profile of these entrepreneurs and their economic performance.
Key words: migrant entrepreneurship, high-tech, GALAXY model, economic performance
JEL classification codes: L 26, R 11
*Source: Sahin, M., Todiras, A., Nijkamp, P., and Masurel, E. (2012), An Explanatory Model for the Economic Performance of Migrant Entrepreneurs in the High-Tech Sector. In: Peter Nijkamp, Jacques Poot, and Mediha Sahin (eds), Migration Impact Assessment: New Horizons, Edward Elgar, Cheltenham UK (Accepted).

269
1. ENTREPRENEURIAL MIGRANTS ON THE MOVE Entrepreneurship is a creative process that depends on the decisions that people make about how to engage in business (Shane et al., 2003). Segal et al. (2005) define entrepreneurship as: being self-employed in one’s own business. Ahmad and Hoffmann’s (2008) definition considers three components: entrepreneurs; entrepreneurial activity; and entrepreneurship. Entrepreneurs are those persons (business owners) who seek to generate value, through the creation or expansion of economic activity, and by identifying and exploiting new products, processes or markets. Entrepreneurial activity is enterprising human action in pursuit of the generation of value, through the creation or expansion of economic activity, by identifying and exploiting new products, processes or markets, while entrepreneurship is the phenomenon associated with entrepreneurial activity (Ahmad and Hoffmann, 2008; Shane and Venkataraman, 2007; van Praag and Versloot, 2007). Shane et al. (2003) explicitly assume that entrepreneurship is not solely the result of human action based on both motivational and cognitive factors, but that external factors also play a critical role. The external environment includes: (1) political factors (e.g. legal restrictions, quality of law enforcement, political stability, and currency stability); (2) market forces (e.g. structure of industry, technology regime, potential barriers to entry, market size, and population demographics); and (3) resources (e.g. availability of investment capital, labour market including skill availability, transportation infrastructure, and complementary technology).
Over the last few decades we have witnessed a significant rise in entrepreneurship among migrants in the largest European cities (Waldinger et al., 1990; Kloosterman and Rath, 2001; Sahin et al., 2007; Ram and Jones, 1998, Baycan-Levent et al., 2009). In Europe the share of the migrant business ownership is expected to continue growing, in some countries the rates of self-employed immigrants exceeding those of native-born (Baycan-Levent and Nijkamp, 2009). The developed economies recognized early on the contribution of migrants to their economic vitality, through their innovative nature and relatively high-self employment rates. Moreover, the small and medium-sized enterprises (SMEs) set up by the migrant entrepreneurs are an important source of new jobs, new products and services, new activities, and the business dynamism that results in diversity of output (Nijkamp et al., 2009). This, according to Jacobs (1969), is the main cause of the prosperity of urban economies. It is asserted in the literature that the reason behind the high self-employment rate of migrant entrepreneurs is that they are confined to a lower socio-economic ladder of European cities due to their lack of skills and education. Therefore, starting-up their own businesses proves to be a much more rewarding and challenging activity for them than standard employment. It is very common, especially for the first-generation migrants, to establish businesses in the traditional markets (e.g. retail, catering and hospitality industry). Moreover, these entrepreneurs can be characterized by an internal orientation, i.e. they develop a network of ethnic people, thus both their employees and customer base belong to their own ethnic group. However, the next-generation entrepreneurs (next-generation immigrants who are, in conformity with the Dutch Central Bureau of

270
Statistics definition, ‘persons born in Netherlands from at least one parent who was born abroad’) bring often evidence of external orientation, which indicates that they are seeking opportunities outside their own ethnic group. These could be explained by the fact that next-generation migrant entrepreneurs are more highly skilled and educated, have a better knowledge of the host country language, and their culture is influenced to a much greater extent by the culture of the host country, so that their behaviour and attitudes will resemble more those of the native population.
Ethnic entrepreneurship research studies are generally based on case studies, surveys with small samples, or secondary databases. Obtaining respondent cooperation is particularly difficult as many ethnic groups members, especially visible minorities, may belong to the as yet not high-skilled, and thus be may less inclined to participate in survey research. While there is a growing literature on the different aspects of ethnic entrepreneurship (Kloosterman and Rath, 2001; Ram and Jones, 1998; Baycan-Levent et al., 2009; Levie, 2007), far less research has been conducted on the comparison of the performance of businesses started by migrant entrepreneurs. This paper aims to offer the comprehensive analytical framework for identifying and understanding the critical factors that are decisive for the economic performance of migrant entrepreneurs in the high-tech sector.
2. TRENDS IN MIGRANT ENTREPRENEURSHIP
2.1 Backgrounds Creativeness, risk-taking behaviour, courage, technological and market knowledge, human and social capital and skills are usually regarded as important driving forces of successful entrepreneurship. Education, capital start-up, previous experience, and parent’s occupation (class resources) have all been found to be more important in business success than ethnic involvement (Marger, 1989). Others have analysed the relative contribution of immigrants to entrepreneurial activity in their host country (Light and Rosenstein, 1995; Hammarstedt, 2001). The general finding is that, in many countries, migrants are known to make a disproportionately quantitative contribution to new business activities (Levie, 2007). The present paper is concerned with the performance conditions of ethnic (or migrant) entrepreneurship based on social and human capital assets. Its performance and success are often ascribed to specific characteristics of migrant entrepreneurs (e.g. socio-cultural networks, community sense).
Lately, the traditional sectors have become overrepresented by migrant entrepreneurs, thus fierce competition has had destructive effects on self-employment in this area, driving the overall revenues down, and considerably reducing the survival rate of ethnic enterprises. This has, as a result, led to a shift from the traditional to the high-tech sector, a tendency which is predominant among the next-generation entrepreneurs. Hence, their sector distribution now resembles more that of the natives than of the first-generation entrepreneurs (Baycan-Levent et al., 2009). This shift in sectoral choice may be a natural result of skill acquisition of immigrants
271
by the time spent in the host country; especially, as the next-generation acquires these skills much faster.
As in the case of other European urban economies, in the Netherlands the migrant entrepreneurs occupy a considerable part of the SME sector, therefore becoming important determinants of the urban vitality of the major cities in the country (Amsterdam, Rotterdam, Utrecht, and The Hague). They have been pushed to embark on self-employment due to lack of both financial capital and human capital (e.g. education and skills). The survival of their businesses depends largely on long working hours and cheap labour (often provided by ethnic workers) (Baycan-Levent et al., 2009; Nijkamp et al., 2009a; Kloosterman et al., 1999; Waldinger, 1986). A strong characteristic of the migrant entrepreneurs in the Netherlands is their reliance on the social networks that help them reduce their transaction costs in formal or, most likely, informal ways. Baycan-Levent and Nijkamp (2009) find that the informal social networks or the mixed embeddedness is the main aspect of the migrant entrepreneurship in the Netherlands. According to Nijkamp et al. (2009a), this reliance on informal networks, which is mainly formed by people from the entrepreneurs’ own ethnic group, could be developmental in the short run, though ultimately destructive in the long run.
2.2. New opportunities in the high-tech sector Over the last few decades increased attention has been paid to self-employment in the high-tech sector in general, and more specifically to the tendency of next-generation entrepreneurs to shift from starting-up companies in the traditional sectors (e.g. retail, and hotel and catering) towards knowledge intensive sectors.
The services provided by the high-tech sector are also referred to as ‘knowledge-intensive business services’ which, according to Warf (2010), include: financial services, insurance, legal service, industrial engineering, medical services, education services, advertising, architecture, computer services management consulting and public relations, research and development (R&D), higher education, and accounting.
Our paper will mainly concentrate on the characteristics of migrant self-employment in the ICT sector (e.g. automation, software computer programming, and Internet service provider companies) and the FIRE sector (e.g. finance, insurance, real estate, consulting and accountancy companies), and we will also consider the tourism sector (e.g. tour operators, travel agencies) as being knowledge-intensive to a certain extent.
According to Goetz and Rupasingha (2002), high-tech companies are ‘engines of local economic development’, and most of the definitions for the high-tech sector refer to research and development (R&D) spending (i.e. an above-average amount of revenues), and the share of high-skilled workers in the labour force. Companies active in this sector have much higher expenditures per employee, an important part being attributed to R&D and to the payment of skilled workers; however, despite the higher costs, there is evidence that high-tech firms have considerably higher growth rates than other types of firms (Goetz and Rupasingha, 2002).
272
Many countries have realized the importance of the small firms in innovation. For instance, the Netherlands has streamlined and consolidated its innovation support programmes to direct more government R&D funding to small firms; voucher programmes and guarantee schemes have been introduced in order to boost the activity of high-tech firms and to propel R&D in small firms (OECD, 2006). Moreover, on the human resources side, the policy measures have focused on increasing the supply of scientists and engineers by introducing reforms to the school curricula to make it more appealing and accessible to students, by shortening the duration of PhD studies, and by the improvement of international mobility, etc. (OECD, 2006).
Hence, as Kloosterman et al. (1999) emphasize, the rise in entrepreneurship among the immigrants has been facilitated by changes in the socio-cultural frameworks, and, at the same time, by the transformation processes in urban economies and the institutional framework. Moreover, due to the effort on the government side to create an environment that will encourage the involvement of immigrants in entrepreneurial activity and innovation, we can observe in recent years a shift of immigrant entrepreneurship from the lower end to the higher end of the opportunity structure. There are multiple factors that have led to this sectoral change, among which are the saturation of the traditional markets, which has resulted in the emergence of new niches (e.g. entertainment, creative industries) (Baycan-Levent et al., 2009). The reorientation of next-generation migrant entrepreneurs towards the high-tech sector can be also attributed to their increased educational opportunities, a better knowledge of the host country language, and a higher degree of assimilation in comparison with their forerunners. Consequently, it can be argued that the new generation immigrants have come to resemble more the indigenous population in general, and more specifically in sectoral choice. They prove to be more selective in terms of jobs, and will rather respond to pull factors, and benefit more from formal networks. Nijkamp et al. (2009a) have underlined the importance of the break-out from the migrants’ own ethnic frontiers in order to tap into wider markets, and start to compete or even collaborate or create joint ventures with the native population.
However, there is considerable debate in the literature on the relationship between immigration, innovation and economic growth. Florida (2003) has written in his seminal work ‘Cities and the Creative Class’ about the ‘Melting Pot Index’ that measures the relationship between immigration and high-tech industry. The experiments conducted by Florida have, brought to our attention that there is no strong connection between immigration and innovation or job growth. On the contrary, other scholars have found a significant link between migration and innovation (Ozgen et al., 2011, Niebuhr, 2010, Hunt and Gauthier-Loiselle, 2010)-add more here.
In line with the above discussion, our paper introduces an explanatory model coined “GALAXY”, which consists of a set of systematic factors that are believed to have a great impact on the economic performance of immigrant entrepreneurs. Our aim is to provide theoretical insight into the factors that form the GALAXY. And, on the empirical side, we

273
intend to create the profile of the main groups of migrant entrepreneurs in four biggest cities in the Netherlands, based on the data collected from our online survey.
The present paper has the following structure: we start by tracing a parallel between the real astronomical GALAXY and our model of ‘entrepreneurship GALAXY’. We proceed with an extensive presentation of the structure of our novel model, describing all the dimensions that have great impact on the business performance of migrant entrepreneurs. In the following section we will present the profile of the migrant entrepreneurs who have participated in our survey. Finally, the research findings are discussed, including their theoretical and practical implications.
3. DESIGN OF THE GALAXY MODEL
In order to understand the theoretical basis of the GALAXY model it is necessary to know that galaxies contain multiple star systems, star clusters, and various interstellar clouds. The sun is one of the stars in the Milky Way GALAXY: the Solar system includes the Earth and all the other objects that orbit the Sun. There are many creation myths around the world which explain the origin of the Milky Way. The word ‘GALAXY’ derives from the Greek term for our own GALAXY, galaxias, or kyklos galaktikos, meaning ‘milky circle’ for its appearance in the sky. Actual proof of the Milky Way which consists of many stars came in 1610 when Galileo Galilei used a telescope to study the Milky Way, and discovered that it was composed of a huge number of faint stars (O’Conner and Robertson, 2002). The stars in our GALAXY appear to twinkle when viewed from the earth. However, this is just an illusion created by the thick layers of the Earth’s turbulent atmosphere. Finkbeiner (1991) talks in her article ‘Untwinkling the Stars’ about an erupting star called Eta Carinae, which as she emphasizes ‘is violence itself, a brilliant core with puffballs on either side and a jet of material shooting out of the top, surrounded by visible shock waves. By the time the light reaches our best ground-based telescopes the star looks far less interesting than it really is’.
We would, therefore, like to draw a connection between the real GALAXY and our entrepreneurship GALAXY model. Just like the star Eta Caterinae, the stars (i.e. the characteristic dimensions) of our GALAXY model which affect the overall performance of the immigrant entrepreneurs can be perceived in a biased way, with important aspects being ignored or disregarded. In order to ‘untwinkle the stars’, or, in other words, to get a real picture of immigrant entrepreneurship, we have used a survey carried out among ethnic entrepreneurs in the Netherlands. By means of this survey we aim to put forward a more objective perspective concerning those factors that have an impact on the self-employment performance of immigrants.
In the GALAXY model, several overarching factors are identified that may affect the entrepreneurial business performance. These factors include: motivational factors, socio-economic contextual factors, policy factors and business environment. Some of these factors cover a number of different areas that affect the performance conditions. The focus of the
274
motivational factor is especially on the individual entrepreneur, and it refers to: (1) bounded rationality; (2) entrepreneurial animal spirit; and (3) social networks. Secondly, the socio-economic contextual factor refers to: (1) business culture; (2) access to new markets; and (3) operational characteristics, thus its focus is on the enterprise. The factor business environment refers to: (1) business networks; (2) business markets; and (3) locational conditions, its focus is on the micro-environment. Finally, the policy factor refers to: (1) financial incentives; (2) regulatory systems; and (3) institutional systems, therefore its focus is on macro-environment.
The current study uses the OECD/EUROSTAT’s Entrepreneurship Indicators Framework to investigate entrepreneurial performance in order to contribute to the creation of the GALAXY model. The GALAXY Model is broadly composed, and proposes a systematic treatment of evident and less evident factors. It links up the process factors, and comprises a number of factors that affect the entrepreneurial business performance of the individual entrepreneur. The entrepreneurial infrastructure concept of the GALAXY model covers the selection and creation of factors that influence entrepreneurial performance. The GALAXY model focuses on several areas which are the key to entrepreneurial performance: entrepreneurs, business environment, entrepreneurial culture, knowledge and skills, capital, innovation, and public regulation. All these factors affect entrepreneurs’ skills and their possibility to achieve success. The development of the GALAXY model is a formidable challenge. To identify the most significant factors in the GALAXY model which affect the performance in the entrepreneurial process, extensive efforts have been made. Obviously, the list of factors is not conclusive. New knowledge and new data might make it possible to incorporate new areas to change the structure of the existing framework.
4. THEORETICAL FRAMEWORK: THE MAIN STRUCTURE OF THE GALAXY MODEL
The structure of our GALAXY model ranges from factors on the individual level to factors on the macro-level that altogether contribute to the entrepreneurial opportunity of the migrants and, consequently, the effectiveness of their enterprises. This section aims to provide a thorough theoretical insight into all these factors that shape our GALAXY model, assuming that they have a great impact on the overall performance of the migrant entrepreneurs. GALAXY focuses both on general factors and migrant-specific factors. The model was intended to measure the business performance of migrant entrepreneurs in different sectors, however, as we are interested in the high-tech sector, we approach the migrant entrepreneurs in this sector.
275
4.1. Motivational factors Prior research offers a wide range of motivational factors which have a major impact on the entrepreneurial process. With respect to the main focus of this paper, we have considered three sub-categories for the motivational factor, namely: entrepreneurial animal spirit; bounded rationality; and social networks.
The entrepreneurial animal spirit is perhaps at the core of the self-employment process; it could manifest itself through such characteristics as: need for achievement; risk-taking propensity; tolerance for ambiguity; locus of control; desire for independence, drive (ambition, goals, energy and stigma, persistence); and egotistic passion. According to Shane et al. (2003), the need for achievement is a basic motivation that pushes one to engage in activities or tasks that have a high degree of individual responsibility for outcomes, require individual skill and effort, have a moderate degree of risk, and include clear feedback on performance. The risk-taking propensity implies that the entrepreneur is usually ready to bear uncertainty with respect to financial well-being, psychic well-being, career security, and family relations. Tolerance for ambiguity is another motivational trait representative for entrepreneurs, because the challenges and potential for success associated with business start-ups are by nature unpredictable (Schere, 1982). The locus of control is also an important trait that represents the extent to which individuals believe that their actions or personal characteristics affect the outcomes (Shane et al., 2003).
Furthermore, other traits, as Shane et al. (2003) suggest, could be the self-efficacy and the goal setting features of an entrepreneur. Firstly, self-efficacy represents ‘one’s ability to muster and implement the necessary personal resources, skills, and competencies to attain a certain level of achievement on a given task’. An individual with high self-efficacy for a given task will employ more effort for a greater length of time, persist through set-backs, set and accept higher goals, and develop better plans and strategies for the task. In addition, an individual with high self-efficacy will be more tolerant to negative feedback, and will treat it in a more positive manner and eventually use the feedback to improve his/her performance. Another specific motivation is the goal-setting trait. Previous research has shown that there is a significant connection between the goals set by the entrepreneurs and the corresponding outcomes.
Shane et al. (2003) suggest that some (or all of the) traits that form the entrepreneurial animal spirit influence the transition of individuals from one stage of the entrepreneurial process to another. However, these characteristics are not the only things that influence these transitions; they should be supplemented by cognitive factors; i.e. bounded rationality. The bounded rationality will comprise the knowledge, skills and abilities of the entrepreneurs. First, the entrepreneurs need to have some knowledge, especially of the industry and of any relevant technology that is critical to success. They could also hire people with the specific skills that they themselves lack. However, the entrepreneurs must possess enough expertise so as to know that they are undertaking the right actions. Secondly, the entrepreneur must have certain skills. The essential skills will depend on specific circumstances, thus they might include, for instance: expertise in leadership, planning, decision making, problem solving, team building,
276
communication and conflict management, selling, and bargaining. Third, the entrepreneur needs to have the requisite abilities, including intelligence. Subsequently, all the factors mentioned above enable the entrepreneurs to develop a viable vision (ibid.). As has been argued, entrepreneurial activity will only take place when there are people with the skills and the knowledge to initiate it. A large part of being a successful entrepreneur is having the training and know-how to accomplish the venture.
A third subcategory of the motivational factor in the GALAXY model is represented by the social networks that could serve as a strong determinant for the migrants to become self-employed. The development of entrepreneurs’ networking has attracted increasing attention in studies of (migrant) entrepreneurship, and network theories are being increasingly applied to entrepreneurship research (Low and MacMillan, 1980). Within the entrepreneurship literature, the term ‘network’ has been used to describe the notion of entrepreneurial networks with reference to industrial districts (e.g. Saxenian, 1990), support structures (e.g. Chaston, 1995), and the personal contacts of entrepreneurs (e.g. Birley, 1985; Aldrich and Zimmer, 1986). The social network has a wider cultural dimension. Culturally-induced values, attitudes and behaviour are of prime importance in explaining the nature of relationships. Research has highlighted the importance of social networks and networking as an entrepreneurial tool for contributing to the establishment, development and growth of SMEs. The social networks of entrepreneurs play a number of important roles: (i) they generate social support for the actions of the entrepreneurs; (ii) they help extend the strategic competence of the entrepreneur in response to opportunities and threats; and (iii) they supplement resources to entrepreneurs who often have very limited resources (Johannisson and Peterson, 1984). The networks are also very important for the innovation process of businesses. Furthermore, entrepreneurial networks can be categorized into two types derived from different sources: informal and formal networks (Birley, 1985; Littunen, 2000). Informal entrepreneurial networks consist of personal relationships, families, and business contacts. Formal networks consist of venture capitalists, banks, accountants, creditors, lawyers, trade associations, licensing agreements, and supply-chain linkages with either suppliers or users (Carter and Jones-Evans, 2006; Das and Teng, 1997). A key distinction between informal and formal network relationships is based on the role of trust (Birley, 1985). Researchers suggest that social networks assist small firms in their acquisition of information and advice, in their development of innovative products, and in their ability to compete (Birley, 1985; Rothwell, 1991; Brown and Butler, 1995; Carson et al., 1995; Conway, 1997; Shaw, 1997; Freel, 2000). The studies of entrepreneurial and small-firm networks generally highlight the importance of family and friends, particularly during the early phase of entrepreneurial activity. An entrepreneur acts in interaction with the environment, and, when personal networks decrease or increase markedly, it is possible that such changes may also influence the motives, values, attitudes or personal characteristics of an entrepreneur (Littunen, 2000). Moreover, the family is an important financial and human resource for a migrant entrepreneur as a source for unpaid or underpaid employees. The utilization of family
277
resources makes businesses more successful, and is also associated with long-term growth (Butler, 1991; Upton and Heck, 1997).
More specifically, of great interest for our study is the socio-cultural network (the co-ethnic group) of immigrants that plays an important role in shaping an incubation potential for ethnic business. In the literature, the main themes concerning the ethnic social networks are: the relationship with clients, and the labour situation and financial arrangements. Furthermore, in the context of kinship relationships and social bonds it seems plausible that there are special connections between ethnic minority business firms and their co-ethnic customers. Dyer and Ross (2000) observed ambivalent signals of business owners in their relationships with co-ethnic clients. However, they also found that intra-cluster ethnic loyalty and highly intensive communication behaviour within the ethnic community gave potential competitive advantage for ethnic firms. Socio-cultural bonds appear to create a more than average loyalty between the ethnic firm and its clients. Ethnic culture seems to create specific customer relationships.
An important element of the network relationships with co-ethnic groups is formed by the input variables, labour and finance. Van Delft et al. (2000) argue that social networks comprise one of the critical ethnic-related attributes and structures that may give a potential comparative advantage in the undertaking of a new economic activity. These social networks are multifaceted: they provide flexible and efficient possibilities for the recruitment of personnel and the acquisition of capital. In general, ethnic businesses rely heavily on labour from the co-ethnic group in general, and the family more specifically. Capital can be more easily borrowed in an informal way. In addition, within the network of ethnic people, certain individuals are used as an informal way of doing business and exchanging information, because there is mutual trust within the network. The use of networks can also form the major bridge into mainstream business development. Through their networks of relatives, co-nationals, or co- ethnics, new firms have privileged and flexible access to information, capital, and labour (Kloosterman et al., 1999). Hence, it can be argued that the entrepreneurial action undertaken by migrants is a result of the combination or integration of entrepreneurial animal spirit, bounded rationality, and social networks. 4.2. Socio-economic contextual factors A second cluster of factors concerns the socio-economic context and is on the enterprise level. The main factors in this category are: business culture, access to new markets, and operational characteristics. Skills and business culture play a central role in the development of the migrant enterprise, and also impinge on its overall performance and, accordingly, its probability to succeed. Prior to understanding the business culture of the migrant entrepreneurs, there is a need to look at their culture as a whole, since it has an incremental impact on the management style and practices adopted by each entrepreneur. Thus, we consider it appropriate to elaborate more on the latter concept. Culture affects all parts of the model. Culture influences an entrepreneur’s behaviour, attitudes, and overall effectiveness. It comprises each individual’s assumptions, adoptions, perceptions and learning (Ahmad and Hoffmann, 2008). The culture of

278
a society is a major force defining the thoughts and activities of its people. The role that cultural forces play with respect to entrepreneurial activities is powerful and deeply rooted in personal life. Social and cultural values, along with social, economic, and political institutions, legitimatize and encourage the pursuit of entrepreneurial opportunity (Reynolds et al., p. 29). In general, when the motivation to be entrepreneurial is high, start-up rates are also high. Entrepreneurs are known for their ability to turn limited resources into successful business ventures. ‘Culture’ is a notoriously difficult term to define. In 2002 the United Nations Economic, Social and Cultural Organization (UNESCO) described culture as follows: “Culture should be regarded as the set of distinctive spiritual, material, intellectual and emotional features of society or a social group, and that encompasses, in addition to art and literature, lifestyles, ways of living together, value systems, traditions and beliefs”. According to Kroeber et al. (1952), culture consists of patterns, explicit and implicit, and of behaviour acquired and transmitted by symbols, constituting the distinctive achievements of human groups, including their embodiment in artifacts; the essential core of culture consists of traditional ideas, and especially their attached values. According to Schwartz (1992), culture consists of the derivatives of experience, more or less organized, learned or created by the individuals of a population, including those images or encodements and their interpretations (meanings) transmitted from past generations, from contemporaries, or formed by individuals themselves. Hofstede (1994) described culture as the collective programming of the mind which distinguishes the members of one group or category of people from another.
Culture is shared by a group or a society and helps to interpret situations in everyday life. Culture is not genetic, but learned. Especially with next-generation foreigners, who live in another country than the original country of their parents, it can be seen that they tend towards the culture of the host country instead of the culture in which their parents were brought up. Thus, although people from a group share the same culture, the behaviour that results depends on the individual personality.
There is a changing and often contradictory relationship between migration, the increasing cultural diversity that follows migration, and the development of global cities as desirable places. Of special interest then are the small and medium-sized enterprises (SMEs), which are often owned by migrants. They work particularly in the retail and service sector. Immigrants have established many of the groceries, bakeries, butchers, restaurants and other businesses, and certainly most of the ones seen as exotic and exciting (Vertovec and Wessendorf, 2004). The businesses are operated mainly by migrant bosses, personnel, chefs, cooks, and waiters. Many European cities contain a mosaic of distinct ethno-cultural neighbourhoods, a rich variety of migrant businesses, and a wide range of cultural events (Vertovec and Wessendorf, 2004). The cosmopolitan landscapes of these cities allow citizens and visitors to experience the diversity of global cultures, all located close to each other. There are many different cities in which one can easily move between places that reflect the influence of different cultures—all in a single day.
279
Furthermore, as economic performance in general largely depends on transaction costs, it mainly reflects the level of trust in the economy, and the level of trust in turn depends on the culture (Casson, 1994). Therefore, the business culture of the ethnic entrepreneurs is often represented by a strong tie with members of the same ethnicity community, which has a strong moral content. The morality of certain minority groups, as Casson (1994) finds, can transcend the formal procedures, and thus reduce the transaction costs and time, and consequently increases the performance of entrepreneurs. It is also most likely that the migrants will prefer to adopt the business culture of their country of origin than that of the host country. The concepts of the host business system that are unfamiliar to them are often dismissed and considered irrelevant. Furthermore, the migrant entrepreneurs also have in most of the cases a distinct leadership style, characteristic of their own culture. For instance, frequently migrant entrepreneurs have a very authoritarian leadership style. Moreover, in some cases, they might be even gender discriminatory, and it is also common for them to underpay their employees or to expect them to work long hours.
The second factor in the socio-economic context of the migrant enterprise is the access to new markets. Access to new markets is dependent on several conditions. As Kloosterman and Rath (2001) find, first of all there need to be opportunities on the demand side in order to run a business in an economically sound way. Secondly, these opportunities have to be accessible for the migrant entrepreneurs, since, for instance, the rules and regulations in some countries may directly or indirectly block the access of migrants to business markets. And lastly, these opportunities have to be seized and inferred by the potential entrepreneurs (ibid.).
Moreover, when referring to the access of migrant entrepreneurs to certain markets, the concept ‘break-out strategy’ is of major significance. Finkelstein et al. (2007) define break-out strategy as ‘an action oriented framework for delivering accelerated growth and it is founded on the concept of strategic excellence from beginning to end’. In the field of migrant entrepreneurship, the ‘break-out’ strategy is defined by Baycan-Levent et al. (2009) as a strategy to escape from the circumstances where the migrant entrepreneurs’ own ethnic groups dominate the factors of production and the customers. Ram and Hillin (1994) find that the ethnic minority firms in most of the cases rely on their own community support, and the growth of such firms could be achieved by tapping into wider ‘majority’ markets. Therefore, the potential for growth is limited in such firms, which mainly serve the ethnic market, owing the small size of the market and the insufficient buying power of the ethnic population.
Baycan-Levent et al. (2009) distinguish between internal and external orientation. The authors claim that an internal orientation is characteristic for entrepreneurs who produce for their own ethnic niches, while an external orientation means that the entrepreneur serves a wider market (ibid.). There is a trade-off between these two types of orientation, since, on the one hand, the internal orientation might never lead to market expansion and, on the other hand, the external orientation requires more skills, diversified communication channels and better access to government policy support measures. In some cases, breaking-out from ethnic dependency could be nearly impossible due to the specific ties between the entrepreneurs and
280
their ethnic niches. Under such circumstances, the migrant entrepreneurs could be restrained from expanding the range of their products and services in an attempt to widen their group of customers, and go beyond their own ethnic group (ibid.). The authors (Baycan-Levent et al., 2009) also argue about the opportunities inside and outside the ethnic border. A forte of the internal orientation could be customer loyalty and also the social network based on trust. However, these advantages undermine, at the same time, the opportunities for expansion of the ethnic enterprise. Lately, we have observed an external orientation of the second-generation entrepreneurs, which is directly linked to their increased educational attainment and greater experience with non-ethnic situations.
The third subcategory in the socio-economic context factors addresses the operational characteristics of the migrant enterprise. Migrant businesses show a different pattern than the native self-employment, the main difference consisting of the predominance of informal networks, which allow the migrants to trade with one another, and to have easier access to a pool of cheap labour.
Waldinger (1986) identifies three main characteristics of migrant businesses: (i) Low economies of scale. Economies of scale occur when the fixed cost of an operation can be
spread over a larger number of units, and as a result decrease the average cost. And, it often happens in the ethnic businesses that the entrepreneur is very likely to be his/her own boss, as for instance in the taxi business. Therefore, the limited resources available to migrant entrepreneurs can hinder them from taking advantage of economies of scale. (ii) Instability and uncertainty. The migrant enterprises can be characterized by unstable demand. Therefore, according to Waldinger (1986), if product requirements change frequently, the learning curve of employees is low because there is limited time for them to acquire specialized proficiencies. Hence, in such cases versatility is preferred to specialization, and smaller companies gain advantage over large ones. (iii) Small or differentiated markets. Ethnic consumer tastes might serve as a determinant of a protected market position due to a cultural preference of the ethnic community to deal with co-ethnics, or partly because of the costs (of the natives) to learn the specific tastes and needs of the ethnic minorities.
The migrant enterprises are generally known to employ people with lower skills; therefore they will avoid training costs. A common practice for migrant entrepreneurs is to recruit through ‘word of mouth” methods, thereby recruiting acquaintances of their friends and relatives. Another feature of ethnic enterprises is to provide only short or sometimes uncertain work contracts, owing to seasonal or cyclical factors (Waldinger, 1986).
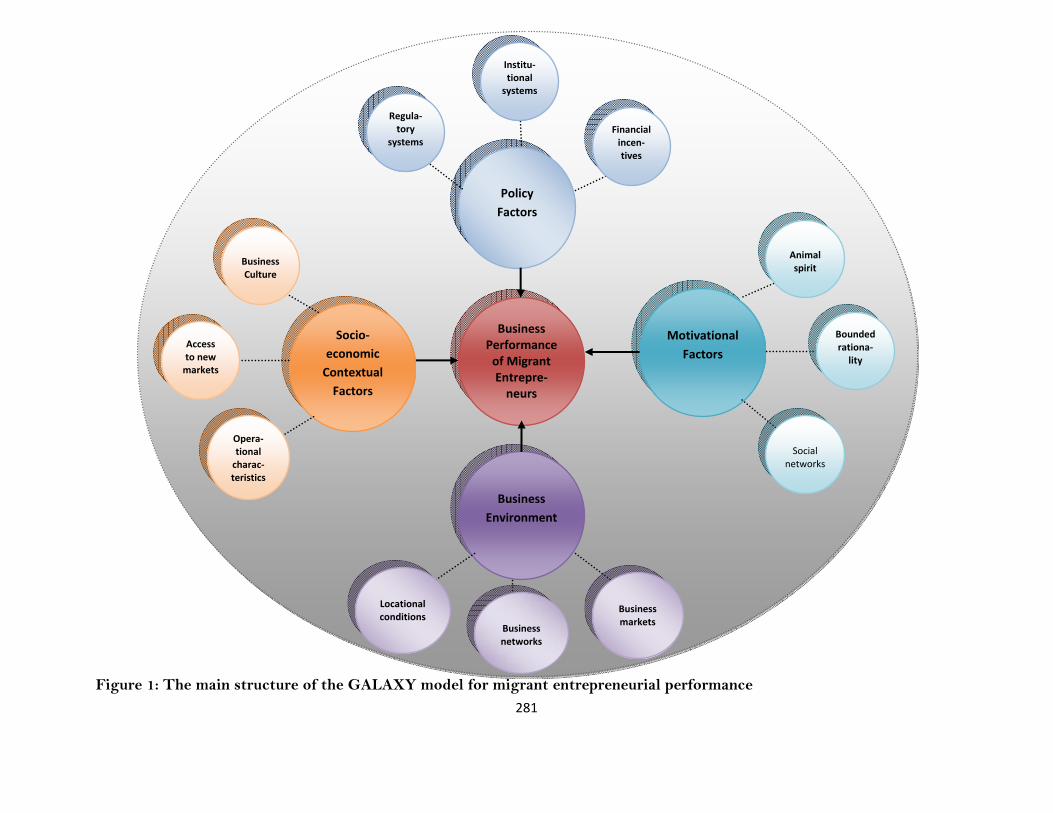
281
Figure 1: The main structure of the GALAXY model for migrant entrepreneurial performance
Socio‐
economic
Contextual
Factors
Regula‐tory
systems
Motivational
Factors
Policy
Factors
Business
Environment
Business Performance of Migrant Entrepre‐neurs
Institu‐tional systems
Financial incen‐tives
Animal spirit
Bounded rationa‐lity
Social networks
Business markets
Locational conditions
Business networks
Opera‐tional charac‐teristics
Business Culture
Access to new markets
282
4.3. Business environment In the business (micro-) environment category we have included the following factors: the locational conditions, the business markets and the business networks. The chance of economic success, and thereby the continuation of the establishment in question, depends to a high degree on the local conditions. When choosing a location for an establishment, whether it is to be founded there or moved there, knowledge about the location conditions at the relevant sites is important for the entrepreneur in question. In practice, when selecting and comparing eligible locations, entrepreneurs tend to follow their locational preferences. These are based on knowledge they have acquired about local conditions, yet they also contain subjective elements in addition to the objective ones.
The decision on facility location is a whole process which comprises the identification, analysis, evaluation and selection among alternative steps (Yang and Lee, 1997). The choice of location has significant strategic implications for firms, since this decision will in most of the cases ‘involve long-term commitment and will be irreversible in nature’ (ibid.). Currently, some SME’s which have previously occupied a rather disadvantageous position have now become attractive to many businesses as new facility locations. This has happened as result of the constantly diminishing traditional distance barrier in location selection as a result of advances in communication technologies and new means of transportation. Furthermore, the facility location decision will also depend on the requirements of different industries. For instance, the firms in the service sector will use their facility location as a competitive advantage, while the manufacturing firms will choose to locate their plant in areas that will eventually reduce their transportation costs.
The decision where to locate an enterprise has a direct impact on the venture’s odds of survival. The physical and social environments significantly influence the offered product and the outcome. Other environmental factors that contribute to the location of the business are: the number of other enterprises in the same geographic region and the variety of activities offered, the level of infrastructure development, accessibility to the site and shopping, accessibility to highways, proximity to an airport, etc. (Reichel et al., 1998).
The business markets revolve around three main actors who can have a tremendous impact on the overall business performance of the migrant enterprise. These actors are: the competitors, the suppliers and the customers. Porter (1979) has identified five major factors that shape competition. These factors are: the threat of entry; the power of suppliers; the power of buyers; the threat of substitutes; and the rivalry among existing competitors. The threat of entry is concerned with the possibility for new entrants to an industry to bring new capacity and a desire to gain market share that puts pressure on prices, costs, and the rate of investment necessary to compete. In this case, entry barriers could help the incumbents protect themselves against new entrants. Another potential threat could be the case when powerful suppliers tend to capture more of the value for themselves by charging higher prices, limiting quality or services, or shifting costs to industry participants.
283
Powerful suppliers, including suppliers of labour, can squeeze profitability out of an industry that is unable to pass on cost increases in its own prices. Powerful customers—the flip side of powerful suppliers—can capture more value by forcing down prices, demanding better quality or more service (therefore driving up costs), and generally playing industry participants off against one another, all at the expense of industry profitability. Buyers are powerful if they have negotiating leverage relative to industry participants, especially if they are price sensitive, using their clout primarily to pressure price reductions. Yet, another threat could be the substitutes which are always present, but they are easy to overlook because they may appear to be very different from the industry’s product. When the threat of substitutes is high, industry profitability suffers. Substitute products or services limit an industry’s profit potential by placing a ceiling on prices. If an industry does not distance itself from substitutes through product performance, marketing, or other means, it will suffer in terms of profitability and often growth potential. The rivalry among competitors could also have a negative impact on the profitability of an industry. It can take many familiar forms, including price discounting, new product introductions, advertising campaigns, and service improvements. The degree to which rivalry drives down an industry’s profit potential depends, first, on the intensity with which companies compete and, second, on the basis on which they compete
Lastly, among the business environment factors we have included the business networks. Business networks are the formal networks which encompass the following actors: venture capitalists, banks, accountants, creditors, lawyers, trade associations, licensing agreements, and supply-chain linkages with either suppliers or users (Carter and Jones-Evans, 2006; Das and Teng, 1997). According to Marlow (1992), migrant entrepreneurs do not appear to be benefiting from, or even using, formal networks, which is an important obstacle to business formation and growth. Migrant entrepreneurs generally have fewer opportunities to develop relevant experience, have fewer contacts, and have greater difficulty in assembling information resources in a majority-dominated environment (Brush, 1992; Carter and Rose, 1998).
4.4. Policy factors The policy factors that we found to be most relevant to the purpose of this paper are the institutional systems, the regulatory systems and the financial incentives. According to Scott (1987), the main functions of the institutional systems are to legitimize and to govern the collective action. The ultimate authorities governing and legitimizing collective action are the rules and norms of the society in which organizations function (ibid.). Kloosterman and Rath (2001) emphasize the crucial role of the institutions at national and also at regional/urban level. These institutions can draw the trajectories of self-employment of both the indigenous and the migrant population. National institutions can, for instance, decide what is marketable and what is decommodified. It is also known that institutional arrangements can both facilitate or inhibit the emergence of new industries and technologies. Furthermore,
284
a more tolerant antitrust policy permitting joint venture research among competitors could enhance the diffusion of innovation. These institutional arrangements are frequently highly imperfect; nevertheless, they have a tremendous impact on industry and new technology development (Van de Ven, 1993).
The regulatory system includes all taxes, regulations and other public rules and institutions that affect entrepreneurship. The regulatory framework comprises administrative burdens for entry, administrative burdens for growth, bankruptcy regulations, safety, health and environmental regulations (OECD/STATE PAPER). The latter are affected by many different policy areas. Policy areas are, typically, not well-defined concepts since they usually reflect a simple collection of policy instruments with similar objectives. The number of policy areas that affect entrepreneurial activity is exhaustive. The number of factors is thought to be exhaustive but not final. The emergence of new indicators may allow for a more detailed analysis.
An interesting study of Djakov et al. (2002) provides us with information on the regulation of entry for start-up companies in 85 countries. There are numerous procedures an entrepreneur needs to carry out in order to legally begin to operate a company involved in industrial or commercial activity. The range of procedures encompasses: screening procedures, tax-related requirements, labour/social security-related requirements, safety and health requirements, environment-related controls.
The financial incentives are tools that could be introduced by the government locally or nationally. These incentives can serve as means to confer attractiveness to specific locations where they are being introduced. Dubini (1988) distinguishes between two types of incentives that could be provided by the government to the entrepreneurs: cost reduction and cash support. Firstly, the cash-support variables encompass the funds diverted to the development of certain products and services. Furthermore, they could also serve as means for attracting external entrepreneurs into a particular territory, this way speeding up the diffusion of entrepreneurship within a local economy. Secondly, the cash-support factor comprises the following variables: regional income, unemployment support, unemployment lump-sum support, tax abatements, export assistance and guaranteed loans. According to Dubini (1988), the factors mentioned previously are not direct investments for starting a business, they could rather be considered as funds that could eventually be used for starting-up a business. Furthermore, Dubini (1988) mentioned in her paper some important implications for the design of public policy in relation to the financial incentives for start-ups. She argues that the design of public policy aimed at fostering new ventures creation should be to “assist” a new entrepreneur by creating a supportive environment, rather than merely provide financial support. Furthermore, although the government can play a key role in promoting the diffusion of entrepreneurship, public policies have to be adapted to local requirements in order to be effective. The author also claims that in the case where blanket policies are applied to a wide geographic area, these prove to be rather
285
ineffective and also result in a waste of resources. Therefore, local initiatives are more appropriate, at the same time paying close attention to the characteristics of the environment, so as to adapt incentives to the needs of specific local entrepreneurs.
SMEs use different types of finance compared with large firms. The proportion of equity invested in small firms tends to be less, and there is more reliance on bank lending. The main sources of the types of finance employed by SME’s are: (i) banks; (ii) leasing; (iii) equity; (iv) venture capital; (v) informal venture capital; and (vi) factoring. According to Rath (2000), the native entrepreneurs in most of the cases acquire their start-up capital from banks, while the ethnic entrepreneurs have fewer chances to receive bank loans; therefore they have to turn to their informal networks for capital.
4.5. Business performance Business performance is an essential concept in any study on entrepreneurship and entrepreneurial behaviour. The business performance of SMEs has been a source of an important policy and academic debate. Accurate and appropriate measurement of performance is critical in the entrepreneurship literature (Murphy et al., 1996). The lack of suitable means of measuring performance is a serious obstacle for the development of theory, and this makes it difficult to develop useful guidelines for entrepreneurs. Entrepreneurs are judged on the basis of the performance of their businesses. Good performance influences the continuation of the business. According to Carter and Jones-Evans (2006), the performance of SMEs refers to their ability to contribute to employment and wealth creation through business start-up, survival and growth. It is necessary to specify how exactly the business performance will be measured. Murphy et al. (1996) investigated the entrepreneurship literature and evaluated the dimensions and measures of performance used. They examined 51 published entrepreneurship studies using performance as the dependent variable, and observed a total of 71 different measures of performance. Little consistency in performance measurement across studies was found; rather, a wide diversity of measures are relied upon. According to Brush and Vanderwerf (1992) and Murphy et al. (1996), the use of the term “performance” by researchers includes many constructs that measure alternative dimensions of performance. However, efficiency, growth, and profit were the most commonly considered dimensions. Other dimensions were: size, liquidity, success/failure, market share, and leverage.
Performance may be measured by either subjective or objective criteria. Arguments for subjective measures include difficulties in collecting quantitative performance data from the entrepreneurs and in the reliability of such data arising from differences in the accounting methods used by entrepreneurs (Kotey and Meredith, 1997). Subjective measures of performance are based on the owner’s perception, so they increase the possibility of measurement error and the potential for bias (Delaney and Huselid, 1996). Objective performance measures include indicators such as profit growth, cash flow, earnings, net earnings per euro of assets

286
employed, capital productivity, capital output ratio, rate of return on investment, turnover, expenditure/revenue ratio growth, total assets and employment (Kent et al., 1982). Profit is a commonly used objective measure of performance, as it is seen as an overriding business goal (Thomas and Evanson, 1987). Both absolute and relative profit values are used (Thomas and Evanson, 1987), although often relative measures of profit are preferred, because they take account of the scale of business (Kent et al., 1982). Performance is also measured in terms of growth. Examples of growth measures include changes in profit and sales. Growth − or the lack of it − provides an indication of the improvement or impairment of financial performance (Kent et al., 1994).
Postma and Zwart (2001) have argued that, in order to measure the multidimensional performance construct, both objective and subjective measures should be included in the measurement instrument. The correct performance measures might be influenced by the size of the business and the ambition of the entrepreneur. Venkatraman and Ramanujam (1987) have pointed out that firm performance is a multidimensional construct. They proposed the following proxies for firm and business performance: (i) financial performance refers to return on assets (ROA), return on sales (ROS), and return on equity (ROE); (ii) business performance measures market-related items such as market share, growth, diversification, and product development; (iii) organizational effectiveness measures refer to employee satisfaction, quality and social responsibility. According to Madsen (1987) and Matthyssens and Pauwels (1996), all measures of overall business performance can be grouped into distinct well-defined performance categories, representing financial, non-financial, and composite scales, as follows: (i) the “sales” category includes measures of the absolute volume of sales, export sales, or the export intensity; (ii) the “profit” category consists of absolute measures of overall export profitability and relative measures such as export profit divided by total profit or by domestic market profit; (iii) the “growth” measures refer to changes in export sales or profit over a period of time (whereas the “sales” and “profit” measures are static); (iv) the “success” category comprises measures such as the managers’ belief that exports contribute to a firm’s overall profitability and reputation (see, e.g., Raven et al., 1994); (v) the “satisfaction” indicators refer to the managers’ overall contentment with the company’s export performance (e.g. Evangelista, 1994); (vi) the “goal achievement” measures refer to the managers’ assessment of performance compared with objectives (e.g. Katsikeas et al., 1996); and, finally, (vii) “composite scales” refer to measures that are based on overall scores of a variety of performance measures. To evaluate business performance, Shoobridge (2006) proposes the use of universal “financial indicators” such as: profits per employee, return on total assets, return on shareholders’ funds, return on capital employed, profit margin percentage, interest cover, liquidity ratio, and solvency ratio.
The businesses of migrants are perceived as smaller and less likely to grow (Butler and Greene, 1997). There are two explanations for this: (i) migrant

287
entrepreneurs tend to enter fragmented business sectors defined by low barriers to entry, intense competition, low profit margins, and low liquidity, which are all survival mechanisms and therefore not initially designed for significant levels of growth; (ii) migrant businesses, especially those existing in an ethnic enclave, are perceived as serving largely a co-ethnic community, and are therefore potentially bounded by a niche-market demand. Other influential authors who link ethnic minorities to business performance are Hartenian and Gudmundson (2000); they linked cultural diversity in small business, in terms of the firm’s overall number of ethnically diverse employees, with the firm’s performance. They also focused on the business and managerial characteristics and their impact on the firm’s level of workforce diversity. They concluded that firms that had a more diverse workforce reported a higher level of business performance.
5. PROFILE OF MIGRANT ENTREPRENEURS IN THE HIGH-TECH SECTOR IN THE NETHERLANDS Our study seeks to create a profile of migrant entrepreneurs originating from three main ethnic groups in four large cities in the Netherlands. We have restricted our search to those migrant entrepreneurs who are active in the high-tech sector. We will present here the results of our exploratory study undertaken in the year 2010 in the four big cities in the Netherlands (Amsterdam, Rotterdam, The Hague and Utrecht). The total sample of our study includes approx. 50 migrant entrepreneurs of different ethnic origins, who are predominantly Turkish, and also Moroccan and Surinamese. The willingness to participate is generally low, therefore we used various channels, databases and personal contacts to find and approach the ethnic entrepreneurs etc. Our research used an online survey comprising 36 questions, which was sent to the e-mail addresses of the selected entrepreneurs. The research questionnaire included open-ended and closed questions in order to collect the necessary information. Apart from questions which aimed to disclose the personal characteristics of the entrepreneurs (e.g., ethnic origin, age, gender, education level), questions linked to our GALAXY model were also included in the survey. However, in this paper we present only the results of the former type of questions1.
From Figure 2 we can observe that most of our respondents were in the age group 41-50 (38 per cent). The age group 21-30 is 8 per cent lower (30 per cent), followed by the age group 31-40 (26 per cent). The age group older than 50 (6 per cent) has the lowest score.
1 The questionnaire used in this research is available upon request from the corresponding author
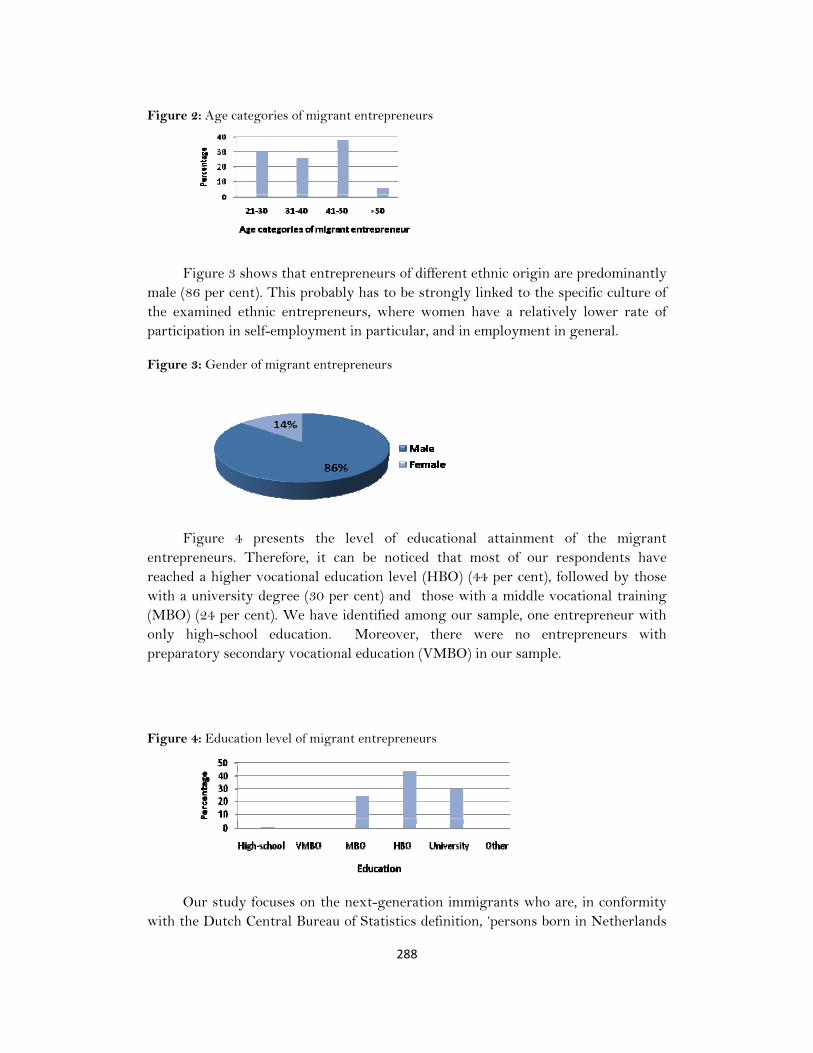
288
Figure 2: Age categories of migrant entrepreneurs
Figure 3 shows that entrepreneurs of different ethnic origin are predominantly male (86 per cent). This probably has to be strongly linked to the specific culture of the examined ethnic entrepreneurs, where women have a relatively lower rate of participation in self-employment in particular, and in employment in general.
Figure 3: Gender of migrant entrepreneurs
Figure 4 presents the level of educational attainment of the migrant
entrepreneurs. Therefore, it can be noticed that most of our respondents have reached a higher vocational education level (HBO) (44 per cent), followed by those with a university degree (30 per cent) and those with a middle vocational training (MBO) (24 per cent). We have identified among our sample, one entrepreneur with only high-school education. Moreover, there were no entrepreneurs with preparatory secondary vocational education (VMBO) in our sample.
Figure 4: Education level of migrant entrepreneurs
Our study focuses on the next-generation immigrants who are, in conformity
with the Dutch Central Bureau of Statistics definition, ‘persons born in Netherlands

289
from at least one parent who was born abroad’. Masurel and Nijkamp (2004) extend the time limit, and thus consider the next-generation immigrants to be those persons who arrived to Netherlands before the age of 12, which is the border between primary and secondary school. The development of these immigrants is largely connected to their educational attainment. While their parents might have experienced difficulties in the process of integration with the host country due to discrimination, or problems of transferability of their diplomas and statuses and difficulties in learning the host country language, the next-generation entrepreneurs can benefit from much more opportunities to set-up businesses. They are often more educated and skilled, which increases their chances to become employed or to deliberately become self-employed. The success and survival rate of their enterprises can be superior to that of their counterparts; this could also be a result of their external orientation, where the formal networks are used and there is an increased orientation towards non-traditional markets, while delivering mainstream products and services.
In order to see the share of both first and next-generation migrant entrepreneurs in the high-tech sector, we have looked at their age. Therefore, those who were less than 12 years old upon arrival to the Netherlands, and those who were born in the Netherlands have been automatically categorized as ‘next-generation migrants’.
Figure 5: Generation distribution of the migrant entrepreneurs in the high-tech sector
From Figure 5 we can observe the predominance of next-generation
entrepreneurs in the high-tech sector with a share of 72 per cent. Therefore, this confirms our assumptions about the higher involvement of next-generation entrepreneurs in this sector, which could possibly be due to their higher educational accomplishments and stronger resemblance to the indigenous population.
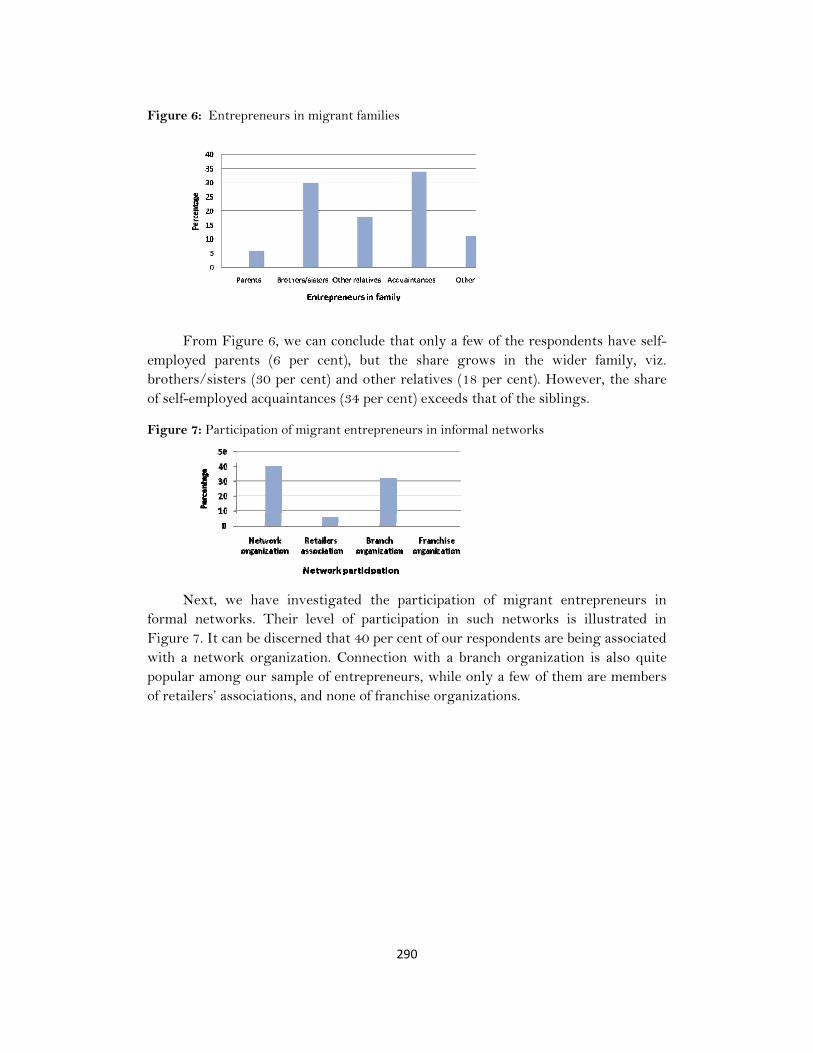
290
Figure 6: Entrepreneurs in migrant families
From Figure 6, we can conclude that only a few of the respondents have self-employed parents (6 per cent), but the share grows in the wider family, viz. brothers/sisters (30 per cent) and other relatives (18 per cent). However, the share of self-employed acquaintances (34 per cent) exceeds that of the siblings.
Figure 7: Participation of migrant entrepreneurs in informal networks
Next, we have investigated the participation of migrant entrepreneurs in
formal networks. Their level of participation in such networks is illustrated in Figure 7. It can be discerned that 40 per cent of our respondents are being associated with a network organization. Connection with a branch organization is also quite popular among our sample of entrepreneurs, while only a few of them are members of retailers’ associations, and none of franchise organizations.

291
Figure 8: Turnover of migrant entrepreneurs in the high-tech sector
In order to analyze the performance of migrant entrepreneurs in the high-tech sector, following the logic of our GALAXY model, we have looked at their turnover, profitability and assets. Figure 8 presents the level of turnover of migrant entrepreneurs in the high-tech sector. It shows that migrant entrepreneurs have predominantly a strongly increased or an increased turnover. 34 per cent of the migrant entrepreneurs have an increased turnover and 23 per cent a strongly increased turnover. Moreover, 20 per cent of the migrant entrepreneurs have more or less the same turnover rate. 12 per cent and 11 per cent of the migrant entrepreneurs have a decreased and strongly decreased turnover rate.
Figure 9: Profitability of migrant entrepreneurs in the high-tech sector
The profitability rate is illustrated in Figure 9. We can see that 34 per cent of the migrant entrepreneurs have an increase in profitability, and 21 per cent have a strongly increased profitability. 20 per cent of the migrant entrepreneurs have more or less the same profitability, while 10 and 14 per cent have a strongly decreased and descreased profitability.
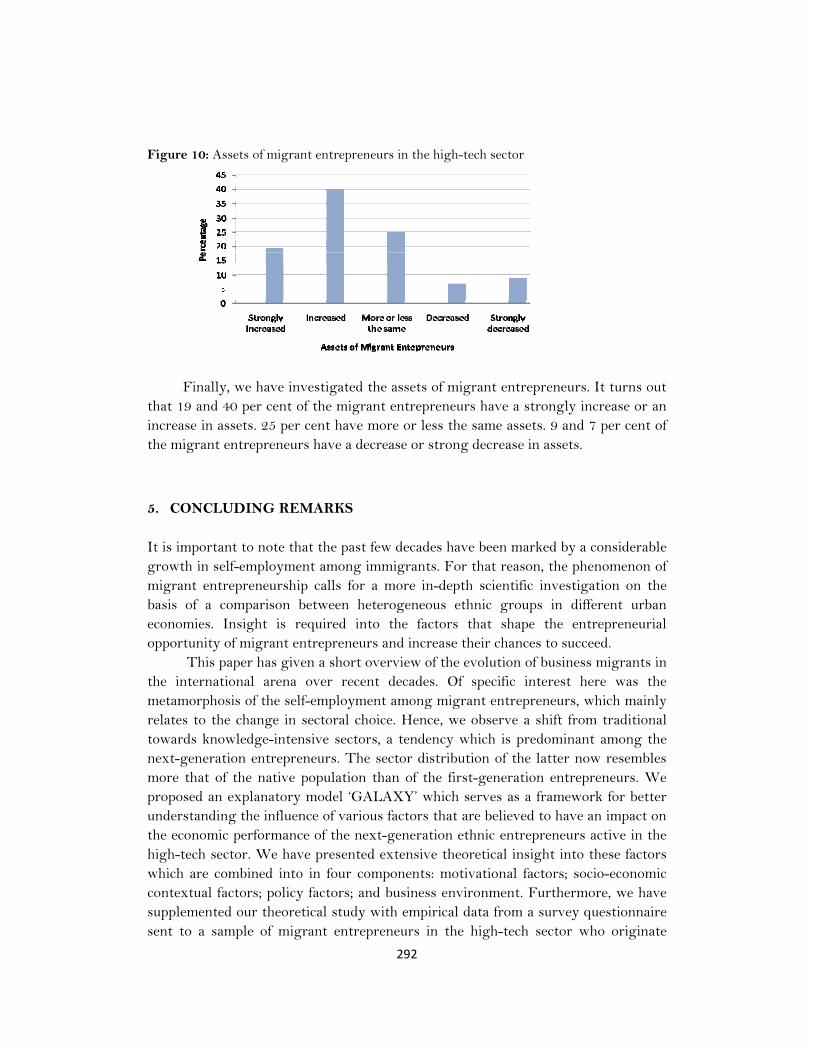
292
Figure 10: Assets of migrant entrepreneurs in the high-tech sector
Finally, we have investigated the assets of migrant entrepreneurs. It turns out that 19 and 40 per cent of the migrant entrepreneurs have a strongly increase or an increase in assets. 25 per cent have more or less the same assets. 9 and 7 per cent of the migrant entrepreneurs have a decrease or strong decrease in assets.
5. CONCLUDING REMARKS It is important to note that the past few decades have been marked by a considerable growth in self-employment among immigrants. For that reason, the phenomenon of migrant entrepreneurship calls for a more in-depth scientific investigation on the basis of a comparison between heterogeneous ethnic groups in different urban economies. Insight is required into the factors that shape the entrepreneurial opportunity of migrant entrepreneurs and increase their chances to succeed.
This paper has given a short overview of the evolution of business migrants in the international arena over recent decades. Of specific interest here was the metamorphosis of the self-employment among migrant entrepreneurs, which mainly relates to the change in sectoral choice. Hence, we observe a shift from traditional towards knowledge-intensive sectors, a tendency which is predominant among the next-generation entrepreneurs. The sector distribution of the latter now resembles more that of the native population than of the first-generation entrepreneurs. We proposed an explanatory model ‘GALAXY’ which serves as a framework for better understanding the influence of various factors that are believed to have an impact on the economic performance of the next-generation ethnic entrepreneurs active in the high-tech sector. We have presented extensive theoretical insight into these factors which are combined into in four components: motivational factors; socio-economic contextual factors; policy factors; and business environment. Furthermore, we have supplemented our theoretical study with empirical data from a survey questionnaire sent to a sample of migrant entrepreneurs in the high-tech sector who originate

293
from three main ethnic groups in four large cities in the Netherlands. This helped us create their profile; hence, the biggest share of our respondents is in the age range between 41 and 50, they are predominantly male, and in most of the cases they have a higher vocational education level. As expected, our data reveal the predominance of next-generation entrepreneurs in the high-tech sector. Also, they have relatively high participation rates in network and branch organizations. Further extension of our sample, especially to extend the coverage to other ethnic groups, is underway. This will enable us to analyse and compare the impact of the four most important groups of prominent factors (motivational factors; socio-economic contextual factors; policy factors; and business environment) on the overall economic performance of the next-generation migrant entrepreneurs in four large cities in Amsterdam. References Ahmad, N., and Hoffmann, A. N. (2008). “A framework for addressing and measuring
entrepreneurship”, OECD Statistics Working Paper, 2. Aldrich, H.E. and Zimmer, C. (1986). Entrepreneurship through Social Networks, in
Sexton, D.L. and Wilson, R.W. (eds), The Art and Science of Entrepreneurship, Mass: Ballinger, 154-167.
Banker, R.D., Charnes, A. and Cooper, W.W. (1984). “Some Models for Estimating Technical and Scale Inefficiencies in Data Envelopment Analysis”, Management Science, 30: 1078-1092.
Baycan-Levent, T. and Nijkamp, P. (2009). “Characteristics of Migrant Entrepreneurship in Europe”, Entrepreneurship and Regional Development, 27(4) 375-397.
Baycan-Levent, T., Nijkamp, P. and Sahin, M. (2009). “New Orientations in Ethnic Entrepreneurship: Motivation, Goals and Strategies of New Generation Ethnic Entrepreneurs”, International Journal of Foresight and Innovation Policy, 5: 83-111.
Birley, S. (1985). “The Role of Networks in the Entrepreneurial Process”, Journal of Business Venturing, 1: 107-117.
Brown, B. and Butler, J.E. (1995). “Competitors as Allies: A Study of the Entrepreneurial Networks in the US Wine Industry”, Journal of Small Business Management, 33(3): 57-66.
Brush, C.G. (1992). “Research on Women Business Owners: Past Trends, a New Perspective and Future Directions”, Entrepreneurship Theory and Practice, 16: 5-30.
Brush, C.G. and Vanderwerf, P.A. (1992). “A Comparison of Methods and Sources for Obtaining Estimates of New Venture Performance”. Journal of Business Venturing. 7 (3):157-170.
Butler, J.S. (1991). “Entrepreneurship and Self-help among Black Americans: A

294
Reconsideration of Race and Ethnicity”, State University of New York Press: New York.
Butler, J.S. and Greene, P.G. (1997). “Ethnic Entrepreneurship: The Continuous
Rebirth of American Entrepreneurship”, in D.L. Sexton and R.W. Smilor (eds), Entrepreneurship 2000, Chicago, IL: Upstart Publishing 267-289.
Carter and Jones-Evans. 2006. Enterprise and Small Business, Principles, Practice and Policy. 2nd edition, Prentice Hall, Edinburgh Gate, Harlow.
Carson, D., Cromie, S., MCgowan, P. and Hill, J. (1995). Marketing and Entrepreneurship in SMEs: An Innovative Approach. Prentice Hall International.
Carter, S. and Rose, P. (1998). “The Financing of Male-and Female-Owned\ Businesses”, Entrepreneurship and Regional Development, 10 (3):225-241.
Casson M. (1994). The Economics of Business Culture: Game theory, Transaction Costs and Economic performance, Oxford University Press, New York.
Charnes, A., Cooper, W.W. and Rhodes, E. (1978). Measuring the Efficiency of Decision Making Units, European Journal of Operational research, 2: 429-444.
Chaston, I. (1995). Small Firm Growth through the Creation of Value-added Networks, Proceedings of the 18th ISBA National Small Firms Policy and Research Conference, Paisley, 45-57.
Conway, S. (1997). Informal Networks of Relationships in Successful Small Firm Innovation, in D. Jones-Evans and M. Klofsten (eds.). Technology, Innovation and Enterprise: The European Experience, MacMillan, 236 - 271.
Cracolici, M.F. and Nijkamp, P. (2006) Competition among Tourist Destinations, In: M. Giaoutzi and P. Nijkamp (eds), Tourism and Regional Development. Ashgate, Aldershot, 133-152.
Das, T.K. and Teng, B.S. (1997). “Time and Entrepreneurial Risk Behavior”, Entrepreneurship Theory and Practice, 22(2): 69-88.
Delft, H. Van, Gorter, C. and Nijkamp, P. (2000), “In Search of Migrant Entrepreneurship Opportunities in The City: A Comparative Policy Study”, Environment and Planning C: Government and Policy, 18: 429-451.
Delaney, J.T. and Huselid, M.A. (1996). The Impact of Human Resource Management Practices on Perceptions of Organizational Performance. Academy of Management Journal, 39(4): 949-969.
Djankov, S., La porta, R., Lopez-de-Silanes, F. and Shleifer, A. (2002). "The Regulation of Entry”, Quarterly Journal of Economics, 117(1):1-37.
Dubini, P. (1988). “The Influence of Motivations and Environment on Business Start-ups: Some Hints for Public Policies”, Journal Business Venturing, 11–26.
Dyer, L.M., and Ross, C.A. (2000). “Ethnic Enterprises and Their Clientele”, Journal of Small Business Management, 38 (2): 48-66.
Evangelista, F.U. (1994). “Export Performance and its Determinants: Some Empirical Evidence from Australian Manufacturing Firms”, Advances in International Marketing, 6: 207.
Farrell, M.J. (1957). “The Measurement of Productive Efficiency”, Journal of the

295
Royal Statistical Society, Series A,120: 253–281. Finkbeiner, A. (1991). Untwinkling The Stars. Science 252 (5014): 1786-1787. Finkelstein, S., Harvey, C. and Lawton, T. (2007). Breakout Strategy: Meeting the Challenge of Double-Digit Growth. McGraw-Hill: New York. Florida R. (2003). Cities and the Creative Class. Routledge, New York. Freel, M. (2000). “External Linkages and Product Innovation in Small
Manufacturing Firms”, Entrepreneurship and Regional Development, 12: 245-266 Goetz, S.J. and Rupasingha, A. (2002). “High-Tech Firm Clustering: Implications for
Rural Areas,” American Journal of Agricultural Economics, 84 (5):1229-1236. Hammarstedt, M. (2001). “Immigrant Self-employment in Sweden – its Variation
and Some Possible Determinants”, Entrepreneurship and Regional Development, 13(2), 147–161.
Hartenian, L.S. and GUDMUNDSON, D.E. (2000). “Cultural Diversity in Small Business: Implications for Firm Performance”, Journal of Development Entrepreneurship, 5(3): 209.
Hofstede, G. (1994), Cultures and Organisations: Software of the Mind, London: Harper- Collins Business.
Hult, G.T.M., HURLEY, R.F. and KNIGHT, G.A. (2004). Innovativeness: Its Antecedents and Impact on Bussiness Performance. Industrial Marketing Management 33: 429-438.
Hunt J. and Gauthier-Loiselle, M. (2010). How Much Does Immigration Boost Innovation? American Economic Journal: Macroeconomics, 2 (2): 31-56.
Jacobs, J. (1969). The economy of cities, Random House: New York. Johannisson, B. and Peterson R. (1984). “The Personal Networks of Entrepreneurs”,
paper presented at the Third Canadian Conference of the International Council for Small Business, Toronto, 23-25 May.
Katsikeas, C.S., Piercy, N.F. and Ioannidis, C. (1996). “Determinants of Export Performance in a European Context”, European Journal of Marketing, 30(6): 6.
Kent, C., Sexton, D. and Vesper, K. (eds). (1982). The Encyclopedia of Entrepreneurship. Prentice Hall, Engelewood Cliffs.
Kloosterman, R., Leun, J., van der, Rath, J. (1999). “Mixed Embeddedness: (in)formal Economic Activities and Immigrant Businesses in The Netherlands”, International Journal of Urban and Regional Research, 23 (2): 252-266.
Kloosterman, R. and Rath, J. (2001). “Immigrant Entrepreneurs in Advanced Economies: Mixed Embeddedness Further Explored”, Journal of Ethnic and Migration Studies, 27(2): 189-201.
Kroeber, A.L. and Kluckhohn, C. (1952). Culture: A Critical Review of Concepts and Definitions. New York, NY: Vintage Books.
Kotey, B. and Meredith, G.G. (1997). “Relationship among Owner/manager Personal Values and Perceptions, Business Strategies, and Enterprise Performance”, Journal of Small Business Management, 35 (2): 37-64.
296
Levie, J. (2007). “Immigration, In-migration, Ethnicity and Entrepreneurship in the United Kingdom”, Small Business Economics, 28(2–3): 143–170.
Light, I. and Rosenstein, C. (1995). Race, Ethnicity and Entrepreneurship in Urban America. Aldine de Gruyter: New York.
Littunen, H. (2000). “Entrepreneurship and The Characteristics of The Entrepreneurial Personality”. International Journal of Entrepreneurial Behaviour & Research, 6(6): 295-309.
Low, M.B. and Macmillan, I.C. (1980). “Entrepreneurship: Post Research and Future Challengs”, Journal of Management, 14 (2): 139-161.
Madsen, T.K. (1987). “Empirical Export Performance Studies: A Review of Conceptualisations and Findings”, Advanced in International Marketing, 2: 177-198.
Marger, M.N. (1989). Business Strategies among East Indian Entrepreneurs in Toronto: The Role of Group Resources and Opportunity Structure, Ethnic and Racial Studies, 12: 539–563.
Marlow, S. (1992). “The Take-up of Business Growth Training Schemes by Ethnic Minority-owned Firms in Britain”, International Small Business Journal, 10 (4): 34-47.
Masurel, E., Nijkamp, P., Tastan, M. and Vindigni, G. (2002), Motivations and Performance Conditions for Ethnic Entrepreneurship. Growth & Change 33(2): 238-260.
Matthyssens, P. and Pauwels, P. (1996). “Assessing Export Performance Measurement”, Advances in International Marketing, 8: 85.
Murphy, G.B., Trailer, J.W. and Hill. R.C. (1996). “Measuring Performance in Entrepreneurship Research”, Journal of Business Research, 36: 15-23.
Niebuhr, A. ( 2010). Migration and Innovation: Does Cultural Diversity Matter for Regional R&D Activity? Papers in Regional Science, 89: 563–585.
Nijkamp, P., Baycan-Levent, T., Gheasi, M., Longhi, S., Masurel, E., Ozgen, C., Poot, J. and Sahin, M. (2009). “Migration Impact Assessment: An Overview, Tentative Findings And A Framework”, A Quick Scan Document Commissioned By Forum (Utrecht).
Nijkamp, P., Sahin, M., and Baycan-Levent, T. (2010). “Migrant Entrepreneurship and New Urban Economic Opportunities – Identification of Critical Success Factors by Means of Qualitative Pattern Recognition Analysis”, In: Tijdschrift voor Economische en Sociale Geografie, 101(4): 371-391.
O'Connor, J.J. and Robertson, E.F. (November 2002). "Galileo Galilei". University of St Andrews. http://www-gap.dcs.st-and.ac.uk/~history/Biographies/Galileo.html. Retrieved 2007-01-08.
OECD (2006). OECD Science, technology and industry outlook 2006, Paris: OECD. Ozgen, C., Nijkamp, P., Poot, J. (2011). Immigration and Innovation in European
Regions. Upcoming in Migration Impact Assessment book, by Edward Elgar.
297
Porter, M. E. (1979). How Competitive Forces Shape Strategy. Harvard Business Review 57(2): 137–145.
Postma, TH.J.B.M. and Zwart, P.S. (2001). Strategic Research and Performance of SMEs. Journal of Small Business Strategy.12 (2): 52-64.
Praag, C. M., Van, and Versloot, P.H. (2007). “The Economic Benefits and Costs of Entrepreneurship: A Review of The Research”, Foundations and Trends in Entrepreneurship, 4(2): 65-154.
Ram M. and Jones, T. (1998). Ethnic Minorities in Business, Milton Keynes: Open University Press.
Ram, M. and Hillin, G. (1994). “Achieving ―Break-out; Developing Mainstream Ethnic Minority Business”, Small Business Enterprise and Development, 1: 15-21.
Rath, J. (2000). Introduction; Immigrant Business and the Economic, Politico- Institutional and Social Environment, in: J. Rath (ed.), Immigrant Business: The Economic, Political and Social Environment, London: Macmillan Press, pp 1-19.
Raven, P.V., MCcullough J.M. and Tansuhaj, P.S. (1994). “Environmental Influences and Decision-making Uncertainty in Export Channels: Effects on Satisfaction and Performance”, Journal of International Marketing, 2 (3): 37.
Reichel, A., Mehrez, A.and Altman, S. (1998). “Neve-Ilan, Israel: A Site Selection and Business Feasibility Case Study”, Tourism Management, 19(2): 161–170.
Rothwell, R. (1991). “External Networking and Innovation in Small and Medium- Sized Manufacturing Firms in Europe“, Technovation, 11(2): 93-111.
Sahin, M., Rietdijk, M., and Nijkamp, P. (2007). “Is Cultural Diversity a Socio- Economic Opportunity? – A Case of Urban Migrant Entrepreneurs”, Innovation ─ The European Journal of Social Science Research, 22(3): 251-281.
Sahin M., Nijkamp, P., and Rietdijk, M. (2009). “Cultural Diversity and Urban Innovativeness: Personal and Business Study on the Performance of Migrant Workers in the Dutch Service Sector”, Studies in Regional Science, 37 (2): 535-552.
Sahin, M., Nijkamp, P., and Stough, R.R. (2010). “Impact of Urban Conditions on Firm Performance of Migrant Entrepreneurs – A Comparative Dutch−US Study”, Annals of Regional Science (Published Online: 05 January 2010). This article is published with open access at Springerlink.com: DOI 10.1007/s00168-009-0351-2.
Saxenian, A.L. (1990). “Regional Networks and the Resurgence of Silicon Valley“, Californian Management Review, 33(1): 89-112.
Schere J. (1982). “Tolerance of Ambiguity as a Discriminating Variable Between Entrepreneurs and Managers”, Proceedings New York Academy of Management, pp. 404–408.
Schwartz, S.H. (1992). “Universals in the Content and Structure of Values: Theory and Empirical Tests in 20 countries”, In: Zanna, M., (Ed) (1992). Advances in Experimental Social Psychology Vol. 25, Academic Press, New York, pp. 1–65.

298
Scott, W. R. (1987) The Adolescence of Institutional Theory. Administrative Science Quarterly, 32: 493-511.
Segal G., Borgia D. and Schoenfeld, J. (2005). “The Motivation to become An Entrepreneur”, International Journal of Entrepreneurial Behaviour & Research, 11 (1): 42-57
Shane S. and Venkataraman, S. (2007). The Promise of Entrepreneurship as a Field of Research. Entrepreneurship Concepts, Theory and Perspective. Pringer-Verlag, Berlin.
Shane S., Locke, E.A. and Collins, C.J. (2003). “Entrepreneurial Motivation”, Human Resource Management Review, 13: 257-279.
Shaw, E. (1997). “Social Networks: Their Impact on the Innovative Behaviour of Small Service Firms”, International Journal of Innovation Management, 2(2): 201-222
Shoobridge, G.E. (2006). “Multi-Ethnic Workforce and Business Performance: Review and Synthesis of the Empirical Literature”, Human Resource Development Review, 5 (1): 92-137.
Suzuki, S., Nijkamp, P., Rietveld, P. and Pels, E. (2010a). “A Distance Friction Minimization Approach in Data Envelopment Analysis; An Application to Airport Performance”, European Journal of Operational Research, 207 (2): 1104-1115.
Suzuki, S., Nijkamp, P. and Rietveld, P. (2010b). Regional Efficiency Improvement by Means of Data Envelopment Analysis through Euclidean Distance Minimization Including Fixed Input Factors: An Application to Tourist Regions in Italy. Papers in Regional Science.
Thomas, J. and Evanson, R.V. (1987). “An Empirical Investigation of the Association between Financial Ratio Use and Small Business Success”, Journal of Business Finance and Accounting, 14 (4): 555.
Upton, N.B. and Heck, R.K.Z. (1997). The Family Business Dimensions of Entrepreneurship, In. D.L. Sexton and R.W. Smilor (Eds.), Entrepreneurship 2000, Chicago: Upstart Publishing, pp. 243-266.
Van de Ven, A. H. (1993).”The development of an infrastructure for entrepreneurship”, Journal of Business Venturing, 8:211-230.
Venkatraman, N. and Ramanujam, V. (1987). “Measurement of Business Economic Performance: An Examination of Method Convergence”, Journal of Management, 13(1): 109-122.
Velde, M.E.G., Van, Jansen, P.G.W. and Telting, I.A. (2000) Bedrijfswetenschappelijk Onderzoek: Van Probleemstelling tot Presentatie. Baarn: Nelissen.
Verheul, I., Wennekers, A.R.M., Audretsch, D. and Thurik, R. (2002). An Eclectic Theory of Entrepreneurship: Policies, Institutions and Culture, in D. B. Audretsch, A. R. Thurik, I. Verheul and A.R.M. Wennekers (eds.), Entrepreneurship: Determinants and Policy in a European–US Comparison, Boston/Dordrecht: Kluwer Academic Publishers, pp. 11–81.

299
Vertovec, S. and Wessendorf, S. (2004). Migration and Cultural, Religious and Linguistic Diversity in Europe: An overview of Issues and Trends, International Migration, Integration and Social Cohesion (IMISCOE), Centre on Migration, Policy and Society [COMPAS], University of Oxford.
Waldinger, R. (1986). “Immigrant Enterprise”, Theory and Society, 15 (1-2): 249-285. Waldinger, R., Aldrich, H. and Ward, R. (eds). (1990). Ethnic Entrepreneurs. Sage
Publishers. Newbury Park, Ca. Warf, B. (2010). “US International Trade in Knowledge-Intensive Business
Services”, in Doloreux, D., Freel, M. and Shearmur, R. (eds), Knowledge-Intensive Business Services. Geography and Innovation, Ashgate: Surrey.
Yang, J. and Lee, H. (1997). “An AHP Decision Model for Facility Location Selection”, Facilities, 15 (9-10): 241-254.

300
CHAPTER 10* MIGRANT IMPACT ASSESSMENT OF ETHNIC ENTREPRENEURS: DATA ENVELOPMENT ANALYSIS AS A POLICY SUPPORT TOOL
Abstract
An issue of continuous debate over recent decades has been the impact of migration on the development of both destination and origin countries of migrants. Migration is a form of optimal allocation of production factors in both sending and receiving countries. In the sending countries some positive effects could be the economic growth attributed to the remittances and to the return migrants, who are regarded as engines of change and innovation. On the other hand, migration could be a cause of increasing disparities in origin and host countries. Some negative effects in the origin countries could be the amplification of the consumerist, non-productive and remittance-dependent behaviour. The goal of this paper is to assess the importance of migration in the currently globalizing world, with special attention being paid to the entrepreneurial behaviour and performance of immigrants. In line with the main purpose of this paper, we provide some theoretical insight into the impact of ethnic diversity on the economic performance of receiving and origin countries, this being further narrowed down to the entrepreneurial behaviour of the migrants. The empirical part consist of a migrant impact analysis of ethnic entrepreneurs, and presents the results of a cross-correlation and Data Envelopment Analysis.
Key words: migrant entrepreneurship, GALAXY model, ethnic diversity, economic performance
JEL classification codes: L 26, R 11
*Source: Sahin, M., Todiras, A., Suzuki, S., and Nijkamp, P. (2011), Migrant Impact Assessment of Ethnic Entrepreneurs: Data Envelopment Analysis as a Policy Support Tool, Innovation (Accepted).
301
1. INTRODUCTION Migration as a form of geographical labour mobility has become a global phenomenon. Clearly, it has become a selective process, depending on the human capital of the (potential) migrants and socio-economic opportunities in the countries of origin and destination. Migration has also become a controversial matter which for quite some time has caused political unrest, racism, and prejudices which often have led to restrictive immigration policies that often have been harmful for society as a whole. Hence, migration has also become an issue of great concern to both researchers and the general public. According to de Haas (2010), there are multiple ways whereby migrants can affect the local and the macro-development context of the receiving countries; among these are their effects on consumption, labour supply, investments, inequality, social stratification, culture and aspirations, etc. The effects of migration on the receiving countries can be two-sided, as they can be either negative or positive. It is an empirical question whether the latter effects outweigh the former. Evidence shows that the main characteristic of the world’s greatest cities is their large and heterogeneous population. Therefore, the ethnic mix can be regarded as an infinite source of diverse skills and abilities, cultures and experiences, ultimately leading to increased creativity and innovation (Pratt, 2007; Smallbone et al., 2007). Moreover, sustained economic growth in the global cities has led in particular to ‘a rising demand for professionals and technicians of high caliber’ (Portes, 2007). Therefore, an important distinction in the literature is made between the low-skilled and the high-skilled migrant population. The latter is receiving increasing attention, as it is assumed that: the highly-skilled migrants can adapt more easily to the host country environment; they require less spending (on education and training); they bring new ideas, skills and knowledge; and will consequently stimulate economic growth in the long run (Ozgen et al., 2010; Nijkamp et al., 2009b).
There is an abundance of literature on the socio-economic impacts of skilled vs unskilled migrants (see Beine et al., 2001; Levine et al., 2010). The issue of skilled migrants has recently been taken up by the Organization for Economic Co-operation and Development (Dumont et al., 2010). Studies undertaken by the OECD provide some important information on the trends in migration. They show that the global emigration rate is 2.4 per cent, with Europe, Latin America and Oceania having the highest rates, especially in less-populated countries and small islands. On the other hand, some OECD countries (e.g. the USA, Germany, France) and non-OECD countries (e.g. Russia, India) hold a considerable share of the world’s migrants. In absolute terms low-skilled migration still dominates over high-skilled in both OECD and non-OECD countries. Most host countries receive migrants mainly from the same region/continent, apart from those countries that have historical bonds (colonies) with countries outside the region. Another exception could be those OECD countries that have received migrants from diverse countries through historical migration waves. The database on immigrants in OECD countries and
302
non-OECD receiving countries provides a thorough insight into migration on the global level. Previous studies have mainly focused on Western countries, ignoring considerable migration flows, for instance, within central and Eastern Europe (e.g. from the countries of the former USSR) or the migration in the Sub-Saharan region and Asia. Some important facts on the topic of migration encompass the migrant gender composition, which in both OECD and non-OECD countries is on average 51 per cent women. Moreover, the migrants from Africa are mainly low-skilled, while those from Asia are quite mixed. Latin America has the lowest rate of high-skilled emigrants. Emigrants to OECD countries are more than twice as numerous as emigrants to non-OECD countries. Larger destination countries host a bigger share of migrants in general, and of the high-skilled in particular (Dumont et al., 2010).
An issue of continuous debate over recent decades has been the impact of migration on the development of both destination and origin countries of migrants. De Haas (2010) has analysed the different views regarding this issue. Therefore, from the optimistic perspective, migration is a form of optimal allocation of production factors in both sending and receiving countries. In the sending countries some positive effects could be the economic growth attributed to the remittances and to the return migrants, who are regarded as engines of change and innovation. On the other hand, the pessimists regard migration as a cause of increasing disparities in origin and host countries. Some negative effects in the origin countries could be the amplification of the consumerist, non-productive and remittance-dependent behaviour. Hence, they consider migration ‘a problem’ which calls for more restrictive immigration policies. Portes (2007) found that money transfers to the home countries can either boost their economic growth or can expand inequalities in those countries. Other negative impacts in this context, mentioned by that author (ibid) are: potential unemployment, loss of qualified workers, inflation, production stagnation, etc. which can consequently lead to depopulation and the abandonment of productive activities in the sending countries.
An additional perspective on migration is provided by the transnational view, which foresees the opportunity of migrants and their families to live transnationally (Portes et al., 1999; Guarnizo et al., 2003; Zhou, 2004). These possibilities for migrants have been considerably facilitated by the ‘death of distance’ due to recent developments in information and communication technologies (ICT), thus allowing the migrants to maintain strong transnational ties. According to de Haas (2010), integration in the host country and commitment to the origin country should not necessarily be regarded as substitutes, but rather as complements. Moreover, transnational ties can help migrants transmit the ‘entrepreneurial spirit and skills that their home countries so sorely lack’ (Moises, 2002). Similarly to migrant entrepreneurship, transnational entrepreneurship heavily relies on ethnic networks (Zhou, 2004). This sort of entrepreneurship is considered by the latter author to deliver both economic and non-economic benefits ‘in terms of employment security,
303
economic independence, favourable earnings, and social recognition in sending countries’ (ibid.).
The goal of this paper is to assess the importance of migration in the currently globalizing world, with special attention being paid to the entrepreneurial behaviour and performance of immigrants. In line with the main purpose of this paper, the following sections will provide some theoretical insight into the impact of ethnic diversity on the economic performance of the receiving and the origin countries, this being further narrowed down to the entrepreneurial behaviour of the migrants. The empirical part consists of a migrant impact analysis of ethnic entrepreneurs, and presents the results of a cross-correlation and Data Envelopment Analysis, with the aim to identify the performance characteristics and differences among distinct groups of migrant entrepreneurs, who are mainly active in the high-tech sector in large Dutch cities.
2. ETHNIC DIVERSITY AND ECONOMIC PERFORMANCE
Immigration is usually accompanied by cultural diversity, sometimes also called ‘multiculturalism’ (Sahin et al., 2007). This new phenomenon in Europe has prompted many debates on the advantages and disadvantages of cultural diversity. Moreover, it has become one of the core issues of policy making in the European Union. The empirical literature on cultural diversity contains a long list of positive diversity effects, not only on the labour market, but also on many other domains of society. A modern urban society in the Western world is being increasingly faced with cultural diversity as a result of international migration. Diversity is valued as a positive developmental factor, and its social, cultural and economic benefits are broadly recognized. In any case, cultural diversity has become a key feature of a modern Western society. According to Bellini et al. (2008), one of the main characteristics of global cities is their cultural diversity. According to UNESCO, ‘cultural diversity is an asset that is indispensable for poverty reduction and achievement of sustainable development’. In the 2001 Declaration of UNESCO on Cultural diversity, the importance of sustainable development for humankind was associated with the importance of biodiversity for nature. According to Ozgen et al. (2010), a high concentration of a more ethnically-diverse population in some areas may be a source of knowledge spillovers, new ideas, entrepreneurship, and consequently economic growth. Furthermore, innovation levels are positively linked to ethnic diversity.
Some work has identified diversity as simply the share of the ‘foreign born’ (Florida and Gates, 2001). In contrast to this, many specialists tend to use a more abstract measure of ‘diversity’, developed through fractionalization indices which account for the shares of different groups of the population. These fractionalization indices can be calculated using ethnic origin, country of birth, religion, or language spoken. There is a growing body of literature on the impacts of ethnic heterogeneity on the economic performance of both receiving and sending countries. The empirical studies show various results, which are often contradictory. For instance, some

304
authors have found that ethnic diversity has a direct negative effect on economic growth (Easterly and Levine, 1997; Alesina et al., 2003; Alesina and Ferrara, 2005). This could be caused by the potential costs deriving from racial discrimination and prejudices. Increased ethnic diversity can lead to a conflict between the preferences of certain ethnic groups, which ultimately alters the provision of public goods. As a consequence, public spending is much lower in racially-fragmented locations, and this can have a negative impact on the economic growth in the long run (Bellini et al., 2008; Alesina et al., 2004; La Porta et al., 1999; Alesina and Ferrara, 2005). Therefore, heterogeneous societies can generate more socio-economic challenges compared with the homogeneous ones (Alesina and Ferrara, 2005). For instance, the USA has a very low redistribution of income because of its heterogeneous population, the opposite being characteristic for Europe (high level of social transfers and spending). However, the constantly increasing number of foreign-born population in European countries makes us question whether the redistribution capacity in these countries will eventually be diminished.
Moreover, ethnic diversity can in some cases be a source of clashes between different ethnicities, ultimately leading to political instability and tensions, which can have long-lasting economic effects (Montalvo and Reynal-Querol, 2005). Other authors also find a negative effect of diversity on employment (Angrist and Kugler, 2003). However, according to Easterly (2001) and La Porta et al. (1999), the negative effects of ethnic diversity can be considerably diminished by the presence of good institutions.
Yet other authors find that diversity is positively related to productivity (Bellini et al. 2008, Florida, 2002; Ottaviano and Peri, 2006), the explanation for this being an increased variety in skills, products, services available for production, innovation, and consumption. Jacobs (1969) claims that diversity in output is the main cause of the prosperity of urban economies. Lee and Nathan (2010) investigate the impact of ethnic diversity on employment growth. There has been much debates on the impact of diversity on growth. The literature suggests that diversity is beneficial for cities for the following four main reasons: (i) it allows diverse consumption and possible attraction of human capital or Florida’s ‘creative class’ (Florida and Gates, 2001; Florida, 2002, 2003); (ii) it attracts tourism (Gotham, 2002); (iii) it brings the benefits of immigrant and ethnic minority entrepreneurship (Ram and Jones, 2009); and (iv) it stimulates productivity through innovation, better problem-solving, and information flows (Alesina et al., 2003). Some studies have shown that cities with diverse populations grow faster. Ethnic diversity attracts human capital, tourists or firms, and increases productivity through diverse approaches to problem-solving or ethnic minority entrepreneurship. Some studies tend to find positive effects from diversity, although the evidence is unclear.
Apart from studies of diversity issues on the macro-level, few empirical works have been undertaken on the enterprise level. Ethnic diversity is believed to positively affect the economic performance due to increased productivity. This is the result of the combination of the skills of the different ethnic groups, which are often

305
complimentary, thus this diversity implies increased productivity. However, Alesina and Ferrara (2005) mention the importance of having in place the ‘rules of the game’ to moderate and control the conflict element inherent in diversity. The study of Kochan et al. (2003) shows that, on the one hand, intra-organization diversity can produce conflict due to miscommunication or/and lower cohesion, while, on the other hand, diversity may boost creativity and innovation. According to these authors, it is important to carefully monitor diversity and create an organizational context that will muture it, therefore avoiding the emergence of conflicts within the organization. Kochan et al. (2003) also emphasize that there is no significant relationship between diversity and team performance if a specific organizational context and policies are not in place. Another opinion is that there is a limit to the degree of heterogeneity in an enterprise, and the optimal degree should be found in order to avoid the potential costs which may occur due to difficulties in communication (Alesina and Ferrara, 2005).
3. IMPACTS OF IMMIGRANTS ON ENTREPRENEURSHIP
According to Wang (2010), immigration can encourage the emergence and development of ethnic-owned businesses in multiple ways. On the demand side, immigration expands the tastes and needs of the consumers, and on the supply side it encourages ethnic firms to supply culturally-specific products and services to fulfill these needs. Verheul and van Stel (2010) also emphasize that ‘a greater diversity of the entrepreneurial population…will contribute to this supply variation’. Moreover, as Wang states (2010), immigration has also caused changes to the institutional environment, which has, among other things, a tremendous impact on ethnic business development. Therefore, Wang’s study emphasizes the importance of the macro-socio-economic context in which entrepreneurship takes place.
Therefore, the growth of migration flows in recent years has consequently led to a rise in the number of ethnic entrepreneurs, who are coming from increasingly diverse backgrounds. Ethnic entrepreneurs are ‘owners and managers of their own businesses, whose group membership is tied to a common heritage or origin’ (Zhou, 2004). They are known to be entrenched in specific social structures that determine for their social networks, economic transactions, etc. Some societies, through their restrictive policies, prevent immigrants from equally competing with the native population in the mainstream economy. This racial exclusion in the labour market forces migrants to either engage in jobs that are not desired by the native population, or otherwise opt for small business ownership (Teixeira et al., 2007; Clark and Drinkwater 2000). The latter is feasible if there is demand for specific goods and services that cannot be fulfilled by the mainstream economy (Zhou, 2004). According to Light and Roach (1996), a considerable share of migrants have created their own opportunities in the metropolitan market rather than crowding out the native population. Furthermore, in most of the cases hostile markets in the receiving countries have driven migrants to proactively create new business opportunities, taking advantage of the available low-skilled and cheap migrant labour who are

306
known to work for longer hours and lower pay (Baycan-Levent et al., 2009; Nijkamp et al., 2009a; Kloosterman et al., 1999; Waldinger, 1986; Zhou, 2004). Therefore, migrant entrepreneurship can also generate job opportunities for migrant workers who are otherwise excluded from the mainstream economy. Baycan and Nijkamp (2009) find that the main determinants of migrant entrepreneurship in many European countries are: high unemployment rates, low participation rates, low status of migrants, and the related factor ‘mixed embeddedness’.
Another interesting point here is that some ethnic minorities are more likely than others to engage in self-employment, this being caused by multiple factors, among which are the poor knowledge of the host language, low education level, and lack of skills (Nijkamp et al., 2009a). Other authors argue that some ethnic groups are more culturally inclined towards entrepreneurship, which is a characteristic that they bring from their home country (Clark and Drinkwater, 2000; Barrett et al., 1996; Hofstede et al., 2004). Some authors have also found that the high self-employment rate of some ethnic groups is strongly related to their high average income (Fairlie and Meyer, 1996).
The skilled immigrants are often known to be more entrepreneurial and risk-averse (Kloosterman and Rath, 2003). Furthermore, Eckhardt and Shane (2003) view entrepreneurship as the interaction between individuals and opportunities in the marketplace. Therefore, migrant entrepreneurship is shaped by two main forces, i.e. the personal characteristics of the entrepreneurs (e.g. age, gender, education, host language proeficiency, prior business experience) (see Fairlie, 2008; Wang, 2010; Zhou, 2004) and the macro-labour market conditions. An important role can also be attributed to migrants’ social networks which can have a crucial role in raising capital, recruiting labour, and dealing with suppliers and customers (Clark and Drinkwater, 2000; Aldrich and Waldinger, 1990). Furthermore, as Boyd (1989) argues, social networks may be the main determinant for the development of immigrant enterprises. Over the last few decades we have observed a substantial growth in the number of migrant entrepreneurs in the high-tech sector, and this shift is mainly characteristic for the next-generation entrepreneurs (Baycan et al., 2009). The latter are considered to have reached higher educational levels and have attained various skills, and also an important factor here is a better knowledge of the host country's language which leads to a greater degree of assimilation and increased opportunities in the labour market.
4. GALAXY: A CONCEPTUAL FRAMEWORK
Multiple causes of migrant entrepreneurship can be found in the literature, with increased attention being paid to the interrelated determining factors at various levels. This set of factors is at the core of our GALAXY model (for a comprehensive description, see Sahin et al., 2011). This model encompasses all the factors that are believed to jointly affect the overall entrepreneurial performance of migrants. They are classified in four categories: (1) Motivational Factors (MF) - at the individual level, including entrepreneurial animal spirits, bounded rationality, and social

307
networks; (2) Socio-economic Contextual Factors (SCF) - at the enterprise level, including business culture, access to new markets, and operational characteristics; (3) Business Environment (BE) - the focus on the micro-environment, including business environment, business markets, and locational conditions; (4) Policy Factors (PF) - the focus on macro-environment, including financial incentives, institutional systems, and regulatory systems. The main structure of our GALAXY model is presented in Figure 1.
Among a large number of Motivational Factors that stimulate migrants to become self-employed we have identified three most significant ones. First, the entrepreneurial animal spirit which is a term which was introduced by Keynes to describe human action and behaviour. According to Keynes, in an uncertain environment, entrepreneurs will take action on the basis of non-rational motives (instinct, desire), rather than rational ones. Thus, the animal spirits of potential entrepreneurs ‘prevent uncertainty from stopping action’ (Koppl, 1991).
Figure 1: The main structure of the GALAXY model for migrant entrepreneurial performance
This could be a strong characteristic especially in the case of ethnic
entrepreneurs, who are known to engage in entrepreneurship despite the barriers in the host society and who often lack the necessary means. Secondly, bounded rationality is a concept developed by Simon (1957), serving his aim to find a realistic theory to explain human economic decision making. According to Gigerenzer (2010), bounded rationality is based on an ecological rather than a logical view of behaviour. Therefore, entrepreneurs will make decisions based not only on character traits and rational deliberations but also on bounded rationality, which is the interplay between mind and environment. Another important factor here is the social networks which are very important for migrant enterprises, since they supply them with resources not available internally. Therefore, these networks provide access to
308
information, financial and physical resources, and human capital (Rath, 2000; Johannisson, 2000; van Delft et al., 2000; Clark and Drinkwater, 2000; Aldrich and Waldinger, 1990). Social networks can be one of the core motives for some migrants to embark on self-employment, and further stay competitive (Boyd, 1989).
The Socio-economic Contextual Factors that we have found to be most important in the process of ethnic businesses formation and development concern the business culture of the ethnic entrepreneurs, which is often represented by a strong tie with members of the same ethnicity, which has a strong moral content. The morality of certain minority groups, as Casson (1994) finds, can surpass the formal procedures, and thus reduce the transaction costs and time, and consequently increase the performance of entrepreneurs. It is also most likely that the migrants will adopt the business culture of their country of origin rather than that of the host country. The concepts of the host business system that are unfamiliar to them are often dismissed and considered irrelevant. Furthermore, the migrant entrepreneurs also have in most of the cases a distinct leadership style, characteristic of their own culture. Another important factor here is the access to new markets. Ram and Hillin (1994) find that in most cases, the ethnic minority firms rely on their own community support, and the growth of such firms could only be achieved by tapping into wider ‘majority’ markets. Therefore, the potential for growth is limited in such firms, which mainly serve the ethnic market, due to the small size of the market, on the one hand, and insufficient buying power of the ethnic population, on the other. However, increased educational attainment, greater experience with non-ethnic situations, more skills, diversified communication channels, and better access to government policy-support measures can all help migrants to tap into wider markets (Baycan et al., 2009). Lastly, the operational characteristics of ethnic enterprises have a big impact on the overall performance of ethnic businesses. According to Waldinger (1986) the migrant enterprises are often distinguished by the following characteristics: low economies of scale, instability and uncertainty, small or differentiated markets. Moreover, the migrant enterprises are generally known to employ people with lower skills; and therefore they will avoid their trainingcosts. A common practice for migrant entrepreneurs is to recruit through ‘word of mouth’ methods, thus recruiting acquaintances of their friends and relatives. Another feature of ethnic enterprises is to provide only short, or sometimes uncertain work, contracts due to seasonal or cyclical factors (Waldinger, 1986).
Another set of factors are formed by the Business Environment of migrant-owned firms. Among these are the locational conditions: the choice of location has significant strategic implications for firms since this decision will in most of the cases ‘involve long-term commitment and will be irreversible in nature’ (Yang and Lee, 1997). The decision where to locate an enterprise has a direct impact on the venture’s odds of survival. The physical and social environments significantly influence the offered product and the experience. Other environmental factors that contribute to the location of the business are the number of other enterprises in the same geographic region and the variety of activities offered, the level of

309
infrastructure development, accessibility to the site and shoppingfacilities, accessibility to highways, proximity to airport, etc. (Reichel et al., 1998). Furthermore, a spatial concentration of ethnic enterprises will favour the formation of stronger social networking and facilitate access to a pool of vast resources. Another important factor is the business network of enterprises. These formal networks encompass the following actors: venture capitalists, banks, accountants, creditors, lawyers, trade associations, licensing agreements, and supply-chain linkages with either suppliers or users (Carter and Jones-Evans, 2006; Das and Teng, 1997). According to Marlow (1992), migrant entrepreneurs do not appear to be benefiting from, or even using, formal networks, which is an important obstacle to business formation and growth. Lastly, the Business markets also have a big impact on the overall success of enterprises. Business markets revolve around three main actors that can have a tremendous impact on the overall business performance of the migrant enterprise. These actors are: the competitors who can be a threat due to, for example, product and services substitutes, price discounting, new product introductions, advertising campaigns, and service improvements. The second actor that shapes business markets is the suppliers who can squeeze profitability out of an industry that is unable to pass on cost increases in its own prices. Thirdly, and lastly, the customers can capture more value by forcing down prices, demanding better quality or more service (therefore driving up costs), and generally playing industry participants off against one another, all at the expense of industry profitability (Porter, 1979).
The Policy Factors that we have included in our model are the institutional systems, which can influence the trajectories of self-employment of both the indigenous and the migrant population. National institutions can, for instance, decide what is marketable and what is decommodified. It is also known that institutional arrangements can both facilitate and inhibit the emergence of new industries (Kloosterman and Rath, 2001). Another policy factor in our model is the regulatory systems. They comprise all regulations, taxes, and other public rules and institutions affecting entrepreneurship. There are numerous procedures an entrepreneur needs to carry out in order to legally begin operating a company involved in industrial or commercial activity. The range of procedures encompasses: screening procedures, tax-related requirements, labour/social security-related requirements, safety and health requirements, environment-related environments (Djankov et al., 2002). We also assume that financial incentives have an impact on entrepreneurship in general, and on ethnic entrepreneurship more specifically. Financial incentives are tools that could be introduced by the government locally or nationally. These incentives can serve as a means to confer attractiveness to specific locations where these are being introduced. Dubini (1988) distinguishes between two types of incentives that could be provided by the government to the entrepreneurs: cost reduction and cash support.

310
5. METHODOLOGY AND DATABASE Our study aims to investigate the critical success factors behind the business performance of the next-generation entrepreneurs who are active in the high-tech sector: namely, the ICT sector, the FIRE sector and the tourism sector. All these factors are at the core of the GALAXY model developed in this paper, and their importance and impact will be assessed on the basis of the data from a survey among next-generation entrepreneurs. Thus, our study analyses the main factors that impact on the economic performance of migrant entrepreneurs in the high-tech sector in four large cities in the Netherlands: Amsterdam, Rotterdam, Utrecht, and The Hague. The sample of our study consists of a total of 50 entrepreneurs of predominantly Turkish origin and also few Moroccan and Surinamese entrepreneurs who are active in the ICT, FIRE and tourism sectors that all require highly-educated and skilled labour. The empirical data of our research was gathered from an online survey conducted in the fall of 2010.
In the following paragraph we will specify the main indicators of their economic performance, and then evaluate and compare them (and their trend) for the main ethnic groups approached in the course of this study. The primary goal of this study is to assess the impact of several fundamental factors on the economic performance of next-generation migrant entrepreneurs. Our GALAXY model has been constructed accordingly, and thus all the main factors have been included in the model, i.e. the motivational factor, the socio-economic contextual factor, the business environment factor, and the policy factor. These serve as independent input factors for the overall business performance of the migrant entrepreneurs. Therefore, after collecting all the responses from our online survey, we then selected from the full range of questions, those which could be interpreted as indicators for the input factors mentioned above. Apart from that, a few questions served as indicators for our output factor – business performance. Table 1 gives an overview of the input and output indicators that were selected. Table 1: Input and output indicators of migrant entrepreneurs
Input Output MF SCF BE PF T P A
Animal spirits
Business culture
Business markets
Regulatory systems
Turnover Profitability Assets
Bounded rationality
Access new markets
Business networks
Institutional systems
Social networks
Operational characteristics
Locational conditions
Financial incentives
Input factors Output factors
MF = Motivational Factor T= Turnover SCF = Socio-economic Contextual Factor P = Profitability BE = Business environment Factor A = Assets PF = Policy Factor
311
The independent variable motivational factor encompasses the dimensions concerning animal spirits, bounded rationality, and social networks. All these dimensions are employed by this study since they are frequently investigated and cited in the specialty literature. Furthermore, these can be considered as factors that focus on the individual characteristics of the entrepreneur. The other independent variable socio-economic contextual factor is constructed from dimensions referring to the skills and business culture of the entrepreneur, the access to new markets, and the operational characteristics, so here we have investigated the indicators at the enterprise level. The value of another independent variable, i.e. business environment, has been assessed by looking at its main components, i.e. business markets, business networks, and locational conditions. We have chosen all these dimensions since they can project the micro-environment in which the entrepreneurs are active. We have also used the independent input variable policy factor which is constructed from the following dimensions: regulatory systems, institutional systems and financial incentives. We consider this last input factor to have a crucial role in the whole entrepreneurial process, although this is predominantly in its early phase.
The questions of our online survey were related to all the above dimensions and have served as their indicators. However, some dimensions had more than one indicator, and thus we had to cluster them and then recompute them to a single variable. A reliability check was undertaken during this process in order to investigate if we could use the constructs for further analysis. Therefore, the reliability of the clustered indicators and dimensions have been measured with Cronbach’s alpha, with the critical value being at least 0.6 (van Velde et al., 2000). Therefore, the Cronbach’s alpha values for all four input factors had to be sufficient in order to proceed with further research of the impact of the chosen independent variables on the business performance of migrant entrepreneurs. Our dependent variable is the business performance of the migrant entrepreneurs. This study looked at the objective components of this variable, i.e. turnover, profitability and assets. For each of them, the respondents could answer the associated question on a 5-point Likert scale, where 5 is the highest score per answer, while 1 is the lowest. The averages of the scores for each of the variables were used.
6. DATA ENVELOPMENT ANALYSIS AS AN ASSESSMENT TOOL FOR BUSINESS EFFICIENCY
In the industrial organization literature of the past decades, a great deal of attention has been paid to the evaluation of efficiency differences among individual decision-making units (DMUs) involved in multi-product and multi-input activities. Data envelopment analysis (DEA) is an operational and quantitative, non-parametric method in production efficiency analysis that is generally used to judge the efficiency of firms or non-profit organizations. There are several different explanatory and multidimensional analyses and models that can be used to investigate the efficiency contribution of variables. A conventional class of approaches is found by multiple
312
regression models. This is certainly a useful approach, but in our case, we use DEA, because our study seeks to address the efficiency of individual entrepreneurs. The general idea is that the production process of a DMU can be described by a generalized production function which may contain multiple input and multiple output factors. The most efficient production technology of such a composite production process can be described by means of the production possibility frontier, while the actual position of a firm − in terms of its realized efficiency or relative use of input factors to achieve a certain output (or a set of outputs) − can be represented by a point in either the input space or the output space.
DEA is based on the seminal work of Farrell (1957), later on extended by Charnes et al. (1978) and Banker et al. (1984). This method has been applied numerous times to operational efficiency problems in public sector agencies (schools, airports, hospitals, etc.) as well as in private sector agencies (banks, hotels, airlines, etc.). A major advantage of DEA is that it does not require any a priori-specified functional form of the production technology, since it is − in contrast to traditional production theory − generated from empirical data on observed performance measures (both inputs and outputs). In general, DEA models assess the (in)efficiency of a DMU on the basis of the actual economic distance to the production frontier that gives the highest possible efficiency. The efficiency analysis developed by Charnes et al. (1978) aims to maximize production efficiency in terms of the ratio of total weighted output to total weighted input, subject to the condition that in all circumstances this efficiency measure is smaller than or equal to 1. Thus, the distance to the maximum value 1 is then seen as a measure of inefficiency.
A standard approach in DEA is the estimation of weights, which are calculated in a standard way by specifying a multiple objective maximization model (if there are multiple outputs). In that case, the weights are determined through a maximization exercise faced by each DMU. The following steps are normally undertaken (for more details, see Cracolici and Nijkamp, 2006; Suzuki et al., 2010a; Suzuki et al., 2010b).
First, we have to specify a fractional maximization problem by each DMU (in terms of the ratios of weighted outputs to weighted inputs) with the aim to identify the optimal weights. Secondly, we have to transform the above non-linear maximization problem into a standard linear programming problem in order to compute the input and output weights. This primal linear programming model represents an output-oriented approach, while its dual formulation indicates an input orientation (for a given level of outputs, inputs are minimized). The next step is to check whether the solution to the maximization problem leads to a value 1 for some DMU, in which case this DMU is efficient (i.e., a case of a non-dominated solution), while a value below 1 indicates a case of inefficiency. Clearly, all points on the efficiency frontier have a value of 1. Finally, if one or more inputs or outputs are added to the DEA method, this will affect the selection and the number of efficiently operating DMUs. In general, if more relevant inputs are added, the number of efficient DMUs will rise. Thus, this is a clear reason to pay attention to the

313
specification of the DEA model, while a sensitivity analysis regarding the choice of the inputs or outputs is also desirable.
In Suzuki et al. (2010a, 2010b) a generalized DEA model has been designed, and this will be used in our application. Thus, this new DEA approach is the central tool for explaining differences in the performance of migrant entrepreneurs in Amsterdam, using recently developed software described in Suzuki et al. (2010a, 2010b). The basic idea is that each migrant entrepreneur is a multi-product organization (DMU) that has a set of distinct input descriptors and a set of multiple output (or performance) indicators (for details see Table 2). The relative efficiency in using inputs to generate outputs is then a measure for the economic success of a DMU, where the relative success performance ranges from 0 (i.e. totally inferior efficiency) to 1 (maximum efficiency). The individual results can then be summarized in an integrated survey table.
7. RESULTS OF DATA ENVELOPMENT ANALYSIS AND CROSS-CORRELATION
Data Envelopment Analysis (DEA) can be used to compare efficiency rates across firms. There are several types of DEA, the most basic being CCR, based on the one developed by Charnes, Cooper and Rhoades. However there are also DEAs which address varying returns to scale, either CRS (constant returns to scale) or VRS (variable) returns to scale (Seiford and Trall, 1990). In our case, DEA is applied to an evaluation of efficiency of firms in the high-tech sector. Entrepreneurs are assessed by the set of their inputs and outputs (for input and output values, see Table 1).
7.1. Efficiency analysis results This section presents and interprets the results of our own DEA. DEA is considered to be an important quantitative research tool in efficiency analysis in corporate and other settings (Nijkamp et al., 2009a; Charnes et al., 1978). A general DEA approach was used for our sample of 50 migrant entrepreneurs from the four largest cities in the Netherlands. The results of this analysis are presented in Figure 8, followed by some comments.
Figure 8 illustrates the efficiency rate of our sample of migrant entreprises. It can be therefore observed that 8 out of 50 DMUs are efficient since they have relative efficiency scores of 1.00, which is the maximum score possible, while all the others score lower. 7.2. Cross-analysis results The subsequent step in our statistical analysis was to perform a cross-analysis by taking into consideration some personal characteristics of the entrepreneurs in order to investigate the efficiency of the DMUs with respect to several distinct categories. For this purpose, the personal characteristics taken into account were the generation

314
and the level of educational attainment of the entrepreneurs. The score for each DMU was determined according to the categorization A(1.00), B (0.999-0.750), C(0.749-0.500), D(0.499-0.250) and E(0.249-0.000), where value A refers to a maximum efficiency score, and value E to a minimum efficiency score.
First, we made a distinction between first- and next-generation migrants (see Figure 3). We classified those entrepreneurs who were born in the Netherlands or arrived at an age lower than 12 as next-generation migrants, all the rest fell in the category of first-generation migrants.
Figure 2: Efficiency score of migrant entrepreneurs

315
It is interesting to note that 28.6 per cent of the first-generation DMUs have an efficiency score equal to the maximum value A (1.00), while only 11.1 per cent of the next-generation DMUs have an efficiency score of value A. On the other hand, it is interesting to see that, at the same time, 14.3 per cent of the first-generation DMUs have an efficiency score equal to the lowest value E (0.249-0.000), compared with 11.1 per cent of the next-generation.
A B C D E Total
1st
generation 28.6% 21.4% 21.4% 14.3% 14.3% 100.0% 2nd
generation 11.1% 19.4% 19.4% 38.9% 11.1% 100.0%
Figure 3: Cross-comparative results of business efficiency according to generation
We next look at the education level of the migrant entrepreneurs as a discriminatory variable (See Figure 4). We made a distinction between several levels of education, i.e. high-school, middle vocational (MBO), higher vocational (HBO) and university levels. The cross-analysis on business efficiency according to education level showed some surprising results – the most efficient DMUs with an efficiency score of value A are those with a middle vocational education level (33.3 per cent) and not university level as expected. The next-highest efficiently performing group refers to DMUs with a university level (13.3 per cent), followed by the DMUs with a higher vocational education (9.1 per cent), while no DMUs with high-school education have an efficiency score of value A. Moreover, if we look at the percentage of DMUs with an efficiency score of value E, we can see that most

316
of them have higher vocational education (18 per cent), followed by the DMUs with middle vocational education (8.3 per cent), and those with university education (6.7 per cent). Therefore, by looking at the cross-comparative results on business efficiency according to education level, we can conclude that a higher level of education does not necessarily improve the efficiency score of DMUs.
EDUCATION
A B C D E Total University 13.3% 13.3% 26.7% 40.0% 6.7% 100.0% HBO 9.1% 18.2% 27.3% 27.3% 18.2% 100.0% MBO 33.3% 33.3% 0.0% 25.0% 8.3% 100.0% High-School 0.0% 0.0% 0.0% 100.0% 0.0% 100.0%
Figure 4: Cross-comparative results on business efficiency according to education level
8. CONCLUDING REMARKS Constantly increasing rates of migration over the last few decades have
caused major changes at socio-economic and institutional level of both sending and receiving countries. The growth of the migration flows has, among other things, also led to a rise in the number of entrepreneurs, who are coming from increasingly diverse backgrounds. Migration has not only led to a rise in policy and research interest, but has also prompted heated debates on policy interventions. But there is a need for evidence-based knowledge on the factual inputs of migrants. Our study has aimed to assess the impact of migrants on entrepreneurship through cross-analysis and Data Envelopment Analysis (DEA). The results of our analysis based on the
317
DEA method showed that the performance of migrant entrepreneurs may differ if measured on the basis of their efficiency rate. 8 of our sample of 50 entrepreneurs were efficient. One possible reason for low, or differences in, efficiency rates of migrant entrepreneurs may be the limited potential for growth of their market niches, because several of these entrepreneurs appear to operate in small markets. Other reasons for their low efficiency score may be insufficient (-market) experience and lack of entrepreneurial experience. Institutional and regulatory systems also have an important role in influencing the trajectory of ethnic entrepreneurship; they can encumber or even block the access of migrant firms to new markets. Moreover, an important drawback could also be that in most of the cases the migrant entrepreneurs do not make use of, or are simply not well-informed about, the financial incentives provided by the government.
The results of the cross-correlation also yielded some interesting results. First, by looking at the results of business efficiency according to generation, we noticed that the first-generation migrant entrepreneurs, and not those of the next-generation as we expected, have higher efficiency rates, on the one hand, and higher failure rates, on the other. By looking at the education level of the entrepreneurs and their resulting business efficiency, our study showed that the entrepreneurs with middle vocational education level are the most successful, and not those with higher vocational or university education, as we expected. Therefore, our cross-analysis results have shown that a higher level of education does not necessarily improve the efficiency score of ethnic enterprises.
References Aldrich, H. and Waldinger, R. (1990). "Ethnicity and Entrepreneurship", Annual
Review of Sociology, 16:111-135. Alesina A., Devleschawuer, A., Easterly, W., Kurlat, S. and Wacziarg, R. (2003).
“Fractionalization”, Journal of Economic Growth, 8: 155-194. Alesina A., Baqir, R. and Hoxby, C. (2004). “Political Jurisdictions in Heterogeneous
Communities”, Journal of Political Economy, 112 (2): 384-396. Alesina, A. and La Ferrara, E. (2005). “Ethnic Diversity and Economic
Performance”, Journal of Economic Literature, 63: 762-800. Angrist, J.D., Kugler, A.D. (2003).”Protective or Counter-Productive? Labour
Market Institutions and the Effect of Immigration on EU Natives”, Economic Journal, 113: 302-331.
Banker, R.D., Charnes, A. and Cooper, W.W. (1984). “Some Models for Estimating Technical and Scale Inefficiencies in Data Envelopment Analysis”, Management Science, 30: 1078-1092.
Barrett, G.A., Jones, T.P. and McEvoy, D. (1996). “Ethnic Minority Business: Theoretical Discourse in Britain and North America”, Urban Studies, 33: 783-809.
Baycan-Levent, T., Nijkamp, P. and Sahin, M. (2009). “New Orientations in Ethnic Entrepreneurship: Motivation, Goals and Strategies of New Generation Ethnic

318
Entrepreneurs”, International Journal of Foresight and Innovation Policy, 5: 83-111.
Baycan-Levent, T. and Nijkamp, P. (2009). “Characteristics of Migrant Entrepreneurship in Europe”, Entrepreneurship and Regional Development, 21 (4):375-397.
Beine, M., Docquier, F. and Rapoport, H. (2001). “Brain Drain and Economic Growth: Theory and Evidence”, Journal of Development Economics, 64 (1): 275-289.
Bellini, E., Ottaviano, G.I.P., Pinelli, D., and Prarolo, G. (2008). “Cultural Diversity and Economic Performance: Evidence from European Regions”, HWWI Research Paper 3-14, Hamburg Institute of International Economics.
Boyd, M. (1989). “Family and Personal Networks in International Migration: Recent Developments and New Agendas”, International Migration Review, 23: 638-670.
Carter, S. and Jones-Evans, D. (2006). Enterprise and Small Business, Principles, Practice and Policy, 2nd edition, Prentice Hall, Edinburgh Gate: Harlow.
Casson, M. (1994). The Economics of Business Culture: Game theory, Transaction Costs and Economic Performance. Oxford University Press: New York.
Charnes, A., Cooper, W.W. and Rhodes, E. (1978). “Measuring the Efficiency of Decision Making Units, European”, Journal of Operational Research, 2: 429-444.
Clark, K. and Drinkwater, S. (2000). “Pushed Out or Pulled In? Self-employment among Ethnic Minorities in England and Wales”, Labour Economics, 7: 603-628.
Cracolici, M.F. and Nijkamp, P. (2006). “Competition among Tourist Destinations”, Tourism and Regional Development, In: M. Giaoutzi, and P. Nijkamp, (eds) Ashgate: Aldershot, pp. 133-152.
Das, T.K. and Teng, B.S. (1997). “Time and Entrepreneurial Risk Behavior”, Entrepreneurship Theory and Practice, 22 (2): 69-88.
Delft, H. van, Gorter, C. and Nijkamp, P. (2000). “In Search of Migrant Entrepreneurship Opportunities in The City: A Comparative Policy Study”, Environment and Planning C: Government and Policy, 18: 429-451.
Djankov, S., La Porta R., Lopez-De-Silanes, F., and Shleifer A. (2002). "The Regulation of Entry", Quarterly Journal of Economics, 117 (1):1-37.
Dubini, P. (1988). “The Influence of Motivations and Environment on Business Start-ups: Some Hints for Public Policies”, Journal of Business Venturing, 4: 11–26.
Dumont, J.C., Spielvogel, G. and Widmaier, S. (2010). “International Migration in Developed, Emerging and Developing Countries: An Extended Profile”, OECD Social, Employment and Migration Working Papers no.113.
Easterly, W. (2001). “Can Institutions Resolve Ethnic Conflict?”, Economic Development and Cultural Change, 49 (4): 687-706.
Easterly, W. and Levine, R. (1997). “ Africa’s Growth Tragedy: Policies and Ethnic Division”, Quarterly Journal of Economics, 111 (4): 1203-1250.
Eckhardt, J. and Shane, S. (2003). “The Individual-Opportunity Nexus: A New Perspective on Entrepreneurship”, In: Z. Acs, and D. Audretsch, (eds) Handbook of Entrepreneurship. Kluwer, Boston, MA.
Fairlie, R.W. (2008). “Estimating The Contribution of Immigrant Business Owners to The U.S. Economy”, Working Paper at SBA Office of Advocacy.

319
Fairlie, R. W. and Meyer, B.D. (1996). "Ethnic and Racial Self-Employment Differences and Possible Explanations," Journal of Human Resources, 31(4): 757-793.
Fairlie, R.W. and Meyer, B.D. (2003). “The Effect of Immigration on Native Self-employment”, Journal of Labor Economics, 21 (3): 619-650.
Farrell, M.J. (1957). “The Measurement of Productive Efficiency”, Journal of the Royal Statistical Society, 120: 253-281.
Florida, R. (2002). “ The Economic Geography of Talent”, Annals of the Association of American Geographers, 92: 743-755.
Florida, R. (2003). Cities and the Creative Class. Routledge, New York. Florida, R. and Gates, G. (2001). Technology and Tolerance: The Importance of Diversity
to High-tech Growth, Brookings Institution Press: Washington, DC. Guarnizo, L., Portes, A. and Haller, W. (2003). ‘‘Assimilation and Transnationalism:
Determinants of Transnational Political Action among Contemporary Migrants’’. American Journal of Sociology, 108 (6):1211-1248.
Gigerenzer, G. (2010). “Moral Satisficing: Rethinking Moral Behavior as Bounded Rationality”, Topics in Cognitive Science, 2:528-554.
Gotham, K. F. (2002). “Marketing Mardi Gras: Commodification, Spectacle and The Political Economy of Tourism in New Orleans”, Urban Studies, 39(10): 1735–1756.
Haas, de, H. (2010). “Migration and Development: A Theoretical Perspective”, International Migration Review, 44 (1) :227-264.
Hofstede, G., Noorderhaven, N., Thurik, A., Uhlaner, L., Wennekers, A. and Wildeman, R. (2004). “Culture’s role in Entrepreneurship: Self-employment Out of Dissatisfaction”. In: J. Ulijn, and T. Brown, T. (eds) Innovation, Entrepreneurship and Culture: The Interaction between Technology, Progress and Economic Growth, Edward Elgar: Cheltenham, pp. 162-203.
Jacobs, J. (1969). The economy of cities, Random House: New York. Johannisson, B. (2000). “Networking and Entrepreneurial Growth”. In: D. L. Sexton
and H. Landström (eds), The Blackwell Handbook of Entrepreneurship, Blackwell: Oxford.
Kloosterman, R., Van Der Leun, J. and Rath, J. (1999). “Mixed Embeddedness: (In)formal Economic Activities and Immigrant Businesses in The Netherlands”, International Journal of Urban and Regional Research, 23 (2): 252-266.
Kloosterman, R. and Rath, J. (2001). “Immigrant Entrepreneurs in Advanced Economies: Mixed Embeddedness Further Explored”, Journal of Ethnic and Migration Studies, 27 (2): 189-201.
Kloosterman, R. and Rath, J. (2003). Immigrant Entrepreneurs: Venturing Abroad in the Age of Globalization, Berg Publishers: Oxford.
Kochan, T., Bezrukova, K., Ely, R., Jackson, S., Joshi A., Jehn, K., Leonard, J., Levine, D. and Thomas, D. (2003). “The Effects of Diversity on Business Performance: Report of the Diversity Research Network”, MIT Sloan School of Management. Mimeo.
Koppl, R.G. (1991). "Retrospectives: Animal Spirits", Journal of Economic Perspectives, 5 (3): 203-10.
La Porta, R., Lopez de Silanes, F., Shleifer, A. and. Vishny, R (1999). “The Quality of Government”, Journal of Law, Economics and Organisation, 15(1): 222-279.

320
Lee, N. and Nathan, M. (2010). “Knowledge Workers, Cultural Diversity and Innovation”, International Journal of Knowledge-Based Development, 1(1/2): 53-78.
Levine, P., Lotti, E., Pearlman, J. and Pierse, R. (2010). “Growth and Welfare Effects of World Migration”, Forthcoming, Scottish Journal of Political Economy.
Light, I. and Roach, E. (1996). "Self-Employment: Mobility Ladder or Economic Lifeboat". In: R. Waldinger and M. Bozorgmehr (eds), Ethnic Los Angeles, University of California Press: Berkeley, CA, pp. 193-213.
Marlow, S. (1992). “The Take-up of Business Growth Training Schemes by Ethnic Minority-owned Firms in Britain”, International Small Business Journal, 10 (4): 34-47.
Moises, N. (2002). “ The New Diaspora”, Foreign Policy, 131: 95–96. Montalvo, J. and Reynal-Querol, M. (2005). “Ethnic Diversity and Development”,
Journal of Development Economics, 76(2): 293–323. Nijkamp, P., Stough, R. and Sahin, M. (2009a). “Impact of Social and Human Capital
on Business Performance of Migrant Entrepreneurs – A Comparative Dutch-US study”, Annals of Regional Science (Published Online: 05 January 2010). This article is published with open access at Springerlink.com: DOI 10.1007/s00168-009-0351-2.
Nijkamp, P., Baycan-Levent, T., Gheasi, M., Longhi, S., Masurel, E., Ozgen, C., Poot, J. and Sahin, M. (2009b). “Migration Impact Assessment: An Overview, Tentative Findings And A Framework”, A Quick Scan Document Commissioned By Forum (Utrecht).
Ottaviano, G.I.P and Peri, G. (2006). “The Economic Value of Cultural Diversity: Evidence from US Cities”, Journal of Economic Geography, 6(1): 9-44.
Ozgen, C., Nijkamp, P. and Poot, J. (2010). “Immigration and Innovation in European Regions”, Amsterdam: Department of Spatial Economics, VU University.
Porter, M. E. (1979). “How Competitive Forces Shape Strategy”, Harvard Business Review, 57 (2): 137-145.
Portes, A. (2007). ”Migration, Development, and Segmented Assimilation: A Conceptual Review of The Evidence”, Annals of the American Academy of Political and Social Science, 610:73-97.
Portes, A., Guarnizo L. E. and Landolt, P. (1999). “The Study of Transnationalism: Pitfalls and Promise of an Emergent Research Field”, Ethnic and Racial Studies, 22 (2): 217-37.
Portes, A. and Landolt, P. (2000). “Social Capital: Promise and Pitfalls of Its Role in Development”, Journal of Latin American Studies, 32 (2):529-547.
Pratt, A.C. (2007). Innovation and Creativity, Sage: London, pp. 266-297. Ram, M. and Hillin, G. (1994). “Achieving ―Break-out; Developing Mainstream
Ethnic Minority Business”, Small Business Enterprise and Development, 1: 15-21. Ram, M. and Jones, T. (2009).” Ethnic-minority businesses in the UK: a review of
research and policy developments”, Environment and Planning C, 26(2): 352-374.
Rath, J. (2000). “Introduction; Immigrant Business and the Economic, Politico- Institutional and Social Environment”. In: J. Rath (ed.), Immigrant Business: The Economic, Political and Social Environment, Macmillan Press: London, pp. 1-19.
321
Reichel, A., Mehrez, A.and Altman, S. (1998). “Neve-Ilan, Israel: A Site Selection and Business Feasibility Case Study”, Tourism Management, 19(2): 161–170.
Sahin, M., Rietdijk, M., and Nijkamp, P. (2007). “Is Cultural Diversity a Socio- Economic Opportunity? – A Case of Urban Migrant Entrepreneurs”, Innovation ─ The European Journal of Social Science Research, 22(3): 251-281.
Sahin, M., Todiras, A. and Nijkamp, P. (2011). “An Explanatory Model for the Economic Performance of Migrant Entrepreneurs in the High-tech Sector”, Migration Impact Analysis: New Horizons.
Seiford, L.M. and Thrall, R.M. (1990). Recent Developments in DEA: The Mathematical Programming Approach to Frontier Analysis, Journal of Econometrics, 46: 7–38.
Simon, H.A. (1957). Models of Man, Wiley & Sons: New York. Smallbone, D., Kitching, J. and Athayde, R. (2007), “Ethnic Diversity, Entrepreneurship
and Competitiveness in a Global City”, paper presented at the ICEEM International Colloquium, The University of Bradford School of Management, Bradford, 22-23 March. Transnational family networks 393.
Suzuki, S., Nijkamp, P., Rietveld, P. and Pels, E. (2010a). “A Distance Friction Minimization Approach in Data Envelopment Analysis; An Application to Airport Performance”, European Journal of Operational Research, 207 (2): 1104-1115.
Suzuki, S., Nijkamp, P. and Rietveld, P. (2010b). “Regional Efficiency Improvement by Means of Data Envelopment Analysis through Euclidean Distance Minimization Including Fixed Input Factors: An Application to Tourist Regions in Italy.”. Forthcoming in Papers in Regional Science.
Teixeira, C., Lo, L., and Truelove, M. (2007). “Immigrant entrepreneurship, Institutional Discrimination, and Implications for Public Policy: A Case Study in Toronto”, Environment and Planning C: Government and Policy, 25 (2): 176-193.
Velde, M.E.G. van, Jansen, P.G.W. and Telting, I.A. (2000). Bedrijfswetenschappelijk Onderzoek: Van Probleemstelling tot Presentatie. Baarn: Nelissen.
Verheul, I. and Stel, A. van (2010) In: Bonnet, J., D. Garcia Perez de Lema and H. van Auken H., The Entrepreneurial Society: How to Fill the Gap Between Knowledge and Innovation, Edward Elgar Publishing: Northampton, MA.
Waldinger, R. (1986). “Immigrant Enterprise”, Theory and Society, 15 (1-2): 249-285. Wang, Q. (2010). “Immigration and Ethnic Entrepreneurship: A Comparative Study
in the United States”, Growth and Change, 41(3): 430–458. Yang, J. and Lee, H. (1997). “An AHP Decision Model for Facility Location Selection”,
Facilities, 15 (9-10): 241-254. Zhou, M. (2004). “Revisiting Ethnic Entrepreneurship: Convergences,
Controversies, and Conceptual Advancements”, International Migration Review, 38:1040-74.

322
CHAPTER 11* STRUCTURAL EQUATIONS MODEL FOR ASSESSING THE ECONOMIC PERFORMANCE OF HIGH-TECH ETHNIC ENTREPRENEURS
Abstract In this paper we develop and test a conceptual model of the key relationships concerning the business performance and success of ethnic entrepreneurs. To that end, an explanatory model ‘GALAXY’ is presented which serves as a framework for mapping out the impact that various background factors are assumed to have on the economic performance of ethnic entrepreneurs active in the high-tech sector in four big cities in the Netherlands. The model describes the behavioural and other factors which are grouped into four components: Motivational Factors; Socio-economic Contextual Factors; Policy Factors; and Business Environment. After a first examination of the relationships using ordered logit modelling, the resulting structural equation model is tested by using the AMOS software. The information base of our research comes from a set of extensive survey questionnaires administered to migrant and native entrepreneurs in Amsterdam, Rotterdam, Utrecht and The Hague. With the help of these data, a series of hypotheses on the relationships between the above-mentioned four components and individual firm performance is tested, with particular reference to the success conditions of ethnic entrepreneurs in the high-tech sector. Our structural equation model shows that three of the eight hypothesized paths were statistically significant. Of the three significant paths, only the paths between social networks and pull factors had the direction predicted, while current business location and Business Performance showed a reverse relationship. Key words: migrant entrepreneurship, GALAXY model, ethnic diversity, economic performance
JEL classification codes: L 26, R 11
*Source: Sahin, M., Todiras, A., and Nijkamp, P., Neuts, B., and Behrens, C. (2011), A Structural Equations Model for Assessing the Economic Performance of High-Tech Ethnic Entrepreneurs. In: Tomaz Dentinho and Roberta Capello (eds), Globalization Trends and Regional Development: New Directions in FDI and Human Capital Flows, Edward Elgar, Cheltenham UK (Accepted).

323
1. THE AGE OF MIGRATION 1.1. Introduction
Global migration is increasing at a fast pace; nowadays approximately 3 per cent (215 million) of the world’s population live outside their country of origin (Ratha et al., 2010). While European international migration flows have not increased considerably, at the same time regional mobility inside the European Union is much higher. The main determinants for individuals to relocate to another country are: the unemployment rates, differences in wages, cost of living, provision of public goods and public transfers, costs of moving, and also psychological costs, social networks, etc. (Zaiceva and Zimmermann, 2008; de Haas, 2010). Moreover, the migration propensity also depends on individual human characteristics, with migration decreasing with age and individuals with a higher education having a higher propensity to migrate (de Haas, 2010). Previous studies show that the earliest migrants are usually not those from the poorest regions, as presumed, but those from upper-lower to middle-income countries (de Haas, 2010).
The revolutionary technological and infrastructural developments in recent decades have dramatically changed the migration interface, allowing for the acceleration and transformation of the globalization process. It is especially the latest transportation and telecommunication technologies which have facilitated the upsurge of flows of people, goods, services, knowledge, capital, etc., and which have created opportunities for migrants to maintain transnational ties (de Haas, 2010). According to Coniglio (2008), ‘immigration is extremely important in boosting the efficiency of European labour markets and increasing productivity, and in turn, competitiveness’, and this author argues that strict immigration policies can create considerable distortions and damage to European labour markets. The positive effects of immigration are: (i) increased productivity; (ii) increase of the population of working age; (iii) boosting of trade; and (iv) increased variety of goods and services available in destination countries (Coniglio, 2008).
Most recently, the migration patterns were affected by the 2008 global financial downturn in a number of ways. Migrants, as a vulnerable layer of the host societies, were thus exposed to higher levels of anxiety and depression. Wright and Black’s (2011) study provides an extensive overview of the impacts of the recent crisis on migration outcomes both on the micro- and the macro-level. At the macro-level, the downturn has led to a reduction of welfare spending and the toughening of international migration policy in some host societies. Furthermore, this context has provoked anti-immigration debates which has resulted in greater hostility, marginalization, and discrimination against migrants (Wright and Black, 2011). Another outcome has been an increase of the unemployment rate, especially in some industries such as construction, which has subsequently led to a significant reduction in the remittances that form a great part of the developing countries GDP, as well as being a far more effective instrument for poverty alleviation, income redistribution, and economic growth than the bureaucratic development programmes or
324
development aid (Kapur, 2003). Moreover, at the micro-level, the global downturn has caused numerous tensions in migrant households, among which marital breakdown, increased pressure on women to send remittances, gender-based dietary changes (poverty being more likely to affect women), etc. (Wright and Black, 2011). However, according to Wright and Black (2011), the 2008 global downturn could be regarded as an opportunity for host societies to rethink their policy responses to international migration, thus, for instance, making a shift from a migration regulation approach toward development and poverty reduction strategies.
The issue of migration has numerous aspects worth addressing; however, this paper mainly focuses on the impact of migration on entrepreneurship. Since a large share of the cross-border mobility is due to labour-seeking activity, self-employment might become a necessity when employment opportunities are limited. This increased labour mobility in the Western world has led to a shift from employee labour contracts to self-employment labour contracts (Ibrahim and Galt, 2011). Ibrahim and Galt (2011) argue that a proportion of any minority group will become self-employed due to ‘the changing structure of industries, the development of new industries and the shift to external contracting through markets rather than within organizations’. Wang (2010) finds that migration has boosted migrant business formation in a number of ways, among which, from a market perspective, it has expanded the demand for ethnic products, thus encouraging ethnic businesses that supply exotic products and services. Furthermore, immigration has led to the transformation of the institutional environment that influences the formation and development of ethnic firms. Some governments encourage such entrepreneurial activity, regarding it as a thrust for economic growth and a contributor to solving labour market imbalances in the receiving countries (Baycan-Levent and Nijkamp, 2009; Ibrahim and Galt, 2011). In Europe the share of migrant business ownership is expected to continue growing, and in some countries the rates of self-employed immigrants are exceeding those of the native-born population (Baycan-Levent and Nijkamp, 2009).
1.2. Migrants in business: A world of opportunity
Migrant entrepreneurs are having an increasingly strong impact on the economies of cosmopolitan cities, being an important driving force for economic growth in many US cities. They have made decisive contributions to the US economy for more than a century (Bowles and Kotkin, 2003). The US Census since 1880 shows that immigrants have been more likely to be self-employed than the native-born population, as mentioned above (Bowles and Kotkin, 2003). The boom in immigrant entrepreneurship is also a big phenomenon in Europe. Across the EU, immigrant entrepreneurs are contributing greatly to the European economy, and display a strong capacity and potential for entrepreneurship (Tzilivakis, 2005). In 2000, the 16 million legal immigrants in Western Europe earned more than $460 billion. The number of immigrant entrepreneurs in the EU has increased by about 20 per cent over the past seven years. In the Netherlands, the number of businesses owned by

325
foreigners has tripled since 1986. Research on migrant entrepreneurship has recently been dominated by the study of self-employment, ethnic enclaves, mixed embeddedness, and transnationalism. This literature argues that the foreign-born are more likely to start companies than the native-born (Fairlie, 2008; Light and Rosenstein, 1995). Immigrants have a much higher rate of self-employment than the general population (Light and Bonacich, 1988). Hence, governments in a growing number of countries are taking an active role in promoting entrepreneurship, and are counting on the help of entrepreneurs in creating businesses, and thus providing jobs.
An entrepreneur is a person who is able to act with self-confidence, a leader who shakes existing norms and patterns. In addition, he or she is the person who takes initiatives, accepts risks or failures, and manages resources, materials, and personnel to create value for customers (Hisrich and Peters, 1989). Richard Cantillon observed that an entrepreneur is one who bears the risk of buying and selling products or goods; he is a risk taker who buys products at a certain price and then sells them at an uncertain price, therefore taking a risk. According to Meredith et al. (1982) and Makhbul (2011), entrepreneurs are individuals who have the capability to foresee opportunities, gather the needed resources – time, energy, and money – and take the necessary actions to ensure success. Finally, according to Kuratko and Hodgetts (2004), entrepreneurship is a process of creation and innovation with four dimensional elements — individual, organization, environmental factors, and process, with support from the government, education, and constitution. Entrepreneurs are often driven by passion and opportunity. The reasons for choosing the entrepreneurial lifestyle include the desire to be independent and to be passionate about work, to achieve satisfaction, and to find a motivation for productivity (Minetti et al., 2006).
Apart from these pull factors that focus on the positive attributes of self-employment, which makes it an attractive enterprise entered into by choice alone (de Freitas, 1991), the motivation to enter self-employment can also be related to push factors (Baycan-Levent et al., 2003; de Freitas, 1991). According to Portes and Rumbaut (1996), push factors are the ones that obstruct entry or block opportunities to pursue normal employment in the primary job market, thus forcing new immigrants into self-employment.
1.3. The socio-economic impact of migrant entrepreneurs on the
receiving countries Migrant entrepreneurship plays a central role for the economic development of the receiving countries mainly through the creation of job opportunities for other immigrants who would otherwise be excluded from the mainstream labour market. Moreover, it can consequently reduce the competition with the natives in the labour market (Chrysostome and Lin, 2010).
The rationale behind the self-employment of immigrants can be, according to Chrysostome and Arcand (2009), driven by either necessity or by opportunity.
326
Migrant entrepreneurs in the former category are usually middle-aged men coming from developing countries, with a relatively low educational level, insufficient professional experience, and a reliance on social networks as their primary source of information, labour, and start-up capital. On the other hand, the entrepreneurs in the latter category are known to be highly-educated, less/not reliant on ethnic networks, and more proficient in host country’s language. They target the mainstream markets and have access to financial institutions in the receiving country (Chrysostome and Arcand, 2009).
According to Chrysostome and Lin (2010), among the most prominent non-economic impacts of migrant entrepreneurs are: the development of ethnic communities; migrants’ social integration and recognition; encouragement of entrepreneurial spirit; and the creation of role models for migrants. Moreover, migrant entrepreneurship contributes to the formation of social capital (Zou and Kim, 2006).
Curci and Mackoy (2010) distinguish three levels of migrant entrepreneurs’ integration into the host society: 1) the low level, which is highly segmented and supplies the ethnic market with ethnic products; 2) the middle level, which can be product-integrated (mainstream products for the ethnic market) or market-integrated (ethnic products for the mainstream market); and 3) the high level, which targets the dominant market with a mainstream product.
Moreover, an important aspect of migrant entrepreneurship treated in the literature is that of the effects of returnee entrepreneurs on their home country’s high-tech firms. Filatotchev et al. (2011) define the returnee entrepreneurs as ‘scientists and engineers returning to start up a new venture in their native countries, after several years of business experience and/or education in OECD countries’. These authors (Filatotchev et al., 2011) have found that the returnee entrepreneurs can generate knowledge spillover effects that consequently stimulate innovation in local high-tech firms.
The study of Ndofor and Priem (2011) argues that first- and second-generation immigrant entrepreneurs’ endowments of economic, human, and social capital, together with their degree of social identification with their ethnic community, affect their elemental strategic choice to pursue a venture strategy focused either on their ethnic enclave or on the dominant market. Therefore, the findings of Ndofor and Priem (2011) indicate that there is a strong connection between the social capital of the migrant entrepreneurs and the venture strategy they choose. It has been confirmed that the immigrant entrepreneurs’ strong network ties with their ethnic community will encourage a ethnic enclave strategy. Subsequently, human capital has had a mixed effect on firm strategy. On the one hand, the entrepreneurs with previous managerial experience tended to pursue dominant market strategies, and, on the other hand, those with previous entrepreneurial experience pursued an enclave strategy. Furthermore, no connection was found between the economic capital and the venture strategy chosen (Ndofor and Priem, 2011).
327
The literature on immigrant entrepreneurship has predominantly focused on the first-generation migrants, with increased attention being paid to the markets they serve (in most of the cases, these markets arise within their own immigrant communities), their social networks, their mixed embeddedness, business characteristics, etc. At the same time, the literature on second-generation entrepreneurs is lagging behind, and it is important to shed some light on the entrepreneurship evolution of the latter group since it has some crucial distinct features when compared with the former group. A strong point of difference is the gradual move towards a mainstream clientele, and thus the second-generation is more likely than the first-generation to break out from their own ethnic boundaries where the competition is rather fierce and growth is constrained (Smallbone et al., 2005; Rusinovic, 2008). Another major point of distinction between the first- and the second-generation entrepreneurs is their sectoral choice. Previous studies have shown that first-generation entrepreneurs are predominantly active in the traditional industries (catering, hospitality, retail, etc.), often targeting their ethnic client base with an ethnic product. On the other hand, the following generation is increasingly shifting towards the high-tech sector, targeting a mainstream market with a mainstream product (see Baycan-Levent et al., 2009). Some explanatory factors for this evolution of immigrant entrepreneurship could be a better knowledge of the local language and environment, higher educational attainment, etc.
The aim of this paper is to assess the impact of several fundamental factors on the economic performance of second-generation migrant entrepreneurs, and to see if there is a significant relationship between Business Performance and the main determinant factors of our ‘GALAXY’ model. The structure of this study is as follows: We start with the theoretical background in Section 2, in which we introduce and give an overview of our novel framework ‘GALAXY’. Subsequently, in Section 3, the methodology part, we discuss the hypotheses of this study, and the research design and approach used to test the hypotheses. In Section 4, we present the study methods and empirical results. Study methods used are ordinal logit regression and structural equation modeling and their application to our ‘GALAXY’ model. In the next section, we discuss the results of our empirical investigation. Finally, the last section concludes with concluding remarks.
1.4. International positioning of the GALAXY model Empirical studies about the contributions of immigrant high-tech entrepreneurs have generally been restricted to particular countries or regions in countries. High-tech start-ups are founded by people who are able to recognize and exploit entrepreneurial opportunities (Shane and Venkataraman, 2000). According to Hart and Acs (2011) the foreign-born have both advantages and disadvantages with respect to the native-born in high-tech entrepreneurship. Florida (2002) suggests that immigrant high-tech entrepreneurs recognize different opportunities than their native-born counterparts.
328
Kirzner (1973) claims that entrepreneurs are more ‘alert’ to opportunities than others. In the Kirznerian sense, immigrants may be more ‘alert’ than the native-born. ‘Alertness’ is difficult to measure, but there are other factors, which are also typical prerequisites for recognizing high-tech business opportunities, such as formal knowledge acquired from education and skills gained from work experience (Bullvaag et al., 2006). Hart et al. (2009) claim that, even though immigrant entrepreneurs are more alert, more knowledgeable, and more creative, they still face obstacles in recognizing high-tech opportunities that do not challenge most natives. Language proficiency in general is the most important determinant of immigrant success in the labour market (Borjas, 1999). And the language barrier, for instance, may impede opportunity recognition.
Hart and Acs (2011) investigated high-tech immigrant entrepreneurship in the United States. Hart and Acs (2011) found that immigrants have played an important role in founding some of the nation’s most important businesses. Immigrant enterprises operate in the same industries as their native-founded counterparts, are about the same size, and have about the same level of technological performance. In that study, three multivariate analyses are carried out that compare high-impact, high-tech firms that have at least one immigrant in their founding teams with those that were founded by native-born entrepreneurs. The authors (Hart and Acs, 2011) found that the two groups of firms are not significantly different with respect to economic and technological performance.
A study of Hart et al. (2009) on high-tech entrepreneurship among migrants in the US has identified important similarities and discrepancies between native-founded and immigrant-founded businesses. The commonalities and differences between the two founding groups are the size and the industries they operate in. The distinctive factor of the immigrant businesses is related to the location decision, in many cases these businesses decide to locate in those states where there are large immigrant groups. Yet another distinction concerns the existence of the companies’ strategic relationships with foreign firms, which, according to the study of Hart et al. (2009), are almost twice as probable in the case of migrant-founded firms.
2. THEORETICAL BACKGROUND: THE GALAXY MODEL FOR ANALYSING THE PERFORMANCE OF ETHNIC ENTREPRENEURS
2.1. A systemic description: Entrepreneurial success and ethnicity Entrepreneurial success is complex and difficult to measure (Shane and Venkataraman, 2000). Moreover, the measurement of business success draws from different approaches (Sexton and Bowman-Upton, 1990), with each approach having different limitations in terms of evaluation, validity, reliability, availability, accuracy, etc. Therefore, entrepreneurial success has been defined in different ways. The easiest definition is through tangible elements, such as revenue or a firm’s growth, personal wealth creation, profitability, sustainability, and turnover (Perren, 1999; Amit et al., 2000). Watson et al. (1998) and Dafna (2008) associate entrepreneurial

329
success with continued trading, and entrepreneurial failure with unrewarding or ceased trading. According to Bailom et al. (2007), business success factors refer to: (a) profitability; (b) growth; (c) advantageous market position with regard to quality, brands, etc.; and (d) subjective assessment by the most senior executives to ascertain how well the company is prepared for the competitive conditions and challenges of the future.
The literature on how businesses need to operate to achieve success relates to works on business survival, and growth in sales and profitability, as well as in growth in the size of the firm (Bates, 1990; Hall, 1992; Kalleberg and Leicht, 1991). Entrepreneurs with relatively higher levels of managerial performance – whether as a result of their managerial experience, education and training in management, or their personal traits – are likely to pursue entrepreneurial activities with potentially larger returns (Bhide, 2000; Cassar, 2004). Both managing innovation, R&D and change (Chakrabarti, 1990; Deeds and Rothaermel, 2003) and networking (Anand and Khanna, 2000; Duysters et al., 1999; Walter et al., 2006; Dafna, 2008) are found to stimulate sales. The management practices of business owners have been repeatedly found to be positively associated with business success (Barney, 1991; 2001; Zahra, 2007). The entrepreneur’s managerial performance (i.e. capabilities, personal abilities) is also associated with business growth (Barney, 1991; 2001), i.e. number of employees. Employees are a critical resource in the achievement and maintenance of any growth (Bhide, 2000; Flamholtz and Randle, 2000; Greiner, 1998; Watson, 2006), and thus effective management of their employees enhances entrepreneurs’ business success. Studies show that the most important managerial functions for achieving growth in the number of employees relate to effectively managing people in terms of empowerment, feedback, and personal development, and rewarding the employees (Weitzman and Kruse, 1990; Zenger, 1992).
Entrepreneurial factors that contribute to the success of entrepreneurs from previous studies refer, according to Say (1971), to the possession of outstanding qualities, especially in decision making, and the need for achievement (McClelland, 1961). Other outstanding qualities include an internal locus of control (Rotter, 1966), self-confidence, independence (Hisrich and Gracher, 1995), and innovativeness, as well as good communication and decision-making skills (Cox and Jennings, 1995). An entrepreneur must also be able to face any situation effectively during the formation of a new venture. Risk taking is an important factor in developing a strong entrepreneurial personality, which is useful for business activities (Wadhaw, 1998). Other characteristics of successful entrepreneurs include high self-efficacy, opportunity recognition, perseverance, and social skills (Markman and Baron, 2003). Hodgetts and Kuratko (1992) confirm that characteristics such as being creative and having good interpersonal, mental and technical skills, all contribute to an entrepreneur’s success. In addition, being goal-oriented, pragmatic, determined, flexible, and self-confident are distinguished as attributes that add value to entrepreneurs (Nandram, 2002). Another important factor that contributes to successful entrepreneurs is knowledge that is gained from various sources such as
330
training, or personal experience through formal or informal education (Aldrich and Martinez, 2001). Leadership is also another pertinent factor that contributes significantly to business success (Dafna, 2008; Jong and Hartog, 2007). Entrepreneurs need two types of leadership competencies in order to succeed, including functional and self-competencies (Swiercz and Lydon, 2002). Functional competencies consist of four performance subsystems (i.e. operations, finance, marketing, and human resources), while self-competencies include intellectual integrity, promoting the company rather than the individual leader, utilizing external advisors, and creating a sustainable organization. Although there is a robust theory, for instance, on the relationship between entrepreneurial success and gender (Alsos et al., 2006; Boden and Nucci, 2000; Grilo and Irigoyen, 2006; Dafna, 2008), with most studies showing that women entrepreneurs are less successful in turning their managerial performance into successful and profitable enterprises (Carter et al., 1997; Du Reitz and Henrekson, 2000), studies on entrepreneurial success and ethnicity are scarce.
In the last decade, a number of empirical studies have suggested that differences between the genders in managerial performance can be explained by cultural factors, such as nationality. Managerial performance has been found to differ across nationalities, both in terms of perceptions of what determines managerial performance, and in terms of management practices (Atuahene-Gima and Ko, 2001; Neelankavil et al., 2000; Steensma et al., 2000). The existing literature has revealed positive relationships between managerial functions related to innovation, business longevity (Gagnon et al., 2000) and turnover from sales (Chakrabarti, 1990; Deeds and Rothaermel, 2003); and that a greater focus on leading change (Chakrabarti, 1990; Deeds and Rothaermel, 2003) has also stimulated business turnover from sales.
Furthermore, the success of entrepreneurs is influenced by support from others, which can be both formal and informal support. Formal support comes in the form of financial, technology, and strategic partnerships or industrial contacts (Carrier et al., 2004), while informal support may come from personal and community-based networks (Baycan-Levent et al., 2003). Many other variables may contribute to the success or failure of businesses, and these may vary from business to business. Some examples of these variables refer to geographical location, prior experiences in entrepreneurial start-ups, and education and training level (Bruner, 2011). According to Bruner (2011), migrant businesses may have different variables that may contribute, or be a barrier, to success.
The odds of survival of migrant firms depend on multiple factors, among which are: psycho-behavioural factors (risk-taking propensity and commitment); ethno-cultural factors (ethnic networks, and ethnic market niche); financial factors (start-up capital and emergency loans); managerial factors (educational attainment and previous professional experience), and institutional factors (Chrysostome and Arcand, 2009). In a previous study we proposed a model: namely ‘GALAXY’, that identifies the factors that have a crucial impact on the Business Performance of

331
business entrepreneurs. We included in our model factors ranging from the individual level to the macro-level. These are four main factors: the Motivational Factors, Business Environment, Socio-economic Contextual Factors, and Policy Factors (Sahin et al., 2011 a,b).
There are three most significant Motivational Factors (MTF). The first is the entrepreneurial animal spirit that overcomes inaction caused by uncertainty. This trait is linked to the motivational pull factors (Baycan-Levent et al., 2003), and the opportunity-driven rationale (Chrysostome and Arcand, 2009). The second motivational characteristic which is rather important, especially in the case of the migrant entrepreneurs who are far more disadvantaged than the local entrepreneurs, is bounded rationality, which is based on an ecological rather than a logical view of behaviour (Gigerenzer, 2010). This characteristic will allow the entrepreneur to make decisions, disregarding such hurdles as risk and uncertainty, complexity, and incomplete information about alternatives (March, 1978). As such, bounded rationality is associated with motivational push factors (Baycan-Levent et al. 2003; Chrysostome and Arcand, 2009), since it encompasses cognitive limitations to entrepreneurial decision making. The third crucial motivational factor for migrant entrepreneurship is the migrants’ social networks, since these networks provide access to financial and physical resources, information, and human capital, as well as helping to reduce their transaction costs (Rath, 2000; Johannisson, 2000; van Delft et al., 2000; Clark and Drinkwater, 2000; Aldrich and Waldinger, 1990; Baycan-Levent and Nijkamp, 2009).
In the set of Socio-economic Factors (SEF) we have included the business culture, which can have a considerable impact on the economic performance of enterprises. According to Casson (1994), a strong business culture can reduce the transaction costs and increase performance. The other factor is access to markets, which in the case of immigrant enterprises is much more limited compared with the local enterprises. This could, on the one hand, be due to the limited knowledge of certain business environments, local language, limited skills, and the previous experience of the ethnic entrepreneur, or it could be the case that certain countries have policy measures that limit the access of immigrants to certain markets.
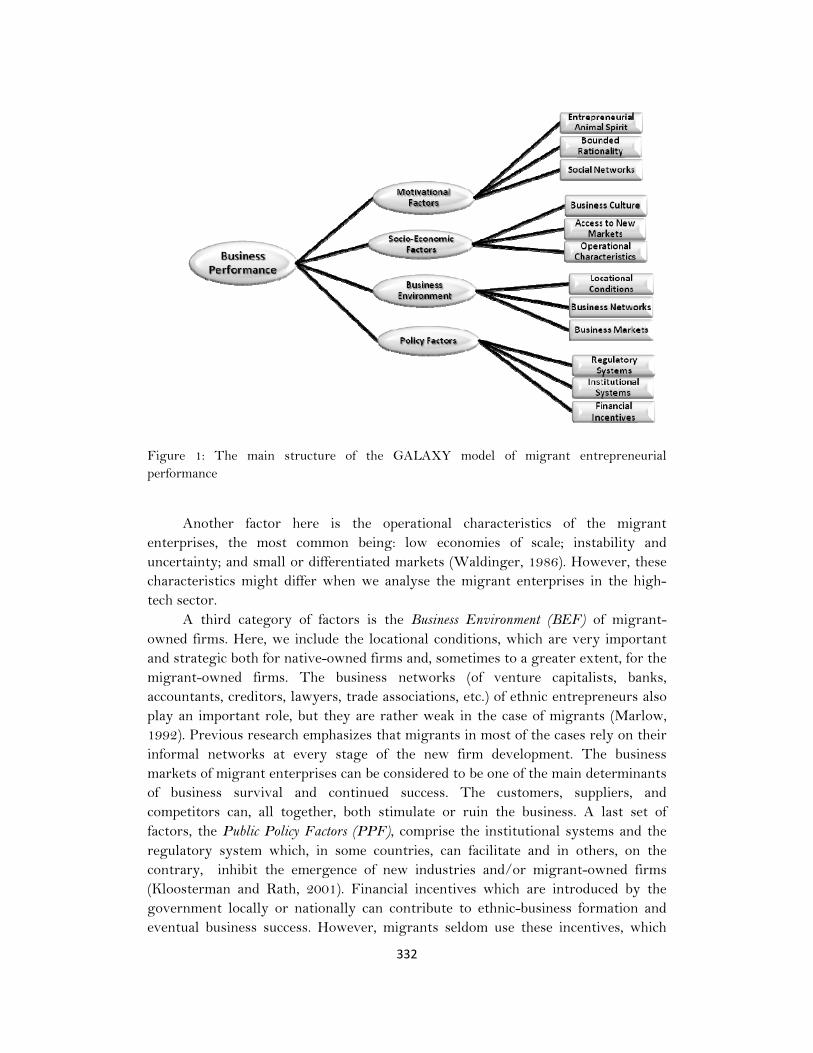
332
Figure 1: The main structure of the GALAXY model of migrant entrepreneurial performance
Another factor here is the operational characteristics of the migrant enterprises, the most common being: low economies of scale; instability and uncertainty; and small or differentiated markets (Waldinger, 1986). However, these characteristics might differ when we analyse the migrant enterprises in the high-tech sector.
A third category of factors is the Business Environment (BEF) of migrant-owned firms. Here, we include the locational conditions, which are very important and strategic both for native-owned firms and, sometimes to a greater extent, for the migrant-owned firms. The business networks (of venture capitalists, banks, accountants, creditors, lawyers, trade associations, etc.) of ethnic entrepreneurs also play an important role, but they are rather weak in the case of migrants (Marlow, 1992). Previous research emphasizes that migrants in most of the cases rely on their informal networks at every stage of the new firm development. The business markets of migrant enterprises can be considered to be one of the main determinants of business survival and continued success. The customers, suppliers, and competitors can, all together, both stimulate or ruin the business. A last set of factors, the Public Policy Factors (PPF), comprise the institutional systems and the regulatory system which, in some countries, can facilitate and in others, on the contrary, inhibit the emergence of new industries and/or migrant-owned firms (Kloosterman and Rath, 2001). Financial incentives which are introduced by the government locally or nationally can contribute to ethnic-business formation and eventual business success. However, migrants seldom use these incentives, which
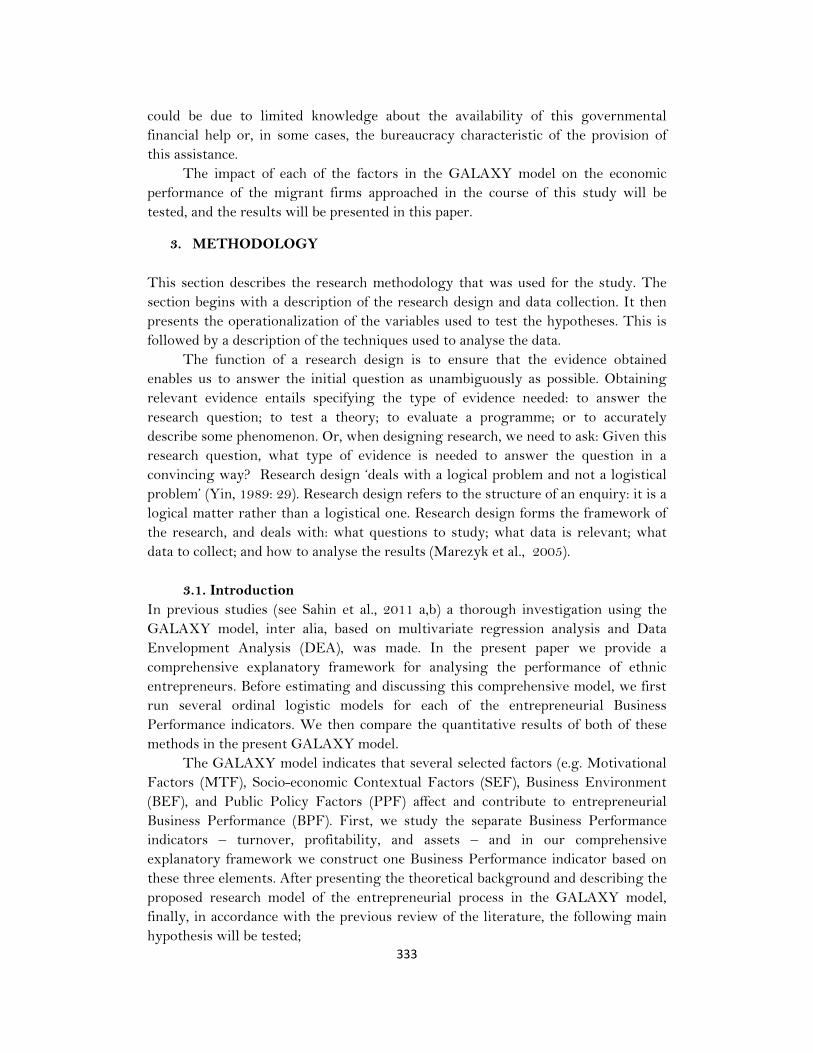
333
could be due to limited knowledge about the availability of this governmental financial help or, in some cases, the bureaucracy characteristic of the provision of this assistance.
The impact of each of the factors in the GALAXY model on the economic performance of the migrant firms approached in the course of this study will be tested, and the results will be presented in this paper.
3. METHODOLOGY
This section describes the research methodology that was used for the study. The section begins with a description of the research design and data collection. It then presents the operationalization of the variables used to test the hypotheses. This is followed by a description of the techniques used to analyse the data.
The function of a research design is to ensure that the evidence obtained enables us to answer the initial question as unambiguously as possible. Obtaining relevant evidence entails specifying the type of evidence needed: to answer the research question; to test a theory; to evaluate a programme; or to accurately describe some phenomenon. Or, when designing research, we need to ask: Given this research question, what type of evidence is needed to answer the question in a convincing way? Research design ‘deals with a logical problem and not a logistical problem’ (Yin, 1989: 29). Research design refers to the structure of an enquiry: it is a logical matter rather than a logistical one. Research design forms the framework of the research, and deals with: what questions to study; what data is relevant; what data to collect; and how to analyse the results (Marezyk et al., 2005).
3.1. Introduction In previous studies (see Sahin et al., 2011 a,b) a thorough investigation using the GALAXY model, inter alia, based on multivariate regression analysis and Data Envelopment Analysis (DEA), was made. In the present paper we provide a comprehensive explanatory framework for analysing the performance of ethnic entrepreneurs. Before estimating and discussing this comprehensive model, we first run several ordinal logistic models for each of the entrepreneurial Business Performance indicators. We then compare the quantitative results of both of these methods in the present GALAXY model.
The GALAXY model indicates that several selected factors (e.g. Motivational Factors (MTF), Socio-economic Contextual Factors (SEF), Business Environment (BEF), and Public Policy Factors (PPF) affect and contribute to entrepreneurial Business Performance (BPF). First, we study the separate Business Performance indicators – turnover, profitability, and assets – and in our comprehensive explanatory framework we construct one Business Performance indicator based on these three elements. After presenting the theoretical background and describing the proposed research model of the entrepreneurial process in the GALAXY model, finally, in accordance with the previous review of the literature, the following main hypothesis will be tested;

334
“Policy Factors (PPF), Motivational Factors (MTF), Business Environment Factors (BEF), and Socio-economic Factors (SEF) have a significant influence on Business Performance (BPF)”.
H0: There is no significant relationship between PPF, MTF, BEF, SEF and BPF.
H1: There is a significant relationship between PPF. MTF, BEF, SEF and BPF.
This main hypothesis can subsequently be broken down into a set of sub-hypotheses, which test the individual relationships between the factors and Business Performance. The first sub-hypotheses concern the Motivational Factors. From the earlier literature review, three motivational sources were identified as: push factors (MTF1), availability of social networks (MTF2), and pull factors (MTF3). We suspect different entrepreneurial motivations will have a different effect on Business Performance,:
H2a: Motivational push factors (MTF1) have a negative influence on Business Performance (BPF).
H2b: Social networks (MTF2) have a positive influence on Business Performance (BPF).
H2c: Motivational pull factors (MTF3) have a positive influence on Business Performance (BPF).
The two Socio-economic Contextual Factors, relating to operational characteristics concerning the use of the Internet (SEF1) and new market access through innovation (SEF2), are both hypothesized to have a significant positive relationship on Business Performance:
H3a: Operational characteristics concerning Internet use (SEF1) have a positive influence on Business Performance (BPF). H3b: New market access through innovation (SEF2) has a positive influence on Business Performance (BPF).
Public Policy Factors relate primarily to the level of information gathered concerning the different policy aspects of entrepreneurship and the source of this information. The hypothesis about this relationship is as follows:
H4: Public Policy Factors (PPF) have a positive influence on Business Performance (BPF).
Finally, the Business Environment factor (BEF) is primarily concerned about the location of the enterprise: both the current location (BEF1) and the start-up
335
location (BEF2) are expected to relate to Business Performance, with businesses operating from home thought to be less efficient.
H5a: A current location at a facility away from the home (BEF1) has a positive influence on business performance (BPF) H5b: A start-up location at a facility away from the home (BEF2) has a positive influence on business performance (BPF)
Our study used the above-mentioned factors to relate them to overall Business Performance. We investigated how entrepreneurs perform, and whether they have an increase in turnover, profitability, and assets.
3.2. Research design and approach
Our study analyses the main factors that have an impact on the economic performance of second-generation migrant entrepreneurs in the high-tech sector in four large cities in the Netherlands: Amsterdam, Rotterdam, Utrecht, and The Hague. In our study second- or next-generation migrants refer to those individuals born in the Netherlands with at least one parent of foreign origin. The sample in our study consists of a total of 212 entrepreneurs, who are predominantly of Turkish origin, and also few of Moroccan, Surinamese, and Antillean origin, who are active in the high-tech sector (e.g. ICT), and non-traditional sectors (e.g. FIRE (Finance, Insurance and Real Estate) and tourism services) that all require highly-educated and skilled labour.
The contributions of immigrants to job creation have not remained limited to ethnic niches and markets, but they have enlarged their market orientation to new sectors other than traditional ones and have become more active in the creative industries. In this study, we focus on the high-tech sector related to the advanced producer services, and knowledge-intensive business services (KIBS). Selected categories of advanced producer services are Finance, Insurance and Real Estate (FIRE), and business related professional services. Business services have been defined as “knowledge- and information intensive”, and have been recognized as providers of strategic inputs to the rest of the system (Antonelli, 1998; Guerrieri and Meliciani, 2005). KIBS form a category of service activities which is often highly innovative in its own right, as well as facilitating innovation in other economic sectors, including both the industrial and manufacturing sectors. KIBS industries were defined as: (a) private companies or organizations; (b) relying heavily on professional knowledge (i.e. knowledge or expertise related to a specific technological discipline or technical functional domain); and (c) supplying intermediate products and services that are knowledge based. According to Den Hertog (2000), KIBS actually cover a rather wide range of services: namely, those KIBS that derive their intermediate function primarily from the production and transfer of technology-related knowledge, including, among others, engineering services and IT service firms.
336
The empirical data of our research was gathered from a self-administered online survey conducted in 2010 and 2011. The response rate was rather low: only 10 per cent of the targeted entrepreneurs provided complete answers to our questionnaire. A more detailed presentation of the ethnic composition of our sample and its distribution in the four biggest Dutch cities is beyond the scope of this article, but is included in another more descriptive study (see Sahin et al., 2012). This publication also contains a comparison of the selected groups. In order to determine the appropriate sample size we had to make a number of decisions: for instance, how representative the sample size would be and what methods would be used for the data analysis. This data uses Ordinal Logistic Regression, Factor Analysis, and Structural Equation Modeling (SEM), and therefore the sample choice is largely dependent on multivariate analysis requirements. One of the central requirements of this study was to have a sample size higher than 100 (Hair et al., 1998). However, Kline (2010) asserts that a ‘typical’ sample size in studies where SEM is used is about 200 cases, a number which corresponds to the approximate median sample size in surveys of published articles in which SEM results are presented. Therefore, a final sample size of 212 entrepreneurs was used in this study.
Our strategy for the design of the survey questionnaire was to keep it focused and short, aiming for completion within 5 to 10 minutes. To help maximize response rates, we attended network events, and asked two student-assistants to approach entrepreneurs and help them to complete the questionnaires. The questionnaire was designed in accordance with the GALAXY model, a theoretical model that takes into consideration the multiple factors that are presumed to affect the Business Performance of migrant entrepreneurs. Therefore, in order to empirically test this model we connected the questions in the questionnaire to the factors in the model. When constructing the questionnaire, we wanted to capture all the dimensions of our GALAXY model in order to be able, at a later stage, to determine the level of influence of each factor on the Business Performance of migrant entrepreneurs. The questionnaire has three parts. The first part covers the general information about the enterprise, including information about age, gender, ethnicity, and education of the entrepreneur, as well as the sector and type of the organization, etc. The second part comprises questions relating to the main factors in the GALAXY model: Motivational Factors, Business Environment, Socio-economic Contextual Factors and Policy Factors. The final part comprises questions that would help us assess the Business Performance of the enterprises. The questionnaire was initially written in English. Afterwards, as suggested by Saunders et al. (2006), a pilot study of the questionnaire was carried out on a sample of 20 people, among which were entrepreneurs of different nationalities and our fellow colleagues. It helped us determine whether all the questions were interpreted properly by the respondent, and it also helped test the reliability and validity of each question in capturing the desired information. Therefore, the feedback from the test helped us make final adjustments to the questionnaire before sending it out to the targeted groups. We removed a few questions that were not relevant for our study, especially some of the

337
open-ended questions, as recommended by the test respondents. Furthermore, the pilot study helped us determine the time required to complete the questionnaire. When all the improvements had been made, the questionnaire was translated from English to Dutch.
The primary goal of this study is to assess the impact of several fundamental factors on the economic performance of second-generation migrant entrepreneurs. Our GALAXY model was constructed accordingly, with all the main factors included in the model, i.e. the Motivational Factor, the Socio-economic Contextual Factor, the Business Environment Factor, and the Policy Factor. These serve as independent input factors for the overall Business Performance of the migrant entrepreneurs. Therefore, after we had collected all the responses from our online survey, we next selected, from the full range of questions, those which could be interpreted as indicators for the input factors mentioned above. In addition, a few questions served as indicators for our output factor – Business Performance. Table 1 gives an overview of the survey items that were selected and their relationship to the theoretical GALAXY model.
Table 1 Survey questions, measurement level, and link with GALAXY factors Factors Survey questions Measurement level
MTF1 Push factors (bounded rationality) MF1.1 No recognition of diploma Ordinal (1 to 5)
MF1.2 Poverty Ordinal (1 to 5)
MF1.3 Unemployment Ordinal (1 to 5)
MF1.4 Family business continuation Ordinal (1 to 5)
MF1.5 Discrimination Ordinal (1 to 5)
MF1.6 Following the role model Ordinal (1 to 5)
MTF2 Social networks MF2.1 Employees from own ethnic group in 2009 Ordinal (0 to 3)
MF2.2 Employees from own ethnic group in 2010 Ordinal (0 to 3)
MF2.3 Employees from different groups in 2009 Ordinal (0 to 3)
MF2.4 Employees from different groups in 2010 Ordinal (0 to 3)
MF2.5 Family members as employees in 2009 Ordinal (0 to 3)
MF2.6 Family members as employees in 2010 Ordinal (0 to 3)
MTF3 Pull factors (animal spirit) MF3.1 Challenge Ordinal (1 to 5)
MF3.2 Motivating others Ordinal (1 to 5)
MF3.3 Better position Ordinal (1 to 5)
MF3.4 Realizing idea Ordinal (1 to 5)
SEF1 Operational characteristics SF1.1 Transactions with customers Dichotomous (yes/no)
SF1.2 Transactions with suppliers Dichotomous (yes/no)
SF1.3 Contact with suppliers Dichotomous (yes/no)
SF1.4 Contact with customers Dichotomous (yes/no)
SF1.5 Electronic taxation Dichotomous (yes/no)
SEF2 Access to new markets SF2.1 New customer service Dichotomous (yes/no)
SF2.2 Training for employees Dichotomous (yes/no)
SF2.3 New product process in 2009 Dichotomous (yes/no)
SF2.4 New services Dichotomous (yes/no)
SF2.5 New market Dichotomous (yes/no)
PPF Public policy factors PF1.1 Advice of friends Dichotomous (yes/no)
PF1.2 Advice of network organization Dichotomous (yes/no)
PF1.3 Advice of customers Dichotomous (yes/no)
PF1.4 Advice of consultant Dichotomous (yes/no)
BEF1 Current location BE1 Current location of enterprise Categorical
BEF2 Start‐up location BE2 Start‐up location of enterprise Categorical
BPF Business Performance BP1.1 Profitability Ordinal (1 to 5)

338
BP1.2 Revenue Ordinal (1 to 5)
BP1.3 Assets Ordinal (1 to 5)
The first independent variable Motivational Factor (MTF) is divided into three dimensions concerning animal spirit (MTF3), bounded rationality (MTF1), and social networks (MTF2). The latter are employed by this study since they are frequently investigated and cited in the specialty literature. Furthermore, these can be considered as factors that focus on the individual characteristics of the entrepreneur. The second independent variable Socio-economic Contextual Factor (SEF) is constructed from dimensions referring to the access to new markets (SEF2) and the operational characteristics (SEF1), and therefore here we have investigated the indicators at the enterprise level. The value of the third independent variable Business Environment (BEF) was assessed by looking at its main components i.e. the start-up and current locational conditions (BEF1 and BEF2). We have chosen these two components since they can project the micro-environment in which the entrepreneurs are active. We have also used the independent input variable Policy Factor for the information gathering concerning entrepreneurial policies (PPF). We consider this fourth and last input factor to have a crucial role in the whole entrepreneurial process, but predominantly in its early phase.
From Table 1 it can be clear that some dimensions had more than one indicator, and thus we had to cluster them and then recompute them into a single factor. This was done in the early stages of our research by performing both an explanatory factor analysis and a reliability check in order to investigate both the undimensionality and the reliability of the constructs for further analysis. This analysis, and the subsequent structural equation modeling will be discussed next.
4. STUDY METHODS AND EMPIRICAL RESULTS
4.1 Ordinal Logistic regression
As stated before, we first study the three different elements of entrepreneurial Business Performance separately. We estimate three different models for, respectively, assets, turnover and profitability . The dependent variable is the ordinal response to each of these three questions in the survey, i.e. respondents indicate whether their profitability ‘strongly decreased’, ‘decreased’, ‘remained the same’, ‘increased’, or ‘strongly increased’. In order to explain the dependent variable we use explanatory, predictor, variables mainly including a selection of the motivational, socio-economic, business environment and policy factors mentioned in the theoretical GALAXY framework and the hypotheses, as stated in the Introduction of this chapter. Because of the clearly ordered nature of the responses in the data, the most appropriate method to use is what is called the ordered logistic regression model (for further econometric details and considerations, see, e.g., Train, 2003). Below we discuss our ordered logistic regression models for assets, turnover and profitability. Each of the three models follows the main structure of:

339
0 1 1 2 2 3 3 4 1 5 2 6 7 1 8 2Prob Turnover outcome MTF MTF MTF SEF SEF PPF BEF BEF
.(1)
For each of the models, we assume that the error terms follow a logistic distribution, and therefore we estimate ordinal logit models. So, the probability of observing a certain response (e.g. ‘strongly increased’) to one of the business indicators depends on all explanatory variables and the error term. Furthermore, each of the explanatory factors mentioned in equation 1 can be disentangled into the separate questions asked during the survey. While the interpretation of the coefficients in these kind of models is ambiguous due to the nature of the specified logistic distribution, the signs of the coefficients and their relative values give important insights into the effects of the classified factors on entrepreneurial Business Performance. The sign of a coefficient indicates the effect of the specific level (i.e. ‘strongly disagree’) of that factor (i.e. poverty) relative to the effect of the reference category (i.e. ‘strongly agree’). Setting the effect of the reference category equal to zero, a negative (positive) coefficient of a certain factor level (i.e. ‘strongly disagree’) indicates that the probability of being in a “higher” cumulative outcome category (i.e. ‘strongly increased’) is lower (higher) compared with someone answering the reference level. In general, it is the case that a greater coefficient indicates a greater probability of being in one of the “higher” cumulative outcome categories.
Assets
Table 2 shows the estimation results of the significant explanatory variables when estimating equation 1 for assets (the full estimation results are available on request). Regarding our eight hypotheses, we conclude that certain elements of the Motivational Factors (push and pull factors and social networks), socio-economic factors (access to new markets) and Public Policy Factors have a significant effect on assets at the 5 per cent significance level. Therefore, we then conclude that we cannot find supportive evidence for Hypotheses H5a and H5b (Business Environment Factors) with respect to assets.
According to Hypothesis H2a, we expect a negative influence of motivational push factors (MTF1) on Business Performance. Our results show that the third and fourth indicators of the motivational push factor (unemployment and family business continuation) are the only elements which have a significant effect. If the respondent indicates that ‘job loss’ is not the reason to start a business, a positive growth in assets is more likely than if the respondent started up the business for the reason of unemployment. The response towards the ‘family business continuation’ question shows a similar pattern. In particular the ‘disagree’ and ‘neutral’ levels show a positive and significant effect. Hence, these model results support our Hypothesis H2a. The effect of employees from different groups and different ethnic groups is
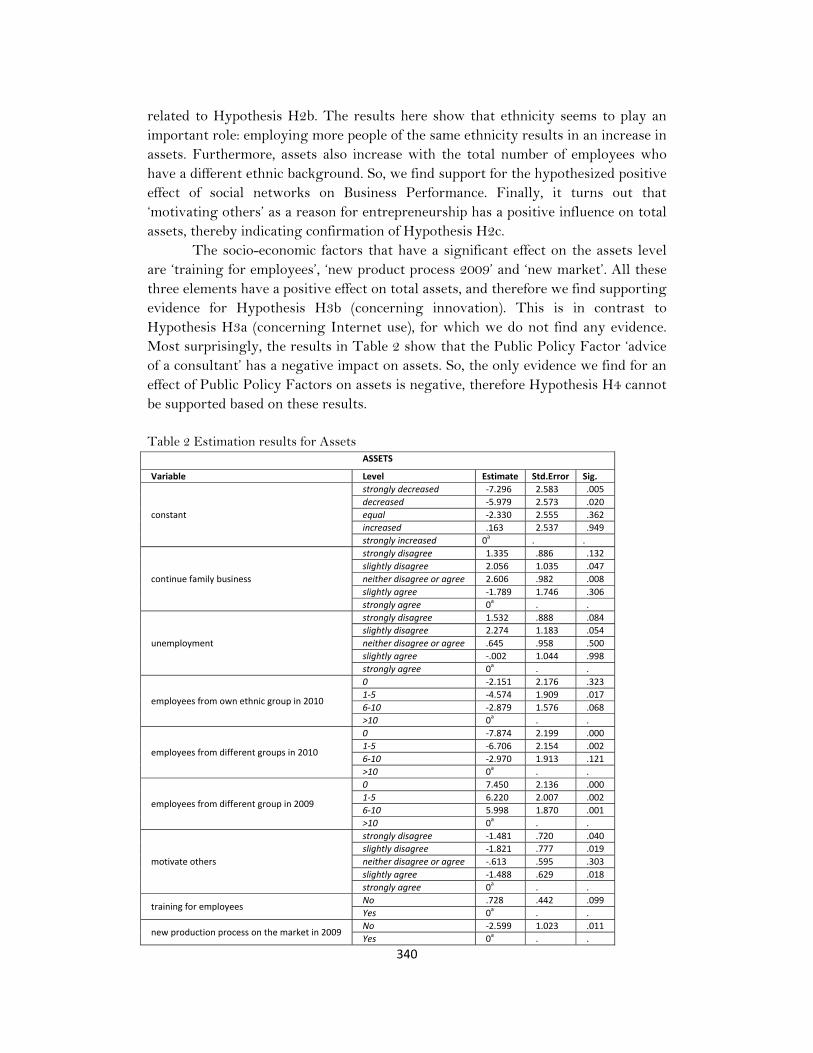
340
related to Hypothesis H2b. The results here show that ethnicity seems to play an important role: employing more people of the same ethnicity results in an increase in assets. Furthermore, assets also increase with the total number of employees who have a different ethnic background. So, we find support for the hypothesized positive effect of social networks on Business Performance. Finally, it turns out that ‘motivating others’ as a reason for entrepreneurship has a positive influence on total assets, thereby indicating confirmation of Hypothesis H2c.
The socio-economic factors that have a significant effect on the assets level are ‘training for employees’, ‘new product process 2009’ and ‘new market’. All these three elements have a positive effect on total assets, and therefore we find supporting evidence for Hypothesis H3b (concerning innovation). This is in contrast to Hypothesis H3a (concerning Internet use), for which we do not find any evidence. Most surprisingly, the results in Table 2 show that the Public Policy Factor ‘advice of a consultant’ has a negative impact on assets. So, the only evidence we find for an effect of Public Policy Factors on assets is negative, therefore Hypothesis H4 cannot be supported based on these results. Table 2 Estimation results for Assets
ASSETS
Variable Level Estimate Std.Error Sig.
constant
strongly decreased ‐7.296 2.583 .005
decreased ‐5.979 2.573 .020
equal ‐2.330 2.555 .362
increased .163 2.537 .949
strongly increased 0a
. .
continue family business
strongly disagree 1.335 .886 .132
slightly disagree 2.056 1.035 .047
neither disagree or agree 2.606 .982 .008
slightly agree ‐1.789 1.746 .306
strongly agree 0a
. .
unemployment
strongly disagree 1.532 .888 .084
slightly disagree 2.274 1.183 .054
neither disagree or agree .645 .958 .500
slightly agree ‐.002 1.044 .998
strongly agree 0a
. .
employees from own ethnic group in 2010
0 ‐2.151 2.176 .323
1‐5 ‐4.574 1.909 .017
6‐10 ‐2.879 1.576 .068
>10 0a
. .
employees from different groups in 2010
0 ‐7.874 2.199 .000
1‐5 ‐6.706 2.154 .002
6‐10 ‐2.970 1.913 .121
>10 0a
. .
employees from different group in 2009
0 7.450 2.136 .000
1‐5 6.220 2.007 .002
6‐10 5.998 1.870 .001
>10 0a
. .
motivate others
strongly disagree ‐1.481 .720 .040
slightly disagree ‐1.821 .777 .019
neither disagree or agree ‐.613 .595 .303
slightly agree ‐1.488 .629 .018
strongly agree 0a
. .
training for employees No .728 .442 .099
Yes 0a
. .
new production process on the market in 2009 No ‐2.599 1.023 .011
Yes 0a
. .

341
new service on the market in 2009 No .046 .509 .927
Yes 0a
. .
entered a new market in 2009 No ‐1.085 .529 .040
Yes 0a
. .
advice of consultant No .983 .491 .045
Yes 0a
. .
Note: a. This parameter is set to zero because it is redundant.
Turnover Table 3 shows the estimation results of the significant explanatory variables when estimating equation 1 for turnover. Elements of the Motivational Factors (push factors and social networks), socio-economic factors (access to new markets), public policy factors, and Business Environment Factors (current and start-up location) have a significant effect on turnover at the 5 per cent significance level. Therefore, we can then conclude that we cannot find supportive evidence for the Hypotheses H2c and H3a with respect to turnover.
Regarding Hypothesis H2a, the push factors, we conclude from Table 3 that ‘poverty’ and ‘role model’ influence turnover. If the respondent indicates that poverty is the reason to start the business, his turnover will be lower compared with the case where the respondent does not mention poverty as a reason for starting the business, thereby confirming the Hypothesis for this particular element. In contrast, the results show that, if the respondents follow a ‘role model’, the probability of a higher turnover increases, thereby contradicting our hypothesis. According to our results, the effects of the number of employees of different backgrounds show that employing more people of different backgrounds results in a higher turnover. Therefore, we find supporting evidence for Hypothesis H2c.
The factors related to access to new markets show counterintuitive results: the factor ‘training for employees’ has a negative influence on turnover. Thus, entrepreneurs who provide no training opportunities for their employees have consequently increased their turnover. This contradicts Hypothesis H3b. However, ‘new services’ is strongly correlated with an increase in turnover, so this supports our Hypothesis.
Of all the Public Policy Factors (Hypothesis H4), only ‘advice from a network’ and ‘advice from a consultant’ show significant effects on turnover. Advice from a network has a positive effect on turnover, whereas advice from a consultant shows a negative effect. So, the evidence for this Hypothesis regarding turnover is mixed.
Hypotheses 5a and 5b state that current and start-up locations have a positive influence on Business Performance. Because the home location has a stronger influence on turnover than the enterprise building, with the entrepreneurs’ own office having the strongest influence, we do not find supportive evidence for Hypothesis 5a. Concerning the start-up location we find that all the locations have almost the same order of magnitude in their effect to turnover, so these results do not support Hypothesis 5b.

342
Table 3 Estimation results for Turnover
TURNOVER
Variable Level Estimate Std.Error Sig.
constant
strongly decreased ‐6.342 2.360 .007
decreased ‐4.843 2.349 .039
equal ‐2.973 2.340 .204
increased ‐.484 2.322 .835
strongly increased 0a
. .
poverty
strongly disagree ‐2.812 1.299 .022
slightly disagree ‐2.342 1.510 .121
neither disagree or agree ‐1.292 1.327 .330
slightly agree ‐4.755 1.886 .012
strongly agree 0a
. .
follow role model
strongly disagree 1.357 .745 .069
slightly disagree 1.528 .923 3.337
neither disagree or agree 1.615 .838 3.258
slightly agree 2.640 .985 4.571
strongly agree 0a
. .
employees from different group in 2010
0 ‐5.396 1.935 .005
1‐5 ‐4.632 1.887 .014
6‐10 ‐3.306 1.765 .061
>10 0a
. .
employees from different groups in 2009
0 4.009 1.867 .032
1‐5 3.607 1.751 .039
6‐10 4.152 1.697 .014
>10
training for employees no .689 .406 .090
yes 0a
. .
new services on the market no ‐.917 .476 .054
yes 0a
. .
current location
home 3.554 1.154 .002
incubator 0a
. .
enterprise building 2.726 1.127 .016
own office 3.690 1.135 .001
other 0a
. .
Start‐up location
home ‐2.079 1.232 .091
incubator ‐2.683 1.594 .092
enterprise building ‐2.015 1.252 .107
own office ‐2.176 1.279 .089
other 0a
. .
advice of network organization no ‐.927 .383 .016
yes 0a
. .
advice of consultant no 1.249 .451 .006
yes 0a
. .
Note: a. This parameter is set to zero because it is redundant.
Profitability Table 4 shows the estimation results of the significant explanatory variables when estimating equation 1 for profitability. Elements of the Motivational Factors (push factors and social networks), Public Policy Factors, and Business Environment Factors (current and start-up location) have a significant effect on profitability at the 5 per cent significance level. Therefore, we can then conclude that we cannot find supportive evidence for Hypotheses H2c, H3a, and H3b with respect to profitability.
Concerning Hypothesis H2a we do find the same qualitative results for profitability as for turnover in the last section. So, indicating poverty as a reason for entrepreneurship and following a role model as a reason have, respectively, a
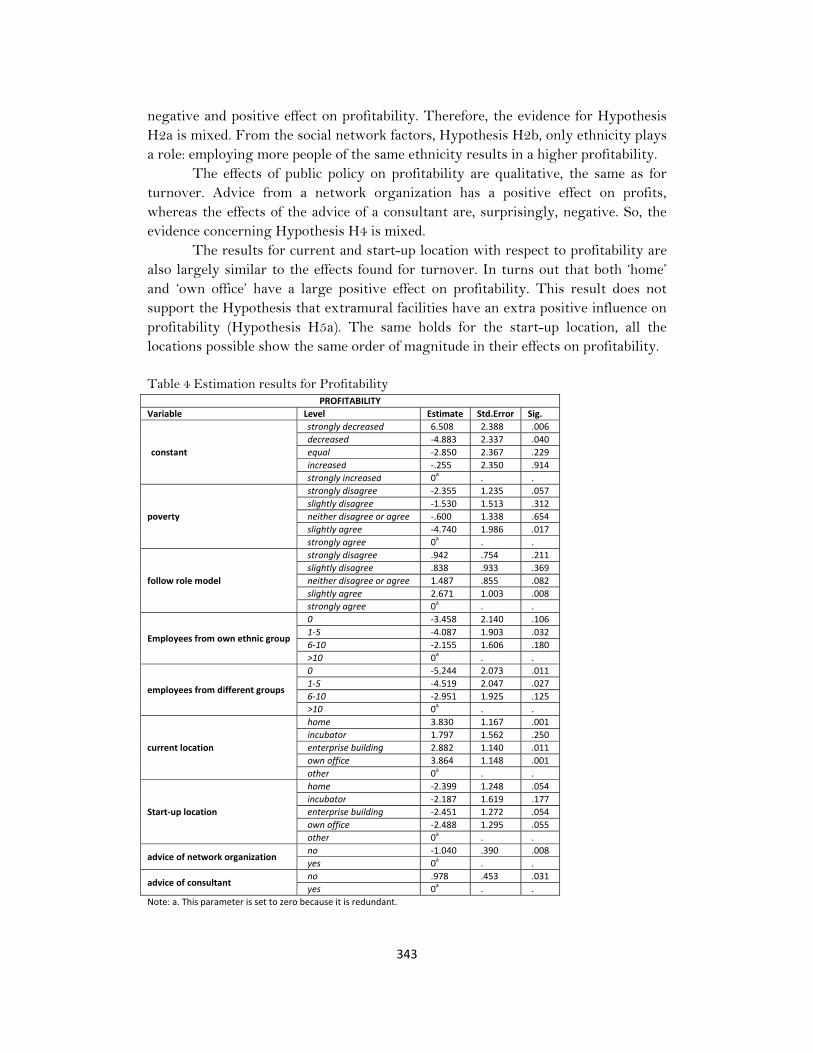
343
negative and positive effect on profitability. Therefore, the evidence for Hypothesis H2a is mixed. From the social network factors, Hypothesis H2b, only ethnicity plays a role: employing more people of the same ethnicity results in a higher profitability.
The effects of public policy on profitability are qualitative, the same as for turnover. Advice from a network organization has a positive effect on profits, whereas the effects of the advice of a consultant are, surprisingly, negative. So, the evidence concerning Hypothesis H4 is mixed.
The results for current and start-up location with respect to profitability are also largely similar to the effects found for turnover. In turns out that both ‘home’ and ‘own office’ have a large positive effect on profitability. This result does not support the Hypothesis that extramural facilities have an extra positive influence on profitability (Hypothesis H5a). The same holds for the start-up location, all the locations possible show the same order of magnitude in their effects on profitability.
Table 4 Estimation results for Profitability
PROFITABILITY
Variable Level Estimate Std.Error Sig.
constant
strongly decreased 6.508 2.388 .006
decreased ‐4.883 2.337 .040
equal ‐2.850 2.367 .229
increased ‐.255 2.350 .914
strongly increased 0a
. .
poverty
strongly disagree ‐2.355 1.235 .057
slightly disagree ‐1.530 1.513 .312
neither disagree or agree ‐.600 1.338 .654
slightly agree ‐4.740 1.986 .017
strongly agree 0a
. .
follow role model
strongly disagree .942 .754 .211
slightly disagree .838 .933 .369
neither disagree or agree 1.487 .855 .082
slightly agree 2.671 1.003 .008
strongly agree 0a
. .
Employees from own ethnic group
0 ‐3.458 2.140 .106
1‐5 ‐4.087 1.903 .032
6‐10 ‐2.155 1.606 .180
>10 0a
. .
employees from different groups
0 ‐5.244 2.073 .011
1‐5 ‐4.519 2.047 .027
6‐10 ‐2.951 1.925 .125
>10 0a
. .
current location
home 3.830 1.167 .001
incubator 1.797 1.562 .250
enterprise building 2.882 1.140 .011
own office 3.864 1.148 .001
other 0a
. .
Start‐up location
home ‐2.399 1.248 .054
incubator ‐2.187 1.619 .177
enterprise building ‐2.451 1.272 .054
own office ‐2.488 1.295 .055
other 0a
. .
advice of network organization no ‐1.040 .390 .008
yes 0a
. .
advice of consultant no .978 .453 .031
yes 0a
. .
Note: a. This parameter is set to zero because it is redundant.

344
The above discussion of the ordered logit models for the separate elements of Business Performance indicators and the explanatory factors (elements) shows mixed results regarding the hypotheses formulated in Section 4.1. Therefore, we continue with an integrative model in the next session. 4.2. A structural equations model The proposed model and hypothesized relationships between the different variables of the GALAXY model were tested using the AMOS 19 structural equation modeling package (SEM) for SPSS. Before running the structural equation modeling software, however, some data transformations had to be performed. First of all, patterns of missing data were analysed. All in all, only a few items contained some missing data, with MF3.2, MF3.2 and BE1 each having one unrelated piece of missing data. Because of the very limited nature of the missing data, a simple sample mean imputation was performed in order to construct a full data set. A second transformation pertained to the measurement levels of the survey items. Since SEM assumes variables on the interval or ratio measurement level, nominal variables can only be incorporated when recoded as a collection of dummy variables. Consequently, the business environment factor measured by the questions: ‘current location’ and ‘starting location’, was recoded as a dummy variable. The original nominal scale with categories: ‘home’, ‘incubator’, ‘business park’, ‘office premises’, and ‘other’, was transformed into a dichotomous variable, with a code 0 for home enterprises, and 1 for entrepreneurs operating from business locations away from home. All other measurement items were measured on either the ordinal (the indicators for Motivational Factors, Public Policy Factors, and Business Performance) or the dichotomous categorical (the indicators for socio-economic variables) scale, and did not require data manipulation. In accordance with Mulaik and Millsap’s (2000) suggestions, a four-step modelling approach was used in order to test our theoretical model:
1. Explanatory factor analysis to establish the number of latent variables;
2. Confirmatory factor analysis to confirm the measurement model;
3. A structural model to test the relationships between the model variables;
4. Nested models testing in order to identify the most parsimonious model.
While Steps 2 to 4 are part of SEM software, the first step was performed in SPSS 17.0. The unidimensionality of each proposed construct of the model was assessed using Principal Component Analysis to assure that the measurement items had only one underlying construct in common (Sethi and King, 1994). Use of the polychoric and tetrachoric correlation matrix was preferred over the more common Pearson’s product-moment correlation, as suggested by Jöreskog and Sörbom (1996), who observed that lack of variability in ordinal data correlations can limit the lower and upper limit of Pearson’s Correlation to, respectively, -0.5 and 0.5, leading to Kubinger’s (2003) notion that factor analysis on Pearon’s correlation matrices will
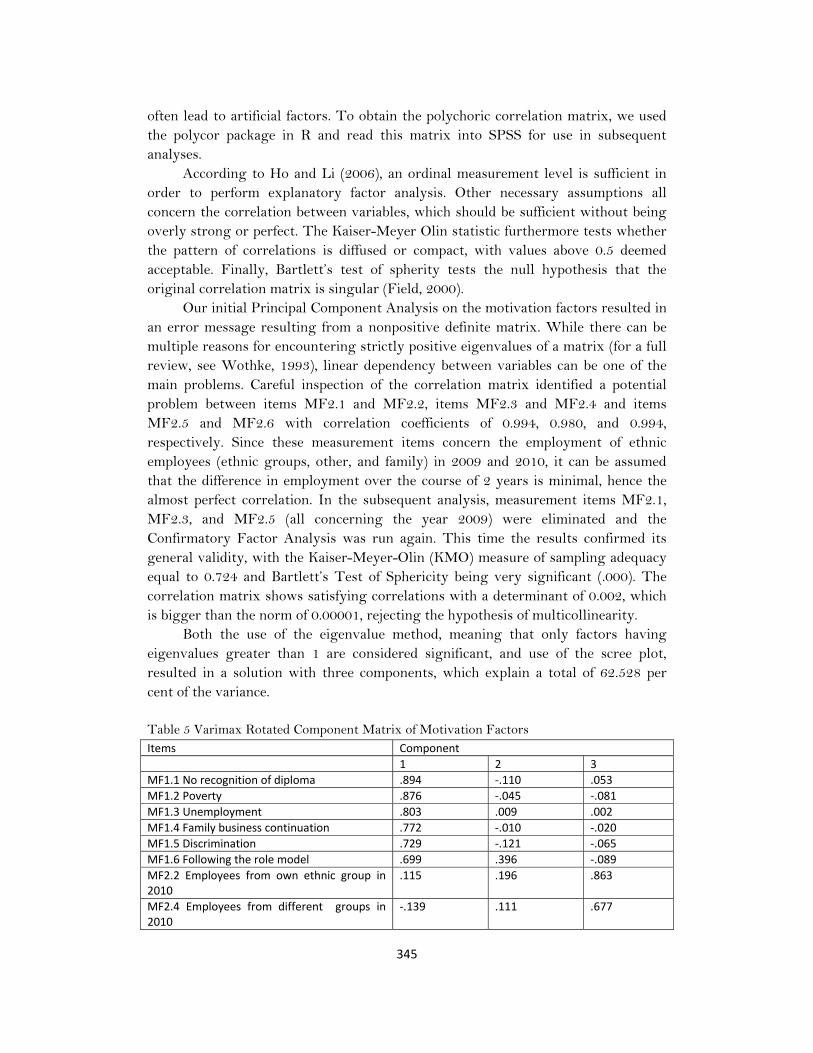
345
often lead to artificial factors. To obtain the polychoric correlation matrix, we used the polycor package in R and read this matrix into SPSS for use in subsequent analyses. According to Ho and Li (2006), an ordinal measurement level is sufficient in order to perform explanatory factor analysis. Other necessary assumptions all concern the correlation between variables, which should be sufficient without being overly strong or perfect. The Kaiser-Meyer Olin statistic furthermore tests whether the pattern of correlations is diffused or compact, with values above 0.5 deemed acceptable. Finally, Bartlett’s test of spherity tests the null hypothesis that the original correlation matrix is singular (Field, 2000). Our initial Principal Component Analysis on the motivation factors resulted in an error message resulting from a nonpositive definite matrix. While there can be multiple reasons for encountering strictly positive eigenvalues of a matrix (for a full review, see Wothke, 1993), linear dependency between variables can be one of the main problems. Careful inspection of the correlation matrix identified a potential problem between items MF2.1 and MF2.2, items MF2.3 and MF2.4 and items MF2.5 and MF2.6 with correlation coefficients of 0.994, 0.980, and 0.994, respectively. Since these measurement items concern the employment of ethnic employees (ethnic groups, other, and family) in 2009 and 2010, it can be assumed that the difference in employment over the course of 2 years is minimal, hence the almost perfect correlation. In the subsequent analysis, measurement items MF2.1, MF2.3, and MF2.5 (all concerning the year 2009) were eliminated and the Confirmatory Factor Analysis was run again. This time the results confirmed its general validity, with the Kaiser-Meyer-Olin (KMO) measure of sampling adequacy equal to 0.724 and Bartlett’s Test of Sphericity being very significant (.000). The correlation matrix shows satisfying correlations with a determinant of 0.002, which is bigger than the norm of 0.00001, rejecting the hypothesis of multicollinearity. Both the use of the eigenvalue method, meaning that only factors having eigenvalues greater than 1 are considered significant, and use of the scree plot, resulted in a solution with three components, which explain a total of 62.528 per cent of the variance. Table 5 Varimax Rotated Component Matrix of Motivation Factors Items Component
1 2 3
MF1.1 No recognition of diploma .894 ‐.110 .053
MF1.2 Poverty .876 ‐.045 ‐.081
MF1.3 Unemployment .803 .009 .002
MF1.4 Family business continuation .772 ‐.010 ‐.020
MF1.5 Discrimination .729 ‐.121 ‐.065
MF1.6 Following the role model .699 .396 ‐.089
MF2.2 Employees from own ethnic group in 2010
.115 .196 .863
MF2.4 Employees from different groups in2010
‐.139 .111 .677

346
MF2.6 Family members as employees in 2010 ‐.043 ‐.165 .700
MF3.1 Challenge ‐.306 .787 .101
MF3.2 Motivating others .109 .763 .146
MF3.3 Better position .167 .626 ‐.139
MF3.4 Realizing idea ‐.429 .561 .110
Cronbach’s alpha .817 .808 .629
Varimax rotation was used to obtain a clearer interpretation of the factors. Table 5 shows the factor loadings of the different measurement items on the respective components. The results are in line with our theoretical considerations, dividing the motivational factor into push-factors (or bounded rationality), which concern items such as poverty, unemployment, and discrimination, social networks: specifically, the employability of ethic employees, and pull-factors (or entrepreneurial animal spirit), which combine items such as looking for a challenge, realizing ideas, and creating a better position for oneself. Cronbach’s alpha was calculated separately for all three factors, showing acceptable to good internal consistency. As a result, three Motivational Factors: push factors (MTF1), social networks (MTF2), and pull factors (MTF3) are incorporated in the measurement model. A first Principal Component Analysis failed to identify underlying data dimensions, owing to a nonpositive definite correlation matrix. A sequential analysis of the correlation matrix, deleting one variable at a time and computing the determinant, identified a problem with item SF1.2, which was subsequently left out of the analysis. The new correlation matrix resulted in a KMO measure of sampling adequacy of 0.413 and a p-value of Bartlett’s test of Sphericity of .000. The KMO was below the threshold level, indicating that the items would potentially not factor well. A two-factor solution is given as the eigenvalues rule-of-thumb. The total variance explained by the two factors is 71.347 per cent. Table 6 Varimax Rotated Component Matrix of Socio-economic Factors Items Component
1 2
SF1.1 Transactions with customers .169 .906
SF1.3 Contact with suppliers .035 .853
SF1.4 Contact with customers ‐.204 .920
SF1.5 Electronic taxation ‐.003 .824
SF2.1 New customer service .800 ‐.003
SF2.2 Training for employees .762 ‐.130
SF2.3 New production process in 2009 .882 .131
SF2.4 New services .812 ‐.121
SF2.5 New market .740 .149
Cronbach’s alpha .771 .636
Table 6 gives an overview of the construction of the two Socio-economic Contextual Factors. Factor 1 combines all the variables indicating Internet use for transactions, contacts, and electronic taxation (SEF1). The second component,

347
Factor 2, is mainly dependent on innovations in services, and markets, and is therefore described as ‘innovation’ (SEF2). The factor analysis of Public Policy Factors also indicates general validity, with a KMO of .726, and a significant Bartlett’s Test of Sphericity (.000). Multicollinearity could be rejected (determinant = .381). The eigenvalue-method proposes a one-factor solution which is also supported by a visual check of the scree plot. Table 7 shows the resulting one-factor varimax rotated solution, which explains 56.909 per cent of the total variance in the data set. Table7 Varimax Rotated Component Matrix of Public Policy Factors Items Component
1
PF1.1 Advice of friends .859
PF1.2 Advice of network organization .733
PF1.3 Advice of customers .783
PF1.4 Advice of consultant .622
Cronbach’s alpha .561
Different from the theoretical GALAXY model, the operationalization of the policy factor is strictly one-dimensional, with the constructed component measuring the extent to which entrepreneurs have gathered advice from a range of sources concerning regulatory, institutional, and financial incentives. The Cronbach’s alpha value for internal consistency shows a rather weak internal consistency of .561, with a possible increase to .986 if item PF1.4 Advice of consultant is deleted. However, at this point, we are primarily concerned with the unidimensionality in the constructs and the potential exclusion of items will be further analysed in the measurement and structural models. Finally, Exploratory Factor Analysis was used to test the unidimensionality of the Business Performance Factor. Both the KMO (.741) and the Bartlett’s Test of Sphericity (.000) accept the use of factor analysis on our data. The correlation coefficients are sufficiently high, but there is no reason to suspect multicollinearity with a determinant of .014. A one-factor solution explains 94.151 per cent of the total variance with the varimax rotated factor loadings given in Table 8.
Table 8 Varimax Rotated Component Matrix of Business Performance Items Component
1
BP1.1 Profitability .983
BP1.2 Revenue .976
BP1.3 Assets .951
Cronbach’s alpha .944
The Exploratory Factor Analysis results in a one-dimensional construct, combining profitability, revenue, and assets. The high Cronbach’s alpha value is further proof of the acceptability of using Business Performance as a singular latent variable, with BP1.1, BP1.2, and BP1.3 as measurement items.

348
After conducting Exploratory Factor Analysis to identify the different latent dimensions in the data and the convergent validity of the indicators, Confirmatory Factor Analysis tests the adequacy of individual items and reliability and the divergent validity of the latent variable constructions in an overall measurement model. Before performing parameter estimation with AMOS, it is important to verify the data considerations in order to perform SEM, since deviations with respect to these requirements influence the estimation method and parameter reliability. Earlier remarks concerning the measurement level of the data in factor analysis are also applicable in SEM estimation. Since most estimation and model fit procedures are based on calculations of the variance-covariance matrix, ordinal-level measurement scales can influence the parameter estimations under Maximum Likelihood estimation. Closely related to the measurement scale is the issue of normality. SEM requires a multivariate normal distribution, implying a univariate distribution for every variable, and a bivariate normal distribution between pairs of variables (Gao et al., 2008). Nonnormality, which can, among other things, occur because of the scaling of variables or limited sampling of subjects, will affect the variance-covariance among variables (Schumacker and Lomax, 2004). While Muthén and Kaplan (1985) conclude that not much distortion in chi-square and parameter estimation is expected from using Maximum Likelihood or Generalized Least Squares estimation on non-multivariate normal data, if the univariate skewnesses and kurtoses remain within the range of -1.0 and +1.0, but skewnesses and kurtoses above an absolute value of 2.0 are cause for greater concern. While the measurement level of the different variables has been established before as being ordinal or dichotomous, with nominal variables recoded into a set of dummy items, the normality of the data can be tested by assessing skewness, kurtosis, Mardia’s coefficient, and the squared Mahalanobis distance. A value below the critical ratio of 1.96 on Mardia’s coefficient of multivariate kurtosis would imply a normal multivariate distribution. Higher values of the squared Mahalanobis distance, on the other hand, indicate larger differences between observations and the centroid under normality assumptions, and are therefore a sign of outliers influencing non-multivariate normality (Sharma, 1996). Since Mardia’s coefficient of our data set has a critical ratio of 11.170, we have to assume a significant non-normality in the data. Furthermore, the largest squared Mahalanobis distances and associated significance values show that at least 56 observations are improbably far from the centroid to assume normality. Following the advice of Muthén and Kaplan (1985), we subsequently check the univariate skewness and kurtosis of the data. A large number of variables show skewness and kurtosis above the absolute value of 2.0, which leads us to conclude that the data distribution is not suited for estimation methods like Maximum Likelihood or Generalized Least Squares that require normality. The approach proposed by Jöreskog and Sörbom (1996) in the case of below-interval measurement level of data and a significant non-normal distribution is an Asymptotic Distribution Free estimation method based on the polyserial, polychoric,

349
or tetrachoric correlation matrix. However, Yung and Bentler (1994) have indicated the need for a large sample size (at least 2,000, and preferably as high as 5,000) in order for this method to generate satisfactory results. On the other hand, AMOS offers an alternative estimation method by applying a Bayesian framework with ordinal, non-normal data. In the context of the Bayesian approach, every parameter is treated as a random variable with a probability distribution. A hypothesized prior probability distribution is combined with empirical evidence of the sample data through the use of Bayes’ theorem and leads to a posterior distribution. Uncertainty in the parameter estimates is reduced by the acquisition of new data, generated from the original sample through a Markov Chain Monte Carlo algorithm (Arbuckle, 2009; Byrne, 2010). It was decided to further use this Bayesian approach in our subsequent Confirmatory Factor Analysis and SEM as a result of the violations against distribution and measurement assumptions, combined with the limited sample size. However, since diverse authors have also observed only marginal differences between Maximum Likelihood and Bayesian estimation outcomes (Byrne, 2010), we have opted to run a simultaneous Maximum Likelihood estimation in order to compare results and model fit indices. The measurement model was constructed based on the previously identified dimensions. Following Garson (2011), we assume correlation between the different latent exogenous variables (depicted by a double-headed arrow). Maximum Likelihood estimation gave an overall fit of the original measurement model of χ² = 629.691 (p = .000), indicating a significant difference between the observed and implied variance-covariance matrices. However, Schumacker and Lomax (2004) note that the χ² statistic is sensitive to sample size and departures from multivariate normality, with a tendency to indicate a significant probability level if the sample size increases above 200, and the model is comparatively complex. This is also indicated by dividing the χ² by the degrees of freedom, and using this statistic as an index. With a value of 1.543 (<3), this χ²/df indicates a good model fit (Mîndrilă, 2010). Therefore, Tabachnick and Fidell (1996) mention that a non-significant chi-square value, combined with reasonable results on the other fit indices can still mean that it is feasible to continue working with the theorized model. Of the fit indices available in structural equation modeling, Fan et al. (2011) mention that the root mean square error of approximation (RMSEA) and the McDonald Centrality Index perform well under different sample size and on sensitivity to model misspecification, while the Comparative Fit Index (CFI) is less sensitive to model misspecification, but also performs well for small samples. The RMSEA was, at 0.051, slightly higher than the maximum of 0.05 that indicates a good fit. The CFI had a value of 0.893, with values of 0.9 or higher indicating a good fit. The Normed Fit Index (NFI) was 0.752, with a Parsimonious Normed Fit Index (PNFI) of 0.660 and an Akaika Information Criterion (AIC) of 867.691. Apart from looking at the total model fit indices, the significance of the individual factor loadings should also be considered. Only two measurement items, MF2.6 and MF3.3 had non-significant
350
factor loadings at the 99 per cent confidence interval, with standardized regression weights below the minimal level of 0.30 (Hair et al., 1998; Merenda, 1997). The Bayesian estimation procedure shows largely comparable parameter estimates, while the available model fit indices in the Bayesian analysis have the following values: Deviance Information Criterion (DIC)= 871.01, a posterior predictive p =0.00, with values towards the extremes of 0 and 1 indicating non-plausible models (Lee and Song, 2003), and an effective number of parameters = 113.05. Both estimation methods showed potential improvement by correlating measurement errors and fixing the regression weight of some variables to zero. However, Silvia and MacCallum (1988) warn against the use of modification indices without theoretical justification, since this might overfit the model to data noise and fluctuations in the sample data (Garson, 2011). Specifically, correlation in error terms is reserved for situations where the residual of one indicator helps in estimating the residual in another indicator. This might, for instance, be the case when similar measurement scales are used in different questions. Taking these warnings into account, we now have to provide the theoretical background to the decision to correlate the error terms. The measurement model was respecified by including correlations between the error terms of: MF1.1 (no recognition of diploma) and MF1.5 (discrimination); MF1.6 (following the role model) and MF3.3 (better position); and MF3.2 (motivating others) and MF3.3 (better position). All these variables were measured on a comparable scale where it can be presumed that the answers could be influenced by social acceptability. A further modification was made by eliminating the paths between the measurement items MF2.6, MF3.3 and their respective latent variables, since deleting these items also resulted in an improvement of the Cronbach’s alpha for MTF2 (from 0.808 to 0.814) and MTF3 (from 0.629 to 0.661). Since no significant cross-loadings between indicators and other latent variables were indicated, no problems with convergent validity were expected, and no further modifications were made (Kline, 2010). The model fit indices generated by Maximum Likelihood estimation improved to an RMSEA of 0.047, a CFI of .906, a NFI of 0.757, a PNFI .689, and a χ²/df of 1.458. The AIC had a value of 824.793, and the χ² was significant (p = .000) at 616.793. While the χ²-value is still significant, and both NFI and PNFI are rather low, the RMSEA and CFI show a model with a reasonably good fit, and the AIC indicates an improvement of the model. Furthermore, all individual factor loadings are significant at a 99 per cent confidence interval. The Bayesian estimation model converged with a convergence criterion of 1.0019, a posterior predictive p of 0.00, an improved DIC of 829.09 (where smaller values of DIC are preferred over larger values), and an effective number of parameters of 101. The regression weights were all significant and comparable to the Maximum Likelihood estimates. After confirming the reliability and validity of the latent variable constructs, the structural model was constructed, based on the theoretical GALAXY model. Figure 2 shows the constructed latent variables and the paths between the latent
351
variables and the endogenous variable Business Performance. When comparing Figure 1 with Figure 2 some differences between the theoretical model and the structural model are obvious. First, while it might seem from the GALAXY model that Motivational Factors, Socio-economic Contextual Factors, Business Environment, and Policy Factors are all latent factors constructed from a collection of observed variables, in fact these exogenous variables from the theoretical model are themselves latent variables. This was already identified in the earlier Exploratory Factor Analysis. Second, not all variables from the theoretical model were measured by the survey, therefore ‘Policy Factors’ is represented by a single variable, as is ‘Business Environment’ which is coded as a set of dummy variables for current and start-up locations. Finally, the Socio-economic Contextual Factor consists of two dimensions in our structural equation model, instead of the theorized three dimensions. In a first step, the complete regression model was tested (both full and dashed arrows in Figure 2) on path significance. It should be noted that, in line with the earlier conclusions from the measurement models, the paths between MTF2 and MF2.6 and between MTF3 and MF3.3 were set to zero. Furthermore, since both DBE1 and DBE2 are dummy-coded variables, their error terms (δ27 and δ28) were given a mean and variance of zero. Lastly, while not shown in Figure 2 for reasons of simplicity, there are significant covariances between the latent variables (MTF1 <-> MTF3, MTF3 <-> SEF2, MTF2 <-> SEF2, SEF1 <-> PPF, BEF2 <-> BEF1, MTF2 <-> BEF1, BEF2 <-> MTF2, MTF3 <-> SEF1, SEF2 <-> BEF1, and SEF3 <-> PPF) and between the error terms (δ6 <-> δ12, δ5 <-> δ1, and δ12 <-> δ11).
The result of the initial Maximum Likelihood estimation procedure revealed a non-significant chi-square value (χ² = 599.906, p = .000), with model fit indices of RMSEA = 0.046, CFI = .911, NFI = 0.764, PNFI = .681, χ²/df =1.446, and AIC = 823.906, indicating a potential for model improvement. Furthermore, none of the hypothesized relationships between the latent variables and Business Performance was found to be significant at a 95 per cent confidence level. The same results were generated with Bayesian estimation, which failed to converge with a convergence criterion of 1.0256, therefore resulting in unstable parameter estimates. None of the weights for the regression paths were significantly different from zero.
Next, a series of nested structural models were tested through the AMOS specification search in order to identify the best fitting model for the data. A total of 68 different models were tested on top of the saturated model. Table 9 gives an overview of the significance tests between the original model, eight models with every regression tested individually, and the best fitting model with five paths fixed to zero.

352
Table 9 Significance test of nested models Model Description df χ² χ²/df BCC 0 D² (=Iχ²original – χ²aI)
1 Original (full) model 415 599.906 1.446 11.009
2 Only path between SEF2 and BPF 422 607.995 1.441 2.595 8.089
3 Only path between MTF3 and BPF 422 608.367 1.442 2.967 8.461
4 Only path between MTF1 and BPF 422 613.696 1.454 8.296 13.790
5 Only path between MTF2 and BPF 422 614.385 1.456 8.985 14.479
6 Only path between SEF1 and BPF 422 614.660 1.457 9.260 14.754
7 Only path between BEF1 and BPF 422 616.161 1.460 10.761 16.255
8 Only path between BEF2 and BPF 422 616.622 1.461 11.222 16.716
9 Only path between PPF and BPF 422 616.791 1.462 11.391 16.885
10 Path between MTF2, MTF3, BEF1 and BPF
420 562.044 1.348 0.000 37.862
Apart from looking at the model fit values, a Likelihood ratio test was performed where the difference D² between the χ²-values of the full model and the nested models was compared with that between the tabled χ²-values for the related degrees of freedom (= Idforiginal – dfaI). In general, a lower χ²-value is preferred over a higher value, while for an insignificant χ² difference between the full and the constrained model, the modification should be accepted on grounds of parsimony (Garson, 2011). From Table 9 we can see that Models 2 to 9 have a higher χ²-value. The question then is to investigate whether this higher value is significantly different. The tabled χ²-value for 7 degrees of freedom and an α-level of 0.05 is 14.067. Comparing these tabled values with the D² values of Table 9, we can reject Models 5 to 9, while Models 2, 3, and 4 do not show a significant difference in χ²-value with the original model and should therefore be preferred on grounds of parsimony.

353
Note: Dashed lines were included in the first structural model and excluded in the second model. Figure 2 Final Structural Equation Model

354
However, Model 10 shows a preferable lower χ²-value of 562.044 as compared to both the original and one-path models. The χ²-value for 5 degrees of freedom and a 0.05 α-level is 11.070. Therefore, the D²-value is significant and positive, making this the most preferred model. This analysis can be further extended since Models 2 to 9 are themselves nested models of Model 10. Performing a new Likelihood ratio test with Model 10 as the original model, we find a significant difference for all χ²-values with D²-values of 37.862, 45.951, 46.323, 51.652, 52.341, 52.616, 54.117, and 54.578 compared with a tabled χ²-value of 5.991, meaning we cannot reject Model 10 in favour of the more parsimonious Models 2 to 9.
In the final Model 10, five paths were fixed at zero with only an expected regression between MTF2, MTF3, BEF1 and the dependant variable BPF. The overall model fit statistics of Maximum Likelihood Estimation indicate that the accepted model fits the data better than the original model, with an improvement in RMSEA (.041), CFI (.930), PNFI (.834), χ²/df (1.348), AIC (782.044), and NFI (0.778). The χ²-value of 562.044, however, still remains non-significant (p = .000). While we discussed before that the significance of the χ²-value is dependent on normality and sample size, the non-significance is troublesome since a number of authors argue that the χ²-test is the only substantive test of fit for SEM (Barrett, 2007). Thankfully, AMOS offers an alternative χ² fit test for non-normal data by using the Bollen-Stine Bootstrap. Running the test with 2000 bootstrap samples, we get a p-value of .057. As a result we can accept the null hypothesis that our model is correct. Different from the original SEM, the regression weights between MTF2, MTF3, BEF1 and BPF are now significant at a 95 per cent confidence interval, with MTF1 and MTF3 having a positive influence, while the influence of BEF1 on BPF shows a negative sign. The same conclusions can be drawn from the Bayesian analysis, with significant positive weights for MTF2 and MTF3, and a negative value for the regression weight of BEF1. Moreover, the Bayesian estimation procedure did converge this time, with a convergence criterion of 1.0020, a posterior predicitive p which is still unsatisfactory at 0.00, a DIC of 817.68, and an effective number of parameters of 103.41. The factor loadings and regression weights of both the Maximum Likelihood and the Bayesian estimation are compared in Table 10.
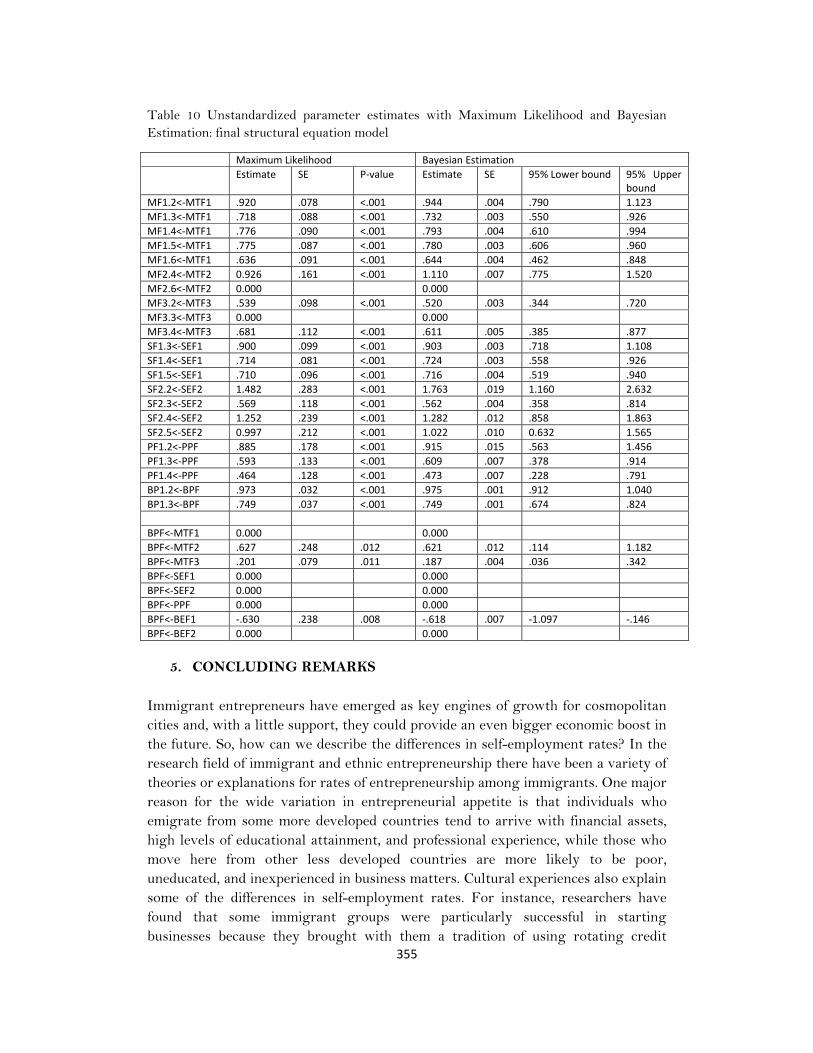
355
Table 10 Unstandardized parameter estimates with Maximum Likelihood and Bayesian Estimation: final structural equation model
5. CONCLUDING REMARKS
Immigrant entrepreneurs have emerged as key engines of growth for cosmopolitan cities and, with a little support, they could provide an even bigger economic boost in the future. So, how can we describe the differences in self-employment rates? In the research field of immigrant and ethnic entrepreneurship there have been a variety of theories or explanations for rates of entrepreneurship among immigrants. One major reason for the wide variation in entrepreneurial appetite is that individuals who emigrate from some more developed countries tend to arrive with financial assets, high levels of educational attainment, and professional experience, while those who move here from other less developed countries are more likely to be poor, uneducated, and inexperienced in business matters. Cultural experiences also explain some of the differences in self-employment rates. For instance, researchers have found that some immigrant groups were particularly successful in starting businesses because they brought with them a tradition of using rotating credit
Maximum Likelihood Bayesian Estimation
Estimate SE P‐value Estimate SE 95% Lower bound 95% Upper bound
MF1.2<‐MTF1 .920 .078 <.001 .944 .004 .790 1.123
MF1.3<‐MTF1 .718 .088 <.001 .732 .003 .550 .926
MF1.4<‐MTF1 .776 .090 <.001 .793 .004 .610 .994
MF1.5<‐MTF1 .775 .087 <.001 .780 .003 .606 .960
MF1.6<‐MTF1 .636 .091 <.001 .644 .004 .462 .848
MF2.4<‐MTF2 0.926 .161 <.001 1.110 .007 .775 1.520
MF2.6<‐MTF2 0.000 0.000
MF3.2<‐MTF3 .539 .098 <.001 .520 .003 .344 .720
MF3.3<‐MTF3 0.000 0.000
MF3.4<‐MTF3 .681 .112 <.001 .611 .005 .385 .877
SF1.3<‐SEF1 .900 .099 <.001 .903 .003 .718 1.108
SF1.4<‐SEF1 .714 .081 <.001 .724 .003 .558 .926
SF1.5<‐SEF1 .710 .096 <.001 .716 .004 .519 .940
SF2.2<‐SEF2 1.482 .283 <.001 1.763 .019 1.160 2.632
SF2.3<‐SEF2 .569 .118 <.001 .562 .004 .358 .814
SF2.4<‐SEF2 1.252 .239 <.001 1.282 .012 .858 1.863
SF2.5<‐SEF2 0.997 .212 <.001 1.022 .010 0.632 1.565
PF1.2<‐PPF .885 .178 <.001 .915 .015 .563 1.456
PF1.3<‐PPF .593 .133 <.001 .609 .007 .378 .914
PF1.4<‐PPF .464 .128 <.001 .473 .007 .228 .791
BP1.2<‐BPF .973 .032 <.001 .975 .001 .912 1.040
BP1.3<‐BPF .749 .037 <.001 .749 .001 .674 .824
BPF<‐MTF1 0.000 0.000
BPF<‐MTF2 .627 .248 .012 .621 .012 .114 1.182
BPF<‐MTF3 .201 .079 .011 .187 .004 .036 .342
BPF<‐SEF1 0.000 0.000
BPF<‐SEF2 0.000 0.000
BPF<‐PPF 0.000 0.000
BPF<‐BEF1 ‐.630 .238 .008 ‐.618 .007 ‐1.097 ‐.146
BPF<‐BEF2 0.000 0.000

356
associations to overcome financing obstacles. In contrast, other cultures frown upon taking loans and going into debt. Another factor that might help to explain why some immigrant communities start businesses at higher rates than others is that some countries from which immigrants hail have stronger or weaker traditions of entrepreneurship.
The primary goal of this study is to assess the impact of several fundamental factors on the economic performance of second-generation migrant entrepreneurs. Our study analyses the main factors that have an impact on the economic performance of second-generation migrant entrepreneurs in the high-tech sector in four large cities in the Netherlands: Amsterdam, Rotterdam, Utrecht, and The Hague. The sample of our study consists of entrepreneurs of predominantly Turkish origin, and also a few of Moroccan Surinamese and Antillean origin, who are active in the advanced producer services (e.g. ICT, FIRE, and tourism services), and knowledge-intensive business services (KIBS) that all require highly-educated and skilled labour. A more detailed presentation of the ethnic composition of our sample and its distribution in the four biggest Dutch cities is beyond the scope of this article, but is included in another more descriptive study (see Sahin et al., 2012).
Ultimately, our structural equation model (SEM) shows that three of the eight hypothesized paths were statistically significant at a .05 probability level. Of the three significant paths, only the paths between social networks (MTF2) and pull factors (MTF3) had the direction predicted, while current business location (BEF1) and Business Performance showed a reverse relationship.
The constrained model, which showed better fit indices than the full model, indicated a rejection of most of the proposed hypotheses, since maintaining only three of the eight hypotheses did not result in a deterioration of model fit criteria. The results suggest no significant relationship between the Socio-economic Contextual Factors (SEF1 and SEF2) and Business Performance, whereas the ordered logit model suggests that a relationship between access to new markets (SEF2) and Business Performance exists. However, the results for the ordered logit model were mixed, and our SEM gives no evidence for this relationship. Therefore, Hypotheses H3a and H3b are rejected based on the data. While previous studies have suggested a significant positive impact of innovation and business culture in general (e.g. Casson, 1994; Chakrabarti, 1990; Deeds and Rothaermel, 2003), this study indicates a lack of relationship between, on the one hand, the use of the Internet with lower transaction costs, training of employees and accessibility to new markets, and on the other hand, Business Performance.
Hypothesis H4 concerning the information gathering of entrepreneurs about public policies also appeared to be not significant in our structural equation model. In particular, concerning the effect of advice of a network organization and a consultant, the ordered logit model shows mixed evidence. Therefore, we conclude that, as far as our data are concerned, no connection can be established between the amount and sources of public policy information and the Business Performance indicators.

357
Of the three hypotheses with regard to Motivational Factors, two (H2b and H2c) were found to be significant and positively related to Business Performance in both models. As such, our results support previous studies which have focused attention on Motivational Factors (e.g., Chrysostome and Arcand, 2009). Furthermore, the positive relationship between social networks and Business Performance adds to the notion that migrant entrepreneurs might be especially dependent on ethnic networks for business success. The acceptance of Hypothesis H2c, linking motivational pull factors to business success, can also be seen in the light of managerial performance, since the factor combines personal motivations with the ability to motivate others (Barney, 1991, 2001; Markman and Baron, 2003). Hypothesis H2a was not supported by the analysis, indicating no significant difference between entrepreneurs who were primarily motivated by factors such as poverty, unemployment or continuation of the family business, and those who were not.
Finally, of the two hypotheses about business location (H5a and H5b), only the current location significantly influenced Business Performance, while the start-up location had no clear effect. Contrary to the initial belief, home businesses reported a better Business Performance than businesses operating from offices outside the home. This might be linked with the earlier observation that migrant entrepreneurs seem more dependent on their local social network, which might be more accessible operating from the home environment.
While we have to acknowledge that not all model fit indices of our final model reached satisfactory levels, with an NFI (.0778) and PNFI (.698) lower than 0.9, a posterior predictive p of 0.00, and a significant χ², it is a known problem that these indices are biased with small sample sizes, a large number of variables, and a non-normal data distribution (Fan et al., 2011; Kenny and McCoach, 2003; Schumacker and Lomax, 2004). Since the better performing RMSEA and CFI indices both indicate a good model fit for the final model, the final parameter estimates can be considered as sufficiently stable. Comparing the estimates under both Maximum Likelihood and Bayesian estimation in Table 10, we observerthat the unstandardized factor weights are very similar between methods, However, as indicated by other authors (e.g. Mîndrilă, 2010; Nevitt and Hancock, 2001), the standard errors of the Maximum Likelihood estimates are inflated under violations of multivariate normality and the inadequate measurement level. While this is not an issue in our analysis, it could potentially result in the rejection of certain parameter estimates and regression paths when used without caution.
358
References Aldrich, H. and Waldinger, R. (1990). "Ethnicity and Entrepreneurship", Annual
Review of Sociology, 16: 111-135. Aldrich, H. and Martinez, M. (2001).“Many are Called, but Few are Chosen: An
Evolutionary Perspective For The Study of Entrepreneurship”, Entrepreneurship Theory & Practice, 25: 41-56.
Alsos, G.A., Isaksen, E.J. and Ljunggren, E. (2006). “New Venture Financing and Subsequent Business Growth in Men- and Women-Led Businesses”, Entrepreneurship Theory & Practice, 30(5): 667-88.
Antonelli, C., (1998). Localised Technological Change, New Information Technology and the Knowledge-based Economy: The European Evidence, Journal of Evolutionary Economics, 8:177-198.
Amit, R., MacCrimmon, K., Zietsma, C. and Oesch, J. (2000). “Does Money Matter? Wealth Attainment as the Motive for Initiating Growth-Oriented Technology Ventures”, Journal of Business Venturing, 16(2): 119-143.
Anand, B.N. and Khanna, T. (2000). “Do Firms Learn to Create Value? The Case of Alliances”, Strategic Management Journal, 21: 295-315.
Arbuckle, J.L. (2009). Amos 18 User’s Guide, Amos Development Corporation: Crawfordville, FL.
Atuahene-Gima, K. and Ko, A. (2001). “An Empirical Investigation of the Effect of Market Orientation Alignment on Product Innovation”, Organization Science 12(1): 54-74.
Bailom, F., Matzler, K. and Tschemernjak, D. (2007). Enduring Success: What Top Companies Do Differently, Palgrave MacMillan: New York, NY.
Barney, J. (1991). “Firm Resources and Sustained Competitive Advantage”, Journal of Management, 17(1): 99-120.
Barney, J.B. (2001). “Resource-Based Theories of Competitive Advantage: A Ten-Year Retrospective on the Resource-Based View”, Journal of Management, 27: 643-50.
Barrett, P. (2007) “Structural Equation Modeling: Adjudging model fit”, Personality and Individual Differences, 42: 815-824.
Bates, T. (1990). “Entrepreneur Human Capital Inputs and Small Business Longevity”, The Review of Economics and Statistics, 72 (4): 551-9.
Baycan-Levent, T. and Nijkamp, P. (2009). “Characteristics of Migrant Entrepreneurship in Europe”, Entrepreneurship & Regional Development, 21(4): 375-397.
Baycan-Levent, T., Masurel, E. and Nijkamp, P. (2003). “Diversity in Entrepreneurship: Ethnic and Female Roles in Urban Economic Life”, International Journal Social Economic, 30(11): 1131-1161.
Baycan-Levent, T., Nijkamp, P. and Sahin, M. (2009). “New Orientations in Ethnic Entrepreneurship: Motivation, Goals and Strategies of New Generation Ethnic Entrepreneurs”, International Journal Foresight and Innovation Policy, 5(1/2/3):3-111.
359
Bhide, A.V. (2000). The Origin and Evolution of New Businesses, Oxford University Press: New York, NY.
Boden, R. and Nucci, A. (2000). “On the Survival Prospects of Men’s and Women’s New Business Ventures”, Journal of Business Venturing, 15 (4): 347-62.
Borjas, G. J. (1999). Heaven’s Door: Immigration Policy and the American Economy, Princeton University Press: Princeton, NJ.
Bowles, J. and Kotkin, J. (2003). “Engine Failure: With Economic Woes That Go Well Beyond 9/11, New York Needs a Bold New Vision to Renew the City’s Economy”, Center for an Urban Future.
Bruner, D.C. (2011). “Identifying and Comparing Characteristics of Successful Minority and Majority Businesses”, McNair Chronicles, 3(1).
Bullvaag, E., Allen, I. E., Bygrave, W. D. and Spinelli, S., Jr. (2006). Global Entrepreneurship Monitor, National Entrepreneurship Assessment, U.S.A., 2004-2005 executive report, Babson College: Wellesley, MA.
Byrne, B.M. (2010). Structural Equation Modeling with AMOS: Basic Concepts, Applications, and Programming, Routledge: New York.
Carrier, C., Raymond, L. and Eltaief, A. (2004). “Cyberentrepreneurship: A Multiple Case Study”, International Journal of Entrepreneurial Behavior and Research, 10(5): 349-363.
Carter, N.M., Williams, M. and Reynolds, P.D. (1997). “Discontinuance among New Firms in Retail: The Influence of Initial Resources, Strategy, and Gender”, Journal of Business Venturing, 12: 125-45.
Cassar, G. (2004). “Entrepreneur Opportunity Costs and Intended Venture Growth”, Journal of Business Venturing, 21(95): 610-32.
Casson M. (1994). The Economics of Business Culture: Game theory, Transaction Costs and Economic Performance, Oxford University Press: New York.
Chakrabarti, A.K. (1990). “Scientific Output of Small and Medium Size Firms in High-Tech Industries”, Engineering Management, IEEE Transactions, 48: 52.
Chrysostome, E. and Arcand, S. (2009). “Survival of Necessity Immigrant Entrepreneurs: An Exploratory Study”, Journal of Comparative International Management, 12(2): 3-29.
Chrysostome, E. and Lin, X. (2010). “Immigrant Entrepreneurship: Scrutinizing a Promising Type of Business Venture”, Thunderbird International Review, 52: 77-82.
Clark, K. and Drinkwater, S. (2000). “Pushed Out or Pulled In? Self-employment among Ethnic Minorities in England and Wales”, Labour Economics, 7: 603-628.
Coniglio, N.D. (2008). “Making Migration Work for Europe”. In: O. Neumaier, G. Schweiger and C. Sedmak (eds) Perspectives on Work.
Cox, C. and Jennings, R. (1995). “The Foundation of Success: The Development and Characteristics of British Entrepreneurs and Intrapreneurs”, Leadership and Organizational Development Journal, 16(7): 4-9.
360
Curci, R. and Mackoy, R. (2010). “Immigrant Business Enterprises: A Classification Framework Coualization and Test”, Thunderbird International Business Review, 52: 107-121.
Dafna, K. (2008). “Managerial Performance and Business Success: Gender Differences in Canadian and Israeli Entrepreneurs”, Journal of Enterprising Communities: People and Places in the Global Economy, 2(4): 300-331.
Deeds, D.L. and Rothaermel, F.T. (2003). “Honeymoons and Liabilities: The Relationship Between Age and Performance in R&D Alliances”, Journal of Product Innovation Management, 20(6): 468-84.
Delft, H. van, Gorter, C. and Nijkamp, P. (2000). “In Search of Migrant Entrepreneurship Opportunities in the City: A Comparative Policy Study”, Environment and Planning C: Government and Policy, 18: 429-451.
Du Reitz, A. and Henrekson, M. (2000). “Testing the Female Underperformance Hypothesis”, Small Business Economics, 14: 1-10.
Duysters, G.M., de Man, A.P. and Wildeman, L. (1999). “A Network Approach to Alliance Management”, European Management Journal, 17(2): 182-7.
Fairlie, R.W. (2008). Estimating the Contribution of Immigrant Business Owners to the U.S. Economy (SBA Office of Advocacy Research Summary No. 334), SBA: Washington, DC.
Fan, X., Thompson, B. and Wang, L. (2011). “Effects of Sample Size, Estimation Methods, and Model Specification on Structural Equation Modeling Fit Indexes”, Structural Equation Modeling: A Multidisciplinary Journal, 6(1): 56-83.
Field, A. (2000). Discovering Statistics Using SPSS for Windows. SAGE Publications: London.
Filatotchev, I., Liu X., Lu, J. and Wright, M. (2011). “Knowledge Spillovers through Human Mobility Across National Borders: Evidence from Zhongguancun Science Park in China”, Research Policy, 40(3): 453-462.
Flamholtz, E. and Randle, Y. (2000). Growing Pains: Transitioning from an Entrepreneurship to a Professionally Managed Firm, Jossey-Bass: San Francisco, CA.
Florida, R. (2002). The Rise of the Creative Class, Basic Books: New York, NY. Freitas, G. de (1991). Inequality at Work: Hispanics in the US Labor Force, Oxford
University Press: New York, NY. Gagnon, Y.C., Sicotte, H. and Posada, E. (2000), “Impact of SME Manager’s
Behavior on the Adoption of Technology”, Entrepreneurship Theory & Practice, 25(2): 43-58.
Gao, S., Mokhtarian, P. L. and Johnston, R. A. (2008). “Nonnormality of Data in Structural Equation Models”, Transportation Research Record, 2082: 116-124.
Garson, G.D. (2011). Structural Equations Modeling, from Statnotes: Topics in Multivariate Analysis. Retrieved from http://www2.chass.ncsu.edu/garson/pa765/statnote.htm
Gigerenzer, G. (2010). “Moral Satisficing: Rethinking Moral Behavior as Bounded Rationality”, Topics in Cognitive Science, 2: 528-554.

361
Greiner, L.E. (1998). “Evolution and Revolution as Organizations Grow”, Harvard Business Review, 76(3): 55-64.
Grilo, I. and Irigoyen, J.M. (2006). “Entrepreneurship in the EU: To Wish and Not To Be”, Small Business Economics, 26(4): 305-18.
Guerrieri, P. and Meliciani, V. (2005). Technology and International Competitiveness: The Interdependence between Manufacturing and Producer
Services, Structural Change and Economic Dynamics, 16: 489-502. Hair, J.F., Anderson, R.E., Tatham, R.L. and Black, W.C. (1998). Multivariate Data
Analysis, Prentice Hall: Upper Saddle River. Hall, R. (1992). “The Intangible Analysis of Strategic Resources”, Strategic
Management Journal, 13: 135-44. Hart, D.M., Acs, Z.J. and Tracy, S.L., Jr. (2009). High-tech Immigrant Entrepreneurship
in the United States, U.S. Small Business Administration Office of Advocacy: Washington, DC.
Hart, D.M. and Acs, Z.J. (2011). “High-tech Immigrant Entrepreneurship in the U.S.”, Economic Development Quarterly, 25: 116-129.
Haas, de H. (2010). “Migration and Development: A Theoretical Perspective”, International Migration Review, 44(1): 227-64.
Hertog, den, P. (2000). Knowledge-intensive Business Services as Co-producers of Innovation, International Journal of Innovation Management, 4(4): 491-528.
Hisrisch, R. D., and Peters, M. P. (1989). Entrepreneurship: Starting, developing, and managing a new enterprise. Homewood, IL: Irwin.
Hisrich, R.D. and Gracher, M.V. (1995). “The Russian Entrepreneur: Characteristics and Prescription for Success”, Journal of Managerial Psychology, 10(2): 3-9.
Ho, C. and Li, D. (2006). Spatial Analysis of City Income Distribution Dynamics in China. Paper presented at the Chinese Economists Society 2006 Annual Conference.
Hodgetts, R.M. and Kuratko, D.F. (1992). Effective Small Business Management, Harcourt Brace Jovanovich: San Diego, FL.
Ibrahim, G. and Galt, V. (2011). “Explaining Ethnic Entrepreneurship: An Evolutionary Economics Approach”, International Business Review.
Johannisson, B. (2000). “Networking and Entrepreneurial Growth”. In: D.L. Sexton and H. Landström (eds), The Blackwell Handbook of Entrepreneurship, Blackwell: Oxford.
Jong, J.P.J. and Hartog, D.N.D. (2007). “How Leaders Influence Employees’ Innovative Behavior”, European Journal of Innovation Management, 10(1): 41-64.
Jöreskog, K.G., and Sörbom, D. (1996). LISREL 8: User's Reference Guide, Scientific Software International: Chicago.
Kalleberg, A.L. and Leicht, K.T. (1991). “Gender and Organizational Performance: Determinants of Small Business Survival and Success”, Academy of Management Journal, 34(1): 136-61.
Kapur, D. (2003). “Remittances: The New Development Mantra”, Paper prepared for the G-24 Technical Group Meeting.
362
Kenny, D.A. and McCoach, B.D. (2003). “Effect of the Number of Variables on Measures of Fit in Structural Equation Modeling”, Structural Equation Modeling: A Multidisciplinary Journal, 10(3): 333-351.
Kirzner, I.M. (1973). Competition and Entrepreneurship, University of Chicago Press: Chicago, IL.
Kline, R.B. (2010). Principles and Practice of Structural Equation Modeling. Third Edition, Guilford Press: New York.
Kloosterman, R. and Rath, J. (2001). “Immigrant Entrepreneurs In Advanced Economies: Mixed Embeddedness Further Explored”, Journal of Ethnic and Migration Studies, 27(2): 189-202.
Kubinger K.D. (2003). “On Artificial Results Due to Using Factor Analysis For Dichotomous Variables”, Psychology Science, 45(1): 106-110.
Kuratko, D.F. and Hodgetts, R.M. (2004). Entrepreneurship: Theory, Process & Practice, South-Western Publishers: Mason, OH.
Light, I.H. and Rosenstein, C.N. (1995). Race, Ethnicity, and Entrepreneurship in Urban America, Aldine de Gruyter: New York, NY.
Light, I. and Bonacich, E. (1988). Immigrant Entrepreneurs: Koreans in Los Angeles 1965-1982, University of California Press: Berkeley, CA.
Lee, S.Y. and Song X.Y. (2003). “Bayesian Analysis of Structural Equation Models With Dichotomous Variables”, Statistics in Medicine, 22: 3073-3088.
Makhbul, Z.M. (2011). “Entrepreneurial Success: An Exploratory Study among Entrepreneurs”, International Journal of Business and Management, 6(1): 116-125.
March, J.G. (1978). “Bounded Rationality, Ambiguity, and the Engineering of Choice”, Bell Journal of Economics, 9: 587-608.
Marczyk, D., DeMatteo, D. and Festinger, D. (2005). Essentials of Research and Design Methodology. John Wiley & Sons: New York, NY.
Markman, G. and Baron, R. (2003). “Person-Entrepreneurship Fit: Why Some People Are More Successful as Entrepreneurs than Others”, Human Resource Management Review, 13(2): 281-301.
Marlow, S. (1992). “The Take-up of Business Growth Training Schemes by Ethnic Minority-owned Firms in Britain”, International Small Business Journal, 10(4): 34-47.
McClelland, D.C. (1961). The Achieving Society, D. Van Norstrand Co. Inc: New York, NY, pp. 210-215.
Meredith, G.G., Nelson, R.E. and Neck, P.A. (1982). “The Practice of Entrepreneurship”, Geneva International Labour Office: Switzerland.
Merenda, P.F. (1997). “A Guide to the Proper Use of Factor Analysis in the Conduct and Reporting of Research: Pitfalls to Avoid”, Measurement and Evaluation in Counseling and Development, 30: 156-164.
Minetti, M., Allen, E. and Langowitz, N. (2006). GEM: Report and Women and Entrepreneurship, Global Entrepreneurship Monitor, a joint publication of The Center for Women’s Leadership at Babson College and the London School of Business.
363
Mîndrilă, D. (2010). “Maximum Likelihood (ML) and Diagonally Weighted Least Squares (DWLS) Estimation Procedures: A Comparison of Estimation Bias with Ordinal and Multivariate Non-Normal Data”, International Journal of Digital Society, 1(1): 60-66.
Mulaik, S.A. and Millsap, R.E. (2000). “Doing the Four-step Right”, Structural Equation Modeling, 7: 36-73.
Muthén, B. and Kaplan, D. (1985). “A Comparison of Methodologies for the Factor Analysis of Non-Normal Likert Variables”, British Journal of Mathematical and Statistical Psychology, 38(1): 171-189.
Nandram, S.S. (2002). “Attributes of Entrepreneurial Success and Failures. New Perspectives gained from the Critical Incident Technique”, in Conference Proceedings. The 2002 Small Business and Entrepreneurship Development Conference, The University of Nottingham: UK.
Ndofor, A.H. and Priem, R.L. (2011). “Immigrant Entrepreneurs, the Ethnic Enclave Strategy, and Venture Performance”, Journal of Management , 37(3): 790-818.
Neelankavil, J., Mathur, A. and Zhang, Y. (2000). “Determinants of Managerial Performance: A Cross-cultural Comparison of the Perceptions of Middle-level Managers in Four Countries”, Journal of International Business Studies, 31(1), 121-140.
Nevitt, J. and Hancock, G.R. (2001). “Performance of Bootstrapping Approaches to Model Test Statistics and Parameter Standard Error Estimation in Structural Equation Modeling”, Structural Equation Modeling: A Multidisciplinary Journal, 8(3): 353-377.
Perren, L. (1999). “Factors in the Growth of Micro-enterprises: Developing a Framework, Journal of Small Business and Enterprise Development, 6(4): 366-385.
Portes, A. and Rumbaut, R. (1996). Immigrant America: A Portrait, University of California Press: Berkley, CA.
Rath, J. (2000). “Introduction; Immigrant Business and the Economic, Politico-Institutional and Social Environment”. In: J. Rath (ed.), Immigrant Business: The Economic, Political and Social Environment, Macmillan Press: London, pp. 1-19.
Ratha, D., Mohapatra, S. and Scheja, E. (2010). ‘’Impact of Migration on Economic and Social Development: A Review of Evidence and Emerging Issues”, World Bank Policy Research Working Paper No. 5558.
Rotter, J.B. (1966). “Generalized Expectations For Internal Versus External Control of Reinforcement”, Psychological Monographs: General and Applied, 80(1): 1-27.
Rusinovic, K. (2008) "Moving Between Markets? Immigrant Entrepreneurs in Different Markets", International Journal of Entrepreneurial Behaviour & Research, 14(6): 440-454.
Sahin, M., Todiras, A., Nijkamp, P. and Masurel, E. (2011a). “An Explanatory Model for the Economic Performance of Migrant Entrepreneurs in the High-tech Sector”. In: P. Nijkamp, J. Poot and M. Sahin (eds), Migration Impact Analysis: New Horizons (forthcoming).
364
Sahin, M., Todiras, A., Nijkamp, P. and Suzuki, S. (2011b). Migrant Impact Assessment of Ethnic Entrepreneurs: Data Envelopment Analysis as a Policy Support Tool, Innovation (forthcoming).
Sahin, M., Todiras, A., and Nijkamp, P. (2012). Colourful Entrepreneurship in Dutch Cities: A Review and Analysis of Business Performance, Regional Science Inquiry, 3(2): 179-197.
Saunders, M., Lewis, P. and Thornhill, A. (2006). Research Methods For Business Students, Prentice Hall: Harlow.
Say, J.B. (1971). A Treatise on Political Economy or the Production, Distribution and Consumption of Wealth. A.M. Kelley Publishers: New York, NY.
Schumacker, R.E. and Lomax, R.G. (2004). A Beginner’s Guide to Structural Equation Modeling, Lawrence Erlbaum Associates: New Jersey.
Sethi, V. and King, W. R. (1994). "Development of Measures to Assess the Extent to Which an Information Technology Application Provides Competitive Advantage", Management Science, 40(12): 1601-1627.
Sexton, D.L. and Bowman-Upton, N. (1990). “Female and Male Entrepreneurs: Psychological Characteristics and Their Role in Gender Related Discrimination”, Journal of Business Venturing, 5(1): 29-36.
Shane, S. and Venkataraman, S. (2000). “The Promise of Entrepreneurship as a Field of Research”, Academy of Management Review, 25: 217-226.
Sharma, S. (1996). Applied Multivariate Techniques, John Wiley & Sons: New York. Silvia, E.S.M. and MacCallum, R.C. (1988). “Some factors affecting the success of
specification searches in covariance structure modeling”, Multivariate Behavioral Research, 23: 297-326.
Smallbone, D., Bertotti, M. and Ekanem, I. (2005). “Diversification in Ethnic Minority Business: The Case of Asians in London’s Creative Industries”, International Journal of Entrepreneurial Behaviour & Research, 12(1): 41-56.
Steensma, H.K., Marino, L. and Dickson, P.H. (2000). “The Influence of National Culture on the Formation of Technology Alliances by Entrepreneurial Firms, Academy of Management Journal, 43(5), 951-973.
Swiercz, P.M. and Lydon, S.R. (2002). “Entrepreneurial Leadership in High-tech Firms: A Field Study”, Leadership and Organization Development Journal, 23(7): 380-389.
Tabachnick, B.G. and Fidell, L.S. (1996). Using Multivariate Statistics. HarperCollins: New York, USA.
Train, K. (2003). Discrete Choice Models With Simulation, Cambridge University Press: Cambridge.
Tzilivakis, K. (2005). Athens News Online, ATHENS NEWS, 26/08/2005, page: A15, Article code: C13145A151.
Wadhaw, R.K. (1998). Entrepreneur and Enterprise Management, Karishka Publisher: India.
Waldinger, R. (1986). “Immigrant Enterprise”, Theory and Society, 15(1-2): 249-285.
365
Walter, A., Auer, M. and Ritter, T. (2006). “The Impact of Network Capabilities and Entrepreneurial Orientation on University Spin-Off Performance”, Journal of Business Venturing, 21 (4): 541-67.
Wang, Q. (2010). “Immigration and Ethnic Entrepreneurship: A Comparative Study in the United States”, Growth and Change, 42(3): 430-450.
Watson, K., Horgarth-Scott, S. and Wilson, N. (1998). “Small Business Start-Ups: Success Factors and Support Implication”, Journal of Entrepreneurial Behaviour and Research, 4(3): 217-238.
Watson, J. (2006), “External Funding and Firm Growth: Comparing Female- and Male-Controlled SME’s”, Venture Capital, 8(1): 33-49.
Weitzman, M. and Kruse, D.L. (1990). “Profit Sharing and Productivity”. In: A.S. Blinder (ed.), Paying for Productivity. A Look at the Evidence, Brookings Institution: Washington, DC.
Wothke, W. (1993). Nonpositive Definite Matrices In Structural Modeling, In: K.A. Bollen and J.S. Long (eds), Testing structural equation models, Sage Publications: Newbury Park, CA, pp. 256-293.
Wright, K. and Black, R. (2011). “International Migration and the Downturn: Assessing the Impacts of the Global Financial Downturn on Migration, Poverty and Human Well-being”, Journal of International Development, 23(4): 555-564.
Yin, R.K. (1989). Case study research: Design and methods, SAGE Publications: London. Yung, Y.F. and Bentler, P.M. (1994). “Bootstrap-corrected ADF Test Statistics In
Covariance Structure Analysis”, British Journal of Mathematical and Statistical Psychology, 47: 63-84.
Zahra, S.A. (2007). “Contextualizing Theory Building in Entrepreneurship Research”, Journal of Business Venturing, 22(3): 443-52.
Zaiceva, A. and Zimmermann, K. (2008). ‘’Scale, Diversity, and Determinants of Labour Migration in Europe’’, Oxford Review of Economic Policy, 24(3): 427-451.
Zenger, T.R. (1992). “Why do Employers Only Reward Extreme Performance? Examining the Relationships among Performance, Pay, and Turnover”, Administrative Science Quarterly, 37: 198-219.
Zou, M. and Kim, S. (2006). “Community Forces, Social Capital and Educational Achievement: The Case of Supplementary Education in the Chinese and Korean Immigrant Communities”, Harvard Educational Review, 76(1): 1-29.

366
CHAPTER 12
CONCLUSION
1. RETROSPECT
It is noteworthy that the past decades have shown a remarkable growth in entrepreneurship among migrants. Recent studies on ethnic entrepreneurship have observed an increasing share of migrants in urban small- and medium-sized entrepreneurial businesses. The phenomenon of migrant entrepreneurship deserves more in-depth scientific investigation, on the basis of, inter alia, comparative studies in terms of incubator conditions and critical success factors (CSFs) for a promising and efficient business performance. Given the growing importance of entrepreneurship, there is practical value in being able to identify these CSFs. Due insight into entrepreneurial behaviour and the relative performance of migrants is needed to develop an effective business policy, in which migrants are seen as a source of new socio-economic opportunities, for both the migrant groups and the city concerned. Strategic information will also be necessary for the development of fine-tuned policy strategies to enhance the participation of traditionally less-privileged groups and to improve their business performance potential.
The Netherlands is a great example of an ethnically colourful country with strong multiculturalism, where migrant enterprises enrich the society and people appreciate the added value of cultural diversity. The rise of migrant entrepreneurship, in general, appears to have had a favourable effect on the economy of the Netherlands. During the economic decline of recent years, the presence of migrant entrepreneurs has been one of the factors which have kept the urban economy running. Migrant entrepreneurship reflects different cultures and open-ended capacities for the creation of economic growth in cities, and contributes to economic diversity. Different migrant groups and different cultures can show different characteristics in terms of driving forces, motivation, performance, and conditions for success. Moreover, besides the most obvious cultural differences that exist between peoples, such as language, attire, and traditions, there are also significant variations in how societies organize themselves, in their shared perception of morality, and in the ways they interact with their environment. It is debatable whether these differences are merely incidental artifacts arising from patterns of human migration, or whether they represent an evolutionary trait that is key to our success as a species.
367
In order to evaluate migrant entrepreneurship, we have addressed different groups of migrant entrepreneurs in the Netherlands by comparing their socio-economic and cultural differences. We focused mainly on four active and dominant migrant groups, viz. Turks, Moroccans, Surinamese, and Antilleans in the Netherlands, and we compared these groups in terms of their entrepreneurial behaviour and performance. In the Netherlands, the migrant populations from Turkey and Morocco are rather similar regarding their demographic composition. They are, on average, less well-educated, and most likely to be married, and most migrants from these countries consider themselves to be Muslim. The migrants from Surinam and Antilles are better educated, more familiar with the Dutch culture and language, and more often single or single parents. Migrants from Surinam and the Antilles also have similar demographic characteristics. Regarding the labour force participation rate of women and the share of married couples in the total number of households, the Surinamese and Antilleans have much in common with the native Dutch population. The educational level is lowest for migrant groups from Turkey and Morocco. Migrants from Surinam and the Antilles have, on average, higher educational levels, yet not as high as those of the native population. First-generation migrants are far more entrepreneurial than the second-generation migrants. Among the Turkish and Moroccan migrant groups, it can be seen that men are relatively more entrepreneurial. The other two major groups of migrants from Suriname and the Dutch Antilles show that entrepreneurship is more or less evenly distributed among males and females.
2. FINDINGS
Our study was instigated by the conviction that migrant entrepreneurs deserve more attention. Migrant minorities are usually a highly motivated and qualified entrepreneurial group. Migrant entrepreneurs are seen as the future entrepreneurs of the Netherlands. The country’s welfare is increasingly dependent on the success of this group of entrepreneurs. The ambition and desire of migrant entrepreneurs to start their own businesses is much higher compared with the motivation of the native population of the Netherlands. In addition, migrants are becoming more professional and often have sky-high ambitions. Migrant minority businesses mostly fall into the category of Small and Medium-sized Enterprises (SMEs). Such SMEs play a significant role in the domestic economies of most countries. Each and every successful self-employed migrant or minority business contributes to improved social and economic integration. A growing migrant economy creates a virtuous circle: business success gives rise to a distinctive motivational structure, breeding a community-wide orientation towards entrepreneurship.
Differences among migrant entrepreneurs may be caused by differences in their entrepreneurial behaviour. Besides the migrant network and support, the success of migrant entrepreneurs depends on their personality and work discipline; and on their inclination to be ambitious, patient, obstinate, and self-confident. Other

368
reasons for success could be to work hard and conscientiously, and have good relationships with clients. To like the job and to do a good job, and to be supported by spouse and family members are also explanations for the success of migrant entrepreneurs (Baycan-Levent et al., 2003). Within a multicultural society it is plausible that differences in basic cultural values, attitudes and behaviour of the various ethnic communities influence their attitude towards entrepreneurship.
In this thesis, we were particularly interested in the question whether the dominant migrant entrepreneur groups (Moroccans, Surinamese, Turks, and Antilleans) in the Netherlands have significant differences in CSFs for their business performance. The main research question of this study is:
Under which socio-cultural and economic conditions will migrant entrepreneurs develop a successful business, with a particular view to entering new market segments and contributing to a dynamic and innovative urban business climate?
The main challenge of our research was to explore the differences in the business performance factors of migrant entrepreneurs that are linked to their success and possible ‘break-out’ strategy towards new markets, given their socio-cultural background and network context. It is also important to consider the following sub-questions:
To what extent do contextual and individual motivational factors influence the business performance of migrant entrepreneurs in a multicultural playing field?
Does the existence of migrant linkages and socio-cultural bonds in urban networks of migrants help to improve business performance and support conditions for entry into new markets in a competitive urban economic environment?
Our study comes up with the results for each of these distinct groups and also offers an overall comparative evaluation for four groups of migrant entrepreneurs. The results of our own analysis, based on rough set analysis, show that the CSFs in performance (e.g. market share, change in turnover, profit) differ among the migrant groups. Our comparative evaluation clearly shows that there are some culture-based differences among the respondents in their perception of business, as well as in the CSFs that determine their performance level. The results of our analysis show that Moroccan and Surinamese entrepreneurs are much more aware of the market situation, as well as of external success factors and leadership, whereas Turkish entrepreneurs are much more aware of internal success factors such as management of their relationships with employees and customers. However, surprisingly, it seems that awareness of internal success factors contributes much more to the success level or to an increase in performance than external success factors or leadership.
The results of our analysis, based on DEA analysis, show that the performance of migrant entrepreneurs may differ based on their efficiency rate. Our study show that 15 of the 83 entrepreneurs in the Amsterdam sample are efficient (they have relative efficiency scores of 1.00, which is the maximum possible score), and that 12 of the 42 entrepreneurs in the Fairfax sample are efficient (they have relative efficiency scores of 1.00, which is the maximum possible score). But these
369
findings are certainly provisional and call for more solid research on a large sample of migrant entrepreneurs. For further research it would be interesting to examine possible reasons for differences in performance and efficiency rates between migrant entrepreneurs. Possible reasons for low, or differences in efficiency rates amongst migrant entrepreneurs may be caused by the limited potential for growth of their market niches, because several of these entrepreneurs appear to operate in limited markets. Other reasons for their low efficiency rate may be less labour (-market) experience and lack of entrepreneurial experience. Moreover, they are most often not aware, and do not make use, of support facilities provided by the Dutch government.
A growing number of the second-generation migrant entrepreneurs and an orientation to non-traditional sectors have become the new trends in migrant entrepreneurship in recent years. Although traditional sectors are still most popular among the first-generation migrant entrepreneurs, due to the increasing pressure and high competitiveness in traditional areas, new niches are developing. While the first-generation has more often become active in the traditional sector areas, the second-generation has been more active in advanced producer services, such as finance, insurance, real estate and business-related professional services (FIRE), and has also contributed to the emergence of new areas of immigrant business activity, such as ICT and the creative industries. Similar trends are also observed in the Netherlands. A general evaluation of immigrant entrepreneurship in the Netherlands highlights a sectoral change towards producer services, characterized by an increasing number of second-generation immigrant entrepreneurs.
Furthermore, our study investigated the new external orientations in immigrant entrepreneurship in terms of the motivation, sector choice, goals and strategies of the second-generation immigrant entrepreneurs when addressing the second-generation Turkish entrepreneurs in the ICT and FIRE sectors in the Netherlands. The results of our study show that the second-generation Turkish entrepreneurship in the Netherlands started after 1996, and there has been an enormous increase in start-up enterprises, especially after 2000. The results of our study also show that the motivation and driving forces of the second-generation Turkish entrepreneurs stem from both their personal characteristics, shaped by their higher educational level and language ability, and their previous working experience as an employee or entrepreneur in the same sector. The demand for, and a gap in, the sector, as well as the growing and promising structure of the sector play also an important role in pulling the second-generation Turkish immigrants to become entrepreneurs in these new sectors. On the other hand, the results of our study show that the second-generation Turkish entrepreneurs are less oriented to co-ethnic clientele, and are more embedded in formal networks, while keeping their informal networks as a complementary option.
This thesis then addressed in particular ethnic entrepreneurship as a major force field in the SME sector in many contemporary urban areas. In this connection, we made two empirical studies – one from the Netherlands and one from the US –
370
which highlight the impact of social and human capital on business performance. Research studies on motivation and critical success conditions for ethnic entrepreneurs demonstrate that performance conditions vary across ethnic groups. The studies that consider differences by race and ethnicity find that human capital, access to finance, and industry structures may produce systematic differences (Bates, 1993; Fairlie, 1999, Butler and Greene, 1997).
Minority-owned businesses lag behind non-minority-owned businesses in terms of sales, profits, survivability, and employment: coming up against greater obstacles in obtaining financing for their business implies that an already difficult situation is growing worse. According to Holguin et al. (2006), there are several significant barriers that are specifically faced by some groups of ethnic entrepreneurs in the US. Access to financial capital, access to mentors and networks, access to labour market, and barriers to the marketplace are highly important when starting a business and these factors can discourage the development of the business. Studies of migrant and ethnic communities, in particular, show that minority businesses that are better embedded in the local community, serve a large share of residents in the neighbourhood, and help their community as a whole to do better than they might have otherwise.
Migrant entrepreneurs not only have to deal with arbitrary problems of entrepreneurship, but also with specific problems that occur among these groups. Firstly, communication is an important aspect which needs attention. One of the main problems is the distance in approach and the excessive amount of information sent via letters and on the Internet. This type of communication is not effective among migrant entrepreneurs, since they would prefer the personal approach. Secondly, the fact that most migrant entrepreneurs are uninformed and have a limited network is a main problem. Most of the time they are unaware of the issuing of the rules and the facilities which are provided. Rarely do they have a business plan, which results in an unprepared start. Developing role models would help in this case. Finally, the minimum contact between entrepreneurs and advice organizations such as business associations, Chambers of Commerce and native entrepreneurs is another problem. One important consequence is that migrant entrepreneurs do not make use of the information/support/ assistance possibilities.
Our findings brought to light new patterns in business performance of ethnic entrepreneurs. It turns out that the business profile of migrant entrepreneurship is changing from the first generation to the second. This ‘break-out’ strategy positions migrant entrepreneurs in a mature competitive context, and herealds essentially a socio-economic emancipation of this class of entrepreneurs. Our study has indentified the success conditions for business performance of this new class of migrant entrepreneurs.
The results of our investigation show that a new orientation to the non-traditional sector, or, in other words, an external orientation with a combination of personal characteristics, skills and experience, may produce a very high economic performance and success level of the second-generation Turkish entrepreneurs.

371
Therefore, this new orientation may also help them to escape from the ethnic enclave and breake out from their ethnic dependency. Moreover, this external orientation may also help them to expand their market. The results of our study show that the motivation and driving forces of the second- generation Turkish entrepreneurs stem from both their personal characteristics shaped by their higher educational level and their previous working experience as an employee or entrepreneur in the same sector. The demand for, and a gap in, the sector, as well as the growing and promising structure of the sector play, also have an important role in pulling the second-generation Turkish immigrants to become entrepreneurs in these new sectors.
The results of our study by using rough set analysis show that the most important factors in motivation, driving forces and sectoral choice of the second-generation Turkish entrepreneurs in the ICT and FIRE sector in the Netherlands have emerged in three factors/attributes: (a) nationality of employees; (b) preferences for employees; and (c) target group. The results of the rough set analysis also show that there are some differences in orientation to the ICT and the FIRE sectors. While educational attainment and working experience appear as determining factors towards orientation to the ICT sector, the existence of both Turkish entrepreneurs in the sector and potential Turkish clients, as a result a perceived demand for the sector constitute the determining factors behind the choice for the FIRE sector. An overall evaluation shows that Turkish entrepreneurs in the ICT sector exhibit a more independent feature than those in the FIRE sector. Those in the FIRE sector seem to be more dependent on the ethnic market and ethnic niche. However, the general results of our study show that the second-generation Turkish entrepreneurs in the Netherlands have started to orient towards new and non-traditional sectors like the ICT and FIRE sectors instead of staying in the traditional hospitality sector which is popular among Turkish entrepreneurs.
Ultimately, our structural equation model shows that three of the eight hypothesized paths were statistically significant at a .05 probability level. Of the three significant paths, only the paths between social networks (MTF2) and pull factors (MTF3) had the direction predicted, while current business location (BEF1) and business performance showed a reverse relationship. This means that the support framework offered by migrant linkages and socio-cultural bonds in urban networks of migrants does help to improve business performance and their socio-economic conditions for entry into new markets in a competitive urban economic environment. The results suggest no significant relationship between the socio-economic factors (SEF1 and SEF2) and business performance. While previous studies have suggested a significant positive impact of innovation and business culture in general (e.g. Casson, 1994; Chakrabarti, 1990; Deeds and Rothaermel, 2003), this study indicates a lack of relationship between, on the one hand, the use of the Internet with lower transaction costs, training of employees and accessibility to new markets, and, on the other hand, the business performance.

372
The information gathering of entrepreneurs about public policies also appeared to be not significant in our structural equation model. In particular, concerning the effect of advice from a network organization and a consultant, the ordered logit model shows mixed evidence. Therefore, we conclude that, as far as our data is concerned, no connection can be established between the amount and sources of public policy information and the business performance indicators. Of the three hypotheses with regard to motivational factors, two (social networks and motivational pull factors) were found to be significant and positively related to business performance. As such, our results support previous studies which have focused attention on motivational factors (e.g. Chrysostome and Arcand, 2009). Furthermore, the positive relationship between social networks and business performance adds to the notion that migrant entrepreneurs might be especially dependent on ethnic networks for business success. Motivational push factors were not supported by the analysis, indicating no significant difference between entrepreneurs who were primarily motivated by factors such as poverty, unemployment or continuation of the family business, and those who were not.
Regarding our research question, we can state that, besides the migrant network and support, the success of migrant entrepreneurs depends on their personality and work discipline, as well as on their attitude to be ambitious, patient, tenacious, and self-confident. Other reasons for success are to work hard and conscientiously, and to have good relationships with clients. To like the job and to do a good job, and to be supported by spouse and family members are also explanations for the success of migrant entrepreneurs (Baycan-Levent et al., 2003). The possible reason for low, or differences in, efficiency rates among migrant entrepreneurs may be the limited potential for growth of their market niches, because they appear to operate in limited markets. Other reasons for their low efficiency rate may be less labour ( - market) experience and lack of entrepreneurial experience. Moreover, they are most often not aware, and do not make use, of support facilities provided by the Dutch government. A way to improve possibilities for migrant entrepreneurs in Amsterdam is for them to go beyond their own ethnic frontiers and expand their activities into broader and other market segments and business lines, competing or associating with the native Dutch entrepreneur in their own markets. This new strategy may need improvement of their skills and knowledge of the Dutch language. Here established associations can play a role in order to improve the relationship between migrant entrepreneurs and private and public institutions in the Netherlands.
The general results of this study based on the motivation, performance and efficiency of migrant entrepreneurs approached are presented in Table 1.
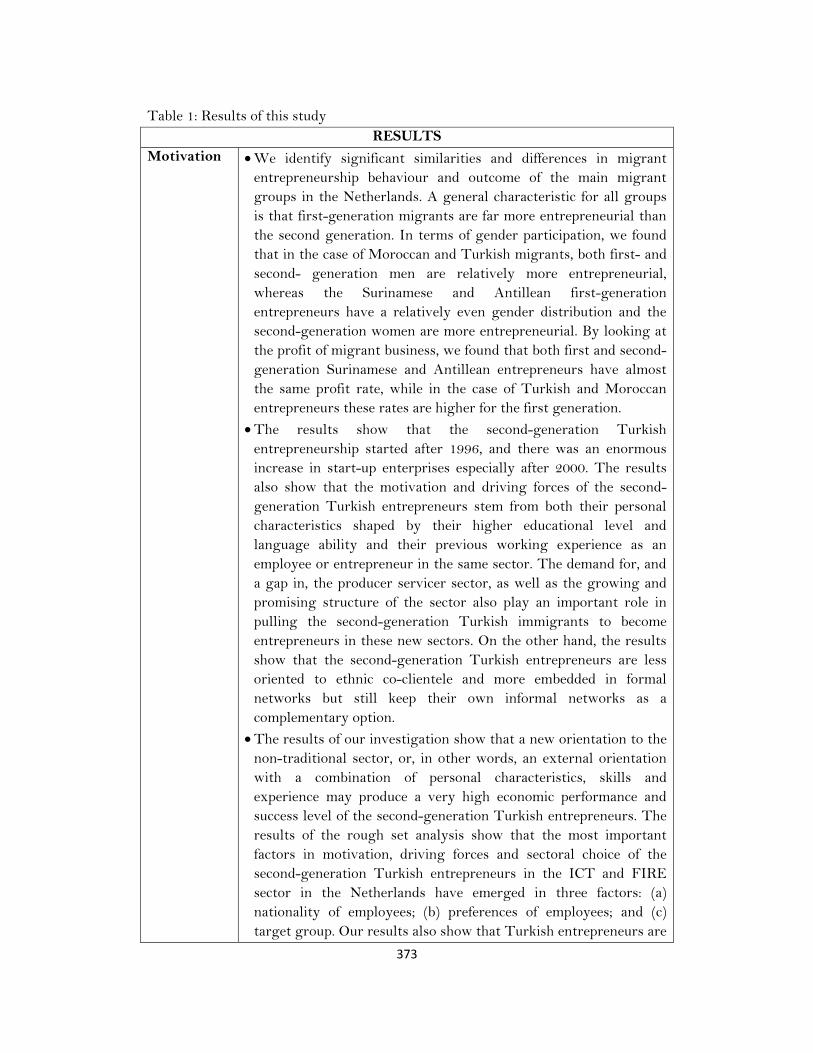
373
Table 1: Results of this study RESULTS
Motivation We identify significant similarities and differences in migrant entrepreneurship behaviour and outcome of the main migrant groups in the Netherlands. A general characteristic for all groups is that first-generation migrants are far more entrepreneurial than the second generation. In terms of gender participation, we found that in the case of Moroccan and Turkish migrants, both first- and second- generation men are relatively more entrepreneurial, whereas the Surinamese and Antillean first-generation entrepreneurs have a relatively even gender distribution and the second-generation women are more entrepreneurial. By looking at the profit of migrant business, we found that both first and second-generation Surinamese and Antillean entrepreneurs have almost the same profit rate, while in the case of Turkish and Moroccan entrepreneurs these rates are higher for the first generation.
The results show that the second-generation Turkish entrepreneurship started after 1996, and there was an enormous increase in start-up enterprises especially after 2000. The results also show that the motivation and driving forces of the second-generation Turkish entrepreneurs stem from both their personal characteristics shaped by their higher educational level and language ability and their previous working experience as an employee or entrepreneur in the same sector. The demand for, and a gap in, the producer servicer sector, as well as the growing and promising structure of the sector also play an important role in pulling the second-generation Turkish immigrants to become entrepreneurs in these new sectors. On the other hand, the results show that the second-generation Turkish entrepreneurs are less oriented to ethnic co-clientele and more embedded in formal networks but still keep their own informal networks as a complementary option.
The results of our investigation show that a new orientation to the non-traditional sector, or, in other words, an external orientation with a combination of personal characteristics, skills and experience may produce a very high economic performance and success level of the second-generation Turkish entrepreneurs. The results of the rough set analysis show that the most important factors in motivation, driving forces and sectoral choice of the second-generation Turkish entrepreneurs in the ICT and FIRE sector in the Netherlands have emerged in three factors: (a) nationality of employees; (b) preferences of employees; and (c) target group. Our results also show that Turkish entrepreneurs are
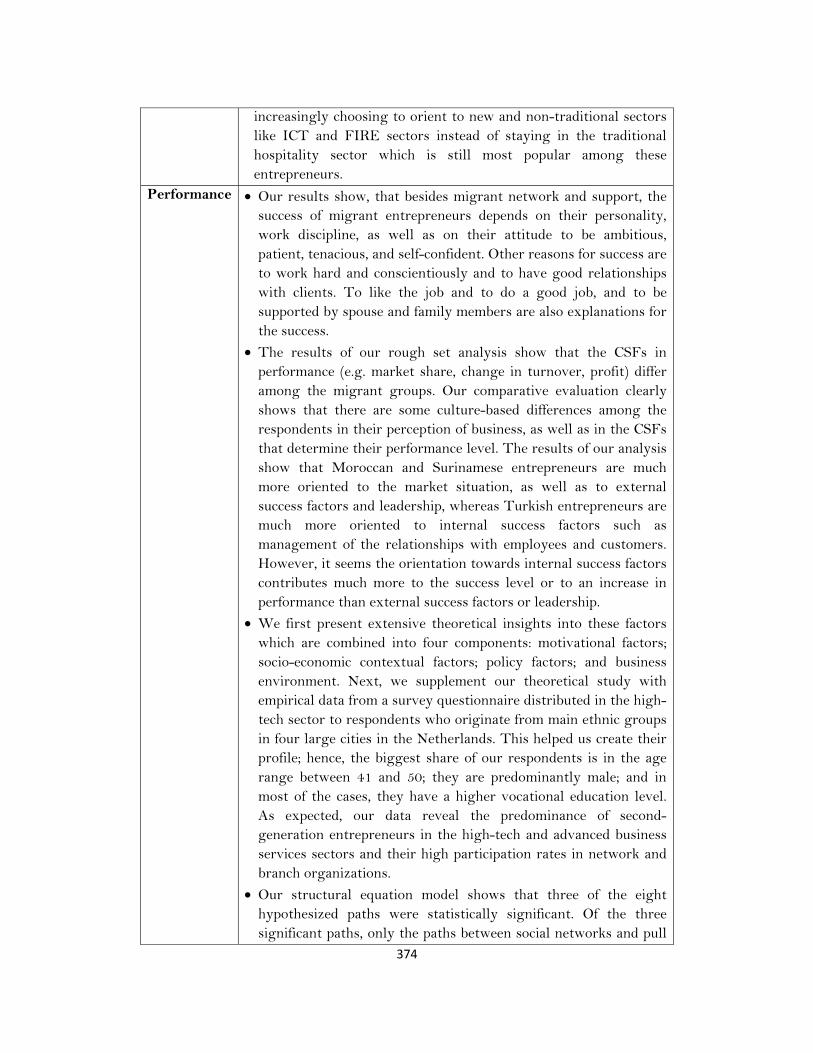
374
increasingly choosing to orient to new and non-traditional sectors like ICT and FIRE sectors instead of staying in the traditional hospitality sector which is still most popular among these entrepreneurs.
Performance Our results show, that besides migrant network and support, the success of migrant entrepreneurs depends on their personality, work discipline, as well as on their attitude to be ambitious, patient, tenacious, and self-confident. Other reasons for success are to work hard and conscientiously and to have good relationships with clients. To like the job and to do a good job, and to be supported by spouse and family members are also explanations for the success.
The results of our rough set analysis show that the CSFs in performance (e.g. market share, change in turnover, profit) differ among the migrant groups. Our comparative evaluation clearly shows that there are some culture-based differences among the respondents in their perception of business, as well as in the CSFs that determine their performance level. The results of our analysis show that Moroccan and Surinamese entrepreneurs are much more oriented to the market situation, as well as to external success factors and leadership, whereas Turkish entrepreneurs are much more oriented to internal success factors such as management of the relationships with employees and customers. However, it seems the orientation towards internal success factors contributes much more to the success level or to an increase in performance than external success factors or leadership.
We first present extensive theoretical insights into these factors which are combined into four components: motivational factors; socio-economic contextual factors; policy factors; and business environment. Next, we supplement our theoretical study with empirical data from a survey questionnaire distributed in the high-tech sector to respondents who originate from main ethnic groups in four large cities in the Netherlands. This helped us create their profile; hence, the biggest share of our respondents is in the age range between 41 and 50; they are predominantly male; and in most of the cases, they have a higher vocational education level. As expected, our data reveal the predominance of second-generation entrepreneurs in the high-tech and advanced business services sectors and their high participation rates in network and branch organizations.
Our structural equation model shows that three of the eight hypothesized paths were statistically significant. Of the three significant paths, only the paths between social networks and pull
375
factors had the direction predicted, while current business location and business performance showed a reverse relationship. The results suggest no significant relationship between the socio-economic factors (operational characteristics and access to new markets) and business performance, whereas the ordered logit model suggests that a relationship between access to new markets (SEF2) and business performance exists. The results also suggest no significant relationship between public policy factors and business performance. Social networks and motivational pull factors were found to be significant and positively related to business performance. Finally, concerning business location, only the current location significantly influenced business performance, while the start-up location had no clear effect.
Efficiency The results of the DEA analysis show that 15 out of 83 entrepreneurs in our study are efficient since they achieve the maximum efficiency score 1.0. From this, 7 Turkish entrepreneurs, 12 Moroccan entrepreneurs, and 5 entrepreneurs of Surinamese origin are efficient. Our results reveal that Moroccan-owned businesses have the highest efficiency rates, and not, as would be expected, those that are Turkish-owned. Furthermore, we find that businesses owned by migrant entrepreneurs in the age range of 26 to 30 have both the highest rate of efficiency and the highest rate of failure.
The results of our analysis, based on the DEA analysis, show that the performance of migrant entrepreneurs may differ in terms of their efficiency rate. Possible reasons for low, or differences in, efficiency rates amongst migrant entrepreneurs may be caused by the limited potential for growth of their market niches, because several of these entrepreneurs appear to operate in limited markets. Other reasons for their low-efficiency rate may be less labour (-market) experience and lack of entrepreneurial experience.
The results of the DEA analysis show that 8 out of 50 migrant businesses in our sample were operating efficiently, since they have a relative efficiency score of 1.00, which is the maximum score possible. We made a distinction between first-and second-generation migrants. It is interesting to note that almost 30 per cent of the first-generation entrepreneurs have an efficiency score equal to the maximum value, while only 11 per cent of the second-generation have an efficiency score of 1.00, which is the maximum score. We next looked at the education level of the migrant entrepreneurs as a discriminatory variable. The cross-analysis on business efficiency according to education level showed some surprising results – the most efficient entrepreneurs with an

376
efficiency score of value A are those with a middle vocational education level, not university level as expected. Therefore, by looking at the cross-comparative results on business efficiency according to education level, we can conclude that a higher level of education does not necessarily improve the efficiency score of Decision-making Units (DMUs).
3. POLICY ISSUES
In Europe, entrepreneurship is regarded as the most important driver of the economy, and this observation has paved the way for Union-wide stimulation programme in EU countries. The European Union’s aim is to improve the business environment of SMEs and promote entrepreneurship. It is also noteworthy that SMEs form about 99 per cent of the businesses. To support all SMEs and entrepreneurship, a framework entitled Small Business Act for Europe (SBA) has been introduced (European Commission, 2011).
Another issue tackled by European policy is that of the significance of migrants: they form an important part of the pool of entrepreneurs in Europe. Evidence from various Member States suggests that members of different ethnic groups start businesses more often than the native population. However, apart from those difficulties shared by migrant enterprises and local SMEs, there are some specific barriers that migrant entrepreneurs are likely to encounter (European Commission, 2011). These are the difficulties in accessing financial and other support services, while migrants also often have language barriers and a low-level of business, management and marketing skills. All this has led to an overconcentration of migrant businesses in the low-skill sectors, such as retail, hospitality, and catering, which are characterized by fierce competition and a limited possibility of ‘break-out’ into the mainstream markets. Therefore, special attention by the policy makers may be directed towards supporting and promoting migrant entrepreneurship, as well as helping migrants overcome the difficulties they have to face when setting up and growing a company. Furthermore, there is a need to increase the awareness of different stakeholders concerning the additional issues that migrant entrepreneurs have to cope with in comparison to the native population.
In the Netherlands, in the last two decades the rate of migrant entrepreneurship has grown at a faster pace than that of the native Dutch population. In the Netherlands, policy measures may have to be directed towards improving the educational levels of immigrants and towards encouraging the general integration of the immigrants in Dutch society. In addition, policy measures should facilitate the access of migrants to financial support and other support measures. Furthermore, aside from the general policy measures to stimulate ethnic entrepreneurship, attention should be focused on specific minority groups which have dissimilar entrepreneurial behaviour. For instance, the Turkish group is characterized by a high tendency to become self-employed, and thus their rate of

377
entrepreneurship is expected to grow even without additional policy measures. On the other hand, Moroccans usually have a more closed nature, and thus are less likely to be inclined to become self-employed and are reluctant to communicate with official institutions (Jansen et al, 2003). Therefore, in this case, the policy measures might stimulate the general integration of this group in Dutch society, and provide incentives for them to pursue entrepreneurial activities.
One way to improve possibilities for migrant entrepreneurs in the Netherlands is for them to go beyond their own ethnic frontiers and expand their activities into broader and other market segments and business lines, competing or associating with the native Dutch entrepreneurs in their own markets. This new strategy may require the migrants to improve their skills and knowledge of the Dutch language. Here established associations can play a role in order to improve the relationship between migrant entrepreneurs and private and public institutions in the Netherlands.
The main objective of this study was to examine the most important determinants and success factors behind the success of migrant entrepreneurs and to answer the research and sub research questions. After a thorough examination of the previous studies on migrant entrepreneurship, we were then able to build our novel analysis framework, which we called GALAXY. For its design, we have addressed in particular those factors which seem to be shared by most experts on entrepreneurship. First, we have looked at the motivation factors of individuals to become self-employed. Due attention was given to the migrants’ specific motivation factors which drive them to pursue entrepreneurial activity to a greater extent compared with the natives. Thus, besides the entrepreneurial animal spirit and the bounded rationality shared by both the native and migrant entrepreneurs, social networks have emerged as a crucial determinant to become self-employed in the case of the migrants. Second, we suggested that the business environment can have a great impact on the business performance of migrant-owned companies. It was found that location conditions, business markets, and the business network do indeed have a positive or negative effect on the trajectory of migrant businesses. Thirdly, we also found that socio-economic contextual factors play an important role in the process of setting-up and further developing the business. Here, the business culture and the operational characteristics are of utmost importance, and, besides these, access to new markets, widely referred to as ‘break-out’ strategy, is imperative in the case of ethnic entrepreneurs, who are very often trapped in ethnic enclaves. Lastly, our analysis suggests that the policy factors may significantly impact ethnic enterprise formation and its consequent growth. Therefore, support measures and policy initiatives are crucial in helping migrants to overcome those barriers that prevent them from starting their own businesses.
The results of our study suggest no significant relationship between the socio-economic factors and business performance. While previous studies have suggested a significant positive impact of innovation and business culture in general (e.g. Casson, 1994; Chakrabarti, 1990; Deeds and Rothaermel, 2003), our study

378
indicates the lack of a significant relationship between, on the one hand, the use of the Internet to reduce transaction costs, the training of employees, and accessibility to new markets and, on the other, the business performance.
Our assumptions concerning the information gathering of entrepreneurs about public policies also appeared to be non-significant. As far as our data is concerned, no connection could be found between the amount and sources of public policy information and the business performance indicators.
Of the hypotheses concerning motivational factors, two were found to be significant and positively related to business performance. As such, our results support previous studies which have focused attention on motivational factors (e.g. Chrysostome, 2009). Furthermore, the positive relationship between social networks and performance adds to the notion that migrant entrepreneurs might be especially dependent on ethnic networks for business success. The acceptance of the hypothesis which links motivational pull factors to business success can also be seen in light of managerial performance, since the factor combines personal motivations with the ability to motivate others (Barney, 1991, 2001; Markman and Baron, 2003).
Finally, with respect to the hypotheses about business location, only the current location significantly influenced business performance, while the start-up location had no clear effect. Contrary to our initial belief, home businesses reported a better business performance than businesses operating from offices outside the home. This might be linked with the earlier observation that migrant entrepreneurs seem to be more dependent on the local social network, which might be more accessible when operating from the home environment.
The migrant entrepreneur is often considered to be an ‘entrepreneurial hero’. Clearly, migrant entrepreneurs make up a significant share of the urban business economy and they contribute considerably to urban vitality. Our analysis also shows, however, that – despite the ‘signs of hope’ offered by migrant entrepreneurship for urban vitality – they do not create an entirely innovative business climate in the urban economy. They are a solid and, in the meantime, established part of the normal urban-economic business sector – and as such are indispensable, but it remains to be seen whether they deserve to be called ‘entrepreneurial heros’. They offer many job opportunities in a modern city, but the ‘jump’ towards a high-tech sector is still modest. This holds for both first- and second-generation entrepreneurs, although the second generation clearly demonstrates a more knowledge-oriented business attitude. A converging pathway from specific, often ethnic-oriented, market niches to mainstream economic branches is a plausible consequence of the gradual transition of first-generation to second-generation migrant entrepreneurs. Clearly, this converging transition may take several decades. It is, therefore, not too speculative to argue that the distinct nature of migrant entrepreneurship – as a special modern business activity sui generis – will vanish in the future.
379
4. HIGHLIGHTS OF THE STUDY
Migrant entrepreneurship has become an established business phenomenon in modern cities in the developed world. The Netherlands – and in particular the large Dutch cities – is not an exception to this trend. In our search for the driving forces of business performance of distinct major migrant entrepreneurs’ groups in the Netherlands, we have come up with various fascinating findings based on a diversity of empirical studies. The most important results are summarized here in the form of seven highlights:
Critical success factors Our research brings to light that the CSFs in the business performance of migrant entrepreneurs vary substantially among different ethnic groups. Our comparative evaluation shows that there are clear culture-based differences between these groups of respondents in their views on business and in the success factors that determine their performance level (e.g. market share, change in turnover, profit). The results of our analysis also show that Moroccan and Surinamese entrepreneurs are more oriented to the market situation, as well as to external success factors and leadership, whereas Turkish entrepreneurs are more concerned about internal success factors such as the management of the relationships with employees and customers. However, the orientation towards internal success factors contributes more to their success level or to an increase in performance than external success factors or leadership. In addition to migrant network and support systems, the success of migrant entrepreneurs also depends on their personality and motivation.
Motivation and driving forces There are significant differences in economic achievements between distinct ethnic groups of entrepreneurs. Our results show that an external orientation of second-generation Turkish migrant groups – compared with Moroccan, Surinamese, and Antillean entrepreneurs – is the result of both personal characteristics and previous work experience. Furthermore, this group is less oriented towards ethnic co-clientele and relatively more embedded in formal networks. The motivation and driving forces of the second-generation Turkish entrepreneurs appear to stem from both their personal characteristics shaped by their higher educational level and language ability and their previous working experience as an employee or entrepreneur in the same sector.
The second generation The results of our investigation show that a new orientation towards non-traditional sectors – in other words, an external orientation – combined with personal characteristics, skills and experience may produce a high level of economic performance and success of the second-generation Turkish entrepreneurs. The generally most important factors in motivation, driving forces and sectoral choice of
380
these entrepreneurs in the advanced business sector in the Netherlands are: (a) nationality of employees; (b) preferences of employees; and (c) business target group. Our analysis also reveals the predominance of second-generation entrepreneurs and their relatively higher participation rates in network and branch organizations. There is apparently a clear difference in the business performance of migrant entrepreneurs in successive (generation) cohorts.
Ethnic enclaves Of all the migrant groups in our study, the Turks have the highest share of entrepreneurs; their rate of self-employment approaches that of the native population. This is the result of the existence of ethnic enclaves of immigrants of the same ethnicity in areas with a high concentration of Turkish immigrants. The factors that favour the formation of a geographical concentration of these migrants are, above all, the language competence and the culture of the immigrants. Furthermore, most of the Turkish immigrants appear to come from families with an entrepreneurial background and strong social bonds, which explains the high degree of entrepreneurship for this ethnic group in the Netherlands.
Education Moroccan-owned businesses appear to have relatively high efficiency rates. In general, at present, the entrepreneurship rate of immigrants from Morocco, Suriname, and the Antilles is lower than that of Dutch entrepreneurs. Moroccans are rather similar to Turks in terms of their demographic composition, and are relatively less well-educated. On the other hand, Surinamese immigrants are more similar to Antillean immigrants; they are usually better-educated than the other two groups, and are more familiar with the Dutch language and culture. A common characteristic of all these immigrant groups is that they are relatively young compared with the native population. The cross-analysis on business efficiency according to education level showed some surprising results – the most efficient entrepreneurs with a high performance are those with a middle vocational education level, not those with a university level of education.
Age and gender Businesses owned by migrant entrepreneurs in the young age cohort have both the highest rate of efficiency and the highest rate of failure. In terms of gender participation, in the case of Moroccan and Turkish entrepreneurs, both first- and second-generation men are relatively more entrepreneurial, whereas the Surinamese and Antillean first-generation entrepreneurs have a relatively even gender distribution, and the second-generation women are more entrepreneurial.
The GALAXY model This study introduced a methodological novelty in the form of the design of a new explanatory model, called ‘GALAXY’, which serves as a framework for better

381
understanding the influence of the critical factors that have a clear impact on the economic performance of the second-generation ethnic entrepreneurs, mainly in the context of the high-tech and advanced business services sector. This model is a new operational instrument that links theoretical insights on business performance to the driving forces of business-motivational factors; socio-economic contextual factors; policy factors; and the business environment.
References Barney, J. (1991). “Firm Resources and Sustained Competitive Advantage”, Journal
of Management, 17 (1): 99-120. Barney, J.B. (2001). “Resource-Based Theories of Competitive Advantage: A Ten-
Year Retrospective on the Resource-Based View”, Journal of Management, 27: 643-50.
Bates, T. (1993). Assessment of State and Local Government Minority Business Development Programs, US Department of Commerce: Washington, DC.
Baycan-Levent, T., Masurel, E. and Nijkamp, P. (2003). “Diversity in Entrepreneurship: Migrant and Female Roles in Urban Economic Life”, International Journal of Social Economics, 30: 1131-1161.
Butler, J. S. and Greene, P. G. (1997). “Ethnic Entrepreneurship: the Continuous Rebirth of American Entrepreneurship”. In: D.L. Sexton and R.W. Smilor (eds), Entrepreneurship 2000, Upstart Publishing: Chicago, pp. 267-289.
Casson, M. (1994). The Economics of Business Culture: Game Theory, Transaction Costs and Economic Performance. Oxford University Press: New York.
Chakrabarti, A.K. (1990). “Scientific Output of Small and Medium Size Firms in High-Tech Industries”, Engineering Management, IEEE Transactions, 48: 52.
Chrysostome, E. and Arcand, S. (2009). “Survival of Necessity Immigrant Entrepreneurs: An Exploratory Study”, Journal of Comparative International Management, 12(2): 3-29.
Deeds, D.L. and Rothaermel, F.T. (2003). “Honeymoons and Liabilities: The Relationship Between Age and Performance in R&D Alliances”, Journal of Product Innovation Management, 20 (6): 468-84.
European Commission (2011). “Small and Medium-sized Enterprises (SMEs), Migrant Entrepreneurs / Ethnic Minority Entrepreneurs”. http://ec.europa.eu/enterprise/policies/sme/promoting-entrepreneurship /migrants-ethnic-minorities/index_en.htm
Fairlie, R. W. (1999). “The Absence of the African-American Owned Business: An Analysis of the Dynamics of Self-Employment”, Journal of Labor Economics, 17: 80-108.
Holguin, J., Gamboa E. and Hoy, F. (2006). “Challenges and Opportunities for Hispanic Entrepreneurs in the United States. In: L.P. Dana (ed.), Migrant Entrepreneurship, Edward Elgar: Aldershot, pp. 99-113.
Jansen, M., Kok, J. de, Spronsen, J. and Willemsen, S. (2003). “Immigrant Entrepreneurship in The Netherlands”, Research Report No. H200304, Scientific Analysis of Entrepreneurship and SMEs, Zoetermeer.
Markman, G. and Baron, R. (2003). “Person-Entrepreneurship Fit: Why Some People Are More Successful as Entrepreneurs than Others”, Human Resource Management Review, 13(2): 281-301.
382
NEDERLANDSE SAMENVATTING: STUDIES OVER ETNISCH ONDERNEMERSCHAP IN NEDERLANDSE STEDEN De afgelopen decennia hebben een belangrijke verschuiving in de richting van zelfstandig ondernemerschap onder allochtone groepen te zien gegeven. Dit heeft geleid tot een sterke opkomst van ondernemerschap bij migranten. Etnisch (allochtoon of migranten-)1 ondernemerschap onderscheidt zich in eerste instantie van ‘normaal’ ondernemerschap door de volgende kenmerken: de oriëntatie op migrantenproducten, een groot aandeel van migrantenklanten, en specifieke migranten business-strategieën. Ondernemerschap van migranten kan worden beschouwd als een belangrijk ‘self-organizing’ principe, waarmee migranten in staat zijn hun relatief zwakke sociaal-economische positie te verbeteren. Etnisch ondernemerschap komt volgens de literatuur voort uit een verzameling van zakelijke patronen en interacties tussen mensen met een gemeenschappelijke nationale achtergrond of overeenkomstige migratie-ervaringen.
Onze studie richt zich op de economische relevantie van ondernemerschap bij migranten, vooral vanuit het perspectief van de grote steden. De grote betekenis van allochtone ondernemers wordt in toenemende mate erkend in een groot aantal gastlanden, die ook diverse beleidsmaatregelen hebben ingevoerd om zelfstandig ondernemerschap onder migranten te stimuleren door een omgeving te creëren waarin etnische ondernemers goed kunnen functioneren.
Een van de meest genoemde voordelen van ondernemerschap bij migranten is hun bijdrage aan economische groei, nieuwe banen en bevordering van diversiteit, factoren die volgens de bekende Amerikaans-Canadese hoogleraar Jane Jacobs de belangrijkste oorzaak van de welvaart van stedelijke economieën zijn. Bovendien leidt allochtoon ondernemerschap in het bijzonder tot de verbetering van de economische positie van migranten uit niet-westerse landen en ondersteunt het de economische integratie van deze allochtone groepen in de samenleving. Hoe belangrijk is die bijdrage dan? Het is duidelijk dat etnisch ondernemerschap om solide onderzoek vraagt naar de belangrijkste motieven en succesfactoren voor het ontstaan en voortbestaan van migranten-ondernemingen.
Ondernemerschap bij migranten is in de afgelopen decennia uitgegroeid tot een belangrijk fenomeen in de moderne steden in de ontwikkelde wereld. Nederland - en in het bijzonder de grote Nederlandse steden - zijn geen uitzondering op deze trend. Ons land is getuige geweest van een grote toestroom van - of opkomst van - migranten-ondernemers. Het merendeel van de immigranten in Nederland is afkomstig uit niet-EU landen. Deze mensen behoren tot de eerste-generatie migranten die buiten Nederland geboren zijn, en de tweede-generatie migranten die hier geboren zijn, maar van wie ten minste een ouder van buitenlandse afkomst is. De gestage instroom van immigranten sinds de jaren ’60 heeft geleid tot een
1 De termen etnische ondernemers, allochtone ondernemers en migranten ondernemers worden in
deze studie als synoniemen beschouwd.
383
gevarieerde etnische samenstelling van Nederland, voornamelijk in de grote steden Amsterdam, Den Haag, Rotterdam en Utrecht. Deze etnische diversiteit in de stad biedt een prachtige kans op verrijking van sociale en economische mogelijkheden, en op een hogere variatie in het ontstaan van talenten op de arbeidsmarkt, wat vervolgens weer kan leiden tot het stimuleren van creativiteit. Etnisch ondernemerschap is een zichtbare uitingsvorm van etnische en culturele diversiteit, met vele nieuwe kansen voor die groepen waar de werkloosheid relatief hoog is (vanwege de meestal lage scholing van migranten).
Steeds meer gebieden en steden in Nederland krijgen een multicultureel karakter. De aanwezigheid van etnische winkels en restaurants brengt vitaliteit en diversiteit en verrijkt tevens de buurten. In deze etnisch kleurrijke buurten kunnen migranten hun eigen identiteit ervaren, zichzelf uiten en hun eigen cultuur behouden. Zij kunnen de benodigde informele steun, veiligheid en solidariteit in deze buurten vinden om economische activiteiten na te streven en de daarbij behorende risico’s nemen. Deze gebieden bieden daarom unieke kansen voor migranten om een eigen zaak te beginnen. Ondernemende immigranten zijn van groot belang voor het economisch potentieel van de stad, en leveren op hun eigen manier een bijdrage aan de diversiteit van de buurt en de versterking van de lokale economie. Dankzij de positieve ontwikkeling van etnisch ondernemerschap zijn deze buurten tegenwoordig het toneel van florerende ondernemingen en een goede kwaliteit van leven, waarbij het klanten (zowel lokaal als van buiten) mogelijk wordt gemaakt om bijzondere zaken te bezoeken in een specifieke buurt. Kortom, het economisch potentieel in deze gebieden, dat door een groeiend aandeel in etnisch ondernemerschap wordt weerspiegeld, is een bron van creatieve mogelijkheden voor multiculturele buurten.
Tegen de achtergrond van bovenstaande constateringen, heeft deze
dissertatie tot doel om het economisch belang van migranten-ondernemingen in stedelijke gebieden te onderzoeken. Daarbij wordt de zoeker in het bijzonder gericht op een empirische analyse van de economische prestaties van diverse groepen etnische ondernemers in hooggeschoolde en high-tech sectoren in stedelijke gebieden in Nederland. In deze studie wordt vooral een micro-aanpak gepresenteerd, met veel nadruk op contextuele factoren die als kritische succesfactoren voor ondernemerspresentaties zijn aan te merken. Er wordt hierbij aandacht besteed aan zowel interne als externe factoren die de economische prestaties van migranten-ondernemingen bepalen.
In methodologisch opzicht wordt daarbij gebruik gemaakt van een breed samengestelde en kwantitatief georiënteerde ‘toolbox’. Daarvan gebruiken wij in het bijzonder de volgende researchtechnieken: Rough Set Data Analysis (RSDA), Data Envelopment Analysis (DEA), and Structural Equations Modelling (SEM). Deze methoden worden toegepast op steekproeven van allochtone bedrijven, onder meer in de FIRE (Finance, Insurance and Real Estate), ICT (Information and Communications Technology), en andere high-tech sectoren in Nederland. Een en
384
ander mondt uit in de kernbijdrage van deze studie, namelijk het ontwerp en de schatting van het zogenaamde GALAXY model.
Etnisch ondernemerschap wordt vaak gezien als een ‘teken van hoop’ voor
zwakke stedelijke economieën en daarom verdient het fenomeen ‘etnisch ondernemerschap’ zorgvuldig kwantitatief onderzoek, mede op basis van een vergelijkende benchmark-analyse, in termen van prestatie-condities en kritische omgevingssuccesfactoren voor veelbelovende ondernemingen. Gebaseerd op een mix van theoretisch en toegepast onderzoek, richt onze studie zich op de analyse van significante verschillen in ondernemingsprestaties onder diverse migranten-groepen. Ons onderzoek tracht met name de kritische succesfactoren en de verschillen in ondernemingsgedrag te identificeren – zowel conceptueel als empirisch – voor verschillende groepen van etnische ondernemers in de grote steden in Nederland. Persoonlijke en ondernemingskarakteristieken, alsmede deelname aan sociale netwerken, worden onderzocht om de verschillen in ondernemingsprestatie – en de kritieke condities die ondernemingsprestaties in competitieve stedelijke economische omgevingen beïnvloeden – in het vizier te krijgen. Deze dissertatie onderzoekt daarbij zowel de motivatie van verschillende etnische groepen (Hoofdstuk 2, Hoofdstuk 3, Hoofdstuk 5, Hoofstuk 9) als de prestatie van etnische ondernemingen (Hoofdstuk 4, Hoofdstuk 6, Hoofdstuk 7, Hoofdstuk 8).
Onze studie baseert zich op persoonlijke en business kenmerken die in de literatuur geassocieerd worden met ondernemingsprestatie. Het conceptueel kader in ons onderzoek gaat uit van een veronderstelde relatie tussen de persoonlijke en de business kenmerken van de ondernemer (en zijn of haar beslissing om te participeren in (in)formele netwerken) en hun invloed op de bedrijfsprestaties. Er zijn daarbij vier met elkaar verbonden categorieën onderscheiden: (i) persoonlijke kenmerken, (ii) business kenmerken; (iii) deelname aan sociale netwerken, en (iv) business performance. De literatuur suggereert dat individuele kenmerken invloed hebben op ondernemersgedrag. In ons onderzoek zal de nadruk worden gelegd op de persoonlijke en business kenmerken die de activiteiten en de resultaten van ondernemers beïnvloeden.
De belangrijkste Nederlandse migranten-groepen worden onderzocht in deze dissertatie, die bestaat uit een verzameling met elkaar verbonden studies over etnisch ondernemerschap. De volgende allochtone groepen ondernemers in Nederland worden onderzocht: Turkse, Marokkaanse, Surinaamse en Antilliaanse migranten. We richten ons vooral op de bovenkant van de economische bedrijvigheid, met name geavanceerde economische sectoren zoals FIRE en ICT, die veelvuldig in de vier grootste steden in Nederland te vinden zijn (Amsterdam, Rotterdam, Den Haag en Utrecht). Deze vier grote steden hebben een aandeel van 43 procent in bedrijven, die eigendom zijn van etnische ondernemers in Nederland: 19 procent in Amsterdam, 11 procent in Rotterdam, 10 procent in Den Haag, en 3 procent in Utrecht. Deze steden staan bekend als de concentratiegebieden met broedplaatsen voor belangrijke activiteiten rondom etnisch ondernemerschap.
385
De onderzoeksvraag die in dit proefschrift centraal staat is: Onder welke sociaal-culturele en economische condities zullen migranten-ondernemers een succesvolle onderneming kunnen ontwikkelen, inclusief een goede toegang tot passende marktsegmenten, opdat ze een bijdrage kunnen leveren aan een dynamisch en innovatief stedelijk ondernemingsklimaat?
Uit deze onderzoeksvraag worden er een aantal meer specifieke deelvragen gedestilleerd: In welke mate beïnvloeden contextuele en individuele motivatiefactoren de bedrijfsprestaties van migranten-ondernemers in een multi-cultureel speelveld? In hoeverre bevordert het bestaan van onderlinge migranten-contacten en van sociaal-culturele relaties in stedelijke netwerken van migranten de bedrijfsprestaties en de markttoegang in een competitieve economische stedelijke omgeving?
Na een algemene beschrijving van de ‘scope’ van deze dissertatie en van de onderzoeksvragen in Hoofdstuk 1, wordt in de volgende hoofdstukken de nadruk gelegd op verschillende thema’s. De daarbij behorende onderzoeken leiden tot een reeks vindingen die wetenschappelijk zeer interessant zijn alsmede beleidsmatig relevant. Deze vindingen kunnen in vier thema’s worden samengevat: (i) motivatie-aspecten van etnische ondernemers, (ii) prestatiegerichtheid van etnische ondernemers, (iii) efficiencyverschillen tussen etnische groepen en (iv) generatieverschillen onder etnische ondernemers. Deze thema’s vormen de centrale aandachtspunten van deze dissertatie.
Elk van de vier bovengenoemde hoofddelen bestaat uit een beperkt aantal geselecteerde studies (hoofdstukken) die meer specifieke vragen met betrekking tot de betrokken onderdelen adresseren. Dit proefschrift is dus gebaseerd op een reeks met elkaar verbonden studies over etnisch ondernemerschap, die uitgevoerd zijn in de afgelopen jaren. Deze zijn gepubliceerd (of zullen binnenkort worden gepubliceerd) in de officiële internationale literatuur. De verschillende hoofdstukken bieden elk afzonderlijk een nieuw perspectief op migranten-ondernemingen in Nederlandse steden. Ze zijn te interpreteren als een prisma met verschillende invalshoeken. Ze laten daarbij ook een interessante variatie zien in termen van de samenstelling of grootte van de steekproef, het specifieke doel van de studie, of de gebruikte methodiek. Figuur 1 biedt een gevisualiseerd weergave van de structuur van deze studie.
Zoals gezegd, bestaat dit proefschrift uit vier onderling samenhangende en
met elkaar verbonden delen (zie ook Tabel 1). Deel A analyseert en evalueert ondernemerschap bij migranten vanuit verschillende verkennende perspectieven, en richt zich vooral op motivatie-aspecten. Deel B maakt gebruik van kwantitatieve patroon herkenningstechnieken voor kwalitatieve data-analyse in de vorm van zogenaamde Rough Set Data Analyse om het gedrag en prestaties van migranten-ondernemers te onderzoeken.
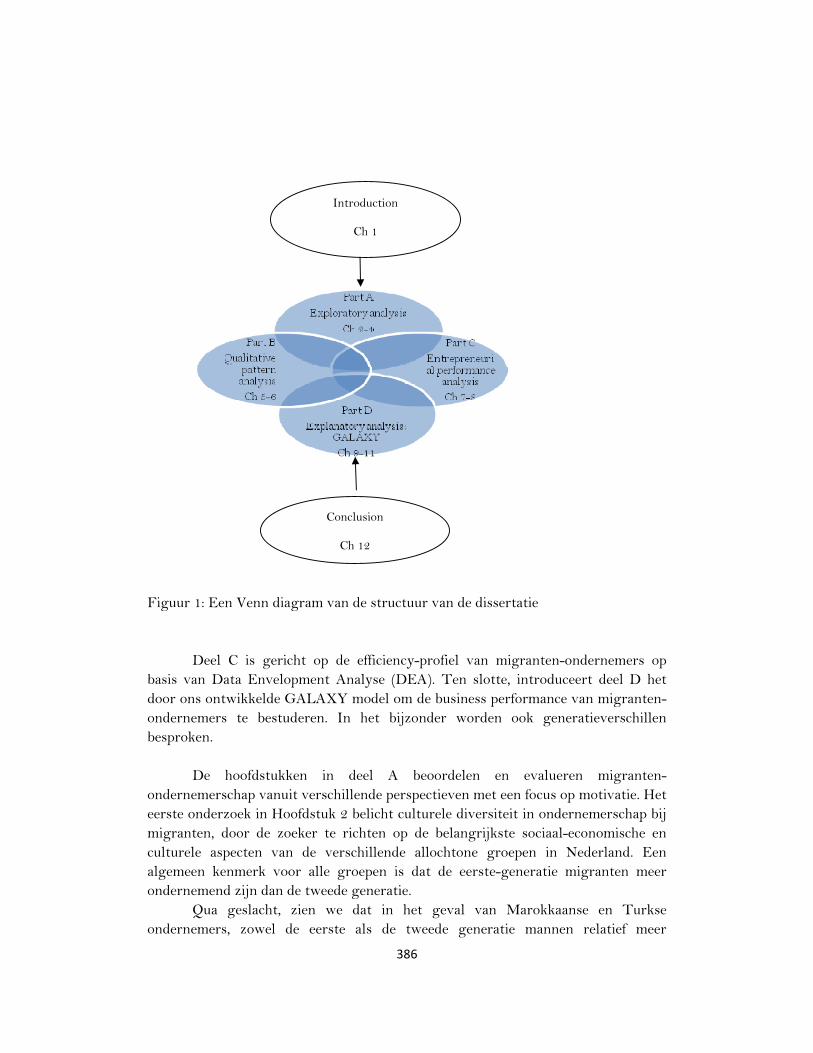
386
Figuur 1: Een Venn diagram van de structuur van de dissertatie
Deel C is gericht op de efficiency-profiel van migranten-ondernemers op basis van Data Envelopment Analyse (DEA). Ten slotte, introduceert deel D het door ons ontwikkelde GALAXY model om de business performance van migranten-ondernemers te bestuderen. In het bijzonder worden ook generatieverschillen besproken.
De hoofdstukken in deel A beoordelen en evalueren migranten-
ondernemerschap vanuit verschillende perspectieven met een focus op motivatie. Het eerste onderzoek in Hoofdstuk 2 belicht culturele diversiteit in ondernemerschap bij migranten, door de zoeker te richten op de belangrijkste sociaal-economische en culturele aspecten van de verschillende allochtone groepen in Nederland. Een algemeen kenmerk voor alle groepen is dat de eerste-generatie migranten meer ondernemend zijn dan de tweede generatie.
Qua geslacht, zien we dat in het geval van Marokkaanse en Turkse ondernemers, zowel de eerste als de tweede generatie mannen relatief meer
Introduction
Ch 1
Conclusion
Ch 12

387
ondernemend zijn, terwijl de Surinaamse en Antilliaanse eerste-generatie ondernemers relatief dezelfde sexe-verdeling hebben, maar de tweede generatie vrouwen meer ondernemend zijn. Wanneer we kijken naar de winstpositie van allochtone ondernemers, vinden we dat zowel de eerste generatie als de tweede generatie Surinaamse en Antillaanse ondernemers bijna hetzelfde winstpercentage hebben, terwijl in het geval van Turkse en Marokkaanse ondernemers deze percentages hoger zijn voor de eerste generatie.
Deze studie analyseert ook de perceptie en het gedrag van zowel de eerste- als de tweede-generatie migranten-ondernemers. De eerste-generatie groep bestaat veelal uit traditionele migranten die rechtstreeks werden gerekruteerd om werkgelegenheidsredenen. Meestal zijn het de eerste-generatie migranten-ondernemers die impulsief hun eigen bedrijf opzetten zonder eerst het marktpotentieel te overzien. De tweede-generatie groep bestaat uit de jongere leden van het gezin, meestal geboren in de gastlanden. Deze groep blijkt over het algemeen ambitieuzer te zijn en selectief in het kiezen van een baan. De populatie in ons onderzoek was beperkt tot vier allochtone groepen van mensen die oorspronkelijk uit Turkije, Marokko, Suriname en de Nederlandse Antillen komen.
In Hoofdstuk 3 onderzoeken we vervolgens de nieuwe externe oriëntaties in ondernemerschap bij migranten door te kijken naar de motivatie, de sectorale keuze, de zakelijke doelen en de strategieën van met name de tweede-generatie Turkse ondernemers in Nederland. De resultaten tonen aan, dat een externe oriëntatie van deze migrantengroep het resultaat van zowel persoonlijke kenmerken als eerdere werkervaring is. Bovendien laten onze resultaten zien dat deze groep minder gericht is op de co-etnische klantenkring en veel meer ingebed is in formele netwerken.
In hoofdstuk 4 analyseren we de belangrijkste achtergrondfactoren die het succes en falen van allochtone ondernemers beïnvloeden. Onze resultaten tonen aan dat persoonlijkheid, arbeidsdiscipline en zakelijke ambitie de kritische succesfactoren voor een goede ondernemingsprestatie van allochtone ondernemers zijn. In deel B gebruiken we een specifieke wiskundige techniek, afkomstig uit de kunstmatige intelligentie literatuur, namelijk Rough Set Data Analysis, om de motivatie, doelen en strategieën van allochtone ondernemers te onderzoeken en om de voorwaarden voor succesvol ondernemerschap van migranten te traceren. Rough Set theorie kan kenmerken in groepen met vergelijkbare eigenschappen classificeren door meerdere dimensies in de beschouwing te betrekken, die bijdragen aan het verminderen van de niet-geobserveerde heterogeniteit. Eerst richten we ons in Hoofdstuk 5, op een voorbeeld van de tweede-generatie Turkse ondernemers in de ICT en FIRE (Finance, Insurance en Real Estate) sector in Nederland. Onze resultaten laten zien dat deze ondernemers zich in toenemende mate oriënteren in de richting van nieuwe en niet-traditionele sectoren zoals de ICT en FIRE sectoren, in plaats van een oriëntatie op de traditionele horeca-sector, die nog steeds het meest populair onder de Turkse ondernemers is.

388
Tabel 1: Een systematische overzichtstabel van de onderdelen van de dissertatie
Part Chapter Focus Analytical Approach
Methodology Sample Aim
A
2. Migrant entrepreneurship from the perspective of cultural diversity
Motivation Exploratory Literature Study ‐ To review and evaluate migrant entrepreneurship from the perspective of cultural diversity.
3. New orientations in ethnic entrepreneurship: motivation, goals and strategies of new generation ethnic entrepreneurs
Motivation Exploratory Case Study 23 To assess new departures for ethnic entrepreneurship in terms of motivation, sectoral choice, business goals and strategies of new generation ethnic entrepreneurs.
4. Cultural diversity and urban innovativeness: personal and business characteristics of urban migrant entrepreneurs
Performance Qualitative Regression Analysis
83 To identify the driving forces for successful migrant entrepreneurship Amsterdam.
B
5. The urban growth potential of second-generation migrant entrepreneurs: a sectoral study on Amsterdam
Motivation Qualitative Rough Set Data Analysis
23 To examine the extent to which the choice for entrepreneurship is made by higher-educated young ethnic generations.
6. Migrant entrepreneurship and new urban economic opportunities: identification of critical success factors by means of qualitative pattern recognition analysis
Performance Qualitative Rough Set Data Analysis
83 To investigate the entrepreneurial behaviour of migrants in Dutch cities from a micro-economic perspective.
C
7. Survival of the fittest among migrant entrepreneurs
Efficiency Quantitative Data Envelopment Analysis
83 To identify the efficiency profile of individual migrant businesses.
8. Impact of urban conditions on firm performance of migrant entrepreneurs: a comparative Dutch-US study
Efficiency Quantitative Data Envelopment Analysis
42/83 To identify success conditions of ethnic entrepreneurship.
D
9. Economic performance of migrant entrepreneurs in the high-tech sector – design and application of the GALAXY model
Performance Explanatory Statistical Review 50 To introduce a comprehensive explanatory model – GALAXY – which comprises a varied set of systematic factors that are supposed to have an impact on the economic performance of next-generation ethnic entrepreneurs.
10. Migrant impact assessment of ethnic entrepreneurs: Data Envelopment Analysis as a policy support tool
Efficiency Explanatory Cross-correlation/ Data Envelopment Analysis
50 To assess the impact of migrants on entrepreneurship and their efficiency rate
11. A structural equations model for assessing the economic performance of ethnic entrepreneurs.
Performance Explanatory Factor Analysis/ SEM
212 To test the conceptual model of key relationships on business performance and success of ethnic entrepreneurs.

389
In Hoofdstuk 6 analyseren we de kritische succesvoorwaarden voor de ondernemingsprestaties van de drie dominante allochtone groepen in Nederland. We vinden dat deze succesfactoren in ondernemingsprestatie sterk verschillen tussen de verschillende migranten-groepen. Uit onze vergelijkende evaluatie blijkt dat er duidelijke cultureel-gebaseerde verschillen bestaan tussen de respondenten in hun perceptie van het bedrijfsleven en in de succesfactoren die hun prestaties bepalen.
De bijdragen in deel C hebben als doel om het efficiëntieprofiel van migranten-
ondernemingen te beoordelen door een kwantitatieve research techniek, namelijk Data Envelopment Analysis (DEA), toe te passen. In het algemeen beoordelen DEA-modellen de (in)efficiëntie van een actor op basis van het verschil tussen het actuele performance niveau van deze actor en de omhullende production posibility frontiers.
In Hoofdstuk 7 onderzoeken we de ondernemersprestaties van de belangrijkste migranten-groepen in Amsterdam en proberen we om relatieve efficiëntieverschillen tussen verschillende categorieën ondernemers te identificeren. Onze resultaten tonen aan dat de Marokkaanse ondernemingen relatief hoge rendementen hebben. Verder vinden we dat ondernemingen, die eigendom zijn van migranten-ondernemers in de leeftijd van 26 tot 30 jaar, zowel het hoogste niveau van efficiëntie hebben als de hoogste mate van falen.
In Hoofdstuk 8 hebben we vervolgens aandacht voor de impact van sociaal en menselijk kapitaal op de bedrijfsprestaties door de resultaten van empirisch onderzoek in Nederland en in de VS te presenteren. Uit de resultaten van onze onderzoek, op basis van DEA-analyse, blijkt dat de prestaties van allochtone ondernemers onderling verschillen op basis van hun efficiency-profiel.
De studies in het laatste deel (deel D) leveren een modelmatige bijdrage aan de
stuwkrachten van ondernemingsprestaties onder allochtone ondernemers in Nederland. Wij ontwikkelen daartoe een nieuw verklarend model, genaamd 'GALAXY', dat als kader dient om de invloed van verschillende drijvende krachten beter te begrijpen. Met name wordt daarbij ingegaan op de economische prestaties van de tweede-generatie etnische ondernemers, die vooral actief zijn in de high-tech sector. Eerst presenteren wij in Hoofdstuk 9 uitgebreide theoretische inzichten in vier sleutel factoren, die gecombineerd worden tot vier componenten: motivatie-factoren, sociaal-economische omgevingsfactoren, beleidsfactoren en de zakelijke omgeving. Vervolgens vullen we onze theoretische studie aan met empirische gegevens uit een ondernemersenquête onder allochtone ondernemers in de high-tech sector, die afkomstig zijn uit de drie belangrijkste etnische groepen in de vier grote steden in Nederland. Uit onze analyse blijkt een dominantie van de tweede-generatie ondernemers dat in de high-tech sector werkzaam is, met daarnaast een hoge participatiegraad in netwerk- en brancheorganisaties.
De tweede GALAXY studie, in Hoofdstuk 10, heeft tot doel de impact van migranten op het ondernemerschap te beoordelen door middel van cross-analyse en Data Envelopment Analysis (DEA). Uit de resultaten van de DEA analyse blijkt dat slechts acht van de vijftig

390
allochtone ondernemingen operationeel efficiënt waren. Daarom wordt in dit hoofdstuk dan ook getracht uit te vinden wat de voornaamste redenen voor het lage rendement van de verschillende allochtone ondernemingen zijn.
Terwijl de eerste en de tweede studie in deel D een meer algemeen overzicht van de migranten-ondernemers van de grootste etnische groepen in Nederland en de rendementen van hun bedrijven laten zien, toont de laatste model studie in Hoofdstuk 11 een meer integrale test van het GALAXY model, gebaseerd op unieke micro-data. We hebben daartoe een steekproef van 212 respondenten gebruikt, om de validiteit van onze resultaten verder te verbeteren. In het onderzoek hebben we eerst een factoranalyse toegepast, gevolgd door een toepassing van regressieanalyse, terwijl we in de laatste fase de relevantie van ons model hebben getest met behulp van zogenaamde Structual Equations Modeling (SEM) met behulp van AMOS software.
Tenslotte sluit Hoofdstuk 12 af met een retrospectieve en prospectieve bespreking van
de resultaten van onze studie. De belangrijkste vindingen in dit proefschrift zijn gebaseerd op diverse hoofdstuk-analyses die hieronder zijn samengevat in de vorm van zeven punten (‘highlights’):
Kritische succesfactoren Uit onze vergelijkende evaluatie blijkt dat er duidelijk cultuur-gebaseerde verschillen zijn in opvattingen onder het allochtone bedrijfsleven en in de succesfactoren die de prestaties van de respondenten bepalen (bijv. marktaandeel, verandering in de omzet, winst). Motivatie en drijvende krachten Er zijn aanzienlijke verschillen in economische prestaties tussen de verschillende etnische groepen van ondernemers. Onze resultaten tonen aan dat een externe oriëntatie van de tweede generatie Turkse migranten - in vergelijking met Marokkaanse, Surinaamse, en Antilliaanse ondernemers - het resultaat van zowel de persoonlijke kenmerken als eerdere werkervaring is. De tweede generatie De resultaten van ons onderzoek tonen aan dat een nieuwe oriëntatie op niet-traditionele sectoren - met andere woorden, een externe oriëntatie - in combinatie met persoonlijke kenmerken, vaardigheden en ervaring kan leiden tot hoge economische prestaties van de tweede-generatie ondernemers. Onze analyse toont ook het belang van de tweede-generatie ondernemers – en hun relatief hoge participatiegraad in netwerk-en branche-organisaties – aan. Er is blijkbaar in het bedrijfsleven een duidelijk verschil in de prestaties van allochtone ondernemers in de opeenvolgende generatie-cohorten. Etnische enclaves Van alle allochtone groepen in ons onderzoek, hebben de Turken het hoogste aandeel van de ondernemers. Dit is vooral het resultaat van het bestaan van etnische enclaves van migranten

391
met dezelfde etnische achtergrond in stedelijke gebieden met een hoge concentratie van Turkse immigranten.
Onderwijs De cross-analyse van zakelijke efficiëntie op basis van opleidingsniveau toonde enkele verrassende resultaten - de meest efficiënte ondernemers met een high performance zijn die met een middelbaar beroepsopleidings-niveau, en niet met een universitair niveau. Leeftijd en geslacht Bedrijven die eigendom zijn van allochtone ondernemers in de cohort jonge leeftijd hebben zowel het hoogste percentage van efficiëntie als de hoogste percentage mislukkingen. Het GALAXY model Dit model is een nieuw operationeel instrument dat theoretische inzichten in de bedrijfsprestaties verbindt met drijvende krachten van allochtone business-factoren, sociaal-economische omgevingsfactoren, beleidsfactoren en zakelijke omgeving.

392
List of official publications on migrant entrepreneurship by Mediha Sahin
NWO Mozaiek programme
I. Sahin, M., Nijkamp, P., and Baycan-Levent, T. (2007), Migrant Entrepreneurship from the Perspective of Cultural Diversity. In: Leo Paul Dana (ed.), Handbook of Research on Ethnic Minority Entrepreneurship – A Co-evolutionary View on Resource Management, Edward Elgar, Cheltenham UK, pp. 99-113.*
II. Sahin, M., Nijkamp, P., and Baycan-Levent, T. (2007), Multicultural Diversity and Migrant
Entrepreneurship: The Case of the Netherlands, ITU A/Z, Vol. 4, No. 1, pp. 22-46.
III. Sahin, M., Rietdijk, M., and Nijkamp, P. (2007), Is Cultural Diversity a Socio-Economic Opportunity? – A Case Study on the Performance of Migrant Workers in the Dutch Service Sector, Studies in Regional Science, Vol. 37, No. 2, pp. 535-552.
IV. Baycan-Levent, T., Nijkamp, P., and Sahin, M. (2009), New Orientations in Ethnic
Entrepreneurship: Motivation, Goals and Strategies of New Generation Ethnic Entrepreneurs, International Journal Foresight and Innovation Policy, Vol. 5, No. 1/2/3, pp. 83-111.*
V. Sahin, M., Nijkamp, P., and Rietdijk, M. (2009), Cultural Diversity and Urban
Innovativeness: Personal and Business Characteristics of Migrant Entrepreneurs, Innovation – The European Journal of Social Science Research, Vol. 22, No. 3, pp. 251-281.*
VI. Sahin, M, Nijkamp, P., and Suzuki, S. (2009), Survival of the Fittest among Migrant
Entrepreneurs – A Study on Efficiency Performance of Migrant Entrepreneurs in Amsterdam by Means of Data Envelopment Analysis, Regional Studies (Conditionally accepted).*
VII. Baycan-Levent, T., Nijkamp, P., and Sahin, M. (2009), The Urban Growth Potential of
Second-Generation Migrant Entrepreneurs – A Sectoral Study on Amsterdam, International Business Review (Accepted).*
VIII. Nijkamp, P., Sahin, M., and Baycan-Levent, T. (2010), Migrant Entrepreneurship and New
Urban Economic Opportunities – Identification of Critical Success Factors by Means of

393
Qualitative Pattern Recognition Analysis, Journal of Economic and Social Geography (TESG), Vol. 101, No. 4, pp. 371-391.*
IX. Sahin, M., Nijkamp, P., and Stough, R.R. (2010), Impact of Urban Conditions on Firm
Performance of Migrant Entrepreneurs – A Comparative Dutch−US Study, Annals of Regional Science, Vol. 46, No. 3, pp. 661-689.*
X. Sahin, M., Todiras, A., Suzuki, S., and Nijkamp, P. (2011), Migrant Impact Assessment of
Ethnic Entrepreneurs: Data Envelopment Analysis as a Policy Support Tool, Innovation (Accepted).*
XI. Sahin, M., Todiras, A., and Nijkamp, P., Neuts, B., and Behrens, C. (2011), A Structural
Equations Model for Assessing the Economic Performance of High-Tech Ethnic Entrepreneurs. In: Tomaz Dentinho and Roberta Capello (eds), Globalization Trends and Regional Development: New Directions in FDI and Human Capital Flows, Edward Elgar, Cheltenham UK (Accepted).*
XII. Sahin, M., Todiras, A., and Nijkamp, P. (2011), The Development Potential of Urban
Migrant Entrepreneurship – New Opportunity Seekers in the Netherlands. In: Charlie Karlsson, Börje Johansson, and Roger Stough, The Regional Economics of Knowledge and Talent: Local Advantage in a Global Context. Edward Elgar, Cheltenham UK (Accepted).
XIII. Sahin, M., Baycan, T., and Nijkamp, P. (2011), The Economic Performance of Migrant
Entrepreneurship: An Application of Data Envelopment Analysis, Town and Regional Planning, No 59, pp. 17-25.
XIV. Sahin, M., Todiras, A., Nijkamp, P., and Masurel, E. (2012), Economic Performance of
Migrant Entrepreneurs in the High-Tech Sector: Design and Application of the GALAXY Model. In: Peter Nijkamp, Jacques Poot, and Mediha Sahin (eds), Migration Impact Assessment: New Horizons, Edward Elgar, Cheltenham UK (Accepted).*
XV. Sahin, M., Todiras, A., and Nijkamp, P. (2012), Colourful Entrepreneurship in Dutch Cities:
A Review and Analysis of Business Performance, Regional Science Inquiry, Vol. 3 No. 2, pp. 179-197.
XVI. Nijkamp, P., Poot, P., and Sahin, M. (eds) (2012), Migration Impact Assessment: New Horizons,
Edward Elgar, Cheltenham UK (forthcoming).
*Selected for Ph.D. Thesis
394
Edited Special Issues of Journals I. Peter Nijkamp, Mediha Sahin, and Roger Stough (eds) (2009), International
Journal of Foresight and Innovation Policy, Creative Drivers of Economic Growth, Vol. 5, Nos. 1/2/3.
II. Mediha Sahin, Peter Nijkamp, and Roger Stough (eds) (2009), Innovation: The
European Journal of Social Science Research, Socio-Cultural Drivers of Innovation, Vol. 22, No. 3.
III. Mediha Sahin, Peter Nijkamp, and Roger Stough (eds) (2012), Regional Studies,
Human Capital and Entrepreneurship: Methods and Analysis in Economic Growth and Regional Development (forthcoming)