Embed Size (px)
Citation preview

Preface
The Gender perspective is imperative to formulate and enforce a holistic, inclusive and non-
discriminatory regime of policies. As an indispensable prelude to this end, the “Compendium on
Gender Statistics 2004” presents gender disaggregated data on population, education, health,
family planning, employment and public representation. Besides, international comparison of
some important gender sensitive indicators has also been included to provide for collective self-
reflection.
This document is an up-date of its maiden predecessor of 1998, prepared in accordance with UN
standards and international practices, under the financial and technical assistance of the Asian
Development Bank. Despite no project facilitation and, exclusive reliance on mail inquiry, all
possible efforts have been made to collect the latest available data from the sources.
I am thankful to Dr. France Donnay, the Representative of UNFPA who kindly agreed to provide
support in publishing this document and hope that the database developed in Federal Bureau of
Statistics would be useful for the researchers, policy makers and students to help underpin an
analytical framework in the pursuit of an all-inclusive and non-discriminatory polity and economy
of Pakistan.
Comments and suggestions for improvement would be welcome and highly appreciated.
.
ASAD ELAHI Secretary Statistics Division Government of Pakistan
Islamabad, 2006

II
Acknowledgement This document “Compendium on Gender Statistics 2004” is the 1st up-dation of its maiden
predecessor produced in 1998, under the aegis of the project “Establishment of Gender
Disaggregated Statistical Database”. Notwithstanding exclusive reliance on mail inquiry, the
Directorate of Social Statistics has made utmost efforts to tap all available secondary sources in
the pursuit of the latest information for up-dating the tabular profile of the document. I also seize
this opportunity to acknowledge the debt of gratitude owed to our respondents of data both in
public and private sector.
I would like to appreciate the staff of Social Statistics Section for the preparation of this
compendium, particularly, Mr. Hammad Ali, Statistical Officer, Mr. Muhammad Shahan
Khattak, Statistical Officer, Mr. Muhammad Zaiwar Statistical Officer, Messrs Abdul Latif
Rashid Statistical Assistant, Muhammad Azhar, Statistical Assistant, Shabnam A Khaliq and
Shabbir Ali Steno Typist for their untiring efforts in completing the report under the guidance of
their Director,Mr. Munir Ahmad Aslam.
Mr. Ghulam Ahmed Deputy Director General

III
Table of Contents
Preface....................................................................................................................................... I
Acknowledgement ....................................................................................................................II
Chapter 1...................................................................................................................................1 1.1 Population Size And Trends....................................................................................1 1.2 Proportion of Population.........................................................................................1 1.3 Gender Population .................................................................................................2 1.4 Gender Composition and Sex Ratio ........................................................................2 1.5 Rate of Population Growth .....................................................................................3 1.6 Population Change..................................................................................................3 1.7 Urbanization...........................................................................................................3 1.8 Age Composition....................................................................................................4 1.9 Median Age and Index of Aging .............................................................................4 1.10 Children, Youth and Elderly Population.................................................................4
1.10.1 Youth Population Aged 15-29 Years................................................................5 1.10.2 Youth Population Aged 30-59 Years................................................................5 1.10.3 Working Population Aged 15-59 Years............................................................5 1.10.4 Elderly Persons (60 years of age and above) ....................................................5 1.10.5 Dependency Ratio............................................................................................6
CHAPTER - 2 ...........................................................................................................................6 2. Fertility and Mortality Indicators .........................................................................7
2.1 Marital Status .........................................................................................................7 2.2 Currently Married Population .................................................................................7 2.3 Never Married Population.......................................................................................8 2.4 Age at Marriage.......................................................................................................8 2.5 Crude Birth Rates (CBRs).......................................................................................9 2.6 Age Specific Fertility Rates ....................................................................................9 2.7 Mortality Indicators ..............................................................................................10 2.8 Crude Death Rates By Gender ..............................................................................10 2.9 Infant Mortality Rates (IMR) ................................................................................10 2.10 Gender Infant Mortality Rates...............................................................................11 2.11 Age Specific Death Rates (ASDR) by Gender.......................................................11 2.12 Life Expectancy....................................................................................................12
CHAPTER – 3.........................................................................................................................13 3. Household and Family Structure..........................................................................13
3.1 Housing Stock ......................................................................................................13 3.2. Head of Households by Gender............................................................................13 3.3 Headship by Marital Status ...................................................................................13 3.4 Age Structure of Gender Headship........................................................................14 3.5 Gender Composition of Households......................................................................14 3.6 Household by Number of Persons.........................................................................15

IV
3.7 Family Structure ...................................................................................................15
CHAPTER – 4.........................................................................................................................17 4. Health Profile ...................................................................................................................17
4.1 Health Care ............................................................................................................17 4.2 Health Delivery Facilities .......................................................................................17
4.2.1 Number of Registered Medical Personnel ......................................................17 4.2.2 Urban - Rural based facilities: ........................................................................19
4.3 Health Manpower Turnover Trends ......................................................................19 4.3.1 Medical and Dental Doctors...........................................................................19 4.3.2 Paramedics and Auxiliary Health Workers .....................................................21
4.4 Health Manpower Development Institutes ............................................................21 4.4.1 Medical Colleges ...........................................................................................21 4.4.2 Teaching Staff in Medical Colleges................................................................22
4.5 Disabled Population..............................................................................................22 4.5.1 Blind..............................................................................................................22 4.5.2 Deaf and Dumb..............................................................................................23 4.5.3 Crippled.........................................................................................................23 4.5.4 Mentally retarded...........................................................................................23 4.5.5 Other disabled................................................................................................23
CHAPTER 5............................................................................................................................25 5. Family Planning ...................................................................................................25
5.1 Programme ...........................................................................................................25 5.2 Service Delivery Facilities ....................................................................................25 5.3 Knowledge of Contraceptive Methods ..................................................................25 5.4 Ever Using Contraceptives by Methods ................................................................26 5.5 Use of Specific Contraceptive Methods among Currently Married Women.....26 5.6 Awareness of Modern Methods Among Currently Married Women by Place of
Residence, Pakistan, 2000-01 and 2003. ...............................................................27 5.7 Awareness of Modern Methods Among Currently Married Women by Educational
Attainments, Pakistan, 2000-01 and 2003. ............................................................27 5.8 The Percentage of Currently Married Women Ever Used Any Specific Methods
Pakistan, 2000-01 and 2003. .................................................................................28 5.9 Percentage Distribution of Currently Married Women by Knowledge of Specific
Method by Type and Areas ...................................................................................28 5.10 Percentage Distribution of Currently Married Women by Knowledge of Supply
Source, Specific Methods by Type, Pakistan and Provinces ..................................29
CHAPTER - 6 .........................................................................................................................29 6.1 Literacy level ...........................................................................................................30 6.2 Educational Infrastructure - Public Schools...........................................................31
6.2.1 Primary Schools.............................................................................................31 6.2.2 Middle Schools ..............................................................................................31 6.2.3. High Schools .................................................................................................32 6.2.4. Arts and Science Colleges..............................................................................33

V
6.2.5 Number of Professional Colleges ...................................................................33 6.3 Enrolment Status- Public Schools .........................................................................34
6.3.1 Primary School Enrolment .............................................................................34 6.3.2 Middle and High School Enrolments..............................................................34 6.3.3 Art and Science College Enrolments ..............................................................35 6.3.4 Professional Colleges Enrolments ..................................................................36 6.3.5 Universities Enrolment...................................................................................37
6.4 Teaching Staff-Public Schools ..............................................................................37 6.4.1 Primary School Teachers ...............................................................................37 6.4.2 Middle School Teachers.................................................................................38 6.4.3 High School Teachers ....................................................................................38 6.4.4 College Teachers............................................................................................39 6.4.5 Professional College Teachers........................................................................39 6.4.6 University Teachers .......................................................................................40
6.5 Results Statistics......................................................................................................40 6.5.1 Matriculation Examination.............................................................................41 6.5.2 Intermediate Examination (Faculty of Arts and Science) ................................42
Chapter 7.................................................................................................................................46 7.1 Labour Force Participation Rates ..........................................................................46 7.2 Labour Force: Absolute Figures............................................................................49 7.3 Employed: Absolute Figures.................................................................................51 7.4 Unemployed: Absolute Figures............................................................................51 7.5 Employed: Major Industry Divisions ......................................................................2 7.6 Employed:Major Occupational Groups .................................................................52 7.7 Employed: Employment Status.............................................................................55 7.8 Employed: Number of Hours Worked During the Week .......................................55 7.9 Employed: Informal Sector...................................................................................55 7.10: Informal Sector: Major Industry Divisions............................................................57 7.11 Informal Sector: Major Occupational Groups........................................................57 7.12 Informal Sector: Employment Status.....................................................................57 7.13 Employed: Occupational Safety and Health .........................................................57 7.14 Occupational Safety and Health: Major Industry Divisions .....................................2 7.15 Occupational Safety and Health: Major Occupational Groups...............................60 7.16 Occupational Safety and Health: Employment Status............................................60 7.17 Occupational Safety and Health: Types of Treatment Received...........................2 7.18 Occupational Safety and Health: Parts of Body Injured........................................62 7.19 Unemployed Labour Force: Unemployment Rates................................................62 7.20 A Look at Officialdom..........................................................................................63 7.21 A Peep in to Financial Institutions ........................................................................64
CHAPTER - 8 .........................................................................................................................65 8 Women Role in Public Life....................................................................................65
8.1 General Elections..................................................................................................65 8.2 Number of Seats in National and Provincial Assemblies and Senate .....................65 8.3 Registered Votes/Voters participation...................................................................65

VI
8.4 Elected Members By Gender ................................................................................66 8.5 Members of Cabinet .............................................................................................67 8.6 Participation of Women in Voluntary Associations / Groups.................................67
CHAPTER-9 .........................................................................................................................215
Content of Tables Table1.1: Province- Wise Population by Sex and Rural - Urban 1998- Census................................................................................................. 68 Table1.2: Population by Gender and Sex Ratio, Pakistan and Provinces........................................................................................................... 69 Table1.3: Average Annual Growth Rate and Population Change, Pakistan and Provinces............................................................................ 70 Table 1.4: Urban Population as Percent of Total Population, Pakistan and Provinces.................................................................................... 71 Table 1.5: Population of Twelve Major Cities 1931- 1998..................................................................................................................................... 72 Table 1.6: Median Age And Index of Aging, Pakistan And Provinces ................................................................................................................ 73 Table 1.7: Percent Distribution of Children Population ( 0- 14 Years ) By Gender Pakistan And Provinces .............................................. 74 Table 1.8: Percent of Population Aged 15-29 and 30-59 Years, Pakistan and Provinces ................................................................................ 75 Table 1.9: Percent of Population Aged 15 - 59 And 60 Years And Above, Pakistan And Provinces............................................................. 76 Table 1.10: Population of Pakistan By Broad Age Group And Dependency Ratio,Pakistan And Provinces ......... 77 Table 2.1: Marital Status of Population (15 Years and Above) by Gender, Pakistan and Provinces, 1972 ..... 78 Table 2.2: Marital Status of Population (15 Years and Above) by Gender, Pakistan and Provinces, 1981 ..... 83 Table 2.3: Marital Status of Population (15 Years and Above) by Gender, Pakistan and Provinces,1998 ..... 89 Table 2.4: Currently Married Population (15 Years and Above) by Gender, Age Urban-Rural Areas, Pakistan and Provinces, 1972.. 94 Table 2.5: Currently Married Population (15 Years and Above) by Gender, Age Urban- Rural Areas, Pakistan and Provinces, 1981. 96 Table 2.6: Currently Married Population (15 Years and Above) by Gender, Age Urban- Rural Areas, Pakistan and Provinces, 1998. 98 Table 2.7: Never Married Population (15 Years and Above) by Gender Age,Pakistan and Provinces ....................... 100 Table 2.8: Singulate Mean Age At Marriage By Gender, Pakistan And Provinces ........................................................................................ 102 Table 2.9: Crude Birth Rates by Gender, Urban- Rural Areas, Pakistan and Provinces .............................................................................. 104 Table 2.10: Crude Birth Rates By Gender And Urban - Rural Areas, Pakistan andProvinces ...... 105 Table 2.11: Age Specific Fertility Rates (ASFR) Per 1000 Women, Pakistan and Provinces ........................................................................ 106 Table 2.12: Crude Death Rates by Gender, Urban - Rural Areas, Pakistan and Provinces.......................................................................... 107 Table 2.13: Crude Death Rates by Gender and Urban- Rural Areas, Pakistan and Provinces .................................................................... 108 Table 2.14: Infant Mortality Rates By Sex And Area, Pakistan......................................................................................................................... 109 Table 2.15: Infant Mortality Rates by Sex, Area and Provinces ........................................................................................................................ 110 Table 2.16: Age Specific Death Rates by Gender, Pakistan and Provinces ...................................................................................................... 111 Table 2.17: Life Expectancy by Age, Pakistan....................................................................................................................................................... 113 Table 3.1: Percentage Distribution of Households By Gender Headship.......................................................................................................... 114 Table 3.2: Percentage Distribution of Head of Household By Gender And Marital Status, Pakistan And Provinces .............................. 115 Table 3.2: Percentage Distribution of Head of Households By Gender And Marital Status, Pakistan And Provinces ............................ 115 Table 3.3: Percentage Distribution of Gender Headship by Age, Pakistan and Provinces ............................................................................ 117 Table 3.4: Average Household Size by Gender, Place of Residence, Pakistan and Province......................................................................... 120 Table 3.5: Percentage of Households by Number of Persons Per Household, Pakistan and Provinces ....................................................... 121 Table 4.1: Health Delivery Facilities by Type in Public Sector and Urban- Rural Areas, Pakistan and Provinces ........... 124 Table 4.2: Number of Registered Medical Personnel by Gender, Pakistan...................................................................................................... 129 Table 4.3: Number of Medical Colleges, Enrolment and Teaching Staff by Gender and Area ..... 131 Table 4.4: Number of Private Medical Practitioners by Gender, Pakistan and Provinces .................... 132 Table 4.5: Percentage Distribution of Disabled Population by Gender and Urban-Rural Areas, Pakistan and Provinces ........ 133 Table 5.1: Percentage of Currently Married Women Who Reported knowledge of Contraceptive Methods, Pakistan And Provinces134 Table 5.2: Proportion of Respondents Ever Using Contraceptives by Methods, Pakistan and Provinces, 2003 .............. 136 Table 5.3: Percentage of Currently Using Specific Methods, Among Currently Married Women, Pakistan and Provinces, 2003........ 136 Table 5.4: Awareness of Modern Methods Among Currently Married Women by Places of Residence, Pakistan and Provinces,2003137 Table 5.5: Awareness of Modern Methods Among Currently Married Women by Educational Attainments Pakistan and Provinces, 2003....................................................................................................................................................................................................................................... 137 Table 5.6: Percentage Distribution of Currently Married Women by Knowledge of Specific Method by Type of Areas, 2003 ......... 138 Table 5.7: Percentage Distribution of Currently Married Women by Knowledge of Supply Source Specific Methods by Type, Pakistan and Provinces, 2003.................................................................................................................................................................................................... 138 Table 5.8: Percentage of Currently Married Women Ever Used Specific Methods,Pakistan and Provinces, 2003................................... 139 Table 5.9: Percentage of Currently Married Women Ever Used Specific Methods byPercent of Even Users Type of Areas, 2003....... 139 Table 5.10: Percentage of Currently Married Women Using Specific Methods by Pakistan and Provinces, 2003 ......... 140 Table 5.11: Percentage of Currently Married Women Using Specific Methods by Type of Areas, 2003.................................................... 140 Table 6.1: Literacy Ratio by Sex and Urban- Rural Areas, Pakistan and Provinces ............................. 141 Table 6.2: Number of Schools by Level and Gender,Pakistan............................................................................................................................ 142 Table 6.3: Number of Arts and Science Colleges by Gender, Pakistan and Province .................................................................................... 143 Table 6.4: Percent Distribution of Schools (Public Sector) by Level and Gender, Pakistan and Provinces,1995-96 ............ 144 Table 6.4: Percent Distribution of Schools (Public Sector) by Level and Gender, Pakistan and Provinces,1998-99 ................................ 145 Table 6.4: Percent Distribution of Schools (Public Sector) by Level and Gender, Pakistan and Provinces,1999-00 ................................ 146 Table 6.4: Percent Distribution of Schools (Public Sector) by Level and Gender, Pakistan and Provinces,2000-01 ................................ 147 Table 6.4: Percent Distribution of Schools (Public Sector) by Level and Gender, Pakistan and Provinces,2001-02 ................................ 148

VII
Table 6.4: Percent Distribution of Schools (Public Sector) by Level and Gender, Pakistan and Provinces,2002-03 ................................ 149 Table 6.4: Percent Distribution of Schools (Public Sector) by Level and Gender, Pakistan and Provinces,2003-04 ................................ 150 Table 6.5: Primary School (Public Sector) Enrolment and Enrolment Ratio by Gender, Pakistan and Provinces ................................. 150 Table 6.6: Middle School (Public Sector) Enrolment by Gender and Year and Gender Ratio of Enrolment, Pakistan and Provinces 151 Table 6.7: High School (Public Sector) Gender Enrolment by Year and Gender Ratio of Enrolment, Pakistan and Provinces............ 152 Table 6.8: College of Gender Enrolment by Year and Gender Ratio, Pakistan and Provinces ...153 Table 6.9: Number of Professional Colleges, Enrolment, Sex Ratio of Enrolment,Pakistan and Provinces ........ 154 Table 6.10: Gender Enrolment in University and Gender Ratio of Enrolment, Pakistan and Provinces ................. 155 Table 6.11: Number of Primary School (Public Sector) Teachers by Gender and Teachers per School, Pakistan and Provinces......... 157 Table 6.12: Number of Middle School (Public Sector) Teachers by Gender and Teachers per School, Pakistan and Provinces .......... 158 Table 6.13: Number of High Schools (Public Sector) Teachers by Gender and Teachers Per School, Pakistan and Provinces ............. 159 Table 6.14: Number of College Teachers by Gender and Teachers per College, Pakistan and Provinces ............... 160 Table 6.15: Number of Teachers in Professional Colleges (Public Sector) and Teachers Per College by Gender, Pakistan and Provinces .................... 161 Table 6.16: Number of University Teachers by Gender and Teachers per University, Pakistan and Provinces ....................................... 162 Table 6.17: Result of Matric Examination (Public Sector) by Gender, Pakistan and Provinces 1996 ...163 Table 6.17: Result of Matric Examination (Public Sector) by Gender, Pakistan and Provinces 1997 ...164 Table 6.17: Result of Matric Examination (Public Sector) by Gender, Pakistan and Provinces 1998 ..165 Table 6.17: Result of Matric Examination (Public Sector) by Gender, Pakistan and Provinces 1999 ...166 Table 6.17: Result of Matric Examination (Public Sector) by Gender, Pakistan and Provinces 2000 ...167 Table 6.17: Result of Matric Examination (Public Sector) by Gender, Pakistan and Provinces 2001 168 Table 6.17: Result of Matric Examination (Public Sector) by Gender, Pakistan and Provinces 2002 ...169 Table 6.17: Result of Matric Examination (Public Sector) by Gender, Pakistan and Provinces 2003 ...170 Table 6.17: Result of Matric Examination (Public Sector) by Gender, Pakistan and Provinces 2004 ...171 Table 6.18: Result of Intermediate Examination (Public Sector) by Gender, Pakistan and Provinces 1996…………………………….172 Table 6.18: Result of Intermediate Examination (Public Sector) by Gender, Pakistan and Provinces 1997…………………………….173 Table 6.18: Result of Intermediate Examination (Public Sector) by Gender, Pakistan and Provinces 1998…………………………….174 Table 6.18: Result of Intermediate Examination (Public Sector) by Gender, Pakistan and Provinces 1999…………………………….175 Table 6.18: Result of Intermediate Examination (Public Sector) by Gender, Pakistan and Provinces 2000…………………………….176 Table 6.18: Result of Intermediate Examination (Public Sector) by Gender, Pakistan and Provinces 2001…………………………….177 Table 6.18: Result of Intermediate Examination (Public Sector) by Gender, Pakistan and Provinces 2002…………………………….178 Table 6.18: Result of Intermediate Examination (Public Sector) by Gender, Pakistan and Provinces 2003…………………………….179 Table 6.18: Result of Intermediate Examination (Public Sector) by Gender, Pakistan and Provinces 2004…………………………….180 Table 7.1: Growth of Total Population and Economically Active Population (10 years and above) by Sex, Pakistan - 1951 – 1998..... 181 Table 7.2: Crude Activity (Participation ) Rates: Pakistan and Provinces by Sex and Rural/Urban Areas…………………………….182 Table 7.3: Refined Activity (Participation ) Rates: Pakistan and Provinces by Sex and Rural/Urban Areas ........ 183 Table 7.4: Age Specific Activity (Participation) Rates by Sex, Pakistan ........................................................................................................... 184 Table 7.5: Percentage Distribution of Population and that of 10 Years of Age and above by Area, Age, Sex and Nature of Activities, 2003-2004 ........ 185 Table 7.6: Civilian Labour Force: Pakistan and Provinces................................................................................................................................. 185 Table 7.7: Employed: Pakistan and Provinces ...................................................................................................................................................... 186 Table 7.8: Employed: Pakistan and Provinces ...................................................................................................................................................... 187 Table 7.9: Distribution of Employed: Major Industry Division ......................................................................................................................... 187 Table 7.10: Distribution of Employed: Major Industry Division ....................................................................................................................... 188 Table 7.11: Distribution of Employed: Employment Status and Sex................................................................................................................. 188 Table 7.12: Distribution of Employed: Hours Worked, 2003-04........................................................................................................................ 189 Table 7.13: Distribution of Non-Agriculture Workers into Formal and Informal Sector ............................................................................. 189 Table 7.14: Distribution of Informal Sectors Workers: Major Industry Divisions......................................................................................... 190 Table 7.15: Distribution of Informal Sectors Workers: Major Occupational Groups ................................................................................... 190 Table 7.16: Distribution of Informal Sectors Workers: Employment Status ................................................................................................... 191 Table 7.17: Distribution of Employed Persons 10 years of Age and Above by Status of Injuries/Diseases................................................. 191 Table 7.18: Distribution of Employed Persons Suffered Occupational Injuries/Diseases: Major Industry Divisions .............................. 192 Table 7.19: Distribution of Employed Persons Suffered Occupational Injuries/Diseases: Major Occupational Groups......................... 192 Table 7.20: Distribution of Employed Persons Suffered Occupational Injuries/Diseases: Employment Status ........................................ 193 Table 7.21: Distribution of Employed Persons 10 Years of Age & Above Suffered Occupational Injuries/Diseases by Type of Treatment Received .......... 193 Table 7.22: Unemployment Rates Including Underemployed Who Worked Less Than 15 Hours During Reference Week................... 193 Table 7.23: Distribution of Employed Persons 10 years of Age and Above Suffered Occupational Injuries/Diseases by Parts of Body Injured ...194 Table 7.24: Unemployment: Rates: Sex and Age ................................................................................................................................................. 194 Table 7.25: Number of Government’s Employed Persons by Grade and Sex................................................................................................. 195 Table 7.26: Number of Government’s Employed Persons by Grade Sex NWFP ............................................................................................ 196 Table 7.27: Number of Government’s Employed Persons by Grade Sex Punjab ........................................................................................... 197 Table 7.28: Number of Government’s Employed Persons by Grade Sex Sindh .............................................................................................. 198 Table 7.29: Number of Employed Persons in Insurance Companies by Grade Sex Pakistan ....................................................................... 199 Table 7.30: Number of Employed Persons in Investment Bank by Grade Sex Pakistan ............................................................................... 201 Table 7.31: Number of Employed Persons in Leasing Corporation by Grade Sex Pakistan........................................................................ 202 Table 7.32: Number of Employed Persons in Modaraba by Grade Sex Pakistan ........................................................................................... 204 Table 7.33: Number of Employed Person in Bank by Grade Sex Pakistan...................................................................................................... 205 Table 8.1: Male and Female Voters of Pakistan (As on 30th August, 2002)..................................................................................................... 208

VIII
Table 8.2: Registered Voters, Votes Polled and Turnout of Voters in the National ....................................................................................... 209 Table 8.3: Number of Elected Senators to the Senate by Gender....................................................................................................................... 210 Table 8.4: Number of Elected Members to the National Assembly by Gender................................................................................................ 210 Table 8.5: Number of Elected Members to the Provincials Assemblies by Gender ........................................................................................ 211 Table 8.6: Number of Ministers/State Ministers/Advisors to Prime Minister and Special Assistant to Prime Minister by Gender and Years in the Federal Cabinet of Pakistan ........... 212 Table 8.7: Number of Ministers/ Advisors and Special Assistants to Chief Minister by Gender and Years in the Provincial Cabinet.213 Table 9.1: Demographic Data and Estimates for the Countries and Regions of the World-2004................................................................. 215

1
Chapter 1
This chapter presents historical trends in country's population during 1947-98, its distribution by sex, pattern of its growth during inter-censal period, percentage changes, urbanization, sex ratios and age composition. 1.1 Population Size And Trends The population of the country at the time of Independence, which was 32.5 million is put into perspective on the basis of decennial censuses as under:- Table 1.1 Population of Pakistan
Years Population in Thousand(s) 1947 1951 1961 1972 1981 1998
32500 33740 42880 65309 84254 132352
Source:1.Population Census 1951,1972, 1981 and 1998. 2. Estimate for 1947. Thus, in just 51 years (1947-1998), the population has registered fourfold increase. With the population of 132.4 million in the year 1998, Pakistan is ranked as seventh most populous country in the world after China, India, USA, Russia, Indonesia and Brazil. Time series of census figures make a steeply rising step function, particularly, in post- 1961 period.
Figure 1.1 Population of Pakistan 1947-1998
132.352
84.25465.308
42.8832.5 33.74
020406080
100120140
1947 1951 1961 1972 1981 1998
Population
Source: Table 1.1
1.2 Proportion of Population The Proportion of Population in each province showed a slight variation in the year 1998 over the proportion as obtained in 1981 census. NWFP, Sindh and Islamabad have slightly gained, while Punjab, Balochistan and Federally Administered Tribal Areas have pared a bit down. This may be due to in or out migration and over and under coverage in the earlier census. Table 1.2 Province-wise Population Distribution of Pakistan- 1998
Population (000) Area Both Sexes Women Men
Pakistan 132352 63479 68874 NWFP 17744 8655 9089 FATA 3176 1524 1652 Punjab 73621 35527 38094 Sindh 30440 14342 16098 Balochistan 6566 3059 3507 Islamabad 805 371 434 Source: Population Census Organization 1998. Table 1.3 Province-wise Population
Distribution by Gender- 1998 Population Share in Percent
Area Both Sexes Women Men Pakistan 100.0 100.0 100.0 NWFP 13.4 13.6 13.2 FATA 2.4 2.4 2.4 Punjab 55.6 56.0 55.3 Sindh 23.0 22.6 23.4 Balochistan 5.0 4.8 5.1 Islamabad 0.6 0.6 0.6 Source: Population Census Organization 1998

2
Figure 1.2 Province-wise Men Distribution, Pakistan-1998
13.2
2.4
55.3
23.4
5.1
0.6
NWFP FATA Punjab Sindh Balochistan Islamabad
Source: Table 1.3
Figure 1.3 Province-wise Women Distribution, Pakistan-1998
13.6
2.4
56
4.8
0.6
22.6
NWFP FATA Punjab Sindh Balochistan Islamabad
Source: Table 1.3 1.3 Gender Population During the post-independence period capped by census 1998, the gender make-up of population has proceeded as expected biologically. However, the population of women has increased more than four fold whereas that of men slightly lesser during the same period, which is in consonance with the inherent survivability of females. (Table 1.4). Table 1.4 Women - Men Population, 1947-1998
Year Women (000)
Men (000)
Both Sexes (000)
Propor-tion of women
1947 1951 1961 1972 1981 1998
15,100 15,593 19,920 30,476 40,021 63,478
17,400 18,147 22,960 34,833 44,233 68,874
32,500 33,740 42,880 65,309 84,254 132,352
45.5 46.2 46.5 46.7 47.5 48.0
Source: Population Censuses 1951, 1961, 1972, 1981 and 1998. Estimates for 1947.
Figure 1.4 Women - Men Population, Pakistan 1947-1998
15 16 2030
40
63
17 18 2335
44
69
0
50
100
1947 1951 19761 1972 1981 1998Figu
re in
Tho
usan
ds
Women Men
Source: Table 1.4 1.4 Gender Composition and Sex
Ratio As the table 1.5 below depicts, the sex ratios of women per 100 men as obtained from the past five population censuses indicate that there has been less number of women than men in each period. However, there has been a progressive convergence towards better gender poise due perhaps to faster decline in the level of female mortality. Nonetheless, the sex ratio at birth has generally been between 105 to 107 males per 100 females in the country. As far urban - rural difference, the lower sex ratio in urban areas is not surprising because men, while moving to urban areas for job and other work leave, generally, women folk behind in the rural areas.
Table-1.5 Sex Ratio by Area, Pakistan, 1951-1998
Women per Hundred Men Year Urban Rural All Areas
1951 1961 1972 1981 1998
78.6 79.6 83.6 86.7 89.2
87.2 88.9 88.8 92.0 93.7
85.9 86.8 87.5 90.5 92.2
Source: Population Censuses 1951,1961,1972 and 1998

3
Figure 1.5 Sex Ratio(Women per 100 Men), Pakistan-1951-1998
85.986.8 87.5
90.592.2
82848688909294
1951 1961 19872 1981 1998
Source: Table 1.5
1.5 Rate of Population Growth Intercensal growth rates rose rapidly in the post-independence period to peak in 1972 (3.7%). Thereafters a slow decline is discernable. Women grew higher than men in each census year. The intercensal average growth rate per annum is estimated 2.8% for women and 2.6% for men during the period 1981-1998. If the same trend of population growth continues, the population of women will double in next 26 years, two years ahead of men’s (28 years) (Table 1.6). Table-1.6 Average Growth Rate Per annum (%)
Year Women Men Both Sexes
1951 1961 1972 1981 1998
1.81 2.49 3.73 3.28 2.75
1.72 2.39 3.65 2.87 2.64
1.80 2.43 3.69 3.06 2.69
Source: Censuses 1951, 1961, 1972, 1981 and 1998.
Fig.1.6 Average Growth Rate of Population per Annum, Pakistan-1951-1998
0
0.5
1
1.5
2
2.5
3
3.5
4
1951 1961 1972 1981 1998
Perc
ent
Women Men Both Sexes
Source: Table 1.6 1.6 Population Change
The percentage change in population, instead of a mildly ascending exponential curve, has fallowed a bi-modal pattern for both genders in the intercensal periods. It peaked in 1972 followed by a relatively higher peak in 1998. However, the figures for women have consistently been higher vis-à-vis that of men. For explanation, the variable profile of coverage can be cited as one of leading factors in this regard. Table-1.7 Percent Population Change Pakistan 1951-1998
Year Women Men Both Sexes
1951 1961 1972 1981 1998
19.6 27.7 53.0 31.3 58.6
18.8 26.5 51.7 27.0 55.7
19.3 27.1 52.3 29.0 57.1
Source: Censuses 1951, 1961, 1972, 1981 and 1998.
Figure 1.7 Percent Population Change, Pakistan 1951-1998
19.627.7
53
31.3
58.6
18.826.5
51.7
27
55.7
010203040506070
1951 1961 1972 1981 1998
Women Men
Source: Table 1.7 1.7 Urbanization Urbanization had been waving ahead with variable amplitude. The urban population at the time of independence stood at 15.4% of total population scaled up to 17.8% in 1951 in the spell of four years. The following censuses are nigh equally spaced in this regard, though, the last one (of 1998) records a relatively bigger stride. Gender prism reflects a less variable pattern. Apparently, the terms of trade in the favour of industrialization-the trend setter of urbanization-vis-à-vis agriculture have not been consistent over the periods under discussion . Table 1.8 Urban Population as Percent of Total Population, Pakistan, 1951-98
Total Percent of Population

4
Year Population All Areas
(in million)
Women Men Both Sexes
1951 1961 1972 1981 1998
33.8 42.8 65.3 84.3 132.4
7.8 9.9 11.6 13.0 15.3
10.0 12.6 13.8 15.2 17.2
17.8 22.5 25.4 28.2 32.5
Source: Censuses 1951, 1961, 1972, 1981 and 1998. There were only 11 cities in 1961 with more than 100 thousand population and the population size ranged from 1.913 million for Karachi to 0.107 million for Quetta. The number of such cities increased to 23 in 1998, i.e. thirteen more cities had crossed 100 thousand population in 37 years. In terms of size, population of Karachi, the largest city, reached to 9.339 million in 1998, whereas population of Lahore was reported 5.443 million. Faisalabad with population of 2.009 million was third largest city. The population of these three cities stood at 5.208, 2.953 and 1.104 million respectively in 1981. The respective average annual growth rates 3.45, 3.32 and 3.58 speak volumes about exponential growth in the size of cities.
Figure 1.8 Urban Population as Percent of the Total Population, Pakistan 1951-1998
7.89.9
11.613
15.3
1012.6 13.8
15.217.2
0
5
10
15
20
1951 1961 1972 1981 1998
Women Men
Source: Table 1.8 1.8 Age Composition The age structure is an important feature of a population, as it brings forth the role of fertility, mortality and migration. The age distribution of women as well as men tilts heavily towards younger and economically un-productive ages. However, percentage of population below 15 years age has declined from 44.5 percent in 1981 to 42.4 percent in 1998 (over a period of 17 years). Graphically, population of Pakistan constitutes a broad based pyramid, with high population at younger age groups. 14.8 % are under 5 years whereof 14.52 % are male and 15.10 % are females. The progressive narrowness of the pyramid at the
adult ages to a very thin peak puts question mark on the state of longevity in Pakistan. 1.9 Median Age and Index of Aging The Median age provide reference to reflect on the age composition of the population. The median of women (7.6 and 18.2 years) and men (8.5 and 18.2 years) in the consecutive censuses of 1981and 1998 respectively, adduces the prevalence of high fertility and low longevity with oblique reference to the unenviable gender scenario. The population of 65 years and above is considered old in Pakistan. As such the index of ageing defined as the ratio of population 65 years and over to the population under 15 years of age, seems to be on decline (table-1.8). This trend is clearer in case of women. Table-1.9 Median Age and Index of Aging, Pakistan, 1972-1998
Median Age (years) Index of Ageing
Year Women
Men Both Sexes
Women
Men Both Sexes
1972 1981 1998
18.3 17.6 18.2
18.9 18.5 18.2
17.4 16.1 18.2
8.6 8.5 7.6
10.2 10.7 8.5
9.5 9.6 8.1
Computed from Censuses 1961, 1972, 1981 and 1998. The index figures give further credence to the observation made in the preceding paragraph 1.10 Children, Youth and Elderly Population The share of children under 15 years of age remained well nigh same (43%) in all head counts. The figures for males and females also constitute nearly invariant series with 23% and 21% as the respective measure of central tendency. However, lower figures for women defy explanation when judged in relation to their higher biological survivability.
Table-1.9.1 Percent Distribution of Children Population for the Period 1951-1998
Total Population
In
Percentage of Children Population Aged 0-14
Years

5
Year (Thousands) Female Male Both Sexe
s
1951(a) 1961(a) 1972(a) 1981 1998
31,948 39,442 62,462 84,254 132,352
20.4 20.0 20.7 21.5 20.3
22.7 22.4 23.1 23.0 22.1
43.1 42.4 43.8 44.5 42.4
a: Age distribution of FATA is not included in 1951, 1961 and 1972 censuses.
Source. Censuses 1951,1961,1972,1981 and 1998.
20.4
22.7
20
22.4
20.7
23.1
21.5
23
20.3
22.1
18
19
20
21
22
23
24
(%)
1951 1961 1972 1981 1998
Figure 1.9 Percentage of Childern Population (0-14) Years, Pakistan 1951-
1998
Female Male
Source: Table 1.9.1
1.10.1 Youth Population Aged 15-29 Years The population aged 15-29 years, categorized as primary youth, has gradually been ebbing. The same holds true more for men than for women. This scenario does not provide unmixed rumblings of some imminent demographic shift. The near-steady proportion of women might keep the fertility form falling whereas sagging percentage of men might raise the threshold of nuptiality. Table-1.9.2 Percent of Total Youth Population Aged 15-29
Year Women Men Both Sexes
1951 1961 1972 1981 1998
12.3 11.5 10.9 11.1 13.1
14.3 13.0 12.3 12.6 13.6
26.6 24.5 23.2 23.7 26.7
1.10.2 Youth Population Aged 30-59 Years The time series of secondary youth (aged 30-59 years) is akin to that of primary youth. However, proportions of women give an inkling of moving up. Since women
tend to outlive men, the spectacle befits the general perception. Table-1.9.3 Percent of Total Youth Population Aged 30-59
Year Women Men Both Sexes
1951 1961 1972 1981 1998
10.7 11.9 11.9 11.9 11.6
13.9 14.2 14.0 12.8 12.8
24.6 26.1 25.9 24.7 24.4
Source:. Population Censuses 1951 to 1998
1.10.3 Working Population Aged 15-59 Years During the time span marked by the censuses, the working population (aged 15-59 years) forms a sagging trajectory with a sort of resurgence in 1998. This is in consonance with the course of labour emigration. The descending proportion of men and ascending ones of women also impart credence to the aforementioned observation. Table-1.9.4 Percent of Working Population Aged 15-59
Year Women Men Both Sexes
1951 1961 1972 1981 1998
23.0 23.4 22.8 23.0 24.7
28.2 27.2 26.3 25.5 26.4
51.2 50.6 49.2 48.5 51.1
1.10.4 Elderly Persons (60 years of age and
above) The elderly population figures form a flat bottomed inverted “U” in the censual period (1951-1998). The same pattern is reflected in the case of men & women. As an explanation, shrinking coverage of social support can be counted as a minor premise alongside surge in young population.

6
Table-1.9.5 Percent of Elderly Persons (60 years of age and above)
Year Women Men Both Sexes
1951 1961 1972 1981 1998
2.6 3.0 2.9 3.0 2.5
3.1 4.0 4.1 4.0 3.0
5.7 7.0 7.0 7.0 5.5
1.10.5 Dependency Ratio The Dependency Ratio is the sum of population under 15 and 60+ years divided by the population aged 15-59 years. The overall dependency ratio has steadily been on ascent since 1951. However, the last census (1998) find it a bit pared down in the upper vicinity of the 1st census (1951) figure.
Table 1.10 Population of Pakistan by Broad Age Group and Dependency Ratios (thousands)
Year
Population under 15
years
Population 15-59
Population 60+
1 2 3 4
1951* 1961* 1972* 1981 1998
14,528 18,224 28,605 36,519 56,065
17,258 21,697 32,132 39,802 65,948
19,211 2,916 4,572 5,733 7,162
Year
Total Population
Overall Dependency Ratio
(col 2+col 4 x 100)
col 3
Old Age Dependency Ratio (col 4 x
100) col 3
1 5 6 7
1951* 1961* 1972* 1981 1998
33,707 42,880 65,309 82,055 132,352
94.7 97.4 103.3 106.2 95.9
10.5 13.4 14.2 14.4 10.9
* Age distribution of FATA is not included in 1951, 1961 and 1972 censuses.
CHAPTER - 2

7
2. Fertility and Mortality Indicators This chapter highlights some of the important demographic indicators such as, fertility and mortality rates, marital status, age at marriage and life expectancy. 2.1 Marital Status According to 1998 census, almost 96 percent of women and men were married before reaching 40 and 50 years of age respectively. The data of marital status for both sexes indicated that 63.4% of total population 15 years and above were eventually married, 5.4% widowed and 0.34% divorced and 31.2% never married. This underscores universality of marriage in Pakistani society. Table-2.1 Marital Status of Population Age 15 Years and above by Sex and Age, Pakistan 1998
(Percent) Ever Married Age
Group/ Sex
Never Married
Currently Married Wido
wed Divorced
Total
MALE All Ages 15-19 20-24 25-29 30-34 35-39 40-44 45-49 50-54 55-59 60 years and above FEMALE All Ages 15-19 20-24 25-29 30-34 35-39 40-44 45-49 50-54 55-59 60 years and above
36.8 93.7 70.1 38.4 16.9 8.3 5.5 3.9 4.0 3.2 4.5
25.2 78.9 38.6 14.8
7.1 4.3 3.4 2.5 3.0 2.7 5.4
59.8 6.0
29.4 60.7 81.7 89.9 92.0 92.5 90.4 89.1 78.1
66.5 20.7 60.6 83.7 90.3 91.6 89.9 87.2 79.6 74.4 48.8
3.2 0.3 0.4 0.7 1.1 1.5 2.2 3.7 5.3 7.4
17.1
7.8 0.3 0.5 1.0 1.9 3.4 6.0 9.7
16.7 22.2 45.2
0.2 0.0 0.1 0.2 0.3 0.3 0.3 0.3 0.3 0.3 0.3
0.5 0.1 0.3 0.5 0.6 0.7 0.7 0.7 0.7 0.6 0.6
3.4 0.3 0.5 0.9 1.4 1.8 2.5 3.6 5.6 7.7
17.4
9.6 0.4 0.9 1.6 2.5 4.1 6.7
10.3 17.4 22.9 45.8
Source: Population Census Organization 1998. The comparative percentage of the never and currently married reflect that men are more prone to afford the former status. Nuptiality starts earlier for women as compared to men right from latter teens. The vertical ascent is also steeper. It also peaks five years earlier.
For advance years, it is women who end up living alone, perhaps due to relatively higher longevity as compared to men who are more taken to remarriage. The relevant figures of divorces and widows bear out the same observation. .
Figure 2.1 Marital Status of Male Population Pakistan,1998
36.8
59.8
3.2
0.2
Never Married Currently MarriedWidowed Divorced
Marital Status of Female Population, Pakistan, 1998
25.2
66.5
7.8 0.5
Never Married Currently MarriedWidowed Divorced
2.2 Currently Married Population In tune with the general perception, the census 1998 finds matrimony much more prevalent in rural areas as compared to urban areas. This gap however tends to narrow down in the higher age groups. Generally nuptiality is higher for fair sex for all age segments. The level of the pertinent figure in census 1998 indicate decline as compared to that of census 1981. Table-2.2 Percentage Distribution of Currently Married Population (15 years and above) by Sex, Age and Urban - Rural Areas, Pakistan, 1998
(Percent) Urban Rural Age
Group Men Women Men Women All Ages 55.8 61.4 62.1 69.2
8
Urban Rural Age Group Men Women Men Women 15-19 20-24 25-29 30-34 35-39 40-44 45-49 50-54 55-59 60+
3.3 20.1 52.0 78.8 89.2 92.1 92.8 90.5 89.0 76.5
12.9 49.8 78.7 88.8 90.9 89.1 85.4 76.8 69.4 44.5
7.6 35.1 66.0 83.6 90.3 91.9 92.3 90.3 89.1 78.8
25.0 66.1 86.2 91.2 92.0 90.3 88.1 80.9 76.7 50.5
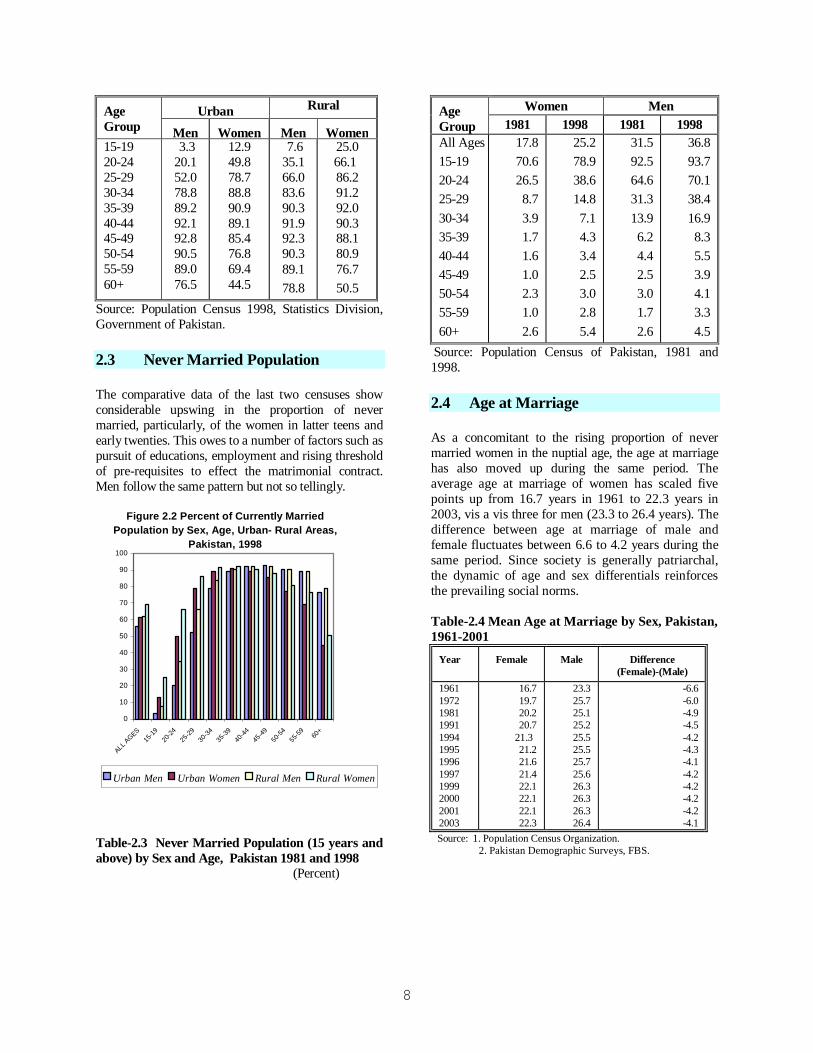
Source: Population Census 1998, Statistics Division, Government of Pakistan. 2.3 Never Married Population The comparative data of the last two censuses show considerable upswing in the proportion of never married, particularly, of the women in latter teens and early twenties. This owes to a number of factors such as pursuit of educations, employment and rising threshold of pre-requisites to effect the matrimonial contract. Men follow the same pattern but not so tellingly.
Figure 2.2 Percent of Currently Married Population by Sex, Age, Urban- Rural Areas,
Pakistan, 1998
0
10
20
30
40
50
60
70
80
90
100
ALL AGES
15-19
20-24
25-29
30-34
35-39
40-44
45-49
50-54
55-59 60
+
Urban Men Urban Women Rural Men Rural Women
Table-2.3 Never Married Population (15 years and above) by Sex and Age, Pakistan 1981 and 1998 (Percent)
Women Men Age Group 1981 1998 1981 1998 All Ages 15-19 20-24 25-29 30-34 35-39 40-44 45-49 50-54 55-59 60+
17.8 70.6 26.5 8.7 3.9 1.7 1.6 1.0 2.3 1.0 2.6
25.2 78.9 38.6 14.8 7.1 4.3 3.4 2.5 3.0 2.8 5.4
31.5 92.5 64.6 31.3 13.9 6.2 4.4 2.5 3.0 1.7 2.6
36.8 93.7 70.1 38.4 16.9 8.3 5.5 3.9 4.1 3.3 4.5
Source: Population Census of Pakistan, 1981 and 1998. 2.4 Age at Marriage As a concomitant to the rising proportion of never married women in the nuptial age, the age at marriage has also moved up during the same period. The average age at marriage of women has scaled five points up from 16.7 years in 1961 to 22.3 years in 2003, vis a vis three for men (23.3 to 26.4 years). The difference between age at marriage of male and female fluctuates between 6.6 to 4.2 years during the same period. Since society is generally patriarchal, the dynamic of age and sex differentials reinforces the prevailing social norms. Table-2.4 Mean Age at Marriage by Sex, Pakistan, 1961-2001
Year Female Male Difference (Female)-(Male)
1961 1972 1981 1991 1994 1995 1996 1997 1999 2000 2001 2003
16.7 19.7 20.2 20.7
21.3 21.2 21.6 21.4 22.1 22.1 22.1 22.3
23.3 25.7 25.1 25.2 25.5 25.5 25.7 25.6 26.3 26.3 26.3 26.4
-6.6 -6.0 -4.9 -4.5 -4.2 -4.3 -4.1 -4.2 -4.2 -4.2 -4.2 -4.1
Source: 1. Population Census Organization. 2. Pakistan Demographic Surveys, FBS.

9
Figure 2.4 Mean Age at Marriage by Sex , Pakistan 1961- 2001
048
1216202428
19911994
19951996
19971999
20002001
2003
Female Male
2.5 Crude Birth Rates (CBRs) Pakistan demographic survey (PDS) provides declining time series of CBRs. It is descends from 40.6 of 1990 to 26.5 in 2003. Decline in rural areas has been much steeper than in urban areas. It appears that, with the expansion of secondary and tertiary activities, the social norms sprouting from the dependence on primary occupation are bringing the family size into sharp focus. Gender disaggregation is patterned on the same lines. Table-2.5 Crude Birth Rates of Pakistan Based on Census and Surveys, 1990 to 2003
CBR per 1000 population Based on surveys
Year All Areas Urban
Areas Rural Areas
1990 1991 1992 1993 1994 1995 1996 1997 1999 2000 2001 2003
40.6 39.5 39.3 39.9 37.6 37.2 35.2 33.8 30.2 29.1 27.8 26.5
34.8 34.4 32.8 33.5 31.7 32.5 31.3 30.1 27.8 25.8 25.0 24.1
43.2 41.9 42.3 41.4 40.3 39.3 37.1 35.6 32.2 31.8 29.4 27.9
Source: Pakistan Demographic Surveys (PDS), FBS.
Figure 2.5 Crude Births Rates by Gender, Urban-Rural Area, Pakistan 1994-2003
0
5
10
15
20
25
30
35
1999 2000 2001 2003
Perc
ent
Urban Female Births Rural Female BirthsUrban Male Births Rural Male Births
2.6 Age Specific Fertility Rates ASFRs have generally been declining. However, the women in latter twenties, latter thirties and forties portray regressive undercurrents. The foremost group forms the peak segment of the histograms both of an year and across the years. It appears that society is bracing up for lower fertility, but to ease the travails of transition, pent up fertility is partly finding expression in latter years of the matrimonial relationship. Table 2.7 Age Specific Fertility Rates (ASFR) per 1000 women
Age Group/ Year
1996 1997 1999 2000 2001 2003
All
15-19
20-24
25-29
30-34
35-39
40-44
45-59
163.7
54.7
258.2
295.9
255.4
143.0
65.5
23.2
152.8
52.3
231.0
273.2
211.2
142.9
68.4
30.7
134.9
36.2
205.6
275.5
203.6
118.3
61.7
25.8
127.6
32.9
195.1
244.2
203.8
114.5
54.4
22.9
120.8
24.2
162.0
242.9
197.2
118.5
57.9
21.9
*
23.7
163.1
229.6
190.6
112.7
49.0
18.0
*Not available in the report 2003 Source: 1. Pakistan Demographic Surveys FBS.

10
Figure 2.6 Age Specific Fertility Rates (ASFR) per 1000 Women in Pakistan
0
50
100
150
200
250
300
15-19 20-24 25-29 30-34 35-39 40-44 45-59
1997
1999
2000
2001
2003
2.7 Mortality Indicators The state of mortality was always analyzed from data as obtained in censuses and surveys. There are however, limitations to obtain reliable and accurate data on the occurrence of deaths in the country. Deaths are usually under reported as compared to births. The CDRs make mildly declining time series. However, curvature is a bit steeper for the rural areas. It appears that spread of health supporting facilities in rural habitats have been catching up with that of urban locations. Table-2.8 Crude Death Rates by Urban and Rural Areas, Pakistan 1990 to 2003
Year All Areas Urban Rural
1990 1991 1992 1993 1994 1995 1996 1997 1999 2000 2001 2003
10.6 9.8 10.1 10.1 9.9 9.2 8.8 8.9 8.3 7.8 7.2 7.0
7.6 7.4 7.7 8.0 7.0 7.6 7.1 7.3 7.1 6.7 6.3 6.2
12.0 10.9 11.2 11.0 11.2 10.0 9.6 9.6 9.2 8.8 7.6 7.4
Source: Pakistan Demographic Survey Reports, FBS.
Figure 2.7 Crude Death Rates by Urban-Rural Areas, Pakistan 1990-2003
0
2
4
6
8
10
12
14
1990
1991
1992
1993
1994
1995
1996
1997
1999
2000
2001
2003
All Areas Urban Rural
2.8 Crude Death Rates By Gender Gender specific CDRs influence the age-specific sex ratio and, by the same taken, the entire range of socio-demographic factors. Save the period of early childhood and that of child bearing age, female mortality in the later years is lower as compared to men’s. This is an indication of women’s inherent resilience in the nature’s scheme of ensuring continuity of human race. Table-2.9 Crude Death Rates By Gender, Urban-Rural Area, Pakistan
Crude Death Rates Per 1000 Population
All Areas Urban Area Rural Area Year
Both Sexes
Male
Female
Both Sexes
Male
Female
Both Sexes
Male
Female
1996 8.8 9.3 8.2 7.1 8.0 6.1 9.6 10.0 9.2
1997 8.9 9.5 8.3 7.3 7.7 6.9 9.6 10.3 8.9
1999 8.3 8.9 7.7 7.1 7.6 6.6 9.2 9.9 8.5
2000 7.8 8.2 7.4 6.7 7.0 6.3 8.8 9.2 8.3
2001 7.2 7.4 6.9 6.3 6.6 6.0 7.6 7.9 7.3
2003 7.0 7.3 6.6 6.2 6.8 5.6 7.4 7.9 6.9
2.9 Infant Mortality Rates (IMR)

11
Infant mortality rate is one of the best indicators to reflect upon the state of general welfare. The IMRs exhibit a mildly decreasing trend though with cyclical curvature. The profile of rural IMRs adumbrates onset of an inclusive paradigm of social amelioration. Table-2.10 Infant Mortality Rates, Pakistan
Infant Mortality Rates per 1000 live births
Year
All Areas
Urban Areas
Rural Areas
1997
1999
2000
2001
77.6
69.0
73.3
77.1
68.4
62.0
57.0
68.9
81.2
73.9
84.3
80.9 2003 76.2 67.2 80.6
Source: Pakistan Demographic Surveys, Federal Bureau of Statistics Table 2.11 Infant Mortality Rates by Urban- Rural Area and Sex, Pakistan 1990-2001
Urban Rural Year
Female
Male
Both Sexes Fem
ale
Male
Both Sexes
1990 62.7 84.9 74.3 116.6 115.4 116.0 1991 62.0 75.4 68.9 114.5 116 115.3 1992 76.4 66.7 71.4 114.1 109.2 111.6 1993 65.5 80.5 73.5 108.2 116.7 112.7 1994 62.7 53.8 58.1 117.3 114.3 115.7 1995 65.5 75.4 70.6 102.0 107.1 104.6 1997 68.4 76.6 72.7 81.2 96.6 89.2 1999 62.0 80.8 71.8 73.9 101.5 88.3 2000 57.0 80.9 69.3 84.3 89.1 86.8 2001 69.2 68.3 68.9 82.3 82.8 80.9 2003 64.4 69.7 67.2 74.1 85.6 80.6
Source: Pakistan Demographic Surveys
Figure 2.8 Infant Mortality Rates, Pakistan, 1997, 1999, 2000, 2001
0
25
50
75
100
1997 1999 2001 2003
All Areas Urban Rural
2.10 Gender Infant Mortality Rates Beholding the time series through the prism of gender it appears that urban environment is more congenial to female infants as compared to rural. Given the congenital resilience of female infant, it translates into their better survivability as compared to their male compatriots. However, obverse picture prevails in rural areas.
Fig. 2.9 Infant Mortality Rates by Urban-Rural Area and Sex , Pakistan 1999-2003
0
20
40
60
80
100
120
1999 2000 2001 2003
Urban Women Urban Men Rural Women Rural Men
2.11 Age Specific Death Rates (ASDR) by Gender Longitudinally, ASDR tend to be cyclical though with mildly falling vicissitude. They follow a slanting U shaped pattern across the age groups with longer prong for the first year of life and shorter one for fifties and beyond. Congenital resilience of female is evident from its markedly lower size as compared to that of males. Rest of the U does not reflect a discernable gender bias except a mild strand in the early sixties.

12
. Table 2.12: Age Specific Death Rates (ASDR) By Gender Source: Pakistan Demographic Surveys, Federal
Bureau of Statistics.
Figure 2.11 Age Specific Death Rates by Gender, Pakistan- 2003
0102030405060708090
100
All A
ges
Below
-
1 1
-4 5
-9
10-1
4
15-1
9
20-
24
25-
29
30-
34
35-
39
40-4
4
45-4
9
50-5
4
55-5
9
60-
64 65
+
Male Female
2.12 Life Expectancy From the gender perspective, life expectancy at birth follow the expected biological pattern. The females are markedly more survivable as compared to males. The size of life expectancy is comfortably above the dismal level. Longitudinally, life expectancy is scaling up except a small dip in the later eighties.
Table 2.13 Life Expectancy at Birth, Pakistan
1986-2003
(In Years) Year Women Men
1986 1991 1996 2001 2003
61.43 61.36 64.22 66.02 66.0
59.71 59.31 62.82 64.70 64.70
Source: Pakistan Demographic Surveys, Federal Bureau of Statistics.
Fig. 2.12 Life Expectancy at Birth
55
60
65
70
1986 1991 1996 2001 2003
Women Men
1999 2000 2001 2003 Age Groups
Both Male Female Both Male Female Both Male Female Both Male Female
All Ages 8.3 8.9 7.7 7.2 7.4 6.9 7.8 8.2 7.4 7.0 7.5 6.4 Below-1 103.8 123.7 83.9 81.9 85.2 78.5 111.6 122.5 100.3 81.8 86.6 76.5 1-4 9.5 8.9 10.1 5.6 5.7 5.5 9.4 8.2 10.7 6.2 6.8 5.6 5-9 2.8 2.7 3.0 1.6 1.5 1.7 5.3 4.6 5.9 0.8 1.1 0.6 10-14 2.5 2.6 2.5 1.2 0.8 1.7 2.7 2.6 2.7 0.4 0.7 0.1 15-19 1.9 1.9 1.9 1.4 1.5 1.3 1.2 1.4 1.0 0.9 0.6 1.3 20-24 3.4 2.9 3.9 1.9 1.5 2.3 1.4 1.7 1.1 1.7 1.4 1.9 25-29 3.0 3.4 2.6 2.1 2.2 1.9 1.6 2.0 1.2 1.8 1.9 1.6 30-34 3.7 3.5 3.8 2.5 3.4 1.8 1.4 1.0 1.8 2.0 2.3 1.7 35-39 3.7 3.6 3.7 4.2 4.8 3.5 2.3 3.0 1.7 2.6 2.7 2.6 40-44 5.2 5.8 4.6 4.0 3.9 4.1 3.4 3.7 3.1 3.5 3.8 3.1 45-49 3.8 4.7 2.7 5.4 6.4 4.3 3.3 3.3 3.3 4.8 5.6 4.1 50-54 8.8 9.1 8.5 8.7 9.1 8.1 8.0 7.6 8.5 11.4 10.0 12.9 55-59 9.4 10.2 8.5 13.2 13.2 13.1 11.7 15.1 7.9 15.8 16.7 14.7 60-64 17.7 15.2 20.7 20.3 18.4 22.6 18.4 19.8 16.5 23.7 26.3 20.7 65+ 51.3 53.0 48.8 53.2 53.3 53.1 49.9 46.6 44.9 57.7 57.6 57.8

13
CHAPTER – 3
3. Household and Family Structure This chapter describes some salient features of households and family structure such as household size, headship, age and marital status of heads of household and type of family. 3.1 Housing Stock
A household is usually defined as comprising of one or more persons, related or unrelated who make common provision for food or other essentials for living. According to the data of national population and housing censuses and selected household sample surveys, there were 7.8 million household units in 1960, which increased to 12.6 million in 1980 and 16.5 million in 1990-91 as computed from data of Pakistan Demographic Survey (PDS) 1990-91. At present there
are 19.7 million housing units in the country as reported in 1998 Population and Housing Census. 3.2. Head of Households by Gender As the table 3.1 reflects, Pakistan is predominantly a patriarchal society. However, women headship has also been gaining some ground, perhaps, more due to migration of men than any significant socio-cultural/attitudinal shift. The provincial profiles also bear out the aforementioned observation. Since men’s migration is common spectacle in Punjab and NWFP as compared to Sindh and Balochistan, the women headship of household has been on assent in the former two provinces both for rural and urban areas as compared to latter provinces where socio-cultural milieu puts much premium on soil-based identity and wresting economic opportunities as a means to social advancement is not too strong there to induce men’s migration in the pursuit of self-actualization. .
Table-3.1 Percentage Distribution of Households by Gender Headship, Pakistan and Provinces
1996-97 1998-99 2001-02 Areas
Women Men Women Men Women Men
PAKISTAN 6.8 93.2 7.9 92.1 8.1 91.9 Urban 6.3 93.8 7.8 92.2 8.3 91.7 Rural 7.0 93.0 7.9 92.1 8.0 92.0
PUNJAB 7.7 92.3 9.2 90.8 9.3 90.7 Urban 7.0 93.0 9.1 90.9 9.8 90.2 Rural 8.0 92.0 9.2 90.8 9.1 90.9
SINDH 2.4 97.6 2.8 97.2 2.5 97.5 Urban 4.7 95.3 5.4 94.6 5.5 94.6 Rural 0.4 99.6 0.8 99.2 0.4 99.6
N.W.F.P 10.3 89.7 14.3 85.7 14.6 85.5 Urban 9.5 90.5 11.5 88.5 10.8 89.2 Rural 10.4 89.6 14.8 85.2 15.2 84.8
BALOCHSTAN 2.9 97.1 1.5 98.5 2.2 97.8 Urban 3.2 96.8 3.6 96.5 3.0 97.0 Rural 2.8 97.2 1.2 98.8 2.0 98.0
Source: Pakistan Integrated Household Survey, (PIHS), FBS 3.3 Headship by Marital Status
As a matter of fact, matrimony is the basis to claim the headship of a household. Consequently, households headed by unmarried persons is not a common

14
spectacle and appear to exist as transitory/stop-gap arrangement. The household surveys (HIES/PIHS) range unmarried headed households three to four percent for men and less than one percent for women, Longitudinally, it is a receding phenomenon. About ninety percent of the household are headed by currently married men as compared to four to five percent headed by the women of the same category. High correlation of the status of household headship with that of currently married indicates that nuclear family structure is gaining ground as a dominate form of household. The time series adumbrates that patriarchalism is ceding a bit to matriarchalism apparently as an expediency and not by design. Owing to the lingering sanction of the matrimonial contract, the widow headed households are obviously more numerous than headed by unmarried persons. A trace number of divorced also finds catapulted to the same status, probably, due to carry over responsibilities of their truncated households. Table-3.2 Percentage Distribution of Heads of Household by Gender and Marital Status, Pakistan.
Year / Sex Un-Married
Currently
Married
Widow/ Widower
Divorced
1996-97 Both Sexes Women Men 1998-99 Both Sexes Women Men 2001-02 Both Sexes Women Men
3.2 0.1 3.2
3.6 0.1 3.4
3.4 0.1 3.3
90.5 4.4 86.4
89.2 4.7 84.4
88.9 4.7 84.3
5.8 2.3 3.6
6.9 3.0 3.9
7.2 3.2 0.4
0.4 0.1 0.4
0.4 0.1 0.3
0.4 0.1 0.3
Source:1) Household Integrated Economic Survey (HIES), Federal Bureau of Statistics, Statistics Division, 2) Pakistan Integrated Household Survey , Federal Bureau of Statistics, Statistics Division,
Figure 3.1 Percentage Distribution of Head of Households by Marital Status, Pakistan 2001-02
3%
90%
7%
0%
Un-Married Married Widow/Widower Divorced
3.4 Age Structure of Gender Headship Age structure of gender headship bears out this status as a masculine prerogative. Significant start to pick up its gauntlet takes place in early twenties to spike in early forties and curve mildly down to the minimum in early sixties. An apparent scaling up beyond that can be attributed to open endedness of the age interval. Women follow the same pattern, though, fare enormously lesser than their men compatriots in sync with patriarchal composition of Pakistani society, characterized with a raft of socio-cultural inhibitions on the mobility and initiative of womenfolk. Table 3.3 Percentage Distribution of Gender Headship by Age, Pakistan
1998-99 2001-02
Age group
Wom
en
Men
Both Sexes
Wom
en
Men
Both Sexes
15-19 0.0 0.9 1.0 0.0 0.7 0.7 20-24 0.2 3.4 3.6 0.2 3.3 3.6 25-29 0.9 6.9 7.8 0.7 7.1 7.7 30-34 1.1 10.2 11.3 0.9 9.9 10.9 35-39 1.3 12.3 13.6 1.2 13.3 14.5 40-44 1.2 12.2 13.4 1.3 11.4 12.7 45-49 0.8 10.5 11.3 0.9 10.6 11.4 50-54 0.6 9.1 9.7 1.0 9.7 10.7 55-59 0.5 7.5 7.9 0.6 7.6 8.2 60-64 0.6 7.8 8.4 0.5 7.1 7.7
65 Years & above
0.8 11.4 12.1 0.7 11.2 11.9 3.5 Gender Composition of Households As the table below portrays, the data do not point out significant skewness in the gender composition of the household. It appear, that fair sex does not face wide spread discrimination in meeting the essential needs. However, it is higher needs relating to initiative and enterprise where women have to scale up a twisted trajectory. Table-3.4 Average Household Size by Gender, Place of Residence, Pakistan

15
1998-99 2001-02
Province / Areas
Wom
en
Men
Both Sexes
Wom
en
Men
Both Sexes
All Areas 3.4 3.4 6.8 3.5 3.5 7.0 Urban 3.3 3.4 6.7 3.4 3.5 6.9 Rural 3.4 3.4 6.8 3.5 3.5 7.0 Source: 1) Household Integrated Economic Survey (HIES),
Federal Bureau of Statistics, Statistics Division.1998-99
2) Pakistan Integrated Household Survey, Federal Bureau of Statistics, Statistics Division
2001-02. 3) Population Census of 1998, Population Census
Organization, Statistics Division. 3.6 Household by Number of Persons Household size is skewed in favour of high numbers both across the time and space (areas). Smaller households tend to get fewer with the passage of time. This descent gets flatter for higher numbers till it changes into ascent for the “seven plus” household size. Since fertility has, at least, not been increasing, the trend towards larger household size might have emerged as a means to come to grips with the impact of receding social security cover and rising unemployment/poverty.
Table 3.5 Percentage of Household by Number of Persons
Area/No.of Persons
1996-97
1998-99
2001-02
All Areas One 1.7 1.6 1.1 Two 7.0 5.3 4.8 Three 8.5 7.6 6.8 Four 11.9 10.3 10.2
Five 14.4 12.7 12.9 Six 14.5 14.4 13.9 Seven+ 42.0 48.3 50.4 Urban One 3.0 2.3 1.6 Two 4.6 4.7 4.7 Three 6.7 7.6 6.6 Four 10.9 9.7 9.5 Five 14.8 14.1 15.1 Six 15.3 15.3 14.1 Seven+ 44.7 46.3 48.5 Rural One 1.2 1.3 1.0 Two 8.0 5.5 4.8 Three 9.2 7.6 6.8 Four 12.4 10.5 10.5 Five 14.3 12.1 11.9 Six 14.1 13.9 13.8 Seven+ 40.8 49.1 51.2 Source: 1) Household Integrated Economic Survey
(HIES),Federal Bureau of Statistics,1998-99 2) Pakistan Integrated Household Survey,
Federal Bureau of Statistics, 2001-02.
Fig. 3.2 Percentage of Households by Number of Persons, Pakistan 2001-02
1% 5% 7%10%
13%
14%
50%
One Two Three FourFive Six Seven+
3.7 Family Structure Pakistan, being a predominantly Muslim society, is characterized with the universality of marriage. Both nuclear and extended family interact on the same continuum. Almost 94 percent women aged 30 to 34 are currently married. According to the findings of Pakistan Demographic and Health Survey, 1990-91, most of the women are married to close relatives. Only 37 percent of married women were not related to their spouses before marriage. Consanguineous marriage is more common in rural families, particularly, in extended families. The data on teenage pregnancy and motherhood from the same survey indicates that sixteen

16
percent of teenagers (women age 15-19) were reported as pregnant with their first child. The percentage rises rapidly with age as only 6 percent of women at age 15 or 16 became pregnant or mother, compared to 31 percent of those of age 19. Polygamy, though allowed with the written consent of the first wife, is not a common practice. PDHS Survey 1996-97, finds only 5 percent of currently married in a polygamous union. The divorce rate is very low in the country due to low level of social tolerance. Woman can also seek divorce
under law provided the court is convinced of the casus belli.

17
CHAPTER – 44. Health Profile This chapter give an empirical brief overview of the state of health care and its concomitants such as health facilities, health manpower, morbidity, causes of deaths, disability, anemia and nutrition etc. 4.1 Health Care According to the country’s constitution, the delivery of health services lies with the provincial governments. The federal government is mainly concerned with formulation of National Health Policy, Co-ordination of Provincial Health Services and Health Training Standards. However federal government is responsible to provide health services directly in the federally controlled areas. Three health care systems namely Allopathic, Unani and Homeopathic are working in the country. Public health care employs the foremost system only. Due to financial constraints, the rate of expansion of public health facilities and qualified manpower has been too inadequate to provide for universal access, particularly, in rural areas.
The government health services are generally available in the daytime. However emergency remains open round the clock . A large number of private practionners (Doctors, Paramedics, Hakims, Homeopaths, Paramedics and faith healers) are also available in day and evening time with considerable clientele. 4.2 Health Delivery Facilities At the time of independence Pakistan inherited very poor health infrastructure, which included one medical college and 78 doctors in the country. There were in all 1105 health delivery facilities in 1947,.comprising of 292 hospitals, 722 dispensaries and 91 MCH centres spread over the whole country Notwithstanding steady expansion of health facilities in the post independence period, the goal of universal access still eludes general populace. Table 4.1 provides post 1998 scenario of the expansion of health facilities in public sector. It is evident that except MCH centers and Sub Health clinics, health facilities have not increased on a promising scale. This owes to the much pointed out low status of social sector in the scheme of national priorities.
4.2.1 Number of Registered Medical Personnel
Table 4.1 Health Delivery Facilities by Type in Public Sector Pakistan (Numbers)
Year Hospital Dispensaries MCH Centres
Tuberculosis Centres
Rural Health Centres
Sub-Health Clinics
Basic Health
Units
1998 1999 2000 2001 2002 2003 2004
872 879 876 907 906 906 916
4551 4583 4635 4625 4590 4554 4582
852 855 856 879 862 907 906
263 264 274 272 285 289 289
514 530 531 541 550 552 552
651 664 671 723 685 704 701
4504 4521 4500 4507 4623 4586 4600
Source: Health Division.

19
To supplement the normal health facilities, a special programme known as "Prime Minister's Programme"(PMP) for Family Planning and Primary Health Care was initiated during the year 1994. This special programme established a new cadre of service provider through Lady Health Workers for rural areas. The Lady Health Workers are normally from local community and work in the same area. They provide services for Maternal care, Infant care and Nutrition, diarrhoea disease control, Acute Respiratory Infections (ARI), Immunization, community Hygiene and sanitation and also to take care of sick persons. They keep a link with RHC, BHU, FWC centres, RHS centres (Family Planning Service Outlets). These women are appointed on contract basis over a period of time. Table 4.2 presents data for 2004.
4.2.2 Urban - Rural based facilities: On the average one facility is available for 10905 people and one bed is available for 1478 persons. As for area wise distribution of facilities, the top curative facilities (hospitals) and reproductive health centers (MCH Centres) are concentrated in urban localities whereas primary health care centers (RHC/BHU) are located in rural areas. As a result the distribution of beds is also skewed in favour of urban areas. A comparison of service provider by gender indicates that women as doctors, LHVs, Nurses, Mid wives and Lady Health Visitors have surpassed the number of male personnel deployed in the Health sector. Deployment of women as Lady Health Visitors will certainly lead to better state of women health especially in rural areas.
Table-4.2 Number of Health Facilities by Type and Beds in Urban and Rural Areas, Pakistan 2004.
Urban Rural All Areas Type of Facilities No. of
Facilities No. of Beds No. of
Facilities No. of Beds No. of
Facilities No. of Beds
Hospital Dispensaries T.B. Centres MCH Centres RH Centres Basic Health Units
776 1649 245 616 130 63
77305 886 132 236 2252 94
140 2933 44 290 422 4537
4568 1928 20 18 7010 5459
916 4582 289 906 552
4600
81873 2814 152 254
9262 5553
Total 3479 80905 8366 19003 11845 99908 Source: 1. Ministry of Health, Government of Pakistan Note: Basic Health Units includes Sub Health Centres4.3 Health Manpower Turnover
Trends 4.3.1 Medical and Dental Doctors As of 2004, there are 5144 medical doctors and 597 dentists registered with Pakistan Medical and Dental Council. As the table 4.3 portrays, the lady practitioners has more than catching up with their men compatriots over time. It is, interalia also due to our conservative social dispositions which find doctor’s
and teacher’s profession compatible with our national ethos.
.
Table 4.3 Number of Registered Medical and Dental Doctors by Gender, Pakistan Doctors Dentists
Years Women Men Total Women Men Total

20
1991 1096 2588 3684 41 75 116
1992 1238 3233 4471 28 57 85
1993 959 2000 2959 42 83 125
1994 1025 2166 3191 81 109 190
1995 1404 2099 3503 60 103 163
1996 2201 2329 4530 101 85 186
1997 2029 2207 4236 110 111 221
1998 1946 2278 4224 122 158 280
1999 2195 2227 4422 211 212 423
2000 2353 2367 4720 164 144 308
2001 2319 2103 4422 252 195 447
2002 2691 2694 5385 252 194 446
2003 2706 2815 5521 259 214 473
2004 2710 2434 5144 348 249 597 S Source: Pakistan Medical & Dental Council, Islamabad.
0
500
1000
1500
2000
2500
3000
3500
1991 1992 1993 1994 1995 1996 1997 1998 1999 2000 2001 2002 2003 2004
Fig 4.1(a) Number of Registered Medical Doctors During 1991 to 2004
Women Men

21
0
50
100
150
200
250
300
350
1991 1992 1993 1994 1995 1996 1997 1998 1999 2000 2001 2002 2003 2004
Fig 4.1 (b) Number of Registered Dental Doctors During 1991 to 2004
Women Men
4.3.2 Paramedics and Auxiliary Health Workers . The LHVs are the next important service provider in the health sector after doctors. They are posted in MCHs,RHVs, BHUs, etc. In the foremost case, they head the facility. Nurses and mid wives as auxiliary of the former, constitute indispensable rank and file of the health facilities. The temporal profile of employment in the aforementioned activities betokens a creeping social and attitudinal change towards gender equity in the domain of economic opportunities Table-4.4 Number of Registered Lady Health Visitors, Nurses and Mid Wives, Pakistan 1997- 2003
Years Lady Health Visitors
Women Nurses
Mid wives
1997 1998 1999 2000 2001 2002 2003
65 257 260 321 419 684 478
1207 2347 2968 2547 3922 3947 4128
100 188 271 185 256 360 301
Source: Ministry of Health, Government of Pakistan.
Figure 4.2 Number of Lady Health
Visitors, Nurses and Mid Wives, Pakistan 1997-2003
0500
10001500200025003000350040004500
1997 1998 1999 2000 2001 2002 2003
Lady Health Visitors Women Nurses Mid wives
4.4 Health Manpower Development
Institutes 4.4.1 Medical Colleges As of 2003-04 there exist 30 medical colleges in the country of these, two (2)-one in Punjab and other in sindh are exclusively for women. It is pertinent to mention that in all of the remaining 28 medical colleges, seats are reserved for women as well as they are also eligible to compete for general seats. Medical colleges are operating both in public and private sector. In the latter category, those of Agha Khan, Hamdard and Baqai are the vanguard Medical Colleges. In addition, there are four dental colleges in the country. In the context that dental hygiene is the most visible

22
sequel to and attendant with the human’s life routine, it is difficult to explain low number of dental colleges. Perhaps, social image of dentist is profiled in comparison with medical doctors to the disadvantage of the former which translates in to inadequate availability of aspirants. As a sequel to soaring cost of medical counseling /medicines and limited access to/decrepit state of, public health facilities, alternative treatment facilities are on rise. In 2003-04, 28 tibbi and 106 homeopathic colleges were imparting instructions to a growing number of customers-the relevant figure are presented in Table No.4.5.Women constitute larger part of the enrolment in medical colleges. This spectacle is beholden to our socio cultural preferences whereby medical and teaching are deemed as the best professions to situate women in public life. The spectrum of regional enrolment by gender situates NWFP, Balochistan, Islamabad, Sindh and Punjab in a sequence of declining masculinity. As for seats of instructions in alternative treatments, both tibb and homeopathy are predominantly masculine professions, particularly the former one. Regional profile of enrolment in the alternative treatment’s seats of learning portrays Sindh and Punjab as the most preferred pastures of its practitioners. The relevant figures are provided in Table No.4.6 Table-4.5 Number of Medical Colleges by Gender and Area 2003-04
Medical Tibb Homeopathic
Region
Total
Female
Male
Total
Female
Male
Total
Female
Male
Pakistan 30 2 28 28 1 27 106 4 102 Punjab 17 1 16 23 1 22 89 4 85 Sindh 4 1 3 4 - 4 9 - 9 NWFP 7 - 7 - - - 6 - 6 Balochistan 1 - 1 1 - 1 2 - 2 Islamabad 1 - - - - - - - - Source: Provincial Bureau’s of Statistics Table-4.6 Enrolment of Medical Colleges by Gender and Area 2003-04
Medical Region Total Female Male
Pakistan 19303 10709 8594 Punjab 11406 6340 5066 Sindh 5044 3374 1670 NWFP 2279 757 1522 Balochistan 303 114 189 Islamabad 271 124 147
Source: Provincial Bureau’s of Statistics 4.4.2 Teaching Staff in Medical Colleges
The teaching community of medical colleges is predominately masculine. Only one fourth (781) of the total strength (3031) are women teachers. Regions also reflect similar disparities with Balochistan constituting the extreme case. It seems that medically qualified women, being extremely short in supply, do not find teaching as economically preferred option in the face of rising demand for women medical practitioners. The relevant figures may be seen in the Table No.4.7 Table-4.7 Teaching Staff of Medical Colleges by Gender and Area 2003-04
Medical Region
Total Female Male Pakistan 3031 781 2250 Punjab 1621 496 1125 Sindh 578 137 441 NWFP 575 111 464 Balochistan 160 13 147 Islamabad 97 24 73
Source: Provincial Bureau’s of Statistics
4.5 Disabled Population A person is generally classified as disabled who suffers from physical or mental defects whether natural or acquired which create major hindrances in the participation of normal day to day activities. The categories of disability include blind, deaf and dumb, crippled, mentally retarded, Insane and others like multi handicapped due to old age. In Pakistan, focused initiatives have seldom been taken to collect social statistics, particularly on the prevalence and magnitude of impairment and disability. However, on the basis of information collected through population censuses of 1961, 1972, 1981, 1998 and other relevant surveys government has setup a number of institutions for the welfare of disabled community. According to population census1981 rural areas account for 56.7 percent women and 43.3 percent men out of the total disableds vis a vis 42.0 percent and 58.0 percent of census-1998. Similarly, urban areas fared at 50.9,49.1 percent and 41, 58.9 percent in the referred consecutive censuses. . The information pertains only to the blind, deaf and dumb, crippled, mentally retarded and other persons with related impairment. The comparative data reflect that urban women are more shielded. The obverse situation prevails for men. 4.5.1 Blind In 1981 census, there were 66.9 percent rural blind women as compared to 33.1 percent blind men. The

23
comparative figures for urban areas were 65.5 and 34.5 percent. In 1998 there were 45.6 percent blind women and 54.4 percent blind men in rural areas, whereas urban blind accounted for 43.9 and 56.1 of women and men respectively. Since blindness has causal nexus with nutrition and environment, its higher incidence in women puts questions mark on the status of female baby in the scheme of social preferences. 4.5.2 Deaf and Dumb The census 1981finds 61.4 and 38.6 percent of the deaf and dumb women and men in rural areas as compared to 43 percent deaf and 56.9 percent census 1998. For urban areas, the comparative figures for the referred consecutive censuses fare at 61.2, 38.8 percent and 43.0, 57.0 percent. The observation made in case of blindness, vide 4.51, again resonate in affirmation. 4.5.3 Crippled The census 1981 finds ruralites accounting for 49.7 percent of crippled women and 50.3 percent crippled men as compared to 39.5, 60.5 percent in census 1998. The comparative figures for urban areas in the referred consecutive censuses stand 44.9, 55.1 percent and 37.3, 62.7 percent respectively.
Seeing through gender prism, it appears that, factors entailing crippling impairment, tend to concentrate in those activities which have traditionally been the men’s preserve. 4.5.4 Mentally retarded As per census 1981, ruralite women and men account respectively for 49.2 and 50.8 percent of the mentally retarded persons viz a viz 46.3 and 53.7 percent of 1998. The comparative figure for urban areas in the consecutive census stand as 39.8 vs 45.9 percent and 60.2 vs 54.1 percent respectively. Urban localities appear to be less congenial for the relatively more emotional brains of the fair sex. 4.5.5 Other disabled Rural women and men fare respectively at 52 and 48 percent of other disabled in census 1981 as compared to 42.2 and 59.8 percent of census 1998. The comparative figure for urban areas in the consecutive census stand as 41.6 vs 39.4 percent and 58.4 vs 60.6 percent. Since men are answerable to the whole range of residual assignments, they are more exposed to the hazards of unspecific disablement as compared to women..
Table-4.8 Percentage Distribution Of Disabled Population by Gender And Urban - Rural Areas, 1981and
1998 Pakistan
1981 1998
Rural Urban Rural Urban
Nature of Disability
Women Men Women Men Women Men Women Men
All disabled Blind Deaf & dumb Crippled Mentally Retarded Insane Others
56.7 66.9 61.4 49.7 49.2 45.9 52.0
43.3 33.1 38.6 50.3 50.8 54.1 48.0
50.9 65.5 61..2 44.9 39.8 41.0 41.6
49.1 34.5 38.8 55.1 60.2 59.0 58.4
42.0 45.6 43.1 39.5 46.3 44.1 42.2
58.0 54.4 56.9 60.5 53.7 55.9 59.8
41.1 43.9 43.0 37.3 45.9 42.0 39.4
58.9 56.1 57.0 62.7 54.1 58.0 60.6
Source: Population Census Organization (PCO), Government of Pakistan

24
25
CHAPTER 5 5. Family Planning
This chapter briefly presents synopsis on Family Planning relating to service delivery facilities, man power and gender based level of knowledge, attitude, ever and current use of contraceptives.
5.1 Programme
Family planning had made its beginning in Pakistan as early as 1953 in the private sector by a non-government organization (NGO). The Family Planning Association of Pakistan (FPAP). The Government of Pakistan allocated Rs.5 million in the Ist plan (1955-60) as a grant to this organization to provide contraceptive advice and services. The Population Welfare Programme as a regular governmental programme is of second Five Year Plan 1960-65 vintage. It proceeded modestly during 1960 - 1987. However significant progress was achieved during seventh and eight Five Year Plans when the Contraceptive Prevalence Rate increased from 9 percent of in 1984-87 to 24.0 percent during 1996-97. During 1994-95, 90.5 percent of currently married women reported contraceptive knowledge of one modern method, which increased to 93.4 percent in 1996-97. It hovers around the same level as the figure of 93.6 percent during 2003 (Table 5.1) bears it out. The International Conference on Population and Development (ICPD) held in Cario in 1994 recommended to promote family planning as an integral part of reproductive health and not in isolation. The Plan of Action defined the reproductive health as a state of complete physical, mental and social being and not merely the absence of disease or infirmity. This clearly implies that reproductive health services have to be integrated with family planning and these services to be made accessible and affordable to all couples have right to have safe methods of their choice. Under the umbrella of new concept of reproductive health, all service outlets of Health Departments and Population Welfare including NGOs and Social Marketing of Contraceptives have now been formulating their strategies to promote family planning as an important element among other parameters of reproductive health. These strategies altogether would have hopefully been gaining ground to enhance contraceptive use during
the Ninth Five Year Plan 1998-2003, as there is now an evidence that a dent has been made in fertility. 5.2 Service Delivery Facilities The service delivery outlets under the Population Welfare Programme are (i) Family Welfare Centres (ii) Reproductive Health Service Centres (iii) Mobile Service Units and (iv) Village Based facilities to outreach currently married women throughout the country. The husbands may and do also accompany their wives to these facilities. The dispensation of contraceptives services varies facility to facility. The Family Welfare Centres provide contraceptive delivery on cafeteria system i.e. IUD insertion, oral pill, condom, injection and also provide treatment for minor ailment and to some extent, MCH services. The reproductive health services provide mainly female sterilization, in addition to IUD insertion, oral pill, injectable and condom apart from counselling and treatment for infertility. About 30,000 commercial outlets of Social Marketing and 750 service outlets under NGOs are also dispensing contraceptives. The Mobile Service Units provide services on the basis of out reach approach as per their scheduled visits in the vicinity. In addition to dispensation of contraceptives, medicines are also provided for minor ailment to the desiring persons and do take care of follow-up and improvement of quality of service provided through Family Welfare Centres. 5.3 Knowledge of Contraceptive
Methods The ratio among currently married women who reported knowledge of at least one contraceptive method fared at 90.7 percent in 1994-95, which increased to 94.3 percent in 1996-97. The figure for the year 2003 ( 94.1 percent) hover in the same vicinity . Similarly, the percentage of currently married women who reported knowledge of one modern method increased from 90.5 of 1994-95 to 93.4 in 1996-97 and 93.6 percent during 2003 (Table 5.1). It appears that the complete diffusion of the knowledge of contraceptive needs to catalyze universal access to attendant services has been achived.

26
Table-5.1 Percentage of Currently Married Women Who Reported Knowledge of Contraceptives Methods, Pakistan and Provinces
Knowledge of Contraceptive Method
Region/Province
Knowledge of at Least One
Method
Knowledge of One
Modern Method
1994-95 Pakistan Punjab Sindh NWFP Balochistan 1996-97 Pakistan Punjab Sindh NWFP Balochistan 2003 Pakistan Punjab Sindh NWFP Balochistan
90.7 93.2 87.5 97.7 57.9
94.3 94.3 95.4 97.9 77.9
94.1 97.5 87.5 95.6 88.7
90.5 93.0 87.3 97.7 57.2
93.4 93.3 95.2 97.7 74.8
93.6 97.3 86.4 94.9 88.1
Source: National Institute of Population Studies
5.4 Ever Using Contraceptives by Methods
According to National Institute of Population Studies, percentage of ever users of any modern method stood at 36.0 during 2003.Provincially, Balochistan forms the loose end of the continuum. However, the figures of the most urbanized province of Sindh do cast some damper on the expected nexus between city culture and demand for contraceptive services. The percentage of users of Condom, Pill, Injection, IUD, Female Sterilization, Male Sterilization, any Traditional Method, Periodic Abstinence, Withdrawal and any Method was 13.1, 10.2, 10.1, 9.4, 7.7, 0.2, 12.9, 5.4, 9.4 and 41.8 respectively(Table 5.2). A common strand is implicit in the relative percentages; there is an inherent choice for reversible modality.
Table 5.2 Proportion of Respondents Ever Using Contraceptives by Methods, Pakistan and Provinces 2003
Percent of Ever Users
Methods Used
Pakistan
Punjab
Sindh
N.W
.F.P
Balochistan
2003 Any Modern Method 36.0 38.0 32.8 39.3 20.9
Condom 13.1 14.0 13.3 12.3 4.9
Pill 10.2 8.9 10.4 15.7 6.9
Injection 10.1 9.5 9.0 16.0 4.9
IUD 9.4 12.4 5.8 5.9 4.6 Female Sterilization 7.7 9.1 6.4 6.5 3.4 Male Sterilization 0.2 0.3 0.1 - - Used Any traditional Method 12.9 15.6 9.2 12.1 5.8 Periodic Abstinence 5.4 7.0 2.1 7.3 0.3
Withdrawal 9.4 10.5 7.3 10.0 5.6 Any Method 41.8 44.8 37.9 43.6 24.9 Source: National Institute of Population Studies 5.5 Use of Specific Contraceptive
Methods among Currently Married Women
National Institute of Population Studies finds that during 2003 one fourth of the currently married women did use any specific method. The percentage of current users of Condom, Pill, Injection, IUD, Female Sterilization, Male Sterilization, any Traditional Method, Periodic Abstinence, Withdrawal and any Method was 6.4, 3.1, 3.4, 4.4, 7.5, 0.2, 6.8, 1.7, 4.9, and 32.1 respectively (Table 5.3).As mentioned earlier, the choice for reversible methods particularly on the part of women is also evident. Similarly, the observation regarding Sindh and Balochistan hold in this case as well.

27
Table 5.3 Percentage of Currently Using Specific
Methods, Among Currently Married Women, Pakistan and Provinces 2003
Percent of Ever Users
Methods Used
Pakistan
Punjab
Sindh
N.W
.F.P
Balochistan
Any Modern Method 25.2 26.1 25.2
25.2 15.1
Condom 6.4 6.3 8.2 4.5 2.6
Pill 3.1 2.1 3.7 5.6 2.6
Injection 3.4 2.7 3.9 5.3 2.9
IUD 4.4 5.4 3.2 3.5 3.5 Female Sterilization 7.5 9.0 5.8 6.0 3.5 Male Sterilization 0.2 0.2 0.2 0.0 0.0 Used Any traditional Method 6.8 7.8 6.4 5.1 3.9 Periodic Abstinence 1.7 2.3 0.7 1.6 0.4
Withdrawal 4.9 5.1 5.5 3.3 3.5 Any Method 32.1 33.9 31.8 30.3 19.0 Source: National Institute of Population Studies 5.6 Awareness of Modern Methods
Among Currently Married Women by Place of Residence, Pakistan, 2000-01 and 2003.
Queerly, national scene reflects that the awareness of modern methods by place of residence appears to have curved down during the triennial period 2000-03. The two eastern, more populous, urbanized and prosperous provinces follow the national pattern where as the two more rural, less populous and less endowed western provinces reflect an exception. It appears that instinctive urge to proliferate as a consequence of poverty has been giving way to calculated, socially palatable and humane approach of containing population growth.
Table 5.4 Awareness of Modern Methods Among Currently Married Women by Place of
Residence, Pakistan and Provinces 2000-01 2003
Province
All A
reas
Urban A
reas
Rural A
reas
All A
reas
Urban A
reas
Rural A
reas
Pakistan 95.0 97.3 93.9 93.6 94.6 93.2
Punjab 97.8 98.9 97.2 97.3 98.3 96.9
Sind 96.9 96.3 97.5 86.4 89.0 84.0
NWFP 91.6 92.6 91.4 94.9 95.8 94.8
Balochistan 61.7 92.5 54.2 88.1 97.8 85.5
Source: National Institute of Population Studies 5.7 Awareness of Modern Methods
Among Currently Married Women by Educational Attainments, Pakistan, 2000-01 and 2003.
The level of educational attainment and awareness of modern method do not exhibit a clear functional relationship. It appears that currently married women, are equally exposed to the flow of contraceptive information irrespective of their educational attainment. It implies that society, particularly womenfolk, has well taken the rationale of arresting population growth, though, with a pinch of salt as the fall of percentages over time signifies. And this pinch of salt puts the lack of universal access to the delivery of cheap services into sharp focus.
Table 5.5 Awareness of Modern Methods Among Currently Married Women by Educational Attainment, Pakistan and Provinces Province No
Schooling
Education Upto
Primary Level
Education Upto Primary
and

28
Above 2000-01
Pakistan 93.6 99.1 98.0 Punjab 97.0 99.4 99.1 Sind 96.8 98.5 96.3 NWFP 90.4 98.3 97.6 Balochistan 58.3 98.5 86.2 2003
Pakistan 91.6 97.9 97.6 Punjab 96.3 98.6 99.4 Sind 82.5 96.0 94.1 NWFP 94.0 99.1 99.7 Balochistan
87.0 94.4 98.4
Source: National Institute of Population Studies 5.8 The Percentage of Currently
Married Women Ever Used Any Specific Methods Pakistan, 2000-01 and 2003.
The rising profile of the captioned percentage over the comparative periods hold out promise for containing population growth. The figures also portray an overall tilt in favour of modern methods which underscores that recourse to contraceptive services is made more as a part of conjugal life and less as an expedient way out of unforeseen compulsions. Table 5.6 Percentage of Currently Married Women Ever Used Specific Methods, Pakistan and Provinces
Percent of Ever Users
Methods Used
Pakistan
Punjab
Sindh
N.W
.F.P
Balochistan
2000-01
Any Method 40.2 43.3 36.4 40.5 21.3
Modern Method 33.7 35.2 32.8 34.4 18.4
Pill 10.1 8.6 11.2 14.9 7.0
IUD 9.0 11.7 5.1 7.3 3.1
Injection 10.4 9.2 9.7 17.4 5.8
Implant 0.2 0.1 0.1 0.3 0.0
Condom 13.7 16.1 13.9 7.7 4.0 Female Sterilization 6.9 6.8 9.0 5.1 3.3
Male Sterilization 0.1 0.2 0.0 0.0 0.0 Used Any traditional Method 17.1 21.2 12.3 13.2 6.5 Periodic Abstinence 6.0 5.7 7.2 6.2 3.0
Withdrawal 13.4 17.6 6.7 10.8 3.8
Others 1.0 1.2 1.0 0.6 0.4
2003
Any Method 42.8 46.1 38.6 44.1 25.3
Modern Method 36.8 39.1 33.4 39.7 21.1
Pill 10.4 9.1 10.6 16.0 6.9
IUD 9.6 12.8 5.8 6.0 4.7
Injection 10.3 9.8 9.3 16.3 4.9
Implant 0.3 0.4 0.2 0.1 -
Condom 13.4 14.4 13.5 12.3 5.0 Female Sterilization 7.9 9.4 6.5 6.4 3.5 Male Sterilization 0.2 0.3 0.1 - - Used Any traditional Method 13.2 16.0 9.3 12.3 5.9 Periodic Abstinence 5.5 7.2 2.1 7.3 0.3
Withdrawal 9.6 10.8 7.5 10.2 5.7
Others 0.5 0.6 0.7 0.0 0.2 Source: National Institute of Population Studies
5.9 Percentage Distribution of Currently Married Women by Knowledge of Specific Method by Type and Areas

29
As observed earlier in the case of similar tabulations, married women reflect an inherent bias in favour of reversible methods. Of late, the relatively strenuous method of implant and socially non palatable method of male sterilization have been gaining ground with the passage of time. However, the spectacle of falling number during the comparative periods poses big question mark. Perhaps the same growing lack of access to/affordability of contraceptive services holds the explanation. This contention is also evidenced by the declining expenditure on social sector. Table 5.7 Percentage Distribution of Currently Married Women by Knowledge of Specific Method by Type and Area
2000-01 2003
Methods
Urban
Rural
Total
Urban
Rural
Total
Pill 93.6 89.9 91.1 92.7 89.5 90.6 IUD 88.0 82.6 84.4 87.8 78.4 81.5 Injection 92.8 88.9 90.2 90.5 86.5 87.8 Implant 31.9 14.0 19.9 36.4 22.3 26.9 Condom 84.5 62.7 69.9 77.9 57.7 64.3 Female Sterilization 91.7 87.3 88.8 88.1 84.8 85.9 Male Sterilization 44.9 25.0 31.6 53.4 35.8 41.5 Source: National Institute of Population Studies 5.10 Percentage Distribution of
Currently Married Women by Knowledge of Supply Source, Specific Methods by Type, Pakistan and Provinces
The profile of the captioned knowledge fares less than exhaustive. The word “source” holds explanation as it brings forth the universality of access to and affordability of contraceptive services into sharp focus. Mercifully, the figures reflect an asent over time led by
increasing recourse to relatively more strenuous (implant) and socially less palatable (male sterilization) methods. As for provinces, Balochistan has of late been moving from the loose end to the tight segment of the continuum made up of other brothers in federation. Table 5.8 Percentage Distribution of Currently Married Women by Knowledge of Supply Source Specific Method by Type, Pakistan and Provinces
Percent of Ever Users
Methods Used
Pakistan
Punjab
Sindh
N.W
.F.P
Balochistan
2000-01 Pill 76.5 76.3 79.6 80.0 49.4 IUD 69.8 73.8 69.8 64.4 38.0 Injection 75.1 75.7 77.8 77.8 44.3 Implant 16.3 14.5 26.0 9.1 7.9 Condom 57.6 63.1 52.1 52.9 36.1 Female Sterilization 76.4 79.1 80.8 71.1 36.8 Male Sterilization 25.2 32.0 12.7 15.3 20.8 2003 Pill 77.4 82.8 63.1 84.1 74.7 IUD 69.6 79.3 54.5 65.6 57.2 Injection 75.2 81.3 60.3 81.8 68.7 Implant 21.8 24.9 24.2 10.7 7.1 Condom 54.6 62.1 43.1 49.4 50.0 Female Sterilization 73.2 81.2 61.1 72.6 51.5 Male Sterilization 33.5 49.4 14.2 15.4 16.4 Source: National Institute of Population Studies
CHAPTER - 6
This chapter mainly focuses on education and education related issues such as literacy, enrolment,
educational attainment, growth of educational institutions and teachers etc.

30
6.1 Literacy level
The consecutive censuses find the overall literacy rate for the population 10 years and above an increasing function of time. However, considerable part of population is still illiterate as the figure of census 1998
(44%) bears out. As for gender differentials, men’s better halves have been proceeding ahead one and half times faster to catch up with them. In so far as this contrast is sharper in rural than urban areas it appears that socio-cultural constraints lurking behind rural-urban divide are fast relenting with the passage of time, particularly, from the perspective of gender equity.
Fig. 6. 1 Literacy Rates by Gender and Urban-Rural Areas, Pakistan 1961-1998
21.3
30.937.3
55.2
44.949.9
55. 3
70
2.2 4.7 7.3
20.11822.6
26.2
46.4
0
10
20
30
40
50
60
70
80
1961 1972 1981 1998
U rban Female Urban M ale Rural Female Rural M ale
For the most recent and widely accepted measure of literacy level, Labour Force Survey of Pakistan is referred. The Survey’s historical data reflects consistent ascent in the level of literacy, more for women than men. Table 6.2 Literacy Rates (%)
Area/Sex 1999-00 2001-02 2003-04 Pakistan
Total 46.5 50.0 51.6 Male 59.0 62.2 63.7 Female 33.3 36.9 39.2
Rural Total 36.1 40.5 41.6 Male 51.1 55.0 56.3
Table-6.1 Literacy Rates of Population (10 years and above) by Gender and Urban - Rural Areas, Pakistan (Percent)
Urban Rural Total
Years Female Male Both Sexes
Female Male Both Sexes
Female Male Both Sexes
1961
1972
1981
1998
21.3
30.9
37.3
55.2
44.9
49.9
55.3
70.0
34.8
41.5
47.1
63.1
2.2
4.7
7.3
20.1
18.0
22.6
26.2
46.4
10.6
14.3
17.3
33.6
6.7
11.6
16.0
32.0
25.1
30.2
35.1
54.8
16.7
21.7
26.2
43.9
Source: Census Reports 1961, 1972, 1981 and 1998.

31
Female 20.6 25.4 26.6 Urban
Total 67.4 67.8 69.7 Male 74.5 75.5 76.5 Female 59.6 29.3 62.5
Source:- Labour Force Survey of Pakistan 6.2 Educational Infrastructure - Public
Schools 6.2.1 Primary Schools Primary schools are the main determinant of literacy level as well as a great social equalizer. The gender symmetrical expansion in their numbers ushers in deepening of social capital. The boys and girls schools make a secularly ascending time series. Mixed schools-due to their transient status i.e. a mixed schools is likely to assume gender tag if enrolment tilts in favour of a gender-form a bumpy trajectory through time though the crests are getting more numerous and elongated. Table 6.3 Number of Educational Institutions
Number of Primary School Year Male Female Mixed Total
1992-93 80291 33080 7145 120516
1993-94 81089 34160 7538 122787
1994-95 84199 35917 7652 127768
1995-96 80262 36779 13211 130252
1996-97 71885 34722 28889 135496
1997-98 75493 39492 18668 133653
1998-99 77882 41436 16669 135987
1999-00 73463 41589 16727 131779
2000-01 73541 42387 16599 132527
2001-02 73520 43018 16578 133116
2002-03 73722 43321 16984 134027
2003-04 73783 43245 16924 133952 Source:- Academy of educational Planning & Management, Islamabad
Fig . 6 . 2 ( a) Number of Primary Schools by Gender , Pakistan 1992 - 93 - 2003 - 2004
0
10000
20000
30000
40000
50000
60000
70000
80000
90000
1992-93
1993-94
1994-95
1995-96
1996-97
1997-98
1998-99
1999-00
2000-01
2001-02
2002-03
2003-04
Male Female Mixed
Fig. 6.2 (b) Percent Distribution of Primay Schools by Gender, Pakistan 2003-04
55.132.3
12.6
Male Female Mixed
6.2.2 Middle Schools At the out-set, the time series of middle school is, more or less, akin to that of primary schools. However, the number have been rising more consistently. Similarly, mixed schools traverse a bumpy ride through the tabular period. Longitudinally, the number of middle schools speaks of gravitation towards gender poise. Table 6.4 Number of Educational Institutions
Number of Middle School Year Male Female Mixed Total
1992-93 4996 4030 575 9601
1993-94 4901 4066 731 9698
1994-95 5051 4322 268 9641
1995-96 5130 4355 284 9769
1996-97 5127 4259 1184 10570

32
Number of Middle School Year Male Female Mixed Total
1997-98 5522 4766 798 11086
1998-99 5853 5120 499 11472
1999-00 6150 5494 441 12085
2000-01 6323 5777 429 12529
2001-02 6595 6154 451 13200
2002-03 6778 6439 519 13736
2003-04 6739 6426 503 13668 Source:- Academy of educational Planning & Management, Islamabad
Fig. 6.3 (a) Number of Middle Schools by Gender, Pakistan 1992-93 to 2003-04
0
1000
2000
3000
4000
5000
6000
7000
8000
1992-93
1993-94
1994-95
1995-96
1996-97
1997-98
1998-99
1999-00
2000-01
2001-02
2002-03
2003-04
Male Female Mixed
Fig. 6.3 (b) Percent Distribution of Middle Schools by Gender, Pakistan 2003-04
49.3
47.0
3.7
Male Female Mixed
6.2.3. High Schools Longitudinally, number of high schools follows the over all pattern of primary and secondary schools. Both boys and girls schools have, more or less, been expanding during the tabular period. However, the later fare at less than half of the former at any point of time. Table 6.5 Number of Educational Institutions
Number of High School Year Male Female Mixed Total
1992-93 5111 2113 240 7464
1993-94 5291 2264 280 7835
1994-95 5534 2376 168 8078
1995-96 5505 2306 190 8001
1996-97 5420 2290 453 8163
1997-98 5640 2390 370 8400
1998-99 5832 2512 287 8631
1999-00 5757 2498 254 8509
2000-01 5827 2578 247 8652
2001-02 5805 2557 248 8610
2002-03 5960 2632 255 8847
2003-04 5937 2684 247 8868 Source: Academy of Educational Planning &
Management, Islamabad. Fig. 6.4 (a) Number of High Schools by
Gender, Pakistan 1992-93 to 2003-04
0
1000
2000
3000
4000
5000
6000
7000
1992-93
1993-94
1994-95
1995-96
1996-97
1997-98
1998-99
1999-00
2000-01
2001-02
2002-03
2003-04
Male Female Mixed
7

33
Fig. 6.4 (b) Number of High Schools by Gender, Pakistan 1992-93 to 2003-04
66.9
30.3
2.8
Male Female Mixed
6.2.4. Arts and Science Colleges After discounting for the “headstartness” of the time series of boys colleges, longitudinal trajectory of girls colleges do not betoken gender skewness. Arts and science colleges have been increasing for both sexes which implies that system’s inhibitions to embrace gender equity relent a lot in the domain of tertiary education. It may be due to society’s subliminal realization that tertiary education, owing to high threshold of entry in terms of resources, is inherently preserve of privileged classes. Table 6.6 Number of Arts and Science Colleges
Arts and Science Colleges Year Total Female Male
1990-91 612 222 390
1991-92 633 233 400
1992-93 649 243 406
1993-94 651 248 403
1994-95 678 257 421
1995-96 715 276 439
1996-97 737 287 450
1997-98 787 309 478
1998-99 840 339 501
1999-00 889 358 531
2000-01 916 380 536
2001-02 939 394 545
2002-03 964 414 550
2003-04 1066 458 608 Source:- Provincial Bureau’s of Statistics
6.2.5 Number of Professional Colleges
Professional colleges (table 6.6) depict an entirely
male-led growth over time. Women colleges traverse a
nigh flat and wavering trajectory. This scenario owes to
a number of socio-cultural and economic factors;
preeminence of nuptial bond as the foremost concern of
women which translates into weak clientele/demand for
women colleges, weak demand for women
professionals due to their culturally reinforced
preoccupation with traditional role as housewives and,
of course, an attitudinal aversion to savour women’s
economic independence. Time series on the number of
universities (table-6.7) reflect the same pattern with
more intensity to give credence to explanatory words
jotted afore in the case of professional colleges.
Table 6.7 Number of Professional Colleges Number of Professional Colleges Year
Total Female Male
1990-91 99 8 91
1991-92 139 9 130
1992-93 147 9 138
1993-94 165 10 155
1994-95 167 10 157
1995-96 260 16 244
1996-97 264 16 248
1997-98 293 19 274
1998-99 308 18 290
1999-00 324 15 309
2000-01 352 18 334
2001-02 374 20 354
2002-03 382 19 363
2003-04 416 20 396 Source:- Provincial Bureau’s of Statistics Table 6.8 Number of Universities
Number of Universities Year Total Female Male

34
1990-91 22 - 22
1991-92 23 - 23
1992-93 23 - 23
1993-94 25 - 25
1994-95 25 - 25
1995-96 25 - 25
1996-97 25 - 25
1997-98 26 1 25
1998-99 26 1 25
1999-00 26 1 25
2000-01 26 1 25
2001-02 29 1 28
2002-03 29 1 28
2003-04* 51 3 48 * Include data of AJK & Northern Area Source:- Concerned Universities
6.3 Enrolment Status- Public Schools Enrolment starts from class I at primary school, to continue up the ladder to higher level. Some time, though, rarely, students are also enrolled in higher classes of primary schools after getting preparatory coaching at home. For enrolment in a primary school, 5 years age is fixed both for girls and boys. 6.3.1 Primary School Enrolment Primary school enrolment forms an evenly rising step function of time. It lost some steam just before the turn of century to regain thereafter. From female male perspective the former have always fared at one half of the latter. However, incipient twenties do reflect a visible trend towards narrowing down of gender differentials in enrolment. Table 6.9 Primary School Enrolments
Thousand Enrolment in Primary Stage (I-V) Year
Male Female Total 1992-93 7329739 3896447 11226186
1993-94 7300545 4222760 11523305
1994-95 7617864 4731235 12349099
1995-96 7736894 4713666 12450560
1996-97 7468604 4606516 12075120
1997-98 7410259 4672670 12082929
1998-99 7424885 4208059 11632944
1999-00 7722844 4757622 12480466
2000-01 7540396 4889377 12429773
Enrolment in Primary Stage (I-V) Year Male Female Total
2001-02 7525134 5062966 12588100
2002-03 7722583 5309334 13031917
2003-04 8097218 5570266 13667484 Source:- Academy of educational Planning & Management, Islamabad
Fig 6.5 Number of Enrolment in Primary Schools by Gender, Pakistan 1992-93 to 2003-04
0
1000000
2000000
3000000
4000000
5000000
6000000
7000000
8000000
9000000
1992-9
3
1993-94
1994-9
5
1995-96
1996-97
1997-9
8
1998-99
1999-0
0
2000-0
1
2001-02
2002-0
3
2003-04
Primary Stage (I-V)( In th
ousa
nd
Male Female
6.3.2 Middle and High School Enrolments Middle school enrolment form a segmented trajectory. A rising early nineties, flat later nineties and an ascending incipient twenties. As for boys and girls enrolment in the same periods, the former’s trajectory remained more than two times higher than that of the latter’s. This gulf began to narrow down in mid nineties continued as such steadily in latter nineties and nascent twenties. In general, pattern of enrolment by gender is in sync with that of the overall enrollment. As middle school enrolment later on constitutes almost all of high school enrolment, the latter’s profile both in toto and by gender is akin to that of the former’s. Table 6.10 Middle School Enrolments
Thousand Enrolment in Middle Stage (VI-VII) Year
Male Female Total 1992-93 1866115 823958 2690073
1993-94 1966182 918761 2884943
1994-95 2210029 1102207 3312236
1995-96 2023742 975852 2999594
1996-97 2027153 1033496 3060649
1997-98 1986441 1047138 3033579
1998-99 1998619 1081646 3080265

35
Enrolment in Middle Stage (VI-VII) Year Male Female Total
1999-00 1973941 1099997 3073938
2000-01 1559121 1288496 2847617
2001-02 1795749 1068173 2863922
2002-03 1821483 1091491 2912974
2003-04 1907113 1171104 3078217 Source: Academy of Educational Planning & Management,
Islamabad
Fig. 6.6 Middle School Enrolment by Gender, Pakistan 1992-93 to 2003-04
0
500000
1000000
1500000
2000000
2500000
1992-93
1993-94
1994-95
1995-96
1996-97
1997-98
1998-99
1999-00
2000-01
2001-02
2002-03
2003-04
Middle Stage (VI-VIII)
(In th
ousa
nd)
Male Female
Table 6.11 High School Enrolments
Thousand
Enrolment in High Stage (IX-X) Year
Male Female Total
1992-93 716450 291879 1008329
1993-94 789247 343017 1132264
1994-95 895681 420421 1316102
Enrolment in High Stage (IX-X) Year
Male Female Total
1995-96 840980 368367 1209347
1996-97 862594 396983 1259577
1997-98 845904 419796 1265700
1998-99 856124 439985 1296109
1999-00 860737 450370 1311107
2000-01 718937 531004 1249941
2001-02 750773 492658 1243431
2002-03 743368 498265 1241633
2003-04 841488 499192 1340680 Source: Academy of Educational Planning & Management,
Islamabad
Fig. 6.7 Number of Enrolment in High Schools by Gender, Pakistan 1992-93 to
2003-04
0
100000
200000
300000
400000
500000
600000
700000
800000
900000
1000000
1992
-93
1993
-94
1994
-95
1995
-96
1996
-97
1997
-98
1998
-99
1999
-00
2000
-01
2001
-02
2002
-03
2003
-04
High Stage (IX-X)
(In th
oush
and)
Male Female
6.3.3 Art and Science College Enrolments Art and Science College enrolment, both into toto and by gender, exhibit a steady ascent during nineties and incipient twenties. However, girls enrolment which fared at one half of boys enrolment during early nineties, has steadily been catching up in latter nineties and unfurling twenties
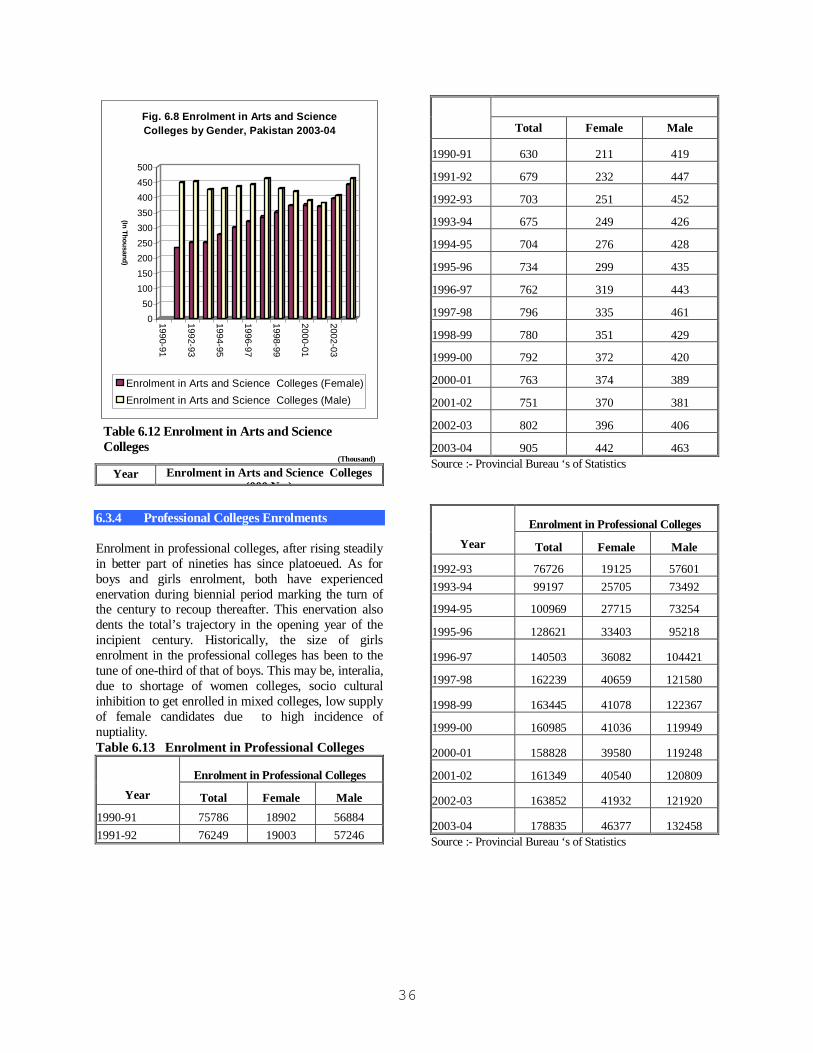
36
050
100150200250300350400450500
(In Thousand)
1990-91
1992-93
1994-95
1996-97
1998-99
2000-01
2002-03
Fig. 6.8 Enrolment in Arts and Science Colleges by Gender, Pakistan 2003-04
Enrolment in Arts and Science Colleges (Female)Enrolment in Arts and Science Colleges (Male)
Table 6.12 Enrolment in Arts and Science Colleges
(Thousand) Year Enrolment in Arts and Science Colleges
(000 No.)
Total Female Male
1990-91 630 211 419
1991-92 679 232 447
1992-93 703 251 452
1993-94 675 249 426
1994-95 704 276 428
1995-96 734 299 435
1996-97 762 319 443
1997-98 796 335 461
1998-99 780 351 429
1999-00 792 372 420
2000-01 763 374 389
2001-02 751 370 381
2002-03 802 396 406
2003-04 905 442 463 Source :- Provincial Bureau ‘s of Statistics
6.3.4 Professional Colleges Enrolments Enrolment in professional colleges, after rising steadily in better part of nineties has since platoeued. As for boys and girls enrolment, both have experienced enervation during biennial period marking the turn of the century to recoup thereafter. This enervation also dents the total’s trajectory in the opening year of the incipient century. Historically, the size of girls enrolment in the professional colleges has been to the tune of one-third of that of boys. This may be, interalia, due to shortage of women colleges, socio cultural inhibition to get enrolled in mixed colleges, low supply of female candidates due to high incidence of nuptiality. Table 6.13 Enrolment in Professional Colleges
Enrolment in Professional Colleges Year Total Female Male
1990-91 75786 18902 56884 1991-92 76249 19003 57246
Enrolment in Professional Colleges Year Total Female Male
1992-93 76726 19125 57601 1993-94 99197 25705 73492
1994-95 100969 27715 73254
1995-96 128621 33403 95218
1996-97 140503 36082 104421
1997-98 162239 40659 121580
1998-99 163445 41078 122367
1999-00 160985 41036 119949
2000-01 158828 39580 119248
2001-02 161349 40540 120809
2002-03 163852 41932 121920
2003-04 178835 46377 132458 Source :- Provincial Bureau ‘s of Statistics

37
Fig. 6.9 Enrolment in Professional Colleges by Gender, Pakistan 2002-03
0
50000
100000
150000
200000
1990-9
1
1991-9
2
1992-9
3
1993-9
4
1994-9
5
1995
-96
1996
-97
1997
-98
1998
-99
1999
-00
2000
-01
2001
-02
2002-03
Total Female Male
6.3.5 Universities Enrolment University enrolment follows the dynamics of college enrolment. It has been rising during nineties and unfurling twenties save a little enervation in a couple of years both proceeding and proceeding the biennial period marking the turn of century. Female enrolment fared at less than one-fourth of the males’s gradually rose to figure at one half as much. Boys enrolment has been proceeding faster than girls’s. Ala total enrolment, male and female enrolment also reflect enervation on a couple, though a lead, points of time. Table 6.14 Enrolment in Universities
Enrolment in Universities Year Total Female Male
1990-91 61857 11667 50190 1991-92 65944 12727 53217 1992-93 68301 14856 53445 1993-94 77119 19342 57777 1994-95 80651 21174 59477 1995-96 82955 23105 59850 1996-97 91883 25050 66833 1997-98 93780 24848 68932 1998-99 91637 25469 66168 1999-00 114010 27369 86641 2000-01 124944 36699 88245 2001-02 117863 39682 78181 2002-03 126870 43668 83202 2003-04* 218275 83127 135148
* Include data of AJK & Northern Area universities. Source:-Concerned Uviversities
Figure 6.4(g) Enrolment in Universities by Gender, Pakistan
0
20000
40000
60000
80000
100000
120000
140000
1990-91
1992-93
1994-95
1996-97
1998-99
2000-01
2002-03
Total Female Male
6.4 Teaching Staff-Public Schools 6.4.1 Primary School Teachers Number of teachers have been waving ahead though with minor amplitude. From gender prism, the ordinates constituting female series have consistently been faring at almost one half of that of males’s. The gender specific series has been proceeding with same pace throughout the tabulated period.
Table 6.15 Number of Primary School Teachers Year
Number of Primary School Teachers

38
Male Female Total 1992-93 202476 96336 298812
1993-94 212087 109629 321716
1994-95 219131 114461 333592
1995-96 208406 109306 317712 *
1996-97 211112 111877 322989
1997-98 219442 120503 339945
1998-99 234533 124694 359227
1999-00 216788 115234 332022
2000-01 207763 122897 330660
2001-02 212045 119753 331798
2002-03 222463 124758 347221
2003-04 210857 119182 330039 * Adjusted for Balochistan Source:- Academy of educational Planning & Management,
Islamabad
Fig 6.9 Number of Primary School Teachers by Gender Pakistan 1992-93 to 2003-04
0
50000
100000
150000
200000
250000
1992
-93
1993
-94
1994
-95
1995
-96
1996
-97
1997
-98
1998
-99
1999
-00
2000
-01
2001
-02
2002
-03
2003
-04
(In th
ousa
nd)
Male Female
6.4.2 Middle School Teachers The number of middle school teachers show a mixed ascent during the period. The difference between gender specific series has been diminishing through the passage of time. Its seems that availability of qualified female teachers is getting as numerous as that of males.
Table 6.16 Number of Middle School Teachers
Number of Middle School Teachers Year Male Female Total
1992-93 39982 31836 71818
1993-94 40436 39937 80373
1994-95 47991 38408 86399
1995-96 49405 37807 87212 *
1996-97 45861 38900 84761
1997-98 45796 42715 88511
1998-99 46307 43395 89702
1999-00 49634 45615 95249
2000-01 52229 47877 100106
2001-02 59658 55371 115029
2002-03 57783 57661 115444
2003-04 56927 52400 109327 * Adjusted for Balochistan Source:- Academy of Educational Planning & Management, Islamabad
Fig. 6.10 Number of Middle School Teachers by Gender, Pakistan 1992-93 to 2003-04
0
10000
20000
30000
40000
50000
60000
70000
1992
-93
1993
-94
1994
-95
1995
-96
1996
-97
1997
-98
1998-99
1999-00
2000-01
2001-02
2002-03
2003-04
(In th
ousa
nd)
Male Female
6.4.3 High School Teachers
The time series of high school teachers ala that of middle school’s portray the same mixed rise during the period. Gender disaggregation reflects the similar

39
pattern. The numbers have generally been rising after the turn of the century. Similarly, the gulf between the number of male and female teachers have been diminishing over the time. Table 6.17 Number of High School Teachers
Number of High School Teachers Year Male Female Total
1992-93 85394 38227 123621
1993-94 115503 55307 170810
1994-95 110062 65719 175781
1995-96 108830 51213 160043 *
1996-97 107518 53190 160708
1997-98 119614 62238 181852
1998-99 101496 51164 152660
1999-00 106755 53299 160054
2000-01 106977 55858 162835
2001-02 114765 53126 167891
2002-03 115175 55333 170508
2003-04 109593 52837 162430 * Adjusted for Balochistan Source:- Academy of Educational Planning &
Management, Islamabad.
Fig . 6.11 Number of High School Teachers by Gender, Pakistan 1992-93 to 2003 -04
0
20000
40000
60000
80000
100000
120000
140000
( In th
ousa
nd
Male Female
6.4.4 College Teachers College teachers has been rising series in the better part of nineties. However, it has since 1997-98 platoeued to spike in 2003-04. It appears that tertiary education has lost a bit steam due, probably, to the combined effect of
IMF’s spearheaded austerity, falling clientele as a sequel to weak prospects of employability and shrinking affordability resulted by rising poverty and scaling down of subsidized education. Gender disaggregation is also patterned similarly. However, the difference between comparative figures of male and female teachers has been narrowing down the chronological lane.
02000400060008000
1000012000140001600018000
1990
-91
1992
-93
1994
-95
1996
-97
1998
-99
2000
-01
2002
-03
Fig. 6.12 Number of College Teachers by Gender, Pakistan 2003-04
Female Male
6.4.5 Professional College Teachers Teachers of professional colleges traverse the time lane through a step function of four distinct, nigh flat segments of early nineties, mid nineties, latter nineties and post nineties. For explanation it can be argued; since tertiary education requires secular planning, its predicatives can not be changed in the short term. Gender disaggregated series mirror the same segmented time trajectories. However, the wide gulf between the time series of male and female teachers endures throughout the tabulated time period to latter’s disfavour. Putative socio-cultural factors can be cited as an explanation in this regard. Table 6.19 Number of Teachers
Number of Teachers in Professional Colleges Year
Total Female Male

40
Number of Teachers in Professional Colleges Year
Total Female Male 1990-91 4544 907 3637 1991-92 4591 913 3678 1992-93 4520 927 3593 1993-94 6494 1381 5113 1994-95 6650 1364 5286 1995-96 7431 1529 5902 1996-97 7852 1574 6278 1997-98 7989 1639 6350 1998-99 8861 1771 7090 1999-00 9043 1765 7278 2000-01 9131 1769 7362 2001-02 9358 2015 7343 2002-03 9841 2107 7734 2003-04 10659 2178 8481
Source:- Provincial Bureau’s of Statistics
Fig. 6.13 Number of Teacher in Professional Colleges by Gender, Pakistan
2002-03
0
1000
2000
3000
4000
5000
6000
7000
8000
9000
1990
-91
1991-9
2
1992
-93
1993
-94
1994-9
5
1995-9
6
1996
-97
1997-9
8
1998-9
9
1999
-00
2000
-01
2001-0
2
2002
-03
Female Male
6.4.6 University Teachers University teachers constitute curvaceous, secularly ascending series. This might be due to the fact that, by virtue of their lofty educational clibre, they are prone to high occupational mobility. Men teachers also traverse the similar trajectory. Women teacher, which fare at one-fourth of the men’s count, form a relatively consistent series, tending to catch up with
that of men’s in post nineties. The expansion of university education indicates that probably, the social inhibition to combined education has of late been relenting fastly.
Table 6.20 Number of Teachers in Universities
Number of Teachers in Universities Year
Total Female Male 1990-91 4744 640 4104 1991-92 4926 674 4252 1992-93 5728 747 4981 1993-94 5217 918 4299 1994-95 5316 939 4377 1995-96 5417 927 4490 1996-97 5162 919 4243 1997-98 5515 976 4539 1998-99 4911 837 4074 1999-00 5914 1174 4740 2000-01 5988 1302 4686 2001-02 5160 1247 3913 2002-03 6180 1375 4805 2003-04* 11404 3137 8267 * Include data of AJK & Northern Areas universities Source:- Concerned Universities
0100020003000400050006000700080009000
1990
-91
1992
-93
1994
-95
1996
-97
1998
-99
2000
-01
2002
-03
Fig. 6.14 Number of University Teachers by Gender, Pakistan 2003-04
Female Male
6.5 Results Statistics

41
6.5.1 Matriculation Examination Comparative result statistics of the years 2003 and 2004 constitute an interesting contrast. The ratio of appeared in the matric Arts group 2003 is equivalent (50%) for either gender whereas fair sex excels over “condescending sex” in pass percentage (62 vs 38). The comparative figures in 2004, with the exception that composition of “appears” is also more feminine, are well nigh in consonance with those of 2003, particularly, in the case of pass percentage. This spectacle reflects an oft-observed but half-accepted reality that, even after discounting for the socio-cultural conditioning, fair sex has an inherent edge in “passionate faculties”. The matrix of comparative figures interchange the cells when it comes for science group. In 2003, “condescending sex” scores higher in both categories of “appeared” (73 vz 27%) and passed (69vz 31%). As if to impart a sense of dejavu, the result statistics of 2004 beget the congruous percentages for “appeared (72 vz 26%) and passed (70 vz 30%). It can be said at the risk of sounding presumptuous that dispassionate faculties tend to be characterized with masculine “lesser half” of homo sapien. As for regional alignment the two western, less urbanized and conservative, provinces provide an exception in the Arts group while, only south eastern province is odd man out in the case of science group. Table 6.21 Summary Result Statistics of Metric
(Arts group) 2003
Appeared Passed
Province Both Sexes
Male
Female
Both Sexes
Male
Female
Islamabad 16267 5735 10532 6949 1215 5734
Punjab 462627 210606 252021 201882 65004 136878
Sindh 55249 18796 36453 29492 9543 19949
NWFP 151956 108440 43516 56238 34556 21682
Balochistan 5489 3398 2091 2388 1434 954G.T.Arts Pakistan 691588 346975 344613 296949 111752 185197Source:-Concerned Board of B.I.S.E
Table 6.22 Summary Result Statistics of Matric (Arts group) 2004
Appeared Passed
Province
Both Sexes
Male
Female
Both Sexes
Male
Female
Islamabad 16869 4604 12265 8872 1747 7125
Punjab 357782 147083 210699 329473 128105 201368
Sindh 54191 20624 33567 35973 12966 23007
NWFP 143063 97135 45928 62652 37390 25262
Balochistan 10707 5764 4943 6550 2985 3565G.T.Arts Pakistan 582612 275210 307402 443520 183193 260327Source:-Concerned Board of B.I.S.E Table 6.23 Summary Result Statistics of Matric (Science group) 2003
Appeared Passed
Province
Both Sexes
Male
Female
Both Sexes
Male
Female
Islamabad 39882 25616 14266 29052 17252 11800
Punjab 379431 288200 91231 223692 156445 67247
Sindh 191853 123156 68697 132907 83103 49804
NWFP 70503 60971 9532 46895 38864 8031
Balochistan 22457 18136 4321 13312 9949 3363 G.T.Science Pakistan 704126 516079 188047 445858 305613 140245 Source:-Concerned Board of B.I.S.E Table 6.24 Summary Result Statistics of Matric (Science group) 2004
Appeared Passed
Province
Both Sexes
Male
Female
Both Sexes
Male
Female
Islamabad 46440 31201 15239 34018 20981 13037
Punjab 374003 270554 103449 358385 256680 101705
Sindh 203661 130011 73650 163089 102889 60200
NWFP 95606 81765 13841 65228 54019 11209
Balochistan 25470 20441 5029 15627 13367 2260 G.T.Science Pakistan 745180 533972 211208 636347 447936 188411 Source:-Concerned Board of B.I.S.E

42
6.5.2 Intermediate Examination (Faculty of Arts and Science)
As to sound epiphanous, men’s better half proves her matier in humanities-the domain of passion meticulousness, and transformation. The percentages of girls and boys in the category of “appeared” (51 vs 49) and “passed” (58 vs 42) in 2003 are proximate to the comparative figures of 2004 i.e (52 vs 48) and (60 vs 40). Pre-engineering or by the same token, engineering, being more exacting in terms of brawn and brain- the spring heads of detached, dispassionate and transactional behavior-appears to be forte of the Adam’s sons. In 2003 boys vis a vis girls constitute the top quartiles whereas girls form the bottom one both in term of “appeared” (82 vs 18%) and “Passed” (82 vz 18%). Fortuitously, the comparative percentages in 2004 viz (83 vs 17) and (82 vs 18) tend to further point up the observation. However it is advisable to take the stock of socio cultural and institutional factors which tend to impede girls in the pursuit of career in engineering fields.
Though, pre-medical as a precursor to career in medical profession, requires both transactional and transformational demeanour, it is the latter trait which determines the mind set and skill profile of a successful practitioner. That is why girls tend to edge ahead of their boy compatriots. The 2003’s percentages of girls and boys in the category of “appeared” (50 vs 50) and “passed” (57 vs 47) in comparison with that of 2004 viz (53 vs 47) and (50 vs50) tend to make the point. Table 6.25 Summary Result Statistics of Intermediate (Arts group ) 2003
Appeared Passed
Province Both Sexes
Male
Female
Both Sexes
Male
Female
Islamabad 25545 12615 12930 11855 4884 6971
Punjab 298299 140189 158110 146682 56458 90224
Sindh 49372 18707 30665 25813 10077 15736
NWFP 69969 42735 27234 25249 13793 11456
Balochistan 14441 10150 4291 7092 4725 2367 G.T.Arts Pakistan 457626 224396 233230 216691 89937 126754 Table 6.26 Summary Result Statistics of Intermediate (Pre-Engineering group) 2003
Province Appeared Passed
Both Sexes
Male
Female
Both Sexes
Male
Female
Islamabad 7953 6520 1433 6252 5078 1174 Punjab 29565 25326 4239 16097 13364 2733 Sindh 45224 35405 9819 23001 18211 4790
NWFP 9899 9104 795 6117 5589 528
Balochistan 2327 1955 372 1151 951 200 G.T.Pre-Engineering Pakistan 94968 78310 16658 52618 43193 9425 Source: Boards of Intermediate and Secondary Education. Table 6.27 Summary Result Statistics of Intermediate (Pre-Medical group) 2003
Appeared Passed
Province
Both
Sexes
Male
Female
Both
Sexes
Male
Female
Islamabad 7182 2524 4658 5916 1899 4017
Punjab 26182 12503 13679 16549 6796 9753
Sindh 50458 24244 26214 29610 13889 15721
NWFP 9715 6821 2894 7217 4841 2376
Balochistan 5148 3285 1863 2332 1342 990 G.T.Pre-Medical Pakistan 98685 49377 49308 61624 28767 32857 Source: Boards of Intermediate and Secondary Education. Table 6.28 Summary Result Statistics of Intermediate (Arts group ) 2004

43
Appeared Passed
Province Both Sexes
Male
Female
Both Sexes
Male
Female
Islamabad 12851 4262 8589 7499 1657 5842
Punjab 302767 135673 167094 159057 56907 102150
Sindh 64427 29355 35072 41798 20026 21772
NWFP 96498 58092 38406 32628 16721 15907
Balochistan 18094 11034 7060 6780 4000 2780G.T.Arts Pakistan 494637 238416 256221 247762 99311 148451Source: Boards of Intermediate and Secondary Education. Table 6.29 Summary Result Statistics of Intermediate (Pre-Engineering group) 2004
Appeared Passed
Province Both Sexes
Male
Female
Both Sexes
Male
Female
Islamabad 7988 6554 1434 6822 5500 1322
Punjab 28639 24830 3809 15987 13455 2532
Sindh 47190 36505 10685 26809 20660 6149
NWFP 13323 12308 1015 8934 8150 784
Balochistan 2278 1974 304 1220 1040 180
Appeared Passed
Province Both Sexes
Male
Female
Both Sexes
Male
Female
G.T.Pre-Engineering Pakistan 99418 82171 17247 59772 48805 10967 Source: Boards of Intermediate and Secondary Education. Table 6.30 Summary Result Statistics of Intermediate (Pre-Medical group) 2004
Appeared Passed
Province
Both Sexes
Male
Female
Both Sexes
Male
Female
Islamabad 7206 2387 4819 6379 1969 4410
Punjab 28790 13276 15514 18396 7338 11058
Sindh 54924 29184 25740 38482 20088 18394
NWFP 13881 10003 3878 9762 6561 3201
Balochistan 5567 3697 1870 2782 1651 1131 G.T.Pre-Medical Pakistan 110368 58547 51821 75801 37607 38194 Source: Boards of Intermediate and Secondary Education

44
Table 6.31 Enrolment in Educational Institutions
(Thousand)
PRIMARY STAGE (I-V) MIDDLE STAGE (VI-VII) HIGH STAGE (IX-X) Year
Male Female Total Male Female Total Male Female Total
1990-91 7162 3675 10837 1979 842 2821 719 285 1004
1991-92 7022 3714 10736 2123 858 2981 784 295 1079
1992-93 8130 4596 12726 2046 994 3040 811 357 1168
1993-94 8233 5055 13288 2182 1123 3305 894 421 1315
1994-95 8626 5638 14264 2469 1347 3816 1011 514 1525
1995-96 8825 5702 14527 2335 1270 3605 967 480 1447
1996-97 9239 6156 15395 2369 1357 3726 1001 520 1521
1997-98 10066 6997 17063 2500 1532 4032 1053 605 1658
1998-99 11719 6450 18169 2512 1586 4098 1064 638 1702
1999-00 12104 7044 19148 2497 1615 4112 1073 653 1726
2000-01 10242 6893 17135 2304 1455 3759 968 597 1565
2001-02 10362 7167 17529 2315 1506 3821 930 644 1574
2002-03 10701 7519 18220 2367 1551 3918 931 658 1589
2003-04 11602 8179 19781 2584 1737 4321 1091 709 1800
Source:- Academy of Education Planning & Management, Islamabad

45

46
Chapter 7
7.1 Labour Force Participation Rates The most common indicators of participation in economic activities are the Crude Activity Rate, the Refined Activity Rate and the Age Specific Activity Rate. In order to reckon with the influence of cultural, socio-economic and geographical factors, it is often recommended to calculate these rates by sex. They are defined as: -
i) Crude Activity (Participation) Rate (CAR) is the percentage of persons in labour force to the total population.
ii) Refined Activity (Participation) Rate (RAR) is the percentage of persons in labour force to the population 10 years of age and above.
iii) Specific Activity (Participation) Rates are the percentage of persons in the labour force with a specific characteristics (age, level of education, marital status, etc.) to the total population with the specific characteristics. For example, if we want to have the age specific activity rate for females in the age group of 20-24 years old, we must divide the number of active females 20-24 years old by the total number of women in that age group.
A comparative picture of crude participation rate based on current and 2001-02 Labour Force
Survey is given in table-7.1. The crude activity rate ascends marginally from 29.6% in 2001-02 to 30.4% in 2003-04. Rural rates have scaled up higher relative to urban rates, which adumbrates osmosis of more activities into informal sector. The same observations hold with respect to area and gender as well. Punjab’s crude participation rates for both sexes are the highest among the provinces. Crude participation rates for Pakistan by sex, rural/urban areas and provinces are presented in table-7.1. For obtaining a better measure of the labour participation, especially of females, a few new questions to net in a set of economic activities likely to be carried out within house premises were introduced in Labour Force Surveys, from 1990-91 onwards. Table-7.1 shows that the augmented female participation rates (i.e. 26% in 2001-02 Vs 28% in 2003-04) are substantially higher than shown by the extant methodology (10% and 11%). This ratchets up the overall participation rates significantly (37% in 2001-02 Vs 39% in 2003-04) without altering the relative profile overtime. However, due to steeper decline in the urban women’s participation, the new urban rate loses a wee bit to level down during the comparative periods. The same generally holds for provinces as well.

46
Table 7.1 Crude Activity (Participation) Rates: Pakistan And Provinces (%)
2001-02 2003-04
* Improved Participation
Rate
* Improved Participation Rate
Province/ Area Total Male Female
Total Female
Total Male Female
Total Female Pakistan 29.6 48.0 9.9 37.4 25.8 30.4 48.7 11.2 38.5 27.5 Rural 29.9 47.6 11.1 40.3 32.3 31.0 48.2 13.2 42.2 35.8 Urban 29.1 48.9 7.3 31.4 12.0 29.2 49.8 7.0 31.1 10.8 Balochistann
25.3 44.5 3.6 36.0 25.8 25.7 45.0 4.8 36.2 26.5 Rural 25.7 45.3 3.5 38.1 29.3 26.4 46.1 5.0 39.3 31.8 Urban 23.8 41.3 4.1 27.1 11.0 23.4 41.3 3.9 26.0 9.3 NWFP 23.5 41.7 4.7 36.9 31.6 24.6 42.3 6.9 38.1 33.8 Rural 23.1 41.1 4.6 38.3 35.1 24.5 41.8 7.3 39.8 37.7 Urban 25.8 45.0 5.0 29.0 11.6 25.1 44.8 5.1 29.1 13.1 Punjab 32.5 50.1 14.0 38.3 25.9 33.4 50.6 15.6 39.1 27.1 Rural 33.0 49.6 15.8 40.6 31.1 34.5 50.3 18.4 42.2 33.9 Urban 31.3 51.0 9.9 33.2 13.9 30.9 51.3 9.4 32.3 12.1 Sindh 27.3 47.8 4.1 35.6 21.8 27.9 48.8 4.6 37.6 24.9 Rural 27.6 48.4 4.1 41.9 34.4 27.8 48.3 4.7 45.0 41.0 Urban 26.9 47.3 4.0 29.4 9.2 28.1 49.3 4.4 30.2 8.7
Note:- * According to extant methodology, persons 10 years of age and above reporting housekeeping and other related activities are considered out of labour force. However, they are now identified as employed if they have spent time on the specified fourteen agricultural and non-agricultural activities.
Source:- Labour Force Survey, 2001-02 & 2003-04
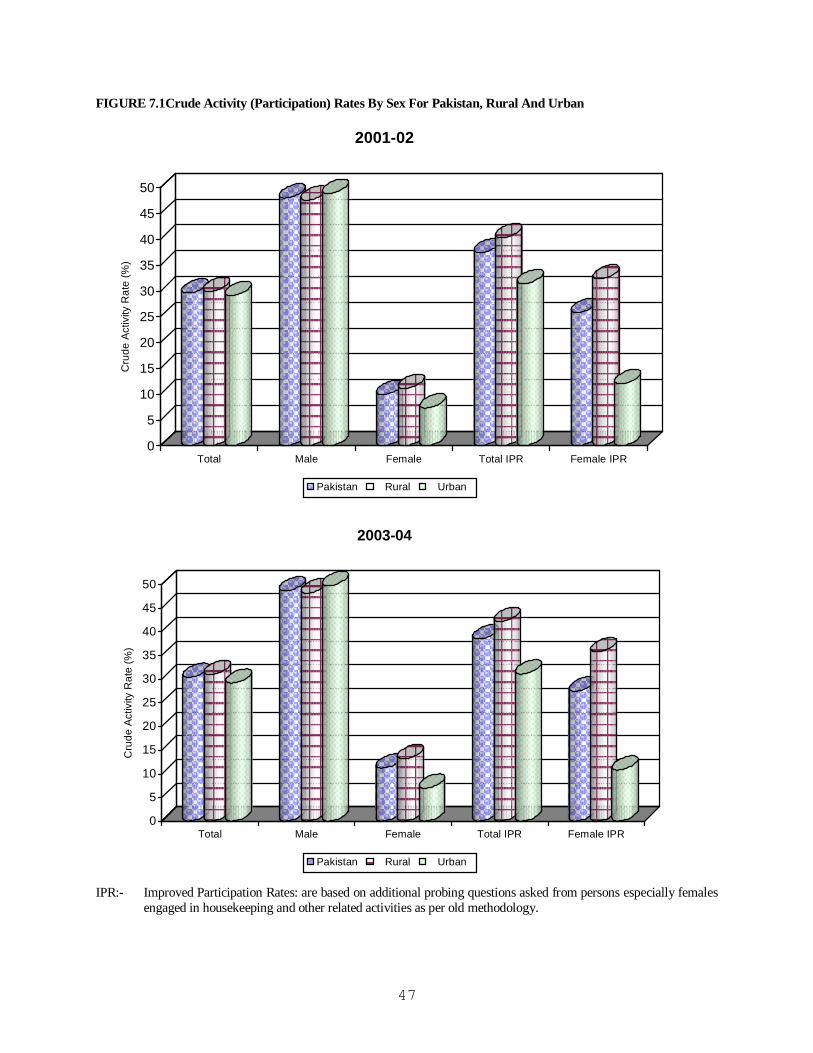
47
FIGURE 7.1Crude Activity (Participation) Rates By Sex For Pakistan, Rural And Urban
0
5
10
15
20
25
30
35
40
45
50
Cru
de A
ctiv
ity R
ate
(%)
Total Male Female Total IPR Female IPR
2001-02
Pakistan Rural Urban
0
5
10
15
20
25
30
35
40
45
50
Cru
de A
ctiv
ity R
ate
(%)
Total Male Female Total IPR Female IPR
2003-04
Pakistan Rural Urban
IPR:- Improved Participation Rates: are based on additional probing questions asked from persons especially females
engaged in housekeeping and other related activities as per old methodology.

48
Ala crude activity rate(s), refined activity rate has increased from 43% in 2001-02 to 44% in 2003-04. Provinces also line up in the same order and, males participation rate (71%) is over four-times higher than that of females (16%). Similarly, female refined participation rates obtained through augmentation are substantially higher. The new refined rates behave in line with their crude twins along the area, province and gender. Rising rural (and stagnating urban rates) bespeak expanding frontiers of informal sector. A comparative picture of refined activity rates for Pakistan and its provinces by rural and urban areas for the current and 2001-02 surveys are given in table-7.2.
Table7.3 (and figure 7.2) presents a comparative picture of age specific participation rates for Pakistan by sex based on 2001-02 and 2003-04 Labour Force Surveys. The rates appear to follow a platty kurtic dome-shaped trajectory through the age intervals with relatively flatter tail for later part of life. This observation holds irrespective of gender. Invariably, this pattern befits the government’s delimitation of productive life years. Further, female participation in all age groups have leveled higher in 2003-04 which may be due to increase in informal particularly, farming activities.
Table 7.2 Refined Activity (Participation) Rates: Pakistan And Provinces (%)
2001-02 2003-04 * Improved
Participation Rate
* Improved Participation Rate
Province/
Area Total Male Female
Total Female
Total Male Female
Total Female Pakistan 43.3 70.3 14.4 54.7 37.7 43.7 70.6 15.9 55.3 39.3 Rural 45.2 72.2 16.8 60.9 48.7 46.3 72.6 19.5 62.9 52.7 Urban 39.9 66.9 10.0 43.0 16.4 39.2 67.1 9.4 41.7 14.5
Balochistan 40.2 68.0 6.0 57.2 43.0 40.0 68.1 7.6 56.4 42.6 Rural 41.5 70.1 6.0 61.6 50.0 42.0 71.5 8.2 62.6 52.1 Urban 35.2 59.8 6.2 40.0 16.6 34.0 58.1 5.9 37.8 14.0 NWFP 36.4 65.2 7.2 57.1 48.3 37.2 65.7 10.2 57.7 50.0 Rural 36.5 65.8 7.2 60.4 54.3 37.5 66.0 10.8 61.1 56.2 Urban 36.1 62.4 7.0 40.6 16.4 35.7 64.3 7.1 41.4 18.5 Punjab 46.3 71.6 19.9 54.7 36.8 47.0 71.8 21.8 55.0 37.8 Rural 48.2 72.9 22.9 59.3 45.1 49.9 73.6 26.4 61.1 48.5 Urban 42.4 69.1 13.4 45.0 18.8 41.0 68.5 12.3 42.8 16.0 Sindh 40.5 70.4 6.1 52.9 32.7 40.5 70.8 6.6 54.5 36.1 Rural 44.3 76.6 6.8 67.4 56.4 43.6 75.8 7.4 70.5 64.3 Urban 37.2 65.1 5.5 40.7 12.8 37.8 66.4 5.9 40.6 11.7 Note:- * According to extant methodology, persons 10 years of age and above reporting housekeeping and
other related activities are considered out of labour force. However, they are now identified as employed if they have spent time on the specified fourteen agricultural and non-agricultural activities.
Source:- Labour Force Survey, 2001-02 & 2003-04
Table 7.3 Age Specific Activity (Participation) Rates By Sex For Pakistan (%)

49
2001-02 2003-04 Age Groups Total Male Female Total Male Female
10 – 14 12.0 17.2 6.3 12.8 18.5 6.7 15 – 19 37.2 57.6 13.8 37.4 59.0 14.5 20 – 24 51.2 87.0 15.9 51.5 85.7 18.0 25 – 29 54.3 95.9 15.9 55.6 96.2 17.7 30 – 34 53.9 97.3 16.3 55.3 96.3 19.1 35 – 39 59.5 97.4 19.5 59.0 97.7 20.9 40 – 44 59.8 97.6 20.4 60.1 97.0 22.6 45 – 49 60.2 96.8 20.0 59.8 96.5 20.9 50 – 54 59.5 94.1 18.6 58.1 94.5 21.0 55 -59 53.9 88.2 14.5 55.9 89.7 18.6
60 + 37.4 56.6 11.4 38.7 58.4 12.9 Source:-Labour Force Survey, 2001-02 & 2003-04
Figure 7.2 Age Specific Activity Rate (ASAR) By Sex For Pakistan
0
20
40
60
80
100
120
10 – 14 15 – 19 20 – 24 25 – 29 30 – 34 35 – 39 40 – 44 45 – 49 50 – 54 55 -59 60 +
AGE GROUPS (YEARS)
ASA
R (%
)
2001-02 Male 2001-02 Female 2003-04 Male 2003-04 Female
7.2 Labour Force: Absolute Figures The absolute figures of labour force have been calculated by multiplying crude participation rate of the respective survey year with the estimated population as on 1st January of that year. The numbers of employed and unemployed persons have been obtained by multiplying the labour force with percentages of employed and unemployed persons. It is observed that 45.23 million of the total population are currently active, termed as “Labour Force”. The labour force has increased from 42.39 million in
2001-02 to 45.23 million in 2003-04. The volume of labour force has increased in all provinces irrespective of area and gender. However, the volume of male labour force has shrunk slightly in rural NWFP, probably, due to declining farming opportunities and, rural pathan’s historical penchant for breaking new grounds especially in trade and commerce. Absolute figures of labour force for Pakistan and its provinces by rural and urban areas for the current and 2003-04 surveys are given in table below.
Table7.4 Civilian Labour Force Of Pakistan And Provinces By Rural, Urban and Sex (Million)
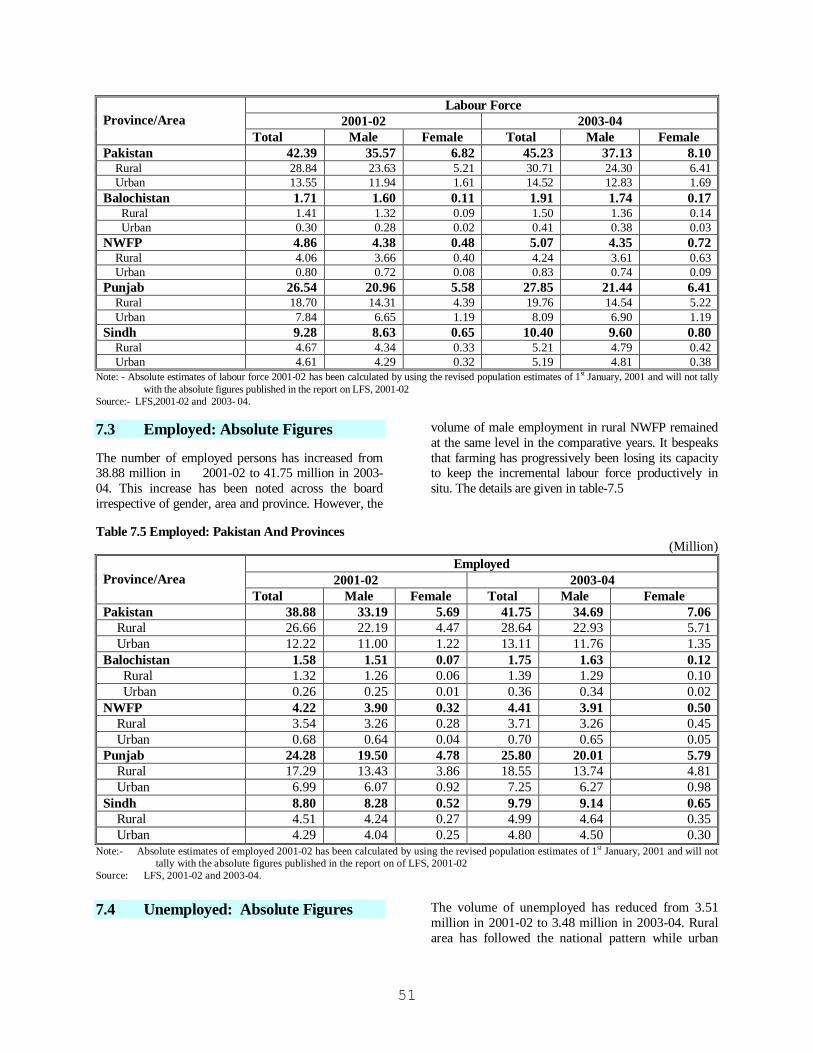
51
Labour Force 2001-02 2003-04 Province/Area
Total Male Female Total Male Female Pakistan 42.39 35.57 6.82 45.23 37.13 8.10 Rural 28.84 23.63 5.21 30.71 24.30 6.41 Urban 13.55 11.94 1.61 14.52 12.83 1.69 Balochistan 1.71 1.60 0.11 1.91 1.74 0.17 Rural 1.41 1.32 0.09 1.50 1.36 0.14 Urban 0.30 0.28 0.02 0.41 0.38 0.03 NWFP 4.86 4.38 0.48 5.07 4.35 0.72 Rural 4.06 3.66 0.40 4.24 3.61 0.63 Urban 0.80 0.72 0.08 0.83 0.74 0.09 Punjab 26.54 20.96 5.58 27.85 21.44 6.41 Rural 18.70 14.31 4.39 19.76 14.54 5.22 Urban 7.84 6.65 1.19 8.09 6.90 1.19 Sindh 9.28 8.63 0.65 10.40 9.60 0.80 Rural 4.67 4.34 0.33 5.21 4.79 0.42 Urban 4.61 4.29 0.32 5.19 4.81 0.38
Note: - Absolute estimates of labour force 2001-02 has been calculated by using the revised population estimates of 1st January, 2001 and will not tally with the absolute figures published in the report on LFS, 2001-02
Source:- LFS,2001-02 and 2003- 04.
7.3 Employed: Absolute Figures The number of employed persons has increased from 38.88 million in 2001-02 to 41.75 million in 2003-04. This increase has been noted across the board irrespective of gender, area and province. However, the
volume of male employment in rural NWFP remained at the same level in the comparative years. It bespeaks that farming has progressively been losing its capacity to keep the incremental labour force productively in situ. The details are given in table-7.5
Table 7.5 Employed: Pakistan And Provinces
(Million) Employed
2001-02 2003-04 Province/Area
Total Male Female Total Male Female Pakistan 38.88 33.19 5.69 41.75 34.69 7.06 Rural 26.66 22.19 4.47 28.64 22.93 5.71 Urban 12.22 11.00 1.22 13.11 11.76 1.35 Balochistan 1.58 1.51 0.07 1.75 1.63 0.12 Rural 1.32 1.26 0.06 1.39 1.29 0.10 Urban 0.26 0.25 0.01 0.36 0.34 0.02 NWFP 4.22 3.90 0.32 4.41 3.91 0.50 Rural 3.54 3.26 0.28 3.71 3.26 0.45 Urban 0.68 0.64 0.04 0.70 0.65 0.05 Punjab 24.28 19.50 4.78 25.80 20.01 5.79 Rural 17.29 13.43 3.86 18.55 13.74 4.81 Urban 6.99 6.07 0.92 7.25 6.27 0.98 Sindh 8.80 8.28 0.52 9.79 9.14 0.65 Rural 4.51 4.24 0.27 4.99 4.64 0.35 Urban 4.29 4.04 0.25 4.80 4.50 0.30
Note:- Absolute estimates of employed 2001-02 has been calculated by using the revised population estimates of 1st January, 2001 and will not tally with the absolute figures published in the report on of LFS, 2001-02
Source: LFS, 2001-02 and 2003-04. 7.4 Unemployed: Absolute Figures
The volume of unemployed has reduced from 3.51 million in 2001-02 to 3.48 million in 2003-04. Rural area has followed the national pattern while urban

2
has surged in the number of unemployed persons, on account of rise in male unemployment. It points out obliquely that traction of secondary and tertiary activities has a bit slackened in the referred period. Punjab, with relative fall in both gender and area specific unemployment, stands out vis a vis three smaller provinces where unemployment leveled higher across gender and area during the comparative periods. 7.5 Employed: Major Industry
Divisions Agricultural and allied industry, with 43% of the total employed in 2003-04, levels one percentage point higher as compared to 2001-02. As for gender composition, male employment declines while
female’s climbs more than 2% up. Contrarily, the non-agriculture sector portrays a sort of enervation. For instance, employment in construction sector is down from 6.1% in 2001-02 to 5.8% in 2003-04 and community, social & personal services loses a half percentage point from 15.5% in 2001-02 to 15% in 2003-04. Thus, employability of secondary and tertiary activities has generally decreased. This-in the context of increase in primary (agricultural) sector’s employment, especially, of females-owes, probably, to creeping atomization (informalization) and/or, fall in the infusion of technology (investment). Other sectors almost remain unchanged. A comparative picture of the proportions of persons employed in major industry divisions during current and 2001-02 surveys is given in table-7.7 Industrial distribution of employed persons is shown in figure-7.3.
Table7.6 Unemployed: Pakistan And Provinces
(Million) Unemployed
2001-02 2003-04 Province/Area
Total Male Female Total Male Female Pakistan 3.51 2.38 1.13 3.48 2.44 1.04 Rural 2.18 1.44 0.74 2.07 1.37 0.70 Urban 1.33 0.94 0.39 1.41 1.07 0.34 Balochistan 0.13 0.09 0.04 0.16 0.11 0.05 Rural 0.09 0.06 0.03 0.11 0.07 0.04 Urban 0.04 0.03 0.01 0.05 0.04 0.01 NWFP 0.64 0.48 0.16 0.66 0.44 0.22 Rural 0.52 0.40 0.12 0.53 0.35 0.18 Urban 0.12 0.08 0.04 0.13 0.09 0.04 Punjab 2.26 1.46 0.80 2.05 1.43 0.62 Rural 1.41 0.88 0.53 1.21 0.80 0.41 Urban 0.85 0.58 0.27 0.84 0.63 0.21 Sindh 0.48 0.35 0.13 0.61 0.46 0.15 Rural 0.16 0.10 0.06 0.22 0.15 0.07 Urban 0.32 0.25 0.07 0.39 0.31 0.08
Note:- Absolute estimates of unemployed 2001-02 has been calculated by using the revised population estimates of 1st January, 2001 and will not tally with the absolute figures published in the report on LFS, 2001-02
Source: LFS, 2001-02 and 2003-04. Table7.7 Distribution of Employed: Major Industry Divisions
(%) 2001-02 2003-04 Major Industry Divisions
Total Male Female Total Male Female
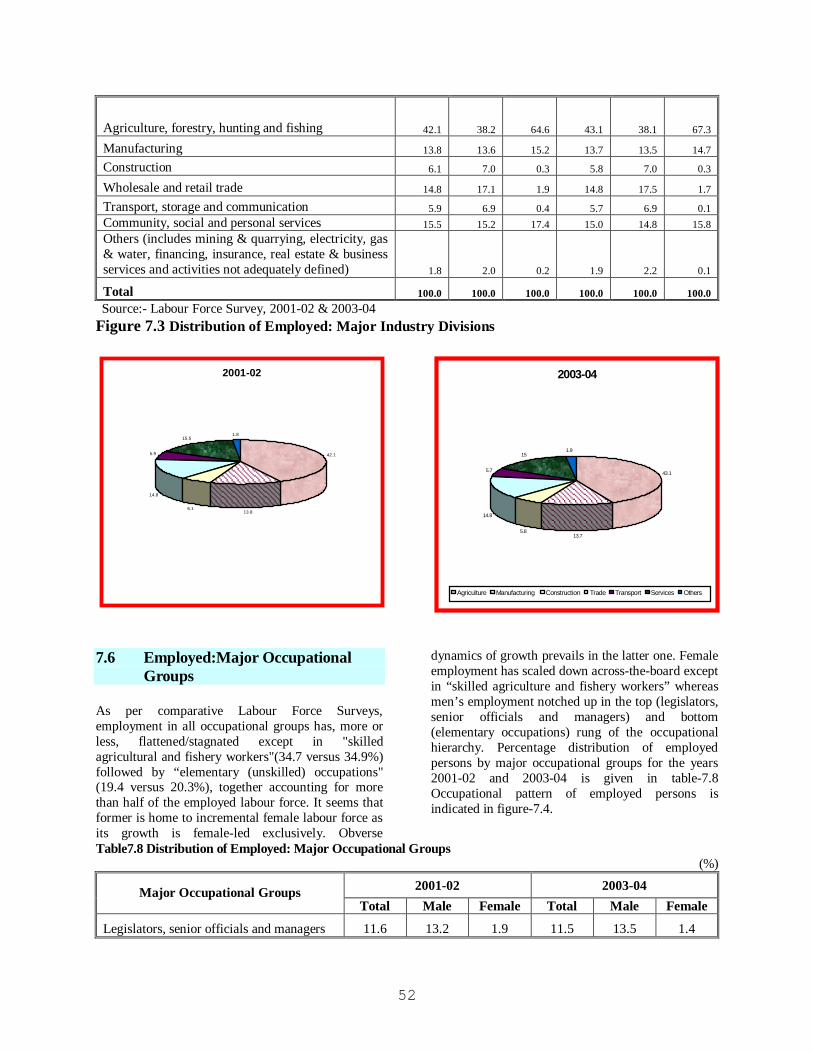
52
Agriculture, forestry, hunting and fishing 42.1 38.2 64.6 43.1 38.1 67.3
Manufacturing 13.8 13.6 15.2 13.7 13.5 14.7
Construction 6.1 7.0 0.3 5.8 7.0 0.3
Wholesale and retail trade 14.8 17.1 1.9 14.8 17.5 1.7
Transport, storage and communication 5.9 6.9 0.4 5.7 6.9 0.1 Community, social and personal services 15.5 15.2 17.4 15.0 14.8 15.8 Others (includes mining & quarrying, electricity, gas & water, financing, insurance, real estate & business services and activities not adequately defined) 1.8 2.0 0.2 1.9 2.2 0.1
Total 100.0 100.0 100.0 100.0 100.0 100.0 Source:- Labour Force Survey, 2001-02 & 2003-04
Figure 7.3 Distribution of Employed: Major Industry Divisions
2001-02
42.1
13.86.1
14.8
5.9
15.51.8
2003-04
43.1
13.75.8
14.8
5.7
151.9
Agriculture Manufacturing Construction Trade Transport Services Others
7.6 Employed:Major Occupational
Groups As per comparative Labour Force Surveys, employment in all occupational groups has, more or less, flattened/stagnated except in "skilled agricultural and fishery workers"(34.7 versus 34.9%) followed by “elementary (unskilled) occupations" (19.4 versus 20.3%), together accounting for more than half of the employed labour force. It seems that former is home to incremental female labour force as its growth is female-led exclusively. Obverse
dynamics of growth prevails in the latter one. Female employment has scaled down across-the-board except in “skilled agriculture and fishery workers” whereas men’s employment notched up in the top (legislators, senior officials and managers) and bottom (elementary occupations) rung of the occupational hierarchy. Percentage distribution of employed persons by major occupational groups for the years 2001-02 and 2003-04 is given in table-7.8 Occupational pattern of employed persons is indicated in figure-7.4.
Table7.8 Distribution of Employed: Major Occupational Groups (%)
2001-02 2003-04 Major Occupational Groups Total Male Female Total Male Female
Legislators, senior officials and managers 11.6 13.2 1.9 11.5 13.5 1.4

55
Professionals 2.1 2.0 2.5 2.0 2.0 1.9
Technicians and associate professionals 4.7 3.9 9.5 4.9 4.1 8.7
Clerks 1.7 2.0 0.3 1.6 1.9 0.2
Service workers and shop & market sales workers 5.7 6.4 1.3 5.2 6.1 0.8
Skilled agricultural and fishery workers 34.7 33.0 44.3 34.9 32.2 48.4
Craft and related trades workers 16.2 16.4 14.9 15.9 16.2 14.3
Plant and machine operators and assemblers 3.9 4.6 0.2 3.7 4.5 0.1
Elementary (unskilled) occupations 19.4 18.5 25.1 20.3 19.5 24.2
Total 100.0 100.0 100.0 100.0 100.0 100.0 Source:- Labour Force Survey, 2001-02 & 2003-04
7.7 Employed: Employment Status Employed persons are denominated mainly as employees, self-employed, unpaid family helpers and employers. During the comparative periods, the two foremost categories have receded whereas the last one nigh fared at the same level. Thus, the profile of activities likely to siphon labour force from unorganized into organized sector has weakened comparatively. A conspicuously women-led surge in the third one (unpaid family worker) gives credence to the aforementioned observation. Majority (38%) constitutes employees followed by self-employed (37%), unpaid family helpers (24%) and employers (1%). As expected, more female workers are engaged as unpaid family helpers (53%) compared to male workers (18%). Contrarily more male workers are engaged in the category of self-employed, employees and employers. Comparative data for the current and 2001-02 surveys is given in table-7.9.
Table 7.9 Distribution Of Employed: Employment Status And Sex (%)
2001-02 2003-04 Employment Status Total
Male
Female
Total
Male
Female
Employers 0.8 0.9 0.3 0.9 1.1 0.1 Self-employed 38.5 42.4 15.7 37.1 41.4 15.9 Unpaid family helpers 20.8 16.4 46.9 24.1 18.3 52.8
Employees 39.9 40.3 37.1 37.9 39.2 31.2
Total 100 100 100 100 100 100 Source:-Labour Force Survey, 2001-02 & 2003-04
Figure 7.4 Distribution of Employed: Major Occupational Groups

54
2001-02
11.62.1
4.71.7
5.7
34.7
16.2
3.9
19.4
2003-04
11.52
4.91.6
5.2
34.9
15.9
3.7
20.3
Legislators, senior officials and managers Professionals Technicians and associate professionals ClerksService workers and shop and market sales workers Skilled agricultural and fishery workersCraft and related trades workers Plant and machine operators and assemblersElementary (unskilled) occupations

55
Table7.10 Distribution Of Employed: Hours Worked, 2003-04 (%)
Area/ Province
Total employ
ed
Not worked
Less than 15 hours
15-24 hours
25-34 hours
35-41 hours
42-48 hours
49-55 hours
56 hours & above
Pakistan 100.0 0.7 1.3 4.2 8.5 15.0 25.9 13.6 30.8 Rural 100.0 0.7 1.5 5.2 10.2 16.9 23.7 13.8 28.0 Urban 100.0 0.8 0.8 2.0 4.7 10.9 30.7 13.3 36.9
Balochistan 100.0 0.5 0.4 1.8 6.9 16.9 42.3 13.2 18.0 Rural 100.0 0.3 0.5 2.1 7.9 17.5 40.5 12.9 18.4 Urban 100.0 1.4 0.1 0.7 3.2 14.4 49.3 14.5 16.4
NWFP 100.0 1.3 1.7 7.4 10.7 18.3 24.9 10.6 25.1 Rural 100.0 1.3 2.0 8.3 11.4 19.3 23.6 10.4 23.9 Urban 100.0 1.4 0.4 2.8 7.6 13.4 31.7 11.5 31.3
Punjab 100.0 0.8 1.6 4.7 9.2 15.2 23.7 13.7 31.1 Rural 100.0 0.8 1.8 5.6 10.8 16.3 22.2 13.7 28.9 Urban 100.0 0.9 1.1 2.5 5.2 12.4 27.4 13.7 36.9
Sindh 100.0 0.4 0.6 1.7 5.9 12.6 29.1 14.9 34.9 Rural 100.0 0.3 0.5 2.2 8.0 17.2 24.4 16.9 30.6 Urban 100.0 0.4 0.6 1.2 3.8 7.8 34.0 12.8 39.4
Note:- Total may not add to 100 due to rounding effect. Source:- Labour Force Survey, 2001-02 & 2003-04 7.8 Employed: Number of Hours
Worked During the Week Of the currently employed persons, 0.7% constitutes the group of people had a job attachment but did not work last week due to certain reasons. On the other end of the spectrum lies a large proportion (31%) of employed persons worked 56 hours or more a week. However, 14% of the employed persons falls left to the water shed “35 hours a week”, liable to be bracketed as under employed. The corresponding figures for urban (8%) and rural (17%) areas points out prevalence of under employment in the latter. However, the predominant proportion (more than 80%) of overworked persons which lie to the right of “35 hours a week” obliquely brings forth the prevalence of lower than subsistence wages in the (fractured) job market. Percentage distribution of employed persons by number of hours worked during reference week for the current survey is given in table 7.10.
7.9 Employed: Informal Sector Currently, true to the often-held contention, informal sector accounts for 70% of the employment in main jobs outside agriculture sector. In the same refrain, percentage of employed involved in informal sector (73%), in rural area, is higher compared to that of urban areas (67%). As expected, formal sector activities are more concentrated in urban areas (33%) as compared to rural areas (27%). Since informal activities are predominantly non-agrarian, male workers are relatively more concentrated in informal sector both in rural and urban areas of the country. Informal sector’s employment has surged by five percentage points from 65% in 2001-02 to 70% in 2003-04, irrespective of gender and area. For explanation, the aggressive consumer finance schemes launched by various financial institutions is one of the important reason. However, inhibiting influence of government’s long held predilection to generate revenue by hook or crook can not be discounted altogether as a reason for surge in informal activities. A comparative picture of the proportions of persons employed in non-agriculture sector into formal and informal for the current and 2001-02 surveys is given in table 7.11.
Table 7.11 Distribution Of Non-Agriculture Workers Into Formal And Informal Sector (%)

57
2001-02 2003-04 Sector Total Male Female Total Male Female
Total 100 100 100 100 100 100 Formal 35.4 35.3 37.0 30.0 29.6 34.3 Informal 64.6 64.7 63.0 70.0 70.4 65.7
Rural 100 100 100 100 100 100 Formal 31.7 31.5 34.3 27.1 26.7 30.1 Informal 68.3 68.5 65.7 72.9 73.3 69.9
Urban 100 100 100 100 100 100 Formal 38.9 38.9 39.3 32.8 32.2 38.4 Informal 61.1 61.1 60.7 67.2 67.8 61.6
Source:-Labour Force Survey, 2001-02 & 2003-04 7.10: Informal Sector: Major Industry
Divisions According to classification of the informal sector employment by major industry divisions, the largest slice (35%) goes to wholesale and retail trade. Manufacturing sector ranks second with about one-fifth (21%) followed by community, social and personal services (19%), construction (13%) and transport (11%). The other categories including mining & quarrying; electricity, gas & water and finance, insurance, real estate & business services
account for less than two percent. Comparative Labour Force Surveys indicate relative decline in all categories except “wholesale and retail trade” and “others” grouping. Both groups reflects relative rise in the male employment. Males employment forms a bit skewed unimodal pattern peaked in wholesale and retail trade while females employment is bimodally apportioned with maximas lying in manufacturing (57%) and community and social services (34%). Percentage distribution of informal sector workers by major industry divisions for the years 2001-02 and 2003-04 is given in table 7.12.
Table 7.12 Distribution of Informal Sectors Workers: Major Industry Divisions (%)
2001-02 2003-04 Major Industry Divisions Total Male Female Total Male Female
Total 100.0 100.0 100.0 100.0 100.0 100.0
Manufacturing 20.9 17.3 57.5 20.6 16.9 57.3
Construction 13.9 15.1 1.3 13.4 14.6 1.2
Wholesale and retail trade 34.0 36.5 7.6 34.6 37.3 7.6
Transport, storage and communication 11.7 12.7 1.0 11.2 12.3 0.3
Community, social and personal services 18.9 17.6 32.4 18.7 17.2 33.5 Others (includes mining & quarrying; electricity, gas & water and finance, insurance, real estate & business services 0.7 0.8 0.2 1.5 1.7 0.1
Source:-Labour Force Survey, 2001-02 & 2003-04 7.11 Informal Sector: Major
Occupational Groups Majority (31%) are reported as craft and related trade workers. Nigh a quarter (25%) are legislators, senior officials & managers. About one-fifth (23%) are engaged in elementary (unskilled) occupations. Services workers, shop and market sales workers rank fourth (10%) followed by plant & machine operators & assemblers (6%), technicians & associate professionals
(4%) and professionals (2%). As expected, occupational distribution of workers is marked by wide sex differentials. Figures on males sit in the vicinity of overall pattern at wide variance with that of females. Further, apportionment of number among activities is, relatively, more even for men than for women. Craft & related trade activities, home to three-fifth (59%) of female and more-than-one quarter male workers (28%), constitute peak irrespective of gender. Among the sizeable groupings “plant and machine operators & assemblers” and “legislators, senior officials and

57
managers” reflect male dominance in the same order. “Professionals” and “technicians and associate professionals” are more tuned to women. “Elementary Occupations” tend to be gender neutral. Except the grouping of legislators, technicians, clerks and elementary occupations, all reflect relative decline
during the comparative period. A comparative picture of the informal sector workers classified by major occupational groups for the current and 2001-02 surveys is given in tables 7.13.
Table 7.13 Distribution of Informal Sectors Workers: Major Occupational Groups (%)
2001-02 2003-04 Major Occupational Groups Total Male Female Total Male Female
Total 100.0 100.0 100.0 100.0 100.0 100.0 Legislators, senior officials & managers 24.6 26.3 6.8 24.9 26.7 5.9
Professionals 1.8 1.7 2.5 1.6 1.5 2.5 Technicians and associate professionals 2.8 2.3 8.5 3.8 3.2 9.8 Clerks 0.2 0.2 - 0.4 0.5 - Service workers and shop & market sales workers 9.5 9.9 5.2 9.5 10.1 3.1
Skilled agricultural and fishery workers 0.1 0.1 - - - -
Craft and related trade workers 32.3 29.6 59.9 31.1 28.4 58.6
Plant and machine operators and assemblers 6.4 7.0 0.6 6.1 6.7 0.2
Elementary (unskilled) occupations 22.4 22.9 16.5 22.6 22.9 19.9 Source:- Labour Force Survey, 2001-02 & 2003-04
7.12 Informal Sector: Employment
Status The employment status categorizes majority (44%) as self-employed followed by employees (43%). The former, embracing majority (45%) of men and latter, containing better part (46%) of women, are mutually obverse in gender skewness. About one in ten workers (12%) are reported as unpaid family helpers and one & a half percent are identified as employers. The former is home to two-time more women vis-à-vis men while the latter in acutely men centric. As far change in the comparative periods, unpaid family workers, employees and self-employed reflect a modicum of ascent in the same order while employees category a bit recedes. It seems that organized activities tend to concede ground to unorganized ones during the referred periods. Percentage distribution of informal sector workers by employment status for the years 2001-02 and 2003-04 is given in table 7.14.
7.13 Employed: Occupational Safety and Health
Questions on occupational safety and health, introduced firstly in Labour Force Survey for 2001-02, are asked from the employed persons ten years of age and above. About one out of thirty-three (2.8%) employed persons has reported some sort of occupational injury/disease. Explicably, the percentage suffered finds male workers (3.2%) more vulnerable relative to female workers (1%). Same holds for rural workers (3.1%) vis-à-vis urban workers (2.2%). Nevertheless, urban women (0.5%) is much more shielded in comparison with her rural and urban compatriots of same and opposite sex. Susceptibility to occupational hazards has slackened over time across the area and gender. However, the lot of urban women has improved most eminently. Comparative status of occupational injuries/diseases for the years 2001-02 and 2003-04 are given in table-7.15.

2
Table 7.14 Distribution Of Informal Sectors Workers: Employment Status (%)
2001-02 2003-04 Employment Status
Total Male Female Total Male Female
Total 100 100 100 100 100 100 Employer 1.0 1.1 0.2 1.5 1.6 0.2 Self-employed 43.6 44.8 31.0 43.7 44.7 34.0 Unpaid family helpers 10.9 10.1 19.1 11.7 10.9 19.5 Employees 44.5 44.0 49.7 43.1 42.8 46.3
Source:-Labour Force Survey, 2001-02 & 2003-04 Table 7.15 Distribution Of Employed Persons 10 Years Of Age And Above By Status Of Injuries/Diseases (%)
2001-02 2003-04 Status of Injuries/Diseases Total Male Female Total Male Female
Total 100.0 100.0 100.0 100.0 100.0 100.0 Suffered 3.6 3.9 1.5 2.8 3.2 1.0
Not suffered 96.4 96.1 98.5 97.2 96.8 99.0
Rural 100.0 100.0 100.0 100.0 100.0 100.0 Suffered 3.9 4.4 1.4 3.1 3.6 1.1
Not suffered 96.1 95.6 98.6 96.9 96.4 98.9
Urban 100.0 100.0 100.0 100.0 100.0 100.0 Suffered 2.9 3.0 1.9 2.2 2.4 0.5
Not suffered 97.1 97.0 98.1 97.8 97.6 99.5 Source:- Labour Force Survey, 2001-02 & 2003-04
7.14 Occupational Safety and Health:
Major Industry Divisions Well nigh half (45%) victims of occupation hazards belong to agricultural sector. Manufacturing account for about one-seventh (15%), followed by construction (11%), community, social and personal services (10%), wholesale & retail trade (9%) and transport, storage and communication (9%). From the gender perspective, women are twice as much exposed to risk as men in agriculture (80 Vs 43%). Contrarily, men are thrice (10 Vs 3%) in wholesale and retail trade. Both categories reflect deterioration over time evenly be gender. Incidence of risk in
manufacturing has changed from gender neutral (15% both for men & women) in 2001-02 to gender partial (15 Vs 8%) in 2003-04 in favour of women. Community, social and personal services display improvement in the comparative periods evenly for men & women. Construction also fared well during the comparative periods marked by Labour Force Surveys of 2001-02 and 2003-04. Percentage distribution of employed persons suffered occupational injuries/diseases by major industry divisions for the years 2001-02 and 2003-04 are given in table 7.16.
Table 7.16 Distribution Of Employed Persons Suffered Occupational Injuries/Diseases: Major Industry Divisions (%)
2001-02 2003-04 Major Industry Divisions Total Male Female Total Male Female
Total 100.0 100.0 100.0 100.0 100.0 100.0

60
Agriculture, forestry, hunting and fishing 42.9 41.0 71.2 44.9 42.6 79.8 Mining & quarrying 0.1 0.1 - - - - Manufacturing 14.5 14.5 14.7 14.6 15.0 8.0 Electricity, gas and water 0.7 0.8 - 1.0 1.0 - Construction 12.5 13.3 1.0 10.7 11.4 - Wholesale & retail trade and restaurants & hotels 8.6 9.0 3.1 9.1 9.5 3.4 Transport, storage and communication 9.4 9.9 0.9 8.9 9.5 - Financing, insurance, real estate and business services 0.1 0.1 - 0.5 0.6 -
Community, social and personal services 11.2 11.3 9.1 10.3 10.4 8.8 Source:-Labour Force Survey, 2001-02 & 2003-04 7.15 Occupational Safety and Health:
Major Occupational Groups Ala the pattern of major industry divisions, majority of sufferers (39%) are concentrated in skilled agriculture and fishery activities. Comparative survey figures (38 Vs 39%) don’t bespeak improvement over time. Women’s exposure to risk has increased from one and half (56 Vs 36%) of men’s in 2001-02 to more the twice (76 Vs 36%) in 2003-04. Since three-fourth of women victims belong to this group, one need not be feminist to get alarmed. Craft & related trade activities and elementary occupations are the next major occupational groups (21%) followed by legislators, senior officials & managers (6%) and plant and machine operators & assemblers (6%). The former two reflect, more or less, flip-side of the state of occupational safety during the comparative periods. Men’s exposure to risk has increased steadily whereas that of women steeply declined. Profile of the second group is much sharpers relatively. The latter two groups exhibit improvement during the comparative periods. Gender composition of the incidence of occupational health hazards remains same over time in the 1st one. No such observation seems to be in order for well nigh masculine group of “plant and machine operators and assemblers”. Other relatively minor occupations have experienced a slight decline in the proportions of suffered workers. Distribution of employed persons with reported
occupational injuries/diseases by major occupational groups for the years 2001-02 and 2003-04 is given in table 7.17. 7.16 Occupational Safety and Health:
Employment Status Quite explicably, the majority (49%) of sufferers falls in the category of self-employed, The comparative proportions (46% in 2001-02 Vs 49% of 2003-04) adduce risk as increasing function of time for self employed. Further, self-employed men’s exposure to risk has increased during the comparative periods whereas that of women has declined steeply. The second important category is employees (41%) followed by unpaid family helpers (10%). Both groups seem to be improving over time. The former reflects sharp improvement in the lot of women as comparative proportions (27% in 2001-02 Vs 7% in 2003-04) bear out. The latter-home to 70% of women sufferers-paints acutely rising exposure to risk from four times (41% Vs 10% in 2001-02) to more than eleven time (68% Vs 6%) as higher as that of men. This bespeaks “much lesser half” status of the female unpaid family helpers. Employers with insignificant proportion appear to have arrogated themselves preeminent claim over safety regime. Percentage incidence of occupational injuries/ diseases by employment status for the survey years 2001-02 and 2003-04 is given in table-7.18.
Table 7.17 Distribution Of Employed Persons Suffered Occupational Injuries/Diseases: Major Occupational Groups
(%) 2001-02 2003-04 Major Occupational Groups
Total Male Female Total Male Female Total 100.0 100.0 100.0 100.0 100.0 100.0

2
Legislators, senior officials & managers 6.7 7.0 3.1 6.3 6.4 3.4 Professionals 0.3 0.2 0.8 0.4 0.4 - Technicians and associate professionals 2.3 2.1 5.0 2.3 2.3 1.6 Clerks 1.2 1.2 - 1.0 1.1 - Service workers and shop & market sales workers 3.8 4.0 1.2 2.8 3.0 - Skilled agricultural and fishery workers 37.6 36.4 55.9 38.7 36.3 76.3 Craft and related trade workers 20.9 21.3 15.9 21.4 22.1 11.2 Plant and machine operators and assembles 7.4 7.8 0.9 5.7 6.1 - Elementary (unskilled) occupations 19.8 20.0 17.2 21.4 22.3 7.5 Source:- Labour Force Survey, 2001-02 & 2003-04
Table 7.18 Distribution of Employed Persons Suffered Occupational Injuries/Diseases: Employment Status (%)
2001-02 2003-04
Employment Status
Total
Male
Female
Total
Male
Female
Total 100 100 100 100 100 100
Employers 0.8 0.8 0.4 0.7 0.8 - Self-employed 45.9 46.9 31.2 48.7 50.2 25.2 Unpaid family helpers 12.3 10.4 41.4 10.1 6.3 67.9
Employees 41.0 41.9 27.0 40.5 42.7 6.9 Source:-Labour Force Survey, 2001-02 & 2003-04
7.17 Occupational Safety and Health: Types of Treatment Received It is observed that majority (61%) of the sufferers are reported to have consulted a doctor or other medical professionals. Of the total, 19% have taken time off work and 12% have been hospitalized. Seen in the context of relative rise in former and, decline in latter two activities, it appears that affordability to pursue treatment is on decline, probably, due to lack of financial support, paucity of facilities, strict regimentation at the work place. According to gender composition of the tabulated categories, women have got more savvy for doctor’s advice relative to men (64 Vs 61%) Similarly, women appear to be better disposed to take time off work (21 Vs 19%). However, the event of hospitalization, though significantly men-centred, has declined gender-neutrally during the comparative periods. Auspiciously, non category-stemming, probably, from aversion/inhibition/lack of access to doctor’s advice-has also declined steeply. The remaining 8% did not avail themselves any of the aforementioned option. Percentage incidence of occupational injuries/diseases by type of treatment received for the years 2001-02 and 2003-04 is given in table 7.19
Table 7.19 Distribution of Employed Persons 10 Years of Age And Above Suffered Occupational Injuries/Diseases By Types of Treatment Received
(%)
2001-02 2003-04 Types of Treatment Received
Total
Male
Female
Total
Male
Female
Total 100 100 100 100 100 100
Hospitalized 14.7 15.0 9.9 12.2 12.6 6.3 Consulted a Doctor or other Medical Professional 48.8 48.6 51.5 61.1 60.9 64.3 Took time off work 19.3 19.6 15.4 19.0 18.8 21.4
None 17.2 16.8 23.2 7.7 7.7 8.0 Source:-Labour Force Survey, 2001-02 & 2003-04

62
7.18 Occupational Safety and Health: Parts of Body Injured Majority of the workers (45%) received injuries of general nature, followed by the injury of lower limb (20%), upper limb (16%), multiple locations (9%) and head injuries (7%), which should be noted with concern, as it can cause death, partial or complete disablement and loss of intellectual abilities. The foremost category reflects increasing women’s exposure to risk from equal (52% each) in 2001-02 to twice (82 Vs 43%) as higher as that of men. Better coverage/reporting might well be one of the reasons. Incidence of limb injuries have been on rise. More men with rising incidence over time have been succumbing to this type of affliction as opposite to women. “Multiple location” type has shrunk over time, steeply for women whereas, gender neutral incident of head injury has mercifully been sagging in frequency. Proportions for trunk injuries across the time and gender, levels, more or less, same in 2003-04 except for women, where no trunk injury has been reported. Percentage incidence suffered occupational injuries/diseases by parts of body injured for the years 2001-02 and 2003-04 is given in table 7.20.
Table 7.20 Distribution of Employed Persons 10 Years of Age And Above Suffered Occupational Injuries/Diseases by Parts of Body Injured (%)
2001-02 2003-04
Parts of Body Injured
Total
Male
Female
Total
Male
Female
Total 100 100 100 100 100 100
Head 7.9 7.7 9.7 6.7 7.1 -
Neck 1.4 1.4 0.4 1.9 2.0 0.5
Trunk 1.9 1.9 1.5 1.7 1.8 -
Upper Limb 11.7 11.0 22.4 15.9 16.2 12.6
Lower Limb 12.6 13.1 6.3 19.8 20.8 3.4 Multiple Locations 12.4 12.7 7.3 8.9 9.3 1.9 General Injuries 52.3 52.2 52.4 45.1 42.8 81.6
Source:-Labour Force Survey, 2001-02 & 2003-04
7.19 Unemployed Labour Force: Unemployment Rates
Unemployment rate is defined as the percentage of unemployed labour force to the total labour force. The data shows that overall unemployment rate has decreased from 8.3% in 2001-02 to 7.7% in 2003-04, due, mainly, to steeper decline in women’s unemployment (17 Vs 13%) vis-à-vis that of men (6.7 Vs 6.6%). Age specific unemployment rates form a spectrum of two-different hues. The 1st one encompasses three up-start age groups (10-24) with respect to size of unemployment. This grouping exhibits women-led decline in unemployment overtime. Men’s unemployment has also shrunk except for the latter most (20-24) interval. The 2nd part of the spectrum spans over seven age groups between 25 to 59 years. This part reflects mildly rising men-led profile of unemployment over time save for the fourth (40-44) and last two (50-59) age interval. Women’s unemployment has consistently been on decline across the constituent age intervals. The unemployment rates of beyond retirement age may partly be accrued by the re-entry of retired people into economically active life because of the absence of social securities for them. The unemployment rates as revealed in current and 2001-02 surveys may be seen in table7.21 and figure 7.5.
Table 7.21 Unemployment Rates: Sex And Age (%)
2001-02 2003-04 Age Groups
Total
Male
Female
Total
Male
Female
Ten years & above 8.3 6.7 16.5 7.7 6.6 12.8
10 – 14 16.5 16.1 17.7 12.8 13.6 10.4
15 – 19 16.2 15.3 20.5 13.2 12.8 14.9
20 – 24 10.9 9.1 20.5 10.3 9.3 15.0
25 – 29 6.3 5.1 12.9 7.1 6.1 12.5
30 – 34 4.2 3.2 9.6 4.5 3.8 7.4
35 – 39 2.6 1.5 8.2 2.9 2.0 7.2
40 – 44 3.2 2.2 8.2 2.9 2.5 4.8
45 – 49 3.3 2.5 7.9 3.5 2.3 9.5
50 – 54 6.0 4.0 18.2 5.1 3.5 12.2
55 – 59 8.0 4.6 31.8 7.1 4.5 20.7 60 years & above 13.6 8.9 45.5 12.8 8.9 36.1
Source:- Labour Force Survey, 2001-02 & 2003-04

63
Figure7.5 Age Specific Unemployment Rates by Sex for Pakistan
0
5
10
15
20
25
30
35
40
45
50
10 – 14 15 – 19 20 – 24 25 – 29 30 – 34 35 – 39 40 – 44 45 – 49 50 – 54 55 -59 60 +
AGE GRUPS (YEARS)
AS
UR
(%)
2001-02 Male 2001-02 Female 2003-04 Male 2003-04 Female
The over all unemployment rates in Pakistan seems low. In the absence of social security and unemployment insurance schemes, remaining out of work is hardly workable proposition even after retirement. In order to eke out something to make the both ends meet, even partly, the bulk of population must engage all the times in some sort of economic activity, irrespective of the size of earning. Thus, a vast proportion of people worked less than” 35 hours a week” notwithstanding their quest for alternative or additional work, may be considered as employed at fringe or, at best, underemployed. Unemployment rate in 2003-04 whittles down to 8.9% if persons worked less than 15 hours during the reference week are treated as unemployed. Unemployment has thus receded during the comparative periods, steeply for rural areas and fair sex. The comparative picture of unemployment rates including underemployed (worked less than 15 hours during reference week) by sex and area for the Labour Force Surveys, 2001-02 and 2003-04 is given in table.

63
Table 7.22 Unemployment Rates Including Underemployed Who Worked Less Than 15 Hours During Reference Week (%)
2001-02 2003-04 Areas
Total Male Female Total Male Female Pakistan 9.7 7.5 21.1 8.9 7.2 16.7 Rural 9.3 7.1 19.0 8.2 6.4 14.9 Urban 10.7 8.4 28.2 10.5 8.7 23.7
INDICATORS Indicators 2001-02 2003-04 Indicators 2001-02 2003-04
Crude Activity (Participation) Rates (%) Labour Force (In millions) Pakistan Total 42.39 45.23
Total 29.6 30.4 Male 35.57 37.13 Male 48.0 48.7 Female 6.82 8.10 Female 9.9 11.2 Employed
Improved Total 38.88 41.75 Total 37.4 38.5 Male 33.19 34.69 Female 25.8 27.5 Female 5.69 7.06
Rural Unemployed Total 29.9 31.0 Total 3.51 3.48 Male 47.6 48.2 Male 2.38 2.44 Female 11.1 13.2 Female 1.13 1.04
Improved Employment by Sector (%) Total 40.3 42.2 Total 100.0 100.0 Female 32.3 35.8 Agriculture 42.1 43.1
Urban Non-agriculture 57.9 56.9 Total 29.1 29.2 Formal 20.5 17.1 Male 48.9 49.8 Informal 37.4 39.8 Female 7.3 7.0 Unemployment Rates (%)
Improved Pakistan Total 31.4 31.1 Total 8.3 7.7 Female 12.0 10.8 Male 6.7 6.6 Refined Activity (Participation) Rates (%) Female 16.5 12.8
Pakistan Rural Total 43.3 43.7 Total 7.6 6.7 Male 70.3 70.6 Male 6.1 5.7 Female 14.4 15.9 Female 14.1 10.9
Improved Urban Total 54.7 55.3 Total 9.8 9.7 Female 37.7 39.3 Male 7.9 8.4
Rural Female 24.2 19.8 Total 45.2 46.3 Literacy Rates (%) Male 72.2 72.6 Pakistan Female 16.8 19.5 Total 50.0 51.6
Improved Male 62.2 63.7 Total 60.9 62.9 Female 36.9 39.2 Female 48.7 52.7 Rural
Urban Total 40.5 41.6 Total 39.9 39.2 Male 55.0 56.3 Male 66.9 67.1 Female 25.4 26.6 Female 10.0 9.4 Urban
Improved Total 67.8 69.7 Total 43.0 41.7 Male 75.5 76.5 Female 16.4 14.5 Female 59.3 62.5
Source:-Labour Force Survey, 2001-02 & 2003-04 7.20 A Look at Officialdom Government employees constitute three tiers of the mainstream official hierarchy viz Federal, Provincial and Local. Annual census is conducted to document
federal employees by grade, gender and postings. No such documentation is carried out for other tiers to provide the data in a comprehensive publication. Further, employment profile of autonomous/semi-autonomous organizations is not accessible with requisite adequacy, reliability and timeliness. Thus, notwithstanding unstinting and targeted mail enquiry,

64
the profile of the pertinent data from provincial and local bodies is fragmented and sketchy. However, to afford an indicative assessment of the obtaining situation in the provinces, data from the responding organizations have been compiled. Obviously, in keeping with the general perception, women do not seem to be factored-in as a formative underpinning to draw up the employment profile. Though empirical basis for making inter-provincial comparison regarding the gender composition of the employees is not strenuous, it can be argued that the ratio of female employees does not bear defining nexus with the prevalence of conservative values. In this connection, a multitude of factors interact in a complex way. However, nodal significance and seminal preeminence can be ascribed to the primeval, endemic and systemic obsession of the feudal classes-reinforced by the unending spell of non representative dispensations-with the continuation of their hold on power. Since women participation in public life at par with men does not fit well with a compliant and subservient power matrix, the entire repertoire of activities constituting polity and economy becomes unrelenting for any regimen of gender poise. The tables No.7.24-27 profile government employees on availability basis. The responding organizations have been listed at the bottom of the tables.
7.21 A Peep in to Financial Institutions Financial Sector is broadly categorized as banking and non banking financial institutions (NBFIs). The former are regulated by State Bank of Pakistan (SBP) whereas the latter are controlled by Security and Exchange Commission of Pakistan (SECP). Since financial institutions are presumably the most documented sector of an economy, expansive and incessant mail inquiry both at operational and apex level was made to coax out the gender disaggregated employment data. It is jarring to point out that after a long last, we could collect scheduled banks data whereas SECP’s dominion did not relent much save for a blurred peep. Nevertheless, the evolving composition of financial sector employees does signify a sort of shift towards gender poise. However, the unfolding scenario is hardly paradigmatic in the sense that placement of women in the hierarchy still smacks of an exercise in window dressing. Thus, better part of the men’s better-halves at best constitute rank & file and adore window seats to deal with the sight smelling customers. The tables No. 7.29-33 profile gender composition of the financial sector employees. In order to impart a sobering rather sombring reflections on the poor response from NBFIs, lists of the names of non responding agencies is given in the end of report.

65
CHAPTER - 8 8 Women Role in Public Life This chapter briefly describes the participation of women in public life such as elected representative in the Parliament i.e. National and Provincial Assemblies and Senate, ministerial positions, women associations and groups working for women rights, women in media and women in development. 8.1 General Elections The latest general elections to the National and Provincial Assemblies were held in the year 2002. These were the fourth mid term elections in the series due to dissolution of the National and Provincial Assemblies during the period 1990 to 1999. 8.2 Number of Seats in National and
Provincial Assemblies and Senate There are 342 seats in the National Assembly. Of these 332 are reserved for Muslims and 10 seats for minority communities. There are 728 seats in four Provincial Assemblies altogether. Of these 705 are Muslim seats and 23 seats are reserved for the minority communities. Women are legally allowed at par with men to contest election on any seat for the National and Provincial Assemblies. There are 100 seats in the Senate (known as upper house). Of these 66 seats are general and 17 are for women and 17 for technocrats. The provinces have equal number of seats (14 seats for each province plus 4 special seats). In addition, 3 seats for Federal Capital and 8 for Federally Administered Tribal Areas (FATA). The elections for Senate are not conducted by direct cast of votes from electorol comprising women and men voters registered with the Election Commission of Pakistan. Instead, elected members of the provincial assemblies elect senators on provincial basis, whereas, the senators from the Federal Capital are elected by the members of the National Assembly and senators from FATA are elected by their elected members of the National Assembly. Special seats for women which were allowed till 1988 were abolished in 1990 and 1997 general election. But decision was reversed in election 2002 to allocate 60 and 17 seats in National Assembly and Senate respectively.
8.3 Registered Votes/Voters participation
Every Pakistani 21 years and above was eligible as voter to National and Provincial Assemblies. All of 71.9 million Muslim votes for both sexes registered in provinces / area in general election 2002, were declared eligible to cast votes to candidates with free choice. Of these 33.2 million (46.1 percent) were women and 38.7 million (53.9 percent) men. Table 8.1 As for relative turn-out the past four elections point out a decling trend. Table-8.1 Registered Voters By Sex and
Province, Pakistan, 2002
Registered Voters (In million) Percent of total voters
Pakistan/ Province
Wom-
-en
Men
Total
Wom-en
Men
Pakistan Punjab Sindh NWFP Balochistan Islamabad
33.16 19.38 7.41 3.92 1.80 0.18
38.71 21.87 8.77 4.93 2.12 0.20
71.86 41.24 16.17 8.85 3.93 0.38
46.1 47.0 45.8 44.3 45.9 47.0
53.9 58.0 54.2 55.7 54.1 53.0
Source: Election Commission of Pakistan, Islamabad.
Fig.8.1 Registered Voters by Sex, Pakistan 2002
46%
54%
Women Men
Table-8.2 Registered Voters, Votes Polled and Turnout of Voters in the National Assembly of Pakistan, 1970-2002

66
Registered Voters (In million)
Year Men
Female
Total
Votes polled
Tern-out
1970 Percent 1985 Percent 1988 Percent 1990 Percent 1993 Percent 1997 Percent 2002 Percent
30.51 53.6 17.98 55.3 24.82 53.7 25.36 53.9 27.46 54.5 30.60 55.6 38.71 46.4
26.43 46.4 14.56 44.7 21.38 46.3 21.70 46.1 22.92 45.5 24.47 44.4 33.16 53.6
56.94 100
32.54 100
46.21 100
47.06 100
50.38 100
55.07 100
71.86 100
34.09
17.47
19.90
21.39
20.29
19.51
30.01
59.9
53.69
43.07
45.46
40.28
35.42
41.74
Source:- Websites www.ecp.gov.pk 8.4 Elected Members By Gender Among the all muslim and non muslim seats in the National Assembly, women as elected representatives were negligible in number. There were only 2 women members in the National Assembly of 1990 (0.9 percent) against 215 men members. The number of women members improved slightly in the National Assembly of 1993 and 1997. In order to raise women’s representation in all tiers of elected institutions, their seats have substantially been increased in election 2002. There are 73 (21%) women members in National Assembly now vis a vis 269 men members. Table-8.3 Elected Members to the National Assembly By
Gender Number of Elected Members of
National Assembly Election
Year
Total No. of
Seats No. of
Wom-en
Perce-nt to total
No. of
Men
Perce-nt to total
1990
1993
1997
2002
217
217
217
342
2
4
6
73
0.9
1.8
2.8
21.0
215
213
211
269
99.1
98.2
97.2
79.0
Source: National Assembly Secretariat, Parliament House, Islamabad.
Fig.8.2 Elected Members to the National Assembly by Gender,
Pakistan 2002
21%
79%
Women Men
Women senator has always been a rare spectacle. There was a single woman in the Senates of 1990 and 1993. In 1997 Senate, their number rose to 2. However, of late the women seats in Senate, ala N.A & P.A have been increased manifold. As a result, the senate in seat has 18 (18%) women members. Here an observation appears to be in orders; the women’s representation in all walks of the life can only be realized if their access to the pivotal equalizers i.e education and health is ensured across the time and space. (Table-8.4). Table 8.4 Number of Senators to the Senate By Gender
Number of Elected Senators Women Men Election
Year
Total No. of Seats Num
ber Percent
Number Percent
1990
1993
1997
2003
2004
87
87
87
100
100
1
1
2
18
18
1.1
1.1
2.3
18.0
18.0
86
86
85
82
82
98.9
98.9
97.3
82.0
82.0 Source: Senate Secretariat, Parliament House, Islamabad
Fig. 83 Percentage of Senators to the Sanate by Gender, Pakistan 2003
18%
82%
Women Men
Table 8.5 Number of Elected Members to The Provincials Assemblies by Gender
Number of Elected Member Province Total Number Women Men

67
of Member
s
Num ber
Per cent
Num ber
Per cent
Balochis-tan 65 12 18.5 53 81.5
NWFP 124 23 18.5 101 81.5
Punjab 371 73 19.7 298 80.3
Sindh 168 33 19.6 135 80.4 Source:- Websites www.ecp.gov.pk www.pap. Gov.pk. 8.5 Members of Cabinet At present there is one woman minister in the federal cabinet, she is having portfolio of Cabinet Minister for Social Welfare and Special Education as compared with 17 men Ministers and 7 Ministers of State. There is one woman Advisor to Prime Minister and Special Assistant to the Prime Minister. In all the four Provincial Cabinets at present (2004) there are eight ministers, four in Punjab and two each in Sindh and Balochistan. 8.6 Participation of Women in
Voluntary Associations / Groups A number of NGOs and associations have been constituted and operated by women as a highly visible and vocal part of our civil society. Their main focus is advocacy of women rights, and representation. A lot are also engaged in substantive activities in the pursuits of women uplift. Some others are running crises centres
and performing distress management. The prominent among them include like All Pakistan Women Association (APWA). Aurat Publication & Information Service Foundation. Women’s Action Forum. Mother Trust. Maternity & Child Welfare Association of Pakistan. Family Planning Association of Pakistan. Pakistan Labour Liberation Front (BLLP) etc.

68
Table1.1: Province- Wise Population by Sex and Rural - Urban 1998- Census
Province- Wise Population b Sex and Rural - 1998- Census 1998 - Census
Area Women Men Both Sexes
1981 Population
1981-98 Average Annual Growth
Rate
Pakistan
TOTAL 63,478,593 68,873,686 132,352,279 84,253,644 2.69
Rural 43,194,115 46,121,760 89,315,875 60,412,173 2.33
Urban 20,284,478 22,751,926 43,036,404 23,841,171 3.53
Punjab
TOTAL 35,526,923 38,094,367 73,621,290 47,292,441 2.64
Rural 24,579,275 26,022,990 50,602,265 34,240,795 2.32
Urban 10,947,648 12,071,377 23,019,025 13,051,646 3.39 Sindh
TOTAL 14,342,302 16,097,591 30,439,893 19,028,666 2.80
Rural 7,406,903 8,193,128 15,600,031 10,785,630 2.19
Urban 6,935,399 7,904,463 14,839,862 8,243,036 3.52 N.W.F.P.
TOTAL 8,654,709 9,088,936 17,743,645 11,061,328 2.82
Rural 7,250,049 7,499,512 14,749,561 9,395,675 2.69
Urban 1,404,660 1,589,424 2,994,084 1,665,653 3.51 Balochistan
TOTAL 3,059,379 3,506,506 6,565,885 4,332,376 2.47
Rural 2,340,062 2,657,043 4,997,105 3,655,604 1.85
Urban 719,317 849,463 1,568,780 676,772 5.07 F.A.T.A.
TOTAL 1,524,284 1,652,047 3,176,331 2,198,547 2.19
Rural 1,485,293 1,605,565 3,090,858 2,198,547 2.02
Urban 38,991 46,482 85,473 - - Islamabad
TOTAL 370,996 434,239 805,235 340,286 5.19
Rural 132,533 143,522 276,055 135,922 4.25
Urban 238,463 290,717 529,180 204,364 5.75 Source: Population Census Organization

69
Table1.2: Population by Gender and Sex Ratio, Pakistan and Provinces
Year Women Men Both sexes Proportion Of Women (%)
Sex Ratio (Women Per 100
Men)
PAKISTAN
1972 30476057 34833283 65309340 46.7 87.5
1981 40020967 44232677 84253644 47.5 90.5
1998 63478593 68873686 132352279 48.0 92.2
PUNJAB
1972 17399712 20210447 37610159 46.3 86.1
1981 22432228 24860213 47292441 47.4 90.2
1998 35526923 38094367 73621290 48.3 93.3 SINDH
1972 6581720 7574189 14155909 46.5 86.9
1981 9029461 9999205 19028666 47.5 90.3
1998 14342302 16097591 30439893 47.1 89.1 NWFP
1972 4025476 4363075 8388551 48.0 92.3
1981 5299821 5761507 11061328 47.9 92.0
1998 8654709 9088936 17743645 48.8 95.2 BALOCHISTAN
1972 1138897 1289781 2428678 46.9 88.3 1981 2048294 2284082 4332376 47.3 89.7 1998 3059379 3506506 6565885 46.6 87.2
FATA
1972 1225251 1265979 2491230 49.2 96.8 1981 1055681 1142866 2198547 48.0 92.4 1998 1524284 1652047 3176331 48.0 92.3
ISLAMABAD 1972 105001 129812 234813 44.7 80.9 1981 155482 184804 340286 45.7 84.1 1998 370996 434239 805235 46.1 85.4
Source: Population Census, Organization

70
Table1.3: Average Annual Growth Rate and Population Change, Pakistan and Provinces
(Percent)
Average Annual Growth Rate Population Change Year
Women Men Both Sexes Women Men Both Sexes
Pakistan
1972 3.7 3.7 3.7 53.0 51.7 52.3
1981 3.3 2.9 3.1 31.3 27.0 29.0
1998 2.8 2.6 2.7 58.6 55.7 57.1
Punjab
1972 3.3 3.5 3.4 46.4 48.8 47.7
1981 3.1 4.3 2.7 28.9 23.0 25.7
1998 2.7 2.5 2.6 58.4 53.2 55.7
Sindh
1972 2.8 4.3 4.6 75.4 64.1 69.2
1981 3.8 3.3 3.6 37.2 32.0 34.4
1998 2.8 2.8 2.8 58.8 61.0 60.0
NWFP
1972 3.3 3.4 3.3 46.6 46.1 46.4
1981 3.3 3.3 3.3 31.7 32.1 31.9
1998 2.9 2.7 2.8 63.3 57.8 60.4
Balochistan
1972 5.5 4.8 5.1 87.4 73.0 79.4
1981 7.2 7.0 7.1 79.8 77.1 78.4
1998 2.4 2.6 2.5 49.4 53.5 51.6 Islamabad
1981 4.8 4.3 4.5 48.1 42.4 44.9
1998 5.2 5.1 5.2 138.6 135.0 136.6 Source: Population Census Organization.

71
Table 1.4: Urban Population as Percent of Total Population, Pakistan and Provinces
Percent of Total Population Year Total Population
(in Million) Women Men Both Sexes
Pakistan
1972 65.3 11.6 13.8 25.4
1981 84.3 13.0 15.2 28.2
1998 132.4 15.3 17.2 32.5
Punjab
1972* 37.6 11.2 13.2 24.4
1981 47.3 12.9 14.7 27.6
1998 73.6 15.0 16.4 31.4
Sindh
1972 14.2 18.3 22.0 40.3
1981 19.0 20.1 23.3 43.4
1998 30.4 22.8 26.0 48.8
NWFP
1972 8.4 6.0 7.1 13.1
1981 11.1 6.9 8.1 15.0
1998 17.7 8.0 9.0 17.0
Balochistan
1972 2.4 8.3 8.3 16.7
1981 4.3 4.2 5.6 9.8
1998 6.6 11.0 12.9 23.9
Islamabad
1981 0.3 26.7 33.3 60.0
1998 0.8 29.6 36.1 65.7 Source: Population Census Organization * Includes Population of Islamabad

72
Table 1.5: Population of Twelve Major Cities 1931- 1998
City 1931 1941 1951 1961 1972 1981 1998
Karachi** 263565 386655 1068459 1912598 3515402 5208132 9204480
Lahore (M.C.&Cantt) 429747 671659 849333 1296477 2169742 2952689 5143495
Faisalabad( M.C) 42932
69930 179127 425248 823343 1104209 2008861
Rawalpindi (M.C & Cantt) 119284
185042 236877 304175 614809 794834 1409768
Multan (M.C.& Cantt) 119457 142768 190122 358201 538949 732070 1197384
Hyderabad (M.C & Cantt) 101699 134693 241801 434537 628631 751529 1166894
Gujranwala (M.C & Cantt) 58716 84545 120852 196154 323880 600993 1132509
Peshawar (M.C. & Cantt) 121866 173420 151435 217885 272697 566248 982816
Quetta (M.C. & Cantt) 60272 64476 83892 106633 158026 285719 565137
Islamabad - - - - 76641 204364 529180
Sargodha (M.C. & Cantt) 26761 36420 78447 129291 200460 291362 458440
Sialkot (M.C. & Cantt) 100973 138708 156378 167294 203650 302009 421502 Source: Population Census Organization * City means an urban locality or an agglomeration of more than one urban locality
adjacent to each other except Islamabad and Rawalpindi, which are treated as independent cities.
** Karachi city comprises Karachi East, West, South, Central and Malir.
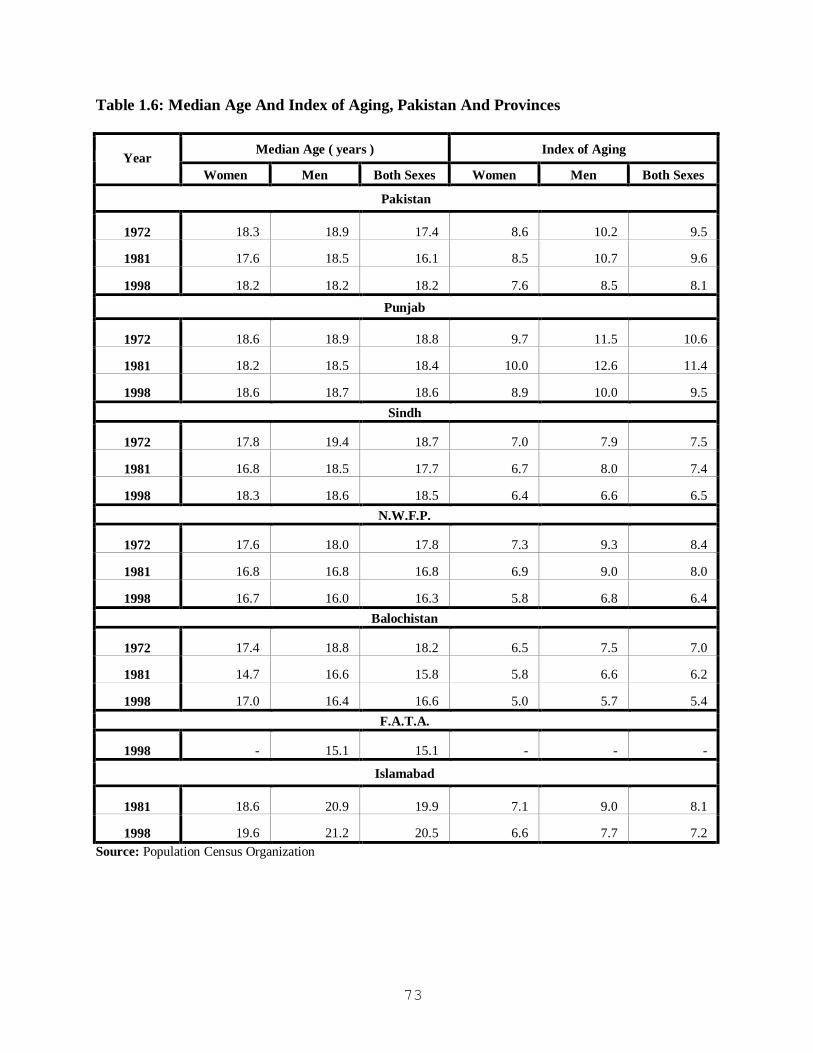
73
Table 1.6: Median Age And Index of Aging, Pakistan And Provinces
Median Age ( years ) Index of Aging Year
Women Men Both Sexes Women Men Both Sexes
Pakistan
1972 18.3 18.9 17.4 8.6 10.2 9.5
1981 17.6 18.5 16.1 8.5 10.7 9.6
1998 18.2 18.2 18.2 7.6 8.5 8.1
Punjab
1972 18.6 18.9 18.8 9.7 11.5 10.6
1981 18.2 18.5 18.4 10.0 12.6 11.4
1998 18.6 18.7 18.6 8.9 10.0 9.5 Sindh
1972 17.8 19.4 18.7 7.0 7.9 7.5
1981 16.8 18.5 17.7 6.7 8.0 7.4
1998 18.3 18.6 18.5 6.4 6.6 6.5 N.W.F.P.
1972 17.6 18.0 17.8 7.3 9.3 8.4
1981 16.8 16.8 16.8 6.9 9.0 8.0
1998 16.7 16.0 16.3 5.8 6.8 6.4 Balochistan
1972 17.4 18.8 18.2 6.5 7.5 7.0
1981 14.7 16.6 15.8 5.8 6.6 6.2
1998 17.0 16.4 16.6 5.0 5.7 5.4 F.A.T.A.
1998 - 15.1 15.1 - - -
Islamabad
1981 18.6 20.9 19.9 7.1 9.0 8.1
1998 19.6 21.2 20.5 6.6 7.7 7.2 Source: Population Census Organization

74
Table 1.7: Percent Distribution of Children Population ( 0- 14 Years ) By Gender, Pakistan And Provinces
Percent of Children Population Aged 0-14 Years Year Total Population
(Thousand) Women Men Both Sexes
Pakistan
1972 62,462 20.7 23.1 43.8
1981 84,254 21.5 23.0 44.5
1998 132,352 20.3 22.1 42.4 Punjab
1972 37,610 20.3 23.2 43.4
1981 47,292 20.8 22.6 43.4
1998 73,621 20.5 22.0 42.5 Sindh
1972 14,156 21.2 22.7 43.9
1981 19,029 22.3 22.8 45.1
1998 30,440 20.3 22.5 42.8 NWFP
1972 8,388 22.0 23.4 45.4
1981 11,061 22.5 24.3 46.8
1998 17,744 22.6 24.6 47.2 Balochistan
1972 2,429 21.8 22.8 44.6
1981 4,332 23.9 24.7 48.5
1998 6,566 21.5 25.2 46.7 FATA
1972 2,491 . . . . . .
1981 2,198 . . 45.8 45.8
1998 3,176 19.0 21.3 41.2 Islamabad
1972 235 . . . . . .
1981 340 19.6 20.9 40.5
1998 805 18.3 19.6 37.9 Source: Population Census Organization

75
Table 1.8: Percent of Population Aged 15-29 and 30-59 Years, Pakistan and Provinces
Age 15 - 29 Years Age 30- 59 Years Year
Women Men Both Sexes Women Men Both Sexes
Pakistan
1972 10.9 12.3 23.3 11.9 14.0 25.9
1981 11.1 12.6 23.7 11.9 12.9 24.8
1998 13.1 13.6 26.7 11.6 12.8 24.4
Punjab
1972 10.9 12.2 23.1 11.9 13.9 25.8
1981 11.4 12.5 23.9 12.0 12.9 24.9
1998 13.0 13.4 26.4 11.9 12.9 24.8
Sindh
1972 11.1 13.0 24.1 11.7 14.5 26.2
1981 11.1 13.2 24.3 11.6 13.3 24.9
1998 13.5 14.6 28.1 11.3 13.2 24.5
N.W.F.P.
1972 10.8 11.6 22.4 12.1 13.3 25.4
1981 10.6 11.9 22.5 12.1 12.2 24.2
1998 12.8 12.6 25.4 11.1 11.3 22.5
Balochistan
1972 10.2 12.9 23.1 12.4 14.3 26.7
1981 9.5 13.0 22.5 11.6 12.1 23.7
1998 12.7 13.8 26.5 10.6 11.9 22.5
F.A.T.A.
1981 0.0 26.4 26.4 0.0 22.6 22.6
1998 0.0 12.5 12.5 0.0 10.7 10.7
Islamabad
1981 11.9 14.4 26.2 11.9 15.7 27.7
1998 13.0 15.4 28.4 12.8 16.4 29.2 Source: Population Census Organization

76
Table 1.9: Percent of Population Aged 15 - 59 And 60 Years And Above, Pakistan And Provinces
Age 15- 59 Years Age 60 Years And Above Year
Women Men Both Sexes Women Men Both Sexes
Pakistan
1972 22.8 26.3 49.2 3.0 4.0 7.0
1981 23.0 25.5 48.5 2.9 4.0 7.0
1998* 24.7 26.4 51.1 2.5 3.0 5.5
Punjab
1972 22.9 26.1 49.0 3.1 4.4 7.6
1981 23.4 25.4 48.8 3.3 4.5 7.8
1998 24.9 26.4 51.3 2.8 3.4 6.2
Sindh
1972 22.8 27.6 50.4 2.5 3.2 5.8
1981 22.7 26.5 49.2 2.5 3.2 5.7
1998 24.8 27.9 52.6 2.1 2.5 4.6
N.W.F.P.
1972 23.0 24.9 47.8 2.9 3.8 6.7
1981 22.7 24.1 46.8 2.7 3.7 6.4
1998 24.0 23.9 47.9 2.2 2.7 4.9
Balochistan
1972 22.6 27.2 49.7 2.5 3.1 5.6
1981 21.1 25.1 46.2 2.3 3.0 5.3
1998 23.3 25.7 49.0 1.8 2.5 4.3
F.A.T.A.
1981 0.0 49.0 49.0 . . 5.2 5.2
1998 0.0 49.0 49.0 0.0 0.0 0.0
Islamabad
1981 23.8 30.1 53.9 2.3 3.3 5.6
1998 25.8 31.8 57.5 2.0 2.5 4.5 Source: Population Census Organization Statistics Division, Govt. of Pakistan * FATA is not included in Pakistan

77
Table 1.10: Population of Pakistan By Broad Age Group And Dependency Ratio, Pakistan And Provinces
Year Population under
15 years (Thousand)
Population 15-59 Years
(Thousand)
Population 60 +
(Thousand)
Total Population (Thousand)
Total Dependency
Ratio
Old Dependency
Ratio
1 2 3 4 5 6 7
Pakistan
1972 28,605 ( a ) 32,132 ( a ) 4,572 ( a ) 65,309 ( a ) 103.3 ( a ) 14.2 ( a ) 1981 36,519 ( b ) 39,802 ( b ) 5,733 ( b ) 82,055 ( b ) 106.2 ( b ) 14.4 ( b ) 1998 56,065 65,948 7,162 132,352 95.9 10.9
Punjab 1972 16,341 18,415 2,854 37,610 104.2 15.5 1981 20,521 23,082 3,690 47,292 104.9 16.0 1998 31,304 37,747 4,570 73,621 95.0 12.1
Sindh 1972 6,211 7,128 817 14,156 98.6 11.5 1981 8,580 9,364 1,085 19,029 103.2 11.6 1998 13,016 16,021 1,403 30,440 90.0 8.8
NWFP
1972 3,648* 3,842* 542* 8,032* 109.1* 14.1* 1981 5,179 5,171 712 11,061 113.9 13.8 1998 8,371 8,496 869 17,736 108.8 10.2
Balochistan
1972 1,084 1,208 137 2,429 101.1 11.3 1981 2,102 2,001 229 4,332 116.5 11.4 1998 3,064 3,219 282 6,566 103.9 8.8
FATA 1981 524 * * 560 * * 59 * * 1,143 * * 104.1** 10.5 ** 1998 1,582 *** 1,419 *** 175 *** 1,312 *** 123.8 *** 12.3 ***
Islamabad
1981 138 184 19 340 85.4 10.3 1998 305 464 37 805 73.7 8.0
Source: Population Census Organization Statistics Division, Govt. of Pakistan (a) Does not include Population of FATA, Kohistan Area & PATA of Hazara District.
(b) Population of FATA excluded . * Does not include Population of Hazara District & FATA adjoining Hazara District where special census schedules were used. * * Male Population only as female Population by broad age group is not available. *** Female data estimated.

78
Table 2.1: Marital Status of Population (15 Years and Above) by Gender, Pakistan and Provinces, 1972
(Percent) Ever Married Age Group Never Married
Currently Married
Widowed Divorced Total Pakistan Women
All Ages 15.0 74.2 10.5 0.3 10.8
15-19 65.6 34.1 0.2 0.1 0.4
20-24 21.3 77.7 0.7 0.3 1.0
25-29 7.2 91.1 1.3 0.4 1.7
30-34 3.6 93.6 2.4 0.4 2.8
35-39 2.1 93.7 3.8 0.4 4.2
40-44 1.9 90.0 7.6 0.4 8.0
45-49 1.5 87.4 10.7 0.3 11.1
50-54 1.5 76.0 22.1 0.3 22.4
55-59 1.6 75.9 22.2 0.2 22.5
60 Years & above 1.8 45.2 52.9 0.2 53.1
Men All Ages 31.8 63.1 4.9 0.2 5.1
15-19 92.6 7.2 0.1 0.1 0.2
20-24 67.8 31.6 0.5 0.1 0.6
25-29 36.1 62.5 1.2 0.3 1.5
30-34 17.4 80.2 2.0 0.3 2.4
35-39 9.2 87.8 2.7 0.3 3.0
40-44 6.4 89.1 4.2 0.3 4.5
45-49 4.3 90.2 5.2 0.3 5.5
50-54 3.7 88.0 8.0 0.3 8.3
55-59 3.4 86.5 9.8 0.3 10.1
60 Years & above 4.1 76.1 19.6 0.2 19.8 Contd…

79
Table 2.1: Marital Status of Population (15 Years and Above) by Gender, Pakistan and Provinces, 1972 (Percent)
Ever Married Age Group Never Married Currently Married Widowed Divorced Total
Punjab Women
All Ages 16.1 73.4 10.1 0.4 10.5
15-19 69.4 30.3 0.2 0.2 0.3
20-24 23.4 75.6 0.6 0.4 1.0
25-29 7.8 90.5 1.1 0.5 1.7
30-34 3.8 93.5 2.1 0.6 2.7
35-39 2.2 93.8 3.4 0.5 3.9
40-44 2.0 90.8 6.7 0.5 7.2
45-49 1.5 88.6 9.4 0.4 9.8
50-54 1.5 78.2 19.8 0.4 20.2
55-59 1.7 78.5 19.5 0.3 19.8
60 Years & above 1.9 47.3 50.6 0.3 50.8
Men
All Ages 31.7 62.5 5.6 0.3 5.9
15-19 93.2 6.5 0.1 0.1 0.2
20-24 68.7 30.6 0.5 0.2 0.7
25-29 36.0 62.3 1.4 0.4 1.7
30-34 17.1 80.3 2.2 0.4 2.6
35-39 8.9 87.8 2.9 0.4 3.3
40-44 6.3 88.8 4.5 0.4 4.9
45-49 4.2 89.8 5.6 0.4 6.0
50-54 3.7 87.3 8.6 0.3 9.0
55-59 3.6 85.6 10.5 0.3 10.8
60 Years & above 4.8 73.6 21.3 0.2 21.6 Contd…

80
Table 2.1: Marital Status of Population (15 Years and Above) by Gender, Pakistan and Provinces, 1972 (Percent)
Ever Married Age Group Never Married Currently Married
Widowed Divorced Total Sindh
Women
All Ages 12.2 76.8 10.9 0.1 11.1
15-19 55.5 44.1 0.3 0.1 0.4
20-24 16.5 82.5 0.8 0.2 1.0
25-29 5.3 93.0 1.5 0.2 1.7
30-34 2.4 94.5 2.9 0.2 3.1
35-39 1.4 93.9 4.5 0.2 4.7
40-44 1.2 89.4 9.2 0.2 9.4
45-49 1.0 85.4 13.5 0.1 13.6
50-54 1.1 72.5 26.3 0.1 26.4
55-59 1.0 71.5 27.5 0.1 27.6
60 Years & above 1.4 40.8 57.7 0.1 57.8
Men All Ages 31.4 64.3 4.2 0.1 4.3
15-19 89.6 10.2 0.1 0.0 0.2
20-24 63.0 36.5 0.5 0.1 0.5
25-29 34.5 64.4 1.1 0.1 1.2
30-34 18.0 79.9 2.0 0.1 2.1
35-39 10.1 87.1 2.7 0.1 2.8
40-44 6.9 88.6 4.4 0.1 4.5
45-49 4.8 89.7 5.3 0.1 5.5
50-54 4.0 87.5 8.4 0.1 8.5
55-59 3.4 86.7 9.8 0.1 10.0 60 Years & above 2.9 79.3 17.7 0.1 17.8
Contd…

81
Table 2.1: Marital Status of Population (15 Years and Above) by Gender, Pakistan and Provinces, 1972 (Percent)
Ever Married Age Group Never Married Currently Married
Widowed Divorced Total N.W.F.P Women
All Ages 15.2 73.1 11.5 0.3 11.7
15-19 64.6 35.0 0.2 0.1 0.3
20-24 21.7 77.3 0.7 0.3 1.0
25-29 8.6 89.8 1.3 0.3 1.6
30-34 4.9 92.1 2.7 0.3 3.0
35-39 3.1 92.4 4.2 0.3 4.5
40-44 2.9 88.1 8.7 0.3 9.0
45-49 2.3 85.2 12.3 0.2 12.5
50-54 2.2 73.0 24.6 0.2 24.9
55-59 1.9 71.0 26.9 0.2 27.1
60 Years & above 2.0 41.6 56.3 0.2 56.4
Men All Ages 32.4 64.0 3.5 0.1 3.7
15-19 94.6 5.3 0.1 0.0 0.1
20-24 72.4 27.2 0.3 0.1 0.4
25-29 38.4 60.7 0.7 0.1 0.9
30-34 17.3 81.3 1.3 0.2 1.5
35-39 8.4 89.7 1.7 0.2 1.9
40-44 6.0 91.3 2.6 0.2 2.7
45-49 4.0 92.5 3.3 0.2 3.4
50-54 3.3 91.3 5.3 0.2 5.4
55-59 2.9 90.0 6.9 0.2 7.1
60 Years & above 2.4 82.4 15.0 0.1 15.2 Contd…

82
Table 2.1: Marital Status of Population (15 Years and Above) by Gender, Pakistan and Provinces, 1972 (Percent)
Ever Married Age Group Never Married Currently Married
Widowed Divorced Total Balochistan
Women All Ages 12.5 76.3 11.0 0.2 11.2
15-19 61.5 37.9 0.4 0.2 0.6
20-24 18.6 80.0 1.1 0.3 1.4
25-29 6.0 92.0 1.7 0.3 2.0
30-34 2.5 94.3 2.9 0.3 3.2
35-39 1.4 94.3 4.1 0.2 4.3
40-44 1.3 89.7 8.7 0.2 8.9
45-49 1.0 86.5 12.3 0.2 12.5
50-54 1.1 72.3 26.4 0.2 26.6
55-59 0.9 71.5 27.5 0.2 27.6
60 Years & above 1.5 42.7 55.7 0.2 55.9
Men
All Ages 33.9 62.6 3.4 0.1 3.5
15-19 93.1 6.7 0.2 0.0 0.2
20-24 70.0 29.2 0.7 0.1 0.8
25-29 39.1 59.2 1.5 0.1 1.7
30-34 20.1 77.3 2.4 0.2 2.6
35-39 9.8 87.2 2.8 0.1 2.9
40-44 6.2 89.7 3.9 0.1 4.0
45-49 4.0 91.6 4.3 0.1 4.4
50-54 3.3 90.3 6.4 0.1 6.5
55-59 2.6 90.7 6.7 0.1 6.8
60 Years & above 2.7 85.3 11.8 0.1 12.0 Source: Population Census Organization Statistics Division, Govt. of Pakistan

83
Table 2.2: Marital Status of Population (15 Years and Above) by Gender, Pakistan and Provinces, 1981 (Percent)
Ever Married Age Group Never Married
Currently Married
Widowed Divorced Total
Pakistan
Women
All Ages 17.8 72.7 9.1 0.4 9.4
15-19 70.6 29.1 0.2 0.1 0.3
20-24 26.5 72.4 0.7 0.4 1.1
25-29 8.7 89.6 1.2 0.5 1.7
30-34 3.9 93.4 2.2 0.5 2.7
35-39 1.7 94.6 3.2 0.4 3.6
40-44 1.6 92.1 5.9 0.4 6.3
45-49 1.0 89.9 8.7 0.4 9.1
50-54 2.3 79.9 17.4 0.4 17.8
55-59 1.0 80.6 18.2 0.3 18.5
60 Years & above 2.6 49.6 47.5 0.3 47.8
Men All Ages 31.5 65.2 3.1 0.2 3.3
15-19 92.5 7.4 0.1 0.0 0.1
20-24 64.6 34.7 0.5 0.2 0.7
25-29 31.3 67.7 0.8 0.2 1.1
30-34 13.9 84.5 1.4 0.3 1.7
35-39 6.2 91.7 1.9 0.2 2.1
40-44 4.4 92.6 2.7 0.2 3.0
45-49 2.5 93.9 3.3 0.2 3.6
50-54 3.0 92.0 4.8 0.2 5.0
55-59 1.7 92.5 5.6 0.2 5.8
60 Years & above 2.6 85.5 11.7 0.2 11.9 Contd…

84
Table 2.2: Marital Status of Population (15 Years and Above) by Gender, Pakistan and Provinces, 1981
(Percent)
Ever Married Age Group Never Married
Currently Married Widowed Divorced Total
Punjab Women
All Ages 18.7 71.9 9.0 0.5 9.4
15-19 72.6 27.1 0.2 0.2 0.3
20-24 27.9 71.0 0.6 0.5 1.1
25-29 8.9 89.4 1.1 0.7 1.8
30-34 3.8 93.5 2.0 0.7 2.7
35-39 1.7 94.6 3.1 0.6 3.7
40-44 1.5 92.4 5.5 0.6 6.1
45-49 0.9 90.4 8.2 0.5 8.7
50-54 2.2 81.1 16.2 0.5 16.7
55-59 0.9 82.4 16.4 0.4 16.7
60 Years & above 2.5 51.5 45.7 0.3 46.0
Men All Ages 30.9 65.3 3.6 0.3 3.8
15-19 92.5 7.3 0.1 0.0 0.1
20-24 64.2 35.0 0.5 0.2 0.8
25-29 31.0 67.8 0.9 0.3 1.2
30-34 13.7 84.4 1.6 0.4 1.9
35-39 6.2 91.4 2.1 0.3 2.4
40-44 4.4 92.2 3.0 0.3 3.4
45-49 2.5 93.5 3.7 0.3 4.0
50-54 3.0 91.5 5.3 0.3 5.6
55-59 1.8 91.8 6.1 0.3 6.4
60 Years & above 2.5 84.1 13.0 0.3 13.3 Contd…

85
Table 2.2: Marital Status of Population (15 Years and Above) by Gender, and Provinces,1981 (Percent)
Ever Married Age Group Never Married
Currently Married Widowed Divorced Total
Sindh
Women All Ages 16.4 73.7 9.7 0.2 9.9
15-19 66.6 33.1 0.3 0.1 0.3
20-24 24.2 74.7 0.8 0.2 1.1
25-29 8.1 90.3 1.4 0.2 1.6
30-34 3.5 93.7 2.6 0.2 2.8
35-39 1.4 94.8 3.6 0.2 3.8
40-44 1.3 91.5 7.1 0.2 7.3
45-49 0.8 88.7 10.4 0.1 10.5
50-54 1.9 76.9 21.0 0.2 21.2
55-59 0.9 76.0 23.0 0.1 23.1
60 Years & above 2.6 42.7 54.5 0.2 54.7
Men
All Ages 31.9 65.2 2.7 0.1 2.8
15-19 91.3 8.6 0.1 0.0 0.1
20-24 63.2 36.1 0.5 0.2 0.7
25-29 31.2 67.9 0.8 0.1 0.9
30-34 14.6 83.9 1.4 0.1 1.5
35-39 6.9 91.2 1.8 0.1 1.9
40-44 4.7 92.3 2.9 0.1 3.0
45-49 2.8 93.7 3.4 0.1 3.5
50-54 3.1 91.8 5.0 0.2 5.1
55-59 1.9 92.4 5.7 0.1 5.8
60 Years & above 2.8 86.0 11.1 0.2 11.3 Contd…

86
Table 2.2: Marital Status of Population (15 Years and Above) by Gender, Pakistan and Provinces, 1981 (Percent)
Ever Married Age Group Never Married
Currently Married Widowed Divorced Total
Balochistan
Women
All Ages 15.2 76.1 8.3 0.4 8.7
15-19 70.4 29.0 0.4 0.2 0.6
20-24 23.7 74.8 1.1 0.4 1.5
25-29 7.1 91.0 1.5 0.4 1.8
30-34 2.9 94.4 2.3 0.4 2.7
35-39 1.1 95.8 2.8 0.3 3.1
40-44 1.1 93.1 5.4 0.4 5.7
45-49 0.5 91.8 7.3 0.3 7.7
50-54 1.9 82.6 15.1 0.4 15.5
55-59 0.5 82.5 16.8 0.3 17.0
60 Years & above 2.4 49.1 47.7 0.7 48.4
Men All Ages 34.6 63.5 1.8 0.1 2.0
15-19 93.6 6.2 0.2 0.0 0.2
20-24 67.1 31.9 0.8 0.2 1.0
25-29 31.9 66.9 1.1 0.1 1.2
30-34 15.0 83.2 1.7 0.1 1.8
35-39 6.2 92.1 1.6 0.1 1.7
40-44 4.5 93.1 2.3 0.2 2.5
45-49 2.1 95.7 2.1 0.1 2.2
50-54 2.9 93.9 3.1 0.1 3.2
55-59 1.2 95.7 3.1 0.1 3.1
60 Years & above 2.9 91.1 5.9 0.1 6.0 Contd…
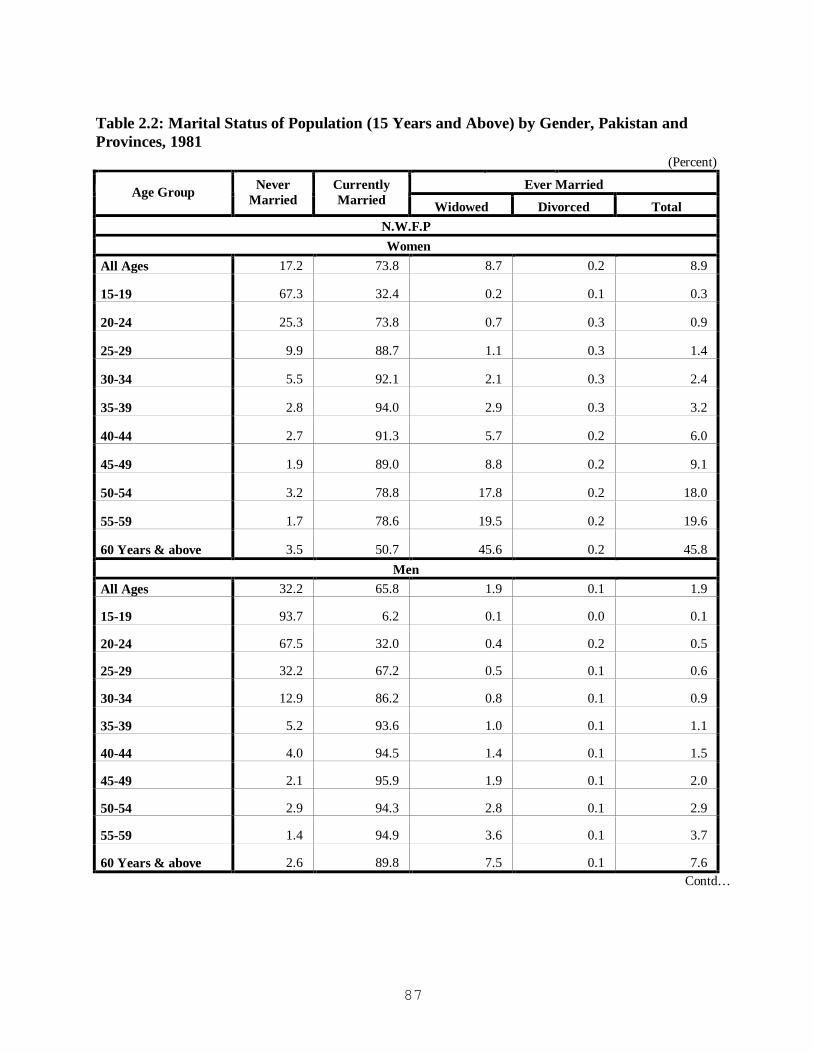
87
Table 2.2: Marital Status of Population (15 Years and Above) by Gender, Pakistan and Provinces, 1981 (Percent)
Ever Married Age Group Never Married
Currently Married Widowed Divorced Total
N.W.F.P Women
All Ages 17.2 73.8 8.7 0.2 8.9
15-19 67.3 32.4 0.2 0.1 0.3
20-24 25.3 73.8 0.7 0.3 0.9
25-29 9.9 88.7 1.1 0.3 1.4
30-34 5.5 92.1 2.1 0.3 2.4
35-39 2.8 94.0 2.9 0.3 3.2
40-44 2.7 91.3 5.7 0.2 6.0
45-49 1.9 89.0 8.8 0.2 9.1
50-54 3.2 78.8 17.8 0.2 18.0
55-59 1.7 78.6 19.5 0.2 19.6
60 Years & above 3.5 50.7 45.6 0.2 45.8 Men
All Ages 32.2 65.8 1.9 0.1 1.9
15-19 93.7 6.2 0.1 0.0 0.1
20-24 67.5 32.0 0.4 0.2 0.5
25-29 32.2 67.2 0.5 0.1 0.6
30-34 12.9 86.2 0.8 0.1 0.9
35-39 5.2 93.6 1.0 0.1 1.1
40-44 4.0 94.5 1.4 0.1 1.5
45-49 2.1 95.9 1.9 0.1 2.0
50-54 2.9 94.3 2.8 0.1 2.9
55-59 1.4 94.9 3.6 0.1 3.7
60 Years & above 2.6 89.8 7.5 0.1 7.6 Contd…

88
Table 2.2: Marital Status of Population (15 Years and Above) by Gender, Pakistan and Provinces, 1981 (Percent)
Ever Married Age Group Never Married
Currently Married Widowed Divorced Total
Islamabad
Women
All Ages 21.7 69.2 8.7 0.4 9.0
15-19 81.5 18.3 0.2 0.1 0.2
20-24 33.2 65.7 0.7 0.4 1.0
25-29 10.1 88.1 1.2 0.5 1.7
30-34 4.6 92.7 2.4 0.4 2.8
35-39 1.9 94.6 3.2 0.3 3.5
40-44 2.2 91.3 6.1 0.4 6.5
45-49 1.1 87.9 10.4 0.6 11.0
50-54 3.5 76.4 19.7 0.4 20.1
55-59 1.1 72.4 26.0 0.5 26.5
60 Years & above 3.6 42.5 53.5 0.4 53.9
Men All Ages 32.7 64.7 2.5 0.1 2.6
15-19 96.0 4.0 0.0 0.1 0.0
20-24 70.9 28.6 0.4 0.1 0.5
25-29 34.2 65.1 0.6 0.1 0.7
30-34 12.1 86.8 0.9 0.1 1.1
35-39 4.8 93.9 1.2 0.1 1.3
40-44 3.7 94.4 1.7 0.1 1.9
45-49 2.0 95.3 2.6 0.2 2.7
50-54 3.3 92.4 4.1 0.1 4.3
55-59 1.5 92.0 6.3 0.7 6.5
60 Years & above 3.9 83.1 12.7 0.0 13.0 Source: Population Census Organization, Statistics Division, Govt. of Pakistan

89
Table 2.3: Marital Status of Population (15 Years and Above) by Gender, Pakistan and Provinces,1998 (Percent)
Ever Married Age Group Never
Married Currently Married Widowed Divorced Total
Pakistan Women
All Ages 25.2 66.5 7.8 0.5 8.3
15-19 78.9 20.7 0.3 0.1 0.4
20-24 38.6 60.6 0.5 0.3 0.9
25-29 14.8 83.7 1.0 0.5 1.6
30-34 7.1 90.3 1.9 0.6 2.5
35-39 4.3 91.6 3.4 0.7 4.1
40-44 3.4 89.9 6.0 0.7 6.7
45-49 2.5 87.2 9.7 0.7 10.3
50-54 3.0 79.6 16.7 0.7 17.4
55-59 2.7 74.4 22.2 0.6 22.9
60 Years & above 5.4 48.8 45.2 0.6 45.8
Men All Ages 36.8 59.8 3.2 0.2 3.4
15-19 93.7 6.0 0.3 0.0 0.3
20-24 70.1 29.4 0.4 0.1 0.5
25-29 38.4 60.7 0.7 0.2 0.9
30-34 16.9 81.7 1.1 0.3 1.4
35-39 8.3 89.9 1.5 0.3 1.8
40-44 5.5 92.0 2.2 0.3 2.5
45-49 3.9 92.5 3.3 0.3 3.6
50-54 4.0 90.4 5.3 0.3 5.6
55-59 3.2 89.1 7.4 0.3 7.7
60 Years & above 4.5 78.1 17.1 0.3 17.4 Contd…

90
Table 2.3: Marital Status of Population (15 Years and Above) by Gender, Pakistan and Provinces,1998 (Percent)
Ever Married Age Group Never Married
Currently Married Widowed Divorced Total
Punjab Women
All Ages 26.0 65.1 8.2 0.7 9.6
15-19 83.9 15.7 0.3 0.1 0.4
20-24 42.7 56.4 0.5 0.5 1.0
25-29 15.5 82.8 1.0 0.7 1.7
30-34 6.6 90.7 1.9 0.8 2.7
35-39 3.7 91.9 3.4 1.0 4.3
40-44 2.9 90.3 5.9 0.9 6.8
45-49 2.1 87.7 9.4 0.9 10.3
50-54 2.4 80.7 16.0 0.8 16.9
55-59 2.2 75.5 21.5 0.8 22.3
60 Years & above 4.4 49.1 45.8 0.7 46.5 Men
All Ages 37.3 58.6 3.8 0.3 4.1
15-19 95.6 4.2 0.2 0.0 0.2
20-24 74.4 25.1 0.4 0.1 0.5
25-29 41.1 57.8 0.8 0.3 1.1
30-34 17.2 81.2 1.3 0.4 1.6
35-39 8.1 89.8 1.7 0.4 2.1
40-44 5.1 91.9 2.6 0.4 2.9
45-49 3.9 92.0 3.8 0.4 4.2
50-54 3.8 89.7 6.1 0.4 6.5
55-59 3.1 88.1 8.4 0.4 8.7
60 Years & above 3.9 76.2 19.6 0.4 19.9 Contd…

91
Table 2.3: Marital Status of Population (15 Years and Above) by Gender, Pakistan and Provinces,1998 (Percent)
Ever Married Age Group Never Married
Currently Married
Widowed Divorced Total Sindh Women
All Ages 24.4 67.5 7.8 0.3 8.1
15-19 72.3 27.1 0.5 0.1 0.5
20-24 34.4 64.8 0.6 0.2 0.8
25-29 14.7 83.9 1.2 0.3 1.5
30-34 8.3 89.2 2.1 0.4 2.5
35-39 4.9 90.9 3.7 0.5 4.2
40-44 4.0 88.5 7.1 0.5 7.6
45-49 2.8 85.2 11.6 0.4 12.0
50-54 3.8 75.6 20.2 0.4 20.6
55-59 3.4 69.8 26.3 0.4 26.8
60 Years & above 7.7 44.6 47.1 0.6 47.7
Men
All Ages 36.1 61.1 2.6 0.1 2.7
15-19 89.8 9.7 0.4 0.1 0.5
20-24 63.5 36.0 0.5 0.1 0.6
25-29 36.2 63.0 0.7 0.1 0.8
30-34 18.0 80.8 1.1 0.2 1.2
35-39 9.5 88.8 1.5 0.2 1.6
40-44 6.7 90.9 2.3 0.2 2.5
45-49 4.5 92.1 3.3 0.2 3.5
50-54 5.1 89.6 5.1 0.2 5.4
55-59 3.8 88.9 7.1 0.2 7.3
60 Years & above 6.6 78.8 14.3 0.3 14.6 Contd…

92
Table 2.3: Marital Status of Population (15 Years and Above) by Gender, Pakistan and Provinces,1998 (Percent)
Ever Married Age Group Never Married
Currently Married Widowed Divorced Total
N.W.F.P
Women
All Ages 24.1 68.8 6.8 0.2 7.1
15-19 73.8 25.9 0.3 0.1 0.3
20-24 31.5 67.9 0.4 0.2 0.6
25-29 13.2 85.6 0.9 0.3 1.2
30-34 8.1 89.9 1.7 0.3 2.0
35-39 5.8 90.8 3.0 0.3 3.3
40-44 4.8 89.7 5.2 0.3 5.5
45-49 3.7 87.4 8.6 0.3 8.9
50-54 4.2 80.3 15.2 0.3 15.6
55-59 4.0 74.6 21.0 0.3 21.4
60 Years & above 6.4 51.2 42.1 0.3 42.4
Men All Ages 37.3 60.7 1.9 0.1 2.0
15-19 94.5 5.3 0.2 0.0 0.2
20-24 69.9 29.9 0.2 0.0 0.2
25-29 35.3 64.3 0.4 0.1 0.4
30-34 15.0 84.4 0.5 0.1 0.6
35-39 7.4 91.9 0.7 0.1 0.7
40-44 4.9 94.0 1.0 0.1 1.0
45-49 3.4 95.0 1.5 0.1 1.6
50-54 3.5 93.7 2.8 0.1 2.9
55-59 2.9 92.6 4.3 0.1 4.4
60 Years & above 4.1 84.1 11.7 0.1 11.8 contd…

93
Table 2.3: Marital Status of Population (15 Years and Above) by Gender, Pakistan and Provinces, 1998 (Percent)
Ever Married Age Group Never Married
Currently Married Widowed Divorced Total
Balochistan
Women
All Ages 21.0 73.4 5.5 0.2 5.6
15-19 65.2 34.2 0.5 0.1 0.6
20-24 29.4 69.7 0.7 0.2 0.9
25-29 10.6 88.2 1.1 0.2 1.3
30-34 5.6 92.4 1.7 0.2 2.0
35-39 3.2 93.9 2.8 0.2 2.9
40-44 3.0 91.5 5.3 0.2 5.5
45-49 2.1 90.1 7.7 0.2 7.8
50-54 3.4 81.8 14.6 0.2 14.9
55-59 2.7 80.7 16.3 0.3 16.6
60 Years & above 7.2 57.9 34.5 0.4 34.9
Men All Ages 32.9 65.3 1.7 0.1 1.8
15-19 88.5 11.0 0.4 0.0 0.5
20-24 54.3 45.1 0.5 0.1 0.6
25-29 26.3 73.0 0.7 0.1 0.8
30-34 12.6 86.3 1.0 0.1 1.1
35-39 7.0 91.7 1.2 0.1 1.3
40-44 5.6 92.7 1.6 0.1 1.7
45-49 3.7 94.1 2.1 0.1 2.2
50-54 4.2 92.4 3.3 0.1 3.3
55-59 3.3 92.6 4.0 0.1 4.2
60 Years & above 5.5 86.6 7.7 0.1 7.9 Source: Population Census Organization, Statistics Division, Govt. of Pakistan

94
Table 2.4: Currently Married Population (15 Years and Above) by Gender, Age Urban- Rural Areas, Pakistan and Provinces, 1972 (Percent)
Urban Rural Age Group
Women Men Women Men
Pakistan
All Ages 70.5 59.8 75.5 64.3 15-19 28.2 4.7 36.7 8.3 20-24 72.4 26.5 79.8 34.0 25-29 90.1 60.0 91.4 63.5 30-34 93.6 80.5 93.6 80.1 35-39 93.3 87.9 93.8 87.8 40-44 88.8 88.9 90.5 89.2 45-49 84.9 89.8 88.2 90.4 50-54 70.9 86.7 77.6 88.5 55-59 69.7 85.2 77.6 87.0 60 Years & above 38.8 74.0 46.8 76.7
Punjab
All Ages 70.8 60.2 74.2 63.2 15-19 24.5 4.1 32.4 7.4 20-24 71.4 26.2 77.1 32.3 25-29 90.4 61.5 90.6 62.5 30-34 94.1 82.2 93.3 79.6 35-39 94.1 89.3 93.8 87.3 40-44 90.5 89.8 90.8 88.4 45-49 87.5 90.4 89.0 89.6 50-54 75.1 87.2 79.1 87.4 55-59 75.0 85.6 79.4 85.6 60 Years & above 43.0 72.7 48.3 73.9
Sindh
All Ages 61.1 59.3 80.8 68.2 15-19 33.9 5.7 54.3 13.9 20-24 74.8 28.0 88.7 44.4 25-29 82.4 59.1 94.8 68.7 30-34 69.7 78.6 95.2 80.9 35-39 84.3 86.1 94.8 87.9 40-44 55.1 87.3 91.1 89.6 45-49 74.8 88.3 87.8 90.8 50-54 36.0 85.2 76.7 89.2 55-59 61.4 83.5 76.5 88.6 60 Years & above 32.3 74.6 44.9 81.7
Contd….

95
Table 2.4: Currently Married Population (15 Years and Above) by Gender, Age Urban- Rural Areas, Pakistan and Provinces, 1972 (Percent)
Urban Rural Age Group
Women Men Women Men
N.W.F.P
All Ages 67.5 59.3 74.0 64.9
15-19 27.6 3.6 36.5 5.7
20-24 67.7 20.9 79.2 28.8
25-29 86.1 54.3 90.5 62.1
30-34 90.2 78.4 92.4 81.9
35-39 91.0 88.1 92.7 90.0
40-44 86.1 90.2 88.4 91.5
45-49 81.4 91.4 85.8 92.8
50-54 66.2 89.9 73.9 91.5
55-59 62.9 88.4 72.1 90.2
60 Years & above 34.5 80.9 42.5 82.6
Balochistan
All Ages 71.1 60.0 77.2 63.2
15-19 30.8 4.7 39.6 7.1
20-24 73.8 25.8 81.5 30.0
25-29 89.6 58.7 92.5 59.3
30-34 92.8 77.5 94.6 77.3
35-39 92.3 86.5 94.6 87.4
40-44 87.0 88.1 90.2 90.1
45-49 82.1 89.7 87.3 92.0
50-54 64.9 87.6 73.4 90.8
55-59 56.6 87.6 73.5 91.2
60 Years & above 33.2 79.9 43.9 86.1 Source: Population Census Organization Statistics Division, Govt. of Pakistan

96
Table 2.5: Currently Married Population (15 Years and Above) by Gender, Age Urban- Rural Areas, Pakistan and Provinces, 1981 (Percent)
Urban Rural Age Group Women Men Women Men
Pakistan All Ages 68.2 61.4 74.6 67.0 15-19 22.1 4.9 32.5 8.6 20-24 65.6 29.3 75.6 37.7 25-29 87.7 65.2 90.4 68.9 30-34 93.0 85.0 93.5 84.2 35-39 94.4 92.1 94.8 91.5 40-44 91.0 93.0 92.4 92.4 45-49 87.5 93.9 90.8 94.0 50-54 75.7 91.1 81.4 92.4 55-59 74.9 91.5 82.4 92.8 60 Years & above 44.0 82.4 51.2 86.4
Punjab
All Ages 68.4 61.8 73.1 66.7 15-19 20.1 4.5 30.1 8.6 20-24 65.5 29.5 73.3 37.6 25-29 88.6 66.5 89.6 68.4 30-34 93.8 86.2 93.3 83.6 35-39 94.9 92.9 94.5 90.8 40-44 92.1 93.4 92.5 91.8 45-49 89.2 94.1 90.8 93.2 50-54 78.4 91.1 82.0 91.6 55-59 78.9 91.6 83.5 91.9 60 Years & above 47.2 81.7 52.8 84.8
Sindh All Ages 67.7 60.8 78.5 69.1 15-19 24.4 5.4 43.1 11.8 20-24 65.5 29.2 83.1 43.3 25-29 87.0 63.8 92.9 71.4 30-34 92.4 83.7 94.7 84.1 35-39 94.0 91.1 95.4 91.2 40-44 89.8 92.3 92.7 92.3 45-49 85.3 93.3 91.0 94.2 50-54 71.9 90.7 80.1 92.6 55-59 68.9 91.0 80.1 93.4 60 + 38.5 82.9 44.9 87.8
Contd…

97
Table 2.5: Currently Married Population (15 Years and Above) by Gender, Age Urban- Rural Areas, Pakistan and Provinces, 1981 (Percent)
Urban Rural Age Group
Women Men Women Men
N.W.F.P
All Ages 68.1 60.9 74.8 66.8
15-19 25.8 5.0 33.8 6.5
20-24 65.8 27.4 75.4 33.2
25-29 84.1 62.8 89.5 68.2
30-34 90.0 83.7 92.5 86.7
35-39 92.4 91.9 94.3 94.0
40-44 89.2 93.8 91.7 94.6
45-49 84.7 94.9 89.7 96.1
50-54 73.0 93.3 79.7 94.4
55-59 69.2 93.1 79.9 95.2
60 Years & above 41.8 87.3 51.9 90.1
Balochistan
All Ages 71.2 60.7 77.0 64.1
15-19 27.4 5.3 29.4 6.3
20-24 70.8 30.7 75.7 32.3
25-29 88.9 64.7 91.5 67.4
30-34 92.8 82.6 94.6 83.3
35-39 94.1 90.1 96.0 92.5
40-44 89.7 90.9 93.7 93.5
45-49 86.3 93.1 92.7 96.2
50-54 71.5 89.2 84.2 94.7
55-59 71.2 91.8 84.0 96.4
60 Years & above 39.3 82.9 50.5 92.3 Source: Population Census Organization, Statistics Division, Govt. of Pakistan

98
Table 2.6: Currently Married Population (15 Years and Above) by Gender, Age Urban- Rural Areas, Pakistan and Provinces, 1998 (Percent)
Urban Rural Age Group Women Men Women Men
Pakistan All Ages 61.4 55.8 69.2 62.1 15-19 12.9 3.3 25.0 7.6 20-24 49.8 20.1 66.1 35.1 25-29 78.7 52.0 86.2 66.0 30-34 88.8 78.8 91.2 83.6 35-39 90.9 89.2 92.0 90.3 40-44 89.1 92.1 90.3 91.9 45-49 85.4 92.8 88.1 92.3 50-54 76.8 90.5 80.9 90.3 55-59 69.4 89.0 76.7 89.1 60 Years & above 44.5 76.5 50.5 78.8
Punjab
All Ages 61.3 55.9 66.9 60.0 15-19 9.9 2.4 18.6 5.1 20-24 47.3 18.1 60.7 28.9 25-29 79.4 51.7 84.4 61.1 30-34 90.5 80.1 90.8 81.8 35-39 92.2 90.3 91.8 89.5 40-44 90.3 92.9 90.3 91.3 45-49 86.8 93.2 88.1 91.4 50-54 79.1 90.9 81.4 89.2 55-59 72.2 89.0 76.8 87.8 60 Years & above 46.4 75.4 50.0 76.4
Sindh
All Ages 60.4 54.9 74.7 68.1 15-19 15.0 4.2 40.7 16.1 20-24 51.2 21.5 77.7 52.7 25-29 76.9 50.7 90.5 76.5 30-34 86.2 76.0 92.5 86.5 35-39 89.0 87.3 92.9 90.8 40-44 87.2 90.5 89.8 91.3 45-49 83.1 91.8 87.3 92.4 50-54 73.1 89.1 78.1 90.0 55-59 64.4 88.2 75.6 89.7 60 Years & above 40.0 76.4 48.6 80.9
Contd…

99
Table 2.6: Currently Married Population (15 Years and Above) by Gender, Age Urban- Rural Areas, Pakistan and Provinces, 1998
(Percent)
Urban Rural Age Group
Women Men Women Men N.W.F.P
All Ages 64.0 56.8 69.8 61.7 15-19 20.5 3.5 27.1 5.7 20-24 58.3 21.5 69.8 32.1 25-29 80.2 55.2 86.7 66.7 30-34 87.9 80.5 90.4 85.5 35-39 89.6 89.8 91.1 92.5 40-44 88.4 93.2 90.0 94.3 45-49 84.7 94.4 88.0 95.1 50-54 76.6 93.1 81.0 93.8 55-59 68.6 92.4 75.7 92.7 60 + 46.4 83.6 52.0 84.2
Balochistan All Ages 66.8 60.6 75.5 67.0 15-19 23.6 6.9 37.8 12.4 20-24 61.7 33.3 72.4 49.7 25-29 83.3 64.9 89.7 76.1 30-34 89.5 83.1 93.4 87.7 35-39 91.2 89.8 94.7 92.5 40-44 89.1 91.6 92.3 93.1 45-49 85.9 92.7 91.4 94.6 50-54 75.6 90.5 83.6 93.0 55-59 71.4 90.4 83.4 93.4 60 Years & above 48.7 82.5 60.4 87.6
Islamabad All Ages 62.6 58.5 63.3 57.5 15-19 8.8 2.4 11.5 2.4 20-24 42.1 15.6 51.6 17.7 25-29 75.9 47.1 81.6 52.1 30-34 89.6 80.2 91.2 82.4 35-39 92.0 91.9 92.2 92.6 40-44 91.4 95.1 90.6 94.5 45-49 87.4 95.7 86.6 94.9 50-54 81.3 94.1 78.9 93.4 55-59 74.3 92.9 71.4 91.1 60 Years & above 50.9 82.5 42.4 79.0 Source: Population Census Organization, Statistics Division, Govt. of Pakistan

100
Table 2.7: Never Married Population (15 Years and Above) by Gender Age, Pakistan and Provinces
(Percent) Women Men
Age Group 1972 1981 1998 1972 1981 1998
Pakistan All Ages 15.0 17.8 25.2 31.8 31.5 36.8 15-19 65.6 70.6 78.9 92.6 92.5 93.7 20-24 21.3 26.5 38.6 67.8 64.6 70.1 25-29 7.2 8.7 14.8 36.1 31.3 38.4 30-34 3.6 3.9 7.1 17.4 13.9 16.9 35-39 2.1 1.7 4.3 9.2 6.2 8.3 40-44 1.9 1.6 3.4 6.4 4.4 5.5 45-49 1.5 1.0 2.5 4.3 2.5 3.9 50-54 1.5 2.3 3.0 3.7 3.0 4.0 55-59 1.6 1.0 2.8 3.4 1.7 3.2 60 Years & above 1.8 2.6 5.4 4.1 2.6 4.5
Punjab All Ages 16.1 18.7 26.0 31.7 30.9 37.3 15-19 69.4 72.6 83.9 93.2 92.5 95.6 20-24 23.4 27.9 42.7 68.7 64.2 74.4 25-29 7.8 8.9 15.5 36.0 31.0 41.1 30-34 3.8 3.8 6.6 17.1 13.7 17.2 35-39 2.2 1.7 3.7 8.9 6.2 8.1 40-44 2.0 1.5 2.9 6.3 4.4 5.2 45-49 1.5 0.9 2.1 4.2 2.5 3.9 50-54 1.5 2.2 2.4 3.7 3.0 3.8 55-59 1.7 0.9 2.2 3.6 1.8 3.1 60 Years & above 1.9 2.5 4.4 4.8 2.5 3.9
Sindh All Ages 12.2 16.4 24.4 31.4 31.9 36.1 15-19 55.5 66.6 72.3 89.6 91.3 89.8 20-24 16.5 24.2 34.4 63.0 63.2 63.5 25-29 5.3 8.1 14.7 34.5 31.2 36.2 30-34 2.4 3.5 8.3 18.0 14.6 18.0 35-39 1.4 1.4 4.9 10.1 6.9 9.5 40-44 1.2 1.3 4.0 6.9 4.7 6.7 45-49 1.0 0.8 2.8 4.8 2.8 4.5 50-54 1.1 1.9 3.8 4.0 3.1 5.1 55-59 1.0 0.9 3.4 3.4 1.9 3.8 60 Years & above 1.4 2.6 7.7 2.9 2.8 6.6
Contd…

101
Table 2.7: Never Married Population (15 Years and Above) by Gender Age, Pakistan and Provinces
(Percent) Women Men
Age Group 1972 1981 1998 1972 1981 1998
N.W.F.P All Ages 15.2 17.2 24.1 32.4 32.2 37.3 15-19 64.6 67.3 73.8 94.6 93.7 94.5 20-24 21.7 25.3 31.5 72.4 67.5 69.9 25-29 8.6 9.9 13.2 38.4 32.2 35.3 30-34 4.9 5.5 8.1 17.3 12.9 15.0 35-39 3.1 2.8 5.8 8.4 5.2 7.4 40-44 2.9 2.7 4.8 6.0 4.0 4.9 45-49 2.3 1.9 3.7 4.0 2.1 3.4 50-54 2.2 3.2 4.2 3.3 2.9 3.5 55-59 1.9 1.7 4.0 2.9 1.4 2.9 60 Years & above 2.0 3.5 6.4 2.4 2.6 4.1
Balochistan All Ages 12.5 15.2 21.0 33.9 34.6 32.9 15-19 61.5 70.4 65.2 93.1 93.6 88.5 20-24 18.6 23.7 29.4 70.0 67.1 54.3 25-29 6.0 7.1 10.6 39.1 31.9 26.3 30-34 2.5 2.9 5.6 20.1 15.0 12.6 35-39 1.4 1.1 3.2 9.8 6.2 7.0 40-44 1.3 1.1 3.0 6.2 4.5 5.6 45-49 1.0 0.5 2.1 4.0 2.1 3.7 50-54 1.1 1.9 3.4 3.3 2.9 4.2 55-59 0.9 0.5 2.7 2.6 1.2 3.3 60 Years & above 1.5 2.4 7.2 2.7 2.9 5.5
Islamabad All Ages . . . 21.7 30.1 . . . 32.7 39.8 15-19 . . . 81.5 89.9 . . . 96.0 97.4 20-24 . . . 33.2 54.1 . . . 70.9 83.5 25-29 . . . 10.1 21.0 . . . 34.2 50.9 30-34 . . . 4.6 7.9 . . . 12.1 18.4 35-39 . . . 1.9 4.7 . . . 4.8 7.0 40-44 . . . 2.2 3.6 . . . 3.7 3.9 45-49 . . . 1.1 3.1 . . . 2.0 2.7 50-54 . . . 3.5 3.3 . . . 3.3 2.9 55-59 . . . 1.1 3.1 . . . 1.5 2.6 60 Years & above . . . 3.6 5.4 . . . 3.9 4.0 Source: Population Census Organization … Not available

102
Table 2.8: Singulate Mean Age At Marriage By Gender, Pakistan And Provinces
Year Women Men Difference (Female) - (Male)
Pakistan 1961 16.7 23.3 -6.6 1972 19.7 25.7 -6.0 1981 20.2 25.1 -4.9 1991 20.7 25.2 -4.5 1994 21.3 25.5 -4.2 1995 21.2 25.5 -4.3 1996 21.6 25.7 -4.1 1997 21.4 25.6 -4.2 1999 22.1 26.3 -4.2 2000 22.1 26.3 -4.2 2001 22.1 26.3 -4.2 2003 22.3 26.4 -4.1
Punjab 1961 17.8 23.4 -5.6 1972 20.1 25.8 -5.7 1981 20.4 23.3 -2.9 1991 21.2 25.2 -4.0 1994 21.7 25.4 -3.7 1995 21.7 25.7 -4 1996 21.8 25.7 -3.9 1997 21.8 25.8 -4 1999 22.7 26.7 -4 2000 22.7 26.6 -3.9 2001 22.8 26.7 -3.9
Sindh 1961 16.7 23.1 -6.4 1972 18.8 25.3 -6.5 1981 19.7 24.6 -4.9 1991 20.3 25.0 -4.7 1994 21.1 25.7 -4.6 1995 21.0 25.4 -4.4 1996 20.7 25.1 -4.4 1997 20.7 24.7 -4 1999 21.4 25.7 -4.3 2000 21.4 25.7 -4.3 2001 21.9 26.1 -4.2
Contd…

103
Table 2.8: Singulate Mean Age At Marriage By Gender, Pakistan And Provinces
Year Women Men Difference (Female) - (Male)
N.W.F.P
1961 17.9 24.1 -6.2
1972 19.7 26.2 -6.5
1981 19.7 24.9 -5.2
1991 19.6 25.2 -5.6
1994 20.2 25.9 -5.7
1995 21.6 25.9 -4.3
1996 20.6 25.4 -4.8
1997 21.3 26.0 -4.7
1999 21.6 26.3 -4.7
2000 21.5 26.2 -4.7
2001 22.0 26.4 -4.4
Balochistan
1961 16.1 24.0 -7.9
1972 19.3 26.3 -7.0
1981 19.9 25.1 -5.2
1991 19.0 23.6 -4.6
1994 20.4 24.6 -4.2
1995 19.8 24.3 -4.5
1996 19.6 25.8 -6.2
1997 20.4 27.7 -7.3
1999 20.0 25.2 -5.2
2000 20.0 25.3 -5.3
2001 20.7 25.3 -4.6 Source: i) Population Census Organization, ii) Pakistan Demographic Survey, Federal Bureau of Statistics, Statistics Division,
Govt. of Pakistan

104
Table 2.9: Crude Birth Rates by Gender, Urban- Rural Areas, Pakistan and Provinces
Crude Birth Rates Per 1000 Population
All Areas Urban Area Rural Area Year Both Sexes Male Female Both
Sexes Male Female Both Sexes Male Female
Pakistan 1996 35.2 35.7 34.8 31.3 31.2 31.5 37.1 37.9 36.3 1997 33.8 34.1 33.5 30.1 30.4 29.7 35.6 35.9 35.3 1999 30.2 30.4 30.1 27.8 27.6 28.0 32.2 32.6 31.8 2000 29.1 29.2 29.0 25.8 25.5 26.1 31.8 32.3 31.2 2001 27.8 28.3 27.4 25.0 24.7 25.2 29.4 30.2 28.6 2003 26.5 26.5 26.5 24.1 24.0 24.1 27.9 27.9 27.8
Punjab 1996 35.3 35.5 35.0 30.9 30.3 31.5 37.2 37.9 36.5 1997 34.1 35.6 32.5 30.3 31.3 29.3 35.8 37.6 34.0 1999 30.8 31.0 30.6 28.6 28.6 28.7 32.5 33.0 32.0 2000 29.0 29.0 29.1 25.2 24.7 25.8 32.1 32.6 31.7 2001 27.8 27.7 28.0 24.5 23.9 25.1 30.5 30.8 30.3 2003 26.4 26.5 26.4 23.9 24.1 23.7 27.9 28.0 27.9
Sindh 1996 35.5 34.8 36.2 32.8 32.4 33.3 37.9 37.0 39.0 1997 33.7 32.0 35.5 29.3 28.8 30.0 37.8 35.0 40.8 1999 29.2 28.9 29.5 25.1 24.6 25.6 33.7 33.6 33.8 2000 28.7 28.1 29.4 25.0 24.0 26.1 32.6 32.3 32.8 2001 27.5 28.9 26.1 24.0 24.7 23.3 31.4 33.3 29.2 2003 26.1 25.8 26.5 23.5 23.0 24.0 28.5 28.4 28.6
NWFP 1996 35.6 39.6 31.4 30.1 33.5 26.4 36.7 40.9 32.4 1997 33.9 35.3 32.6 31.3 32.7 29.9 34.7 36.0 33.3 1999 30.2 31.0 29.4 30.0 30.5 29.4 30.4 31.3 29.4 2000 29.9 32.3 27.5 29.3 31.2 27.3 30.3 33.0 27.5 2001 28.3 31.2 25.4 27.1 27.8 26.5 28.9 33.1 24.8 2003 27.3 28.3 26.2 26.9 27.6 26.1 27.4 28.5 26.2
Balochistan 1996 32.9 32.0 34.0 25.4 26.6 24.0 35.1 33.5 36.9 1997 32.5 29.3 36.2 29.6 28.5 30.8 33.4 29.5 37.8 1999 29.1 28.5 29.7 28.9 27.6 30.5 29.2 28.9 29.4 2000 29.0 28.3 29.9 28.8 30.2 27.2 29.2 27.2 31.4 2001 27.7 24.3 31.6 27.5 24.9 30.4 27.9 23.7 32.5 2003 26.7 25.2 28.4 26.8 25.9 27.8 26.7 25.0 28.5
Source: Federal Bureau of Statistics

105
Table 2.10: Crude Birth Rates By Gender And Urban - Rural Areas, Pakistan and Provinces
Female Crude Birth Rates Per 1000 Population Male Crude Birth Rates Per 1000 Population Year
All Areas Urban Rural All Areas Urban Rural
Pakistan
1996 34.8 31.5 36.3 35.7 31.2 37.9 1997 33.5 29.7 35.3 34.1 30.4 35.9 1999 30.1 28.0 31.8 30.4 27.6 32.6 2000 29.0 26.1 31.2 29.2 25.5 32.3 2001 27.4 25.2 28.6 28.3 24.7 30.2 2003 26.5 24.1 27.8 26.5 24.0 27.9
Punjab
1996 35.0 31.5 36.5 35.5 30.3 37.9 1997 32.5 29.3 34.0 35.6 31.3 37.6 1999 30.6 28.7 32.0 31.0 28.6 33.0 2000 29.1 25.8 31.7 29.0 24.7 32.6 2001 28.0 25.1 30.3 27.7 23.9 30.8 2003 26.4 23.7 27.9 26.5 24.1 28.0
Sindh
1996 36.2 33.3 39.0 34.8 32.4 37.0 1997 35.5 30.0 40.8 32.0 28.8 35.0 1999 29.5 25.6 33.8 28.9 24.6 33.6 2000 29.4 26.1 32.8 28.1 24.0 32.3 2001 26.1 23.3 29.2 28.9 24.7 33.3 2003 26.5 24.0 28.6 25.8 23.0 28.4
N.W.F.P
1996 31.4 26.4 32.4 39.6 33.5 40.9 1997 32.6 29.9 33.3 35.3 32.7 36.0 1999 29.4 29.4 29.4 31.0 30.5 31.3 2000 27.5 27.3 27.5 32.3 31.2 33.0 2001 25.4 26.5 24.8 31.2 27.8 33.1 2003 26.2 26.1 26.2 28.3 27.6 28.5
Balochistan
1996 34.0 24.0 36.9 32.5 26.6 33.5 1997 36.2 30.8 37.8 29.3 28.5 29.5 1999 29.7 30.5 29.4 28.5 27.6 28.9 2000 29.9 27.2 31.4 28.3 30.2 27.2 2001 31.6 30.4 32.5 24.3 24.9 23.7 2003 28.4 27.8 28.5 25.2 25.9 25.0
Source: Pakistan Demographic Survey, FBS.

106
Table 2.11: Age Specific Fertility Rates (ASFR) Per 1000 Women, Pakistan and Provinces
Age Group 1996 1997 1999 2000 2001 2003
Pakistan Total 163.7 152.8 134.9 127.6 120.8 15-19 54.7 52.3 36.2 32.9 24.2 23.7 20-24 258.2 231.0 205.6 195.1 162.0 163.1 25-29 295.9 273.2 257.5 244.2 242.9 229.6 30-34 255.4 211.2 203.6 203.8 197.2 190.0 35-39 143.0 142.9 118.3 114.5 118.5 112.7 40-44 65.5 68.4 61.7 54.4 57.9 49.0 45-49 23.2 30.7 25.8 22.9 21.9 18.8
Punjab Total 162.1 151.9 134.6 124.3 118.4 15-19 45.1 41.3 27.2 22.4 21.4 20.2 20-24 263.7 230.9 203.3 184.0 164.1 159.8 25-29 303.1 287.6 284.5 260.4 255.1 239.9 30-34 259.9 214.0 212.1 212.5 196.1 194.8 35-39 137.5 146.7 115.2 112.5 103.1 109.7 40-44 62.5 62.3 52.2 48.9 51.9 41.6 45-49 16.4 23.4 23.2 18.6 15.1 17.0
Sindh Total 164.9 152.6 133.1 130.0 123.9 15-19 64.0 58.3 41.6 49.4 25.9 24.8 20-24 245.3 228.7 199.1 202.5 142.9 159.7 25-29 280.9 262.4 218.6 205.3 238.1 216.7 30-34 256.1 191.7 197.5 184.1 204.8 183.5 35-39 157.0 149.0 120.3 121.6 135.8 116.9 40-44 67.2 60.1 76.1 68.4 69.7 56.9 45-49 34.8 31.8 35.9 35.2 37.6 22.2
NWFP Total 167.2 154.7 136.6 133.1 122.7 15-19 77.9 70.0 52.7 41.3 26.6 35.5 20-24 270.7 227.9 222.6 210.7 159.1 171.7 25-29 296.8 260.6 227.7 256.2 229.5 206.7 30-34 229.7 243.3 192.8 210.8 213.8 187.3 35-39 136.4 118.5 128.4 122.1 137.7 115.4 40-44 63.1 90.7 71.4 44.1 59.8 64.7 45-49 32.2 36.8 18.1 18.0 25.7 21.2
Balochistan Total 167.2 154.9 142.3 142.1 131.4 15-19 61.8 63.2 76.0 63.0 35.3 24.9 20-24 225.9 241.7 216.0 254.1 211.7 198.0 25-29 278.2 244.8 230.4 216.1 221.6 245.7 30-34 267.7 184.5 159.4 172.2 154.6 174.4 35-39 158.3 152.6 117.6 86.2 141.7 123.4 40-44 96.6 74.5 77.3 85.1 60.0 56.4 45-49 36.1 56.4 35.1 34.7 21.8 19.8
Source: Federal Bureau of Statistics

107
Table 2.12: Crude Death Rates by Gender, Urban - Rural Areas, Pakistan and Provinces
Crude Death Rates Per 1000 Population
All Areas Urban Area Rural Area Year
Both Sexes Male Female Both
Sexes Male Female Both Sexes Male Female
Pakistan 1996 8.8 9.3 8.2 7.1 8.0 6.1 9.6 10.0 9.2 1997 8.9 9.5 8.3 7.3 7.7 6.9 9.6 10.3 8.9 1999 8.3 8.9 7.7 7.1 7.6 6.6 9.2 9.9 8.5 2000 7.8 8.2 7.4 6.7 7.0 6.3 8.8 9.2 8.3 2001 7.2 7.4 6.9 6.3 6.6 6.0 7.6 7.9 7.3 2003 7.0 7.3 6.6 6.2 6.6 5.8 7.4 7.7 7.0
Punjab 1996 9.1 9.4 8.6 7.1 7.9 6.3 9.9 10.2 9.7 1997 9.2 9.7 8.7 7.8 7.9 7.7 9.9 10.5 9.2 1999 8.3 9.0 7.5 7.4 7.9 6.8 9.0 9.8 8.1 2000 8.0 8.0 8.0 7.0 6.7 7.3 8.7 9.0 8.5 2001 7.4 7.5 7.3 6.7 6.9 6.4 8.0 8.1 7.9 2003 7.3 7.6 6.9 6.6 6.8 6.5 7.6 8.0 7.2
Sindh 1996 8.6 9.3 8.0 7.3 8.3 6.1 9.9 10.1 9.7 1997 8.8 9.1 8.3 6.5 7.6 5.3 10.9 10.6 11.2 1999 7.9 8.2 7.5 6.2 6.4 6.0 9.7 10.2 9.2 2000 7.8 8.9 6.6 5.9 7.1 4.6 9.8 10.7 8.8 2001 6.5 7.6 5.3 5.7 6.1 5.3 7.4 9.2 5.3 2003 6.3 6.6 5.0 5.5 6.4 4.6 7.0 6.7 7.2
NWFP 1996 8.6 9.9 7.3 7.3 8.7 5.7 8.9 10.2 7.7 1997 8.9 10.2 7.5 7.6 7.9 7.3 9.2 10.9 7.5 1999 8.8 9.7 7.8 7.7 9.1 6.2 9.4 10.0 8.7 2000 7.6 8.7 6.5 6.8 8.3 5.1 8.1 9.0 7.3 2001 7.1 7.5 6.7 6.0 6.2 5.8 7.7 8.2 7.2 2003 6.9 7.6 6.2 5.9 5.9 5.9 7.1 7.9 6.2
Balochistan 1996 6.8 6.9 6.6 4.2 4.5 4.0 7.5 7.6 7.4 1997 7.5 7.9 7.2 7.1 6.6 7.8 7.7 8.3 7.0 1999 9.5 9.3 9.6 8.6 7.9 9.6 9.8 10.0 9.6 2000 7.0 6.5 7.6 6.9 6.9 6.9 7.0 6.2 7.9 2001 7.5 6.4 8.8 6.5 6.7 6.3 8.4 6.2 10.8 2003 7.3 7.3 7.2 6.4 6.5 6.3 7.5 7.6 7.4
Source: Federal Bureau of Statistics

108
Table 2.13: Crude Death Rates by Gender and Urban- Rural Areas, Pakistan and Provinces
Female Crude Death Rates Per 1000 Population Male Crude Death Rates Per 1000 Population Year
All Areas Urban Rural All Areas Urban Rural Pakistan
1996 8.2 6.1 9.2 9.3 8.0 10.0 1997 8.3 6.9 8.9 9.5 7.7 10.3 1999 7.7 6.6 8.5 8.9 7.6 9.9 2000 7.4 6.3 8.3 8.2 7.0 9.2 2001 6.9 6.0 7.3 7.4 6.6 7.9 2003 6.6 5.8 7.0 7.3 6.6 7.7
Punjab
1996 8.6 6.3 9.7 9.4 7.9 10.2 1997 8.7 7.7 9.2 9.7 7.9 10.5 1999 7.5 6.8 8.1 9.0 7.9 9.8 2000 8.0 7.3 8.5 8.0 6.7 9.0 2001 7.3 6.4 7.9 7.5 6.9 8.1 2003 6.9 6.5 7.2 7.6 6.8 8.0
Sindh
1996 8.0 6.1 9.7 9.3 8.3 10.1 1997 8.3 5.3 11.2 9.1 7.6 10.6 1999 7.5 6.0 9.2 8.2 6.4 10.2 2000 6.6 4.6 8.8 8.9 7.1 10.7 2001 5.3 5.3 5.3 7.6 6.1 9.2 2003 5.0 4.6 7.2 6.6 6.4 6.7
N.W.F.P
1996 7.3 5.7 7.7 9.9 8.7 10.2 1997 7.5 7.3 7.5 10.2 7.9 10.9 1999 7.8 6.2 8.7 9.7 9.1 10.0 2000 6.5 5.1 7.3 8.7 8.3 9.0 2001 6.7 5.8 7.2 7.5 6.2 8.2 2003 6.2 5.9 6.2 7.6 5.9 7.9
Balochistan
1996 6.6 4.0 7.4 6.9 4.5 7.6 1997 7.2 7.8 7.0 7.9 6.6 8.3 1999 9.6 9.6 9.6 9.3 7.9 10.0 2000 7.6 6.9 7.9 6.5 6.9 6.2 2001 8.8 6.3 10.8 6.4 6.7 6.2 2003 7.2 6.3 7.4 7.3 6.5 7.6
Source: Pakistan Demographic Survey Federal Bureau of Statistics
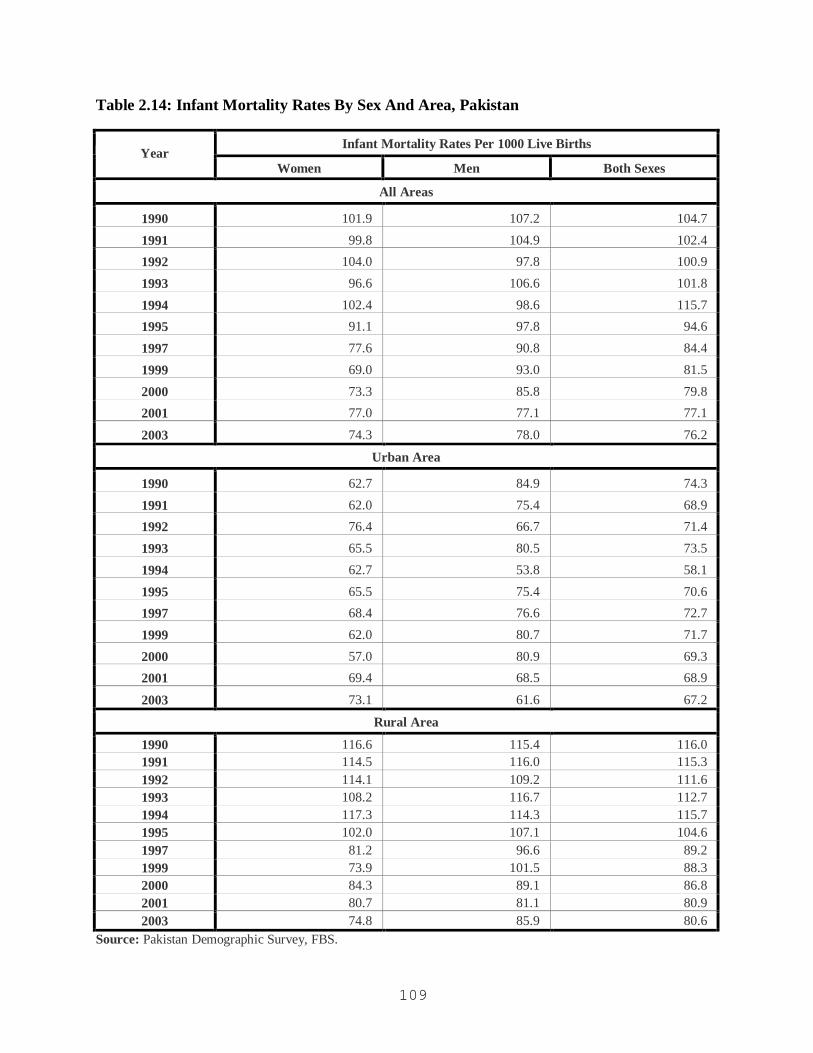
109
Table 2.14: Infant Mortality Rates By Sex And Area, Pakistan
Infant Mortality Rates Per 1000 Live Births Year
Women Men Both Sexes
All Areas
1990 101.9 107.2 104.7
1991 99.8 104.9 102.4 1992 104.0 97.8 100.9
1993 96.6 106.6 101.8
1994 102.4 98.6 115.7 1995 91.1 97.8 94.6
1997 77.6 90.8 84.4
1999 69.0 93.0 81.5
2000 73.3 85.8 79.8 2001 77.0 77.1 77.1
2003 74.3 78.0 76.2
Urban Area
1990 62.7 84.9 74.3
1991 62.0 75.4 68.9 1992 76.4 66.7 71.4
1993 65.5 80.5 73.5
1994 62.7 53.8 58.1
1995 65.5 75.4 70.6 1997 68.4 76.6 72.7
1999 62.0 80.7 71.7
2000 57.0 80.9 69.3 2001 69.4 68.5 68.9
2003 73.1 61.6 67.2
Rural Area
1990 116.6 115.4 116.0 1991 114.5 116.0 115.3 1992 114.1 109.2 111.6 1993 108.2 116.7 112.7 1994 117.3 114.3 115.7 1995 102.0 107.1 104.6 1997 81.2 96.6 89.2 1999 73.9 101.5 88.3 2000 84.3 89.1 86.8 2001 80.7 81.1 80.9 2003 74.8 85.9 80.6
Source: Pakistan Demographic Survey, FBS.

110
Table 2.15: Infant Mortality Rates by Sex, Area and Provinces
Deaths Per 1000 Live Births
All Areas Urban Area Rural Area Year
Both Sexes Male Female Both
Sexes Male Female Both Sexes Male Female
Pakistan 1997 84.4 90.8 77.6 72.7 76.6 68.4 89.2 96.6 81.2
1999 81.5 93.0 69.0 71.8 80.8 62.0 88.3 101.5 73.9
2000 79.8 85.5 73.3 69.3 80.9 57.0 86.8 89.1 84.3
2001 77.1 77.1 77.0 68.9 68.5 69.4 80.9 81.1 80.7
2003 76.2 78.0 74.3 67.2 61.6 73.1 80.6 85.9 74.8
Punjab 1997 86.0 94.7 76.1 73.8 80.7 66.1 93.7 103.4 82.5
1999 83.1 94.2 71.0 71.9 80.4 62.8 90.9 104.0 76.7
2000 81.7 82.8 80.6 70.5 73.6 67.3 88.9 88.6 89.3
2001 77.5 78.4 76.6 69.6 65.0 74.4 82.6 86.9 78.1
2003 77.6 77.0 78.2 69.4 62.0 77.5 81.7 84.7 78.5
Sindh 1997 79.8 79.4 80.3 70.3 71.7 68.9 89.2 87.4 90.9
1999 74.5 91.2 56.3 61.7 81.0 41.2 84.9 99.4 69.0
2000 73.1 90.2 55.2 60.6 86.5 34.6 83.2 93.1 72.5
2001 71.7 74.8 68.0 61.3 55.7 67.6 80.4 89.8 68.3
2003 71.2 71.5 70.7 61.2 57.8 64.9 78.4 81.5 75.1
NWFP 1997 82.6 89.0 75.6 72.1 70.5 73.9 89.5 101.2 76.7
1999 79.6 86.2 72.4 73.2 77.3 68.8 83.2 91.2 74.4
2000 77.9 83.9 70.6 70.9 86.1 52.3 81.6 82.7 80.2
2001 71.0 72.7 82.3 68.1 74.6 60.8 81.6 71.8 94.6
2003 76.1 85.0 66.4 66.5 65.7 67.4 78.0 88.7 66.2
Balochistan
1997 92.2 100.4 84.7 79.1 83.9 74.1 103.9 117.6 93.0
1999 91.6 102.4 79.5 91.3 87.3 95.7 91.8 113.8 67.1
2000 89.0 92.5 85.2 85.9 89.0 81.8 91.5 95.9 87.5
2001 87.4 86.6 88.1 84.0 108.3 61.5 90.3 67.2 109.1
2003 84.3 99.3 69.2 81.5 79.4 83.8 85.2 105.5 64.9 Source: Federal Bureau of Statistics

111
Table 2.16: Age Specific Death Rates by Gender, Pakistan and Provinces Rates Per 1000 Population Rates Per 1000 Population Rates Per 1000 Population Rates Per 1000 Population
1999 2000 2001 2003 Age Group
Women Men Both Sexes Women Men Both Sexes Women Men Both
Sexes Women Men Both Sexes
Pakistan TOTAL 7.7 8.9 8.3 7.4 8.2 7.8 6.9 7.4 7.2 6.4 7.5 7.0 00-04 83.9 123.7 103.8 100.3 122.5 111.6 78.5 85.2 81.9 05-09 10.1 8.9 9.5 10.7 8.2 9.4 5.5 5.7 5.6 0.6 1.1 0.8 10-14 3.0 2.7 2.8 5.9 4.6 5.3 1.7 1.5 1.6 0.1 0.7 0.4 15-19 2.5 2.6 2.5 2.7 2.6 2.7 1.7 0.8 1.2 1.3 0.6 0.9 20-24 1.9 1.9 1.9 1.0 1.4 1.2 1.3 1.5 1.4 1.9 1.4 1.7 25-29 3.9 2.9 3.4 1.1 1.7 1.4 2.3 1.5 1.9 1.6 1.9 1.8 30-34 2.6 3.4 3.0 1.2 2.0 1.6 1.9 2.2 2.1 1.7 2.3 2.0 35-39 3.8 3.5 3.7 1.8 1.0 1.4 1.8 3.4 2.5 2.6 2.7 2.6 40-44 3.7 3.6 3.7 1.7 3.0 2.3 3.5 4.8 4.2 3.1 3.8 3.5 45-49 4.6 5.8 5.2 3.1 3.7 3.4 4.1 3.9 4.0 4.1 5.6 4.8 50-54 2.7 4.7 3.8 3.3 3.3 3.3 4.3 6.4 5.4 12.9 10.0 11.4 55-59 8.5 9.1 8.8 8.5 7.6 8.0 8.1 9.1 8.7 14.7 16.7 15.8 60-64 8.5 10.2 9.4 7.9 15.1 11.7 13.1 13.2 13.2 20.7 26.3 23.7 65-69 20.7 15.2 17.7 16.5 19.8 18.4 22.6 18.4 20.3 35.0 21.0 27.2 70+ 48.8 53.0 51.3 44.9 46.6 45.9 53.1 53.3 53.2 73.6 82.0 78.4
Punjab TOTAL 7.5 9.0 8.3 8.0 8.0 8.0 7.3 7.5 7.4 6.9 7.6 7.3 00-04 23.8 28.8 26.3 25.3 23.9 24.6 19.7 21.1 20.4 21.6 22.6 22.1 05-09 3.4 2.7 3.0 7.1 3.7 5.4 2.0 1.3 1.6 0.1 0.9 0.5 10-14 2.7 2.6 2.7 3.3 2.9 3.1 2.1 0.4 1.2 0.1 0.5 0.3 15-19 1.1 0.7 0.9 0.5 1.1 0.8 1.5 2.0 1.8 1.1 0.6 0.9 20-24 3.2 2.0 2.6 1.1 1.7 1.4 2.4 1.6 2.0 1.6 0.8 1.2 25-29 2.1 2.4 2.3 0.9 2.0 1.4 2.6 3.1 2.8 2.5 2.2 2.3 30-34 2.7 4.3 3.5 1.7 0.4 1.1 2.2 3.4 2.8 1.0 2.5 1.7 35-39 2.9 4.7 3.8 0.7 3.7 2.2 3.1 4.0 3.6 2.3 2.8 2.6 40-44 3.9 5.0 4.5 3.2 3.6 3.4 1.4 4.2 2.8 1.3 4.8 3.1 45-49 3.6 4.8 4.2 3.5 3.3 3.4 5.0 7.2 6.1 4.5 4.8 4.6 50-54 7.0 8.3 7.7 12.3 4.6 8.1 6.5 8.9 7.8 14.3 9.5 11.7 55-59 7.0 9.5 8.3 6.4 15.8 11.3 12.7 9.1 10.9 14.2 16.5 15.4 60-64 15.5 16.6 16.1 17.9 19.7 18.8 27.0 12.8 19.2 23.3 26.1 24.8 65-69 29.9 23.5 26.3 19.2 29.0 24.6 40.5 28.8 34.0 32.8 15.2 23.0 70+ 62.6 75.9 70.4 71.2 60.7 65.1 64.2 68.2 66.5 71.8 77.0 74.7
Sindh TOTAL 7.5 8.2 7.9 6.6 8.9 7.8 5.3 7.6 6.5 6.0 6.6 6.3 00-04 22.6 28.5 25.6 23.6 28.7 26.2 14.4 20.1 17.3 17.1 16.7 16.9 05-09 1.9 2.5 2.2 3.9 5.2 4.5 0.6 1.5 1.0 1.4 1.3 1.3 10-14 1.9 1.7 1.8 1.7 1.9 1.8 0.0 1.2 0.6 0.0 0.0 0.0 15-19 2.4 3.4 3.0 0.8 1.9 1.4 0.8 0.7 0.8 1.5 0.0 0.7 20-24 5.6 3.3 4.5 1.0 2.5 1.7 0.9 0.9 0.9 3.2 2.5 2.9 25-29 2.7 4.6 3.6 1.3 3.0 2.2 1.7 1.7 1.7 0.5 1.6 1.1 30-34 5.9 1.6 3.6 2.5 0.7 1.6 1.4 2.7 2.1 1.4 3.4 2.4 35-39 5.6 1.6 3.5 4.7 3.2 3.9 4.2 5.9 5.1 3.2 2.9 3.0 40-44 3.5 5.2 4.4 4.5 3.9 4.2 6.4 2.8 4.5 5.7 1.8 3.7 45-49 1.4 3.6 2.6 1.3 4.6 3.0 2.3 6.0 4.3 5.5 6.7 6.2 50-54 13.6 7.5 10.1 3.1 14.3 9.0 5.7 12.9 9.4 13.1 8.7 10.7 55-59 11.0 15.6 13.5 7.2 16.5 12.2 16.0 23.3 20.0 13.5 22.9 18.6 60-64 22.1 15.3 18.0 11.5 23.5 18.7 16.2 32.5 25.8 15.5 26.5 21.6 65-69 7.6 15.9 13.1 33.9 25.8 29.0 25.0 31.8 29.0 35.2 37.8 36.6 70+ 53.9 56.8 55.7 43.8 55.4 50.8 70.3 78.6 75.0 52.1 88.7 72.4
Contd…

112
Table 2.16: Age Specific Death Rates by Gender, Pakistan and Provinces
Rates Per 1000 Population Rates Per 1000 Population Rates Per 1000 Population Rates Per 1000 Population 1999 2000 2001 Age
Group Women Men Both Sexes Women Men Both
Sexes Women Men Both Sexes Women Men Both
Sexes N.W.F.P
TOTAL 7.8 9.7 8.8 6.5 8.7 7.6 6.7 7.5 7.1 6.2 7.6 6.9
00-04 18.4 26.3 22.4 21.5 22.5 22.1 19.0 19.5 19.2 15.1 17.2 16.2
05-09 2.7 3.5 3.1 5.5 7.8 6.7 1.6 1.2 1.4 0.7 1.2 1.0
10-14 3.1 2.8 2.9 1.4 3.5 2.5 1.9 1.3 1.6 0.4 2.0 1.2
15-19 3.0 3.3 3.1 3.2 2.2 2.7 1.4 1.7 1.5 1.7 1.6 1.7
20-24 4.5 5.3 4.9 2.0 0.6 1.3 1.6 2.8 2.2 1.6 1.8 1.7
25-29 3.3 3.3 3.3 1.6 0.9 1.2 0.7 0.8 0.7 0.7 2.3 1.5
30-34 5.0 4.6 4.8 1.9 3.6 2.6 1.8 5.4 3.4 5.2 2.1 3.8
35-39 3.2 3.4 3.3 1.0 0.0 0.5 4.0 5.9 4.9 3.1 0.0 1.7
40-44 7.1 12.1 9.7 1.3 5.3 3.3 6.2 4.2 5.3 1.3 2.8 2.0
45-49 1.5 7.2 4.4 6.0 2.9 4.4 5.4 4.2 4.8 0.0 5.6 2.8
50-54 9.9 12.2 11.1 3.7 8.9 6.4 12.1 6.6 9.3 13.1 15.6 14.3
55-59 10.8 7.1 8.8 8.4 113.7 11.3 13.1 16.1 14.7 9.4 9.9 9.6
60-64 35.0 10.6 21.7 17.1 20.6 19.1 17.4 22.6 20.2 14.6 28.9 22.1
65-69 16.6 19.6 18.4 20.7 31.4 26.8 33.0 3.6 16.4 50.7 20.4 33.3
70+ 106.1 85.3 92.3 32.7 61.4 50.6 70.1 96.9 85.8 94.3 89.4 91.4
Balochistan TOTAL 9.6 9.3 9.5 7.6 6.5 7.0 8.8 6.4 8.8 7.2 7.3 7.3
00-04 26.1 27.1 26.6 23.4 28.7 26.0 25.6 20.8 25.6 20.4 24.1 22.2
05-09 5.0 2.1 3.4 4.2 3.7 3.9 2.3 3.2 2.3 1.1 2.0 1.5
10-14 1.8 5.4 3.8 3.4 1.3 2.2 3.2 0.6 3.2 0.0 0.0 0.0
15-19 5.8 4.7 5.2 1.1 0.0 0.5 1.2 0.0 1.2 0.0 0.0 0.0
20-24 1.4 6.3 3.9 0.0 0.0 0.0 6.0 0.0 6.0 0.0 3.2 1.7
25-29 5.8 7.5 6.6 4.5 0.0 2.3 1.5 1.5 1.5 0.0 0.0 0.0
30-34 4.0 1.7 2.8 0.0 3.7 1.9 0.0 1.7 0.0 1.6 0.0 0.8
35-39 6.5 1.9 4.0 2.2 1.7 1.9 4.2 4.9 4.2 12.7 1.7 7.1
40-44 10.7 2.3 6.2 0.0 0.0 0.0 9.6 4.3 9.6 2.3 4.2 3.3
45-49 0.0 2.7 1.5 3.1 0.0 1.4 3.1 7.4 3.1 2.8 8.7 6.2
50-54 0.0 17.6 9.2 3.8 10.6 7.3 16.5 6.6 16.5 11.0 9.1 9.9
55-59 14.1 4.6 8.4 34.3 4.4 16.1 12.1 10.0 12.1 22.1 11.0 16.6
60-64 48.0 10.6 25.5 17.9 0.0 6.6 26.8 11.0 26.8 27.4 21.5 23.7
65-69 40.8 28.8 32.7 40.8 43.1 42.4 29.0 24.0 29.0 13.5 40.7 30.5
70+ 90.9 90.9 90.9 62.5 13.4 28.2 166.7 92.3 166.7 209.0 114.6 142.9 Source: Pakistan Demographic Survey, FBS.

113
Table 2.17: Life Expectancy by Age, Pakistan (In Year)
1991 1996 2001 2003 Age
Women Men Women Men Women Men Women Men
00 61.36 59.31 64.22 62.82 66.02 64.70 65.56 64.73
01 69.29 67.21 69.61 68.63 70.21 69.28 69.41 68.93
05 67.30 64.91 67.74 66.27 67.74 66.83 67.18 66.55
10 62.89 60.18 63.16 61.63 63.28 62.32 62.39 61.93
15 58.25 55.44 58.53 56.88 58.81 57.55 57.43 57.12
20 53.61 50.93 53.84 52.28 54.18 52.97 52.63 52.36
25 49.41 46.31 49.19 47.65 59.76 48.35 48.03 47.67
30 45.05 1.71 44.84 43.47 45.22 43.86 43.45 43.12
35 40.43 37.20 40.22 39.04 40.60 39.57 38.92 38.59
40 35.89 32.75 36.13 34.58 36.28 35.47 34.42 34.11
45 31.49 28.59 31.50 30.18 31.99 31.12 29.97 29.72
50 26.93 24.59 27.34 26.36 27.63 27.06 25.70 25.60
55 22.83 20.70 23.70 22.64 23.68 23.22 12.82 21.82
Source: Pakistan Demographic Survey, FBS

114
Table 3.1: Percentage Distribution of Households By Gender Headship
1996-97 1998-99 2001-02 Provinces\Areas
Women Men Women Men Women Men
PAKISTAN 6.8 93.2 7.9 92.1 8.1 91.9
Urban 6.3 93.8 7.8 92.2 8.3 91.7
Rural 7.0 93.0 7.9 92.1 8.0 92.0
PUNJAB 7.7 92.3 9.2 90.8 9.3 90.7
Urban 7.0 93.0 9.1 90.9 9.8 90.2
Rural 8.0 92.0 9.2 90.8 9.1 90.9
SINDH 2.4 97.6 2.8 97.2 2.5 97.5
Urban 4.7 95.3 5.4 94.6 5.5 94.6
Rural 0.4 99.6 0.8 99.2 0.4 99.6
N.W.F.P 10.3 89.7 14.3 85.7 14.6 85.5
Urban 9.5 90.5 11.5 88.5 10.8 89.2
Rural 10.4 89.6 14.8 85.2 15.2 84.8
BALOCHISTAN 2.9 97.1 1.5 98.5 2.2 97.8
Urban 3.2 96.8 3.6 96.5 3.0 97.0
Rural 2.8 97.2 1.2 98.8 2.0 98.0 Source: Household Integrated Economic Survey, (HIES) 1996-97
Pakistan Integrated Household Survey, (PIHS), FBS

115
Table 3.2: Percentage Distribution of Head of Household By Gender And Marital Status, Pakistan And Provinces
Year / Sex Never Married Married Widowed Divorced
1996-97 Pakistan
Both sexes 3.2 90.5 5.8 0.4 Women 0.1 4.4 2.3 0.1 Men 3.2 86.2 3.6 0.4
Punjab Both sexes 3.1 89.3 7.2 0.5 Women 0.0 4.9 2.8 0.1 Men 3.0 84.5 4.4 0.4
Sindh Both sexes 3.6 92.5 3.8 0.1 Women 0.0 0.8 1.5 0.1 Men 3.6 91.7 2.2 0.2
N.W.F.P Both sexes 3.5 91.4 4.4 0.7 Women 0.1 8.5 1.6 0.0 Men 3.4 82.8 2.8 0.7
Balochistan Both sexes 2.1 95.6 2.4 - Women 0.0 1.8 1.1 - Men 2.1 93.8 1.3 -
1998-99 Pakistan
Both sexes 3.6 89.2 6.9 0.4 Women 0.1 4.7 3.0 0.1 Men 3.4 84.4 3.9 0.3
Punjab Both sexes 3.3 88.4 7.8 0.5 Women 0.1 5.5 3.5 0.1 Men 3.1 82.9 4.3 0.4
Sindh Both sexes 4.7 89.2 5.8 0.3 Women 0.0 0.5 2.3 0.1 Men 4.7 88.8 3.5 0.2
N.W.F.P Both sexes 3.2 90.0 6.7 0.1 Women 0.2 11.0 3.1 0.0 Men 3.0 79.0 3.6 0.1
Balochistan Both sexes 2.4 95.4 2.1 0.1 Women 0.0 1.1 0.4 0.0 Men 2.4 94.3 1.8 0.1 Sources: Household Integrated Economic Survey, (HIES) 1996-97
Pakistan Integrated Household Survey, (PIHS) FBS. Table 3.2: Percentage Distribution of Head of Households By Gender And Marital Status,
Pakistan And Provinces

116
Year / Sex Never Married Married Widowed
Divorced
2001-02
Pakistan
Both sexes 3.4 88.9 7.2 0.4
Women 0.1 4.7 3.2 0.1
Men 3.3 84.3 4 0.3
Punjab
Both sexes 3.2 87.9 8.3 0.6
Women 0.1 5.2 3.9 0.1
Men 3.1 82.7 4.4 0.5
Sindh
Both sexes 3.8 90.1 5.9 0.2
Women 0.0 0.4 2.0 0.1
Men 3.7 89.7 3.9 0.2
N.W.F.P
Both sexes 3.8 90.1 6.0 0.1
Women 0.2 11.0 3.3 0.1
Men 3.6 79.1 2.7 0.1
Balochistan
Both sexes 2.9 93.9 3.1 0.0
Women 0.0 1.4 0.8 0.0
Men 2.9 92.5 2.4 0.0 Sources: Household Integrated Economic Survey, (HIES) 1996-97
Pakistan Integrated Household Survey, (PIHS) FBS. Note:- (Seven cases of Nikah Solemnised but rukhsati has not been taken place treated as married.)
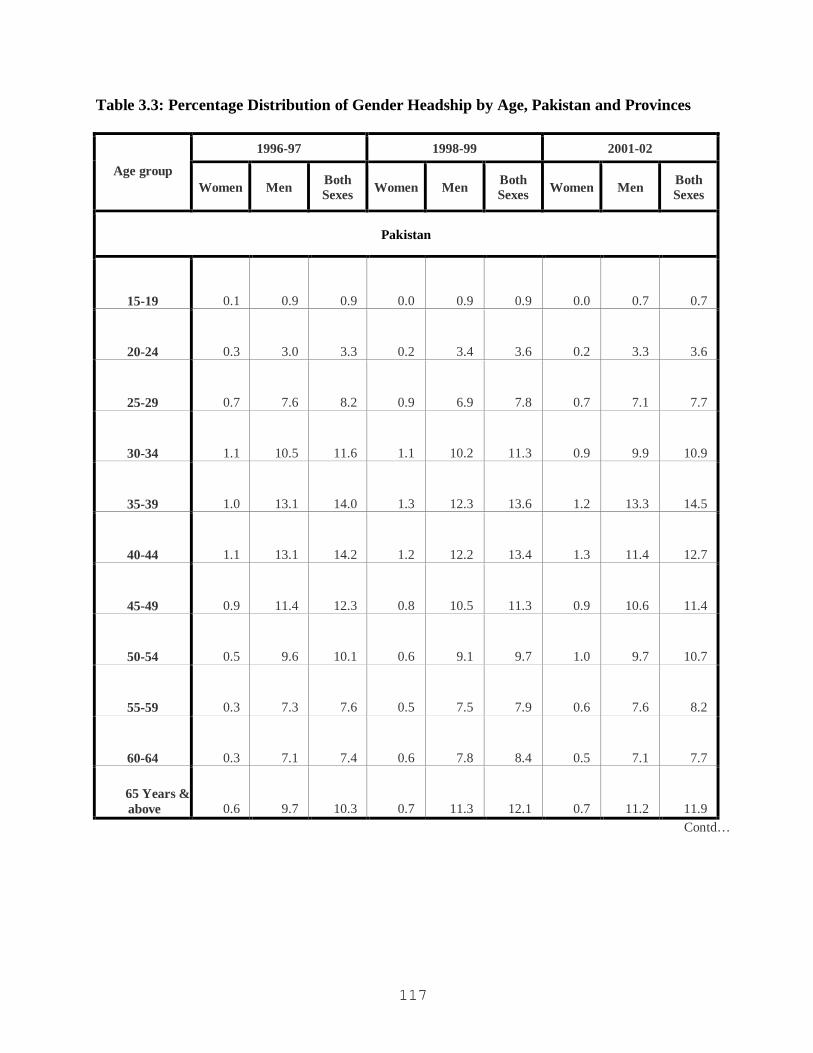
117
Table 3.3: Percentage Distribution of Gender Headship by Age, Pakistan and Provinces
1996-97 1998-99 2001-02
Age group Women Men Both
Sexes Women Men Both Sexes Women Men Both
Sexes
Pakistan
15-19 0.1 0.9 0.9 0.0 0.9 0.9 0.0 0.7 0.7
20-24 0.3 3.0 3.3 0.2 3.4 3.6 0.2 3.3 3.6
25-29 0.7 7.6 8.2 0.9 6.9 7.8 0.7 7.1 7.7
30-34 1.1 10.5 11.6 1.1 10.2 11.3 0.9 9.9 10.9
35-39 1.0 13.1 14.0 1.3 12.3 13.6 1.2 13.3 14.5
40-44 1.1 13.1 14.2 1.2 12.2 13.4 1.3 11.4 12.7
45-49 0.9 11.4 12.3 0.8 10.5 11.3 0.9 10.6 11.4
50-54 0.5 9.6 10.1 0.6 9.1 9.7 1.0 9.7 10.7
55-59 0.3 7.3 7.6 0.5 7.5 7.9 0.6 7.6 8.2
60-64 0.3 7.1 7.4 0.6 7.8 8.4 0.5 7.1 7.7
65 Years & above 0.6 9.7 10.3 0.7 11.3 12.1 0.7 11.2 11.9
Contd…

118
Table 3.3: Percentage Distribution of Gender Headship by Age, Pakistan And Provinces
1996-97 1998-99 2001-02
Age group Women Men Both
Sexes Women Men Both Sexes Women Men Both
Sexes
Punjab
15-19 0.1 0.8 0.8 0.1 0.8 0.9 0.0 0.5 0.5
20-24 0.4 2.7 3.0 0.2 2.9 3.1 0.3 3.0 3.3
25-29 0.8 6.6 7.4 1.1 5.6 6.7 0.7 6.2 6.9
30-34 1.2 9.4 10.6 1.1 9.7 10.9 1.0 9.7 10.7
35-39 1.0 12.0 13.1 1.5 121 13.6 1.3 13.3 14.6
40-44 1.3 12.2 13.5 1.3 11.7 13.0 1.4 11.2 12.6
45-49 1.1 11.3 12.4 0.9 10.4 11.3 1.0 10.4 11.4
50-54 0.6 10.5 11.1 0.7 9.0 9.7 1.2 9.5 10.7
55-59 0.3 7.4 7.7 0.5 8.0 8.5 0.8 7.5 8.3
60-64 0.3 7.8 8.1 0.7 8.2 8.9 0.6 7.1 7.7 65 Years & above 0.7 11.6 12.2 0.9 12.4 13.3 0.9 12.2 13.2
Sindh
15-19 0.0 0.9 0.9 0.0 1.1 1.1 0.0 1.0 1.0
20-24 0.0 4.1 4.1 0.0 4.1 4.1 0.0 4.2 4.2
25-29 0.0 10.6 10.7 0.1 9.9 10.0 0.1 10.0 10.1
30-34 0.4 14.4 14.8 0.2 12.3 12.5 0.1 11.7 11.8
35-39 0.1 16.7 16.8 0.3 14.1 14.4 0.2 14.9 15.2
40-44 0.5 15.7 16.2 0.4 13.9 14.3 0.5 12.2 12.7
45-49 0.4 12.2 12.5 0.1 10.7 10.8 0.1 11.3 11.4
50-54 0.3 8.0 8.2 0.2 8.6 8.8 0.6 10.1 10.6
55-59 0.4 5.4 5.8 0.4 6.5 6.9 0.3 7.2 7.4
60-64 0.2 4.7 4.9 0.5 7.0 7.5 0.3 6.4 6.6 65 Years & above 0.3 4.9 5.2 0.5 7.9 8.4 0.3 8.5 8.9
Contd…

119
Table 3.3: Percentage Distribution of Gender Headship by Age, Pakistan and Provinces
1996-97 1998-99 2001-02
Age group Women Men Both
Sexes Women Men Both Sexes Women Men Both
Sexes
NWFP
15-19 0.1 1.3 1.4 0.0 0.7 0.7 0.1 1.0 1.1
20-24 0.8 2.5 3.3 0.5 3.1 3.6 0.6 3.1 3.7
25-29 1.3 6.1 7.3 1.6 6.0 7.6 1.9 5.2 7.1
30-34 1.8 8.1 9.9 2.6 8.1 10.7 2.1 7.4 9.5
35-39 2.2 10.4 12.6 2.4 9.7 12.1 2.5 10.8 13.3
40-44 1.5 12.2 13.7 2.5 10.8 13.3 2.4 10.2 12.6
45-49 1.0 10.7 11.7 2.0 9.8 11.8 1.7 9.8 11.5
50-54 0.6 8.8 9.4 1.1 9.9 11.1 1.1 10.1 11.2
55-59 0.4 10.1 10.4 0.6 7.5 8.1 0.8 8.1 8.9
60-64 0.2 8.3 8.5 0.4 7.5 7.9 0.8 8.1 9.0 65 Years
& above 0.6 11.1 11.7 0.5 12.6 13.1 0.5 11.5 12.1 Balochistan
15-19 0.0 0.8 0.8 0.0 1.0 1.0 0.0 0.6 0.6
20-24 0.1 4.0 4.1 0.1 3.1 3.2 0.0 3.8 3.9
25-29 0.3 10.2 10.5 0.2 9.8 10.0 0.3 8.3 8.6
30-34 0.5 13.3 13.8 0.3 11.3 11.6 0.3 10.9 11.2
35-39 0.7 18.7 19.4 0.4 12.4 12.8 0.5 12.8 13.3
40-44 0.2 16.4 16.5 0.2 13.6 13.8 0.6 13.4 14.0
45-49 0.8 11.9 12.6 0.0 11.4 11.4 0.0 11.6 11.6
50-54 0.3 7.6 7.8 0.1 10.3 10.4 0.1 9.5 9.6
55-59 0.1 6.2 6.3 0.0 6.1 6.1 0.1 9.0 9.1
60-64 0.0 5.5 5.5 0.0 8.0 8.0 0.1 8.1 8.1 65 Years & above 0.1 2.7 2.8 0.1 11.6 11.6 0.1 9.9 10.0
Source:- Household Integrated Economic Survey, (HIES) 1996-97 Pakistan Integrated Household Survey, (PIHS), FBS Total may not match due to rounding

120
Table 3.4: Average Household Size by Gender, Place of Residence, Pakistan and Province
1996-97 1998-99 2001-02 Area/ Province Women Men Both
Sexes Women Men Both Sexes Women Men Both
Sexes
Pakistan
All Areas 3.0 3.2 6.2 3.4 3.4 6.8 3.5 3.5 7.0
Urban 3.1 3.3 6.4 3.3 3.4 6.7 3.4 3.5 6.9
Rural 3.0 3.2 6.1 3.4 3.4 6.8 3.5 3.5 7.0
Punjab
All Areas 3.0 3.1 6.1 3.3 3.3 6.5 3.3 3.3 6.5
Urban 3.1 3.3 6.4 3.3 3.3 6.5 3.3 3.3 6.6
Rural 3.0 3.1 6.0 3.5 3.9 7.4 3.3 3.2 6.5
Sindh
All Areas 2.7 3.1 5.9 3.2 3.5 6.7 3.7 3.9 7.5
Urban 3.0 3.3 6.3 3.2 3.4 6.6 3.5 3.6 7.1
Rural 2.6 2.9 5.5 3.3 3.6 6.9 3.8 4.1 7.9
NWFP
All Areas 3.5 3.6 7.1 4.0 3.8 7.8 3.9 3.8 7.7
Urban 3.3 3.4 6.7 3.8 3.8 7.6 3.7 3.9 7.6
Rural 3.6 3.6 7.2 4.0 3.8 7.8 3.9 3.7 7.7
Balochistan
All Areas 2.8 3.0 5.9 3.5 4.0 7.5 3.6 4.1 7.6
Urban 3.1 3.4 6.4 3.9 4.1 8.1 3.8 4.1 8.0
Rural 2.8 2.9 5.7 3.5 3.9 7.4 3.5 4.0 7.6 Source:- : Household Integrated Economic Survey, (HIES) 1996-97 Pakistan Integrated Household Survey, (PIHS), FBS Total may not match due to rounding
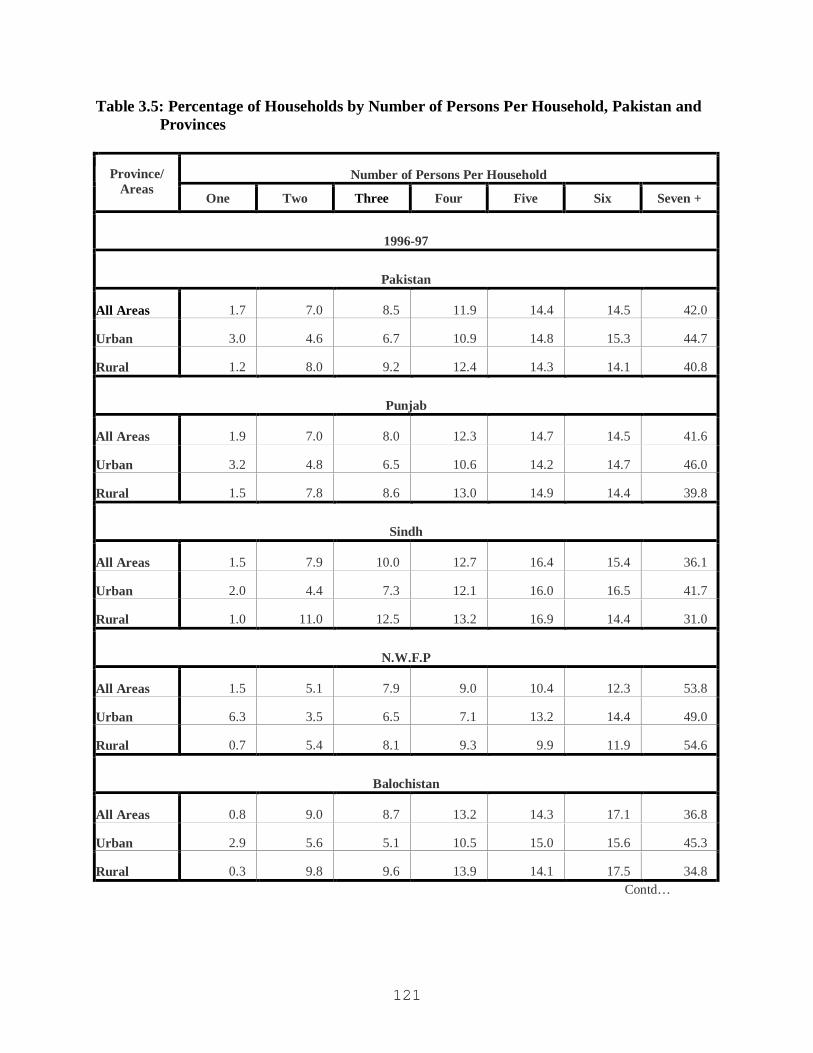
121
Table 3.5: Percentage of Households by Number of Persons Per Household, Pakistan and Provinces
Number of Persons Per Household Province/ Areas
One Two Three Four Five Six Seven +
1996-97
Pakistan
All Areas 1.7 7.0 8.5 11.9 14.4 14.5 42.0
Urban 3.0 4.6 6.7 10.9 14.8 15.3 44.7
Rural 1.2 8.0 9.2 12.4 14.3 14.1 40.8
Punjab
All Areas 1.9 7.0 8.0 12.3 14.7 14.5 41.6
Urban 3.2 4.8 6.5 10.6 14.2 14.7 46.0
Rural 1.5 7.8 8.6 13.0 14.9 14.4 39.8
Sindh
All Areas 1.5 7.9 10.0 12.7 16.4 15.4 36.1
Urban 2.0 4.4 7.3 12.1 16.0 16.5 41.7
Rural 1.0 11.0 12.5 13.2 16.9 14.4 31.0
N.W.F.P
All Areas 1.5 5.1 7.9 9.0 10.4 12.3 53.8
Urban 6.3 3.5 6.5 7.1 13.2 14.4 49.0
Rural 0.7 5.4 8.1 9.3 9.9 11.9 54.6
Balochistan
All Areas 0.8 9.0 8.7 13.2 14.3 17.1 36.8
Urban 2.9 5.6 5.1 10.5 15.0 15.6 45.3
Rural 0.3 9.8 9.6 13.9 14.1 17.5 34.8 Contd…

122
Table 3.5: Percentage of Households by Number of Persons Per Household, Pakistan and Provinces
Number of Persons Per Household Province/ Areas
One Two Three Four Five Six Seven +
1998-99
Pakistan
All Areas 1.6 5.3 7.6 10.2 12.7 14.3 48.3
Urban 2.4 4.7 7.6 9.7 13.9 15.2 46.5
Rural 1.3 5.6 7.6 10.4 12.1 13.9 49.1
Punjab
All Areas 1.9 5.5 7.8 10.5 13.1 15.1 46.1
Urban 2.5 4.4 7.9 8.9 14.7 15.7 45.9
Rural 0.2 4.7 6.7 9.0 13.4 12.1 53.9
Sindh
All Areas 1.2 6.0 8.3 11.1 12.4 14.4 46.7
Urban 2.1 5.4 7.5 11.6 13.5 15.0 44.8
Rural 0.4 6.4 9.0 10.8 11.5 13.8 48.1
N.W.F.P
All Areas 1.5 3.6 5.6 7.2 11.2 11.6 59.3
Urban 2.7 3.6 5.9 7.2 10.6 13.3 56.7
Rural 1.3 3.6 5.6 7.2 11.3 11.3 59.7
Balochistan
All Areas 0.4 4.4 6.4 8.8 13.1 12.1 54.7
Urban 2.1 2.5 4.2 7.8 10.4 12.5 60.5
Rural 0.2 4.7 6.7 9.0 13.4 12.1 53.9 Contd…

123
Table 3.5: Percentage of Households by Number of Persons Per Household, Pakistan and Provinces
Number of Persons Per Household Province/ Areas
One Two Three Four Five Six Seven +
2001-02
Pakistan
All Areas 1.1 4.8 6.8 10.2 12.9 13.9 50.4
Urban 1.6 4.7 6.6 9.5 15.1 14.1 48.5
Rural 1.0 4.8 6.8 10.5 11.9 13.8 51.2
Punjab
All Areas 1.4 5.4 7.4 11.1 13.8 14.8 46.1
Urban 1.8 4.7 6.6 9.8 15.8 14.7 46.6
Rural 1.2 5.7 7.7 11.7 12.9 14.8 45.9
Sindh
All Areas 0.6 4.3 6.0 9.1 12.0 12.1 56.0
Urban 1.2 5.1 6.7 9.6 14.5 13.2 49.7
Rural 0.2 3.7 5.5 8.8 10.2 11.2 60.4
N.W.F.P
All Areas 1.1 2.8 5.6 8.5 10.6 13.6 58.0
Urban 1.1 2.7 7.2 7.7 13.0 12.4 56.0
Rural 1.1 2.8 5.3 8.7 10.1 13.8 58.3
Balochistan
All Areas 0.5 3.9 5.9 8.3 11.7 12.4 57.3
Urban 1.2 3.2 6.1 6.0 10.5 14.4 58.7
Rural 0.4 4.0 5.9 8.8 12.0 12.0 57.0 Source: Household Integrated Economic Survey, (HIES) 1996-97, FBS. Pakistan Integrated Household Survey, (PIHS), 1998-99,2001-02 FBS

124
Table 4.1: Health Delivery Facilities by Type in Public Sector and Urban- Rural Areas, Pakistan and Provinces
Hospitals Dispensaries M.C.H Centres
Tubercolu-sis Centres
Rural Health Centres
Sub-Health Centres
Basic Health Units Year/Area
No. Beds No. Beds No. Beds No. Beds No. Beds No. Beds No. Beds
Pakistan All Areas
1999 879 75,182 4,583 2,884 855 329 264 212 530 8,164 664 - 4,521 5,403
2000 876 76,615 4,635 2,863 856 329 274 186 531 8,486 671 - 4,500 5,428
2001 907 80,345 4,625 2,847 879 264 272 174 541 8,867 723 - 4,507 5,448
2002 906 80,655 4,590 2,815 862 254 285 212 550 8,840 685 - 4,623 5,488
2003 906 80,734 4,554 2,804 907 254 289 154 552 9,222 704 - 4,586 5,516
2004 916 81,873 4,582 2,814 906 254 289 152 552 9,262 701 - 4,600 5,553
Urban
1999 733 69,989 1,707 894 629 311 233 136 128 2,182 31 - 58 93
2000 730 71,389 1,702 883 628 311 236 116 127 2,186 35 - 50 90
2001 767 75,529 1,665 873 635 246 230 154 131 2,272 87 - 50 90
2002 770 75,871 1,665 865 628 236 247 136 131 2,340 80 - 53 90
2003 767 76,194 1,644 878 613 236 245 132 129 2,238 95 - 52 90
2004 776 77,305 1,644 886 616 236 245 132 130 2,252 97 - 63 94
Rural
1999 146 5,193 2,876 1,990 226 18 31 76 402 5,982 633 - 4,463 5,310
2000 146 5,226 2,933 1,980 228 18 38 70 404 6,300 636 - 4,450 5,338
2001 140 4,816 2,960 1,974 244 18 42 20 410 6,595 636 - 4,457 5,358
2002 136 4,784 2,925 1,950 234 18 38 76 419 6,500 605 - 4,570 5,384
2003 139 4,540 2,910 1,926 294 18 44 22 423 6,984 609 - 4,534 5,426
2004 140 4,568 2,933 1,928 290 18 44 20 422 7,010 604 - 4,537 5,459
Contd …

125
Table 4.1: Health Delivery Facilities by Type in Public Sector and Urban- Rural Areas, Pakistan and Provinces
Hospitals Dispensaries M.C.H Centres
Tubercolu- sis Centres
Rural Health Centres
Sub-Health Centres
Basic Health Units Year/Area
No. Beds No. Beds No. Beds No. Beds No. Beds No. Beds No. Beds
Punjab* All Areas
1999 300 35,145 1,540 2,100 524 263 54 40 296 5,620 605 - 2,415 3,962
2000 297 35,249 1,546 2,100 524 263 54 40 296 5,620 609 - 2,415 3,962
2001 312 37,742 1,521 2,071 523 198 54 40 296 5,620 658 - 2,415 3,962
2002 313 37,721 1,533 2,071 522 188 54 40 296 5,620 638 - 2,415 3,962
2003 313 37,802 1,517 2,071 522 188 54 40 296 5,620 657 - 2,415 3,962
2004 314 38,352 1,518 2,079 522 188 54 40 296 5,620 662 - 2,416 3,962
Urban
1999 276 34,333 562 236 434 263 54 40 73 1,418 31 - - -
2000 273 34,437 566 236 434 263 54 40 73 1,418 35 - - -
2001 288 36,930 543 207 433 198 54 40 73 1,418 84 - - -
2002 289 36,909 555 207 432 188 54 40 73 1,418 64 - - -
2003 289 36,990 539 207 432 188 54 40 73 1,418 83 - - -
2004 291 37,644 541 215 432 188 54 40 73 1,418 88 - - - Rural
1999 24 812 978 1,864 90 - - - 223 4,202 574 - 2,415 3,962
2000 24 812 980 1,864 90 - - - 223 4,202 574 - 2,415 3,962
2001 24 812 978 1,864 90 - - - 223 4,202 574 - 2,415 3,962
2002 24 812 978 1,864 90 - - - 223 4,202 574 - 2,415 3,962
2003 24 812 978 1,864 90 - - - 223 4,202 574 - 2,415 3,962
2004 23 708 977 1,864 90 - - - 223 4,202 574 - 2,416 3,962 * Islamabad is included in Punjab Contd…

126
Table 4.1: Health Delivery Facilities by Type in Public Sector and Urban- Rural Areas, Pakistan and Provinces
Hospitals Dispensaries M.C.H Centres
Tubercolu-sis Centres
Rural Health Centres
Sub-Health Centres
Basic Health Units
Year/Area
No. Beds No. Beds No. Beds No. Beds No. Beds No. Beds No. Beds
Sindh All Areas
1999 323 23,361 1,873 569 150 50 179 - 90 1,324 5 - 687 1,422
2000 324 23,768 1,888 569 150 50 181 - 92 1,364 4 - 701 1,450
2001 324 23,768 1,926 569 150 50 185 - 97 1,454 3 - 712 1,470
2002 326 23,843 1,957 569 150 50 186 - 98 1,474 3 - 724 1,492
2003 327 24,111 1,975 569 150 50 186 - 98 1,474 3 - 738 1,520
2004 327 24,636 1,993 569 150 50 186 - 99 1,484 3 - 747 1,538
Urban
1999 317 23,074 977 565 112 48 150 - 46 672 - - 31 80
2000 318 23,481 976 565 112 48 150 - 46 672 - - 31 80
2001 318 23,481 978 565 112 48 150 - 46 672 - - 31 80
2002 320 23,556 977 565 112 48 150 - 46 672 - - 31 80
2003 321 23,824 977 565 112 48 150 - 46 672 - - 31 80
2004 321 24,349 978 565 112 48 150 - 46 672 - - 31 80
Rural
1999 6 287 896 4 38 2 29 - 44 652 5 - 656 1,342
2000 6 287 912 4 38 2 31 - 46 692 4 - 670 1,370
2001 6 287 948 4 38 2 35 - 51 782 3 - 681 1,390
2002 6 287 980 4 38 2 36 - 52 802 3 - 693 1,412
2003 6 287 998 4 38 2 36 - 52 802 3 - 707 1,440
2004 6 287 1015 4 38 2 36 - 53 812 3 - 716 1,458
Contd….

127
Table 4.1: Health Delivery Facilities by Type in Public Sector and Urban- Rural Areas,Pakistan and Provinces
Hospitals Dispensaries M.C.H Centres
Tubercolu-sis Centres
Rural Health Centres
Sub-Health Centres
Basic Health Units Year/Area
No. Beds No. Beds No. Beds No. Beds No. Beds No. Beds No. Beds N.W.F.P All Areas
1999 189 12,482 542 142 105 16 26 172 87 650 29 - 990 -
2000 185 13,245 514 113 102 16 22 146 84 912 28 - 942 -
2001 183 14,225 531 130 118 16 27 134 88 1,075 32 - 944 -
2002 182 14,257 540 122 102 16 23 172 86 932 28 - 980 -2003 181 13,959 525 111 145 16 27 114 89 1,226 32 - 939 -
2004 183 14,060 527 111 142 16 27 112 89 1,230 27 - 939 -Urban
1999
79 8,468 129 56 47 - 24 96 5 52 - - 4 -
2000
76 9,228 116 33 46 - 15 76 4 56 - - 4 -
2001
78 10,594 103 52 52 - 20 114 5 66 - - 4 -
2002
79 10,638 107 44 46 - 21 96 5 134 - - 4 -2003 77 10,612 103 57 31 - 19 92 3 36 - - 4 -
2004 77 10,592 104 57 31 - 19 92 3 36 - - 4 -Rural
1999 110
4,014 413 86 58 16 2 76 82 598 29 -
986 -
2000 109
4,017 398 80 56 16 7 70 80 856 28 -
938 -
2001 105
3,631 428 78 66 16 7 20 83 1,009 32 -
940 -
2002 103
3,619 433 78 56 16 2 76 81 798 28 -
976 -2003 104 3,347 422 54 114 16 8 22 86 1,190 32 - 935 -
2004 106 3,468 423 54 111 16 8 20 86 1,194 27 - 935 -Contd …

128
Table 4.1: Health Delivery Facilities by Type in Public Sector and Urban- Rural Areas, Pakistan and Provinces
Hospitals Dispensaries M.C.H Centres
Tubercolu-sis Centres
Rural Health Centres
Sub-Health Centres
Basic Health Units Year/Area
No. Beds No. Beds No. Beds No. Beds No. Beds No. Beds No. Beds Balochistan All Areas
1999 67 4,194 628 73 76 - 5 - 57 570 25 - 429 19
2000 70 4,353 687 81 80 - 17 - 59 590 30 - 442 16
2001 88 4,610 647 77 88 - 6 - 60 718 30 - 436 16
2002 85 4,834 560 53 88 - 22 - 70 814 16 - 504 34
2003 85 4,862 537 53 90 - 22 - 69 902 12 - 494 34
2004 92 4,825 544 55 92 - 22 - 68 928 9 - 498 53 Urban
1999 61 4,114 39 37 36 - 5 - 4 40 - - 23 13
2000 63 4,243 44 49 36 - 17 - 4 40 - - 15 10
2001 83 4,524 41 49 38 - 6 - 7 116 3 - 15 10
2002 82 4,768 26 49 38 - 22 - 7 116 16 - 18 10
2003 80 4,768 25 49 38 - 22 - 7 112 12 - 17 10
2004 87 4,720 26 49 41 - 22 - 8 126 9 - 28 14
Rural 1999 6 80 589 36 40 - - - 53 530 25 - 406 6
2000 7 110 643 32 44 - - - 55 550 30 - 427 6
2001 5 86 606 28 50 - - - 53 602 27 - 421 6
2002 3 66 534 4 50 - - - 63 698 - - 486 24
2003 5 94 512 4 52 - - - 62 790 - - 477 24
2004 5 105 518 6 51 - - - 60 802 - - 470 39 Source: Health Division

129
Table 4.2: Number of Registered Medical Personnel by Gender, Pakistan
Specialists Doctors Dentists Hakeems Homoeopathic Doctors
Years Women Men Women Men Women Men Women Men Women Men
1991 161 663 1096 2588 41 75 21 535 784 3161
1992 140 695 1238 3233 28 57 15 599 910 3090
1993 131 517 959 2000 42 83 55 849 948 3100
1994 135 709 1025 2166 81 109 8 388 1006 3637
1995 175 705 1404 2099 60 103 15 432 917 3869
1996 135 576 2201 2329 101 85 29 920 692 3036
1997 147 640 2029 2207 110 111 40 971 1316 5104
1998 137 545 1946 2278 122 158 39 999 1318 4843
1999 155 564 2195 2227 211 212 36 1140 1242 4448
2000 159 588 2353 2367 164 144 21 897 1339 4781
2001 223 711 2319 2103 252 195 46 878 1446 4393
2002 213 729 2691 2694 252 194 2 197 925 2335
2003 263 845 2706 2815 259 214 33 961 1424 4007
2004 235 770 2710 2434 348 249 .. .. .. ..Contd…

130
Table 4.2: Number of Registered Medical Personnel by Gender, Pakistan
Nurses Midwives LHV's Others Years
Women Men Women Men Women Men Women Men
1991 - - - - - - - -
1992 - - - - - - - -
1993 - - - - - - - -
1994 - - - - - - - -
1995 - - - - - - - -
1996 - - - - - - - -
1997 1207 56 100 - 65 - 16 -
1998 2347 81 188 - 257 - 17 -
1999 2968 72 271 - 260 - 41 -
2000 2547 125 185 - 321 - 25 -
2001 3922 221 256 - 419 - 25 -
2002 3947 200 360 - 684 - 14 -
2003 4128 161 301 - 478 - 12 -
2004 1953 162 241 - 142 - - - Source: Pakistan Medical & Dental Council, Islamabad
- Not Available

131
Table 4.3: Number of Medical Colleges, Enrolment and Teaching Staff by Gender and Area
Number of Colleges Enrolment Teaching Staff Region Total Female Male Total Female Male Total Female Male
1998-99
Pakistan 28 2 26 24079
11,927 12152 3208 822 2386
Punjab 14 1 13
10,051
5,059 4992 1605 464 1141
Sindh 5 1 4
10,954
5,757 5197 881 246 635
N.W.F.P 7 - 7
2,278
775 1503 329 47 282
Balochiatan 1 - 1
709
321 388 274 43 231
Islamabad 1 - 1
87
15
72
119 22 97
Northern Areas - - - - -
- - - -
1999-00
Pakistan 28 2 26 22905 11,947 10958 3252 799 2453
Punjab 14 1 13
9,774
5,284 4490 1650 454 1196
Sindh 5 1 4
10,320
5,555 4765 824 218 606
N.W.F.P 7 - 7
1,760
664 1096 375 64 311
Balochiatan 1 - 1
929
408 521 284 41 243
Islamabad 1 - 1
122
36
86
119 22 97
Northern Areas - - - - -
- - - - 2000-01
Pakistan 27 2 25 18005
10,001 8004 2902 691 2211
Punjab 14 1 13
9,782
5,390 4392 1528 448 1080
Sindh 4 1 3
6,562
3,947 2615 602 145 457
N.W.F.P 7 - 7
563
208 355 269 32 237
Balochiatan 1 - 1
988
421 567 384 44 340
Islamabad 1 - 1
110
35
75
119 22 97
Northern Areas - - -
-
- -
- - - - Contd…

132
Table 4.3: Number of Medical Colleges, Enrolment and Teaching Staff by Gender and Area
Number of Colleges Enrolment Teaching Staff Region
Total Female Male Total Female Male Total Female Male
2002-03
Pakistan 29 2 27 19189 10536 8653 3015 808 2207
Punjab 16 1 15 11027 5869 5158 1572 493 1,079
Sindh 4 1 3 5982 3781 2201 583 140 443
N.W.F.P 7 - 7 982 395 587 486 99 387
Balochiatan 1 - 1 1,025 429 596 328 60 268
Islamabad 1 - 1 173 62 111 46 16 30
Northern Areas - - - - - - - - -
2003-04
Pakistan 30 2 28 19303 10709 8594 3031 781 2250
Punjab 17 1 16 11406 6340 5066 1621 496 1125
Sindh 4 1 3 5044 3374 1670 578 137 441
N.W.F.P 7 - 7 2279 757 1522 575 111 464
Balochiatan 1 - 1 303 114 189 160 13 147
Islamabad 1 - 1 271 124 147 97 24 73
Northern Areas - - - - - - - - - Sources: 1. Provincial BOS offices 2. Bolan College Quetta . Table 4.4: Number of Private Medical Practitioners by Gender, Pakistan and Provinces
Pakistan Punjab Sindh N.W.F.P Balochistan Year
Women Men Women Men Women Men Women Men Women Men
1997 2917 13596 638 4,263 1841 7421 334 1577 104 335
1998 2539* 9863* N.A N.A 2135 8492 294* 1028* 110 343
1999 2868* 11939* 637 3481 2106 8,103 N.A N.A 125 355
2000 4250 16721 769 3971 2958 10447 422 1901 101 402
2001 4391 16578 786 3992 3045 10267 448 1918 112 401
2002 3777* 12725* N.A N.A 3730 12435 47* 290* N.A N.A Source: Health Division *= Partial N.A = Not Available
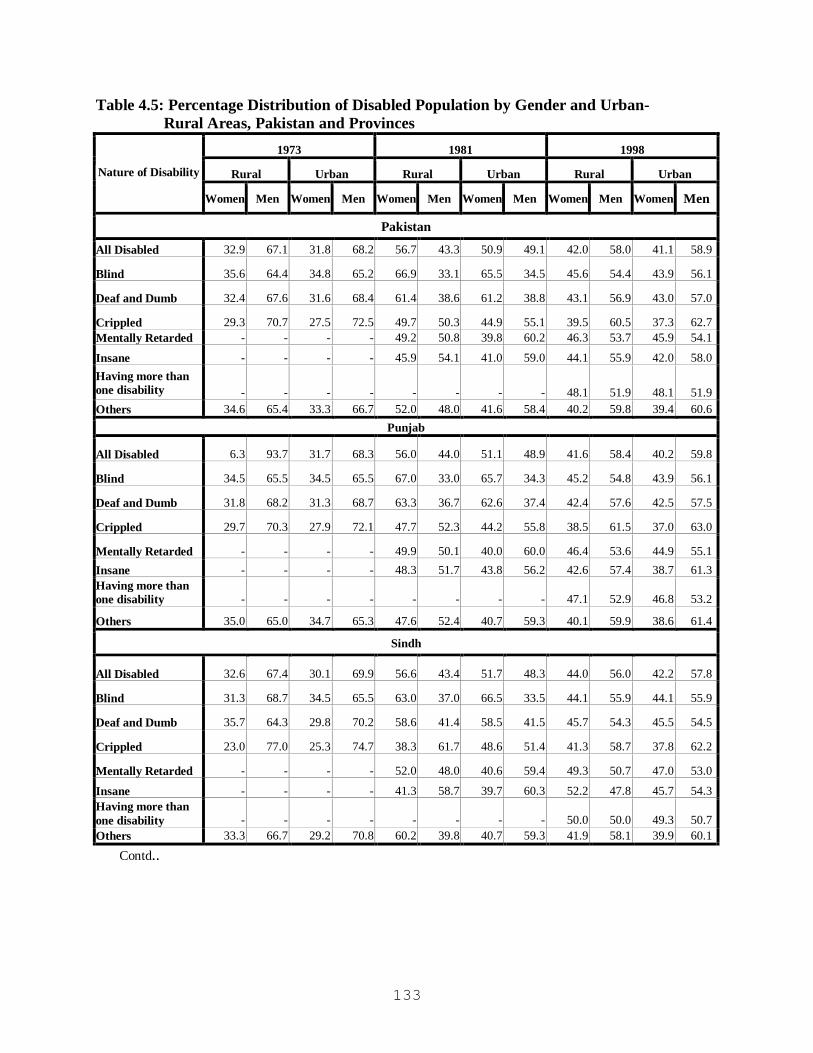
133
Table 4.5: Percentage Distribution of Disabled Population by Gender and Urban- Rural Areas, Pakistan and Provinces
1973 1981 1998
Rural Urban Rural Urban Rural Urban Nature of Disability
Women Men Women Men Women Men Women Men Women Men Women Men
Pakistan
All Disabled 32.9 67.1 31.8 68.2 56.7 43.3 50.9 49.1 42.0 58.0 41.1 58.9
Blind 35.6 64.4 34.8 65.2 66.9 33.1 65.5 34.5 45.6 54.4 43.9 56.1
Deaf and Dumb 32.4 67.6 31.6 68.4 61.4 38.6 61.2 38.8 43.1 56.9 43.0 57.0
Crippled 29.3 70.7 27.5 72.5 49.7 50.3 44.9 55.1 39.5 60.5 37.3 62.7 Mentally Retarded - - - - 49.2 50.8 39.8 60.2 46.3 53.7 45.9 54.1
Insane - - - - 45.9 54.1 41.0 59.0 44.1 55.9 42.0 58.0 Having more than one disability - - - - - - - - 48.1 51.9 48.1 51.9 Others 34.6 65.4 33.3 66.7 52.0 48.0 41.6 58.4 40.2 59.8 39.4 60.6
Punjab
All Disabled 6.3 93.7 31.7 68.3 56.0 44.0 51.1 48.9 41.6 58.4 40.2 59.8
Blind 34.5 65.5 34.5 65.5 67.0 33.0 65.7 34.3 45.2 54.8 43.9 56.1
Deaf and Dumb 31.8 68.2 31.3 68.7 63.3 36.7 62.6 37.4 42.4 57.6 42.5 57.5
Crippled 29.7 70.3 27.9 72.1 47.7 52.3 44.2 55.8 38.5 61.5 37.0 63.0
Mentally Retarded - - - - 49.9 50.1 40.0 60.0 46.4 53.6 44.9 55.1 Insane - - - - 48.3 51.7 43.8 56.2 42.6 57.4 38.7 61.3 Having more than one disability - - - - - - - - 47.1 52.9 46.8 53.2
Others 35.0 65.0 34.7 65.3 47.6 52.4 40.7 59.3 40.1 59.9 38.6 61.4
Sindh
All Disabled 32.6 67.4 30.1 69.9 56.6 43.4 51.7 48.3 44.0 56.0 42.2 57.8
Blind 31.3 68.7 34.5 65.5 63.0 37.0 66.5 33.5 44.1 55.9 44.1 55.9
Deaf and Dumb 35.7 64.3 29.8 70.2 58.6 41.4 58.5 41.5 45.7 54.3 45.5 54.5
Crippled 23.0 77.0 25.3 74.7 38.3 61.7 48.6 51.4 41.3 58.7 37.8 62.2
Mentally Retarded - - - - 52.0 48.0 40.6 59.4 49.3 50.7 47.0 53.0
Insane - - - - 41.3 58.7 39.7 60.3 52.2 47.8 45.7 54.3 Having more than one disability - - - - - - - - 50.0 50.0 49.3 50.7 Others 33.3 66.7 29.2 70.8 60.2 39.8 40.7 59.3 41.9 58.1 39.9 60.1
Contd..

134
Table 4.5: Percentage Distribution of Disabled Population by Gender and Urban-Rural Areas, Pakistan and Provinces
1973 1981 1998
Rural Urban Rural Urban Rural Urban Nature of Disability
Women Men Women Men Women Men Women Men Women Men Women Men N.W.F.P
All Disabled 36.8 63.2 35.4 64.6 56.0 44.0 46.8 53.2 41.2 58.8 38.8 61.2
Blind 43.6 56.4 36.9 63.1 67.7 32.3 66.0 34.0 48.2 51.8 39.3 60.7
Deaf and Dumb 36.3 63.7 35.4 64.6 55.9 44.1 59.8 40.2 42.9 57.1 30.3 69.7
Crippled 30.3 69.7 27.7 72.3 57.1 42.9 41.6 58.4 40.5 59.5 37.8 62.2 Mentally Retarded - - - - 42.6 57.4 35.4 64.6 42.7 57.3 43.4 56.6 Insane - - - - 42.7 57.3 34.0 66.0 40.9 59.1 38.1 61.9 Having more than one disability - - - - - - - - 49.0 51.0 44.7 55.3
Others 34.8 65.2 38.1 61.9 53.2 46.8 38.7 61.3 37.5 62.5 39.4 60.6
Balochistan
All Disabled 32.9 67.1 44.5 55.5 63.9 36.1 53.6 46.4 43.3 56.7 42.0 58.0 Blind 40.7 59.3 37.9 62.1 77.0 23.0 57.8 42.2 46.6 53.4 45.4 54.6
Deaf and Dumb 28.1 71.9 56.0 44.0 67.0 33.0 57.3 42.7 46.1 53.9 34.2 65.8
Crippled 26.8 73.2 42.4 57.6 69.8 30.2 38.5 61.5 46.4 53.6 38.0 62.0
Mentally Retarded - - - - 54.8 45.2 39.3 60.7 46.2 53.8 47.3 52.7
Insane - - - - 48.8 51.2 36.0 64.0 48.6 51.4 42.9 57.1 Having more than one disability - - - - - - - - 50.0 50.0 52.5 47.5
Others 38.8 61.2 43.0 57.0 56.6 43.4 60.7 39.3 40.4 59.6 40.9 59.1
Islamabad
All Disabled 32.9 67.1 44.5 55.5 63.9 36.1 53.6 46.4 36.5 63.5 40.3 59.7 Blind 40.7 59.3 37.9 62.1 77.0 23.0 57.8 42.2 50.9 49.1 32.0 68.0
Deaf and Dumb 28.1 71.9 56.0 44.0 67.0 33.0 57.3 42.7 38.3 61.7 40.3 59.7
Crippled 26.8 73.2 42.4 57.6 69.8 30.2 38.5 61.5 41.2 58.8 36.5 63.5 Mentally Retarded - - - - 54.8 45.2 39.3 60.7 39.4 60.6 52.7 47.3
Insane - - - - 48.8 51.2 36.0 64.0 36.1 63.9 44.7 55.3 Having more than one disability - - - - - - - - 36.9 63.1 41.1 58.9 Others 38.8 61.2 43.0 57.0 56.6 43.4 60.7 39.3 25.4 74.6 41.0 59.0 Source: Hand Book of Population Census Data, December, 1985, P.C.O. 1998
- = Nil Note: Data regarding Mentally Retarded and Insane was not reported in 1973. Table 5.1: Percentage of Currently Married Women Who Reported knowledge of Contraceptive Methods, Pakistan And Provinces

135
Knowledge of Contraceptive Method Province Knowledge of at Least one
Method Knowledge of one Modern
Method
1994-95
Pakistan 90.7 90.5
Punjab 93.2 93.0
Sindh 87.5 87.3
N.W.F.P 97.7 97.7
Balochistan 57.9 57.2
1996-97
Pakistan 94.3 93.4
Punjab 94.3 93.3
Sindh 95.4 95.2
N.W.F.P 97.9 97.7
Balochistan 77.9 74.8
2003
Pakistan 94.1 93.6
Punjab 97.5 97.3
Sindh 87.5 86.4
N.W.F.P 95.6 94.9
Balochistan 88.7 88.1 Source: National Institute of Population Studies
- Not available

136
Table 5.2: Proportion of Respondents Ever Using Contraceptives by Methods, Pakistan and Provinces, 2003
Percent of Ever Users Characteristics
Pakistan Punjab Sindh N.W.F.P Balochistan
Modern Method Any Modern Method 36.0 38.0 32.8 39.3 20.9 Condom 13.1 14.0 13.3 12.3 4.9 Pill 10.2 8.9 10.4 15.7 6.9
Injection 10.1 9.5 9.0 16.0 4.9 IUD 9.4 12.4 5.8 5.9 4.6 Female Sterilization 7.7 9.1 6.4 6.5 3.4 Male Sterilization 0.2 0.3 0.1 - - Any Traditional Method 12.9 15.6 9.2 12.1 5.8 Periodic Abstinence 5.4 7.0 2.1 7.3 0.3 Withdrawal 9.4 10.5 7.3 10.0 5.6 Any Method 41.8 44.8 37.9 43.6 24.9 Source: National Institute of Population Studies Table 5.3: Percentage of Currently Using Specific Methods, Among Currently Married Women, Pakistan and Provinces, 2003
Percent of Currently Users Domain
Pakistan Punjab Sindh N.W.F.P Balochistan
Modern Method
Any Modern Method 25.2 26.1 25.5 25.2 15.1 Condom 6.4 6.3 8.2 4.5 2.6 Pill 3.1 2.1 3.7 5.6 2.6
Injection 3.4 2.7 3.9 5.3 2.9 IUD 4.4 5.4 3.2 3.5 3.5
Female Sterilization 7.5 9.0 5.8 6.0 3.5 Male Sterilization 0.2 0.2 0.2 0.0 0.0 Any Traditional Method 6.8 7.8 6.4 5.1 3.9 Periodic Abstinence 1.7 2.3 0.7 1.6 0.4 Withdrawal 4.9 5.1 5.5 3.3 3.5 Any Method 32.1 33.9 31.8 30.3 19.0 Source: National Institute of Population Studies

137
Table 5.4: Awareness of Modern Methods Among Currently Married Women by Places of Residence, Pakistan and Provinces,2003 (Percent)
Provinces All Areas Urban Area Rural Area
Pakistan 93.6 94.6 93.2
Punjab 97.3 98.3 96.9
Sindh 86.4 89.0 84.0
N.W.F.P 94.9 95.8 94.8
Balochistan 88.1 97.8 85.5 Source: National Institute of Population Studies Table 5.5: Awareness of Modern Methods Among Currently Married Women by Educational Attainments Pakistan and Provinces, 2003
(Percent)
Provinces No Schooling Up to Primary Level Education
Primary and above Level Education
Pakistan 91.6 97.9 97.6
Punjab 96.3 98.6 99.4
Sindh 82.5 96.0 94.1
N.W.F.P 94.0 99.1 99.7
Balochistan 87.0 94.4 98.4 Source: National Institute of Population Studies

138
Table 5.6: Percentage Distribution of Currently Married Women by Knowledge of Specific Method by Type of Areas, 2003
(Percent) Type of Areas
Methods Urban Rural Total
Pill 92.7 89.5 90.6
IUD 87.8 78.4 81.5
Injection 90.5 86.5 87.8
Implant 36.4 22.3 26.9
Condom 77.9 57.7 64.3
Female Sterilization 88.1 84.8 85.9
Male Sterilization 53.4 35.8 41.5 Source: National Institute of Population Studies Table 5.7: Percentage Distribution of Currently Married Women by Knowledge of Supply Source Specific Methods by Type, Pakistan and Provinces, 2003
(Percent)
Methods Pakistan Punjab Sindh N.W.F.P Balochistan
Pill 77.4 82.8 63.1 84.1 74.7
IUD 69.6 79.3 54.5 65.6 57.2
Injection 75.2 81.3 60.3 81.8 68.7
Implant 21.8 24.9 24.2 10.7 7.1
Condom 54.6 62.1 43.1 49.4 50.0
Female Sterilization 73.2 81.2 61.1 72.6 51.5
Male Sterilization 33.5 49.4 14.2 15.4 16.4 Source: National Institute of Population Studies

139
Table 5.8: Percentage of Currently Married Women Ever Used Specific Methods, Pakistan and Provinces, 2003
Percent of Ever Users Methods Used
Pakistan Punjab Sindh N.W.F.P Balochistan
Used Any Method 42.8 46.1 38.6 44.1 25.3 Used Modern Method 36.8 39.1 33.4 39.7 21.1 Pill 10.4 9.1 10.6 16.0 6.9 IUD 9.6 12.8 5.8 6.0 4.7 Injection 10.3 9.8 9.3 16.3 4.9 Implant 0.3 0.4 0.2 0.1 - Condom 13.4 14.4 13.5 12.3 5.0 Female Sterilization 7.9 9.4 6.5 6.4 3.5 Male Sterilization 0.2 0.3 0.1 - - Used Any traditional Method 13.2 16.0 9.3 12.3 5.9 Abstinence 5.5 7.2 2.1 7.3 0.3 Withdrawal 9.6 10.8 7.5 10.2 5.7 Others 0.5 0.6 0.7 0.0 0.2 Source: National Institute of Population Studies Table 5.9: Percentage of Currently Married Women Ever Used Specific Methods by Percent of Even Users Type of Areas, 2003
Type of Areas Methods Used
Total Urban Rural
Used any Method 42.8 54.4 37.1
Used Modern Method 36.8 46.4 32.1
Pill 10.4 12.7 9.3
IUD 9.6 11.9 8.4
Injection 10.3 10.5 10.3
Implant 0.3 0.3 0.3
Condom 13.4 21.1 9.7
Female Sterilization 7.9 10.5 6.6
Male Sterilization 0.2 0.2 0.2
Used any Traditional Method 13.2 17.8 10.9
Abstinence 5.5 5.4 5.6
With drawal 9.6 14.2 7.4
Others 0.5 0.8 0.4 Source: National Institute of Population Studies

140
Table 5.10: Percentage of Currently Married Women Using Specific Methods by Pakistan and Provinces, 2003
Percent of Currently Users Methods
Pakistan Punjab Sindh N.W.F.P Balochistan
Any Method 32.1 33.9 31.8 30.3 19.0 Any Modern Method 25.2 26.1 25.5 25.2 15.1 Traditional Method 6.8 7.8 6.4 5.1 3.9 Pill 3.1 2.1 3.7 5.6 2.6 IUD 4.4 5.4 3.2 3.5 3.5 Injection 3.4 2.7 3.9 5.3 2.9 Condom 6.4 6.3 8.2 4.5 2.6 Female Sterilization 7.5 9.0 5.8 6.0 3.5 Male Sterilization 0.2 0.2 0.2 - - Periodic Abstinence 1.7 2.3 0.7 1.6 0.4 Withdrawal 4.9 5.1 5.5 3.3 3.5 Others 0.3 0.4 0.2 0.1 0.1 Source: National Institute of Population Studies Table 5.11: Percentage of Currently Married Women Using Specific Methods by Type of Areas, 2003
Percent of Currently Users Methods
Urban Rural
Any Method 43.5 26.5 Any Modern Method 33.6 21.1 Traditional Method 9.9 5.4 Pill 3.7 2.8 IUD 4.8 4.3 Injection 3.3 3.5 Implant 0.2 0.3 Condom 11.4 3.9 Female Sterilization 10.0 6.2 Male Sterilization 0.2 0.1 Periodic Abstinence 1.6 1.7 Withdrawal 7.7 3.5 Others 0.6 0.2 Source: National Institute of Population Studies

141
Table 6.1: Literacy Ratio by Sex and Urban- Rural Areas, Pakistan and Provinces
Urban Rural Total Years
Women Men Both Sexes Women Men Both
Sexes Women Men Both Sexes
Pakistan
1972 30.9 49.9 41.5 4.7 22.6 14.3 11.6 30.2 21.7
1981 37.3 55.3 47.1 7.3 26.2 17.3 16.0 35.1 26.2
1998 55.2 70.0 63.1 20.1 46.4 33.6 32.0 54.8 43.9
Punjab
1972 28.0 47.8 38.9 5.2 22.9 14.7 10.7 29.1 20.7
1981 36.7 55.2 46.7 9.4 29.6 20.0 16.8 36.8 27.4
1998 57.2 70.9 64.5 24.8 50.4 38.0 35.1 57.2 46.6
Sindh
1972 38.4 54.5 47.4 5.8 27.5 17.6 19.2 39.1 30.2
1981 42.2 57.8 50.8 5.2 24.5 15.6 21.6 39.7 31.5
1998 56.7 69.8 63.7 12.2 37.9 25.7 34.8 54.5 45.3
N.W.F.P
1972 19.9 44.7 33.7 2.2 19.0 11.0 4.7 23.1 14.5
1981 21.9 47.0 35.8 3.8 21.7 13.2 6.5 25.9 16.7
1998 39.1 67.5 54.3 14.7 47.7 31.3 18.8 51.4 35.4
Balochistan
1972 19.2 42.4 32.3 1.3 9.2 5.6 4.2 14.8 10.1
1981 18.5 42.4 32.2 1.8 9.8 6.2 4.3 15.2 10.3
1998 33.1 58.1 46.9 7.9 25.8 17.5 14.1 34.0 24.8
Islamabad
1981 46.8 65.8 57.6 14.7 48.1 32.5 33.5 59.1 47.8
1998 69.7 83.2 77.3 48.8 71.1 62.5 62.4 80.0 72.4
FATA
1981 NA NA NA NA NA NA 0.8 10.9 6.4
1998 12.0 59.7 39.3 2.8 28.6 16.8 3.0 29.5 17.4 Source: Population Census Organization, 1972, 1981 and 1998.

142
Table 6.2: Number of Schools by Level and Gender,Pakistan
No. of Primary School No. of Middle School No. of Secondary School
Years Women Men Both
Sexes Women Men Both Sexes Women Men Both
Sexes
1974-75 15,678 36,066 51,744 1,266 3,447 4,713 911 2,288 3,199
1980-81 18,595 40,573 59,168 1,412 3,883 5,295 1,055 2,655 3,710
1985-86 22,441 54,766 77,207 1,893 4,367 6,260 1,420 3,550 4,970
1990-91 31,124 83,018 114,142 3,446 5,315 8,761 2,395 6,540 8,935
1991-92 31,591 80,788 112,379 3,537 5,504 9,041 2,374 6,608 8,982
1992-93 38,080 92,516 130,596 5,055 6,753 11,808 3,029 6,297 9,326
1993-94 39,987 94,063 134,050 5,194 6,932 12,126 3,142 6,513 9,655
1994-95 41,967 97,667 139,634 5,562 7,009 12,571 3,323 6,682 10,005
1995-96 43,434 99,696 143,130 5,719 7,611 13,330 3,329 6,790 10,119
1996-97 42,042 107,619 149,661 5,760 8,727 14,487 3,394 7,042 10,436
1997-98 51,204 105,114 156,318 7,168 10,186 17,354 4,019 7,667 11,686
1998-99 56,515 102,815 159,330 7,985 10,087 18,072 4,710 8,221 12,931
1999-00 58,748 103,773 162,521 8,146 10,289 18,435 4,805 8,406 13,211
2000-01 42,870 104,866 147,736 5,875 19,597 25,472 3,009 12,407 15,416
2001-02 43,524 105,560 149,084 6,257 20,534 26,791 3,000 12,658 15,658
2002-03 43,858 106,951 150,809 6,553 21,468 28,021 3,080 13,128 16,208
2003-04 43,913 111,057 154,970 6,567 22,160 28,727 3,213 13,529 16,742 Source: i) Ministry of Education, Government of Pakistan ii) Academy of Educational Planning & Management Note:- i) Mosque Schools are included in Primary Schools. ii) Secondary schools included High schools and Secondary Vocational Institutions. iii) Pakistan include data of Northern Area and AJK.

143
Table 6.3: Number of Arts and Science Colleges by Gender, Pakistan and Province
No. of Arts and Science Colleges Year
Women Men Both Sexes
Pakistan 1999-00 355 522 877 2000-01 377 527 904 2001-02 391 536 927 2002-03 411 541 952 2003-04 455 598 1053
Punjab 1999-00 229 267 496 2000-01 241 269 510 2001-02 247 267 514 2002-03 260 270 530 2003-04 299 286 585
Sindh 1999-00 73 134 207 2000-01 73 134 207 2001-02 74 138 212 2002-03 78 136 214 2003-04 86 141 227
N.W.F.P 1999-00 21 61 82 2000-01 21 61 82 2001-02 29 68 97 2002-03 30 72 102 2003-04 30 74 104
Balochistan 1999-00 21 37 58 2000-01 21 38 59 2001-02 21 38 59 2002-03 21 38 59 2003-04 23 46 69
F.A.T.A. 1999-00 0 9 9 2000-01 1 10 11 2001-02 1 10 11 2002-03 1 10 11 2003-04 11 21 32
Islamabad 1999-00 11 14 25 2000-01 20 15 35 2001-02 19 15 34 2002-03 21 15 36 2003-04 19 17 36
Source: Provincial Bureaus of Statistics Note:- Data for Pakistan may not tally with that of other publications due to exclusion of Northern Area data in this table

144
Table 6.4: Percent Distribution of Schools (Public Sector) by Level and Gender, Pakistan and Provinces,1995-96
Number of Schools Percent of Total Schools Type of School
Girls Boys Mixed Total Girls Boys Mixed Total
Pakistan
Primary School 33,894 75,409 4,562 113,865 29.8 66.2 4.0 100.0 Mddle School 3,881 4,353 278 8,512 45.6 51.1 3.3 100.0 High School 2,135 4,994 184 7,313 29.2 68.3 2.5 100.0
Total 39,910 84,756 5,024 129,690 30.8 65.4 3.9 100.0
Punjab
Primary School 22,418 33,330 231 55,979 40.0 59.5 0.4 100.0 Middle School 2,857 2,031 11 4,899 58.3 41.5 0.2 100.0 High School 1,441 2,930 10 4,381 32.9 66.9 0.2 100.0
Total 26,716 38,291 252 65,259 40.9 58.7 0.4 100.0
Sindh
Primary School 5,023 17,040 12,823 34,886 19.0 64.6 16.4 100.0 Middle School 515 815 266 1,596 32.3 51.1 16.7 100.0 High School 380 737 174 1,291 29.4 57.1 13.5 100.0
Total 5,918 18,592 4,763 29,273 20.2 63.5 16.3 100.0 N.W.F.P
Primary School 5,148 18,176 - 23,324 22.1 77.9 - 100.0 Middle School 390 970 - 1,360 28.7 71.3 - 100.0 High School 220 1,003 - 1,223 18.0 82.0 - 100.0
Total 5,758 20,149 - 25,907 22.2 77.8 - 100.0 Balochistan
Primary School 1,165 6,759 8 7,932 14.7 85.2 0.1 100.0 Middle School 90 522 1 613 14.7 85.2 0.2 100.0 High School 65 289 - 354 18.4 81.6 - 100.0
Total 1,320 7,570 9 8,899 14.8 85.1 0.1 100.0 F.A.T.A.
Primary School 698 1,973 2 2,673 26.1 73.8 0.1 100.0 Middle School 47 239 - 286 16.4 83.6 - 100.0 High School 16 149 1 166 9.6 89.8 0.6 100.0
Total 761 2,361 3 3,125 24.4 75.6 0.1 100.0 Islamabad
Primary School 140 104 - 244 57.4 42.6 - 100.0 Middle School 29 15 - 44 65.9 34.1 - 100.0 High School 29 35 - 64 45.3 54.7 - 100.0
Total 198 154 - 352 56.3 43.8 - 100.0 Contd…

145
Table 6.4: Percent Distribution of Schools (Public Sector) by Level and Gender, Pakistan and Provinces,1998-99
Number of Schools Percent of Total Schools Type of School
Girls Boys Mixed Total Girls Boys Mixed Total
Pakistan
Primary School 39,198 74,918 16,005 130,121 30.1 57.6 12.3 100.0 Mddle School 4,666 5,292 415 10,373 45.0 51.0 4.0 100.0 High School 2,346 5,435 250 8,031 29.2 67.7 3.1 100.0
Total 46,210 85,645 16,670 148,525 31.1 57.7 11.2 100.0 Punjab
Primary School 23,750 34,502 - 58,252 40.8 59.2 - 100.0 Middle School 3,278 2,328 - 5,606 58.5 41.5 - 100.0 High School 1,526 3,014 - 4,540 33.6 66.4 - 100.0
Total 28,554 39,844 - 68,398 41.7 58.3 - 100.0
Sindh
Primary School 5,844 16,691 15,755 38,290 15.3 83.6 41.1 100.0 Middle School 594 1,027 402 2,023 29.4 50.8 19.9 100.0 High School 410 811 237 1,458 28.1 55.6 16.3 100.0
Total 6,848 18,529 16,394 41,771 16.4 44.4 39.2 100.0 N.W.F.P
Primary School 6,191 14,349 - 20,540 30.1 69.9 - 100.0 Middle School 563 1,145 - 1,708 33.0 67.0 - 100.0 High School 269 1,067 - 1,336 20.1 79.9 - 100.0
Total 7,023 16,561 - 23,584 29.8 70.2 - 100.0 Balochistan
Primary School 2,416 7,206 - 9,622 25.1 74.9 - 100.0 Middle School 140 542 - 682 20.5 79.5 - 100.0 High School 84 330 - 414 20.3 79.7 - 100.0
Total 2,640 8,078 - 10,718 24.6 75.4 - 100.0 F.A.T.A.
Primary School 933 2,093 127 3,153 29.6 64.4 4.0 100.0 Middle School 66 231 6 303 21.8 76.2 2.0 100.0 High School 18 169 9 196 9.2 86.2 4.6 100.0
Total 1,017 2,493 142 3,652 27.8 68.3 3.9 100.0 Islamabad
Primary School 64 77 123 264 24.2 29.2 46.6 100.0 Middle School 25 19 7 51 49.0 37.3 13.7 100.0 High School 39 44 4 87 44.8 50.6 4.6 100.0
Total 128 140 134 402 31.8 34.8 33.3 100.0 Contd…
Table 6.4: Percent Distribution of Schools (Public Sector) by Level and Gender, Pakistan

146
and Provinces,1999-00
Number of Schools Percent of Total Schools Type of School
Girls Boys Mixed Total Girls Boys Mixed Total
Pakistan
Primary School 39,295 70,500 16,252 126,047 31.2 55.9 12.9 100.0 Mddle School 5,042 5,556 424 11,022 45.7 50.4 3.8 100.0 High School 2,334 5,353 248 7,935 29.4 67.5 3.1 100.0
Total 46,671 81,409 16,924 145,004 32.2 56.1 11.7 100.0 Punjab
Primary School 22,908 29,496 - 52,404 43.7 56.3 - 100.0 Middle School 3,523 2,451 - 5,974 59.0 41.0 - 100.0 High School 1,504 2,921 - 4,425 34.0 66.0 - 100.0
Total 27,935 34,868 - 62,803 44.5 55.5 - 100.0
Sindh
Primary School 5,976 16,893 16,016 38,885 15.4 43.4 41.2 100.0 Middle School 598 1,064 411 2,073 28.8 51.3 19.8 100.0 High School 407 805 237 1,449 28.1 55.6 16.4 100.0
Total 6,981 18,762 16,664 42,407 16.5 44.2 39.3 100.0 N.W.F.P
Primary School 6845 14531 - 21376 32.0 68.0 0.0 100.0 Middle School 689 1241 - 1930 35.7 64.3 0.0 100.0 High School 274 1079 - 1353 20.3 79.7 0.0 100.0
Total 7808 16851 - 24659 31.7 68.3 0.0 100.0 Balochistan
Primary School 2466 7352 - 9818 25.1 74.9 - 100.0 Middle School 143 553 - 696 20.5 79.5 - 100.0 High School 87 337 - 424 20.5 79.5 - 100.0
Total 2696 8242 - 10938 24.6 75.4 - 100.0 F.A.T.A.
Primary School 1030 2150 119 3299 31.2 65.2 3.6 100.0 Middle School 66 228 7 301 21.9 75.7 2.3 100.0 High School 21 169 8 198 10.6 85.4 4.0 100.0
Total 1117 2547 134 3798 29.4 67.1 3.5 100.0 Islamabad
Primary School 70 78 117 265 26.4 29.4 44.2 100.0 Middle School 23 19 6 48 47.9 39.6 12.5 100.0 High School 41 42 3 86 47.7 48.8 3.5 100.0
Total 134 139 126 399 33.6 34.8 31.6 100.0 Contd…

147
Table 6.4: Percent Distribution of Schools (Public Sector) by Level and Gender, Pakistan and Provinces,2000-01
Number of Schools Percent of Total Schools Type of School
Girls Boys Mixed Total Girls Boys Mixed Total
Pakistan
Primary School 40,193 70,749 16,090 127,032 31.6 55.7 12.7 100.0 Mddle School 5,251 5,726 416 11,393 46.1 50.3 3.7 100.0 High School 2,348 5,397 243 7,988 29.4 67.6 3.0 100.0
Total 47,792 81,872 16,749 146,413 32.6 55.9 11.4 100.0
Punjab
Primary School 22,808 29,342 - 52,150 43.7 56.3 - 100.0 Middle School 3,669 2,558 - 6,227 58.9 41.1 - 100.0 High School 1,502 2,928 - 4,430 33.9 66.1 - 100.0
Total 27,979 34,828 - 62,807 44.5 55.5 - 100.0
Sindh
Primary School 6,043 17,152 15,854 39,049 15.5 43.9 40.6 100.0 Middle School 594 1,087 403 2084 28.5 52.2 19.3 100.0 High School 413 813 234 1460 28.3 55.7 16.0 100.0
Total 7,050 19,052 16,491 42,593 16.6 44.7 38.7 100.0 N.W.F.P
Primary School 7,641 14734 - 22,375 34.1 65.9 - 100.0 Middle School 735 1299 - 2,034 36.1 63.9 - 100.0 High School 272 1063 - 1,335 20.4 79.6 - 100.0
Total 8,648 17096 - 25,744 33.6 66.4 - 100.0 Balochistan
Primary School 2,576 7,237 - 9,813 26.3 73.7 - 100.0 Middle School 163 527 - 690 23.6 76.4 - 100.0 High School 100 379 - 479 20.9 79.1 - 100.0
Total 2,839 8,143 - 10,982 25.9 74.1 - 100.0 F.A.T.A.
Primary School 1,060 2,215 120 3,395 31.2 65.2 3.5 100.0 Middle School 66 235 7 308 21.4 76.3 2.3 100.0 High School 21 173 8 202 10.4 85.6 4.0 100.0
Total 1,147 2,623 135 3,905 29.4 67.2 3.5 100.0 Islamabad
Primary School 65 69 116 250 26.0 27.6 46.4 100.0 Middle School 24 20 6 50 48.0 40.0 12.0 100.0 High School 40 41 1 82 48.8 50.0 1.2 100.0
Total 129 130 123 382 33.8 34.0 32.2 100.0 Contd…

148
Table 6.4: Percent Distribution of Schools (Public Sector) by Level and Gender, Pakistan and Provinces,2001-02
Number of Schools Percent of Total Schools Type of School
Girls Boys Mixed Total Girls Boys Mixed Total
Pakistan
Primary School 40,844 7,0768 16,002 127,614 32.0 55.5 12.5 100.0 Mddle School 5,604 5,985 420 12,009 46.7 49.8 3.5 100.0 High School 2,319 5,367 242 7,928 29.3 67.7 3.1 100.0
Total 48,767 82,120 16,664 147,551 33.1 55.7 11.3 100.0
Punjab
Primary School 23,016 29,019 - 52,035 44.2 55.8 - 100.0 Middle School 3,904 2,675 - 6,579 59.3 40.7 - 100.0 High School 1,470 2,884 - 4,354 33.8 66.2 - 100.0
Total 28,390 34,578 - 62,968 45.1 54.9 - 100.0
Sindh
Primary School 6,093 17,226 15,857 39,176 15.6 44.0 40.5 100.0 Middle School 674 1159 407 2240 30.1 51.7 18.2 100.0 High School 423 823 234 1480 28.6 55.6 15.8 100.0
Total 7,190 19,208 16,498 42,896 16.8 44.8 38.5 100.0 N.W.F.P
Primary School 7,718 14,855 - 22,573 34.2 65.8 - 100.0 Middle School 751 1,325 - 2,076 36.2 63.8 - 100.0 High School 272 1,064 - 1,336 20.4 79.6 - 100.0
Total 8,741 17,244 - 25,985 33.6 66.4 - 100.0 Balochistan
Primary School 2,602 7,311 - 9,913 26.2 73.8 - 100.0 Middle School 164 532 - 696 23.6 76.4 - 100.0 High School 101 382 - 483 20.9 79.1 - 100.0
Total 2,867 8,225 - 11,092 25.8 74.2 - 100.0 F.A.T.A.
Primary School 1,384 2,311 - 3,695 37.5 62.5 - 100.0 Middle School 93 278 - 371 25.1 74.9 - 100.0 High School 17 176 - 193 8.8 91.2 - 100.0
Total 1,494 2,765 - 4,259 35.1 64.9 - 100.0 Islamabad
Primary School 31 46 145 222 14.0 20.7 65.3 100.0 Middle School 18 16 13 47 38.3 34.0 27.7 100.0 High School 36 38 8 82 43.9 46.3 9.8 100.0
Total 85 100 166 351 24.2 28.5 47.3 100.0 Contd…

149
Table 6.4: Percent Distribution of Schools (Public Sector) by Level and Gender, Pakistan and Provinces,2002-03
Number of Schools Percent of Total Schools Type of School
Girls Boys Mixed Total Girls Boys Mixed Total
Pakistan
Primary School 41,138 70,936 16,346 128,420 32.0 55.2 12.7 100.0 Mddle School 5,880 6,161 485 12,526 46.9 49.2 3.9 100.0 High School 2,397 5,516 251 8,164 29.4 67.6 3.1 100.0
Total 49,415 82,613 17,082 149,110 33.1 55.4 11.5 100.0
Punjab
Primary School 23,057 28,938 - 51,995 44.3 55.7 - 100.0 Middle School 4,078 2,797 - 6,875 59.3 40.7 - 100.0 High School 1,505 2,959 - 4,464 33.7 66.3 - 100.0
Total 28,640 34,694 - 63,334 45.2 54.8 - 100.0
Sindh
Primary School 6,348 17,570 16,203 40,121 15.8 43.8 40.4 100.0 Middle School 701 1,203 469 2,373 29.5 50.7 19.8 100.0 High School 433 828 243 1,504 28.8 55.1 16.2 100.0
Total 7,482 19,601 16,915 43,998 17.0 44.5 38.4 100.0 N.W.F.P
Primary School 7,440 14,552 - 21,992 33.8 66.2 - 100.0 Middle School 735 1,320 - 2,055 35.8 64.2 - 100.0 High School 276 1,064 - 1,340 20.6 79.4 - 100.0
Total 8,451 16,936 - 25,387 33.3 66.7 - 100.0 Balochistan
Primary School 2,593 7,300 - 9,893 26.2 73.8 - 100.0 Middle School 223 541 - 764 29.2 70.8 - 100.0 High School 122 421 - 543 22.5 77.5 - 100.0
Total 2,938 8,262 - 11,200 26.2 73.8 - 100.0 F.A.T.A.
Primary School 1,671 2,531 - 4,202 39.8 60.2 - 100.0 Middle School 124 283 - 407 30.5 69.5 - 100.0 High School 26 206 - 232 11.2 88.8 - 100.0
Total 1,821 3,020 - 4,841 37.6 62.4 - 100.0 Islamabad
Primary School 29 45 143 217 13.4 20.7 65.9 100.0 Middle School 19 17 16 52 36.5 32.7 30.8 100.0 High School 35 38 8 81 43.2 46.9 9.9 100.0
Total 83 100 167 350 23.7 28.6 47.7 100.0 Contd…

150
Table 6.4: Percent Distribution of Schools (Public Sector) by Level and Gender, Pakistan and Provinces,2003-04
Number of Schools Percent of Total Schools Type of School
Girls Boys Mixed Total Girls Boys Mixed Total
Pakistan
Primary School 41,062 70,999 1,6286 128,347 32.0 55.3 12.7 100.0 Mddle School 5,868 6,122 469 12,459 47.1 49.1 3.8 100.0 High School 2,449 5,493 243 8,185 29.9 67.1 3.0 100.0
Total 49,379 82,614 1,6998 1489,91 33.1 55.4 11.4 100.0
Punjab
Primary School 22,844 28,854 - 51,698 44.2 55.8 - 100.0 Middle School 4,048 2,753 - 6,801 59.5 40.5 - 100.0 High School 1,542 2,924 - 4,466 34.5 65.5 - 100.0
Total 28,434 34,531 - 62,965 45.2 54.8 - 100.0
Sindh
Primary School 6,348 17,570 16,203 40,121 15.8 43.8 40.4 100.0 Middle School 701 1,203 469 2,373 29.5 50.7 19.8 100.0 High School 433 828 243 1,504 28.8 55.1 16.2 100.0
Total 7,482 19,601 16,915 43,998 17.0 44.5 38.4 100.0 N.W.F.P
Primary School 7,449 14,544 - 21,993 33.9 66.1 - 100.0 Middle School 734 1,319 - 2,053 35.8 64.2 - 100.0 High School 273 1,059 - 1,332 20.5 79.5 - 100.0
Total 8,456 16,922 - 25,378 33.3 66.7 - 100.0 Balochistan
Primary School 2,651 7,436 - 10,087 26.3 73.7 - 100.0 Middle School 232 542 - 774 30.0 70.0 - 100.0 High School 126 430 - 556 22.7 77.3 - 100.0
Total 3,009 8,408 - 11,417 26.4 73.6 - 100.0 F.A.T.A.
Primary School 1,711 2,527 - 4,238 40.4 59.6 - 100.0 Middle School 120 284 - 404 29.7 70.3 - 100.0 High School 27 206 - 233 11.6 88.4 - 100.0
Total 1,858 3,017 - 4,875 38.1 61.9 - 100.0 Islamabad
Primary School 59 68 83 210 28.1 32.4 39.5 100.0 Middle School 33 21 - 54 61.1 38.9 - 100.0 High School 48 46 - 94 51.1 48.9 - 100.0
Total 140 135 83 358 39.1 37.7 23.2 100.0 Source: Academy of Educational Planning and Management Ministry of Education, Government of Pakistan Note:- Data for Pakistan may not tally with that of other publications due to Pakistan exclude Northern Area and AJK
ii) Data of other public schools also not included as bifurcation by province is not available for other public sector.
Table 6.5: Primary School (Public Sector) Enrolment and Enrolment Ratio by Gender,

151
Pakistan and Provinces
Primary School Enrolment Year
Girls Boys Total Gender Ratio ( Percent of Girls Enroled per 100
Boys Enrolment )
Pakistan 2000-01 4,702,201 7,250,057 11,952,258 64.9 2001-02 4,842,808 7,259,269 12,102,077 66.7 2002-03 5,079,778 7,451,560 12,531,338 68.2 2003-04 5,336,230 7,819,788 13,156,018 68.2
Punjab 2000-01 2,801,772 3,820,742 6,622,514 73.3 2001-02 2,884,913 3,771,394 6,656,307 76.5 2002-03 2,925,274 3,820,402 6,745,676 76.6 2003-04 2,969,080 3,812,319 6,781,399 77.9
Sindh 2000-01 797,130 1,472,891 2,270,021 54.1 2001-02 831,078 1,517,606 2,348,684 54.8 2002-03 957,057 1,608,150 2,565,207 59.5 2003-04 1,018,525 1,721,223 2,739,748 59.2
N.W.F.P 2000-01 770,008 1,277,363 2,047,371 60.3 2001-02 761,575 1,258,624 2,020,199 60.5 2002-03 807,872 1,323,859 2,131,731 61.0 2003-04 898,167 1,545,835 2,444,002 58.1
Balochistan 2000-01 232,523 387,005 619,528 60.1 2001-02 234,836 390,884 625,720 60.1 2002-03 240,561 402,111 642,672 59.8 2003-04 266,917 407,835 674,752 65.4
F.A.T.A.
2000-01 60,896 247,619 308,515 24.6 2001-02 90,904 275,839 366,743 33.0 2002-03 109,696 253,525 363,221 43.3 2003-04 141,653 291,388 433,041 48.6
Islamabad 2000-01 39,872 44,437 84,309 89.7 2001-02 39,502 44,922 84,424 87.9 2002-03 39,318 43,513 82,831 90.4 2003-04 41,888 41,188 83,076 101.7
Source: Academy of Education Planning & Management Ministry of Education, Govt. of Pakistan Note:- Data for Pakistan may not tally with that of other publications due to exclusion of Northern Area and AJK data in this table Table 6.6: Middle School (Public Sector) Enrolment by Gender and Year and Gender Ratio of Enrolment, Pakistan and Provinces

152
Middle School Enrolment Year
Girls Boys Total
Gender Ratio ( Percent of Girls Enroled per 100 Boys Enrolment )
Pakistan 2000-01 1,232,329 1,468,918 2,701,247 83.9 2001-02 1,009,859 1,706,813 2,716,672 59.2 2002-03 1,030,939 1,730,996 2,761,935 59.6 2003-04 1,110,489 1,817,569 2,928,058 61.1
Punjab 2000-01 612,997 937,611 1,550,608 65.4 2001-02 638,243 972,462 1,610,705 65.6 2002-03 647,164 985,106 1,632,270 65.7 2003-04 693,522 1,030,907 1,724,429 67.3
Sindh 2000-01 192,348 288,240 480,588 66.7 2001-02 179,171 266,343 445,514 67.3 2002-03 184,888 269,096 453,984 68.7 2003-04 199,165 290,441 489,606 68.6
N.W.F.P 2000-01 126,428 376,590 503,018 33.6 2001-02 139,926 347,931 487,857 40.2 2002-03 143,626 354,817 498,443 40.5 2003-04 154,016 372,805 526,821 41.3
Balochistan 2000-01 29,074 60,339 89,413 48.2 2001-02 29,365 60,942 90,307 48.2 2002-03 31,320 62,127 93,447 50.4 2003-04 35,594 64,669 100,263 55.0
F.A.T.A. 2000-01 3,510 36,992 40,502 9.5 2001-02 4,864 37,945 42,809 12.8 2002-03 5,502 36,617 42,119 15.0 2003-04 7,186 39,498 46,684 18.2
Islamabad
2000-01 17,810 19,308 37,118 92.2 2001-02 18,290 21,190 39,480 86.3 2002-03 18,439 23,233 41,672 79.4 2003-04 21,006 19,249 40,255 109.1
Source: Academy of Education Planning & Management Ministry of Education, Govt. of Pakistan Note:- Data for Pakistan may not tally with that of other publications due to exclusion of Northern Area and AJK data in this table Table 6.7: High School (Public Sector) Gender Enrolment by Year and Gender Ratio of Enrolment, Pakistan and Provinces
Year High School Enrolment Gender Ratio (Percent of Girls Enroled per

153
Girls Boys Total
100 Boys Enrolment )
Pakistan 2000-01 513,071 684,347 1,197,418 75.0 2001-02 475,507 715,216 1,190,723 66.5 2002-03 481,177 708,063 1,189,240 68.0 2003-04 482,102 806,666 1,288,768 59.8
Punjab 2000-01 239,815 402,209 642,024 59.6 2001-02 301,985 358,951 660,936 84.1 2002-03 306,216 363,623 669,839 84.2 2003-04 293,636 454,488 748,124 64.6
Sindh 2000-01 103,965 166,079 270,044 62.6 2001-02 97,697 147,868 245,565 66.1 2002-03 98,381 142,397 240,778 69.1 2003-04 106,173 153,778 259,951 69.0
N.W.F.P 2000-01 69,341 148,289 217,630 46.8 2001-02 53,516 161,382 214,898 33.2 2002-03 53,772 154,125 207,897 34.9 2003-04 55,980 148,078 204,058 37.8
Balochistan 2000-01 10,036 22,536 32,572 44.5 2001-02 10,137 22,764 32,901 44.5 2002-03 11,522 23,909 35,431 48.2 2003-04 13,160 25,588 38,748 51.4
F.A.T.A. 2000-01 1,031 13,181 14,212 7.8 2001-02 1,354 13,675 15,029 9.9 2002-03 1,259 12,765 14,024 9.9 2003-04 1,781 14,336 16,117 12.4
Islamabad 2000-01 9,935 11,001 20,936 90.3 2001-02 10,818 10,576 21,394 102.3 2002-03 10,027 11,244 21,271 89.2 2003-04 11,372 10,398 21,770 109.4
Source: Academy of Education Planning & Management, Ministry of Education Note:- Data for Pakistan may not tally with that of other publications due to exclusion of Northern Area & AJK And data of other public institutions (as bifurcation by province for other public sector not available.) Table 6.8: College of Gender Enrolment by Year and Gender Ratio, Pakistan and Provinces
College Enrolment Year
Girls Boys Total
Gender Ratio ( Percent of Girls Enroled per 100 Boys Enrolment )

154
Pakistan
2000-01 373,550 387,915 761,465 96.3 2001-02 369,161 379,137 748,298 97.4 2002-03 394,324 403,745 798,069 97.7 2003-04 440,654 460,630 901,284 95.7
Punjab 2000-01 232,407 204,487 436,894 113.7 2001-02 243,267 218,449 461,716 111.4 2002-03 257,618 234,272 491,890 110.0 2003-04 290,233 257,209 547,442 112.8
Sindh 2000-01 103,679 113,995 217,674 91.0 2001-02 87,879 92,473 180,352 95.0 2002-03 94,959 95,025 189,984 99.9 2003-04 106,167 122,846 229,013 86.4
N.W.F.P 2000-01 21,484 43,334 64,818 49.6 2001-02 19,712 46,009 65,721 42.8 2002-03 21,126 48,769 69,895 43.3 2003-04 22,326 51,085 73,411 43.7
Balochistan 2000-01 4,727 15,023 19,750 31.5 2001-02 7,228 11,317 18,545 63.9 2002-03 8,124 13,686 21,810 59.4 2003-04 8,177 13,918 22,095 58.8
F.A.T.A. 2000-01 119 3,079 3,198 3.9 2001-02 101 2,760 2,861 3.7 2002-03 142 3,781 3,923 3.8 2003-04 586 6,601 7,187 8.9
Islamabad 2000-01 11,134 7,997 19,131 139.2 2001-02 10,974 8,129 19,103 135.0 2002-03 12,355 8,212 20,567 150.5 2003-04 13,165 8,971 22,136 146.8
Source: Provincial Bureaus of Statistics Note:- Data for Pakistan may not tally with that of other publications due to exclusion of Northern Area data in this table Table 6.9: Number of Professional Colleges, Enrolment, Sex Ratio of Enrolment, Pakistan and Provinces
Professional College Enrolment Year
Girls Boys Total
Gender Ratio ( Percent of Girls Enroled per 100 Boys Enrolment )
Pakistan 1999-00 41,036 119,949 160,985 34.2
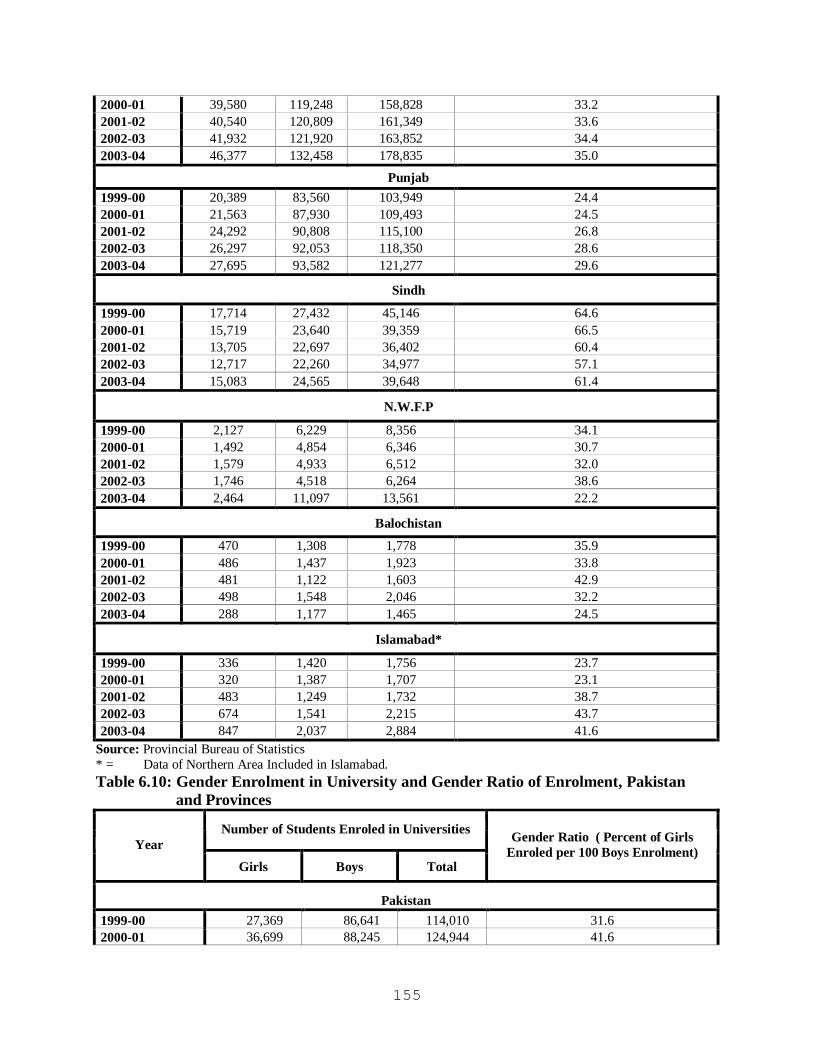
155
2000-01 39,580 119,248 158,828 33.2 2001-02 40,540 120,809 161,349 33.6 2002-03 41,932 121,920 163,852 34.4 2003-04 46,377 132,458 178,835 35.0
Punjab 1999-00 20,389 83,560 103,949 24.4 2000-01 21,563 87,930 109,493 24.5 2001-02 24,292 90,808 115,100 26.8 2002-03 26,297 92,053 118,350 28.6 2003-04 27,695 93,582 121,277 29.6
Sindh
1999-00 17,714 27,432 45,146 64.6 2000-01 15,719 23,640 39,359 66.5 2001-02 13,705 22,697 36,402 60.4 2002-03 12,717 22,260 34,977 57.1 2003-04 15,083 24,565 39,648 61.4
N.W.F.P
1999-00 2,127 6,229 8,356 34.1 2000-01 1,492 4,854 6,346 30.7 2001-02 1,579 4,933 6,512 32.0 2002-03 1,746 4,518 6,264 38.6 2003-04 2,464 11,097 13,561 22.2
Balochistan
1999-00 470 1,308 1,778 35.9 2000-01 486 1,437 1,923 33.8 2001-02 481 1,122 1,603 42.9 2002-03 498 1,548 2,046 32.2 2003-04 288 1,177 1,465 24.5
Islamabad*
1999-00 336 1,420 1,756 23.7 2000-01 320 1,387 1,707 23.1 2001-02 483 1,249 1,732 38.7 2002-03 674 1,541 2,215 43.7 2003-04 847 2,037 2,884 41.6
Source: Provincial Bureau of Statistics * = Data of Northern Area Included in Islamabad. Table 6.10: Gender Enrolment in University and Gender Ratio of Enrolment, Pakistan and Provinces
Number of Students Enroled in Universities Year
Girls Boys Total
Gender Ratio ( Percent of Girls Enroled per 100 Boys Enrolment)
Pakistan 1999-00 27,369 86,641 114,010 31.6 2000-01 36,699 88,245 124,944 41.6

156
2001-02 39,682 78,181 117,863 50.8 2002-03 43,668 83,202 126,870 52.5 2003-04* 82,203 133,225 215,428 61.7
Punjab 1999-00 10,077 25,506 35,583 39.5 2000-01 12,373 27,957 40,330 44.3 2001-02 15,366 28,933 44,299 53.1 2002-03 16,642 31,473 48,115 52.9 2003-04 46,499 64,696 111,195 71.9
Sindh 1999-00 13,923 37,524 51,447 37.1 2000-01 14,675 30,703 45,378 47.8 2001-02 13,195 22,310 35,505 59.1 2002-03 16,192 25,580 41,772 63.3 2003-04 20,291 31,548 51,839 64.3
N.W.F.P 1999-00 1,119 14,047 15,166 8.0 2000-01 6,539 19,843 26,382 33.0 2001-02 4,407 13,056 17,463 33.8 2002-03 3,197 12,816 16,013 24.9 2003-04 5,268 16,766 22,034 31.4
Balochistan 1999-00 387 6,410 6,797 6.0 2000-01 823 4,749 5,572 17.3 2001-02 1,328 4,532 5,860 29.3 2002-03 1,131 3,330 4,461 34.0 2003-04 648 1,942 2,590 33.4
Islamabad 1999-00 1,863 3,154 5,017 59.1 2000-01 2,289 4,993 7,282 45.8 2001-02 5,386 9,350 14,736 57.6 2002-03 6,506 10,003 16,509 65.0 2003-04 9,497 18,273 27,770 52.0
Source: Provincial Bureau of Statistics/Universities Note:- Data of AJK & Northern Area is not included.

157
Table 6.11: Number of Primary School (Public Sector) Teachers by Gender and Teachers per School, Pakistan and Provinces
Number of Primary School Teachers Teachers per Primary School Year
Women Men Both Sexes Women Men Both Sexes Pakistan
2000-01 119,638 203,114 322,752 3.0 2.9 2.5 2001-02 116,408 207,165 323,573 2.9 2.9 2.5 2002-03 121,220 217,533 338,753 2.9 3.1 2.6 2003-04 115,639 205,912 321,551 2.8 2.9 2.5
Punjab 2000-01 62,191 79,844 142,035 2.7 2.7 2.7 2001-02 62,015 82,488 144,503 2.7 2.8 2.8 2002-03 66,350 88,252 154,602 2.9 3.0 3.0 2003-04 58,702 77,177 135,879 2.6 2.7 2.6
Sindh 2000-01 27,358 71,779 99,137 4.5 4.2 2.5 2001-02 27,915 69,322 97,237 4.6 4.0 2.5 2002-03 26,676 68,655 95,331 4.2 3.9 2.4 2003-04 26,676 68,655 95,331 4.2 3.9 2.4
N.W.F.P 2000-01 18,842 42,332 61,174 2.5 2.9 2.7 2001-02 18,812 42,280 61,092 2.4 2.8 2.7 2002-03 18,462 41,984 60,446 2.5 2.9 2.7 2003-04 19,860 40,812 60,672 2.7 2.8 2.8
Balochistan 2000-01 3,625 6,222 9,847 1.4 0.9 1.0 2001-02 3,661 6,283 9,944 1.4 0.9 1.0 2002-03 4,361 11,601 15,962 1.7 1.6 1.6 2003-04 4,823 12,196 17,019 1.8 1.6 1.7
F.A.T.A. 2000-01 6,057 2,501 8,558 5.7 1.1 2.5 2001-02 2,990 6,001 8,991 2.2 2.6 2.4 2002-03 3,953 6,570 10,523 2.4 2.6 2.5 2003-04 4,180 6,608 10,788 2.4 2.6 2.5
Islamabad 2000-01 1,565 436 2,001 24.1 6.3 8.0 2001-02 1,015 791 1,806 32.7 17.2 8.1 2002-03 1,418 471 1,889 48.9 10.5 8.7 2003-04 1,398 464 1,862 23.7 6.8 8.9
Source: Academy of Education Planning & Management M/O Education Note:- Data for Pakistan may not tally with that of other publications due to exclusion of Northern Area, AJK And other public sector data for 2003-04 in this table.

158
Table 6.12: Number of Middle School (Public Sector) Teachers by Gender and Teachers
per School, Pakistan and Provinces
Number of Middle School Teachers Teachers per Middle School Year
Women Men Both Sexes Women Men Both Sexes
Pakistan 2000-01 42,664 50,008 92,672 8.1 8.7 8.1 2001-02 51,945 55,152 107,097 9.3 9.2 8.9 2002-03 54,210 53,337 107,547 9.2 8.7 8.6 2003-04 48,956 52,523 101,479 8.3 8.6 8.1
Punjab 2000-01 34,439 28,838 63,277 9.4 11.3 10.2 2001-02 40,164 29,171 69,335 10.3 10.9 10.5 2002-03 42,976 31,210 74,186 10.5 11.2 10.8 2003-04 37,070 29,972 67,042 9.2 10.9 9.9
Sindh 2000-01 3,146 5,521 8,667 5.3 5.1 4.2 2001-02 4,334 5,357 9,691 6.4 4.6 4.3 2002-03 4,244 5,248 9,492 6.1 4.4 4.0 2003-04 4,244 5,248 9,492 6.1 4.4 4.0
N.W.F.P 2000-01 1,553 2,673 4,226 2.1 2.1 2.1 2001-02 4,063 7,463 11,526 5.4 5.6 5.6 2002-03 3,786 8,514 12,300 5.2 6.5 6.0 2003-04 3,749 8,450 12,199 5.1 6.4 5.9
Balochistan 2000-01 2,526 10,147 12,673 15.5 19.3 18.4 2001-02 2,552 10,249 12,801 15.6 19.3 18.4 2002-03 1,777 5,359 7,136 8.0 9.9 9.3 2003-04 2,572 6,001 8,573 11.1 11.1 11.1
F.A.T.A. 2000-01 610 2,626 3,236 9.2 11.2 10.5 2001-02 696 2,534 3,230 7.5 9.1 8.7 2002-03 1,010 2,788 3,798 8.1 9.9 9.3 2003-04 923 2,625 3,548 7.7 9.2 8.8
Islamabad 2000-01 390 203 593 16.3 10.2 11.9 2001-02 136 378 514 7.6 23.6 10.9 2002-03 417 218 635 21.9 12.8 12.2 2003-04 398 227 625 12.1 10.8 11.6
Source: Academy of Educational Planning & Management M/O Education Note:- Data for Pakistan may not tally with that of other publications due to exclusion of Northern Area and AJK and other public sector data in table. Table 6.13: Number of High Schools (Public Sector) Teachers by Gender and Teachers

159
Per School, Pakistan and Provinces
Number of High School Teachers Teachers per High School Year
Women Men Both Sexes Women Men Both Sexes Pakistan
2000-01 49,884 102,035 151,919 21.2 18.9 19.0 2001-02 49,853 106,896 156,749 21.5 19.9 19.8 2002-03 51,997 107,313 159,310 1.1 1.3 1.1 2003-04 49,500 101,708 151,208 20.2 18.5 18.5
Punjab 2000-01 33,062 63,024 96,086 22.0 21.5 21.7 2001-02 30,982 57,373 88,355 21.1 19.9 20.3 2002-03 33,149 61,388 94,537 22.0 20.7 21.2 2003-04 30,517 54,889 85,406 19.8 18.8 19.1
Sindh 2000-01 11,074 18,646 29,720 26.8 22.9 20.4 2001-02 10,844 18,453 29,297 25.6 22.4 19.8 2002-03 10,908 17,796 28,704 25.2 21.5 19.1 2003-04 10,908 17,796 28,704 25.2 21.5 19.1
N.W.F.P 2000-01 1,456 5,992 7,448 5.4 5.6 5.6 2001-02 3,809 16,731 20,540 14.0 15.7 15.4 2002-03 3,587 15,486 19,073 13.0 14.6 14.2 2003-04 3,556 15,436 18,992 13.0 14.6 14.3
Balochistan 2000-01 3,223 10,713 13,936 32.2 28.3 29.1 2001-02 3,255 10,821 14,076 32.2 28.3 29.1 2002-03 3,071 8,186 11,257 25.2 19.4 20.7 2003-04 3,159 8,948 12,107 25.1 20.8 21.8
F.A.T.A. 2000-01 227 3,000 3,227 10.8 17.3 16.0 2001-02 173 2,746 2,919 10.2 15.6 15.1 2002-03 413 3,581 3,994 15.9 17.4 17.2 2003-04 390 3,551 3,941 14.4 17.2 16.9
Islamabad 2000-01 842 660 1,502 21.1 16.1 18.3 2001-02 790 772 1,562 21.9 20.3 19.0 2002-03 869 876 1,745 24.8 23.1 21.5 2003-04 970 1,088 2,058 20.2 23.7 21.9
Source: Ministry of Education, Government of Pakistan Note:- Data for Pakistan may not tally with that of other publications due to exclusion of Northern Area and AJK and other public sector data in this table.

160
Table 6.14: Number of College Teachers by Gender and Teachers per College, Pakistan and Provinces
Number of Colleges Teachers Teachers Per College Year
Women Men Both Sexes Women Men Both Sexes
Pakistan 2000-01 10,491 16,805 27,296 27.8 31.9 30.2 2001-02 10,389 15,896 26,285 26.6 29.7 28.4 2002-03 10,971 16,689 27,660 26.7 30.8 29.1 2003-04 12,187 17,281 29,468 26.8 28.9 28.0
Punjab 2000-01 6,557 9,260 15,817 34.5 43.3 39.0 2001-02 6,442 8,726 15,168 26.1 32.7 29.5 2002-03 6,990 9,254 16,244 26.9 34.3 30.6 2003-04 7,678 9,693 17,371 25.6 33.9 29.7
Sindh 2000-01 2,410 3,607 6,017 34.9 30.7 32.2 2001-02 2,387 3,346 5,733 32.3 24.2 27.0 2002-03 2,364 3,546 5,910 30.3 26.1 27.6 2003-04 2,435 3,352 5,787 28.3 23.8 25.5
N.W.F.P 2000-01 582 2,109 2,691 28.6 35.1 33.5 2001-02 681 2,221 2,902 23.5 32.7 29.9 2002-03 707 2,275 2,982 23.6 31.6 29.2 2003-04 756 2,468 3,224 25.2 33.4 31.0
Balochistan 2000-01 355 1,074 1,429 23.8 30.5 28.9 2001-02 295 865 1,160 14.0 22.8 19.7 2002-03 297 872 1,169 14.1 22.9 19.8 2003-04 297 877 1174 12.9 19.1 17.0
F.A.T.A. 2000-01 24 256 280 24.0 25.6 25.5 2001-02 24 256 280 24.0 25.6 25.5 2002-03 22 213 235 22.0 21.3 21.4 2003-04 132 362 494 12.0 17.2 15.4
Islamabad 2000-01 563 499 1,062 35.8 39.3 37.4 2001-02 560 482 1,042 29.5 32.1 30.6 2002-03 591 529 1,120 28.1 35.3 31.1
2003-04 889 529 1,418 46.8 31.1 39.4 Source: Ministry of Education, Government of Pakistan Note:- Data for Pakistan may not tally with that of other publications due to exclusion of Northern Area, data in this table

161
Table 6.15: Number of Teachers in Professional Colleges (Public Sector) and Teachers Per College by Gender, Pakistan and Provinces
Number of Professional Colleges Teachers Teachers per Professional College Year
Women Men Both Sexes Women Men Both Sexes
Pakistan 1999-00 1,765 7,278 9,043 118 22 26 2000-01 1,769 7,362 9,131 98 21 24 2001-02 2,015 7,343 9,358 101 20 24 2002-03 2,107 7,734 9,841 111 21 26 2003-04 2,187 8,472 10,659 109 21 26
Punjab 1999-00 1,091 4,977 6,068 121 23 27 2000-01 1,161 5,158 6,319 97 21 25 2001-02 1,360 5,240 6,600 97 20 24 2002-03 1,434 5,520 6,954 102 20 24 2003-04 1,491 5,870 7,361 107 20 69
Sindh 1999-00 450 1,114 1,564 113 27 35 2000-01 402 945 1,347 101 24 31 2001-02 407 954 1,361 102 24 31 2002-03 384 933 1,317 128 23 30 2003-04 382 951 1,333 96 23 29
N.W.F.P 1999-00 128 730 858 128 16 19 2000-01 102 718 820 102 16 17 2001-02 144 711 855 144 15 18 2002-03 163 831 994 163 19 23 2003-04 215 1,266 1,481 215 27 31
Balochistan 1999-00 46 309 355 - 77 89 2000-01 47 386 433 - 97 108 2001-02 47 285 332 - 71 83 2002-03 63 321 384 - 80 96 2003-04 21 222 243 - 32 35
Islamabad* 1999-00 50 148 198 50 37 40 2000-01 57 155 212 57 39 42 2001-02 57 153 210 57 38 42 2002-03 63 129 192 63 32 38 2003-04 69 172 241 69 34 40
Source: Provincial Bureaus of Statistics * = Data of Northern Area included in Islamabad

162
Table 6.16: Number of University Teachers by Gender and Teachers per University, Pakistan and Provinces
Number of University Teachers Teachers per University Year
Women Men Both Sexes Women Men Both Sexes
Pakistan 2000-01 1,302 4,686 5,988 52 240 240 2001-02 1,247 3,913 5,160 43 178 178 2002-03 1,375 4,805 6,180 47 213 213 2003-04* 3,072 8,057 11,129 63 227 227
Punjab 2000-01 319 1,485 1,804 35 200 200 2001-02 420 1,003 1,423 47 158 158 2002-03 347 1,605 1,952 39 217 217 2003-04 1,569 3,744 5,313 83 280 280
Sindh 2000-01 682 2,021 2,703 85 338 338 2001-02 506 1,448 1,954 63 244 244 2002-03 571 1,500 2,071 71 259 259 2003-04 844 1,923 2,767 70 231 231
N.W.F.P 2000-01 169 802 971 42 243 243 2001-02 97 851 948 14 135 135 2002-03 193 949 1,142 28 163 163 2003-04 218 1,009 1,227 27 153 153
Balochistan 2000-01 77 205 282 39 141 141 2001-02 84 355 439 42 220 220 2002-03 84 367 451 42 226 226 2003-04 88 306 394 29 131 131
Islamabad 2000-01 55 173 228 28 114 114 2001-02 140 256 396 47 132 132 2002-03 180 384 564 60 188 188 2003-04 353 1,075 1,428 50 204 204
Source: Universities * Data of AJK and Northern Area are not included.

163
Table 6.17: Result of Matric Examination (Public Sector) by Gender, Pakistan and Provinces 1996
Arts Subjects Science Subjects Year
Number Appeared
Number Passed
Percent of Passed
Number Appeared
Number Passed
Percent of Passed
Pakistan
Women 277083 154110 55.6 92448 72234 78.1
Men 369371 132615 35.9 417402 254562 61.0
Both Sexes 646454 286725 44.4 509850 326796 64.1
Punjab
Women 196348 103766 52.8 30090 23109 76.8
Men 227556 74501 32.7 170147 96055 56.5
Both Sexes 423904 178267 42.1 200237 119164 59.5
Sindh
Women 35730 23895 66.9 48180 37824 78.5
Men 24069 12938 53.8 136656 92882 68.0
Both Sexes 59799 36833 61.6 184836 130706 70.7
NWFP
Women 32570 17496 53.7 5113 3436 67.2
Men 103407 38587 37.3 69757 38204 54.8
Both Sexes 135977 56083 41.2 74870 41640 55.6
Balochistan
Women 3297 2181 66.2 1803 1448 80.3
Men 5989 3012 50.3 22033 13837 62.8
Both Sexes 9286 5193 55.9 23836 15285 64.1
Islamabad
Women 9138 6772 74.1 7262 6417 88.4
Men 8350 3577 42.8 18809 13584 72.2
Both Sexes 17488 10349 59.2 26071 20001 76.7 Contd…

164
Table 6.17: Result of Matric Examination (Public Sector) by Gender, Pakistan and Provinces 1997
Arts Subjects Science Subjects Year
Number Appeared
Number Passed
Percent of Passed
Number Appeared
Number Passed
Percent of Passed
Pakistan
Women 279216 141502 50.7 101853 80342 78.9
Men 332951 105238 31.6 432694 255761 59.1
Both Sexes 612167 246740 40.3 534547 336103 62.9
Punjab
Women 190940 91010 47.7 37057 28302 76.4
Men 187817 53796 28.6 192467 106100 55.1
Both Sexes 378757 144806 38.2 229524 134402 58.6
Sindh
Women 36257 25237 69.6 48610 39005 80.2
Men 21242 12957 61.0 121666 87534 71.9
Both Sexes 57499 38194 66.4 170276 126539 74.3
NWFP
Women 39333 17803 45.3 6006 4601 76.6
Men 109954 32991 30.0 72956 36690 50.3
Both Sexes 149287 50794 34.0 78962 41291 52.3
Balochistan
Women 3709 2302 62.1 2451 1559 63.6
Men 7080 3451 48.7 27608 12661 45.9
Both Sexes 10789 5753 53.3 30059 14220 47.3
Islamabad
Women 8977 5150 57.4 7729 6875 89.0
Men 6858 2043 29.8 17997 12776 71.0
Both Sexes 15835 7193 45.4 25726 19651 76.4 Contd…

165
Table 6.17: Result of Matric Examination (Public Sector) by Gender, Pakistan and
Provinces 1998
Arts Subjects Science Subjects Year
Number Appeared
Number Passed
Percent of Passed
Number Appeared
Number Passed
Percent of Passed
Pakistan
Women 309035 146806 47.5 116235 86511 74.4
Men 351063 96844 27.6 441866 242734 54.9
Both Sexes 660098 243650 36.9 558101 329245 59.0
Punjab
Women 207971 93745 45.1 41731 29738 71.3
Men 190476 49111 25.8 193569 93243 48.2
Both Sexes 398447 142856 35.9 235300 122981 52.3
Sindh
Women 37532 25751 68.6 54482 41093 75.4
Men 22142 14000 63.2 126365 86338 68.3
Both Sexes 59674 39751 66.6 180847 127431 70.5
NWFP
Women 47319 18381 38.8 7972 5766 72.3
Men 124032 28902 23.3 74813 34982 46.8
Both Sexes 171351 47283 27.6 82785 40748 49.2
Balochistan
Women 4688 2725 58.1 3074 2360 76.8
Men 6017 2402 39.9 25818 14399 55.8
Both Sexes 10705 5127 47.9 28892 16759 58.0
Islamabad
Women 11525 6204 53.8 8976 7554 84.2
Men 8396 2429 28.9 21301 13772 64.7
Both Sexes 19921 8633 43.3 30277 21326 70.4 Contd…

166
Table 6.17: Result of Matric Examination (Public Sector) by Gender, Pakistan and Provinces 1999
Arts Subjects Science Subjects Year
Number Appeared
Number Passed
Percent of Passed
Number Appeared
Number Passed
Percent of Passed
Pakistan
Women 311762 152065 48.8 143447 103060 71.8
Men 325267 99816 30.7 447691 231455 51.7
Both Sexes 637029 251881 39.5 591138 334515 56.6
Punjab
Women 205495 100910 49.1 49270 35898 72.9
Men 160917 50399 31.3 193665 97170 50.2
Both Sexes 366412 151309 41.3 242935 133068 54.8
Sindh
Women 38984 21575 55.3 64019 43232 67.5
Men 24157 11083 45.9 139481 73407 52.6
Both Sexes 63141 32658 51.7 203500 116639 57.3
NWFP
Women 48943 19812 40.5 7922 6363 80.3
Men 126809 33053 26.1 78584 38151 48.5
Both Sexes 175752 52865 30.1 86506 44514 51.5
Balochistan
Women 6123 3616 59.1 12706 9608 75.6
Men 5486 3287 59.9 13226 8213 62.1
Both Sexes 11609 6903 59.5 25932 17821 68.7
Islamabad
Women 12217 6152 50.4 9530 7959 83.5
Men 7898 1994 25.2 22735 14514 63.8
Both Sexes 20115 8146 40.5 32265 22473 69.7 Contd…

167
Table 6.17: Result of Matric Examination (Public Sector) by Gender, Pakistan and Provinces 2000
Arts Subjects Science Subjects Year
Number Appeared
Number Passed
Percent of Passed
Number Appeared
Number Passed
Percent of Passed
Pakistan
Women 320026 159905 50.0 137524 91895 66.8
Men 330620 97028 29.3 463399 221808 47.9
Both Sexes 650646 256933 39.5 600923 313703 52.2
Punjab
Women 214045 108560 50.7 53282 40124 75.3
Men 177437 60326 34.0 206071 114418 55.5
Both Sexes 391482 168886 43.1 259353 154542 59.6
Sindh
Women 36806 20707 56.3 61354 34864 56.8
Men 18410 8684 47.2 119663 47816 40.0
Both Sexes 55216 29391 53.2 181017 82680 45.7
NWFP
Women 51054 22830 44.7 8100 6292 77.7
Men 120887 25559 21.1 87319 40464 46.3
Both Sexes 171941 48389 28.1 95419 46756 49.0
Balochistan
Women 5319 1190 22.4 4265 1778 41.7
Men 4877 786 16.1 25107 3144 12.5
Both Sexes 10196 1976 19.4 29372 4922 16.8
Islamabad
Women 12802 6618 51.7 10523 8837 84.0
Men 9009 1673 18.6 25239 15966 63.3
Both Sexes 21811 8291 38.0 35762 24803 69.4 Contd…

168
Table 6.17: Result of Matric Examination (Public Sector) by Gender, Pakistan and Provinces 2001
Arts Subjects Science Subjects Year
Number Appeared
Number Passed
Percent of Passed
Number Appeared
Number Passed
Percent of Passed
Pakistan
Women 314583 165604 52.6 155162 104971 67.7
Men 323540 105482 32.6 480632 256963 53.5
Both Sexes 638123 271086 42.5 635794 361934 56.9
Punjab
Women 206323 114980 55.7 58269 45195 77.6
Men 171774 64851 37.8 208376 127943 61.4
Both Sexes 378097 179831 47.6 266645 173138 64.9
Sindh
Women 38677 19158 49.5 71918 40519 56.3
Men 20852 8973 43.0 142301 62776 44.1
Both Sexes 59529 28131 47.3 214219 103295 48.2
NWFP
Women 51006 22913 44.9 8533 6785 79.5
Men 117884 28895 24.5 79108 40849 51.6
Both Sexes 168890 51808 30.7 87641 47634 54.4
Balochistan
Women 5375 2636 49.0 4845 3164 65.3
Men 3320 826 24.9 24601 9231 37.5
Both Sexes 8695 3462 39.8 29446 12395 42.1
Islamabad
Women 13202 5917 44.8 11597 9308 80.3
Men 9710 1937 19.9 26246 16164 61.6
Both Sexes 22912 7854 34.3 37843 25472 67.3 Contd….

169
Table 6.17: Result of Matric Examination (Public Sector) by Gender, Pakistan and Provinces 2002
Arts Subjects Science Subjects Year
Number Appeared
Number Passed
Percent of Passed
Number Appeared
Number Passed
Percent of Passed
Pakistan
Women 315014 171634 54.5 162108 117660 72.6
Men 321298 117849 36.7 450979 268115 59.5
Both Sexes 636312 289483 45.5 613087 385775 62.9
Punjab
Women 212046 118626 55.9 62762 48358 77.0
Men 183635 72331 39.4 206843 123832 59.9
Both Sexes 395681 190957 48.3 269605 172190 63.9
Sindh
Women 40357 21419 53.1 70813 48693 68.8
Men 19903 9721 48.8 131264 81231 61.9
Both Sexes 60260 31140 51.7 202077 129924 64.3
NWFP
Women 46192 23420 50.7 10231 8271 80.8
Men 102716 31049 30.2 70482 43350 61.5
Both Sexes 148908 54469 36.6 80713 51621 64.0
Balochistan
Women 3896 1557 40.0 3509 1625 46.3
Men 2162 609 28.2 15519 3659 23.6
Both Sexes 6058 2166 35.8 19028 5284 27.8
Islamabad
Women 12523 6612 52.8 14793 10713 72.4
Men 12882 4139 32.1 26871 16043 59.7
Both Sexes 25405 10751 42.3 41664 26756 64.2 Contd…

170
Table 6.17: Result of Matric Examination (Public Sector) by Gender, Pakistan and Provinces 2003
Arts Subjects Science Subjects Year
Number Appeared
Number Passed
Percent of Passed
Number Appeared
Number Passed
Percent of Passed
Pakistan
Women 344613 185197 56.0 188047 140245 74.6
Men 346975 111752 32.2 516079 305613 59.2
Both Sexes 691588 296949 44.1 704126 445858 63.3
Punjab
Women 252021 136878 54.3 91231 67247 73.7
Men 210606 65004 30.9 288200 156445 54.3
Both Sexes 462627 201882 43.6 379431 223692 59.0
Sindh
Women 36453 19949 54.7 68697 49804 72.5
Men 18796 9543 50.8 123156 83103 67.5
Both Sexes 55249 29492 53.4 191853 132907 69.3
NWFP
Women 43516 21682 49.8 9532 8031 84.3
Men 108440 34556 31.9 60971 38864 63.7
Both Sexes 151956 56238 37.0 70503 46895 66.5
Balochistan
Women 2091 954 243.3 4321 3363 77.8
Men 3398 1434 42.2 18136 9949 54.9
Both Sexes 5489 2388 152.1 22457 13312 59.3
Islamabad
Women 10532 5734 54.4 14266 11800 82.7
Men 5735 1215 21.2 25616 17252 67.3
Both Sexes 16267 6949 42.7 39882 29052 72.8 Contd..

171
Table 6.17: Result of Matric Examination (Public Sector) by Gender, Pakistan and Provinces 2004
Arts Subjects Science Subjects Year
Number Appeared
Number Passed
Percent of Passed
Number Appeared
Number Passed
Percent of Passed
Pakistan
Women 307402 260327 84.7 211208 188411 89.2
Men 275210 183193 66.6 533972 447936 83.9
Both Sexes 582612 443520 76.1 745180 636347 85.4
Punjab*
Women 210699 201368 95.6 103449 101705 98.3
Men 147083 128105 87.1 270554 256680 94.9
Both Sexes 357782 329473 92.1 374003 358385 95.8
Sindh
Women 33567 23007 68.5 73650 60200 81.7
Men 20624 12966 62.9 130011 102889 79.1
Both Sexes 54191 35973 66.4 203661 163089 80.1
NWFP
Women 45928 25262 55.0 13841 11209 81.0
Men 97135 37390 38.5 81765 54019 66.1
Both Sexes 143063 62652 43.8 95606 65228 68.2
Balochistan
Women 4943 3565 72.1 5029 2260 44.9
Men 5764 2985 51.8 20441 13367 65.4
Both Sexes 10707 6550 61.2 25470 15627 61.4
Islamabad
Women 12265 7125 58.1 15239 13037 85.6
Men 4604 1747 37.9 31201 20981 67.2
Both Sexes 16869 8872 52.6 46440 34018 73.3 Source: Provincial Bureaus of Statistics and Universities * In Punjab result of matric level for 2004is prepared under (New System ) with out pass/;fail system.

172
Table 6.18: Result of Intermediate Examination (Public Sector) by Gender, Pakistan and Provinces 1996
Arts Subjects Pre- Engineering Group Pre- Medical Group
Year Number
Appeared Number Passed
Percent of Passed
Number Appeared
Number Passed
Percent of Passed
Number Appeared
Number Passed
Percent of Passed
Pakistan
Women 185574 69432 37.4 4440 2546 57.3 39893 26807 67.2
Men 228458 69769 30.5 80485 33077 41.1 84238 46364 55.0
Both Sexes 414032 139201 33.6 84925 35623 41.9 124131 73171 58.9
Punjab
Women 130954 42135 32.2 816 479 58.7 7856 4350 55.4
Men 136432 37584 27.5 18941 7089 37.4 14633 5016 34.3
Both Sexes 267386 79719 29.8 19757 7568 38.3 22489 9366 41.6
Sindh
Women 29160 15541 53.3 2910 1484 51.0 26085 17789 68.2
Men 20036 9591 47.9 46772 17858 38.2 54589 33967 62.2
Both Sexes 49196 25132 51.1 49682 19342 38.9 80674 51756 64.2
NWFP
Women 16473 6737 40.9 186 127 68.3 1600 1075 67.2
Men 55148 16032 29.1 6545 3078 47.0 6004 2967 49.4
Both Sexes 71621 22769 31.8 6731 3205 47.6 7604 4042 53.2
Balochistan
Women 2825 1373 48.6 39 27 69.2 911 628 68.9
Men 11201 4198 37.5 3283 1344 40.9 5952 2208 37.1
Both Sexes 14026 5571 39.7 3322 1371 41.3 6863 2836 41.3
Islamabad
Women 6162 3646 59.2 489 429 87.7 3441 2965 86.2
Men 5641 2364 41.9 4944 3708 75.0 3060 2206 72.1
Both Sexes 11803 6010 50.9 5433 4137 76.1 6501 5171 79.5 Contd…

173
Table 6.18: Result of Intermediate Examination (Public Sector) by Gender, Pakistan and Provinces 1997
Arts Subjects Pre- Engineering Group Pre- Medical Group
Year Number
Appeared Number Passed
Percent of Passed
Number Appeared
Number Passed
Percent of Passed
Number Appeared
Number Passed
Percent of Passed
Pakistan
Women 183126 81468 44.5 5402 2988 55.3 38798 24394 62.9
Men 221217 79334 35.4 67661 31459 46.5 65914 30028 45.6
Both Sexes 404343 160802 39.5 73063 34447 47.1 104712 54422 52.0
Punjab
Women 116092 48560 41.8 1522 747 49.1 8629 5495 63.7
Men 126923 40927 32.2 16746 7250 43.3 14801 6300 42.6
Both Sexes 243015 89487 36.8 18268 7997 43.8 23430 11795 50.3
Sindh
Women 35174 19210 54.6 2912 1465 50.3 23705 13652 57.6
Men 28151 14665 52.1 35376 16172 45.7 35598 16213 45.5
Both Sexes 63325 33875 53.5 38288 17637 46.1 59303 29865 50.4
NWFP
Women 21711 7629 35.1 342 242 70.8 2063 1412 68.4
Men 52035 17923 32.5 7806 3374 43.2 7166 3550 49.5
Both Sexes 73746 25552 33.3 8148 3616 44.4 9229 4962 53.8
Balochistan
Women 2064 1047 50.7 55 35 63.6 738 570 77.2
Men 5022 1770 35.2 2599 833 32.1 5336 1744 32.7
Both Sexes 7086 2817 39.8 2654 868 32.7 6074 2314 38.1
Islamabad
Women 8085 5022 62.1 571 499 87.4 3663 3265 89.1
Men 9086 4049 44.6 5134 3830 74.6 3013 2221 73.7
Both Sexes 17171 9071 52.8 5705 4329 75.9 6676 5486 82.2 Contd…

174
Table 6.18: Result of Intermediate Examination (Public Sector) by Gender, Pakistan and Provinces 1998
Arts Subjects Pre- Engineering Group Pre- Medical Group
Year Number
Appeared Number Passed
Percent of Passed
Number Appeared
Number Passed
Percent of Passed
Number Appeared
Number Passed
Percent of Passed
Pakistan
Women 190802 86577 45.4 5808 3692 63.6 39530 25554 64.6
Men 225361 76729 34.0 66705 32342 48.5 64018 32475 50.7
Both Sexes 416163 163306 39.2 72513 36034 49.7 103548 58029 56.0
Punjab
Women 114619 48319 42.2 1213 785 64.7 9234 5670 61.4
Men 111670 33589 30.1 16855 7005 41.6 13667 5709 41.8
Both Sexes 226289 81908 36.2 18068 7790 43.1 22901 11379 49.7
Sindh
Women 37141 20697 55.7 3340 1962 58.7 22834 14224 62.3
Men 30239 17913 59.2 32243 15592 48.4 31452 17185 54.6
Both Sexes 67380 38610 57.3 35583 17554 49.3 54286 31409 57.9
NWFP
Women 25535 9459 37.0 378 258 68.3 2057 1348 65.5
Men 61853 16048 25.9 7917 3449 43.6 7521 3606 47.9
Both Sexes 87388 25507 29.2 8295 3707 44.7 9578 4954 51.7
Balochistan
Women 4299 2811 65.4 171 97 56.7 1495 954 63.8
Men 11468 5312 46.3 4016 2180 54.3 8485 3937 46.4
Both Sexes 15767 8123 51.5 4187 2277 54.4 9980 4891 49.0
Islamabad
Women 9208 5291 57.5 706 590 83.6 3910 3358 85.9
Men 10131 3867 38.2 5674 4116 72.5 2893 2038 70.4
Both Sexes 19339 9158 47.4 6380 4706 73.8 6803 5396 79.3 Contd…

175
Table 6.18: Result of Intermediate Examination (Public Sector) by Gender, Pakistan and Provinces 1999
Arts Subjects Pre- Engineering Group Pre- Medical Group
Year Number
Appeared Number Passed
Percent of Passed
Number Appeared
Number Passed
Percent of Passed
Number Appeared
Number Passed
Percent of Passed
Pakistan
Women 198074 85126 43.0 7108 4067 57.2 41380 23522 56.8
Men 214311 66578 31.1 71132 32116 45.1 72180 29160 40.4
Both Sexes 412385 151704 36.8 78240 36183 46.2 113560 52682 46.4
Punjab
Women 121990 52356 42.9 1749 1046 59.8 10011 6102 61.0
Men 108222 36196 33.4 18359 8090 44.1 13375 5745 43.0
Both Sexes 230212 88552 38.5 20108 9136 45.4 23386 11847 50.7
Sindh
Women 38071 15830 41.6 4045 1958 48.4 23656 11237 47.5
Men 31337 11241 35.9 36408 13693 37.6 41745 14165 33.9
Both Sexes 69408 27071 39.0 40453 15651 38.7 65401 25402 38.8
NWFP
Women 21723 7427 34.2 385 293 76.1 2247 1617 72.0
Men 55598 12185 21.9 7570 4431 58.5 7378 4347 58.9
Both Sexes 77321 19612 25.4 7955 4724 59.4 9625 5964 62.0
Balochistan
Women 7227 4232 58.6 113 86 76.1 1413 1039 73.5
Men 9887 3047 30.8 2853 1605 56.3 6846 2813 41.1
Both Sexes 17114 7279 42.5 2966 1691 57.0 8259 3852 46.6
Islamabad
Women 9063 5281 58.3 816 684 83.8 4053 3527 87.0
Men 9267 3909 42.2 5942 4297 72.3 2836 2090 73.7
Both Sexes 18330 9190 50.1 6758 4981 73.7 6889 5617 81.5 Contd…

176
Table 6.18: Result of Intermediate Examination (Public Sector) by Gender, Pakistan and Provinces 2000
Arts Subjects Pre- Engineering Group Pre- Medical Group
Year Number
Appeared Number Passed
Percent of Passed
Number Appeared
Number Passed
Percent of Passed
Number Appeared
Number Passed
Percent of Passed
Pakistan
Women 211448 94795 44.8 8508 4913 57.7 44132 21368 48.4
Men 200264 61092 30.5 66283 27975 42.2 65655 20488 31.2
Both Sexes 411712 155887 37.9 74791 32888 44.0 109787 41856 38.1
Punjab
Women 129519 65560 50.6 1937 1298 67.0 10009 6631 66.3
Men 104453 42474 40.7 17156 9092 53.0 11664 6106 52.3
Both Sexes 233972 108034 46.2 19093 10390 54.4 21673 12737 58.8
Sindh
Women 37236 13167 35.4 4755 2280 47.9 26063 8493 32.6
Men 23842 3192 13.4 32401 8732 26.9 36407 6141 16.9
Both Sexes 61078 16359 26.8 37156 11012 29.6 62470 14634 23.4
NWFP
Women 32553 11008 33.8 498 372 74.7 2554 2015 78.9
Men 60885 13293 21.8 8670 5320 61.8 8792 5325 60.6
Both Sexes 93438 24301 26.0 9168 5692 62.5 11346 7340 64.7
Balochistan
Women 3217 867 27.0 386 160 41.5 1469 635 43.2
Men 5992 570 9.5 2379 520 21.9 6285 949 15.1
Both Sexes 9209 1437 15.6 2765 680 24.6 7754 1584 20.4
Islamabad
Women 8923 4193 47.0 932 803 86.2 4037 3594 89.0
Men 5092 1563 30.7 5677 4311 75.9 2507 1967 78.5
Both Sexes 14015 5756 41.1 6609 5114 77.4 6544 5561 85.0 Contd…
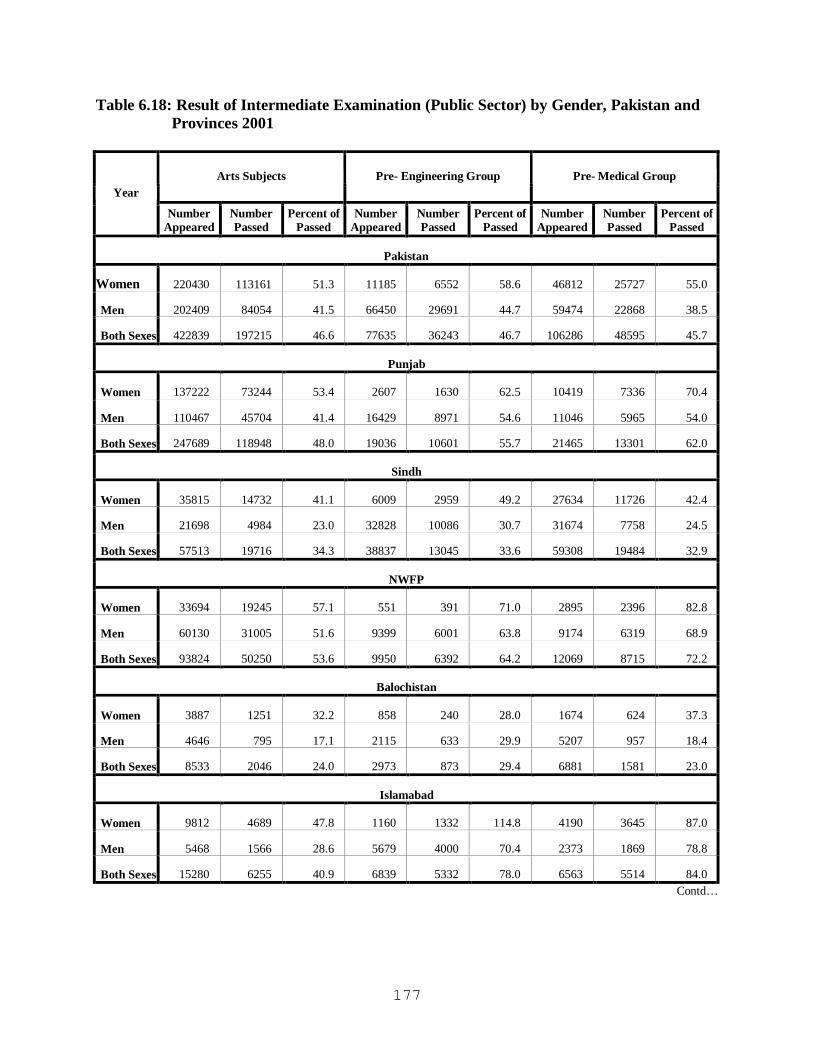
177
Table 6.18: Result of Intermediate Examination (Public Sector) by Gender, Pakistan and Provinces 2001
Arts Subjects Pre- Engineering Group Pre- Medical Group Year
Number Appeared
Number Passed
Percent of Passed
Number Appeared
Number Passed
Percent of Passed
Number Appeared
Number Passed
Percent of Passed
Pakistan
Women 220430 113161 51.3 11185 6552 58.6 46812 25727 55.0
Men 202409 84054 41.5 66450 29691 44.7 59474 22868 38.5
Both Sexes 422839 197215 46.6 77635 36243 46.7 106286 48595 45.7
Punjab
Women 137222 73244 53.4 2607 1630 62.5 10419 7336 70.4
Men 110467 45704 41.4 16429 8971 54.6 11046 5965 54.0
Both Sexes 247689 118948 48.0 19036 10601 55.7 21465 13301 62.0
Sindh
Women 35815 14732 41.1 6009 2959 49.2 27634 11726 42.4
Men 21698 4984 23.0 32828 10086 30.7 31674 7758 24.5
Both Sexes 57513 19716 34.3 38837 13045 33.6 59308 19484 32.9
NWFP
Women 33694 19245 57.1 551 391 71.0 2895 2396 82.8
Men 60130 31005 51.6 9399 6001 63.8 9174 6319 68.9
Both Sexes 93824 50250 53.6 9950 6392 64.2 12069 8715 72.2
Balochistan
Women 3887 1251 32.2 858 240 28.0 1674 624 37.3
Men 4646 795 17.1 2115 633 29.9 5207 957 18.4
Both Sexes 8533 2046 24.0 2973 873 29.4 6881 1581 23.0
Islamabad
Women 9812 4689 47.8 1160 1332 114.8 4190 3645 87.0
Men 5468 1566 28.6 5679 4000 70.4 2373 1869 78.8
Both Sexes 15280 6255 40.9 6839 5332 78.0 6563 5514 84.0 Contd…

178
Table 6.18: Result of Intermediate Examination (Public Sector) by Gender, Pakistan and Provinces 2002
Arts Subjects Pre- Engineering Group Pre- Medical Group
Year Number
Appeared Number Passed
Percent of Passed
Number Appeared
Number Passed
Percent of Passed
Number Appeared
Number Passed
Percent of Passed
Pakistan
Women 217232 114873 52.9 13624 9008 66.1 42101 28220 67.0
Men 209276 77922 37.2 70296 35559 50.6 45095 24163 53.6
Both Sexes 426508 192795 45.2 83920 44567 53.1 87196 52383 60.1
Punjab
Women 145189 81394 56.1 4055 2718 67.0 11714 8459 72.2
Men 127434 51318 40.3 24087 13223 54.9 11685 6449 55.2
Both Sexes 272623 132712 48.7 28142 15941 56.6 23399 14908 63.7
Sindh
Women 35254 16309 46.3 6691 4262 63.7 21513 11233 52.2
Men 29361 9676 33.0 30436 12157 39.9 19774 9274 46.9
Both Sexes 64615 25985 40.2 37127 16419 44.2 41287 20507 49.7
NWFP
Women 23877 9510 39.8 736 394 53.5 2500 2030 81.2
Men 39446 11798 29.9 8637 5084 58.9 7917 5401 68.2
Both Sexes 63323 21308 33.6 9373 5478 58.4 10417 7431 71.3
Balochistan
Women 3312 1632 49.3 766 442 57.7 2129 1199 56.3
Men 7959 3179 39.9 1511 605 40.0 3603 1362 37.8
Both Sexes 11271 4811 42.7 2277 1047 46.0 5732 2561 44.7
Islamabad
Women 9600 6028 62.8 1376 1192 86.6 4245 5299 124.8
Men 5076 1951 38.4 5625 4490 79.8 2116 1677 79.3
Both Sexes 14676 7979 54.4 7001 5682 81.2 6361 6976 109.7 Contd…

179
Table 6.18: Result of Intermediate Examination (Public Sector) by Gender, Pakistan and Provinces 2003
Arts Subjects Pre- Engineering Group Pre- Medical Group
Year Number
Appeared Number Passed
Percent of Passed
Number Appeared
Number Passed
Percent of Passed
Number Appeared
Number Passed
Percent of Passed
Pakistan
Women 233230 126754 54.3 16658 9425 56.6 49308 32857 66.6
Men 224396 89937 40.1 78310 43193 55.2 49377 28767 58.3
Both Sexes 457626 216691 47.4 94968 52618 55.4 98685 61624 62.4
Punjab
Women 158110 90224 57.1 4239 2733 64.5 13679 9753 71.3
Men 140189 56458 40.3 25326 13364 52.8 12503 6796 54.4
Both Sexes 298299 146682 49.2 29565 16097 54.4 26182 16549 63.2
Sindh
Women 30665 15736 51.3 9819 4790 48.8 26214 15721 60.0
Men 18707 10077 53.9 35405 18211 51.4 24244 13889 57.3
Both Sexes 49372 25813 52.3 45224 23001 50.9 50458 29610 58.7
NWFP
Women 27234 11456 42.1 795 528 66.4 2894 2376 82.1
Men 42735 13793 32.3 9104 5589 61.4 6821 4841 71.0
Both Sexes 69969 25249 36.1 9899 6117 61.8 9715 7217 74.3
Balochistan
Women 4291 2367 55.2 372 200 53.8 1863 990 53.1
Men 10150 4725 46.6 1955 951 48.6 3285 1342 40.9
Both Sexes 14441 7092 49.1 2327 1151 49.5 5148 2332 45.3
Islamabad
Women 12930 6971 53.9 1433 1174 81.9 4658 4017 86.2
Men 12615 4884 38.7 6520 5078 77.9 2524 1899 75.2
Both Sexes 25545 11855 46.4 7953 6252 78.6 7182 5916 82.4 Contd..

180
Table 6.18: Result of Intermediate Examination (Public Sector) by Gender, Pakistan and Provinces 2004
Arts Subjects Pre- Engineering Group Pre- Medical Group
Year Number
Appeared Number Passed
Percent of Passed
Number Appeared
Number Passed
Percent of Passed
Number Appeared
Number Passed
Percent of Passed
Pakistan
Women 256221 148451 57.9 17247 10967 63.6 51821 38194 73.7
Men 238416 99311 41.7 82171 48805 59.4 58547 37607 64.2
Both Sexes 494637 247762 50.1 99418 59772 60.1 110368 75801 68.7
Punjab
Women 167094 102150 61.1 3809 2532 66.5 15514 11058 71.3
Men 135673 56907 41.9 24830 13455 54.2 13276 7338 55.3
Both Sexes 302767 159057 52.5 28639 15987 55.8 28790 18396 63.9
Sindh
Women 35072 21772 62.1 10685 6149 57.5 25740 18394 71.5
Men 29355 20026 68.2 36505 20660 56.6 29184 20088 68.8
Both Sexes 64427 41798 64.9 47190 26809 56.8 54924 38482 70.1
NWFP
Women 38406 15907 41.4 1015 784 77.2 3878 3201 82.5
Men 58092 16721 28.8 12308 8150 66.2 10003 6561 65.6
Both Sexes 96498 32628 33.8 13323 8934 67.1 13881 9762 70.3
Balochistan
Women 7060 2780 39.4 304 180 59.2 1870 1131 60.5
Men 11034 4000 36.3 1974 1040 52.7 3697 1651 44.7
Both Sexes 18094 6780 37.5 2278 1220 53.6 5567 2782 50.0
Islamabad
Women 8589 5842 68.0 1434 1322 92.2 4819 4410 91.5
Men 4262 1657 38.9 6554 5500 83.9 2387 1969 82.5
Both Sexes 12851 7499 58.4 7988 6822 85.4 7206 6379 88.5Source: Provincial Bureaus of Statistics and Universities

181
Table 7.1: Growth of Total Population and Economically Active Population (10 years and above) by Sex, Pakistan - 1951 – 1998
(Population in thousand)
Population Economically active population (10 years and above)
Censuses year / Sex
Total Percentage Increase
Annual growth
rate Total Percentage
increase
Annual growth
rate
Crude Activity
Rate (Percent)
Both Sexes
1951* 31,948 - - 9812 - - 30.71
1961 39,442 23.46 2.15 12,763 30.07 2.68 32.36
1973 60,510 53.41 3.45 19,762 54.84 3.52 32.66
1981 84,254 39.24 4.52 22,626 14.49 1.81 26.85
1998 132,352 57.09 2.69 28,734 27.00 2.75 21.71
Male
1951* 17,204 - - 9,495 - - 55.19
1961 21,168 23.04 2.11 11,641 22.60 2.07 54.99
1973 32,511 53.59 3.46 18,016 54.76 3.52 55.41
1981 44,233 36.05 4.19 21,791 20.95 2.55 49.26
1998 68,874 56.10 2.54 27,778 27.47 2.12 40.33
Female
1951* 14,744 - - 317 - - 2.15
1961 18,274 23.95 2.19 1,122 253.62 13.57 6.14
1973 27,988 53.21 3.44 1,746 55.59 3.56 6.23
1981 40,021 42.94 4.88 835 52.16 9.37 2.09
1998 63,479 58.61 2.68 956 14.49 10.79 1.51 * 12 years and above for the year 1951 ** Estimated on the basis of Crude Activity rates obtained from 1994-95 labour force survey. Source: 1. Government of Pakistan, Census of Pakistan 1951, Vol. 7, Census organization, Ministry of Interior
and Kashmir Affairs, Karachi. 2. Government of Pakistan, Census of Pakistan 1961, Vol. 3 (West Pakistan), Census Organization,
Ministry of Home and Kashmir Affairs, Karachi. 3. Government of Pakistan, Housing, Economic and Demographic Survey 1973. Vol. II, Part I,
Statistical tables, Census Organization, Interior Division, Islamabad. 4. Government of Pakistan, 1981 Census Report of Pakistan, Population Census Organization,
Statistics Division, Islamabad. 5. Labour Force Survey, 1994-95, Federal Bureau of Statistics, Statistics Division Islamabad.

182
Table 7.2: Crude Activity (Participation ) Rates: Pakistan and Provinces by Sex and Rural/Urban Areas
(Percent) 2001-02 2003-04
*Improved Participation
Rate
*Improved Participation
Rate Area/
Province Both Sexes Male Female
Both Sexes Female
Both Sexes Male
Female
Both Sexes Female
Pakistan 29.6 48.0 9.9 37.4 25.8 30.4 48.7 11.2 38.5 27.5
Rural 29.9 47.6 11.1 40.3 32.3 31.0 48.2 13.2 42.2 35.8
Urban 29.1 48.9 7.3 31.4 12.0 29.2 49.8 7.0 31.1 10.8
Balochistan 25.3 44.5 3.6 36.0 25.8 25.7 45.0 4.8 36.2 26.5
Rural 25.7 45.3 3.5 38.1 29.3 26.4 46.1 5.0 39.3 31.8
Urban 23.8 41.3 4.1 27.1 11.0 23.4 41.3 3.9 26.0 9.3
NWFP 23.5 41.7 4.7 36.9 31.6 24.6 42.3 6.9 38.1 33.8
Rural 23.1 41.1 4.6 38.3 35.1 24.5 41.8 7.3 39.8 37.7
Urban 25.8 45.0 5.0 29.0 11.6 25.1 44.8 5.1 29.1 13.1
Punjab 32.5 50.1 14.0 38.3 25.9 33.4 50.6 15.6 39.1 27.1
Rural 33.0 49.6 15.8 40.6 31.1 34.5 50.3 18.4 42.2 33.9
Urban 31.3 51.0 9.9 33.2 13.9 30.9 51.3 9.4 32.3 12.1
Sindh 27.3 47.8 4.1 35.6 21.8 27.9 48.8 4.6 37.6 24.9
Rural 27.6 48.4 4.1 41.9 34.4 27.8 48.3 4.7 45.0 41.0
Urban 26.9 47.3 4.0 29.4 9.2 28.1 49.3 4.4 30.2 8.7 Source: Pakistan Labour Force Survey 2003-2004

183
Table 7.3: Refined Activity (Participation ) Rates: Pakistan and Provinces by Sex and Rural/Urban Areas
(Percent)
2001-02 2003-04 *Improved
Participation Rate
*Improved Participation Rate
Area/ Province Both
Sexes Male Female Both Sexes Female
Both Sexes Male
Female
Both Sexes Female
Pakistan 43.3 70.3 14.4 54.7 37.7 43.7 70.6 15.9 55.3 39.3
Rural 45.2 72.2 16.8 60.9 48.7 46.3 72.6 19.5 62.9 52.7
Urban 39.9 66.9 10.0 43.0 16.4 39.2 67.1 9.4 41.7 14.5
Balochistan 40.2 68.0 6.0 57.2 43.0 40.0 68.1 7.6 56.4 42.6
Rural 41.5 70.1 6.0 61.6 50.0 42.0 71.5 8.2 62.6 52.1
Urban 35.2 59.8 6.2 40.0 16.6 34.0 58.1 5.9 37.8 14.0
NWFP 36.4 65.2 7.2 57.1 48.3 37.2 65.7 10.2 57.7 50.0
Rural 36.5 65.8 7.2 60.4 54.3 37.5 66.0 10.8 61.1 56.2
Urban 36.1 62.4 7.0 40.6 16.4 35.7 64.3 7.1 41.4 18.5
Punjab 46.3 71.6 19.9 54.7 36.8 47.0 71.8 21.8 55.0 37.8
Rural 48.2 72.9 22.9 59.3 45.1 49.9 73.6 26.4 61.1 48.5
Urban 42.4 69.1 13.4 45.0 18.8 41.0 68.5 12.3 42.8 16.0
Sindh 40.5 70.4 6.1 52.9 32.7 40.5 70.8 6.6 54.5 36.1
Rural 44.3 76.6 6.8 67.4 56.4 43.6 75.8 7.4 70.5 64.3
Urban 37.2 65.1 5.5 40.7 12.8 37.8 66.4 5.9 40.6 11.7 Source: Pakistan Labour Force Survey 2003-2004

184
Table 7.4: Age Specific Activity (Participation) Rates by Sex, Pakistan
(Percent)
2001-02 2003-04 Age Group
Both Sexes Male Female Both Sexes Male Female
10-14 12.0 17.2 6.3 12.8 18.5 6.7
15-19 37.2 57.6 13.8 37.4 59.0 14.5
20-24 51.2 87.0 15.9 51.5 85.7 18.0
25-29 54.3 95.9 15.9 55.6 96.2 17.7
30-34 53.9 97.3 16.3 55.3 96.3 19.1
35-39 59.5 97.4 19.5 59 97.7 20.9
40-44 59.8 97.6 20.4 60.1 97.0 22.6
45-49 60.2 96.8 20 59.8 96.5 20.9
50-54 59.5 94.1 18.6 58.1 94.5 21.0
55-59 53.9 88.2 14.5 55.9 89.7 18.6
60+ 37.4 56.6 11.4 38.7 58.4 12.9 Source: Pakistan Labour Force Survey 2003-2004

185
Table 7.5: Percentage Distribution of Population and that of 10 Years of Age and above by Area, Age, Sex and Nature of Activities, 2003-2004
Total Population Civilian Labour Force Out of Labour Force Economic Activity Both
Sex Male Female Both Sex Male Femal
e Both Sex Male Femal
e All Areas
Total (All Ages) 100.00 51.23 48.77 30.41 24.97 5.44 69.59 26.26 43.33 Total l(10 Years & Above 100.00 50.86 49.14 43.74 35.91 7.83 56.26 14.95 41.31 10-14 18.44 9.59 8.85 2.36 1.77 0.59 16.08 7.82 8.26 15-19 16.19 8.32 7.86 6.05 4.91 1.14 10.13 3.41 6.72 20-24 12.64 6.26 6.39 6.51 5.36 1.15 6.13 0.89 5.23 25-29 9.48 4.57 4.91 5.27 4.40 0.87 4.21 0.17 4.04 30-34 7.71 3.62 4.09 4.26 3.48 0.78 3.44 0.13 3.31 35-39 7.63 3.79 3.84 4.50 3.70 0.80 3.13 0.09 3.04 40-44 6.34 3.19 3.15 3.81 3.10 0.71 2.53 0.10 2.44 45-49 5.68 2.92 2.76 3.39 2.82 0.58 2.28 0.10 2.18 50-54 4.35 2.19 2.15 2.53 2.07 0.45 1.82 0.12 1.70 55-59 3.38 1.77 1.61 1.89 1.59 0.30 1.49 0.18 1.31 60-64 3.02 1.61 1.41 1.48 1.23 0.25 1.54 0.38 1.17 65 Years & Above 5.15 3.03 2.13 1.68 1.48 0.21 3.47 1.55 1.92
Rural Areas Total (All Ages) 100.00 50.93 49.07 31.02 24.55 6.47 68.98 26.39 42.60 Total l(10 Years & Above 100.00 50.40 49.60 46.25 36.60 9.65 53.75 13.80 39.95 10-14 19.02 10.03 8.99 3.04 2.21 0.83 15.98 7.82 8.16 15-19 15.85 8.13 7.72 6.74 5.34 1.40 9.11 2.79 6.32 20-24 11.97 5.65 6.32 6.41 5.08 1.33 5.56 0.57 4.99 25-29 9.33 4.34 4.99 5.22 4.21 1.01 4.11 0.13 3.98 30-34 7.67 3.47 4.19 4.28 3.34 0.94 3.39 0.13 3.25 35-39 7.54 3.75 3.79 4.64 3.67 0.97 2.90 0.08 2.81 40-44 6.27 3.03 3.24 3.83 2.96 0.87 2.44 0.07 2.37 45-49 5.60 2.86 2.73 3.48 2.77 0.70 2.12 0.09 2.03 50-54 4.40 2.22 2.19 2.70 2.10 0.59 1.71 0.11 1.59 55-59 3.53 1.84 1.69 2.11 1.72 0.39 1.43 0.12 1.30 60-64 3.15 1.64 1.51 1.71 1.37 0.35 1.44 0.27 1.16 65 Years & Above 5.67 3.42 2.25 2.09 1.82 0.27 3.58 1.60 1.98
Urban Areas Total (All Ages) 100.00 51.82 48.18 29.20 25.81 3.39 70.80 26.01 44.79 Total l(10 Years & Above 100.00 51.70 48.30 39.24 34.68 4.56 60.76 17.02 43.74 10-14 17.38 8.78 8.60 1.14 0.98 0.17 16.24 7.81 8.43 15-19 16.80 8.67 8.12 4.82 4.14 0.68 11.97 4.53 7.44 20-24 13.84 7.34 6.51 6.69 5.86 0.83 7.15 1.48 5.68 25-29 9.75 4.99 4.76 5.34 4.73 0.61 4.40 0.25 4.15 30-34 7.77 3.88 3.90 4.23 3.74 0.49 3.54 0.13 3.41 35-39 7.79 3.86 3.93 4.26 3.77 0.49 3.53 0.10 3.44 40-44 6.47 3.49 2.98 3.77 3.34 0.43 2.70 0.15 2.55 45-49 5.81 3.02 2.80 3.25 2.90 0.35 2.57 0.12 2.45 50-54 4.24 2.16 2.09 2.22 2.02 0.20 2.03 0.13 1.89 55-59 3.11 1.65 1.46 1.50 1.37 0.14 1.61 0.29 1.32 60-64 2.80 1.55 1.25 1.06 0.98 0.08 1.73 0.57 1.17 65 Years & Above 4.23 2.32 1.91 0.95 0.85 0.10 3.28 1.46 1.81
Source: Pakistan Labour Force Survey 2003-2004
Table 7.6: Civilian Labour Force: Pakistan and Provinces

186
(Million)
Labour Force 2001-02 2003-04 Province/Area
Both Sex Male Female Both Sex Male Female
Pakistan 42.39 35.57 6.82 45.23 37.13 8.10 Rural 28.84 23.63 5.21 30.71 24.30 6.41 Urban 13.55 11.94 1.61 14.52 12.83 1.69 Balochistan 1.71 1.60 0.11 1.91 1.74 0.17 Rural 1.41 1.32 0.09 1.50 1.36 0.14 Urban 0.30 0.28 0.02 0.41 0.38 0.03 NWFP 4.86 4.38 0.48 5.07 4.35 0.72 Rural 4.06 3.66 0.40 4.24 3.61 0.63 Urban 0.80 0.72 0.08 0.83 0.74 0.09 Punjab 26.54 20.96 5.58 27.85 21.44 6.41 Rural 18.70 14.31 4.39 19.76 14.54 5.22 Urban 7.84 6.65 1.19 8.09 6.90 1.19 Sindh 9.28 8.63 0.65 10.40 9.60 0.80 Rural 4.67 4.34 0.33 5.21 4.79 0.42 Urban 4.61 4.29 0.32 5.19 4.81 0.38
Source: Pakistan Labour Force Survey 2003-2004 Table 7.7: Employed: Pakistan and Provinces
(Million)
Employed 2001-02 2003-04 Province/Area
Both Sex Male Female Both Sex Male Female
Pakistan 38.88 33.19 5.69 41.75 34.69 7.06 Rural 26.66 22.19 4.47 28.64 22.93 5.71 Urban 12.22 11.00 1.22 13.11 11.76 1.35 Balochistan 1.58 1.51 0.07 1.75 1.63 0.12 Rural 1.32 1.26 0.06 1.39 1.29 0.10 Urban 0.26 0.25 0.01 0.36 0.34 0.02 NWFP 4.22 3.90 0.32 4.41 3.91 0.50 Rural 3.54 3.26 0.28 3.71 3.26 0.45 Urban 0.68 0.64 0.04 0.70 0.65 0.05 Punjab 24.28 19.50 4.78 25.80 20.01 5.79 Rural 17.29 13.43 3.86 18.55 13.74 4.81 Urban 6.99 6.07 0.92 7.25 6.27 0.98 Sindh 8.80 8.28 0.52 9.79 9.14 0.65 Rural 4.51 4.24 0.27 4.99 4.64 0.35 Urban 4.29 4.04 0.25 4.80 4.50 0.30
Source: Pakistan Labour Force Survey 2003-2004
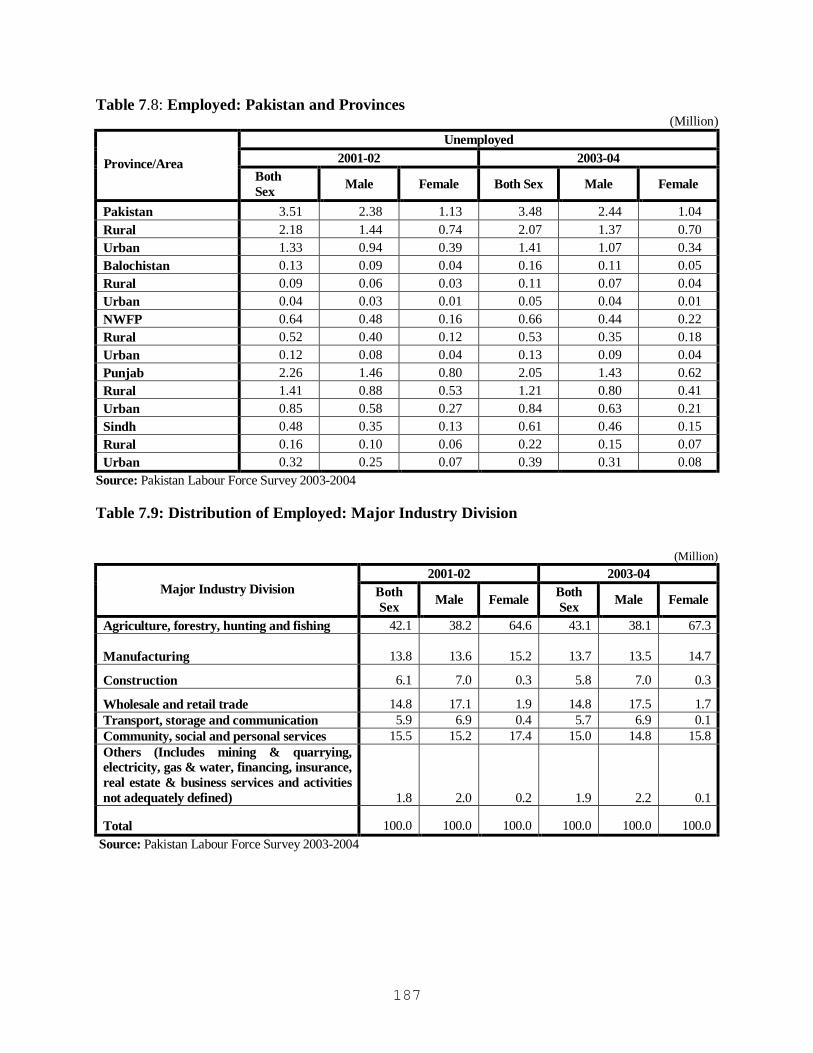
187
Table 7.8: Employed: Pakistan and Provinces (Million)
Unemployed 2001-02 2003-04 Province/Area
Both Sex Male Female Both Sex Male Female
Pakistan 3.51 2.38 1.13 3.48 2.44 1.04 Rural 2.18 1.44 0.74 2.07 1.37 0.70 Urban 1.33 0.94 0.39 1.41 1.07 0.34 Balochistan 0.13 0.09 0.04 0.16 0.11 0.05 Rural 0.09 0.06 0.03 0.11 0.07 0.04 Urban 0.04 0.03 0.01 0.05 0.04 0.01 NWFP 0.64 0.48 0.16 0.66 0.44 0.22 Rural 0.52 0.40 0.12 0.53 0.35 0.18 Urban 0.12 0.08 0.04 0.13 0.09 0.04 Punjab 2.26 1.46 0.80 2.05 1.43 0.62 Rural 1.41 0.88 0.53 1.21 0.80 0.41 Urban 0.85 0.58 0.27 0.84 0.63 0.21 Sindh 0.48 0.35 0.13 0.61 0.46 0.15 Rural 0.16 0.10 0.06 0.22 0.15 0.07 Urban 0.32 0.25 0.07 0.39 0.31 0.08
Source: Pakistan Labour Force Survey 2003-2004 Table 7.9: Distribution of Employed: Major Industry Division
(Million)
2001-02 2003-04 Major Industry Division Both
Sex Male Female Both Sex Male Female
Agriculture, forestry, hunting and fishing 42.1 38.2 64.6 43.1 38.1 67.3
Manufacturing 13.8 13.6 15.2 13.7 13.5 14.7
Construction 6.1 7.0 0.3 5.8 7.0 0.3
Wholesale and retail trade 14.8 17.1 1.9 14.8 17.5 1.7 Transport, storage and communication 5.9 6.9 0.4 5.7 6.9 0.1 Community, social and personal services 15.5 15.2 17.4 15.0 14.8 15.8 Others (Includes mining & quarrying, electricity, gas & water, financing, insurance, real estate & business services and activities not adequately defined) 1.8 2.0 0.2 1.9 2.2 0.1
Total 100.0 100.0 100.0 100.0 100.0 100.0 Source: Pakistan Labour Force Survey 2003-2004

188
Table 7.10: Distribution of Employed: Major Industry Division
( %) 2001-02 2003-04
Major Occupational Groups Both Sex Male Female Both
Sex Male Female
Legislators, senior officials and managers 11.6 13.2 1.9 11.5 13.5 1.4
Professionals 2.1 2.0 2.5 2.0 2.0 1.9
Technicians and associate professionals 4.7 3.9 9.5 4.9 4.1 8.7
Clerks 1.7 2.0 0.3 1.6 1.9 0.2 Services workers and shop & market sales workers 5.7 6.4 1.3 5.2 6.1 0.8 Skilled agricultural and fishery workers 34.7 33.0 44.3 34.9 32.2 48.4 Craft and related trades workers 16.2 16.4 14.9 15.9 16.2 14.3
Plant and machine operators and assemblers 3.9 4.6 0.2 3.7 4.5 0.1
Elementary (unskilled) occupations 19.4 18.5 25.1 20.3 19.5 24.2
Total 100.0 100.0 100.0 100.0 100.0 100.0 Source: Pakistan Labour Force Survey 2003-2004 Table 7.11: Distribution of Employed: Employment Status and Sex
( %) 2001-02 2003-04
Employment status Both Sex Male Female Both
Sex Male Female
Employers 0.8 0.9 0.3 0.9 1.1 0.1
Self-employed 38.5 42.4 15.7 37.1 41.4 15.9
Unpaid family helpers 20.8 16.4 46.9 24.1 18.3 52.8
Employees 39.9 40.3 37.1 37.9 39.2 31.2
Total 100.0 100.0 100.0 100.0 100.0 100.0 Source: Pakistan Labour Force Survey 2003-2004

189
Table 7.12: Distribution of Employed: Hours Worked, 2003-04
(%)
Area/ Province
Total employed
Not worked
Less than15 hours
15-24 hours
25-34 hours
35-41 hours
42-48 hours
49-55 hours
56 hours
& above
Pakistan 100.0 0.7 1.3 4.2 8.5 15.0 25.9 13.6 30.8 Rural 100.0 0.7 1.5 5.2 10.2 16.9 23.7 13.8 28.0 Urban 100.0 0.8 0.8 2.0 4.7 10.9 30.7 13.3 36.9 Balochistan 100.0 0.5 0.4 1.8 6.9 16.9 42.3 13.2 18.0 Rural 100.0 0.3 0.5 2.1 7.9 17.5 40.5 12.9 18.4 Urban 100.0 1.4 0.1 0.7 3.2 14.4 49.3 14.5 16.4 NWFP 100.0 1.3 1.7 7.4 10.7 18.3 24.9 10.6 25.1 Rural 100.0 1.3 2.0 8.3 11.4 19.3 23.6 10.4 23.9 Urban 100.0 1.4 0.4 2.8 7.6 13.4 31.7 11.5 31.3 Punjab 100.0 0.8 1.6 4.7 9.2 15.2 23.7 13.7 31.1 Rural 100.0 0.8 1.8 5.6 10.8 16.3 22.2 13.7 28.9 Urban 100.0 0.9 1.1 2.5 5.2 12.4 27.4 13.7 36.9 Sindh 100.0 0.4 0.6 1.7 5.9 12.6 29.1 14.9 34.9 Rural 100.0 0.3 0.5 2.2 8.0 17.2 24.4 16.9 30.6 Urban 100.0 0.4 0.6 1.2 3.8 7.8 34.0 12.8 39.4
Source: Pakistan Labour Force Survey 2003-2004 Table 7.13: Distribution of Non-Agriculture Workers into Formal and Informal Sector
(%)
2001-02 2003-04 Sector Both
Sex Male Female Both Sex Male Female
Total 100.0 100.0 100.0 100.0 100.0 100.0 Formal 35.4 35.3 37.0 30.0 29.6 34.3
Informal 64.6 64.7 63.0 70.0 70.4 65.7
Rural 100.0 100.0 100.0 100.0 100.0 100.0 Formal 31.7 31.5 34.3 27.1 26.7 30.1
Informal 68.3 68.5 65.7 72.9 73.3 69.9
Urban 100.0 100.0 100.0 100.0 100.0 100.0 Formal 38.9 38.9 39.3 32.8 32.2 38.4
Informal 61.1 61.1 60.7 67.2 67.8 61.6 Source: Pakistan Labour Force Survey 2003-2004

190
Table 7.14: Distribution of Informal Sectors Workers: Major Industry Divisions
(%) 2001-02 2003-04
Major Industry Divisions Both Sex Male Female Both Sex Male Female
Total 100.0 100.0 100.0 100.0 100.0 100.0 Manufacturing 20.9 17.3 57.5 20.6 16.9 57.3
Construction 13.9 15.1 1.3 13.4 14.6 1.2
Wholesale and retail trade 34.0 36.5 7.6 34.6 37.3 7.6 Transport, social and personal services 11.7 12.7 1.0 11.2 12.3 0.3 Community, social and personal services 18.9 17.6 32.4 18.7 17.2 33.5 Others (includes mining & quarrying; electricity, gas & water and finance, insurance, real estate & business services 0.7 0.8 0.2 1.5 1.7 0.1
Source: Pakistan Labour Force Survey 2003-2004 Table 7.15: Distribution of Informal Sectors Workers: Major Occupational Groups
(%) 2001-02 2003-04
Major Occupational Divisions Both Sex Male Female Both Sex Male Female
Total 100.0 100.0 100.0 100.0 100.0 100.0 Legislators, senior officials & managers 24.6 26.3 6.8 24.9 26.7 5.9
Professionals 1.8 1.7 2.5 1.6 1.5 2.5 Technicians and associate professionals 2.8 2.3 8.5 3.8 3.2 9.8 Clerks 0.2 0.2 - 0.4 0.5 - Services workers and shop & market sales workers 9.5 9.9 5.2 9.5 10.1 3.1 Skilled agricultural and fishery workers 0.1 0.1 - - - -
Craft and related trade workers 32.3 29.6 59.9 31.1 28.4 58.6 Plant and machine operators and assemblers 6.4 7.0 0.6 6.1 6.7 0.2
Elementary (unskilled) occupations 22.4 22.9 16.5 22.6 22.9 19.9 Source: Pakistan Labour Force Survey 2003-2004

191
Table 7.16: Distribution of Informal Sectors Workers: Employment Status
(%) 2001-02 2003-04
Employment Status
Both Sex Male Female Both Sex Male Female
Total 100.0 100.0 100.0 100.0 100.0 100.0 Employer 1.0 1.1 0.2 1.5 1.6 0.2
Self-employed 43.6 44.8 31.0 43.7 44.7 34.0
Unpaid family helpers 10.9 10.1 19.1 11.7 10.9 19.5
Employees 44.5 44.0 49.7 43.1 42.8 46.3 Source: Pakistan Labour Force Survey 2003-2004 Table 7.17: Distribution of Employed Persons 10 years of Age and Above by Status of Injuries/Diseases
(%) 2001-02 2003-04
Status of Injuries/Diseases
Both Sex Male Female Both Sex Male Female
Total 100.0 100.0 100.0 100.0 100.0 100.0
Suffered 3.6 3.9 1.5 2.8 3.2 1.0
Not Suffered 96.4 96.1 98.5 97.2 96.8 99.0
Rural 100.0 100.0 100.0 100.0 100.0 100.0
Suffered 3.9 4.4 1.4 3.1 3.6 1.1
Not Suffered 96.1 95.6 98.6 96.9 96.4 98.9
Urban 100.0 100.0 100.0 100.0 100.0 100.0
Suffered 2.9 3.0 1.9 2.2 2.4 0.5
Not Suffered 97.1 97.0 98.1 97.8 97.6 99.5 Source: Pakistan Labour Force Survey 2003-2004

192
Table 7.18: Distribution of Employed Persons Suffered Occupational Injuries/Diseases: Major Industry Divisions
(%)
2001-02 2003-04 Major Industry Division Both
Sex Male Female Both Sex Male Female
Total 100.0 100.0 100.0 100.0 100.0 100.0 Agriculture, forestry, hunting and fishing 42.9 41.0 71.2 44.9 42.6 79.8
Mining & quarrying 0.1 0.1 - - - -
Manufacturing 14.5 14.5 14.7 14.6 15.0 8.0
Electricity, gas and water 0.7 0.8 - 1.0 1.0 - Construction 12.5 13.3 1.0 10.7 11.4 - Wholesale & retail trade and restaurants & hotels 8.6 9.0 3.1 9.1 9.5 3.4 Transports, storage and communications 9.4 9.9 0.9 8.9 9.5 - Financing, insurance, real estate and business services 0.1 0.1 - 0.5 0.6 -
Community, social and personal services 11.2 11.3 9.1 10.3 10.4 8.8 Source: Pakistan Labour Force Survey 2003-2004 Table 7.19: Distribution of Employed Persons Suffered Occupational Injuries/Diseases: Major Occupational Groups
(%)
2001-02 2003-04 Major Occupational Divisions Both
Sex Male Female Both Sex Male Female
Total 100.0 100.0 100.0 100.0 100.0 100.0 Legislators, senior officials & managers 6.7 7.0 3.1 6.3 6.4 3.4 Professionals 0.3 0.2 0.8 0.4 0.4 - Technicians and associate professionals 2.3 2.1 5.0 2.3 2.3 1.6 Clerks 1.2 1.2 - 1.0 1.1 - Services workers and shop & market sales workers 3.8 4.0 1.2 2.8 3.0 - Skilled agricultural and fishery workers 37.6 36.4 55.9 38.7 36.7 76.3 Craft and related trade workers 20.9 21.3 15.9 21.4 22.1 11.2 Plant and machine operators and assemblers 7.4 7.8 0.9 5.7 6.1 - Elementary (unskilled) occupations 19.8 20.0 17.2 21.4 22.3 7.5
Source: Pakistan Labour Force Survey 2003-2004
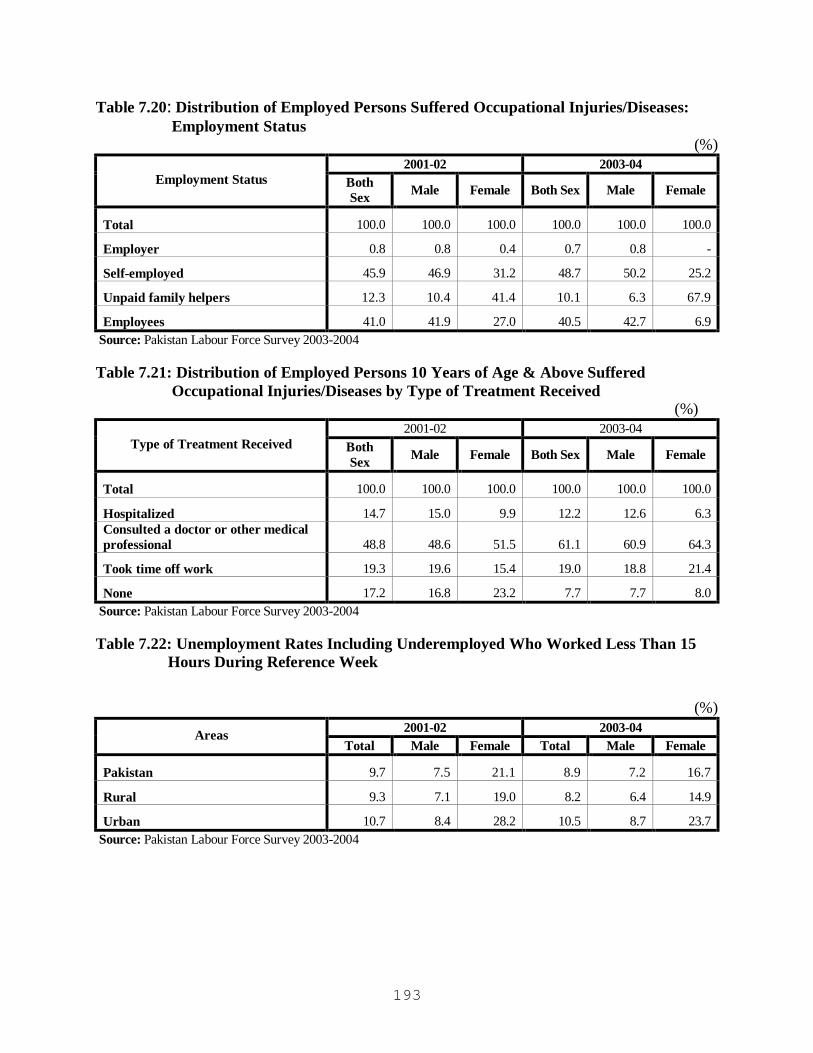
193
Table 7.20: Distribution of Employed Persons Suffered Occupational Injuries/Diseases: Employment Status
(%) 2001-02 2003-04
Employment Status
Both Sex Male Female Both Sex Male Female
Total 100.0 100.0 100.0 100.0 100.0 100.0 Employer 0.8 0.8 0.4 0.7 0.8 -
Self-employed 45.9 46.9 31.2 48.7 50.2 25.2
Unpaid family helpers 12.3 10.4 41.4 10.1 6.3 67.9
Employees 41.0 41.9 27.0 40.5 42.7 6.9 Source: Pakistan Labour Force Survey 2003-2004 Table 7.21: Distribution of Employed Persons 10 Years of Age & Above Suffered Occupational Injuries/Diseases by Type of Treatment Received
(%) 2001-02 2003-04
Type of Treatment Received Both Sex Male Female Both Sex Male Female
Total 100.0 100.0 100.0 100.0 100.0 100.0 Hospitalized 14.7 15.0 9.9 12.2 12.6 6.3 Consulted a doctor or other medical professional 48.8 48.6 51.5 61.1 60.9 64.3
Took time off work 19.3 19.6 15.4 19.0 18.8 21.4
None 17.2 16.8 23.2 7.7 7.7 8.0 Source: Pakistan Labour Force Survey 2003-2004 Table 7.22: Unemployment Rates Including Underemployed Who Worked Less Than 15 Hours During Reference Week
(%)
2001-02 2003-04 Areas Total Male Female Total Male Female
Pakistan 9.7 7.5 21.1 8.9 7.2 16.7
Rural 9.3 7.1 19.0 8.2 6.4 14.9
Urban 10.7 8.4 28.2 10.5 8.7 23.7 Source: Pakistan Labour Force Survey 2003-2004

194
Table 7.23: Distribution of Employed Persons 10 years of Age and Above Suffered Occupational Injuries/Diseases by Parts of Body Injured
(%) 2001-02 2003-04
Parts of Body Injured Both Sex Male Female Both Sex Male Female
Total 100.0 100.0 100.0 100.0 100.0 100.0
Head 7.9 7.7 9.7 6.7 7.1 -
Neck 1.4 1.4 0.4 1.9 2.0 0.5
Trunk 1.9 1.9 1.5 1.7 1.8 -
Upper limb 11.7 11.0 22.4 15.9 16.2 12.6
Lower limb 12.6 13.1 6.3 19.8 20.8 3.4
Multiple locations 12.4 12.7 7.3 8.9 9.3 1.9
General injuries 52.3 52.2 52.4 45.1 42.8 81.6 Source: Pakistan Labour Force Survey 2003-2004 Table 7.24: Unemployment: Rates: Sex and Age
(%)
2001-02 2003-04 Age group Both Sex Male Female Both Sex Male Female
10 Years & Above 8.3 6.7 16.5 7.7 6.6 12.8
10-14 16.5 16.1 17.7 12.8 13.6 10.4
15-19 16.2 15.3 20.5 13.2 12.8 14.9
20-24 10.9 9.1 20.5 10.3 9.3 15.0
25-29 6.3 5.1 12.9 7.1 6.1 12.5
30-34 4.2 3.2 9.6 4.5 3.8 7.4
35-39 2.6 1.5 8.2 2.9 2.0 7.2
40-44 3.2 2.2 8.2 2.9 2.5 4.8
45-49 3.3 2.5 7.9 3.5 2.3 9.5
50-54 6.0 4.0 18.2 5.1 3.5 12.2
55-59 8.0 4.6 31.8 7.1 4.5 20.7
60 Years & Above 13.6 8.9 45.5 12.8 8.9 36.1 Source: Pakistan Labour Force Survey 2003-2004

195
Table 7.25: Number of Government’s Employed Persons by Grade and Sex Balochistan
2001 2002 2003 Grade
Men Women Both Men Women Both Men Women Both 1 520 520 535 535 935 935 2 24 24 22 22 22 22 4 40 40 39 39 39 39 5 299 1 300 300 1 301 287 1 288 6 1 1 1 1 1 1 7 122 4 126 124 4 128 118 4 122 11 244 244 236 236 247 247 12 194 1 195 184 1 185 192 1 193 14 10 10 10 10 6 6 15 62 62 61 61 60 60 16 126 1 127 126 1 127 124 1 125 17 111 1 112 111 1 112 111 1 112 18 31 31 31 31 29 29 19 13 13 13 13 13 13 20 10 10 10 10 10 10
Total 1807 8 1815 1803 8 1811 2194 8 2202 Note: The data relates to the following departments/Organization.
1. Chief Minister Secretariat 2. Anti Corruption Estb. 3. S&GAD

196
Table 7.26: Number of Government’s Employed Persons by Grade Sex NWFP
2001 2002 2003 Grade
Men Women Both Men Women Both Men Women Both 1 4032 13 4045 3632 11 3643 10902 2184 13086 2 53 53 47 47 47 47 3 82 82 61 61 61 61 4 317 317 302 302 307 4 311 5 2272 54 2326 2158 53 2211 3689 437 4126 6 1889 27 1916 1721 27 1748 1705 27 1732 7 536 3 539 458 3 461 49009 24989 73998 8 17 3 20 15 3 18 15 3 18 9 30 30 29 29 19271 8737 28008 10 46 1 47 46 46 46 2 48 11 902 3 905 902 3 905 935 6 941 12 340 5 345 338 5 343 369 4 373 13 5 5 5 5 5 5 14 125 2 127 125 2 127 125 2 127 15 238 4 242 236 3 239 231 4 235 16 404 9 413 387 10 397 6892 2417 9309 17 1121 15 1136 1103 16 1119 3419 840 4259 18 124 2 126 120 2 122 423 53 476 19 38 0 38 38 38 220 21 241 20 36 36 38 38 39 39 21 5 5 5 5 5 5 22 1 1 1 1 1 1
Total 12613 141 12754 11767 138 11905 97716 39730 137446 Note: The data relates to the following departments/Organization.
Administration Auqaf Administration Department Agr:Livk:&Coop:Dept:,Tarnab Co-operative Societies D.GResearch Agr:NWFPUniversity Dir:Livestock&Dairy Development Dir:Of Ind:Com:& Labour(L.Wing) Dir:Of Ind:Com:&Labour(Ind.Wing) Dir:of Veterinary Research Institut Director Anti Corruption Director Of Sports. Directorate of School & Literacy Directorate Of Sports. Distt:Coord: Office (P&DD) Distt:Coord:Office(Finance Deptt:) Establishment & Admn.Dept. Finance Department Governor Secretariat Govt. Middle Schools Govt. Primary Schools
Home & T.As Deptt+ Prison I.G. Of Prison Inf:&PR Deptt:(Director Information) Inf:&PR Deptt:(Director P.R.) Inf:&PR Deptt:(Secretary Information) L.G, Election & Rural Dev: Deptt: Law Parl. Affairs & Human Rts.Dept. LG,E&R,Comy:Infrastruc:Project Livestock Research&Development Non-Tech:Staff in Secondary Schl PCS (Executive Group) PCS (Secretariat Group) Public Service Commission Registrar, Service Tribunal. S.I.D.B. Sarhad Council Of Arts Special Judge, Anti Corruption. Sr. Special Judge, Anti Corruption Staff Of Civil Secretariat Statistician Agr:Crop Rep:Service
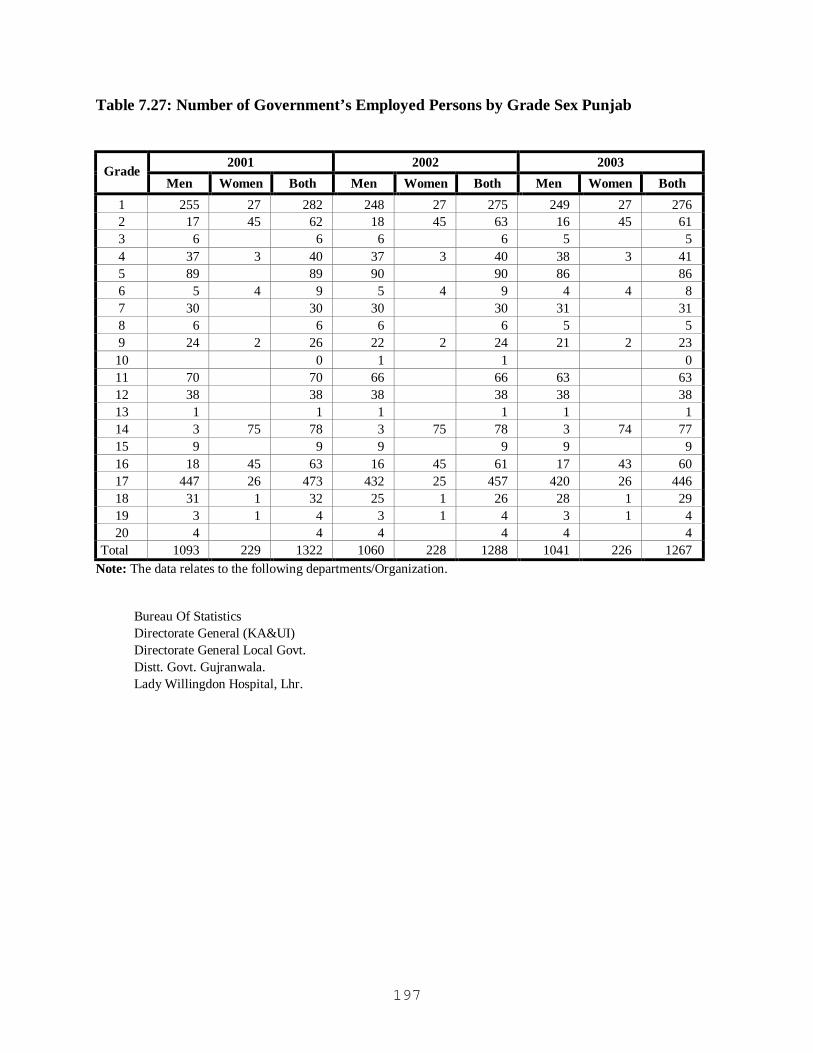
197
Table 7.27: Number of Government’s Employed Persons by Grade Sex Punjab
2001 2002 2003 Grade
Men Women Both Men Women Both Men Women Both 1 255 27 282 248 27 275 249 27 276 2 17 45 62 18 45 63 16 45 61 3 6 6 6 6 5 5 4 37 3 40 37 3 40 38 3 41 5 89 89 90 90 86 86 6 5 4 9 5 4 9 4 4 8 7 30 30 30 30 31 31 8 6 6 6 6 5 5 9 24 2 26 22 2 24 21 2 23 10 0 1 1 0 11 70 70 66 66 63 63 12 38 38 38 38 38 38 13 1 1 1 1 1 1 14 3 75 78 3 75 78 3 74 77 15 9 9 9 9 9 9 16 18 45 63 16 45 61 17 43 60 17 447 26 473 432 25 457 420 26 446 18 31 1 32 25 1 26 28 1 29 19 3 1 4 3 1 4 3 1 4 20 4 4 4 4 4 4
Total 1093 229 1322 1060 228 1288 1041 226 1267 Note: The data relates to the following departments/Organization.
Bureau Of Statistics Directorate General (KA&UI) Directorate General Local Govt. Distt. Govt. Gujranwala. Lady Willingdon Hospital, Lhr.

198
Table 7.28: Number of Government’s Employed Persons by Grade Sex Sindh
2001 2002 2003 Grade
Men Women Both Men Women Both Men Women Both 1 4573 792 5365 4514 790 5304 4261 1048 5309 2 842 33 875 833 40 873 830 38 868 3 86 5 91 86 4 90 87 4 91 4 764 41 805 756 41 797 763 39 802 5 4438 536 4974 4535 538 5073 4657 540 5197 6 725 93 818 681 90 771 687 92 779 7 1070 58 1128 1095 81 1176 1105 89 1194 8 103 346 449 103 347 450 99 347 446 9 323 813 1136 316 813 1129 323 812 1135 10 52 2 54 50 2 52 50 2 52 11 1311 226 1537 1291 228 1519 1297 228 1525 12 482 15 497 484 15 499 503 15 518 13 25 25 24 24 25 25 14 218 143 361 213 143 356 214 143 357 15 191 7 198 192 8 200 196 9 205 16 700 116 816 672 116 788 672 118 790 17 1330 248 1578 1324 245 1569 1297 262 1559 18 380 74 454 363 74 437 407 77 484 19 134 20 154 140 20 160 157 21 178 20 52 2 54 52 2 54 49 3 52 21 12 12 12 12 17 17 22 1 1 1 1 1 1
Total 4573 792 5365 4514 790 5304 4261 1048 5309 Note: The data relates to the following departments/Organization.
Addl.Advocate General Hyderabad Addl.Advocate General Larkana Addl.Advocate General Sukkur Advocate General Sindh Auqaf&Religious Affairs Deptt. Bd:Of Mngt:Workers Chld:Edu. Bureau Of Statistics Camp Office,A&R Affairs Deptt. Civil Defence Directorate D.Officer Edu.& Works Shikarpur Dir:Of Manpower & Trng:Karachi. Director Reclamation & Probation Directorate Of Industries Directorate Of Labour District Officer Building Shikarpur District Officer Roads Shikarpur E.D.O.Comty:Dev:Dep:Shikarpur E.D.Off Anim Husbandry Shikarpur E.D.Off Animal Breeding Shikarpur E.D.Officer Agr.ExtentionShikarpur E.D.Officer Agriculture Shikarpur. E.D.Officer Finance & Planning E.D.Officer Fisheries Shikarpur E.D.Officer Forest Shikarpur E.D.Officer Health Shikarpur.
E.D.Officer Poultry Shikarpur E.D.Officer Revenue Shikarpur. E.D.Officer Works Shikarpur Employees' Social Sec:Institution. Env.&Alt.Energy Deptt. Excise & Taxation Deptt. EXE:Dist.Officer(F&P),Mirpurkhas First Sindh Labour Court, Karachi. Forest&Wildlife Department Forest&Wildlife Dept.(Sectt:) I.G. Of Prisons Information & Archives Deptt. Information Technology Deptt. Inter-provincial Coordination Deptt. Lab:Tran:Ind:&Commerce Deptt. Law,Par:Affairs&HumanRightsDept Local Govt.Support Officer, Lakhi. Mines & Mineral Department. Mines&Mineral Dev: Department. Official Assignee Of Karachi Population Welfare Department Printing & Stationery Department S&GAD and Coordination Deptt. Sindh Coal Authority Sindh Forest Department
Sindh Labour Court # 2, Karachi. Sindh Labour Court # 3, Karachi. Sindh Labour Court # 4, Karachi. Sindh Labour Court # 5, Karachi. Smal Ind.Corp.CarpetCtr.Nasarpur Smal Ind.Corp.Dist.Office Dadu. Smal Ind.Corp.Dist.Office Thatta. Smal Ind.Corp.Dist.Office,Badin Smal Ind.Corp.Dist.OfficeHyd.Abad Smal Ind.Corp.Dist.OfficeSehawan Smal Ind.Corp.DistOff.AC.Bhitshah Smal Ind.Corp.DistOff.Mirpurkhas Smal Ind.Corp.DistOffice,Sanghar Smal Ind.Corp.DistOfficeHLF.Hyd. Smal Ind.Corp.DistOfficeSAE Hala Smal Ind.Corp.Hyd.Abad G.Cader Smal Ind.Corp.Hyd.AbadA/CCader Smal Ind.Corp.R/O,Sukkur. Smal Ind.Corp.S.I.E Tandoadam. Small Industrial Corporation Solicitor's Department Taluka Muncipal Admn Shikarpur. Taluka Municipal Officer, Lakhi. Worker's Welfare Board

199
Table 7.29: Number of Employed Persons in Insurance Companies by Grade Sex Pakistan 2001 2002 2003 Designation
Female Male Both Female Male Both Female Male Both Chairman 2 2 2 2 2 2 Managing Director 3 3 3 3 3 3 Advisor/Attorney 3 3 4 4 4 4 Legal & Prof: Advisor 1 1 1 1 Chief Executive 5 5 5 5 5 5 Circle Head 1 1 Chief G.Manager 1 1 1 1 General Manager 1 22 23 22 22 21 21 Chief Finance Officer 1 1 1 1 2 Executive 26 220 246 25 173 198 26 197 223 Director 4 4 4 4 1 11 12 Incharge 2 2 2 2 2 2 Asstt.G.Manager 6 100 106 5 153 158 5 151 156 Chief Internal Auditor 1 1 1 1 Chief Manager 2 18 20 2 16 18 1 19 20 Chief Med. Officer 1 1 2 1 1 2 1 1 2 S.E.V.P. 2 2 3 3 2 2 E.V.P. 1 1 1 1 1 1 S.V.P. 10 10 10 10 10 10 V.P. 22 22 22 22 23 23 A.V. P. 12 12 11 11 12 12 Regional Manager 45 45 45 45 1 49 50 Deputy Chief Manager 12 12 12 12 13 13 Manager 16 485 501 27 551 578 27 574 601 Asstt.Manager 42 881 923 42 871 913 37 844 881 Internal Auditor 1 1 1 1 1 1 Dy C.Med. Underwriter 1 1 1 1 1 1 Officer 17 169 186 15 181 196 50 192 242 Chief Accountant. 3 3 3 3 4 4 Asstt.Chief Account 2 2 2 2 3 3 Accountant 4 4 6 6 6 6 Supervisor 2 11 13 2 11 13 2 12 14 Superintendent 26 486 512 25 513 538 26 538 564 Inspector 13 13 14 14 13 13 Internees 1 7 8 Assistant 87 1805 1892 81 1726 1807 77 1748 1825 Secretary 3 10 13 5 13 18 4 11 15 Stenographer 28 28 29 29 32 32 Steno typist 1 68 69 1 55 56 1 53 54 Resident Inspector 5 5 5 5 5 5 Receptionist 7 1 8 6 1 7 6 1 7 Cashier 2 2 2 2 1 1 Computer Operator 4 4 4 4 1 3 4 Tech/Maint: Staff 71 71 78 78 74 74
Continue Table 7.29: Number of Employed Persons in Insurance Companies by Grade Sex Pakistan

200
2001 2002 2003 Designation Female Male Both Female Male Both Female Male Both
Telephone Operator 8 3 11 9 3 12 9 4 13 Clerical 4 82 86 6 76 82 6 78 84 Daftary 18 18 17 17 24 24 Despatcher 3 3 3 3 3 3 Driver/record sorter 1 423 424 1 483 484 1 465 466 Peon/Sweeper/ Guards 732 732 672 672 655 655 Grand Total 250 5797 6047 254 5813 6067 285 5880 6165
Note: The data relates to the following departments/Organization.
ACE Insurance Company Limited. Alpha Insurance Company Ltd. Askari General Insurance Co. Ltd. Beema-Pak: Company Limited Capital Insurance Co. Ltd. EFU Life Assurance Ltd. International General Ins:Pak. Ltd. National Insurance Company Limited. Pakistan Reinsurance Co.Ltd. Postal Life Insurance, Quetta Premier Insurance Company Ltd. Reliance Inurance Company Ltd. Royal & Sunalliance Security General Insurance Co. Ltd. Shaheen Insurance Co. Ltd. State Life Ins: Corp: of Pakistan The Asian Mutual Insurance Co.Ltd. The Co-optive:Ins:Societyof Pak.Ltd The Credit Insurance Company Ltd. The Pak.Mutual Insurance Compay The United Insurance

201
Table 7.30: Number of Employed Persons in Investment Bank by Grade Sex Pakistan
2001 2002 2003 Designation Female Male Both Female Male Both Female Male Both
GM 2 2 2 2 2 2 MD 1 1 2 2 2 2 Asstt.G.Manager 1 1 1 1 1 1 Exe: V.P. 3 3 Senior V.P. 3 3 4 4 3 3 V.P. 3 3 4 4 18 18 Asstt.V.P. 4 4 4 4 43 43 Chief Exe: Officer 2 2 2 2 2 2 Executives 21 21 1 17 18 2 20 22 Director 2 2 2 2 2 2 Chief Manager 4 4 4 4 Senior Manager 3 12 15 3 8 11 4 39 43 Management 7 47 54 5 43 48 15 51 66 Manager 1 23 24 2 43 45 2 72 74 Asstt. Manager 1 34 35 1 32 33 10 81 91 Officer 1 21 22 1 31 32 14 80 94 Non-Executives 1 5 6 2 10 12 2 11 13 Non-Management Staff 5 58 63 3 56 59 3 61 64 Supervisor 7 7 12 12 1 10 11 Assistant 1 1 1 6 7 16 16 Receptionist 5 5 6 6 6 6 Secretarial 1 1 2 2 1 3 2 1 3 Clerical 1 1 2 1 1 2 1 1 2 Contract 4 4 Peon 12 12 12 12 13 13 Driver 4 4 Non-Clerical 6 6 6 6 7 7 Grand Total 26 267 293 28 303 331 62 551 613
Note: The data relates to the following departments/Organization. Asset Invt. Bank Ltd. Atlas Investment Bank Ltd. First International Invt. Bank Ltd. Int.Fin: Invt & Com:Bank Ltd.(NIB) Islamic Investment Bank Ltd. Jahangir Siddiqui Invest. Bank Ltd. Orix Investment Bank Ltd. Security Investment Bank Ltd.
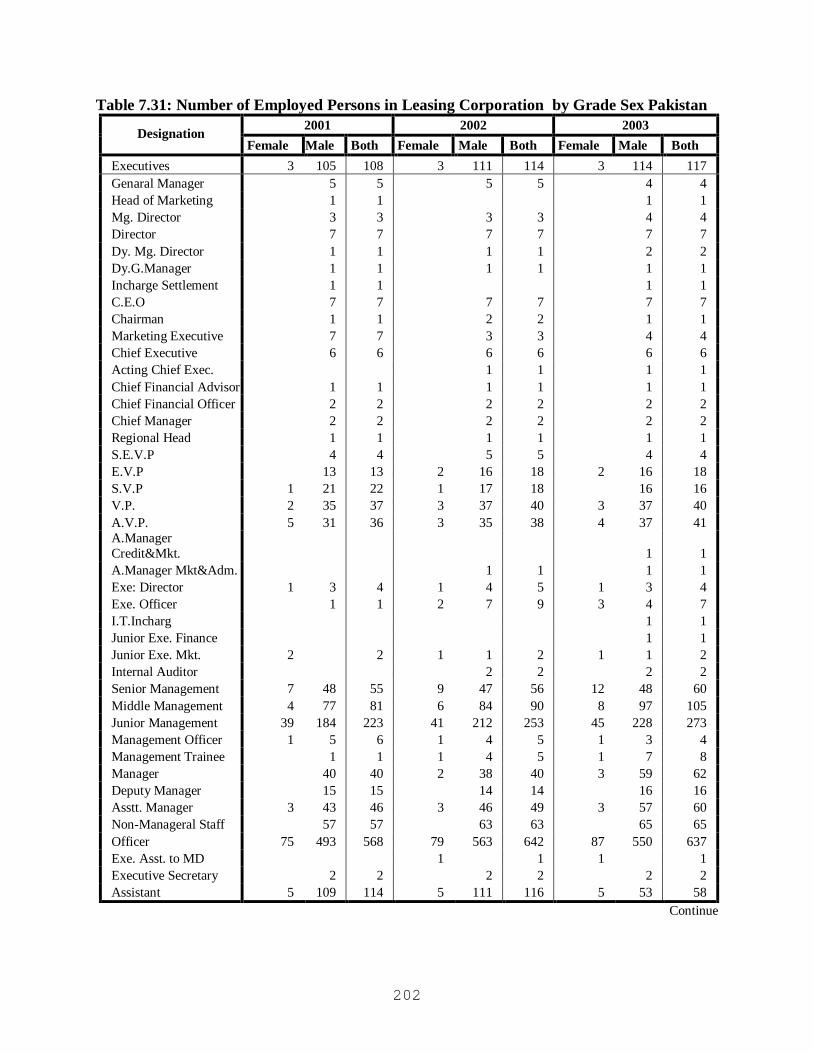
202
Table 7.31: Number of Employed Persons in Leasing Corporation by Grade Sex Pakistan 2001 2002 2003 Designation
Female Male Both Female Male Both Female Male Both Executives 3 105 108 3 111 114 3 114 117 Genaral Manager 5 5 5 5 4 4 Head of Marketing 1 1 1 1 Mg. Director 3 3 3 3 4 4 Director 7 7 7 7 7 7 Dy. Mg. Director 1 1 1 1 2 2 Dy.G.Manager 1 1 1 1 1 1 Incharge Settlement 1 1 1 1 C.E.O 7 7 7 7 7 7 Chairman 1 1 2 2 1 1 Marketing Executive 7 7 3 3 4 4 Chief Executive 6 6 6 6 6 6 Acting Chief Exec. 1 1 1 1 Chief Financial Advisor 1 1 1 1 1 1 Chief Financial Officer 2 2 2 2 2 2 Chief Manager 2 2 2 2 2 2 Regional Head 1 1 1 1 1 1 S.E.V.P 4 4 5 5 4 4 E.V.P 13 13 2 16 18 2 16 18 S.V.P 1 21 22 1 17 18 16 16 V.P. 2 35 37 3 37 40 3 37 40 A.V.P. 5 31 36 3 35 38 4 37 41 A.Manager Credit&Mkt. 1 1 A.Manager Mkt&Adm. 1 1 1 1 Exe: Director 1 3 4 1 4 5 1 3 4 Exe. Officer 1 1 2 7 9 3 4 7 I.T.Incharg 1 1 Junior Exe. Finance 1 1 Junior Exe. Mkt. 2 2 1 1 2 1 1 2 Internal Auditor 2 2 2 2 Senior Management 7 48 55 9 47 56 12 48 60 Middle Management 4 77 81 6 84 90 8 97 105 Junior Management 39 184 223 41 212 253 45 228 273 Management Officer 1 5 6 1 4 5 1 3 4 Management Trainee 1 1 1 4 5 1 7 8 Manager 40 40 2 38 40 3 59 62 Deputy Manager 15 15 14 14 16 16 Asstt. Manager 3 43 46 3 46 49 3 57 60 Non-Manageral Staff 57 57 63 63 65 65 Officer 75 493 568 79 563 642 87 550 637 Exe. Asst. to MD 1 1 1 1 Executive Secretary 2 2 2 2 2 2 Assistant 5 109 114 5 111 116 5 53 58
Continue

203
Table 7.31: Number of Employed Persons in Leasing Corporation by Grade Sex Pakistan
2001 2002 2003 Designation Female Male Both Female Male Both Female Male Both
Clerical 16 123 139 15 116 131 27 128 155 Secretary 5 5 1 6 7 1 6 7 Grade-01-11 1 16 17 4 16 20 6 20 26 Non-Clerical Staff 9 337 346 10 319 329 13 270 283 Grand Total 174 1814 1988 194 1923 2117 230 1892 2122
Note: The data relates to the following departments/Organization. Asian Leasing Corporation Ltd.
Askari Leasing Limited Capital Assets Leasing Corp. Ltd. Crescent Leasing Corporation Ltd. Dawood Leasing Company Ltd. Ebrahim Leasing Ltd. English Leasing Ltd. Grays Leasing Limited InterAsia Leasing Corporation Ltd. International Multi Leasing Corporation Ltd. Investment Corporation of Pakistan KASB Leasing Ltd. Lease Pak Limited National Assets Leasing Corporation Ltd. National Investment Trust Ltd. Natover Lease & Refinance Ltd. Network Leasing Corporation Ltd. ORIX Leasing Pakistan Ltd. Pak. Industrial & Commercial Leasing Ltd. Pak-Gulf Leasing Company Ltd. Pak-Kuwait Investment Company(Pvt) Ltd. Pak-Libya Holding Company (Pvt.) Ltd. Pak-Oman Investment Company Ltd. PICIC Saudi Pak Leasing Company Ltd. Security Leasing Corporation Ltd. Sigma Leasing Corporation Ltd. SME Bank Ltd. Leasing Division Speedway Fondmetall (Pak) Ltd. Union Leasing Limited Universal Leasing Corporation Ltd.

204
Table 7.32: Number of Employed Persons in Modaraba by Grade Sex Pakistan 2001 2002 2003 Designation
Female Male Both Female Male Both Female Male Both Managing Director 1 1 Assistant G.Manager 2 2 Chief Accountant 3 3 3 3 3 3 Chief Executive 3 3 3 3 3 3 Chief Financial Officer 1 1 3 3 3 3 Chief Manager 1 1 2 2 2 2 Director 3 3 3 3 2 2 SEVP 1 1 1 1 EVP 2 2 SVP 3 3 3 3 2 2 VP 2 4 6 1 5 6 1 9 10 A.V.P. 10 10 9 9 9 9 Sr. Executives 2 2 2 2 Executive 2 9 11 2 10 12 3 12 15 Finance Executive 1 1 1 1 Trading Executive 1 1 1 1 1 1 General Manager 3 3 5 5 4 4 Production Incharge 2 2 2 2 2 2 Senior Accountant 14 14 12 12 1 10 11 Senior Manager 4 4 4 4 3 3 Manager 41 41 39 39 40 40 Dy. Manager 4 4 5 5 10 10 Assistant Manager 1 19 20 1 26 27 2 24 26 Accountant 6 6 5 5 6 6 Internal Auditor 2 2 2 2 3 3 Non-Management 1 8 9 1 9 10 1 6 7 Officer 11 100 111 8 90 98 7 98 105 Steno 1 1 1 1 1 1 Secretary/PA 3 5 8 3 5 8 3 5 8 Asst.Finance Officer 1 1 1 1 1 1 Asstt. Accountant 1 1 1 1 1 1 Assistant 5 30 35 5 29 34 4 30 34 Company Secretary 2 2 2 2 2 2 Computer Operator 1 1 1 1 1 1 Clerical & Non-Clerical 6 149 155 6 143 149 5 142 147 Grand Total 31 436 467 27 428 455 27 439 466
Note: The data relates to the following departments/Organization.Al-Zamin Leasing Modaraba B.F.Modaraba B.R.R. International Modaraba Crescent Standard Modaraba Fayzan Manufacturing First Allied Bank Modaraba First Al-Noor Modaraba First Contillation Modaraba First Elite Capital Modaraba First Equity Modaraba First Fidelity Leasing Modaraba First Grindlays Modaraba
First Habib Bank Modaraba First Habib Modaraba First I.B.L.Modaraba First Imrooz Modaraba First Interfund Modaraba First Islamic Modaraba First Mehran Modaraba First National Modaraba First Pak Modaraba First Paramount Modaraba First Prudential Modaraba First Punjab Modaraba
First UDL Modaraba Guardian Modaraba Long Term Venture Capital Modaraba Al-Mali Modaraba Al-Tijarah Trust Modaraba Unicap Modaraba

205
Table 7.33: Number of Employed Person in Bank by Grade Sex Pakistan 2001 2002 2003 Designation
Female Male Both Female Male Both Female Male Both adhoc employees 81 81 55 55 advisor 2 2 1 1 asst 22 692 714 24 654 678 16 422 438 asst director 10 1861 1871 10 1654 1664 7 1400 1407 asst general manager 12 12 12 12 2 2 asst manager 75 1049 1124 72 1077 1149 79 1132 1211 asst officer 14 39 53 23 58 81 42 92 134 avp 91 2272 2363 79 2148 2227 117 3077 3194 cash officer 22 336 358 19 269 288 44 449 493 cashier 18 18 18 18 1 1 chairman 2 2 1 1 1 1 chief executive 2 2 2 2 2 2 chief executive offier 2 2 2 2 1 1 chief executive vp 1 1 chief manager 46 46 1 56 57 1 64 65 chief operating officer 2 2 2 2 1 1 civil engineer 1 1 1 1 1 1 clerk 282 13590 13872 341 12504 12845 363 16120 16483 cog-I 2 2 2 2 2 2 cog-II 8 8 10 10 12 12 cog-III 20 20 23 23 31 31 computer operator 3 11 14 3 19 22 5 21 26 contract 4 4 3 35 38 4 4 contract staff 6 33 39 10 107 117 19 170 189 controller 1 1 1 1 coo 1 1 country manager 1 1 1 1 1 1 dealer treasury 1 1 1 1 dep chief 1 1 1 1 dep director 6 616 622 6 483 489 6 385 391 dep general manager 2 2 2 2 2 2 dep manager 2 84 86 4 91 95 10 123 133 dep managing 25 25 57 57 dep managing director 3 3 3 3 3 3 dep officer 16 61 77 30 104 134 44 159 203 dep president 1 1 director 42 42 35 35 28 28 dsa 1 2 3 evp 7 143 150 6 148 154 10 189 199 executive 29 29 34 34 33 33 executive director 9 9 10 10 1 10 11 executive manager 2 2 2 2 executive officer 2 2 1 1 executive on contract 1 1 1 1 6 6 executives/officer 68 753 821 133 1241 1374 212 1803 2015 extra asst director 50 1775 1825 50 1677 1727 49 1757 1806 general manager 10 10 12 12 8 8 general manager on contrat 1 1 grade-2 1 1 grade-3 5 5 grade-4 16 16

206
2001 2002 2003 Designation Female Male Both Female Male Both Female Male Both
grade-5 1 15 16 grade-6 1 13 14 grade-7 6 6 grade-8 2 1 3 head draftsman 1 1 head of consumer banking 1 1 1 1 1 1 head of corporate banking 2 2 2 2 1 1 head of finance & admn 1 1 1 1 1 1 head of global markets 1 1 1 1 head of human resources 1 1 1 1 1 1 head of traasury 1 1 1 1 international manager 2 2 jco 36 36 39 39 42 42 joint director 1 179 180 1 150 151 1 132 133 js 4 33 37 10 26 36 11 17 28 junior officer 51 653 704 92 767 859 105 827 932 junior trainee officer 32 32 29 29 2 28 30 lab. Tech 1 1 1 1 1 1 legal advisior 1 1 1 1 legel advisor management trainee 1 1 2 3 18 21 manager 28 433 461 23 465 488 18 521 539 managing director 2 2 2 2 2 2 marketing officer 1 1 2 misc 29 29 29 29 28 28 non officers 3 51 54 2 46 48 2 74 76 non-clerkrical 1 3169 3170 2606 2606 2 3760 3762 non-clrekrical 27 9371 9398 108 8459 8567 20 7135 7155 officer 1781 33433 35214 1744 30823 32567 2039 36161 38200 officer on contract 9 9 3 26 29 40 149 189 on contract 19 169 188 41 342 383 43 453 496 other 9 48 57 12 50 62 2 45 47 outsourced employees 61 61 president 7 7 7 7 7 7 probationary officer regional general manager 1 1 1 1 1 1 resident manager 5 20 25 rvp 17 17 2 42 44 3 42 45 secretary 8 8 7 7 6 6 senior field asst 1 1 2 senior technical asst 1 1 Sg-I 3 3 1 4 5 5 5 sg-II 1 5 6 1 6 7 1 9 10 sg-III 17 17 1 14 15 1 23 24 sharia advisior 1 1 1 1 sr. asst manager 1 4 5 2 2 1 1 sr. country executive manager 1 1 1 1 1 1 sr. credit officer 1 1 1 1 sr. director 16 16 12 12 10 10 sr. executive director 1 1 1 1 1 1

207
2001 2002 2003 Designation Female Male Both Female Male Both Female Male Both
sr. executive vp 1 43 44 1 40 41 1 47 48 sr. field asst 1 1 sr. manager 2 61 63 1 62 63 1 51 52 sr. officer 5 5 sr.manager 1 19 20 1 20 21 1 21 22 stenographer 70 70 66 66 43 43 stenotypist 3 84 87 3 81 84 2 80 82 sub-ordinate 89 89 86 86 103 103 svp 14 437 451 16 411 427 18 507 525 system asst 1 1 1 1 system operator 1 1 1 1 telephone operater 6 39 45 5 39 44 6 40 46 telex operator 1 1 1 1 teller 3 3 3 3 2 2 treasurer 1 1 1 1 typist 12 415 427 12 410 422 10 416 426 unit head 1 8 9 2 12 14 2 18 20 vp 41 1015 1056 43 989 1032 63 1422 1485 Grand Total 2691 73644 76335 2948 68766 71714 3439 79965 83404
Note: The following Banks despite repeated request provide Data Bolan Bank Limited Doha Bank Habib Bank Ltd. HBFC HSBC IDBP KASB Bank Meezan Bank NBP Capital Limited Oman International Bank PICIC Commercial Bank Ltd. Punjab Provincial Co-perative Bank Ltd. Soneri Bank The Bank of Kyber The Bank of Punjab The Bank of Tokyo-Mitsubishi Ltd Union Bank Zarai Taraqiat Bank Limited First women Bank Limited Habib Bank AG Zurich National Bank of Pakistan
Al Baraka Islamic Bank PRIME Bank NIB NDLC Bank Limited Bank of Ceylon Rupali Bank Limited Bank Alfalah Limited Allied Bank United Bank Ltd. American Express Faysal Bank Limited Metropolitan Bank Limited Muslim Commercial Bank Ltd. Askari Commercial Bank Ltd. ABN-AMRO Bank Cres Bank Deutsche Bank Standard Chartered Bank AL Habib Limited Saudi Pak Industrial & Agricultural Investment Co. Ltd. Saudi Pak Commercial Bank Limited

208
Table 8.1: Male and Female Voters of Pakistan (As on 30th August, 2002)
Number of Voters Province/Area
Women Men Both Sexes
Pakistan 33,155,551 38,707,729 71,863,280
Percent 46.1 53.9 100.0
Islamabad 180,190 203,371 383,561
Percent 47.0 53.0 100.0
Punjab 19,375,101 21,865,627 41,240,728
Percent 47.0 53.0 100.0
Sindh 7,405,782 8,768,183 16,173,965
Percent 45.8 54.2 100.0
N.W.F.P 3,922,528 4,930,445 8,852,973
Percent 44.3 55.7 100.0
Agencies 469945.0 815704.0 1,285,649
Percent 36.6 63.4 100.0
Balochistan 1,802,005 2,124,399 3,926,404
Percent 45.9 54.1 100.0 Source: Election Commission of Pakistan,2002

209
Table 8.2: Registered Voters, Votes Polled and Turnout of Voters in the National Assembly Election of Pakistan, 1970-2002
Registered Voters (In million) Year
Men
Female
Total Votes polled Tern-out
1970 30.51 26.43 56.94 34.09 59.9
Percent 53.6 46.4 100
1985 17.98 14.56 32.54 17.47 53.69
Percent 55.3 44.7 100
1988 24.82 21.38 46.21 19.90 43.07
Percent 53.7 46.3 100
1990 25.36 21.70 47.06 21.39 45.46
Percent 53.9 46.1 100
1993 27.46 22.92 50.38 20.29 40.28
Percent 54.5 45.5 100
1997 30.60 24.47 55.07 19.51 35.42
Percent 55.6 44.4 100
2002 38.71 33.16 71.86 30.01 41.74
Percent 46.4 53.6 100 Source:- Websites www.ecp.gov.pk

210
Table 8.3: Number of Elected Senators to the Senate by Gender
Number of Elected Senators
Women Men Election Year Total Number of Elected Senators
Number Percent Number Percent
1990 87 1 1.1 86 98.9
1993 87 1 1.1 86 98.9
1997 87 2 2.3 85 97.7
1998 87 2 2.3 85 97.7
1999* 87 2 2.3 85 97.7
2002* Nil Nil Nil Nil Nil
2003 100 18 18.0 82 82.0
2004 100 18 18.0 82 82.0 Senate was dissolved on 12th October, 1999 in accordance with the procnation of emergency dated 14th October, 1999 read with Chief Executive's Order 2 of 2001, dated 20th June, 2001. Source: Senate Secretariat, Parliament House, Islamabad Table 8.4: Number of Elected Members to the National Assembly by Gender
Number of Elected Members
Women Men Election Year Total Number of Members
Number Percent Number Percent
1990 217 2 0.9 215 99.1
1993 217 4 1.8 213 98.3
1997 217 6 2.6 211 97.2
2002 342 73 21.0 269 79.0
2004 342 73 21.0 269 79.0 Source: National Assembly Secretariat, Parliament House, Islamabad

211
Table 8.5: Number of Elected Members to the Provincials Assemblies by Gender
Number of Elected Members
Women Men Province Total Number of Members
Number Percent Number Percent
Balochistan 65 12 18.5 53 81.5
NWFP 124 23 18.5 101 81.5
Punjab 371 73 19.7 298 80.3
Sindh 168 33 19.6 135 80.4

212
Table 8.6: Number of Ministers/State Ministers/Advisors to Prime Minister and Special Assistant to Prime Minister by Gender and Years in the Federal Cabinet of Pakistan
Ministers State Ministers Year
Women Men Both Sexes Women Men Both Sexes
1999 1 18 19 1 4 5
2000 3 23 26 - 1 1
2001 3 23 26 - 1 1
2002 1 17 18 - 7 7
2004 1 32 33 5 21 26
Advisors to P.M Special Assistants to P.M Year
Women Men Both Sexes Women Men Both Sexes
1999 - 8 8 - 8 8
2000 - 5 5 - - -
2001 - 5 5 - - -
2002 - 4 5 - 1 1
2004 1 2 3 - 1 1 Source: Cabinet Division, Government of Pakistan, Islamabad

213
Table 8.7: Number of Ministers/ Advisors and Special Assistants to Chief Minister by Gender and Years in the Provincial Cabinet
Ministers Advisors Special Assistants to Chief
Minister Year
Women Men Both Sexes Women Men
Both Sexes Women Men
Both Sexes
Punjab 1995 - 26 26 - 27 27 - 2 2 1996 - 38 38 - 28 28 - 22 22 1997 - 10 10 - 1 1 - 2 2 1998 - 18 18 - 1 1 - 4 4 1999 1 9 10 - - - - - - 2002 - 26 26 - 5 5 - 5 5 2003 - 26 26 - 5 5 - 5 5 2004 4 36 40 - 3 3 - 1 1
Sindh 1995 - 28 28 3 16 19 - 14 14 1996 1 28 29 3 17 20 - 15 15 1997 - 16 16 - 5 5 - - - 1998 - 16 16 - 6 6 - 6 6 1999 2 24 26 - - - - - - 2002 - 11 11 - - - - - - 2003 1 18 19 1 15 16 - - - 2004 2 21 23 1 5 6 - - -
N.W.F.P 1995 - 33 33 - 2 2 - 3 3 1996 - 33 33 - 2 2 - 3 3 1997 - 9 9 - - - - - - 1998 - 9 9 - - - - - - 1999 - 21 21 - 3 3 - 2 2 2002 1 11 12 1 - 1 - - - 2003 - 12 12 - - - - - - 2004 - 20 20 1 - 1
Balochistan 1995 - 28 28 - - - - - - 1996 - 28 28 - - - - - - 1997 - 23 23 - - - - - - 1998 - 16 16 - - - - - - 1999 - 26 26 - 2 2 - 1 1 2002 2 24 26 - - - - - - 2003 - 14 14 - - - - - - 2004 2 27 29 - - - - - -
Source: Provincial Services and General Admn, Departments.

214

215
CHAPTER-9 The Population Reference Bureau is the leader in providing timely, objective information on U.S and
international population trends and their implications. The following table is a part taken from 2004 World Population Data Sheet of the Population Reference Bureau. Table 9.1: Demographic Data and Estimates for the Countries and Regions of the World-
2004
Country
Area of Countries (Square Miles)
Population per Square
Mile
Population Mid 2004 (millions)
Births per 1,000
Population
Deaths per 1,000
Population
Rate of Natural Increase
(%)
Infant Mortality Rate
1 2 3 4 5 6 7 8
Egypt 386660 190 73.4 26 6 2.0 38
Libya 679359 8 5.6 28 4 2.4 28
Sudan 967494 40 39.1 38 10 2.8 69 Ghana 92100 232 21.4 33 10 2.2 64 Nigeria 356668 385 137.3 42 13 2.9 100
Tanzania 364900 99 36.1 40 17 2.3 105
South Africa 471444 99 46.9 24 13 1 48
United States 3717796 79 293.6 14 8 0.6 6.7
Mexico 756062 140 106.2 25 5 2.1 25
Brazil 3300154 54 179.1 20 7 1.3 33
Turkey 299158 238 71.3 21 7 1.4 39
Bangladesh 55598 2542 141.3 30 9 2.1 66
India 1269340 856 1086.6 25 8 1.7 64
Iran 630575 107 67.4 18 6 1.2 32
Pakistan 307375 518 159.2 34 10 2.4 85
Sri lanka 25332 772 19.6 19 6 1.3 10
Indonesia 735355 297 218.7 22 6 1.6 46
Malaysia 127317 201 25.6 26 4 2.1 11
Thailand 198116 322 63.8 14 7 0.8 20
China 3696100 352 1300.1 12 6 0.6 32
U.K. 94548 630 59.7 12 10 0.1 5.3
Germany 137830 599 82.6 9 10 -0.2 4.1
Russia 6592819 22 144.1 10 17 -0.6 13
Australia 2988888 7 20.1 13 7 0.6 4.7 Contd…

216
Table 9.1: Demographic Data and Estimates for the Countries and Regions of the World-2004
Percent of population of Age
Life Expectancy at Birth (Years)
Percent of Married Women 15-49 Using Contraception
Country Total
Fertility Rate
<15 65+ Total Male Female All Methods
Modern Methods
9 10 11 12 13 14 15 16
Egypt 3.2 36 5 68 66 70 60 57
Libya 3.6 35 4 76 74 78 49 26
Sudan 5.4 45 2 57 56 58 10 7
Ghana 4.4 40 3 58 57 59 25 19
Nigeria 5.7 44 3 52 52 52 12 8
Tanzania 5.3 45 3 45 44 46 25 17
South Africa 2.8 34 4 53 49 57 56 55
United States 2.0 21 12 77 75 80 76 72
Mexico 2.8 35 5 75 73 78 68 59
Brazil 2.2 30 6 71 67 75 76 70
Turkey 2.5 30 6 69 66 71 64 38
Bangladesh 3.3 37 3 60 60 60 54 43
India 3.1 36 4 62 61 63 48 43
Iran 2.5 33 5 69 68 70 74 56
Pakistan 4.8 42 4 61 60 62 28 20
Sri lanka 2.0 27 7 72 70 74 66 44
Indonesia 2.6 30 5 68 66 70 60 57
Malaysia 3.3 34 4 73 71 76 55 30
Thailand 1.7 23 7 71 68 75 72 70
China 1.7 22 7 71 70 73 83 83
U.K. 1.7 19 16 78 76 80 84 79
Germany 1.3 15 17 78 75 81 75 72
Russia 1.4 16 13 65 58 72 67 49
Australia 1.7 20 13 80 77 83 67 65 Source: 2004 World population data sheet of the population reference bureau

217
The List of Non-Responding NBFIs Modarba Companies
S.No. Name of Company Address 1. First Al-Noor Modarba 96-A, Sindhi M.H. Society Karachi. 2. First Allied Bank Modarba 4- Banglore Town, Main Shara-e- Faisal, Karachi.
3. B. F. Modarba 4th Floor Bank House #1, Habib Square, M.A. Jinnah Rood, P.O. Box # 10229, Karachi.
4. B. R. R. Modarba Dean Arcade Block- 8, Kehkeshan, Clifton, Karachi.
5. First Constellation Modarba
2nd Floor, Trade center, I. I. Chunrigar Road Karachi.
6. First Cresent Modarba 2nd Floor, 131-A-E/1, Main Boulevard, Gulberg- III, Lahore.
7. First Custodian Modarba Plot # 148, Sector-30, Korangi Industrial, Area, Karachi.
8. First Dadabhoy Modarba 4th Floor, Ebrahim Estate, D-I Block # 78 KCHSU, Shara-e- Faisal, Karachi.
9. First Elite Capital Modarba 19- AbuBakar Block, New Garden Town, Lahore.
10. First Equity Modarba B-1004,10th Lakson Square Building # 3, Sarwar Shaheed Road, Karachi.
11. First Fidelity Leasing Modarba 97/A, Aziz Avenue, Canal Bank, Lahore.
12. Financial Link Modarba 1st Floor, NIC Building, Abbasi Shaheed Road, Karachi.
13. First General Leasing Modarba
5B, Lakson Square Building # 1, Sarwar Shaheed Road, Karachi.
14. Guardian leasing Modarba 5th Floor, 5B, Lakson Square Building # 1, Sarwar Shaheed Road, Karachi.
15. First Hajveri Modarba Hajveri Centre, 92 B-1, M.M. Alam Road, Gulberg-III, Lahore.
16. First IBL Modarba 1st Floor, NIC Building, Abbasi Shaheed Road Karachi.
17. First Ibrahim Modarba Ibrahim Center, GK-759 Bagh-e- Zehra Street, Karachi.
18. Industrial Capital Modarba 715, 7th Floor Progressive Plaza, Beaumont Road, Civil Lines, Karachi.
19. First Interfund Modarba B-601-602, 6th Floor, Lakson Square Building # 3, Sarwar Shaheed Road, Karachi.
20. First Islamic Modarba Mezzanine Floor, Progressive Plaza, Beaumont Road, Civil Lines, Karachi.
21. Long Term Venture Capital Modarba
6th Floor, Lakson Square Building # 3, Sarwar Shaheed Road, Karachi.
22. First Mehran Modarba 5/18, Rimpa plaza, M.A. Jinnah Road Karachi.
23. First Pak Modarba 1st Floor, Al- Malik Building, 19 Davis Road Lahore.
24. First Proffessional Modarba 315 Clifton Center, Khayaban-e-Roomi, Karachi.

218
S.No. Name of Company Address
25. First Providence Modarba 5B, Lakson Square Building # 1, Sarwar Shaheed Road, Karachi.
26. Second Prodential Modarba
1st Floor, Block # 1, Meher Sons Estate, Talpur Road, Karachi.
27. Third Prodential Modarba - do - 28. First Punjab Modarba 3rd Floor, National Tower, 28-Egerton Road LHR.
29. Schon Modarba (DORMANT) Schon Centre, I.I.Chundrigar Road Karachi.
30.
Ist Tawakkal Modarba (DORMANT)
6TH Floor Lakson Square Building #1, 265-R.A.Lines,Sarwar Shaheed Road, Karachi.
31. First Tri-Star Modarba A.R.T. Modarba Management (ptv.)Ltd., F/498,S.I.T.E P.O Box # 3683, Karachi
32. Second Tri- Star Modarba A.R.T. Modarba Management (ptv.)Ltd., F/498,S.I.T.E P.O Box # 3683, Karachi
33. First UDL Modarba NIC Building, 1st Floor, Abbasi Shaheed Road, off Sharah-e-Faisal, Karachi
34. Unity Modarba 16-C Itehad Lane # 9, Phase VI, Defence Housing Authority, P.O. Box 12349 (DHA P.O.) Karachi.
35. Fayzan Manufacturing Modarba 11/13 Trade Centre, I.I.Chundrigar Road Karachi.
36. Unicap Modarba 104-108, Kassam Court, BC-9, Block 5, Clifton, Karachi.

219
Leasing Companies
1. Asian Leasing Corp. Ltd. 10 Happy Homes, 38-A, Main Gulberg Lahore.
2. Crescent Leasing Corp. Ltd.
B-801/802, 8th Floor, Lakson Square Building # 3, Sarwar Shaheed Road, Karachi.
3. First Leasing Corp. Ltd. 602,6th Floor, Fortune Center, Shara-e- Faisal, Karachi.
4. Inter Asia Leasing Corp. Ltd.
B-601/602, 6th Floor, Lakson Square Building # 3, Sarwar Shaheed Road, Karachi.
5. International Multi Leasing Corp. Ltd.
T-02(B), 3rd Floor, Rehman Business Center, 32/B-3, Gulberg- III, Lahore.
6. Lease Pak Leasing Corp. Ltd.
5/7-B, 7-Canal Bank Road, Aziz Avenue, Gulberg-V, Lahore.
7. National Development Leasing Corp. Ltd.
NIC Building, 10th Floor, Abbasi Shaheed Road, off Sharah-e-Faisal, Karachi
8. Pacific Leasing Company Ltd.
91/B-1, M.M. Alam Road, Gulberg-III, Lahore.
9.
Pak Gulf Leasing Company Ltd.
125-126, 1st Floor, G-20, Block-9, Khayaban-e- Jami, P.O.Box12215, Clifton, Karachi.
10. Paramount Leasing Company Ltd.
701-702, Fortune Centre, 45-A, Block-6, PECHS, Sharah-e- Faisal, Karachi.
11. Saudi Pak Leasing Company Ltd.
6th Floor, Lakson Square Building # 1, Sarwar Shaheed Road, Karachi.
12. Security Leasing Company Ltd.
B901-902, 9th Floor, Lakson Square Building # 3, Sarwar Shaheed Road, Karachi.
13. SME Leasing Company Ltd.
2nd Floor, Tower B, Finance & Trade Centre, (FTC) Building, Sharah-e- Faisal, Karachi.
14. Union Leasing Company Ltd.
6th Floor, New Jubilee Insurance Building, I.I.Chundrigar Road Karachi.

220
Insurance Companies S. No Name of Company Address
1. State Life Insurance Corporation of Pakistan
SLIC Building # 9, Dr. Ziauddin Ahmed Road, P.O. Box 5725, Karachi.
2. National Insurance Company Ltd.
NIC Building, Abbasi Shaheed Road, Shahrah-e- Faisal, P.O. Box 10506, Karachi.
3. Pakistan Re-Insurance Company Ltd.
PIC Towers, 32-A, Lalazar Drive, M.T. Khan road, P.O. Box 4777, Karachi.
4. The Metropolitan Life Assurance Co. of Pak. Ltd. 310, Qamar House, M.A. Jinnah Road, Karachi.
5. Central Insurance Company Ltd.
Dawood Centre, 5th Floor, MT Khan Road, P.O. Box 3988, Karachi.
6. Commercial Union Life Assurance Company.
CU Building 74/1-A, Lalazar, MT Khan Road, P.O. Box 4895, Karachi.
7. EFU General Insurance Company.
Qamar House, M.A. Jinnah Road, P.O. Box 5005, Karachi.
8. The Crescent Star Insurance Company Ltd.
Nadir House, 2nd Floor, I.I. Chundrigar Road, P.O. Box 4616, Karachi.
9. Excel Insurance Company Ltd.
38-C-1, Block-6, P.E.C.H. Society, Shahrah-e- Faisal, Karachi.
10. Agro General Insurance Company Ltd.
612, Qamar House, M.A. Jinnah Road, Karachi.P.O. Box 5920, Karachi.
11. Prime Insurance Company Ltd.
2nd Floor, Sasi Arcade, Block-7, Main Clifton Road, Karachi.
12. The Premier Insurance Co. of Pakistan Ltd.
5th Floor, SLIC Building # 2-A, Wallace Road, Off I.I. Chundrigar Road, P.O.Box 4140, Karachi.
13. Alpha Insurance Company Ltd.
SLIC Building # 1-A &1-C, Wallace Road, Off I.I. Chundrigar Road, P.O.Box 4359, Karachi.
14. International General Insurance Co. of Pak. Ltd.
Finlay House, 1st Floor, I.I. Chundrigar Road, P.O. Box 4576, Karachi.
15. Century Insurance Company Ltd.
11th Floor, Block-D, Lakson Square Building # 1, Sarwar Shaheed Road, Karachi.
16. Shaheen Insurance Company Ltd.
10th Floor, Shaheen Complex, M.R. Kayani Road, Karachi.
17. Platinum Insurance Company Ltd. 8th Floor, Uni Centre, I.I. Chundrigar Road, Karachi.
18. Adamjee Insurance Company Ltd.
Adamjee House, 6th Floor, I.I. Chundrigar Road, P.O. Box 4850, Karachi.
19. Habib Insurance Company Ltd.
Habib Square, M.A. Jinnah Road, P.O. Box 5217, Karachi.
20. New Jubilee Insurance Company Ltd.
2nd Floor, Jubilee Insurance House, I.I.Chundrigar Road , Karachi.

221
S.No Name of Company Address
21. New Hampshire Insurance Company Ltd.
Finlay House, 2nd Floor, I.I. Chundrigar Road, Karachi.
22. East West Insurance Company Ltd.
410, Qamar House, M.A. Jinnah Road, P.O. Box 6693, Karachi.
23. Beema Pakistan Ltd. 719-726, Muhammadi House, I.I. Chundrigar Road, P.O. Box 5626, Karachi.
24. Raja Insurance Company Ltd.
5th Floor, Panorama Centre, 256- Fatima Jinnah Road, P.O. Box 10422, Karachi.
25. Reliance Insurance Company Ltd.
181-A, S.M.C.H. Society, Shahrah-e- Faisal, Karachi.
26. Union Insurance Company Ltd.
9th Floor, Adamjee House, I.I. Chundrigar Road, P.O. Box 4527, Karachi.
27. American Life Insurance Company Ltd.
11th Floor, Lakson Square Building # 1, Sarwar Shaheed Road, Karachi.
28. Continental Insurance Company Ltd.
Suit #207 –208,Adam Chamber, New Challi, Karachi.
29. Jupiter Insurance Company Ltd.
4th Floor, Finlay House, I.I. Chundrigar Road, Karachi.
30. ACE Insurance Company Ltd.
6th Floor, NIC Building, Abbassi Shaheed Road, Karachi.
31. Allianz EFU Health Insurance Company Ltd.
Plot # 74, Block # 5, Clifton, KDA Scheme # 5, Karachi.
32. EFU Life Assurance Ltd. 37-K, Block-6, PECHS, Karachi.
33. The Pakistan General Insurance Company Ltd.
Cooperative Bank House, 5- Bank Square, P.O. Box 1364, Shahrah-e- Quaid-e- Azam, Lahore.
34. Silver Star Insurance Company Ltd. 5- Bank Square, P.O. Box 2533, Lahore.
35. The Co-operative Insurance Society of Pakistan Ltd.
Co-operative Insurance Building, P.O. Box 147, 23, Shahrah-e- Quaid-e- Azam, Lahore.
36. Universal Insurance Company Ltd.
Universal Insurance House, 63, Shahrah-e- Quaid-e- Azam, Lahore.
37. Asia Insurance Company Ltd.
Asia Insurance House, 7- Egerton Road, P.O. Box 2289, Lahore.
38. The Pakistan Mutual Insurance Company Ltd. 29-A, Lytton Road, Lahore.
39. Muslim Insurance Company Ltd. 3- Bank Square, Shahrah-e- Quaid-e- Azam, Lahore.
40. Asian Mutual Insurance Company Ltd. 1- Panj Mahal Road, Off 68: Mozang Road, Lahore.
41. Credit Insurance Company Ltd.
1st Floor, Asmat Chamber, 68, Mozang Road, Lahore.
42. Security General Insurance Company Ltd. Nishat House 53- A, Lawarance Road, Lahore.

222
S.No. Name of Company Address
43.
Pakistan Equity Insurance Company Ltd. M.K. Arcade, 32- Davis Road, Lahore.
44. North Star Insurance Company Ltd.
H.O: 37-38 Basement, Sadiq Plaza, 69- The Mall, Lahore.
45. Postal Life Insurance . Behind GPO Building, Lahore.
46. Ittefaq General Insurance Company Ltd. H-16, Murree Road, Rawalpindi.
47. Askari GeneralInsurance Company Ltd. 4th Floor, AWT Plaza, The Mall, Rawalpindi.
48. Business & Industrial Insurance Company Ltd.
1st Floor, 65 East, Pak Pavilions, Fazal- e- Haq Road, Blue Area, Islamabad.
49. Capital Insurance Co. Ltd. Muradia Road, Model Town, Sialkot.
50. National General Insurance Company Ltd.
401-B, Satelite Town, Near Commercial Market, Rawalpindi.
Mutual Funds S.No. Name of Company Address
1. Al-Meezan Mutual Fund Limited 4th Floor, Block “C” Finance & Trade Centre Shahrah-e-Faisal, Karachi-74400
2. Asian Stocks Fund Limited 5th Floor, Block “C” Finance & Trade Centre Shahrah-e-Faisal, Karachi-74400
3. BSJS Balanced Fund Limited. 1306-1307, Chapa Plaza, Hasrat Mohani Road Karachi-74000
4. Dominion Stock Fund Limited
27, Beverly Centre, Mezannine Floor, Jinnah Avenue Islamabad
5. First Capital Mutual Fund Limited 103-C-11, Gulberg III, Lahore
6. Golden Arrow Selected Stocks Fund Limited.
607, Uni-Tower, I.I Chundrigar Road Karachi-74000
7.
Investec Mutual Fund Limited (Formely Growth Mutual Fund Limited).
707, 7th Floor, Stock Exchange Building, Stock Exchange Road, Karachi
8.
Pakistan Premier Fund Limited (Formely KASB Premier Fund Limited)
7th Floor, Al-Sehat Centre, Rafique Shaheed Road Off Shahrah-e-Faisal, Karachi-75350
9. Prudential Stocks fund Limited One-B-9/G, Block-B 2nd Floor, Mehersons Estate Talpur Road, Off I.I Chundrigar Road, Karachi.
10. Safeway Mutual Fund Limited Unit No.6, Happy Homes, 38-A-3, Main Gulberg Lahore.
11. Tri-Star Mutual fund Limited F/498, S.I.T.E, Karachi-75700

223
S.No. Name of Company Address
12.
Investment Corporation of Pakistan (ICP) Lot “A” Mutual funds (Managed by ABAMCO Limited)
ABAMCO Limited, 1306-1307, Chapal Plaza Hasrat Mohani Road, Karachi-74000
13.
Investment Corporation of Pakistan (ICP) Lots ‘B’ & ‘C’ Mutual funds (Managed by PICIC Limited)
PICIC Limited, State Life Building No.1 Off I.I Chundrigar Road, Karachi.-74000
14. National Investment (Unit) Trust (NIT)
National Bank Building, 6th Floor, Off I.I Chundrigar Road, Karachi.- 74000
15. Unit Trust of Pakistan. (UTP) 1306-1307, Chapal Plaza, Hasrat Mohani Road Karachi-74000
16. Pakistan Income Fund
7th Floor, Al-Sehat Centre, Rafique Shaheed Road Off Shahrah-e-Faisal, Karachi-75350
17. Pakistan Stock Market Fund (PSM)
7th Floor, Al-Sehat Centre, Rafique Shaheed Road Off Shahrah-e-Faisal, Karachi-75350
18. UTP Income Fund 1306-1307, Chapal Plaza, Hasrat Mohani Road Karachi-74000
19. United Money Market Fund 7th Floor, State Life Building No.1 Off I.I Chundrigar Road, Karachi.
20. UTP Islamic Fund 1306-1307, Chapal Plaza, Hasrat Mohani Road Karachi-74000
21. Metro Bank Pakistan Sovereign Fund
7th Floor, State Life Building No.1 Off I.I Chundrigar Road, Karachi.
22. Dawood Money Market Fund 5-B, Lakson Square Building No.1, Sarwar Shaheed Road, Karachi-74200
23. Meezan Islamic Fund 4th Floor, Block “C” Finance & Trade Centre Shahrah-e-Faisal, Karachi-74400

224
Development Financial Institutions (DFIS)
1. SME Bank Limited Investment Banks
1. First Standard Investment Bank Ltd. 2. Atlas Investment Bank Ltd. 3. Crescent Investment Bank Ltd. 4. Escort Investment Bank Ltd. 5. Fidelity Investment Bank Ltd. 6. Islamic Investment Bank Ltd. 7. Jehangir Siddiqui Investment Bank Ltd. 8. Orix Investment Bank (Pak) Ltd. 9. Prudential Investment Bank Ltd
10. Trust Investment Bank Ltd.