Embed Size (px)
Citation preview
PrefaceMaintenance ExperienceEditorial Committee
Maintenance ExperienceNewsroom
Address: ZTE Plaza, Keji Road South, Hi-Tech
Industrial Park, Nanshan District,
Shenzhen, P.R.China
Postal code: 518057
Contact: Song Chunping
Tel: +86-755-26770600, 26771195
Fax: +86-755-26772236
Document Support Email: [email protected]
Technical Support Website: http://ensupport.zte.
com.cn
Maintenance ExperienceBimonthly for Data ProductsNo.13 Issue 160, April 2009
In this issue of ZTE's “Maintenance Experience”, we continue to pass on various field reports and resolutions that are gathered by ZTE engineers and technicians around the world.
The content presented in this issue is as below:One Special DocumentSix Maintenance Cases of ZTE's Data Products
Have you examined your service polices and procedures lately? Are you confident that your people are using all the tools at their disposal? Are they trained to analyze each issue in a logical manner that provides for less downtime and maximum customer service? A close look at the cases reveals how to iso-late suspected faulty or mis-configured equipment, and how to solve a problem step by step, etc. As success in commissioning and service is usually a mix of both discovery and analysis, we consider using this type of approach as an example of success-ful troubleshooting investigations.
While corporate leaders maintain and grow plans for expan-sion, ZTE employees in all regions carry out with individual ef-forts towards internationalization of the company. Momentum continues to be built, in all levels, from office interns to veteran engineers, who work together to bring global focus into their daily work.
If you would like to subscribe to this magazine (electronic version) or review additional articles and relevant technical mate-rials concerning ZTE products, please visit the technical support website of ZTE Corporation (http://ensupport.zte.com.cn).
If you have any ideas and suggestions or want to offer your contributions, you can contact us at any time via the following email: [email protected].
Thank you for making ZTE a part of your telecom experience!
Maintenance Experience Editorial CommitteeZTE CorporationApril, 2009
Director: Qiu Weizhao
Deputy Director: Chen Jianzhou
Editors:Jiang Guobing, Zhang Shoukui, Wu Feng, Yuan
Yufeng, Tang Hongxuan, Li Gangyi, Song Jianbo,
Tian Jinhua, Wang Zhaozheng, Liu Wenjun,
Wang Yapping, Lei Kun, Wang Tiancheng,
Ge Jun, Yu Qing, Zhang Jiebin, Fang Xi
Technical Senior Editors:Hu Jia, Bai Jianwen
Executive Editor:Zhang Fan
Contents
NetNumen N31 Unified Management System......................................................................................... 02
SQL Server Installation Failure ................................................................................................................ 05
Member Switch in Cluster Displaying as CO ........................................................................................... 06
NE MAC Address Collision ...................................................................................................................... 07
Network Interruption Caused by MAC Address Offset ............................................................................ 09
Surfing Internet in MAN ........................................................................................................................... 12
Operational Failure through ACL ............................................................................................................. 15
Surfing Internet in MAN ........................................................................................................................... 17
Operational Failure through ACL ............................................................................................................. 20
Abnormal EBGP Neighborhood Establishment ....................................................................................... 21
Telnet with Slow Speed ........................................................................................................................... 24
Maintenance Experience2
April 2009 Issue 160
NetNumen N31 OverviewAt present, network techniques de-
velop vigorously. More and more key ap-plications and services are established on the base of data network. Therefore, it is very important to ensure that the network works normally and efficiently. Network operators, Internet service providers and enterprises must implement effective man-agements and plans to the network system to meet the growing requirements of users to the maximum extent. To establish, de-ploy and use the network quickly, as well as keep the network running conveniently, a data network management system with powerful functions, good extensibility and high performance is recommended.
On the other hand, due to the fast changing market, declining product life cycle and increasing market launch press, network operators are facing intense com-petition. Therefore, requirement of effec-tive network management system is need-ed in order to decrease operating cost and improve network quality.
In addition, considering the increasing software development cost and demand for supporting different operating systems and hardware platforms, network opera-tors have to find a technique that can help them to improve productivity greatly. In
NetNumen N31 Unified Management System⊙ Ye Dezhong, Lu yinghua / ZTE Corporation
the current situation, technique and demand keeps changing continually. It is important for most equip-ment manufacturers and software developers to make their product support different operating systems and hardware platforms. To meet the changing requirements of their users, equipment manufacturers must provide a network manage-ment system that can run in different platforms and support Web.
ZTE holds the pulse of the times and develops NetNumen N31 Unified Management System. This is a high customization cross-platform network management system of carrier class. It is on the base of new Internet technique and it is designed according to rules from bottom to top. It can be used to manage all ZTE data products. It covers network element management, network manage-ment and service management.
NetNumen N31 FunctionsNetNumen N31 has the following functions.1. Providing unified network management.
NetNumen N31 can be used to manage all ZTE data products.NetNumen N31 covers Management levels of network element, network and service, providing perfect network management functions.NetNumen N31 can be integrated with network management systems of NGN and ADSL to implement unified management.
Key words: NetNumen N31
Data Products
www.zte.com.cn
3
2. Providing different management privileges and implementing management in different areas. Users can access the management system in dif-ferent areas with different management privileges.
3. Supporting different platforms and different databases.
NetNumen N31 uses J2EE architecture and it is developed in JAVA. Therefore it supports different platforms and operating sys tems such as UNIX, L INUX and WINDOWS.NetNumen N31 supports databases such as MSSQL, SYBASE and ORACLE.
4. Providing convenient extension and up-grade.
NetNumen N31 uses modularization structure. It is with good extension and upgrade ability.
5. Providing special management functions.Policy managementFast network automatic discoveryFault processing expert baseReport processingConfiguration management based on taskNetwork statistics
6. Supporting localization.NetNumen N31 supports Chinese and English.
Users can select the language during the installa-tion to implement localization management.
7. Complying with high standardsNetNumen N31 complies with TMN series sug-
gestions defined by ITU-T. NetNumen N31 also complies with a series of network management protocols defined in RFC and network manage-ment suggestions in TMF.
8. Providing high security.NetNumen N31 provides perfect access privilege control.NetNumen N31 provides perfect security log records.
9. Providing high reliability.NetNumen N31 supports local backup and remote recovery.NetNumen N31 is with good fault tolerance
ability. When a server in the system is down, other servers can take over the tasks. This ensures that the services will not be intermitted.NetNumen N31 provides good system management ability. Data information of NetNumen N31 management sys tem can be monitored.
10. Providing good openness.NetNumen N31 supports standard
SNMP and it provides CORBA interface, SNMP interface and TL1 interface. NetNu-men N31 can be integrated with third party systems, providing convenience for offices to implement OSS system application.
11. Providing perfect after sale ser-vice.
NetNumen N31 uses are provided with 24×7 after sale service of ZTE.
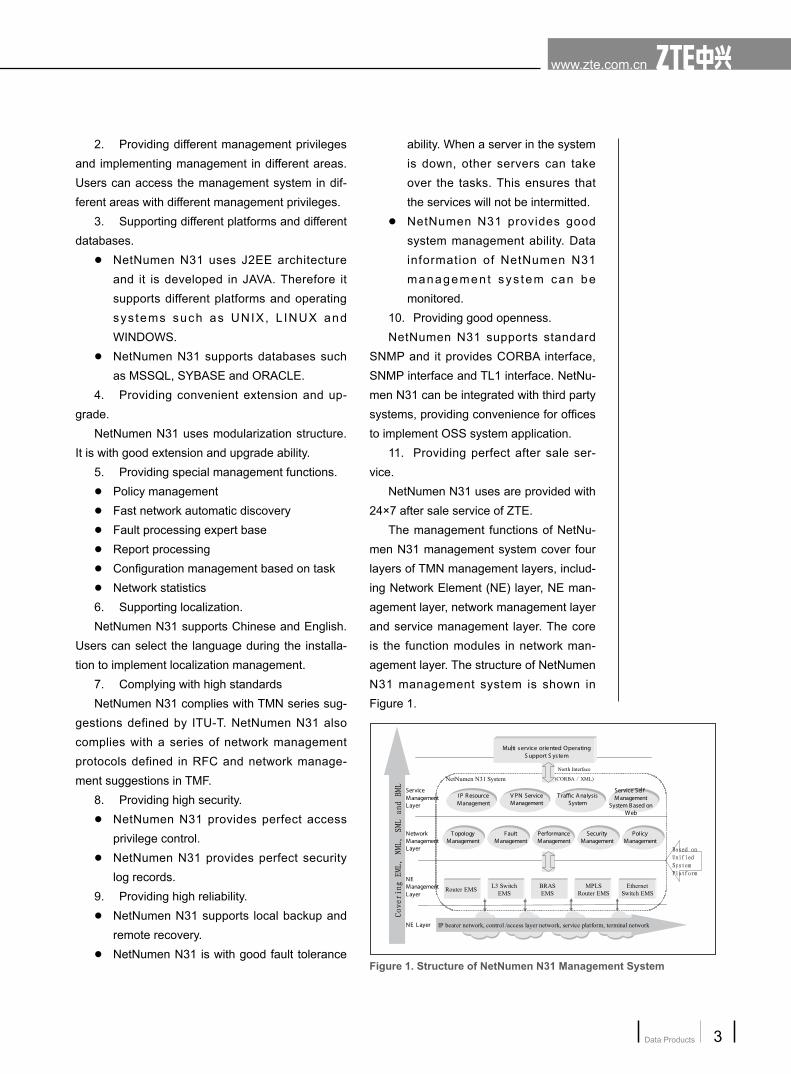
The management functions of NetNu-men N31 management system cover four layers of TMN management layers, includ-ing Network Element (NE) layer, NE man-agement layer, network management layer and service management layer. The core is the function modules in network man-agement layer. The structure of NetNumen N31 management system is shown in Figure 1.
Figure 1. Structure of NetNumen N31 Management System
Maintenance Experience4
April 2009 Issue 160
Network ModesNetNumen N31 is a network manage-
ment system on the base of data commu-
nication network. It can be used to main-
tain and manage different network devices
located in different areas in complicated
application situations. Therefore, central-
ized management mode is usually used,
that is, a network management system
manages a lot of devices locating in the
managed network centrally.
In centralized management mode,
network management system comprises
server and clients. There is only one
server in the whole managed network.
The server implements interactions with
all managed devices. There are multiple
clients. The clients connect the server and
implement human-computer interactions
with users. Clients do not connect devices
directly. There are two modes to configure
client, local terminal and remote terminal.
Local terminal mode
In this mode, the server and clients are
in the same LAN. The clients implement
centralized management in the whole net-
work together with the server.
Remote terminal mode
In this mode, clients connect the server
through WAN. The client may locate in
remote device room. The managed net-
work is divided into different management
areas. Each client manages devices in
local area. Clients do not connect devices
directly.
Management of different layers in
centralized management mode can be
implemented through remote terminals, as
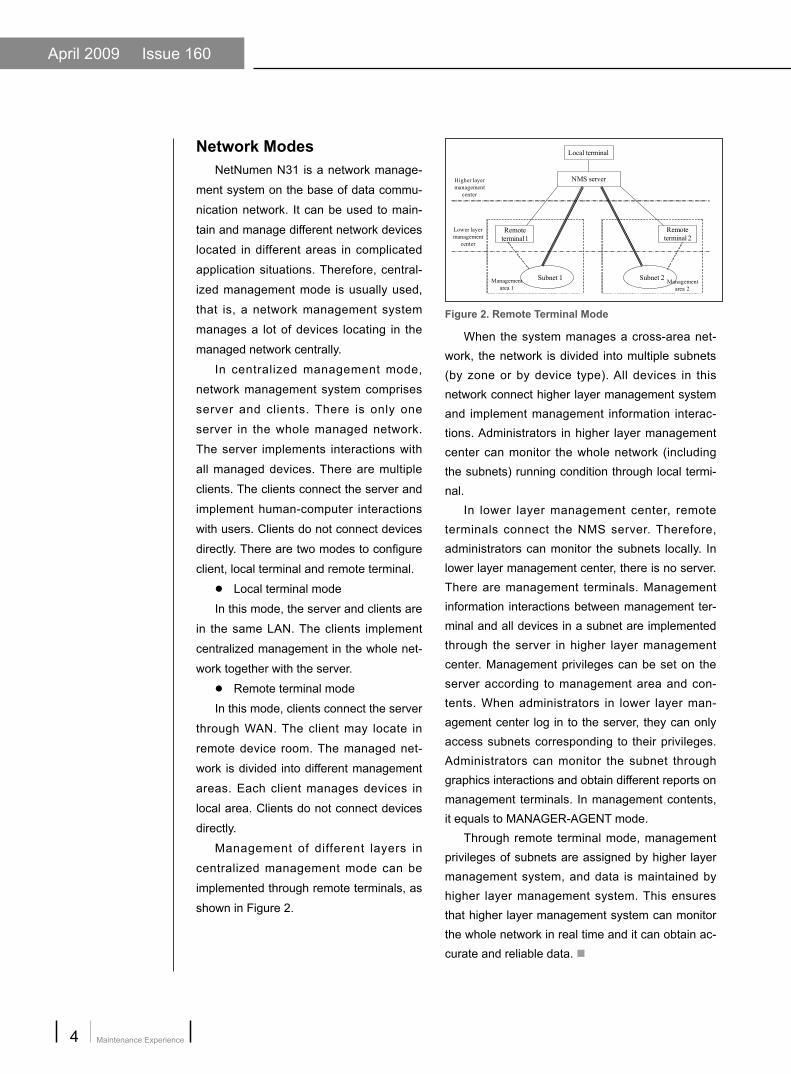
shown in Figure 2.
When the system manages a cross-area net-work, the network is divided into multiple subnets (by zone or by device type). All devices in this network connect higher layer management system and implement management information interac-tions. Administrators in higher layer management center can monitor the whole network (including the subnets) running condition through local termi-nal.
In lower layer management center, remote terminals connect the NMS server. Therefore, administrators can monitor the subnets locally. In lower layer management center, there is no server. There are management terminals. Management information interactions between management ter-minal and all devices in a subnet are implemented through the server in higher layer management center. Management privileges can be set on the server according to management area and con-tents. When administrators in lower layer man-agement center log in to the server, they can only access subnets corresponding to their privileges. Administrators can monitor the subnet through graphics interactions and obtain different reports on management terminals. In management contents, it equals to MANAGER-AGENT mode.
Through remote terminal mode, management privileges of subnets are assigned by higher layer management system, and data is maintained by higher layer management system. This ensures that higher layer management system can monitor the whole network in real time and it can obtain ac-curate and reliable data. ■
Figure 2. Remote Terminal Mode
Data Products
www.zte.com.cn
5
Malfunction SituationWhen users install SQL, the system may usually prompt installation failure. The reason is that
users have installed database before but the database files were not deleted completely.
SolutionTo delete the database files completely, perform the following steps.
1. Uninstall the database program through Add or Remove Programs in Control Panel.2. Delete the whole Microsoft SQL Server file manually.
3. Click Start Run and input regedit to open Registry Editor, and then delete the follow-
ing items.
HKEY_CURRENT_USER\Software\Microsoft\Microsoft SQL Server
HKEY_LOCAL_MACHINE\SOFTWARE\Microsoft\Microsoft SQL Server
HKEY_LOCAL_MACHINE\SOFTWARE\Microsoft\MSSQLServer
4. Reboot the system.
5. Install SQL again. ■
SQL Server Installation Failure⊙ Wang Xinlin / ZTE Corporation
Key words: SQL, installation failure
Maintenance Experience6
April 2009 Issue 160
Malfunction SituationZXR10 2818S switches work as mem-
ber switches in a cluster. As shown in Figure 1, switches are displayed as CO in NetNumen N31 network management platform. However, in normal situation, switches must be displayed as C. When switches are displayed as CO, there is no telnet option in the shortcut menu if users right-click the switches.
Member Switch in Cluster Displaying as CO⊙ Zhang Jintao / ZTE Corporation
switch or an external member switch of the cluster.An internal member switch of a cluster appears in both Device table and Group member table.An external member switch of a cluster appears only in Device table but not in Group member table.
Sometimes, users may find that a switch ap-pears both in Device table and Group member ta-ble, but it is displayed as CO on network manage-ment server. The reason is that that switch worked as a member switch, the link between the member switch and the command switch was down and a moment later it was recovered, but states on the command switch was not refreshed. Users are recommended to implement topology collection to refresh the state on the command switch.
SolutionTo solve the problem, perform the following
steps.1. Delete the member switches on the com-
mand switch and then add the member switches again. This ensures that the state of member switches in Group member table is up and users can log in to member switches through command switch.
2. Input ztp start command on command switch to collect topology information again.
3. Right-click the command switch in topol-ogy management view and then select Update State in the shortcut menu. The member switches are displayed as C. ■
Figure 1. Member Switch in Cluster Displaying as CO
Malfunction AnalysisWhen the switch is displayed as C, it is
an internal member switch of the cluster. When the switch is displayed as CO, it is an external member switch of the cluster.
In a switch cluster, there are two impor-tant tables on the command switch, Device table and Group member table. Users can view the information in the two tables with show ztp device-list command and show group member command.
The following rules are used to judge whether a switch is an internal member
Key words: cluster management, CO, C, ZTP, NetNumen N31
Data Products
www.zte.com.cn
7
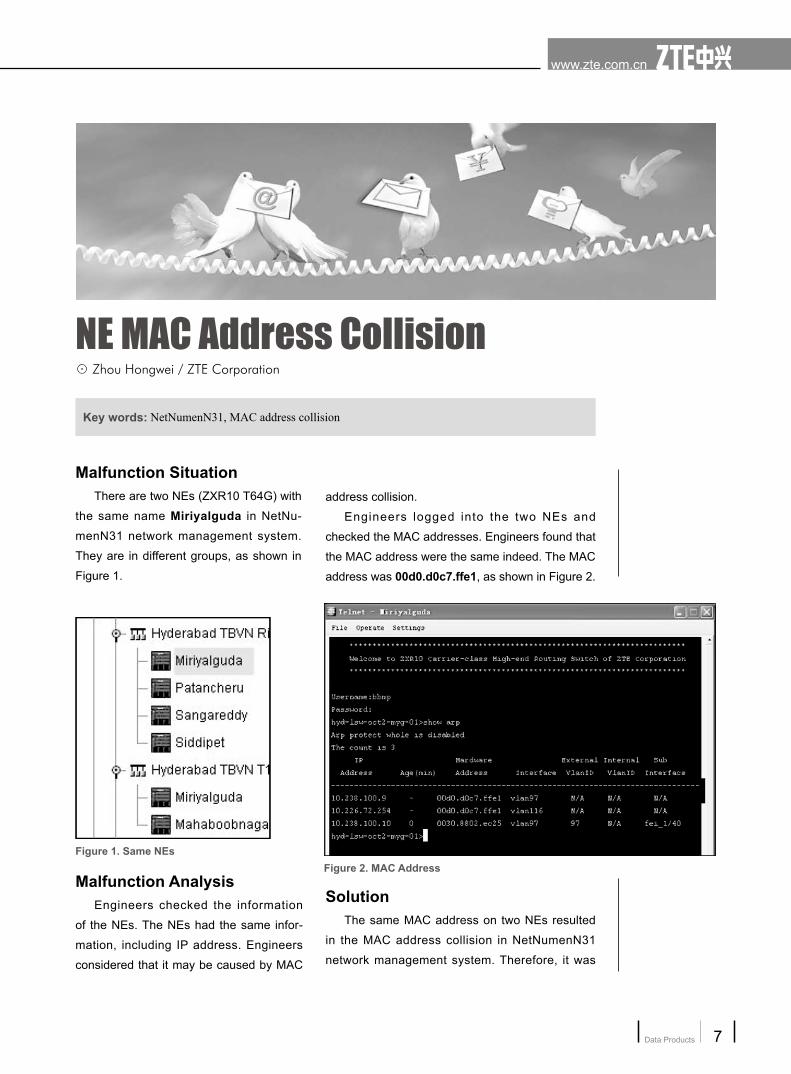
Malfunction SituationThere are two NEs (ZXR10 T64G) with
the same name Miriyalguda in NetNu-
menN31 network management system.
They are in different groups, as shown in
Figure 1.
NE MAC Address Collision⊙ Zhou Hongwei / ZTE Corporation
address collision.
Engineers logged into the two NEs and
checked the MAC addresses. Engineers found that
the MAC address were the same indeed. The MAC
address was 00d0.d0c7.ffe1, as shown in Figure 2.
Figure 1. Same NEsFigure 2. MAC Address
Malfunction AnalysisEngineers checked the information
of the NEs. The NEs had the same infor-
mation, including IP address. Engineers
considered that it may be caused by MAC
SolutionThe same MAC address on two NEs resulted
in the MAC address collision in NetNumenN31
network management system. Therefore, it was
Key words: NetNumenN31, MAC address collision
Maintenance Experience8
April 2009 Issue 160
necessary to modify the MAC address in
one of the NEs.
To modify the MAC address on one
NE through remote connection, engineers
took the following steps.
1. Engineers defined an address
segment range on service interface of the
switch with the following command.
ZXR10(config-increte)#mac-base-addr
add master / slave <mac-address> { 8 |
16 | 32 }
8, 16 and 32 were used to specify the
MAC address range. If the MAC address
range was set as 8, the last three bits of
MAC address must be 0. If the MAC ad-
dress range was set as 16, the last four
bits of MAC address must be 0. If the MAC
address range was set as 32, the last five
bits of MAC address must be 0.
After defining address segment range
on service interface, engineers input the
following command.
ZXR10(config-increte)#mac-base-addr
enable master/slave
After this command was configured,
MAC address was distributed in new mode
and it was saved in nvram of the switch.
After the switch was rebooted, the new
MAC address distribution mode would be
loaded in memory and take effect.
2. Engineers defined an address
segment range on administration interface
of the switch with the following command.
ZXR10(config-increte)#mac-base-addr add
master/slave mng <mac-address> { 1-4 }
At present, four MAC address could be speci-
fied on administration interface. However, only one
administration interface was needed on G series
switches. Therefore it was necessary to configure
one MAC address. It was not necessary to set the
MAC address for administration interface according
to the address segment range defined on service
interface.
After defining address segment range on ad-
ministration interface, engineers input the following
command.
ZXR10(config-increte)#mac-base-addr enable
master/slave
After this command was configured, MAC ad-
dress was distributed in new mode and it was
saved in nvram of the switch. After the switch was
rebooted, the new MAC address distribution mode
would be loaded in memory and take effect.
3. Engineers saved the above configuration.
It was not necessary to save the configuration
manually. After the configuration, the above com-
mands were saved in nvram of the switch automat-
ically. They would take effect after the switch was
rebooted.
The above configuration also could be saved
manually with the following command.
ZXR10# write nvram
Data Products
www.zte.com.cn
9
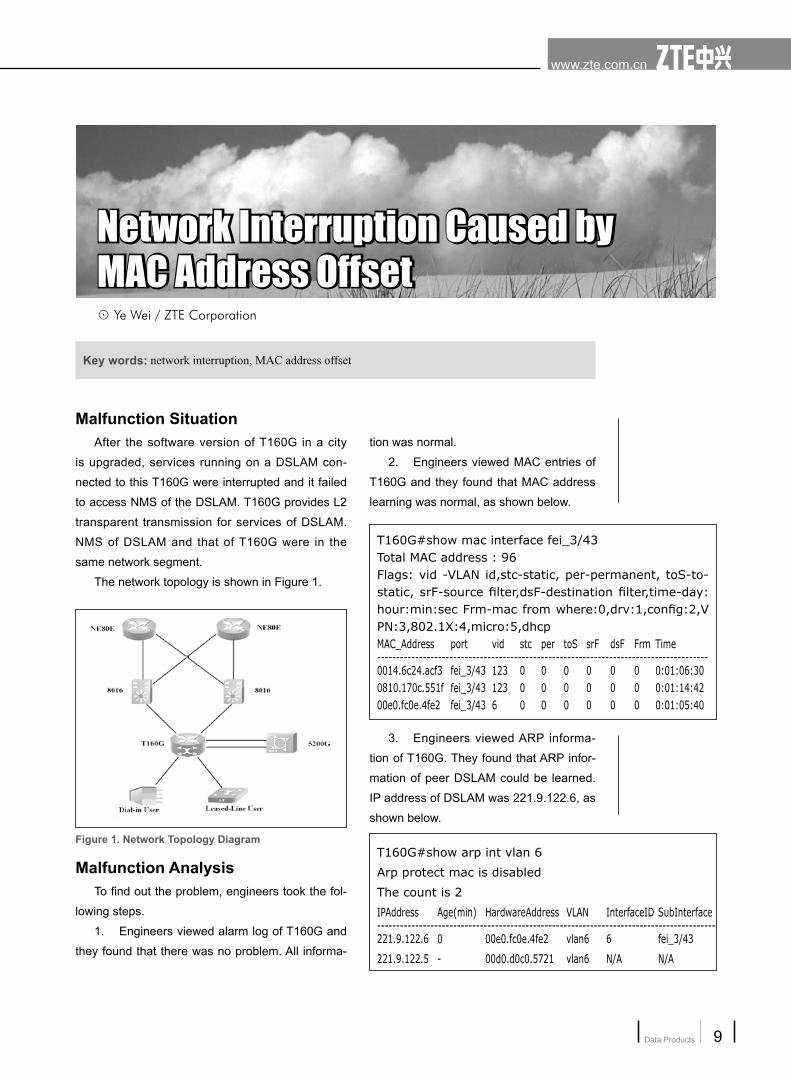
Malfunction SituationAfter the software version of T160G in a city
is upgraded, services running on a DSLAM con-
nected to this T160G were interrupted and it failed
to access NMS of the DSLAM. T160G provides L2
transparent transmission for services of DSLAM.
NMS of DSLAM and that of T160G were in the
same network segment.
The network topology is shown in Figure 1.
tion was normal.
2. Engineers viewed MAC entries of
T160G and they found that MAC address
learning was normal, as shown below.
T160G#show mac interface fei_3/43Total MAC address : 96Flags: vid -VLAN id,stc-static, per-permanent, toS-to-static, srF-source filter,dsF-destination filter,time-day:hour:min:sec Frm-mac from where:0,drv:1,config:2,VPN:3,802.1X:4,micro:5,dhcpMAC_Address port vid stc per toS srF dsF Frm Time---------------------------------------------------------------------------------------0014.6c24.acf3 fei_3/43 123 0 0 0 0 0 0 0:01:06:300810.170c.551f fei_3/43 123 0 0 0 0 0 0 0:01:14:4200e0.fc0e.4fe2 fei_3/43 6 0 0 0 0 0 0 0:01:05:40
Figure 1. Network Topology Diagram
Malfunction AnalysisTo find out the problem, engineers took the fol-
lowing steps.
1. Engineers viewed alarm log of T160G and
they found that there was no problem. All informa-
3. Engineers viewed ARP informa-
tion of T160G. They found that ARP infor-
mation of peer DSLAM could be learned.
IP address of DSLAM was 221.9.122.6, as
shown below.
T160G#show arp int vlan 6
Arp protect mac is disabled
The count is 2
IPAddress Age(min) HardwareAddress VLAN InterfaceID SubInterface-----------------------------------------------------------------------------------------221.9.122.6 0 00e0.fc0e.4fe2 vlan6 6 fei_3/43
221.9.122.5 - 00d0.d0c0.5721 vlan6 N/A N/A
Key words: network interruption, MAC address offset
Network Interruption Caused by MAC Address OffsetNetwork Interruption Caused by MAC Address Offset⊙ Ye Wei / ZTE Corporation
Maintenance Experience10
April 2009 Issue 160
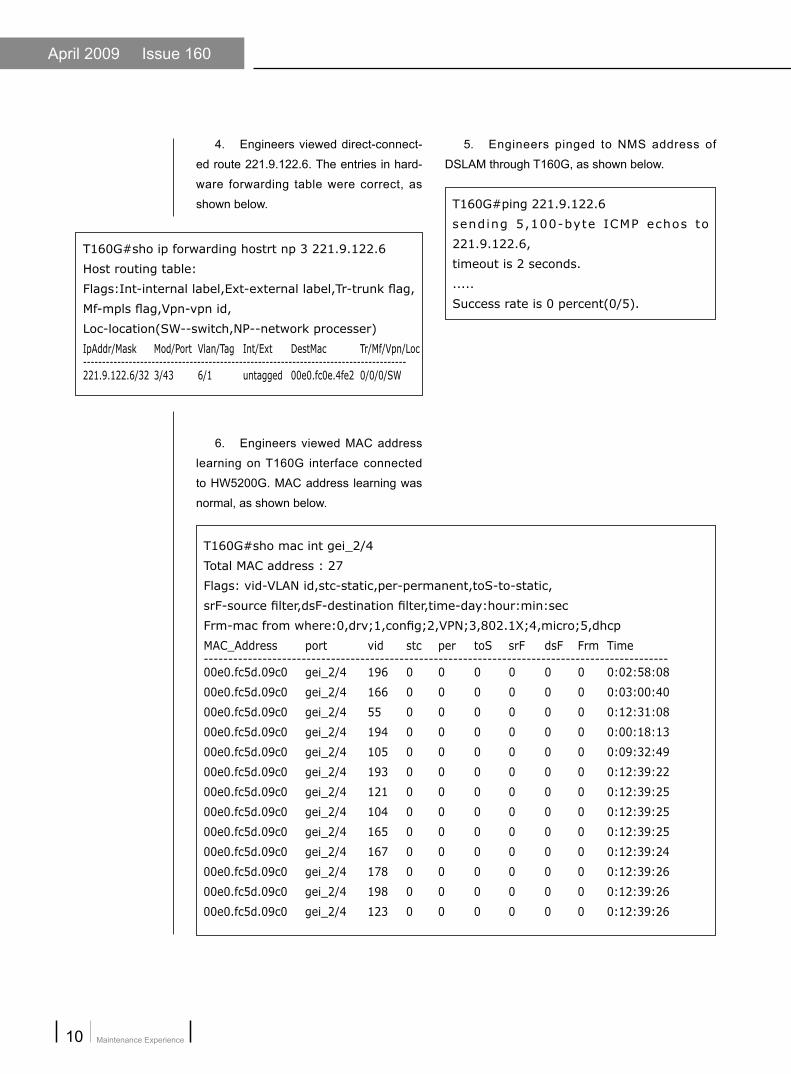
4. Engineers viewed direct-connect-
ed route 221.9.122.6. The entries in hard-
ware forwarding table were correct, as
shown below.
T160G#sho ip forwarding hostrt np 3 221.9.122.6
Host routing table:
Flags:Int-internal label,Ext-external label,Tr-trunk flag,
Mf-mpls flag,Vpn-vpn id,
Loc-location(SW--switch,NP--network processer)
IpAddr/Mask Mod/Port Vlan/Tag Int/Ext DestMac Tr/Mf/Vpn/Loc-------------------------------------------------------------------------------------221.9.122.6/32 3/43 6/1 untagged 00e0.fc0e.4fe2 0/0/0/SW
5. Engineers pinged to NMS address of
DSLAM through T160G, as shown below.
T160G#ping 221.9.122.6
sending 5,100-byte ICMP echos to
221.9.122.6,
timeout is 2 seconds.
.....
Success rate is 0 percent(0/5).
T160G#sho mac int gei_2/4
Total MAC address : 27
Flags: vid-VLAN id,stc-static,per-permanent,toS-to-static,
srF-source filter,dsF-destination filter,time-day:hour:min:sec
Frm-mac from where:0,drv;1,config;2,VPN;3,802.1X;4,micro;5,dhcp
MAC_Address port vid stc per toS srF dsF Frm Time-----------------------------------------------------------------------------------------------00e0.fc5d.09c0 gei_2/4 196 0 0 0 0 0 0 0:02:58:08
00e0.fc5d.09c0 gei_2/4 166 0 0 0 0 0 0 0:03:00:40
00e0.fc5d.09c0 gei_2/4 55 0 0 0 0 0 0 0:12:31:08
00e0.fc5d.09c0 gei_2/4 194 0 0 0 0 0 0 0:00:18:13
00e0.fc5d.09c0 gei_2/4 105 0 0 0 0 0 0 0:09:32:49
00e0.fc5d.09c0 gei_2/4 193 0 0 0 0 0 0 0:12:39:22
00e0.fc5d.09c0 gei_2/4 121 0 0 0 0 0 0 0:12:39:25
00e0.fc5d.09c0 gei_2/4 104 0 0 0 0 0 0 0:12:39:25
00e0.fc5d.09c0 gei_2/4 165 0 0 0 0 0 0 0:12:39:25
00e0.fc5d.09c0 gei_2/4 167 0 0 0 0 0 0 0:12:39:24
00e0.fc5d.09c0 gei_2/4 178 0 0 0 0 0 0 0:12:39:26
00e0.fc5d.09c0 gei_2/4 198 0 0 0 0 0 0 0:12:39:26
00e0.fc5d.09c0 gei_2/4 123 0 0 0 0 0 0 0:12:39:26
6. Engineers viewed MAC address
learning on T160G interface connected
to HW5200G. MAC address learning was
normal, as shown below.
Data Products
www.zte.com.cn
11
The above fault information showed that MAC
address learning on T160G was normal and few
forwarding entries and ARP learning were also
correct. While after upgrade, services and NMSs
of the other DSLAM devices were normal. This
indicated that it was not the problem of T160G.
After the upgrade, fault occurred and the difference
before and after upgrade was that MAC address of
T160G offsets for one bit. It was supposed that IP
address and MAC address of T160G were bound
in DSLAM.
SolutionEngineers checked configuration of DSLAM.
They found that MAC binding was not set and the
learnt MAC address was the old MAC ad-
dress of T160G. Due to software problem,
MAC learning and address aging func-
tion of DSLAM got invalid. After rebooting
DSLAM, services ran normally.
Experience SummaryAfter upgrade, MAC address of T160G
changed and the faulty DSLAM happened
to have problem in MAC learning (MAC
address aging function and MAC learn-
ing got invalid), which brought interruption
of services. After engineers reboot the
DSLAM, MAC address learning function
restored and services ran normally. ■
Maintenance Experience12
April 2009 Issue 160
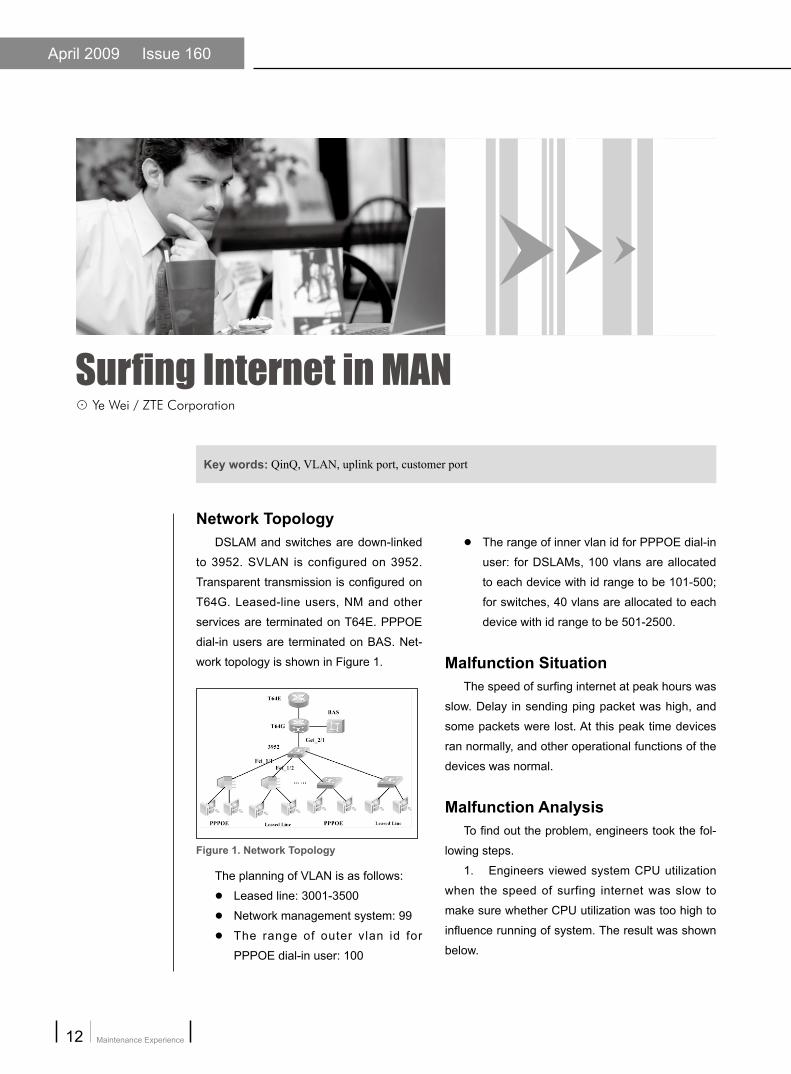
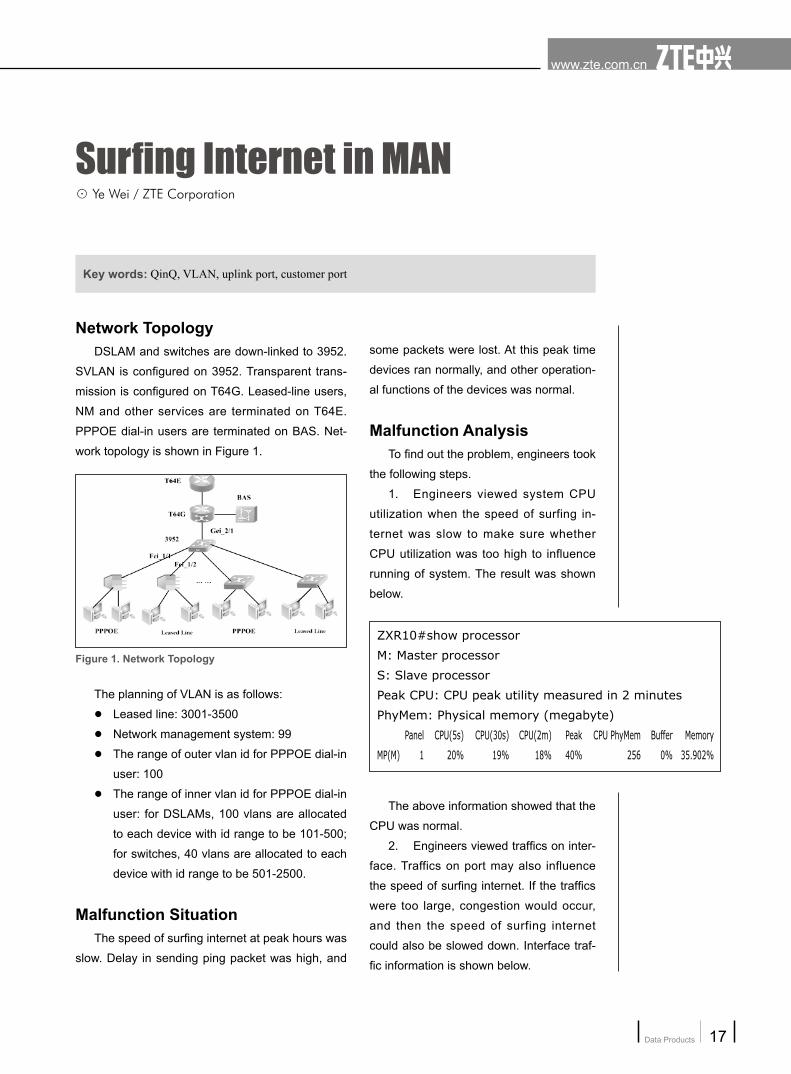
Network TopologyDSLAM and switches are down-linked
to 3952. SVLAN is configured on 3952.
Transparent transmission is configured on
T64G. Leased-line users, NM and other
services are terminated on T64E. PPPOE
dial-in users are terminated on BAS. Net-
work topology is shown in Figure 1.
Surfing Internet in MAN⊙ Ye Wei / ZTE Corporation
The range of inner vlan id for PPPOE dial-in
user: for DSLAMs, 100 vlans are allocated
to each device with id range to be 101-500;
for switches, 40 vlans are allocated to each
device with id range to be 501-2500.
Malfunction SituationThe speed of surfing internet at peak hours was
slow. Delay in sending ping packet was high, and
some packets were lost. At this peak time devices
ran normally, and other operational functions of the
devices was normal.
Malfunction AnalysisTo find out the problem, engineers took the fol-
lowing steps.
1. Engineers viewed system CPU utilization
when the speed of surfing internet was slow to
make sure whether CPU utilization was too high to
influence running of system. The result was shown
below.
Figure 1. Network Topology
The planning of VLAN is as follows:
Leased line: 3001-3500
Network management system: 99
The range of outer vlan id for
PPPOE dial-in user: 100
Key words: QinQ, VLAN, uplink port, customer port
Data Products
www.zte.com.cn
13
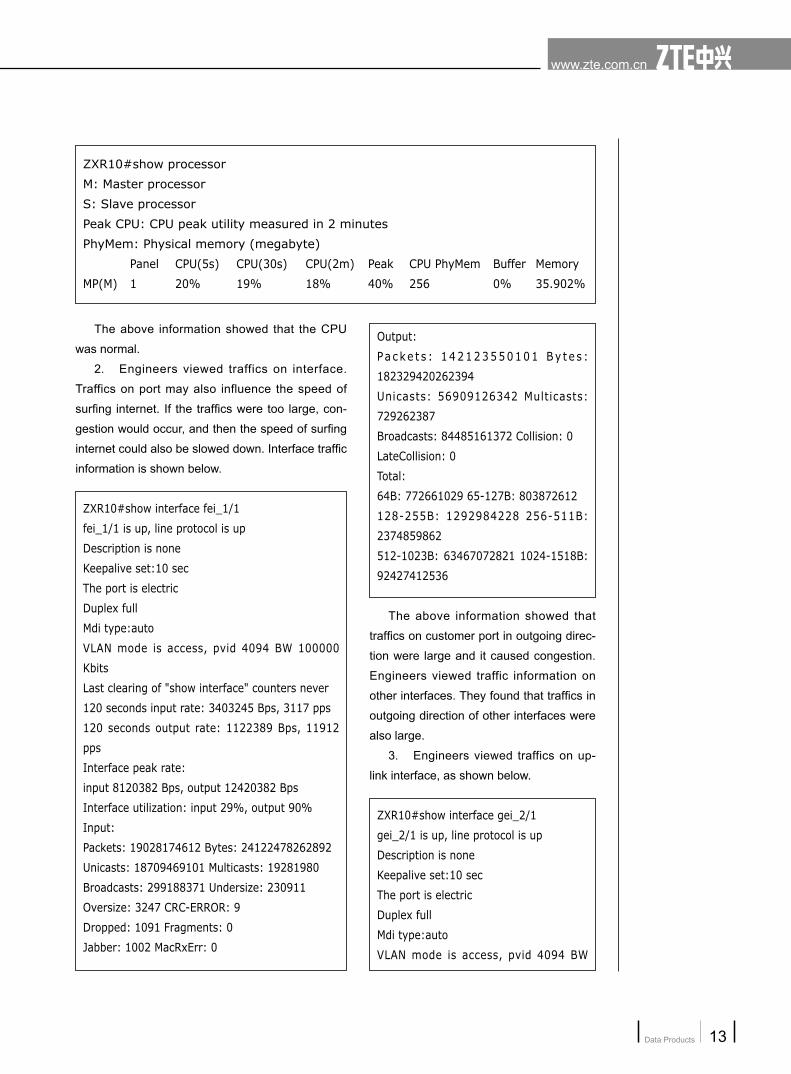
The above information showed that the CPU
was normal.
2. Engineers viewed traffics on interface.
Traffics on port may also influence the speed of
surfing internet. If the traffics were too large, con-
gestion would occur, and then the speed of surfing
internet could also be slowed down. Interface traffic
information is shown below.
ZXR10#show interface fei_1/1
fei_1/1 is up, line protocol is up
Description is none
Keepalive set:10 sec
The port is electric
Duplex full
Mdi type:auto
VLAN mode is access, pvid 4094 BW 100000
Kbits
Last clearing of "show interface" counters never
120 seconds input rate: 3403245 Bps, 3117 pps
120 seconds output rate: 1122389 Bps, 11912
pps
Interface peak rate:
input 8120382 Bps, output 12420382 Bps
Interface utilization: input 29%, output 90%
Input:
Packets: 19028174612 Bytes: 24122478262892
Unicasts: 18709469101 Multicasts: 19281980
Broadcasts: 299188371 Undersize: 230911
Oversize: 3247 CRC-ERROR: 9
Dropped: 1091 Fragments: 0
Jabber: 1002 MacRxErr: 0
Output:
Pa c ke t s : 142123550101 By t e s :
182329420262394
Unicasts: 56909126342 Multicasts:
729262387
Broadcasts: 84485161372 Collision: 0
LateCollision: 0
Total:
64B: 772661029 65-127B: 803872612
128-255B: 1292984228 256-511B:
2374859862
512-1023B: 63467072821 1024-1518B:
92427412536
The above information showed that
traffics on customer port in outgoing direc-
tion were large and it caused congestion.
Engineers viewed traffic information on
other interfaces. They found that traffics in
outgoing direction of other interfaces were
also large.
3. Engineers viewed traffics on up-
link interface, as shown below.
ZXR10#show interface gei_2/1
gei_2/1 is up, line protocol is up
Description is none
Keepalive set:10 sec
The port is electric
Duplex full
Mdi type:auto
VLAN mode is access, pvid 4094 BW
ZXR10#show processor
M: Master processor
S: Slave processor
Peak CPU: CPU peak utility measured in 2 minutes
PhyMem: Physical memory (megabyte)
Panel CPU(5s) CPU(30s) CPU(2m) Peak CPU PhyMem Buffer Memory
MP(M) 1 20% 19% 18% 40% 256 0% 35.902%
Maintenance Experience14
April 2009 Issue 160
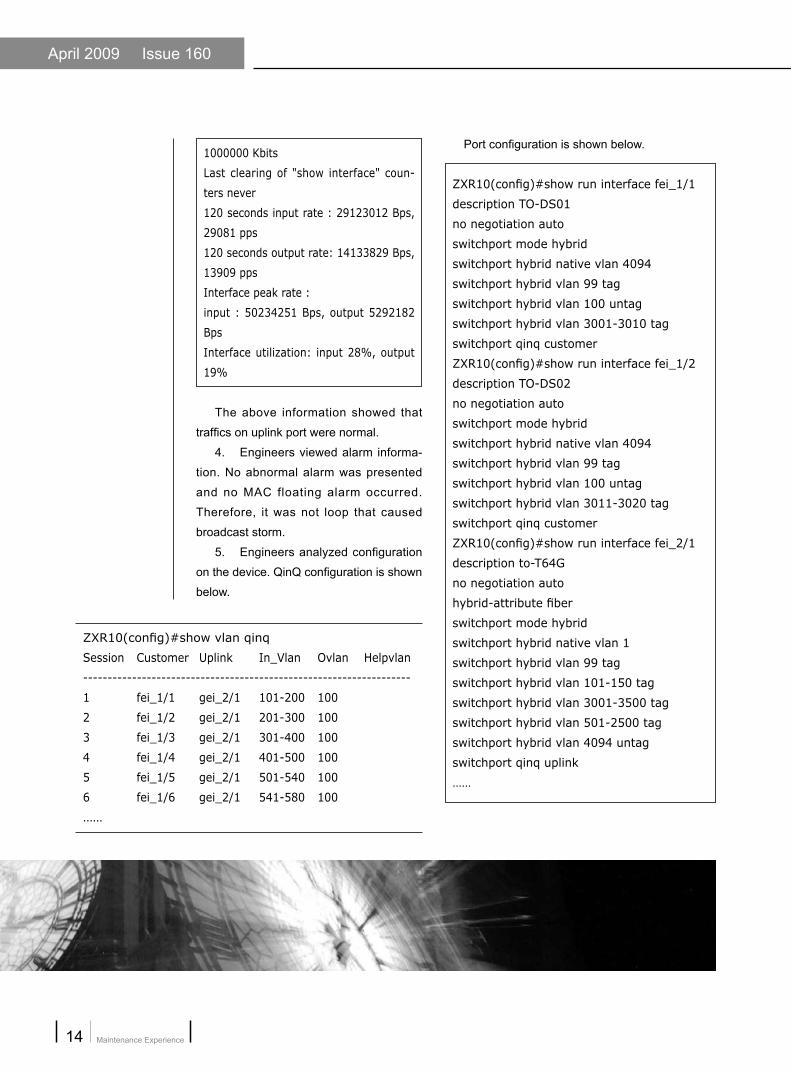
1000000 Kbits
Last clearing of "show interface" coun-
ters never
120 seconds input rate : 29123012 Bps,
29081 pps
120 seconds output rate: 14133829 Bps,
13909 pps
Interface peak rate :
input : 50234251 Bps, output 5292182
Bps
Interface utilization: input 28%, output
19%
The above information showed that
traffics on uplink port were normal.
4. Engineers viewed alarm informa-
tion. No abnormal alarm was presented
and no MAC floating alarm occurred.
Therefore, it was not loop that caused
broadcast storm.
5. Engineers analyzed configuration
on the device. QinQ configuration is shown
below.
Port configuration is shown below.
ZXR10(config)#show run interface fei_1/1
description TO-DS01
no negotiation auto
switchport mode hybrid
switchport hybrid native vlan 4094
switchport hybrid vlan 99 tag
switchport hybrid vlan 100 untag
switchport hybrid vlan 3001-3010 tag
switchport qinq customer
ZXR10(config)#show run interface fei_1/2
description TO-DS02
no negotiation auto
switchport mode hybrid
switchport hybrid native vlan 4094
switchport hybrid vlan 99 tag
switchport hybrid vlan 100 untag
switchport hybrid vlan 3011-3020 tag
switchport qinq customer
ZXR10(config)#show run interface fei_2/1
description to-T64G
no negotiation auto
hybrid-attribute fiber
switchport mode hybrid
switchport hybrid native vlan 1
switchport hybrid vlan 99 tag
switchport hybrid vlan 101-150 tag
switchport hybrid vlan 3001-3500 tag
switchport hybrid vlan 501-2500 tag
switchport hybrid vlan 4094 untag
switchport qinq uplink
……
ZXR10(config)#show vlan qinq
Session Customer Uplink In_Vlan Ovlan Helpvlan
-------------------------------------------------------------------
1 fei_1/1 gei_2/1 101-200 100
2 fei_1/2 gei_2/1 201-300 100
3 fei_1/3 gei_2/1 301-400 100
4 fei_1/4 gei_2/1 401-500 100
5 fei_1/5 gei_2/1 501-540 100
6 fei_1/6 gei_2/1 541-580 100
……
Data Products
www.zte.com.cn
15
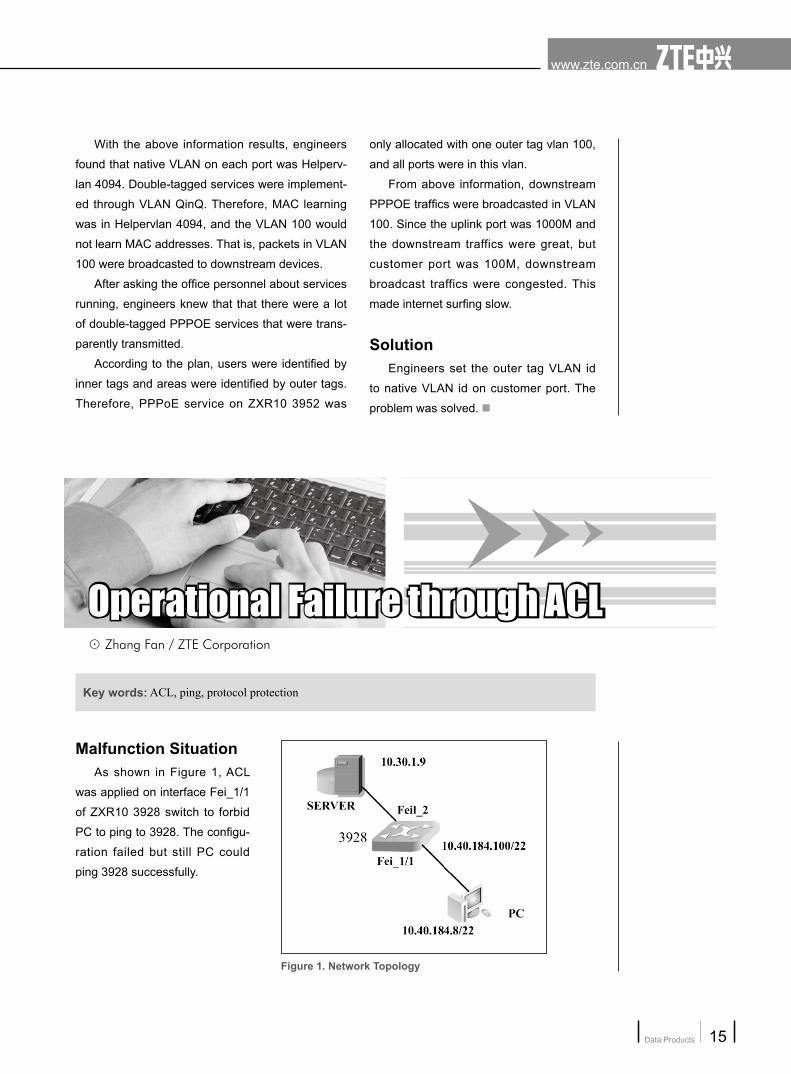
Malfunction SituationAs shown in Figure 1, ACL
was applied on interface Fei_1/1
of ZXR10 3928 switch to forbid
PC to ping to 3928. The configu-
ration failed but still PC could
ping 3928 successfully.
With the above information results, engineers
found that native VLAN on each port was Helperv-
lan 4094. Double-tagged services were implement-
ed through VLAN QinQ. Therefore, MAC learning
was in Helpervlan 4094, and the VLAN 100 would
not learn MAC addresses. That is, packets in VLAN
100 were broadcasted to downstream devices.
After asking the office personnel about services
running, engineers knew that that there were a lot
of double-tagged PPPOE services that were trans-
parently transmitted.
According to the plan, users were identified by
inner tags and areas were identified by outer tags.
Therefore, PPPoE service on ZXR10 3952 was
only allocated with one outer tag vlan 100,
and all ports were in this vlan.
From above information, downstream
PPPOE traffics were broadcasted in VLAN
100. Since the uplink port was 1000M and
the downstream traffics were great, but
customer port was 100M, downstream
broadcast traffics were congested. This
made internet surfing slow.
SolutionEngineers set the outer tag VLAN id
to native VLAN id on customer port. The
problem was solved. ■
Figure 1. Network Topology
Key words: ACL, ping, protocol protection
Operational Failure through ACLOperational Failure through ACL⊙ Zhang Fan / ZTE Corporation
Maintenance Experience16
April 2009 Issue 160
Malfunction AnalysisEngineers checked configuration of
ZXR10 3928 switch, as shown below.
acl extend number 101
rule 1 deny icmp 10.40.184.0 0.0.3.255
any
rule 2 permit ip any any
!
int fei_1/1
protpcol-protect mode icmp disable
switchport access vlan 1
ip access-group 101 0 in
The command to apply ACL is shown
below:
ip access-group <acl-number> <pro-
file-number> inIn this command, parameter<profile-
number> is required. The value is 0 or 1.
0 indicates that protocol protection is en-
abled and 1 indicates protocol protection
is disabled. Protocol protection is enabled
by default on interface, that is, the default
value of <profile-number> is 0.
After protocol protection function was
enabled, switch improved priority of ICMP
packets through a set of special rules.
These rules were placed ahead of ACL.
ICMP was in protocol protection range.
Protocol protected packet had a higher pri-
ority than ACL. As the value of parameter
<profile-number> on ZXR10 3928 switch was 0 by
default, the command of disabling ICMP became
invalid. As a result, PC could still ping to ZXR10
3928 switch successfully.
SolutionEngineers modified the configuration of ZXR10
3928 switch, as shown below.
acl extend number 101
rule 1 deny icmp 10.40.184.0 0.0.3.255 any
rule 2 permit ip any any
!
int fei_1/1
protpcol-protect mode icmp disable
switchport access vlan 1
ip access-group 101 1 in //Set the value of pa-
rameter profile-number to 1, that is, protocol-
protect is disabled
Experience SummaryFor downlink interface where SVLAN is en-
abled, the value of parameter <profile-number>
must be 1. When protocol protection is enabled,
the value of parameter <profile-number> must be 0.
When a switch is used as L2 device, then value
of parameter<profile-number> is allowed to be 1.
However, in this situation, some control packets
will fail to be received on the interface and some
protocol calculations will be wrong. Therefore, set
the value of parameter <profile-number> to 0. ■
Data Products
www.zte.com.cn
17
Network TopologyDSLAM and switches are down-linked to 3952.
SVLAN is configured on 3952. Transparent trans-
mission is configured on T64G. Leased-line users,
NM and other services are terminated on T64E.
PPPOE dial-in users are terminated on BAS. Net-
work topology is shown in Figure 1.
Surfing Internet in MAN⊙ Ye Wei / ZTE Corporation
some packets were lost. At this peak time
devices ran normally, and other operation-
al functions of the devices was normal.
Malfunction AnalysisTo find out the problem, engineers took
the following steps.
1. Engineers viewed system CPU
utilization when the speed of surfing in-
ternet was slow to make sure whether
CPU utilization was too high to influence
running of system. The result was shown
below.
Figure 1. Network Topology
ZXR10#show processor
M: Master processor
S: Slave processor
Peak CPU: CPU peak utility measured in 2 minutes
PhyMem: Physical memory (megabyte)
Panel CPU(5s) CPU(30s) CPU(2m) Peak CPU PhyMem Buffer Memory
MP(M) 1 20% 19% 18% 40% 256 0% 35.902%
The above information showed that the
CPU was normal.
2. Engineers viewed traffics on inter-
face. Traffics on port may also influence
the speed of surfing internet. If the traffics
were too large, congestion would occur,
and then the speed of surfing internet
could also be slowed down. Interface traf-
fic information is shown below.
The planning of VLAN is as follows:
Leased line: 3001-3500
Network management system: 99
The range of outer vlan id for PPPOE dial-in
user: 100
The range of inner vlan id for PPPOE dial-in
user: for DSLAMs, 100 vlans are allocated
to each device with id range to be 101-500;
for switches, 40 vlans are allocated to each
device with id range to be 501-2500.
Malfunction SituationThe speed of surfing internet at peak hours was
slow. Delay in sending ping packet was high, and
Key words: QinQ, VLAN, uplink port, customer port
Maintenance Experience18
April 2009 Issue 160
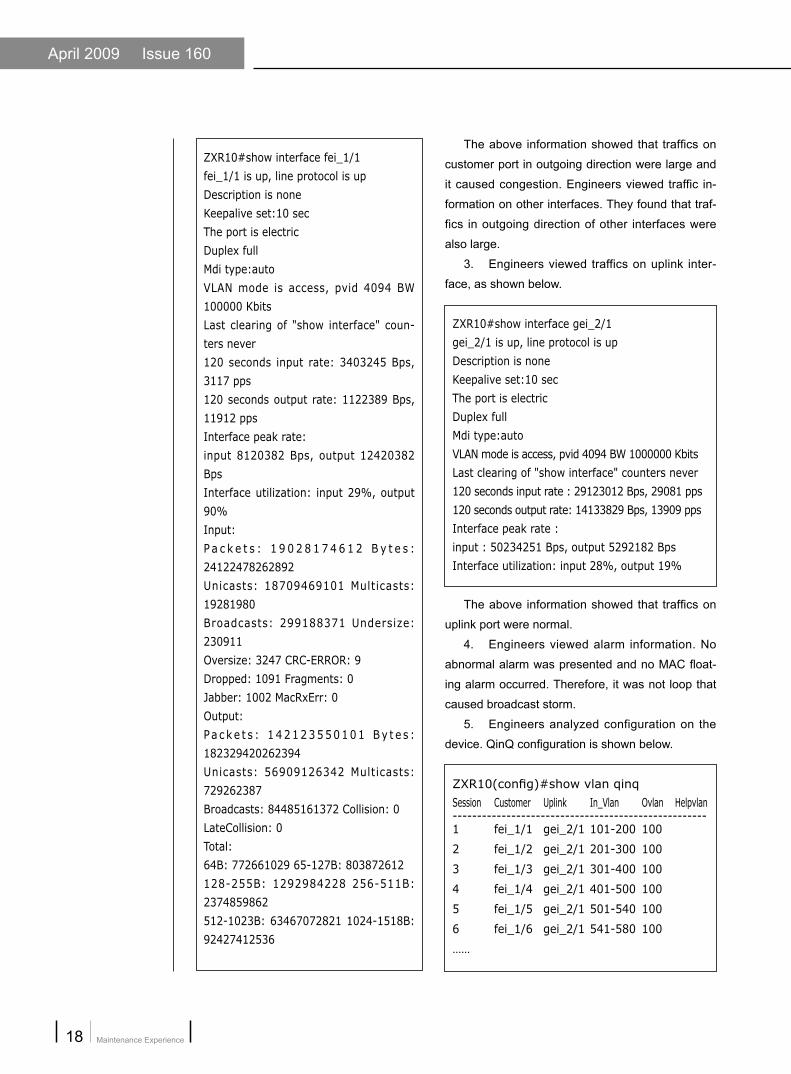
ZXR10#show interface fei_1/1
fei_1/1 is up, line protocol is up
Description is none
Keepalive set:10 sec
The port is electric
Duplex full
Mdi type:auto
VLAN mode is access, pvid 4094 BW
100000 Kbits
Last clearing of "show interface" coun-
ters never
120 seconds input rate: 3403245 Bps,
3117 pps
120 seconds output rate: 1122389 Bps,
11912 pps
Interface peak rate:
input 8120382 Bps, output 12420382
Bps
Interface utilization: input 29%, output
90%
Input:
P a c k e t s : 1 9 0 2 8 1 7 4 6 1 2 B y t e s :
24122478262892
Unicasts: 18709469101 Multicasts:
19281980
Broadcasts: 299188371 Undersize:
230911
Oversize: 3247 CRC-ERROR: 9
Dropped: 1091 Fragments: 0
Jabber: 1002 MacRxErr: 0
Output:
Pa c ke t s : 142123550101 By t e s :
182329420262394
Unicasts: 56909126342 Multicasts:
729262387
Broadcasts: 84485161372 Collision: 0
LateCollision: 0
Total:
64B: 772661029 65-127B: 803872612
128-255B: 1292984228 256-511B:
2374859862
512-1023B: 63467072821 1024-1518B:
92427412536
The above information showed that traffics on
customer port in outgoing direction were large and
it caused congestion. Engineers viewed traffic in-
formation on other interfaces. They found that traf-
fics in outgoing direction of other interfaces were
also large.
3. Engineers viewed traffics on uplink inter-
face, as shown below.
ZXR10#show interface gei_2/1
gei_2/1 is up, line protocol is up
Description is none
Keepalive set:10 sec
The port is electric
Duplex full
Mdi type:auto
VLAN mode is access, pvid 4094 BW 1000000 Kbits
Last clearing of "show interface" counters never
120 seconds input rate : 29123012 Bps, 29081 pps
120 seconds output rate: 14133829 Bps, 13909 pps
Interface peak rate :
input : 50234251 Bps, output 5292182 Bps
Interface utilization: input 28%, output 19%
The above information showed that traffics on
uplink port were normal.
4. Engineers viewed alarm information. No
abnormal alarm was presented and no MAC float-
ing alarm occurred. Therefore, it was not loop that
caused broadcast storm.
5. Engineers analyzed configuration on the
device. QinQ configuration is shown below.
ZXR10(config)#show vlan qinq
Session Customer Uplink In_Vlan Ovlan Helpvlan----------------------------------------------------1 fei_1/1 gei_2/1 101-200 100
2 fei_1/2 gei_2/1 201-300 100
3 fei_1/3 gei_2/1 301-400 100
4 fei_1/4 gei_2/1 401-500 100
5 fei_1/5 gei_2/1 501-540 100
6 fei_1/6 gei_2/1 541-580 100
……
Data Products
www.zte.com.cn
19
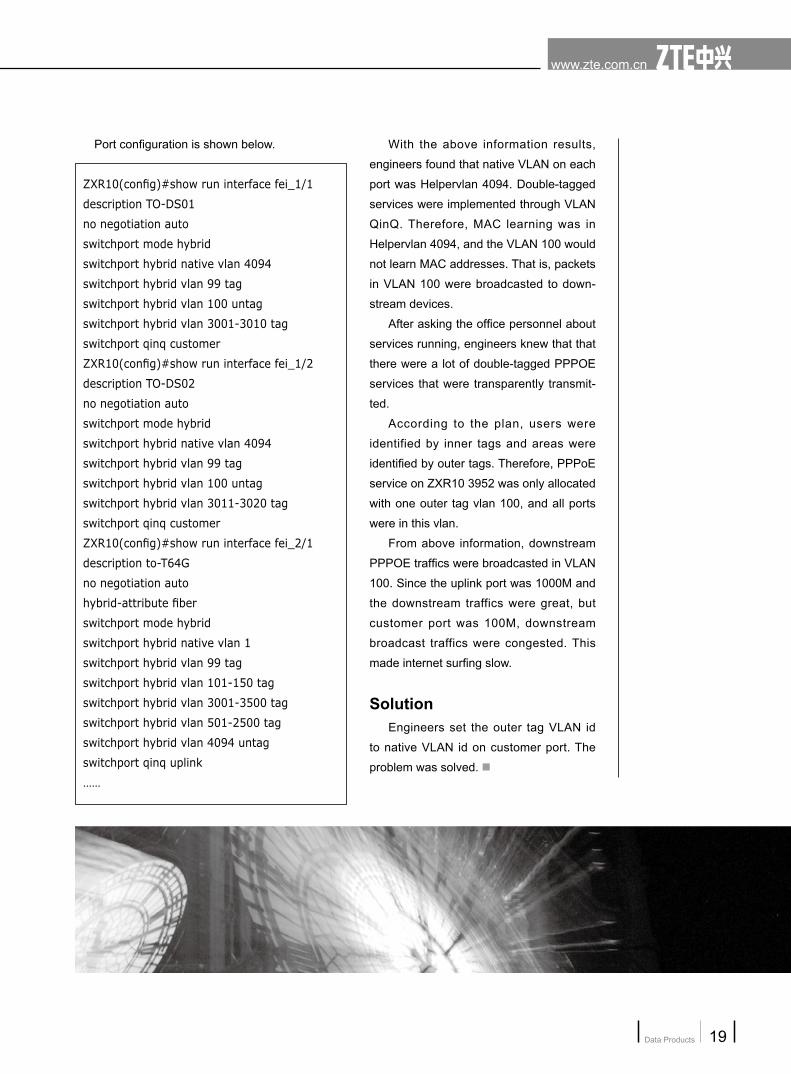
Port configuration is shown below.
ZXR10(config)#show run interface fei_1/1
description TO-DS01
no negotiation auto
switchport mode hybrid
switchport hybrid native vlan 4094
switchport hybrid vlan 99 tag
switchport hybrid vlan 100 untag
switchport hybrid vlan 3001-3010 tag
switchport qinq customer
ZXR10(config)#show run interface fei_1/2
description TO-DS02
no negotiation auto
switchport mode hybrid
switchport hybrid native vlan 4094
switchport hybrid vlan 99 tag
switchport hybrid vlan 100 untag
switchport hybrid vlan 3011-3020 tag
switchport qinq customer
ZXR10(config)#show run interface fei_2/1
description to-T64G
no negotiation auto
hybrid-attribute fiber
switchport mode hybrid
switchport hybrid native vlan 1
switchport hybrid vlan 99 tag
switchport hybrid vlan 101-150 tag
switchport hybrid vlan 3001-3500 tag
switchport hybrid vlan 501-2500 tag
switchport hybrid vlan 4094 untag
switchport qinq uplink
……
With the above information results,
engineers found that native VLAN on each
port was Helpervlan 4094. Double-tagged
services were implemented through VLAN
QinQ. Therefore, MAC learning was in
Helpervlan 4094, and the VLAN 100 would
not learn MAC addresses. That is, packets
in VLAN 100 were broadcasted to down-
stream devices.
After asking the office personnel about
services running, engineers knew that that
there were a lot of double-tagged PPPOE
services that were transparently transmit-
ted.
According to the plan, users were
identified by inner tags and areas were
identified by outer tags. Therefore, PPPoE
service on ZXR10 3952 was only allocated
with one outer tag vlan 100, and all ports
were in this vlan.
From above information, downstream
PPPOE traffics were broadcasted in VLAN
100. Since the uplink port was 1000M and
the downstream traffics were great, but
customer port was 100M, downstream
broadcast traffics were congested. This
made internet surfing slow.
SolutionEngineers set the outer tag VLAN id
to native VLAN id on customer port. The
problem was solved. ■
Maintenance Experience20
April 2009 Issue 160
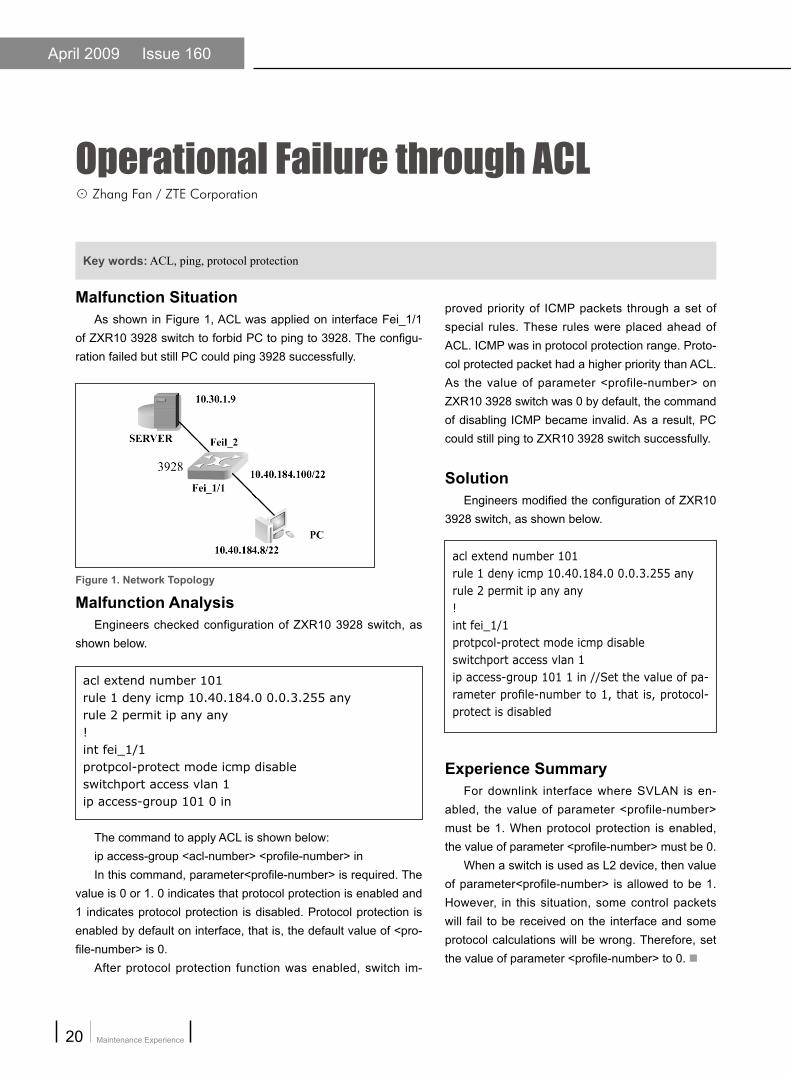
Malfunction SituationAs shown in Figure 1, ACL was applied on interface Fei_1/1
of ZXR10 3928 switch to forbid PC to ping to 3928. The configu-ration failed but still PC could ping 3928 successfully.
proved priority of ICMP packets through a set of special rules. These rules were placed ahead of ACL. ICMP was in protocol protection range. Proto-col protected packet had a higher priority than ACL. As the value of parameter <profile-number> on ZXR10 3928 switch was 0 by default, the command of disabling ICMP became invalid. As a result, PC could still ping to ZXR10 3928 switch successfully.
SolutionEngineers modified the configuration of ZXR10
3928 switch, as shown below.
acl extend number 101rule 1 deny icmp 10.40.184.0 0.0.3.255 anyrule 2 permit ip any any!int fei_1/1protpcol-protect mode icmp disableswitchport access vlan 1ip access-group 101 1 in //Set the value of pa-rameter profile-number to 1, that is, protocol-protect is disabled
Experience SummaryFor downlink interface where SVLAN is en-
abled, the value of parameter <profile-number> must be 1. When protocol protection is enabled, the value of parameter <profile-number> must be 0.
When a switch is used as L2 device, then value of parameter<profile-number> is allowed to be 1. However, in this situation, some control packets will fail to be received on the interface and some protocol calculations will be wrong. Therefore, set the value of parameter <profile-number> to 0. ■
Operational Failure through ACL⊙ Zhang Fan / ZTE Corporation
Figure 1. Network Topology
Malfunction AnalysisEngineers checked configuration of ZXR10 3928 switch, as
shown below.
acl extend number 101rule 1 deny icmp 10.40.184.0 0.0.3.255 anyrule 2 permit ip any any!int fei_1/1protpcol-protect mode icmp disableswitchport access vlan 1ip access-group 101 0 in
The command to apply ACL is shown below:ip access-group <acl-number> <profile-number> inIn this command, parameter<profile-number> is required. The
value is 0 or 1. 0 indicates that protocol protection is enabled and 1 indicates protocol protection is disabled. Protocol protection is enabled by default on interface, that is, the default value of <pro-file-number> is 0.
After protocol protection function was enabled, switch im-
Key words: ACL, ping, protocol protection
Data Products
www.zte.com.cn
21
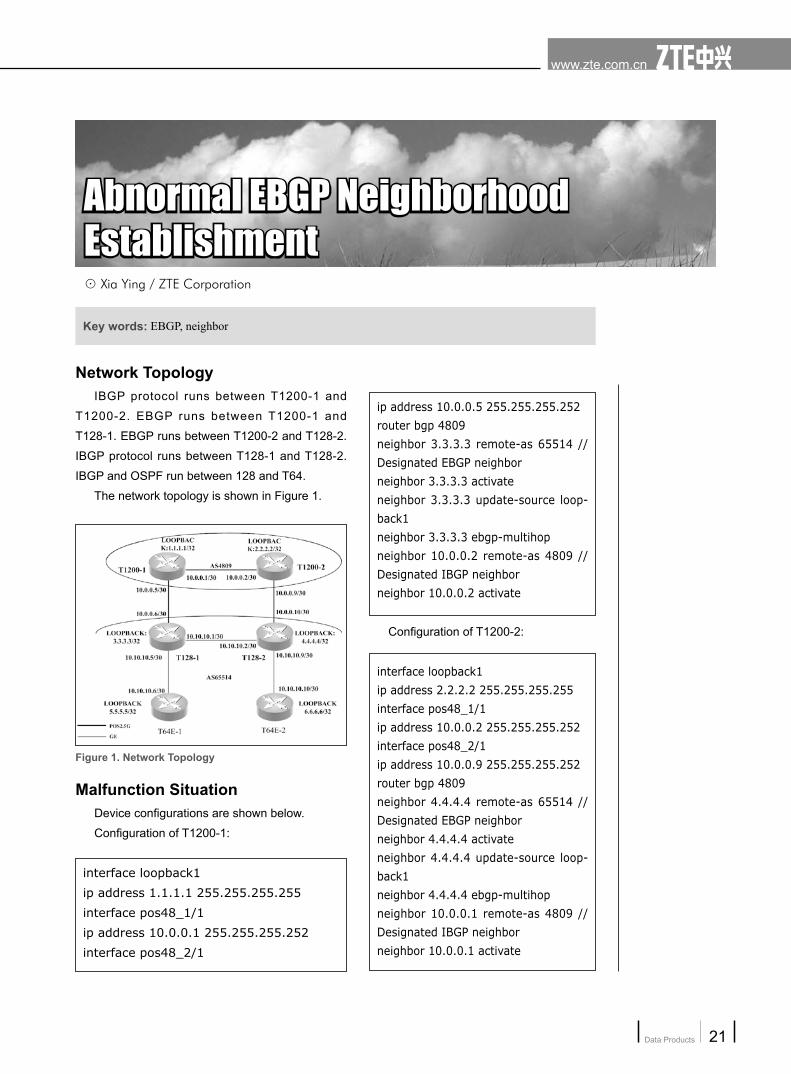
Network TopologyIBGP protocol runs between T1200-1 and
T1200-2. EBGP runs between T1200-1 and
T128-1. EBGP runs between T1200-2 and T128-2.
IBGP protocol runs between T128-1 and T128-2.
IBGP and OSPF run between 128 and T64.
The network topology is shown in Figure 1.
ip address 10.0.0.5 255.255.255.252
router bgp 4809
neighbor 3.3.3.3 remote-as 65514 //
Designated EBGP neighbor
neighbor 3.3.3.3 activate
neighbor 3.3.3.3 update-source loop-
back1
neighbor 3.3.3.3 ebgp-multihop
neighbor 10.0.0.2 remote-as 4809 //
Designated IBGP neighbor
neighbor 10.0.0.2 activate
Configuration of T1200-2:
interface loopback1
ip address 2.2.2.2 255.255.255.255
interface pos48_1/1
ip address 10.0.0.2 255.255.255.252
interface pos48_2/1
ip address 10.0.0.9 255.255.255.252
router bgp 4809
neighbor 4.4.4.4 remote-as 65514 //
Designated EBGP neighbor
neighbor 4.4.4.4 activate
neighbor 4.4.4.4 update-source loop-
back1
neighbor 4.4.4.4 ebgp-multihop
neighbor 10.0.0.1 remote-as 4809 //
Designated IBGP neighbor
neighbor 10.0.0.1 activate
Figure 1. Network Topology
Malfunction SituationDevice configurations are shown below.
Configuration of T1200-1:
interface loopback1
ip address 1.1.1.1 255.255.255.255
interface pos48_1/1
ip address 10.0.0.1 255.255.255.252
interface pos48_2/1
Key words: EBGP, neighbor
Abnormal EBGP Neighborhood EstablishmentAbnormal EBGP Neighborhood Establishment⊙ Xia Ying / ZTE Corporation
Maintenance Experience22
April 2009 Issue 160
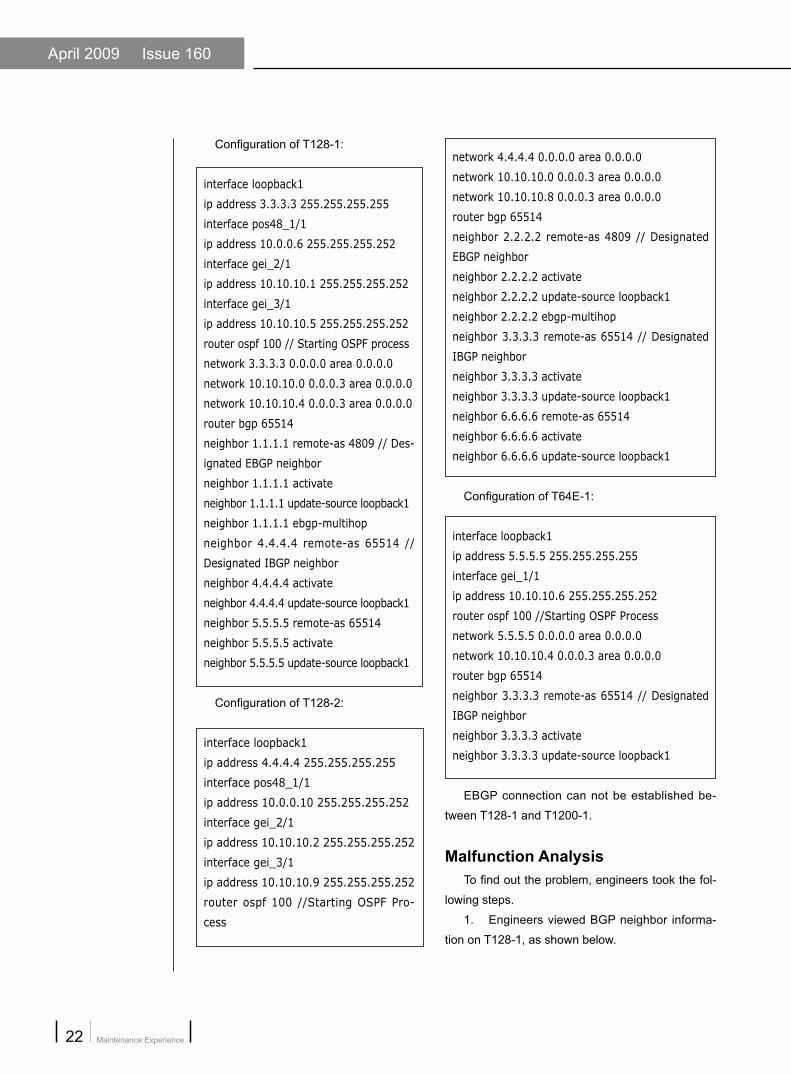
Configuration of T128-1:
interface loopback1
ip address 3.3.3.3 255.255.255.255
interface pos48_1/1
ip address 10.0.0.6 255.255.255.252
interface gei_2/1
ip address 10.10.10.1 255.255.255.252
interface gei_3/1
ip address 10.10.10.5 255.255.255.252
router ospf 100 // Starting OSPF process
network 3.3.3.3 0.0.0.0 area 0.0.0.0
network 10.10.10.0 0.0.0.3 area 0.0.0.0
network 10.10.10.4 0.0.0.3 area 0.0.0.0
router bgp 65514
neighbor 1.1.1.1 remote-as 4809 // Des-
ignated EBGP neighbor
neighbor 1.1.1.1 activate
neighbor 1.1.1.1 update-source loopback1
neighbor 1.1.1.1 ebgp-multihop
neighbor 4.4.4.4 remote-as 65514 //
Designated IBGP neighbor
neighbor 4.4.4.4 activate
neighbor 4.4.4.4 update-source loopback1
neighbor 5.5.5.5 remote-as 65514
neighbor 5.5.5.5 activate
neighbor 5.5.5.5 update-source loopback1
Configuration of T128-2:
interface loopback1
ip address 4.4.4.4 255.255.255.255
interface pos48_1/1
ip address 10.0.0.10 255.255.255.252
interface gei_2/1
ip address 10.10.10.2 255.255.255.252
interface gei_3/1
ip address 10.10.10.9 255.255.255.252
router ospf 100 //Starting OSPF Pro-
cess
network 4.4.4.4 0.0.0.0 area 0.0.0.0
network 10.10.10.0 0.0.0.3 area 0.0.0.0
network 10.10.10.8 0.0.0.3 area 0.0.0.0
router bgp 65514
neighbor 2.2.2.2 remote-as 4809 // Designated
EBGP neighbor
neighbor 2.2.2.2 activate
neighbor 2.2.2.2 update-source loopback1
neighbor 2.2.2.2 ebgp-multihop
neighbor 3.3.3.3 remote-as 65514 // Designated
IBGP neighbor
neighbor 3.3.3.3 activate
neighbor 3.3.3.3 update-source loopback1
neighbor 6.6.6.6 remote-as 65514
neighbor 6.6.6.6 activate
neighbor 6.6.6.6 update-source loopback1
Configuration of T64E-1:
interface loopback1
ip address 5.5.5.5 255.255.255.255
interface gei_1/1
ip address 10.10.10.6 255.255.255.252
router ospf 100 //Starting OSPF Process
network 5.5.5.5 0.0.0.0 area 0.0.0.0
network 10.10.10.4 0.0.0.3 area 0.0.0.0
router bgp 65514
neighbor 3.3.3.3 remote-as 65514 // Designated
IBGP neighbor
neighbor 3.3.3.3 activate
neighbor 3.3.3.3 update-source loopback1
EBGP connection can not be established be-
tween T128-1 and T1200-1.
Malfunction AnalysisTo find out the problem, engineers took the fol-
lowing steps.
1. Engineers viewed BGP neighbor informa-
tion on T128-1, as shown below.
Data Products
www.zte.com.cn
23
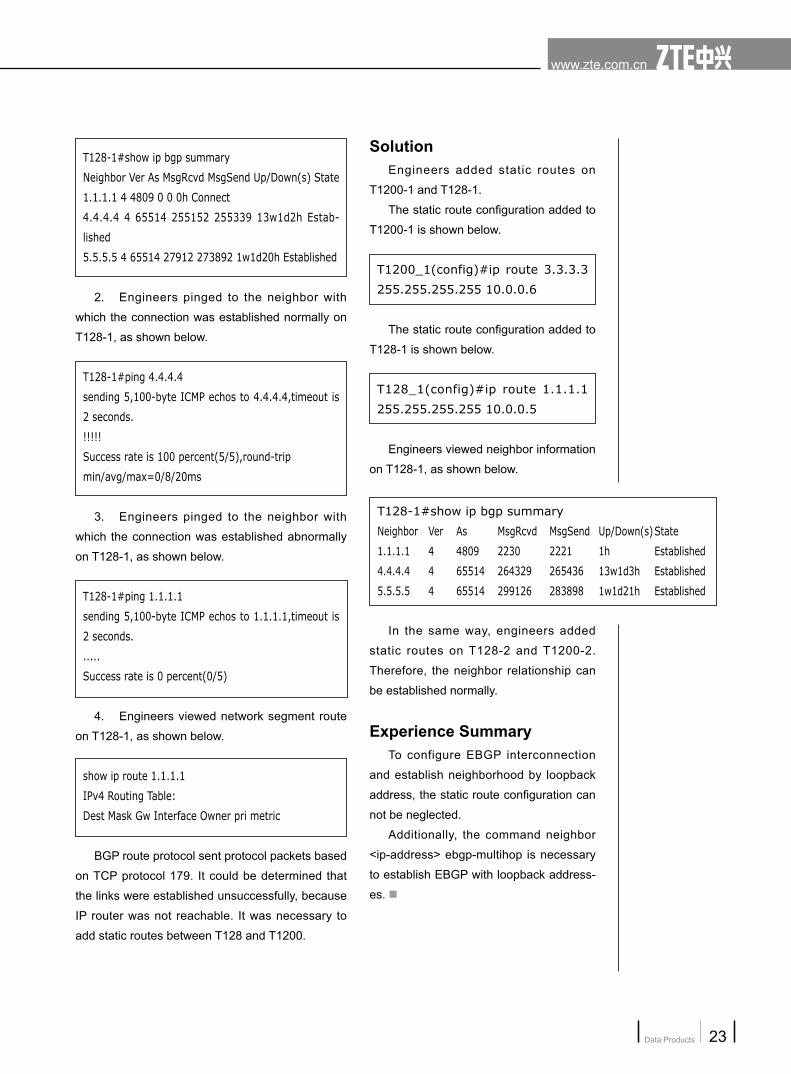
T128-1#show ip bgp summary
Neighbor Ver As MsgRcvd MsgSend Up/Down(s) State
1.1.1.1 4 4809 0 0 0h Connect
4.4.4.4 4 65514 255152 255339 13w1d2h Estab-
lished
5.5.5.5 4 65514 27912 273892 1w1d20h Established
2. Engineers pinged to the neighbor with
which the connection was established normally on
T128-1, as shown below.
T128-1#ping 4.4.4.4
sending 5,100-byte ICMP echos to 4.4.4.4,timeout is
2 seconds.
!!!!!
Success rate is 100 percent(5/5),round-trip
min/avg/max=0/8/20ms
3. Engineers pinged to the neighbor with
which the connection was established abnormally
on T128-1, as shown below.
T128-1#ping 1.1.1.1
sending 5,100-byte ICMP echos to 1.1.1.1,timeout is
2 seconds.
.....
Success rate is 0 percent(0/5)
4. Engineers viewed network segment route
on T128-1, as shown below.
show ip route 1.1.1.1
IPv4 Routing Table:
Dest Mask Gw Interface Owner pri metric
BGP route protocol sent protocol packets based
on TCP protocol 179. It could be determined that
the links were established unsuccessfully, because
IP router was not reachable. It was necessary to
add static routes between T128 and T1200.
SolutionEngineers added static routes on
T1200-1 and T128-1.
The static route configuration added to
T1200-1 is shown below.
T1200_1(config)#ip route 3.3.3.3
255.255.255.255 10.0.0.6
The static route configuration added to
T128-1 is shown below.
T128_1(config)#ip route 1.1.1.1
255.255.255.255 10.0.0.5
Engineers viewed neighbor information
on T128-1, as shown below.
In the same way, engineers added
static routes on T128-2 and T1200-2.
Therefore, the neighbor relationship can
be established normally.
Experience SummaryTo configure EBGP interconnection
and establish neighborhood by loopback
address, the static route configuration can
not be neglected.
Additionally, the command neighbor
<ip-address> ebgp-multihop is necessary
to establish EBGP with loopback address-
es. ■
T128-1#show ip bgp summary
Neighbor Ver As MsgRcvd MsgSend Up/Down(s) State
1.1.1.1 4 4809 2230 2221 1h Established
4.4.4.4 4 65514 264329 265436 13w1d3h Established
5.5.5.5 4 65514 299126 283898 1w1d21h Established
Maintenance Experience24
April 2009 Issue 160
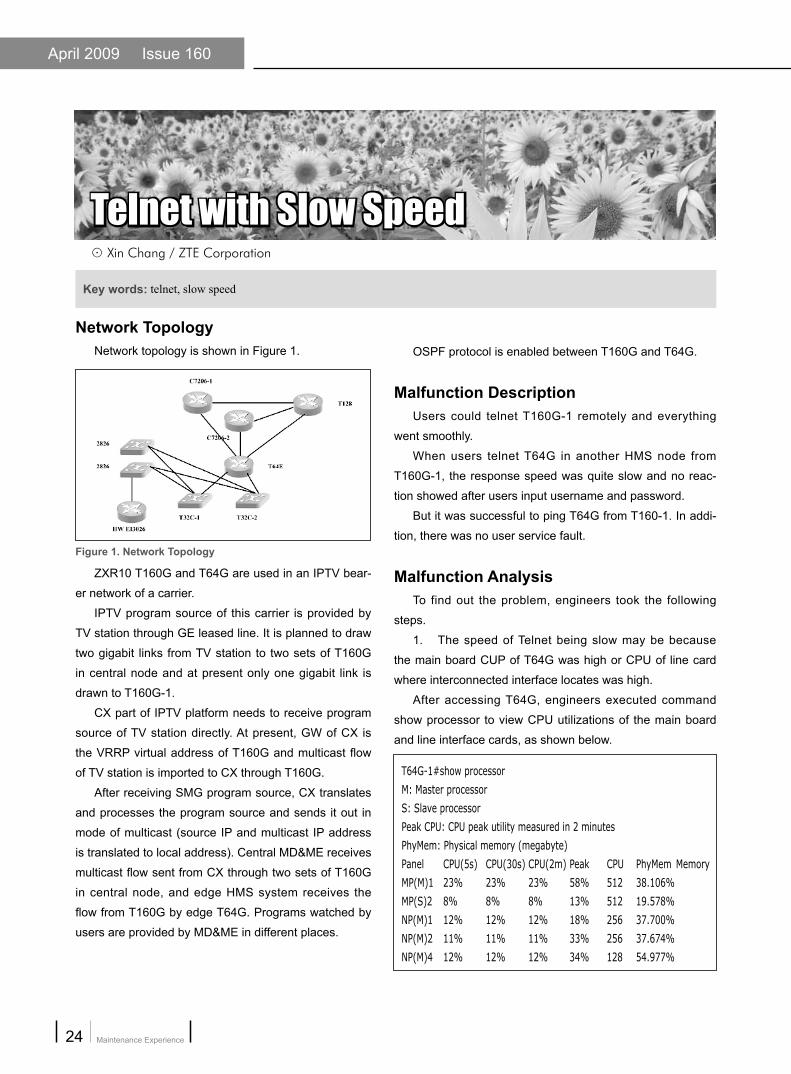
Network TopologyNetwork topology is shown in Figure 1. OSPF protocol is enabled between T160G and T64G.
Malfunction DescriptionUsers could telnet T160G-1 remotely and everything
went smoothly.
When users telnet T64G in another HMS node from
T160G-1, the response speed was quite slow and no reac-
tion showed after users input username and password.
But it was successful to ping T64G from T160-1. In addi-
tion, there was no user service fault.
Malfunction AnalysisTo find out the problem, engineers took the following
steps.
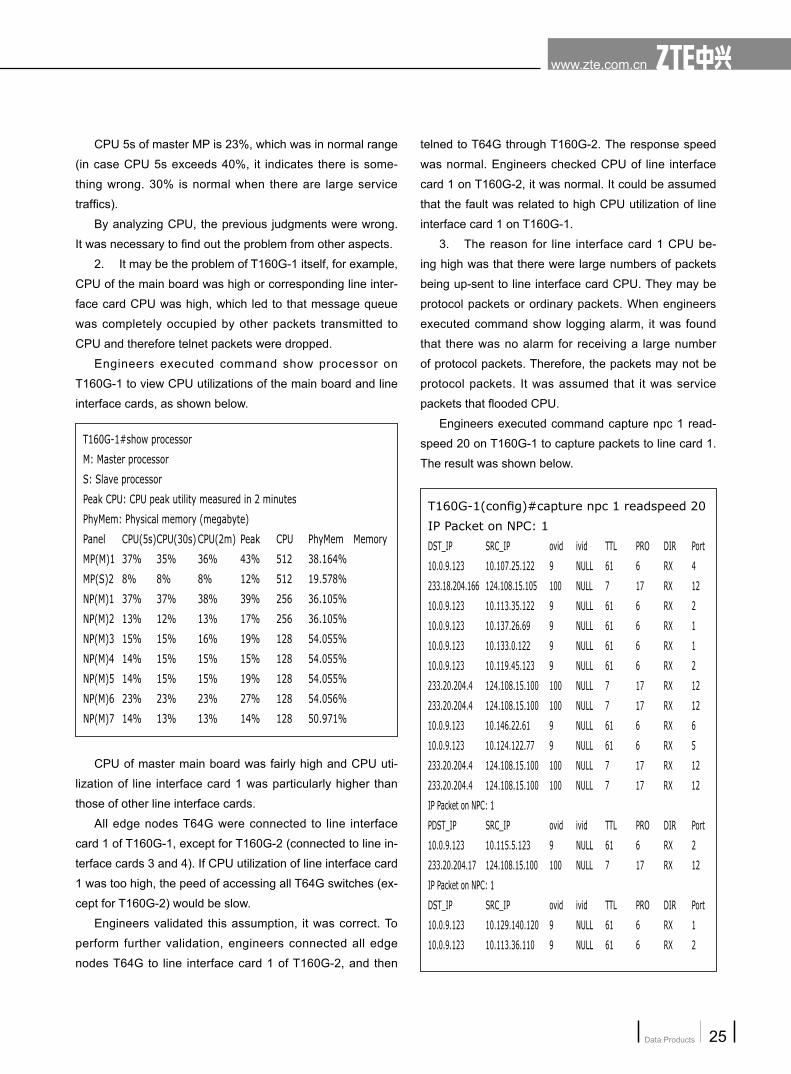
1. The speed of Telnet being slow may be because
the main board CUP of T64G was high or CPU of line card
where interconnected interface locates was high.
After accessing T64G, engineers executed command
show processor to view CPU utilizations of the main board
and line interface cards, as shown below.
Figure 1. Network Topology
ZXR10 T160G and T64G are used in an IPTV bear-
er network of a carrier.
IPTV program source of this carrier is provided by
TV station through GE leased line. It is planned to draw
two gigabit links from TV station to two sets of T160G
in central node and at present only one gigabit link is
drawn to T160G-1.
CX part of IPTV platform needs to receive program
source of TV station directly. At present, GW of CX is
the VRRP virtual address of T160G and multicast flow
of TV station is imported to CX through T160G.
After receiving SMG program source, CX translates
and processes the program source and sends it out in
mode of multicast (source IP and multicast IP address
is translated to local address). Central MD&ME receives
multicast flow sent from CX through two sets of T160G
in central node, and edge HMS system receives the
flow from T160G by edge T64G. Programs watched by
users are provided by MD&ME in different places.
T64G-1#show processor
M: Master processor
S: Slave processor
Peak CPU: CPU peak utility measured in 2 minutes
PhyMem: Physical memory (megabyte)
Panel CPU(5s) CPU(30s) CPU(2m) Peak CPU PhyMem Memory
MP(M)1 23% 23% 23% 58% 512 38.106%
MP(S)2 8% 8% 8% 13% 512 19.578%
NP(M)1 12% 12% 12% 18% 256 37.700%
NP(M)2 11% 11% 11% 33% 256 37.674%
NP(M)4 12% 12% 12% 34% 128 54.977%
Key words: telnet, slow speed
Telnet with Slow SpeedTelnet with Slow Speed⊙ Xin Chang / ZTE Corporation
Data Products
www.zte.com.cn
25
CPU 5s of master MP is 23%, which was in normal range
(in case CPU 5s exceeds 40%, it indicates there is some-
thing wrong. 30% is normal when there are large service
traffics).
By analyzing CPU, the previous judgments were wrong.
It was necessary to find out the problem from other aspects.
2. It may be the problem of T160G-1 itself, for example,
CPU of the main board was high or corresponding line inter-
face card CPU was high, which led to that message queue
was completely occupied by other packets transmitted to
CPU and therefore telnet packets were dropped.
Engineers executed command show processor on
T160G-1 to view CPU utilizations of the main board and line
interface cards, as shown below.
telned to T64G through T160G-2. The response speed
was normal. Engineers checked CPU of line interface
card 1 on T160G-2, it was normal. It could be assumed
that the fault was related to high CPU utilization of line
interface card 1 on T160G-1.
3. The reason for line interface card 1 CPU be-
ing high was that there were large numbers of packets
being up-sent to line interface card CPU. They may be
protocol packets or ordinary packets. When engineers
executed command show logging alarm, it was found
that there was no alarm for receiving a large number
of protocol packets. Therefore, the packets may not be
protocol packets. It was assumed that it was service
packets that flooded CPU.
Engineers executed command capture npc 1 read-
speed 20 on T160G-1 to capture packets to line card 1.
The result was shown below.
T160G-1#show processor
M: Master processor
S: Slave processor
Peak CPU: CPU peak utility measured in 2 minutes
PhyMem: Physical memory (megabyte)
Panel CPU(5s) CPU(30s) CPU(2m) Peak CPU PhyMem Memory
MP(M)1 37% 35% 36% 43% 512 38.164%
MP(S)2 8% 8% 8% 12% 512 19.578%
NP(M)1 37% 37% 38% 39% 256 36.105%
NP(M)2 13% 12% 13% 17% 256 36.105%
NP(M)3 15% 15% 16% 19% 128 54.055%
NP(M)4 14% 15% 15% 15% 128 54.055%
NP(M)5 14% 15% 15% 19% 128 54.055%
NP(M)6 23% 23% 23% 27% 128 54.056%
NP(M)7 14% 13% 13% 14% 128 50.971%
CPU of master main board was fairly high and CPU uti-
lization of line interface card 1 was particularly higher than
those of other line interface cards.
All edge nodes T64G were connected to line interface
card 1 of T160G-1, except for T160G-2 (connected to line in-
terface cards 3 and 4). If CPU utilization of line interface card
1 was too high, the peed of accessing all T64G switches (ex-
cept for T160G-2) would be slow.
Engineers validated this assumption, it was correct. To
perform further validation, engineers connected all edge
nodes T64G to line interface card 1 of T160G-2, and then
T160G-1(config)#capture npc 1 readspeed 20
IP Packet on NPC: 1
DST_IP SRC_IP ovid ivid TTL PRO DIR Port
10.0.9.123 10.107.25.122 9 NULL 61 6 RX 4
233.18.204.166 124.108.15.105 100 NULL 7 17 RX 12
10.0.9.123 10.113.35.122 9 NULL 61 6 RX 2
10.0.9.123 10.137.26.69 9 NULL 61 6 RX 1
10.0.9.123 10.133.0.122 9 NULL 61 6 RX 1
10.0.9.123 10.119.45.123 9 NULL 61 6 RX 2
233.20.204.4 124.108.15.100 100 NULL 7 17 RX 12
233.20.204.4 124.108.15.100 100 NULL 7 17 RX 12
10.0.9.123 10.146.22.61 9 NULL 61 6 RX 6
10.0.9.123 10.124.122.77 9 NULL 61 6 RX 5
233.20.204.4 124.108.15.100 100 NULL 7 17 RX 12
233.20.204.4 124.108.15.100 100 NULL 7 17 RX 12
IP Packet on NPC: 1
PDST_IP SRC_IP ovid ivid TTL PRO DIR Port
10.0.9.123 10.115.5.123 9 NULL 61 6 RX 2
233.20.204.17 124.108.15.100 100 NULL 7 17 RX 12
IP Packet on NPC: 1
DST_IP SRC_IP ovid ivid TTL PRO DIR Port
10.0.9.123 10.129.140.120 9 NULL 61 6 RX 1
10.0.9.123 10.113.36.110 9 NULL 61 6 RX 2
Maintenance Experience26
April 2009 Issue 160
is made clear, it can be known that which line card
corresponds to which slot uniquely.
In usual cases, there could not be many multicast ser-
vice packets up-sent to line interface card CPU. Therefore, it
was assumed that there was something wrong with multicast
routing table.
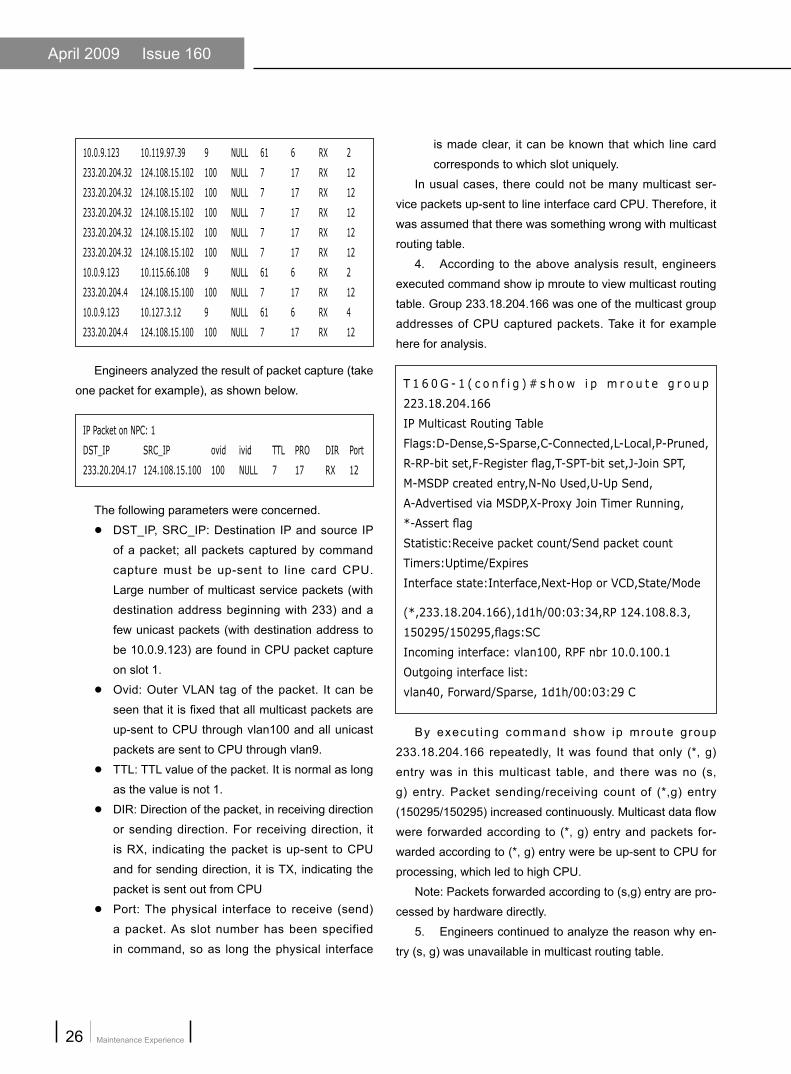
4. According to the above analysis result, engineers
executed command show ip mroute to view multicast routing
table. Group 233.18.204.166 was one of the multicast group
addresses of CPU captured packets. Take it for example
here for analysis.
T 1 6 0 G - 1 ( c o n f i g ) # s h o w i p m r o u t e g r o u p
223.18.204.166
IP Multicast Routing Table
Flags:D-Dense,S-Sparse,C-Connected,L-Local,P-Pruned,
R-RP-bit set,F-Register flag,T-SPT-bit set,J-Join SPT,
M-MSDP created entry,N-No Used,U-Up Send,
A-Advertised via MSDP,X-Proxy Join Timer Running,
*-Assert flag
Statistic:Receive packet count/Send packet count
Timers:Uptime/Expires
Interface state:Interface,Next-Hop or VCD,State/Mode
(*,233.18.204.166),1d1h/00:03:34,RP 124.108.8.3,
150295/150295,flags:SC
Incoming interface: vlan100, RPF nbr 10.0.100.1
Outgoing interface list:
vlan40, Forward/Sparse, 1d1h/00:03:29 C
By execut ing command show ip mroute group
233.18.204.166 repeatedly, It was found that only (*, g)
entry was in this multicast table, and there was no (s,
g) entry. Packet sending/receiving count of (*,g) entry
(150295/150295) increased continuously. Multicast data flow
were forwarded according to (*, g) entry and packets for-
warded according to (*, g) entry were be up-sent to CPU for
processing, which led to high CPU.
Note: Packets forwarded according to (s,g) entry are pro-
cessed by hardware directly.
5. Engineers continued to analyze the reason why en-
try (s, g) was unavailable in multicast routing table.
10.0.9.123 10.119.97.39 9 NULL 61 6 RX 2
233.20.204.32 124.108.15.102 100 NULL 7 17 RX 12
233.20.204.32 124.108.15.102 100 NULL 7 17 RX 12
233.20.204.32 124.108.15.102 100 NULL 7 17 RX 12
233.20.204.32 124.108.15.102 100 NULL 7 17 RX 12
233.20.204.32 124.108.15.102 100 NULL 7 17 RX 12
10.0.9.123 10.115.66.108 9 NULL 61 6 RX 2
233.20.204.4 124.108.15.100 100 NULL 7 17 RX 12
10.0.9.123 10.127.3.12 9 NULL 61 6 RX 4
233.20.204.4 124.108.15.100 100 NULL 7 17 RX 12
Engineers analyzed the result of packet capture (take
one packet for example), as shown below.
IP Packet on NPC: 1
DST_IP SRC_IP ovid ivid TTL PRO DIR Port
233.20.204.17 124.108.15.100 100 NULL 7 17 RX 12
The following parameters were concerned.
DST_IP, SRC_IP: Destination IP and source IP
of a packet; all packets captured by command
capture must be up-sent to line card CPU.
Large number of multicast service packets (with
destination address beginning with 233) and a
few unicast packets (with destination address to
be 10.0.9.123) are found in CPU packet capture
on slot 1.
Ovid: Outer VLAN tag of the packet. It can be
seen that it is fixed that all multicast packets are
up-sent to CPU through vlan100 and all unicast
packets are sent to CPU through vlan9.
TTL: TTL value of the packet. It is normal as long
as the value is not 1.
DIR: Direction of the packet, in receiving direction
or sending direction. For receiving direction, it
is RX, indicating the packet is up-sent to CPU
and for sending direction, it is TX, indicating the
packet is sent out from CPU
Port: The physical interface to receive (send)
a packet. As slot number has been specified
in command, so as long the physical interface
Data Products
www.zte.com.cn
27
In normal cases, entry (s,g) could generate as
long as multicast data flow was available and DR
knew IP address of multicast source and RPT was
switched to SPT. If (s,g) entry faied to be gener-
ated, users could execute command show ip rpf to
view whether RPF check is passed.
When an interface on the switch receives multi-
cast packet sent from a multicast source. if the path
from switch to this multicast source actually passes
through this interface according to the routing table
of this switch, RPF check is passed.
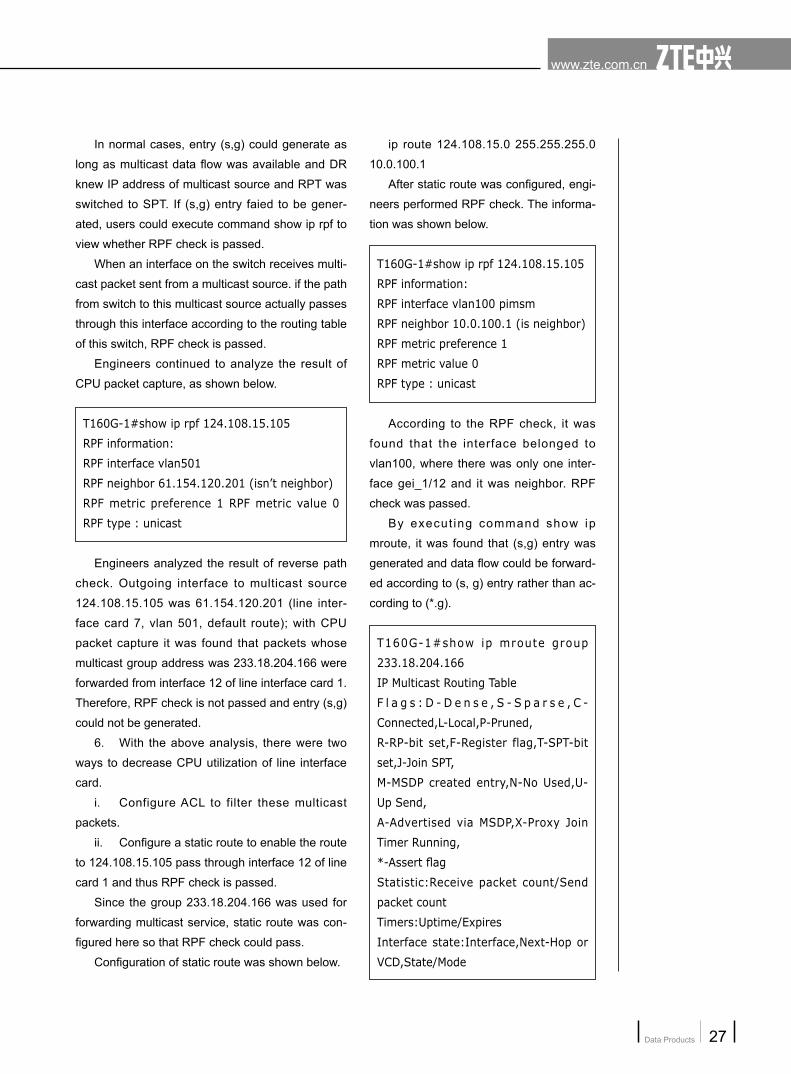
Engineers continued to analyze the result of
CPU packet capture, as shown below.
T160G-1#show ip rpf 124.108.15.105
RPF information:
RPF interface vlan501
RPF neighbor 61.154.120.201 (isn’t neighbor)
RPF metric preference 1 RPF metric value 0
RPF type : unicast
Engineers analyzed the result of reverse path
check. Outgoing interface to multicast source
124.108.15.105 was 61.154.120.201 (line inter-
face card 7, vlan 501, default route); with CPU
packet capture it was found that packets whose
multicast group address was 233.18.204.166 were
forwarded from interface 12 of line interface card 1.
Therefore, RPF check is not passed and entry (s,g)
could not be generated.
6. With the above analysis, there were two
ways to decrease CPU utilization of line interface
card.
i. Configure ACL to filter these multicast
packets.
ii. Configure a static route to enable the route
to 124.108.15.105 pass through interface 12 of line
card 1 and thus RPF check is passed.
Since the group 233.18.204.166 was used for
forwarding multicast service, static route was con-
figured here so that RPF check could pass.
Configuration of static route was shown below.
ip route 124.108.15.0 255.255.255.0
10.0.100.1
After static route was configured, engi-
neers performed RPF check. The informa-
tion was shown below.
T160G-1#show ip rpf 124.108.15.105
RPF information:
RPF interface vlan100 pimsm
RPF neighbor 10.0.100.1 (is neighbor)
RPF metric preference 1
RPF metric value 0
RPF type : unicast
According to the RPF check, it was
found that the interface belonged to
vlan100, where there was only one inter-
face gei_1/12 and it was neighbor. RPF
check was passed.
By execut ing command show ip
mroute, it was found that (s,g) entry was
generated and data flow could be forward-
ed according to (s, g) entry rather than ac-
cording to (*.g).
T160G-1#show ip mroute group
233.18.204.166
IP Multicast Routing Table
F l a g s : D - D e n s e , S - S p a r s e , C -
Connected,L-Local,P-Pruned,
R-RP-bit set,F-Register flag,T-SPT-bit
set,J-Join SPT,
M-MSDP created entry,N-No Used,U-
Up Send,
A-Advertised via MSDP,X-Proxy Join
Timer Running,
*-Assert flag
Statistic:Receive packet count/Send
packet count
Timers:Uptime/Expires
Interface state:Interface,Next-Hop or
VCD,State/Mode
Maintenance Experience28
April 2009 Issue 160
(*, 233.18.204.166), 1d2h/00:02:48,
RP 124.108.8.3,
150385/150385, flags: SC
Incoming interface: vlan100, RPF nbr
10.0.100.1
Outgoing interface list:
v l a n 4 0 , F o r w a r d / S p a r s e ,
1d2h/00:02:43 C
(124.108.15.105, 233.18.204.166),
00:44:39/00:02:48 , 6340/6340 ,
flags: CJT
Incoming interface: vlan100, RPF nbr
10.0.100.1
Outgoing interface list:
v l a n 4 0 , F o r w a r d / S p a r s e ,
00:44:39/00:02:43 C
By executing command show ip mroute
group repeatedly to compare packet send-
ing/receiving counts, it was verified that
data flow were forwarded according to (s,g)
entry rather than according to (*.g). Engineers ex-
ecuted command show processor to view CPU uti-
lization of line interface card and it was found that it
increased rather than decreases. It was normal for
T160G-1 to telnet the other T64Gs connected to it.
Experience SummaryIn normal cases, as for each group, there were
two entries available in multicast routing table, (s,g)
and (*,g). Both are indispensable. If either of the
two entries does not exist or it is abnormal, it is
necessary to analyze the reason.
Packets forwarded according to (s,g) are
processed by hardware and packets forwarded
according to (*,g) are processed by software. In
normal cases, when device receives multicast data
flow for the first time, the device forwards it accord-
ing to (*,g) and it will implement SPT changeover
immediately to generate (s,g) entry, and then for-
ward the multicast data flow by hardware. ■