Embed Size (px)
Citation preview
ii
PREFACE AND ACKNOWLEDGEMENT
The Ghana Statistical Service (GSS) has been conducting the Ghana Living Standards Survey
(GLSS) since 1987 to collect data for monitoring the impact of policies and programmes on
the welfare of the population. Until the year 2012, the GSS had conducted five rounds of the
GLSS; these surveys were undertaken in 1987, 1988, 1991/92, 1998/1999 and 2005/2006.
The sixth round of the Ghana Living Standards Survey (GLSS6), which was implemented
over a period of 12 months from October 18, 2012 to October 17, 2013, had a Labour Force
Module that was meant to collect data on labour indicators. This report is based on the data
generated from the implementation of the Labour Force Module.
The methodology of the GLSS6 was such that it required substantial human and material
resources and financial support to have it implemented. The survey was made possible
following the support provided by the various stakeholders. The GSS acknowledges with
gratitude the many contributions that complemented the efforts of the Service in the
successful completion of the survey. The GSS would like to thank the selected households in
particular, for their patience and cooperation, and for the time they devoted to the field
personnel during the numerous visits and interviews. Our appreciation also goes to the field
personnel and data entry officers for the meticulous manner in which they discharged their
duties. We are also grateful to the regional and district administrators as well as traditional
rulers and community leaders for the diverse ways in which they assisted our field teams to
ensure the success of this important national exercise.
The GSS would also like to acknowledge, with many thanks, the financial contribution and
support of the Government of Ghana, the United Kingdom Department for International
Development (UK-DFID), UNICEF, UNDP, the International Labour Office (ILO) as well as
the technical assistance provided by the World Bank. Special thanks go to Mr. Yacouba
Diallo and Marie Ndiaye of the ILO for his invaluable contribution and support in the
preparation of this report. Finally, the devoted services of the project personnel, the report
writers and all others who have contributed in various ways towards the success of the survey
and subsequent production of this report are duly acknowledged.
DR. PHILOMENA EFUA NYARKO
(GOVERNMENT STATISTICIAN AND
NATIONAL PROJECT DIRECTOR)
iii
TABLE OF CONTENTS
PREFACE AND ACKNOWLEDGEMENT .......................................................................... i
LIST OF TABLES ................................................................................................................... v
LIST OF FIGURES ............................................................................................................... vii
ACRONYMS AND ABBREVIATIONS .............................................................................viii
EXECUTIVE SUMMARY .................................................................................................... ix
CHAPTER ONE: INTRODUCTION ................................................................................... 1 1.1 Background ................................................................................................................. 1 1.2 Objectives of GLSS6 ................................................................................................... 2 1.3 Survey instruments ...................................................................................................... 3 1.4 Training and fieldwork ................................................................................................ 3
CHAPTER TWO: SOCIO- DEMOGRAPHIC CHARACTERISTICS ........................... 9 2.1 Introduction ................................................................................................................. 9 2.2 Population distribution ................................................................................................ 9 2.3 Distribution of population by age, sex and dependency ratio ................................... 10 2.4 Marital status ............................................................................................................. 10 2.5 Educational attainment .............................................................................................. 11 2.6 Literacy...................................................................................................................... 11
2.7 Main trade learnt ....................................................................................................... 12
CHAPTER THREE: ECONOMIC CHARACTERISTICS AND ACTIVITIES ........... 14 3.1 Introduction ............................................................................................................... 14 3.3 Current activity status of population 15 years and older ........................................... 15
3.4 Current activity status of population aged 15 years and older .................................. 18 3.5 Activity status of population 15 years and older and hours worked ......................... 18
3.6 Current activity rate ................................................................................................... 19 3.7 Labour force participation rate of population 15 years and older ............................. 20
CHAPTER FOUR: EMPLOYMENT ................................................................................. 21 4.1 Introduction ............................................................................................................... 21 4.2 Employment-to-population ratio ............................................................................... 21 4.3 Employment status .................................................................................................... 22
4.4 Type of employer and level of informality in the economy ...................................... 23 4.5 Main occupation of the currently employed ............................................................. 24 4.6 Sector of employment of currently employed persons.............................................. 25 4.7 Employment, level of education and occupational mismatch ................................... 27 4.8 Number of hours worked per week ........................................................................... 29
4.9 Earnings from employment ....................................................................................... 32 4.10 Employment contracts and other fringe benefits ................................................... 36
CHAPTER FIVE: LABOUR UNDERUTILIZATION ..................................................... 37 5.1 Introduction ............................................................................................................... 37 5.2 Unemployment .......................................................................................................... 37 5.3 Time-related underemployment ................................................................................ 40
5.4 Combined rate of underemployment, unemployment and potential ......................... 42 labour force .......................................................................................................................... 42
CHAPTER SIX: YOUTH EMPLOYMENT ...................................................................... 44 6.1 Introduction ............................................................................................................... 44 6.2 Share of youth in total population ............................................................................. 44
iv
CHAPTER SEVEN: INACTIVITY .................................................................................... 50 7.1 Introduction ............................................................................................................... 50 7.2 Inactivity of population 15 years and older ............................................................... 50 7.3 Reasons for inactivity of currently inactive population aged 15 years ..................... 51
and older............................................................................................................................... 51 7.4 Reasons for inactivity of currently inactive population 15 years .............................. 52 and older by age ................................................................................................................... 52
CHAPTER EIGHT: USUAL ECONOMIC ACTIVITY .................................................. 53 8.1 Introduction ............................................................................................................... 53 8.2 Usual economic activity participation rate ................................................................ 54 8.3 Usual employment..................................................................................................... 55 8.4 Main occupation of usually employed persons ......................................................... 55
CHAPTER NINE: NON-ECONOMIC ACTIVITY.......................................................... 57
CHAPTER TEN: CHILDREN IN EMPLOYMENT ........................................................ 61 10.1 Introduction ........................................................................................................... 61 10.2 Currently employed children 5-14 years by occupation ........................................ 61 10.3 Currently employed children 5-14 years by industry, locality and sex ................. 62
10.4 Hours worked per week ......................................................................................... 63 10.5 Average hourly earnings ........................................................................................ 63 10.6 Average time spent on housekeeping activities ..................................................... 65
CHAPTER ELEVEN: SUMMARY, CONCLUSIONS AND
RECOMMENDATIONS ............................................................. 67 11.1 Introduction ........................................................................................................... 67 11.2 Summary of findings ............................................................................................. 67 11.3 Conclusions ........................................................................................................... 69
REFERENCES ....................................................................................................................... 70
APPENDICES ........................................................................................................................ 71
v
LIST OF TABLES
Table 2.1: Distribution of the population (in millions) by region, type of locality and sex ..... 9 Table 2.2: Distribution of the population (in millions) by age group, sex and dependency ratio .................................................................................................... 10
Table 2.3: Population by marital status and locality (percent) ............................................... 11 Table 2.4: Educational attainment of the population 5 years and older by sex and locality type ............................................................................................................ 11 Table 2.5: Literacy rates of the population 11 years and older by region, sex and locality type ......................................................................................................................... 12
Table 2.6: Main trade learnt of population 11 years and older by sex and the locality type .. 13 Table 2.7: Average length of time (months) spent on apprenticeship training by main trade, locality and sex ............................................................................................ 13
Table 3.1: Current activity status of population 5 years and older by age, locality and sex .. 15 Table 3.2: Current activity status of population 15 years and older by age, sex and locality 16 Table 3.3: Current activity status of population 15 years and older by locality and sex ........ 18 Table 3.4: Activity status of population 15 years and older by work status, hours worked in the last 7 days, locality and sex.......................................................................... 18 Table 3.5: Current activity rate of population 15 years and older by sex, age and locality.... 19
Table 3.6: Labour force participation rate of population 15 years and older by age, locality and sex ..................................................................................................... 20 Table: 4.1: Number of currently employed persons and employment-to-population ratios
(persons 15 years and older) by locality type and sex .......................................... 21 Table 4.2: Employment status of the currently employed population 15 years and older
by locality and sex ................................................................................................ 22 Table 4.3: Type of work engaged in by the currently employed population aged15 years
and older years by locality and sex ........................................................................ 23 Table 4.4: Currently employed population aged 15 years and older by type of employer, locality and sex ...................................................................................................... 24
Table 4.5: Main occupation of currently employed population 15 years and older years
by locality and sex ................................................................................................. 25 Table 4.6: Currently employed population 15 years and older by industry group, locality and sex ................................................................................................................... 26 Table 4.7: Educational attainment of currently employed population 15 years and older by sex and main occupation ................................................................................... 28
Table 4.8: Hours actually worked per week by currently employed population 15 years and older by main occupation ................................................................................ 29 Table 4.9: Hours worked per week by currently employed population 15 years and older by industry group .................................................................................................. 30
Table 4.10: Average basic hourly earnings (GH₵) of currently employed population 15 years and older by industry, locality and sex ................................................... 32 Table 4.11: Paid employees 15 years and older and proportion receiving cash or in-kind
earnings by major occupation .............................................................................. 34 Table 4.12: Average monthly earnings of paid employees 15 years and older ....................... 35 Table 4.13: Currently employed population 15 years and older with contracts, unions, tax deductions and employee benefits by sex ....................................................... 36 Table 5.1: Unemployment rate of persons 15 years and older by region, locality and sex ... 38 Table 5.2: Unemployment rate of persons 15 years and older by sex, age and locality ........ 38
vi
Table 5.3: Unemployment rate of persons 15 years and older by educational attainment,
locality and sex ..................................................................................................... 39 Table 5.4: Percentage of persons 15 years and older by process of looking for work and kind of work sought by locality and sex ............................................................... 40
Table 5.5: Time-related underemployed persons by employment status and sex .................. 41 Table 5.6: Time-related underemployment rate by age, sex and locality ............................... 41 Table 5.7: Time-related underemployed persons by occupation and sex ............................... 42 Table 5.8: Other measures of labour underutilization by sex and locality ............................. 42 Table 5.9: Composite measure of labour underutilization by age, sex and locality ............... 43
Table 6.1: Share of youth (15-35) in total population by region, locality and sex ................. 44 Table 6.2: Distribution of the youth by sex, age group and type of locality .......................... 45 Table 6.3: Youth population by status in education and type of locality (%) ........................ 45 Table 6.4: Youth population by economic activity status and sex ......................................... 46 Table 6.5: Current labour market indicators and education status of youth (%) .................... 46
Table 6.6: Youth labour force participation rate by age group, locality and sex .................... 47 Table 6.7: Youth employment by employment status and sex ............................................... 47 Table 6.8: Youth employment by industry ............................................................................. 48
Table 6.9: Employed youth by average hours worked per week in all jobs ........................... 49 Table 6.10:Youth Unemployment rate by age group, type of locality and sex ....................... 49 Table 6.11:Key youth (15-35 years) labour market indicators by locality and sex ................. 49
Table 7.1: Number of persons inactive by sex, age group and locality and inactive rates ..... 50 Table 7.3: Reasons for inactivity of currently inactive population aged 15 years and older by sex and age group .................................................................................... 52
Table 8.1: Usual activity status of population aged 15 and older by sex, age and locality .... 53 Table 8.2: Usual economic activity participation rate of the population 15 years and older
by sex, age and locality. ......................................................................................... 55 Table 8.3: Usually employed population 15 years and older by type of employer, locality and sex ...................................................................................................... 55
Table 8.4: Main occupation of usually employed population 15 years and older by
locality and sex ..................................................................................................... 56 Table 9.1: Average time spent in a day on various housekeeping activities by population 15 years and older by sex and locality ................................................................... 57 Table 9.2: Average time spent (minutes) per day by population 15 years and older on
various housekeeping activities by sex and locality ............................................. 59 Table 9.3: Average time spent (minutes) per day by population 15 years and older on various housekeeping activities by sex and age .................................................... 60 Table 10.1: Current activity status of population 5 years and older by age, locality and sex . 61 Table 10.2: Currently employed children 5-14 years by occupation, locality and sex ............ 62
Table 10.3: Currently employed children 5-14 years by industry, locality and sex ................ 62 Table 10.4: Hours worked per week by currently employed children 5-14 years by industry 63 Table 10.5: Average time spent by population 5-14 years per day on various housekeeping
activities by sex and locality ................................................................................. 65 Table 10.6: Average time spent (minutes) per day by population 15-14 years on various housekeeping activities by sex and locality ......................................................... 66 Table A5.1: Unemployment rate of population 15 years and older by region, sex
and locality ........................................................................................................... 71 Table A5.2: Unemployment rate of population 15 years and older by sex, age and locality .. 71 Table A8.1: Usually employed population 15 years and older by industry group, locality and sex ................................................................................................................. 72
vii
Table A8.2: Educational attainment of usually employed population 15 years and older
by sex and main occupation ................................................................................. 73 Table A8.3: Employment status of the usual employed population 15 years and older by sex and locality ............................................................................................... 74
Table A8.4: Type of work engaged in by the usually employed population 15 years and older by locality and sex ...................................................................................... 74 Table A8.5: Usual activity rate by sex, age group and locality ............................................... 75
LIST OF FIGURES
Figure 5.1: Labour force framework ...................................................................................... 4
Figure 4.1: Currently employed population by industry sector, sex and locality ................. 27
Figure 6.1: Youth employment by industry, sector and sex .................................................. 48
Figure 10.1: Average basic hourly earnings (GH₵) of currently employed children
5-14 years by occupation .................................................................................... 64
Figure 10.2: Average basic hourly earnings (GH₵) of currently employed children
5-14 years by industry ......................................................................................... 64
viii
ACRONYMS AND ABBREVIATIONS
BECE Basic Education Certificate Examination
CPI Consumer Price Index
CWIQ Core Welfare Indicators Questionnaire
GAMA Greater Accra Metropolitan Area
GCLS Ghana Child Labour Survey
GDP Gross Domestic Product
GLSS Ghana Living Standards Survey
GPRS Ghana Poverty Reduction Strategy
GSS Ghana Statistical Service
ILO International Labour Office
LEAP Livelihood Empowerment Against Poverty
LFPR Labour Force Participation Rate
LFS Labour Force Survey
MSLC Middle School Leaving Certificate
WFCL Worst Forms of Child Labour
ix
EXECUTIVE SUMMARY
The Ghana Living Standards Survey Round Six (GLSS6), like previous rounds, focuses on
the household as the key socio-economic unit and provides valuable information on the living
conditions and well-being of households in Ghana. This report summarizes the main findings
of the Labour Force Module of the sixth round of the GLSS which was conducted by the
Ghana Statistical Service (GSS) from 18th
October, 2012 to 17th
October, 2013.
Socio- Demographic Characteristics
The data generated from the survey suggest that the estimated population for the entire
country at the mid-survey period is 26.4 million, with the number of females (13.7 million)
being slightly more than the males (12.7 million). By regional distribution, majority of the
population is in the Ashanti region (19.7%), followed by the Greater Accra region (16.3%).
More than half of the population (13.8 million) is concentrated in the lower age group (0-19
years).
More than two-fifth (42.3%) of the population 12 years and older have never been married
while 46.5 percent are either married or in consensual union. Equal proportions (5.6%) are
either widowed or divorced/separated..
The results also show that 37.1 percent of the population aged 5 years and older has attained
less than Middle School Leaving Certificate/Basic Education Certificate (MSLC/BECE)
whereas 25.7 percent has never been to school. Close to 41 percent of the population 11 years
and older in Ghana are literate. One-third (33.4%) of the population have had apprenticeship
training in making apparel, textile and furnishing.
Economic Characteristics and Activities
Information on economic activity was collected on persons 5 years and older who engaged in
any economic activity for pay (cash or in-kind) or profit or family gain for at least one hour
during the seven days preceding the interview. Almost four out of every five persons 15 years
and older is economically active (79.6%). Out of this population, 94.8 percent are employed
and 5.2 percent unemployed, while 20.4 percent are economically not active. The
unemployment rate is higher among females (5.5%) than males (4.8%). In terms of age, the
rate is highest among the 15-24 age group (10.9%) and lowest for those aged 65 years and
older (2.5%).
The activity rate of the population aged 25 to 44 years (93.6%) is higher than that of the other
age groups, while the age group 15-24 years has the lowest activity rate (54.3%) compared to
the other age groups irrespective of sex and locality of residence. The current labour force
participation rate is higher for males (82.2%) than females (77.3%). This pattern is true for all
age groups. Among the age groups, the labour force participation rate is highest within the
age group 40 to 44 years (97.1%).
Employment
The employment-to-population ratios for persons 15 years and older is 75.4 percent, with
majority of the currently employed persons (68.7%) engaged in vulnerable employment (own
account workers and contributing family workers). A little over one in every five workers
(22.5%) is an employee and the main sectors of employment are private, public and not-for-
profit organizations.
x
Agriculture continues to play a key role in employment creation with 44.3 percent of the
currently employed population working as skilled agricultural and/or fishery workers. The
manufacturing sector employs less than 10 percent of the currently employed population
(9.1%).
Majority of professionals (87.5%), clerical support workers (73.2%), technicians and
associate professionals (63.4%), and legislators or managers (59.6%) have attained secondary
education or higher. More than one-third of legislators or managers (33.7%), professionals
(34.7%), technicians and associate professionals (38.7%) and clerical support workers
(37.5%) usually work between 40 to 49 hours a week (according to the legislated maximum
number of hours of work per week). The average hourly earnings for workers in all
occupations is GH₵1.82.
Labour Underutilization
The results also show that the unemployment rate is higher for persons with secondary
education (11.7%) and those with post-secondary diploma education (9.1%) but lower for
persons with post graduate degrees (2.7%), teacher training and agriculture and nursing
training (2.8%). About 4.2 million persons aged 15 years and older (made up of 1.8 million
males and 2.4 million females) are estimated to be time-related underemployed. The
proportion of underemployed persons is higher for those engaged in agricultural activities
(61.5%) compared to persons engaged in non-agricultural activities (38.5%).
Youth Employment
The distribution of the youth population and youth labour indicators as derived from the
GLSS6 indicates that the youth constitutes a little more than one-third of the population
(34.1%) out of a total of 26,347,424. The Ashanti region has the highest proportion (6.8%) of
the youth population, followed by Greater Accra (6.2%) while Upper West and Upper East
regions have low proportions of 1.0 percent and 1.4 percent respectively.
Inactivity
About 3.26 million persons aged 15 years and older are inactive, with majority identified in
the age groups 15 to 24 years (2.06 million) and 65 years and older (0.53 million). More than
half (54.5%) of the population is inactive because they are engaged in education or training.
In terms of age, more than three-quarters of the currently inactive population aged 15 to 29
years (77.2%) cited education and training as their main reason for inactivity, while 51.0
percent of those aged 30 to 44 years indicated that they were home makers.
Usual Economic Activity
The survey results further show that usual inactivity of persons 15 years and older (over the
twelve-month period preceding the interview) is highest among age groups 15-19 (48.2%)
and 65 years and above (15.3%). More than three-quarters of persons 15 years and older
spend most of their time during the twelve-month period participating in economic activities
(78.6%). Also, most of the currently employed persons (46.1%) are employed by agricultural
businesses and the main occupation of the currently employed persons is skilled agriculture
and fishery work, which employs 44 percent of all the currently employed persons.
Non-Economic Activity
Non-economic activities refer to housekeeping activities for which no payment is received.
The results show that generally, more than half of the population 15 years and older spend
their time in washing clothes (63.5%), cleaning (56.4%), cooking (52.4%) and fetching water
xi
(50.4%), with the proportion of females engaged in these activities being higher than males.
Also, the average time spent on fetching water in rural areas (21.4 minutes a day) is higher
than the average for urban areas (13.9 minutes a day), with the figure being particularly high
in rural savannah (32.5 minutes per day).
Children in Employment
Children aged 5-14 years constitute 31.1 percent of the survey population and about one-
quarter of them are economically active (25.2%). Among these economically active children,
95.8 percent are engaged in some form of economic activity. Nearly eighty percent of the
working children 5-14 years are engaged as skilled agriculture and fishery workers (78.0%),
with an additional 15.1 percent engaged as sales and service workers. Only small proportions
of working children are engaged as craft and related trades workers (2.6%) or in elementary
occupations (4.2%).
Regarding the average basic hourly earnings for currently employed children aged 5-14
years, the results show that on average, working children earn GH₵0.97 per hour, with the
highest average hourly earnings (GH₵1.17) paid to children who are engaged in service and
sales work.
Conclusion
The working population of the country is dominated by people with no formal education as
well as those with basic (primary and middle school) education. Though agriculture is the
back-bone of the economy, it does not attract people with higher education and therefore
most of the agricultural activities are done at the subsistence level. The inability of the formal
sector to generate jobs in their required number has pushed many into the informal sector
which is predominantly made up of small to medium-scale businesses.
The survey results show that a greater proportion of the working population suffers from
decent work deficits and low-quality jobs. Most working people are in irregular employment
in the informal economy. Labour laws and collective agreements, including sanctioning
mechanisms, can protect workers and facilitate their transition into stable and decent
employment.
Identifying the nature and extent of the youth employment challenge is a prerequisite to
formulating evidence-based and integrated policies and interventions. With information on
the blockages that are preventing sufficient job creation, policy makers are in a better position
to design effective policy responses. There is, therefore, the need to adopt strategies and
measures to grow and transform Ghana’s economy.
1
CHAPTER ONE
INTRODUCTION
1.1 Background
The overall development of a country is based on the production of goods and services.
Critical to the production process is the human capital of the country. Governments all over
the globe at certain stages of development have sought to know how many people are
employed, unemployed and economically not active. It should be noted that the more the
working population, the higher the creation of wealth, leading to improved living conditions
and poverty reduction.
In view of these, successive governments in Ghana have over the years recognized the
important role labour plays in the development agenda of the country. As a result, a number
of initiatives have been taken to promote growth, including the Ghana Poverty Reduction
Strategy (GPRS) and the Livelihood Empowerment Against Poverty (LEAP). Ghana’s
Vision 2020 adopted a human-centred approach to development with emphasis on social
welfare issues such as poverty, hunger and the problem of child labour. In order to monitor
and evaluate the success of these policies and programmes, current and more focused
statistical indicators on all facets of the labour force are required.
A Labour Force Survey (LFS) is a standard household-based survey of work-related
statistics. It is one of the important statistical surveys used to monitor the country's
development. It constitutes an important basis for decision-making with regard to labour and
its contribution to the economy. Ghana as a country has been battling with inadequate data on
the labour force and labour market indicators. Since independence in 1957, the country has
not been able to conduct a stand-alone labour force survey. Limited questions relating to
employment, unemployment, and underemployment have been included in population and
housing censuses and other national surveys such as the Ghana Living Standards Survey
(GLSS), Core Welfare Indicators Questionnaire (CWIQ) Survey and the 2001 Ghana Child
Labour Survey (GCLS). As a result, in-depth information on Ghana’s labour force has been
lacking. In this regard, there have been concerns, both locally and internationally, for Ghana
to have comprehensive data on the labour force. For instance, concerns raised during the
2006 ILO Conference of African Ministers included:
The non-inclusion of employment issues in national development strategies.
Special needs of vulnerable groups in society, including increasing employment
opportunities for women, youth and persons with disabilities.
The need for African countries to increase the availability of accurate, timely and
policy-relevant data on employment and related indicators, and to measure and profile
the informal sector, which covers a wide range of market activities.
In order to obtain comprehensive statistics on the labour market, the Ghana Statistical Service
(GSS), with support from the Government of Ghana and in collaboration with development
partners, included the labour force module in the sixth round of the Ghana Living Standards
Survey. The main objective of the survey was to collect comprehensive data based on current
activity status of the population aged 15 years and over.
2
The specific objectives of the survey were as follows:
To estimate the number of persons in the labour force (Employed, Under-employed
and Un-employed) and their distribution by sex, major age-groups, educational level,
and geographical and rural/ urban spread.
To provide information on both adult workers and children in employment, their
distribution by status in employment, occupation and industry, as well as weekly
hours worked, location of place of work, earnings, occupational injury and hazards at
the work place, contractual status, informal / formal sector employment, etc.
To provide benchmark data needed for monitoring progress in relation to labour
policies, programmes and law-making.
To provide up-to-date information for assessing the labour force situation in the
country.
To provide current labour force indicators.
To establish a national database on decent work indicators, including labour force
statistics.
The sixth round of the Ghana Living Standards (GLSS6), with its core module being the
labour force module, is the latest in a series of household surveys undertaken by GSS with
the aim of providing insights into the living conditions of the people of Ghana.
This report analyses the current status of labour force with respect to the economically active
and economically not active persons, the employed and the unemployed population.
The concepts and definitions used in this report are explained so that readers can interpret the
results presented.
1.2 Objectives of GLSS6
The objectives of the sixth round of the Ghana Living Standards Survey Round Six are:
To provide information on the patterns of household consumption and expenditure at a
lower level of disaggregation.
To serve as the basis for the construction of a new basket for the next re-basing of the
Consumer Price Index.
To provide information for up-dating the country’s National Accounts.
To provide information on household access to and use of financial services.
To estimate the number of persons in the labour force (Employed, Under-employed
and Unemployed) and their distribution by sex, major age-groups, educational level,
disability status, geographical and rural/urban spread, as well as the ecological
manifestations of these,
To estimate the number of child workers (or children in employment) aged 5-17
years, and their distribution by sex, major age-groups, educational status,
geographical, ecological and rural/urban spread, among others.
3
1.3 Survey instruments
To achieve these objectives, detailed information was collected on key elements of socio-
economic life using the following questionnaires:
Household Questionnaire
Non-farm Household Questionnaire
Community Questionnaire
Governance, Peace and Security Questionnaire
Prices of Food and Non-food Items Questionnaire
The Household Questionnaire is made up of two parts, A and B. Part A and has seven
sections, namely: demographic characteristics of respondents; education and skills training;
health and fertility behavior; employment and time use; migration and tourism; household
agriculture; housing and housing conditions.
Part B covers five sections, namely: agriculture; household income and expenditure; income
transfers; migration and remittances and credit, assets and use of financial services.
The Community Questionnaire covers general information on facilities available in the rural
communities while the Price Questionnaire was used to solicit information on the market
prices of consumer items.
The questionnaire on Governance, Peace and Security was used to solicit for information on
theft, robbery, sexual offences, violence and security, safety, peace and social cohesion as
well as political engagement.
1.4 Training and fieldwork
Personnel with minimum qualification of Higher National Diploma were recruited and
trained to undertake the fieldwork. These attended a 21-day training programme during
which members of the Project Implementation Team (PIT) took them through the various
sections of the questionnaire, including the concepts and definitions that were to be used in
the survey. The training also involved assessment exercises, field practice, role plays and
group discussions and interviews in the major local languages.
The fieldwork was over a twelve-month period and took place from 18th
October 2012 to 17th
October 2013. Thirty teams were deployed to the field, comprising of a supervisor, senior
interviewer/editor, three interviewers and a driver. Data capture centres were setup in the
regional offices of the Service, with each team having one data entry officer.
Field monitoring exercises were undertaken by the the Project Implementation Team as well
as Top Management of the Service, Steering Committee members and Technical Advisory
Committee members.. The monitors observed interviews and checked completed
questionnaires for consistency to ensure the quality of the data.
4
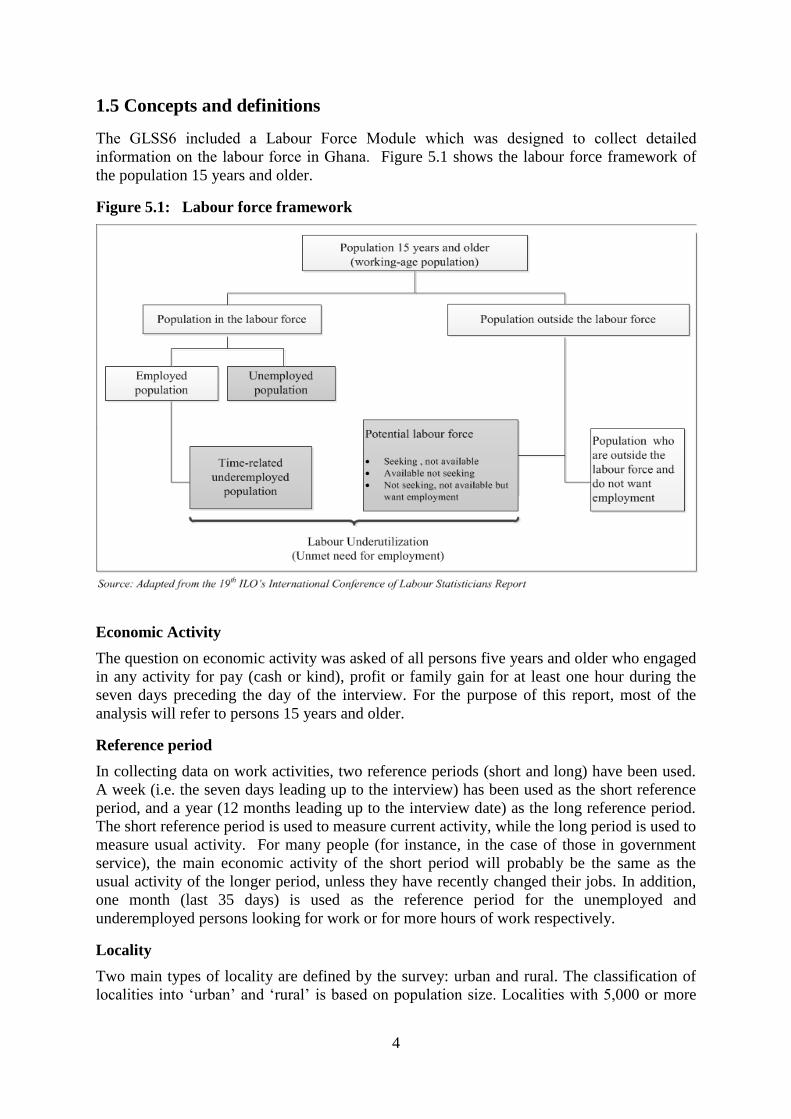
1.5 Concepts and definitions
The GLSS6 included a Labour Force Module which was designed to collect detailed
information on the labour force in Ghana. Figure 5.1 shows the labour force framework of
the population 15 years and older.
Figure 5.1: Labour force framework
Economic Activity
The question on economic activity was asked of all persons five years and older who engaged
in any activity for pay (cash or kind), profit or family gain for at least one hour during the
seven days preceding the day of the interview. For the purpose of this report, most of the
analysis will refer to persons 15 years and older.
Reference period
In collecting data on work activities, two reference periods (short and long) have been used.
A week (i.e. the seven days leading up to the interview) has been used as the short reference
period, and a year (12 months leading up to the interview date) as the long reference period.
The short reference period is used to measure current activity, while the long period is used to
measure usual activity. For many people (for instance, in the case of those in government
service), the main economic activity of the short period will probably be the same as the
usual activity of the longer period, unless they have recently changed their jobs. In addition,
one month (last 35 days) is used as the reference period for the unemployed and
underemployed persons looking for work or for more hours of work respectively.
Locality
Two main types of locality are defined by the survey: urban and rural. The classification of
localities into ‘urban’ and ‘rural’ is based on population size. Localities with 5,000 or more
5
persons are classified as Urban while those with less than 5,000 persons are classified as
Rural.
Work
Work refers to any economic activity performed by the respondent that contributes to the
economic production of goods and services. Examples are selling in a market/street, working
in an enterprise/business or for government, working in one’s own farm or enterprise,
working on a household member’s farm, etc.
Currently employed
There are two situations in which a person can be classified as being currently employed.
Either the person was actually engaged in any work (as defined above) during the reference
week, or he/she had an attachment to a job or business but for some reasons did not work
during the reference week.
Currently unemployed (strict definition)
A person is considered as currently unemployed if he/she was not engaged in any work (as
defined above), had no attachment to a job or business, reported that he/she was available for
work and had taken some specific steps to look for work.
Unemployed (relaxed definition): defined as persons currently without work and available
to take up work in the week prior to the reference period.
Economically active or labour force
A person is considered as economically active if he/she was either employed or unemployed
(and for those without work, whether they were available for work and seeking work during
the reference period); otherwise the person is classified as economically not active. The term
economically active is the same as the labour force. Therefore, these terms are used
interchangeably in the report as appropriate.
Economically not active
The economically not active persons are those who did not work and were not seeking for
work, that is, they are not currently employed or unemployed. This group includes persons
who are studying or performing household duties (homemakers), retired persons, the disabled
and other persons who were unable to work because of their disability or age (i.e., too young
or old to work).
Workforce (the employed)
The workforce represents the total number of workers actively employed, or available for
work. It consists of all persons aged 15 years and older, who during the reference period,
were in the following categories:
(i) At work; that is, persons who during the reference period performed some work
for wage or salary either in cash or in kind or worked without pay.
(ii) Had a job to go back to, but did not work during the reference period.
6
Labour force participation rate
This is the proportion of a country’s working-age population that engages actively in the
labour market, either by working or looking for work. It provides an indication of the relative
size of the supply of labour available to engage in the production of goods and services.
Occupation
Occupation refers to the type of work the person was engaged in at the establishment where
he/she worked. All persons who worked during the reference period were classified by the
kind of work they were engaged in. For those who did not work but had a job to return to,
their occupation was the job they would go back to after the period of absence. Up to two
occupations were considered if a person was engaged in more than one occupation.
Industry
Industry refers to the type of product produced or service rendered at the respondent’s place
of work (irrespective of the occupation the person has).
Time-related underemployment
The concept of time-related underemployment has been introduced to complement the
statistics on unemployment. While unemployment represents a situation of total lack of work
during the reference period, many other people may have jobs but suffer from partial lack of
work.
The currently employed group can, therefore, be sub-classified as either in time-related
underemployment or not. In operational terms, the time-related underemployed persons are
defined as those whose total actual hours of work were less than 35 hours. It should be noted
that, in defining the underemployed, no account is taken of whether or not these people had
actually been looking for additional work.
Labour underutilization
Labour underutilization is a more comprehensive measure than the unemployment rate. In
developing countries, the one-hour criterion defining employment leads to lower
unemployment rates and complicates the interpretation of employment and unemployment
statistics. Labour underutilization consists of that part of the population which has labour
slack, low earnings and skill mismatch among the employed population. In other words, the
employed population might have time-related underemployment, low pay and skill
mismatches which are aspects of labour underutilization.
Employment status
Employment status refers to the position of a person in the establishment where he/she
currently works or previously worked.
Employment sector
Employment sector refers to the sector in which a person works.
Usual economic activity
A person is classified as usually active or usually inactive on the basis of his or her work
experience over the whole year. A person is considered to be usually active if the periods of
time spent either working or available for work taken together during the last 12 months are
greater than (or equal to) the periods of time that the person has not been available for work.
7
Informal employment and sector
Whereas the determination of the informal sector depends on the characteristics of the
enterprise in which a person works, the determination of whether a person is in informal
employment or not depends on the characteristics of the person’s job.
Vulnerable employment
People in vulnerable employment are defined as those whose status in employment is given
as an own account worker or contributing family worker. The vulnerable employment rate is
obtained by calculating this sum as a proportion of total employment. It is a measure of the
proportion of persons who are employed under relatively precarious circumstances as
indicated by their status in employment.
Wage and salary earnings
Wage and salary earnings of paid employees can be of two types, in cash or in kind, and in
this survey, information was collected separately on each of them. Earnings paid in cash are
‘cash’ earnings. Earnings in kind include the regular supply of food, clothing, housing, water,
electricity, fuel, transport, etc. on a free or subsidized basis.
Household
A household consists of a person or a group of persons, who live together in the same house
or compound, share the same house-keeping arrangements and are catered for as one unit and
recognize one person as the head. In general, a household consists of a man or woman, his or
her spouse, children and some other relatives or a house help who may be living with them.
However, it is important to remember that members of a household are not necessarily related
(by blood or marriage) because non-relatives e.g. house helps may form part of a household.
On the other hand, not all related persons living in the same house or compound are
necessarily members of the same household. For example, two brothers who live in the same
house with their wives and children may or may not form separate households depending on
their catering arrangements. The same applies to a father and his married children. Thus, in
many cases, a house or compound may be divided into separate households.
Regular employment
This is defined as wage and salaried workers (employees) holding a contract of greater than
12 months’ duration, plus self-employed youth with employees (employers).
Irregular employment
It is defined as wage and salaried workers (employees) holding a contract of limited duration,
i.e. set to terminate prior to 12 months, self-employed youth with no employees (own-account
workers) and contributing family workers; young people in this category almost certainly fall
outside of the framework of standard employment relationships.
Inactive youth
This group is further divided into two sub-categories: those who are inactive and in school
(“inactive students”) and those who are inactive and not in school (“inactive non-students”).
The inactive students are considered to be investing in their education to emerge better
equipped for their future labour market experience. Hence, this group can tentatively be
judged as a “positive” category (notwithstanding issues of skills mismatch). The inactive
non- students have chosen to be outside of the labour market for reasons other than schooling
(to engage in household duties or care for children, for example) and they may or may not

8
have the intention to (re)enter the labour market in the future. Those who say they intend to
work in the future have some degree of labour market attachment and should thus be
considered in the classification of labour (under)utilization.
Literacy
This question relates to the respondent's ability to read and write in any language. Note that
in this survey, a respondent is considered literate if he/she can read and write a simple
statement in English or any local language with understanding.
9
CHAPTER TWO
SOCIO-DEMOGRAPHIC CHARACTERISTICS
2.1 Introduction
The chapter on demographic characteristics throws light on the distribution of the population
by region, type of locality and sex, age-group and sex. The chapter also discusses the
dependency ratio as well as the educational attainment, marital status, literacy rates and the
main trade learnt by the population in the labour force.
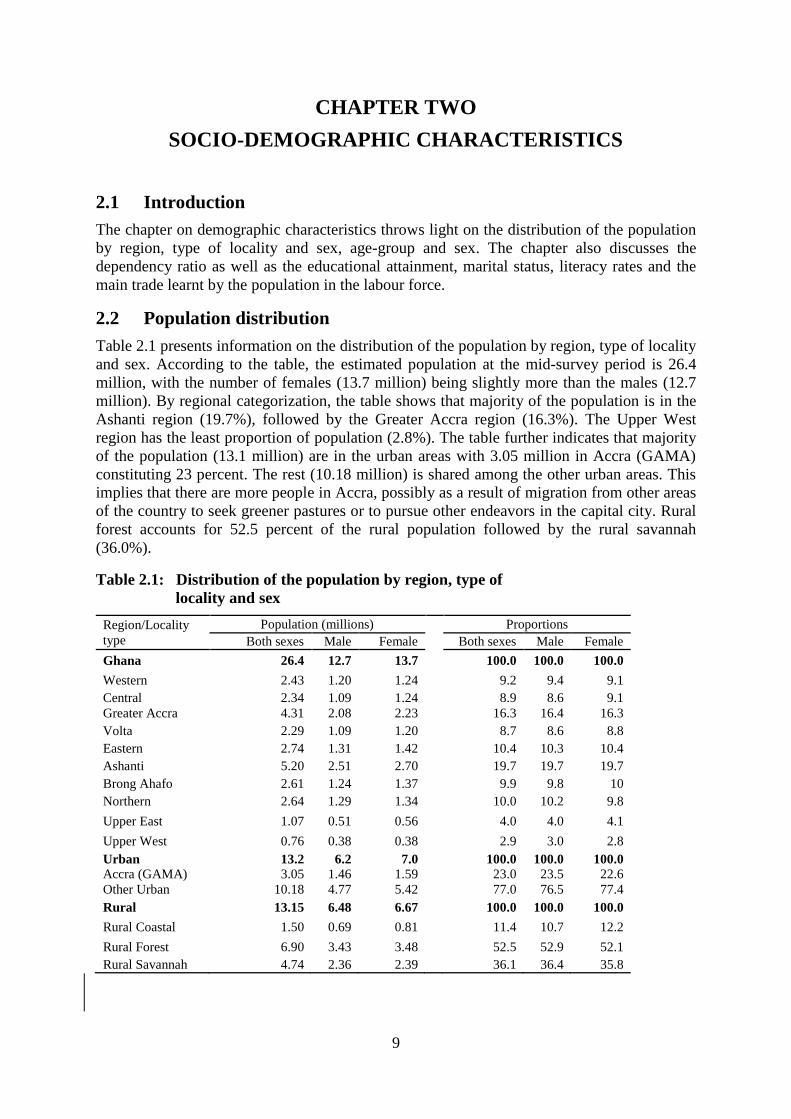
2.2 Population distribution
Table 2.1 presents information on the distribution of the population by region, type of locality
and sex. According to the table, the estimated population at the mid-survey period is 26.4
million, with the number of females (13.7 million) being slightly more than the males (12.7
million). By regional categorization, the table shows that majority of the population is in the
Ashanti region (19.7%), followed by the Greater Accra region (16.3%). The Upper West
region has the least proportion of population (2.8%). The table further indicates that majority
of the population (13.1 million) are in the urban areas with 3.05 million in Accra (GAMA)
constituting 23 percent. The rest (10.18 million) is shared among the other urban areas. This
implies that there are more people in Accra, possibly as a result of migration from other areas
of the country to seek greener pastures or to pursue other endeavors in the capital city. Rural
forest accounts for 52.5 percent of the rural population followed by the rural savannah
(36.0%).
Table 2.1: Distribution of the population by region, type of
locality and sex
Region/Locality
type
Population (millions) Proportions
Both sexes Male Female
Both sexes Male Female
Ghana 26.4 12.7 13.7
100.0 100.0 100.0
Western 2.43 1.20 1.24
9.2 9.4 9.1
Central 2.34 1.09 1.24
8.9 8.6 9.1
Greater Accra 4.31 2.08 2.23
16.3 16.4 16.3
Volta 2.29 1.09 1.20
8.7 8.6 8.8
Eastern 2.74 1.31 1.42
10.4 10.3 10.4
Ashanti 5.20 2.51 2.70
19.7 19.7 19.7
Brong Ahafo 2.61 1.24 1.37
9.9 9.8 10
Northern 2.64 1.29 1.34
10.0 10.2 9.8
Upper East 1.07 0.51 0.56
4.0 4.0 4.1
Upper West 0.76 0.38 0.38
2.9 3.0 2.8
Urban 13.2 6.2 7.0
100.0 100.0 100.0
Accra (GAMA) 3.05 1.46 1.59
23.0 23.5 22.6
Other Urban 10.18 4.77 5.42
77.0 76.5 77.4
Rural 13.15 6.48 6.67
100.0 100.0 100.0
Rural Coastal 1.50 0.69 0.81
11.4 10.7 12.2
Rural Forest 6.90 3.43 3.48
52.5 52.9 52.1
Rural Savannah 4.74 2.36 2.39 36.1 36.4 35.8
10
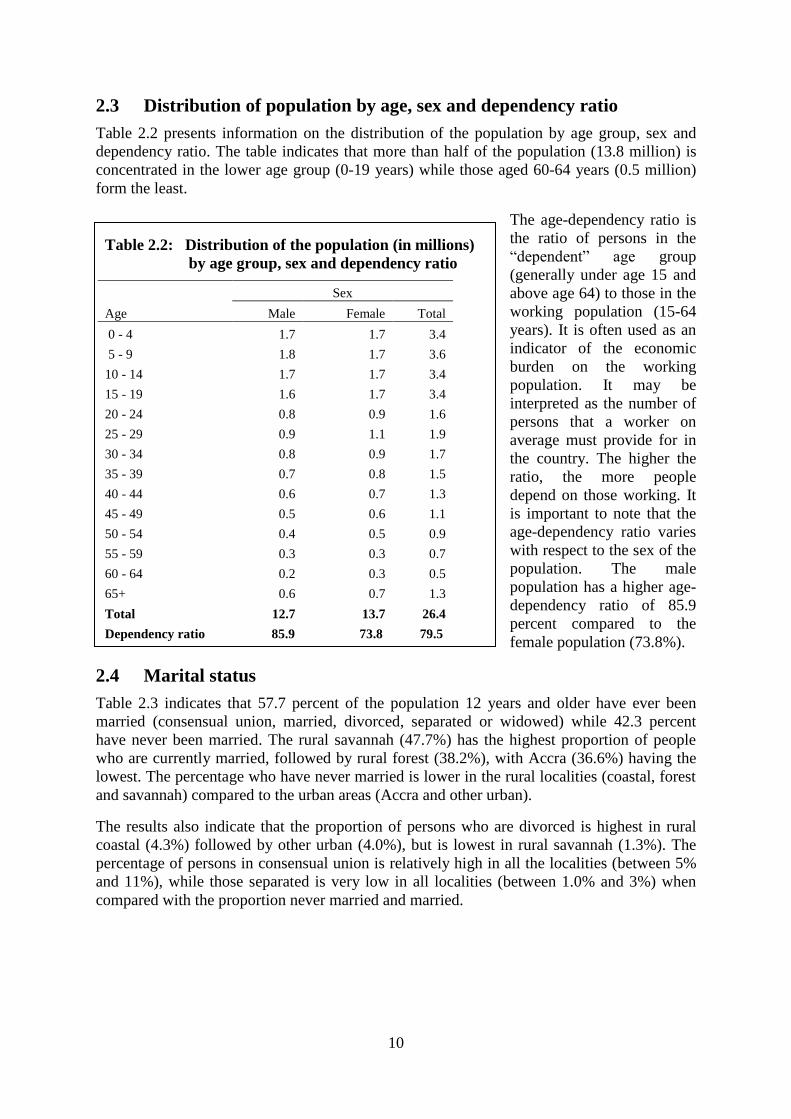
2.3 Distribution of population by age, sex and dependency ratio
Table 2.2 presents information on the distribution of the population by age group, sex and
dependency ratio. The table indicates that more than half of the population (13.8 million) is
concentrated in the lower age group (0-19 years) while those aged 60-64 years (0.5 million)
form the least.
The age-dependency ratio is
the ratio of persons in the
“dependent” age group
(generally under age 15 and
above age 64) to those in the
working population (15-64
years). It is often used as an
indicator of the economic
burden on the working
population. It may be
interpreted as the number of
persons that a worker on
average must provide for in
the country. The higher the
ratio, the more people
depend on those working. It
is important to note that the
age-dependency ratio varies
with respect to the sex of the
population. The male
population has a higher age-
dependency ratio of 85.9
percent compared to the
female population (73.8%).
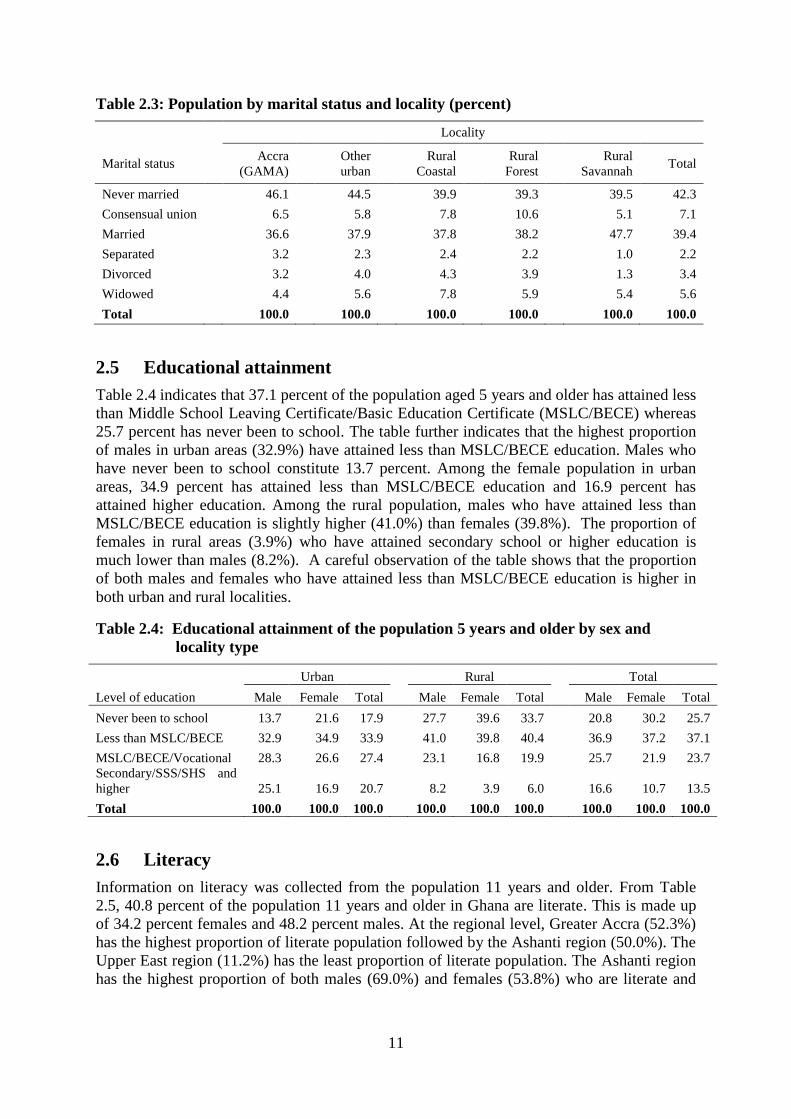
2.4 Marital status
Table 2.3 indicates that 57.7 percent of the population 12 years and older have ever been
married (consensual union, married, divorced, separated or widowed) while 42.3 percent
have never been married. The rural savannah (47.7%) has the highest proportion of people
who are currently married, followed by rural forest (38.2%), with Accra (36.6%) having the
lowest. The percentage who have never married is lower in the rural localities (coastal, forest
and savannah) compared to the urban areas (Accra and other urban).
The results also indicate that the proportion of persons who are divorced is highest in rural
coastal (4.3%) followed by other urban (4.0%), but is lowest in rural savannah (1.3%). The
percentage of persons in consensual union is relatively high in all the localities (between 5%
and 11%), while those separated is very low in all localities (between 1.0% and 3%) when
compared with the proportion never married and married.
Table 2.2: Distribution of the population (in millions)
by age group, sex and dependency ratio
Age
Sex
Male Female Total
0 - 4 1.7 1.7 3.4
5 - 9 1.8 1.7 3.6
10 - 14 1.7 1.7 3.4
15 - 19 1.6 1.7 3.4
20 - 24 0.8 0.9 1.6
25 - 29 0.9 1.1 1.9
30 - 34 0.8 0.9 1.7
35 - 39 0.7 0.8 1.5
40 - 44 0.6 0.7 1.3
45 - 49 0.5 0.6 1.1
50 - 54 0.4 0.5 0.9
55 - 59 0.3 0.3 0.7
60 - 64 0.2 0.3 0.5
65+ 0.6 0.7 1.3
Total 12.7 13.7 26.4
Dependency ratio 85.9 73.8 79.5
11
Table 2.3: Population by marital status and locality (percent)
Locality
Marital status Accra
(GAMA)
Other
urban
Rural
Coastal
Rural
Forest
Rural
Savannah Total
Never married
46.1
44.5
39.9
39.3
39.5 42.3
Consensual union
6.5
5.8
7.8
10.6
5.1 7.1
Married
36.6
37.9
37.8
38.2
47.7 39.4
Separated
3.2
2.3
2.4
2.2
1.0 2.2
Divorced
3.2
4.0
4.3
3.9
1.3 3.4
Widowed
4.4
5.6
7.8
5.9
5.4 5.6
Total 100.0 100.0 100.0 100.0 100.0 100.0
2.5 Educational attainment
Table 2.4 indicates that 37.1 percent of the population aged 5 years and older has attained less
than Middle School Leaving Certificate/Basic Education Certificate (MSLC/BECE) whereas
25.7 percent has never been to school. The table further indicates that the highest proportion
of males in urban areas (32.9%) have attained less than MSLC/BECE education. Males who
have never been to school constitute 13.7 percent. Among the female population in urban
areas, 34.9 percent has attained less than MSLC/BECE education and 16.9 percent has
attained higher education. Among the rural population, males who have attained less than
MSLC/BECE education is slightly higher (41.0%) than females (39.8%). The proportion of
females in rural areas (3.9%) who have attained secondary school or higher education is
much lower than males (8.2%). A careful observation of the table shows that the proportion
of both males and females who have attained less than MSLC/BECE education is higher in
both urban and rural localities.
Table 2.4: Educational attainment of the population 5 years and older by sex and
locality type
Level of education
Urban
Rural
Total
Male Female Total Male Female Total Male Female Total
Never been to school 13.7 21.6 17.9
27.7 39.6 33.7
20.8 30.2 25.7
Less than MSLC/BECE 32.9 34.9 33.9
41.0 39.8 40.4
36.9 37.2 37.1
MSLC/BECE/Vocational 28.3 26.6 27.4
23.1 16.8 19.9
25.7 21.9 23.7
Secondary/SSS/SHS and
higher 25.1 16.9 20.7
8.2 3.9 6.0
16.6 10.7 13.5
Total 100.0 100.0 100.0 100.0 100.0 100.0 100.0 100.0 100.0
2.6 Literacy
Information on literacy was collected from the population 11 years and older. From Table
2.5, 40.8 percent of the population 11 years and older in Ghana are literate. This is made up
of 34.2 percent females and 48.2 percent males. At the regional level, Greater Accra (52.3%)
has the highest proportion of literate population followed by the Ashanti region (50.0%). The
Upper East region (11.2%) has the least proportion of literate population. The Ashanti region
has the highest proportion of both males (69.0%) and females (53.8%) who are literate and
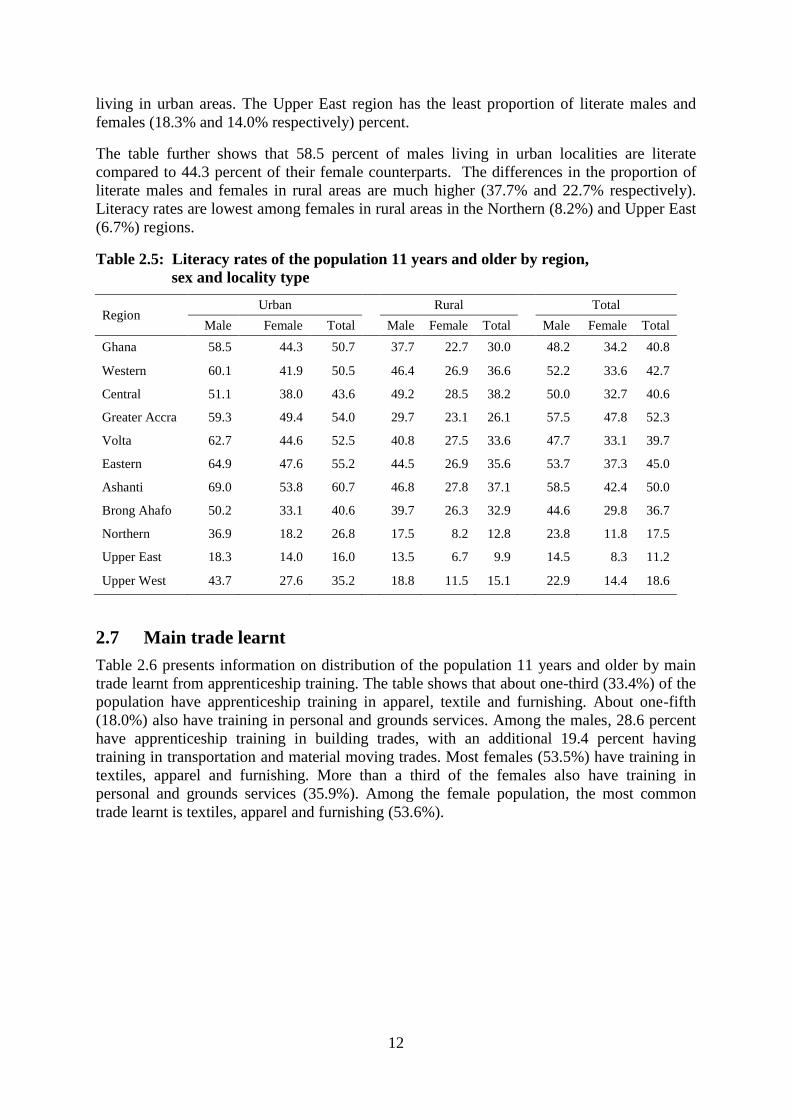
12
living in urban areas. The Upper East region has the least proportion of literate males and
females (18.3% and 14.0% respectively) percent.
The table further shows that 58.5 percent of males living in urban localities are literate
compared to 44.3 percent of their female counterparts. The differences in the proportion of
literate males and females in rural areas are much higher (37.7% and 22.7% respectively).
Literacy rates are lowest among females in rural areas in the Northern (8.2%) and Upper East
(6.7%) regions.
Table 2.5: Literacy rates of the population 11 years and older by region,
sex and locality type
Region Urban Rural Total
Male Female Total Male Female Total Male Female Total
Ghana 58.5 44.3 50.7 37.7 22.7 30.0 48.2 34.2 40.8
Western 60.1 41.9 50.5
46.4 26.9 36.6
52.2 33.6 42.7
Central 51.1 38.0 43.6
49.2 28.5 38.2
50.0 32.7 40.6
Greater Accra 59.3 49.4 54.0
29.7 23.1 26.1
57.5 47.8 52.3
Volta 62.7 44.6 52.5
40.8 27.5 33.6
47.7 33.1 39.7
Eastern 64.9 47.6 55.2
44.5 26.9 35.6
53.7 37.3 45.0
Ashanti 69.0 53.8 60.7
46.8 27.8 37.1
58.5 42.4 50.0
Brong Ahafo 50.2 33.1 40.6
39.7 26.3 32.9
44.6 29.8 36.7
Northern 36.9 18.2 26.8
17.5 8.2 12.8
23.8 11.8 17.5
Upper East 18.3 14.0 16.0
13.5 6.7 9.9
14.5 8.3 11.2
Upper West 43.7 27.6 35.2 18.8 11.5 15.1 22.9 14.4 18.6
2.7 Main trade learnt
Table 2.6 presents information on distribution of the population 11 years and older by main
trade learnt from apprenticeship training. The table shows that about one-third (33.4%) of the
population have apprenticeship training in apparel, textile and furnishing. About one-fifth
(18.0%) also have training in personal and grounds services. Among the males, 28.6 percent
have apprenticeship training in building trades, with an additional 19.4 percent having
training in transportation and material moving trades. Most females (53.5%) have training in
textiles, apparel and furnishing. More than a third of the females also have training in
personal and grounds services (35.9%). Among the female population, the most common
trade learnt is textiles, apparel and furnishing (53.6%).
13
Table 2.6: Main trade learnt of population 11 years and older by sex and
the locality type
Type of trade
Sex
Male Female Total
Food preparation/processing 0.9 7.0 3.9
Health service and related trade 0.2 0.2 0.2
Personal/grounds services 1.0 35.9 18.0
Building trades 28.6 0.2 14.8
Automotive trades 14.5 0.1 7.5
Electrical trades 7.6 0.2 4.0
Mechanical trades 9.4 0.2 4.9
Fishing/hunting/forestry 0.6 0.3 0.5
Textile, apparel and furnishing 14.3 53.6 33.4
Other production-related trades 1.1 1.8 1.4
Transportation and material moving trades 19.4 0.1 10.0
Visual and performance artists 0.9 0.0 0.4
Administrative/support services 0.0 0.1 0.1
Other trades 1.5 0.3 0.9
Total 100.0 100.0 100.0
Table 2.7 provides information on the average length of time spent on apprenticeship training
for the population 15 years and older. On the average, it takes about 35 months (almost three
years) to complete apprenticeship training. The longest periods spent on apprenticeship
training are in the areas of electrical works (38.2 months) and health service and related
activities (37.6 months). Generally, males take a longer duration (35.6 months) to complete
apprenticeship training than females (34.3 months). The longest average duration of
apprenticeship training for males is spent on health service and related activities (38.6
months) while the highest for females is automotive apprenticeship (40.0 months).
Apprenticeship training in the urban areas takes a relatively longer period (average 35.3
months) to complete than similar training undertaken in rural areas (average 34.6 months).
Table 2.7: Average length of time (months) spent on apprenticeship training
by main trade, locality and sex
Main trade learnt
Urban Rural Ghana
Male Female Total Male Female Total Male Female Total
Food preparation processing and
beverage services 30.0 32.0 31.8 32.2 31.9 31.9 31.1 32.0 31.9
Health service and related activities 40.5 40.2 40.4
36.0 34.0 34.8
38.6 36.8 37.6
Personal/grounds service 35.5 34.6 34.7
31.8 34.6 34.5
34.0 34.6 34.6
Building 36.5 36.0 36.5
36.1 36.8 36.1
36.3 36.6 36.3
Automotive 38.2 39.0 38.3
35.3 42.0 35.4
36.9 40.0 36.9
Electrical 38.9 36.0 38.8
37.1 0.0 37.1
38.2 36.0 38.2
Mechanical 37.9 40.0 38.0
37.8 36.0 37.7
37.9 38.4 37.9
Fishing/Hunting/Forestry 26.2 32.0 27.3
35.5 33.2 34.3
32.1 33.1 32.6
Textile, Apparel and Furnishing 35.8 34.9 35.1
34.4 34.5 34.5
35.1 34.7 34.8
Other production related trades 35.4 25.2 29.2
27.8 24.2 25.3
31.1 24.6 26.8
Transportation and material
moving trades 33.1 44.0 33.1
33.0 32.8 33.0
33.0 34.4 33.0
Visual and Performance Artists 31.3 0.0 31.3
33.9 0.0 33.9
32.2 0.0 32.2
Administrative/Support Services 0.0 36.0 36.0
36.0 0.0 36.0
36.0 36.0 36.0
Others 33.0 40.5 34.0
31.7 30.3 31.5
32.3 34.0 32.6
Total 36.1 34.5 35.3 35.0 34.0 34.6 35.6 34.3 35.0
14
CHAPTER THREE
ECONOMIC CHARACTERISTICS AND ACTIVITIES
3.1 Introduction
The overall development of a country is based on the production of goods and services by its
population. Critical to the production process is the human capital of the country. Although
all persons irrespective of age and sex consume the goods and services produced, only a
section of the population, that is, the working population, often referred to as the “employed”
population, produces them. The type of economic activity pursued is influenced by the nature
of the economy and level of socio-economic development (Hull, 2009). Generally, the larger
the employed population, the more wealth is created, leading to the general well-being of the
population. In Ghana, a number of job opportunities have been created over the years in a
wide range of economic activities in both the public and private sectors.
Population censuses provide data on the labour force and economic characteristics of the
population. A detailed study of the dynamics of the population and the labour market,
however, helps to identify the employment opportunities available and the structure of the
economy. This chapter, therefore, analyses the economic activities undertaken, the
economically active and economically not active population, employed and unemployed
population. Each of these population characteristics are analyzed by age, sex, locality of
residence (urban or rural area), marital status, level of education, region, sector and status of
employment.
The question on economic activity was asked of all persons 5 years and older who engaged in
any economic activity for pay (cash or in-kind) or profit or family gain for at least one hour
during the seven days preceding the interview date.
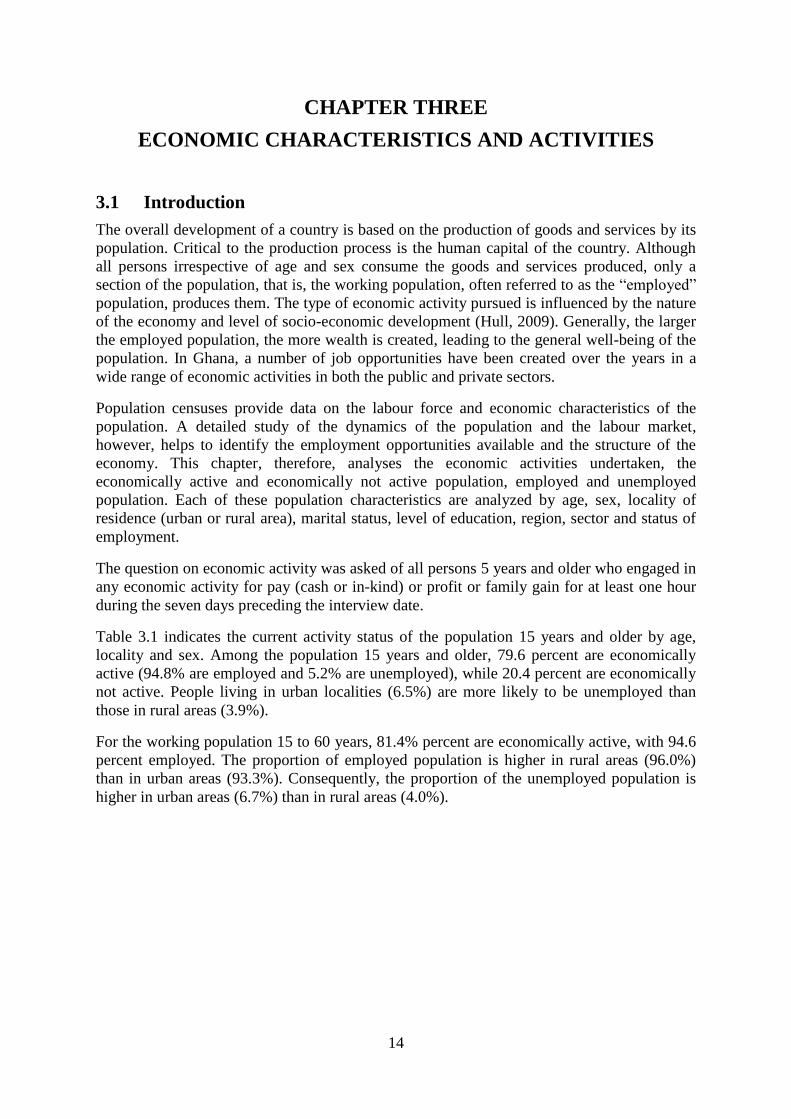
Table 3.1 indicates the current activity status of the population 15 years and older by age,
locality and sex. Among the population 15 years and older, 79.6 percent are economically
active (94.8% are employed and 5.2% are unemployed), while 20.4 percent are economically
not active. People living in urban localities (6.5%) are more likely to be unemployed than
those in rural areas (3.9%).
For the working population 15 to 60 years, 81.4% percent are economically active, with 94.6
percent employed. The proportion of employed population is higher in rural areas (96.0%)
than in urban areas (93.3%). Consequently, the proportion of the unemployed population is
higher in urban areas (6.7%) than in rural areas (4.0%).
15
Table 3.1: Current activity status of population 5 years and older by age group,
locality and sex
Activity
status/Age group
All Urban
Rural
Total Male Female Total Male Female Total Male Female
Population 15-60 62.6 61.0 64.0 65.8 64.5 67.0
59.2 57.5 60.8
Currently active 81.4 83.6 79.5 76.7 79.7 74.2
86.8 87.8 85.9
Employed 94.6 95.0 94.3 93.3 93.7 92.8
96.0 96.3 95.7
Unemployed 5.4 5.0 5.7 6.7 6.3 7.2
4.0 3.7 4.3
Currently inactive 18.6 16.4 20.5 23.3 20.3 25.8
13.2 12.2 14.1
Population 15+ 69.6 67.5 71.5 71.9 70.0 73.6
67.2 65.2 69.1
Currently active 79.6 82.2 77.3 74.7 77.9 72.1
84.9 86.7 83.2
Employed 94.8 95.2 94.5 93.5 93.9 93.1
96.1 96.4 95.9
Unemployed 5.2 4.8 5.5 6.5 6.1 6.9
3.9 3.6 4.1
Currently inactive 20.4 17.8 22.7 25.3 22.1 27.9
15.1 13.3 16.8
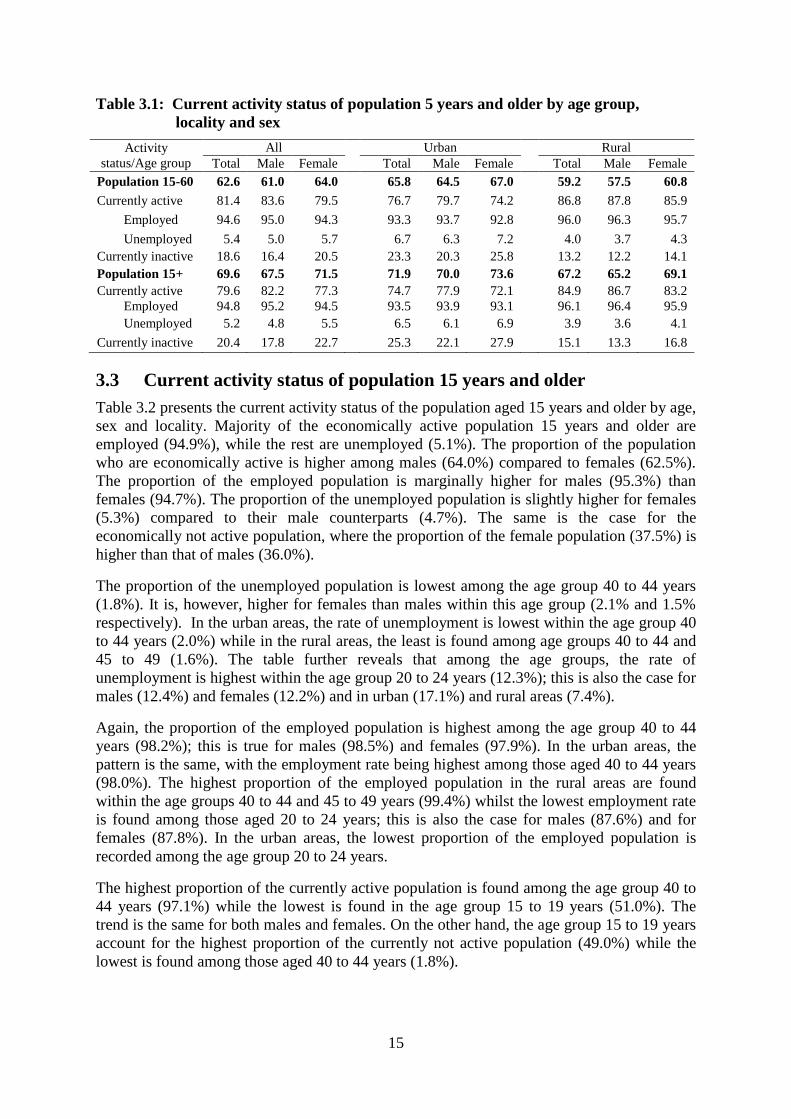
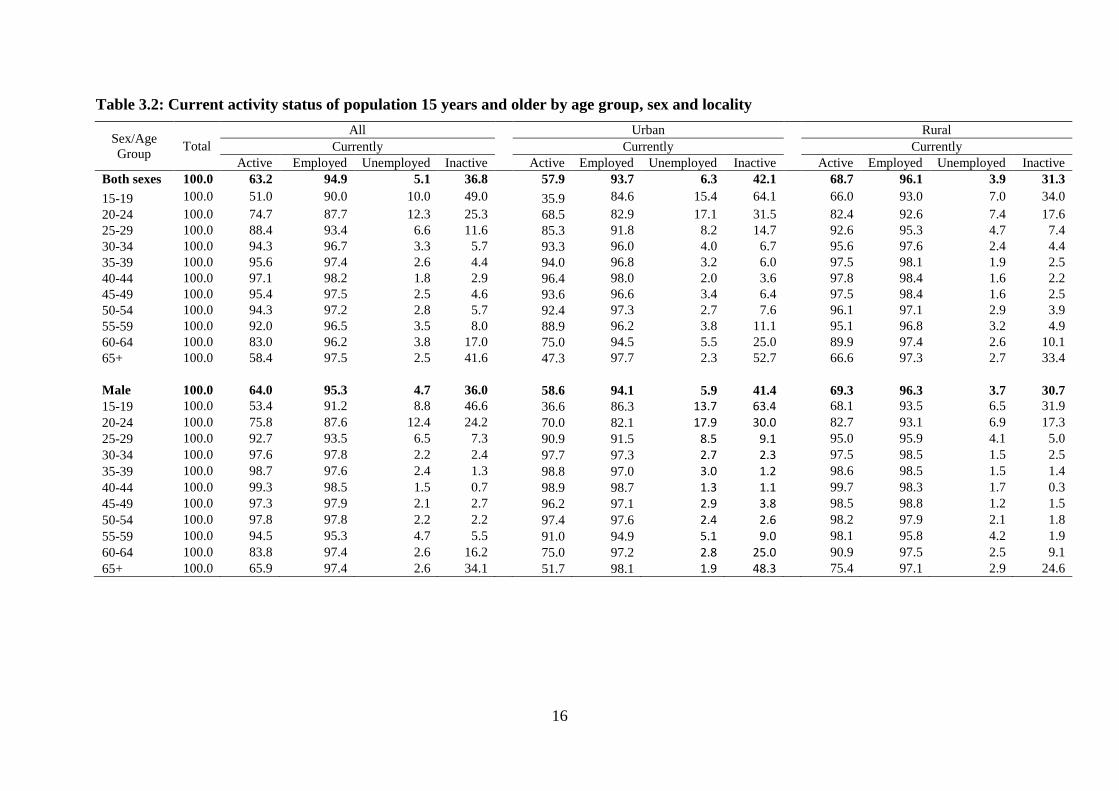
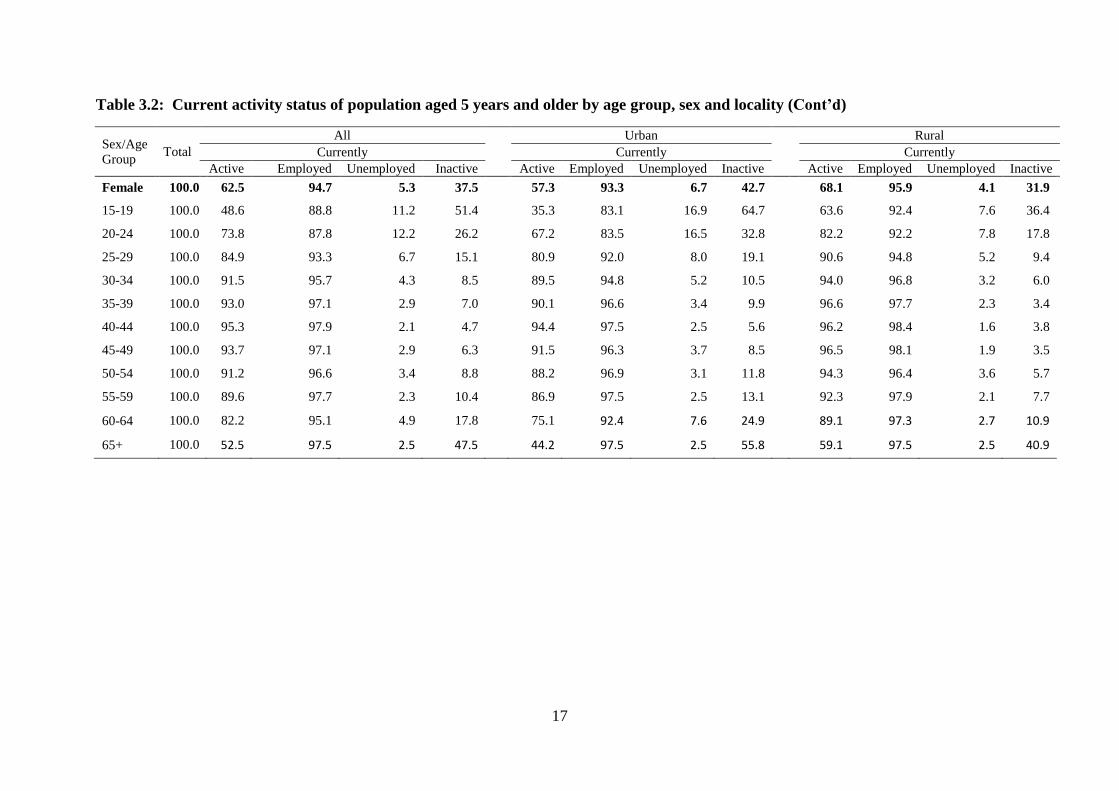
3.3 Current activity status of population 15 years and older
Table 3.2 presents the current activity status of the population aged 15 years and older by age,
sex and locality. Majority of the economically active population 15 years and older are
employed (94.9%), while the rest are unemployed (5.1%). The proportion of the population
who are economically active is higher among males (64.0%) compared to females (62.5%).
The proportion of the employed population is marginally higher for males (95.3%) than
females (94.7%). The proportion of the unemployed population is slightly higher for females
(5.3%) compared to their male counterparts (4.7%). The same is the case for the
economically not active population, where the proportion of the female population (37.5%) is
higher than that of males (36.0%).
The proportion of the unemployed population is lowest among the age group 40 to 44 years
(1.8%). It is, however, higher for females than males within this age group (2.1% and 1.5%
respectively). In the urban areas, the rate of unemployment is lowest within the age group 40
to 44 years (2.0%) while in the rural areas, the least is found among age groups 40 to 44 and
45 to 49 (1.6%). The table further reveals that among the age groups, the rate of
unemployment is highest within the age group 20 to 24 years (12.3%); this is also the case for
males (12.4%) and females (12.2%) and in urban (17.1%) and rural areas (7.4%).
Again, the proportion of the employed population is highest among the age group 40 to 44
years (98.2%); this is true for males (98.5%) and females (97.9%). In the urban areas, the
pattern is the same, with the employment rate being highest among those aged 40 to 44 years
(98.0%). The highest proportion of the employed population in the rural areas are found
within the age groups 40 to 44 and 45 to 49 years (99.4%) whilst the lowest employment rate
is found among those aged 20 to 24 years; this is also the case for males (87.6%) and for
females (87.8%). In the urban areas, the lowest proportion of the employed population is
recorded among the age group 20 to 24 years.
The highest proportion of the currently active population is found among the age group 40 to
44 years (97.1%) while the lowest is found in the age group 15 to 19 years (51.0%). The
trend is the same for both males and females. On the other hand, the age group 15 to 19 years
account for the highest proportion of the currently not active population (49.0%) while the
lowest is found among those aged 40 to 44 years (1.8%).
16
Table 3.2: Current activity status of population 15 years and older by age group, sex and locality
Sex/Age
Group Total
All
Urban
Rural
Currently
Currently
Currently
Active Employed Unemployed Inactive Active Employed Unemployed Inactive Active Employed Unemployed Inactive
Both sexes 100.0 63.2 94.9 5.1 36.8
57.9 93.7 6.3 42.1
68.7 96.1 3.9 31.3
15-19 100.0 51.0 90.0 10.0 49.0
35.9 84.6 15.4 64.1
66.0 93.0 7.0 34.0
20-24 100.0 74.7 87.7 12.3 25.3
68.5 82.9 17.1 31.5
82.4 92.6 7.4 17.6
25-29 100.0 88.4 93.4 6.6 11.6
85.3 91.8 8.2 14.7
92.6 95.3 4.7 7.4
30-34 100.0 94.3 96.7 3.3 5.7
93.3 96.0 4.0 6.7
95.6 97.6 2.4 4.4
35-39 100.0 95.6 97.4 2.6 4.4
94.0 96.8 3.2 6.0
97.5 98.1 1.9 2.5
40-44 100.0 97.1 98.2 1.8 2.9
96.4 98.0 2.0 3.6
97.8 98.4 1.6 2.2
45-49 100.0 95.4 97.5 2.5 4.6
93.6 96.6 3.4 6.4
97.5 98.4 1.6 2.5
50-54 100.0 94.3 97.2 2.8 5.7
92.4 97.3 2.7 7.6
96.1 97.1 2.9 3.9
55-59 100.0 92.0 96.5 3.5 8.0
88.9 96.2 3.8 11.1
95.1 96.8 3.2 4.9
60-64 100.0 83.0 96.2 3.8 17.0
75.0 94.5 5.5 25.0
89.9 97.4 2.6 10.1
65+ 100.0 58.4 97.5 2.5 41.6
47.3 97.7 2.3 52.7
66.6 97.3 2.7 33.4
Male 100.0 64.0 95.3 4.7 36.0
58.6 94.1 5.9 41.4
69.3 96.3 3.7 30.7
15-19 100.0 53.4 91.2 8.8 46.6
36.6 86.3 13.7 63.4
68.1 93.5 6.5 31.9
20-24 100.0 75.8 87.6 12.4 24.2
70.0 82.1 17.9 30.0
82.7 93.1 6.9 17.3
25-29 100.0 92.7 93.5 6.5 7.3
90.9 91.5 8.5 9.1
95.0 95.9 4.1 5.0
30-34 100.0 97.6 97.8 2.2 2.4
97.7 97.3 2.7 2.3
97.5 98.5 1.5 2.5
35-39 100.0 98.7 97.6 2.4 1.3
98.8 97.0 3.0 1.2
98.6 98.5 1.5 1.4
40-44 100.0 99.3 98.5 1.5 0.7
98.9 98.7 1.3 1.1
99.7 98.3 1.7 0.3
45-49 100.0 97.3 97.9 2.1 2.7
96.2 97.1 2.9 3.8
98.5 98.8 1.2 1.5
50-54 100.0 97.8 97.8 2.2 2.2
97.4 97.6 2.4 2.6
98.2 97.9 2.1 1.8
55-59 100.0 94.5 95.3 4.7 5.5
91.0 94.9 5.1 9.0
98.1 95.8 4.2 1.9
60-64 100.0 83.8 97.4 2.6 16.2
75.0 97.2 2.8 25.0
90.9 97.5 2.5 9.1
65+ 100.0 65.9 97.4 2.6 34.1
51.7 98.1 1.9 48.3
75.4 97.1 2.9 24.6
17
Table 3.2: Current activity status of population aged 5 years and older by age group, sex and locality (Cont’d)
Sex/Age
Group Total
All Urban Rural
Currently
Currently
Currently
Active Employed Unemployed Inactive Active Employed Unemployed Inactive Active Employed Unemployed Inactive
Female 100.0 62.5 94.7 5.3 37.5
57.3 93.3 6.7 42.7
68.1 95.9 4.1 31.9
15-19 100.0 48.6 88.8 11.2 51.4
35.3 83.1 16.9 64.7
63.6 92.4 7.6 36.4
20-24 100.0 73.8 87.8 12.2 26.2
67.2 83.5 16.5 32.8
82.2 92.2 7.8 17.8
25-29 100.0 84.9 93.3 6.7 15.1
80.9 92.0 8.0 19.1
90.6 94.8 5.2 9.4
30-34 100.0 91.5 95.7 4.3 8.5
89.5 94.8 5.2 10.5
94.0 96.8 3.2 6.0
35-39 100.0 93.0 97.1 2.9 7.0
90.1 96.6 3.4 9.9
96.6 97.7 2.3 3.4
40-44 100.0 95.3 97.9 2.1 4.7
94.4 97.5 2.5 5.6
96.2 98.4 1.6 3.8
45-49 100.0 93.7 97.1 2.9 6.3
91.5 96.3 3.7 8.5
96.5 98.1 1.9 3.5
50-54 100.0 91.2 96.6 3.4 8.8
88.2 96.9 3.1 11.8
94.3 96.4 3.6 5.7
55-59 100.0 89.6 97.7 2.3 10.4
86.9 97.5 2.5 13.1
92.3 97.9 2.1 7.7
60-64 100.0 82.2 95.1 4.9 17.8
75.1 92.4 7.6 24.9
89.1 97.3 2.7 10.9
65+ 100.0 52.5 97.5 2.5 47.5 44.2 97.5 2.5 55.8 59.1 97.5 2.5 40.9
18
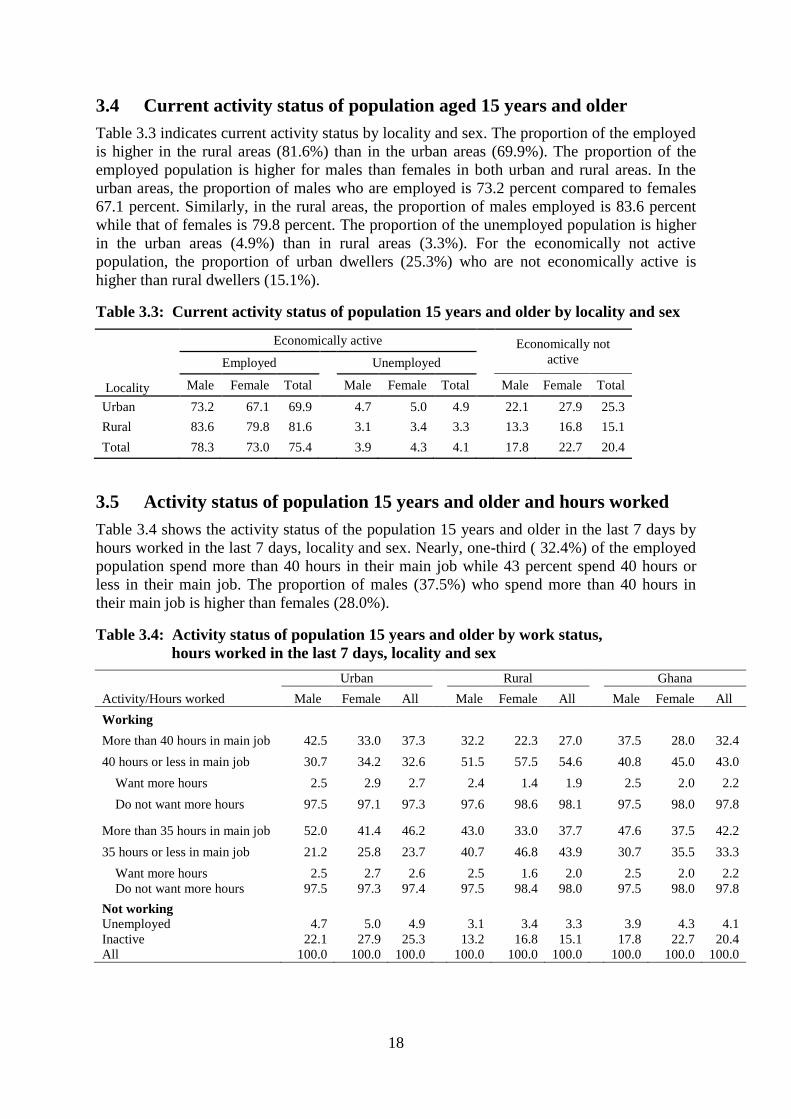
3.4 Current activity status of population aged 15 years and older
Table 3.3 indicates current activity status by locality and sex. The proportion of the employed
is higher in the rural areas (81.6%) than in the urban areas (69.9%). The proportion of the
employed population is higher for males than females in both urban and rural areas. In the
urban areas, the proportion of males who are employed is 73.2 percent compared to females
67.1 percent. Similarly, in the rural areas, the proportion of males employed is 83.6 percent
while that of females is 79.8 percent. The proportion of the unemployed population is higher
in the urban areas (4.9%) than in rural areas (3.3%). For the economically not active
population, the proportion of urban dwellers (25.3%) who are not economically active is
higher than rural dwellers (15.1%).
Table 3.3: Current activity status of population 15 years and older by locality and sex
Locality
Economically active Economically not
active Employed Unemployed
Male Female Total Male Female Total Male Female Total
Urban 73.2 67.1 69.9
4.7 5.0 4.9
22.1 27.9 25.3
Rural 83.6 79.8 81.6
3.1 3.4 3.3
13.3 16.8 15.1
Total 78.3 73.0 75.4 3.9 4.3 4.1 17.8 22.7 20.4
3.5 Activity status of population 15 years and older and hours worked
Table 3.4 shows the activity status of the population 15 years and older in the last 7 days by
hours worked in the last 7 days, locality and sex. Nearly, one-third ( 32.4%) of the employed
population spend more than 40 hours in their main job while 43 percent spend 40 hours or
less in their main job. The proportion of males (37.5%) who spend more than 40 hours in
their main job is higher than females (28.0%).
Table 3.4: Activity status of population 15 years and older by work status,
hours worked in the last 7 days, locality and sex
Activity/Hours worked
Urban Rural Ghana
Male Female All Male Female All Male Female All
Working
More than 40 hours in main job 42.5 33.0 37.3 32.2 22.3 27.0 37.5 28.0 32.4
40 hours or less in main job 30.7 34.2 32.6 51.5 57.5 54.6 40.8 45.0 43.0
Want more hours 2.5 2.9 2.7 2.4 1.4 1.9 2.5 2.0 2.2
Do not want more hours 97.5 97.1 97.3 97.6 98.6 98.1 97.5 98.0 97.8
More than 35 hours in main job 52.0 41.4 46.2 43.0 33.0 37.7 47.6 37.5 42.2
35 hours or less in main job 21.2 25.8 23.7 40.7 46.8 43.9 30.7 35.5 33.3
Want more hours 2.5 2.7 2.6 2.5 1.6 2.0 2.5 2.0 2.2
Do not want more hours 97.5 97.3 97.4 97.5 98.4 98.0 97.5 98.0 97.8
Not working
Unemployed 4.7 5.0 4.9 3.1 3.4 3.3 3.9 4.3 4.1
Inactive 22.1 27.9 25.3 13.2 16.8 15.1 17.8 22.7 20.4
All 100.0 100.0 100.0 100.0 100.0 100.0 100.0 100.0 100.0
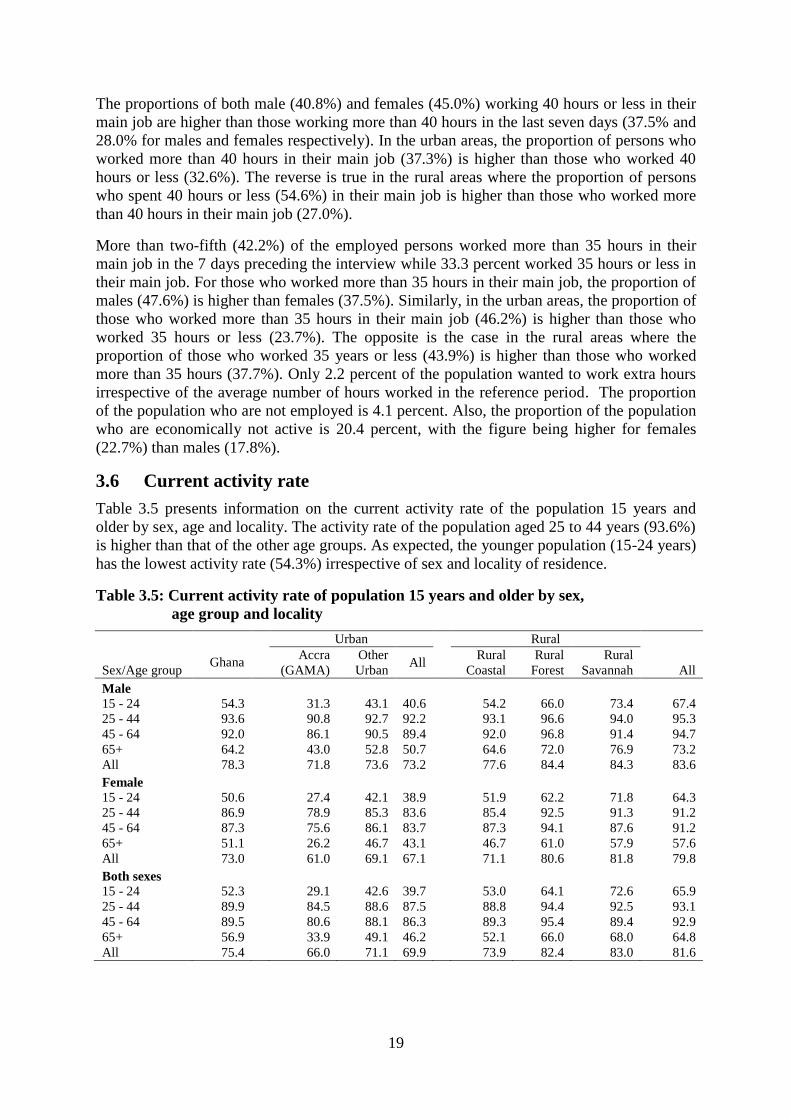
19
The proportions of both male (40.8%) and females (45.0%) working 40 hours or less in their
main job are higher than those working more than 40 hours in the last seven days (37.5% and
28.0% for males and females respectively). In the urban areas, the proportion of persons who
worked more than 40 hours in their main job (37.3%) is higher than those who worked 40
hours or less (32.6%). The reverse is true in the rural areas where the proportion of persons
who spent 40 hours or less (54.6%) in their main job is higher than those who worked more
than 40 hours in their main job (27.0%).
More than two-fifth (42.2%) of the employed persons worked more than 35 hours in their
main job in the 7 days preceding the interview while 33.3 percent worked 35 hours or less in
their main job. For those who worked more than 35 hours in their main job, the proportion of
males (47.6%) is higher than females (37.5%). Similarly, in the urban areas, the proportion of
those who worked more than 35 hours in their main job (46.2%) is higher than those who
worked 35 hours or less (23.7%). The opposite is the case in the rural areas where the
proportion of those who worked 35 years or less (43.9%) is higher than those who worked
more than 35 hours (37.7%). Only 2.2 percent of the population wanted to work extra hours
irrespective of the average number of hours worked in the reference period. The proportion
of the population who are not employed is 4.1 percent. Also, the proportion of the population
who are economically not active is 20.4 percent, with the figure being higher for females
(22.7%) than males (17.8%).
3.6 Current activity rate
Table 3.5 presents information on the current activity rate of the population 15 years and
older by sex, age and locality. The activity rate of the population aged 25 to 44 years (93.6%)
is higher than that of the other age groups. As expected, the younger population (15-24 years)
has the lowest activity rate (54.3%) irrespective of sex and locality of residence.
Table 3.5: Current activity rate of population 15 years and older by sex,
age group and locality
Ghana
Urban Rural
Sex/Age group
Accra
(GAMA)
Other
Urban All
Rural
Coastal
Rural
Forest
Rural
Savannah All
Male
15 - 24 54.3
31.3 43.1 40.6
54.2 66.0 73.4 67.4
25 - 44 93.6
90.8 92.7 92.2
93.1 96.6 94.0 95.3
45 - 64 92.0
86.1 90.5 89.4
92.0 96.8 91.4 94.7
65+ 64.2
43.0 52.8 50.7
64.6 72.0 76.9 73.2
All 78.3
71.8 73.6 73.2
77.6 84.4 84.3 83.6
Female
15 - 24 50.6
27.4 42.1 38.9
51.9 62.2 71.8 64.3
25 - 44 86.9
78.9 85.3 83.6
85.4 92.5 91.3 91.2
45 - 64 87.3
75.6 86.1 83.7
87.3 94.1 87.6 91.2
65+ 51.1
26.2 46.7 43.1
46.7 61.0 57.9 57.6
All 73.0
61.0 69.1 67.1
71.1 80.6 81.8 79.8
Both sexes
15 - 24 52.3
29.1 42.6 39.7
53.0 64.1 72.6 65.9
25 - 44 89.9
84.5 88.6 87.5
88.8 94.4 92.5 93.1
45 - 64 89.5
80.6 88.1 86.3
89.3 95.4 89.4 92.9
65+ 56.9
33.9 49.1 46.2
52.1 66.0 68.0 64.8
All 75.4 66.0 71.1 69.9 73.9 82.4 83.0 81.6
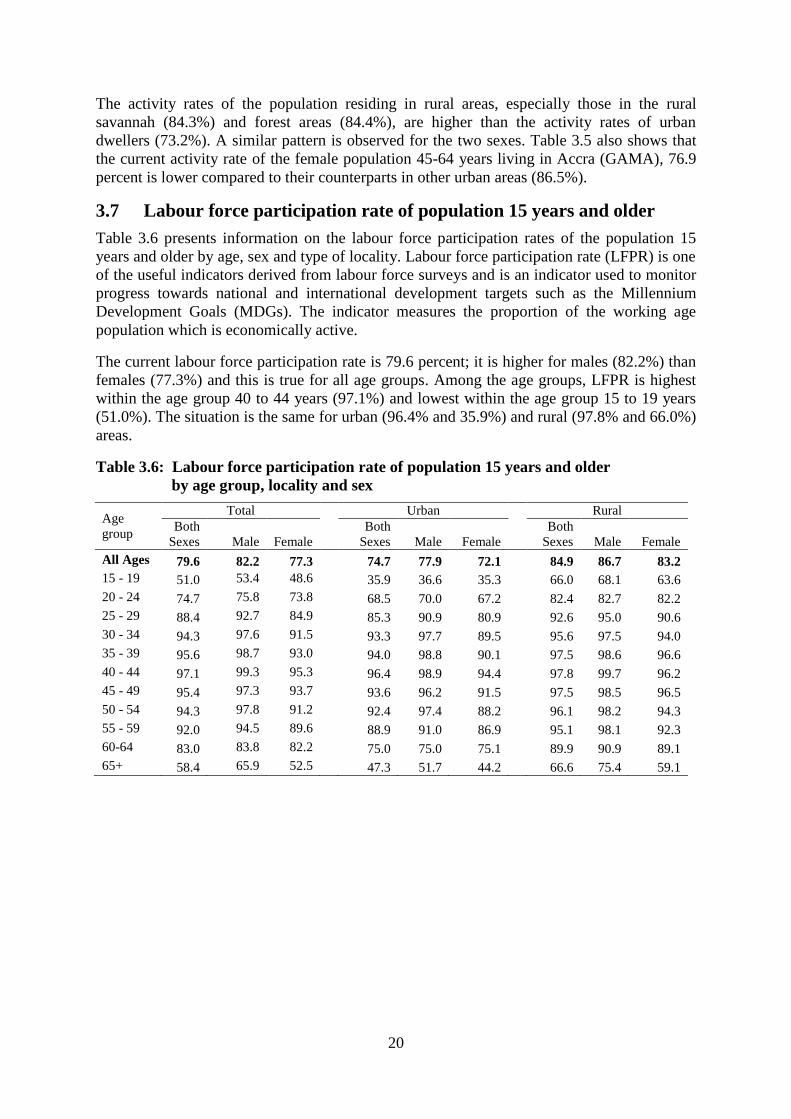
20
The activity rates of the population residing in rural areas, especially those in the rural
savannah (84.3%) and forest areas (84.4%), are higher than the activity rates of urban
dwellers (73.2%). A similar pattern is observed for the two sexes. Table 3.5 also shows that
the current activity rate of the female population 45-64 years living in Accra (GAMA), 76.9
percent is lower compared to their counterparts in other urban areas (86.5%).
3.7 Labour force participation rate of population 15 years and older
Table 3.6 presents information on the labour force participation rates of the population 15
years and older by age, sex and type of locality. Labour force participation rate (LFPR) is one
of the useful indicators derived from labour force surveys and is an indicator used to monitor
progress towards national and international development targets such as the Millennium
Development Goals (MDGs). The indicator measures the proportion of the working age
population which is economically active.
The current labour force participation rate is 79.6 percent; it is higher for males (82.2%) than
females (77.3%) and this is true for all age groups. Among the age groups, LFPR is highest
within the age group 40 to 44 years (97.1%) and lowest within the age group 15 to 19 years
(51.0%). The situation is the same for urban (96.4% and 35.9%) and rural (97.8% and 66.0%)
areas.
Table 3.6: Labour force participation rate of population 15 years and older
by age group, locality and sex
Age
group
Total Urban Rural
Both
Sexes Male Female
Both
Sexes Male Female
Both
Sexes Male Female
All Ages 79.6 82.2 77.3
74.7 77.9 72.1
84.9 86.7 83.2
15 - 19 51.0 53.4 48.6
35.9 36.6 35.3
66.0 68.1 63.6
20 - 24 74.7 75.8 73.8
68.5 70.0 67.2
82.4 82.7 82.2
25 - 29 88.4 92.7 84.9
85.3 90.9 80.9
92.6 95.0 90.6
30 - 34 94.3 97.6 91.5
93.3 97.7 89.5
95.6 97.5 94.0
35 - 39 95.6 98.7 93.0
94.0 98.8 90.1
97.5 98.6 96.6
40 - 44 97.1 99.3 95.3
96.4 98.9 94.4
97.8 99.7 96.2
45 - 49 95.4 97.3 93.7
93.6 96.2 91.5
97.5 98.5 96.5
50 - 54 94.3 97.8 91.2
92.4 97.4 88.2
96.1 98.2 94.3
55 - 59 92.0 94.5 89.6
88.9 91.0 86.9
95.1 98.1 92.3
60-64 83.0 83.8 82.2
75.0 75.0 75.1
89.9 90.9 89.1
65+ 58.4 65.9 52.5
47.3 51.7 44.2 66.6 75.4 59.1
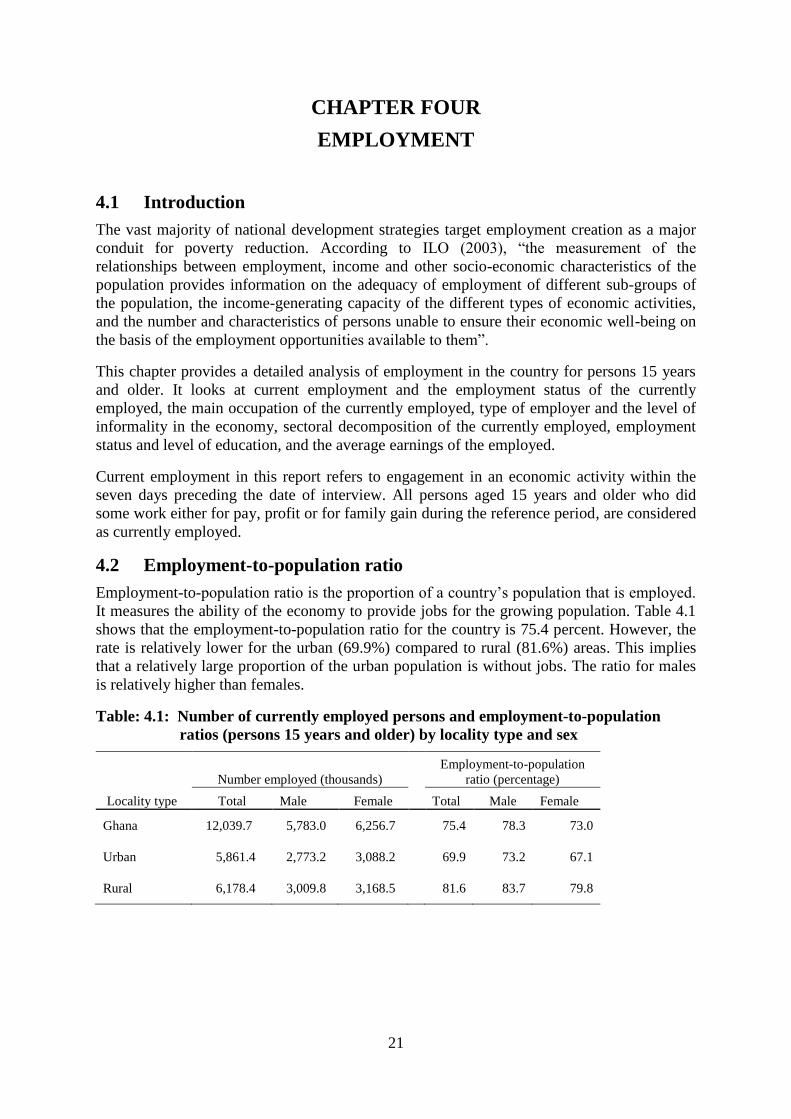
21
CHAPTER FOUR
EMPLOYMENT
4.1 Introduction
The vast majority of national development strategies target employment creation as a major
conduit for poverty reduction. According to ILO (2003), “the measurement of the
relationships between employment, income and other socio-economic characteristics of the
population provides information on the adequacy of employment of different sub-groups of
the population, the income-generating capacity of the different types of economic activities,
and the number and characteristics of persons unable to ensure their economic well-being on
the basis of the employment opportunities available to them”.
This chapter provides a detailed analysis of employment in the country for persons 15 years
and older. It looks at current employment and the employment status of the currently
employed, the main occupation of the currently employed, type of employer and the level of
informality in the economy, sectoral decomposition of the currently employed, employment
status and level of education, and the average earnings of the employed.
Current employment in this report refers to engagement in an economic activity within the
seven days preceding the date of interview. All persons aged 15 years and older who did
some work either for pay, profit or for family gain during the reference period, are considered
as currently employed.
4.2 Employment-to-population ratio
Employment-to-population ratio is the proportion of a country’s population that is employed.
It measures the ability of the economy to provide jobs for the growing population. Table 4.1
shows that the employment-to-population ratio for the country is 75.4 percent. However, the
rate is relatively lower for the urban (69.9%) compared to rural (81.6%) areas. This implies
that a relatively large proportion of the urban population is without jobs. The ratio for males
is relatively higher than females.
Table: 4.1: Number of currently employed persons and employment-to-population
ratios (persons 15 years and older) by locality type and sex
Locality type
Number employed (thousands)
Employment-to-population
ratio (percentage)
Total Male Female Total Male Female
Ghana 12,039.7 5,783.0 6,256.7 75.4 78.3 73.0
Urban 5,861.4 2,773.2 3,088.2 69.9 73.2 67.1
Rural 6,178.4 3,009.8 3,168.5 81.6 83.7 79.8
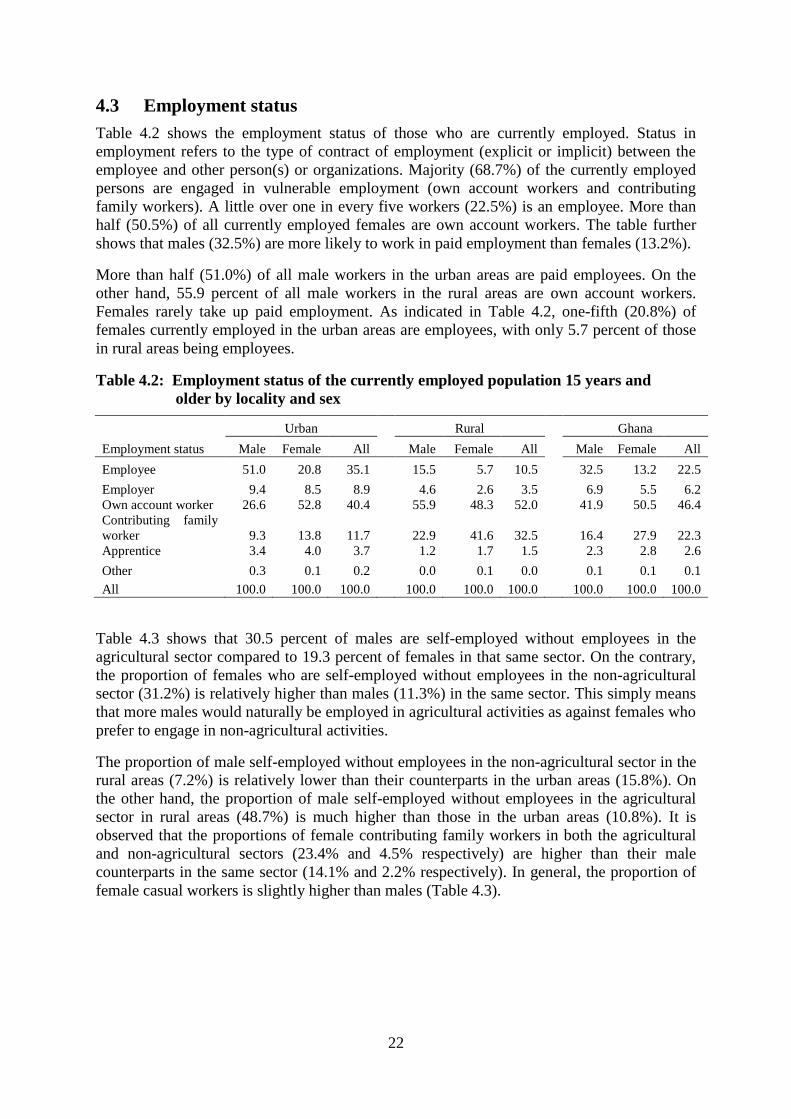
22
4.3 Employment status
Table 4.2 shows the employment status of those who are currently employed. Status in
employment refers to the type of contract of employment (explicit or implicit) between the
employee and other person(s) or organizations. Majority (68.7%) of the currently employed
persons are engaged in vulnerable employment (own account workers and contributing
family workers). A little over one in every five workers (22.5%) is an employee. More than
half (50.5%) of all currently employed females are own account workers. The table further
shows that males (32.5%) are more likely to work in paid employment than females (13.2%).
More than half (51.0%) of all male workers in the urban areas are paid employees. On the
other hand, 55.9 percent of all male workers in the rural areas are own account workers.
Females rarely take up paid employment. As indicated in Table 4.2, one-fifth (20.8%) of
females currently employed in the urban areas are employees, with only 5.7 percent of those
in rural areas being employees.
Table 4.2: Employment status of the currently employed population 15 years and
older by locality and sex
Employment status
Urban Rural Ghana
Male Female All Male Female All
Male Female All
Employee 51.0 20.8 35.1
15.5 5.7 10.5
32.5 13.2 22.5
Employer 9.4 8.5 8.9
4.6 2.6 3.5
6.9 5.5 6.2
Own account worker 26.6 52.8 40.4
55.9 48.3 52.0
41.9 50.5 46.4
Contributing family
worker 9.3 13.8 11.7
22.9 41.6 32.5
16.4 27.9 22.3
Apprentice 3.4 4.0 3.7
1.2 1.7 1.5
2.3 2.8 2.6
Other 0.3 0.1 0.2
0.0 0.1 0.0
0.1 0.1 0.1
All 100.0 100.0 100.0 100.0 100.0 100.0 100.0 100.0 100.0
Table 4.3 shows that 30.5 percent of males are self-employed without employees in the
agricultural sector compared to 19.3 percent of females in that same sector. On the contrary,
the proportion of females who are self-employed without employees in the non-agricultural
sector (31.2%) is relatively higher than males (11.3%) in the same sector. This simply means
that more males would naturally be employed in agricultural activities as against females who
prefer to engage in non-agricultural activities.
The proportion of male self-employed without employees in the non-agricultural sector in the
rural areas (7.2%) is relatively lower than their counterparts in the urban areas (15.8%). On
the other hand, the proportion of male self-employed without employees in the agricultural
sector in rural areas (48.7%) is much higher than those in the urban areas (10.8%). It is
observed that the proportions of female contributing family workers in both the agricultural
and non-agricultural sectors (23.4% and 4.5% respectively) are higher than their male
counterparts in the same sector (14.1% and 2.2% respectively). In general, the proportion of
female casual workers is slightly higher than males (Table 4.3).
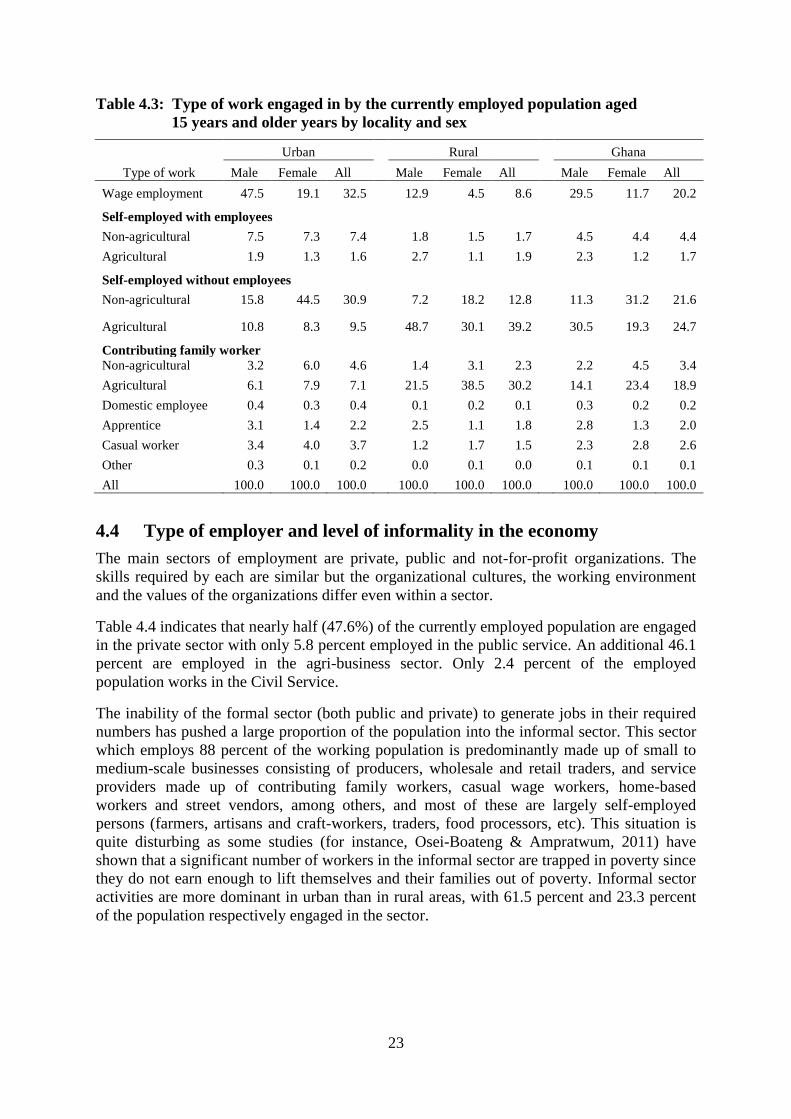
23
Table 4.3: Type of work engaged in by the currently employed population aged
15 years and older years by locality and sex
Type of work
Urban Rural Ghana
Male Female All Male Female All Male Female All
Wage employment 47.5 19.1 32.5 12.9 4.5 8.6 29.5 11.7 20.2
Self-employed with employees
Non-agricultural 7.5 7.3 7.4 1.8 1.5 1.7 4.5 4.4 4.4
Agricultural 1.9 1.3 1.6 2.7 1.1 1.9 2.3 1.2 1.7
Self-employed without employees
Non-agricultural 15.8 44.5 30.9 7.2 18.2 12.8 11.3 31.2 21.6
Agricultural 10.8 8.3 9.5
48.7 30.1 39.2
30.5 19.3 24.7
Contributing family worker
Non-agricultural 3.2 6.0 4.6 1.4 3.1 2.3 2.2 4.5 3.4
Agricultural 6.1 7.9 7.1 21.5 38.5 30.2 14.1 23.4 18.9
Domestic employee 0.4 0.3 0.4 0.1 0.2 0.1 0.3 0.2 0.2
Apprentice 3.1 1.4 2.2 2.5 1.1 1.8 2.8 1.3 2.0
Casual worker 3.4 4.0 3.7 1.2 1.7 1.5 2.3 2.8 2.6
Other 0.3 0.1 0.2 0.0 0.1 0.0 0.1 0.1 0.1
All 100.0 100.0 100.0 100.0 100.0 100.0 100.0 100.0 100.0
4.4 Type of employer and level of informality in the economy
The main sectors of employment are private, public and not-for-profit organizations. The
skills required by each are similar but the organizational cultures, the working environment
and the values of the organizations differ even within a sector.
Table 4.4 indicates that nearly half (47.6%) of the currently employed population are engaged
in the private sector with only 5.8 percent employed in the public service. An additional 46.1
percent are employed in the agri-business sector. Only 2.4 percent of the employed
population works in the Civil Service.
The inability of the formal sector (both public and private) to generate jobs in their required
numbers has pushed a large proportion of the population into the informal sector. This sector
which employs 88 percent of the working population is predominantly made up of small to
medium-scale businesses consisting of producers, wholesale and retail traders, and service
providers made up of contributing family workers, casual wage workers, home-based
workers and street vendors, among others, and most of these are largely self-employed
persons (farmers, artisans and craft-workers, traders, food processors, etc). This situation is
quite disturbing as some studies (for instance, Osei-Boateng & Ampratwum, 2011) have
shown that a significant number of workers in the informal sector are trapped in poverty since
they do not earn enough to lift themselves and their families out of poverty. Informal sector
activities are more dominant in urban than in rural areas, with 61.5 percent and 23.3 percent
of the population respectively engaged in the sector.
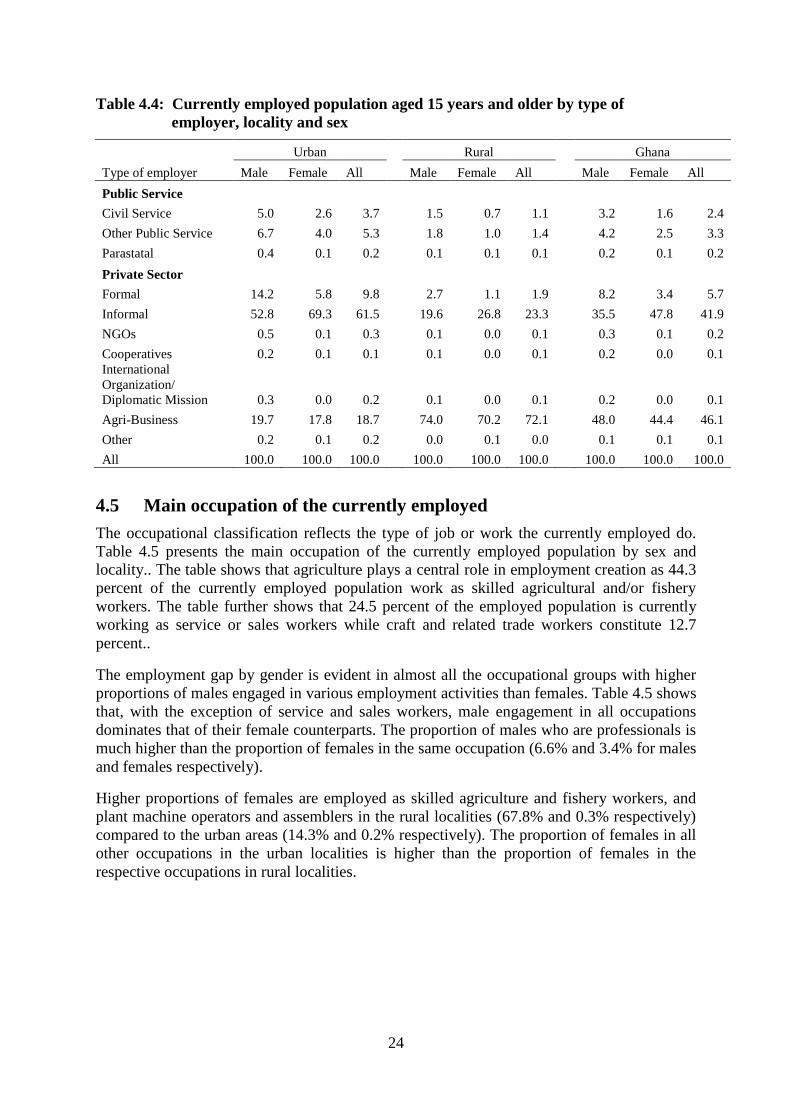
24
Table 4.4: Currently employed population aged 15 years and older by type of
employer, locality and sex
Type of employer
Urban Rural Ghana
Male Female All Male Female All Male Female All
Public Service
Civil Service 5.0 2.6 3.7 1.5 0.7 1.1 3.2 1.6 2.4
Other Public Service 6.7 4.0 5.3 1.8 1.0 1.4 4.2 2.5 3.3
Parastatal 0.4 0.1 0.2 0.1 0.1 0.1 0.2 0.1 0.2
Private Sector
Formal 14.2 5.8 9.8 2.7 1.1 1.9 8.2 3.4 5.7
Informal 52.8 69.3 61.5 19.6 26.8 23.3 35.5 47.8 41.9
NGOs 0.5 0.1 0.3 0.1 0.0 0.1 0.3 0.1 0.2
Cooperatives 0.2 0.1 0.1 0.1 0.0 0.1 0.2 0.0 0.1
International
Organization/
Diplomatic Mission 0.3 0.0 0.2
0.1 0.0 0.1
0.2 0.0 0.1
Agri-Business 19.7 17.8 18.7 74.0 70.2 72.1 48.0 44.4 46.1
Other 0.2 0.1 0.2 0.0 0.1 0.0 0.1 0.1 0.1
All 100.0 100.0 100.0 100.0 100.0 100.0 100.0 100.0 100.0
4.5 Main occupation of the currently employed
The occupational classification reflects the type of job or work the currently employed do.
Table 4.5 presents the main occupation of the currently employed population by sex and
locality.. The table shows that agriculture plays a central role in employment creation as 44.3
percent of the currently employed population work as skilled agricultural and/or fishery
workers. The table further shows that 24.5 percent of the employed population is currently
working as service or sales workers while craft and related trade workers constitute 12.7
percent..
The employment gap by gender is evident in almost all the occupational groups with higher
proportions of males engaged in various employment activities than females. Table 4.5 shows
that, with the exception of service and sales workers, male engagement in all occupations
dominates that of their female counterparts. The proportion of males who are professionals is
much higher than the proportion of females in the same occupation (6.6% and 3.4% for males
and females respectively).
Higher proportions of females are employed as skilled agriculture and fishery workers, and
plant machine operators and assemblers in the rural localities (67.8% and 0.3% respectively)
compared to the urban areas (14.3% and 0.2% respectively). The proportion of females in all
other occupations in the urban localities is higher than the proportion of females in the
respective occupations in rural localities.
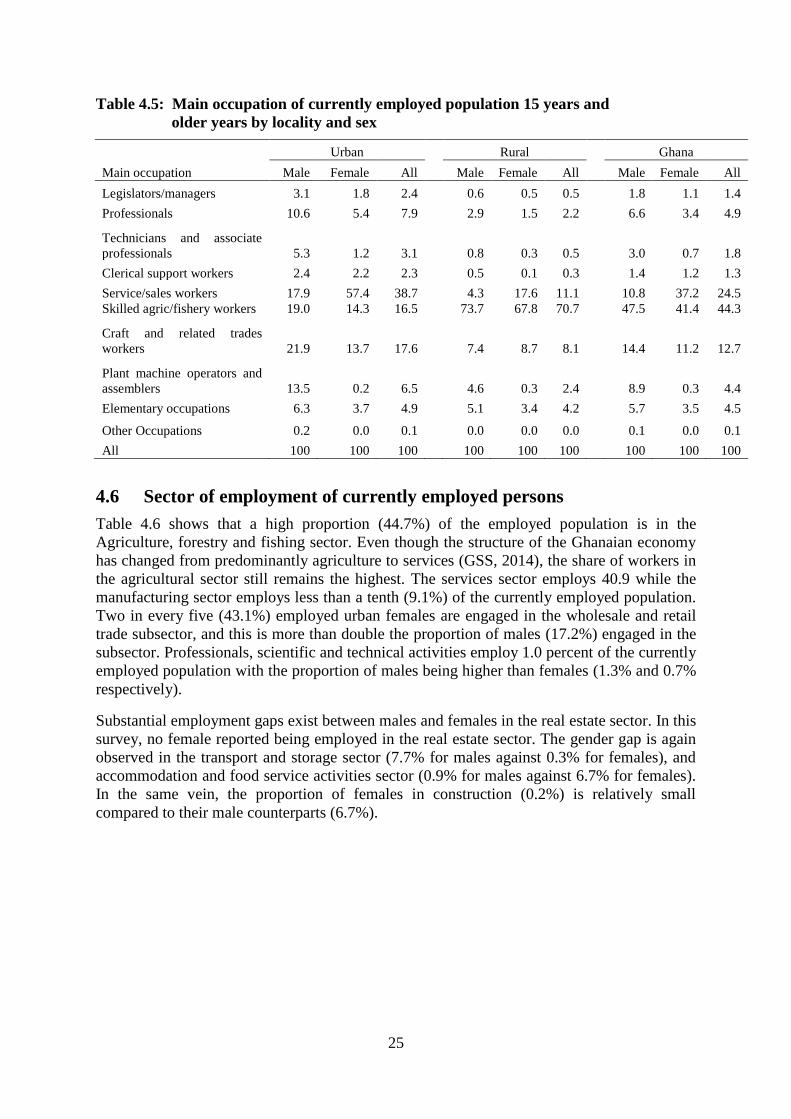
25
Table 4.5: Main occupation of currently employed population 15 years and
older years by locality and sex
Main occupation
Urban Rural Ghana
Male Female All Male Female All Male Female All
Legislators/managers 3.1 1.8 2.4 0.6 0.5 0.5 1.8 1.1 1.4
Professionals 10.6 5.4 7.9 2.9 1.5 2.2 6.6 3.4 4.9
Technicians and associate
professionals 5.3 1.2 3.1
0.8 0.3 0.5
3.0 0.7 1.8
Clerical support workers 2.4 2.2 2.3 0.5 0.1 0.3 1.4 1.2 1.3
Service/sales workers 17.9 57.4 38.7 4.3 17.6 11.1 10.8 37.2 24.5
Skilled agric/fishery workers 19.0 14.3 16.5 73.7 67.8 70.7 47.5 41.4 44.3
Craft and related trades
workers 21.9 13.7 17.6
7.4 8.7 8.1
14.4 11.2 12.7
Plant machine operators and
assemblers 13.5 0.2 6.5
4.6 0.3 2.4
8.9 0.3 4.4
Elementary occupations 6.3 3.7 4.9 5.1 3.4 4.2 5.7 3.5 4.5
Other Occupations 0.2 0.0 0.1
0.0 0.0 0.0
0.1 0.0 0.1
All 100 100 100 100 100 100 100 100 100
4.6 Sector of employment of currently employed persons
Table 4.6 shows that a high proportion (44.7%) of the employed population is in the
Agriculture, forestry and fishing sector. Even though the structure of the Ghanaian economy
has changed from predominantly agriculture to services (GSS, 2014), the share of workers in
the agricultural sector still remains the highest. The services sector employs 40.9 while the
manufacturing sector employs less than a tenth (9.1%) of the currently employed population.
Two in every five (43.1%) employed urban females are engaged in the wholesale and retail
trade subsector, and this is more than double the proportion of males (17.2%) engaged in the
subsector. Professionals, scientific and technical activities employ 1.0 percent of the currently
employed population with the proportion of males being higher than females (1.3% and 0.7%
respectively).
Substantial employment gaps exist between males and females in the real estate sector. In this
survey, no female reported being employed in the real estate sector. The gender gap is again
observed in the transport and storage sector (7.7% for males against 0.3% for females), and
accommodation and food service activities sector (0.9% for males against 6.7% for females).
In the same vein, the proportion of females in construction (0.2%) is relatively small
compared to their male counterparts (6.7%).
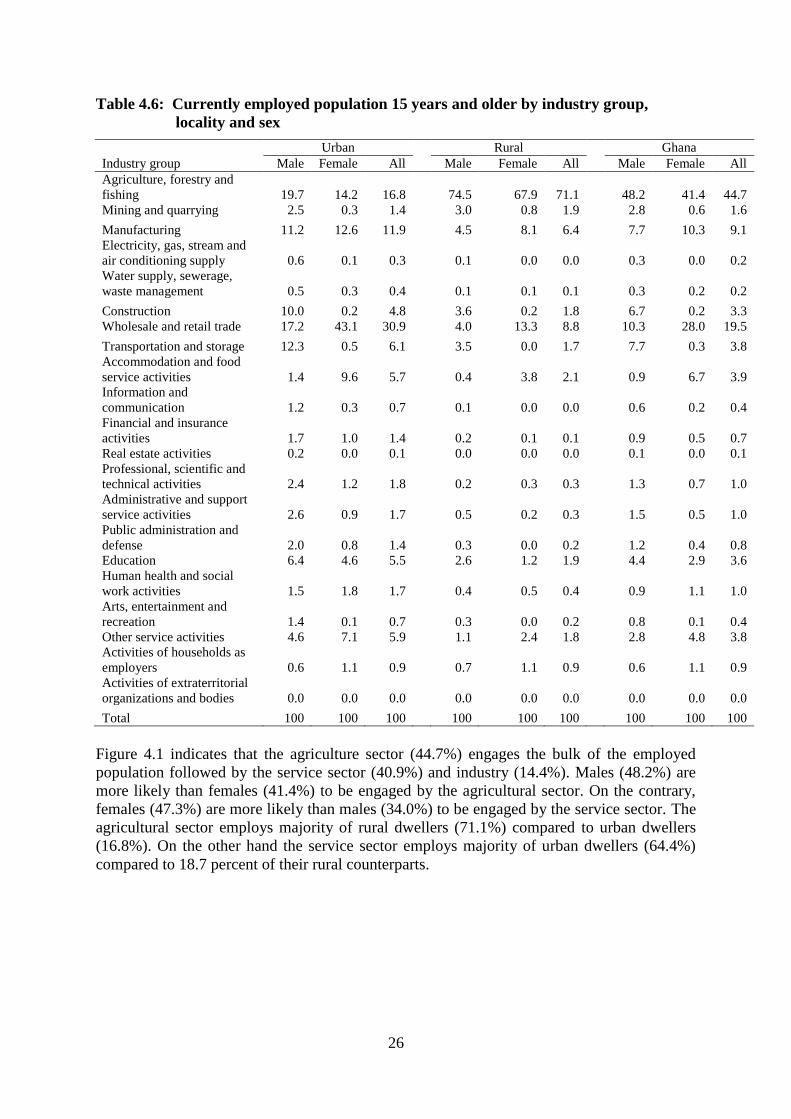
26
Table 4.6: Currently employed population 15 years and older by industry group,
locality and sex
Industry group
Urban Rural Ghana
Male Female All Male Female All Male Female All
Agriculture, forestry and
fishing 19.7 14.2 16.8
74.5 67.9 71.1
48.2 41.4 44.7
Mining and quarrying 2.5 0.3 1.4 3.0 0.8 1.9 2.8 0.6 1.6
Manufacturing 11.2 12.6 11.9 4.5 8.1 6.4 7.7 10.3 9.1
Electricity, gas, stream and
air conditioning supply 0.6 0.1 0.3
0.1 0.0 0.0
0.3 0.0 0.2
Water supply, sewerage,
waste management 0.5 0.3 0.4
0.1 0.1 0.1
0.3 0.2 0.2
Construction 10.0 0.2 4.8 3.6 0.2 1.8 6.7 0.2 3.3
Wholesale and retail trade 17.2 43.1 30.9 4.0 13.3 8.8 10.3 28.0 19.5
Transportation and storage 12.3 0.5 6.1 3.5 0.0 1.7 7.7 0.3 3.8
Accommodation and food
service activities 1.4 9.6 5.7
0.4 3.8 2.1
0.9 6.7 3.9
Information and
communication 1.2 0.3 0.7
0.1 0.0 0.0
0.6 0.2 0.4
Financial and insurance
activities 1.7 1.0 1.4
0.2 0.1 0.1
0.9 0.5 0.7
Real estate activities 0.2 0.0 0.1 0.0 0.0 0.0 0.1 0.0 0.1
Professional, scientific and
technical activities 2.4 1.2 1.8
0.2 0.3 0.3
1.3 0.7 1.0
Administrative and support
service activities 2.6 0.9 1.7
0.5 0.2 0.3
1.5 0.5 1.0
Public administration and
defense 2.0 0.8 1.4
0.3 0.0 0.2
1.2 0.4 0.8
Education 6.4 4.6 5.5 2.6 1.2 1.9 4.4 2.9 3.6
Human health and social
work activities 1.5 1.8 1.7
0.4 0.5 0.4
0.9 1.1 1.0
Arts, entertainment and
recreation 1.4 0.1 0.7
0.3 0.0 0.2
0.8 0.1 0.4
Other service activities 4.6 7.1 5.9 1.1 2.4 1.8 2.8 4.8 3.8
Activities of households as
employers 0.6 1.1 0.9
0.7 1.1 0.9
0.6 1.1 0.9
Activities of extraterritorial
organizations and bodies 0.0 0.0 0.0
0.0 0.0 0.0
0.0 0.0 0.0
Total 100 100 100 100 100 100 100 100 100
Figure 4.1 indicates that the agriculture sector (44.7%) engages the bulk of the employed
population followed by the service sector (40.9%) and industry (14.4%). Males (48.2%) are
more likely than females (41.4%) to be engaged by the agricultural sector. On the contrary,
females (47.3%) are more likely than males (34.0%) to be engaged by the service sector. The
agricultural sector employs majority of rural dwellers (71.1%) compared to urban dwellers
(16.8%). On the other hand the service sector employs majority of urban dwellers (64.4%)
compared to 18.7 percent of their rural counterparts.
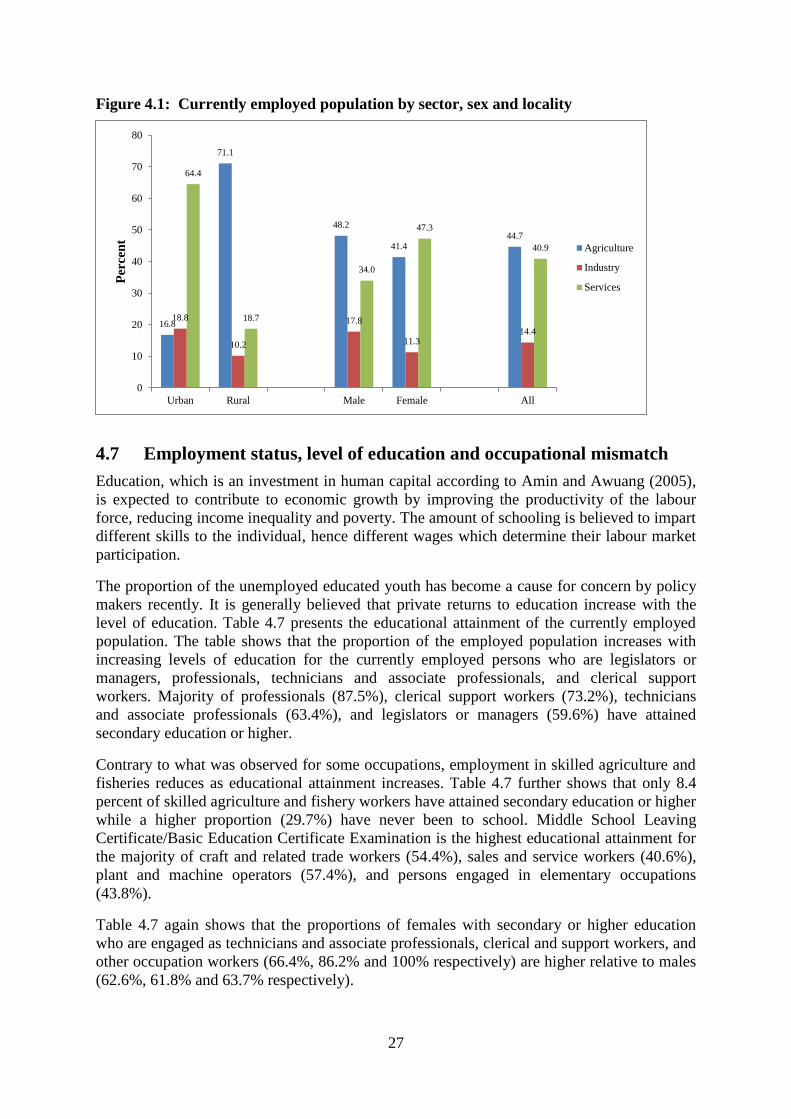
27
Figure 4.1: Currently employed population by sector, sex and locality
4.7 Employment status, level of education and occupational mismatch
Education, which is an investment in human capital according to Amin and Awuang (2005),
is expected to contribute to economic growth by improving the productivity of the labour
force, reducing income inequality and poverty. The amount of schooling is believed to impart
different skills to the individual, hence different wages which determine their labour market
participation.
The proportion of the unemployed educated youth has become a cause for concern by policy
makers recently. It is generally believed that private returns to education increase with the
level of education. Table 4.7 presents the educational attainment of the currently employed
population. The table shows that the proportion of the employed population increases with
increasing levels of education for the currently employed persons who are legislators or
managers, professionals, technicians and associate professionals, and clerical support
workers. Majority of professionals (87.5%), clerical support workers (73.2%), technicians
and associate professionals (63.4%), and legislators or managers (59.6%) have attained
secondary education or higher.
Contrary to what was observed for some occupations, employment in skilled agriculture and
fisheries reduces as educational attainment increases. Table 4.7 further shows that only 8.4
percent of skilled agriculture and fishery workers have attained secondary education or higher
while a higher proportion (29.7%) have never been to school. Middle School Leaving
Certificate/Basic Education Certificate Examination is the highest educational attainment for
the majority of craft and related trade workers (54.4%), sales and service workers (40.6%),
plant and machine operators (57.4%), and persons engaged in elementary occupations
(43.8%).
Table 4.7 again shows that the proportions of females with secondary or higher education
who are engaged as technicians and associate professionals, clerical and support workers, and
other occupation workers (66.4%, 86.2% and 100% respectively) are higher relative to males
(62.6%, 61.8% and 63.7% respectively).
16.8
71.1
48.2
41.4 44.7
18.8
10.2
17.8
11.3 14.4
64.4
18.7
34.0
47.3
40.9
0
10
20
30
40
50
60
70
80
Urban Rural Male Female All
Per
cen
t
Agriculture
Industry
Services
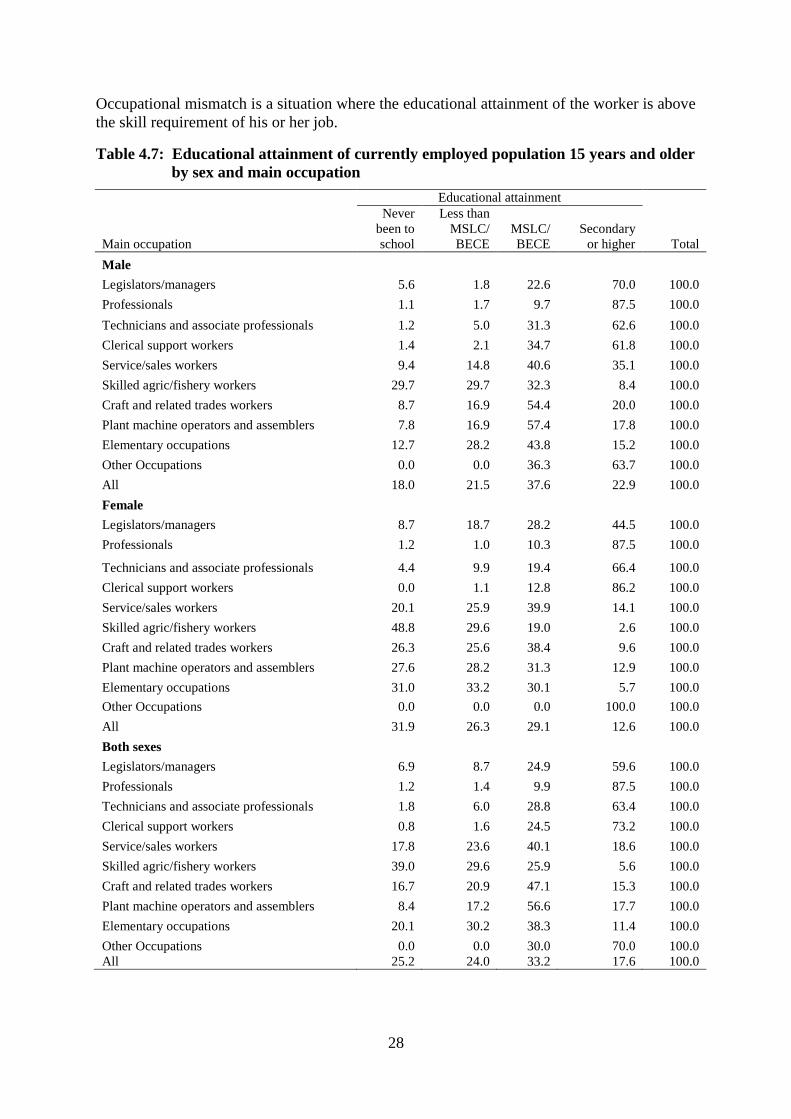
28
Occupational mismatch is a situation where the educational attainment of the worker is above
the skill requirement of his or her job.
Table 4.7: Educational attainment of currently employed population 15 years and older
by sex and main occupation
Main occupation
Educational attainment
Never
been to
school
Less than
MSLC/
BECE
MSLC/
BECE
Secondary
or higher Total
Male
Legislators/managers 5.6 1.8 22.6 70.0 100.0
Professionals 1.1 1.7 9.7 87.5 100.0
Technicians and associate professionals 1.2 5.0 31.3 62.6 100.0
Clerical support workers 1.4 2.1 34.7 61.8 100.0
Service/sales workers 9.4 14.8 40.6 35.1 100.0
Skilled agric/fishery workers 29.7 29.7 32.3 8.4 100.0
Craft and related trades workers 8.7 16.9 54.4 20.0 100.0
Plant machine operators and assemblers 7.8 16.9 57.4 17.8 100.0
Elementary occupations 12.7 28.2 43.8 15.2 100.0
Other Occupations 0.0 0.0 36.3 63.7 100.0
All 18.0 21.5 37.6 22.9 100.0
Female
Legislators/managers 8.7 18.7 28.2 44.5 100.0
Professionals 1.2 1.0 10.3 87.5 100.0
Technicians and associate professionals 4.4 9.9 19.4 66.4 100.0
Clerical support workers 0.0 1.1 12.8 86.2 100.0
Service/sales workers 20.1 25.9 39.9 14.1 100.0
Skilled agric/fishery workers 48.8 29.6 19.0 2.6 100.0
Craft and related trades workers 26.3 25.6 38.4 9.6 100.0
Plant machine operators and assemblers 27.6 28.2 31.3 12.9 100.0
Elementary occupations 31.0 33.2 30.1 5.7 100.0
Other Occupations 0.0 0.0 0.0 100.0 100.0
All 31.9 26.3 29.1 12.6 100.0
Both sexes
Legislators/managers 6.9 8.7 24.9 59.6 100.0
Professionals 1.2 1.4 9.9 87.5 100.0
Technicians and associate professionals 1.8 6.0 28.8 63.4 100.0
Clerical support workers 0.8 1.6 24.5 73.2 100.0
Service/sales workers 17.8 23.6 40.1 18.6 100.0
Skilled agric/fishery workers 39.0 29.6 25.9 5.6 100.0
Craft and related trades workers 16.7 20.9 47.1 15.3 100.0
Plant machine operators and assemblers 8.4 17.2 56.6 17.7 100.0
Elementary occupations 20.1 30.2 38.3 11.4 100.0
Other Occupations 0.0 0.0 30.0 70.0 100.0
All 25.2 24.0 33.2 17.6 100.0
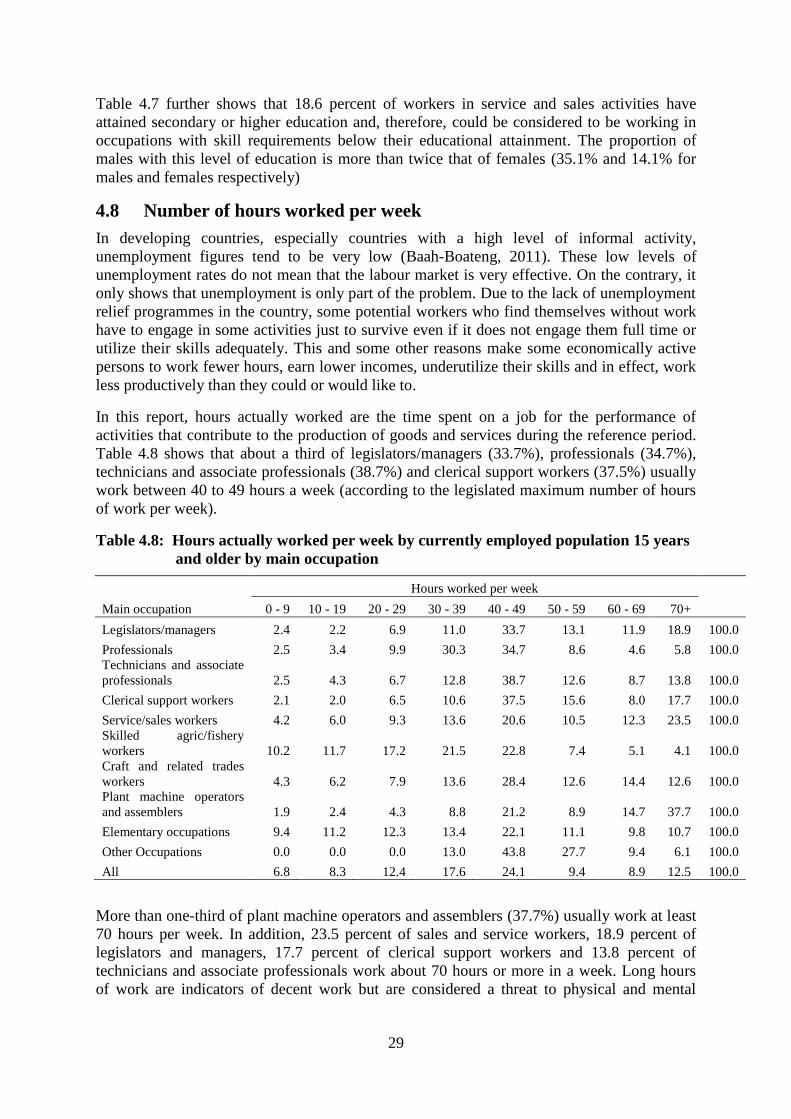
29
Table 4.7 further shows that 18.6 percent of workers in service and sales activities have
attained secondary or higher education and, therefore, could be considered to be working in
occupations with skill requirements below their educational attainment. The proportion of
males with this level of education is more than twice that of females (35.1% and 14.1% for
males and females respectively)
4.8 Number of hours worked per week
In developing countries, especially countries with a high level of informal activity,
unemployment figures tend to be very low (Baah-Boateng, 2011). These low levels of
unemployment rates do not mean that the labour market is very effective. On the contrary, it
only shows that unemployment is only part of the problem. Due to the lack of unemployment
relief programmes in the country, some potential workers who find themselves without work
have to engage in some activities just to survive even if it does not engage them full time or
utilize their skills adequately. This and some other reasons make some economically active
persons to work fewer hours, earn lower incomes, underutilize their skills and in effect, work
less productively than they could or would like to.
In this report, hours actually worked are the time spent on a job for the performance of
activities that contribute to the production of goods and services during the reference period.
Table 4.8 shows that about a third of legislators/managers (33.7%), professionals (34.7%),
technicians and associate professionals (38.7%) and clerical support workers (37.5%) usually
work between 40 to 49 hours a week (according to the legislated maximum number of hours
of work per week).
Table 4.8: Hours actually worked per week by currently employed population 15 years
and older by main occupation
Main occupation
Hours worked per week
0 - 9 10 - 19 20 - 29 30 - 39 40 - 49 50 - 59 60 - 69 70+
Legislators/managers 2.4 2.2 6.9 11.0 33.7 13.1 11.9 18.9 100.0
Professionals 2.5 3.4 9.9 30.3 34.7 8.6 4.6 5.8 100.0
Technicians and associate
professionals 2.5 4.3 6.7 12.8 38.7 12.6 8.7 13.8 100.0
Clerical support workers 2.1 2.0 6.5 10.6 37.5 15.6 8.0 17.7 100.0
Service/sales workers 4.2 6.0 9.3 13.6 20.6 10.5 12.3 23.5 100.0
Skilled agric/fishery
workers 10.2 11.7 17.2 21.5 22.8 7.4 5.1 4.1 100.0
Craft and related trades
workers 4.3 6.2 7.9 13.6 28.4 12.6 14.4 12.6 100.0
Plant machine operators
and assemblers 1.9 2.4 4.3 8.8 21.2 8.9 14.7 37.7 100.0
Elementary occupations 9.4 11.2 12.3 13.4 22.1 11.1 9.8 10.7 100.0
Other Occupations 0.0 0.0 0.0 13.0 43.8 27.7 9.4 6.1 100.0
All 6.8 8.3 12.4 17.6 24.1 9.4 8.9 12.5 100.0
More than one-third of plant machine operators and assemblers (37.7%) usually work at least
70 hours per week. In addition, 23.5 percent of sales and service workers, 18.9 percent of
legislators and managers, 17.7 percent of clerical support workers and 13.8 percent of
technicians and associate professionals work about 70 hours or more in a week. Long hours
of work are indicators of decent work but are considered a threat to physical and mental
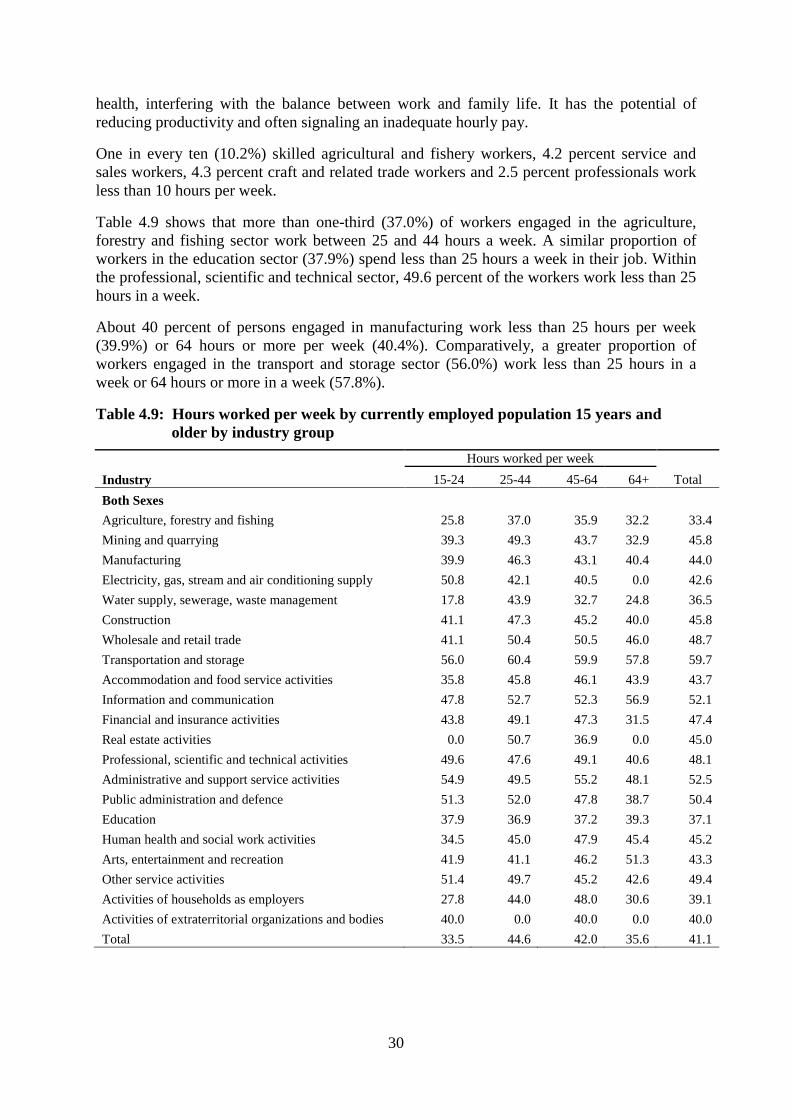
30
health, interfering with the balance between work and family life. It has the potential of
reducing productivity and often signaling an inadequate hourly pay.
One in every ten (10.2%) skilled agricultural and fishery workers, 4.2 percent service and
sales workers, 4.3 percent craft and related trade workers and 2.5 percent professionals work
less than 10 hours per week.
Table 4.9 shows that more than one-third (37.0%) of workers engaged in the agriculture,
forestry and fishing sector work between 25 and 44 hours a week. A similar proportion of
workers in the education sector (37.9%) spend less than 25 hours a week in their job. Within
the professional, scientific and technical sector, 49.6 percent of the workers work less than 25
hours in a week.
About 40 percent of persons engaged in manufacturing work less than 25 hours per week
(39.9%) or 64 hours or more per week (40.4%). Comparatively, a greater proportion of
workers engaged in the transport and storage sector (56.0%) work less than 25 hours in a
week or 64 hours or more in a week (57.8%).
Table 4.9: Hours worked per week by currently employed population 15 years and
older by industry group
Industry
Hours worked per week
Total 15-24 25-44 45-64 64+
Both Sexes
Agriculture, forestry and fishing 25.8 37.0 35.9 32.2 33.4
Mining and quarrying 39.3 49.3 43.7 32.9 45.8
Manufacturing 39.9 46.3 43.1 40.4 44.0
Electricity, gas, stream and air conditioning supply 50.8 42.1 40.5 0.0 42.6
Water supply, sewerage, waste management 17.8 43.9 32.7 24.8 36.5
Construction 41.1 47.3 45.2 40.0 45.8
Wholesale and retail trade 41.1 50.4 50.5 46.0 48.7
Transportation and storage 56.0 60.4 59.9 57.8 59.7
Accommodation and food service activities 35.8 45.8 46.1 43.9 43.7
Information and communication 47.8 52.7 52.3 56.9 52.1
Financial and insurance activities 43.8 49.1 47.3 31.5 47.4
Real estate activities 0.0 50.7 36.9 0.0 45.0
Professional, scientific and technical activities 49.6 47.6 49.1 40.6 48.1
Administrative and support service activities 54.9 49.5 55.2 48.1 52.5
Public administration and defence 51.3 52.0 47.8 38.7 50.4
Education 37.9 36.9 37.2 39.3 37.1
Human health and social work activities 34.5 45.0 47.9 45.4 45.2
Arts, entertainment and recreation 41.9 41.1 46.2 51.3 43.3
Other service activities 51.4 49.7 45.2 42.6 49.4
Activities of households as employers 27.8 44.0 48.0 30.6 39.1
Activities of extraterritorial organizations and bodies 40.0 0.0 40.0 0.0 40.0
Total 33.5 44.6 42.0 35.6 41.1
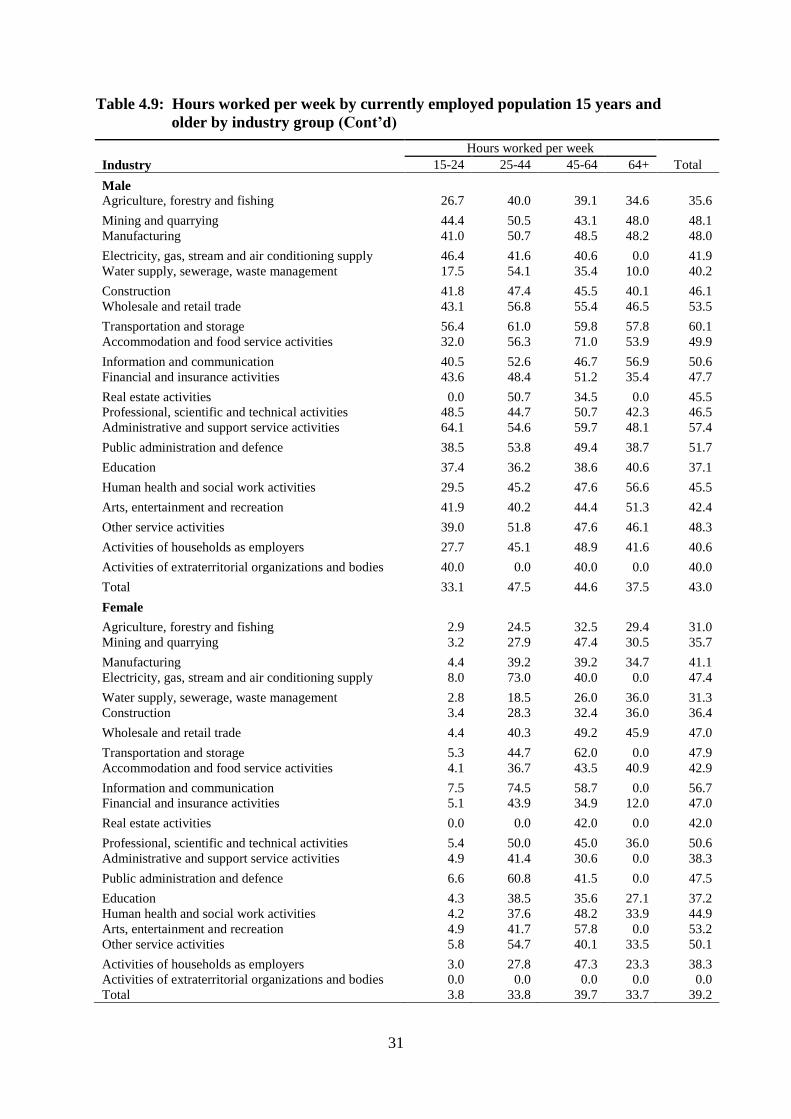
31
Table 4.9: Hours worked per week by currently employed population 15 years and
older by industry group (Cont’d)
Industry
Hours worked per week
Total 15-24 25-44 45-64 64+
Male
Agriculture, forestry and fishing 26.7 40.0 39.1 34.6 35.6
Mining and quarrying 44.4 50.5 43.1 48.0 48.1
Manufacturing 41.0 50.7 48.5 48.2 48.0
Electricity, gas, stream and air conditioning supply 46.4 41.6 40.6 0.0 41.9
Water supply, sewerage, waste management 17.5 54.1 35.4 10.0 40.2
Construction 41.8 47.4 45.5 40.1 46.1
Wholesale and retail trade 43.1 56.8 55.4 46.5 53.5
Transportation and storage 56.4 61.0 59.8 57.8 60.1
Accommodation and food service activities 32.0 56.3 71.0 53.9 49.9
Information and communication 40.5 52.6 46.7 56.9 50.6
Financial and insurance activities 43.6 48.4 51.2 35.4 47.7
Real estate activities 0.0 50.7 34.5 0.0 45.5
Professional, scientific and technical activities 48.5 44.7 50.7 42.3 46.5
Administrative and support service activities 64.1 54.6 59.7 48.1 57.4
Public administration and defence 38.5 53.8 49.4 38.7 51.7
Education 37.4 36.2 38.6 40.6 37.1
Human health and social work activities 29.5 45.2 47.6 56.6 45.5
Arts, entertainment and recreation 41.9 40.2 44.4 51.3 42.4
Other service activities 39.0 51.8 47.6 46.1 48.3
Activities of households as employers 27.7 45.1 48.9 41.6 40.6
Activities of extraterritorial organizations and bodies 40.0 0.0 40.0 0.0 40.0
Total 33.1 47.5 44.6 37.5 43.0
Female
Agriculture, forestry and fishing 2.9 24.5 32.5 29.4 31.0
Mining and quarrying 3.2 27.9 47.4 30.5 35.7
Manufacturing 4.4 39.2 39.2 34.7 41.1
Electricity, gas, stream and air conditioning supply 8.0 73.0 40.0 0.0 47.4
Water supply, sewerage, waste management 2.8 18.5 26.0 36.0 31.3
Construction 3.4 28.3 32.4 36.0 36.4
Wholesale and retail trade 4.4 40.3 49.2 45.9 47.0
Transportation and storage 5.3 44.7 62.0 0.0 47.9
Accommodation and food service activities 4.1 36.7 43.5 40.9 42.9
Information and communication 7.5 74.5 58.7 0.0 56.7
Financial and insurance activities 5.1 43.9 34.9 12.0 47.0
Real estate activities 0.0 0.0 42.0 0.0 42.0
Professional, scientific and technical activities 5.4 50.0 45.0 36.0 50.6
Administrative and support service activities 4.9 41.4 30.6 0.0 38.3
Public administration and defence 6.6 60.8 41.5 0.0 47.5
Education 4.3 38.5 35.6 27.1 37.2
Human health and social work activities 4.2 37.6 48.2 33.9 44.9
Arts, entertainment and recreation 4.9 41.7 57.8 0.0 53.2
Other service activities 5.8 54.7 40.1 33.5 50.1
Activities of households as employers 3.0 27.8 47.3 23.3 38.3
Activities of extraterritorial organizations and bodies 0.0 0.0 0.0 0.0 0.0
Total 3.8 33.8 39.7 33.7 39.2
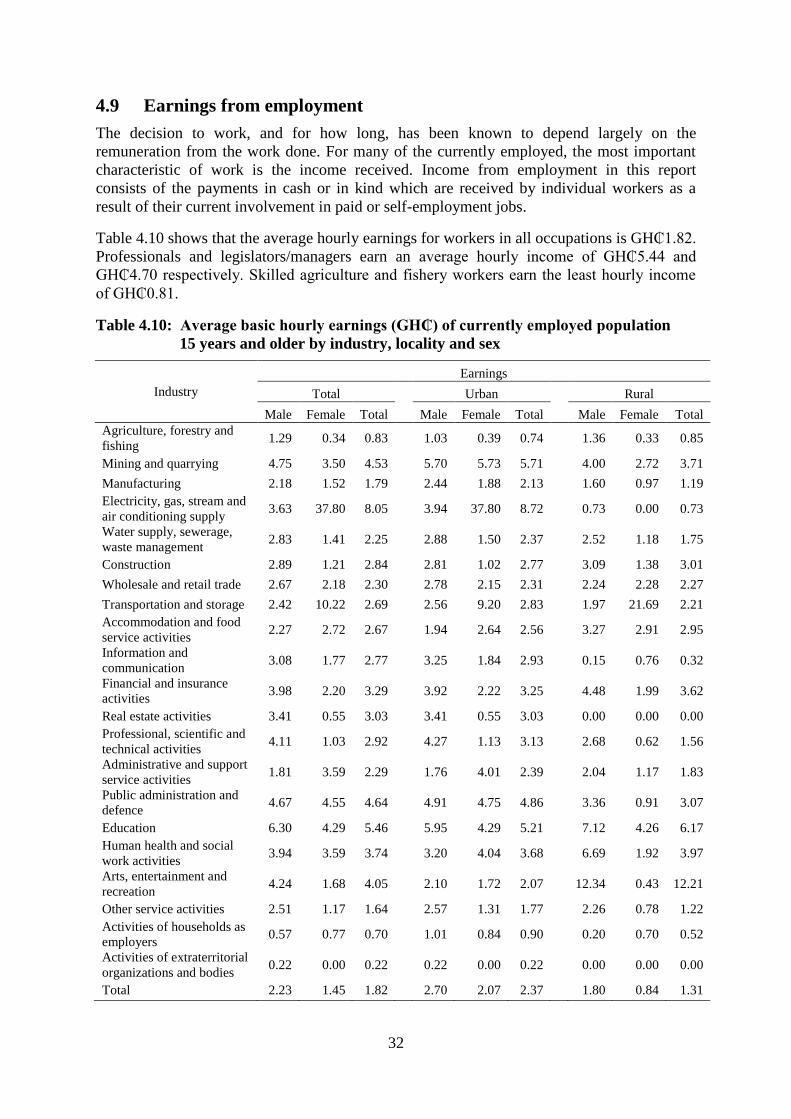
32
4.9 Earnings from employment
The decision to work, and for how long, has been known to depend largely on the
remuneration from the work done. For many of the currently employed, the most important
characteristic of work is the income received. Income from employment in this report
consists of the payments in cash or in kind which are received by individual workers as a
result of their current involvement in paid or self-employment jobs.
Table 4.10 shows that the average hourly earnings for workers in all occupations is GH₵1.82.
Professionals and legislators/managers earn an average hourly income of GH₵5.44 and
GH₵4.70 respectively. Skilled agriculture and fishery workers earn the least hourly income
of GH₵0.81.
Table 4.10: Average basic hourly earnings (GH₵) of currently employed population
15 years and older by industry, locality and sex
Industry
Earnings
Total
Urban
Rural
Male Female Total Male Female Total Male Female Total
Agriculture, forestry and
fishing 1.29 0.34 0.83
1.03 0.39 0.74
1.36 0.33 0.85
Mining and quarrying 4.75 3.50 4.53
5.70 5.73 5.71
4.00 2.72 3.71
Manufacturing 2.18 1.52 1.79
2.44 1.88 2.13
1.60 0.97 1.19
Electricity, gas, stream and
air conditioning supply 3.63 37.80 8.05
3.94 37.80 8.72
0.73 0.00 0.73
Water supply, sewerage,
waste management 2.83 1.41 2.25
2.88 1.50 2.37
2.52 1.18 1.75
Construction 2.89 1.21 2.84
2.81 1.02 2.77
3.09 1.38 3.01
Wholesale and retail trade 2.67 2.18 2.30
2.78 2.15 2.31
2.24 2.28 2.27
Transportation and storage 2.42 10.22 2.69
2.56 9.20 2.83
1.97 21.69 2.21
Accommodation and food
service activities 2.27 2.72 2.67
1.94 2.64 2.56
3.27 2.91 2.95
Information and
communication 3.08 1.77 2.77
3.25 1.84 2.93
0.15 0.76 0.32
Financial and insurance
activities 3.98 2.20 3.29
3.92 2.22 3.25
4.48 1.99 3.62
Real estate activities 3.41 0.55 3.03
3.41 0.55 3.03
0.00 0.00 0.00
Professional, scientific and
technical activities 4.11 1.03 2.92
4.27 1.13 3.13
2.68 0.62 1.56
Administrative and support
service activities 1.81 3.59 2.29
1.76 4.01 2.39
2.04 1.17 1.83
Public administration and
defence 4.67 4.55 4.64
4.91 4.75 4.86
3.36 0.91 3.07
Education 6.30 4.29 5.46
5.95 4.29 5.21
7.12 4.26 6.17
Human health and social
work activities 3.94 3.59 3.74
3.20 4.04 3.68
6.69 1.92 3.97
Arts, entertainment and
recreation 4.24 1.68 4.05
2.10 1.72 2.07
12.34 0.43 12.21
Other service activities 2.51 1.17 1.64
2.57 1.31 1.77
2.26 0.78 1.22
Activities of households as
employers 0.57 0.77 0.70
1.01 0.84 0.90
0.20 0.70 0.52
Activities of extraterritorial
organizations and bodies 0.22 0.00 0.22
0.22 0.00 0.22
0.00 0.00 0.00
Total 2.23 1.45 1.82 2.70 2.07 2.37 1.80 0.84 1.31
33
The size distribution of earnings is an indicator of income inequality. The average hourly
earnings of females across all occupations (with the exception of clerical support workers)
are relatively lower than for males. The largest differential in earnings in absolute terms is
among other occupation workers (GH₵9.84) and Professionals (GH₵1.60).
Table 4.10 also presents the average hourly earnings by industry. Activities of households as
employers are the least paid industry, with average hourly earnings of GH₵0.7; this is
followed closely by agriculture, forestry and fishing industry with GH₵0.83. Electricity, gas,
steam and air conditioning supply is the industry with the highest average hourly earnings
(GH₵8.05). Public administration and defense pays average hourly earnings of GH₵4.64.
The highest gender differential of GH₵34.17 in earnings is observed among workers in the
Electricity, gas, steam and air conditioning supply industry in favour of females. On the other
hand, the highest gender differential in earnings in favour of males (GH₵3.08) is observed in
the Professional, scientific and technical activities industry.
Occupation refers to the kind of work done during the reference period by the person
employed, irrespective of the industry or the status in employment of the person. Such
information usually provides a description of a person’s job. Respondents were asked to
describe the nature of the main type of work they were usually engaged in during the 12
months preceding the interview. However, for the sake of uniformity, where information on
earnings in the main job was not on a monthly basis, it was collected for the previous week
and then converted to monthly earnings.
Table 4.11 presents data on paid employment by the major occupational groups and the
proportions receiving cash and in-kind payments. About 12 million employed persons are
estimated to have received payments in cash or in-kind. The data reveals that more than half
(6.3 million) of all paid employed persons are females. However, the number of males in
almost all the different occupational groups except service/sales is higher than females.
The table further shows that more than half (55.0%) of the employed population received
cash earnings while only 1.0 percent received payments in-kind. The proportion of male
legislators/managers (80.3%) receiving cash is higher than females (75.0%). On the other
hand, the proportion of female professionals who receive cash (80.3%) is higher than males
(75.9%). Almost the same proportions of males and females working as technicians and
associate professionals (80.3% males and 81.8% females), clerical support workers (82.0%
males and 81.1% females), and sales and service workers (77.1% males and 74.2% females)
also receive cash payments.
The proportions of males and females who receive earnings in-kind are far less than those
receiving cash, even though the proportion of males (1.0%) who receive in-kind payments is
higher than females (0.7%) except for plant machine operators and hose in elementary
occupations.
Table 4.12 indicates that the average monthly earnings of paid employed persons for all
occupations are GH₵ 495.47. The average earnings for males (GH₵ 592.64) are much higher
than for females (GH₵ 395.48). In occupations such as legislators/managers, professionals
and other occupations, the difference in earnings between males and females is much wider.
In occupations like agriculture, crafts and related trades and in elementary occupations,
females remained at a disadvantage. The discrepancy in monthly earnings between the sexes
has emerged partly on account of differences in hours of work. Overall, the average monthly
cash earnings by those receiving cash and the average monthly in-kind earnings by those
receiving payments in-kind are more for males than for females in almost all the occupational
groups.
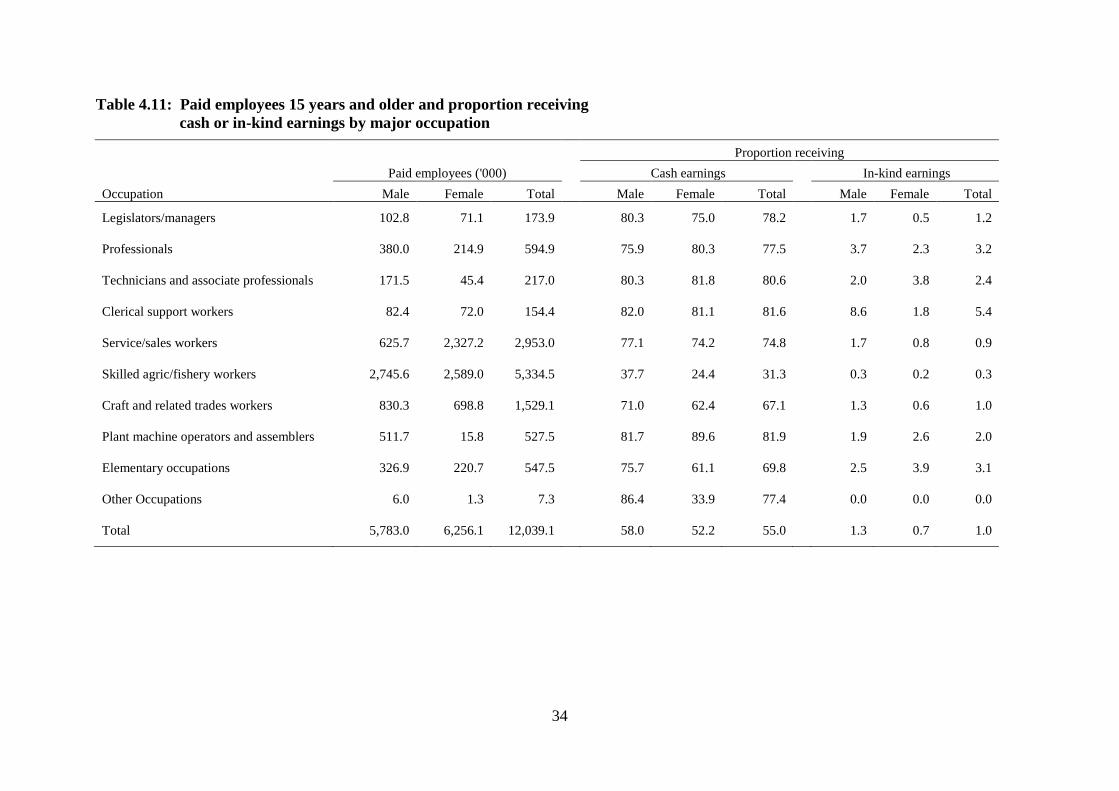
34
Table 4.11: Paid employees 15 years and older and proportion receiving
cash or in-kind earnings by major occupation
Occupation
Paid employees ('000)
Proportion receiving
Cash earnings
In-kind earnings
Male Female Total Male Female Total Male Female Total
Legislators/managers 102.8 71.1 173.9
80.3 75.0 78.2
1.7 0.5 1.2
Professionals 380.0 214.9 594.9
75.9 80.3 77.5
3.7 2.3 3.2
Technicians and associate professionals 171.5 45.4 217.0
80.3 81.8 80.6
2.0 3.8 2.4
Clerical support workers 82.4 72.0 154.4
82.0 81.1 81.6
8.6 1.8 5.4
Service/sales workers 625.7 2,327.2 2,953.0
77.1 74.2 74.8
1.7 0.8 0.9
Skilled agric/fishery workers 2,745.6 2,589.0 5,334.5
37.7 24.4 31.3
0.3 0.2 0.3
Craft and related trades workers 830.3 698.8 1,529.1
71.0 62.4 67.1
1.3 0.6 1.0
Plant machine operators and assemblers 511.7 15.8 527.5
81.7 89.6 81.9
1.9 2.6 2.0
Elementary occupations 326.9 220.7 547.5
75.7 61.1 69.8
2.5 3.9 3.1
Other Occupations 6.0 1.3 7.3
86.4 33.9 77.4
0.0 0.0 0.0
Total 5,783.0 6,256.1 12,039.1 58.0 52.2 55.0 1.3 0.7 1.0
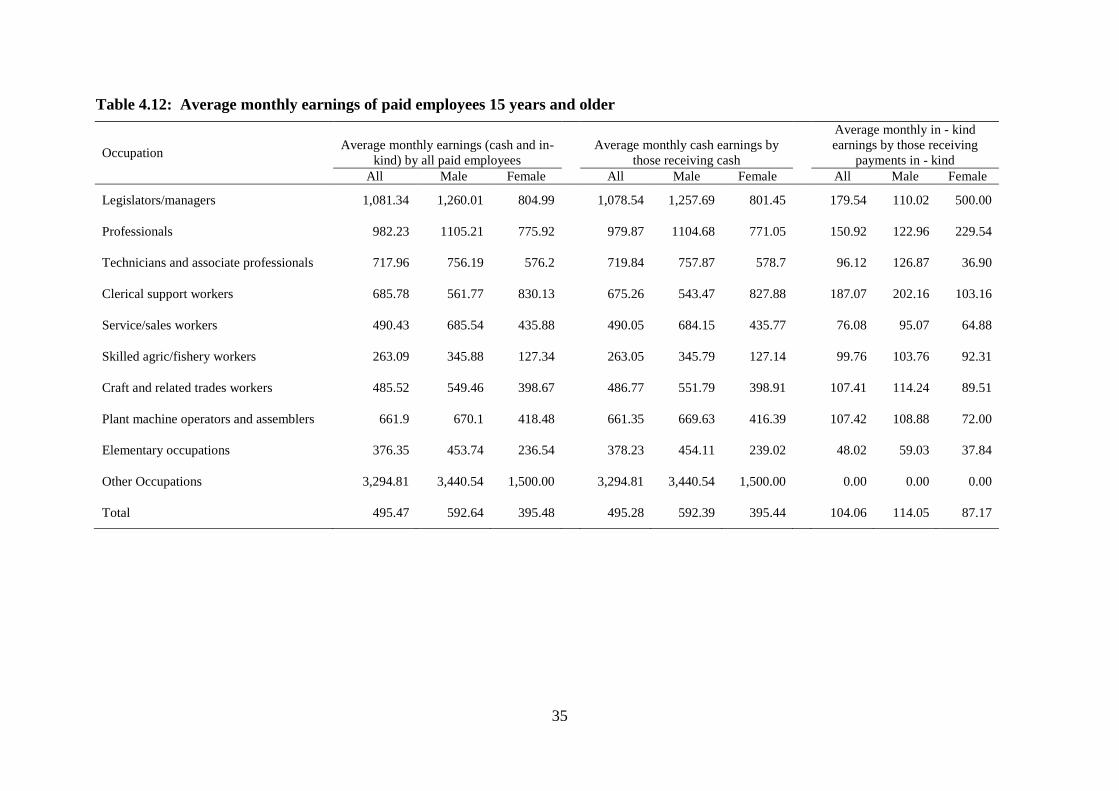
35
Table 4.12: Average monthly earnings of paid employees 15 years and older
Occupation Average monthly earnings (cash and in-
kind) by all paid employees
Average monthly cash earnings by
those receiving cash
Average monthly in - kind
earnings by those receiving
payments in - kind
All Male Female
All Male Female
All Male Female
Legislators/managers 1,081.34 1,260.01 804.99
1,078.54 1,257.69 801.45
179.54 110.02 500.00
Professionals 982.23 1105.21 775.92
979.87 1104.68 771.05
150.92 122.96 229.54
Technicians and associate professionals 717.96 756.19 576.2
719.84 757.87 578.7
96.12 126.87 36.90
Clerical support workers 685.78 561.77 830.13
675.26 543.47 827.88
187.07 202.16 103.16
Service/sales workers 490.43 685.54 435.88
490.05 684.15 435.77
76.08 95.07 64.88
Skilled agric/fishery workers 263.09 345.88 127.34
263.05 345.79 127.14
99.76 103.76 92.31
Craft and related trades workers 485.52 549.46 398.67
486.77 551.79 398.91
107.41 114.24 89.51
Plant machine operators and assemblers 661.9 670.1 418.48
661.35 669.63 416.39
107.42 108.88 72.00
Elementary occupations 376.35 453.74 236.54
378.23 454.11 239.02
48.02 59.03 37.84
Other Occupations 3,294.81 3,440.54 1,500.00
3,294.81 3,440.54 1,500.00
0.00 0.00 0.00
Total 495.47 592.64 395.48 495.28 592.39 395.44 104.06 114.05 87.17
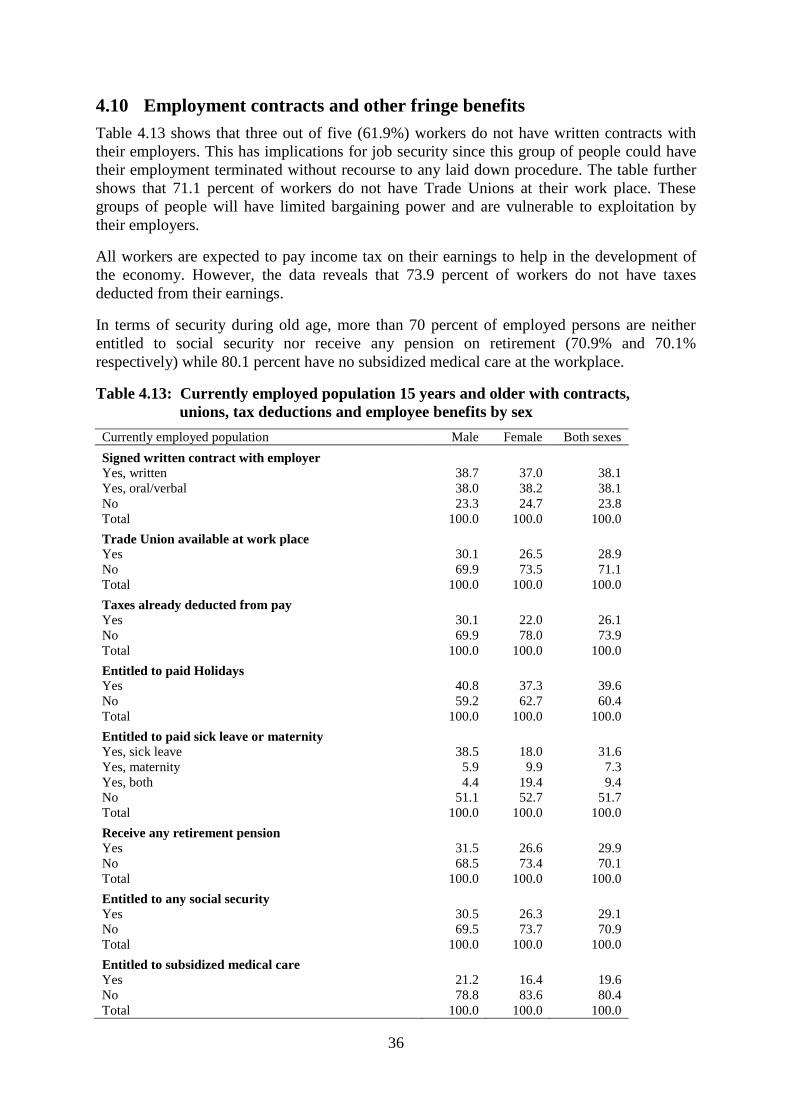
36
4.10 Employment contracts and other fringe benefits
Table 4.13 shows that three out of five (61.9%) workers do not have written contracts with
their employers. This has implications for job security since this group of people could have
their employment terminated without recourse to any laid down procedure. The table further
shows that 71.1 percent of workers do not have Trade Unions at their work place. These
groups of people will have limited bargaining power and are vulnerable to exploitation by
their employers.
All workers are expected to pay income tax on their earnings to help in the development of
the economy. However, the data reveals that 73.9 percent of workers do not have taxes
deducted from their earnings.
In terms of security during old age, more than 70 percent of employed persons are neither
entitled to social security nor receive any pension on retirement (70.9% and 70.1%
respectively) while 80.1 percent have no subsidized medical care at the workplace.
Table 4.13: Currently employed population 15 years and older with contracts,
unions, tax deductions and employee benefits by sex
Currently employed population Male Female Both sexes
Signed written contract with employer
Yes, written 38.7 37.0 38.1
Yes, oral/verbal 38.0 38.2 38.1
No 23.3 24.7 23.8
Total 100.0 100.0 100.0
Trade Union available at work place
Yes 30.1 26.5 28.9
No 69.9 73.5 71.1
Total 100.0 100.0 100.0
Taxes already deducted from pay
Yes 30.1 22.0 26.1
No 69.9 78.0 73.9
Total 100.0 100.0 100.0
Entitled to paid Holidays
Yes 40.8 37.3 39.6
No 59.2 62.7 60.4
Total 100.0 100.0 100.0
Entitled to paid sick leave or maternity
Yes, sick leave 38.5 18.0 31.6
Yes, maternity 5.9 9.9 7.3
Yes, both 4.4 19.4 9.4
No 51.1 52.7 51.7
Total 100.0 100.0 100.0
Receive any retirement pension
Yes 31.5 26.6 29.9
No 68.5 73.4 70.1
Total 100.0 100.0 100.0
Entitled to any social security
Yes 30.5 26.3 29.1
No 69.5 73.7 70.9
Total 100.0 100.0 100.0
Entitled to subsidized medical care
Yes 21.2 16.4 19.6
No 78.8 83.6 80.4
Total 100.0 100.0 100.0
37
CHAPTER FIVE
LABOUR UNDERUTILIZATION
5.1 Introduction
Unemployment has been the most widely known and used component of labour
underutilization than any other labour market indicators in Ghana. There are limitations to the
aggregate unemployment rate that is usually measured. Typically, it is based on a narrow
concept of labour underutilization which ignores underemployment and the potential labour
force. Labour underutilization rate is a new measure which attempts to provide a more
comprehensive view of underutilized labour in the labour force than the unemployment rate
or the underemployment rate.
Measures of labour underutilization are meant to capture mismatches between the demand
and supply of labour due to insufficient labour absorption. They also signal situations of
unmet need for employment among the population. Labour underutilization can have an
impact on the people who experience it, their families, community and, to a large extent, the
economy. Labour underutilization has three components: unemployment, time-related
underemployment and potential labour force.
The population aged 15 years and older is considered as unemployed if they were not
engaged in any work (as already defined), had no attachment to a job or business, reported
that they were available for work and had taken some specific steps to look for work.
Time-related underemployment comprises three criteria and refers to persons 15 years and
older in employment, who during the reference period, had worked less than a threshold
relating to working time (for less than 35 hours in this report).
The potential labour force identifies situations of inadequate absorption of labour, beyond
those captured by unemployment and underemployment. Generally, these are persons
excluded from the unemployed population and yet put pressure on the labour market. The
potential labour force is an important indicator of the need for employment, and covers
persons 15 years or older who have indicated some interest in employment, and fall within
the following three mutually exclusive groups:
(a) Unavailable job-seekers: refers to persons without employment who are seeking
employment but are not available;
(b) Available potential job-seekers: refers to persons without employment who are not
seeking employment but are available; and
(c) Willing potential job-seekers: refers to persons without employment who are neither
seeking nor available for employment but who want employment.
5.2 Unemployment
In this report, the relaxed definition of unemployment is adopted. Thus, the unemployment
rate has been computed based on persons who within the reference period, were without jobs
and were “potentially” available for jobs. The unemployment rate for persons aged 15 years
and older by region, sex and type of locality is presented in Table 5.1.
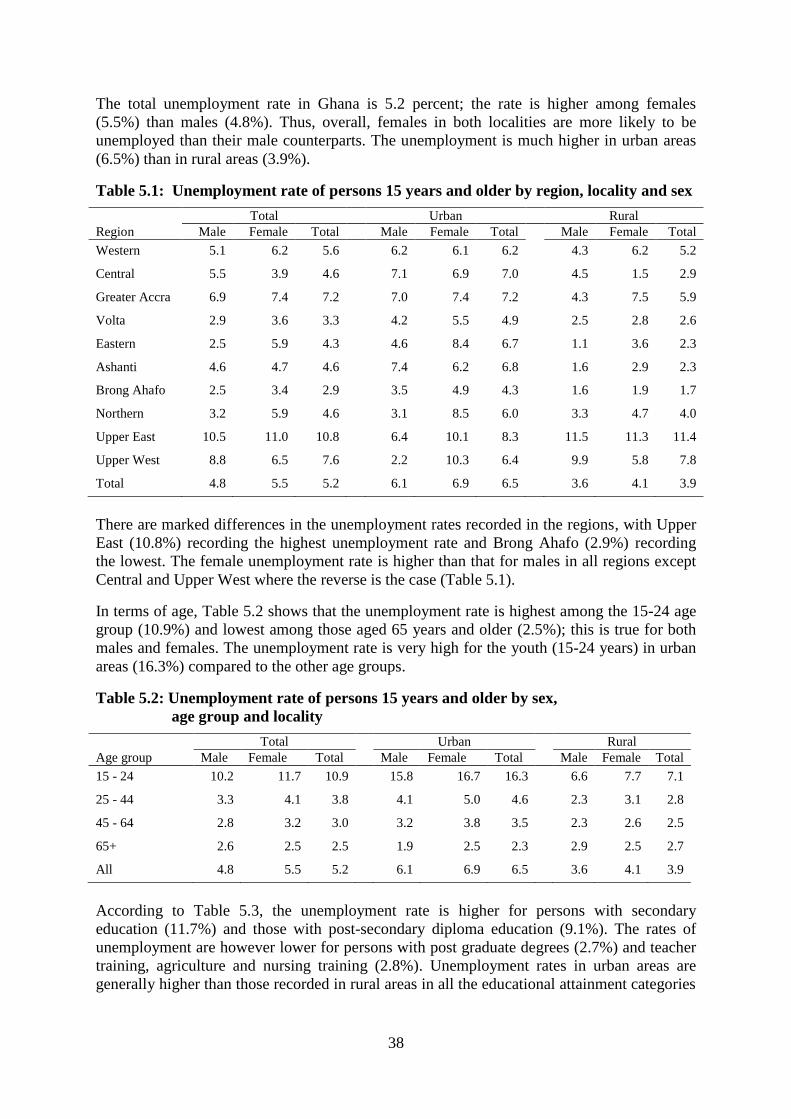
38
The total unemployment rate in Ghana is 5.2 percent; the rate is higher among females
(5.5%) than males (4.8%). Thus, overall, females in both localities are more likely to be
unemployed than their male counterparts. The unemployment is much higher in urban areas
(6.5%) than in rural areas (3.9%).
Table 5.1: Unemployment rate of persons 15 years and older by region, locality and sex
Region
Total Urban Rural
Male Female Total Male Female Total
Male Female Total
Western 5.1 6.2 5.6
6.2 6.1 6.2
4.3 6.2 5.2
Central 5.5 3.9 4.6
7.1 6.9 7.0
4.5 1.5 2.9
Greater Accra 6.9 7.4 7.2
7.0 7.4 7.2
4.3 7.5 5.9
Volta 2.9 3.6 3.3
4.2 5.5 4.9
2.5 2.8 2.6
Eastern 2.5 5.9 4.3
4.6 8.4 6.7
1.1 3.6 2.3
Ashanti 4.6 4.7 4.6
7.4 6.2 6.8
1.6 2.9 2.3
Brong Ahafo 2.5 3.4 2.9
3.5 4.9 4.3
1.6 1.9 1.7
Northern 3.2 5.9 4.6
3.1 8.5 6.0
3.3 4.7 4.0
Upper East 10.5 11.0 10.8
6.4 10.1 8.3
11.5 11.3 11.4
Upper West 8.8 6.5 7.6
2.2 10.3 6.4
9.9 5.8 7.8
Total 4.8 5.5 5.2 6.1 6.9 6.5 3.6 4.1 3.9
There are marked differences in the unemployment rates recorded in the regions, with Upper
East (10.8%) recording the highest unemployment rate and Brong Ahafo (2.9%) recording
the lowest. The female unemployment rate is higher than that for males in all regions except
Central and Upper West where the reverse is the case (Table 5.1).
In terms of age, Table 5.2 shows that the unemployment rate is highest among the 15-24 age
group (10.9%) and lowest among those aged 65 years and older (2.5%); this is true for both
males and females. The unemployment rate is very high for the youth (15-24 years) in urban
areas (16.3%) compared to the other age groups.
Table 5.2: Unemployment rate of persons 15 years and older by sex,
age group and locality
Age group
Total Urban Rural
Male Female Total Male Female Total Male Female Total
15 - 24 10.2 11.7 10.9
15.8 16.7 16.3
6.6 7.7 7.1
25 - 44 3.3 4.1 3.8
4.1 5.0 4.6
2.3 3.1 2.8
45 - 64 2.8 3.2 3.0
3.2 3.8 3.5
2.3 2.6 2.5
65+ 2.6 2.5 2.5
1.9 2.5 2.3
2.9 2.5 2.7
All 4.8 5.5 5.2 6.1 6.9 6.5 3.6 4.1 3.9
According to Table 5.3, the unemployment rate is higher for persons with secondary
education (11.7%) and those with post-secondary diploma education (9.1%). The rates of
unemployment are however lower for persons with post graduate degrees (2.7%) and teacher
training, agriculture and nursing training (2.8%). Unemployment rates in urban areas are
generally higher than those recorded in rural areas in all the educational attainment categories
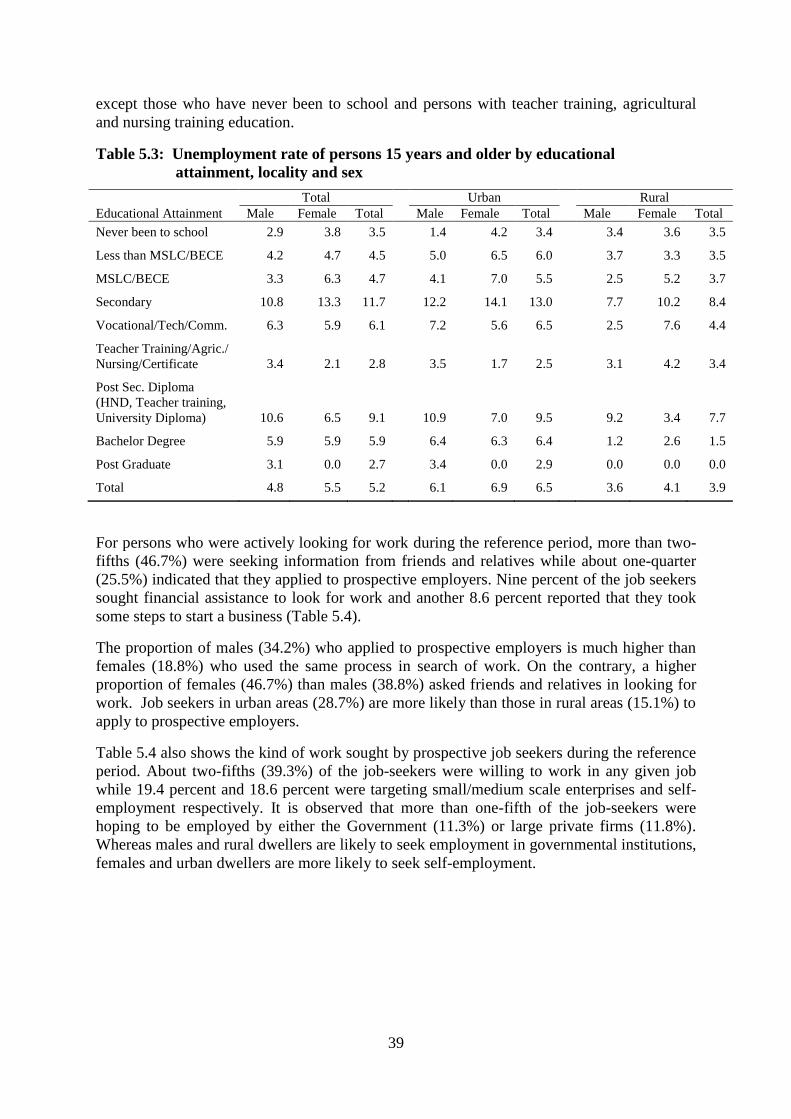
39
except those who have never been to school and persons with teacher training, agricultural
and nursing training education.
Table 5.3: Unemployment rate of persons 15 years and older by educational
attainment, locality and sex
Educational Attainment
Total Urban Rural
Male Female Total Male Female Total Male Female Total
Never been to school 2.9 3.8 3.5
1.4 4.2 3.4
3.4 3.6 3.5
Less than MSLC/BECE 4.2 4.7 4.5
5.0 6.5 6.0
3.7 3.3 3.5
MSLC/BECE 3.3 6.3 4.7
4.1 7.0 5.5
2.5 5.2 3.7
Secondary 10.8 13.3 11.7
12.2 14.1 13.0
7.7 10.2 8.4
Vocational/Tech/Comm. 6.3 5.9 6.1
7.2 5.6 6.5
2.5 7.6 4.4
Teacher Training/Agric./
Nursing/Certificate 3.4 2.1 2.8
3.5 1.7 2.5
3.1 4.2 3.4
Post Sec. Diploma
(HND, Teacher training,
University Diploma) 10.6 6.5 9.1
10.9 7.0 9.5
9.2 3.4 7.7
Bachelor Degree 5.9 5.9 5.9
6.4 6.3 6.4
1.2 2.6 1.5
Post Graduate 3.1 0.0 2.7
3.4 0.0 2.9
0.0 0.0 0.0
Total 4.8 5.5 5.2 6.1 6.9 6.5 3.6 4.1 3.9
For persons who were actively looking for work during the reference period, more than two-
fifths (46.7%) were seeking information from friends and relatives while about one-quarter
(25.5%) indicated that they applied to prospective employers. Nine percent of the job seekers
sought financial assistance to look for work and another 8.6 percent reported that they took
some steps to start a business (Table 5.4).
The proportion of males (34.2%) who applied to prospective employers is much higher than
females (18.8%) who used the same process in search of work. On the contrary, a higher
proportion of females (46.7%) than males (38.8%) asked friends and relatives in looking for
work. Job seekers in urban areas (28.7%) are more likely than those in rural areas (15.1%) to
apply to prospective employers.
Table 5.4 also shows the kind of work sought by prospective job seekers during the reference
period. About two-fifths (39.3%) of the job-seekers were willing to work in any given job
while 19.4 percent and 18.6 percent were targeting small/medium scale enterprises and self-
employment respectively. It is observed that more than one-fifth of the job-seekers were
hoping to be employed by either the Government (11.3%) or large private firms (11.8%).
Whereas males and rural dwellers are likely to seek employment in governmental institutions,
females and urban dwellers are more likely to seek self-employment.
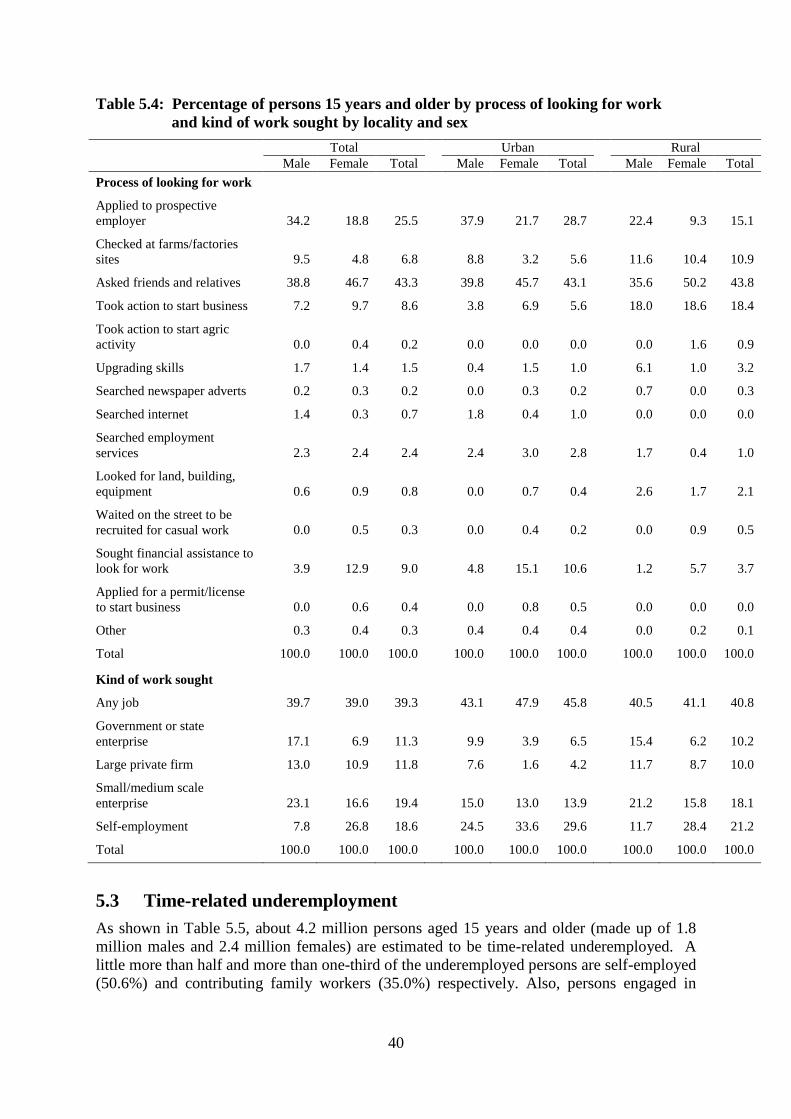
40
Table 5.4: Percentage of persons 15 years and older by process of looking for work
and kind of work sought by locality and sex
Total Urban Rural
Male Female Total Male Female Total Male Female Total
Process of looking for work
Applied to prospective
employer 34.2 18.8 25.5
37.9 21.7 28.7
22.4 9.3 15.1
Checked at farms/factories
sites 9.5 4.8 6.8
8.8 3.2 5.6
11.6 10.4 10.9
Asked friends and relatives 38.8 46.7 43.3
39.8 45.7 43.1
35.6 50.2 43.8
Took action to start business 7.2 9.7 8.6
3.8 6.9 5.6
18.0 18.6 18.4
Took action to start agric
activity 0.0 0.4 0.2
0.0 0.0 0.0
0.0 1.6 0.9
Upgrading skills 1.7 1.4 1.5
0.4 1.5 1.0
6.1 1.0 3.2
Searched newspaper adverts 0.2 0.3 0.2
0.0 0.3 0.2
0.7 0.0 0.3
Searched internet 1.4 0.3 0.7
1.8 0.4 1.0
0.0 0.0 0.0
Searched employment
services 2.3 2.4 2.4
2.4 3.0 2.8
1.7 0.4 1.0
Looked for land, building,
equipment 0.6 0.9 0.8
0.0 0.7 0.4
2.6 1.7 2.1
Waited on the street to be
recruited for casual work 0.0 0.5 0.3
0.0 0.4 0.2
0.0 0.9 0.5
Sought financial assistance to
look for work 3.9 12.9 9.0
4.8 15.1 10.6
1.2 5.7 3.7
Applied for a permit/license
to start business 0.0 0.6 0.4
0.0 0.8 0.5
0.0 0.0 0.0
Other 0.3 0.4 0.3
0.4 0.4 0.4
0.0 0.2 0.1
Total 100.0 100.0 100.0
100.0 100.0 100.0
100.0 100.0 100.0
Kind of work sought
Any job 39.7 39.0 39.3
43.1 47.9 45.8
40.5 41.1 40.8
Government or state
enterprise 17.1 6.9 11.3
9.9 3.9 6.5
15.4 6.2 10.2
Large private firm 13.0 10.9 11.8
7.6 1.6 4.2
11.7 8.7 10.0
Small/medium scale
enterprise 23.1 16.6 19.4
15.0 13.0 13.9
21.2 15.8 18.1
Self-employment 7.8 26.8 18.6
24.5 33.6 29.6
11.7 28.4 21.2
Total 100.0 100.0 100.0 100.0 100.0 100.0 100.0 100.0 100.0
5.3 Time-related underemployment
As shown in Table 5.5, about 4.2 million persons aged 15 years and older (made up of 1.8
million males and 2.4 million females) are estimated to be time-related underemployed. A
little more than half and more than one-third of the underemployed persons are self-employed
(50.6%) and contributing family workers (35.0%) respectively. Also, persons engaged in
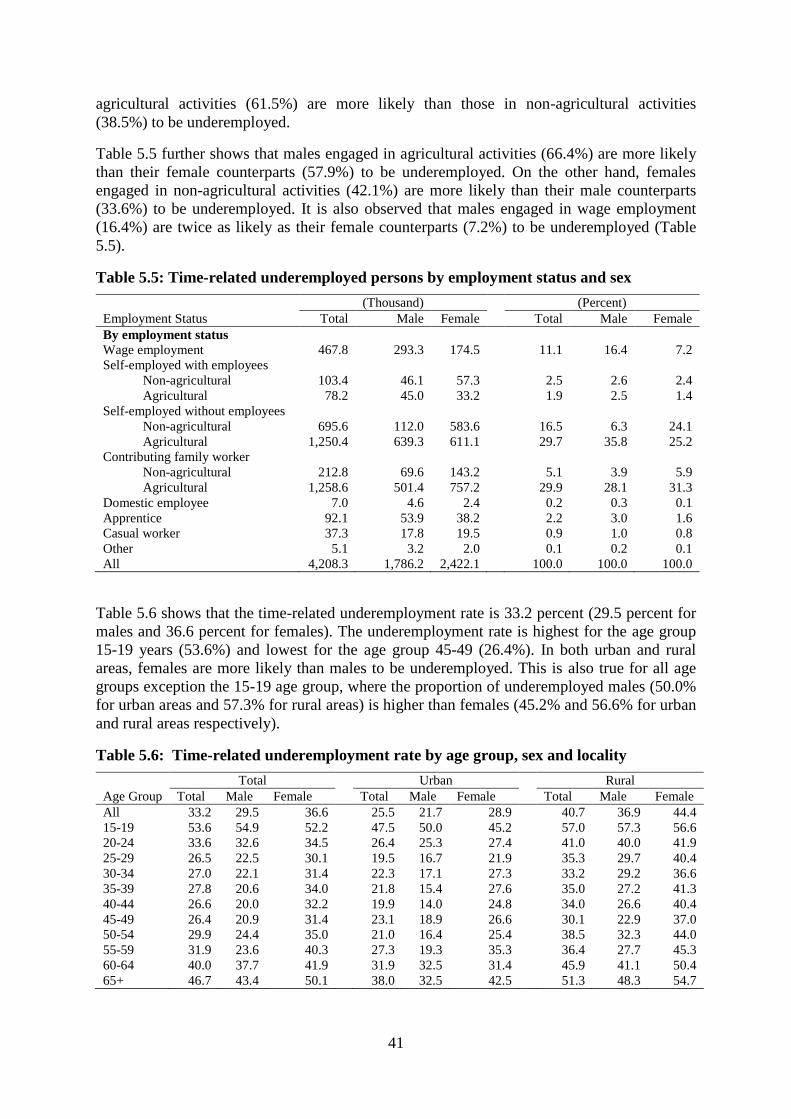
41
agricultural activities (61.5%) are more likely than those in non-agricultural activities
(38.5%) to be underemployed.
Table 5.5 further shows that males engaged in agricultural activities (66.4%) are more likely
than their female counterparts (57.9%) to be underemployed. On the other hand, females
engaged in non-agricultural activities (42.1%) are more likely than their male counterparts
(33.6%) to be underemployed. It is also observed that males engaged in wage employment
(16.4%) are twice as likely as their female counterparts (7.2%) to be underemployed (Table
5.5).
Table 5.5: Time-related underemployed persons by employment status and sex
Employment Status
(Thousand) (Percent)
Total Male Female Total Male Female
By employment status
Wage employment 467.8 293.3 174.5
11.1 16.4 7.2
Self-employed with employees
Non-agricultural 103.4 46.1 57.3
2.5 2.6 2.4
Agricultural 78.2 45.0 33.2
1.9 2.5 1.4
Self-employed without employees
Non-agricultural 695.6 112.0 583.6
16.5 6.3 24.1
Agricultural 1,250.4 639.3 611.1
29.7 35.8 25.2
Contributing family worker
Non-agricultural 212.8 69.6 143.2
5.1 3.9 5.9
Agricultural 1,258.6 501.4 757.2
29.9 28.1 31.3
Domestic employee 7.0 4.6 2.4
0.2 0.3 0.1
Apprentice 92.1 53.9 38.2
2.2 3.0 1.6
Casual worker 37.3 17.8 19.5
0.9 1.0 0.8
Other 5.1 3.2 2.0
0.1 0.2 0.1
All 4,208.3 1,786.2 2,422.1
100.0 100.0 100.0
Table 5.6 shows that the time-related underemployment rate is 33.2 percent (29.5 percent for
males and 36.6 percent for females). The underemployment rate is highest for the age group
15-19 years (53.6%) and lowest for the age group 45-49 (26.4%). In both urban and rural
areas, females are more likely than males to be underemployed. This is also true for all age
groups exception the 15-19 age group, where the proportion of underemployed males (50.0%
for urban areas and 57.3% for rural areas) is higher than females (45.2% and 56.6% for urban
and rural areas respectively).
Table 5.6: Time-related underemployment rate by age group, sex and locality
Total Urban Rural
Age Group Total Male Female Total Male Female Total Male Female
All 33.2 29.5 36.6
25.5 21.7 28.9
40.7 36.9 44.4
15-19 53.6 54.9 52.2
47.5 50.0 45.2
57.0 57.3 56.6
20-24 33.6 32.6 34.5
26.4 25.3 27.4
41.0 40.0 41.9
25-29 26.5 22.5 30.1
19.5 16.7 21.9
35.3 29.7 40.4
30-34 27.0 22.1 31.4
22.3 17.1 27.3
33.2 29.2 36.6
35-39 27.8 20.6 34.0
21.8 15.4 27.6
35.0 27.2 41.3
40-44 26.6 20.0 32.2
19.9 14.0 24.8
34.0 26.6 40.4
45-49 26.4 20.9 31.4
23.1 18.9 26.6
30.1 22.9 37.0
50-54 29.9 24.4 35.0
21.0 16.4 25.4
38.5 32.3 44.0
55-59 31.9 23.6 40.3
27.3 19.3 35.3
36.4 27.7 45.3
60-64 40.0 37.7 41.9
31.9 32.5 31.4
45.9 41.1 50.4
65+ 46.7 43.4 50.1 38.0 32.5 42.5 51.3 48.3 54.7
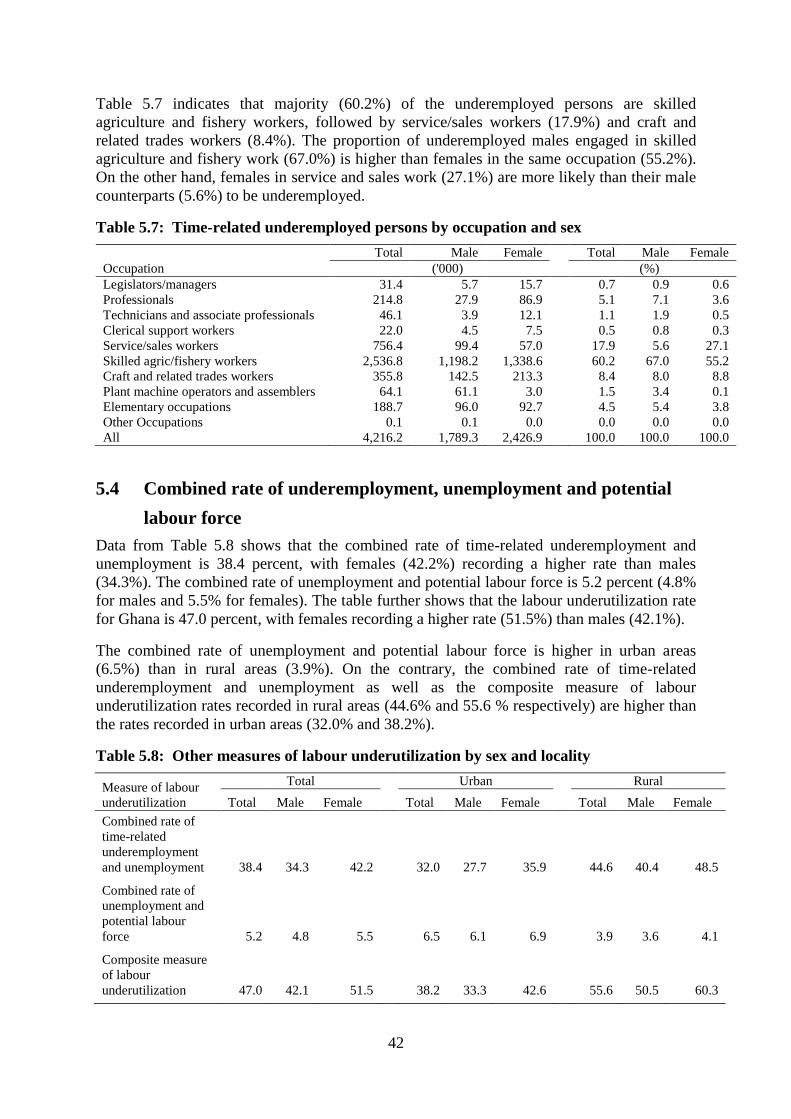
42
Table 5.7 indicates that majority (60.2%) of the underemployed persons are skilled
agriculture and fishery workers, followed by service/sales workers (17.9%) and craft and
related trades workers (8.4%). The proportion of underemployed males engaged in skilled
agriculture and fishery work (67.0%) is higher than females in the same occupation (55.2%).
On the other hand, females in service and sales work (27.1%) are more likely than their male
counterparts (5.6%) to be underemployed.
Table 5.7: Time-related underemployed persons by occupation and sex
Occupation
Total Male Female Total Male Female
('000)
(%)
Legislators/managers 31.4 5.7 15.7
0.7 0.9 0.6
Professionals 214.8 27.9 86.9
5.1 7.1 3.6
Technicians and associate professionals 46.1 3.9 12.1
1.1 1.9 0.5
Clerical support workers 22.0 4.5 7.5
0.5 0.8 0.3
Service/sales workers 756.4 99.4 57.0
17.9 5.6 27.1
Skilled agric/fishery workers 2,536.8 1,198.2 1,338.6
60.2 67.0 55.2
Craft and related trades workers 355.8 142.5 213.3
8.4 8.0 8.8
Plant machine operators and assemblers 64.1 61.1 3.0
1.5 3.4 0.1
Elementary occupations 188.7 96.0 92.7
4.5 5.4 3.8
Other Occupations 0.1 0.1 0.0
0.0 0.0 0.0
All 4,216.2 1,789.3 2,426.9
100.0 100.0 100.0
5.4 Combined rate of underemployment, unemployment and potential
labour force
Data from Table 5.8 shows that the combined rate of time-related underemployment and
unemployment is 38.4 percent, with females (42.2%) recording a higher rate than males
(34.3%). The combined rate of unemployment and potential labour force is 5.2 percent (4.8%
for males and 5.5% for females). The table further shows that the labour underutilization rate
for Ghana is 47.0 percent, with females recording a higher rate (51.5%) than males (42.1%).
The combined rate of unemployment and potential labour force is higher in urban areas
(6.5%) than in rural areas (3.9%). On the contrary, the combined rate of time-related
underemployment and unemployment as well as the composite measure of labour
underutilization rates recorded in rural areas (44.6% and 55.6 % respectively) are higher than
the rates recorded in urban areas (32.0% and 38.2%).
Table 5.8: Other measures of labour underutilization by sex and locality
Measure of labour
underutilization
Total Urban Rural
Total Male Female Total Male Female Total Male Female
Combined rate of
time-related
underemployment
and unemployment 38.4 34.3 42.2 32.0 27.7 35.9 44.6 40.4 48.5
Combined rate of
unemployment and
potential labour
force 5.2 4.8 5.5 6.5 6.1 6.9 3.9 3.6 4.1
Composite measure
of labour
underutilization 47.0 42.1 51.5
38.2 33.3 42.6
55.6 50.5 60.3
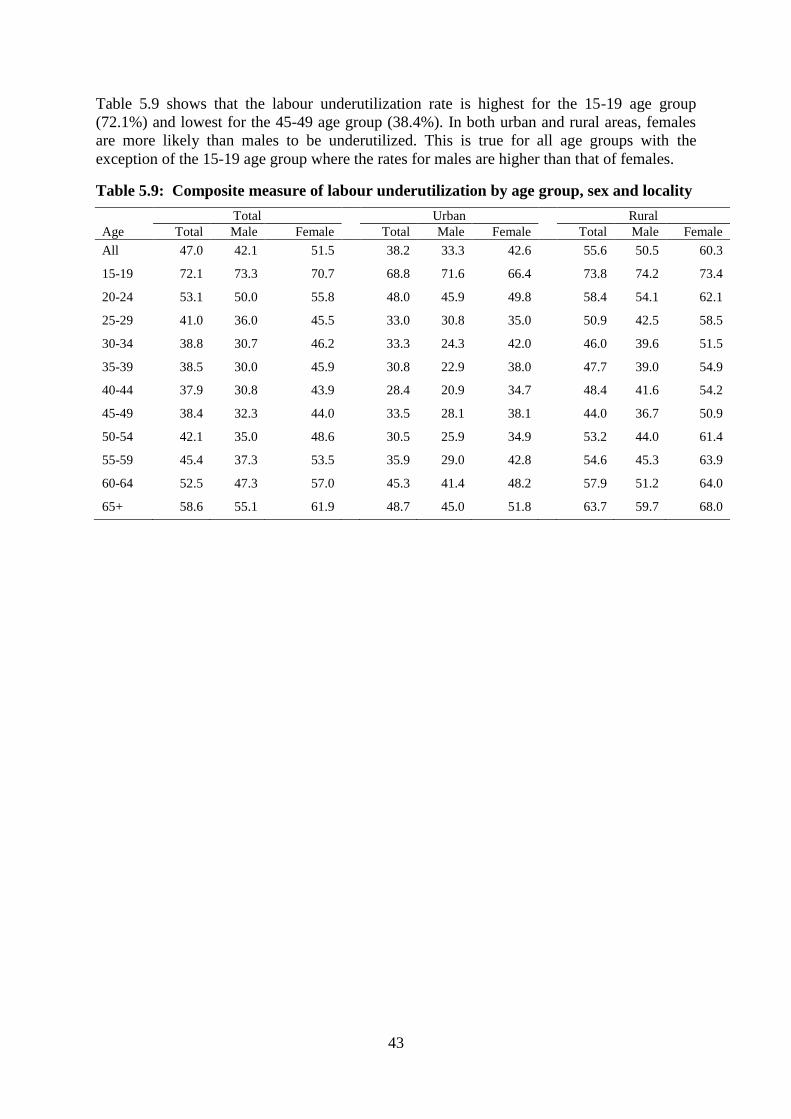
43
Table 5.9 shows that the labour underutilization rate is highest for the 15-19 age group
(72.1%) and lowest for the 45-49 age group (38.4%). In both urban and rural areas, females
are more likely than males to be underutilized. This is true for all age groups with the
exception of the 15-19 age group where the rates for males are higher than that of females.
Table 5.9: Composite measure of labour underutilization by age group, sex and locality
Total Urban Rural
Age Total Male Female Total Male Female Total Male Female
All 47.0 42.1 51.5
38.2 33.3 42.6
55.6 50.5 60.3
15-19 72.1 73.3 70.7
68.8 71.6 66.4
73.8 74.2 73.4
20-24 53.1 50.0 55.8
48.0 45.9 49.8
58.4 54.1 62.1
25-29 41.0 36.0 45.5
33.0 30.8 35.0
50.9 42.5 58.5
30-34 38.8 30.7 46.2
33.3 24.3 42.0
46.0 39.6 51.5
35-39 38.5 30.0 45.9
30.8 22.9 38.0
47.7 39.0 54.9
40-44 37.9 30.8 43.9
28.4 20.9 34.7
48.4 41.6 54.2
45-49 38.4 32.3 44.0
33.5 28.1 38.1
44.0 36.7 50.9
50-54 42.1 35.0 48.6
30.5 25.9 34.9
53.2 44.0 61.4
55-59 45.4 37.3 53.5
35.9 29.0 42.8
54.6 45.3 63.9
60-64 52.5 47.3 57.0
45.3 41.4 48.2
57.9 51.2 64.0
65+ 58.6 55.1 61.9 48.7 45.0 51.8 63.7 59.7 68.0
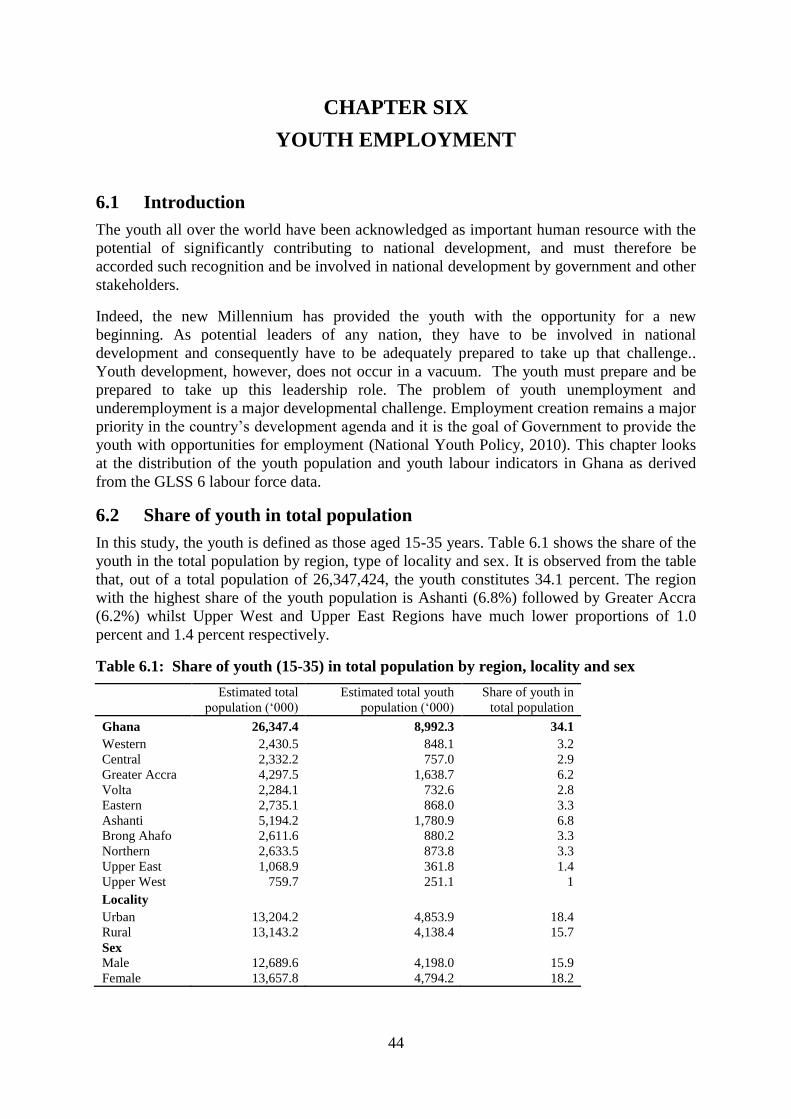
44
CHAPTER SIX
YOUTH EMPLOYMENT
6.1 Introduction
The youth all over the world have been acknowledged as important human resource with the
potential of significantly contributing to national development, and must therefore be
accorded such recognition and be involved in national development by government and other
stakeholders.
Indeed, the new Millennium has provided the youth with the opportunity for a new
beginning. As potential leaders of any nation, they have to be involved in national
development and consequently have to be adequately prepared to take up that challenge..
Youth development, however, does not occur in a vacuum. The youth must prepare and be
prepared to take up this leadership role. The problem of youth unemployment and
underemployment is a major developmental challenge. Employment creation remains a major
priority in the country’s development agenda and it is the goal of Government to provide the
youth with opportunities for employment (National Youth Policy, 2010). This chapter looks
at the distribution of the youth population and youth labour indicators in Ghana as derived
from the GLSS 6 labour force data.
6.2 Share of youth in total population
In this study, the youth is defined as those aged 15-35 years. Table 6.1 shows the share of the
youth in the total population by region, type of locality and sex. It is observed from the table
that, out of a total population of 26,347,424, the youth constitutes 34.1 percent. The region
with the highest share of the youth population is Ashanti (6.8%) followed by Greater Accra
(6.2%) whilst Upper West and Upper East Regions have much lower proportions of 1.0
percent and 1.4 percent respectively.
Table 6.1: Share of youth (15-35) in total population by region, locality and sex
Estimated total
population (‘000)
Estimated total youth
population (‘000)
Share of youth in
total population
Ghana 26,347.4 8,992.3 34.1
Western 2,430.5 848.1 3.2
Central 2,332.2 757.0 2.9
Greater Accra 4,297.5 1,638.7 6.2
Volta 2,284.1 732.6 2.8
Eastern 2,735.1 868.0 3.3
Ashanti 5,194.2 1,780.9 6.8
Brong Ahafo 2,611.6 880.2 3.3
Northern 2,633.5 873.8 3.3
Upper East 1,068.9 361.8 1.4
Upper West 759.7 251.1 1
Locality
Urban 13,204.2 4,853.9 18.4
Rural 13,143.2 4,138.4 15.7
Sex
Male 12,689.6 4,198.0 15.9
Female 13,657.8 4,794.2 18.2
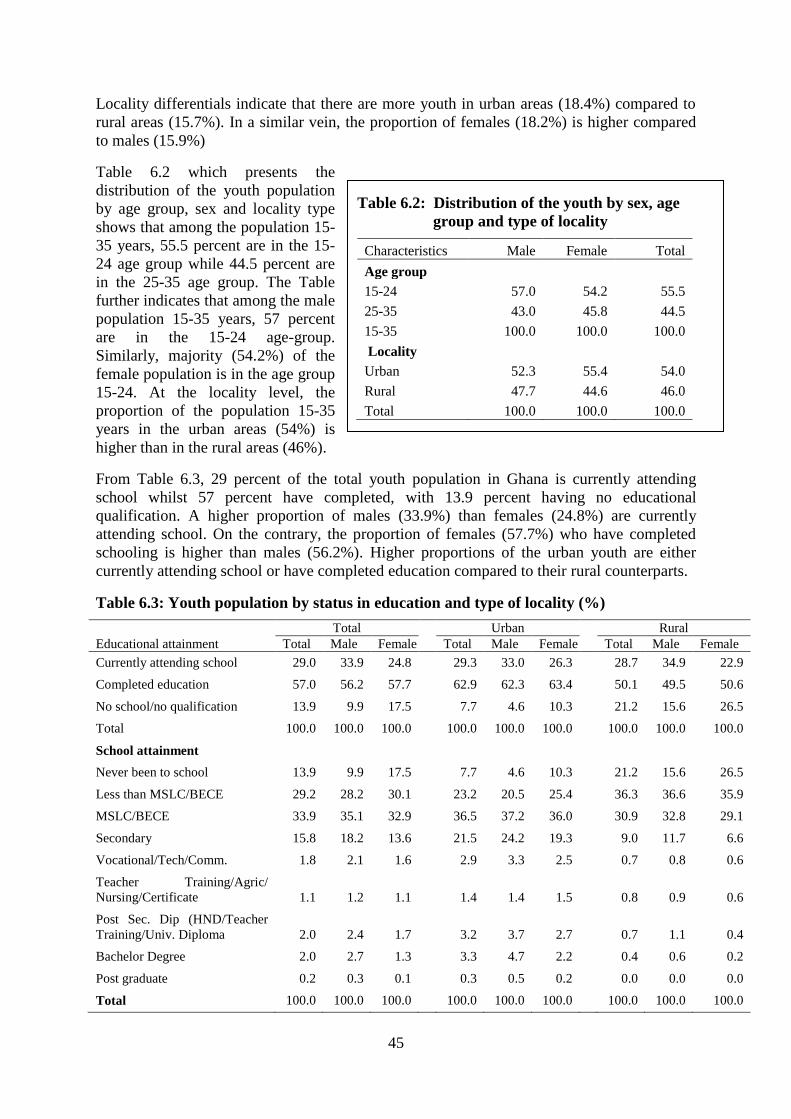
45
Locality differentials indicate that there are more youth in urban areas (18.4%) compared to
rural areas (15.7%). In a similar vein, the proportion of females (18.2%) is higher compared
to males (15.9%)
Table 6.2 which presents the
distribution of the youth population
by age group, sex and locality type
shows that among the population 15-
35 years, 55.5 percent are in the 15-
24 age group while 44.5 percent are
in the 25-35 age group. The Table
further indicates that among the male
population 15-35 years, 57 percent
are in the 15-24 age-group.
Similarly, majority (54.2%) of the
female population is in the age group
15-24. At the locality level, the
proportion of the population 15-35
years in the urban areas (54%) is
higher than in the rural areas (46%).
From Table 6.3, 29 percent of the total youth population in Ghana is currently attending
school whilst 57 percent have completed, with 13.9 percent having no educational
qualification. A higher proportion of males (33.9%) than females (24.8%) are currently
attending school. On the contrary, the proportion of females (57.7%) who have completed
schooling is higher than males (56.2%). Higher proportions of the urban youth are either
currently attending school or have completed education compared to their rural counterparts.
Table 6.3: Youth population by status in education and type of locality (%)
Educational attainment
Total Urban Rural
Total Male Female Total Male Female Total Male Female
Currently attending school 29.0 33.9 24.8
29.3 33.0 26.3
28.7 34.9 22.9
Completed education 57.0 56.2 57.7
62.9 62.3 63.4
50.1 49.5 50.6
No school/no qualification 13.9 9.9 17.5
7.7 4.6 10.3
21.2 15.6 26.5
Total 100.0 100.0 100.0
100.0 100.0 100.0
100.0 100.0 100.0
School attainment
Never been to school 13.9 9.9 17.5
7.7 4.6 10.3
21.2 15.6 26.5
Less than MSLC/BECE 29.2 28.2 30.1
23.2 20.5 25.4
36.3 36.6 35.9
MSLC/BECE 33.9 35.1 32.9
36.5 37.2 36.0
30.9 32.8 29.1
Secondary 15.8 18.2 13.6
21.5 24.2 19.3
9.0 11.7 6.6
Vocational/Tech/Comm. 1.8 2.1 1.6
2.9 3.3 2.5
0.7 0.8 0.6
Teacher Training/Agric/
Nursing/Certificate 1.1 1.2 1.1
1.4 1.4 1.5
0.8 0.9 0.6
Post Sec. Dip (HND/Teacher
Training/Univ. Diploma 2.0 2.4 1.7
3.2 3.7 2.7
0.7 1.1 0.4
Bachelor Degree 2.0 2.7 1.3
3.3 4.7 2.2
0.4 0.6 0.2
Post graduate 0.2 0.3 0.1
0.3 0.5 0.2
0.0 0.0 0.0
Total 100.0 100.0 100.0 100.0 100.0 100.0 100.0 100.0 100.0
Table 6.2: Distribution of the youth by sex, age
group and type of locality
Characteristics Male Female Total
Age group
15-24 57.0 54.2 55.5
25-35 43.0 45.8 44.5
15-35 100.0 100.0 100.0
Locality
Urban 52.3 55.4 54.0
Rural 47.7 44.6 46.0
Total 100.0 100.0 100.0
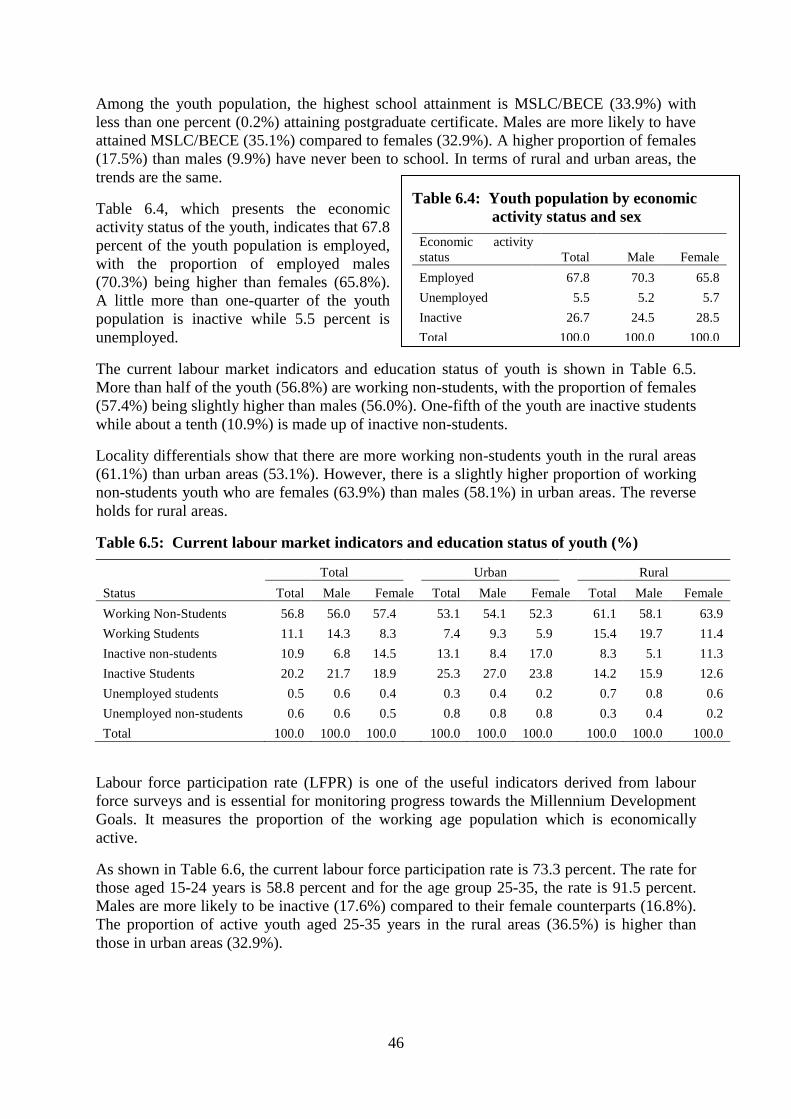
46
Table 6.4: Youth population by economic
activity status and sex
Economic activity
status Total Male Female
Employed 67.8 70.3 65.8
Unemployed 5.5 5.2 5.7
Inactive 26.7 24.5 28.5
Total 100.0 100.0 100.0
Among the youth population, the highest school attainment is MSLC/BECE (33.9%) with
less than one percent (0.2%) attaining postgraduate certificate. Males are more likely to have
attained MSLC/BECE (35.1%) compared to females (32.9%). A higher proportion of females
(17.5%) than males (9.9%) have never been to school. In terms of rural and urban areas, the
trends are the same.
Table 6.4, which presents the economic
activity status of the youth, indicates that 67.8
percent of the youth population is employed,
with the proportion of employed males
(70.3%) being higher than females (65.8%).
A little more than one-quarter of the youth
population is inactive while 5.5 percent is
unemployed.
The current labour market indicators and education status of youth is shown in Table 6.5.
More than half of the youth (56.8%) are working non-students, with the proportion of females
(57.4%) being slightly higher than males (56.0%). One-fifth of the youth are inactive students
while about a tenth (10.9%) is made up of inactive non-students.
Locality differentials show that there are more working non-students youth in the rural areas
(61.1%) than urban areas (53.1%). However, there is a slightly higher proportion of working
non-students youth who are females (63.9%) than males (58.1%) in urban areas. The reverse
holds for rural areas.
Table 6.5: Current labour market indicators and education status of youth (%)
Status
Total Urban Rural
Total Male Female Total Male Female Total Male Female
Working Non-Students 56.8 56.0 57.4
53.1 54.1 52.3
61.1 58.1 63.9
Working Students 11.1 14.3 8.3
7.4 9.3 5.9
15.4 19.7 11.4
Inactive non-students 10.9 6.8 14.5
13.1 8.4 17.0
8.3 5.1 11.3
Inactive Students 20.2 21.7 18.9
25.3 27.0 23.8
14.2 15.9 12.6
Unemployed students 0.5 0.6 0.4
0.3 0.4 0.2
0.7 0.8 0.6
Unemployed non-students 0.6 0.6 0.5
0.8 0.8 0.8
0.3 0.4 0.2
Total 100.0 100.0 100.0 100.0 100.0 100.0 100.0 100.0 100.0
Labour force participation rate (LFPR) is one of the useful indicators derived from labour
force surveys and is essential for monitoring progress towards the Millennium Development
Goals. It measures the proportion of the working age population which is economically
active.
As shown in Table 6.6, the current labour force participation rate is 73.3 percent. The rate for
those aged 15-24 years is 58.8 percent and for the age group 25-35, the rate is 91.5 percent.
Males are more likely to be inactive (17.6%) compared to their female counterparts (16.8%).
The proportion of active youth aged 25-35 years in the rural areas (36.5%) is higher than
those in urban areas (32.9%).
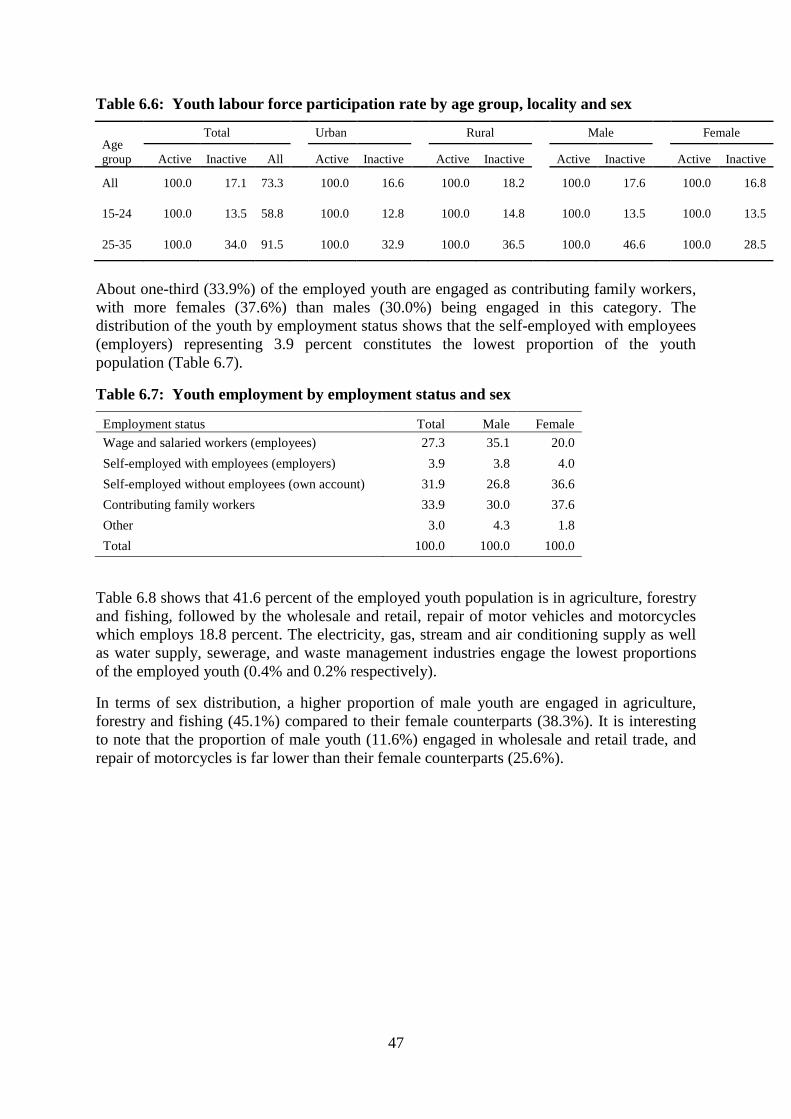
47
Table 6.6: Youth labour force participation rate by age group, locality and sex
Age
group
Total Urban Rural Male Female
Active Inactive All Active Inactive Active Inactive
Active Inactive
Active Inactive
All 100.0 17.1 73.3
100.0 16.6 100.0 18.2
100.0 17.6 100.0 16.8
15-24 100.0 13.5 58.8
100.0 12.8
100.0 14.8
100.0 13.5
100.0 13.5
25-35 100.0 34.0 91.5 100.0 32.9 100.0 36.5 100.0 46.6 100.0 28.5
About one-third (33.9%) of the employed youth are engaged as contributing family workers,
with more females (37.6%) than males (30.0%) being engaged in this category. The
distribution of the youth by employment status shows that the self-employed with employees
(employers) representing 3.9 percent constitutes the lowest proportion of the youth
population (Table 6.7).
Table 6.7: Youth employment by employment status and sex
Employment status Total Male Female
Wage and salaried workers (employees) 27.3 35.1 20.0
Self-employed with employees (employers) 3.9 3.8 4.0
Self-employed without employees (own account) 31.9 26.8 36.6
Contributing family workers 33.9 30.0 37.6
Other 3.0 4.3 1.8
Total 100.0 100.0 100.0
Table 6.8 shows that 41.6 percent of the employed youth population is in agriculture, forestry
and fishing, followed by the wholesale and retail, repair of motor vehicles and motorcycles
which employs 18.8 percent. The electricity, gas, stream and air conditioning supply as well
as water supply, sewerage, and waste management industries engage the lowest proportions
of the employed youth (0.4% and 0.2% respectively).
In terms of sex distribution, a higher proportion of male youth are engaged in agriculture,
forestry and fishing (45.1%) compared to their female counterparts (38.3%). It is interesting
to note that the proportion of male youth (11.6%) engaged in wholesale and retail trade, and
repair of motorcycles is far lower than their female counterparts (25.6%).
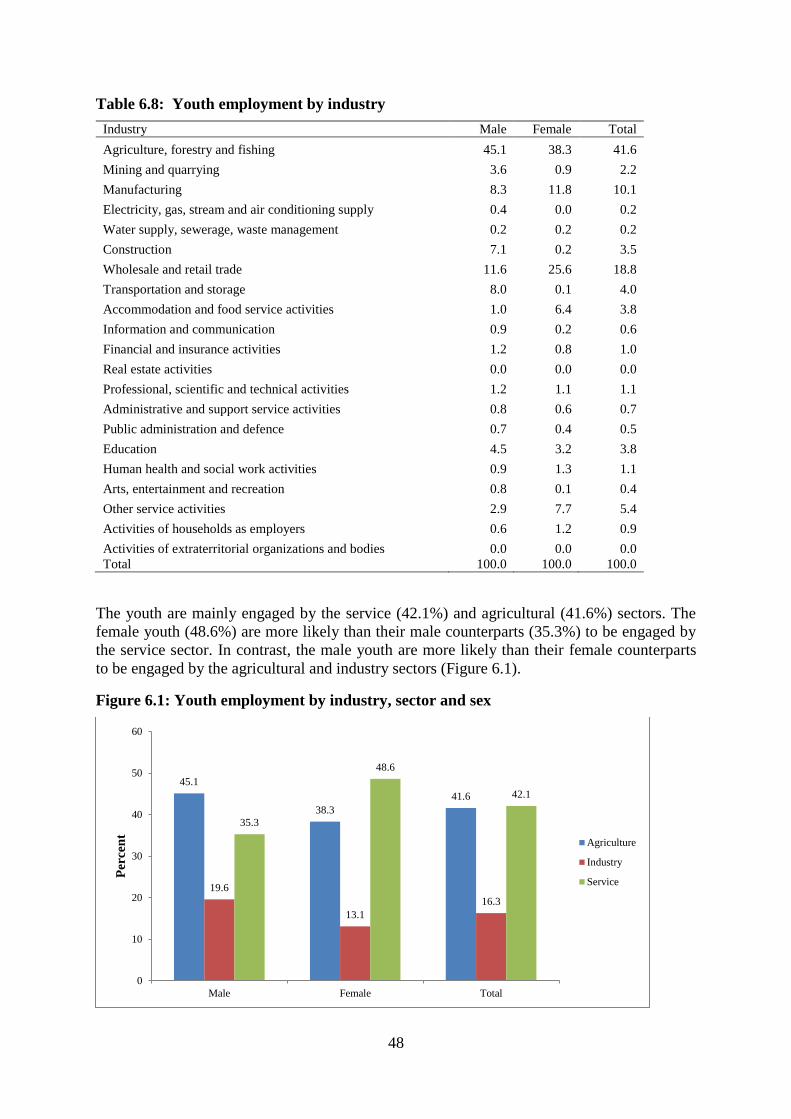
48
Table 6.8: Youth employment by industry
Industry Male Female Total
Agriculture, forestry and fishing 45.1 38.3 41.6
Mining and quarrying 3.6 0.9 2.2
Manufacturing 8.3 11.8 10.1
Electricity, gas, stream and air conditioning supply 0.4 0.0 0.2
Water supply, sewerage, waste management 0.2 0.2 0.2
Construction 7.1 0.2 3.5
Wholesale and retail trade 11.6 25.6 18.8
Transportation and storage 8.0 0.1 4.0
Accommodation and food service activities 1.0 6.4 3.8
Information and communication 0.9 0.2 0.6
Financial and insurance activities 1.2 0.8 1.0
Real estate activities 0.0 0.0 0.0
Professional, scientific and technical activities 1.2 1.1 1.1
Administrative and support service activities 0.8 0.6 0.7
Public administration and defence 0.7 0.4 0.5
Education 4.5 3.2 3.8
Human health and social work activities 0.9 1.3 1.1
Arts, entertainment and recreation 0.8 0.1 0.4
Other service activities 2.9 7.7 5.4
Activities of households as employers 0.6 1.2 0.9
Activities of extraterritorial organizations and bodies 0.0 0.0 0.0
Total 100.0 100.0 100.0
The youth are mainly engaged by the service (42.1%) and agricultural (41.6%) sectors. The
female youth (48.6%) are more likely than their male counterparts (35.3%) to be engaged by
the service sector. In contrast, the male youth are more likely than their female counterparts
to be engaged by the agricultural and industry sectors (Figure 6.1).
Figure 6.1: Youth employment by industry, sector and sex
45.1
38.3
41.6
19.6
13.1
16.3
35.3
48.6
42.1
0
10
20
30
40
50
60
Male Female Total
Per
cen
t
Agriculture
Industry
Service
49
There is substantial variation in the number of hours worked per week among the various
occupations by the employed youth. The average hours actually worked per week by the
employed youth in all jobs is 41.8 hours per week, of which males (43 hours) worked longer
hours per week than females (40.6 hours). Plant machine operators and assemblers have the
highest average hours of work per week (60.7 hours), with males in the same occupation
recording 61 hours per week and females, 52.5 hours. The employed youth spend on average,
less hours per week on skilled agriculture or fishery activities (32.7 hours per week), with
males working 2.3 hours more than females per week.
Table 6.9: Employed youth by average hours worked per week in all jobs
Occupation Male Female Total
Legislators/managers 56.1 49.1 52.8
Professionals 40.7 40.3 40.6
Technicians and associate professionals 46.8 41.9 46.0
Clerical support workers 46.0 48.9 47.7
Service/sales workers 53.6 48.1 49.3
Skilled agric/fishery workers 33.8 31.5 32.7
Craft and related trades workers 49.8 44.1 47.3
Plant machine operators and assemblers 61.0 52.5 60.7
Elementary occupations 42.2 36.4 40.1
Other Occupations 49.5 39.0 47.9
Total 43.0 40.6 41.8
The youth unemployment rate, which is an important indicator for monitoring the
Millennium Development Goals, is 5.5 percent (Table 6.10); and is 6.5 percent in urban areas
and 4.3 percent in rural areas. The rate is higher for those aged 15 – 24 years (6.4%)
compared to those aged 25 – 35 years (4.4%). The unemployment rates are slightly higher for
females than males in both urban and rural areas.
Table 6.10: Youth Unemployment rate by age group, type of locality and sex
Age group
Total Urban Rural
Total Male Female Total Male Female Total Male Female
Total 5.5 5.2 5.7 6.5 6.4 6.7 4.3 4.0 4.6
15-24 6.4 6.2 6.7
7.7 7.6 7.8
5.1 4.8 5.4
25-35 4.4 4.0 4.6
5.2 5.0 5.4
3.3 2.7 3.7
Table 6.11 shows labour force indicators for the youth (aged 15-35 years) by sex and locality.
From the table, the youth labour force participation rate is 73.3 percent, unemployment rate is
5.5 percent and youth labour underutilization rate is 42.6 percent. The table further shows
that females are more likely to be unemployed and underutilized than males.
Table 6.11: Key youth (15-35 years) labour market indicators by locality and sex
Locality
Total
Youth
population
(‘000)
Unemployed
(relaxed)
(‘000)
Inactive
Students
(‘000)
Inactive
Non-
students
(‘000)
Youth Labour
force
participation rate
(relaxed)
Youth
unemployment
rate (relaxed)
%
Youth labour
underutilization
rate (%)
Total 8,992.3 496.0 1,728.4 612.9 73.3 5.5 42.6
Urban 4,853.9 317.8 1,183.1 391.0 67.0 6.5 36.7
Rural 4,138.4 1781 545.3 221.9 80.7 4.3 48.4
Male 4,198.0 220.3 869.1 131.5 75.5 5.2 40.1
Female 4,794.2 275.7 859.4 481.4 71.5 5.7 45.0
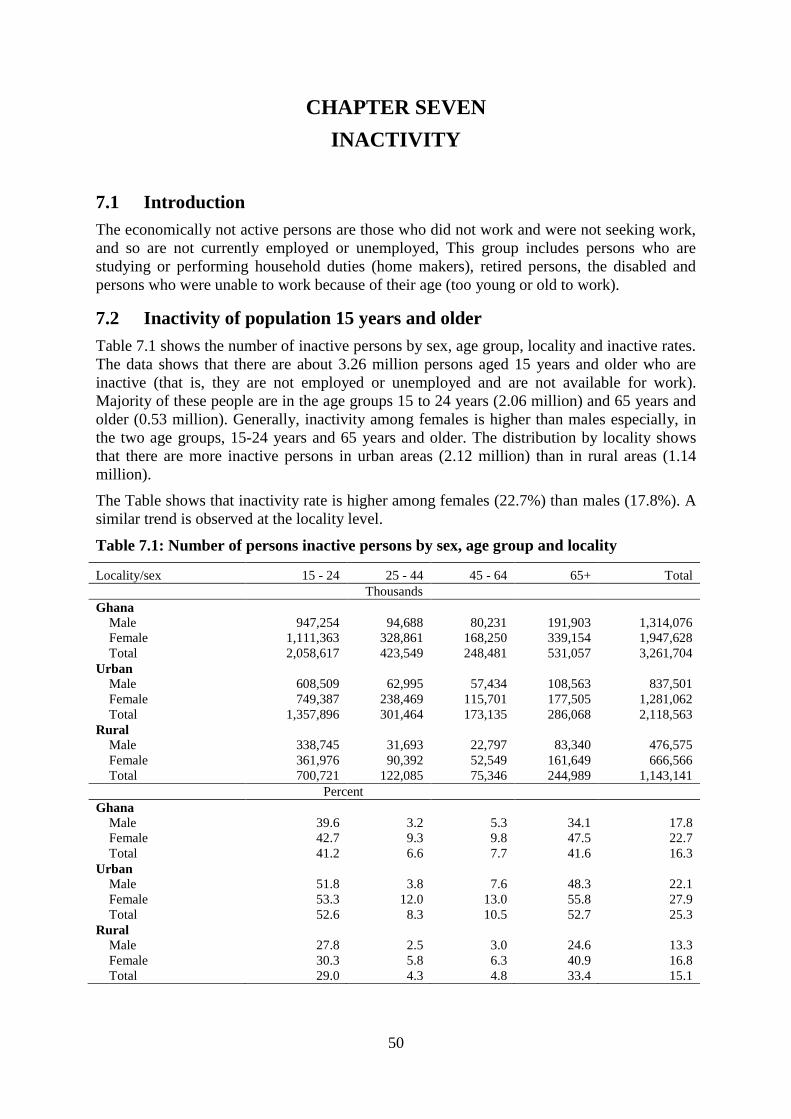
50
CHAPTER SEVEN
INACTIVITY
7.1 Introduction
The economically not active persons are those who did not work and were not seeking work,
and so are not currently employed or unemployed, This group includes persons who are
studying or performing household duties (home makers), retired persons, the disabled and
persons who were unable to work because of their age (too young or old to work).
7.2 Inactivity of population 15 years and older
Table 7.1 shows the number of inactive persons by sex, age group, locality and inactive rates.
The data shows that there are about 3.26 million persons aged 15 years and older who are
inactive (that is, they are not employed or unemployed and are not available for work).
Majority of these people are in the age groups 15 to 24 years (2.06 million) and 65 years and
older (0.53 million). Generally, inactivity among females is higher than males especially, in
the two age groups, 15-24 years and 65 years and older. The distribution by locality shows
that there are more inactive persons in urban areas (2.12 million) than in rural areas (1.14
million).
The Table shows that inactivity rate is higher among females (22.7%) than males (17.8%). A
similar trend is observed at the locality level.
Table 7.1: Number of persons inactive persons by sex, age group and locality
Locality/sex 15 - 24 25 - 44 45 - 64 65+ Total
Thousands
Ghana
Male 947,254 94,688 80,231 191,903 1,314,076
Female 1,111,363 328,861 168,250 339,154 1,947,628
Total 2,058,617 423,549 248,481 531,057 3,261,704
Urban
Male 608,509 62,995 57,434 108,563 837,501
Female 749,387 238,469 115,701 177,505 1,281,062
Total 1,357,896 301,464 173,135 286,068 2,118,563
Rural
Male 338,745 31,693 22,797 83,340 476,575
Female 361,976 90,392 52,549 161,649 666,566
Total 700,721 122,085 75,346 244,989 1,143,141
Percent
Ghana
Male 39.6 3.2 5.3 34.1 17.8
Female 42.7 9.3 9.8 47.5 22.7
Total 41.2 6.6 7.7 41.6 16.3
Urban
Male 51.8 3.8 7.6 48.3 22.1
Female 53.3 12.0 13.0 55.8 27.9
Total 52.6 8.3 10.5 52.7 25.3
Rural
Male 27.8 2.5 3.0 24.6 13.3
Female 30.3 5.8 6.3 40.9 16.8
Total 29.0 4.3 4.8 33.4 15.1
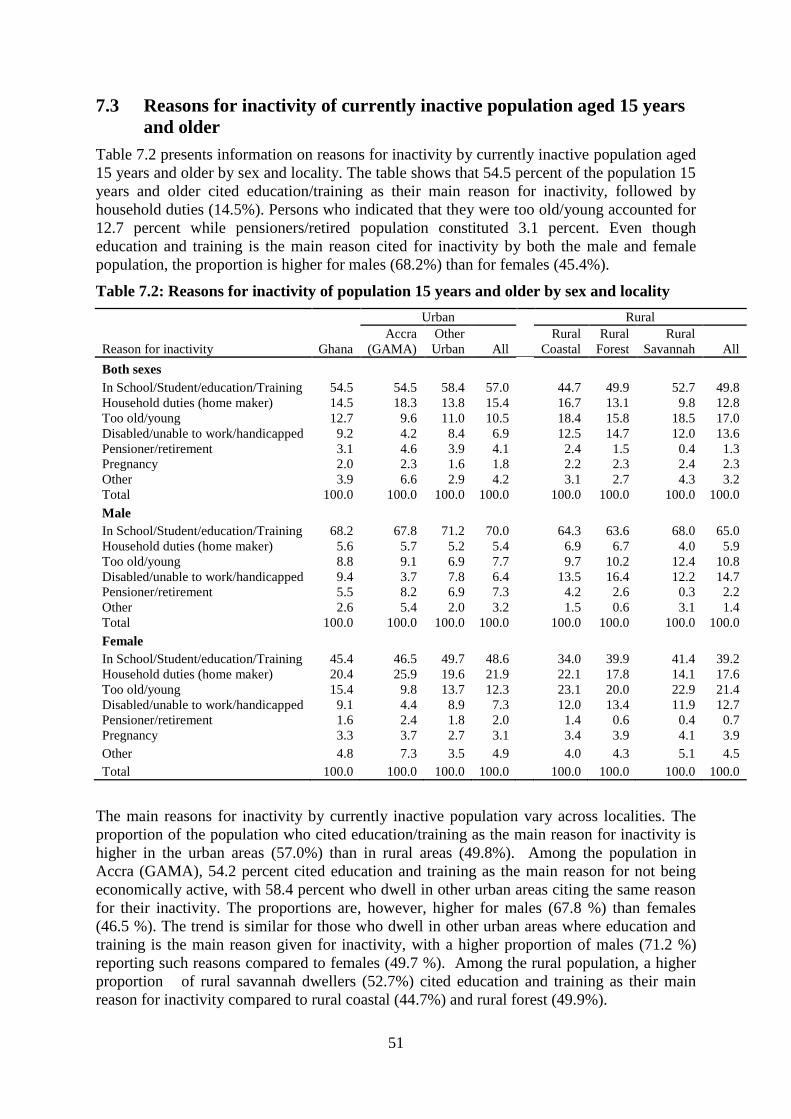
51
7.3 Reasons for inactivity of currently inactive population aged 15 years
and older
Table 7.2 presents information on reasons for inactivity by currently inactive population aged
15 years and older by sex and locality. The table shows that 54.5 percent of the population 15
years and older cited education/training as their main reason for inactivity, followed by
household duties (14.5%). Persons who indicated that they were too old/young accounted for
12.7 percent while pensioners/retired population constituted 3.1 percent. Even though
education and training is the main reason cited for inactivity by both the male and female
population, the proportion is higher for males (68.2%) than for females (45.4%).
Table 7.2: Reasons for inactivity of population 15 years and older by sex and locality
Reason for inactivity Ghana
Urban Rural
Accra
(GAMA)
Other
Urban All
Rural
Coastal
Rural
Forest
Rural
Savannah All
Both sexes
In School/Student/education/Training 54.5 54.5 58.4 57.0
44.7 49.9 52.7 49.8
Household duties (home maker) 14.5 18.3 13.8 15.4
16.7 13.1 9.8 12.8
Too old/young 12.7 9.6 11.0 10.5
18.4 15.8 18.5 17.0
Disabled/unable to work/handicapped 9.2 4.2 8.4 6.9
12.5 14.7 12.0 13.6
Pensioner/retirement 3.1 4.6 3.9 4.1
2.4 1.5 0.4 1.3
Pregnancy 2.0 2.3 1.6 1.8
2.2 2.3 2.4 2.3
Other 3.9 6.6 2.9 4.2
3.1 2.7 4.3 3.2
Total 100.0 100.0 100.0 100.0
100.0 100.0 100.0 100.0
Male
In School/Student/education/Training 68.2 67.8 71.2 70.0
64.3 63.6 68.0 65.0
Household duties (home maker) 5.6 5.7 5.2 5.4
6.9 6.7 4.0 5.9
Too old/young 8.8 9.1 6.9 7.7
9.7 10.2 12.4 10.8
Disabled/unable to work/handicapped 9.4 3.7 7.8 6.4
13.5 16.4 12.2 14.7
Pensioner/retirement 5.5 8.2 6.9 7.3
4.2 2.6 0.3 2.2
Other 2.6 5.4 2.0 3.2
1.5 0.6 3.1 1.4
Total 100.0 100.0 100.0 100.0
100.0 100.0 100.0 100.0
Female
In School/Student/education/Training 45.4 46.5 49.7 48.6
34.0 39.9 41.4 39.2
Household duties (home maker) 20.4 25.9 19.6 21.9
22.1 17.8 14.1 17.6
Too old/young 15.4 9.8 13.7 12.3
23.1 20.0 22.9 21.4
Disabled/unable to work/handicapped 9.1 4.4 8.9 7.3
12.0 13.4 11.9 12.7
Pensioner/retirement 1.6 2.4 1.8 2.0
1.4 0.6 0.4 0.7
Pregnancy 3.3 3.7 2.7 3.1
3.4 3.9 4.1 3.9
Other 4.8 7.3 3.5 4.9
4.0 4.3 5.1 4.5
Total 100.0 100.0 100.0 100.0 100.0 100.0 100.0 100.0
The main reasons for inactivity by currently inactive population vary across localities. The
proportion of the population who cited education/training as the main reason for inactivity is
higher in the urban areas (57.0%) than in rural areas (49.8%). Among the population in
Accra (GAMA), 54.2 percent cited education and training as the main reason for not being
economically active, with 58.4 percent who dwell in other urban areas citing the same reason
for their inactivity. The proportions are, however, higher for males (67.8 %) than females
(46.5 %). The trend is similar for those who dwell in other urban areas where education and
training is the main reason given for inactivity, with a higher proportion of males (71.2 %)
reporting such reasons compared to females (49.7 %). Among the rural population, a higher
proportion of rural savannah dwellers (52.7%) cited education and training as their main
reason for inactivity compared to rural coastal (44.7%) and rural forest (49.9%).
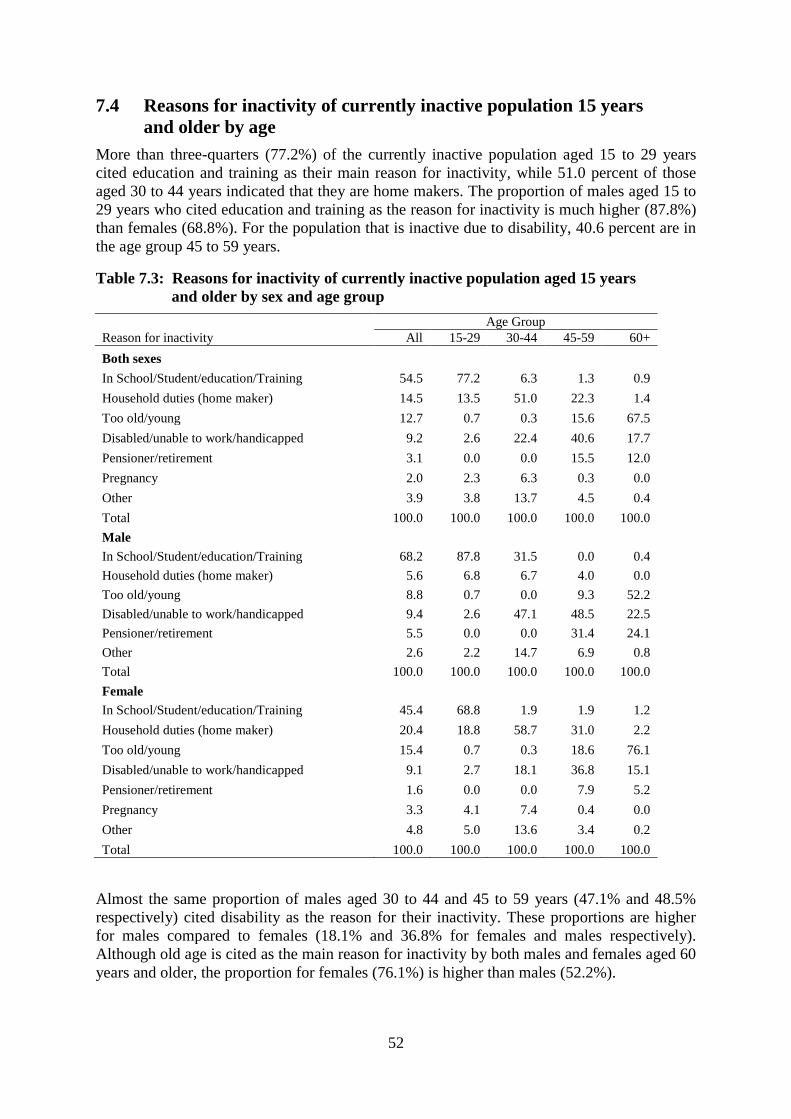
52
7.4 Reasons for inactivity of currently inactive population 15 years
and older by age
More than three-quarters (77.2%) of the currently inactive population aged 15 to 29 years
cited education and training as their main reason for inactivity, while 51.0 percent of those
aged 30 to 44 years indicated that they are home makers. The proportion of males aged 15 to
29 years who cited education and training as the reason for inactivity is much higher (87.8%)
than females (68.8%). For the population that is inactive due to disability, 40.6 percent are in
the age group 45 to 59 years.
Table 7.3: Reasons for inactivity of currently inactive population aged 15 years
and older by sex and age group
Age Group
Reason for inactivity All 15-29 30-44 45-59 60+
Both sexes
In School/Student/education/Training 54.5 77.2 6.3 1.3 0.9
Household duties (home maker) 14.5 13.5 51.0 22.3 1.4
Too old/young 12.7 0.7 0.3 15.6 67.5
Disabled/unable to work/handicapped 9.2 2.6 22.4 40.6 17.7
Pensioner/retirement 3.1 0.0 0.0 15.5 12.0
Pregnancy 2.0 2.3 6.3 0.3 0.0
Other 3.9 3.8 13.7 4.5 0.4
Total 100.0 100.0 100.0 100.0 100.0
Male
In School/Student/education/Training 68.2 87.8 31.5 0.0 0.4
Household duties (home maker) 5.6 6.8 6.7 4.0 0.0
Too old/young 8.8 0.7 0.0 9.3 52.2
Disabled/unable to work/handicapped 9.4 2.6 47.1 48.5 22.5
Pensioner/retirement 5.5 0.0 0.0 31.4 24.1
Other 2.6 2.2 14.7 6.9 0.8
Total 100.0 100.0 100.0 100.0 100.0
Female
In School/Student/education/Training 45.4 68.8 1.9 1.9 1.2
Household duties (home maker) 20.4 18.8 58.7 31.0 2.2
Too old/young 15.4 0.7 0.3 18.6 76.1
Disabled/unable to work/handicapped 9.1 2.7 18.1 36.8 15.1
Pensioner/retirement 1.6 0.0 0.0 7.9 5.2
Pregnancy 3.3 4.1 7.4 0.4 0.0
Other 4.8 5.0 13.6 3.4 0.2
Total 100.0 100.0 100.0 100.0 100.0
Almost the same proportion of males aged 30 to 44 and 45 to 59 years (47.1% and 48.5%
respectively) cited disability as the reason for their inactivity. These proportions are higher
for males compared to females (18.1% and 36.8% for females and males respectively).
Although old age is cited as the main reason for inactivity by both males and females aged 60
years and older, the proportion for females (76.1%) is higher than males (52.2%).
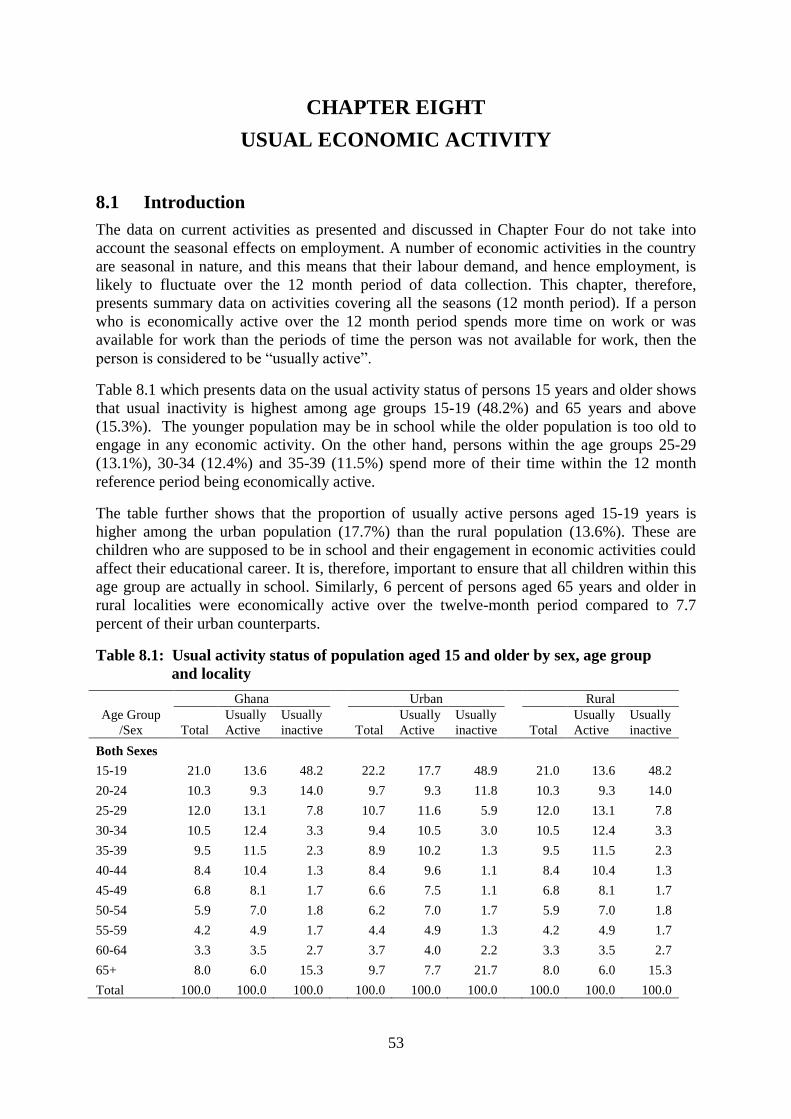
53
CHAPTER EIGHT
USUAL ECONOMIC ACTIVITY
8.1 Introduction
The data on current activities as presented and discussed in Chapter Four do not take into
account the seasonal effects on employment. A number of economic activities in the country
are seasonal in nature, and this means that their labour demand, and hence employment, is
likely to fluctuate over the 12 month period of data collection. This chapter, therefore,
presents summary data on activities covering all the seasons (12 month period). If a person
who is economically active over the 12 month period spends more time on work or was
available for work than the periods of time the person was not available for work, then the
person is considered to be “usually active”.
Table 8.1 which presents data on the usual activity status of persons 15 years and older shows
that usual inactivity is highest among age groups 15-19 (48.2%) and 65 years and above
(15.3%). The younger population may be in school while the older population is too old to
engage in any economic activity. On the other hand, persons within the age groups 25-29
(13.1%), 30-34 (12.4%) and 35-39 (11.5%) spend more of their time within the 12 month
reference period being economically active.
The table further shows that the proportion of usually active persons aged 15-19 years is
higher among the urban population (17.7%) than the rural population (13.6%). These are
children who are supposed to be in school and their engagement in economic activities could
affect their educational career. It is, therefore, important to ensure that all children within this
age group are actually in school. Similarly, 6 percent of persons aged 65 years and older in
rural localities were economically active over the twelve-month period compared to 7.7
percent of their urban counterparts.
Table 8.1: Usual activity status of population aged 15 and older by sex, age group
and locality
Age Group
/Sex
Ghana
Urban
Rural
Total
Usually
Active
Usually
inactive Total
Usually
Active
Usually
inactive Total
Usually
Active
Usually
inactive
Both Sexes
15-19 21.0 13.6 48.2
22.2 17.7 48.9
21.0 13.6 48.2
20-24 10.3 9.3 14.0
9.7 9.3 11.8
10.3 9.3 14.0
25-29 12.0 13.1 7.8
10.7 11.6 5.9
12.0 13.1 7.8
30-34 10.5 12.4 3.3
9.4 10.5 3.0
10.5 12.4 3.3
35-39 9.5 11.5 2.3
8.9 10.2 1.3
9.5 11.5 2.3
40-44 8.4 10.4 1.3
8.4 9.6 1.1
8.4 10.4 1.3
45-49 6.8 8.1 1.7
6.6 7.5 1.1
6.8 8.1 1.7
50-54 5.9 7.0 1.8
6.2 7.0 1.7
5.9 7.0 1.8
55-59 4.2 4.9 1.7
4.4 4.9 1.3
4.2 4.9 1.7
60-64 3.3 3.5 2.7
3.7 4.0 2.2
3.3 3.5 2.7
65+ 8.0 6.0 15.3
9.7 7.7 21.7
8.0 6.0 15.3
Total 100.0 100.0 100.0
100.0 100.0 100.0
100.0 100.0 100.0
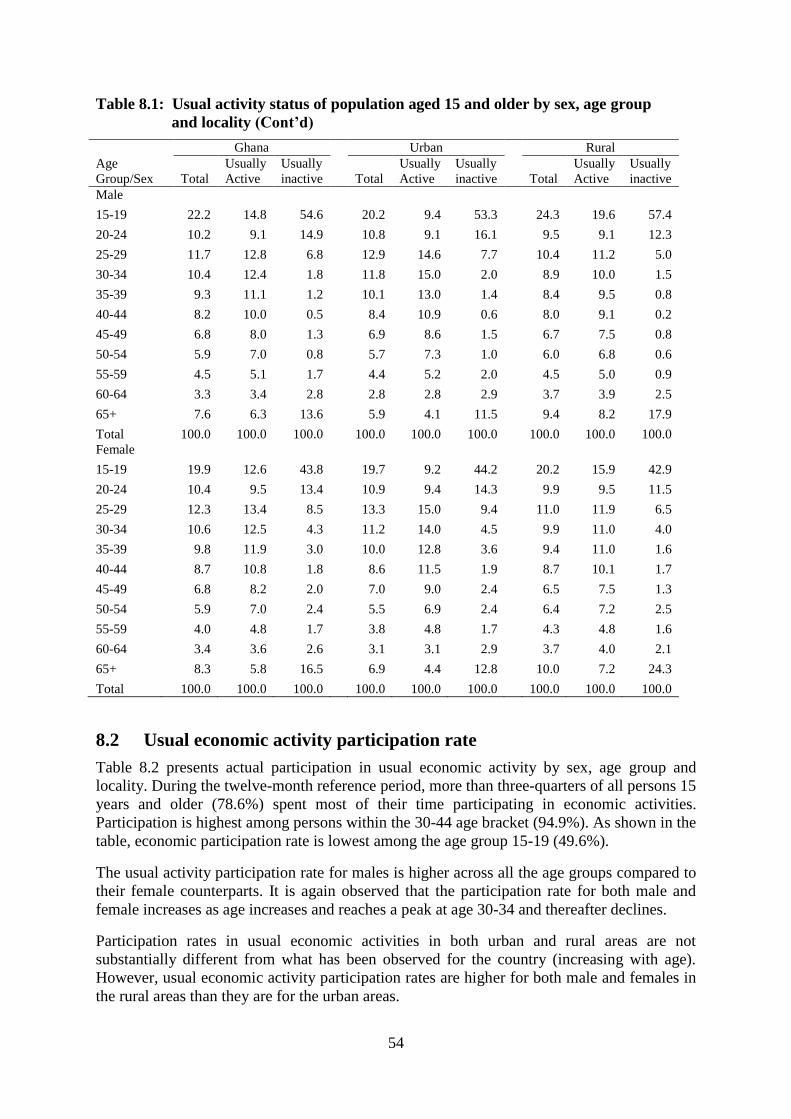
54
Table 8.1: Usual activity status of population aged 15 and older by sex, age group
and locality (Cont’d)
Age
Group/Sex
Ghana
Urban
Rural
Total
Usually
Active
Usually
inactive Total
Usually
Active
Usually
inactive Total
Usually
Active
Usually
inactive
Male
15-19 22.2 14.8 54.6
20.2 9.4 53.3
24.3 19.6 57.4
20-24 10.2 9.1 14.9
10.8 9.1 16.1
9.5 9.1 12.3
25-29 11.7 12.8 6.8
12.9 14.6 7.7
10.4 11.2 5.0
30-34 10.4 12.4 1.8
11.8 15.0 2.0
8.9 10.0 1.5
35-39 9.3 11.1 1.2
10.1 13.0 1.4
8.4 9.5 0.8
40-44 8.2 10.0 0.5
8.4 10.9 0.6
8.0 9.1 0.2
45-49 6.8 8.0 1.3
6.9 8.6 1.5
6.7 7.5 0.8
50-54 5.9 7.0 0.8
5.7 7.3 1.0
6.0 6.8 0.6
55-59 4.5 5.1 1.7
4.4 5.2 2.0
4.5 5.0 0.9
60-64 3.3 3.4 2.8
2.8 2.8 2.9
3.7 3.9 2.5
65+ 7.6 6.3 13.6
5.9 4.1 11.5
9.4 8.2 17.9
Total 100.0 100.0 100.0
100.0 100.0 100.0
100.0 100.0 100.0
Female
15-19 19.9 12.6 43.8
19.7 9.2 44.2
20.2 15.9 42.9
20-24 10.4 9.5 13.4
10.9 9.4 14.3
9.9 9.5 11.5
25-29 12.3 13.4 8.5
13.3 15.0 9.4
11.0 11.9 6.5
30-34 10.6 12.5 4.3
11.2 14.0 4.5
9.9 11.0 4.0
35-39 9.8 11.9 3.0
10.0 12.8 3.6
9.4 11.0 1.6
40-44 8.7 10.8 1.8
8.6 11.5 1.9
8.7 10.1 1.7
45-49 6.8 8.2 2.0
7.0 9.0 2.4
6.5 7.5 1.3
50-54 5.9 7.0 2.4
5.5 6.9 2.4
6.4 7.2 2.5
55-59 4.0 4.8 1.7
3.8 4.8 1.7
4.3 4.8 1.6
60-64 3.4 3.6 2.6
3.1 3.1 2.9
3.7 4.0 2.1
65+ 8.3 5.8 16.5
6.9 4.4 12.8
10.0 7.2 24.3
Total 100.0 100.0 100.0 100.0 100.0 100.0 100.0 100.0 100.0
8.2 Usual economic activity participation rate
Table 8.2 presents actual participation in usual economic activity by sex, age group and
locality. During the twelve-month reference period, more than three-quarters of all persons 15
years and older (78.6%) spent most of their time participating in economic activities.
Participation is highest among persons within the 30-44 age bracket (94.9%). As shown in the
table, economic participation rate is lowest among the age group 15-19 (49.6%).
The usual activity participation rate for males is higher across all the age groups compared to
their female counterparts. It is again observed that the participation rate for both male and
female increases as age increases and reaches a peak at age 30-34 and thereafter declines.
Participation rates in usual economic activities in both urban and rural areas are not
substantially different from what has been observed for the country (increasing with age).
However, usual economic activity participation rates are higher for both male and females in
the rural areas than they are for the urban areas.
55
Table 8.2: Usual economic activity participation rate of the population 15 years
and older by sex, age group and locality.
Age
group
Total
Urban
Rural
Both Male Female Both Male Female Both Male Female
15-19 49.6 52.8 46.5
32.1 33.3 31.2
67.0 69.6 64.2
20-24 67.8 69.4 66.4
57.2 58.4 56.1
80.3 81.8 78.9
25-29 86.1 89.0 83.6
81.6 85.2 78.7
92.1 94.0 90.4
30-44 94.9 97.6 92.6
93.0 96.7 90.0
97.1 98.8 95.8
45-59 93.5 95.8 91.4
90.6 93.5 88.2
96.5 98.3 94.9
60+ 66.1 71.9 61.4
55.6 59.5 52.7
74.3 80.7 68.7
All 78.6 81.3 76.4
72.4 75.3 69.9
85.6 87.6 83.8
8.3 Usual employment
Table 8.3 indicates that most of the usually employed persons (46.4%) are engaged in
agricultural business. The private formal sector of the economy employs 30.0 percent of the
usually employed persons. Table 8.3 further shows that while 72.8 percent of all persons
usually employed in the rural localities are engaged in agricultural business, only 18.7
percent of their urban counterparts are engaged in that sector.
Table 8.3: Usually employed population 15 years and older by type of employer,
locality and sex
Type of employer
Urban Rural Ghana
Male Female All Male Female All Male Female All
Public Service
Civil Service 5.0 2.6 3.7
1.5 0.6 1.1 3.2 1.6 2.4
Other Public Service 6.8 4.0 5.3
1.9 1.1 1.5 4.2 2.5 3.4
Parastatal 0.4 0.1 0.3
0.1 0.1 0.1 0.2 0.1 0.2
Private Sector
Formal 14.3 5.9 9.9
0.1 0.0 0.1 6.9 2.9 4.9
Informal 52.4 69.2 61.2
0.1 0.1 0.1 25.3 34.3 30.0
NGOs 0.5 0.1 0.3
2.8 1.2 2.0 1.7 0.7 1.1
Cooperatives 0.2 0.1 0.2
18.9 25.7 22.4 9.9 13.0 11.5
International Organization/
Diplomatic Mission 0.4 0.0 0.2
0.1 0.0 0.1
0.3 0.0 0.1
Agri-Business 19.8 17.8 18.7
74.5 71.2 72.8 48.2 44.7 46.4
other 0.2 0.1 0.2
0.0 0.1 0.0 0.1 0.1 0.1
All 100.0 100.0 100.0 100.0 100.0 100.0 100.0 100.0 100.0
8.4 Main occupation of usually employed persons
The main occupation of the usually employed persons as indicated in Table 8.4 is skilled
agriculture and fishery work, which employs 45.5 percent of all usually employed persons.
The proportion of females (37.0%) engaged as service and sales workers are higher than
males (10.5%). Also, whereas more males than females (21.3% and 13.4% respectively) are
engaged in craft and related trades work in the urban localities, the reverse is the case for the
rural localities (6.8% for males and 8.2% for females).
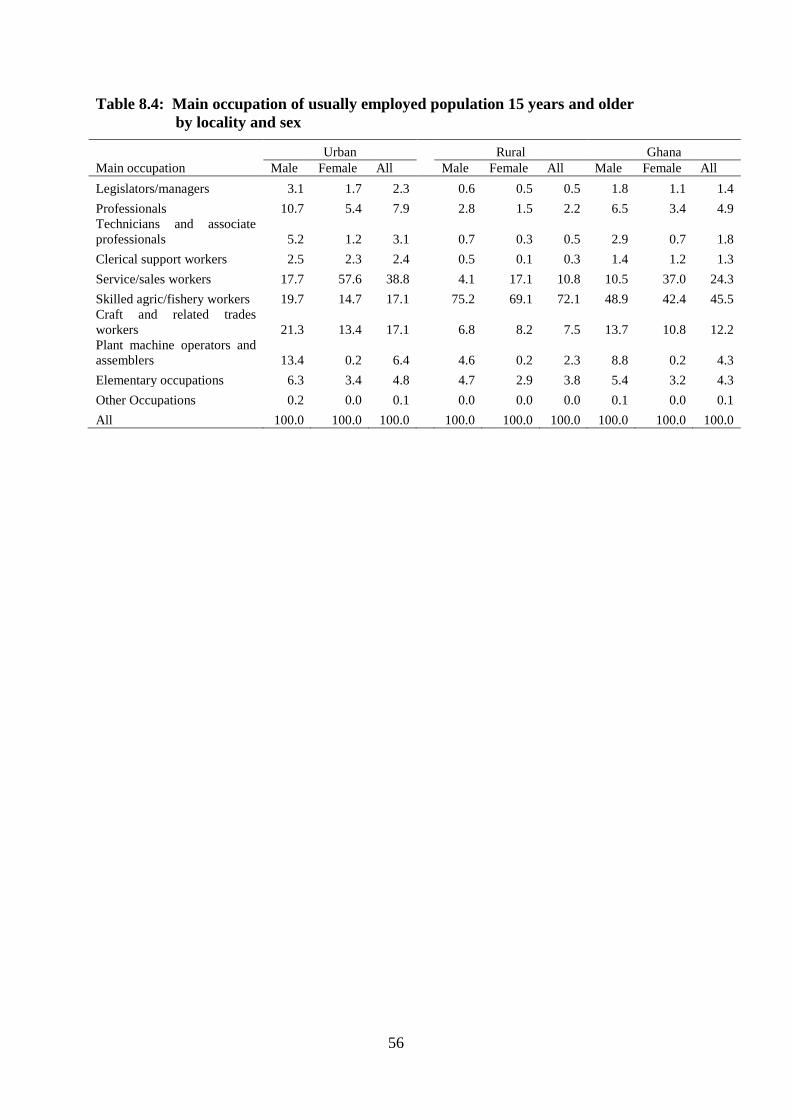
56
Table 8.4: Main occupation of usually employed population 15 years and older
by locality and sex
Main occupation
Urban Rural Ghana
Male Female All Male Female All Male Female All
Legislators/managers 3.1 1.7 2.3
0.6 0.5 0.5 1.8 1.1 1.4
Professionals 10.7 5.4 7.9
2.8 1.5 2.2 6.5 3.4 4.9
Technicians and associate
professionals 5.2 1.2 3.1
0.7 0.3 0.5 2.9 0.7 1.8
Clerical support workers 2.5 2.3 2.4
0.5 0.1 0.3 1.4 1.2 1.3
Service/sales workers 17.7 57.6 38.8
4.1 17.1 10.8 10.5 37.0 24.3
Skilled agric/fishery workers 19.7 14.7 17.1
75.2 69.1 72.1 48.9 42.4 45.5
Craft and related trades
workers 21.3 13.4 17.1
6.8 8.2 7.5 13.7 10.8 12.2
Plant machine operators and
assemblers 13.4 0.2 6.4
4.6 0.2 2.3 8.8 0.2 4.3
Elementary occupations 6.3 3.4 4.8
4.7 2.9 3.8 5.4 3.2 4.3
Other Occupations 0.2 0.0 0.1
0.0 0.0 0.0 0.1 0.0 0.1
All 100.0 100.0 100.0 100.0 100.0 100.0 100.0 100.0 100.0
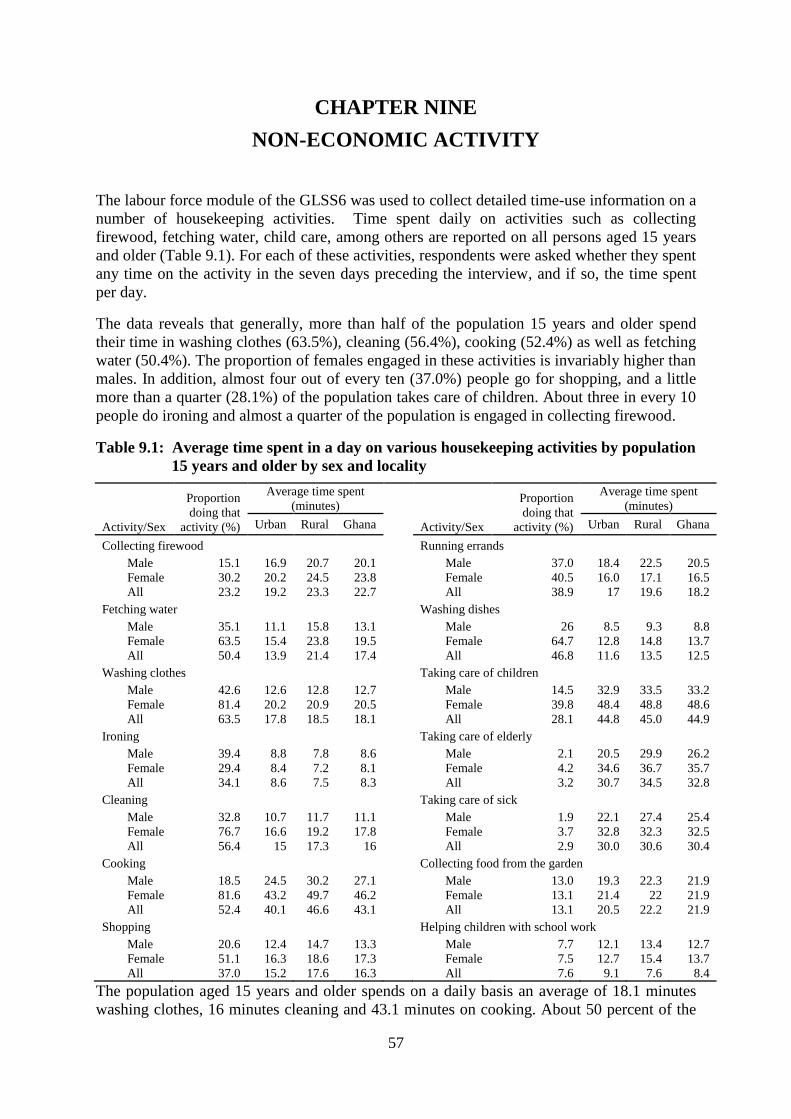
57
CHAPTER NINE
NON-ECONOMIC ACTIVITY
The labour force module of the GLSS6 was used to collect detailed time-use information on a
number of housekeeping activities. Time spent daily on activities such as collecting
firewood, fetching water, child care, among others are reported on all persons aged 15 years
and older (Table 9.1). For each of these activities, respondents were asked whether they spent
any time on the activity in the seven days preceding the interview, and if so, the time spent
per day.
The data reveals that generally, more than half of the population 15 years and older spend
their time in washing clothes (63.5%), cleaning (56.4%), cooking (52.4%) as well as fetching
water (50.4%). The proportion of females engaged in these activities is invariably higher than
males. In addition, almost four out of every ten (37.0%) people go for shopping, and a little
more than a quarter (28.1%) of the population takes care of children. About three in every 10
people do ironing and almost a quarter of the population is engaged in collecting firewood.
Table 9.1: Average time spent in a day on various housekeeping activities by population
15 years and older by sex and locality
Activity/Sex
Proportion
doing that
activity (%)
Average time spent
(minutes)
Activity/Sex
Proportion
doing that
activity (%)
Average time spent
(minutes)
Urban Rural Ghana
Urban Rural Ghana
Collecting firewood
Running errands
Male 15.1 16.9 20.7 20.1
Male 37.0 18.4 22.5 20.5
Female 30.2 20.2 24.5 23.8
Female 40.5 16.0 17.1 16.5
All 23.2 19.2 23.3 22.7
All 38.9 17 19.6 18.2
Fetching water
Washing dishes
Male 35.1 11.1 15.8 13.1
Male 26 8.5 9.3 8.8
Female 63.5 15.4 23.8 19.5
Female 64.7 12.8 14.8 13.7
All 50.4 13.9 21.4 17.4
All 46.8 11.6 13.5 12.5
Washing clothes
Taking care of children
Male 42.6 12.6 12.8 12.7
Male 14.5 32.9 33.5 33.2
Female 81.4 20.2 20.9 20.5
Female 39.8 48.4 48.8 48.6
All 63.5 17.8 18.5 18.1
All 28.1 44.8 45.0 44.9
Ironing
Taking care of elderly
Male 39.4 8.8 7.8 8.6
Male 2.1 20.5 29.9 26.2
Female 29.4 8.4 7.2 8.1
Female 4.2 34.6 36.7 35.7
All 34.1 8.6 7.5 8.3
All 3.2 30.7 34.5 32.8
Cleaning
Taking care of sick
Male 32.8 10.7 11.7 11.1
Male 1.9 22.1 27.4 25.4
Female 76.7 16.6 19.2 17.8
Female 3.7 32.8 32.3 32.5
All 56.4 15 17.3 16
All 2.9 30.0 30.6 30.4
Cooking
Collecting food from the garden
Male 18.5 24.5 30.2 27.1
Male 13.0 19.3 22.3 21.9
Female 81.6 43.2 49.7 46.2
Female 13.1 21.4 22 21.9
All 52.4 40.1 46.6 43.1
All 13.1 20.5 22.2 21.9
Shopping
Helping children with school work
Male 20.6 12.4 14.7 13.3
Male 7.7 12.1 13.4 12.7
Female 51.1 16.3 18.6 17.3
Female 7.5 12.7 15.4 13.7
All 37.0 15.2 17.6 16.3 All 7.6 9.1 7.6 8.4
The population aged 15 years and older spends on a daily basis an average of 18.1 minutes
washing clothes, 16 minutes cleaning and 43.1 minutes on cooking. About 50 percent of the
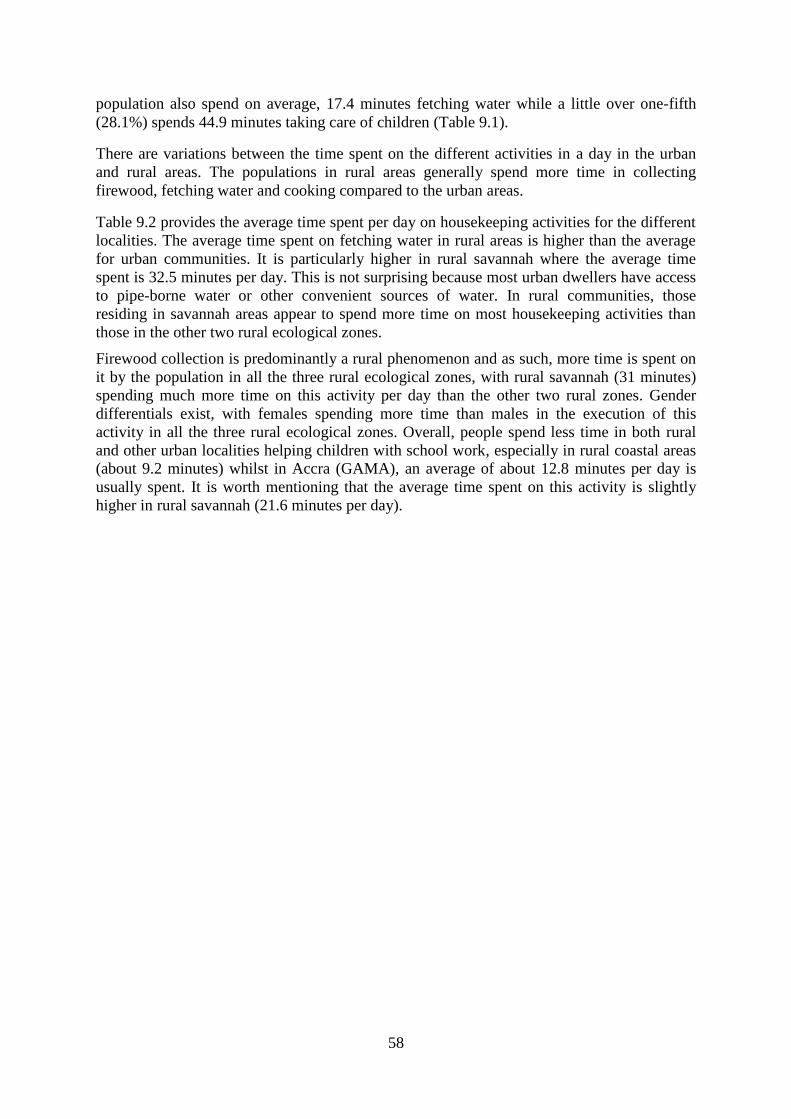
58
population also spend on average, 17.4 minutes fetching water while a little over one-fifth
(28.1%) spends 44.9 minutes taking care of children (Table 9.1).
There are variations between the time spent on the different activities in a day in the urban
and rural areas. The populations in rural areas generally spend more time in collecting
firewood, fetching water and cooking compared to the urban areas.
Table 9.2 provides the average time spent per day on housekeeping activities for the different
localities. The average time spent on fetching water in rural areas is higher than the average
for urban communities. It is particularly higher in rural savannah where the average time
spent is 32.5 minutes per day. This is not surprising because most urban dwellers have access
to pipe-borne water or other convenient sources of water. In rural communities, those
residing in savannah areas appear to spend more time on most housekeeping activities than
those in the other two rural ecological zones.
Firewood collection is predominantly a rural phenomenon and as such, more time is spent on
it by the population in all the three rural ecological zones, with rural savannah (31 minutes)
spending much more time on this activity per day than the other two rural zones. Gender
differentials exist, with females spending more time than males in the execution of this
activity in all the three rural ecological zones. Overall, people spend less time in both rural
and other urban localities helping children with school work, especially in rural coastal areas
(about 9.2 minutes) whilst in Accra (GAMA), an average of about 12.8 minutes per day is
usually spent. It is worth mentioning that the average time spent on this activity is slightly
higher in rural savannah (21.6 minutes per day).
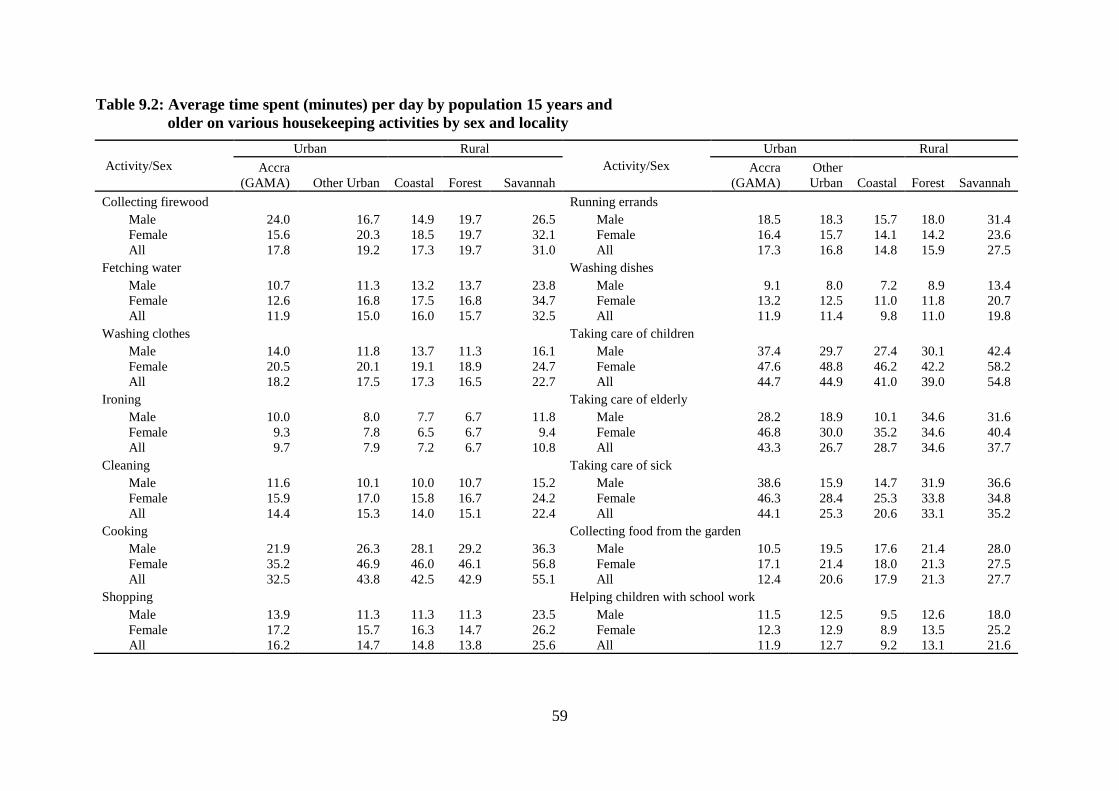
59
Table 9.2: Average time spent (minutes) per day by population 15 years and
older on various housekeeping activities by sex and locality
Activity/Sex
Urban Rural
Activity/Sex
Urban Rural
Accra
(GAMA) Other Urban Coastal Forest Savannah
Accra
(GAMA)
Other
Urban Coastal Forest Savannah
Collecting firewood
Running errands
Male 24.0 16.7 14.9 19.7 26.5 Male 18.5 18.3 15.7 18.0 31.4
Female 15.6 20.3 18.5 19.7 32.1 Female 16.4 15.7 14.1 14.2 23.6
All 17.8 19.2 17.3 19.7 31.0 All 17.3 16.8 14.8 15.9 27.5
Fetching water
Washing dishes
Male 10.7 11.3 13.2 13.7 23.8 Male 9.1 8.0 7.2 8.9 13.4
Female 12.6 16.8 17.5 16.8 34.7 Female 13.2 12.5 11.0 11.8 20.7
All 11.9 15.0 16.0 15.7 32.5 All 11.9 11.4 9.8 11.0 19.8
Washing clothes
Taking care of children
Male 14.0 11.8 13.7 11.3 16.1 Male 37.4 29.7 27.4 30.1 42.4
Female 20.5 20.1 19.1 18.9 24.7 Female 47.6 48.8 46.2 42.2 58.2
All 18.2 17.5 17.3 16.5 22.7 All 44.7 44.9 41.0 39.0 54.8
Ironing
Taking care of elderly
Male 10.0 8.0 7.7 6.7 11.8 Male 28.2 18.9 10.1 34.6 31.6
Female 9.3 7.8 6.5 6.7 9.4 Female 46.8 30.0 35.2 34.6 40.4
All 9.7 7.9 7.2 6.7 10.8 All 43.3 26.7 28.7 34.6 37.7
Cleaning
Taking care of sick
Male 11.6 10.1 10.0 10.7 15.2 Male 38.6 15.9 14.7 31.9 36.6
Female 15.9 17.0 15.8 16.7 24.2 Female 46.3 28.4 25.3 33.8 34.8
All 14.4 15.3 14.0 15.1 22.4 All 44.1 25.3 20.6 33.1 35.2
Cooking
Collecting food from the garden
Male 21.9 26.3 28.1 29.2 36.3 Male 10.5 19.5 17.6 21.4 28.0
Female 35.2 46.9 46.0 46.1 56.8 Female 17.1 21.4 18.0 21.3 27.5
All 32.5 43.8 42.5 42.9 55.1 All 12.4 20.6 17.9 21.3 27.7
Shopping
Helping children with school work
Male 13.9 11.3 11.3 11.3 23.5 Male 11.5 12.5 9.5 12.6 18.0
Female 17.2 15.7 16.3 14.7 26.2 Female 12.3 12.9 8.9 13.5 25.2
All 16.2 14.7 14.8 13.8 25.6 All 11.9 12.7 9.2 13.1 21.6
60
The results also indicate that females in the age brackets 25 to 44 and 45 to 49 years spend
longer time collecting firewood compared to those in the other age brackets (Table 9.3). In
addition, females aged 25 to 44 years spend more time on child care (51.4 minutes). Younger
people spend more time washing dishes (13.7 minutes) but spend less time on cooking (36.4
minutes) , taking care of the sick (23.2 minutes), taking care of children (35.2 minutes) and
collecting food from the garden (20.7 minutes) compared to the other age groups. The traditional
perception that fetching of water is reserved for the young has clearly been demonstrated by the
results in Table 9.3 where the data show that the average time spent on fetching water is higher
among the younger age groups (15 to 19 - 18.2 minutes and 20 to 24 17.7 minutes per day).
Table 9.3: Average time spent (minutes) per day by population 15 years and older on
various housekeeping activities by sex and age group
Activity/Sex
Age group
Activity/Sex
Age group
15 - 19 20 - 24 25 - 44 45 - 59 60+
15 - 19 20 - 24 25 - 44 45 - 59 60+
Collecting firewood
Running errands
Male 19.3 18.9 20.5 20.3 22.2
Male 17.8 20.1 21.5 21.4 23.9
Female 21.8 24.9 24.6 23.7 22.3
Female 16.5 16.1 16.6 16.4 17.1
All 20.7 22.8 23.6 22.8 22.3
All 17.1 17.9 18.6 18.4 20.2
Fetching water
Washing dishes
Male 15.9 13.3 11.1 11 11.9
Male 11.1 8.5 7.6 7.3 8.4
Female 19.9 20.2 19.9 16.9 17.8
Female 15.1 14.1 14 12.1 10.9
All 18.2 17.7 17.5 15.6 16.4
All 13.7 12.5 12.6 11.2 10.5
Washing clothes
Taking care of
children
Male 12.9 13.2 12.6 11.8 11.6
Male 22.7 29.3 34.4 33.6 39.8
Female 17.9 21.2 22.8 18.4 15.8
Female 39.6 50.0 51.4 43.5 40.5
All 15.6 18.0 20.1 17.1 15
All 35.2 47.3 47.5 40.2 40.3
Ironing
Taking care of elderly
Male 8.2 8.9 8.7 8.6 7.3
Male 22.3 29.4 27.2 26.7 23.9
Female 8.2 8.4 8.4 7.5 5.1
Female 32.6 33.3 36.2 35.6 40.7
All 8.2 8.6 8.5 8.1 6.5
All 28.6 31.9 33.7 33.0 37.7
Cleaning
Taking care of sick
Male 12.2 11.8 10.3 10.8 10.7
Male 21.8 20.7 27.7 26.5 28.6
Female 16.9 18.0 18.7 17.0 15.7
Female 24.4 34.5 30.0 36.0 37.5
All 15.2 15.9 16.7 15.8 14.7
All 23.2 30 29.4 32.6 35.6
Cooking
Collecting food from the garden
Male 26.0 24.1 26.8 30.5 31
Male 20.4 21.5 22.3 22.3 22.1
Female 39.2 44.0 48.8 46.9 45.4
Female 19.2 20.9 22.2 23.5 21.3
All 36.4 40.2 45.4 44.7 43.4
All 19.9 21.2 22.3 22.9 21.7
Shopping
Helping children with school work
Male 11.0 12.0 14.4 13.1 13.3
Male 11.8 12.0 13.1 12.8 12.7
Female 14.7 16.8 18.2 17.3 14.8
Female 10.6 13.1 15.0 14.0 13.4
All 13.7 15.5 17.2 16.3 14.5 All 11.2 12.6 14.2 13.3 13
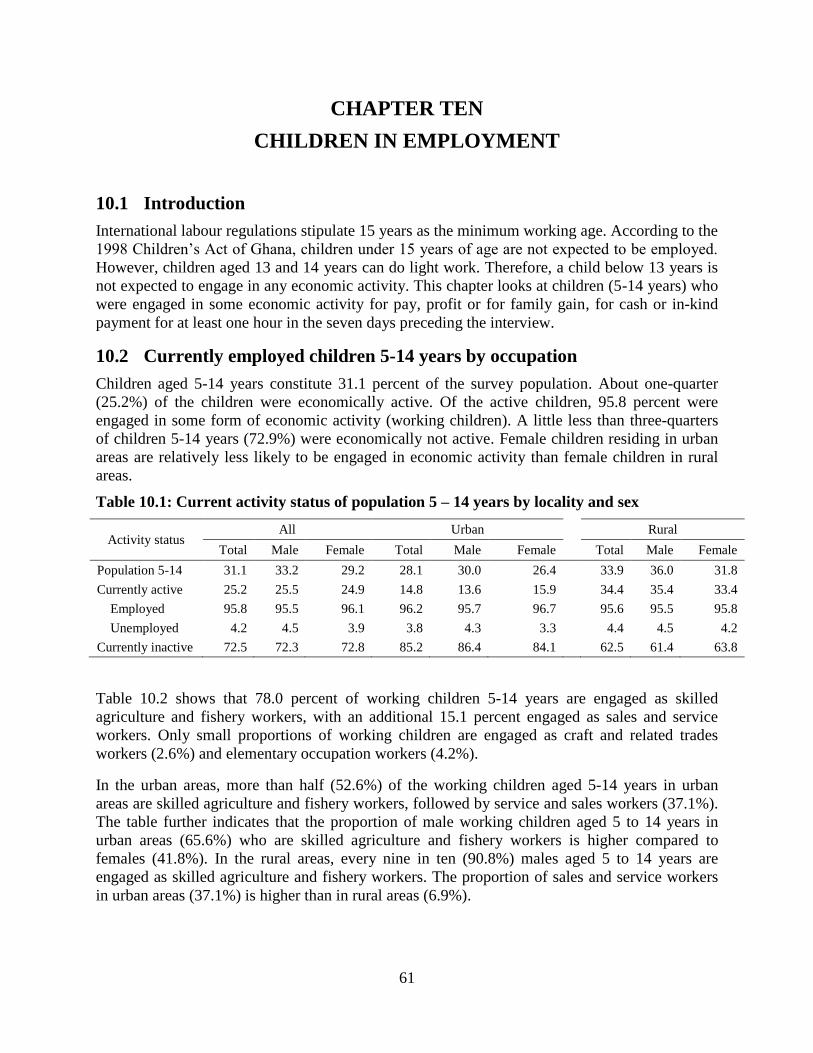
61
CHAPTER TEN
CHILDREN IN EMPLOYMENT
10.1 Introduction
International labour regulations stipulate 15 years as the minimum working age. According to the
1998 Children’s Act of Ghana, children under 15 years of age are not expected to be employed.
However, children aged 13 and 14 years can do light work. Therefore, a child below 13 years is
not expected to engage in any economic activity. This chapter looks at children (5-14 years) who
were engaged in some economic activity for pay, profit or for family gain, for cash or in-kind
payment for at least one hour in the seven days preceding the interview.
10.2 Currently employed children 5-14 years by occupation
Children aged 5-14 years constitute 31.1 percent of the survey population. About one-quarter
(25.2%) of the children were economically active. Of the active children, 95.8 percent were
engaged in some form of economic activity (working children). A little less than three-quarters
of children 5-14 years (72.9%) were economically not active. Female children residing in urban
areas are relatively less likely to be engaged in economic activity than female children in rural
areas.
Table 10.1: Current activity status of population 5 – 14 years by locality and sex
Activity status All Urban
Rural
Total Male Female Total Male Female Total Male Female
Population 5-14 31.1 33.2 29.2 28.1 30.0 26.4
33.9 36.0 31.8
Currently active 25.2 25.5 24.9 14.8 13.6 15.9
34.4 35.4 33.4
Employed 95.8 95.5 96.1 96.2 95.7 96.7
95.6 95.5 95.8
Unemployed 4.2 4.5 3.9 3.8 4.3 3.3
4.4 4.5 4.2
Currently inactive 72.5 72.3 72.8 85.2 86.4 84.1
62.5 61.4 63.8
Table 10.2 shows that 78.0 percent of working children 5-14 years are engaged as skilled
agriculture and fishery workers, with an additional 15.1 percent engaged as sales and service
workers. Only small proportions of working children are engaged as craft and related trades
workers (2.6%) and elementary occupation workers (4.2%).
In the urban areas, more than half (52.6%) of the working children aged 5-14 years in urban
areas are skilled agriculture and fishery workers, followed by service and sales workers (37.1%).
The table further indicates that the proportion of male working children aged 5 to 14 years in
urban areas (65.6%) who are skilled agriculture and fishery workers is higher compared to
females (41.8%). In the rural areas, every nine in ten (90.8%) males aged 5 to 14 years are
engaged as skilled agriculture and fishery workers. The proportion of sales and service workers
in urban areas (37.1%) is higher than in rural areas (6.9%).
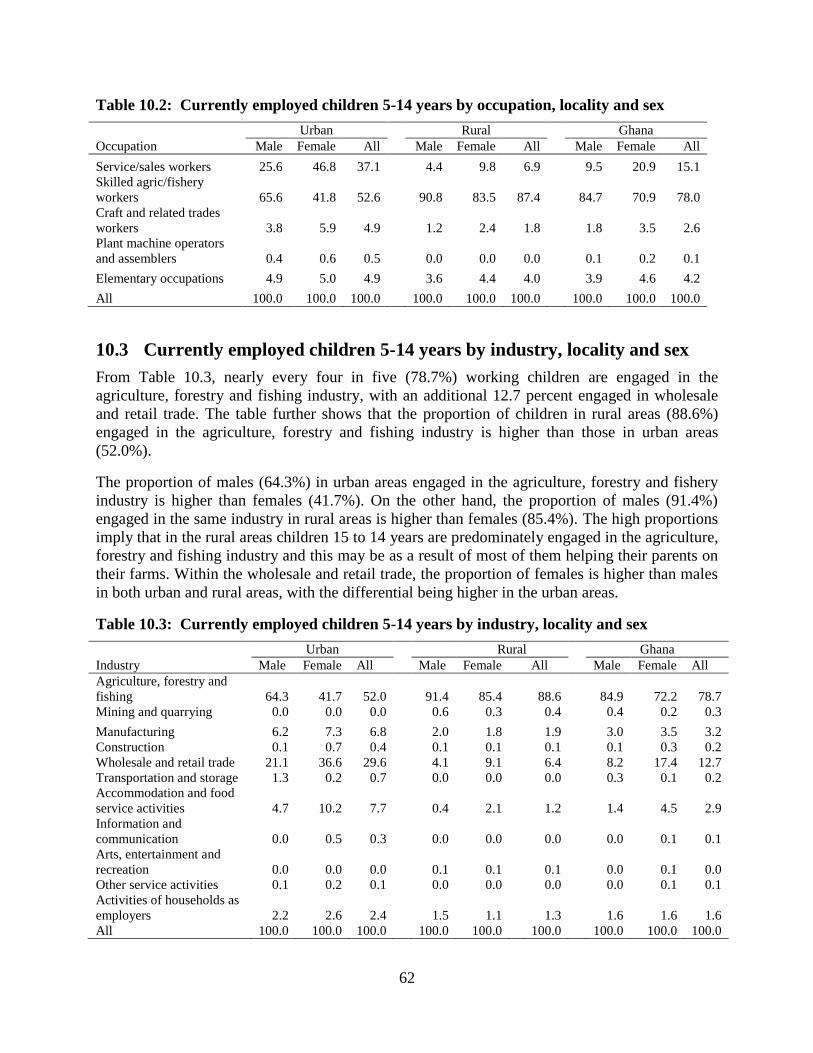
62
Table 10.2: Currently employed children 5-14 years by occupation, locality and sex
Occupation
Urban
Rural
Ghana
Male Female All
Male Female All
Male Female All
Service/sales workers 25.6 46.8 37.1
4.4 9.8 6.9
9.5 20.9 15.1
Skilled agric/fishery
workers 65.6 41.8 52.6
90.8 83.5 87.4
84.7 70.9 78.0
Craft and related trades
workers 3.8 5.9 4.9
1.2 2.4 1.8
1.8 3.5 2.6
Plant machine operators
and assemblers 0.4 0.6 0.5
0.0 0.0 0.0
0.1 0.2 0.1
Elementary occupations 4.9 5.0 4.9
3.6 4.4 4.0
3.9 4.6 4.2
All 100.0 100.0 100.0 100.0 100.0 100.0 100.0 100.0 100.0
10.3 Currently employed children 5-14 years by industry, locality and sex
From Table 10.3, nearly every four in five (78.7%) working children are engaged in the
agriculture, forestry and fishing industry, with an additional 12.7 percent engaged in wholesale
and retail trade. The table further shows that the proportion of children in rural areas (88.6%)
engaged in the agriculture, forestry and fishing industry is higher than those in urban areas
(52.0%).
The proportion of males (64.3%) in urban areas engaged in the agriculture, forestry and fishery
industry is higher than females (41.7%). On the other hand, the proportion of males (91.4%)
engaged in the same industry in rural areas is higher than females (85.4%). The high proportions
imply that in the rural areas children 15 to 14 years are predominately engaged in the agriculture,
forestry and fishing industry and this may be as a result of most of them helping their parents on
their farms. Within the wholesale and retail trade, the proportion of females is higher than males
in both urban and rural areas, with the differential being higher in the urban areas.
Table 10.3: Currently employed children 5-14 years by industry, locality and sex
Industry
Urban
Rural
Ghana
Male Female All Male Female All Male Female All
Agriculture, forestry and
fishing 64.3 41.7 52.0
91.4 85.4
88.6
84.9 72.2 78.7
Mining and quarrying 0.0 0.0 0.0
0.6 0.3 0.4
0.4 0.2 0.3
Manufacturing 6.2 7.3 6.8
2.0 1.8 1.9
3.0 3.5 3.2
Construction 0.1 0.7 0.4
0.1 0.1 0.1
0.1 0.3 0.2
Wholesale and retail trade 21.1 36.6 29.6
4.1 9.1 6.4
8.2 17.4 12.7
Transportation and storage 1.3 0.2 0.7
0.0 0.0 0.0
0.3 0.1 0.2
Accommodation and food
service activities 4.7 10.2 7.7
0.4 2.1
1.2
1.4 4.5 2.9
Information and
communication 0.0 0.5 0.3
0.0 0.0
0.0
0.0 0.1 0.1
Arts, entertainment and
recreation 0.0 0.0 0.0
0.1 0.1
0.1
0.0 0.1 0.0
Other service activities 0.1 0.2 0.1
0.0 0.0 0.0
0.0 0.1 0.1
Activities of households as
employers 2.2 2.6 2.4
1.5 1.1
1.3
1.6 1.6 1.6
All 100.0 100.0 100.0 100.0 100.0 100.0 100.0 100.0 100.0
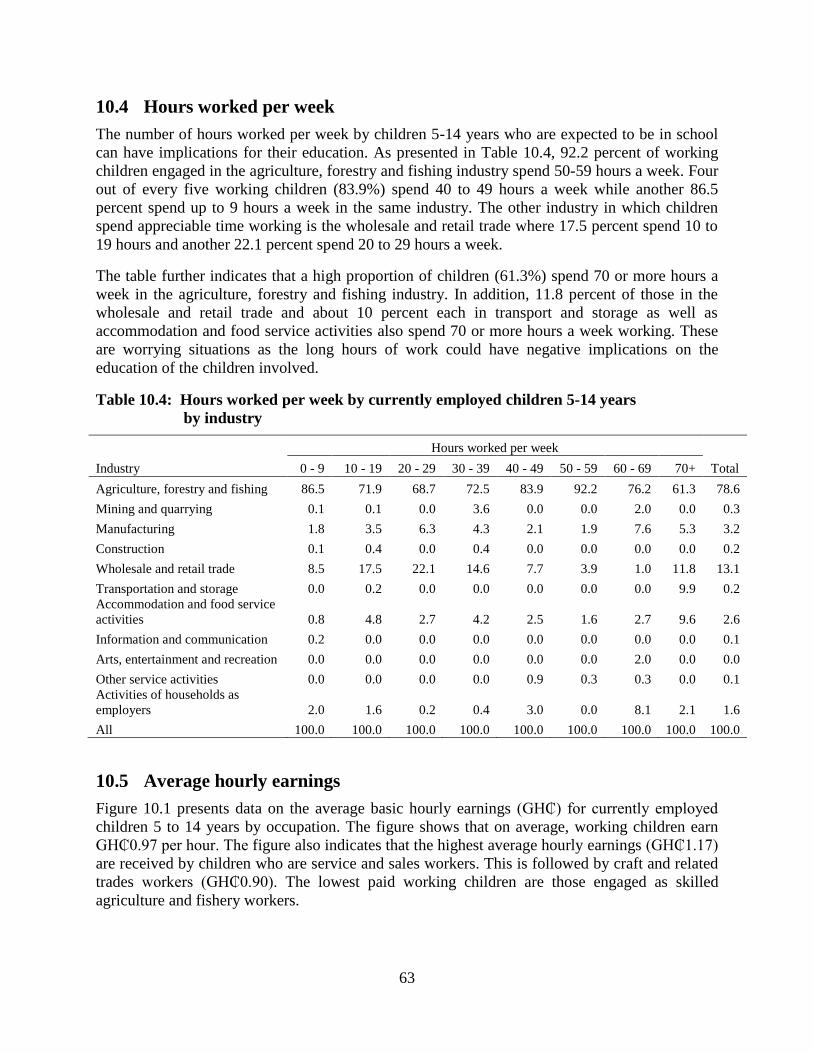
63
10.4 Hours worked per week
The number of hours worked per week by children 5-14 years who are expected to be in school
can have implications for their education. As presented in Table 10.4, 92.2 percent of working
children engaged in the agriculture, forestry and fishing industry spend 50-59 hours a week. Four
out of every five working children (83.9%) spend 40 to 49 hours a week while another 86.5
percent spend up to 9 hours a week in the same industry. The other industry in which children
spend appreciable time working is the wholesale and retail trade where 17.5 percent spend 10 to
19 hours and another 22.1 percent spend 20 to 29 hours a week.
The table further indicates that a high proportion of children (61.3%) spend 70 or more hours a
week in the agriculture, forestry and fishing industry. In addition, 11.8 percent of those in the
wholesale and retail trade and about 10 percent each in transport and storage as well as
accommodation and food service activities also spend 70 or more hours a week working. These
are worrying situations as the long hours of work could have negative implications on the
education of the children involved.
Table 10.4: Hours worked per week by currently employed children 5-14 years
by industry
Industry
Hours worked per week
Total 0 - 9 10 - 19 20 - 29 30 - 39 40 - 49 50 - 59 60 - 69 70+
Agriculture, forestry and fishing 86.5 71.9 68.7 72.5 83.9 92.2 76.2 61.3 78.6
Mining and quarrying 0.1 0.1 0.0 3.6 0.0 0.0 2.0 0.0 0.3
Manufacturing 1.8 3.5 6.3 4.3 2.1 1.9 7.6 5.3 3.2
Construction 0.1 0.4 0.0 0.4 0.0 0.0 0.0 0.0 0.2
Wholesale and retail trade 8.5 17.5 22.1 14.6 7.7 3.9 1.0 11.8 13.1
Transportation and storage 0.0 0.2 0.0 0.0 0.0 0.0 0.0 9.9 0.2
Accommodation and food service
activities 0.8 4.8 2.7 4.2 2.5 1.6 2.7 9.6 2.6
Information and communication 0.2 0.0 0.0 0.0 0.0 0.0 0.0 0.0 0.1
Arts, entertainment and recreation 0.0 0.0 0.0 0.0 0.0 0.0 2.0 0.0 0.0
Other service activities 0.0 0.0 0.0 0.0 0.9 0.3 0.3 0.0 0.1
Activities of households as
employers 2.0 1.6 0.2 0.4 3.0 0.0 8.1 2.1 1.6
All 100.0 100.0 100.0 100.0 100.0 100.0 100.0 100.0 100.0
10.5 Average hourly earnings
Figure 10.1 presents data on the average basic hourly earnings (GH₵) for currently employed
children 5 to 14 years by occupation. The figure shows that on average, working children earn
GH₵0.97 per hour. The figure also indicates that the highest average hourly earnings (GH₵1.17)
are received by children who are service and sales workers. This is followed by craft and related
trades workers (GH₵0.90). The lowest paid working children are those engaged as skilled
agriculture and fishery workers.
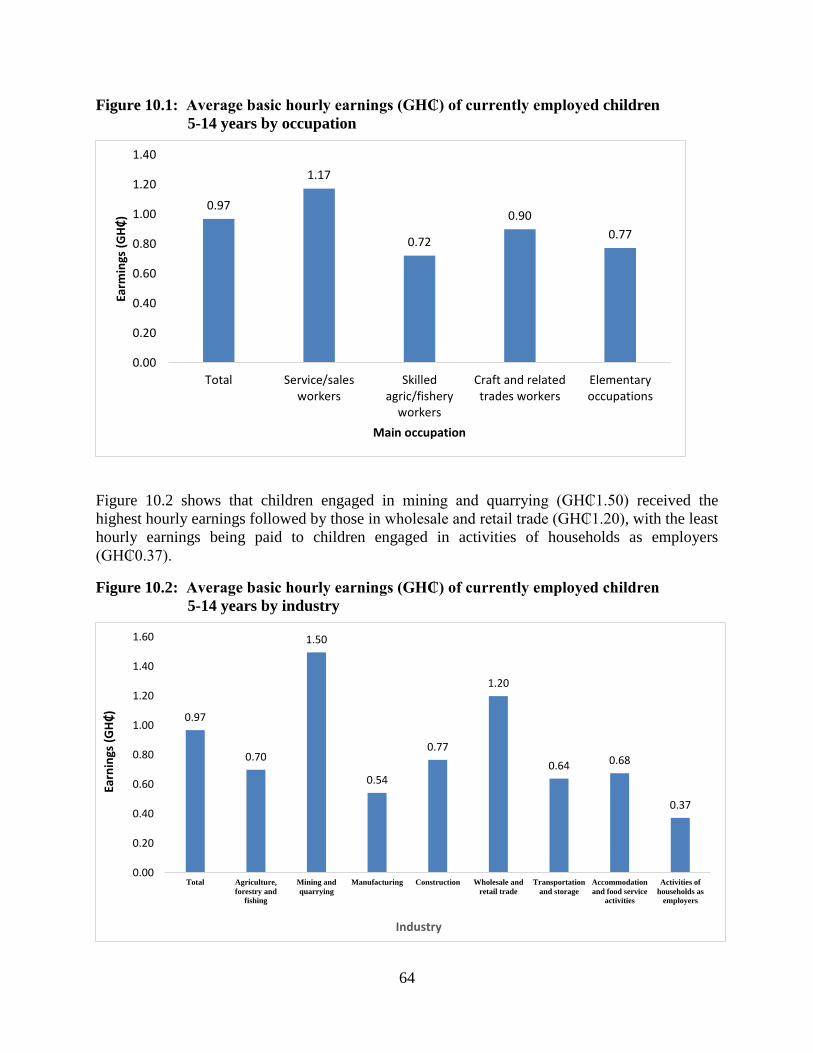
64
Figure 10.1: Average basic hourly earnings (GH₵) of currently employed children
5-14 years by occupation
Figure 10.2 shows that children engaged in mining and quarrying (GH₵1.50) received the
highest hourly earnings followed by those in wholesale and retail trade (GH₵1.20), with the least
hourly earnings being paid to children engaged in activities of households as employers
(GH₵0.37).
Figure 10.2: Average basic hourly earnings (GH₵) of currently employed children
5-14 years by industry
0.97
1.17
0.72
0.90
0.77
0.00
0.20
0.40
0.60
0.80
1.00
1.20
1.40
Total Service/salesworkers
Skilledagric/fishery
workers
Craft and relatedtrades workers
Elementaryoccupations
Earm
ings
(G
H₵
)
Main occupation
0.97
0.70
1.50
0.54
0.77
1.20
0.64 0.68
0.37
0.00
0.20
0.40
0.60
0.80
1.00
1.20
1.40
1.60
Total Agriculture,
forestry and
fishing
Mining and
quarrying
Manufacturing Construction Wholesale and
retail trade
Transportation
and storage
Accommodation
and food service
activities
Activities of
households as
employers
Earn
ings
(G
H₵
)
Industry
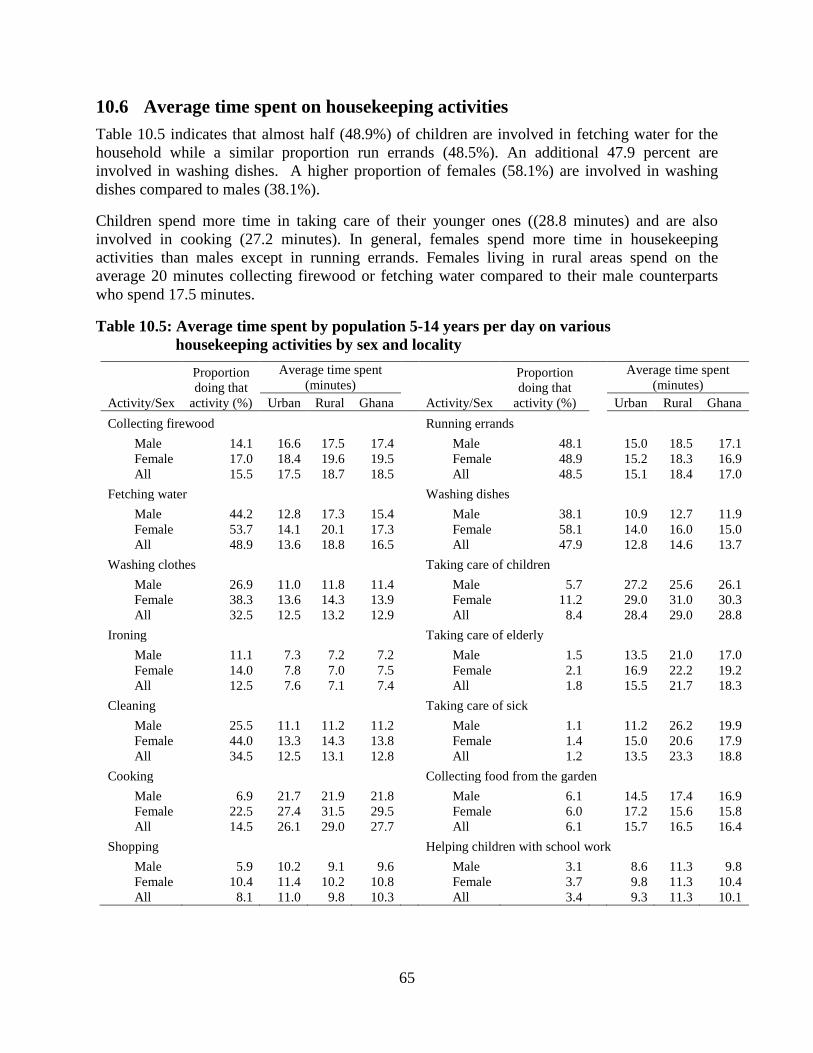
65
10.6 Average time spent on housekeeping activities
Table 10.5 indicates that almost half (48.9%) of children are involved in fetching water for the
household while a similar proportion run errands (48.5%). An additional 47.9 percent are
involved in washing dishes. A higher proportion of females (58.1%) are involved in washing
dishes compared to males (38.1%).
Children spend more time in taking care of their younger ones ((28.8 minutes) and are also
involved in cooking (27.2 minutes). In general, females spend more time in housekeeping
activities than males except in running errands. Females living in rural areas spend on the
average 20 minutes collecting firewood or fetching water compared to their male counterparts
who spend 17.5 minutes.
Table 10.5: Average time spent by population 5-14 years per day on various
housekeeping activities by sex and locality
Activity/Sex
Proportion
doing that
activity (%)
Average time spent
(minutes)
Activity/Sex
Proportion
doing that
activity (%)
Average time spent
(minutes)
Urban Rural Ghana
Urban Rural Ghana
Collecting firewood
Running errands
Male 14.1 16.6 17.5 17.4
Male 48.1
15.0 18.5 17.1
Female 17.0 18.4 19.6 19.5
Female 48.9
15.2 18.3 16.9
All 15.5 17.5 18.7 18.5
All 48.5
15.1 18.4 17.0
Fetching water
Washing dishes
Male 44.2 12.8 17.3 15.4
Male 38.1
10.9 12.7 11.9
Female 53.7 14.1 20.1 17.3
Female 58.1
14.0 16.0 15.0
All 48.9 13.6 18.8 16.5
All 47.9
12.8 14.6 13.7
Washing clothes
Taking care of children
Male 26.9 11.0 11.8 11.4
Male 5.7
27.2 25.6 26.1
Female 38.3 13.6 14.3 13.9
Female 11.2
29.0 31.0 30.3
All 32.5 12.5 13.2 12.9
All 8.4
28.4 29.0 28.8
Ironing
Taking care of elderly
Male 11.1 7.3 7.2 7.2
Male 1.5
13.5 21.0 17.0
Female 14.0 7.8 7.0 7.5
Female 2.1
16.9 22.2 19.2
All 12.5 7.6 7.1 7.4
All 1.8
15.5 21.7 18.3
Cleaning
Taking care of sick
Male 25.5 11.1 11.2 11.2
Male 1.1
11.2 26.2 19.9
Female 44.0 13.3 14.3 13.8
Female 1.4
15.0 20.6 17.9
All 34.5 12.5 13.1 12.8
All 1.2
13.5 23.3 18.8
Cooking
Collecting food from the garden
Male 6.9 21.7 21.9 21.8
Male 6.1
14.5 17.4 16.9
Female 22.5 27.4 31.5 29.5
Female 6.0
17.2 15.6 15.8
All 14.5 26.1 29.0 27.7
All 6.1
15.7 16.5 16.4
Shopping
Helping children with school work
Male 5.9 10.2 9.1 9.6
Male 3.1
8.6 11.3 9.8
Female 10.4 11.4 10.2 10.8
Female 3.7
9.8 11.3 10.4
All 8.1 11.0 9.8 10.3 All 3.4 9.3 11.3 10.1
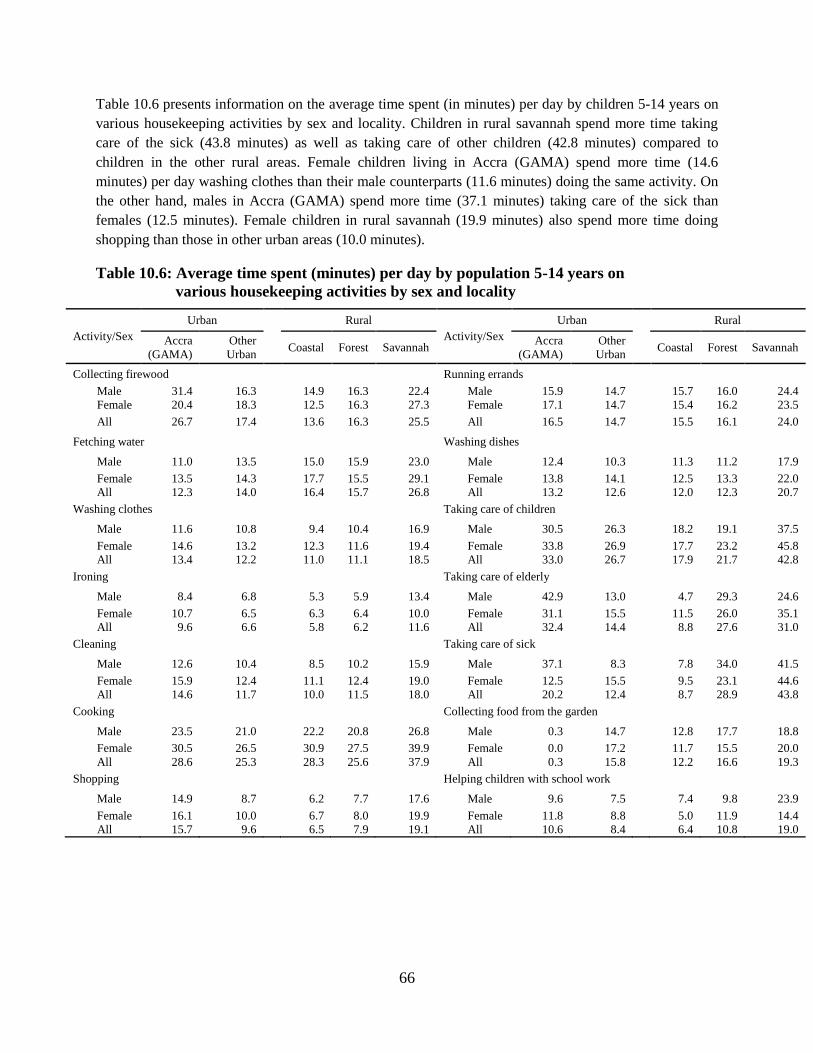
66
Table 10.6 presents information on the average time spent (in minutes) per day by children 5-14 years on
various housekeeping activities by sex and locality. Children in rural savannah spend more time taking
care of the sick (43.8 minutes) as well as taking care of other children (42.8 minutes) compared to
children in the other rural areas. Female children living in Accra (GAMA) spend more time (14.6
minutes) per day washing clothes than their male counterparts (11.6 minutes) doing the same activity. On
the other hand, males in Accra (GAMA) spend more time (37.1 minutes) taking care of the sick than
females (12.5 minutes). Female children in rural savannah (19.9 minutes) also spend more time doing
shopping than those in other urban areas (10.0 minutes).
Table 10.6: Average time spent (minutes) per day by population 5-14 years on
various housekeeping activities by sex and locality
Activity/Sex
Urban Rural
Activity/Sex
Urban Rural
Accra
(GAMA)
Other
Urban Coastal Forest Savannah
Accra
(GAMA)
Other
Urban Coastal Forest Savannah
Collecting firewood
Running errands
Male 31.4 16.3
14.9 16.3 22.4 Male 15.9 14.7
15.7 16.0 24.4
Female 20.4 18.3
12.5 16.3 27.3 Female 17.1 14.7
15.4 16.2 23.5
All 26.7 17.4
13.6 16.3 25.5 All 16.5 14.7
15.5 16.1 24.0
Fetching water
Washing dishes
Male 11.0 13.5
15.0 15.9 23.0 Male 12.4 10.3
11.3 11.2 17.9
Female 13.5 14.3
17.7 15.5 29.1 Female 13.8 14.1
12.5 13.3 22.0
All 12.3 14.0
16.4 15.7 26.8 All 13.2 12.6
12.0 12.3 20.7
Washing clothes
Taking care of children
Male 11.6 10.8
9.4 10.4 16.9 Male 30.5 26.3
18.2 19.1 37.5
Female 14.6 13.2
12.3 11.6 19.4 Female 33.8 26.9
17.7 23.2 45.8
All 13.4 12.2
11.0 11.1 18.5 All 33.0 26.7
17.9 21.7 42.8
Ironing
Taking care of elderly
Male 8.4 6.8
5.3 5.9 13.4 Male 42.9 13.0
4.7 29.3 24.6
Female 10.7 6.5
6.3 6.4 10.0 Female 31.1 15.5
11.5 26.0 35.1
All 9.6 6.6
5.8 6.2 11.6 All 32.4 14.4
8.8 27.6 31.0
Cleaning
Taking care of sick
Male 12.6 10.4
8.5 10.2 15.9 Male 37.1 8.3
7.8 34.0 41.5
Female 15.9 12.4
11.1 12.4 19.0 Female 12.5 15.5
9.5 23.1 44.6
All 14.6 11.7
10.0 11.5 18.0 All 20.2 12.4
8.7 28.9 43.8
Cooking
Collecting food from the garden
Male 23.5 21.0
22.2 20.8 26.8 Male 0.3 14.7
12.8 17.7 18.8
Female 30.5 26.5
30.9 27.5 39.9 Female 0.0 17.2
11.7 15.5 20.0
All 28.6 25.3
28.3 25.6 37.9 All 0.3 15.8
12.2 16.6 19.3
Shopping
Helping children with school work
Male 14.9 8.7
6.2 7.7 17.6 Male 9.6 7.5
7.4 9.8 23.9
Female 16.1 10.0
6.7 8.0 19.9 Female 11.8 8.8
5.0 11.9 14.4
All 15.7 9.6 6.5 7.9 19.1 All 10.6 8.4 6.4 10.8 19.0

67
CHAPTER ELEVEN
SUMMARY, CONCLUSIONS AND RECOMMENDATIONS
11.1 Introduction
The Ghana Living Standards Survey (GLSS) was first conducted in 1987. The second, third,
fourth and fifth rounds were conducted in 1988, 1991/92, 1998/99 and 2005/06 in that order. A
Labour Force module, focusing on employment and time use was introduced in the fourth and
fifth rounds. In the sixth round, however, the module on labour force was used to collect
comprehensive information on employment and labour market conditions in the country. The
module covered the broad areas of current and usual economic activity, informal sector
activities, economic activities of children, non-economic activities, unemployment and
underemployment and youth employment. The survey results are very useful for monitoring the
current employment policies, apprenticeship training and income generating schemes which are
programmes directly related to poverty reduction.
11.2 Summary of findings
Demography
The GLSS6 estimates the total population of the country to be 26.38 million, made up of 12.71
million males and 13.68 million females and a dependency ratio of 79.5.
Activity status
Almost 80 percent of the population 15 years and older are economically active (79.6%), 94.8
percent are employed, 5.2 percent are unemployed and 20.4 percent are economically not active.
The proportion of the population who are unemployed is higher in the urban areas (6.5%)
compared to the rural areas (3.9%). Most of the inactive population is made up of children 5-19
years while the unemployed are mostly persons aged 20 to 24 years (12.3%).
Employment
A high proportion (40.4%) of the employed population are own account workers with an
additional 35.1 percent being employees. Most of the employed are engaged in agri-business
(46.1%). Two-fifths of the employed are in the informal sector (41.9%). Most of the employed
population is engaged in skilled agriculture (44.3%). The service and sales sector employs about
one-quarter of the economically active population (24.5%).
Only 8.4 percent of those engaged in agricultural activities have attained secondary education or
higher though it is the leading employment sector in the country. Majority of the employed are in
vulnerable employment because they work in places where there are no written contracts, no
trade union to negotiate their conditions of engagement, no paid holidays, no sick or maternity
leave or subsidized medical care and no social security.
Labour Underutilization
The unemployment rate in the country is 5.2 percent; the rate is higher among females (5.5%)
than males (4.8%). Overall, unemployment is higher among females than males. The
68
unemployment rate is higher in urban (6.5%) than rural areas (3.9%). The region with the highest
unemployment rate is Upper East (10.8%), with the Brong Ahafo region (2.9%) having the
lowest rate.
Secondary school leavers have the highest unemployment rate (11.7%) with bachelor degree
holders recording 5.9 percent. For the mode of job search, most job seekers resort to friends and
relatives (43.3%). A little over half (50.6%) and more than one-third (35%) of the
underemployed persons are self-employed and contributing family workers respectively. The
combined rate of time-related underemployment and unemployment is 38.4 percent.
More than four million persons aged 15 years and older (made up of 1.8 million males and 2.4
million females) are estimated to be time-related underemployed. More than half of the
underemployed persons are self-employed (50.6%) while 35 percent are contributing family
workers.
The labour underutilization rate is 47.0 percent with females (51.5%) recording a higher rate
than males (42.1%).
Reasons for inactivity
More than three million persons aged 15 years and older who are inactive (3.26 million).
Majority of these people are in the age group 15 to 24 years (2.06 million). Generally, inactivity
among females is higher than males especially in the age groups 15 to -24 and 65 or older. Rural-
urban differentials show that there are more inactive persons in urban areas (2.12 million) than in
rural areas (1.143).
Nearly 55 percent of the population 15 years and older cite education and training as the main
reason for inactivity, followed by household duties (14.5%). More than three-quarters of the
population aged 15 to 29 years (77.2%) are inactive because they are in school
Non-economic activities
More than half of the population 15 years and older spend their time on washing clothes (63.5%),
cleaning (56.4%), cooking (52.4%) as well as fetching water (50.4%). The proportion of females
engaged in these activities is invariably higher than males. The average time spent on fetching
water in rural areas is higher than the average for urban communities. It is particularly high in
rural savannah where the average time spent is 32.5 minutes per day. This is not surprising
because most urban dwellers have access to pipe-borne water or other convenient sources of
water
Youth (15-35 years) employment
The survey results show that 13.9 percent of the youth (15-35 years) have no formal education
while 57 percent in the same age bracket have already completed their education. About 5.5
percent of the youth are unemployed with 67.8 percent employed. For employment status, 33.9
percent of the youth are contributing family workers with 31.9 percent being own account
workers. The results further show that youth labour underutilization rate is 42.6 percent.
Working children (5-14 years)
About one-quarter (25.2%) of the children were economically active. Of the active children, 95.8
percent were engaged in some form of economic activity (working children). Less than three-
69
quarters of the children 5-14 years (72.9%) were economically not active. Nine out of ten
working children who are engaged in the agriculture, forestry and fishing industry (92.2%)
worked 50-59 hours a week.
On the average, working children earn GH₵0.97 per hour, with the highest average hourly
earnings (GH₵1.17) being paid to children engaged in service and sales activities while in the
case of industry, the highest hourly earnings are obtained by children engaged in mining and
quarrying (GH₵1.50). Almost half of children aged 5-14 years are involved in fetching water
(48.9%) for the household while 48.5 percent run errands.
11.3 Conclusions
The working population of the country is dominated by people with no formal education as well
as those with primary and middle school (basic) education. The educational background of the
labour force is a reflection of the structure of the economy. Though agriculture is the back-bone
of the economy, it does not attract people with higher education and, therefore, most of the
agricultural activities are done at the subsistence level. The inability of the formal sector to
generate jobs in their required number has pushed many into the informal sector which is
predominantly made up of small to medium-scale businesses consisting of wholesalers and
retailers, and service providers. Workers in this category also include contributing family
workers who are mainly self-employed persons (farmers, artisans and craft-workers, traders,
food processors).
Generally, Ghana’s economy in terms of employment could be classified as predominantly
informal since most of the currently employed persons 15 years and older are engaged in the
informal sector of the economy. The structure of the economy and the background of the labour
force are not in consonance with the status of the country as a lower middle income country. This
situation leads to the vulnerability of the employed. There is, therefore, the need for the adoption
of strategies and measures to grow and transform the economy.
70
REFERENCES
Amin, A. A., & Awuang, W. (2005). Economic Analysis of Private Returns to Investment in
Education in Cameroon. Dakar, Senegal: Regional Conference on Education in West
Africa.
Baah-Boateng, W. (2011). Unemployment in Ghana: How appropriate is the current definition
for policy purposes? An unpublished paper presented at the Faculty of Social Sciences
Colloquim; University of Ghana, Legon
Hull, K (2009). Understanding the Relationship between Economic Growth, Employment and
Poverty Reduction. Available at http://www.oecd.org/dac/povertyreduction/43280288.pdf
(Accessed on 18th April, 2013).
International Labour Organisation. (2003). Statistics of Employment, Unemployment,
Underemployment: Economically Active Population. Geneva: International Labour
Office.
National Youth Policy of Ghana Document (2010), Ministry of Youth and Sports, Accra.
Osei-Boateng, C., & Ampratrawum, E. (2011). The Informal Sector in Ghana. Friedrich Ebert
Stiftung.
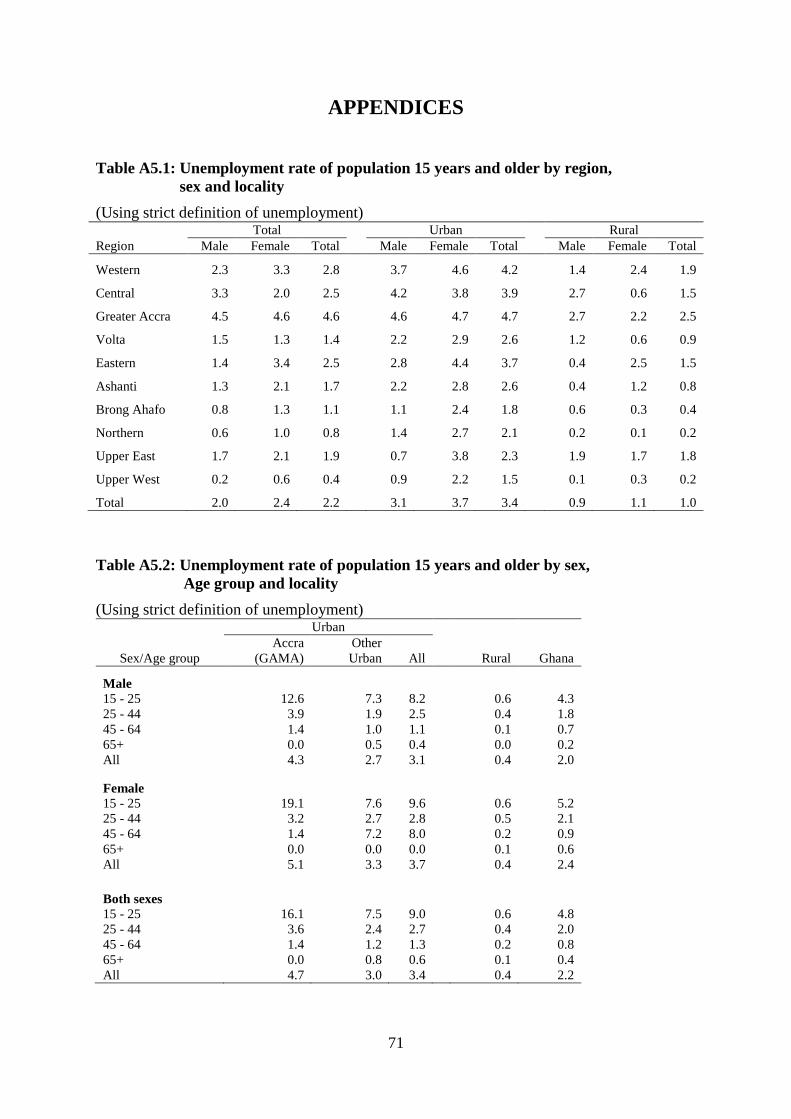
71
APPENDICES
Table A5.1: Unemployment rate of population 15 years and older by region,
sex and locality
(Using strict definition of unemployment)
Region
Total Urban Rural
Male Female Total Male Female Total
Male Female Total
Western 2.3 3.3 2.8
3.7 4.6 4.2
1.4 2.4 1.9
Central 3.3 2.0 2.5
4.2 3.8 3.9
2.7 0.6 1.5
Greater Accra 4.5 4.6 4.6
4.6 4.7 4.7
2.7 2.2 2.5
Volta 1.5 1.3 1.4
2.2 2.9 2.6
1.2 0.6 0.9
Eastern 1.4 3.4 2.5
2.8 4.4 3.7
0.4 2.5 1.5
Ashanti 1.3 2.1 1.7
2.2 2.8 2.6
0.4 1.2 0.8
Brong Ahafo 0.8 1.3 1.1
1.1 2.4 1.8
0.6 0.3 0.4
Northern 0.6 1.0 0.8
1.4 2.7 2.1
0.2 0.1 0.2
Upper East 1.7 2.1 1.9
0.7 3.8 2.3
1.9 1.7 1.8
Upper West 0.2 0.6 0.4
0.9 2.2 1.5
0.1 0.3 0.2
Total 2.0 2.4 2.2 3.1 3.7 3.4 0.9 1.1 1.0
Table A5.2: Unemployment rate of population 15 years and older by sex,
Age group and locality
(Using strict definition of unemployment)
Sex/Age group
Urban
Rural Ghana
Accra
(GAMA)
Other
Urban All
Male
15 - 25 12.6 7.3 8.2
0.6 4.3
25 - 44 3.9 1.9 2.5
0.4 1.8
45 - 64 1.4 1.0 1.1
0.1 0.7
65+ 0.0 0.5 0.4
0.0 0.2
All 4.3 2.7 3.1
0.4 2.0
Female
15 - 25 19.1 7.6 9.6
0.6 5.2
25 - 44 3.2 2.7 2.8
0.5 2.1
45 - 64 1.4 7.2 8.0
0.2 0.9
65+ 0.0 0.0 0.0
0.1 0.6
All 5.1 3.3 3.7
0.4 2.4
Both sexes
15 - 25 16.1 7.5 9.0
0.6 4.8
25 - 44 3.6 2.4 2.7
0.4 2.0
45 - 64 1.4 1.2 1.3
0.2 0.8
65+ 0.0 0.8 0.6
0.1 0.4
All 4.7 3.0 3.4 0.4 2.2
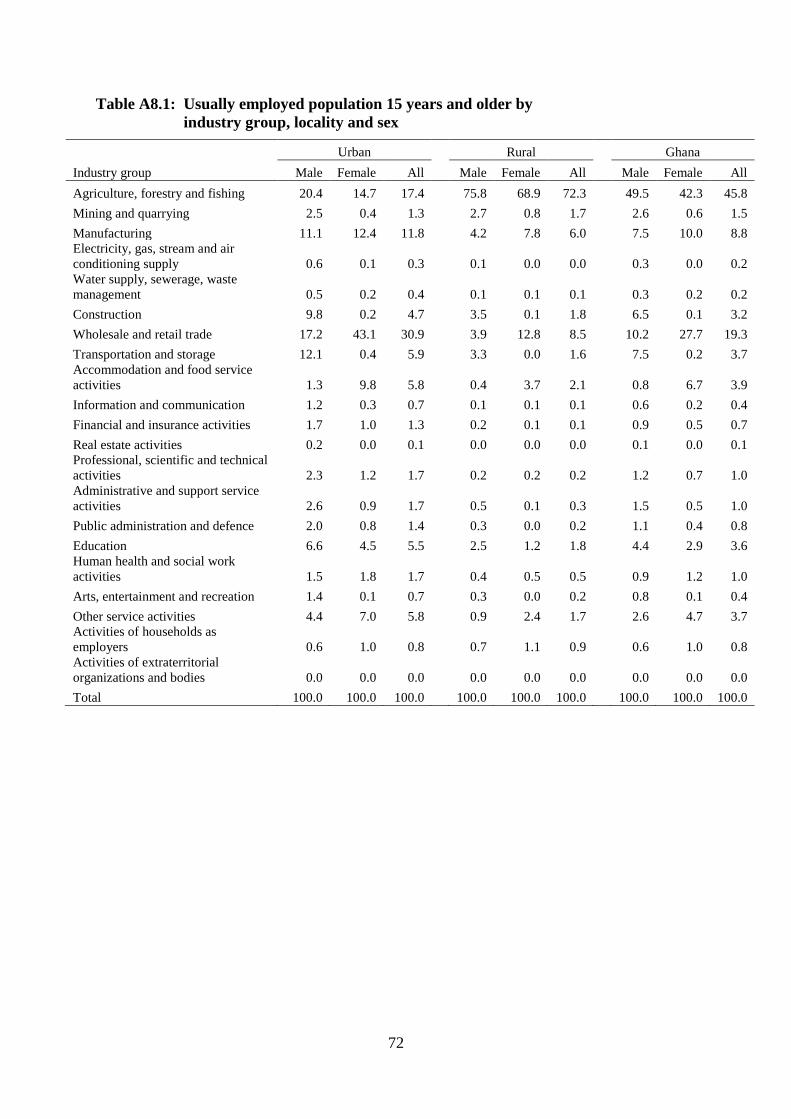
72
Table A8.1: Usually employed population 15 years and older by
industry group, locality and sex
Industry group
Urban
Rural
Ghana
Male Female All Male Female All Male Female All
Agriculture, forestry and fishing 20.4 14.7 17.4
75.8 68.9 72.3
49.5 42.3 45.8
Mining and quarrying 2.5 0.4 1.3
2.7 0.8 1.7
2.6 0.6 1.5
Manufacturing 11.1 12.4 11.8
4.2 7.8 6.0
7.5 10.0 8.8
Electricity, gas, stream and air
conditioning supply 0.6 0.1 0.3
0.1 0.0 0.0
0.3 0.0 0.2
Water supply, sewerage, waste
management 0.5 0.2 0.4
0.1 0.1 0.1
0.3 0.2 0.2
Construction 9.8 0.2 4.7
3.5 0.1 1.8
6.5 0.1 3.2
Wholesale and retail trade 17.2 43.1 30.9
3.9 12.8 8.5
10.2 27.7 19.3
Transportation and storage 12.1 0.4 5.9
3.3 0.0 1.6
7.5 0.2 3.7
Accommodation and food service
activities 1.3 9.8 5.8
0.4 3.7 2.1
0.8 6.7 3.9
Information and communication 1.2 0.3 0.7
0.1 0.1 0.1
0.6 0.2 0.4
Financial and insurance activities 1.7 1.0 1.3
0.2 0.1 0.1
0.9 0.5 0.7
Real estate activities 0.2 0.0 0.1
0.0 0.0 0.0
0.1 0.0 0.1
Professional, scientific and technical
activities 2.3 1.2 1.7
0.2 0.2 0.2
1.2 0.7 1.0
Administrative and support service
activities 2.6 0.9 1.7
0.5 0.1 0.3
1.5 0.5 1.0
Public administration and defence 2.0 0.8 1.4
0.3 0.0 0.2
1.1 0.4 0.8
Education 6.6 4.5 5.5
2.5 1.2 1.8
4.4 2.9 3.6
Human health and social work
activities 1.5 1.8 1.7
0.4 0.5 0.5
0.9 1.2 1.0
Arts, entertainment and recreation 1.4 0.1 0.7
0.3 0.0 0.2
0.8 0.1 0.4
Other service activities 4.4 7.0 5.8
0.9 2.4 1.7
2.6 4.7 3.7
Activities of households as
employers 0.6 1.0 0.8
0.7 1.1 0.9
0.6 1.0 0.8
Activities of extraterritorial
organizations and bodies 0.0 0.0 0.0
0.0 0.0 0.0
0.0 0.0 0.0
Total 100.0 100.0 100.0 100.0 100.0 100.0 100.0 100.0 100.0
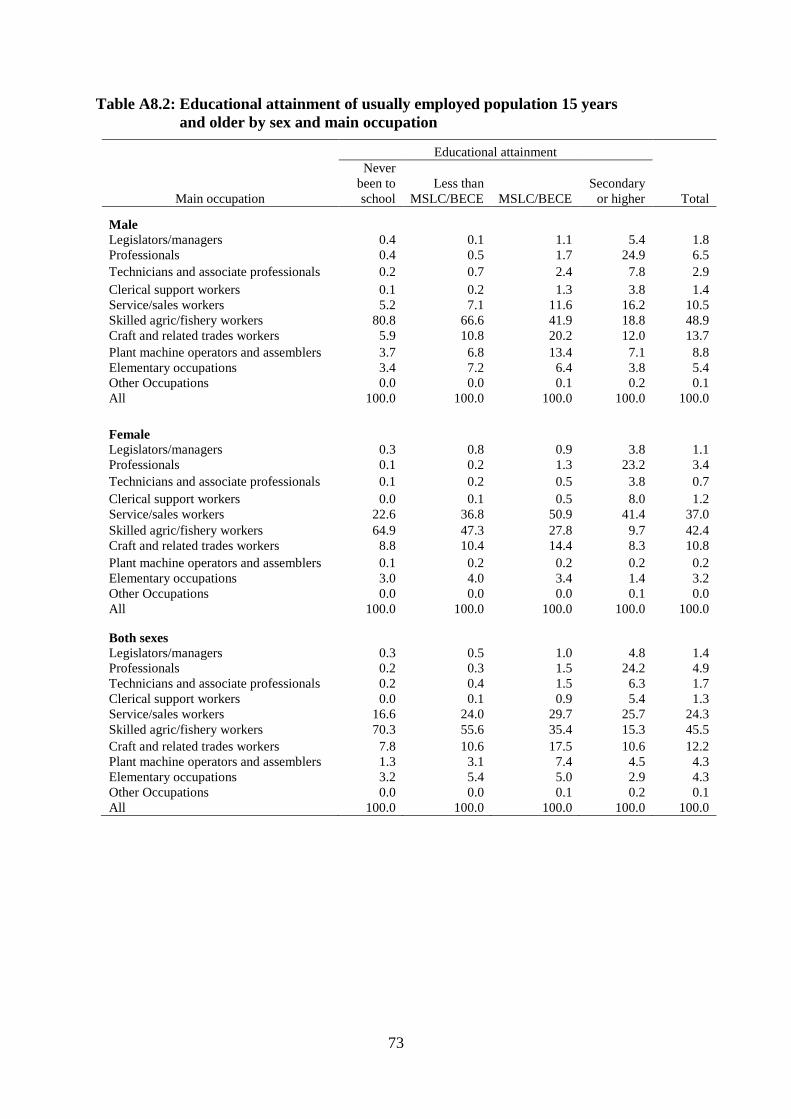
73
Table A8.2: Educational attainment of usually employed population 15 years
and older by sex and main occupation
Main occupation
Educational attainment
Never
been to
school
Less than
MSLC/BECE MSLC/BECE
Secondary
or higher Total
Male
Legislators/managers 0.4 0.1 1.1 5.4 1.8
Professionals 0.4 0.5 1.7 24.9 6.5
Technicians and associate professionals 0.2 0.7 2.4 7.8 2.9
Clerical support workers 0.1 0.2 1.3 3.8 1.4
Service/sales workers 5.2 7.1 11.6 16.2 10.5
Skilled agric/fishery workers 80.8 66.6 41.9 18.8 48.9
Craft and related trades workers 5.9 10.8 20.2 12.0 13.7
Plant machine operators and assemblers 3.7 6.8 13.4 7.1 8.8
Elementary occupations 3.4 7.2 6.4 3.8 5.4
Other Occupations 0.0 0.0 0.1 0.2 0.1
All 100.0 100.0 100.0 100.0 100.0
Female
Legislators/managers 0.3 0.8 0.9 3.8 1.1
Professionals 0.1 0.2 1.3 23.2 3.4
Technicians and associate professionals 0.1 0.2 0.5 3.8 0.7
Clerical support workers 0.0 0.1 0.5 8.0 1.2
Service/sales workers 22.6 36.8 50.9 41.4 37.0
Skilled agric/fishery workers 64.9 47.3 27.8 9.7 42.4
Craft and related trades workers 8.8 10.4 14.4 8.3 10.8
Plant machine operators and assemblers 0.1 0.2 0.2 0.2 0.2
Elementary occupations 3.0 4.0 3.4 1.4 3.2
Other Occupations 0.0 0.0 0.0 0.1 0.0
All 100.0 100.0 100.0 100.0 100.0
Both sexes
Legislators/managers 0.3 0.5 1.0 4.8 1.4
Professionals 0.2 0.3 1.5 24.2 4.9
Technicians and associate professionals 0.2 0.4 1.5 6.3 1.7
Clerical support workers 0.0 0.1 0.9 5.4 1.3
Service/sales workers 16.6 24.0 29.7 25.7 24.3
Skilled agric/fishery workers 70.3 55.6 35.4 15.3 45.5
Craft and related trades workers 7.8 10.6 17.5 10.6 12.2
Plant machine operators and assemblers 1.3 3.1 7.4 4.5 4.3
Elementary occupations 3.2 5.4 5.0 2.9 4.3
Other Occupations 0.0 0.0 0.1 0.2 0.1
All 100.0 100.0 100.0 100.0 100.0
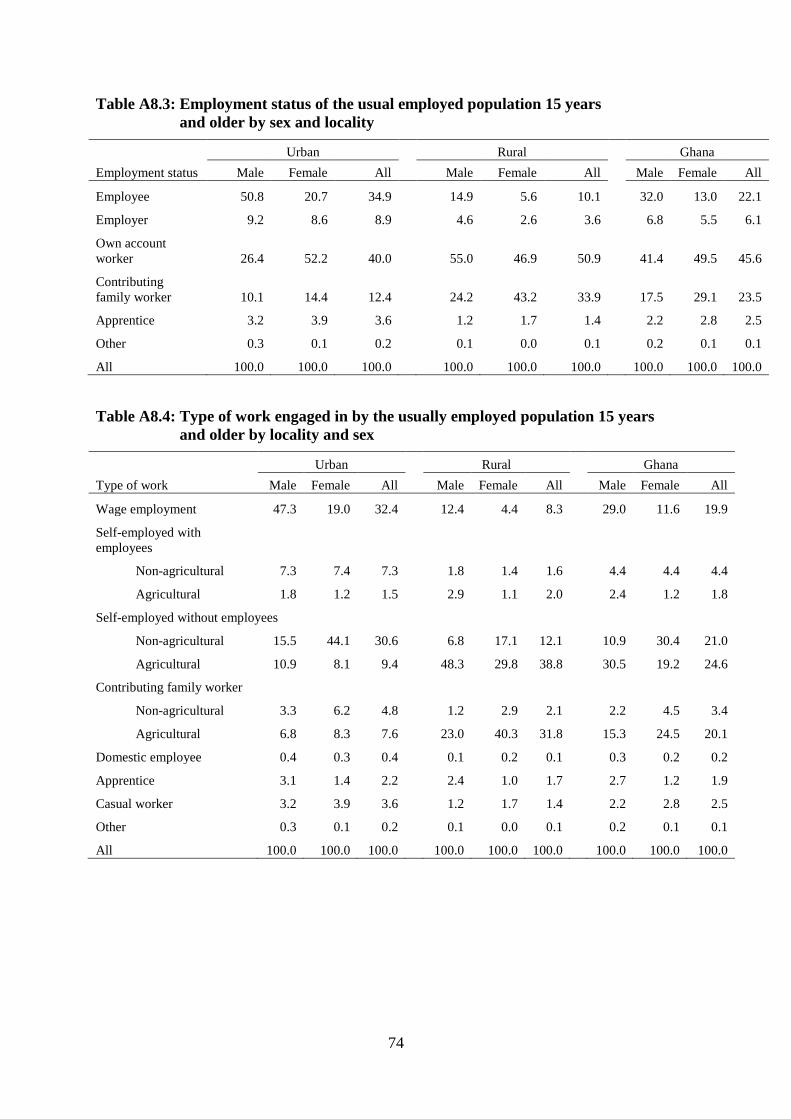
74
Table A8.3: Employment status of the usual employed population 15 years
and older by sex and locality
Employment status
Urban Rural Ghana
Male Female All Male Female All
Male Female All
Employee 50.8 20.7 34.9
14.9 5.6 10.1
32.0 13.0 22.1
Employer 9.2 8.6 8.9
4.6 2.6 3.6
6.8 5.5 6.1
Own account
worker 26.4 52.2 40.0
55.0 46.9 50.9
41.4 49.5 45.6
Contributing
family worker 10.1 14.4 12.4
24.2 43.2 33.9
17.5 29.1 23.5
Apprentice 3.2 3.9 3.6
1.2 1.7 1.4
2.2 2.8 2.5
Other 0.3 0.1 0.2
0.1 0.0 0.1
0.2 0.1 0.1
All 100.0 100.0 100.0 100.0 100.0 100.0 100.0 100.0 100.0
Table A8.4: Type of work engaged in by the usually employed population 15 years
and older by locality and sex
Type of work
Urban Rural
Ghana
Male Female All Male Female All Male Female All
Wage employment 47.3 19.0 32.4
12.4 4.4 8.3
29.0 11.6 19.9
Self-employed with
employees
Non-agricultural 7.3 7.4 7.3
1.8 1.4 1.6
4.4 4.4 4.4
Agricultural 1.8 1.2 1.5
2.9 1.1 2.0
2.4 1.2 1.8
Self-employed without employees
Non-agricultural 15.5 44.1 30.6
6.8 17.1 12.1
10.9 30.4 21.0
Agricultural 10.9 8.1 9.4
48.3 29.8 38.8
30.5 19.2 24.6
Contributing family worker
Non-agricultural 3.3 6.2 4.8
1.2 2.9 2.1
2.2 4.5 3.4
Agricultural 6.8 8.3 7.6
23.0 40.3 31.8
15.3 24.5 20.1
Domestic employee 0.4 0.3 0.4
0.1 0.2 0.1
0.3 0.2 0.2
Apprentice 3.1 1.4 2.2
2.4 1.0 1.7
2.7 1.2 1.9
Casual worker 3.2 3.9 3.6
1.2 1.7 1.4
2.2 2.8 2.5
Other 0.3 0.1 0.2
0.1 0.0 0.1
0.2 0.1 0.1
All 100.0 100.0 100.0 100.0 100.0 100.0 100.0 100.0 100.0
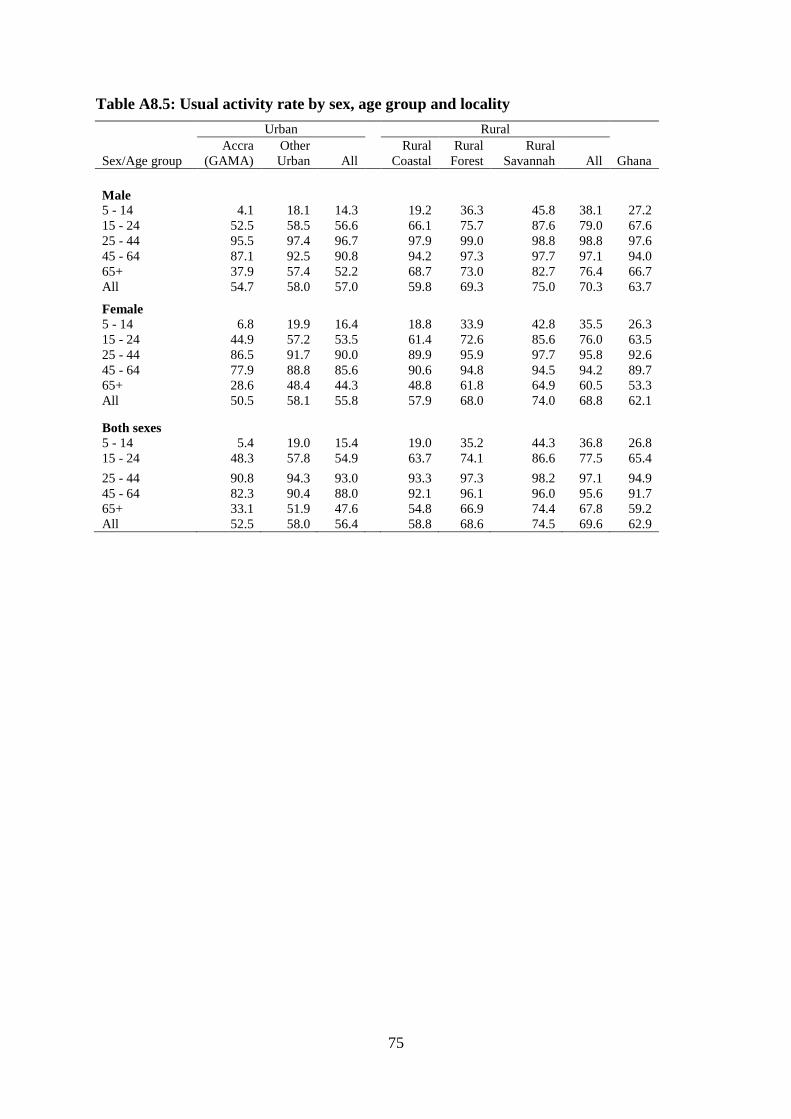
75
Table A8.5: Usual activity rate by sex, age group and locality
Sex/Age group
Urban Rural
Ghana
Accra
(GAMA)
Other
Urban All
Rural
Coastal
Rural
Forest
Rural
Savannah All
Male
5 - 14 4.1 18.1 14.3 19.2 36.3 45.8 38.1 27.2
15 - 24 52.5 58.5 56.6 66.1 75.7 87.6 79.0 67.6
25 - 44 95.5 97.4 96.7 97.9 99.0 98.8 98.8 97.6
45 - 64 87.1 92.5 90.8 94.2 97.3 97.7 97.1 94.0
65+ 37.9 57.4 52.2 68.7 73.0 82.7 76.4 66.7
All 54.7 58.0 57.0 59.8 69.3 75.0 70.3 63.7
Female
5 - 14 6.8 19.9 16.4 18.8 33.9 42.8 35.5 26.3
15 - 24 44.9 57.2 53.5 61.4 72.6 85.6 76.0 63.5
25 - 44 86.5 91.7 90.0 89.9 95.9 97.7 95.8 92.6
45 - 64 77.9 88.8 85.6 90.6 94.8 94.5 94.2 89.7
65+ 28.6 48.4 44.3 48.8 61.8 64.9 60.5 53.3
All 50.5 58.1 55.8 57.9 68.0 74.0 68.8 62.1
Both sexes
5 - 14 5.4 19.0 15.4 19.0 35.2 44.3 36.8 26.8
15 - 24 48.3 57.8 54.9 63.7 74.1 86.6 77.5 65.4
25 - 44 90.8 94.3 93.0 93.3 97.3 98.2 97.1 94.9
45 - 64 82.3 90.4 88.0 92.1 96.1 96.0 95.6 91.7
65+ 33.1 51.9 47.6 54.8 66.9 74.4 67.8 59.2
All 52.5 58.0 56.4 58.8 68.6 74.5 69.6 62.9