Embed Size (px)
Citation preview

GEORGIA DOT RESEARCH PROJECT 14-10
FINAL REPORT
PREFAB BRIDGES FOR GEORGIA CITY AND COUNTY ROADS
OFFICE OF RESEARCH 15 KENNEDY DRIVE
FOREST PARK, GA 30297-2534

ii
1.Report No.: FHWA-GA-16-1410
2. Government Accession No.:
3. Recipient's Catalog No.:
4. Title and Subtitle: Prefab Bridges for Georgia City and County Roads
5. Report Date: February 2016
6. Performing Organization Code:
7. Author(s): Junsuk Kang, Mike Jackson, Marcel Maghiar,
Gustavo Maldonado, Peter Rogers
8. Performing Organ. Report No.:
9. Performing Organization Name and Address: Department of Civil Engineering and
Construction Management Georgia Southern University PO Box 8077 Statesboro, GA 30460-8077
10. Work Unit No.:
11. Contract or Grant No.: RP 14-10/0012919
12. Sponsoring Agency Name and Address: Georgia Department of Transportation Office of Research 15 Kennedy Drive Forest Park, GA 30297-2534
13. Type of Report and Period Covered: Final; December 2014-February 2016 14. Sponsoring Agency Code:
15. Supplementary Notes: Prepared in cooperation with the U.S. Department of Transportation, Federal Highway Administration. 16. Abstract:
The objective of this study was to develop and deliver a toolkit to help local governments (LGs) in Georgia select and construct bridges using prefabricated modular systems with 40-, 60-, and 80-foot spans. The components of the proposed accelerated bridge construction (ABC) toolkit address: 1) decision-making; 2) design; 3) construction; 4) risk analysis; and 5) cost estimation. It will be an extensive, convenient source of the latest guidelines for ABC applications. It is not intended for developing final design and construction plans but as a source of information to help decision-makers and owners develop an initial design, estimate the material and construction costs, and determine when and where ABC will be most beneficial. It will provide guidelines to assist local governments and third-party designers using GDOT design standards for ABC. With repeated implementation, ABC options will become even more economical and efficient. 17. Key Words: Accelerated bridge construction; Concrete girder; Design; Prefabricated bridge; Steel girder; Toolkit
18. Distribution Statement:
19. Security Classification (of this report): Unclassified
20. Security Classification (of this page): Unclassified
21. Number of Pages:
425
22. Price:
Form DOT 1700.7 (8-69)
iii
GDOT Research Project No. 14-10
Final Report
PREFAB BRIDGES FOR GEORGIA CITY AND COUNTY ROADS
Submitted by
Junsuk Kang, Ph.D., Assistant Professor Mike Jackson, Ph.D., P.E., Professor and Chair
Marcel Maghiar, Ph.D., Assistant Professor Gustavo Maldonado, Ph.D., P.E., Associate Professor
Peter Rogers, Ph.D., P.E., Associate Professor
Department of Civil Engineering and Construction Management Georgia Southern University
P.O. Box 8077, Statesboro, GA 30460-8077
Contract with
Georgia Department of Transportation
In cooperation with
U.S. Department of Transportation Federal Highway Administration
February, 2016
The contents of this report reflect the views of the authors who are responsible for the facts and the accuracy of the data presented herein. The contents do not necessarily reflect the official views or policies of the Georgia Department of Transportation or the Federal Highway Administration. This report does not constitute a standard, specification, or regulation.

iv
ACKNOWLEDGMENTS The authors thank the Georgia Department of Transportation (GDOT) for its strong support and invaluable input. The work conducted was sponsored by the Office of Research o f GDOT ( Research Project 14-10). The authors particularly acknowledge the contribution of Gretel Sims, Benjamin Rabun, Binh Bui, and David Jared. The Transportation Research Board kindly granted permission to reproduce the article “Innovative Bridge Designs for Rapid Renewal: SHRP 2 Project Develops and Demonstrates a Toolkit” by Bala Sivakumar in our accelerated bridge construction (ABC) Toolkit for GA, modifying the Mathcad examples from the original SHRP 2 Mathcad files. Professor Emeritus Dr. Noyan Turkkan at the University of Montana generously granted us permission to use the qBridge software, a Mathcad-based code, in this project.
v
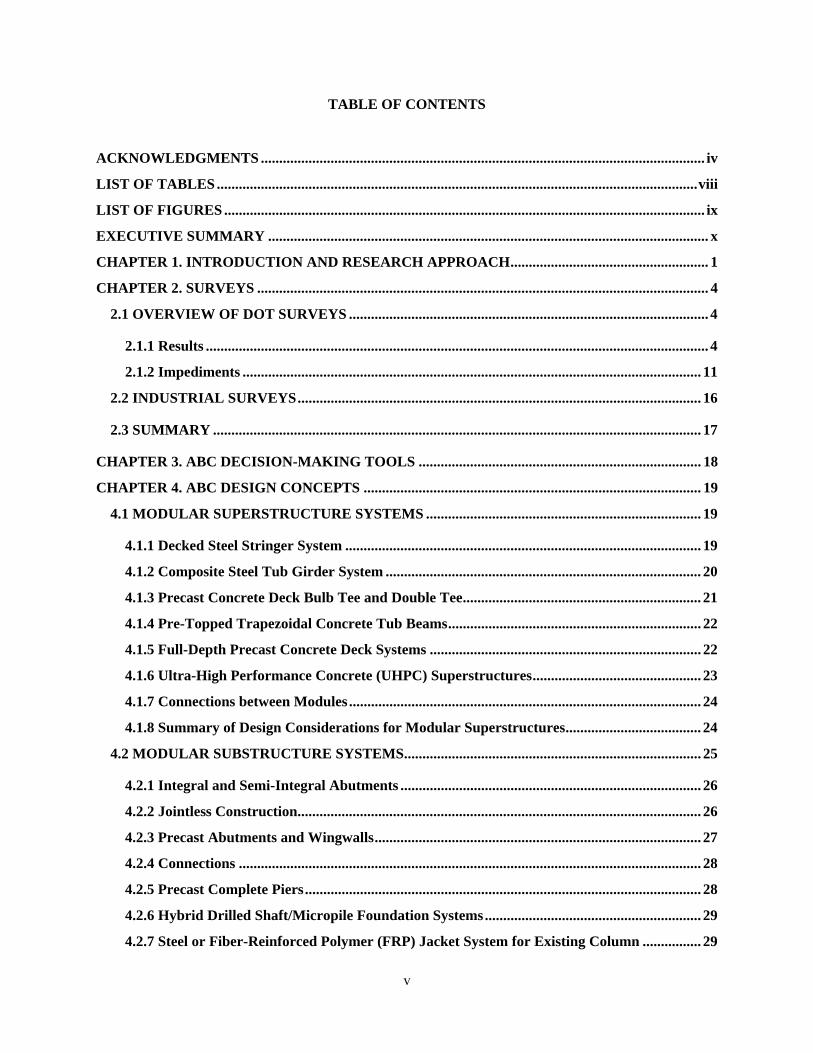
TABLE OF CONTENTS
ACKNOWLEDGMENTS ......................................................................................................................... iv
LIST OF TABLES ................................................................................................................................... viii
LIST OF FIGURES ................................................................................................................................... ix
EXECUTIVE SUMMARY ........................................................................................................................ x
CHAPTER 1. INTRODUCTION AND RESEARCH APPROACH ...................................................... 1
CHAPTER 2. SURVEYS ........................................................................................................................... 4
2.1 OVERVIEW OF DOT SURVEYS .................................................................................................. 4
2.1.1 Results ......................................................................................................................................... 4
2.1.2 Impediments ............................................................................................................................. 11
2.2 INDUSTRIAL SURVEYS .............................................................................................................. 16
2.3 SUMMARY ..................................................................................................................................... 17
CHAPTER 3. ABC DECISION-MAKING TOOLS ............................................................................. 18
CHAPTER 4. ABC DESIGN CONCEPTS ............................................................................................ 19
4.1 MODULAR SUPERSTRUCTURE SYSTEMS ........................................................................... 19
4.1.1 Decked Steel Stringer System ................................................................................................. 19
4.1.2 Composite Steel Tub Girder System ...................................................................................... 20
4.1.3 Precast Concrete Deck Bulb Tee and Double Tee ................................................................. 21
4.1.4 Pre-Topped Trapezoidal Concrete Tub Beams ..................................................................... 22
4.1.5 Full-Depth Precast Concrete Deck Systems .......................................................................... 22
4.1.6 Ultra-High Performance Concrete (UHPC) Superstructures .............................................. 23
4.1.7 Connections between Modules ................................................................................................ 24
4.1.8 Summary of Design Considerations for Modular Superstructures ..................................... 24
4.2 MODULAR SUBSTRUCTURE SYSTEMS................................................................................. 25
4.2.1 Integral and Semi-Integral Abutments .................................................................................. 26
4.2.2 Jointless Construction.............................................................................................................. 26
4.2.3 Precast Abutments and Wingwalls ......................................................................................... 27
4.2.4 Connections .............................................................................................................................. 28
4.2.5 Precast Complete Piers ............................................................................................................ 28
4.2.6 Hybrid Drilled Shaft/Micropile Foundation Systems ........................................................... 29
4.2.7 Steel or Fiber-Reinforced Polymer (FRP) Jacket System for Existing Column ................ 29

vi
CHAPTER 5. RISK ANALYSIS ............................................................................................................. 31
5.1 THE ROLE OF RISK IN CULVERT AND BRIDGE DESIGN ................................................ 31
5.2 CHOOSING BETWEEN A CULVERT AND A BRIDGE CROSSING ................................... 31
5.3 SELECTING A CULVERT TYPE AND SIZE ............................................................................ 32
5.4 PROCESS FOR SIZING AND DESIGNING CULVERTS ........................................................ 34
5.5 PROCESS FOR SIZING CULVERTS AND REQUIRED BRIDGE OPENINGS .................. 35
5.6 BRIDGE FOUNDATION INVESTIGATION AND SCOUR .................................................... 45
CHAPTER 6. CONCEPTUAL COST ESTIMATES ............................................................................ 47
6.1 CONTRACTOR COST CONCERNS .......................................................................................... 47
6.2 COST OPTIONS ............................................................................................................................. 48
6.3 ROAD USER COSTS ..................................................................................................................... 48
6.4 SAFETY COSTS ............................................................................................................................. 48
6.5 LIFE CYCLE COST ANALYSIS ................................................................................................. 48
6.6 COST ACCOUNTING OPTIONS ................................................................................................ 48
CHAPTER 7. TYPICAL CONSTRUCTION PRACTICES ................................................................ 50
7.1 ABC CONSTRUCTION CONCEPTS .......................................................................................... 50
7.1.1 Prefabricated Spread Footings ............................................................................................... 50
7.1.2 Precast Pile Cap Footings ........................................................................................................ 51
7.1.3 Modular Block Systems ........................................................................................................... 51
7.1.4 Geosynthetic Reinforced Soil Integrated Bridge System (GRS-IBS) .................................. 52
7.1.5 Expanded Polystyrene (EPS) Geofoam for Rapid Embankment Construction ................. 53
7.1.6 Abutments or End-Bents ......................................................................................................... 54
7.1.7 Prefabricated Superstructure Elements ................................................................................ 54
7.1.8 Materials for Prefabricated Bridge Elements ....................................................................... 54
7.2 APPLICATION EXAMPLES OF ABC CONSTRUCTION TECHNOLOGIES .................... 56
7.2.1 Rehabilitation of Existing Bridges .......................................................................................... 56
7.2.2 Deck Replacement .................................................................................................................... 56
7.2.3 Superstructure Replacement .................................................................................................. 57
7.2.4 Substructure Replacement ...................................................................................................... 57
7.2.5 Replacement of Existing Bridges and New Bridges .............................................................. 58

vii
7.2.6 Staging ....................................................................................................................................... 58
7.2.7 Full Closure and New Construction ....................................................................................... 58
7.3 ABC CONSTRUCTION TECHNOLOGIES ............................................................................... 58
7.3.1 Above-Deck Driven Carrier (ADDC) ..................................................................................... 59
7.3.2 Launched Temporary Truss Bridge ....................................................................................... 59
7.3.3 Self-Propelled Modular Transports (SPMTs) ....................................................................... 59
7.3.4 Launching and Lateral Shifting .............................................................................................. 59
CHAPTER 8. ABC TOOLKIT ................................................................................................................ 61
CHAPTER 9. SUMMARY AND CONCLUSIONS ............................................................................... 63
SELECTED BIBLIOGRAPHY ............................................................................................................... 64
LIST OF USEFUL ABC WEBSITES ..................................................................................................... 68
APPENDICES
Appendix A. Survey Results
Appendix B. ABC Sample Design Examples and Flowcharts (using Mathcad)
Appendix C. ABC Construction Practice Flowcharts
Appendix D. Risk Analysis Examples and Interactive Flowchart
Appendix E. Conceptual Cost Estimates Examples
Appendix F. ABC Decision-Making Tools
Appendix G. ABC Toolkit Template
Appendix H. Design Aides (using Mathcad)
Appendix I. Implementation Plan

viii
LIST OF TABLES Table 5.1. Regression Equations for Estimating Peak Flow in Rural Ungauged Areas that are Entirely
Within One Hydrologic Region (USGS, 2009) ........................................................................ 37 Table 5.2. Runoff Coefficients (C) for the Rational Method (GDOT, 2014) ............................................. 39 Table 5.3. Frequency Adjustment Factors for Rational Method (Georgia Stormwater Management
Manual, 2001) ........................................................................................................................... 40 Table 5.4. Rainfall Intensity Information for One Hour Storms Across Georgia (GSMM, 2001) ........... 41 Table 5.5. Pipe Culvert Sizing Table (Sizes Common for Corrugated Steel Pipe) .................................... 44 Table 5.6. Box Culvert Sizing Table (American Concrete Pipe Association, 2015) ................................. 45 Table 5.7. Equivalent Capacities for Multi-barrel Pipe Culverts ............................................................... 45 Table 8.1. Comparison of the SHRP2 R04 ABC toolkit and the proposed toolkit .................................... 61

ix
LIST OF FIGURES Figure 4.1. Decked Steel Stringer System. (a) Steel grid open or filled with concrete (photo: D.S. Brown
Co.). (b) Full-depth precast deck panels with and without longitudinal post-tensioning (FHWA, 2015). (c) Partial-depth precast deck panels (photo: Keegan Precast on project in UK by contractor Laing O’Roruke). ....................................................................................... 20
Figure 4.2. (a) Steel tub girder (photo: Greg Price, DHS Discussion Forum). (b) Concrete tub girder (photo: StressCon Industries, Inc., website). (c) Open trapezoidal composite box girder SteelConstruction.info). ........................................................................................................... 20
Figure 4.3. Composite Steel Tub Girder (SHRP, 2014). ............................................................................ 21 Figure 4.4. (a) Adjacent deck bulb tee beams (FHWA, 2015). (b) Adjacent double tee beams (FHWA,
2015). (c) NEXT beam (drawing on High Steel Structures LLC website). ............................ 21 Figure 4.5. Cross Sections of Pre-topped, Trapezoidal, Concrete U Beams (SHRP2, 2014). ................... 22 Figure 4.6. Full-depth Precast Concrete Deck System (SHRP2, 2014). .................................................... 23 Figure 4.7. (a) Precast modular abutment systems (SHRP2, 2014). (b) Precast complete pier system
(FHWA, 2015). (c) Hybrid drilled shaft/micropile foundation (SHRP2, 2014). .................... 26 Figure 4.8. (a) and (b) Precast modular abutment systems. (c) Precast wingwall (SHRP2, 2014). ........... 28 Figure 4.9. Precast Concrete Pier (SHARP2, 2014). ................................................................................. 29 Figure 4.10. (a) Steel/FRP jacket concept (SHRP2, 2014). (b) Steel jacketed bridge column (Nelson,
2012). (c) FRP jackets in several bridge columns (Buccola, 2011). ....................................... 30 Figure 5.1. Common Culvert Shapes (Purdue University, 2005). ............................................................. 32 Figure 5.2. Pipe (a), Box (b), and Arch (c) Culverts (Cranberry Township, American Concrete Industries,
and Contech, 2015). ................................................................................................................. 33 Figure 5.3. Bridge Culvert (Contech, 2015). ............................................................................................. 34 Figure 5.4. Culvert Cross Section showing Headwater and Tailwater Levels (Purdue University, 2005). 35 Figure 5.5. Example of a Delineated Watershed Boundary (Natural Resources Conservation Service,
2014). ....................................................................................................................................... 35 Figure 5.6. Example Hydrograph. .............................................................................................................. 36 Figure 5.7. Map of the Georgia Flood Frequency Regions (USGS, 2008). ............................................... 37 Figure 5.8. Location of the 16 Sites Containing Rainfall Intensity Information (GSMM, 2001). ............. 40 Figure 5.9. Georgia Rainfall Intensity Data for a One Hour Storm, 50 Year Return Period (NOAA,
2015). ....................................................................................................................................... 42 Figure 5.10. Georgia Rainfall Intensity Data for a One Hour Storm, 100 Year Return Period (NOAA,
2015). ....................................................................................................................................... 43 Figure 7.1. Example of Precast Spread Footing Plan and Section (MassDOT, 2013). .............................. 51 Figure 7.2. Modular Block Systems (photo: Redi-Rock.com and ReinforcedEarth.com). ........................ 52 Figure 7.3. Typical GRS-IBS Cross Section at the Bridge Abutment (Adams et. al, 2012). ..................... 53 Figure 7.4. (a) Bridge abutment with geofoam backfill. (b) EPS geofoam in embankment fill. (c) EPS
geofoam for embankment widening (Bartlett et. al., 2000). .................................................... 53 Figure 7.5. (a) Location of abutments at each end of the bridge (image from Benchmark Hunting Wiki).
(b) Integral abutment placed behind a mechanically stabilized earth (MSE) wall (Hailat, 2014). (c) Partial precast end abutment (Hailat, 2014). ........................................................... 54
Figure 7.6. Prefabricated Superstructure Elements (SHRP2, 2014). ......................................................... 54 Figure 7.7. Self-propelled Modular Transporters (AASHTO, 2006). ........................................................ 57
x
EXECUTIVE SUMMARY
Accelerated bridge construction (ABC) differs from conventional cast-in-place methods in that all the members are prefabricated then lifted into place and assembled onsite. As a result of increased interest and use of ABC in Georgia, the Georgia Department of Transportation (GDOT) funded a research project aimed at introducing ABC design and construction to Georgia cities and counties through the use of a toolkit. The research focused specifically on short span bridges for span lengths of 40, 60, and 80 ft. The toolkit is not intended to be used for developing a final design, but rather as an informational source that can help decision makers develop an initial design, estimate the material and construction costs, and determine when and where ABC is most beneficial. This study presents the process used in developing the toolkit and its primary features.
The first phase of the project involved the creation and completion of a survey which was distributed to several state DOTs. It contained questions regarding the organization’s experience with ABC, the level of acceptance of ABC techniques in their state, the number of completed projects in recent years, impediments to the use of ABC techniques, and the ongoing research on ABC topics in the entity’s state.
The toolkit itself contains construction, design, risk analysis, and cost estimate components. The construction guidelines will encompass most steps in the construction process from the foundation to the paving of the deck. It will also outline the construction process of the offsite prefabrication area, transportation of elements, and setting of the prefabricated bridge elements. The design component of the toolkit will provide design concepts, user friendly pre-design examples, and interactive design flowcharts with design aides such as Mathcad, which will allow readers, such as Georgia city and county engineers, to easily follow the extensive procedures involved in ABC bridge construction. Both steel and concrete girder design examples were developed and modified to allow for easy understanding using GDOT standard criteria for highway bridges, information obtained from a design example created by the Federal Highway Association (FHWA), and the latest AASHTO LRFD Bridge Design Specifications, 6th ed. (2012). The base design examples were taken from “Innovative Bridge Designs for Rapid Renewal” (SHRP2, 2013).
In terms of risk analysis, the risk assessment components of the toolkit focused on the evaluation of the bridge’s ability to convey the design and base floods without causing significant damage to the roadway, stream, bridge itself, and other property. The guidelines with an interactive flowchart will be created to assist the potential designer in the collection of the hydrologic data needed to determine the peak discharges for different design year floods and perform a hydraulic analysis. The cost estimate component will provide examples of cost comparisons between corresponding Federal and State requirements to guide local governments in their cost estimation activity.
The proposed ABC toolkit will provide guidelines to assist local governments and third-party designers in employing GDOT design standards for accelerated-built bridges. In the future, sufficient ABC experience in GA will lead to contractor acceptance as well as to savings in schedules and costs, which could diminish the initial additional costs with a consistent and repeated application of ABC practices. Key Words: Accelerated bridge construction (ABC); Concrete girder; Design; Steel girder, Toolkit.

1
CHAPTER 1. INTRODUCTION AND RESEARCH APPROACH Accelerated bridge construction (ABC) encompasses the techniques used in the prefabrication of bridge sections to decrease the closure time required to construct or renovate a bridge. From the Federal Highway Administration (FHWA) website, the definition of ABC is a bridge construction that uses innovative planning, design, materials, and construction methods in a safe and cost effective manner to reduce the onsite construction time that occurs when building new bridges or replacing and rehabilitating existing bridges. In other words, ABC is “building the bridge first before setting up the traffic control cones, and then move it quickly into places, like in hours or a weekend.” (Mistry 2008). As a result of increased interest and use of ABC in Georgia, the Georgia Department of Transportation (GDOT) funded a research project aimed at introducing ABC design and construction to Georgia cities and counties through the use of a toolkit. This study focuses on short span bridges, between 40 and 80 feet, for the state of Georgia. Special attention was given to various areas of ABC, generally regarding design, constructability, and risk analysis, and specifically regarding the use of concrete and steel girders, concrete-decked steel girders, prestressed concrete, as well as cost efficiency, lessons learned reports from other states’ completed projects, and industry surveys. Several specific case studies were also conducted to evaluate the performance and design-to-finish process of a bridge which utilizes prefabricated modular systems.
ABC techniques have been performed in the past and are currently being investigated for more extensive use. Garver, an engineering consultancy out of Arkansas, details the process of a lateral slide, a bridge sliding technique used to replace a bridge superstructure. There is no one ABC technique in use in the United States. Instead, there is a family of ABC construction technologies that are in use that cover the majority of ABC projects. In construction, the foundation and wall element technologies are in the early stages of deployment, while others such as modular superstructure systems are mature and in use on a regular basis. Benefits to employing ABC techniques include: ABC improves:
● Site constructability; ● Total project delivery time; ● Material quality and product durability; and ● Work-zone safety for the commuters and contractor personnel.
ABC reduces: ● Traffic impacts; ● Onsite construction time; and ● Weather-related time delays.
ABC can minimize: ● Environmental impacts; ● Impacts to existing roadway alignment; and ● Utility relocations and right of way take.
` Commonly, ABC has been employed to reduce the traffic impact since the safety and flow of
public travel and the flow of transportation directly correspond to the onsite construction flow of the
2
activities. There are other common and equally viable reasons to use ABC, which range from site constructability issues to time management issues.
Conventional bridge construction, commonly referred to as cast-in-place (CIP) methods, is construction that does not focus on the reduction of onsite construction time. Conventional construction methods involve onsite activities that are time consuming and weather dependent. Conventional construction includes onsite installation of bridge substructures and superstructures, placing reinforcing steel, and concrete placement, followed by concrete curing.
Effectiveness of ABC is determined by two factors: onsite construction time and mobility impact time. Onsite construction time is the period of time from when a contractor alters the project site location until all construction related activity is removed. Some examples involved include maintenance of traffic items, construction materials on site, equipment, and workforce. Mobility impact time is any period of time the traffic flow of the commuters is reduced due to onsite construction activities. The fewer amount of disruptions, the better and least expensive.
The use of prefabricated bridge elements and systems (PBES) is one of the most crucial strategies employed to meet the objectives of ABC. PBES are structural components of a bridge that are built off-site. These elements help reduce the onsite construction time and commuter impact time that occurs from conventional construction methods. Combining PBES with the “Fast Track Contracting” method can create a high-performance and fast paced construction project. Components of PBES include, but are not limited to:
● Precast footings; ● Precast wing walls; ● Precast pile foundations; ● Prefabricated caps and footings; and ● Prefabricated steel/concrete girder beams.
The first phase of the project involved the creation and completion of a survey which was
distributed to several state DOTs. It contained questions regarding the organization’s experience with ABC, the level of acceptance of ABC techniques in their state, the number of completed projects in recent years, impediments to the use of ABC techniques, and the ongoing research on ABC topics in the entity’s state.
The primary objective of this study was to develop and deliver a toolkit for accelerated selection and construction of bridges in place using prefabricated modular systems with 40, 60, and 80 feet span lengths for local governments (LGs) in Georgia. The proposed toolkit itself contains construction, design, risk analysis, cost estimate components, and decision-making tools. The construction guidelines will encompass most steps in the construction process from the foundation to the paving of the deck. It will also outline the construction process of the offsite prefabrication area, transportation of elements, and setting of the prefabricated bridge elements. The design component of the toolkit will provide user friendly pre-design examples and interactive design flowcharts with design aides such as Mathcad, which will allow readers, such as Georgia city and county engineers, to easily follow the extensive procedures involved in ABC bridge construction. Both steel and concrete girder design examples were developed and modified to allow for easy understanding using GDOT standard criteria for highway bridges, information obtained from a design example created by the Federal Highway Association, and the latest AASHTO LRFD Bridge Design Specifications, 6th ed. (2012). The base design examples were taken from the SHRP 2 document, “Innovative Bridge Designs for Rapid Renewal” (SHRP2 2013). In terms of risk analysis, the risk assessment components of the toolkit focused on the evaluation of the bridge’s ability to convey

3
the design and base floods without causing significant damage to the roadway, stream, bridge itself, and other property. The guidelines with an interactive flowchart will be created to assist the potential designer in the collection of the hydrologic data needed to determine the peak discharges for different design year floods and perform a hydraulic analysis. The cost estimate component will provide examples of cost comparisons between corresponding Federal and State requirements and survey other state DOTs regarding their conceptual cost estimates.
The toolkit is not intended to be used for developing final design and construction, but rather as an informational source that can help decision makers develop an initial design, estimate the material and construction costs, and determine when and where ABC is most beneficial. The proposed ABC toolkit will provide guidelines to assist LGs and third-party designers in employing GDOT design standards for accelerated-built bridges. With the sufficient and repeated application, ABC option can become more economical and efficient.

4
CHAPTER 2. SURVEYS
2.1 OVERVIEW OF DOT SURVEYS
The survey was submitted to various agencies in order to inquire as to their experience with ABC. The survey was used to evaluate their successes and to find out what worked, as well as to evaluate their failures to find out what did not. This survey consisted of questions which gauged the experience of bridge owners. Their responses are noted in our research, and state DOTs from all 50 states were contacted regarding their own ABC experiences via a more generalized 7-question survey (taken from SHRP2 2013) by the Georgia Southern ABC Research team. They were asked questions specifically regarding:
● The amount of experience they have had with ABC in recent years and how many projects they have completed.
● The general level of acceptance of ABC in their state. ● Which agency generally engineers the projects to have components of ABC. ● Which impediments, if any, are keeping these agencies from opting to use ABC techniques as
opposed to traditional methods. ● The availability of standardized elements and the benefit thereof. ● The condition of ongoing or completed projects. ● Current research regarding ABC.
Results from our surveys were obtained from 45 of the 50 states and are summarized using tables and U.S. maps in Appendix B. With the exception of Arkansas, Nebraska, and North Dakota, all indicated states have completed ABC projects in recent years and ABC has become standard in Utah and Colorado. The following section briefly presents the level and status of ABC application for each state:
2.1.1 Results Alabama: The Alabama DOT (ALDOT) has completed one project in the past 5 years. The level of acceptance of ABC within the state is low and contractors are doubtful about its use for typical bridges. However, they think ABC could be successful for long structures that require substantial repetition of elements. Alabama is currently involved in the research and testing of four systems of rapid deck replacement on structures in the northern region of the state. Alaska: The Alaska DOT & Public Facilities (ADOT&PF) has completed several projects in recent years, and the support for ABC is moderate within the state. Projects completed recently use decked bulb-tee girders so that construction is faster and a deck does not need to be cast in place. They have also used precast pier cap beams, full depth deck planks, and other prefabricated bridge elements. Projects are engineered to employ ABC, but contractors on occasion have opted to use ABC. Standardization would help encourage ABC, but training and education would probably help more. Most recently, ADOT&PF has completed research on an all-steel bridge pier system that can be quickly constructed in remote locations. It is reported to have good seismic performance but may not be acceptable in the highest seismic regions. Arizona: The Arizona DOT (ADOT) has completed one project using PBES connections. ABC is valued and there are plans to use it on future projects. The decision to use is sometimes left up to the contractor,
5
but projects are often designed to utilize ABC. Standardization would help the decision making process of whether or not to use ABC. Currently, ADOT is in the planning stages of a bridge replacement project that will use a geosynthetic reinforced soil integrated bridge system (GRS-IBS) abutment and a bridge slide. Research on Ultra-High Performance Concrete (UHPC) connections is in progress. Arkansas: The Arkansas State Highway and Transportation Department (AHTD) has no active ABC program. Their perception is that ABC projects will be more expensive and thus counter to their desire for cost savings. California: The California DOT (Caltrans) described several recent projects in which various ABC methods were employed and indicated that meaningful incentives / disincentives greatly motivated contractors. For example, seismic concerns limit their use of precast pier elements, and they are concerned about long-term durability and the ability to balance the higher costs of ABC projects against user cost-savings.
Colorado: The Colorado Department of Transportation (CDOT) has completed a wide array of projects using ABC, including 73 bridge projects and culverts as of March 2015. The level of acceptance is clearly high. Most bridge projects are designed to employ ABC, but for some design-build projects, the decision is left up to the contractor. Standardization is believed essential; ABC is standard in Colorado and considered on every project, although complex bridge projects will always require a certain level of customization. CDOT is not currently conducting research on ABC. Connecticut: None reported
Delaware: The Delaware DOT (DelDOT) has completed fewer than 10 projects in the past 5 years. They were all engineered to employ ABC techniques, so acceptance of innovation is generally good. Projects have used precast elements, but no research on ABC is ongoing. Florida: The Florida Department of Transportation (FDOT) has conducted many ABC projects in recent years, and though it is not a standard practice, it is considered in every project. Florida has access to standardized elements, but contractors tend to avoid subcontracting work to broadcasters because they make their profit from placing steel and concrete. FDOT does not mandate the use of ABC but leaves the decision up to the contractor. Each bridge project has performance specifications that contractors must meet, and because contractors are given more responsibility with ABC, uncertainties about their methods persist. Georgia: GDOT has completed one ABC project in recent years. The decision to use ABC techniques is left up to the contractor, and GDOT does consider the standardization of prefabricated elements a way to lower costs associated with ABC. GDOT is currently preparing their own prefabricated bridge toolkit to expedite the application of ABC and other prefabricated bridge technologies in GA city and county roads. Hawaii: The Hawaii DOT (HDOT) has been using ABC concepts since precast-prestressed concrete elements were introduced in around 1959. However, based on current definitions, it started in 2001 with the use of adjacent slab beams made of precast-prestressed concrete. Hawaii has completed over 20
6
projects since 2001. The level of acceptance is very high, and some ABC projects proved less expensive than CIP projects. Government incentives would encourage further use of ABC in the state, and though standardized elements are available, ABC is only used when it proves economically beneficial. In the field, it saves contractors money in forming, shoring, and stressing tendons or prestressing strands. Time is saved when these elements are prefabricated while other fieldwork is being performed. Idaho: None reported. Illinois: The Illinois Department of Transportation (IDOT) has completed several projects using ABC methods in recent years. Bridge projects undergo a “Bridge Planning State”, during which ABC is evaluated based on site needs and cost-versus-benefit analyses. Standardized elements would help to curtail ABC costs. Indiana: The Indiana DOT (INDOT) has completed two ABC projects in recent years; they used the bridge-slide technique. Projects are designed to use ABC techniques, and standards would make ABC more efficient. Iowa: The Iowa DOT (IOWADOT) has extensive experience with ABC and has completed approximately eleven ABC projects in recent years. Research focusing on substructure is under way with funding from the Iowa Highway Research Board. Acceptance in the state is good, and projects are designed to use ABC.
Kansas: The Kansas DOT (KDOT) used prefabricated materials, including precast concrete girders and deck panels, even before FHWA’s “Every Day Counts” initiative. Its first official ABC project was designed in August 2014 and let in November 2014. It is modeled after Iowa’s Keg Creek bridge project and used a pre-installed foundation; precast columns, abutments, and pier caps; a conventional weathering steel rolled beam superstructure; and precast, full-depth segmental deck sections post-tensioned together. Bridges are designed to employ ABC concepts. Contractors can also use ABC with KDOT permission, and this would normally happen after the project is let. Kansas law prohibits delivery methods other than design-bid-build. The 2014 project attracted only one bid because of its high price. It will be relet in June 2015. Kentucky: None reported. Louisiana: The Louisiana Department of Transportation and Development (LDOTD) has extensive experience with ABC methods, specifically using precast elements, such as span and cap segments, and float-out, float-in construction to erect long-span bridges over its many waterways. It has also used precast flat slab bridges for federal highway system projects. LDOTD reports that though these bridges do not provide the service life of their CIP counterparts, they are easier to construct in remote areas. While the state’s soil conditions preclude precasting longer girder spans, standardization would be possible for shorter spans. Contractors often request that crane mats be used on the top of the structure, so a standard element that accounts for crane loads would be ideal. The department plans to continue using ABC techniques in the future.

7
Maine: The Maine DOT (MaineDOT) has completed several ABC projects in recent years. Acceptance is high, and standardization of elements might help lower precasting costs by encouraging fabricators to invest in standard forms for bridge elements. Maryland: The Maryland DOT (MDOT) has completed several projects using ABC techniques in recent years and has experienced no significant problems. The major bar to further use is the lack of technique testings.
Massachusetts: The Massachusetts DOT (MassDOT) has not completed any ABC projects but is interested in implementing pilot projects to become familiar with techniques. Standardized elements would be useful in reducing the need to develop custom details, and unfamiliarity could be offset by learning about standardized elements that have been successful in other locations. Michigan: The Michigan DOT (MDOT) has some experience with ABC methods; it completed projects designed to use ABC concepts and projects accelerated by the contractor. Standardization could make ABC methods more accessible to designers and would help contractors gain meaningful experience, helping to lower costs and improving quality in the long run. Minnesota: The Minnesota Department of Transportation (MnDOT) has completed approximately 20 projects using ABC techniques. Acceptance is good. In MnDOT design-bid-build projects, the contractor proposes ABC, and use is generally approved. Value Engineering (VE) proposals are also considered during construction. Standardization of elements would help but not substantially. While UHPC addresses precast connection issue, it is expensive and requires a high level of contractor and supplier expertise. MnDOT is participating in a National Cooperative Highway Research Program (NCHRP) project to define tolerances for precast elements and design criteria for lateral slides and self-propelled modular transport (SPMT) moves. Mississippi: ABC is only applied selectively at this point, reserved for emergency reconstruction or projects with special conditions, such as emergency access or site constraints. MDOT senior management must be convinced of the advantages of acceleration and would appreciate having a catalog of ideas to choose from rather than prescriptive standards when trying to decide whether or how to pursue an ABC project. Missouri: The Missouri DOT (MoDOT) cited various examples of recent ABC deployment. Although these projects alleviate traffic constraints, they are much more expensive than conventional approaches and must be used judiciously.
Montana: The Montana DOT (MDT) has completed only one ABC project: the Highway 89 Pondera County Marias River Crossing, which used a GRS-IBS abutment system. The design included a wall radial edge as opposed to the more common straight edge design and was an on-site adjustment. The block required for the abutments was made to order, and the manufacturer was not equipped to produce rounded-edge blocks. MDT is still conducting research on GRS-IBS systems.

8
Nebraska: The Nebraska Department of Roads (NDOR) has not used ABC methods on any completed projects but completed its first GRS-IBS bridge with folded plate girders for a local agency in Boone County, finishing the project within 30 days in 2014. The GRS abutment was built in 15 days, including excavation, to support the 58 ft single-span, modular decked, beam superstructure. Recently, bridge elements have been accelerated. NDOR does not perceive a need for ABC, so it is not widely accepted, and its applications have been limited. However, contractors have used discretionary methods to accelerate construction, such as more man-hours. Standardizing elements is seen as a way to both lower costs and increase the quality and durability of finished bridge projects. Nebraska is currently studying the use of precast deck panels and heavy lifting of remotely assembled superstructure modules. Nevada: The Nevada DOT (NDOT) has experience in using SPMTs, the bridge-slide technique, and precast arches. ABC is widely accepted when it is used for the right application, but the decision is left up to the contractor. Several NDOT projects have used GRS-IBS abutments and fully prefabricated superstructures. New Hampshire: Although successful ABC projects are noted, the New Hampshire DOT (NHDOT) staff said not enough people at the agency were interested in ABC as a project delivery tool. They had no questions about its effectiveness, just insufficient motivation to evaluate. The University of New Hampshire continues to conduct research in the area. ABC is generally accepted, but when given the option, contractors seem reluctant to use it. When considered feasible and appropriate, projects are engineered to use ABC techniques, rather than leaving the decision to the contractor. New Jersey: The New Jersey DOT (NJDOT) provided an extensive interview focused mainly on impediments. ABC has not taken hold because NJDOT engineers, particularly project managers, do not think it is a solution in many situations, based on their past experience and that of other NJDOT units. The agency is generally risk- averse, and ABC raises the level of risk associated with a project. If risk is not shown to be manageable, the concept will not gain traction, and it has not. NJDOT recognizes the need to study and update the user-cost model and its application, but it has no mechanism to screen or to choose projects for ABC and no systematic approach. New Mexico: The New Mexico DOT (NMDOT) has completed approximately 10 projects in recent years. ABC is moderately accepted, and standardizing elements would help. Two projects used a full-depth precast deck panel system, and one used precast pier caps, abutment caps, and wingwalls. New York: The New York State DOT (NYSDOT) completed at least 10 projects using ABC methods, and although ABC is the exception rather than the rule, more and more ABC techniques are gaining acceptance, especially in the region around New York City. Projects are generally designed to use ABC, but contractors also submit substitution proposals opting to use ABC methods. Standardization would be less effective because the most beneficial applications tend to be less standard, such as projects in urban areas. Several pilot projects used UHPC for joints between precast components, deck bulb-tee beams for one bridge, and full-depth precast deck panels for another. NYSDOT is investigating fatigue in precast element joints. On June 17, 2015, it successfully placed a 1,100-ton assembly of three curved steel girders between two concrete piers near the Tappan Zee Bridge’s Rockland County side, which took about four hours to complete.
9
North Carolina: The North Carolina DOT (NCDOT) has recently completed several ABC projects, including 24-hours-a-day construction to replace seven bridges on Ocracoke Island in 90 days. The Washington Bypass project employs an innovative construction gantry that allows complete construction of a new viaduct from the top without any intrusion into environmentally sensitive areas. NCDOT has selection criteria for ABC projects and has discussed a role for the Alternative Project Delivery Unit, which typically enables innovation in several ways: as a proposal from the contractor in design-build contracts, an as-designed solution for special projects, and a VE proposal. NCDOT is currently exploring the use of mechanically stabilized earth (MSE) abutments and GRS-IBS to expedite foundation construction. North Dakota: The North Dakota DOT (NDDOT) has completed no ABC projects, and the level of acceptance is low. Nonetheless, the decision to use ABC is left up to the contractor. Ohio: The Ohio DOT (ODOT) has created “permitted lane-closure maps” that define which highway lanes can be closed for construction. ABC is used to reduce closure time in more urban corridors; projects are designed to fit set time frames in accordance with the maps, and contractors are forced to use ABC practices, though they are free to decide which practices they use. Standardization is not necessary because contractors specialize in certain construction practices. ODOT has experience with precast elements as well as SPMT roll-ins. In a first for the state, it used slide-in bridge construction to replace the I-75 bridges over U.S. 6 in Bowling Green in 2015. Traffic was disrupted for just a weekend instead of the months replacing a bridge typically takes. Oklahoma: None reported. Oregon: The Oregon DOT (ODOT) has completed 8 projects in the past 5-10 years using ABC techniques. Support for ABC is high, and practice is shifting from contractor-employed ABC techniques to DOT-designed ABC projects. Pennsylvania: The Pennsylvania DOT (PennDOT) has used precast elements and SPMTs several times over the past 5 years. ABC is considered in every project, but the decision is left up to the contractor unless ABC promises a clear advantage, in which case PennDOT will engineer the project to use it. Past efforts at standardization have not translated into profits for contractors. Once ABC methods become more mainstream, costs and risks are predicted to decrease to the point where their use will be economical. PennDOT is not currently implementing ABC methods on any project but is involved in research on structural details that could be applied to ABC in the future. Rhode Island: The Rhode Island DOT (RIDOT) replaced I-95 over Route 2 in halves using SPMT and prefabricated approach slabs in August 2014. The work took half the time of conventional construction and, prior to installation, had no impact on interstate traffic. South Carolina: None reported. South Dakota: The South Dakota DOT (SDDOT) most recently completed an ABC project in 2001 using SPMT to move a steel-truss superstructure to its abutments. The bridge spanned a railroad yard, so

10
closures and outages had to be kept to a minimum. ABC is viewed favorably if project conditions warrant it. Interest in using ABC methods to construct jointless decks of adequate length for little or no increased cost is high. Tennessee: The Tennessee DOT (TDOT) has completed one project in recent years that incorporates ABC methods. ABC is always considered for bridge projects but not often used. Standardized elements are considered to be useful along with proven installation and serviceability records. Texas: The ratio of incentives to disincentives impedes further use. For example, low-bid contractors might not be able to perform ABC, but a suggested solution was to select the contractor who offers the best value, not the lowest bid. Project size is also an important consideration. Since most candidate bridges are either small or medium-sized, contractors will not have time to become efficient in the new methods on an individual project. In addition, precast components used for bridge substructures are only practical when several are needed or the available access makes CIP difficult. Contractors would like to choose whether or not to use ABC, so the Florida approach, laying out the requirements and specifications that have to be met, might be effective. Utah: In 2010, The Utah DOT (UDOT) standardized ABC. Senior management unanimously supports it, and project selection criteria frequently lead to its use, rather than traditional methods. Presently, UDOT is delivering its ABC program through a combination of design-build contracts and a method known as Construction Manager/General Contractor (CM/GC), both of which have proven successful. At the same time, it is developing ABC standards for such modules as deck panels, precast substructures, and new prestressed beam sections. These standards will increase the flexibility to let contracts using various mechanisms and to communicate ABC intentions to the design and construction community. Once ABC standards become available for engineers to use in creating as-designed plans, UDOT will explore their use in more conventional design-bid-build contracts. Precast elements offer another opportunity for cost savings in substructure construction. During the early phases of implementation, contractors showed reluctance. UDOT held a series of workshops and scan tours to learn from other agency practices, and some contractors made changes to their business practices to compete in the ABC arena. Successful contractors have demonstrated a willingness to get into the precasting business. Projects let to date have demonstrated a 5:1 – 6:1 ratio of user-costs saved to construction-costs incurred, and with repetition, costs have decreased. Recent bridge project lettings indicate that full-depth precast decks are competitive with, and occasionally less expensive than, traditional CIP concrete decks and include time and quality savings. Vermont: The Vermont DOT (VDOT) acceptance of ABC is generally good, and at least 5 projects using ABC methods have been completed in recent years. Projects are typically engineered to use ABC, but Vermont is considering the Florida approach, which allows the contractor to decide how to meet VDOT design specifications. VDOT is also investigating incentive/disincentive clauses to encourage contractors to use ABC. Virginia: None reported. Washington: The Washington DOT (WashDOT) has completed various ABC projects using traditional design-bid-build procurement and redesigning structures to accommodate ABC approaches. Projects

11
included complete bridge prefabrication and large-scale prefabrication of superstructure and substructure elements. In general, the use of prefabrication and ABC techniques did not seem to affect project quality but had a beneficial impact on safety. WashDOT does not specifically require that user impacts be considered components of project cost but has used incentive/disincentive clauses to motivate project completion. West Virginia: The West Virginia DOT (WVDOT) has completed at least 5 projects in the past several years that were designed to use ABC. Incentive/disincentive clauses were designed to motivate contractors to develop ABC approaches. WVDOT would benefit from ABC specifications and is interested in methods that minimize environmental disruption. Wisconsin: The Wisconsin DOT (WisDOT) is just beginning to implement ABC practices. Its first project re-decked a major structure with a full-depth precast deck panel system. The level of support for ABC is not very high since the practice is new there and not well established. WisDOT is funding research on precast substructure units and looking for opportunities for a demonstration project (Wisconsin Highway Research Program - 0092-15-02 - Evaluation of Performance of Innovative Bridges in Wisconsin - Iowa State University, PI). Wyoming: The Wyoming DOT (WYDOT) has completed several projects involving precast elements and decked bulb-tees for country road bridges. ABC is generally well accepted and used where appropriate. Seeing the design standards used by other states would lead to more use in Wyoming.
2.1.2 Impediments The impediments to ABC are widely noted. Many states cited increased cost as a major factor discouraging its use. Alabama: Alabama cited increased manpower and other costs. Alaska: ADOT&PF reported that the high initial cost of using a new technology is a major impediment. Contractor inexperience and the overall conservatism of the state are also hindrances. Arizona: Currently, ADOT is facing questions about connection durability. Funding for ABC is limited, and contractors are inexperienced. Arkansas: The primary concern is high initial costs. Incentives to use ABC are limited, and no active program is using ABC. California: Caltrans is concerned about how precast pier elements will stand up to earthquakes; long- term durability; and elevated initial cost. The cost of ABC is widely known to exceed that of CIP, and although its time savings is also greater, Caltrans considers time secondary to financial savings. Colorado: The high cost of ABC is the primary impediment, although it has become standard practice. Connecticut: None reported.

12
Delaware: DelDOT noted higher initial costs and longer hours for construction workers, which posed a problem for the contractors who have to pay them. Florida: Though ABC is highly accepted in Florida, many impediments were noted; for example, lack of staging space for SPMTs in urban areas and inexperienced contractors. During the design phase, site traffic constraints must be accounted for since traffic maintenance and phased construction have posed problems. FDOT tries to balance out the higher ABC costs with user costs. Georgia: GDOT is experiencing some of the same problems as other states, especially higher cost, but interest in using ABC, especially prefabricated bridge elements and PBES, is growing. Hawaii: The only impediment is encouraging governing agencies to use ABC, although not for all bridge construction projects. These agencies fail to consider such factors as the use of temporary detours when bridges are being replaced or repaired. Idaho: None reported. Illinois: The main hindrances are higher cost expectations and that user costs are difficult to quantify. Indiana: The lack of overall knowledge and proper pricing methods are impediments.
Iowa: Despite high acceptance generally, some contractors are reluctant to adopt ABC because they believe it is less profitable where traffic volumes are low. They believe ABC is too complex and are discouraged by low incentives. Higher level management supports the use of ABC wherever warranted, yet in some cases, production-level engineers find ABC design slow and frustrating. Standard plans and shapes might ease the design process and allow reuse to save money.
Kansas: The biggest obstacle is the cost difference between ABC and CIP methods. CIP bridges have fewer joints and are therefore cheaper and easier to maintain over time.
Kentucky: None reported. Louisiana: None reported. Maine: Cost is the biggest impediment; precast elements generally cost more than casting in place. Maryland: None reported. Massachusetts: Since MassDOT has not completed any ABC projects, general lack of familiarity with ABC is a major impediment. Contractors have a conservative CIP culture, but increased exposure through pilot projects should overcome it. More experience with ABC may also diminish concerns about financial risk.

13
Michigan: The main hindrances are cost, constructability, and quality/performance. Life-cycle cost analyses with accurate accounting of public benefit would be useful for addressing higher costs, and constructability and quality concerns can be addressed by more experience in completing ABC projects. Minnesota: Contractors are concerned about higher cost and that the reduced timeframes will mean tired, overworked staff. It is difficult to decide to use ABC methods late in the design phase. Mississippi: MDOT is reluctant to use precast columns or footings based on concerns about connection durability and would welcome development of durable connections for these precast elements. They also do not use integral abutments due to concern about approach-slab connection details. Missouri: MoDOT is concerned about durability and seismic activity and is working with local university partners for assistance in advancing ABC. Montana: Low traffic volume is the main impediment. Interest in GRS-IBS systems is growing, but the overall perception is that ABC is not needed now. Nebraska: ABC is primarily hindered by higher costs. Contractors are hesitant to use precast elements because of the amount of work that would have to be subcontracted. Urban areas are associated with higher user-delay costs, but the user costs on lower traffic roads and rural routes do not warrant ABC. Nevada: The main concern is connection durability in case of seismic activity and questions about the efficiency of ABC methods and elements. New Hampshire: NHDOT indicated that opportunities where acceleration appears justified are few. It also reported that the Epping project, one of its successful ABC projects, was 2.2 times more expensive than a conventional bridge replacement, and until the cost premium can be cut by at least 25% or less, promoting ABC will be difficult. Contractors hesitate to use the new technology and want to keep their own employees working rather than subcontracting work to precasters. New Jersey: When NJDOT tried to accelerate earlier projects, their own construction engineering department was reluctant to support the schedule. Schedules are frequently lengthened based on traditional practices. The traffic operations staff also impeded prior efforts, allowing only short closure windows, which prolongs projects. The NJDOT incentive-disincentive opportunity is tied to computation of roadway-user costs, which are typically very low and do not justify acceleration. Designers are reluctant to suggest innovative approaches because they think NJDOT will not accept them. They have no incentive to be creative, and the state does not procure contracts requiring innovative design and construction solutions. New Mexico: NMDOT considers accelerated techniques for every bridge project, but problems were noted on NMDOT’s first full-depth precast deck panel project, the 2013 Eagle Draw Bridge renovation on NM 13. According to the report, the precast deck panels cost approximately 2.5 times the CIP system based on the bidder’s prices. The primary pay items for the precast deck panels were the prestressed, posttensioned concrete; the 8.5-inch precast deck panels; and the epoxy urethane overlay used to create a

14
smooth driving surface and to seal the joints between panels. If the job was done using CIP methods, the primary pay items would have been the concrete in which the deck would have only been 8 inches and epoxy-coated rebar. As one of only two such projects constructed by NMDOT, fabricators, contractors, and designers had no prior experience with full-depth, precast deck panels. The shop drawings for the precast deck panels, twice the number required for CIP construction, went through 5 iterations and took 4 months to be approved. In terms of fabrication, the bridge deck had a crown down the center, which meant one panel could not be used across the entire width, and closure pours had to be used at the abutments, piers, and down the center, causing the exposed rebar from the deck panels to come in contact with the rebar from the closure pours. The rebar then had to be field bent to avoid the adjacent reinforcement and shear studs on the prestressed girders. In addition, the precast deck panels had to be moved transversely over the width of the bridge because the posttensioning ducts in adjacent panels did not line up. This uneven alignment was noticeable along the edges of the deck. The strength of the precast girders was questionable, and since the girders had to be set up before the deck panels, the entire project was slowed. As far as construction was concerned, the contractor could only shut down NM 13 for 60 calendar days, but it could not be shut down until all precast elements were fabricated and accepted by NMDOT. Fabrication took longer than expected, so the contractor decided to close NM 13 at his own When the bridge was closed for over 120 days, the contractor was assessed penalties.
New York: Since the state is so heavily developed, staging is a particular problem. Construction costs are also an impediment; specifically, the use of precast, prefabricated elements and offsite construction using roll-in methods. NYSDOT was also concerned about the durability of precast component connections and joints. Local contractors resist using extensive prefabrication because of the large project share subcontracted out to specialists. North Carolina: None reported. North Dakota: The primary concerns are high cost, connection details, and the low level of support for ABC in the state. Ohio: ABC costs more inevitably but are balanced by user costs when ABC is used on bridges with high average daily traffic (ADT) and relatively high importance to public transportation. Oklahoma: None reported. Oregon: In addition to the elevated initial costs, connections for seismic activity presented a major problem. Connections in seismic zones must withstand a much higher transverse loading and dynamic, repetitive loading. Most common connections have not been tested under lab conditions simulating seismic forces. Once the testing is completed, peer-reviewed, and reported, ODOT will have more confidence that connections of precast columns, footings, and pier caps can safely withstand the high horizontal and vertical uplift common in seismic events. Pennsylvania: Contractors are generally unwilling to assume the additional associated risks with ABC. Because they are inexperienced, they have to subcontract work, which leads to inflated bids.

15
Rhode Island: None reported. South Carolina: None reported. South Dakota: SDDOT is another state with low traffic volumes, so user costs do not balance the cost of ABC. Tennessee: Questions about the durability and quality of precast members and connections, specifically attaching precast bridge decks to beams, impede ABC use. Texas: The funding structure in the Texas DOT (TxDOT) provides no owner incentive to use rapid renewal methods other than staged construction. TxDOT districts may use only 5 percent of the project’s cost and no more than 25 percent of road-user delay costs for incentives. Although road-user costs are considered, the owner has no way of collecting any savings from them. Therefore, if additional funds are spent to reduce road-user costs, fewer funds will be available for other projects. Federal grants to owners, based on the value of savings, would help them to capture savings from user costs and promote rapid construction projects. Moreover, the incentive amount must be sufficient to pay for the additional construction crews and/or special construction equipment needed for ABC and still result in profit. As an alternative, consider milestones with no-excuse bonuses. If the contractor can complete construction without excuses, then he or she is awarded a bonus but will be most likely to submit the bid assuming no bonus will be awarded. Utah: At the outset of the ABC program, internal middle management was the biggest obstacle, particularly its conservatism, as in New Jersey. Convincing consultants, designers, and the contracting industry of ABC’s merits was easier than convincing DOT staff. However, across the business, the core groups willing to try new things prompted a decision, and UDOT moved aggressively to implement trial projects. It still has some unanswered questions and sees areas for improvement; for example, in specifications, connection details and durability, seismic detailing, design considerations for moving structures, and acceptable deformation limits during movement. Nevertheless, UDOT is moving forward with ABC as a standard delivery mechanism. Vermont: Vermont does not experience high traffic volumes, so road-user costs are often too small to create meaningful incentive/disincentive clauses in contracts that would encourage ABC projects. A way to incorporate savings from ABC methods, such as eliminating the need for temporary bridges, into incentive/disincentive clauses might change the picture. Virginia: None reported. Washington: None reported. West Virginia: West Virginia contractors are inexperienced in ABC, and the state does not have a precasting industry or heavy-lift contractors. Contractors would probably use ABC standards, so ABC specifications and sample contracts would prove useful.
16
Wisconsin: Contractors using ABC techniques in a project are most concerned about making money. Training would be beneficial. Wyoming: With lower traffic counts, the main impediment to ABC implementation is justifying the higher costs.
2.2 INDUSTRIAL SURVEYS
The research team contacted various contractors around the country who had experience with ABC. It wanted to know what types of problems they encountered during the construction or design process and how they were resolved. Hugh Boyle Engineering: Hugh Boyle Engineering (HBE) reported that the biggest problem on design-bid-build projects was modifying the original designer’s details to fit an alternate ABC option or making the original ABC design easier to construct. According to this engineer, whether the owner and/or original engineer will accept HBE-proposed revisions is normally unknown, so HBE prefers design-build projects.
In HBE’s experience, ABC designs try to emulate a traditional design as opposed to looking for alternative methods. For example, a bridge would be designed to use a lateral slide, yet its abutments would be designed to be fully integral because the owner wants to use a fully integral bridge. The solution would be to design a semi-integral system.
Precast element connections are also a concern. One of the most common problems is tolerances that are either too tight or unrelated to any functional requirements. Bridge flexibility is not recognized. Flexibility affects how loads are transmitted to equipment or supports used to move the bridge, which is especially serious for SPMT moves where the hydraulic system must balance structural loads.
HBE has also noticed a disconnection between acceptable tolerances and methods used to slide bridges. A specification may allow an elevation difference of up to 1/8" over 10' of a slide slab. A system can be designed to accommodate a significantly greater difference, but some systems need less tolerance. For example, on most of its slides, HBE uses only two supports per abutment because they are determinant. If one support goes up a little, its load barely changes due to a slight twisting of the structure between abutments; these systems can accommodate much more than 1/8" per 10'. However, when designers use a series of very stiff rollers under relatively stiff superstructures that require much less than the 1/8" tolerance, they still use the original 1/8" specs. With more than 2 supports, the system becomes indeterminate, and roller reactions are very sensitive to roller elevation. On these systems, a 1/8" variance over 10 feet might cause the entire bridge to rock over the high point, essentially putting all the load on a single point, which can be dangerous when the designer assumes that the loads will be evenly distributed over 5 supports. HBE is not actively working on any ABC projects; they have a lateral slide under contract, but the owners are considering cancelling due to budget constraints.
Kraemer North America: Kraemer North America, a privately held general contractor from Wisconsin, has had plenty of experience using ABC in various transportation and rail projects that included such methods as incremental launching, superstructure roll-in, transverse slides, and superstructure float-ins. The most

17
common prefabricated bridge components they used were precast bent caps, columns, abutments, and full-depth panels. Further details on their experience in specific ABC projects are being sought.
Mammoet: Mammoet does not design or build bridges; they specialize in moving them with SPMTs. They are called in when an ABC project may need to use the skid or transverse-sliding method. A project manager explained, “We install our transporters underneath the prefabricated bridge and lift the drive, drive away with it, and install it in its final location. We design the support structure on top of our trailers but not the actual bridge. The engineer that designs the bridge already takes into account the fact that the bridge will be driven away. He also checks whether the supports that are under the bridge, will not damage the bridge, etc.” McFarland Johnson: McFarland Johnson (MJ) is another contractor with ABC experience. One project was the I-93 Exit 14 bridge in Bow-Concord, NH. MJ was involved in the initial phase and studied alternatives for improving the safety, mobility, and capacity of the I-93 bridge. After evaluation, it determined that ABC would be the best option for replacing the bridge. Each half of the superstructure was replaced within a 60-hour period. MJ used full-depth, precast concrete deck panels with high-early concrete and longitudinal posttensioning for long-term durability. MJ believes that ABC’s advantages will provide future benefits.
2.3 SUMMARY
Survey results for owners and contractors show the following impediments to ABC:
Higher costs;
Inexperience with the techniques;
Constructability concerns about connection details, congestion of rebar around joints, and staging area;
Resistance to innovation; and
Design-bid-build contracts. We learned that contractors prefer CIP construction for bridge renewals because the large prefabricated elements diminish their profits (Sivakumar 2014). Moreover, ABC involves a new technology, and contractors prefer to keep their own employees working instead of subcontracting work to precasters. Possible solutions to these and other impediments to ABC adoption are:
Introduce the industry to precast technology and demonstrate its profitability;
Use pre-engineered modular systems that can be built with conventional construction equipment, enabling local contractors to bid on rapid replacement projects;
Bundle several bridge projects with similar requirements into a single construction contract, allowing a local contractor to get more benefits from repetition; and
Use full-moment connections with UHPC, which will satisfy the criteria for constructability, structural requirements, and durability in prefabricated modular superstructure systems.

18
CHAPTER 3. ABC DECISION-MAKING TOOLS The ABC decision-making tools is a section devoted to provide guidance on when to use ABC versus conventional bridge construction. If ABC is found to be the most efficient type of construction, then this section will also serve as a guide as to which ABC method is deemed most appropriate for a specific project.
Appendix F presents a Decision Making Matrix, an ABC Decision Flowchart, and a Decision Making Scoring Chart and descriptions of items that can be used in conjunction with one another to answer whether to use ABC or conventional methods.
The Decision-Making Matrix in Appendix F may be used to determine how applicable ABC is for a specific project. This matrix is utilized by tallying up the total amount of points next to each section and finding the overall score for a project. Each of the sections listed in the Decision Making Matrix is explained in further detail within the Decision Making Scoring Guidance which is also located in Appendix F. After a total score is determined from the Decision Making Matrix, that score is then used to enter the Decision Making Flowchart at the appropriate location. The Decision Making Flowchart is designed to help the user make an intelligible decision on whether ABC or a conventional method is the best decision for the project. Once the correct scoring location is determined the question “Do the overall advantages of ABC negate any additional costs?” is to be answered. These additional costs may include schedule, traffic impacts, funding, road user costs (RUC), etc. This question is to be answered on project-specific basis taking into consideration all engineering components and professional judgement, and also the available project information. This question is a part of the Decision Making Flowchart in order to assist the user of the Decision Making Tools in analyzing and making an intelligent decision on whether ABC is in fact the best form of construction for a project. After answering this question and concluding that ABC is in fact the best method, the part of the Decision Making Flowchart afterwards will help guide the user to the best form of ABC for the project.
These Decision Making Tools can help to provide insight into which method would be deemed most efficient, however they are not considered to give an exact answer. After reviewing the outcome from the Decision Making Tools it is up to the user to decide whether ABC does in fact make the most sense for the specific project at hand. There is no definitive answer provided upon the completion of the Decision Making aspect of ABC versus Conventional, it is up to the user’s better judgement.
The Decision Making Flowchart can incorporate a variety of resources that are pertinent which may include (but are not limited to) “Program Initiatives”, like research needs, local resources, input from the public, requests of stakeholders, or structure exhibits. These items should be considered on a project-specifics basis.
While the Decision Making Flowchart is designed to lead the user to the best method for ABC, it should be noted that there is room to combine methods listed at the bottom of the flowchart (i.e. PBES, GRS-IBS).

19
CHAPTER 4. ABC DESIGN CONCEPTS This chapter presents current developments in ABC design that can be used for future projects in Georgia. It should be noted that ABC projects use innovative designs that are also compatible with innovative construction techniques because they are highly interrelated. ABC design strategies have the following goals (SHRP2 2014):
As light as possible This concept improves the load rating of existing foundations and piers, and can simplify the transportation and erection of bridge components.
As simple as possible To achieve this goal, it is recommended to reduce the number of certain elements, such as girders, field splices, and bracing systems.
As simple to erect as possible Fewer workers and fresh-concrete operations on site are desirable. Additionally, geometry needs to be simple.
The following sections discuss design considerations and concepts for prefabricated systems in detail.
4.1 MODULAR SUPERSTRUCTURE SYSTEMS
Pre-engineered standards include the concrete and steel girders under modular superstructure systems. When researchers evaluated new construction techniques, technologies, and bridge systems, including lab testing, deck bulb tees and decked steel stringer systems received the highest scores, reflecting what has been used in the field for rapid renewal. Due to the quality of the prefabricated superstructure, high-performance concrete, and attention to different connections, the modular system is predicted to have a 75- to 100-year service life. Modular superstructure standards for steel and concrete will include:
● Decked steel stringer system; ● Composite steel tube girder system; ● Concrete deck bulb tees; and ● Deck double tees.
4.1.1 Decked Steel Stringer System Like concrete deck girder systems, the decked steel stringer system has proven quite economical and quick to construct (See Fig. 4.1). The use of a modular decked steel system for ABC has become quite popular with states that employ rapid construction techniques.
When compared to precast concrete units, the modular steel system is much lighter, easier to construct, less expensive and easier to fabricate. Each aspect of the system, including the length and weight of the module, can be tailored to suit the particular mode of transportation and erection methods for each case. Conventional construction equipment can usually be employed to erect these steel units, and UHPC is used for closure pours to connect each unit.

20
(a) (b) (c)
Figure 4.1. Decked Steel Stringer System. (a) Steel grid open or filled with concrete (photo: D.S. Brown Co.). (b) Full-depth precast deck panels with and without longitudinal post-tensioning (FHWA, 2015). (c) Partial-depth precast deck panels (photo: Keegan Precast on project in UK by contractor Laing O’Roruke).
Standard designs of common span lengths will assist in gaining acceptance and more widespread
use for modular concepts. Full moment connections are preferred in steel girder systems for the same reason they are in concrete girder systems. In many cases, an integral wearing surface, with a thickness between 1.5 in. and 2 in., can be built with the deck to assist in future surface replacements without damaging the structural deck slab.
4.1.2 Composite Steel Tub Girder System Composite steel tub girder superstructures can be built in the shop in large scale, transported to the site, and then erected by assembling the pieces together with a minimal need of formwork. (See Figs. 4.2 and 4.3). If there is enough room adjacent to the project site, decks can be cast on site. In addition, these systems can be fabricated as longitudinal sections that can be erected piece wise and assembled together using in-place posttensioning, or they can be fabricated as full-width deck systems that can be erected in a single piece.
Trapezoidal steel box girders are very suitable for this type of large construction. They offer light, cost-effective solutions while providing structural efficiency during transportation, erection, and service life. Trapezoidal box girders building blocks can be designed with a single box, two boxes, or as many as needed to complete the width of deck. Twin tub girders, however, are the most popular standard. These bridges can be designed and constructed to function as simple spans or continuous structures. Several connection details are available and can be used to provide continuity for dead and live loads, either as standard splice construction procedures or specific details applicable to the particular situation on the site.
(a) (b) (c) Figure 4.2. (a) Steel tub girder (photo: Greg Price, DHS Discussion Forum). (b) Concrete tub girder (photo:
StressCon Industries, Inc., website). (c) Open trapezoidal composite box girder (photo: SteelConstruction.info).

21
Figure 4.3. Composite Steel Tub Girder (SHRP, 2014).
4.1.3 Precast Concrete Deck Bulb Tee and Double Tee Conventional precast concrete girders have been perfected and used all over the United States for more than 50 years. Owners and contractors use these types of bridges because they are easy and economical to build and maintain. In most cases, the girders are used with a CIP deck built on site. For ABC, the major difference is that the girders will now have integral decks, eliminating the need for CIP (See Fig. 4.4). This concept of precast decked girders has increased in popularity in several states, but is not used all over the country. The integral wearing surface, which is typically 1.5 in. to 2 in. thick, can be built monolithically or in addition to the deck slab. In the future, the wearing surface concrete can be removed and replaced while preserving the structural deck slab. The precast deck bulb tee girders and double tee girders combine the benefits of eliminating the time it takes to make CIP decked superstructure along with the positive attributes of precast girder construction. This ABC approach should be easily adopted by experienced contractors if they have prior knowledge of conventional precast girder construction.
(a) (b) (c) Figure 4.4. (a) Adjacent deck bulb tee beams (FHWA, 2015). (b) Adjacent double tee beams (FHWA, 2015). (c)
NEXT beam (drawing on High Steel Structures LLC website).
Utah, Washington, and Idaho have proven and standardized deck bulb tee and double tee girders. The Precast/Prestressed Concrete Institute (PCI) Northeast developed the northeast extreme tee (NEXT) beam, a variation of the double tee, to serve the ABC market. This deck girder is expected to be competitive with girder and CIP deck systems. It may also be beneficial for sites where deck-casting operations are constrained. CIP closure pours are typically used to connect girders in the field. These girder flanges can be made to different widths to fit site and transportation requirements.

22
4.1.4 Pre-Topped Trapezoidal Concrete Tub Beams Pre-topped trapezoidal concrete tub superstructures have been developed using TxDOT U beams for spans up to 115 ft, which can be transported and erected in one piece. Standards for this system, usually, would be developed to cover span ranging from 60 to 175 ft, with no more than five standard cross sections (See Fig. 4.5). There are two options to construct pre-topped U beams: 1) Spans 60 to 115 ft, transported and erected in one piece; and 2) Spans 60 to 175 ft, transported in 10 ft long, and posttensioned on site. The following design concepts can be considered for pre-topped U beams:
The use of available standard U sections can minimize fabrication costs. Design can be improved to use high-performance materials to reduce weight. Lengths less than 115 ft produce sections under 150 tons for shipment in one piece. Units would be designed to handle transportation and erection stresses. An overlay can be provided with this system and still allow the bridge to be opened within 4
days of the beginning of superstructure erection. Limit the number of standardized sections to 5. Provide two or three suggested methods of erection, such as cranes, launching, and overhead
gantries. Edge sections of deck with curb pieces to allow bolting of prefabricated barriers.
Figure 4.5. Cross Sections of Pre-topped, Trapezoidal, Concrete U Beams (SHRP2, 2014).
4.1.5 Full-Depth Precast Concrete Deck Systems Full-depth precast concrete deck systems allow the bridge to be reopened to traffic faster, as CIP concrete is needed only at the joints between the prefabricated panels (see Fig. 4.6). The CIP joints can also be replaced by match cast joints, which can save time and efforts. The match cast joints method uses each segment matching cast against its adjacent segment to form a precision fit. The joint width between the installed segments is very small, and any gaps are taken up with epoxy paste. Eliminating the CIP joints with match cast joints accelerates the schedule considerably. The addition of post-tensioning does not increase the time of construction because the posttensioning is required to extrude the epoxy on match cast joints and occurs simultaneously. NCHRP Report 584 (Badie and Tadros 2008) addresses the optimum benefits and opportunities of full-depth precast concrete deck panels.
A fully composite connection between the concrete deck panels and the steel or prestressed concrete girders are the primary concern for a precast deck panel system. There have been several research for the use of higher-capacity shear studs and innovative construction. Full-depth concrete deck panels offer a number of innovative opportunities as listed below:
Durable transverse panel connection for staged construction. One possibility for this application is the use of UHPC, which has been successfully used by NYSDOT.
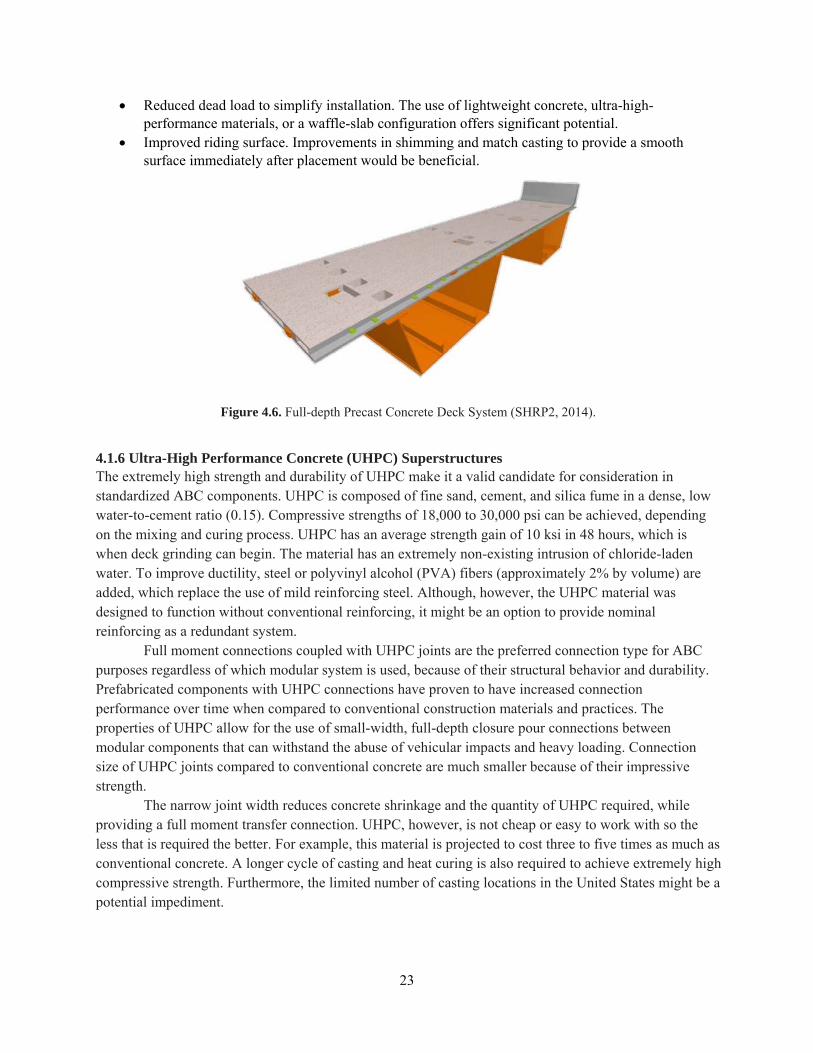
23
Reduced dead load to simplify installation. The use of lightweight concrete, ultra-high-performance materials, or a waffle-slab configuration offers significant potential.
Improved riding surface. Improvements in shimming and match casting to provide a smooth surface immediately after placement would be beneficial.
Figure 4.6. Full-depth Precast Concrete Deck System (SHRP2, 2014).
4.1.6 Ultra-High Performance Concrete (UHPC) Superstructures The extremely high strength and durability of UHPC make it a valid candidate for consideration in standardized ABC components. UHPC is composed of fine sand, cement, and silica fume in a dense, low water-to-cement ratio (0.15). Compressive strengths of 18,000 to 30,000 psi can be achieved, depending on the mixing and curing process. UHPC has an average strength gain of 10 ksi in 48 hours, which is when deck grinding can begin. The material has an extremely non-existing intrusion of chloride-laden water. To improve ductility, steel or polyvinyl alcohol (PVA) fibers (approximately 2% by volume) are added, which replace the use of mild reinforcing steel. Although, however, the UHPC material was designed to function without conventional reinforcing, it might be an option to provide nominal reinforcing as a redundant system.
Full moment connections coupled with UHPC joints are the preferred connection type for ABC purposes regardless of which modular system is used, because of their structural behavior and durability. Prefabricated components with UHPC connections have proven to have increased connection performance over time when compared to conventional construction materials and practices. The properties of UHPC allow for the use of small-width, full-depth closure pour connections between modular components that can withstand the abuse of vehicular impacts and heavy loading. Connection size of UHPC joints compared to conventional concrete are much smaller because of their impressive strength.
The narrow joint width reduces concrete shrinkage and the quantity of UHPC required, while providing a full moment transfer connection. UHPC, however, is not cheap or easy to work with so the less that is required the better. For example, this material is projected to cost three to five times as much as conventional concrete. A longer cycle of casting and heat curing is also required to achieve extremely high compressive strength. Furthermore, the limited number of casting locations in the United States might be a potential impediment.

24
4.1.7 Connections between Modules The ease and speed of construction of a prefabricated bridge system in the field have direct correlation to its acceptance as a viable system for rapid renewal. ABC construction time is greatly influenced by the speed with which the connections between modules can be assembled. Connections between modular segments can also affect live load distribution characteristics, seismic performance of the superstructure system, and the superstructure redundancy. Connections play a crucial role when designing with this approach. Often, the time to develop a structural connection is a function of cure times for the closure pour. Joint detail and number are crucial to the speed of construction, to the overall durability and the amount of long-term maintenance the final structure will require. The use of CIP concrete closure joints should be kept to a minimum for accelerated construction methods due to placement, finishing, and curing time.
To enhance load transfer, prevent cracks under live loads and close shrinkage, the use of induced compression in post-tensioned joints is favored. The post-tensioned joints can present a female-female shear key arrangement infilled with grout or match-cast with epoxied joints, but only if precise tolerances can be maintained throughout the lifetime of the bridge. This process will provide long-term performance. Post-tensioning requires an additional step and complexity during on-site construction, therefore, its use may slow down field assembly and compromise long-term durability which makes it unfavorable for ABC.
Design considerations for connections between deck segments include:
● Full moment connections that can be built quickly. ● At least as durable as the precast deck. ● Joints that can suit heavy, moderate, and light truck-traffic sites. ● Ride quality that is at least equal to CIP decks. ● Durability even without overlays on the deck. An integral wearing surface consisting of an extra
thickness of concrete over the structural slab can help. ● Post-tensioned connections can be an alternative for ABC construction. ● Details that can accommodate slight differential camber between neighboring modules. ● Quick strength gain, so that traffic can be opened with very little delay.
4.1.8 Summary of Design Considerations for Modular Superstructures Design considerations for modular superstructure systems include:
Pre-engineered standards for modular construction. Designs that can be used for most sites with minimal bridge-specific adjustments.
Optimize designs for ABC and use of high-performance materials. Simplicity and efficiency of design, availability of sections, and short lead times are key considerations.
Usually length ≤140 ft, weight ≤100 tons, width ≤8 ft for transportation and erection using conventional construction equipment.
Able to accommodate moderate skews. For rapid renewal, it would be more beneficial to eliminate skews between bents and the longitudinal axis of the bridge.
Segments designed for transportation and erection stresses, including lifting inserts. Sweep of longer beams should not be an issue for erection as there is an opening between the beams.

25
Segments that can be installed without the need for cross frames or diaphragms between adjacent segments. This improves speed of construction and reduces costs. Use of diaphragms is optional based on owner preference.
Segments that can be used in simple spans and in continuous spans (simple for dead load and continuous for live load). Details to eliminate deck joints at piers. Details for live load continuity at piers to be included for use as required.
Use of high-performance materials: High Performance Concrete (HPC)/UHPC, High Performance Steel (HPS), or A588 weathering steel. Consider lightweight concrete for longer spans to reduce weights of deck segments.
Deck tees and double tees with minimum 8-in. flange to function as decks with integral wearing surface so that an overlay is not required. Use of overlay is optional.
Cambering of steel sections for longer spans. Control fabrication of concrete sections, time to erection, and curing procedures so that camber differences between adjacent deck sections are minimized. Leveling procedure to be specified to equalize cambers in the field during erection.
Deck segments when connected in the field should provide acceptable ride quality without the need for an overlay. Deck segments to have ¼-in. concrete overfill that can be diamond ground in the field to obtain a desired surface profile.
Limit the number of standardized designs for each deck type to five, which should cover span ranges from 40 ft to 140 ft. Consider steel rolling cycles and sections widely available.
Segments designed to be used with either full moment connection between flanges or with shear-only connections. Each flange edge needs to be designed as a cantilever deck overhang.
Design for sections that can be transported and erected in one piece. Lengths up to 140 ft may be feasible in certain cases. Provide one method of erection. (Spans longer than 140 ft may be erected by shipping the segments in pieces, splicing on site, and using a temporary launching truss for erection.)
Design for sections that can be transported in pieces and spliced on site before erection to extend spans to 200 ft and beyond. Develop two alternate erection techniques when conventional lifting with cranes may not be feasible due to weight or site constraints.
Edge sections of deck with curb piece ready to allow bolting of precast barriers.
Provide standard details for durable connections between deck segments.
4.2 MODULAR SUBSTRUCTURE SYSTEMS
A significant portion of the on-site construction time is dedicated to building the substructure. Reducing the time for substructure work is critical for all rapid renewal projects. Precasting as much of the substructure as possible will allow for faster construction of the bridge and reduce interference with normal system operation. With this in mind, this section provides details about modular systems for abutments, wingwalls, and piers that are commonly used in routine bridge replacements. These standards include the following:
Precast modular abutment systems. See Fig. 4.7(a).
Precast complete pier systems. See Fig. 4.7(b)
Hybrid drilled shaft/micropile foundation systems. See Fig. 4.7(c).
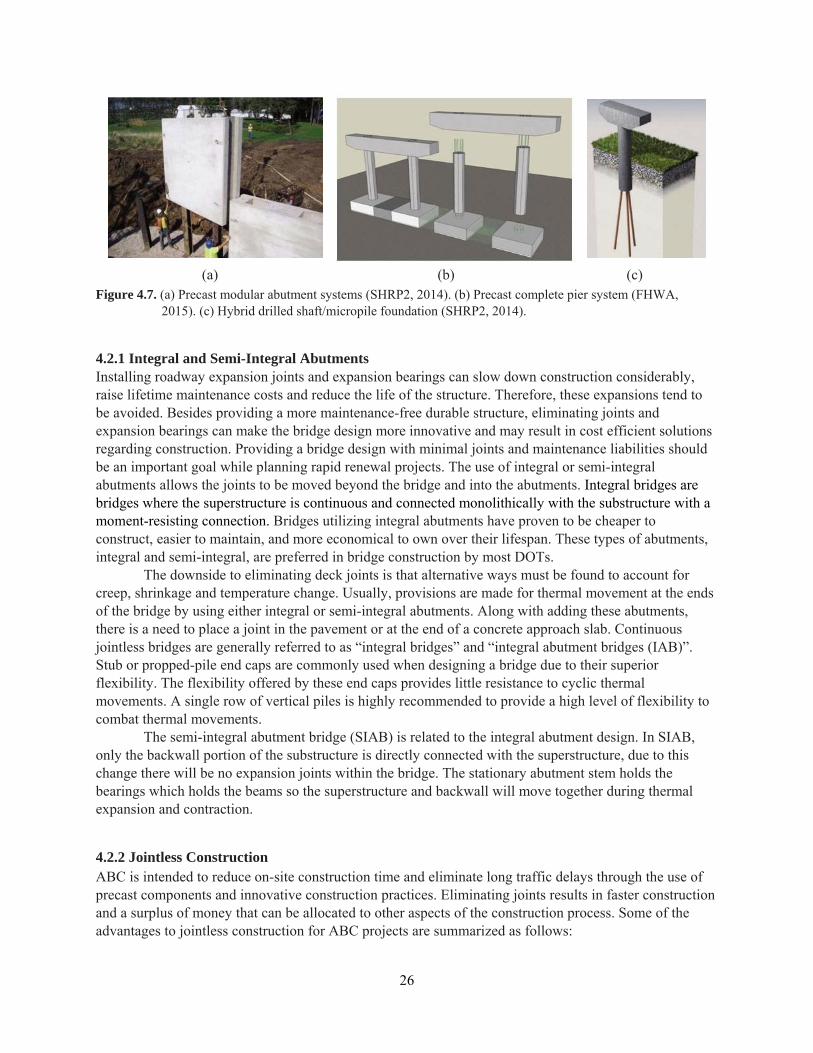
26
(a) (b) (c) Figure 4.7. (a) Precast modular abutment systems (SHRP2, 2014). (b) Precast complete pier system (FHWA,
2015). (c) Hybrid drilled shaft/micropile foundation (SHRP2, 2014).
4.2.1 Integral and Semi-Integral Abutments Installing roadway expansion joints and expansion bearings can slow down construction considerably, raise lifetime maintenance costs and reduce the life of the structure. Therefore, these expansions tend to be avoided. Besides providing a more maintenance-free durable structure, eliminating joints and expansion bearings can make the bridge design more innovative and may result in cost efficient solutions regarding construction. Providing a bridge design with minimal joints and maintenance liabilities should be an important goal while planning rapid renewal projects. The use of integral or semi-integral abutments allows the joints to be moved beyond the bridge and into the abutments. Integral bridges are bridges where the superstructure is continuous and connected monolithically with the substructure with a moment-resisting connection. Bridges utilizing integral abutments have proven to be cheaper to construct, easier to maintain, and more economical to own over their lifespan. These types of abutments, integral and semi-integral, are preferred in bridge construction by most DOTs.
The downside to eliminating deck joints is that alternative ways must be found to account for creep, shrinkage and temperature change. Usually, provisions are made for thermal movement at the ends of the bridge by using either integral or semi-integral abutments. Along with adding these abutments, there is a need to place a joint in the pavement or at the end of a concrete approach slab. Continuous jointless bridges are generally referred to as “integral bridges” and “integral abutment bridges (IAB)”. Stub or propped-pile end caps are commonly used when designing a bridge due to their superior flexibility. The flexibility offered by these end caps provides little resistance to cyclic thermal movements. A single row of vertical piles is highly recommended to provide a high level of flexibility to combat thermal movements.
The semi-integral abutment bridge (SIAB) is related to the integral abutment design. In SIAB, only the backwall portion of the substructure is directly connected with the superstructure, due to this change there will be no expansion joints within the bridge. The stationary abutment stem holds the bearings which holds the beams so the superstructure and backwall will move together during thermal expansion and contraction.
4.2.2 Jointless Construction ABC is intended to reduce on-site construction time and eliminate long traffic delays through the use of precast components and innovative construction practices. Eliminating joints results in faster construction and a surplus of money that can be allocated to other aspects of the construction process. Some of the advantages to jointless construction for ABC projects are summarized as follows:

27
● Issues with tolerances are reduced. The close tolerances required when using expansion bearings and joints are eliminated by using integral abutments. Minor mislocation of the abutments does not create problems with the final fit of the bridge.
● Rapid construction. With integral abutments, only one row of vertical (not battered) piles is used and fewer piles are needed. The backwall and superstructure can be cast together with less forming. This reduces the amount of materials needed, and thus reduces the cost of the project. Fewer issues are encountered with scheduling between suppliers and manufacturers. Integral abutment bridges are faster to erect than bridges with expansion joints, which leads to cost savings. IABs are quicker to construct because the connections involved are simple to form, and there are no expansion joints to slow down construction.
● Reduced removal of existing elements. Integral abutment bridges do not require the complete removal of existing substructures, and can actually be built around existing foundations. Reducing the amount of demolition entailed with the construction process will greatly reduce the overall duration of the project.
● No cofferdams. Integral abutments are generally built with capped pile piers or drilled shaft piers that do not require cofferdams.
● Improved ride quality. Jointless bridges provide a very smooth ride and diminish the impact stress a car experiences. This translates to lower impact loads and, for snow prone areas, less deck damage due to snowplows.
● Integral abutments provide an added element of redundancy in components and capacity for many types of catastrophic events. When seismic events are considered in designs, a significant amount of material can be cut from the design by using integral abutments which do not need enlarged seat widths and restrainers. Integral abutments completely eliminate the loss of girder support, which has proven to be the most common cause of bridge damage in seismic events. The presence of joints creates a much higher potential collapse risk of the overall bridge structure. In the past, integral abutments have consistently outperformed standard CIP bridges during actual seismic events, and have shown very minimal problems with backwall and bearing damage that are associated with seat-type jointed abutments.
4.2.3 Precast Abutments and Wingwalls Bridge abutments are constructed in several different pieces off site in a factory, shipped to the construction site and then put together in the field (See Fig. 4.8). ABC construction companies have preferred an integral connection of the superstructure and substructure. The different components that are being shipped on site should be designed to be transported over roads and constructed using typical construction equipment. To this point, the precast components are made as light as practicable. Voids can be used in the wall sections of larger elements. This is to reduce their weight and facilitate their fabrication and shipment. Voids are also used to attach drilled shafts or piles to the cap for stub-type abutments. Once the components are constructed into place, the voids and shear keys are filled with self-consolidating concrete. Wingwalls are also precast with a formed pocket to slide over wingwall piles or drilled shaft reinforcing. Once this process has been completed, the wingwall pockets are filled with high early strength concrete or self-consolidating concrete.

28
(a) (b) (c)
Figure 4.8. (a) and (b) Precast modular abutment systems. (c) Precast wingwall (SHRP2, 2014).
4.2.4 Connections CIP construction can be eliminated by full-moment connections between modular substructure components. The closure pours are constructed using self-consolidating concrete which makes them easy to construct and results in a highly durable connection. Self-consolidating or self-compacting concrete (SCC) is used to enclose or encapsulate congested reinforcements. This is due to the fact that SCC is highly flowable and non-segregating. It fills formwork without the need to employ any mechanical vibration. SCC is also an ideal material to fill pile pockets in substructure components. This kind of concrete mix can be placed purely by means of its own weight, with little or no vibration. SCC allows easier pumping, flows into complex shapes, transitions through inaccessible spots, and minimizes voids around embedded items to produce a high degree of uniformity.
4.2.5 Precast Complete Piers
Precast complete piers consist of separate components premade off site, shipped, and fabricated onsite (See Fig. 4.9). Piers with single-column and multiple-column configurations are common. Foundations can consist of drilled shafts, which can be extended to form the pier columns. When soil conditions are appropriate, precast spread footings can be employed. However, if soil conditions do not permit these footings, driven piles may be used with precast pile caps. Pier columns are attached to the foundation by grouted splice sleeve connectors. Precast columns can be square or octagonal, the tops of which are connected by grouted splice sleeves to the precast cap. The precast cap is typically rectangular in shape. The pier bents may have single or multiple columns.
States in high seismic regions use integral pier caps. However, the standards in this project were developed only for non-integral piers, which have been found to present more benefits in rapid construction. When using integral pier cap connections, CIP concrete is commonly used. However, the connection can also be made with precast concrete, but it often requires a complicated and lengthy procedure. There are also tight controls over tolerances and grades so the most common form of connection is a CIP concrete closure pour. In a non-integral pier cap, the superstructure and deck will be continuous and jointless over the piers which makes them easier to reuse.
As it is the case with precast modular abutments, the precast piers have been designed to be shipped from the fabrication location to the construction site. To this point, the precast components are made as light as practical for shipping purposes. Precast spread footings can consist of partial precast or complete precast components. To avoid localized point loads, a grout-filled void will be formed beneath the footing to transfer the load to the soil. Column heights and cap lengths will be limited by transportation regulations and erection equipment, but these cap length limitations can be avoided by forming multiple

29
short caps that will function as a single pier cap would. Precast bearing seats can also be used for pier design.
Figure 4.9. Precast Concrete Pier (SHARP2, 2014).
4.2.6 Hybrid Drilled Shaft/Micropile Foundation Systems A hybrid system is composed of conventional drilled shaft and clusters of micropiles, whereby the upper portion (10 to 20 ft) of the deep foundation is constructed by conventional drilled shaft and the lower portion of the shaft is composed of micropiles. Above grade, the drilled shaft is extended to serve as a circular pier column, eliminating pile cap foundation construction. Below grade, the drilled shaft portion of the hybrid foundation need to extend only to the depth required by design, with due consideration of flexural demands and extreme events relating to scour and seismic design.
Micropile foundation systems have several advantages for ABC. One is the possibility to use low-cost, small-footing, all-terrain drilling rigs for installation, and to employ segmented 5 to 12 in. nominal diameter high-strength steel casings that allow for rapid installation in low head-room conditions. Another advantage associated to the use of micropiles is a reduced construction risk, since a failed micropile can simply be abandoned and replaced with a closely adjacent one.
4.2.7 Steel or Fiber-Reinforced Polymer (FRP) Jacket System for Existing Column Jacketing has been used to extend the life of bridge columns that may suffer from significant spalling due to corrosion of reinforcing steel, or for columns that must be upgraded for seismic considerations. External jacketing is used to provide the desired level of confinement without the need for expensive, time-consuming replacement. The concept of column jacketing can be used not only as a retrofit for providing additional capacity, but also as a means for accelerated construction without on-site formwork.
The use of steel or FRP jacket systems has achieved success for retrofitting and strengthening of existing concrete piers for many years (See Fig. 4.10). These jacket systems offer a number of advantages for accelerated construction:
Prefabricated shell components can be easily standardized in a variety of commonly used shapes and sizes.
Easy transportation and erection on site.

30
No on-site formwork to be constructed and stripped.
Suitable for use with all foundation types, including footings and drilled shafts.
(a) (b) (c) Figure 4.10. (a) Steel/FRP jacket concept (SHRP2, 2014). (b) Steel jacketed bridge column (Nelson, 2012). (c)
FRP jackets in several bridge columns (Buccola, 2011).

31
CHAPTER 5. RISK ANALYSIS The risk-assessment component of the toolkit enables the user to determine how to best convey surface water (if applicable) and storm water runoff in order to minimize damage to the roadway, bridge itself, and other property. This process starts by helping the user decide if a culvert or bridge is most appropriate for the site. If a culvert is selected, the toolkit assists in helping the user select the culvert’s shape, material, and initial size. If a bridge crossing is most appropriate, the toolkit provides the user with information as how the hydrologic and hydraulic considerations influence the bridge foundation investigation (BFI) and scour analysis components of the bridge design.
5.1 THE ROLE OF RISK IN CULVERT AND BRIDGE DESIGN
Since rainfall events are governed by chance, historical rainfall information and statistical analysis are used to estimate the magnitude of different storm events over different return periods (example: 50 year storm). Knowing this information about a storm, along with information about the physical attributes of the watershed (area, slope, soil type, vegetation cover, percentage of impervious surfaces) allows us to predict how much water will drain from the watershed and eventually drain through the culvert or under the bridge.
Risk is a measure of the probability of occurrence multiplied by the cost associated with repairs/replacement caused by the event. Since a storm’s return period (20 year, 50 year, etc.) is inversely related to probability that the storm will occur that year, there is a direct relationship between the storm period and risk. While larger return periods have lower probabilities of occurrence, the tradeoff is that they also have higher construction costs. For example, using a return period at 20 years (probability of equaling or exceed the storm is 1/20 or 5%) might result in a project with a low initial construction project cost but with frequent repair or replacement costs. Conversely, using a large return period of 200 years (probability of equaling or exceed the storm is 1/200 or 0.5%) can result in an overly designed project with an excessive construction cost. Since the selection return period requires careful consideration of several factors (potential damage to highway and property as a result of flooding, potential hazards and inconveniences to the public, and project costs) GDOT specifies the required return periods (flood frequency) that should be used for both culverts and bridges (GDOT, 2014):
Culverts for state routes and interstate highways shall be designed using a 50 year flood frequency.
Bridges for state routes and interstates shall be sized so that a 50 year flood is conveyed only through the bridge opening and the 100 year flood is conveyed through the bridge opening and over the roadway.
5.2 CHOOSING BETWEEN A CULVERT AND A BRIDGE CROSSING
Culverts are closed conduits that covey surface water or storm water runoff from one side of a road to the other side. They play a key role in preserving the road base by preventing water from overtopping the road surface and by keeping the sub-base dry by draining water from ditches along the road. Whereas bridges use the bridge deck, superstructure (beams, girders), and substructure (abutments, piers) to

32
support vehicle loads, culverts rely on the structural properties of the conduits and the embankment material covering them and to support these loads.
In cases in which the toolkit user needs to decide between using a culvert or bridge crossing, the following guidelines should be applied: Cases in which a bridge crossing is recommended:
Area draining to the crossing exceeds 20 miles2 (12,800 acres). Cases in which the surface water canal is navigable. Cases in which the water area at the crossing is undefined. If the crossing point is located near an area where flow back up behind the culvert could flood
residential areas (Ministry for the Environment, 2004). If high debris loads (gravel, trees, logs) passing below the roadway are likely. Cases in which the hill catchments is steep (rule of thumb value is 6% or larger) (Ministry for the
Environment, 2004). When the required culvert size (with minimum soil cover) exceeds the elevation difference
between road and canal or drain.
Conversely, culverts can be used when:
Area draining to the crossing does not exceed 20 miles2 (12,800 acres). Surface water is limited or not present. The water area is well defined (i.e. easily be routed through the culvert). Cases in which large debris will not pass below the roadway. Cases in which any flow backup will not flood adjacent areas.
5.3 SELECTING A CULVERT TYPE AND SIZE
A culvert’s shape (Fig. 5.1 for common shapes) and material depends on site-specific characteristics including: the elevation difference between road and canal or drain (available soil height), required span, and bearing capacity of the soil. Other important factors include: material and installation cost, needs of fish and other aquatic organisms, and local preferences. Circular (pipe), box, and arched culverts similar to the ones shown in Fig. 5.2 are most commonly used.
Figure 5.1. Common Culvert Shapes (Purdue University, 2005).
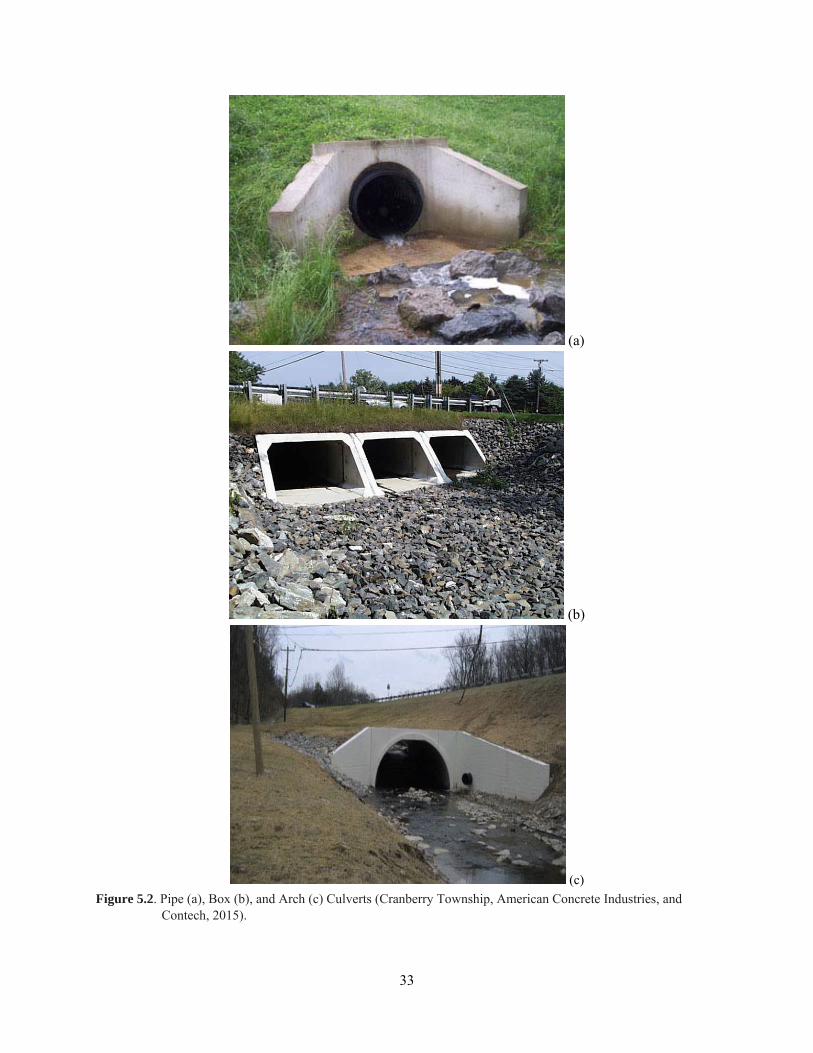
33
(a)
(b)
(c)
Figure 5.2. Pipe (a), Box (b), and Arch (c) Culverts (Cranberry Township, American Concrete Industries, and Contech, 2015).
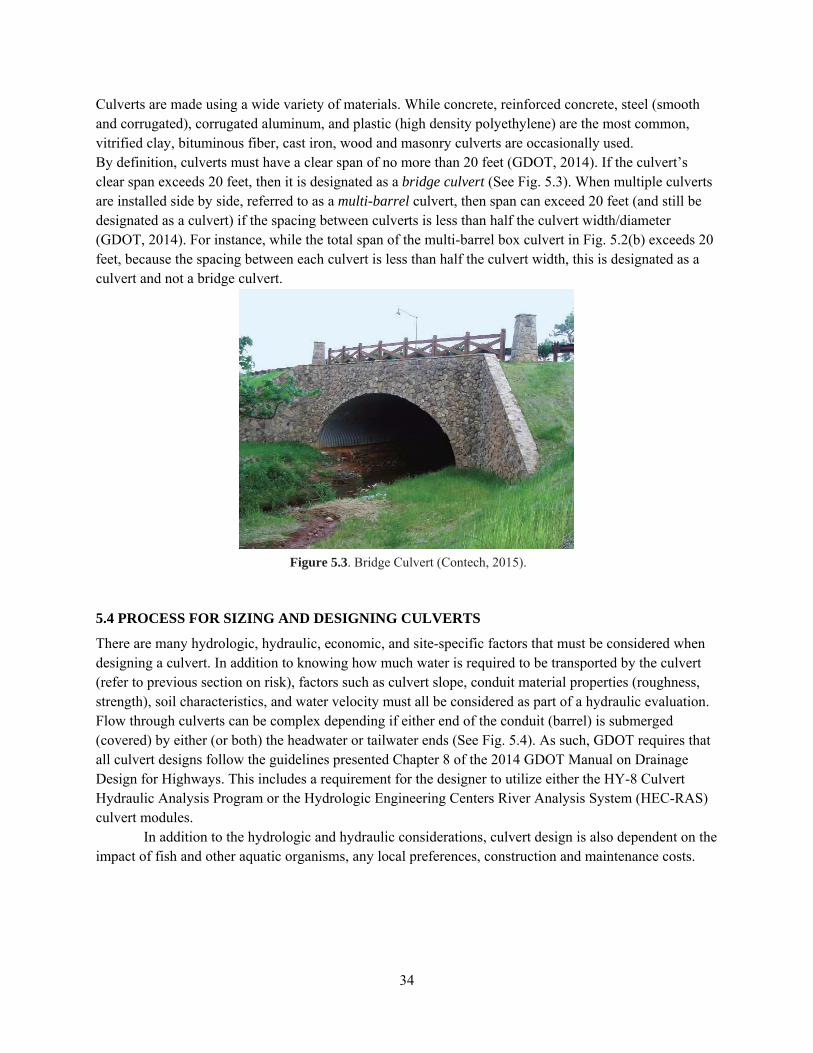
34
Culverts are made using a wide variety of materials. While concrete, reinforced concrete, steel (smooth and corrugated), corrugated aluminum, and plastic (high density polyethylene) are the most common, vitrified clay, bituminous fiber, cast iron, wood and masonry culverts are occasionally used. By definition, culverts must have a clear span of no more than 20 feet (GDOT, 2014). If the culvert’s clear span exceeds 20 feet, then it is designated as a bridge culvert (See Fig. 5.3). When multiple culverts are installed side by side, referred to as a multi-barrel culvert, then span can exceed 20 feet (and still be designated as a culvert) if the spacing between culverts is less than half the culvert width/diameter (GDOT, 2014). For instance, while the total span of the multi-barrel box culvert in Fig. 5.2(b) exceeds 20 feet, because the spacing between each culvert is less than half the culvert width, this is designated as a culvert and not a bridge culvert.
Figure 5.3. Bridge Culvert (Contech, 2015).
5.4 PROCESS FOR SIZING AND DESIGNING CULVERTS
There are many hydrologic, hydraulic, economic, and site-specific factors that must be considered when designing a culvert. In addition to knowing how much water is required to be transported by the culvert (refer to previous section on risk), factors such as culvert slope, conduit material properties (roughness, strength), soil characteristics, and water velocity must all be considered as part of a hydraulic evaluation. Flow through culverts can be complex depending if either end of the conduit (barrel) is submerged (covered) by either (or both) the headwater or tailwater ends (See Fig. 5.4). As such, GDOT requires that all culvert designs follow the guidelines presented Chapter 8 of the 2014 GDOT Manual on Drainage Design for Highways. This includes a requirement for the designer to utilize either the HY-8 Culvert Hydraulic Analysis Program or the Hydrologic Engineering Centers River Analysis System (HEC-RAS) culvert modules.
In addition to the hydrologic and hydraulic considerations, culvert design is also dependent on the impact of fish and other aquatic organisms, any local preferences, construction and maintenance costs.
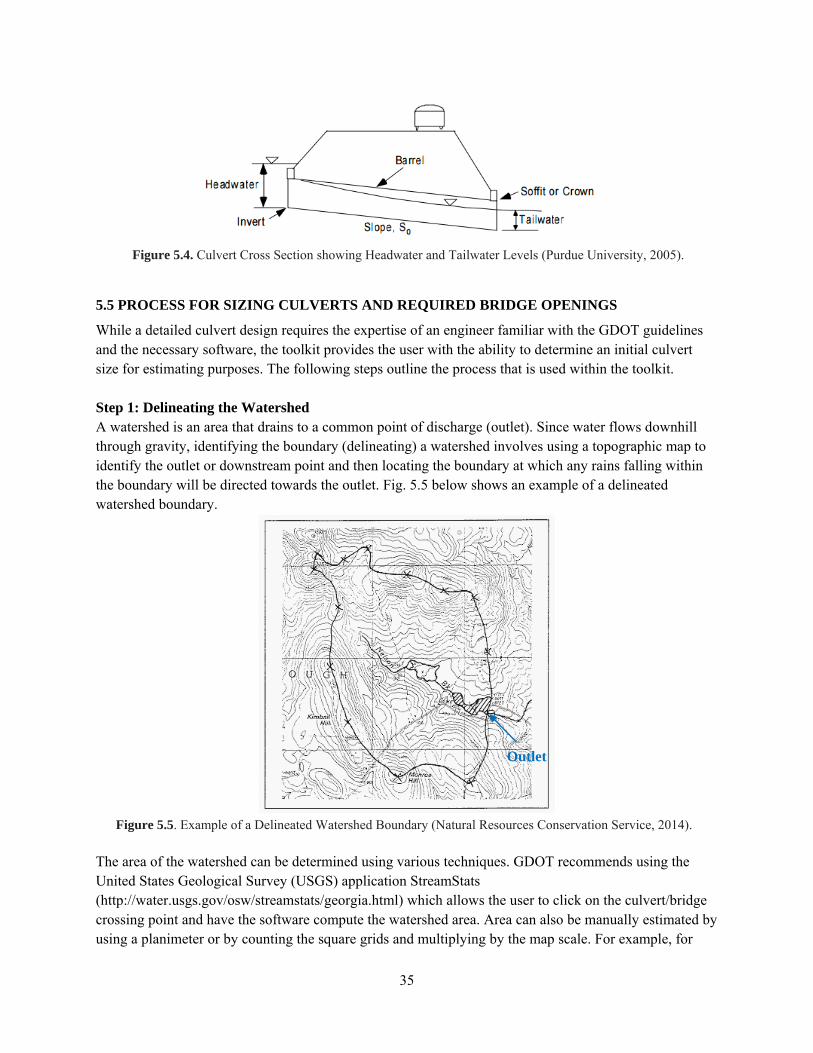
35
Figure 5.4. Culvert Cross Section showing Headwater and Tailwater Levels (Purdue University, 2005).
5.5 PROCESS FOR SIZING CULVERTS AND REQUIRED BRIDGE OPENINGS
While a detailed culvert design requires the expertise of an engineer familiar with the GDOT guidelines and the necessary software, the toolkit provides the user with the ability to determine an initial culvert size for estimating purposes. The following steps outline the process that is used within the toolkit. Step 1: Delineating the Watershed A watershed is an area that drains to a common point of discharge (outlet). Since water flows downhill through gravity, identifying the boundary (delineating) a watershed involves using a topographic map to identify the outlet or downstream point and then locating the boundary at which any rains falling within the boundary will be directed towards the outlet. Fig. 5.5 below shows an example of a delineated watershed boundary.
Figure 5.5. Example of a Delineated Watershed Boundary (Natural Resources Conservation Service, 2014). The area of the watershed can be determined using various techniques. GDOT recommends using the United States Geological Survey (USGS) application StreamStats (http://water.usgs.gov/osw/streamstats/georgia.html) which allows the user to click on the culvert/bridge crossing point and have the software compute the watershed area. Area can also be manually estimated by using a planimeter or by counting the square grids and multiplying by the map scale. For example, for
Outlet

36
maps with a 1:24,000 scale (1 inch represents 2,000 feet) one square grid represents 4 million square feet or 91.8 acres). At a scale of 1:24,000, the map shown in Fig.5.5 would have an approximate area of 3.5 squares or 321 acres. Step 2: Determining Peak Flow If a gauge is installed at the outlet (refer to Fig. 5.5) to record the flow passing through this point over the duration of a storm, the resulting graph (referred to as a hydrograph) would have a shape similar to the one shown in Fig. 5.6. The peak flow (Qp) is highest point on the hydrograph, representing the largest flow rate. This flow occurs at the time to peak (tp) which is the time at which the entire watershed is contributing to the runoff.
Figure 5.6. Example Hydrograph.
There are several commonly used methods for determining peak runoff. The primary differences between each method relates to: i) the assumptions inherent to each method and ii) the required data (slope, vegetation cover, etc.). Accordingly, the methods presented in this manual (and used within the toolkit) where selected based on their wide acceptance and ease of use. While these methods are acceptable for an initial estimate of culvert or bridge opening sizes, an actual culvert design requires a more detailed hydrologic and hydraulic design as specified in the 2014 GDOT Manual on Drainage Design for Highways. Method 1: USGS Regression Equations One option for estimating flow is to apply the regression equations developed by the USGS which take into account the watershed and climatic characteristics within 5 hydrologic regions within the state (See Fig. 5. 7). While the USGS has separate equations for rural and urban watersheds (urban watersheds have impervious areas of 10% or greater), because the urban equations can only be applied to 4 regions within Georgia and require parameters such as mean basin slope and percent developed land which are often not readily available, the toolkit uses the equations for rural watersheds. These equations are shown in Table
0
20
40
60
80
100
120
140
160
0 24 48 72 96 120 144 168 192
Flo
w (
ft3/
s)
Time (hr)
Qp
tp

37
5.1 for eight different return periods (2 500 years) for all five regions within Georgia with watershed areas between 1 and 9,000 miles2. Note that the Table 5.1 equations can only be applied to a watershed that is entirely within one hydrologic region.
Figure 5.7. Map of the Georgia Flood Frequency Regions (USGS, 2008). Table 5.1. Regression Equations for Estimating Peak Flow in Rural
Ungauged Areas that are Entirely Within One Hydrologic Region (USGS, 2009)
Return Period (years)
Regression Equations for Peak Flow (ft3/s) in all Hydrologic Regions (DA: Drainage area in square miles)
1 2 3 4 5 2 158(DA)0.649 110(DA)0.779 25.7(DA)0.758 60.3(DA)0.649 91.2(DA)0.649 5 295(DA)0.627 209(DA)0.749 44.7(DA)0.744 123(DA)0.627 200(DA)0.627
10 398(DA)0.617 288(DA)0.736 58.9(DA)0.740 174(DA)0.617 295(DA)0.617 25 537(DA)0.606 398(DA)0.724 77.6(DA)0.736 245(DA)0.606 447(DA)0.606 50 661(DA)0.600 479(DA)0.718 91.2(DA)0.735 309(DA)0.600 575(DA)0.600
100 776(DA)0.594 575(DA)0.713 105(DA)0.733 380(DA)0.594 724(DA)0.594 200 891(DA)0.589 661(DA)0.709 120(DA)0.733 447(DA)0.589 891(DA)0.589 500 1,072(DA)0.583 794(DA)0.704 138(DA)0.732 550(DA)0.583 1,148(DA)0.583
For watersheds located within multiple regions, the 2009 USGS manual provides a separate set of

38
equations that can be applied. As an example, equations for peak flow for 50 and 100 year storm events are given as:
10 . . . . . . . .
, 10 . . . . . . . .
where Qp50, Qp50 = Peak flow for the 50 and 100 year storm event, and PCT1, PCT2, etc. = Basin percentages in hydrologic regions 1, 2, etc. As an example, a 130 miles2 watershed spanning region 2 (90 miles2) and region 3 (40 miles2) would have PCT1 of 69.2% and PCT2 of 30.8% respectively. Using the equation shown above for the 50 year event, the peak flow would be 9,710 ft3/s. Method 2: Rational Method For cases in which the watershed is clearly urban and less than 200 acres (0.3 miles2) in area the Rational Method can be applied to estimate peak flow. The area limitation is primarily due to the assumption that the rainfall intensity is constant over the entire basin for a duration of time equal to or greater than the time of concentration. It also assumes that the runoff coefficient (C) is constant during the storm event. The formula estimates the peak flow at any location within the watershed as a function of drainage area, runoff coefficient, and rainfall intensity for a duration equal to the time of concentration (defined as the time required for water to flow from the most remote point in the watershed to the location being analyzed). In equation form:
Qp = CIA where Qp = peak flow (ft3/s); C = runoff coefficient (dimensionless); I = rainfall intensity (in/hr); and A = drainage area (acres). Runoff Coefficient (C) The runoff coefficient is a unit less number between 0 and 1 that relates the rate of runoff to the total rainfall. The more covered and impervious the land is (such as pavement) the closer to 1 the C value becomes. The coefficient is highly dependent on several factors including: land use, ground slope, topography, and soil factors influencing the rainfall infiltration into the soil. Table 5.2 shows the recommended runoff coefficients for flat, rolling, and hilly terrains. This table corresponds to storms of 5 year to 10 year frequencies. For higher year storms, the coefficients shown in Table 5.2 should be adjusted by multiplying the coefficients by the frequency adjustment factors (fa) shown in Table 5.3. For example, the runoff coefficient for apartment homes located in a flat area for a 50 year storm event would be calculated as:
. 50 ∗ 1.25 0.625 In cases in which there are several different types of surfaces within the drainage area, a composite (weighted) coefficient can be computed by using the percentages of the different land uses. This is done by using the following equation:
⋯
where C1, C2, etc. = runoff coefficients for surface 1, 2, etc.; and A1, A2, etc. = areas 1, 2, etc.
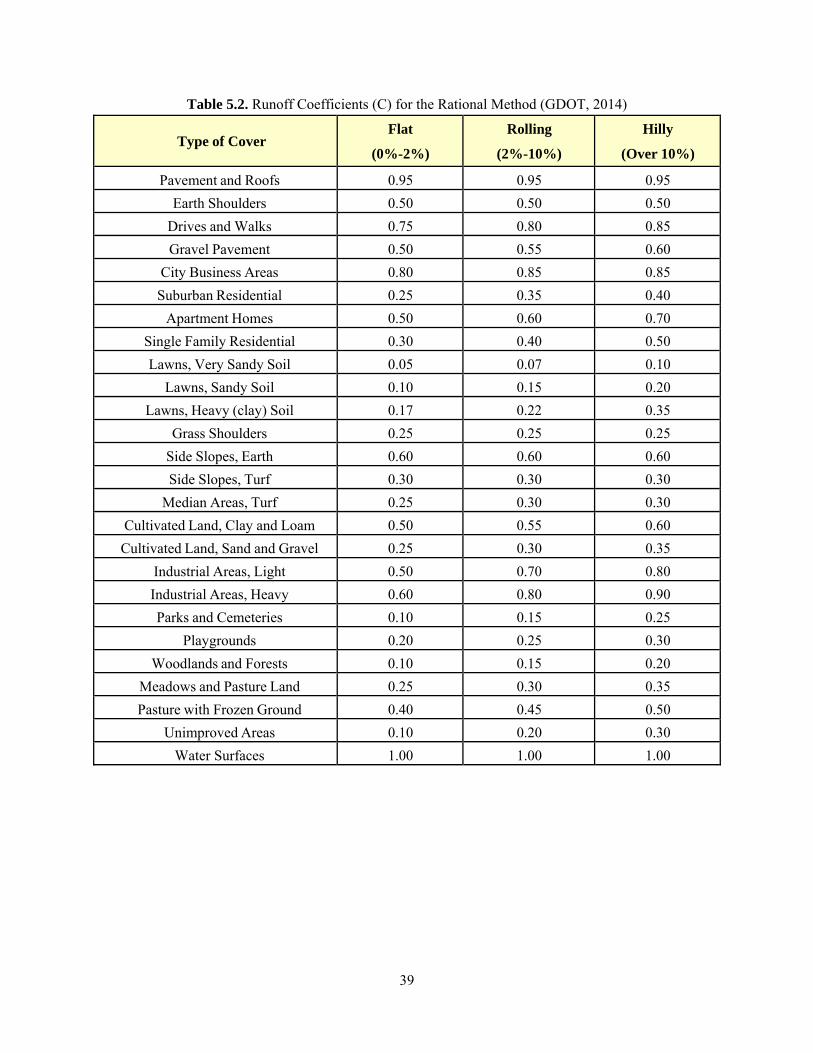
39
Table 5.2. Runoff Coefficients (C) for the Rational Method (GDOT, 2014)
Type of Cover
Flat
(0%-2%)
Rolling
(2%-10%)
Hilly
(Over 10%)
Pavement and Roofs 0.95 0.95 0.95
Earth Shoulders 0.50 0.50 0.50
Drives and Walks 0.75 0.80 0.85
Gravel Pavement 0.50 0.55 0.60
City Business Areas 0.80 0.85 0.85
Suburban Residential 0.25 0.35 0.40
Apartment Homes 0.50 0.60 0.70
Single Family Residential 0.30 0.40 0.50
Lawns, Very Sandy Soil 0.05 0.07 0.10
Lawns, Sandy Soil 0.10 0.15 0.20
Lawns, Heavy (clay) Soil 0.17 0.22 0.35
Grass Shoulders 0.25 0.25 0.25
Side Slopes, Earth 0.60 0.60 0.60
Side Slopes, Turf 0.30 0.30 0.30
Median Areas, Turf 0.25 0.30 0.30
Cultivated Land, Clay and Loam 0.50 0.55 0.60
Cultivated Land, Sand and Gravel 0.25 0.30 0.35
Industrial Areas, Light 0.50 0.70 0.80
Industrial Areas, Heavy 0.60 0.80 0.90
Parks and Cemeteries 0.10 0.15 0.25
Playgrounds 0.20 0.25 0.30
Woodlands and Forests 0.10 0.15 0.20
Meadows and Pasture Land 0.25 0.30 0.35
Pasture with Frozen Ground 0.40 0.45 0.50
Unimproved Areas 0.10 0.20 0.30
Water Surfaces 1.00 1.00 1.00
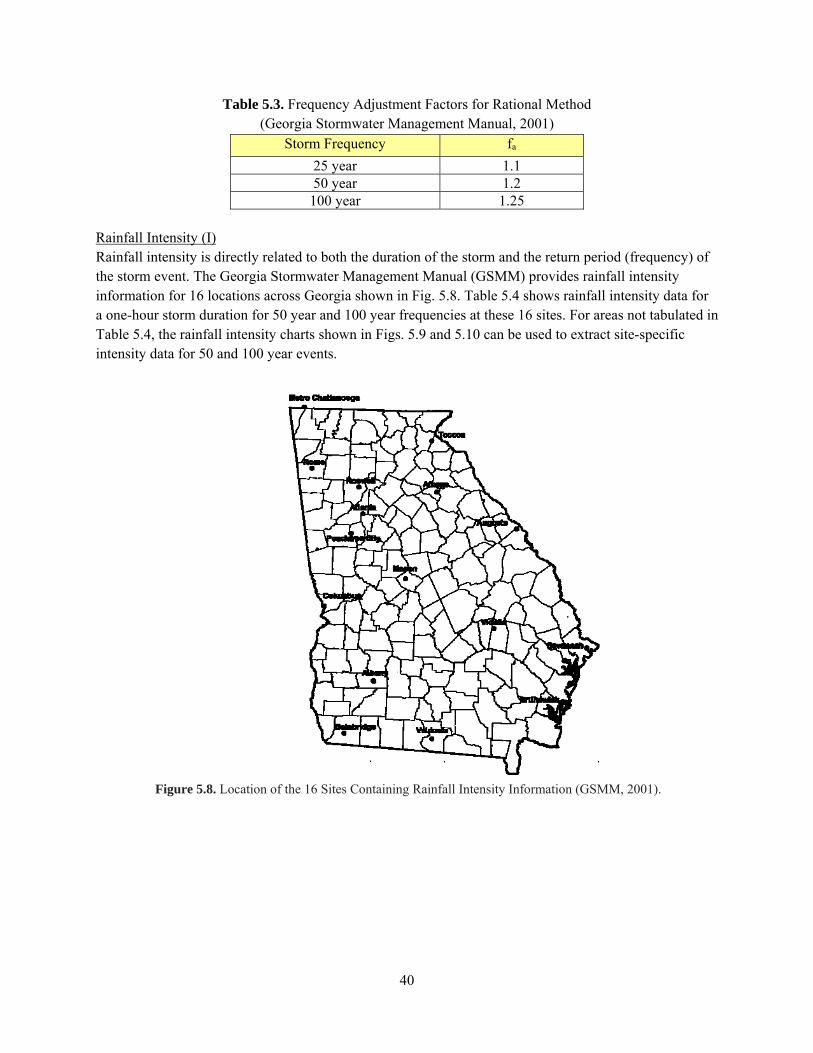
40
Table 5.3. Frequency Adjustment Factors for Rational Method (Georgia Stormwater Management Manual, 2001)
Storm Frequency fa
25 year 1.1 50 year 1.2
100 year 1.25
Rainfall Intensity (I) Rainfall intensity is directly related to both the duration of the storm and the return period (frequency) of the storm event. The Georgia Stormwater Management Manual (GSMM) provides rainfall intensity information for 16 locations across Georgia shown in Fig. 5.8. Table 5.4 shows rainfall intensity data for a one-hour storm duration for 50 year and 100 year frequencies at these 16 sites. For areas not tabulated in Table 5.4, the rainfall intensity charts shown in Figs. 5.9 and 5.10 can be used to extract site-specific intensity data for 50 and 100 year events.
Figure 5.8. Location of the 16 Sites Containing Rainfall Intensity Information (GSMM, 2001).
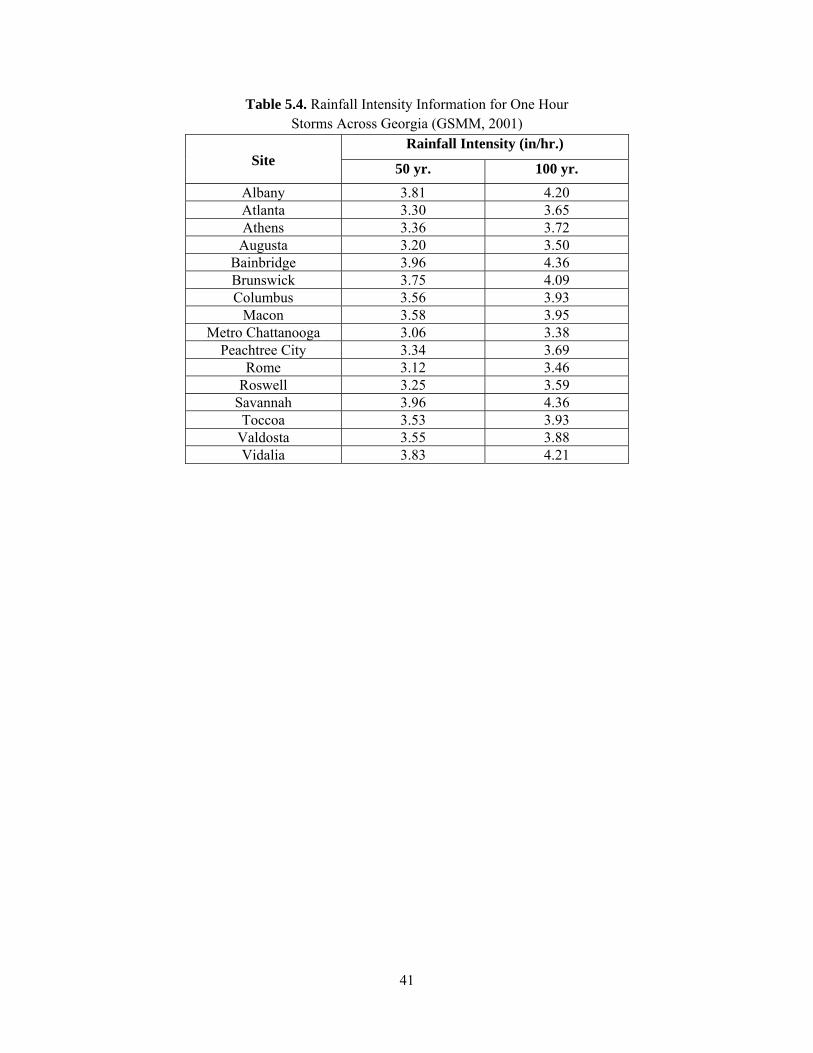
41
Table 5.4. Rainfall Intensity Information for One Hour Storms Across Georgia (GSMM, 2001)
Site
Rainfall Intensity (in/hr.)
50 yr. 100 yr.
Albany 3.81 4.20 Atlanta 3.30 3.65 Athens 3.36 3.72
Augusta 3.20 3.50 Bainbridge 3.96 4.36 Brunswick 3.75 4.09 Columbus 3.56 3.93
Macon 3.58 3.95 Metro Chattanooga 3.06 3.38
Peachtree City 3.34 3.69 Rome 3.12 3.46
Roswell 3.25 3.59 Savannah 3.96 4.36 Toccoa 3.53 3.93
Valdosta 3.55 3.88 Vidalia 3.83 4.21

42
Figure 5.9. Georgia Rainfall Intensity Data for a One Hour Storm,
50 Year Return Period (NOAA, 2015).

43
Figure 5.10. Georgia Rainfall Intensity Data for a One Hour Storm,
100 Year Return Period (NOAA, 2015).
Step 3: Computing Waterway Area: Having computed the anticipated peak flow (runoff), the waterway area is computed using:
where Qp = peak flow (ft3/s), and V = average velocity (ft/s). For applications involving the flow of water overland or through some form of hydraulic channel,
common velocities range from 3 5 ft/s. Compute a waterway area range by using both V = 3 ft/s and V = 5 ft/s. For bridge crossings, this is the required bridge opening area for the 50 year flood.

44
Step 4: Sizing Culverts: Using Table 5.5 for pipe culverts and Table 5.6 for box culverts, the initial culvert size is determined based on the waterway area values computed for both V = 3 and 5 ft/s and then choosing the larger size. Note that the table does not include culvert diameters less than 18 inches since this is the minimum size specified by GDOT (2014). As an example, for a peak flow of 40 ft3/s the computed waterway areas are 13.33 ft2 (for V=3 ft/s) and 8 ft2 (for V=5 ft/s) respectively. Based on these areas, Table 5.5 indicates required pipe culvert diameters of either 54 in or 42 inches, so select 54 inches for an initial sizing. For cases in which site restrictions (example: height from channel bottom to roadway) is not sufficient for a single large culvert, multi-barrel pipe culverts may be applied. Table 5.7 provides equivalent capacities for 2, 3, and 4 multi-barrels culverts.
Table 5.5. Pipe Culvert Sizing Table (Sizes Common for Corrugated Steel Pipe)
Culvert Diameter Waterway Area Diameter of Culvert Waterway Area
( inches ) (ft2) ( inches ) (ft2)
18 1.767 78 33.183
21 2.405 84 38.484
24 3.142 90 44.179
27 3.976 96 50.265
30 4.909 102 56.745
33 5.94 108 63.617
36 7.069 114 70.882
42 9.621 120 78.540
48 12.566 126 86.590
54 15.904 132 95.033
60 19.635 138 103.869
66 23.758 144 113.097
72 28.274 ‐‐‐ ‐‐‐

45
Table 5.6. Box Culvert Sizing Table (American Concrete Pipe Association, 2015)
Table 5.7. Equivalent Capacities for Multi-barrel Pipe Culverts
5.6 BRIDGE FOUNDATION INVESTIGATION AND SCOUR
For applications in which a bridge crossing is required, a BFI is necessary for the foundation design. The BFI must be performed by a licensed geotechnical engineer in the State of Georgia and contains
Dimensions Waterway Area Dimensions Waterway Area Dimensions Waterway Area
ft x ft (ft2) ft x ft (ft2) ft x ft (ft2)
4 x 4 15.65 8 x 5 39.11 10 x 10 98.61
5 x 2 9.50 8 x 6 47.11 11 x 4 42.32
5 x 3 14.50 8 x 7 55.11 11 x 6 53.32
5 x 4 19.50 8 x 8 63.11 11 x 8 64.32
5 x 5 24.50 9 x 4 34.88 11 x 9 97.32
6 x 3 17.32 9 x 5 43.88 11 x 10 108.32
6 x 4 23.32 9 x 6 52.88 11 x 11 119.32
6 x 5 29.32 9 x 7 61.88 12 x 4 46.00
6 x 6 35.32 9 x 8 70.88 12 x 5 58.00
7 x 3 20.11 9 x 9 79.88 12 x 6 70.00
7 x 4 27.11 10 x 4 38.61 12 x 7 82.00
7 x 5 34.11 10 x 5 48.61 12 x 8 94.00
7 x 6 41.11 10 x 6 58.61 12 x 9 106.00
7 x 7 48.11 10 x 7 68.61 12 x 10 118.00
8 X 3 23.11 10 x 8 78.61 12 x 11 130.00
8 x 4 31.11 10 x 9 88.61 12 x 12 142.00
Culvert Diameter
21 in. 2 x 18 in.
24 in. 2 x 18 in.
27 in. 2 x 21 in. 3 x 18 in.
30 in. 2 x 24 in. 3 x 18 in. 4 x 18 in.
33 in. 2 x 24 in. 3 x 21 in. 4 x 18 in.
36 in. 2 x 27 in. 3 x 21 in. 4 x 18 in.
42 in. 2 x 30 in. 3 x 27 in. 4 x 21 in.
48 in. 2 x 36 in. 3 x 30 in. 4 x 24 in.
54 in. 2 x 42 in. 3 x 33 in. 4 x 27 in.
60 in. 2 x 48 in. 3 x 36 in. 4 x 30 in.
66 in. 2 x 48 in. 3 x 42 in. 4 x 36 in.
72 in. 2 x 54 in. 3 x 42 in. 4 x 36 in.
78 in. 2 x 60 in. 3 x 48 in. 4 x 42 in.
84 in. 2 x 60 in. 3 x 48 in. 4 x 42 in.
90 in. 2 x 66 in. 3 x 54 in. 4 x 48 in.
96 in. 2 x 72 in. 3 x 60 in. 4 x 48 in.
102 in. 2 x 78 in. 3 x 60 in. 4 x 54 in.
108 in. 2 x 78 in. 3 x 66 in. 4 x 54 in.
114 in. 2 x 84 in. 3 x 66 in. 4 x 60 in.
120 in. 2 x 90 in. 3 x 72 in. 4 x 60 in.
126 in. 2 x 90 in. 3 x 78 in. 4 x 66 in.
132 in. 2 x 96 in. 3 x 78 in. 4 x 66 in.
138 in. 2 x 102 in. 3 x 84 in. 4 x 72 in.
144 in. 2 x 102 in. 3 x 84 in. 4 x 72 in.
Equivalent to

46
information collected from borings taken at several points along the proposed bridge location. Borings normally contain information relating to soil types, depth to groundwater, presence of any impenetrable layers (bedrock), and the soil’s permeability to water. Aside from providing this baseline information, the BFI also provides design recommendations for different types of foundations including:
Driven piles for pile bents; Caissons (drilled shafts); Spread footings; and Pile footings.
In addition to using information relating to the geotechnical (soil) properties of the bridge site, the
bridge foundation design must also take into account the effects of scour. Scour occurs when flowing water removes sediment such as sand a rocks, from bridge abutments or piers. The US Department of Agriculture (USDA) reports that scour is the most common cause of highway bridge failures in the United States (USDA, 1998). GDOT addresses the issue of scour by specifying that foundation depths be based on a 500 year storm event. This depth, referred to the scour depth, can be adjusted based on the findings from the BFI (GDOT, 2015). An estimation of the flow associated with the 500 year storm event can be calculated using the USGS regression equations shown in Table 5.1.
47
CHAPTER 6. CONCEPTUAL COST ESTIMATES The effort for conceptual cost estimates was concentrated on the unit installed cost approach which combines the cost for time, equipment, manpower, materials, general and project-specific overhead, contingency and profit. A couple of case studies were identified in the literature and the main concern for ABC construction cost estimation was higher cost associated with the projects. This result in higher bid prices due to the complexity of the project and the severity of the time constraints imposed on the contractors. Cost analysis of bridge projects built under Highways for Life (HFL) program, cost premium for deploying ABC ranged from 6 to 21% higher when compared to cost of traditional bridge construction. Also, other cost items that might need to be accounted for would be ancillary items, like railroad flagging, resident engineering time, traffic control devices. Most agencies employ phase-based construction in order to keep traffic flowing through a work zone. Alternatives are considered to close the roadway, establish a detour and build the bridge quickly using ABC method. The additional costs for this process may be offset by the elimination of phased-construction costs. As more ABC projects are built, the costs are trending downward due to construction familiarity with the process which results in lower risks. Road user costs in the work zone are added vehicle operating costs and delay costs to roadway users resulting from construction, maintenance, or rehabilitation activity. They are a function of the timing, duration, frequency, scope, and characteristics of the work zone, the volume and operating characteristics of the traffic affected, and the cost rates assigned to vehicle operations and delays. Overall the conceptual cost estimates are mainly based on specific design, known site conditions, major equipment costs and the probable calculation of user cost savings.
The decision-making matrix described in Chapter 3 and provided in Appendix F may help LGs decide whether to use ABC or conventional construction methods or alternative contracting mechanisms, depending on available funding. A few examples of project costs were initiated corresponding Federal and State requirements to guide LGs in their cost estimation activity; also a short survey was deployed related to conceptual cost estimating activity and major factors impacting cost components for ABC in order to find out how other state DOTs assess cost and its components for ABC. In the followings, contractor cost concerns, cost options, road user costs, and cost accounting options are considered and provided as assistance for local governing bodies in their estimating activity.
6.1 CONTRACTOR COST CONCERNS
Some agencies that have expressed concerns over cost, indicate that they do not see a need to spend extra funds to minimize impacts to the public. In fact, these agencies are already spending additional funds for this purpose. Most agencies employ phased (staged) construction in order to keep traffic flowing through a work zone. It is well known that this construction method is more expensive than construction with a full road closure. The contractors are required to work in a small work zone with adjacent traffic that impedes the work in progress. This approach can increase the cost of the construction. ABC allows owners to take reductions in traffic impacts to the next level by providing even better customer service. In some cases, it may be preferable to close the roadway, establish a detour and build the bridge quickly using ABC. The additional costs of this process may very well be offset by the elimination of phased construction costs. As more ABC projects are built, the costs are trending downward due to construction familiarity with the process which results in lower risks. Risk equates for higher cost in the project.

48
6.2 COST OPTIONS
The primary concern for ABC construction cost estimation is the higher cost associated with the projects. This has resulted in higher bid prices due to the complexity of the project and the severity of the time constraints imposed on the contractors. Based on the cost analysis of eight bridge projects built under HFL program, the cost premium for deploying ABC ranged from 6 to 21% higher when compared to the cost of traditional construction. Other cost options that might need to be accounted for would be Ancillary Items. Examples of this would be: railroad flagging, police details, resident engineering time, traffic control devices, etc.
6.3 ROAD USER COSTS
Road user costs are costs incurred by a highway network when they are delayed due to construction activities. Road User Costs in the work zone are added vehicle operating costs and delay costs to highway users resulting from construction, maintenance, or rehabilitation activity. They are a function of the timing, duration, frequency, scope, and characteristics of the work zone; the volume and operating characteristics of the traffic affected; and the dollar cost rates assigned to vehicle operations and delays. Daily road user costs (DRUC) are a measure of the daily financial impact of a construction project on the traveling public. The major factors in calculating user costs are out-of-distance travel (OODT), average annual daily traffic (AADT), and average daily truck traffic (ADTT) on the bridge. The Iowa DOT uses the formula:
DRUC ($) = (AADT + 2 ∗ ADTT) ∗ (OODT) ∗ (Mileage Rate)
6.4 SAFETY COSTS
Safety costs are estimated based on crash history, exposure times, and traffic maintenance strategies (if the information is available).
6.5 LIFE CYCLE COST ANALYSIS
A process for evaluating the total economic worth of a usable project segment by analyzing initial costs and discounted future costs, such as maintenance, user costs, reconstruction, rehabilitation, restoration, and resurfacing costs, over the life of the project segment. Higher quality reduces the need for maintenance and extends the lifespan of the structure. This will lead to a reduced life cycle cost for prefabricated structures.
6.6 COST ACCOUNTING OPTIONS
The unit cost approach is a method of accounting that combines the cost for time, equipment, manpower, materials, general and project-specific overhead, contingency and profit.
Cost Based (Bottom-Up Estimating) is a method of accounting that takes into consideration production rates, equipment needs, and manpower for each construction operation.
Appendix E is providing a couple of examples on the conceptual cost estimates with respective major categories of direct costs in both conventional and prefabricated construction. Another example was obtained from an experienced contractor working in one of the northern state and it is a detailed

49
report of cost break down by individual construction items entered the respective bridge replacement job. The job estimate report is presented as a guidance in exhibit E3 of Appendix E.
This section of conceptual cost estimates has a focus in guiding users on which circumstances are most appropriate to use ABC versus conventional bridge construction. Additionally, information on the decision making process for ABC selection can be essentially filtered through the decision-making matrix compiled in Chapter 3. A special survey with essential questions on cost estimation for ABC projects (provided in Appendix E) was deployed to all DOTs that were associated, in multiple occasions, with this type of bridge construction. Separate submissions of the survey were also reaching all other state DOTs. In this final report and to this date, a number of sixteen DOTs responses have been recorded. The effort was closely monitored and a number of iterations of the survey were used in the submission and answers collection process. The results can be used as further guidance to potential users and to complement the decision-making matrix with inclusive items affecting directly the conceptual cost estimates. All the state DOTs responses were recorded in the table belonging to Appendix E, as exhibit E4.
50
CHAPTER 7. TYPICAL CONSTRUCTION PRACTICES This chapter presents an overview of ABC practices. Over the years, ABC techniques using PBES have become more and more popular throughout the United States. The desire to reduce traffic impacts for commuters has been a high priority in the recent years. Consequently, in the last 20 years, acute traffic control issues at specific job sites has catalyzed the development of what is now known as ABC.
Early ABC projects focused on specific prefabricated elements such as bridge decks and/or pier caps. Bridge deck construction using full depth precast concrete deck panels has been in use for over 20 years. In recent years, use of PBES has spread to all bridge elements, including substructures and foundations. As structural components of a bridge that are built off site, they are crucial strategies to meet ABC objectives. Combining them with the “Fast-Track Contracting” method can generate a fast, high-performance project. PBES components include, but are not limited to:
Precast footings;
Precast wing walls;
Precast pile foundations;
Prefabricated caps and footings; and
Prefabricated steel/concrete girder beams. Benefits of ABC projects using PBES are:
Fewer problems for reduced road user impacts;
Improved worker and motorist safety;
Expedited project planning process;
Improved quality/constructability; and
Reduced cost to society.
7.1 ABC CONSTRUCTION CONCEPTS
7.1.1 Prefabricated Spread Footings Precast concrete spread footings are a relatively new concept in bridge construction. These footings were placed over a prepared subgrade on leveling bolts and then grouted into place. The joints between the footing elements are made with shear keys that are filled with non-shrink grout. Although the size of footings for bridge piers can get rather large, the columns for 40, 60, and 80 ft bridge spans will allow for reasonably sized footings which will facilitate their transportation. Reinforcing bars can be extended from the precast footings, and a CIP closure pour can be completed during the erection of the remaining portions of the bridge. For compact bridges, smaller footings can be placed under the columns and extended as the pier structure is being constructed. See Fig. 7.1.

51
Figure 7.1. Example of Precast Spread Footing Plan and Section (MassDOT, 2013).
7.1.2 Precast Pile Cap Footings Precast components can be used for concrete pile caps. Recently, new design details have been developed using corrugated steel pipe voids that are based on research completed in Iowa. Results showed that a void made in a precast concrete footing with a corrugated steel pipe can provide very large punching shear resistance. Research on seismic connections has also demonstrated that these voids can develop large moment resistance as well.
7.1.3 Modular Block Systems Modular block retaining walls are a form of gravity retaining wall in which CIP concrete is replaced by modular reinforced concrete modules that interlock to form a wall (See Fig. 7.2). The mass of the wall

52
and, sometimes, the mass of soil placed within the voids in the blocks. These walls are beneficial to ABC because of the ability to construct them off site and be transported to the site.
Figure 7.2. Modular Block Systems (photo: Redi-Rock.com and ReinforcedEarth.com).
7.1.4 Geosynthetic Reinforced Soil Integrated Bridge System (GRS-IBS) This method combines foundation, abutment, and approach embankment into one composite material. GRS is comprised of many thin layers of soil and geosynthetic reinforcement. The internal soil is retained at the face of the abutment with a high quality concrete block facing. The facing simply retains and prevents erosion of the soil near the face of the wall. The composite mass extends into the embankment which allows the abutment, superstructure, and approach into one unit, and eliminating the differential settlement between the abutment seat and the approach backfill, otherwise known as the bump (Fig. 7.3). This integrated bridge system does not require approach slabs and, consequently, can drastically save the time associated with forming, pouring, and curing concrete for the approach slab.
GRS carries all loads and movements of the superstructure allowing this method to be utilized with concrete precast slabs. This system can be used for 40, 60, and 80 foot bridge spans and presents the following benefits:
● Low initial cost; ● Low life cycle cost; ● Fast construction; ● Minimal installation labor and equipment; and ● No approach slabs needed.

53
Figure 7.3. Typical GRS-IBS Cross Section at the Bridge Abutment (Adams et. al, 2012).
7.1.5 Expanded Polystyrene (EPS) Geofoam for Rapid Embankment Construction EPS geofoam is an embankment fill system comprised of large lightweight blocks (1-2 pounds per cubic foot) of expanded polystyrene. This system is not intended to be a structural support system for the bridge abutment. EPS is used to support bridge abutments by placing the blocks behind a conventional abutment or around piles of integral abutments (See Fig. 7.4). A layer of subbase is required below the pavement to distribute wheel loads. The benefits are:
Fast construction;
Extremely lightweight; and
Eliminates pre-load settlement times.
(a) (b) (c) Figure 7.4. (a) Bridge abutment with geofoam backfill. (b) EPS geofoam in embankment fill. (c) EPS geofoam for
embankment widening (Bartlett et. al., 2000).

54
7.1.6 Abutments or End-Bents Abutments are the substructure at the end of a bridge span on which the superstructure rests. Single-span bridges have abutments at each end, which provide vertical and lateral support for the bridge, as well as acting as retaining walls to resist lateral movement of the earthen fill of the bridge approach (Fig. 7.5). Multi-span bridges require piers to support ends of spans unsupported by abutments.
(a) (b) (c) Figure 7.5. (a) Location of abutments at each end of the bridge (image from Benchmark Hunting Wiki). (b) Integral
abutment placed behind a mechanically stabilized earth (MSE) wall (Hailat, 2014). (c) Partial precast end abutment (Hailat, 2014).
7.1.7 Prefabricated Superstructure Elements AASHTO defines a bridge’s superstructure as “Structural parts of the bridge that provide the horizontal span.” The superstructure can also be defined as the portion of the bridge above the bridge bearings. Superstructure systems include both the deck and primary supporting members integrated in a modular manner such that mobility disruptions occur only as a result of the system being placed. These systems can be rolled, launched, slid, lifted, or transported in place, onto existing or new substructures (abutments and/or piers) that have been built in a manner that does not impact mobility (Fig. 7.6).
Figure 7.6. Prefabricated Superstructure Elements (SHRP2, 2014).
7.1.8 Materials for Prefabricated Bridge Elements This section provides an overview of the many different types of materials used in prefabrication and discusses the impact of the materials on accelerated construction processes. Most agencies have approval processes for prequalification of proprietary materials. Designers should be aware of the materials that are available for use in a particular agency prior to specifying the material.
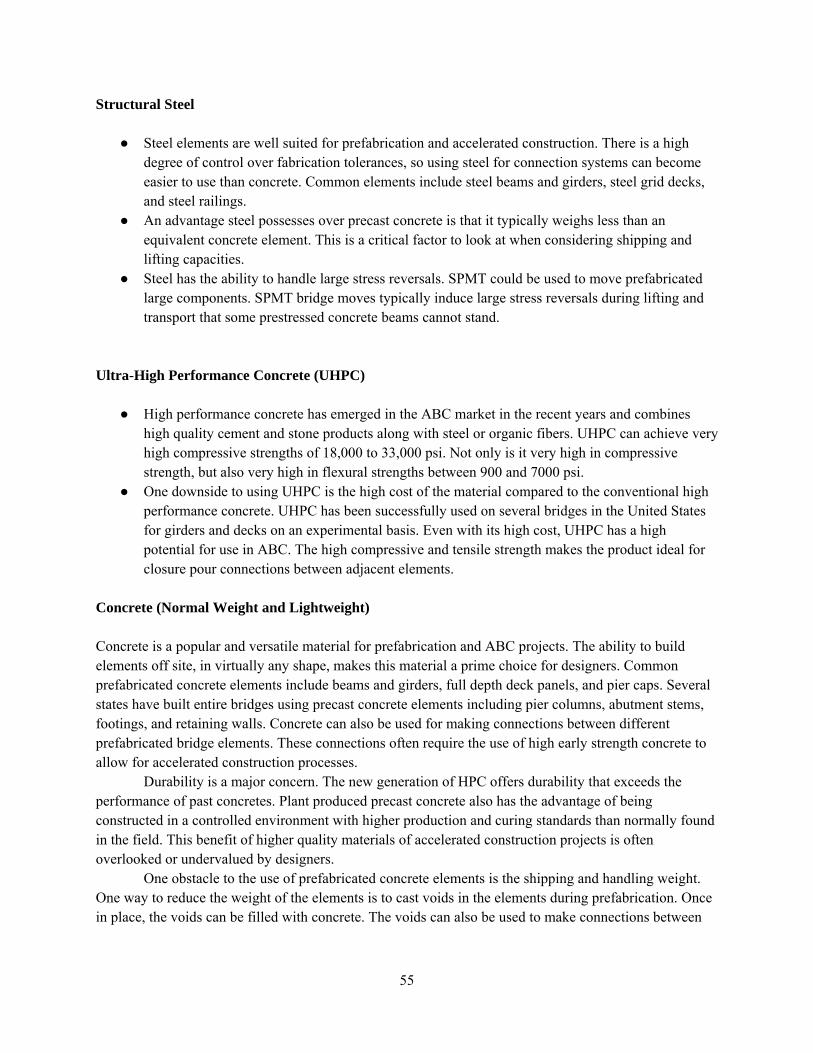
55
Structural Steel
● Steel elements are well suited for prefabrication and accelerated construction. There is a high degree of control over fabrication tolerances, so using steel for connection systems can become easier to use than concrete. Common elements include steel beams and girders, steel grid decks, and steel railings.
● An advantage steel possesses over precast concrete is that it typically weighs less than an equivalent concrete element. This is a critical factor to look at when considering shipping and lifting capacities.
● Steel has the ability to handle large stress reversals. SPMT could be used to move prefabricated large components. SPMT bridge moves typically induce large stress reversals during lifting and transport that some prestressed concrete beams cannot stand.
Ultra-High Performance Concrete (UHPC)
● High performance concrete has emerged in the ABC market in the recent years and combines
high quality cement and stone products along with steel or organic fibers. UHPC can achieve very high compressive strengths of 18,000 to 33,000 psi. Not only is it very high in compressive strength, but also very high in flexural strengths between 900 and 7000 psi.
● One downside to using UHPC is the high cost of the material compared to the conventional high performance concrete. UHPC has been successfully used on several bridges in the United States for girders and decks on an experimental basis. Even with its high cost, UHPC has a high potential for use in ABC. The high compressive and tensile strength makes the product ideal for closure pour connections between adjacent elements.
Concrete (Normal Weight and Lightweight) Concrete is a popular and versatile material for prefabrication and ABC projects. The ability to build elements off site, in virtually any shape, makes this material a prime choice for designers. Common prefabricated concrete elements include beams and girders, full depth deck panels, and pier caps. Several states have built entire bridges using precast concrete elements including pier columns, abutment stems, footings, and retaining walls. Concrete can also be used for making connections between different prefabricated bridge elements. These connections often require the use of high early strength concrete to allow for accelerated construction processes.
Durability is a major concern. The new generation of HPC offers durability that exceeds the performance of past concretes. Plant produced precast concrete also has the advantage of being constructed in a controlled environment with higher production and curing standards than normally found in the field. This benefit of higher quality materials of accelerated construction projects is often overlooked or undervalued by designers.
One obstacle to the use of prefabricated concrete elements is the shipping and handling weight. One way to reduce the weight of the elements is to cast voids in the elements during prefabrication. Once in place, the voids can be filled with concrete. The voids can also be used to make connections between

56
elements. A common cost effective way to make voids is to use corrugated steel pipe to form the void. The corrugations are very effective at transmitting very large forces.
Concrete link-slab technology has also been used on ABC projects at bridge piers to make a jointless bridge without live load continuity. The concept with link slabs is to design the connection of the deck across the pier to accommodate the rotation of the beams without significant cracking. This is done by debonding a small portion of the deck near the pier to allow for a wider spread of the rotation strain. That portion (link) is filled with a highly ductile engineered cementitious composite (ECC) material. Fiber-Reinforced Polymer (FRP) There has been much research into the use of FRP in recent years. Many states and universities have experimented with these materials. The development of high strength polymers has made the use of FRP materials practical for many bridge applications
7.2 APPLICATION EXAMPLES OF ABC CONSTRUCTION TECHNOLOGIES
ABC is most effective for projects that require traffic management. This section will cover how ABC can be applied to the various types of bridge projects that transportation agencies typically manage.
7.2.1 Rehabilitation of Existing Bridges The national bridge inventory is aging; many bridges have deteriorated significantly, especially their superstructure, and concrete deck replacement projects are becoming more common. The supporting girders also experience deterioration due to leaking bridge joints and lack of maintenance.
The substructure is often in better condition when compared to the superstructure. This is especially true for single span bridges and continuous span bridges without deck joints. On many projects, rehabilitation of the substructure combined with replacement of superstructure elements is feasible. The following sections discuss how ABC can be used for the execution for bridge rehabilitation projects.
7.2.2 Deck Replacement Deck replacement is the most common use of ABC. The installation of a bridge deck is time consuming, requiring significant manpower to form it, place reinforcing, cast and cure the concrete, and strip the forms. This labor intensive work is difficult under the best circumstances, but where traffic management is required, it becomes even more complicated.
Three basic forms of ABC deck replacement strategies have been used in the United States. The first is stay-in-place deck forms. They consist of corrugated metal panels designed to support the reinforcing steel and wet concrete of the deck and eliminate the need to strip the forms after the concrete is cured. However, they still require the placement of reinforcing steel and casting and curing of concrete, which does not result in a significant time savings. Also, the underside of the deck cannot be visually inspected in the future.
The second ABC deck replacement strategy is the use of precast and prestressed concrete partial depth deck panels. These panels are typically cast to half the thickness of the finished deck. The remainder of the deck is made up of one layer of steel reinforcement and on-site cast concrete. The panels are designed to span from girder to girder with reinforcement designed to accommodate the positive deck

57
bending moments. Negative deck bending moments are accommodated by the top layer of field placed reinforcement. The advantages and disadvantages of this system are similar to stay-in-place deck forms except that the panel is a structural part of the deck, and is exposed for future visual inspections.
The fastest form of deck placement uses full depth prefabricated deck panels. Different systems have been used in the United States including open grid steel, exodermic deck panels, fiber reinforced polymer panels, and precast concrete panels.
Most ABC projects use precast panels, and they are the focus of this construction manual. Significant research has examined them, including the composite connections between the panel and the girders and the connection between the panels.
7.2.3 Superstructure Replacement The use of ABC for superstructure replacement projects is very common. ABC techniques are particularly well suited for them since the time consuming process of building foundations and substructures is not required. Each state has its own technique to accomplish this type of work in a very short time frame.
Figure 7.7. Self-propelled Modular Transporters (AASHTO, 2006). Several states have used SPMT technology or lateral skidding/sliding technology to remove and install entire bridge superstructure systems (Fig. 7.7). The new superstructures can be built off site and moved into position in only a few hours.
7.2.4 Substructure Replacement On some bridges, the substructure may be in disrepair due to leaking deck joints and spray from vehicles passing underneath. If abutments have deteriorated, full bridge replacement or abutment patching may be necessary because replacing an abutment is difficult without significant disruption to adjacent areas.
Accelerated replacement of pier columns and caps has more potential. Old pier columns and caps can be removed and replaced with prefabricated pier elements if the footings and foundation are in sound condition and structurally adequate. Closure pours at the base of the columns can be used to connect the old footings to the new pier elements. If an existing pier is supported on a spread footing, the new pier can be built alongside it on rails and jacked into place in a method similar to lateral superstructure skidding/ sliding. Once in place, the footing can be underpinned with grout to seat it on the subgrade.

58
7.2.5 Replacement of Existing Bridges and New Bridges Replacing entire bridges and building new bridges differ from deck and superstructure replacement projects because the substructures and foundations must be replaced, which adds a level of complexity. However, ABC methods are often still appropriate.
Replacing a bridge is also different from constructing a new bridge on a new alignment. Often, traffic needs to be accommodated, which requires building the bridge amid and around the traffic or a traffic detour. ABC can minimize the impact of both scenarios. The following sections describe the role that ABC can play in several replacement strategies.
7.2.6 Staging On many projects, traffic needs to be maintained through the construction site at various stages if a suitable detour is unavailable. ABC can be used to minimize the duration of each construction stage. In some cases, complete superstructure prefabrication may not be possible in stage construction projects. Individual prefabricated elements can be used for all portions of the substructures and superstructures.
On any project where staging is being considered, the project team should investigate the potential for changing from staged construction to ABC with full closure with a detour. This approach will offer the greatest opportunity for accelerating the construction since the contractor will have full access to the site for manpower and equipment. It also offers the safest work zone for workers and inspectors.
7.2.7 Full Closure and New Construction On many projects, the entire construction site can be made available to a contractor for the construction of an entire bridge. This occurs on new bridges being built on new roadway alignments, and on bridges that are built with traffic detours.
The previous section outlined the benefits of ABC on projects with detours. Full closure of the bridge offers significant benefits to the ABC process. The use of ABC on projects that involve detours is appropriate if the detour is long or has undesirable geometrics. ABC can be used to minimize the length of time that the detour is in place. Virtually any bridge can be built using ABC methods; however, certain bridge features can have an effect on the ABC process.
7.3 ABC CONSTRUCTION TECHNOLOGIES
SHRP2 (2014) provide ABC concepts and sketches for the following technologies:
Above-deck driven carrier systems;
Launched temporary truss bridge;
Wheeled carriers or SPMTs;
Launching and lateral sliding; and
Jacking and mining.
This section summarizes these ABC technologies and their advantages and disadvantages to help decision-makers choose the ideal technique for a specific project.

59
7.3.1 Above-Deck Driven Carrier (ADDC) Above-deck driven carriers (ADDCs) ride over an existing bridge structure to deliver components. They are ideal where access below the bridge for cranes is limited or the bridge’s span is long.
ADDC can be delivered to the construction site shipped on flatbed trucks or towed using mountable axles. Once at the site, they are erected with multiple-axle configurations; after reaching the destination pier, the ADDC is raised to unload the axles. It is then secured and supported at the pier, loaded with gantries, and ready to demolish structure or to deliver girders and slab panels.
On narrow bridges, the ADDC can remove and replace half of the existing structure using counterweights on the gantries. Next, the ADDC can be repositioned over the new half to remove and
replace the remaining old half. For shorter bridge lengths, ADDC can be used to provide access from abutment to abutment. For longer bridge lengths, ADDC can be used to provide access over a number of spans concurrently, to allow for complete removal and replacement of the exterior portions of multiple spans of an existing structure.
ADDC may not be ideal for highly curved bridges. The stability of the gantry systems must be studied for the weights of the existing slab panels and girders as well as the weights of the new girders and slab panels.
7.3.2 Launched Temporary Truss Bridge Launched temporary truss bridges (LTTBs) are used to transport girders, materials, or equipment over spans, especially when:
Minimal disruption to traffic is desired,
Traditional crane access and picks are limited, or
Temporary access over waterways is restricted. LTTBs can be shipped to sites on flatbed trucks or towed with mountable axles. They are erected on site and launched; after reaching the destination pier or temporary bent, they are secured and ready to deliver girders and equipment.
7.3.3 Self-Propelled Modular Transports (SPMTs) SPMTs can be used to remove entire spans or full-length span strips of existing bridges for replacement with new units. They are cost-effective, easily transported, and can be set up and taken down quickly. Trolley movement and steering are governed by hydraulic motors powered by diesel engines. For highway bridge applications, the spans are lighter when made with prestressed concrete and much lighter when made from steel girders and a concrete deck slab. The spans can also be divided into longitudinal strips to diminish the weight to be lifted and the cost of the wheeled carriers.
7.3.4 Launching and Lateral Shifting This method involves building a bridge at a single construction location and launching it incrementally as each section is completed. Prestressed concrete bridges are constructed in a small casting yard behind an abutment. The first bridge segment is equipped with a light steel extension to control the launch stresses. The segment and the steel extension are launched forward onto the piers until it clears the formwork. A

60
second bridge segment is match cast and prestressed against the first one, and the entire bridge section is launched again. This process is repeated until the bridge completed. Similar operations can be applied to steel girder bridges, where the form is replaced with adjustable supports that sustain the girder segments during assembly.
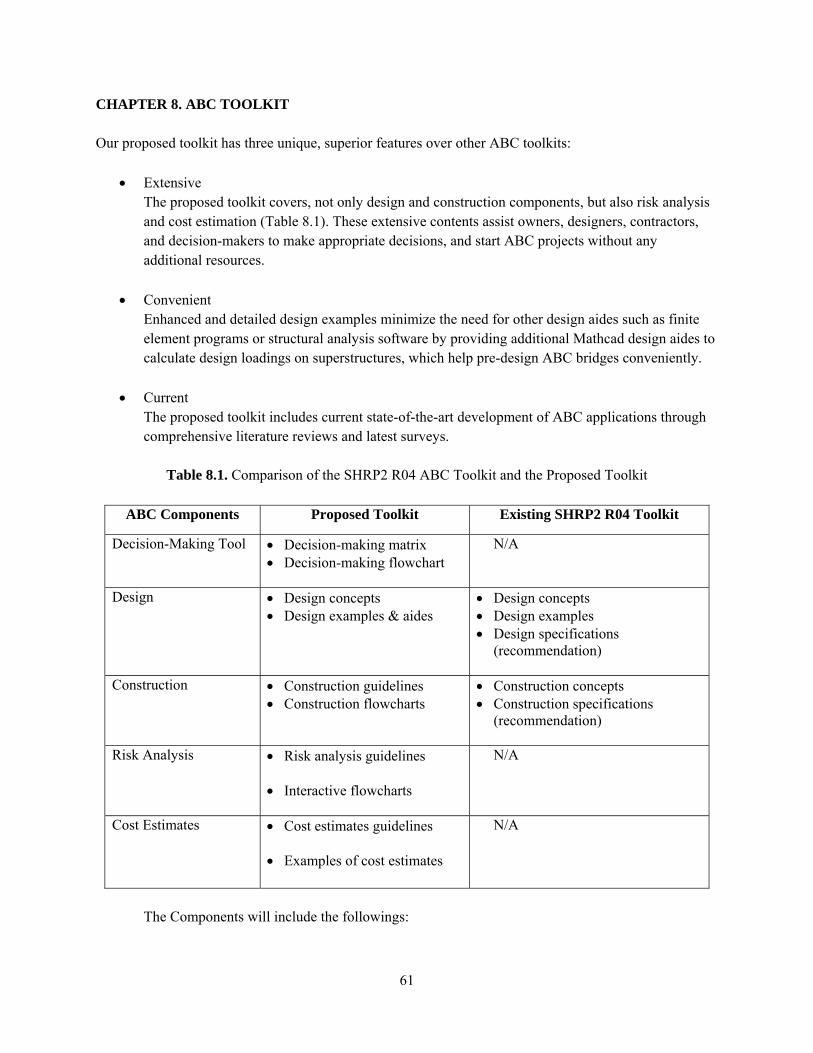
61
CHAPTER 8. ABC TOOLKIT Our proposed toolkit has three unique, superior features over other ABC toolkits:
Extensive The proposed toolkit covers, not only design and construction components, but also risk analysis and cost estimation (Table 8.1). These extensive contents assist owners, designers, contractors, and decision-makers to make appropriate decisions, and start ABC projects without any additional resources.
Convenient Enhanced and detailed design examples minimize the need for other design aides such as finite element programs or structural analysis software by providing additional Mathcad design aides to calculate design loadings on superstructures, which help pre-design ABC bridges conveniently.
Current The proposed toolkit includes current state-of-the-art development of ABC applications through comprehensive literature reviews and latest surveys.
Table 8.1. Comparison of the SHRP2 R04 ABC Toolkit and the Proposed Toolkit
ABC Components Proposed Toolkit Existing SHRP2 R04 Toolkit
Decision-Making Tool Decision-making matrix Decision-making flowchart
N/A
Design Design concepts Design examples & aides
Design concepts Design examples Design specifications
(recommendation)
Construction Construction guidelines Construction flowcharts
Construction concepts Construction specifications
(recommendation)
Risk Analysis Risk analysis guidelines
Interactive flowcharts
N/A
Cost Estimates Cost estimates guidelines
Examples of cost estimates
N/A
The Components will include the followings:

62
● ABC decision-making Component ● ABC design Component
- Design Concepts - Pre-design Examples - Design Aides (Mathcad Examples) to calculate design loadings (moments, shears, and
reactions) ● ABC Construction Component ● Hydrological and Hydraulic Component ● Conceptual Cost Component
The toolkit will be provided in a word-processor format with hyperlinks to referenced sites, or the team will create a template for a web-based system to facilitate ABC design implementation; a final version of the web site can be built from the template. The web site and its server will contain links to the main design documents required for the proper selection of accelerated bridge techniques and a user form generated by a software application for cost analyses.

63
CHAPTER 9. SUMMARY AND CONCLUSIONS Accelerated Bridge Construction (ABC) techniques are highly effective in remediating traffic disruptions during bridge renewals, promoting traffic and worker safety, and improving the quality and durability of bridges. However, their higher initial cost has prevented widespread and sustained implementation.
Our survey results revealed that local contractors prefer conventional CIP construction for bridge renewals because modular construction cuts into profits. Furthermore, designers hesitate to risk using new technologies. However, comprehensive national studies of ABC practices found that accumulated experience and repeated use could lead to contractor acceptance as well as savings in construction costs and time.
The primary objective of this study was to develop and deliver a toolkit for accelerated selection and construction of bridges in place using prefabricated modular systems with 40, 60, and 80 ft span lengths for LGs in Georgia. The components of the proposed ABC toolkit address: 1) decision-making; 2) design; 3) construction; 4) risk analysis; and 5) cost estimation. It will be an extensive, convenient source of the latest guidelines for ABC applications. It is not intended for developing final design and construction plans but as a source of information to help decision-makers and owners develop an initial design, estimate the material and construction costs, and determine when and where ABC will be most beneficial. It will provide guidelines to assist LGs and third-party designers in employing GDOT design standards for ABC. With repeated implementation, ABC options will become even more economical and efficient.
64
SELECTED BIBLIOGRAPHY
Adams, M., Nicks, J., Stabile, T., Wu, J., Schlatter, W., & Hartmann, J. (2012). Geosynthetic reinforced soil integrated bridge interim implementation guide. Federal Highway Administration Report No. FHWA-HRT-11-026. Available at
https://www.fhwa.dot.gov/publications/research/infrastructure/structures/11026/11026.pdf.
American Association of State Highway and Transportation Officials (AASHTO). (2003). Guide specifications for design and construction of segmental concrete bridges. Washington, DC:
AASHTO.
AASHTO. (2006). Innovation initiative, SPMT photos. Florida DOT Graves Avenue Bridge over I-4.
Available at http://aii.transportation.org/Pages/SPMTPhotos.aspx. AASHTO. (2012). AASHTO LRFD bridge design specifications, 6th ed, Washington, DC: AASHTO.
AASHTO & FHWA. (2002). Innovative technology for accelerated construction of bridge and
embankment foundations. Preliminary summary report. Washington, DC: US Department of Transportation.
American Concrete Industries, (2015). Precast concrete box culverts by ACI. Available at
http://americanconcrete.com/commercial/box_culverts/box-culverts.htm. Bartlett, S., Negussey, D., Kimble, M., & Sheeley, M. (2000). Use of geofoam for I-15 reconstruction in
Salt Lake City. Syracuse: Syracuse University Geofoam Research Center. Available at http://geofoam.syr.edu/grc_i15.asp.
Buccola, Greg. (2011). FRP concrete strengthening 101. Louisville, KY: Luckett & Farley Architects, Engineers, & Construction Managers. Available at http://www.luckett-farley.com/frp-strengthening/. Contech, (2015). Practical factors related to the inspection, evaluation, and load rating of installed
culverts. Available at http://www.conteches.com/knowledge-center/pdh-article-series/inspection-evaluation-and-load-rating-of-installe.aspx.
Cranberry Township, (2015). Stormwater management plan. Available at
http://www.twp.cranberry.pa.us/index.aspx?NID=1326.
Federal Highway Administration (FHWA). (2007a). FHWA seismic accelerated bridge construction workshop outcomes and follow-up activities final report: Rapid bridge construction: Seismic connections in moderate-to-high seismic zones. San Diego: FHWA.
FHWA. (2007b). Geotechnical engineering circular no. 8: Design and construction of continuous flight
auger piles. Washington, DC: US Department of Transportation, FHWA.

65
FHWA. (2007c). Manual on use of self-propelled modular transporters to remove and replace bridges. Federal Highway Administration pre- fabricated bridge elements and systems. Available at http://www.fhwa.dot .gov/bridge/pubs/07022.
FHWA. (2008). Bridge deck replacement project using self-propelled modular transporters (SPMTs). Available at http://www.fhwa.dot.gov/bridge/prefab/spmt.cfm, modified May 12, 2008.
FHWA. (2009a). Colorado: Lightning fast construction at Mitchell Gulch. Available at http://www.fhwa.dot.gov/hfl/co2story.pdf.
FHWA. (2009b). Current practices in FRP composites technology: Completed FRP deck projects.
Available at http://www.fhwa.dot.gov/bridge/frp/ deckproj.cfm. FHWA. (2009c). Fiber reinforced polymer composite bridge technology: FRP library. Available at
http://www.fhwa.dot.gov/BRIDGE/frp/frppaper.cfm. FHWA. (2009d). Structures: Prefabricated bridge elements and systems. Bridge deck replacement project
using self-propelled modular transporters (SPMTs). Available at http://www.fhwa.dot.gov/bridge/prefab/ spmt.cfm.
FHWA. (2010a). Accelerated bridge construction (ABC) decision making and economic modeling tool.
Transportation Pooled Fund Project TPF-5(221), Quarterly Reports. Washington, DC: US Department of Transportation.
FHWA. (2010b). FHWA Resource Center: Innovative contracting solutions: Alternative contracting
methods. Available at http://www.fhwa.dot.gov/resourcecenter/teams/construction/cpm_6ics.cfm.
FHWA. (2011). Accelerated bridge construction manual, Publication HIF-12-013. Washington, DC: US Department of Transportation,
FHWA. (2013). Framework for prefabricated bridge elements and systems: Framework for decision-
making. Available at http://www.fhwa.dot.gov/bridge/ prefab/framework.cfm.
FHWA. (2015). Prefabricated bridge elements and systems (PBES) definitions. Available at https://www.fhwa.dot.gov/bridge/abc/prefab_def.cfm.
Figg, L., & Pate, W. D. (2004). Precast concrete segmental bridges: America’s beautiful and affordable
icons. PCI Journal, 49, 5, pp. 26–38. Georgia Department of Transportation (GDOT). (2014). Manual on drainage for highways. GDOT (2015). Bridge and structures design manual.

66
Graybeal, B. (2010). Behavior of field-cast ultra-high performance concrete bridge deck connections under cyclic and static structural loading. FHWA-HRT-11-023. Washington DC: US Department of Transportation.
Graybeal, B. (2011). Ultra-high performance concrete. Report FHWA- HRT-11-038. Washington, DC:
US Department of Transportation. Hailat, M. (2014). Integral abutments design and construction considerations. Indiana Department of
Transportation, Bridge Division. Available as Integral Abutment Details: Pile to Girder Connection, http://www.iowadot.gov/bridge/abc_ppt_2014.htm.
Massachusetts Department of Transportation (massDOT). (2013). Bridge Design Manual, Part III:
Prefabricated Bridge Elements. Available at: https://www.massdot.state.ma.us/highway/DoingBusinessWithUs/ManualsPublicationsForms/LRFDBridgeManual2013Edition/PartIIandPartIIIStandardDetails/PartIIIPrefabricatedBridgeElements.aspx.
Mistry, V. (2008). Need for prefabricated bridge elements and systems for accelerated bridge
construction. WASHTO-X Webinar (17 June). Ministry for the Environment (2004). Culvert and bridge construction: Guidelines for farmers.
Wellington, NZ: Manatu Mo Te Taiao. Available at http://www.mfe.govt.nz/sites/default/files/culvert-bridge-oct04.pdf.
National Cooperative Highway Research Program (NCHRP). (2008). Full-depth precast concrete bridge
deck panel systems. NCHRP Report 584. Available at http://www.trb.org/main/blurbs/159669.aspx. Natural Resources Conservation Service, New Hampshire (2014). Delineating watersheds. Available at
http://www.nrcs.usda.gov/wps/portal/nrcs/detail/nh/technical/?cid=nrcs144p2_015680. Nelson, LeAnne. (2012). Fauntleroy Expressway wearing new jackets… Seattle Department of
Transportation. Available at http://sdotblog.seattle.gov/2012/06/21/fauntleroy-expressway-wearing-new-jackets/.
Purdue University, (2005). Culvert design. Available at
https://engineering.purdue.edu/~abe527/lectures/culvertdesign.pdf. Salem, S., & Miller, R. (2006a). Accelerated construction decision-making process for bridges. Madison:
Department of Civil and Environmental Engineering, University of Wisconsin, Midwest Regional University Transportation Center.
Salem, S., & Miller, R. (2006b). Accelerated construction decision-making threshold levels. Final report.
Cincinnati: Midwest Regional University Transportation Center.

67
Strategic Highway Research Program 2 (SHRP2). (2013). Innovative bridge designs for rapid renewal: ABC toolkit. SHRP2 Report S2-R04-RR-2. Washington, DC: Transportation Research Board.
SHRP2. (2014). Innovative bridge designs for rapid renewal, SHRP2 Report S2-R04-RR-1. Washington,
DC: Transportation Research Board. United States Department of Agriculture (USDA). (1998). Bridge scour evaluation: Screening, analysis, &
countermeasures. Available at http://www.fs.fed.us/eng/structures/98771207.pdf United States Geological Survey (USGS). (2009). Magnitude and frequency of rural floods in the
southeastern United States, 2006: Volume 1, Georgia. Available at http://pubs.usgs.gov/sir/2009/5043/pdf/SIR2009_5043_book_508_V2.pdf.
USGS. (2011). Magnitude and frequency of floods for urban and small rural streams in Georgia. Available
at http://pubs.usgs.gov/sir/2011/5042. Utah Department of Transportation (UDOT). (2008a). ABC standards: Full depth precast concrete deck
panels. Salt Lake City: UDOT.
UDOT. (2008b). Full depth precast concrete deck panel manual. Salt Lake City: UDOT. UDOT. (2008c). Full depth precast concrete deck panel special provision. Salt Lake City: UDOT.
UDOT. (2008d). Innovate 80. Available at http://www. udot.utah.gov/innovate80. UDOT. (2008e). Manual for the moving of Utah bridges using self propelled modular transporters
(SPMTs). Available at http://www.udot.utah.gov/main/uconowner.gf?n=3712960312264389695. UDOT. (2010a). Precast approach slab manual. Salt Lake City: UDOT. UDOT. (2010b). Precast bulb tee girder manual. Salt Lake City: UDOT.
UDOT. (2010c). Precast substructure elements manual. Salt Lake City: UDOT.

68
LIST OF USEFUL ABC WEBSITES The following website references include SHRP2 program-related websites (AASHTO, SHRP2, TRB); the ABC-UTC website; the TRB ABC subcommittee website; manuals; individual case-study research; and general data collected on ABC techniques and procedures.
1. http://abc-utc.fiu.edu/index.php/Events/national 2. http://shrp2.transportation.org/Pages/Bridge-Designs-for-Rapid-Renewal.aspx 3. http://www.fhwa.dot.gov/goshrp2/Solutions/all/R04/Toolkit_for_Rapid_Bridge_Construction/ 4. http://www.fhwa.dot.gov/everydaycounts/ 5. http://www.trb.org/Main/Blurbs/168046.aspx 6. http://www.trbaff103.com/ 7. http://www.dot.state.fl.us/structures/edc/Files/PBEDC_CS1_Notes.pdf 8. http://www.woodwardcom.com/wp-content/uploads/2010/07/focus_december2011_www.pdf 9. http://www.fhwa.dot.gov/bridge/pubs/07022/chap07.cfm 10. http://www.precastconcrete.org/seminars/2008/2008-08.pdf 11. http://health.masstopics.com/topic/ac/accelerated-construction-construction-strategies-fhwa-
work-zone.html 12. http://www.roadsbridges.com/sites/default/files/selfhelp.pdf 13. http://www.fhwa.dot.gov/bridge/abc/docs/abcmanual.pdf 14. http://on.dot.wi.gov/dtid_bos/extranet/structures/LRFD/BridgeManual/Ch-07.pdf 15. http://www.udot.utah.gov/main//f?p=100:pg:0::::T,V:2090 16. http://www.pcine.org/cfcs/cmsIT/baseComponents/fileManagerProxy.cfc?method=GetFile&fileI
D=29EA580A-F1F6-B13E-8B386984EA89F68F 17. http://transportation.ky.gov/Structural-Design/Pages/ABC.aspx 18. http://www.oregon.gov/ODOT/HWY/BRIDGE/pages/standards_manuals.aspx 19. http://www.abc.fiu.edu/event-on-06022011/ 20. http://conf.tac-atc.ca/english/resourcecentre/readingroom/conference/conf2010/docs/b2/burak.pdf 21. http://books.google.com/books?id=BCeOAgAAQBAJ&pg=PA205&lpg=PA205&dq=accelerated
+bridge+construction+manual&source=bl&ots=6HBscITYuW&sig=FQNXMeaRLm5Lqy4Sim9CJUwJJKY&hl=en&sa=X&ei=CTiXU43hHIXlsASh3oHwAw&ved=0CE4Q6AEwCTge#v=onepage&q=accelerated%20bridge%20construction%20manual&f=false
22. hftp://mceer.buffalo.edu/OConnor/ftp/7NSC%20papers/Oral%20Papers/150%20White.docx 23. http://www.lrrb.org/media/reports/TRS1203.pdf 24. http://cms.oregon.egov.com/ODOT/TD/TP_RES/docs/Reports/2011/ABC.pdf?ga=t 25. http://www.woodwardcom.com/wp-content/uploads/2010/07/focus_december2011_www.pdf 26. http://www.fhwa.dot.gov/hfl/summary/pdfs/iw_070112.pdf 27. http://www.intrans.iastate.edu/research/documents/research-reports/TR-561 Report Volume 1.pdf 28. http://udot.utah.gov/main/uconowner.gf?n=14572900843381595 29. http://udot.utah.gov/main/uconowner.gf?n=14572709238365034 30. https://www.udot.utah.gov/main/uconowner.gf?n=14572526291351034 31. http://www.udot.utah.gov/main/uconowner.gf?n=3712960312264389695 32. http://books.google.com/books/about/State_of_the_Art_of_Precast_Prestressed.html?id=zYPCYg
EACAAJ

69
33. https://www.fhwa.dot.gov/publications/research/infrastructure/structures/bridge/12038/12038.pdf 34. http://www.fhwa.dot.gov/research/resources/uhpc/ 35. http://www.fhwa.dot.gov/publications/research/infrastructure/structures/hpc/13060/13060.pdf 36. http://www.fhwa.dot.gov/publications/research/infrastructure/structures/hpc/12042/12042.pdf 37. http://ntl.bts.gov/lib/35000/35400/35413/FHWA-HRT-11-023.pdf 38. http://www.ductal-lafarge.com/SLib/22-FHWA-HRT-06103.pdf 39. http://www.fhwa.dot.gov/bridge/abc/docs/abcmanual.pdf 40. http://www.oregon.gov/ODOT/TD/TP_RES/docs/Reports/2011/ABC.pdf 41. http://www.fhwa.dot.gov/bridge/prefab/if09010/report.pdf 42. http://www.fhwa.dot.gov/bridge/prefab/if06030.pdf 43. http://www.fhwa.dot.gov/bridge/pubs/07022/chap00.cfm 44. http://www.fhwa.dot.gov/bridge/pubs/07022/hif07022.pdf 45. http://ascelibrary.org/doi/abs/10.1061/(ASCE)BE.1943-5592.0000097 46. http://books.google.com/books?hl=en&lr=&id=U0Ra5aukj0sC&oi=fnd&pg=PP1&dq=accelerate
d+bridge+construction+in+the+state+of+georgia&ots=3nzl02Y9pO&sig=xX8NqCPu-rlGCNTREtwMqynWfeY#v=onepage&q=accelerated%20bridge%20construction%20in%20the%20state%20of%20georgia&f=false
47. http://www.countyengineers.org/events/annualconf/Documents/2013%20Presentations/Accel%20Bridge%20Construc%20Russell.pdf
48. http://www.edkraemer.com/construction-services/accelerated-bridge-construction-abc/ 49. http://sri.cce.iastate.edu/abc-seismic/

APPENDIX A
SURVEY RESULTS
A-1
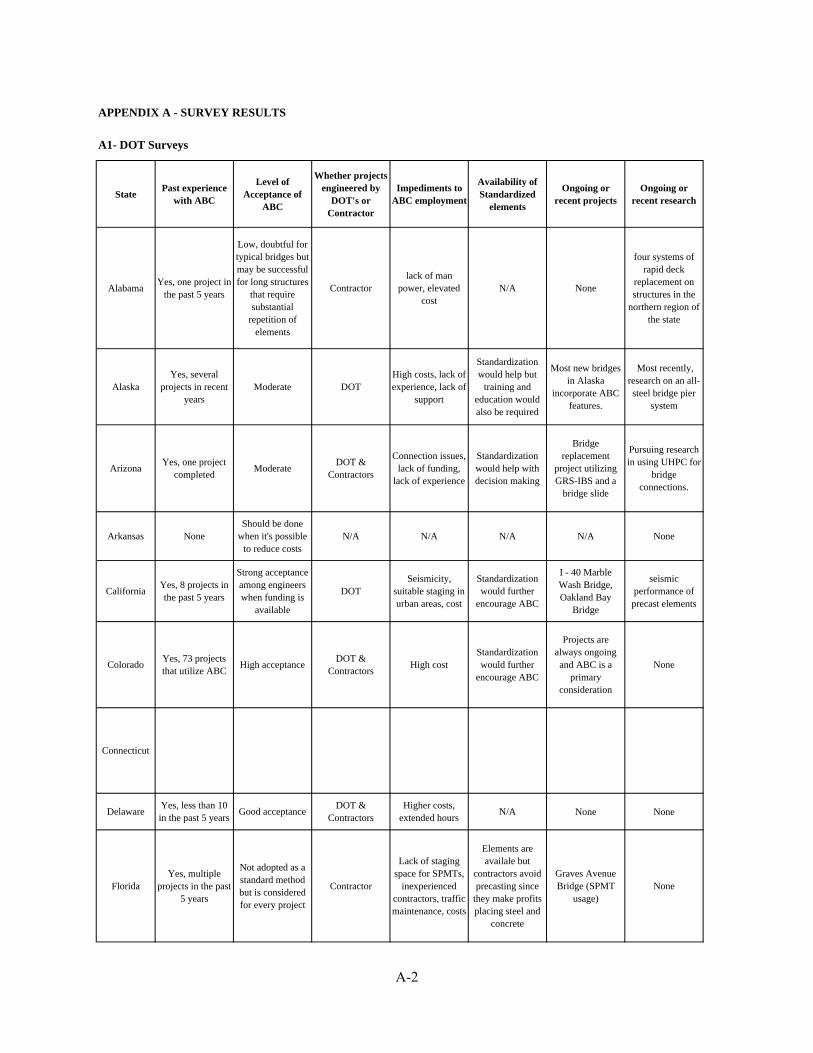
APPENDIX A - SURVEY RESULTS
A1- DOT Surveys
StatePast experience
with ABC
Level of Acceptance of
ABC
Whether projects engineered by
DOT's or Contractor
Impediments to ABC employment
Availability of Standardized
elements
Ongoing or recent projects
Ongoing or recent research
AlabamaYes, one project in
the past 5 years
Low, doubtful for typical bridges but may be successful for long structures
that require substantial
repetition of elements
Contractorlack of man
power, elevated cost
N/A None
four systems of rapid deck
replacement on structures in the
northern region of the state
AlaskaYes, several
projects in recent years
Moderate DOTHigh costs, lack of experience, lack of
support
Standardization would help but
training and education would also be required
Most new bridges in Alaska
incorporate ABC features.
Most recently, research on an all-steel bridge pier
system
ArizonaYes, one project
completedModerate
DOT & Contractors
Connection issues, lack of funding,
lack of experience
Standardization would help with decision making
Bridge replacement
project utilizing GRS-IBS and a
bridge slide
Pursuing research in using UHPC for
bridge connections.
Arkansas NoneShould be done
when it's possible to reduce costs
N/A N/A N/A N/A None
CaliforniaYes, 8 projects in the past 5 years
Strong acceptance among engineers when funding is
available
DOTSeismicity,
suitable staging in urban areas, cost
Standardization would further
encourage ABC
I - 40 Marble Wash Bridge, Oakland Bay
Bridge
seismic performance of
precast elements
ColoradoYes, 73 projects that utilize ABC
High acceptanceDOT &
ContractorsHigh cost
Standardization would further
encourage ABC
Projects are always ongoing and ABC is a
primary consideration
None
Connecticut
DelawareYes, less than 10 in the past 5 years
Good acceptanceDOT &
ContractorsHigher costs,
extended hoursN/A None None
FloridaYes, multiple
projects in the past 5 years
Not adopted as a standard method but is considered for every project
Contractor
Lack of staging space for SPMTs,
inexperienced contractors, traffic maintenance, costs
Elements are availale but
contractors avoid precasting since
they make profits placing steel and
concrete
Graves Avenue Bridge (SPMT
usage)None
A-2

StatePast experience
with ABC
Level of Acceptance of
ABC
Whether projects engineered by
DOT's or Contractor
Impediments to ABC employment
Availability of Standardized
elements
Ongoing or recent projects
Ongoing or recent research
GeorgiaYes, 1 project in the past 5 years
Growing acceptance and
interestContractor
Higher costs, extended hours
N/A Nonestandardized prefabricated
elements
Hawaii
Very experienced, 20 projects using ABC techniques
since 2001
Very high acceptance, lower cost than cast in place methods
DOT
Initiatives by governing bodies encourage using ABC techniques just to use them instead of using ABC techniques
where it most makes sense
Yes but ABC should be used when it is most economically efficient or
environmentally beneficial
None None
Idaho 2 ongoing projects DOTUsed precast concrete deck
panels
Northside Blvd I-84, Union Pacific
Railroad E. Lateral Canal
Bridge, Highway 75
IllinoisYes, multiple
projects in the past 5 years
Low accpetance because of high
costDOT Higher costs
Would help cut costs
None None
IndianaYes, 2 projects,
one involved sliding
Low acceptance DOTLack of
knowledge, cost efficiency
Availability of standards would
make ABC easier
One unspecified project
None
IowaYes, multiple
projects over the past 5 years
Good acceptance DOT
Low traffic volumes,
contractors say it's less profitable and
more complex
Standar plans and shapes would ease the design process and save money
I-92 Cass County Bridge, US 6 Keg
Creek Bridge (completely
prefabricated)
None
KansasYes, one project in
the past 5 years
Unknown but a shift to ABC as a
standard is doubtful
DOT
Methods other than design-bid-
build are prohibited by state
law
Kansas gets very low prices on cast-in-place short span
bridges that are very low
maintenance. Kansas is relectant
to use standardized prefabricated
elements
Project similar to Iowa's Keg Creek
project (completely
prefabricated)
precast concrete bridge elements
Kentucky
Louisiana
Extensive experience with
several ABC methods
Widely accepted and currently used
DOT
Precast bridges have a shorter
service life than cast in place
bridges
Common use of precast girders for
short spans
Maree Michael Bridge and Creek Bridge (Vermilion
Parish, LA)
None
MaineYes, several
projects over the past 5 years
High accpetance DOT
Cost of precasting elements as
opposed to casting in place
Desired standardization for
lower costsNone None
A-3
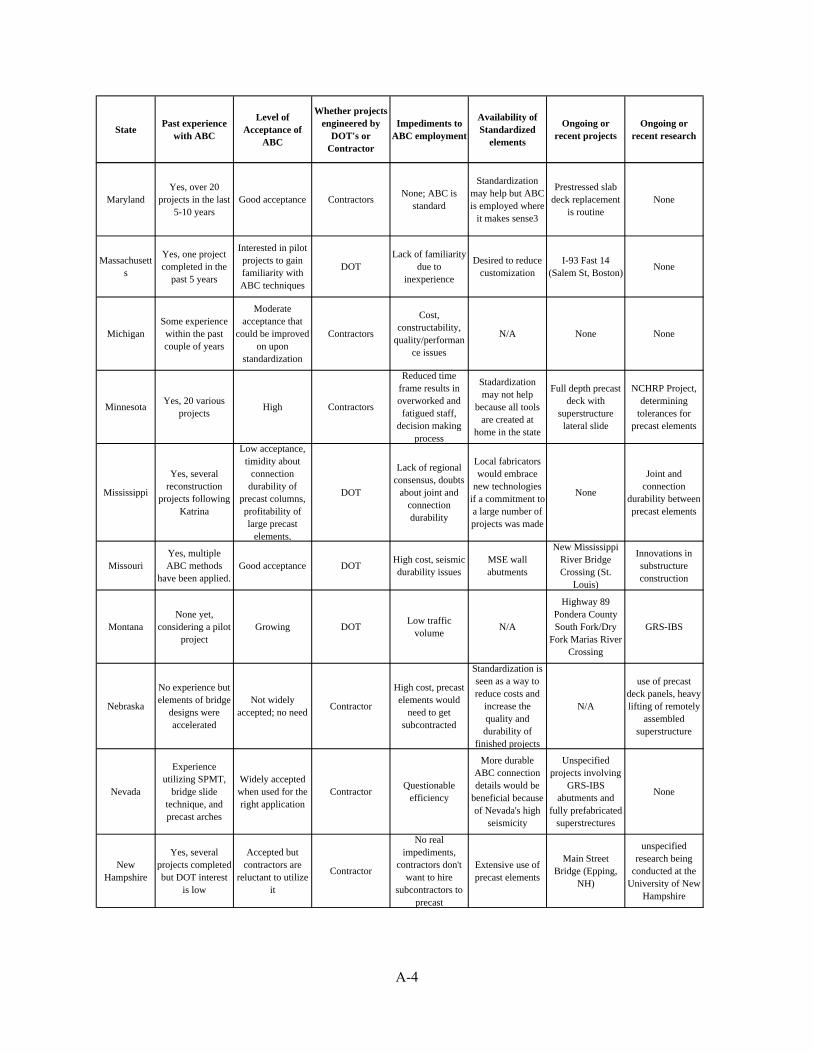
StatePast experience
with ABC
Level of Acceptance of
ABC
Whether projects engineered by
DOT's or Contractor
Impediments to ABC employment
Availability of Standardized
elements
Ongoing or recent projects
Ongoing or recent research
MarylandYes, over 20
projects in the last 5-10 years
Good acceptance ContractorsNone; ABC is
standard
Standardization may help but ABC is employed where
it makes sense3
Prestressed slab deck replacement
is routineNone
Massachusetts
Yes, one project completed in the
past 5 years
Interested in pilot projects to gain familiarity with ABC techniques
DOTLack of familiarity
due to inexperience
Desired to reduce customization
I-93 Fast 14 (Salem St, Boston)
None
MichiganSome experience within the past couple of years
Moderate acceptance that
could be improved on upon
standardization
Contractors
Cost, constructability,
quality/performance issues
N/A None None
MinnesotaYes, 20 various
projectsHigh Contractors
Reduced time frame results in overworked and fatigued staff,
decision making process
Stadardization may not help
because all tools are created at
home in the state
Full depth precast deck with
superstructure lateral slide
NCHRP Project, determining
tolerances for precast elements
Mississippi
Yes, several reconstruction
projects following Katrina
Low acceptance, timidity about
connection durability of
precast columns, profitability of large precast
elements,
DOT
Lack of regional consensus, doubts
about joint and connection durability
Local fabricators would embrace
new technologies if a commitment to a large number of projects was made
None
Joint and connection
durability between precast elements
MissouriYes, multiple ABC methods
have been applied.Good acceptance DOT
High cost, seismic durability issues
MSE wall abutments
New Mississippi River Bridge Crossing (St.
Louis)
Innovations in substructure construction
MontanaNone yet,
considering a pilot project
Growing DOTLow traffic
volumeN/A
Highway 89 Pondera County South Fork/Dry
Fork Marias River Crossing
GRS-IBS
Nebraska
No experience but elements of bridge
designs were accelerated
Not widely accepted; no need
Contractor
High cost, precast elements would
need to get subcontracted
Standardization is seen as a way to reduce costs and
increase the quality and durability of
finished projects
N/A
use of precast deck panels, heavy lifting of remotely
assembled superstructure
Nevada
Experience utilizing SPMT,
bridge slide technique, and precast arches
Widely accepted when used for the right application
ContractorQuestionable
efficiency
More durable ABC connection details would be
beneficial because of Nevada's high
seismicity
Unspecified projects involving
GRS-IBS abutments and
fully prefabricated superstrectures
None
New Hampshire
Yes, several projects completed but DOT interest
is low
Accepted but contractors are
reluctant to utilize it
Contractor
No real impediments,
contractors don't want to hire
subcontractors to precast
Extensive use of precast elements
Main Street Bridge (Epping,
NH)
unspecified research being
conducted at the University of New
Hampshire
A-4

StatePast experience
with ABC
Level of Acceptance of
ABC
Whether projects engineered by
DOT's or Contractor
Impediments to ABC employment
Availability of Standardized
elements
Ongoing or recent projects
Ongoing or recent research
New JerseyMany projects over the past 5
years
Good acceptance but high
reluctance on the thesis that ABC is
too high risk
DOT
DOT and contractors don't think of it to be a solution in many
cases, no incentive to be creative
Precast elements used
Route 70 bridge over the
Manasquan River, None
New MexicoYes, 10 projects in
the past 5 to 10 years
ABC is moderately accepted
DOT
Cost and effectiveness, lack
of contractor experience and
knowledge, lack of construction
personnel
Standardization would help
2 projects that utilized full depth
precast deck panels, 1 project
that utilizes precast pier caps, abutment caps, and wingwalls
None
New YorkYes, 10 total
projectsGaining
acceptanceDOT
Construction costs, lack of staging areas
Precast elements used
Van Wyck Expressway on
Long Island
UHPC research for fatigue in
precast element joints
North Carolina
Several projects over the past
couple of years, Good accpetance DOT N/A N/A
Washington Bypass Project
MSE abutments, geosynthetic
reinforced soil abutments
North Dakota None N/A ContractorLow acceptance,
high cost, connection issues
Standardization may help
NoneVery little (topics
unspecified)
OhioMany projects
completed in the past 14 years
High DOT Connection issuesStandardization is
not necessary
OklahomaSeveral projects over the past 5
yearsGood acceptance DOT
Extensive use of precast elements
Highway 51 over Cottonwood Creek
Bridge (Mannford,OK)
Oregon8 projects in the past couple of
yearsVery high DOT
High cost, seismic connections
UHPC for connections of full depth deck panels
None
PennsylvaniaYes, several
projects over the past 5 years
Accepted, considered on a
project by project basis
Contractor
Contractors are unwilling to
assume additional risks, low
experience, reluctance to subcontract,
Yes, used precast elements and
launching using SPMTs
None structural details
Rhode Island
A-5

StatePast experience
with ABC
Level of Acceptance of
ABC
Whether projects engineered by
DOT's or Contractor
Impediments to ABC employment
Availability of Standardized
elements
Ongoing or recent projects
Ongoing or recent research
South Carolina
South Dakota Yes
Widely accepted, seen as favorable
if project conditions warrant
it
Low traffic volumes that don't balance high cost of ABC methods
2001 project over a railroad yard
Construction of jointless decks
without increasing cost significantly
or at all
TennesseeLittle experience, one project in the
past 5 years
Limited acceptance,
always considered in bridge projects but not often used
DOT
Questions about durability of
precast elements, connection issues with precast decks
to beams
Precast memebers and elements used
None None
TexasLow acceptance because of low
incentivesContractor
No financial incentive, bridge projects are too
small to sufficiently expose contractors to the
new methods
Only practical for use when lack of
access makes cast-in-place
components hard to construct or
when there is a lot of repetition
None None
Utah
Yes, extensive use of ABC
techniques over the past 10 years
High acceptance, standard practice
since 2010DOT
No impediments. ABC is standard
Available for use and currently
being implemented
Standard current practice
Standards for deck panels, precast
substructures, new presrressed beam sections, seismic
detailing, acceptable
deformation limits, connection
details and durability
VermontYes, completed 5
projects in the past 5 years
Good acceptance Contractor
Low traffic, user costs don't balance out costs of ABC
methods,
Yes None
Incentive/dicincentive clauses to help encourage ABC methods
Virginia
Washington
Yes, several projects that
incorporated ABC techniques
Good acceptance DOT None documented
Completed projects using
complete prefabrication or
superstructure and substructure
elements
None None
West VirginiaYes, 5 projects in the past 5 years
Accepted but traffic volume is
too low to make it feasible
DOT
Underdeveloped ABC contracting industry, lack of
heavy lift contractors and
local contractors,
No precasting industry in the
stateNone
methods that minimize
environmental disruption
WisconsinJust beginning to impliment ABC
practices
Low acceptance and support because the
program is so new, yet no strong
opposition
ContractorNew process, low support and lack
of experience
Precasting available
Re-decking of major structure with full depth precast deck
panels
precast substructure units
A-6
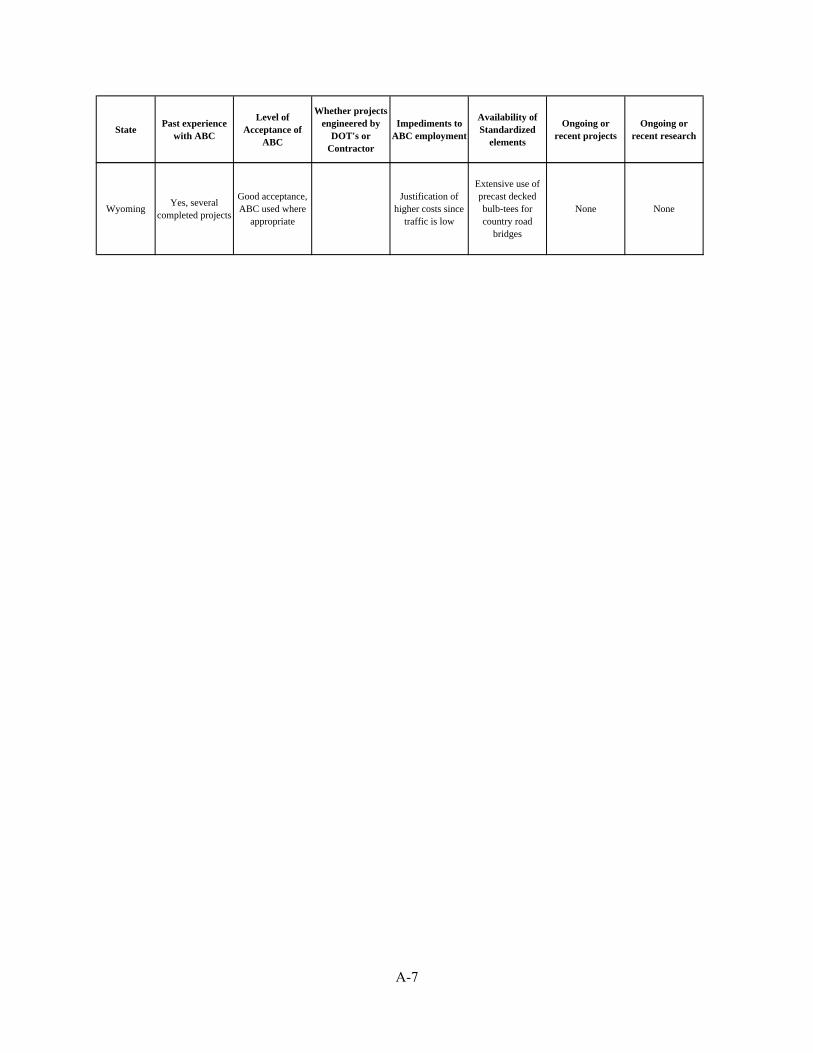
StatePast experience
with ABC
Level of Acceptance of
ABC
Whether projects engineered by
DOT's or Contractor
Impediments to ABC employment
Availability of Standardized
elements
Ongoing or recent projects
Ongoing or recent research
WyomingYes, several
completed projects
Good acceptance, ABC used where
appropriate
Justification of higher costs since
traffic is low
Extensive use of precast decked bulb-tees for country road
bridges
None None
A-7

A2- ABC Map Map based off 2009 survey results (SHRP2 2013). Displays total completed projects reported.
A-8

Map based off 2015 survey results. Displays total completed projects reported to date.
A-9
APPENDIX B
ABC Sample Design Examples and Flowcharts: Using Mathcad
A-10

APPENDIX B - ABC Sample Design Examples and Flowcharts: Using Mathcad The design component of the toolkit is composed of design concepts and examples. This APPENDIX B provides user friendly pre-design examples and interactive design flowcharts with design aides such as Mathcad. Both steel and concrete girder design examples were developed for 40, 60, 80 ft span lengths, and modified to allow for easy understanding. The base design examples were taken from the SHRP 2 document “Innovative Bridge Designs for Rapid Renewal” (SHRP2 2013). Modifications were made to the original design document by using GDOT standard criteria for highway bridges, information obtained from a design example created by the Federal Highway Association, and the latest AASHTO LRFD Bridge Design Specifications, 6th Ed. (2012). All design examples in this project were created using Mathcad, which allows readers such as Georgia city or county engineers to easily follow the extensive procedures involved in ABC bridge design. Simplicity is stressed throughout the examples and even in the standard drawings in this project.
A-11

B1 - Design Flowchart for Concrete Decked Steel Girder and Precast/Prestressed Concrete Girder
A-12

B2- Design Examples for Concrete Decked Steel Girder and Precast/Prestressed Concrete Girder Design using Mathcad
1. Concrete decked steel girder examples for 40ft, 60ft, 80ft spans - Steel Girder-80ft.xmcd - Steel Girder-60ft.xmcd - Steel Girder-40ft.xmcd
2. Precast/prestressed concrete girder examples for 40ft, 60ft, 80ft spans - Prestressed Concrete Girder-80ft.xmcd - Prestressed Concrete Girder-60ft.xmcd - Prestressed Concrete Girder-40ft.xmcd
Note: The electronic files of these Mathcad examples are provided through an external hard drive or email.
A-13

Summary of changes from SHRP2:
Adapted the AASHTO LRFD Bridge Design Specifications, 6th Edition (2012) and GDOT Standards MathCAD Design Aides provided in Appendix of the final report
- Design loadings calucation (moment, shear, and reaction) for girders - Design loadings calucation for deck
List of variable definitions added Enhanced the descriptions for all design steps Expansion of detail regarding girder sizingNew cross-section drawingsLoad combination explanations12 ft travel lanes, 6 ft shoulders and 2% slope from crown to comply with GDOT standards
A-14

CONCRETE DECKED STEEL GIRDER DESIGN FOR ABC
The following example details the design of a steel girder bridge accompanied by precast concrete deck panels. Thisparticular example was created in accordance with Accelerated Bridge Construction (ABC) principles. The exampleshown here is presented for a Georgia Department of Transportation research endeavour into ABC technology, and isintended to simplify the design procedure of ABC style bridges. This example was taken from the SHRP 2 Manual(S2-R04-RR-2), and modified by a Georgia Southern University research team working for the Georgia Department ofTransportation.
Note: These calculations do not consider every aspect of the bridge design process, and should not be condsideredexhaustive.
Note: All user inputs are highlighted in yellow for easy identification.
AASHTO LRFD Bridge Design Specifications (Sixth Edition with 2012 interims) was used to formulate this example.Located throughout this example are direct references to the AASHTO LRFD Bridge Design Specifications, which arefound to the right side of their affiliated calculation.
Before beginning this example, a structural modeling program was used to analyze the superstructure. Although thecalculations are not shown, the outputs are used for the design moments, shears and reactions in the example.
BRIDGE GEOMETRY:
Design member parameters:
Deck Width: wdeck 36ft 2in C. to C. Piers: Length 80ft
Roadway Width: wroadway 33ft C. to C. Bearings Lspan 77ft 10in
Skew Angle: Skew 0deg Bridge Length: Ltotal 3 Length 240 ft
Deck Thickness td 10.5in Stringer W33x118
Haunch Thickness th 2in Stringer Weight ws1 118plf
Haunch Width wh 10.5in Stringer Length Lstr Length 6 in 79.5 ft
Girder Spacing spacingint 2ft 11in Average spacing of adjacent beams. This value is usedso that effective deck width is not overestimated.
spacingext 3ft
File Name: Steel Girder-80 ft.xmcd
A-15

TABLE OF CONTENTS:
General:1. Introduction2. Design Philosophy3. Design Criteria4. Material Properties5. Load Combinations
Girder Design:6. Beam Section Properties7. Permanent Loads8. Precast Lifting Weight9. Live Load Distribution Factors10. Load Results11. Flexural Strength
12. Flexural Strength Checks 13. Flexural Service Checks 14. Shear Strength 15. Fatigue Limit States 16. Bearing Stiffeners 17. Shear ConnectorsDeck Design:
18. Slab Properties 19. Permanent Loads 20. Live Loads
21. Load Results22. Flexural Strength Capacity Check23. Longitudinal Deck Reinforcing Design24. Design Checks25. Deck Overhang Design
Continuity Design:26. Compression Splice27. Closure Pour Design
A-16

List of Variable Definitions
A = plan area of ice floe (ft2); depth of temperature gradient (in.) (C3.9.2.3) (3.12.3)AEP = apparent earth pressure for anchored walls (ksf) (3.4.1)AF = annual frequency of bridge element collapse (number/yr.) (C3.14.4)AS = peak seismic ground acceleration coefficient modified by short-period site factor (3.10.4.2)
= notional slope of backfill (degrees) (3.11.5.8.1)B = equivalent footing width (ft) (3.11.6.3)Be = width of excavation (ft) (3.11.5.7.2b)BM = beam (width) for barge, barge tows, and ship vessels (ft) (C3.14.5.1)Bp = width of bridge pier (ft) (3.14.5.3)BR = vehicular braking force; base rate of vessel aberrancy (3.3.2) (3.14.5.2.3)b = braking force coefficient; width of a discrete vertical wall element (ft) (C3.6.4) (3.11.5.6)bf = width of applied load or footing (ft) (3.11.6.3)C = coefficient to compute centrifugal forces; constant for terrain conditions in relation to wind approach (3.6.3)(C3.8.1.1)
CD = drag coefficient (s2 lbs./ft4) (3.7.3.1)CH = hydrodynamic mass coefficient (3.14.7)CL = lateral drag coefficient (C3.7.3.1)
Csm = elastic seismic response coefficient for the mth mode of vibration (3.10.4.2) c = soil cohesion (ksf) (3.11.5.4)cf = distance from back of a wall face to the front of an applied load or footing (ft) (3.11.6.3)D = depth of embedment for a permanent nongravity cantilever wall with discrete vertical wall elements (ft)(3.11.5.6)DE = minimum depth of earth cover (ft) (3.6.2.2)Do = calculated embedment depth to provide equilibrium for nongravity cantilevered with continuous verticalelements by the simplified method (ft) (3.11.5.6)D1 = effective width of applied load at any depth (ft) (3.11.6.3)d = depth of potential base failure surface below base of excavation (ft); horizontal distance from the back of awall face to the centerline of an applied load (ft) (3.11.5.7.2b) (3.11.6.3)dc = total thickness of cohesive soil layers in the top 100 ft (3.10.3.1)ds = total thickness of cohesionless soil layers in the top 100 ft (3.10.3.1)E = Young’s modulus (ksf) (C3.9.5)EB = deformation energy (kip-ft) (C3.14.11)e = eccentricity of load on footing (ft) (3.11.6.3)F1 = lateral force due to earth pressure (kip/ft) (3.11.6.3)F2 = lateral force due to traffic surcharge (kip/ft) (3.11.6.3)f = constant applied in calculating the coefficient C used to compute centrifugal forces, taken equal to 4/3 forload combinations other than fatigue and 1.0 for fatigue (3.6.3)f c = specified compressive strength of concrete for use in design (ksi) (3.5.1)
g = gravitational acceleration (ft/s2) (3.6.3)H = ultimate bridge element strength (kip); final height of retaining wall (ft); total excavation depth (ft);resistance of bridge component to a horizontal force (kip) (C3.11.1) (3.11.5.7.1) (3.14.5.4)Hp = ultimate bridge pier resistance (kip) (3.14.5.4)Hs = ultimate bridge superstructure resistance (kip) (3.14.5.4)H1 = distance from ground surface to uppermost ground anchor (ft) (3.11.5.7.1)Hn+1 = distance from base of excavation to lowermost ground anchor (ft) (3.11.5.7.1)h = notional height of earth pressure diagram (ft) (3.11.5.7)heq = equivalent height of soil for vehicular load (ft) (3.11.6.4)IM = dynamic load allowance (C3.6.1.2.5)k = coefficient of lateral earth pressure; number of cohesive soil layers in the top 100 ft (3.11.6.2) (3.10.3.1)ka = coefficient of active lateral earth pressure (3.11.5.1)ko = coefficient of at rest lateral earth pressure (3.11.5.1)kp = coefficient of passive lateral earth pressure (3.11.5.1)ks = coefficient of earth pressure due to surcharge (3.11.6.1)L = perimeter of pier (ft); length of soil reinforcing elements in an MSE wall (ft); length of footing (ft);
A-17

expansion length (in.) (3.9.5) (3.11.5.8) (3.11.6.3) (3.12.2.3) = characteristic length (ft); center-to-center spacing of vertical wall elements (ft) (C3.9.5) (3.11.5.6)
m = multiple presence factor; number of cohesionless soil layers in the top 100 ft (3.6.1.1.2) (3.10.3.1)N = average Standard Penetration Test (SPT) blow count (blows/ft) (ASTM D1586) for the upper 100 ft of thesoil profile (3.10.3.1)
Nch = average Standard Penetration Test (SPT) blow count (blows/ft) (ASTM D1586) for cohesive soil layers in theupper 100 ft of the soil profile and us for cohesive soil layers (PI > 20) in the top 100 ft ( us method) (3.10.3.1)Nchi = blowcount for a cohesionless soil layer (not to exceed 100 blows/ft in the above expression) (3.10.3.1)Ni = Standard Penetration Test blow count of a layer (not to exceed 100 blows/ft in the above expression). Notethat when using Method B, N values are for cohesionless soils and cohesive soil and rock layers within theupper 100 ft Where refusal is met for a rock layer, Nishould be taken as 100 blows/ft (3.10.3.1)Ns = stability number (3.11.5.6)OCR = overconsolidation ratio (3.11.5.2)P = maximum vertical force for single ice wedge (kip); load resulting from vessel impact (kip); concentratedwheel load (kip); live load intensity; point load (kip) (C3.9.5) (3.14.5.4) (C3.6.1.2.5) (C3.11.6.2) (3.11.6.1)Pa = force resultant per unit width of wall (kip/ft) (3.11.5.8.1)PC = probability of bridge collapse (3.14.5)PD = design wind pressure (ksf) (3.8.1.2.1)PGA = peak seismic ground acceleration coefficient on rock (Site Class B) (3.10.2.1) (3.10.4.2)PH = lateral force due to superstructure or other concentrated lateral loads (kip/ft) (3.11.6.3)Ph = horizontal component of resultant earth pressure on wall (kip/ft) (3.11.5.5)PI = plasticity index (ASTM D4318) (3.10.3.1)Pp = passive earth pressure (kip/ft) (3.11.5.4)Pv = vertical component of resultant earth pressure on wall (kip/ft); load per linear foot of strip footing (kip/ft)(3.11.5.5) (3.11.6.3)P v = load on isolated rectangular footing or point load (kip) (3.11.6.3)p = effective ice crushing strength (ksf); stream pressure (ksf); basic earth pressure (psf); fraction of truck trafficin a single lane; load intensity (ksf) (3.9.2.2) (3.7.3.1) (3.11.5.1) (3.6.1.4.2) (3.11.6.1)pa = apparent earth pressure (ksf); maximum ordinate of pressure diagram (ksf) (3.11.5.3) (3.11.5.7.1)pp = passive earth pressure (ksf) (3.11.5.4)Q = total factored load; load intensity for infinitely long line loading (kip/ft) (3.4.1) (3.11.6.2)Qi = force effects (3.4.1)q = surcharge pressure (ksf) (3.11.6.3)qs = uniform surcharge pressure (ksf) (3.11.6.1)R = radius of curvature (ft); radius of circular pier (ft); seismic response modification factor; reduction factor oflateral passive earth pressure; radial distance from point of load application to a point on the wall (ft);reaction force to be resisted by subgrade below base of excavation (kip/ft) (3.6.3) (3.9.5) (3.10.7.1) (3.11.5.4)(3.11.6.1) (3.11.5.7.1)Sm = shear strength of rock mass (ksf) (3.11.5.6)Su = undrained shear strength of cohesive soil (ksf) (3.11.5.6)Sub = undrained strength of soil below excavation base (ksf) (3.11.5.7.2b)Sv = vertical spacing of reinforcements (ft) (3.11.5.8.1)us = average undrained shear strength in ksf (ASTM D2166 or ASTM D2850) for the upper 100 ft of the soil profile(3.10.3.1)sui = undrained shear strength for a cohesive soil layer (not to exceed 5.0 ksf in the above expression) (3.10.3.1)S1 = horizontal response spectral acceleration coefficient at 1.0-s period on rock (Site Class B) (3.10.2.1)(3.10.4.2)T = mean daily air temperature (°F) (C3.9.2.2)TF = period of fundamental mode of vibration of bridge (s) (3.10.2.2)Thi = horizontal load in anchor i (kip/ft) (3.11.5.7.1)Tm = period of vibration for mth mode (s) (3.10.4.2)Tmax = applied load to reinforcement in a mechanically stabilized earth wall (kip/ft) (3.11.5.8.2)TMaxDesign= maximum design temperature used for thermal movement effects (°F) (3.12.2.1) (3.12.2.2) (3.12.2.3)TMinDesign = minimum design temperature used for thermal movement effects (°F) (3.12.2.1) (3.12.2.2) (3.12.2.3)TS = corner period at which acceleration response spectrum changes from being independent of period to beinginversely proportional to period (s) (3.10.4.2)T0 = reference period used to define shape of acceleration response spectrum (s) (3.10.4.2)
A-18

t = thickness of ice (ft); thickness of deck (in.) (3.9.2.2) (3.12.3)V = design velocity of water (ft/s); design impact speed of vessel (ft/s) (3.7.3.1) (3.14.6)VB = base wind velocity taken as 100 mph (3.8.1.1)VDZ = design wind velocity at design Elevation Z (mph) (3.8.1.1)VMIN = minimum design impact velocity taken not less than the yearly mean current velocity for the bridge location(ft/s) (3.14.6)V0 = friction velocity, a meteorological wind characteristic for various upwind surface characteristics (mph)(3.8.1.1)V30 = wind speed at 30.0 ft above low ground or water level (mph) (3.8.1.1)v = highway design speed (ft/s) (3.6.3)s v = average shear wave velocity for the upper 100 ft of the soil profile (3.10.3.1)W = displacement weight of vessel (tonne) (C3.14.5.1)w = width of clear roadway (ft); width of clear pedestrian and/or bicycle bridge (ft); width of pier at level of iceaction (ft); specific weight of water (kcf); moisture content (ASTM D2216) (3.6.1.1.1) (3.6.1.6) (3.9.2.2)(C3.7.3.1) (3.10.3.1)X = horizontal distance from back of wall to point of load application (ft); distance to bridge element from thecenterline of vessel transit path (ft) (3.11.6.2) (3.14.6)X1 = distance from the back of the wall to the start of the line load (ft) (3.11.6.2)X2 = length of the line load (ft) (3.11.6.2)Z = structure height above low ground or water level > 30.0 ft (ft); depth below surface of soil (ft); depth fromthe ground surface to a point on the wall under consideration (ft); vertical distance from point of loadapplication to the elevation of a point on the wall under consideration (ft) (3.8.1.1) (3.11.6.3) (3.11.6.2)Z0 = friction length of upstream fetch, a meteorological wind characteristic (ft) (3.8.1.1)Z2 = depth where effective width intersects back of wall face (ft) (3.11.6.3)z = depth below surface of backfill (ft) (3.11.5.1)
= constant for terrain conditions in relation to wind approach; coefficient for local ice condition; inclination ofpier nose with respect to a vertical axis (degrees); inclination of back of wall with respect to a vertical axis(degrees); angle between foundation wall and a line connecting the point on the wall under consideration anda point on the bottom corner of the footing nearest to the wall (rad); coefficient of thermal expansion(in./in./°F) (C3.8.1.1) (C3.9.2.2) (3.9.2.2) (C3.11.5.3) (3.11.6.2) (3.12.2.3)
= safety index; nose angle in a horizontal plane used to calculate transverse ice forces (degrees); slope ofbackfill surface behind retaining wall; {+ for slope up from wall; for slope down from wall} (degrees)(C3.4.1) (3.9.2.4.1) (3.11.5.3)
= slope of ground surface in front of wall {+ for slope up from wall; for slope down from wall} (degrees)(3.11.5.6) = load factors; unit weight of materials (kcf); unit weight of water (kcf); unit weight of soil (kcf) (C3.4.1)
(3.5.1) (C3.9.5) (3.11.5.1)s = unit weight of soil (kcf) (3.11.5.1)s = effective soil unit weight (kcf) (3.11.5.6)EQ = load factor for live load applied simultaneously with seismic loads (3.4.1)eq = equivalent-fluid unit weight of soil (kcf) (3.11.5.5)i = load factor (3.4.1)p = load factor for permanent loading (3.4.1)SE = load factor for settlement (3.4.1)TG = load factor for temperature gradient (3.4.1) = movement of top of wall required to reach minimum active or maximum passive pressure by tilting or lateral
translation (ft) (C3.11.1) (3.11.5.5)p = constant horizontal earth pressure due to uniform surcharge (ksf) (3.11.6.1)ph = constant horizontal pressure distribution on wall resulting from various types of surcharge loading (ksf)
(3.11.6.2)T = design thermal movement range (in.) (3.12.2.3)
H = horizontal stress due to surcharge load (ksf) (3.11.6.3)v = vertical stress due to surcharge load (ksf) (3.11.6.3)
= angle of truncated ice wedge (degrees); friction angle between fill and wall (degrees); angle betweenfoundation wall and a line connecting the point on the wall under consideration and a point on the bottomcorner of the footing furthest from the wall (rad) (C3.9.5) (3.11.5.3) (3.11.6.2)i = load modifier specified in Article 1.3.2; wall face batter (3.4.1) (3.11.5.9)
A-19

= angle of back of wall to the horizontal (degrees); angle of channel turn or bend (degrees); angle betweendirection of stream flow and the longitudinal axis of pier (degrees) (3.11.5.3) (3.14.5.2.3) (3.7.3.2)f = friction angle between ice floe and pier (degrees) (3.9.2.4.1) = standard deviation of normal distribution (3.14.5.3)T = tensile strength of ice (ksf) (C3.9.5) = Poisson’s Ratio (dim.) (3.11.6.2) = resistance factors (C3.4.1)f = angle of internal friction (degrees) (3.11.5.4)
f = effective angle of internal friction (degrees) (3.11.5.2)r = internal friction angle of reinforced fill (degrees) (3.11.6.3)s = angle of internal friction of retained soil (degrees) (3.11.5.6)
• Permanent LoadsCR = force effects due to creepDD = downdrag forceDC = dead load of structural components andnonstructural attachmentsDW = dead load of wearing surfaces and utilitiesEH = horizontal earth pressure loadEL = miscellaneous locked-in force effects resultingfrom the construction process, including jackingapart of cantilevers in segmental constructionES = earth surcharge loadEV = vertical pressure from dead load of earth fill
• Transient Loads
EQ = earthquake loadFR = friction loadIC = ice loadIM = vehicular dynamic load allowanceLL = vehicular live loadLS = live load surchargePL = pedestrian live loadSE = force effect due to settlementTG = force effect due to temperature gradientTU = force effect due to uniform temperatureWA = water load and stream pressureWL = wind on live loadWS = wind load on structure
1. INTRODUCTION
AASHTO LRFD principles were used in the design of this superstructure. The example is designed for a bridge withthree even spans, and has no skew. The bridge has two 12-foot wide lanes and two 6-foot wide shoulders, for a totalroadway width of 36' from curb to curb. The bridge deck is precast reinforced concrete with overhangs at the outermostgirders. The longitudinal girders are placed as simply supported modules, and made continuous with connection platesand cast-in-place deck joints. The design of the continuity at the deck joint is addressed in final sections of thisexample.
The cross-section consists of six modules. The interior modules are identical and consist of two steel girders and a 6'-0"precast composite deck slab. Exterior modules include two steel girders and a 6'-1" precast composite deck slab, withF-shape barriers. Grade 50 steel is used throughout, and the deck concrete has a compressive strength of 5,000 psi.
A-20

The closure pour joints between the modules use Ultra High Performance Concrete with a strength of 21,000 psi.
Steel girder design steps, including constructability checks, fatigue design for infinite fatigue lift (unless otherwise noted),and bearing stiffener design comprise the majority of the example. Diaphragm and deck design procedures are present,but not detailed.
Tips for reading this Design Example:
This calculation was prepared with Mathcad version 14. Mathcad was used in this instance to provide a clearrepresentation of formulas, and their execution. Design software other than Mathcad is recommended for aspeedier and more accurate design.
Mathcad is not a design software. Mathcad executes user mathematical and simple logic commands.
Example 1: User inputs are noted with dark shaded boxes. Shading of boxes allows the user to easily find thelocation of a desired variable. Given that equations are written in mathcad in the same fashion as they are onpaper, except that they are interactive, shading input cells allows the user to quicly locate inputs amongst otherdata on screen. Units are user inputs.
Height ofStructure:
Hstructure 25ft
Example 2: Equations are typed directly into the workspace. Mathcad then reads the operators and executesthe calculations.
Panels are 2.5' Npanels
Hstructure
2.5ftNpanels 10
Example 3: If Statements are an important operator that allow for the user to dictate a future value with givenparameters. They are marked by a solid bar and operate with the use of program specific logic commands.
Operator offers discountper volume of panels Discount .75 Npanels 6if
.55 Npanels 10if
1 otherwise
Discount 0.6
Example 4: True or False Verification Statements are an important operator that allow for the user to verify asystem criteria that has been manually input. They are marked by lighter shading to make a distinctionbetween the user inputs. True or false statements check a single or pairs of variables and return a Zero or One.
Owner to proceed if discountson retail below 60% Discount .55 1
2. DESIGN PHILOSOPHY
The superstructure of the bridge in this example consists of modules, which are two rolled steel girders supporting abridge deck panel along their length. The girders are assumed to be simply supported under the weight of the deckpanels. In each module, one girder is assumed to support half the weight of its respective deck panel.
The barrier wall is added to exterior modules once the deck and girders are joined. When working with the barrier deadload, the weight is assumed to be evenly distributed between the two modules. Under the additional barrier dead load, thegirders are again assumed to be simply supported.
Concerning transportation of modules, it is assumed that the deck has reached 28-day concrete strength, and the deck isfully composite with the girders. The self-weight of the module during lifting and placement is assumed as evenlydistributed to four pick points (two per girder).
The modules are placed such that there is a bearing on each end and are again simply supported. The continuous span
A-21
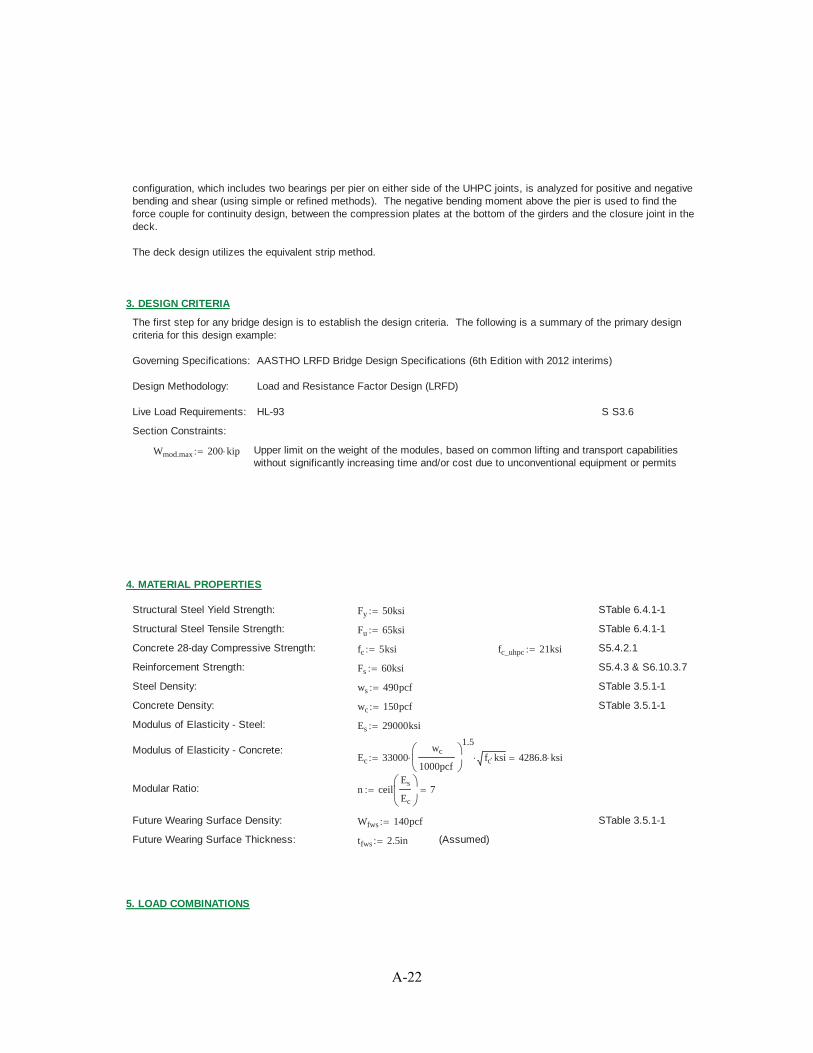
configuration, which includes two bearings per pier on either side of the UHPC joints, is analyzed for positive and negativebending and shear (using simple or refined methods). The negative bending moment above the pier is used to find theforce couple for continuity design, between the compression plates at the bottom of the girders and the closure joint in thedeck.
The deck design utilizes the equivalent strip method.
3. DESIGN CRITERIA
The first step for any bridge design is to establish the design criteria. The following is a summary of the primary designcriteria for this design example:
Governing Specifications: AASTHO LRFD Bridge Design Specifications (6th Edition with 2012 interims)
Design Methodology: Load and Resistance Factor Design (LRFD)
Live Load Requirements: HL-93 S S3.6
Section Constraints:
Wmod.max 200 kip Upper limit on the weight of the modules, based on common lifting and transport capabilitieswithout significantly increasing time and/or cost due to unconventional equipment or permits
4. MATERIAL PROPERTIES
Structural Steel Yield Strength: Fy 50ksi STable 6.4.1-1
Structural Steel Tensile Strength: Fu 65ksi STable 6.4.1-1
Concrete 28-day Compressive Strength: fc 5ksi fc_uhpc 21ksi S5.4.2.1
Reinforcement Strength: Fs 60ksi S5.4.3 & S6.10.3.7
Steel Density: ws 490pcf STable 3.5.1-1
Concrete Density: wc 150pcf STable 3.5.1-1
Modulus of Elasticity - Steel: Es 29000ksi
Modulus of Elasticity - Concrete:Ec 33000
wc
1000pcf
1.5
fc ksi 4286.8 ksi
Modular Ratio: n ceilEs
Ec
7
Future Wearing Surface Density: Wfws 140pcf STable 3.5.1-1
Future Wearing Surface Thickness: tfws 2.5in (Assumed)
5. LOAD COMBINATIONS
A-22
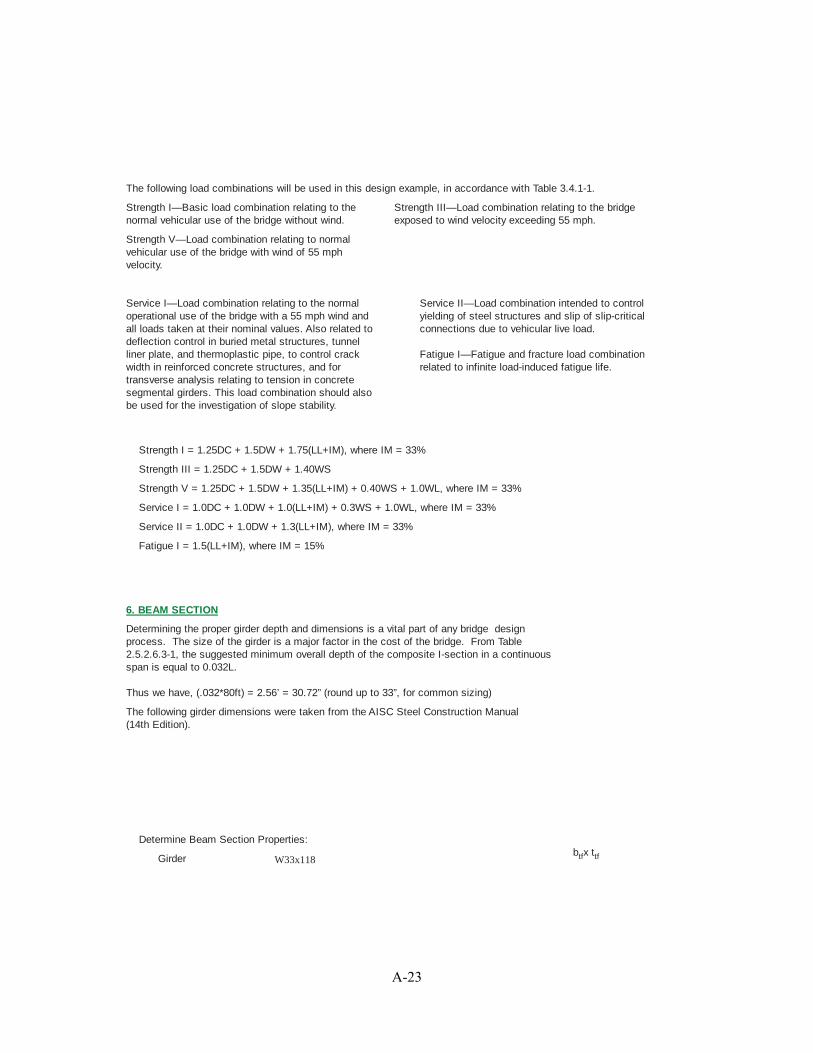
The following load combinations will be used in this design example, in accordance with Table 3.4.1-1.
Strength I—Basic load combination relating to thenormal vehicular use of the bridge without wind.
Strength III—Load combination relating to the bridgeexposed to wind velocity exceeding 55 mph.
Strength V—Load combination relating to normalvehicular use of the bridge with wind of 55 mphvelocity.
Service I—Load combination relating to the normaloperational use of the bridge with a 55 mph wind andall loads taken at their nominal values. Also related todeflection control in buried metal structures, tunnelliner plate, and thermoplastic pipe, to control crackwidth in reinforced concrete structures, and fortransverse analysis relating to tension in concretesegmental girders. This load combination should alsobe used for the investigation of slope stability.
Service II—Load combination intended to controlyielding of steel structures and slip of slip-criticalconnections due to vehicular live load.
Fatigue I—Fatigue and fracture load combinationrelated to infinite load-induced fatigue life.
Strength I = 1.25DC + 1.5DW + 1.75(LL+IM), where IM = 33%
Strength III = 1.25DC + 1.5DW + 1.40WS
Strength V = 1.25DC + 1.5DW + 1.35(LL+IM) + 0.40WS + 1.0WL, where IM = 33%
Service I = 1.0DC + 1.0DW + 1.0(LL+IM) + 0.3WS + 1.0WL, where IM = 33%
Service II = 1.0DC + 1.0DW + 1.3(LL+IM), where IM = 33%
Fatigue I = 1.5(LL+IM), where IM = 15%
6. BEAM SECTION
Determining the proper girder depth and dimensions is a vital part of any bridge designprocess. The size of the girder is a major factor in the cost of the bridge. From Table2.5.2.6.3-1, the suggested minimum overall depth of the composite I-section in a continuousspan is equal to 0.032L.
Thus we have, (.032*80ft) = 2.56’ = 30.72” (round up to 33”, for common sizing)
The following girder dimensions were taken from the AISC Steel Construction Manual (14th Edition).
Determine Beam Section Properties:btfx ttfGirder W33x118
A-23
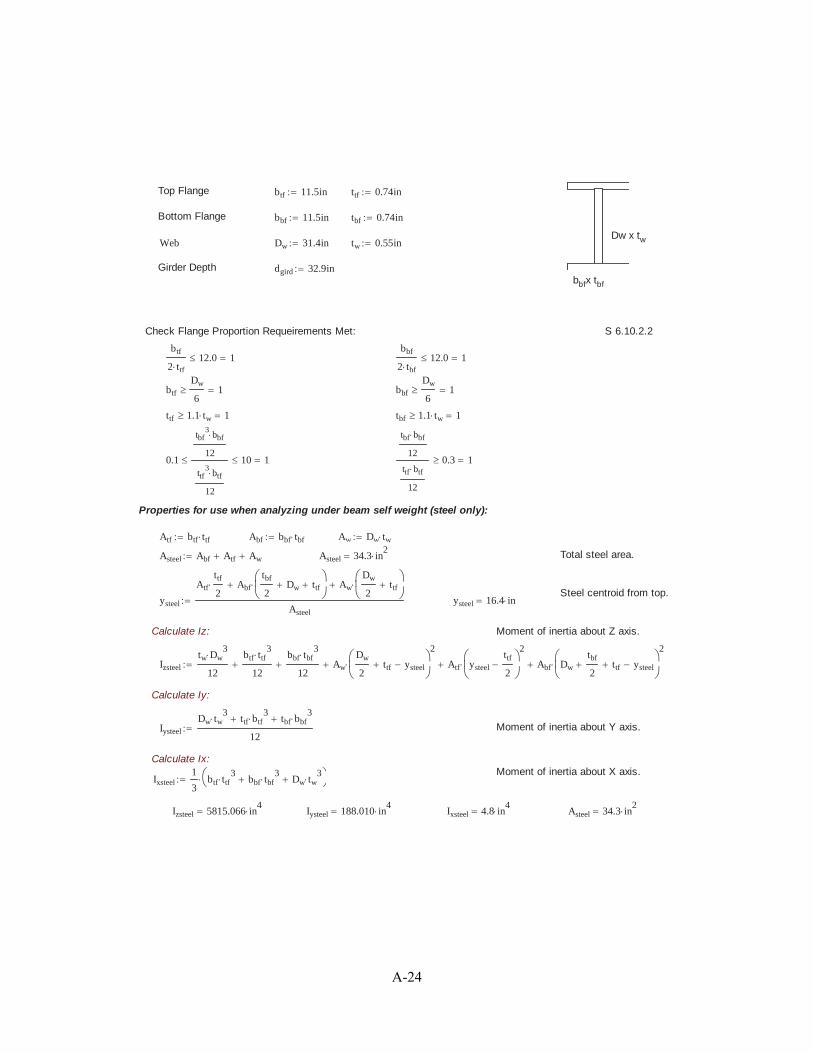
Top Flange btf 11.5in ttf 0.74in
Bottom Flange bbf 11.5in tbf 0.74in
Dw x twWeb Dw 31.4in tw 0.55in
Girder Depth dgird 32.9inbbfx tbf
Check Flange Proportion Requeirements Met: S 6.10.2.2
btf
2 ttf
12.0 1bbf
2 tbf
12.0 1
btf
Dw
61 bbf
Dw
61
ttf 1.1 tw 1 tbf 1.1 tw 1
0.1
tbf3
bbf
12
ttf3
btf
12
10 1
tbf bbf
12
ttf btf
12
0.3 1
Properties for use when analyzing under beam self weight (steel only):
Atf btf ttf Abf bbf tbf Aw Dw tw
Asteel Abf Atf Aw Asteel 34.3 in2 Total steel area.
Steel centroid from top.ysteel
Atf
ttf
2Abf
tbf
2Dw ttf Aw
Dw
2ttf
Asteel
ysteel 16.4 in
Calculate Iz: Moment of inertia about Z axis.
Izsteel
tw Dw3
12
btf ttf3
12
bbf tbf3
12Aw
Dw
2ttf ysteel
2
Atf ysteel
ttf
2
2
Abf Dw
tbf
2ttf ysteel
2
Calculate Iy:
Iysteel
Dw tw3
ttf btf3
tbf bbf3
12Moment of inertia about Y axis.
Calculate Ix:Moment of inertia about X axis.
Ixsteel1
3btf ttf
3bbf tbf
3Dw tw
3
Izsteel 5815.066 in4
Iysteel 188.010 in4
Ixsteel 4.8 in4
Asteel 34.3 in2
A-24
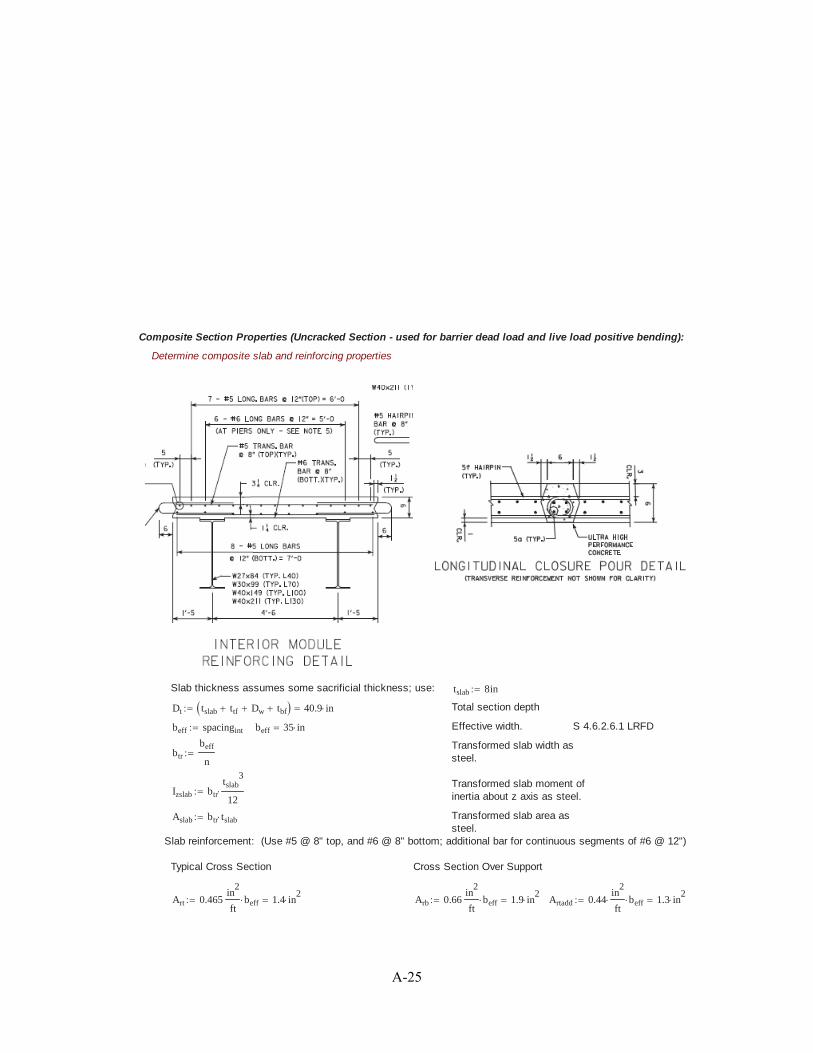
Composite Section Properties (Uncracked Section - used for barrier dead load and live load positive bending):
Determine composite slab and reinforcing properties
Slab thickness assumes some sacrificial thickness; use: tslab 8in
Dt tslab ttf Dw tbf 40.9 in Total section depth
beff spacingint beff 35 in Effective width. S 4.6.2.6.1 LRFD
Transformed slab width assteel.btr
beff
n
Transformed slab moment ofinertia about z axis as steel.Izslab btr
tslab3
12
Aslab btr tslab Transformed slab area assteel.
Slab reinforcement: (Use #5 @ 8" top, and #6 @ 8" bottom; additional bar for continuous segments of #6 @ 12")
Typical Cross Section Cross Section Over Support
Art 0.465in
2
ftbeff 1.4 in
2Arb 0.66
in2
ftbeff 1.9 in
2Artadd 0.44
in2
ftbeff 1.3 in
2
A-25
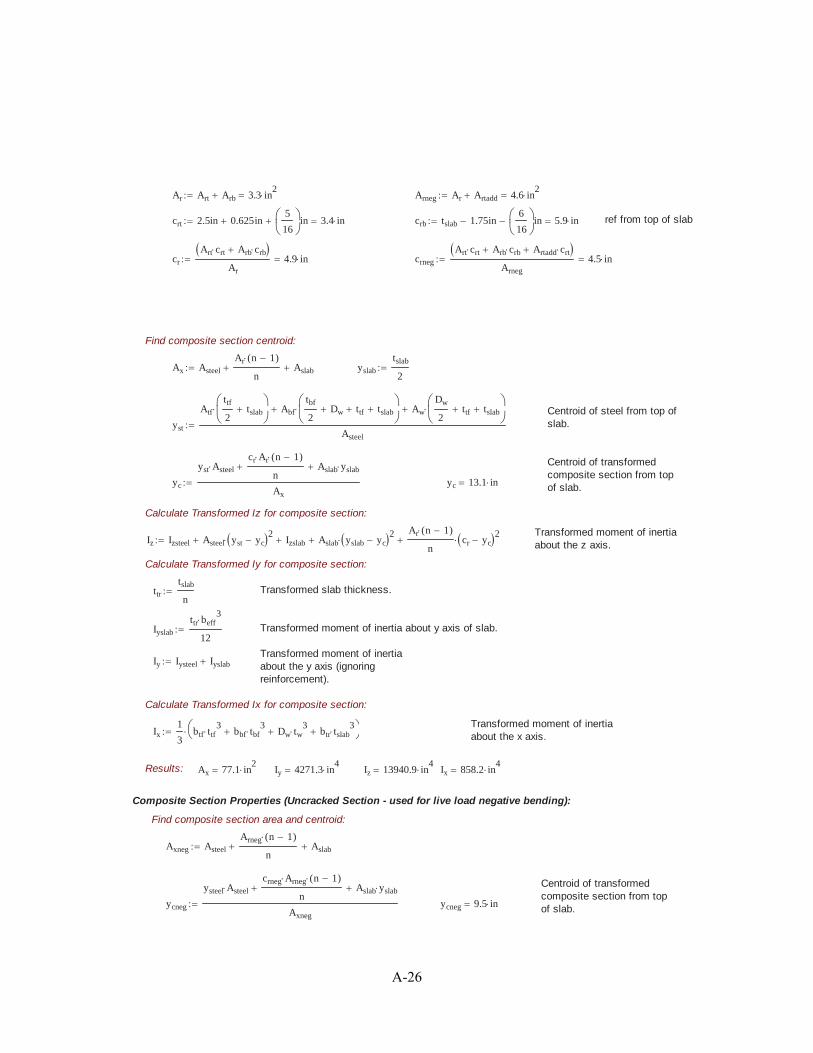
Ar Art Arb 3.3 in2
Arneg Ar Artadd 4.6 in2
crt 2.5in 0.625in5
16in 3.4 in crb tslab 1.75in
6
16in 5.9 in ref from top of slab
cr
Art crt Arb crb
Ar
4.9 in crneg
Art crt Arb crb Artadd crt
Arneg
4.5 in
Find composite section centroid:
Ax Asteel
Ar n 1( )
nAslab yslab
tslab
2
Centroid of steel from top ofslab.yst
Atf
ttf
2tslab Abf
tbf
2Dw ttf tslab Aw
Dw
2ttf tslab
Asteel
Centroid of transformedcomposite section from topof slab.yc
yst Asteel
cr Ar n 1( )
nAslab yslab
Ax
yc 13.1 in
Calculate Transformed Iz for composite section:
Transformed moment of inertiaabout the z axis.Iz Izsteel Asteel yst yc
2Izslab Aslab yslab yc
2 Ar n 1( )
ncr yc
2
Calculate Transformed Iy for composite section:
ttr
tslab
nTransformed slab thickness.
Iyslab
ttr beff3
12Transformed moment of inertia about y axis of slab.
Transformed moment of inertiaabout the y axis (ignoringreinforcement).
Iy Iysteel Iyslab
Calculate Transformed Ix for composite section:
Transformed moment of inertiaabout the x axis.Ix
1
3btf ttf
3bbf tbf
3Dw tw
3btr tslab
3
Results: Ax 77.1 in2
Iy 4271.3 in4
Iz 13940.9 in4
Ix 858.2 in4
Composite Section Properties (Uncracked Section - used for live load negative bending):
Find composite section area and centroid:
Axneg Asteel
Arneg n 1( )
nAslab
Centroid of transformedcomposite section from topof slab.ycneg
ysteel Asteel
crneg Arneg n 1( )
nAslab yslab
Axneg
ycneg 9.5 in
A-26

Calculate Transformed Izneg for composite negative moment section:
Transformed momentof inertia about the zaxis.
Izneg Izsteel Asteel ysteel ycneg2
Izslab Aslab yslab ycneg2 Arneg n 1( )
ncrneg ycneg
2
Izneg 8989.1 in4
Composite Section Properties (Cracked Section - used for live load negative bending):
Find cracked section area and centroid:
Acr Asteel Arneg 38.9 in2
ycr
Asteel ysteel Arneg crneg
Acr
15 in ycrb tslab ttf Dw tbf ycr 25.8 in
Find cracked section moments of inertia and section moduli:
Izcr Izsteel Asteel ysteel ycr2
Ar cr ycr2
Izcr 6222 in4
Iycr Iysteel Iycr 188 in4
Ixcr1
3btf ttf
3bbf ttf
3Dw tw
3Ixcr 4.8 in
4
dtopcr ycr crt dtopcr 11.6 in
dbotcr tslab ttf Dw tbf ycr dbotcr 25.8 in
Stopcr
Izcr
dtopcr
Stopcr 536.6 in3
Sbotcr
Izcr
dbotcr
Sbotcr 240.7 in3
7. PERMANENT LOADS
Phase 1: Steel girders are simply supported, and support their self-weight plus the weight of the slab. Steel girders ineach module for this example are separated by three diaphragms - one at each bearing location, and one at midspan.Other module span configurations may require an increase or decrease in the number of diaphragms.
Wdeck_int wc spacingint td Wdeck_int 382.8 plf
Wdeck_ext wc spacingext td Wdeck_ext 393.8 plf
Whaunch wc wh th Whaunch 21.9 plf
Wstringer ws1 Wstringer 118 plf
Diaphragms: MC18x42.7 Thickness Conn. Plate tconn5
8in
Diaphragm Weight ws2 42.7plf Width Conn. Plate wconn 5in
Diaphragm Length Ldiaph 4ft 2.5in Height Conn. Plate hconn 28.5in
Wdiaphragm ws2
Ldiaph
2 Wdiaphragm 89.8 lbf
A-27

Wconn 2 ws tconn wconn hconn Wconn 50.5 lbf
WDCpoint Wdiaphragm Wconn 1.05WDCpoint 147.4 lbf
Equivalent distributed load from DC point loads: wDCpt_equiv
3 WDCpoint
Lstr
5.6 plf
Interior Uniform Dead Load, Phase 1: WDCuniform1_int Wdeck_int Whaunch Wstringer wDCpt_equiv 528.2 plf
Exterior Uniform Dead Load, Phase 1: WDCuniform1_ext Wdeck_ext Whaunch Wstringer wDCpt_equiv 539.2 plf
Moments due to Phase 1 DL: MDC1_int x( )WDCuniform1_int x
2Lstr x MDC1_ext x( )
WDCuniform1_ext x
2Lstr x
Shear due to Phase 1 DL: VDC1_int x( ) WDCuniform1_int
Lstr
2x VDC1_ext x( ) WDCuniform1_ext
Lstr
2x
Phase 2: Steel girders are simply supported and composite with the deck slab, and support their self-weight plus theweight of the slab in addition to barriers on exterior modules. Barriers are assumed to be evenly distributed betweenthe two exterior module girders.
Barrier Area Abarrier 2.89ft2
Barrier Weight Wbarrier
wc Abarrier
2Wbarrier 216.8 plf
Interior Dead Load, Phase 2: WDCuniform_int WDCuniform1_int 528.2 plf
Exterior Dead Load, Phase 2: WDCuniform_ext WDCuniform1_ext Wbarrier 755.9 plf
Moments due to Phase 2 DL: MDC2_int x( )WDCuniform_int x
2Lstr x MDC2_ext x( )
WDCuniform_ext x
2Lstr x
Shear due to Phase 2 DL: VDC2_int x( ) WDCuniform_int
Lstr
2x VDC2_ext x( ) WDCuniform_ext
Lstr
2x
Phase 3: Girders are composite and have been made continuous. Utilities and future wearing surface are applied.
Unit Weight Overlay wws 30psf
Wws_int wws spacingint Wws_int 87.5 plfWws_ext wws spacingext 1 ft 7in
Wws_ext 42.5 plf
Unit Weight Utilities Wu 15plf
WDWuniform_int Wws_int Wu WDWuniform_int 102.5 plfWDWuniform_ext Wws_ext Wu WDWuniform_ext 57.5 plf
Moments due to DW: MDW_int x( )WDWuniform_int x
2Lstr x MDW_ext x( )
WDWuniform_ext x
2Lstr x
Shears due to DW: VDW_int x( ) WDWuniform_int
Lstr
2x VDW_ext x( ) WDWuniform_ext
Lstr
2x
A-28
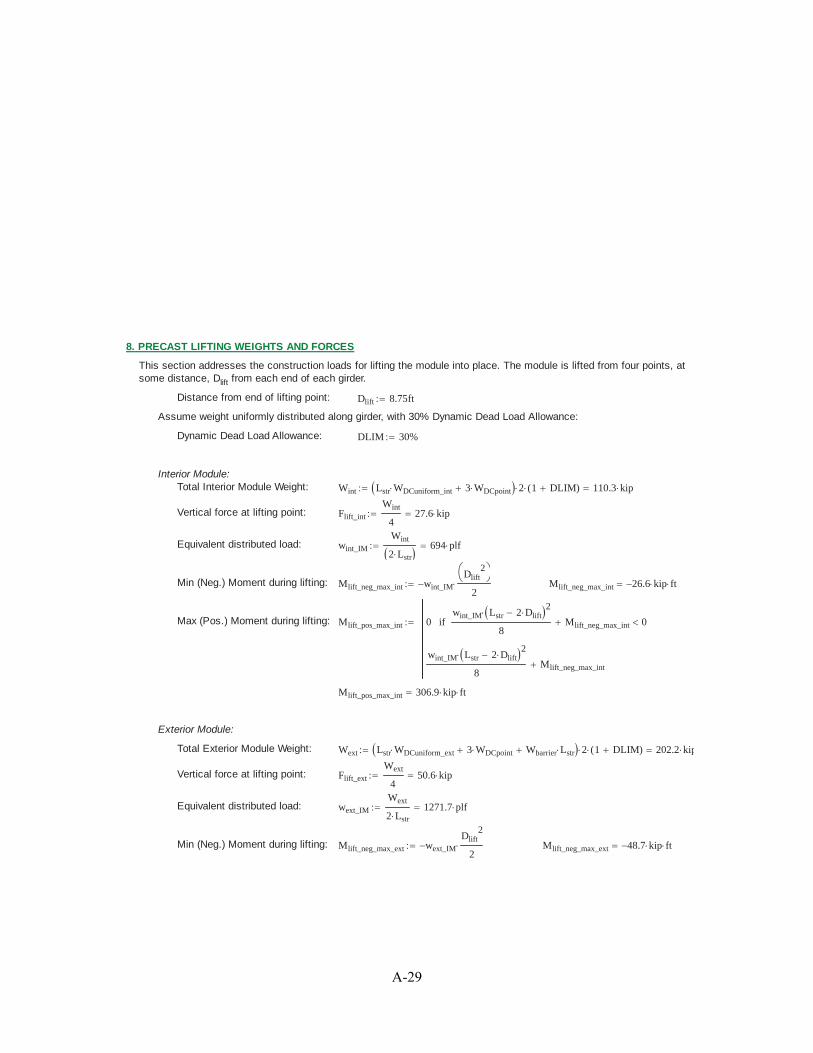
8. PRECAST LIFTING WEIGHTS AND FORCES
This section addresses the construction loads for lifting the module into place. The module is lifted from four points, atsome distance, Dlift from each end of each girder.
Distance from end of lifting point: Dlift 8.75ft
Assume weight uniformly distributed along girder, with 30% Dynamic Dead Load Allowance:
Dynamic Dead Load Allowance: DLIM 30%
Interior Module:Total Interior Module Weight: Wint Lstr WDCuniform_int 3 WDCpoint 2 1 DLIM( ) 110.3 kip
Vertical force at lifting point: Flift_int
Wint
427.6 kip
Equivalent distributed load: wint_IM
Wint
2 Lstr
694 plf
Min (Neg.) Moment during lifting: Mlift_neg_max_int wint_IM
Dlift2
2Mlift_neg_max_int 26.6 kip ft
Max (Pos.) Moment during lifting: Mlift_pos_max_int 0wint_IM Lstr 2 Dlift
2
8Mlift_neg_max_int 0if
wint_IM Lstr 2 Dlift2
8Mlift_neg_max_int
Mlift_pos_max_int 306.9 kip ft
Exterior Module:
Total Exterior Module Weight: Wext Lstr WDCuniform_ext 3 WDCpoint Wbarrier Lstr 2 1 DLIM( ) 202.2 kip
Vertical force at lifting point: Flift_ext
Wext
450.6 kip
Equivalent distributed load: wext_IM
Wext
2 Lstr
1271.7 plf
Min (Neg.) Moment during lifting: Mlift_neg_max_ext wext_IM
Dlift2
2Mlift_neg_max_ext 48.7 kip ft
A-29

Max (Pos.) Moment during lifting: Mlift_pos_max_ext 0wext_IM Lstr 2 Dlift
2
8Mlift_neg_max_ext 0if
wext_IM Lstr 2 Dlift2
8Mlift_neg_max_ext
Mlift_pos_max_ext 562.4 kip ft
Max Shear during lifting: Vlift max wext_IM Dlift Flift_ext wext_IM Dlift 39.4 kip
9. LIVE LOAD DISTRIBUTION FACTORS
These factors represent the distribution of live load from the deck to the girders in accordance with AASHTO Section 4,and assumes the deck is fully continuous across the joints.
Girder Section Modulus: Izsteel 5815.1 in4
Girder Area: Asteel 34.3 in2
Girder Depth: dgird 32.9 in
Distance betweencentroid of deck andcentroid of beam:
eg
td
2th
dgird
223.7 in
Modular Ratio: n 7
Multiple PresenceFactors:
MP1 1.2 MP2 1.0 S3.6.1.1.2-1
Interior Stringers for Moment:S4.6.2.2.1-1
One Lane Loaded: Kg n Izsteel Asteel eg2
175527.9 in4
gint_1m 0.06spacingint
14ft
0.4spacingint
Lspan
0.3Kg
Lspan td3
0.1
0.226
Two Lanes Loaded: gint_2m 0.075spacingint
9.5ft
0.6spacingint
Lspan
0.2Kg
Lspan td3
0.1
0.288
Governing Factor: gint_m max gint_1m gint_2m 0.288
Interior Stringers for Shear:One Lane Loaded: gint_1v 0.36
spacingint
25ft0.477
Two Lanes Loaded: gint_2v 0.2spacingint
12ft
spacingint
35ft
2
0.436
Governing Factor: gint_v max gint_1v gint_2v 0.477
Exterior Stringers for Moment:
A-30
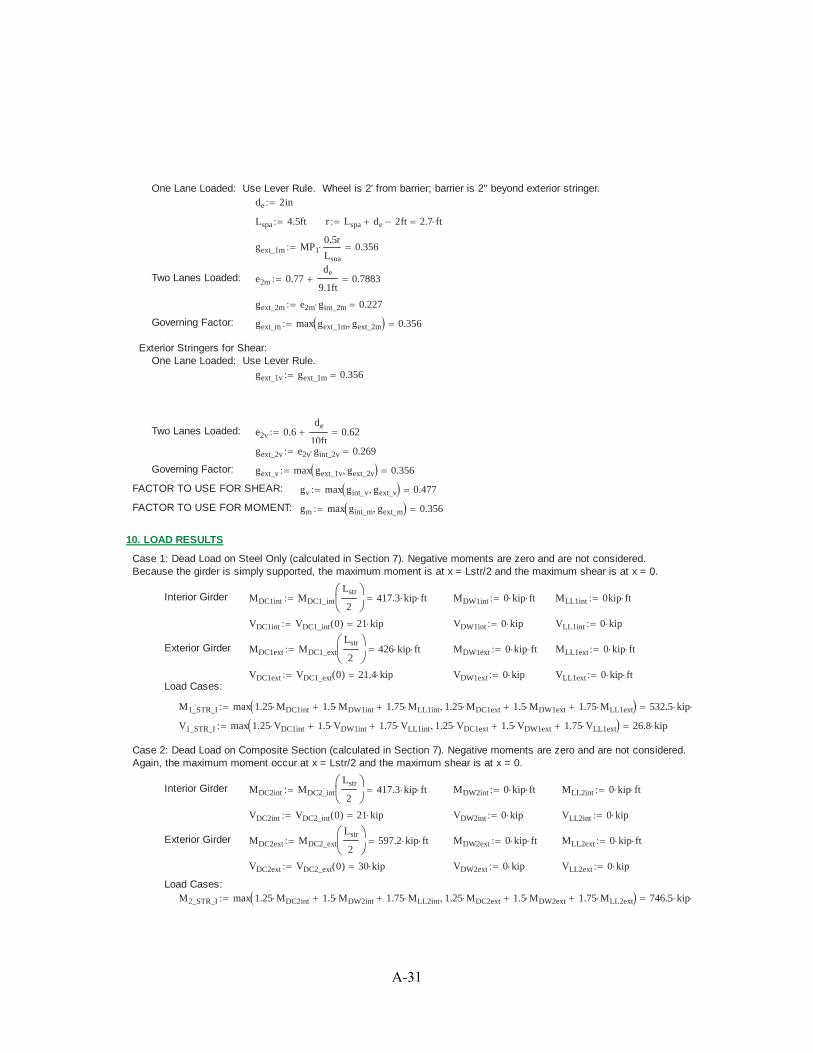
One Lane Loaded: Use Lever Rule. Wheel is 2' from barrier; barrier is 2" beyond exterior stringer.de 2in
Lspa 4.5ft r Lspa de 2ft 2.7 ft
gext_1m MP10.5r
Lspa
0.356
Two Lanes Loaded: e2m 0.77de
9.1ft0.7883
gext_2m e2m gint_2m 0.227
Governing Factor: gext_m max gext_1m gext_2m 0.356
Exterior Stringers for Shear:One Lane Loaded: Use Lever Rule.
gext_1v gext_1m 0.356
Two Lanes Loaded: e2v 0.6de
10ft0.62
gext_2v e2v gint_2v 0.269
Governing Factor: gext_v max gext_1v gext_2v 0.356
FACTOR TO USE FOR SHEAR: gv max gint_v gext_v 0.477
FACTOR TO USE FOR MOMENT: gm max gint_m gext_m 0.356
10. LOAD RESULTS
Case 1: Dead Load on Steel Only (calculated in Section 7). Negative moments are zero and are not considered.Because the girder is simply supported, the maximum moment is at x = Lstr/2 and the maximum shear is at x = 0.
Interior Girder MDC1int MDC1_int
Lstr
2417.3 kip ft MDW1int 0 kip ft MLL1int 0kip ft
VDC1int VDC1_int 0( ) 21 kip VDW1int 0 kip VLL1int 0 kip
Exterior Girder MDC1ext MDC1_ext
Lstr
2426 kip ft MDW1ext 0 kip ft MLL1ext 0 kip ft
VDC1ext VDC1_ext 0( ) 21.4 kip VDW1ext 0 kip VLL1ext 0 kip ftLoad Cases:
M1_STR_I max 1.25 MDC1int 1.5 MDW1int 1.75 MLL1int 1.25 MDC1ext 1.5 MDW1ext 1.75 MLL1ext 532.5 kip f
V1_STR_I max 1.25 VDC1int 1.5 VDW1int 1.75 VLL1int 1.25 VDC1ext 1.5 VDW1ext 1.75 VLL1ext 26.8 kip
Case 2: Dead Load on Composite Section (calculated in Section 7). Negative moments are zero and are not considered.Again, the maximum moment occur at x = Lstr/2 and the maximum shear is at x = 0.
Interior Girder MDC2int MDC2_int
Lstr
2417.3 kip ft MDW2int 0 kip ft MLL2int 0 kip ft
VDC2int VDC2_int 0( ) 21 kip VDW2int 0 kip VLL2int 0 kip
Exterior Girder MDC2ext MDC2_ext
Lstr
2597.2 kip ft MDW2ext 0 kip ft MLL2ext 0 kip ft
VDC2ext VDC2_ext 0( ) 30 kip VDW2ext 0 kip VLL2ext 0 kip
Load Cases:M2_STR_I max 1.25 MDC2int 1.5 MDW2int 1.75 MLL2int 1.25 MDC2ext 1.5 MDW2ext 1.75 MLL2ext 746.5 kip f
A-31

V2_STR_I max 1.25 VDC2int 1.5 VDW2int 1.75 VLL2int 1.25 VDC2ext 1.5 VDW2ext 1.75 VLL2ext 37.6 kip
Case 3: Composite girders are lifted into place from lifting points located distance Dlift from the girder edges.
Maximum moments and shears were calculated in Section 8.
Interior Girder MDC3int Mlift_pos_max_int 306.9 kip ft MDW3int 0 kip ft MLL3int 0 kip ft
MDC3int_neg Mlift_neg_max_int 26.6 kip ft MDW3int_neg 0 kip ft MLL3int_neg 0 kip ft
VDC3int Vlift 39.4 kip VDW3int 0 kip VLL3int 0 kip
Exterior Girder MDC3ext Mlift_pos_max_ext 562.4 kip ft MDW3ext 0 kip ft MLL3ext 0 kip ft
MDC3ext_neg Mlift_neg_max_ext 48.7 kip ft MDW3ext_neg 0 kip ft MLL3ext_neg 0 kip ft
VDC3ext Vlift 39.4 kip VDW3ext 0 kip VLL3ext 0 kip
Load Cases:M3_STR_I max 1.5 MDC3int 1.5 MDW3int 1.5 MDC3ext 1.5 MDW3ext 843.6 kip ft
M3_STR_I_neg max 1.5 MDC3int_neg 1.5 MDW3int_neg 1.5 MDC3ext_neg 1.5 MDW3ext_neg 73 kip ft
V3_STR_I max 1.5 VDC3int 1.5 VDW3int 1.5 VDC3ext 1.5 VDW3ext 59.1 kip
Case 4: Composite girders made continuous. Utilities and future wearing surface are applied, and live load. Maximummoment and shear results are from a finite element analysis not included in this design example. The live load valueincludes the lane fraction calculated in Section 9, and impact.
Governing Loads: MDC4 387 kip ft MDW4 52.5 kip ft MLL4 537.98 kip ft
MWS4 0kip ft MW4 0kip ft
MDC4neg 483.8 kip ft MDW4neg 65.6 kip ft MLL4neg 541.16kip ft
MWS4neg 0 kip ft MWL4neg 0 kip ft
VDC 36.3kip VDW 4.9kip VLL 107.7kip
Vu 1.25 VDC 1.5 VDW 1.75 VLL gv 142.6 kip
Load Cases:M4_STR_I 1.25 MDC4 1.5 MDW4 1.75 MLL4 1504 kip ft
M4_STR_I_neg 1.25 MDC4neg 1.5 MDW4neg 1.75 MLL4neg 1650.2 kip ft
M4_STR_III 1.25 MDC4 1.5 MDW4 1.4 MWS4 562.5 kip ft
M4_STR_III_neg 1.25 MDC4neg 1.5 MDW4neg 1.4 MWS4 703.1 kip ft
M4_STR_V 1.25 MDC4 1.5 MDW4 1.35 MLL4 0.4 MWS4 1.0 MW4 1288.8 kip ft
M4_STR_V_neg 1.25 MDC4neg 1.5 MDW4neg 1.35 MLL4neg 0.4 MWS4neg 1.0 MWL4neg 1433.7 kip ft
M4_SRV_I 1.0 MDC4 1.0 MDW4 1.0 MLL4 0.3 MWS4 1.0 MW4 977.5 kip ft
M4_SRV_I_neg 1.0 MDC4neg 1.0 MDW4neg 1.0 MLL4neg 0.3 MWS4neg 1.0 MWL4neg 1090.6 kip ft
M4_SRV_II 1.0 MDC4 1.0 MDW4 1.3 MLL4 1138.9 kip ft
M4_SRV_II_neg 1.0 MDC4neg 1.0 MDW4neg 1.3 MLL4neg 1252.9 kip ft
A-32
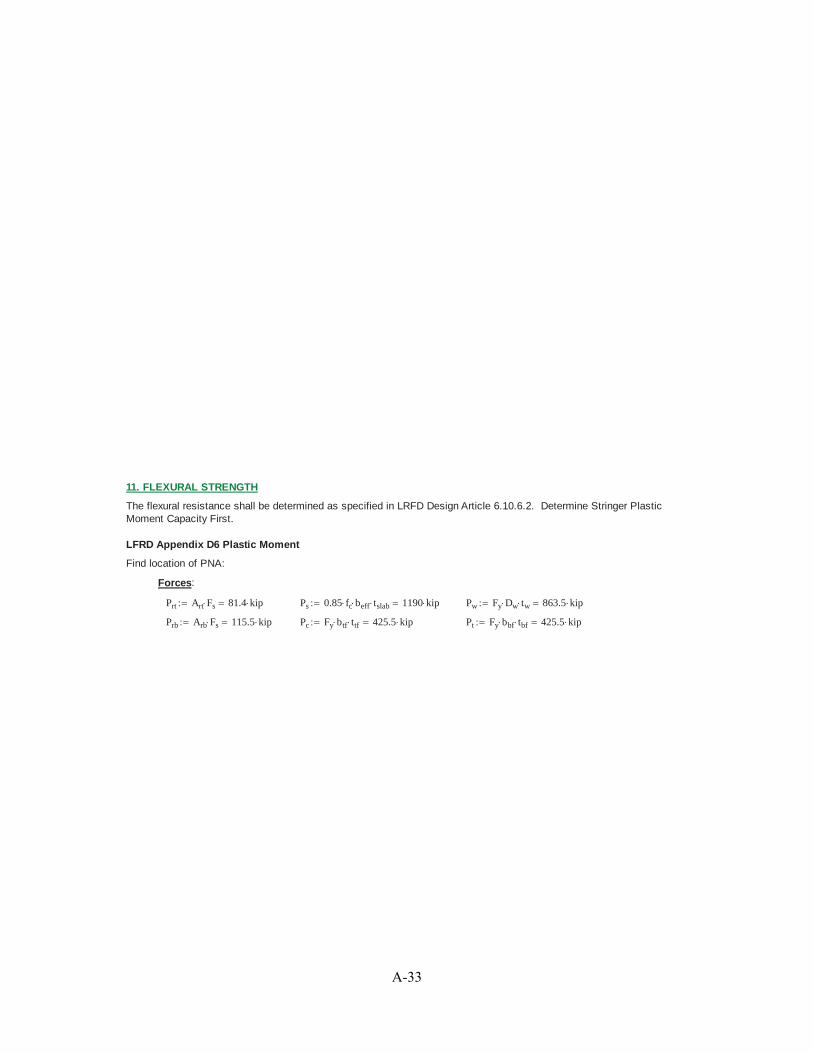
11. FLEXURAL STRENGTH
The flexural resistance shall be determined as specified in LRFD Design Article 6.10.6.2. Determine Stringer PlasticMoment Capacity First.
LFRD Appendix D6 Plastic Moment
Find location of PNA:
Forces:
Prt Art Fs 81.4 kip Ps 0.85 fc beff tslab 1190 kip Pw Fy Dw tw 863.5 kip
Prb Arb Fs 115.5 kip Pc Fy btf ttf 425.5 kip Pt Fy bbf tbf 425.5 kip
A-33

PNApos "case 1" Pt Pw Pc Ps Prt Prbif
"case 2" Pt Pw Pc Ps Prt Prbif
"case 3" Pt Pw Pc
crb
tslab
Ps Prt Prbif
"case 4" Pt Pw Pc Prb
crb
tslab
Ps Prtif
"case 5" Pt Pw Pc Prb
crt
tslab
Ps Prtif
"case 6" Pt Pw Pc Prb Prt
crt
tslab
Psif
"case 7" Pt Pw Pc Prb Prt
crt
tslab
Psif otherwise
otherwise
otherwise
otherwise
otherwise
otherwise
PNApos "case 2"
PNAneg "case 1" Pc Pw Pt Prt Prbif
"case 2" Pt Pw Pc Prt Prbif otherwise PNAneg "case 1"
Calculate Y, Dp, and Mp: D Dw ts tslab th 0 Crt crt Crb crb
Case I : Plastic Nuetral Axis in the Steel Web
Y1D
2
Pt Pc Ps Prt Prb
Pw
1 DP1 ts th ttf Y1
MP1
Pw
2DY1
2D Y1
2Ps Y1
ts
2ttf th Prt ts Crt ttf Y1 th Prb ts Crb ttf Y1 th
Pc Y1
ttf
2Pt D Y1
tbf
2
Y1negD
21
Pc Pt Prt Prb
Pw
Dp1neg ts th ttf Y1neg
DCP1negD
2 Pw
Pt Pw Prb Prt Pc
A-34

Mp1neg
Pw
2 DY1neg
2Dw Y1neg
2Prt ts Crt ttf Y1neg th Prb ts Crb ttf Y1neg th
Pt D Y1neg
tbf
2Pc Y1neg
ttf
2
Case II: Plastic Nuetral Axis in the Steel Top Flange
Y2
ttf
2
Pw Pt Ps Prt Prb
Pc
1 DP2 ts th Y2
MP2
Pc
2ttf
Y22
ttf Y22
Ps Y2
ts
2th Prt ts Crt th Y2 Prb ts Crb th Y2
PwD
2ttf Y2 Pt D Y2
tbf
2ttf
Y2neg
ttf
21
Pw Pc Prt Prb
Pt
DP2neg ts th Y2neg DCP2neg D
Mp2neg
Pt
2 ttf
Y2neg2
ttf Y2neg2
Prt ts Crt th Y2neg Prb ts Crb th Y2neg
Pw ttf Y2negD
2Pc ts th Y2neg
ttf
2
Case III: Plastic Nuetral Axis in the Concrete Deck Below the Bottom Reinforcing
Y3 ts
Pc Pw Pt Prt Prb
Ps
DP3 Y3
MP3
Ps
2ts
Y32
Prt Y3 Crt Prb Crb Y3 Pc
ttf
2ts th Y3 Pw
D
2ttf th ts Y3
Pt Dtbf
2ttf ts th Y3
Case IV: Plastic Nuetral Axis in the Concrete Deck in the bottom reinforcing layer
Y4 Crb DP4 Y4
MP4
Ps
2ts
Y42
Prt Y4 Crt Pc
ttf
2th ts Y4 Pw
D
2ttf th ts Y4
Pt Dtbf
2ttf th ts Y4
Case V: Plastic Nuetral Axis in the Concrete Deck between top and bot reinforcing layers
Y5 ts
Prb Pc Pw Pt Prt
Ps
DP5 Y5
MP5
Ps
2ts
Y52
Prt Y5 Crt Prb ts Crb Y5 Pc
ttf
2ts th Y5 Pw
D
2ttf th ts Y5
Pt Dtbf
2ttf ts th Y5
A-35

Ypos Y1 PNApos "case 1"=if
Y2 PNApos "case 2"=if
Y3 PNApos "case 3"=if
Y4 PNApos "case 4"=if
Y5 PNApos "case 5"=if
DPpos DP1 PNApos "case 1"=if
DP2 PNApos "case 2"=if
DP3 PNApos "case 3"=if
DP4 PNApos "case 4"=if
DP5 PNApos "case 5"=if
MPpos MP1 PNApos "case 1"=if
MP2 PNApos "case 2"=if
MP3 PNApos "case 3"=if
MP4 PNApos "case 4"=if
MP5 PNApos "case 5"=if
Ypos 0.3 in DPpos 8.3 in MPpos 2793 kip ft
Dp = distance from the top of slab of composite section to the neutral axis atthe plastic moment (neglect positive moment reinforcement in the slab).
Yneg Y1neg PNAneg "case 1"=if
Y2neg PNAneg "case 2"=if
DPneg Dp1neg PNAneg "case 1"=if
DP2neg PNAneg "case 2"=if
MPneg Mp1neg PNAneg "case 1"=if
Mp2neg PNAneg "case 2"=if
Yneg 12.1 in DPneg 20.9 in MPneg 23955 kip in
Depth of web in compression at the plastic moment [D6.3.2]:
At bbf tbf Ac btf ttf
DcpposD
2
Fy At Fy Ac 0.85 fc Aslab Fs Ar
Fy Aw
1
Dcppos 0in( ) PNApos "case 1"if
0in( ) Dcppos 0if
Dcppos PNApos "case 1"=if
Dcpneg DCP1neg PNAneg "case 1"=if
DCP2neg PNAneg "case 2"=if
Dcpneg 19.3 in
Dcppos 0 in
Positive Flexural Compression Check:
From LRFD Article 6.10.2
Check for compactness:
Web Proportions: Web slenderness Limit:
Dw
tw
150 1 2Dcppos
tw
3.76Es
Fy
1 S 6.10.6.2.2
Therefore Section is considered compact and shall satisfy the requirements of Article 6.10.7.1.
Mn MPpos DPpos 0.1 Dtif
MPpos 1.07 0.7DPpos
Dt
otherwise Mn 2592.3 kip ft
Negative Moment Capacity Check (Appendix A6):
Web Slenderness: Dt 40.9 in Dcneg Dt ycr tbf 25.1 in
2 Dcneg
tw
5.7Es
Fy
1 S Appendix A6 (for skew less than 20 deg).
Moment ignoring concrete:
A-36

Myt Fy Sbotcr 12036.4 kip in Myc Fs Stopcr 32194.6 kip in
My min Myc Myt 12036.4 kip in
Web Compactness:
Check for Permanent Deformations (6.10.4.2):
Dn max tslab ttf Dw yc yc tslab ttf 27 in
Gov if yc tslab ttf yc crt Dn 9.7 in
fn M4_SRV_II_negGov
Iz
10.4 ksi Steel stress on side of Dn
ρ min 1.0Fy
fn
1 β 2 Dn
tw
Atf
3.5 Rh12 β 3ρ ρ
3
12 2 β( )1
λrw 5.7Es
Fy
λPWdcp min λrw
Dcpneg
Dcneg
Es
Fy
0.54MPneg
Rh My
0.09
224.8
2Dcpneg
tw
λPWdcp 0
Web Plastification: Rpc
MPneg
Myc
0.7 Rpt
MPneg
Myt
2
Flexure Factor: ϕf 1.0
Tensile Limit: Mr_neg_t ϕf Rpt Myt 1996.3 kip ft
Compressive Limit:
Local Buckling Resistance:
λf
bbf
2 tbf
7.8 λrf 0.95 0.76Es
Fy
19.9
λpf 0.38Es
Fy
9.2 Fyresid max min 0.7 Fy Rh Fy
Stopcr
Sbotcr
Fy 0.5 Fy 35.0 ksi
MncLB Rpc Myc λf λpfif
Rpc Myc 1 1Fyresid Stopcr
Rpc Myc
λf λpf
λrf λpf
otherwise MncLB 1996.3 kip ft
Lateral Torsional Buckling Resistance:
Lb
Lstr
2 313.2 ft Inflection point assumed to be at 1/6 span
rt
bbf
12 11
3
Dcneg tw
bbf tbf
2.7 in
A-37
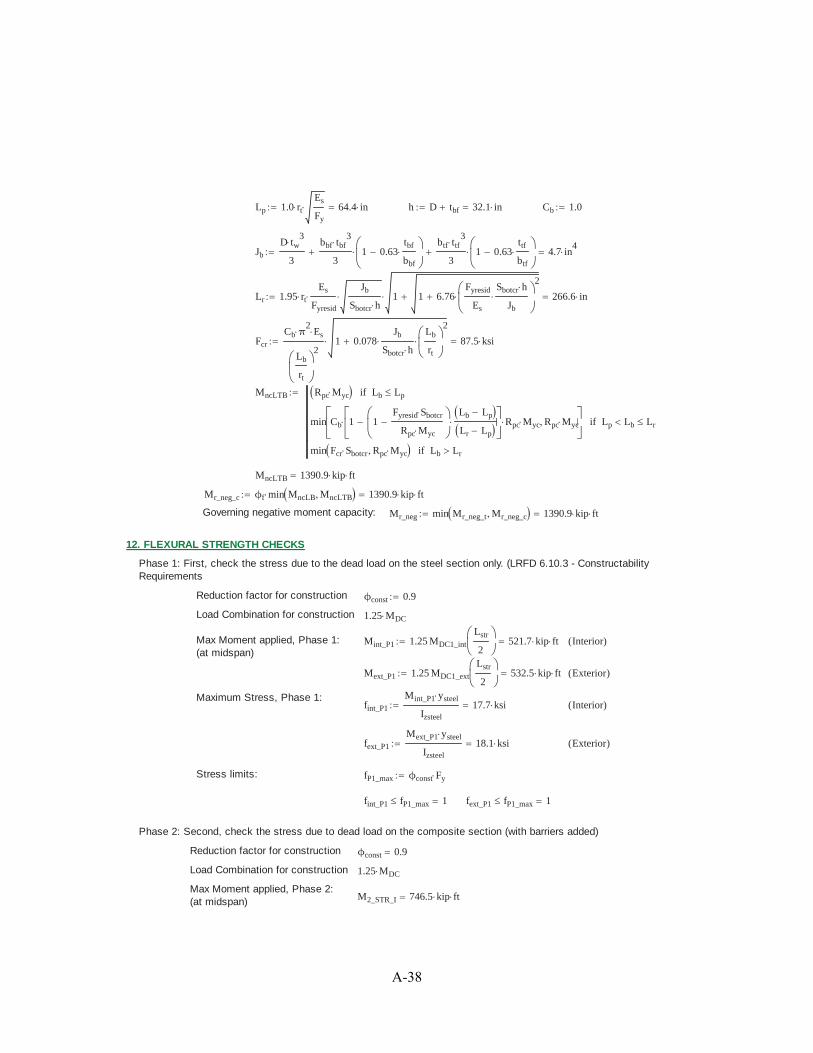
Lp 1.0 rt
Es
Fy
64.4 in h D tbf 32.1 in Cb 1.0
Jb
D tw3
3
bbf tbf3
31 0.63
tbf
bbf
btf ttf3
31 0.63
ttf
btf
4.7 in4
Lr 1.95 rt
Es
Fyresid
Jb
Sbotcr h1 1 6.76
Fyresid
Es
Sbotcr h
Jb
2
266.6 in
Fcr
Cb π2
Es
Lb
rt
21 0.078
Jb
Sbotcr h
Lb
rt
2
87.5 ksi
MncLTB Rpc Myc Lb Lpif
min Cb 1 1Fyresid Sbotcr
Rpc Myc
Lb Lp
Lr Lp
Rpc Myc Rpc Myc Lp Lb Lrif
min Fcr Sbotcr Rpc Myc Lb Lrif
MncLTB 1390.9 kip ft
Mr_neg_c ϕf min MncLB MncLTB 1390.9 kip ft
Governing negative moment capacity: Mr_neg min Mr_neg_t Mr_neg_c 1390.9 kip ft
12. FLEXURAL STRENGTH CHECKS
Phase 1: First, check the stress due to the dead load on the steel section only. (LRFD 6.10.3 - ConstructabilityRequirements
Reduction factor for construction ϕconst 0.9
Load Combination for construction 1.25 MDC
Max Moment applied, Phase 1:(at midspan)
Mint_P1 1.25 MDC1_int
Lstr
2521.7 kip ft Interior( )
Mext_P1 1.25 MDC1_ext
Lstr
2532.5 kip ft Exterior( )
Maximum Stress, Phase 1:fint_P1
Mint_P1 ysteel
Izsteel
17.7 ksi Interior( )
fext_P1
Mext_P1 ysteel
Izsteel
18.1 ksi Exterior( )
Stress limits: fP1_max ϕconst Fy
fint_P1 fP1_max 1 fext_P1 fP1_max 1
Phase 2: Second, check the stress due to dead load on the composite section (with barriers added)
Reduction factor for construction ϕconst 0.9
Load Combination for construction 1.25 MDC
Max Moment applied, Phase 2:(at midspan) M2_STR_I 746.5 kip ft
A-38

Capacity for positive flexure: Mn 2592.3 kip ft
Check Moment: M2_STR_I ϕconst Mn 1
Phase 3: Next, check the flexural stress on the stringer during transport and picking, to ensure no cracking.
Reduction factor for construction ϕconst 0.9
Load Combination for construction 1.5 MDC when dynamic construction loads are involved (Section 10).
Loads and stresses on stringerduring transport and picking: M3_STR_I_neg 73 kip ft
Concrete rupture stress fr 0.24 fc ksi 0.5 ksi
Concrete stress during construction not to exceed:
fcmax ϕconst fr 0.5 ksi
fcconst
M3_STR_I_neg yc
Iz n0.1 ksi
fcconst fcmax 1
Phase 4: Check flexural capacity under dead load and live load for fully installed continuous composite girders.
Strength I Load Combination ϕf 1.0
M4_STR_I 1504 kip ft M4_STR_I_neg 1650.2 kip ft
M4_STR_I ϕf Mn 1 M4_STR_I_neg Mr_neg 0
Strength III Load CombinationM4_STR_III 562.5 kip ft M4_STR_III_neg 703.1 kip ft
M4_STR_III ϕf Mn 1 M4_STR_III_neg Mr_neg 1
Strength V Load Combination
M4_STR_V 1288.8 kip ft M4_STR_V_neg 1433.7 kip ft
M4_STR_V ϕf Mn 1 M4_STR_V_neg Mr_neg 0
13. FLEXURAL SERVICE CHECKS
Check service load combinations for the fully continuous beam with live load (Phase 4):
under Service II for stress limits - M4_SRV_II 1138.9 kip ft
M4_SRV_II_neg 1252.9 kip ft
under Service I for cracking - M4_SRV_I_neg 1090.6 kip ft
Ignore positive moment for Service I as there is notension in the concrete in this case.
Service Load Stress Limits:Top Flange: ftfmax 0.95 Rh Fy 47.5 ksi
Bottom Flange: fbfmax ftfmax 47.5 ksi
Concrete (Negative bending only): fr 0.5 ksi
Service Load Stresses, Positive Moment:
A-39
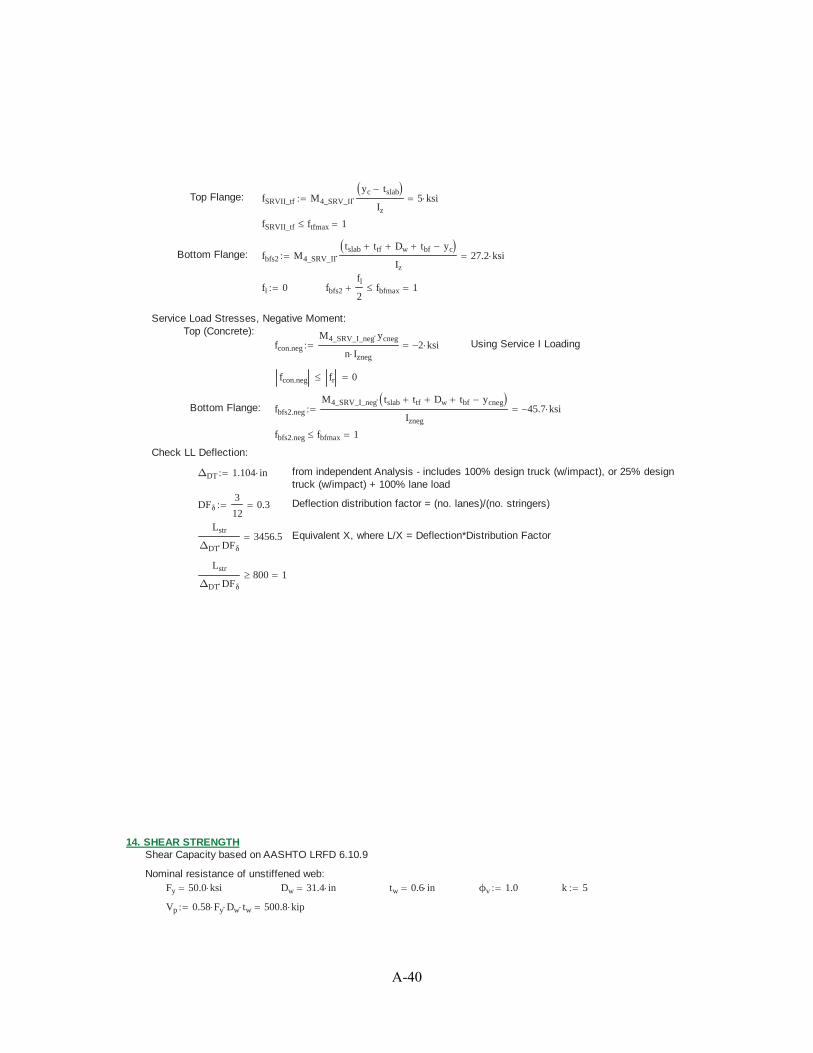
Top Flange: fSRVII_tf M4_SRV_II
yc tslab
Iz
5 ksi
fSRVII_tf ftfmax 1
Bottom Flange: fbfs2 M4_SRV_II
tslab ttf Dw tbf yc
Iz
27.2 ksi
fl 0 fbfs2
fl
2fbfmax 1
Service Load Stresses, Negative Moment:Top (Concrete):
fcon.neg
M4_SRV_I_neg ycneg
n Izneg
2 ksi Using Service I Loading
fcon.neg fr 0
Bottom Flange: fbfs2.neg
M4_SRV_I_neg tslab ttf Dw tbf ycneg
Izneg
45.7 ksi
fbfs2.neg fbfmax 1
Check LL Deflection:
ΔDT 1.104 in from independent Analysis - includes 100% design truck (w/impact), or 25% designtruck (w/impact) + 100% lane load
DFδ3
120.3 Deflection distribution factor = (no. lanes)/(no. stringers)
Lstr
ΔDT DFδ3456.5 Equivalent X, where L/X = Deflection*Distribution Factor
Lstr
ΔDT DFδ800 1
14. SHEAR STRENGTHShear Capacity based on AASHTO LRFD 6.10.9
Nominal resistance of unstiffened web:Fy 50.0 ksi Dw 31.4 in tw 0.6 in ϕv 1.0 k 5
Vp 0.58 Fy Dw tw 500.8 kip
A-40

C1 1.0Dw
tw
1.12Es k
Fy
if
1.57
Dw
tw
2
Es k
Fy
Dw
tw
1.40Es k
Fy
if
1.12
Dw
tw
Es k
Fy
otherwiseC1 1
Vn C1 Vp 500.8 kip
Vu ϕv Vn 1
15. FATIGUE LIMIT STATES:
Fatigue check shall follow LRFD Article 6.10.5. Moments used for fatigue calculations were found using an outsidefinite element analysis program.
First check Fatigue I (infinite life); then find maximum single lane ADTT for Fatigue II if needed.
Fatigue Stress Limits:
ΔFTH_1 16 ksi Category B: non-coated weathering steel
ΔFTH_2 12 ksi Category C': Base metal at toe of transverse stiffener fillet welds
ΔFTH_3 10 ksi Category C: Base metal at shear connectors
Fatigue Moment Ranges at Detail Locations (from analysis):
MFAT_B 301 kip ft MFAT_CP 285.7 kip ft MFAT_C 207.1kip ft
nfat 2 Lstr 40 ftif
1.0 otherwiseγFATI 1.5 γFATII 0.75
Constants to use for detail checks:
ADTTSL_INF_B 860 AFAT_B 120 108
ADTTSL_INF_CP 660 AFAT_CP 44 108
ADTTSL_INF_C 1290 AFAT_C 44 108
Category B Check: Stress at Bottom Flange, Fatigue I
fFATI_B
γFATI MFAT_B tslab ttf Dw tbf yc
Iz
10.8 ksi
fFATI_B ΔFTH_1 1
fFATII_B
γFATII
γFATI
fFATI_B 5.4 ksi
A-41

ADTTSL_B_MAX
ADTTSL_INF_B
nfat
fFATI_B ΔFTH_1if
AFAT_B ksi3
365 75 nfat fFATII_B3
otherwise
ADTTSL_B_MAX 860
Category C' Check: Stress at base of transverse stiffener (top of bottom flange)
fFATI_CP γFATI MFAT_CP
tslab ttf Dw yc
Iz
10 ksi
fFATI_CP ΔFTH_2 1
fFATII_CP
γFATII
γFATI
fFATI_CP 5 ksi
ADTTSL_CP_MAX
ADTTSL_INF_CP
nfat
fFATI_CP ΔFTH_2if
AFAT_CP ksi3
365 75 nfat fFATII_CP3
otherwise
ADTTSL_CP_MAX 660
Category C Check: Stress at base of shear connectors (top of top flange)
fFATI_C γFATI MFAT_C
yc tslab
Iz
1.4 ksi
fFATI_C ΔFTH_3 1
fFATII_C
γFATII
γFATI
fFATI_C 0.7 ksi
ADTTSL_C_MAX
ADTTSL_INF_C
nfat
fFATI_C ΔFTH_3if
AFAT_C ksi3
365 75 nfat fFATII_C3
otherwise
ADTTSL_C_MAX 1290
FATIGUE CHECK: ADTTSL_MAX min ADTTSL_B_MAX ADTTSL_CP_MAX ADTTSL_C_MAX
Ensure that single lane ADTT is less than ADTTSL_MAX 660
If not, then the beam requires redesign.
A-42

16. BEARING STIFFENERSbp x tpUsing LRFD Article 6.10.11 for stiffeners:
tp5
8in bp 5in ϕb 1.0 tp_weld
5
16in 9tw x tw 9tw x tw
*Check min weld sizeProjecting Width Slenderness Check:
bp 0.48tp
Es
Fy
1
bp x tpStiffener Bearing Resistance:
Apn 2 bp tp_weld tp Apn 5.9 in2
Rsb_n 1.4 Apn Fy Rsb_n 410.2 kip
Rsb_r ϕb Rsb_n Rsb_r 410.2 kip
RDC 26.721kip RDW 2.62kip RLL 53.943kip
ϕDC_STR_I 1.25 ϕDW_STR_I 1.5 ϕLL_STR_I 1.75
Ru ϕDC_STR_I RDC ϕDW_STR_I RDW ϕLL_STR_I RLL Ru 131.7 kip
Ru Rsb_r 1
Weld Check:
throat tp_weld2
2throat 0.2 in
Lweld Dw 2 3in Lweld 25.4 in
Aeff_weld throat Lweld Aeff_weld 5.6 in2
Fexx 70ksi ϕe2 0.8
Rr_weld 0.6 ϕe2 Fexx Rr_weld 33.6 ksi
Ru_weld
Ru
4 Aeff_weld
Ru_weld 5.9 ksi
Ru_weld Ru_weld 1
Axial Resistance of Bearing Stiffeners: ϕc 0.9
Aeff 2 9 tw tp tw 2 bp tp Aeff 12 in2
Leff 0.75 Dw Leff 23.6 in
Ixp
2 9 tw tw3
12
tp 2 bp tw3
12Ixp 61.3 in
4
Iyp
tw tp 2 9 tw3
12
2bp tp3
12Iyp 53.6 in
4
rp
min Ixp Iyp
Aeff
rp 2.1 in
Q 1 for bearing stiffeners Kp 0.75
Po Q Fy Aeff 601.9 kip
A-43

Pe
π2Es Aeff
Kp
Leff
rp
249214.3 kip
Pn 0.658
Po
PePo
Pe
Po
0.44if
0.877 Pe otherwise
Pn 598.9 kip
Pr ϕc Pn Pr 539 kip Ru Pr 1
17. SHEAR CONNECTORS:Shear Connector design to follow LRFD 6.10.10.
Stud Properties:
ds7
8in Diameter hs 6in Height of Stud
hs
ds
4 1
cs tslab hs cs 2in 1
ss 3.5in Spacing ss 4ds 1
ns 3 Studs per rowbtf ss ns 1 ds
21.0in 1
Asc πds
2
2
Asc 0.6 in2
Fu 60ksi
Fatigue Resistance:
Zr 5.5 ds2 kip
in2
Zr 4.2 kip Qslab Aslab yc yslab Qslab 364.9 in3
Vf 47.0kip
Vfat
Vf Qslab
Iz
1.2kip
in
ps
ns Zr
Vfat
10.3 in 6 ds ps 24in 1
Strength Resistance:
ϕsc 0.85
fc 5 ksi
Ec 33000 0.151.5
fc ksi 4286.8 ksi
Qn min 0.5 Asc fc Ec Asc Fu Qn 36.1 kip
Qr ϕsc Qn Qr 30.7 kip
Psimple min 0.85 fc beff ts Fy Asteel Psimple 1190 kip
Pcont Psimple min 0.45 fc beff ts Fy Asteel Pcont 1820 kip
nlines
Pcont
Qr ns
nlines 19.8
A-44
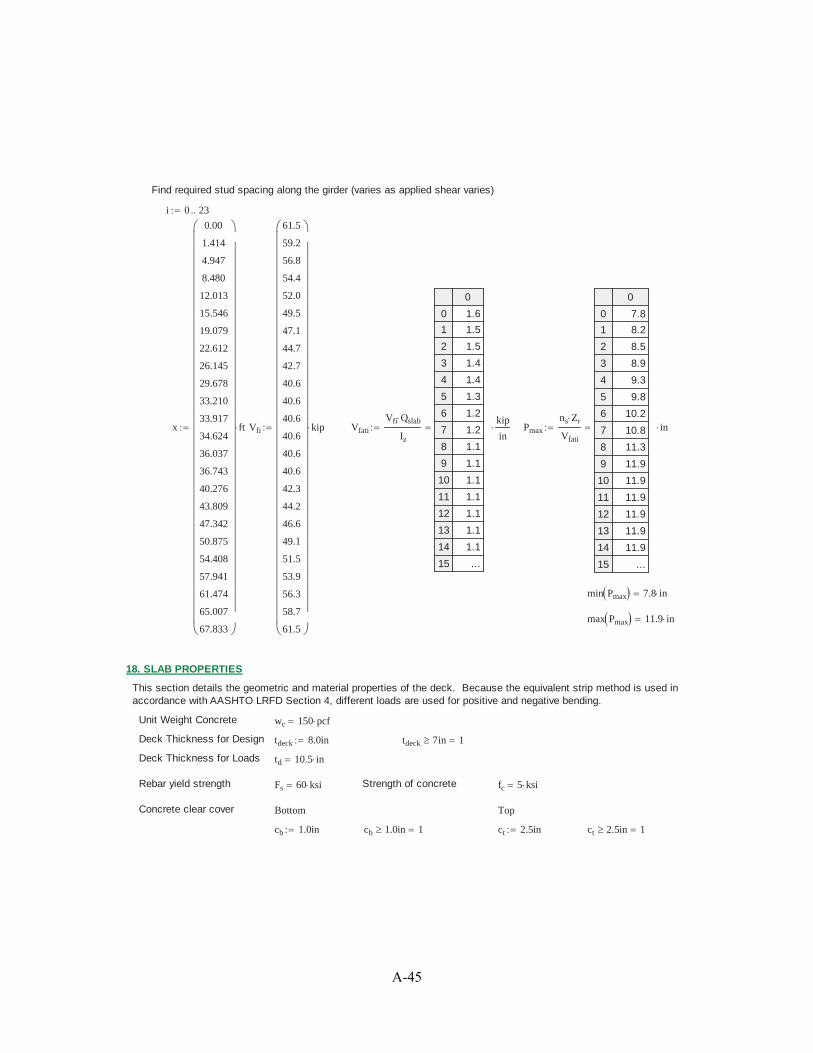
Find required stud spacing along the girder (varies as applied shear varies)
i 0 23
x
0.00
1.414
4.947
8.480
12.013
15.546
19.079
22.612
26.145
29.678
33.210
33.917
34.624
36.037
36.743
40.276
43.809
47.342
50.875
54.408
57.941
61.474
65.007
67.833
ft Vfi
61.5
59.2
56.8
54.4
52.0
49.5
47.1
44.7
42.7
40.6
40.6
40.6
40.6
40.6
40.6
42.3
44.2
46.6
49.1
51.5
53.9
56.3
58.7
61.5
kip Vfati
Vfi Qslab
Iz
0
01
2
3
4
5
6
7
8
9
10
11
12
13
14
15
1.61.5
1.5
1.4
1.4
1.3
1.2
1.2
1.1
1.1
1.1
1.1
1.1
1.1
1.1
...
kip
inPmax
ns Zr
Vfati
0
01
2
3
4
5
6
7
8
9
10
11
12
13
14
15
7.88.2
8.5
8.9
9.3
9.8
10.2
10.8
11.3
11.9
11.9
11.9
11.9
11.9
11.9
...
in
min Pmax 7.8 in
max Pmax 11.9 in
18. SLAB PROPERTIES
This section details the geometric and material properties of the deck. Because the equivalent strip method is used inaccordance with AASHTO LRFD Section 4, different loads are used for positive and negative bending.
Unit Weight Concrete wc 150 pcf
Deck Thickness for Design tdeck 8.0in tdeck 7in 1
Deck Thickness for Loads td 10.5 in
Rebar yield strength Fs 60 ksi Strength of concrete fc 5 ksi
Concrete clear cover Bottom Top
cb 1.0in cb 1.0in 1 ct 2.5in ct 2.5in 1
A-45

Transverse reinforcement Bottom Reinforcing ϕtb6
8in ϕtt
5
8inTop Reinforcing
Bottom Spacing stb 8in Top Spacing stt 8in
stb 1.5ϕtb 1.5in 1 stt 1.5ϕtt 1.5in 1
stb 1.5 tdeck 18in 1 stt 1.5 tdeck 18in 1
Astb12in
stb
πϕtb
2
2
0.7 in2
Astt12in
stt
πϕtt
2
2
0.5 in2
Design depth of Bar dtb tdeck cb
ϕtb
26.6 in dtt tdeck ct
ϕtt
25.2 in
Girder Spacing spacingint_max 2ft 11in
spacingext 3 ft
Equivalent Strip, +M wposM 26 6.6spacingint_max
ftin wposM 45.3 in
Equivalent Strip, -M wnegM 48 3.0spacingint_max
ftin wnegM 56.8 in
Once the strip widths are determined, the dead loads can be calculated.
19. PERMANENT LOADSThis section calculates the dead loads on the slab. These are used later for analysis to determine the design moments.
Weight of deck, +M wdeck_pos wc td wposM wdeck_pos 494.9 plf
Weight of deck, -M wdeck_neg wc td wnegM wdeck_neg 620.7 plf
Unit weight of barrier wb 433.5plf
Barrier point load, +M Pb_pos wb wposM Pb_pos 1.63 kip
Barrier point load, -M Pb_neg wb wnegM Pb_neg 2.05 kip
20. LIVE LOADSThis section calculates the live loads on the slab. These loads are analyzed in a separate program with the permanentloads to determine the design moments.
Truck wheel load Pwheel 16kip
Impact Factor IM 1.33
Multiple presence factors MP1 1.2 MP2 1.0 MP3 0.85
Wheel Loads P1 IM MP1 Pwheel P2 IM MP2 Pwheel P3 IM MP3 Pwheel
P1 25.54 kip P2 21.3 kip P3 18.09 kip
21. LOAD RESULTS
The separate MathCAD design aides (available in Appendix of the final report) was used to analyze the deck as an11-span continuous beam without cantilevered overhangs on either end, with supports stationed at girder locations. The dead and live loads were applied separately. The results are represented here as input values, highlighted.
Design Moments
A-46
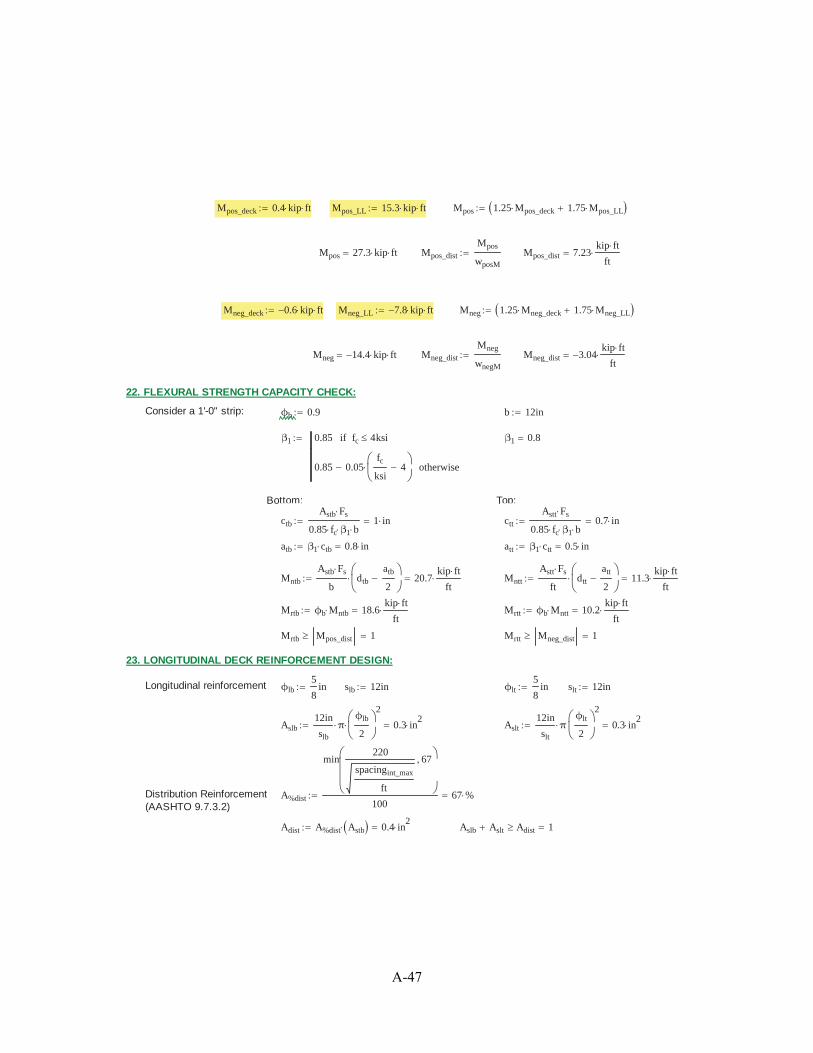
Mpos_deck 0.4 kip ft Mpos_LL 15.3 kip ft Mpos 1.25 Mpos_deck 1.75 Mpos_LL
Mpos 27.3 kip ft Mpos_dist
Mpos
wposM
Mpos_dist 7.23kip ft
ft
Mneg_deck 0.6 kip ft Mneg_LL 7.8 kip ft Mneg 1.25 Mneg_deck 1.75 Mneg_LL
Mneg 14.4 kip ft Mneg_dist
Mneg
wnegM
Mneg_dist 3.04kip ft
ft
22. FLEXURAL STRENGTH CAPACITY CHECK:
Consider a 1'-0" strip: ϕb 0.9 b 12in
β1 0.85 fc 4ksiif
0.85 0.05fc
ksi4 otherwise
β1 0.8
Bottom: Top:
ctb
Astb Fs
0.85 fc β1 b1 in ctt
Astt Fs
0.85 fc β1 b0.7 in
atb β1 ctb 0.8 in att β1 ctt 0.5 in
Mntb
Astb Fs
bdtb
atb
220.7
kip ft
ftMntt
Astt Fs
ftdtt
att
211.3
kip ft
ft
Mrtb ϕb Mntb 18.6kip ft
ftMrtt ϕb Mntt 10.2
kip ft
ft
Mrtb Mpos_dist 1 Mrtt Mneg_dist 1
23. LONGITUDINAL DECK REINFORCEMENT DESIGN:
Longitudinal reinforcement ϕlb5
8in slb 12in ϕlt
5
8in slt 12in
Aslb12in
slb
πϕlb
2
2
0.3 in2
Aslt12in
slt
πϕlt
2
2
0.3 in2
Distribution Reinforcement(AASHTO 9.7.3.2)
A%dist
min220
spacingint_max
ft
67
10067 %
Adist A%dist Astb 0.4 in2
Aslb Aslt Adist 1
A-47
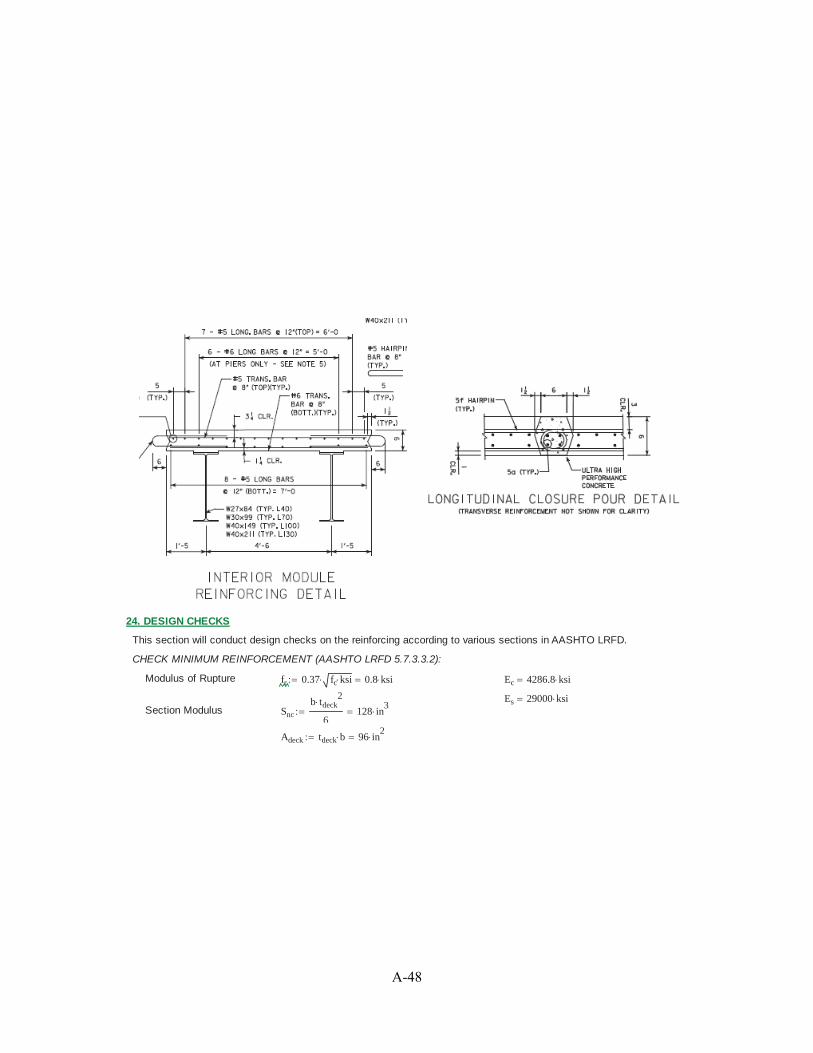
24. DESIGN CHECKS
This section will conduct design checks on the reinforcing according to various sections in AASHTO LRFD.
CHECK MINIMUM REINFORCEMENT (AASHTO LRFD 5.7.3.3.2):
Modulus of Rupture fr 0.37 fc ksi 0.8 ksi Ec 4286.8 ksi
Es 29000 ksiSection Modulus Snc
b tdeck2
6128 in
3
Adeck tdeck b 96 in2
A-48

ybar_tb
Adeck
tdeck
2n 1( ) Astb dtb
Adeck n 1( ) Astb
4.1 in
ybar_tt
Adeck
tdeck
2n 1( ) Astt dtt
Adeck n 1( ) Astt
4 in
Itb
b tdeck3
12Adeck
tdeck
2ybar_tb
2
n 1( ) Astb dtb ybar_tb2
538.3 in4
Itt
b tdeck3
12Adeck
tdeck
2ybar_tt
2
n 1( ) Astt dtt ybar_tt2
515.8 in4
Sc_tb
Itb
tdeck ybar_tb
138.2 in3
Sc_tt
Itt
tdeck ybar_tt
130 in3
Unfactored Dead Load Mdnc_pos_t 1.25kip ft
ftMdnc_neg_t 0.542
kip ft
ft
S 5.7.3.3.2Cracking Moment Mcr_tb max
Sc_tb fr
ftMdnc_pos_t
Sc_tb
Snc
1Sc_tb fr
ft9.5
kip ft
ft
Mcr_tt maxSc_tt fr
ftMdnc_neg_t
Sc_tt
Snc
1Sc_tt fr
ft9
kip ft
ft
Minimum FactoredFlexural Resistance
Mr_min_tb min 1.2 Mcr_tb 1.33 Mpos_dist 9.6kip ft
ftMrtb Mr_min_tb 1
Mr_min_tt min 1.2 Mcr_tt 1.33 Mneg_dist 4kip ft
ftMrtt Mr_min_tt 1
CHECK CRACK CONTROL (AASHTO LRFD 5.7.3.4):γeb 1.0 γet 0.75
MSL_pos 29.64kip ft MSL_neg 29.64kip ft
MSL_pos_dist
MSL_pos
wposM
7.9kip ft
ftMSL_neg_dist
MSL_neg
wnegM
6.3kip ft
ft
fssb
MSL_pos_dist b n
Itb
dtb ybar_tb
3.1 ksi fsst
MSL_neg_dist b n
Itt
dtt ybar_tt
1.2 ksi
dcb cb
ϕtb
21.4 in dct ct
ϕtt
22.8 in
βsb 1dcb
0.7 tdeck dcb
1.3 βst 1dct
0.7 tdeck dct
1.8
sb
700 γeb kip
βsb fssb in2 dcb 171.9 in st
700 γet kip
βst fsst in2 dct 245.5 in
stb sb 1 stt st 1
A-49

SHRINKAGE AND TEMPERATURE REINFORCING (AASHTO LRFD 5.10.8):
Ast
1.30 b tdeck
2 b tdeck Fs
kip
in0.11in
2 1.30 b tdeck
2 b tdeck Fs
kip
in0.60in
2if
0.11in2 1.30 b tdeck
2 b tdeck Fs
kip
in0.11in
2if
0.60in2 1.30 b tdeck
2 b tdeck Fs
kip
in0.60in
2if
0.1 in2
Astb Ast 1 Astt Ast 1
Aslb Ast 1 Aslt Ast 1
SHEAR RESISTANCE (AASHTO LRFD 5.8.3.3):ϕ 0.9 β 2 θ 45deg b 1 ft
dv_tb max 0.72 tdeck dtb
atb
20.9 dtb 6.2 in
dv_tt max 0.72 tdeck dtt
att
20.9 dtt 5.8 in
dv min dv_tb dv_tt 5.8 in
Vc 0.0316 β fc ksi b dv 9.8 kip
Vs 0kip Shear capacity of reinforcing steel
Vps 0kip Shear capacity of prestressing steel
Vns min Vc Vs Vps 0.25 fc b dv Vps 9.8 kip
Vr ϕ Vns 8.8 kip Total factored resistance
Vus 8.38kip Total factored load Vr Vus 1
DEVELOPMENT AND SPLICE LENGTHS (AASHTO LRFD 5.11):
Development and splice length design follows standard calculations in AASHTO LRFD 5.11, or as dictated by the StateDOT Design Manual.
25. DECK OVERHANG DESIGN (AASHTO LRFD A.13.4):
A-50
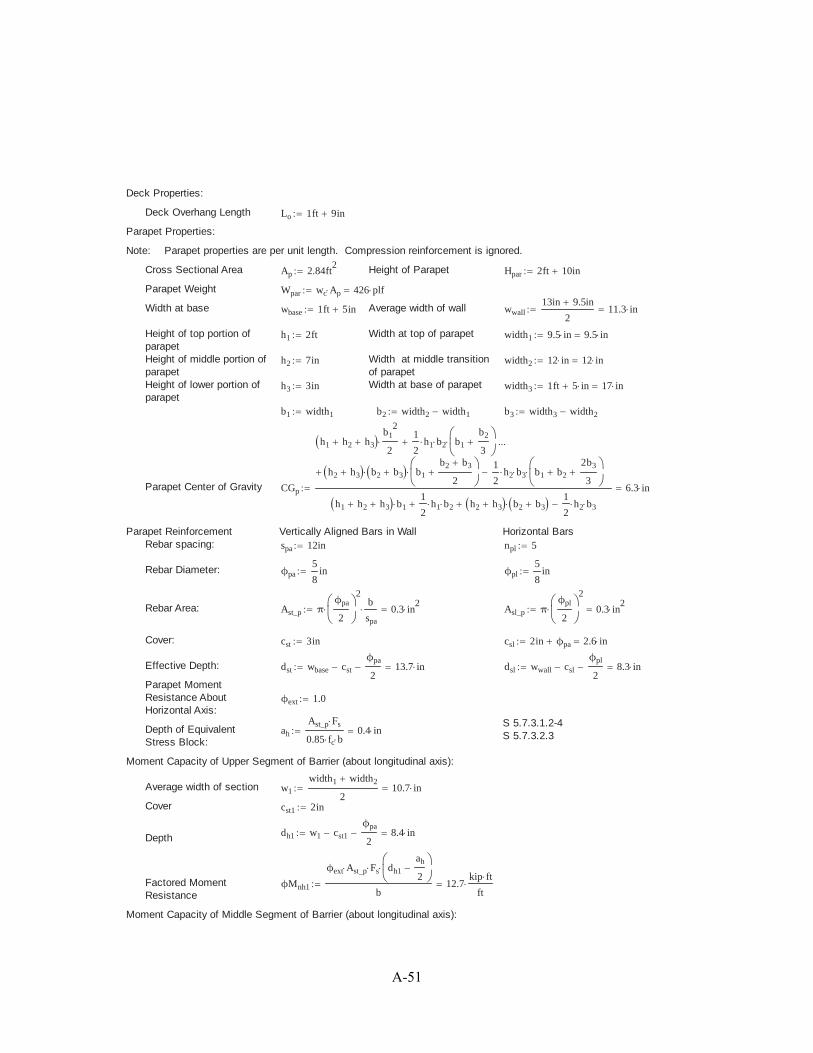
Deck Properties:
Deck Overhang Length Lo 1ft 9in
Parapet Properties:
Note: Parapet properties are per unit length. Compression reinforcement is ignored.
Cross Sectional Area Ap 2.84ft2 Height of Parapet Hpar 2ft 10in
Parapet Weight Wpar wc Ap 426 plf
Width at base wbase 1ft 5in Average width of wall wwall13in 9.5in
211.3 in
Height of top portion ofparapet
h1 2ft Width at top of parapet width1 9.5 in 9.5 in
Height of middle portion ofparapet
h2 7in Width at middle transitionof parapet
width2 12 in 12 in
Height of lower portion ofparapet
h3 3in Width at base of parapet width3 1ft 5 in 17 in
b1 width1 b2 width2 width1 b3 width3 width2
Parapet Center of Gravity CGp
h1 h2 h3
b12
2
1
2h1 b2 b1
b2
3
h2 h3 b2 b3 b1
b2 b3
2
1
2h2 b3 b1 b2
2b3
3
h1 h2 h3 b11
2h1 b2 h2 h3 b2 b3
1
2h2 b3
6.3 in
Parapet Reinforcement Vertically Aligned Bars in Wall Horizontal BarsRebar spacing: spa 12in npl 5
Rebar Diameter: ϕpa5
8in ϕpl
5
8in
Rebar Area: Ast_p πϕpa
2
2b
spa
0.3 in2
Asl_p πϕpl
2
2
0.3 in2
Cover: cst 3in csl 2in ϕpa 2.6 in
Effective Depth: dst wbase cst
ϕpa
213.7 in dsl wwall csl
ϕpl
28.3 in
Parapet MomentResistance AboutHorizontal Axis:
ϕext 1.0
S 5.7.3.1.2-4S 5.7.3.2.3
Depth of EquivalentStress Block:
ah
Ast_p Fs
0.85 fc b0.4 in
Moment Capacity of Upper Segment of Barrier (about longitudinal axis):
Average width of section w1
width1 width2
210.7 in
Cover cst1 2in
dh1 w1 cst1
ϕpa
28.4 inDepth
Factored MomentResistance
ϕMnh1
ϕext Ast_p Fs dh1
ah
2
b12.7
kip ft
ft
Moment Capacity of Middle Segment of Barrier (about longitudinal axis):
A-51

Average width of section w2
width2 width3
214.5 in
Cover cst2 3in
dh2 w2 cst2
ϕpa
211.2 inDepth
Factored MomentResistance ϕMnh2
ϕext Ast_p Fs dh2
ah
2
b16.9
kip ft
ft
Parapet Base Moment Resistance (about longitudinal axis):
development in tension cst3 3in coverbase_vert cst3
ϕpa
23.3 in
minc_ta 1.5 cst3 3 ϕpa spa ϕpa 6 ϕpaif
1.2 otherwise
1.2
mdec_ta 0.8 spa 6inif
1.0 otherwise
0.8
ldb_ta max
1.25in Ast_p
Fs
kip
fc
ksi
0.4 ϕpa
Fs
ksiϕpa
11
8inif
2.70inFs
ksi
fc
ksi
ϕpa14
8in=if
3.50inFs
ksi
fc
ksi
ϕpa18
8in=if
ldt_ta ldb_ta minc_ta mdec_ta 14.4 in
hooked bar developed intension
lhb_ta
38 ϕpa
fc
ksi
10.6 in minc 1.2
ldh_ta max 6in 8 ϕpa minc lhb_ta 12.7 in
lap splice in tension llst_ta max 12in 1.3 ldt_ta 18.7 in
benefit ldt_ta ldh_ta 1.7 in
ldev_a 713
16in
Fdev
benefit ldev_a
ldt_ta
0.7
Fd 0.75
Distance from NA toCompressive Face
ct_b
Fd Ast_p Fs
0.85 fc β1 b0.3 in S 5.7.3.1.2-4
A-52

Depth of Equivalent StressBlock
at β1 ct_b 0.3 in S 5.7.3.2.3
Nominal MomentResistance
Mnt Fd Ast_p Fs dst
at
215.6 kip ft S 5.7.3.2.2-1
Factored MomentResistance
Mcb ϕext
Mnt
ft15.6
kip ft
ftS 5.7.3.2
Average Moment Capacity of Barrier (about longitudinal axis):
Factored MomentResistance aboutHorizontal Axis
Mc
ϕMnh1 h1 ϕMnh2 h2 Mcb h3
h1 h2 h3
13.8kip ft
ft
Parapet Moment Resistance (about vertical axis):
Height of TransverseReinforcement in Parapet
y1 5in Width of Parapet atTransverse Reinforcement
x1 width3
y1 h3 b3
h2
15.6 in
y2 11.5in x2 b1 b2
y2 h3 h2 b2
h1
11.8 in
y3 18in x3 b1 b2
y3 h3 h2 b2
h1
11.2 in
y4 24.5in x4 b1 b2
y4 h3 h2 b2
h1
10.5 in
y5 31in x5 b1 b2
y5 h3 h2 b2
h1
9.8 in
Depth of Equivalent StressBlock
anpl Asl_p Fs
0.85 fc Hpar
0.6 in
Concrete Cover in Parapet coverr 2in coverrear coverr ϕpa
ϕpl
22.9 in
coverbase cst3 ϕpa
ϕpl
23.9 in
coverf 2in coverfront 2in ϕpa
ϕpl
2
covert
x5
24.9 in covertop covert 4.9 in
Design depth d1i x1 coverbase 11.6 in d1o x1 coverrear 12.6 in
d2i x2 coverfront 8.9 in d2o x2 coverrear 8.9 in
d3i x3 coverfront 8.2 in d3o x3 coverrear 8.2 in
d4i x4 coverfront 7.6 in d4o x4 coverrear 7.6 in
d5i x5 covertop 4.9 in d5o x5 covertop 4.9 in
Nominal MomentResistance - Tension onInside Face
ϕMn1i ϕext Asl_p Fs d1ia
2208.3 kip in
ϕMn2i ϕext Asl_p Fs d2ia
2158.1 kip in
ϕMn3i ϕext Asl_p Fs d3ia
2145.6 kip in
ϕMn4i ϕext Asl_p Fs d4ia
2133.2 kip in
A-53
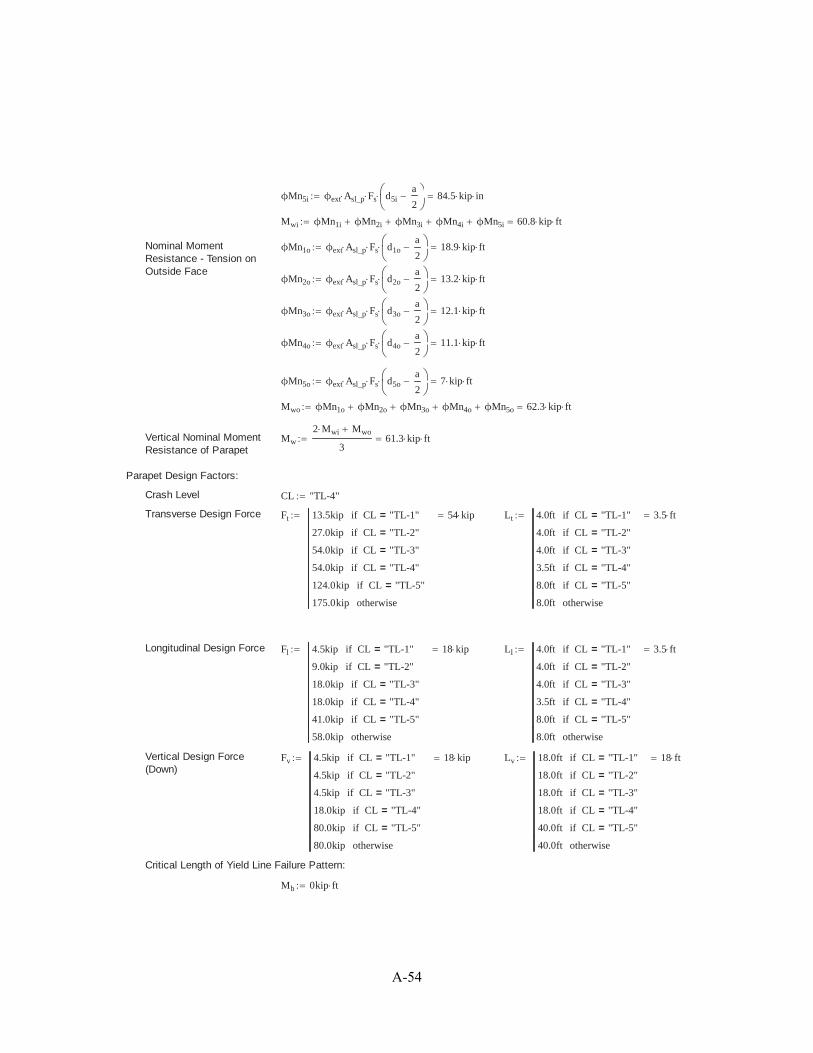
ϕMn5i ϕext Asl_p Fs d5ia
284.5 kip in
Mwi ϕMn1i ϕMn2i ϕMn3i ϕMn4i ϕMn5i 60.8 kip ft
Nominal MomentResistance - Tension onOutside Face
ϕMn1o ϕext Asl_p Fs d1oa
218.9 kip ft
ϕMn2o ϕext Asl_p Fs d2oa
213.2 kip ft
ϕMn3o ϕext Asl_p Fs d3oa
212.1 kip ft
ϕMn4o ϕext Asl_p Fs d4oa
211.1 kip ft
ϕMn5o ϕext Asl_p Fs d5oa
27 kip ft
Mwo ϕMn1o ϕMn2o ϕMn3o ϕMn4o ϕMn5o 62.3 kip ft
Vertical Nominal MomentResistance of Parapet
Mw
2 Mwi Mwo
361.3 kip ft
Parapet Design Factors:
Crash Level CL "TL-4"
Transverse Design Force Ft 13.5kip CL "TL-1"=if
27.0kip CL "TL-2"=if
54.0kip CL "TL-3"=if
54.0kip CL "TL-4"=if
124.0kip CL "TL-5"=if
175.0kip otherwise
54 kip Lt 4.0ft CL "TL-1"=if
4.0ft CL "TL-2"=if
4.0ft CL "TL-3"=if
3.5ft CL "TL-4"=if
8.0ft CL "TL-5"=if
8.0ft otherwise
3.5 ft
Longitudinal Design Force Fl 4.5kip CL "TL-1"=if
9.0kip CL "TL-2"=if
18.0kip CL "TL-3"=if
18.0kip CL "TL-4"=if
41.0kip CL "TL-5"=if
58.0kip otherwise
18 kip Ll 4.0ft CL "TL-1"=if
4.0ft CL "TL-2"=if
4.0ft CL "TL-3"=if
3.5ft CL "TL-4"=if
8.0ft CL "TL-5"=if
8.0ft otherwise
3.5 ft
Vertical Design Force(Down)
Fv 4.5kip CL "TL-1"=if
4.5kip CL "TL-2"=if
4.5kip CL "TL-3"=if
18.0kip CL "TL-4"=if
80.0kip CL "TL-5"=if
80.0kip otherwise
18 kip Lv 18.0ft CL "TL-1"=if
18.0ft CL "TL-2"=if
18.0ft CL "TL-3"=if
18.0ft CL "TL-4"=if
40.0ft CL "TL-5"=if
40.0ft otherwise
18 ft
Critical Length of Yield Line Failure Pattern:
Mb 0kip ft
A-54

Lc
Lt
2
Lt
2
28 Hpar Mb Mw
Mc
11.9 ft S A13.3.1-2
Rw2
2 Lc Lt
8 Mb 8 Mw
Mc Lc2
Hpar
116.2 kip S A13.3.1-1
TRw b
Lc 2 Hpar
6.6 kip S A13.4.2-1
The parapet design must consider three design cases. Design Case 1 is for longitudinal and transverse collision loadsunder Extreme Event Load Combination II. Design Case 2 represents vertical collision loads under Extreme Event LoadCombination II; however, this case does not govern for decks with concrete parapets or barriers. Design Case 3 is for deadand live load under Strength Load Combination I; however, the parapet will not carry wheel loads and therefore this casedoes not govern. Design Case 1 is the only case that requires a check.
Design Case 1: Longitudinal and Transverse Collision Loads, Extreme Event Load Combination II
DC - 1A: Inside face of parapetS A13.4.1S Table 3.4.1-1ϕext 1 γDC 1.0 γDW 1.0 γLL 0.5
llip 2in wbase 17 in
Adeck_1A tdeck llip wbase 152 in2
Ap 2.8 ft2
Wdeck_1A wc Adeck_1A 0.2 klf Wpar 0.4 klf
MDCdeck_1A γDC Wdeck_1A
llip wbase
20.1
kip ft
ft
MDCpar_1A γDC Wpar llip CGp 0.3kip ft
ft
Mtotal_1A Mcb MDCdeck_1A MDCpar_1A 16kip ft
ft
ϕtt_add5
8in stt_add 8in
Astt_p12in
stt
πϕtt
2
212in
stt_add
πϕtt_add
2
2
0.9 in2
dtt_add tdeck ct
ϕtt_add
25.2 in
ctt_p
Astt_p Fs
0.85 fc β1 b1.4 in att_p β1 ctt_p 1.1 in
Mntt_p
Astt_p Fs
ftdtt_add
att_p
221.4
kip ft
ft
Mrtt_p ϕb Mntt_p 19.2kip ft
ftMrtt_p Mtotal_1A 1
AsT Astt Astb 1.1 in2
ϕPn ϕext AsT Fs 67.4 kip ϕPn T 1
Mu_1A Mrtt_p 1T
ϕPn
17.4kip ft
ftMu_1A Mtotal_1A 1
A-55

DC - 1B: Design Section in OverhangNotes: Distribution length is assumed to increase based on a 30 degree angle from the face of parapet.
Moment of collision loads is distributed over the length Lc + 30 degree spread from face of parapet tolocation of overhang design section.
Axial force of collision loads is distributed over the length Lc + 2Hpar + 30 degree spread from face ofparapet to location of overhang design section.
Future wearing surface is neglected as contribution is negligible.
Adeck_1B tdeck Lo 168 in2
Ap 2.8 ft2
Wdeck_1B wc Adeck_1B 0.2 klf Wpar 0.4 klf
MDCdeck_1B γDC Wdeck_1B
Lo
20.2
kip ft
ft
MDCpar_1B γDC Wpar Lo llip CGp 0.5kip ft
ft
Lspread_B Lo llip width3 2 in spread 30deg
wspread_B Lspread_B tan spread( ) 1.2 in
Mcb_1B
Mcb Lc
Lc 2 wspread_B
15.3kip ft
ft
Mtotal_1B Mcb_1B MDCdeck_1B MDCpar_1B 15.9kip ft
ft
Mrtt_p 19.2kip ft
ftMrtt_p Mtotal_1B 1
ϕPn 67.4 kip
Pu
T Lc 2 Hpar
Lc 2 Hpar 2 wspread_B
6.5 kip ϕPn Pu 1
Mu_1B Mrtt_p 1Pu
ϕPn
17.4kip ft
ftMu_1B Mtotal_1B 1
DC - 1C: Design Section in First SpanAssumptions: Moment of collision loads is distributed over the length Lc + 30 degree spread from face of
parapet to location of overhang design section.Axial force of collision loads is distributed over the length Lc + 2Hpar + 30 degree spread from
face of parapet to location of overhang design section.Future wearing surface is neglected as contribution is negligible.
Mpar_G1 MDCpar_1B 0.5kip ft
ft
Mpar_G2 0.137kip ft
ft(From model output)
M1 Mcb 15.6kip ft
ft
M2 M1
Mpar_G2
Mpar_G1
4.7kip ft
ft
bf 10.5in
Mc_M2M1 M1
1
4bf M1 M2
spacingint_max
14.1kip ft
ft
A-56
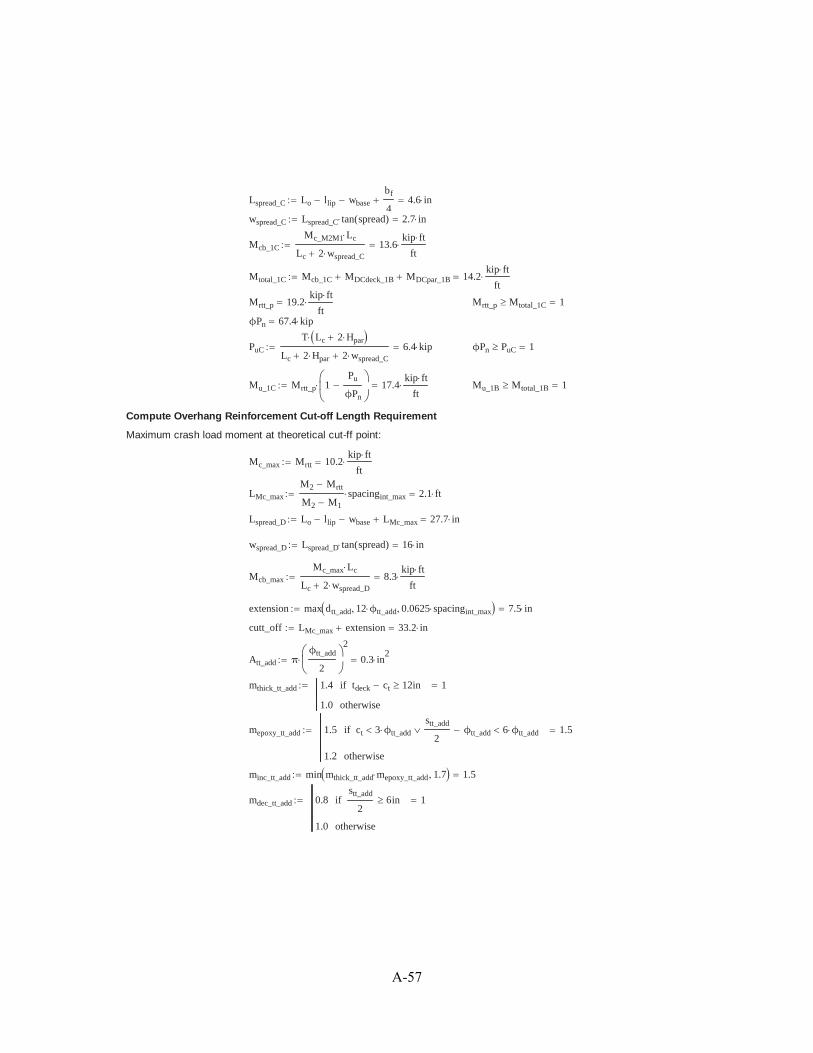
Lspread_C Lo llip wbase
bf
44.6 in
wspread_C Lspread_C tan spread( ) 2.7 in
Mcb_1C
Mc_M2M1 Lc
Lc 2 wspread_C
13.6kip ft
ft
Mtotal_1C Mcb_1C MDCdeck_1B MDCpar_1B 14.2kip ft
ft
Mrtt_p 19.2kip ft
ftMrtt_p Mtotal_1C 1
ϕPn 67.4 kip
PuC
T Lc 2 Hpar
Lc 2 Hpar 2 wspread_C
6.4 kip ϕPn PuC 1
Mu_1C Mrtt_p 1Pu
ϕPn
17.4kip ft
ftMu_1B Mtotal_1B 1
Compute Overhang Reinforcement Cut-off Length Requirement
Maximum crash load moment at theoretical cut-ff point:
Mc_max Mrtt 10.2kip ft
ft
LMc_max
M2 Mrtt
M2 M1
spacingint_max 2.1 ft
Lspread_D Lo llip wbase LMc_max 27.7 in
wspread_D Lspread_D tan spread( ) 16 in
Mcb_max
Mc_max Lc
Lc 2 wspread_D
8.3kip ft
ft
extension max dtt_add 12 ϕtt_add 0.0625 spacingint_max 7.5 in
cutt_off LMc_max extension 33.2 in
Att_add πϕtt_add
2
2
0.3 in2
mthick_tt_add 1.4 tdeck ct 12inif
1.0 otherwise
1
mepoxy_tt_add 1.5 ct 3 ϕtt_add
stt_add
2ϕtt_add 6 ϕtt_addif
1.2 otherwise
1.5
minc_tt_add min mthick_tt_add mepoxy_tt_add 1.7 1.5
mdec_tt_add 0.8stt_add
26inif
1.0 otherwise
1
A-57
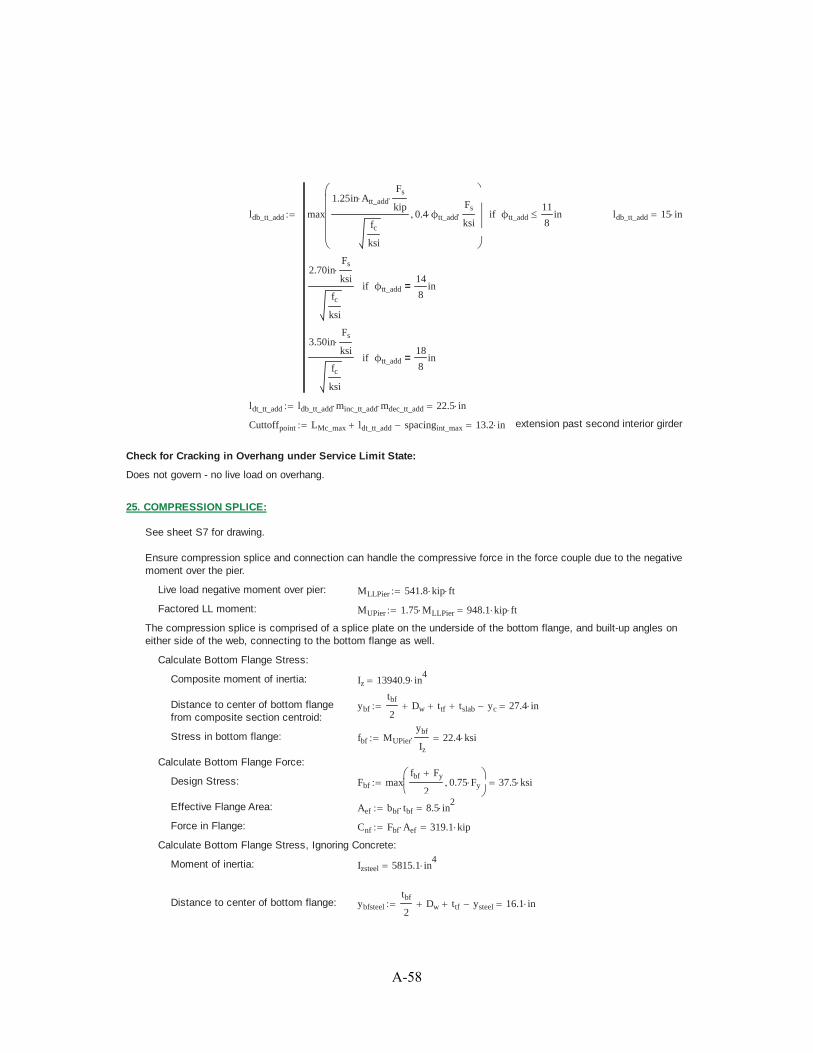
ldb_tt_add max
1.25in Att_add
Fs
kip
fc
ksi
0.4 ϕtt_add
Fs
ksiϕtt_add
11
8inif
2.70inFs
ksi
fc
ksi
ϕtt_add14
8in=if
3.50inFs
ksi
fc
ksi
ϕtt_add18
8in=if
ldb_tt_add 15 in
ldt_tt_add ldb_tt_add minc_tt_add mdec_tt_add 22.5 in
Cuttoffpoint LMc_max ldt_tt_add spacingint_max 13.2 in extension past second interior girder
Check for Cracking in Overhang under Service Limit State:
Does not govern - no live load on overhang.
25. COMPRESSION SPLICE:
See sheet S7 for drawing.
Ensure compression splice and connection can handle the compressive force in the force couple due to the negativemoment over the pier.
Live load negative moment over pier: MLLPier 541.8 kip ft
Factored LL moment: MUPier 1.75 MLLPier 948.1 kip ft
The compression splice is comprised of a splice plate on the underside of the bottom flange, and built-up angles oneither side of the web, connecting to the bottom flange as well.
Calculate Bottom Flange Stress:
Composite moment of inertia: Iz 13940.9 in4
Distance to center of bottom flange from composite section centroid:
ybf
tbf
2Dw ttf tslab yc 27.4 in
Stress in bottom flange: fbf MUPier
ybf
Iz
22.4 ksi
Calculate Bottom Flange Force:
Design Stress: Fbf maxfbf Fy
20.75 Fy 37.5 ksi
Effective Flange Area: Aef bbf tbf 8.5 in2
Force in Flange: Cnf Fbf Aef 319.1 kip
Calculate Bottom Flange Stress, Ignoring Concrete:
Moment of inertia: Izsteel 5815.1 in4
Distance to center of bottom flange: ybfsteel
tbf
2Dw ttf ysteel 16.1 in
A-58

Stress in bottom flange: fbfsteel MUPier
ybfsteel
Izsteel
31.4 ksi
Bottom Flange Force for design:
Design Stress: Fcf maxfbfsteel Fy
20.75 Fy 40.7 ksi
Design Force: Cn max Fbf Fcf Aef 346.5 kip
Compression Splice Plate Dimensions:
Bottom Splice Plate: bbsp bbf 11.5 in tbsp 0.75in Absp bbsp tbsp 8.6 in2
Built-Up Angle Splice PlateHorizontal Leg: basph 4.25in tasph 0.75in Aasph 2 basph tasph 6.4 in
2
Built-Up Angle Splice Plate VerticalLeg: baspv 7.75in taspv 0.75in Aaspv 2 baspv taspv 11.6 in
2
Total Area: Acsp Absp Aasph Aaspv 26.6 in2
Average Stress: fcs
Cn
Acsp
13 ksi
Proportion Load into each plate based on area:
Cbsp
Cn Absp
Acsp
112.3 kip Casph
Cn Aasph
Acsp
83 kip Caspv
Cn Aaspv
Acsp
151.3 kip
Check Plates Compression Capacity:
Bottom Splice Plate: kcps 0.75 for bolted connection
lcps 9in
rbsp
minbbsp tbsp
3
12
tbsp bbsp3
12
Absp
0.2 in
Pebsp
π2
Es Absp
kcps lcps
rbsp
22539.7 kip
Qbsp 1.0bbsp
tbsp
0.45Es
Fy
if
1.34 0.76bbsp
tbsp
Fy
Es
0.45Es
Fy
bbsp
tbsp
0.91Es
Fy
if
0.53 Es
Fy
bbsp
tbsp
2otherwise
0.856
Pobsp Qbsp Fy Absp 369.2 kip
A-59

Pnbsp 0.658
Pobsp
PebspPobsp
Pebsp
Pobsp
0.44if
0.877 Pebsp otherwise
347.4 kip
Pnbsp_allow 0.9 Pnbsp 312.7 kip Check "NG" Cbsp Pnbsp_allowif
"OK" Pnbsp_allow Cbspif
"OK"
Horizontal Angle Leg: kcps 0.75 for bolted connection
lcps 9 in
rasph
minbasph tasph
3
12
tasph basph3
12
Aasph
0.153 in
Peasph
π2
Es Aasph
kcps lcps
rasph
2938.6 kip
Qasph 1.0basph
tasph
0.45Es
Fy
if
1.34 0.76basph
tasph
Fy
Es
0.45Es
Fy
basph
tasph
0.91Es
Fy
if
0.53 Es
Fy
basph
tasph
2otherwise
1
Poasph Qasph Fy Aasph 318.7 kip
Pnasph 0.658
Poasph
PeasphPoasph
Peasph
Poasph
0.44if
0.877 Peasph otherwise
276.5 kip
Pnasph_allow 0.9 Pnasph 248.9 kip Check2 "NG" Casph Pnasph_allowif
"OK" Pnasph_allow Casphif
"OK"
Vertical Angle Leg: kcps 0.75 for bolted connection
lcps 9 in
raspv
minbaspv taspv
3
12
taspv baspv3
12
Aaspv
0.153 in
Peaspv
π2
Es Aaspv
kcps lcps
raspv
21711.6 kip
A-60

Qaspv 1.0baspv
taspv
0.45Es
Fy
if
1.34 0.76baspv
taspv
Fy
Es
0.45Es
Fy
baspv
taspv
0.91Es
Fy
if
0.53 Es
Fy
baspv
taspv
2otherwise
1
Poaspv Qaspv Fy Aaspv 581.2 kip
Pnaspv 0.658
Poaspv
PeaspvPoaspv
Peaspv
Poaspv
0.44if
0.877 Peaspv otherwise
504.2 kip
Pnaspv_allow 0.9 Pnaspv 453.8 kip Check3 "NG" Caspv Pnaspv_allowif
"OK" Pnaspv_allow Caspvif
"OK"
Additional Checks: Design Bolted Connections of the splice plates to the girders, checking for shear, bearing, andslip critical connections.
26. CLOSURE POUR DESIGN:
See sheet S2 for drawing of closure pour.
Check the closure pour according to the negative bending capacity of the section.
Use the minimum reinforcing properties for design, to be conservative.
Asteel 34.3 in2
Art 1.4 in2
Arb 1.9 in2
cgsteel tslab ysteel 24.4 in cgrt 3in 1.55
8in 3.9 in cgrb tslab 1in 1.5
5
8in 6.1 in
Overall CG: Aneg Asteel Art Arb 37.6 in2
cgneg
Asteel cgsteel Art cgrt Arb cgrb
Aneg
22.8 in
Moment of Inertia: Izstl 3990in4
Ineg Izstl Asteel cgsteel cgneg2
Art cgrt cgneg2
Arb cgrb cgneg2
5104 in4
Section Moduli: Stop_neg
Ineg
cgneg cgrt
271.2 in3
rneg
Ineg
Aneg
11.7 in
Sbot_neg
Ineg
tslab ttf Dw tbf cgneg
281.7 in3
Concrete Properties: fc 5 ksi Steel Properties: Fy 50 ksi Lbneg 13.42ft
Ec 4286.8 ksi Es 29000 ksi
A-61

Fyr 0.7 Fy 35 ksi
Negative Flexural Capacity:
Slenderness ratio for compressive flange: λfneg
bbf
2 tbf
7.8
Limiting ratio for compactness: λpfneg 0.38Es
Fy
9.2
Limiting ratio for noncompact λrfneg 0.56Es
Fyr
16.1
Hybrid Factor: Rh 1
Dcneg2
Dw
215.7 in awc
2 Dcneg2 tw
bbf tbf
2
Rb 1.0 2Dcneg2
tw
5.7Es
Fy
if
min 1.0 1awc
1200 300 awc
2Dcneg2
tw
5.7Es
Fy
otherwi
Rb 1
Flange compression resistance: Fnc1 Rb Rh Fy λfneg λpfnegif
1 1Fyr
Rh Fy
λfneg λpfneg
λrfneg λpfneg
Rb Rh Fy otherwise
Fnc1 50 ksi
Lateral Torsional Buckling Resistance: rtneg
bbf
12 1Dcneg2 tw
3 bbf tbf
2.9 in
Lpneg 1.0 rtneg
Es
Fy
69.1 in
Lrneg π rtneg
Es
Fyr
259.5 in
Cb 1
Fnc2 Rb Rh Fy Lbneg Lpnegif
min Cb 1 1Fyr
Rh Fy
Lbneg Lpneg
Lrneg Lpneg
Rb Rh Fy Rb Rh F
Fnc2 42.8 ksi
Compressive Resistance: Fnc min Fnc1 Fnc2 42.8 ksi
Tensile Flexural Resistance: Fnt Rh Fy 50 ksi For Strength
A-62

Fnt_Serv 0.95 Rh Fy 47.5 ksi For Service
Ultimate Moment Resistance: Mn_neg min Fnt Stop_neg Fnc Sbot_neg 1003.6 kip ft
MUPier 948.1 kip ft from external FE analysis
Check4 Mn_neg MUPier 1
For additional design, one may calculate the force couple at the section over the pier to find the force in theUHPC closure joint. This force can be used to design any additional reinforcement used in the joint.
A-63

Summary of changes from SHRP2:
Adapted the AASHTO LRFD Bridge Design Specifications, 6th Edition (2012) and GDOT Standards MathCAD Design Aides provided in Appendix of the final report
- Design loadings calucation (moment, shear, and reaction) for girders - Design loadings calucation for deck
List of variable definitions added Enhanced the descriptions for all design steps Expansion of detail regarding girder sizingNew cross-section drawingsLoad combination explanations12 ft travel lanes, 6 ft shoulders and 2% slope from crown to comply with GDOT standards
A-64

CONCRETE DECKED STEEL GIRDER DESIGN FOR ABC
The following example details the design of a steel girder bridge accompanied by precast concrete deck panels. Thisparticular example was created in accordance with Accelerated Bridge Construction (ABC) principles. The exampleshown here is presented for a Georgia Department of Transportation research endeavour into ABC technology, and isintended to simplify the design procedure of ABC style bridges. This example was taken from the SHRP 2 Manual(S2-R04-RR-2), and modified by a Georgia Southern University research team working for the Georgia Department ofTransportation.
Note: These calculations do not consider every aspect of the bridge design process, and should not be condsideredexhaustive.
Note: All user inputs are highlighted in yellow for easy identification.
AASHTO LRFD Bridge Design Specifications (Sixth Edition with 2012 interims) was used to formulate this example.Located throughout this example are direct references to the AASHTO LRFD Bridge Design Specifications, which arefound to the right side of their affiliated calculation.
Before beginning this example, a structural modeling program was used to analyze the superstructure. Although thecalculations are not shown, the outputs are used for the design moments, shears and reactions in the example.
BRIDGE GEOMETRY:
Design member parameters:
Deck Width: wdeck 36ft 2in C. to C. Piers: Length 60ft
Roadway Width: wroadway 33ft C. to C. Bearings Lspan 57ft 10in
Skew Angle: Skew 0deg Bridge Length: Ltotal 3 Length 180 ft
Deck Thickness td 10.5in Stringer W30x90
Haunch Thickness th 2in Stringer Weight ws1 90plf
Haunch Width wh 10.5in Stringer Length Lstr Length 6 in 59.5 ft
Girder Spacing spacingint 2ft 11in Average spacing of adjacent beams. This value is usedso that effective deck width is not overestimated.
spacingext 3ft
File Name: Steel Girder-60 ft.xmcd
A-65

TABLE OF CONTENTS:
General:1. Introduction2. Design Philosophy3. Design Criteria4. Material Properties5. Load Combinations
Girder Design:6. Beam Section Properties7. Permanent Loads8. Precast Lifting Weight9. Live Load Distribution Factors10. Load Results11. Flexural Strength
12. Flexural Strength Checks 13. Flexural Service Checks 14. Shear Strength 15. Fatigue Limit States 16. Bearing Stiffeners 17. Shear ConnectorsDeck Design:
18. Slab Properties 19. Permanent Loads 20. Live Loads
21. Load Results22. Flexural Strength Capacity Check23. Longitudinal Deck Reinforcing Design24. Design Checks25. Deck Overhang Design
Continuity Design:26. Compression Splice27. Closure Pour Design
A-66

List of Variable Definitions
A = plan area of ice floe (ft2); depth of temperature gradient (in.) (C3.9.2.3) (3.12.3)AEP = apparent earth pressure for anchored walls (ksf) (3.4.1)AF = annual frequency of bridge element collapse (number/yr.) (C3.14.4)AS = peak seismic ground acceleration coefficient modified by short-period site factor (3.10.4.2)
= notional slope of backfill (degrees) (3.11.5.8.1)B = equivalent footing width (ft) (3.11.6.3)Be = width of excavation (ft) (3.11.5.7.2b)BM = beam (width) for barge, barge tows, and ship vessels (ft) (C3.14.5.1)Bp = width of bridge pier (ft) (3.14.5.3)BR = vehicular braking force; base rate of vessel aberrancy (3.3.2) (3.14.5.2.3)b = braking force coefficient; width of a discrete vertical wall element (ft) (C3.6.4) (3.11.5.6)bf = width of applied load or footing (ft) (3.11.6.3)C = coefficient to compute centrifugal forces; constant for terrain conditions in relation to wind approach (3.6.3)(C3.8.1.1)
CD = drag coefficient (s2 lbs./ft4) (3.7.3.1)CH = hydrodynamic mass coefficient (3.14.7)CL = lateral drag coefficient (C3.7.3.1)
Csm = elastic seismic response coefficient for the mth mode of vibration (3.10.4.2) c = soil cohesion (ksf) (3.11.5.4)cf = distance from back of a wall face to the front of an applied load or footing (ft) (3.11.6.3)D = depth of embedment for a permanent nongravity cantilever wall with discrete vertical wall elements (ft)(3.11.5.6)DE = minimum depth of earth cover (ft) (3.6.2.2)Do = calculated embedment depth to provide equilibrium for nongravity cantilevered with continuous verticalelements by the simplified method (ft) (3.11.5.6)D1 = effective width of applied load at any depth (ft) (3.11.6.3)d = depth of potential base failure surface below base of excavation (ft); horizontal distance from the back of awall face to the centerline of an applied load (ft) (3.11.5.7.2b) (3.11.6.3)dc = total thickness of cohesive soil layers in the top 100 ft (3.10.3.1)ds = total thickness of cohesionless soil layers in the top 100 ft (3.10.3.1)E = Young’s modulus (ksf) (C3.9.5)EB = deformation energy (kip-ft) (C3.14.11)e = eccentricity of load on footing (ft) (3.11.6.3)F1 = lateral force due to earth pressure (kip/ft) (3.11.6.3)F2 = lateral force due to traffic surcharge (kip/ft) (3.11.6.3)f = constant applied in calculating the coefficient C used to compute centrifugal forces, taken equal to 4/3 forload combinations other than fatigue and 1.0 for fatigue (3.6.3)f c = specified compressive strength of concrete for use in design (ksi) (3.5.1)
g = gravitational acceleration (ft/s2) (3.6.3)H = ultimate bridge element strength (kip); final height of retaining wall (ft); total excavation depth (ft);resistance of bridge component to a horizontal force (kip) (C3.11.1) (3.11.5.7.1) (3.14.5.4)Hp = ultimate bridge pier resistance (kip) (3.14.5.4)Hs = ultimate bridge superstructure resistance (kip) (3.14.5.4)H1 = distance from ground surface to uppermost ground anchor (ft) (3.11.5.7.1)Hn+1 = distance from base of excavation to lowermost ground anchor (ft) (3.11.5.7.1)h = notional height of earth pressure diagram (ft) (3.11.5.7)heq = equivalent height of soil for vehicular load (ft) (3.11.6.4)IM = dynamic load allowance (C3.6.1.2.5)k = coefficient of lateral earth pressure; number of cohesive soil layers in the top 100 ft (3.11.6.2) (3.10.3.1)ka = coefficient of active lateral earth pressure (3.11.5.1)ko = coefficient of at rest lateral earth pressure (3.11.5.1)kp = coefficient of passive lateral earth pressure (3.11.5.1)ks = coefficient of earth pressure due to surcharge (3.11.6.1)L = perimeter of pier (ft); length of soil reinforcing elements in an MSE wall (ft); length of footing (ft);
A-67
expansion length (in.) (3.9.5) (3.11.5.8) (3.11.6.3) (3.12.2.3) = characteristic length (ft); center-to-center spacing of vertical wall elements (ft) (C3.9.5) (3.11.5.6)
m = multiple presence factor; number of cohesionless soil layers in the top 100 ft (3.6.1.1.2) (3.10.3.1)N = average Standard Penetration Test (SPT) blow count (blows/ft) (ASTM D1586) for the upper 100 ft of thesoil profile (3.10.3.1)
Nch = average Standard Penetration Test (SPT) blow count (blows/ft) (ASTM D1586) for cohesive soil layers in theupper 100 ft of the soil profile and us for cohesive soil layers (PI > 20) in the top 100 ft ( us method) (3.10.3.1)Nchi = blowcount for a cohesionless soil layer (not to exceed 100 blows/ft in the above expression) (3.10.3.1)Ni = Standard Penetration Test blow count of a layer (not to exceed 100 blows/ft in the above expression). Notethat when using Method B, N values are for cohesionless soils and cohesive soil and rock layers within theupper 100 ft Where refusal is met for a rock layer, Nishould be taken as 100 blows/ft (3.10.3.1)Ns = stability number (3.11.5.6)OCR = overconsolidation ratio (3.11.5.2)P = maximum vertical force for single ice wedge (kip); load resulting from vessel impact (kip); concentratedwheel load (kip); live load intensity; point load (kip) (C3.9.5) (3.14.5.4) (C3.6.1.2.5) (C3.11.6.2) (3.11.6.1)Pa = force resultant per unit width of wall (kip/ft) (3.11.5.8.1)PC = probability of bridge collapse (3.14.5)PD = design wind pressure (ksf) (3.8.1.2.1)PGA = peak seismic ground acceleration coefficient on rock (Site Class B) (3.10.2.1) (3.10.4.2)PH = lateral force due to superstructure or other concentrated lateral loads (kip/ft) (3.11.6.3)Ph = horizontal component of resultant earth pressure on wall (kip/ft) (3.11.5.5)PI = plasticity index (ASTM D4318) (3.10.3.1)Pp = passive earth pressure (kip/ft) (3.11.5.4)Pv = vertical component of resultant earth pressure on wall (kip/ft); load per linear foot of strip footing (kip/ft)(3.11.5.5) (3.11.6.3)P v = load on isolated rectangular footing or point load (kip) (3.11.6.3)p = effective ice crushing strength (ksf); stream pressure (ksf); basic earth pressure (psf); fraction of truck trafficin a single lane; load intensity (ksf) (3.9.2.2) (3.7.3.1) (3.11.5.1) (3.6.1.4.2) (3.11.6.1)pa = apparent earth pressure (ksf); maximum ordinate of pressure diagram (ksf) (3.11.5.3) (3.11.5.7.1)pp = passive earth pressure (ksf) (3.11.5.4)Q = total factored load; load intensity for infinitely long line loading (kip/ft) (3.4.1) (3.11.6.2)Qi = force effects (3.4.1)q = surcharge pressure (ksf) (3.11.6.3)qs = uniform surcharge pressure (ksf) (3.11.6.1)R = radius of curvature (ft); radius of circular pier (ft); seismic response modification factor; reduction factor oflateral passive earth pressure; radial distance from point of load application to a point on the wall (ft);reaction force to be resisted by subgrade below base of excavation (kip/ft) (3.6.3) (3.9.5) (3.10.7.1) (3.11.5.4)(3.11.6.1) (3.11.5.7.1)Sm = shear strength of rock mass (ksf) (3.11.5.6)Su = undrained shear strength of cohesive soil (ksf) (3.11.5.6)Sub = undrained strength of soil below excavation base (ksf) (3.11.5.7.2b)Sv = vertical spacing of reinforcements (ft) (3.11.5.8.1)us = average undrained shear strength in ksf (ASTM D2166 or ASTM D2850) for the upper 100 ft of the soil profile(3.10.3.1)sui = undrained shear strength for a cohesive soil layer (not to exceed 5.0 ksf in the above expression) (3.10.3.1)S1 = horizontal response spectral acceleration coefficient at 1.0-s period on rock (Site Class B) (3.10.2.1)(3.10.4.2)T = mean daily air temperature (°F) (C3.9.2.2)TF = period of fundamental mode of vibration of bridge (s) (3.10.2.2)Thi = horizontal load in anchor i (kip/ft) (3.11.5.7.1)Tm = period of vibration for mth mode (s) (3.10.4.2)Tmax = applied load to reinforcement in a mechanically stabilized earth wall (kip/ft) (3.11.5.8.2)TMaxDesign= maximum design temperature used for thermal movement effects (°F) (3.12.2.1) (3.12.2.2) (3.12.2.3)TMinDesign = minimum design temperature used for thermal movement effects (°F) (3.12.2.1) (3.12.2.2) (3.12.2.3)TS = corner period at which acceleration response spectrum changes from being independent of period to beinginversely proportional to period (s) (3.10.4.2)T0 = reference period used to define shape of acceleration response spectrum (s) (3.10.4.2)
A-68

t = thickness of ice (ft); thickness of deck (in.) (3.9.2.2) (3.12.3)V = design velocity of water (ft/s); design impact speed of vessel (ft/s) (3.7.3.1) (3.14.6)VB = base wind velocity taken as 100 mph (3.8.1.1)VDZ = design wind velocity at design Elevation Z (mph) (3.8.1.1)VMIN = minimum design impact velocity taken not less than the yearly mean current velocity for the bridge location(ft/s) (3.14.6)V0 = friction velocity, a meteorological wind characteristic for various upwind surface characteristics (mph)(3.8.1.1)V30 = wind speed at 30.0 ft above low ground or water level (mph) (3.8.1.1)v = highway design speed (ft/s) (3.6.3)s v = average shear wave velocity for the upper 100 ft of the soil profile (3.10.3.1)W = displacement weight of vessel (tonne) (C3.14.5.1)w = width of clear roadway (ft); width of clear pedestrian and/or bicycle bridge (ft); width of pier at level of iceaction (ft); specific weight of water (kcf); moisture content (ASTM D2216) (3.6.1.1.1) (3.6.1.6) (3.9.2.2)(C3.7.3.1) (3.10.3.1)X = horizontal distance from back of wall to point of load application (ft); distance to bridge element from thecenterline of vessel transit path (ft) (3.11.6.2) (3.14.6)X1 = distance from the back of the wall to the start of the line load (ft) (3.11.6.2)X2 = length of the line load (ft) (3.11.6.2)Z = structure height above low ground or water level > 30.0 ft (ft); depth below surface of soil (ft); depth fromthe ground surface to a point on the wall under consideration (ft); vertical distance from point of loadapplication to the elevation of a point on the wall under consideration (ft) (3.8.1.1) (3.11.6.3) (3.11.6.2)Z0 = friction length of upstream fetch, a meteorological wind characteristic (ft) (3.8.1.1)Z2 = depth where effective width intersects back of wall face (ft) (3.11.6.3)z = depth below surface of backfill (ft) (3.11.5.1)
= constant for terrain conditions in relation to wind approach; coefficient for local ice condition; inclination ofpier nose with respect to a vertical axis (degrees); inclination of back of wall with respect to a vertical axis(degrees); angle between foundation wall and a line connecting the point on the wall under consideration anda point on the bottom corner of the footing nearest to the wall (rad); coefficient of thermal expansion(in./in./°F) (C3.8.1.1) (C3.9.2.2) (3.9.2.2) (C3.11.5.3) (3.11.6.2) (3.12.2.3)
= safety index; nose angle in a horizontal plane used to calculate transverse ice forces (degrees); slope ofbackfill surface behind retaining wall; {+ for slope up from wall; for slope down from wall} (degrees)(C3.4.1) (3.9.2.4.1) (3.11.5.3)
= slope of ground surface in front of wall {+ for slope up from wall; for slope down from wall} (degrees)(3.11.5.6) = load factors; unit weight of materials (kcf); unit weight of water (kcf); unit weight of soil (kcf) (C3.4.1)
(3.5.1) (C3.9.5) (3.11.5.1)s = unit weight of soil (kcf) (3.11.5.1)s = effective soil unit weight (kcf) (3.11.5.6)EQ = load factor for live load applied simultaneously with seismic loads (3.4.1)eq = equivalent-fluid unit weight of soil (kcf) (3.11.5.5)i = load factor (3.4.1)p = load factor for permanent loading (3.4.1)SE = load factor for settlement (3.4.1)TG = load factor for temperature gradient (3.4.1) = movement of top of wall required to reach minimum active or maximum passive pressure by tilting or lateral
translation (ft) (C3.11.1) (3.11.5.5)p = constant horizontal earth pressure due to uniform surcharge (ksf) (3.11.6.1)ph = constant horizontal pressure distribution on wall resulting from various types of surcharge loading (ksf)
(3.11.6.2)T = design thermal movement range (in.) (3.12.2.3)
H = horizontal stress due to surcharge load (ksf) (3.11.6.3)v = vertical stress due to surcharge load (ksf) (3.11.6.3)
= angle of truncated ice wedge (degrees); friction angle between fill and wall (degrees); angle betweenfoundation wall and a line connecting the point on the wall under consideration and a point on the bottomcorner of the footing furthest from the wall (rad) (C3.9.5) (3.11.5.3) (3.11.6.2)i = load modifier specified in Article 1.3.2; wall face batter (3.4.1) (3.11.5.9)
A-69

= angle of back of wall to the horizontal (degrees); angle of channel turn or bend (degrees); angle betweendirection of stream flow and the longitudinal axis of pier (degrees) (3.11.5.3) (3.14.5.2.3) (3.7.3.2)f = friction angle between ice floe and pier (degrees) (3.9.2.4.1) = standard deviation of normal distribution (3.14.5.3)T = tensile strength of ice (ksf) (C3.9.5) = Poisson’s Ratio (dim.) (3.11.6.2) = resistance factors (C3.4.1)f = angle of internal friction (degrees) (3.11.5.4)
f = effective angle of internal friction (degrees) (3.11.5.2)r = internal friction angle of reinforced fill (degrees) (3.11.6.3)s = angle of internal friction of retained soil (degrees) (3.11.5.6)
• Permanent LoadsCR = force effects due to creepDD = downdrag forceDC = dead load of structural components andnonstructural attachmentsDW = dead load of wearing surfaces and utilitiesEH = horizontal earth pressure loadEL = miscellaneous locked-in force effects resultingfrom the construction process, including jackingapart of cantilevers in segmental constructionES = earth surcharge loadEV = vertical pressure from dead load of earth fill
• Transient Loads
EQ = earthquake loadFR = friction loadIC = ice loadIM = vehicular dynamic load allowanceLL = vehicular live loadLS = live load surchargePL = pedestrian live loadSE = force effect due to settlementTG = force effect due to temperature gradientTU = force effect due to uniform temperatureWA = water load and stream pressureWL = wind on live loadWS = wind load on structure
1. INTRODUCTION
AASHTO LRFD principles were used in the design of this superstructure. The example is designed for a bridge withthree even spans, and has no skew. The bridge has two 12-foot wide lanes and two 6-foot wide shoulders, for a totalroadway width of 36' from curb to curb. The bridge deck is precast reinforced concrete with overhangs at the outermostgirders. The longitudinal girders are placed as simply supported modules, and made continuous with connection platesand cast-in-place deck joints. The design of the continuity at the deck joint is addressed in final sections of thisexample.
The cross-section consists of six modules. The interior modules are identical and consist of two steel girders and a 6'-0"precast composite deck slab. Exterior modules include two steel girders and a 6'-1" precast composite deck slab, withF-shape barriers. Grade 50 steel is used throughout, and the deck concrete has a compressive strength of 5,000 psi.
A-70

The closure pour joints between the modules use Ultra High Performance Concrete with a strength of 21,000 psi.
Steel girder design steps, including constructability checks, fatigue design for infinite fatigue lift (unless otherwise noted),and bearing stiffener design comprise the majority of the example. Diaphragm and deck design procedures are present,but not detailed.
Tips for reading this Design Example:
This calculation was prepared with Mathcad version 14. Mathcad was used in this instance to provide a clearrepresentation of formulas, and their execution. Design software other than Mathcad is recommended for aspeedier and more accurate design.
Mathcad is not a design software. Mathcad executes user mathematical and simple logic commands.
Example 1: User inputs are noted with dark shaded boxes. Shading of boxes allows the user to easily find thelocation of a desired variable. Given that equations are written in mathcad in the same fashion as they are onpaper, except that they are interactive, shading input cells allows the user to quicly locate inputs amongst otherdata on screen. Units are user inputs.
Height ofStructure:
Hstructure 25ft
Example 2: Equations are typed directly into the workspace. Mathcad then reads the operators and executesthe calculations.
Panels are 2.5' Npanels
Hstructure
2.5ftNpanels 10
Example 3: If Statements are an important operator that allow for the user to dictate a future value with givenparameters. They are marked by a solid bar and operate with the use of program specific logic commands.
Operator offers discountper volume of panels Discount .75 Npanels 6if
.55 Npanels 10if
1 otherwise
Discount 0.6
Example 4: True or False Verification Statements are an important operator that allow for the user to verify asystem criteria that has been manually input. They are marked by lighter shading to make a distinctionbetween the user inputs. True or false statements check a single or pairs of variables and return a Zero or One.
Owner to proceed if discountson retail below 60% Discount .55 1
2. DESIGN PHILOSOPHY
The superstructure of the bridge in this example consists of modules, which are two rolled steel girders supporting abridge deck panel along their length. The girders are assumed to be simply supported under the weight of the deckpanels. In each module, one girder is assumed to support half the weight of its respective deck panel.
The barrier wall is added to exterior modules once the deck and girders are joined. When working with the barrier deadload, the weight is assumed to be evenly distributed between the two modules. Under the additional barrier dead load, thegirders are again assumed to be simply supported.
Concerning transportation of modules, it is assumed that the deck has reached 28-day concrete strength, and the deck isfully composite with the girders. The self-weight of the module during lifting and placement is assumed as evenlydistributed to four pick points (two per girder).
The modules are placed such that there is a bearing on each end and are again simply supported. The continuous span
A-71

configuration, which includes two bearings per pier on either side of the UHPC joints, is analyzed for positive and negativebending and shear (using simple or refined methods). The negative bending moment above the pier is used to find theforce couple for continuity design, between the compression plates at the bottom of the girders and the closure joint in thedeck.
The deck design utilizes the equivalent strip method.
3. DESIGN CRITERIA
The first step for any bridge design is to establish the design criteria. The following is a summary of the primary designcriteria for this design example:
Governing Specifications: AASTHO LRFD Bridge Design Specifications (6th Edition with 2012 interims)
Design Methodology: Load and Resistance Factor Design (LRFD)
Live Load Requirements: HL-93 S S3.6
Section Constraints:
Wmod.max 200 kip Upper limit on the weight of the modules, based on common lifting and transport capabilitieswithout significantly increasing time and/or cost due to unconventional equipment or permits
4. MATERIAL PROPERTIES
Structural Steel Yield Strength: Fy 50ksi STable 6.4.1-1
Structural Steel Tensile Strength: Fu 65ksi STable 6.4.1-1
Concrete 28-day Compressive Strength: fc 5ksi fc_uhpc 21ksi S5.4.2.1
Reinforcement Strength: Fs 60ksi S5.4.3 & S6.10.3.7
Steel Density: ws 490pcf STable 3.5.1-1
Concrete Density: wc 150pcf STable 3.5.1-1
Modulus of Elasticity - Steel: Es 29000ksi
Modulus of Elasticity - Concrete:Ec 33000
wc
1000pcf
1.5
fc ksi 4286.8 ksi
Modular Ratio: n ceilEs
Ec
7
Future Wearing Surface Density: Wfws 140pcf STable 3.5.1-1
Future Wearing Surface Thickness: tfws 2.5in (Assumed)
5. LOAD COMBINATIONS
A-72

The following load combinations will be used in this design example, in accordance with Table 3.4.1-1.
Strength I—Basic load combination relating to thenormal vehicular use of the bridge without wind.
Strength III—Load combination relating to the bridgeexposed to wind velocity exceeding 55 mph.
Strength V—Load combination relating to normalvehicular use of the bridge with wind of 55 mphvelocity.
Service I—Load combination relating to the normaloperational use of the bridge with a 55 mph wind andall loads taken at their nominal values. Also related todeflection control in buried metal structures, tunnelliner plate, and thermoplastic pipe, to control crackwidth in reinforced concrete structures, and fortransverse analysis relating to tension in concretesegmental girders. This load combination should alsobe used for the investigation of slope stability.
Service II—Load combination intended to controlyielding of steel structures and slip of slip-criticalconnections due to vehicular live load.
Fatigue I—Fatigue and fracture load combinationrelated to infinite load-induced fatigue life.
Strength I = 1.25DC + 1.5DW + 1.75(LL+IM), where IM = 33%
Strength III = 1.25DC + 1.5DW + 1.40WS
Strength V = 1.25DC + 1.5DW + 1.35(LL+IM) + 0.40WS + 1.0WL, where IM = 33%
Service I = 1.0DC + 1.0DW + 1.0(LL+IM) + 0.3WS + 1.0WL, where IM = 33%
Service II = 1.0DC + 1.0DW + 1.3(LL+IM), where IM = 33%
Fatigue I = 1.5(LL+IM), where IM = 15%
6. BEAM SECTION
Determining the proper girder depth and dimensions is a vital part of any bridge designprocess. The size of the girder is a major factor in the cost of the bridge. From Table2.5.2.6.3-1, the suggested minimum overall depth of the composite I-section in a continuousspan is equal to 0.032L.
Thus we have, (.032*60ft) = 1.92’ = 23.04” (this is a minimum and may be altered to satisfycriteria)
The following girder dimensions were taken from the AISC Steel Construction Manual (14th Edition).
Determine Beam Section Properties:btfx ttfGirder W30x90
A-73
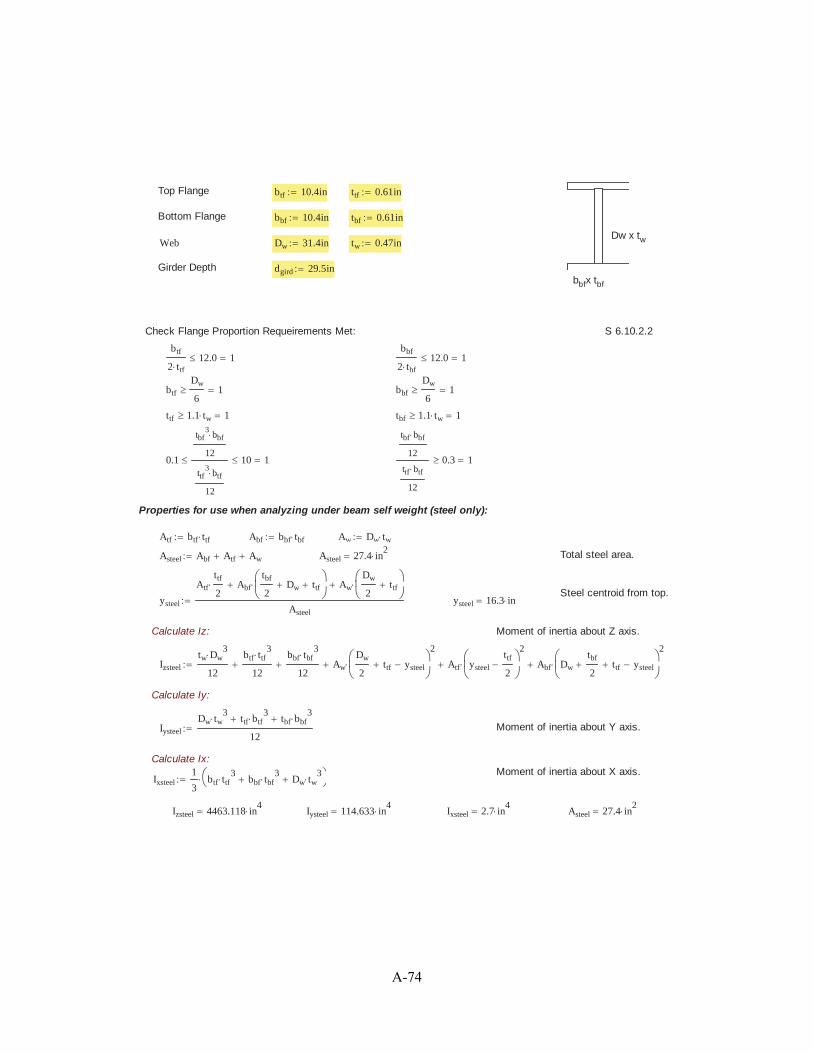
Top Flange btf 10.4in ttf 0.61in
Bottom Flange bbf 10.4in tbf 0.61in
Dw x twWeb Dw 31.4in tw 0.47in
Girder Depth dgird 29.5inbbfx tbf
Check Flange Proportion Requeirements Met: S 6.10.2.2
btf
2 ttf
12.0 1bbf
2 tbf
12.0 1
btf
Dw
61 bbf
Dw
61
ttf 1.1 tw 1 tbf 1.1 tw 1
0.1
tbf3
bbf
12
ttf3
btf
12
10 1
tbf bbf
12
ttf btf
12
0.3 1
Properties for use when analyzing under beam self weight (steel only):
Atf btf ttf Abf bbf tbf Aw Dw tw
Asteel Abf Atf Aw Asteel 27.4 in2 Total steel area.
Steel centroid from top.ysteel
Atf
ttf
2Abf
tbf
2Dw ttf Aw
Dw
2ttf
Asteel
ysteel 16.3 in
Calculate Iz: Moment of inertia about Z axis.
Izsteel
tw Dw3
12
btf ttf3
12
bbf tbf3
12Aw
Dw
2ttf ysteel
2
Atf ysteel
ttf
2
2
Abf Dw
tbf
2ttf ysteel
2
Calculate Iy:
Iysteel
Dw tw3
ttf btf3
tbf bbf3
12Moment of inertia about Y axis.
Calculate Ix:Moment of inertia about X axis.
Ixsteel1
3btf ttf
3bbf tbf
3Dw tw
3
Izsteel 4463.118 in4
Iysteel 114.633 in4
Ixsteel 2.7 in4
Asteel 27.4 in2
A-74

Composite Section Properties (Uncracked Section - used for barrier dead load and live load positive bending):
Determine composite slab and reinforcing properties
Slab thickness assumes some sacrificial thickness; use: tslab 8in
Dt tslab ttf Dw tbf 40.6 in Total section depth
beff spacingint beff 35 in Effective width. S 4.6.2.6.1 LRFD
Transformed slab width assteel.btr
beff
n
Transformed slab moment ofinertia about z axis as steel.Izslab btr
tslab3
12
Aslab btr tslab Transformed slab area assteel.
Slab reinforcement: (Use #5 @ 8" top, and #6 @ 8" bottom; additional bar for continuous segments of #6 @ 12")
Typical Cross Section Cross Section Over Support
Art 0.465in
2
ftbeff 1.4 in
2Arb 0.66
in2
ftbeff 1.9 in
2Artadd 0.44
in2
ftbeff 1.3 in
2
A-75

Ar Art Arb 3.3 in2
Arneg Ar Artadd 4.6 in2
crt 2.5in 0.625in5
16in 3.4 in crb tslab 1.75in
6
16in 5.9 in ref from top of slab
cr
Art crt Arb crb
Ar
4.9 in crneg
Art crt Arb crb Artadd crt
Arneg
4.5 in
Find composite section centroid:
Ax Asteel
Ar n 1( )
nAslab yslab
tslab
2
Centroid of steel from top ofslab.yst
Atf
ttf
2tslab Abf
tbf
2Dw ttf tslab Aw
Dw
2ttf tslab
Asteel
Centroid of transformedcomposite section from topof slab.yc
yst Asteel
cr Ar n 1( )
nAslab yslab
Ax
yc 12 in
Calculate Transformed Iz for composite section:
Transformed moment of inertiaabout the z axis.Iz Izsteel Asteel yst yc
2Izslab Aslab yslab yc
2 Ar n 1( )
ncr yc
2
Calculate Transformed Iy for composite section:
ttr
tslab
nTransformed slab thickness.
Iyslab
ttr beff3
12Transformed moment of inertia about y axis of slab.
Transformed moment of inertiaabout the y axis (ignoringreinforcement).
Iy Iysteel Iyslab
Calculate Transformed Ix for composite section:
Transformed moment of inertiaabout the x axis.Ix
1
3btf ttf
3bbf tbf
3Dw tw
3btr tslab
3
Results: Ax 70.3 in2
Iy 4198 in4
Iz 11538.5 in4
Ix 856 in4
Composite Section Properties (Uncracked Section - used for live load negative bending):
Find composite section area and centroid:
Axneg Asteel
Arneg n 1( )
nAslab
Centroid of transformedcomposite section from topof slab.ycneg
ysteel Asteel
crneg Arneg n 1( )
nAslab yslab
Axneg
ycneg 8.8 in
A-76

Calculate Transformed Izneg for composite negative moment section:
Transformed momentof inertia about the zaxis.
Izneg Izsteel Asteel ysteel ycneg2
Izslab Aslab yslab ycneg2 Arneg n 1( )
ncrneg ycneg
2
Izneg 7219.4 in4
Composite Section Properties (Cracked Section - used for live load negative bending):
Find cracked section area and centroid:
Acr Asteel Arneg 32 in2
ycr
Asteel ysteel Arneg crneg
Acr
14.6 in ycrb tslab ttf Dw tbf ycr 26 in
Find cracked section moments of inertia and section moduli:
Izcr Izsteel Asteel ysteel ycr2
Ar cr ycr2
Izcr 4853.6 in4
Iycr Iysteel Iycr 114.6 in4
Ixcr1
3btf ttf
3bbf ttf
3Dw tw
3Ixcr 2.7 in
4
dtopcr ycr crt dtopcr 11.2 in
dbotcr tslab ttf Dw tbf ycr dbotcr 26 in
Stopcr
Izcr
dtopcr
Stopcr 434 in3
Sbotcr
Izcr
dbotcr
Sbotcr 186.7 in3
7. PERMANENT LOADS
Phase 1: Steel girders are simply supported, and support their self-weight plus the weight of the slab. Steel girders ineach module for this example are separated by three diaphragms - one at each bearing location, and one at midspan.Other module span configurations may require an increase or decrease in the number of diaphragms.
Wdeck_int wc spacingint td Wdeck_int 382.8 plf
Wdeck_ext wc spacingext td Wdeck_ext 393.8 plf
Whaunch wc wh th Whaunch 21.9 plf
Wstringer ws1 Wstringer 90 plf
Diaphragms: MC18x42.7 Thickness Conn. Plate tconn5
8in
Diaphragm Weight ws2 42.7plf Width Conn. Plate wconn 5in
Diaphragm Length Ldiaph 4ft 2.5in Height Conn. Plate hconn 28.5in
Wdiaphragm ws2
Ldiaph
2 Wdiaphragm 89.8 lbf
A-77

Wconn 2 ws tconn wconn hconn Wconn 50.5 lbf
WDCpoint Wdiaphragm Wconn 1.05WDCpoint 147.4 lbf
Equivalent distributed load from DC point loads: wDCpt_equiv
3 WDCpoint
Lstr
7.4 plf
Interior Uniform Dead Load, Phase 1: WDCuniform1_int Wdeck_int Whaunch Wstringer wDCpt_equiv 502.1 plf
Exterior Uniform Dead Load, Phase 1: WDCuniform1_ext Wdeck_ext Whaunch Wstringer wDCpt_equiv 513.1 plf
Moments due to Phase 1 DL: MDC1_int x( )WDCuniform1_int x
2Lstr x MDC1_ext x( )
WDCuniform1_ext x
2Lstr x
Shear due to Phase 1 DL: VDC1_int x( ) WDCuniform1_int
Lstr
2x VDC1_ext x( ) WDCuniform1_ext
Lstr
2x
Phase 2: Steel girders are simply supported and composite with the deck slab, and support their self-weight plus theweight of the slab in addition to barriers on exterior modules. Barriers are assumed to be evenly distributed betweenthe two exterior module girders.
Barrier Area Abarrier 2.89ft2
Barrier Weight Wbarrier
wc Abarrier
2Wbarrier 216.8 plf
Interior Dead Load, Phase 2: WDCuniform_int WDCuniform1_int 502.1 plf
Exterior Dead Load, Phase 2: WDCuniform_ext WDCuniform1_ext Wbarrier 729.8 plf
Moments due to Phase 2 DL: MDC2_int x( )WDCuniform_int x
2Lstr x MDC2_ext x( )
WDCuniform_ext x
2Lstr x
Shear due to Phase 2 DL: VDC2_int x( ) WDCuniform_int
Lstr
2x VDC2_ext x( ) WDCuniform_ext
Lstr
2x
Phase 3: Girders are composite and have been made continuous. Utilities and future wearing surface are applied.
Unit Weight Overlay wws 30psf
Wws_int wws spacingint Wws_int 87.5 plfWws_ext wws spacingext 1 ft 7in
Wws_ext 42.5 plf
Unit Weight Utilities Wu 15plf
WDWuniform_int Wws_int Wu WDWuniform_int 102.5 plfWDWuniform_ext Wws_ext Wu WDWuniform_ext 57.5 plf
Moments due to DW: MDW_int x( )WDWuniform_int x
2Lstr x MDW_ext x( )
WDWuniform_ext x
2Lstr x
Shears due to DW: VDW_int x( ) WDWuniform_int
Lstr
2x VDW_ext x( ) WDWuniform_ext
Lstr
2x
A-78

8. PRECAST LIFTING WEIGHTS AND FORCES
This section addresses the construction loads for lifting the module into place. The module is lifted from four points, atsome distance, Dlift from each end of each girder.
Distance from end of lifting point: Dlift 8.75ft
Assume weight uniformly distributed along girder, with 30% Dynamic Dead Load Allowance:
Dynamic Dead Load Allowance: DLIM 30%
Interior Module:Total Interior Module Weight: Wint Lstr WDCuniform_int 3 WDCpoint 2 1 DLIM( ) 78.8 kip
Vertical force at lifting point: Flift_int
Wint
419.7 kip
Equivalent distributed load: wint_IM
Wint
2 Lstr
662.4 plf
Min (Neg.) Moment during lifting: Mlift_neg_max_int wint_IM
Dlift2
2Mlift_neg_max_int 25.4 kip ft
Max (Pos.) Moment during lifting: Mlift_pos_max_int 0wint_IM Lstr 2 Dlift
2
8Mlift_neg_max_int 0if
wint_IM Lstr 2 Dlift2
8Mlift_neg_max_int
Mlift_pos_max_int 120.7 kip ft
Exterior Module:
Total Exterior Module Weight: Wext Lstr WDCuniform_ext 3 WDCpoint Wbarrier Lstr 2 1 DLIM( ) 147.6 kip
Vertical force at lifting point: Flift_ext
Wext
436.9 kip
Equivalent distributed load: wext_IM
Wext
2 Lstr
1240.2 plf
Min (Neg.) Moment during lifting: Mlift_neg_max_ext wext_IM
Dlift2
2Mlift_neg_max_ext 47.5 kip ft
A-79

Max (Pos.) Moment during lifting: Mlift_pos_max_ext 0wext_IM Lstr 2 Dlift
2
8Mlift_neg_max_ext 0if
wext_IM Lstr 2 Dlift2
8Mlift_neg_max_ext
Mlift_pos_max_ext 226 kip ft
Max Shear during lifting: Vlift max wext_IM Dlift Flift_ext wext_IM Dlift 26 kip
9. LIVE LOAD DISTRIBUTION FACTORS
These factors represent the distribution of live load from the deck to the girders in accordance with AASHTO Section 4,and assumes the deck is fully continuous across the joints.
Girder Section Modulus: Izsteel 4463.1 in4
Girder Area: Asteel 27.4 in2
Girder Depth: dgird 29.5 in
Distance betweencentroid of deck andcentroid of beam:
eg
td
2th
dgird
222 in
Modular Ratio: n 7
Multiple PresenceFactors:
MP1 1.2 MP2 1.0 S3.6.1.1.2-1
Interior Stringers for Moment:S4.6.2.2.1-1
One Lane Loaded: Kg n Izsteel Asteel eg2
124228.9 in4
gint_1m 0.06spacingint
14ft
0.4spacingint
Lspan
0.3Kg
Lspan td3
0.1
0.241
Two Lanes Loaded: gint_2m 0.075spacingint
9.5ft
0.6spacingint
Lspan
0.2Kg
Lspan td3
0.1
0.3
Governing Factor: gint_m max gint_1m gint_2m 0.3
Interior Stringers for Shear:One Lane Loaded: gint_1v 0.36
spacingint
25ft0.477
Two Lanes Loaded: gint_2v 0.2spacingint
12ft
spacingint
35ft
2
0.436
Governing Factor: gint_v max gint_1v gint_2v 0.477
Exterior Stringers for Moment:
A-80

One Lane Loaded: Use Lever Rule. Wheel is 2' from barrier; barrier is 2" beyond exterior stringer.de 2in
Lspa 4.5ft r Lspa de 2ft 2.7 ft
gext_1m MP10.5r
Lspa
0.356
Two Lanes Loaded: e2m 0.77de
9.1ft0.7883
gext_2m e2m gint_2m 0.236
Governing Factor: gext_m max gext_1m gext_2m 0.356
Exterior Stringers for Shear:One Lane Loaded: Use Lever Rule.
gext_1v gext_1m 0.356
Two Lanes Loaded: e2v 0.6de
10ft0.62
gext_2v e2v gint_2v 0.269
Governing Factor: gext_v max gext_1v gext_2v 0.356
FACTOR TO USE FOR SHEAR: gv max gint_v gext_v 0.477
FACTOR TO USE FOR MOMENT: gm max gint_m gext_m 0.356
10. LOAD RESULTS
Case 1: Dead Load on Steel Only (calculated in Section 7). Negative moments are zero and are not considered.Because the girder is simply supported, the maximum moment is at x = Lstr/2 and the maximum shear is at x = 0.
Interior Girder MDC1int MDC1_int
Lstr
2222.2 kip ft MDW1int 0 kip ft MLL1int 0kip ft
VDC1int VDC1_int 0( ) 14.9 kip VDW1int 0 kip VLL1int 0 kip
Exterior Girder MDC1ext MDC1_ext
Lstr
2227 kip ft MDW1ext 0 kip ft MLL1ext 0 kip ft
VDC1ext VDC1_ext 0( ) 15.3 kip VDW1ext 0 kip VLL1ext 0 kip ftLoad Cases:
M1_STR_I max 1.25 MDC1int 1.5 MDW1int 1.75 MLL1int 1.25 MDC1ext 1.5 MDW1ext 1.75 MLL1ext 283.8 kip f
V1_STR_I max 1.25 VDC1int 1.5 VDW1int 1.75 VLL1int 1.25 VDC1ext 1.5 VDW1ext 1.75 VLL1ext 19.1 kip
Case 2: Dead Load on Composite Section (calculated in Section 7). Negative moments are zero and are not considered.Again, the maximum moment occur at x = Lstr/2 and the maximum shear is at x = 0.
Interior Girder MDC2int MDC2_int
Lstr
2222.2 kip ft MDW2int 0 kip ft MLL2int 0 kip ft
VDC2int VDC2_int 0( ) 14.9 kip VDW2int 0 kip VLL2int 0 kip
Exterior Girder MDC2ext MDC2_ext
Lstr
2323 kip ft MDW2ext 0 kip ft MLL2ext 0 kip ft
VDC2ext VDC2_ext 0( ) 21.7 kip VDW2ext 0 kip VLL2ext 0 kip
Load Cases:M2_STR_I max 1.25 MDC2int 1.5 MDW2int 1.75 MLL2int 1.25 MDC2ext 1.5 MDW2ext 1.75 MLL2ext 403.7 kip f
A-81

V2_STR_I max 1.25 VDC2int 1.5 VDW2int 1.75 VLL2int 1.25 VDC2ext 1.5 VDW2ext 1.75 VLL2ext 27.1 kip
Case 3: Composite girders are lifted into place from lifting points located distance Dlift from the girder edges.
Maximum moments and shears were calculated in Section 8.
Interior Girder MDC3int Mlift_pos_max_int 120.7 kip ft MDW3int 0 kip ft MLL3int 0 kip ft
MDC3int_neg Mlift_neg_max_int 25.4 kip ft MDW3int_neg 0 kip ft MLL3int_neg 0 kip ft
VDC3int Vlift 26 kip VDW3int 0 kip VLL3int 0 kip
Exterior Girder MDC3ext Mlift_pos_max_ext 226 kip ft MDW3ext 0 kip ft MLL3ext 0 kip ft
MDC3ext_neg Mlift_neg_max_ext 47.5 kip ft MDW3ext_neg 0 kip ft MLL3ext_neg 0 kip ft
VDC3ext Vlift 26 kip VDW3ext 0 kip VLL3ext 0 kip
Load Cases:M3_STR_I max 1.5 MDC3int 1.5 MDW3int 1.5 MDC3ext 1.5 MDW3ext 339 kip ft
M3_STR_I_neg max 1.5 MDC3int_neg 1.5 MDW3int_neg 1.5 MDC3ext_neg 1.5 MDW3ext_neg 71.2 kip ft
V3_STR_I max 1.5 VDC3int 1.5 VDW3int 1.5 VDC3ext 1.5 VDW3ext 39.1 kip
Case 4: Composite girders made continuous. Utilities and future wearing surface are applied, and live load. Maximummoment and shear results are from a finite element analysis not included in this design example. The live load valueincludes the lane fraction calculated in Section 9, and impact.
Governing Loads: MDC4 210.2kip ft MDW4 29.5 kip ft MLL4 350.16 kip ft
MWS4 0kip ft MW4 0kip ft
MDC4neg 262.7 kip ft MDW4neg 36.9 kip ft MLL4neg 310.79kip ft
MWS4neg 0 kip ft MWL4neg 0 kip ft
VDC 26.3kip VDW 3.7kip VLL 100.6kip
Vu 1.25 VDC 1.5 VDW 1.75 VLL gv 122.3 kip
Load Cases:M4_STR_I 1.25 MDC4 1.5 MDW4 1.75 MLL4 919.8 kip ft
M4_STR_I_neg 1.25 MDC4neg 1.5 MDW4neg 1.75 MLL4neg 927.6 kip ft
M4_STR_III 1.25 MDC4 1.5 MDW4 1.4 MWS4 307 kip ft
M4_STR_III_neg 1.25 MDC4neg 1.5 MDW4neg 1.4 MWS4 383.7 kip ft
M4_STR_V 1.25 MDC4 1.5 MDW4 1.35 MLL4 0.4 MWS4 1.0 MW4 779.7 kip ft
M4_STR_V_neg 1.25 MDC4neg 1.5 MDW4neg 1.35 MLL4neg 0.4 MWS4neg 1.0 MWL4neg 803.3 kip ft
M4_SRV_I 1.0 MDC4 1.0 MDW4 1.0 MLL4 0.3 MWS4 1.0 MW4 589.9 kip ft
M4_SRV_I_neg 1.0 MDC4neg 1.0 MDW4neg 1.0 MLL4neg 0.3 MWS4neg 1.0 MWL4neg 610.4 kip ft
M4_SRV_II 1.0 MDC4 1.0 MDW4 1.3 MLL4 694.9 kip ft
M4_SRV_II_neg 1.0 MDC4neg 1.0 MDW4neg 1.3 MLL4neg 703.6 kip ft
A-82

11. FLEXURAL STRENGTH
The flexural resistance shall be determined as specified in LRFD Design Article 6.10.6.2. Determine Stringer PlasticMoment Capacity First.
LFRD Appendix D6 Plastic Moment
Find location of PNA:
Forces:
Prt Art Fs 81.4 kip Ps 0.85 fc beff tslab 1190 kip Pw Fy Dw tw 737.9 kip
Prb Arb Fs 115.5 kip Pc Fy btf ttf 317.2 kip Pt Fy bbf tbf 317.2 kip
A-83
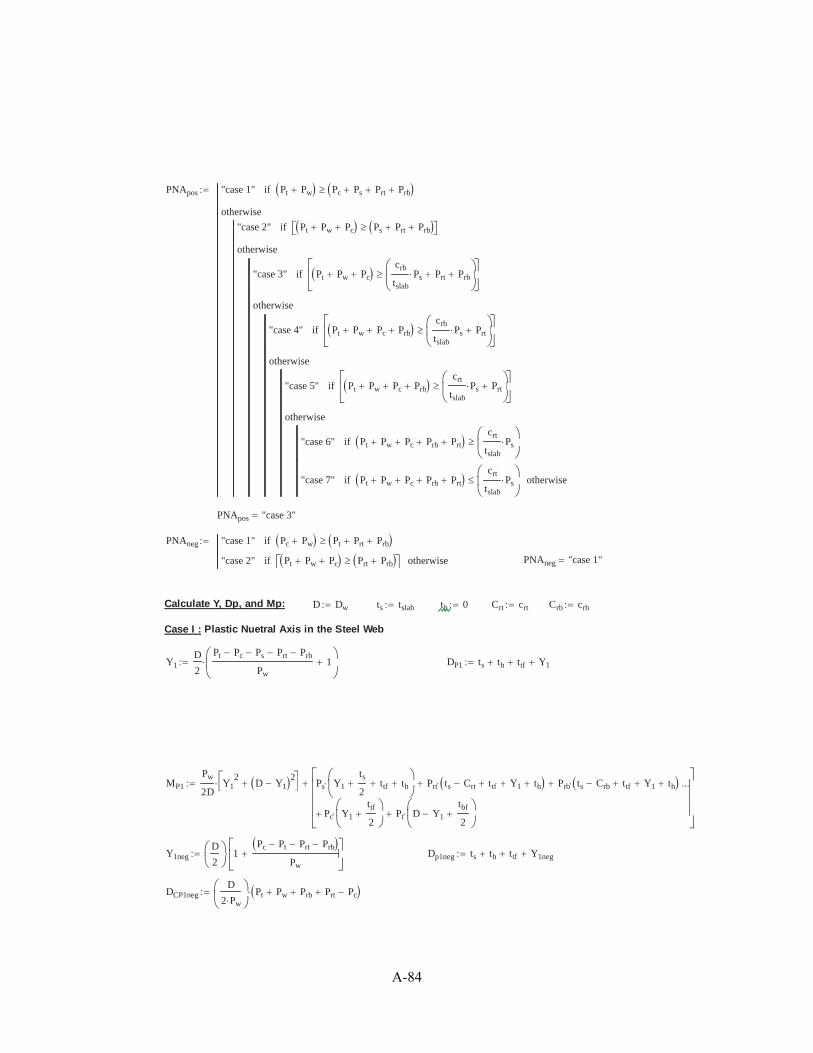
PNApos "case 1" Pt Pw Pc Ps Prt Prbif
"case 2" Pt Pw Pc Ps Prt Prbif
"case 3" Pt Pw Pc
crb
tslab
Ps Prt Prbif
"case 4" Pt Pw Pc Prb
crb
tslab
Ps Prtif
"case 5" Pt Pw Pc Prb
crt
tslab
Ps Prtif
"case 6" Pt Pw Pc Prb Prt
crt
tslab
Psif
"case 7" Pt Pw Pc Prb Prt
crt
tslab
Psif otherwise
otherwise
otherwise
otherwise
otherwise
otherwise
PNApos "case 3"
PNAneg "case 1" Pc Pw Pt Prt Prbif
"case 2" Pt Pw Pc Prt Prbif otherwise PNAneg "case 1"
Calculate Y, Dp, and Mp: D Dw ts tslab th 0 Crt crt Crb crb
Case I : Plastic Nuetral Axis in the Steel Web
Y1D
2
Pt Pc Ps Prt Prb
Pw
1 DP1 ts th ttf Y1
MP1
Pw
2DY1
2D Y1
2Ps Y1
ts
2ttf th Prt ts Crt ttf Y1 th Prb ts Crb ttf Y1 th
Pc Y1
ttf
2Pt D Y1
tbf
2
Y1negD
21
Pc Pt Prt Prb
Pw
Dp1neg ts th ttf Y1neg
DCP1negD
2 Pw
Pt Pw Prb Prt Pc
A-84

Mp1neg
Pw
2 DY1neg
2Dw Y1neg
2Prt ts Crt ttf Y1neg th Prb ts Crb ttf Y1neg th
Pt D Y1neg
tbf
2Pc Y1neg
ttf
2
Case II: Plastic Nuetral Axis in the Steel Top Flange
Y2
ttf
2
Pw Pt Ps Prt Prb
Pc
1 DP2 ts th Y2
MP2
Pc
2ttf
Y22
ttf Y22
Ps Y2
ts
2th Prt ts Crt th Y2 Prb ts Crb th Y2
PwD
2ttf Y2 Pt D Y2
tbf
2ttf
Y2neg
ttf
21
Pw Pc Prt Prb
Pt
DP2neg ts th Y2neg DCP2neg D
Mp2neg
Pt
2 ttf
Y2neg2
ttf Y2neg2
Prt ts Crt th Y2neg Prb ts Crb th Y2neg
Pw ttf Y2negD
2Pc ts th Y2neg
ttf
2
Case III: Plastic Nuetral Axis in the Concrete Deck Below the Bottom Reinforcing
Y3 ts
Pc Pw Pt Prt Prb
Ps
DP3 Y3
MP3
Ps
2ts
Y32
Prt Y3 Crt Prb Crb Y3 Pc
ttf
2ts th Y3 Pw
D
2ttf th ts Y3
Pt Dtbf
2ttf ts th Y3
Case IV: Plastic Nuetral Axis in the Concrete Deck in the bottom reinforcing layer
Y4 Crb DP4 Y4
MP4
Ps
2ts
Y42
Prt Y4 Crt Pc
ttf
2th ts Y4 Pw
D
2ttf th ts Y4
Pt Dtbf
2ttf th ts Y4
Case V: Plastic Nuetral Axis in the Concrete Deck between top and bot reinforcing layers
Y5 ts
Prb Pc Pw Pt Prt
Ps
DP5 Y5
MP5
Ps
2ts
Y52
Prt Y5 Crt Prb ts Crb Y5 Pc
ttf
2ts th Y5 Pw
D
2ttf th ts Y5
Pt Dtbf
2ttf ts th Y5
A-85

Ypos Y1 PNApos "case 1"=if
Y2 PNApos "case 2"=if
Y3 PNApos "case 3"=if
Y4 PNApos "case 4"=if
Y5 PNApos "case 5"=if
DPpos DP1 PNApos "case 1"=if
DP2 PNApos "case 2"=if
DP3 PNApos "case 3"=if
DP4 PNApos "case 4"=if
DP5 PNApos "case 5"=if
MPpos MP1 PNApos "case 1"=if
MP2 PNApos "case 2"=if
MP3 PNApos "case 3"=if
MP4 PNApos "case 4"=if
MP5 PNApos "case 5"=if
Ypos 7.9 in DPpos 7.9 in MPpos 2274.2 kip ft
Dp = distance from the top of slab of composite section to the neutral axis atthe plastic moment (neglect positive moment reinforcement in the slab).
Yneg Y1neg PNAneg "case 1"=if
Y2neg PNAneg "case 2"=if
DPneg Dp1neg PNAneg "case 1"=if
DP2neg PNAneg "case 2"=if
MPneg Mp1neg PNAneg "case 1"=if
Mp2neg PNAneg "case 2"=if
Yneg 11.5 in DPneg 20.1 in MPneg 19361.5 kip in
Depth of web in compression at the plastic moment [D6.3.2]:
At bbf tbf Ac btf ttf
DcpposD
2
Fy At Fy Ac 0.85 fc Aslab Fs Ar
Fy Aw
1
Dcppos 0in( ) PNApos "case 1"if
0in( ) Dcppos 0if
Dcppos PNApos "case 1"=if
Dcpneg DCP1neg PNAneg "case 1"=if
DCP2neg PNAneg "case 2"=if
Dcpneg 19.9 in
Dcppos 0 in
Positive Flexural Compression Check:
From LRFD Article 6.10.2
Check for compactness:
Web Proportions: Web slenderness Limit:
Dw
tw
150 1 2Dcppos
tw
3.76Es
Fy
1 S 6.10.6.2.2
Therefore Section is considered compact and shall satisfy the requirements of Article 6.10.7.1.
Mn MPpos DPpos 0.1 Dtif
MPpos 1.07 0.7DPpos
Dt
otherwise Mn 2123.7 kip ft
Negative Moment Capacity Check (Appendix A6):
Web Slenderness: Dt 40.6 in Dcneg Dt ycr tbf 25.4 in
2 Dcneg
tw
5.7Es
Fy
1 S Appendix A6 (for skew less than 20 deg).
Moment ignoring concrete:
A-86

Myt Fy Sbotcr 9334.1 kip in Myc Fs Stopcr 26039.6 kip in
My min Myc Myt 9334.1 kip in
Web Compactness:
Check for Permanent Deformations (6.10.4.2):
Dn max tslab ttf Dw yc yc tslab ttf 28 in
Gov if yc tslab ttf yc crt Dn 8.5 in
fn M4_SRV_II_negGov
Iz
6.2 ksi Steel stress on side of Dn
ρ min 1.0Fy
fn
1 β 2 Dn
tw
Atf
4.2 Rh12 β 3ρ ρ
3
12 2 β( )1
λrw 5.7Es
Fy
λPWdcp min λrw
Dcpneg
Dcneg
Es
Fy
0.54MPneg
Rh My
0.09
222.7
2Dcpneg
tw
λPWdcp 0
Web Plastification: Rpc
MPneg
Myc
0.7 Rpt
MPneg
Myt
2.1
Flexure Factor: ϕf 1.0
Tensile Limit: Mr_neg_t ϕf Rpt Myt 1613.5 kip ft
Compressive Limit:
Local Buckling Resistance:
λf
bbf
2 tbf
8.5 λrf 0.95 0.76Es
Fy
19.9
λpf 0.38Es
Fy
9.2 Fyresid max min 0.7 Fy Rh Fy
Stopcr
Sbotcr
Fy 0.5 Fy 35.0 ksi
MncLB Rpc Myc λf λpfif
Rpc Myc 1 1Fyresid Stopcr
Rpc Myc
λf λpf
λrf λpf
otherwise MncLB 1613.5 kip ft
Lateral Torsional Buckling Resistance:
Lb
Lstr
2 39.9 ft Inflection point assumed to be at 1/6 span
rt
bbf
12 11
3
Dcneg tw
bbf tbf
2.4 in
A-87

Lp 1.0 rt
Es
Fy
56.7 in h D tbf 32 in Cb 1.0
Jb
D tw3
3
bbf tbf3
31 0.63
tbf
bbf
btf ttf3
31 0.63
ttf
btf
2.6 in4
Lr 1.95 rt
Es
Fyresid
Jb
Sbotcr h1 1 6.76
Fyresid
Es
Sbotcr h
Jb
2
228.3 in
Fcr
Cb π2
Es
Lb
rt
21 0.078
Jb
Sbotcr h
Lb
rt
2
116.7 ksi
MncLTB Rpc Myc Lb Lpif
min Cb 1 1Fyresid Sbotcr
Rpc Myc
Lb Lp
Lr Lp
Rpc Myc Rpc Myc Lp Lb Lrif
min Fcr Sbotcr Rpc Myc Lb Lrif
MncLTB 1225.3 kip ft
Mr_neg_c ϕf min MncLB MncLTB 1225.3 kip ft
Governing negative moment capacity: Mr_neg min Mr_neg_t Mr_neg_c 1225.3 kip ft
12. FLEXURAL STRENGTH CHECKS
Phase 1: First, check the stress due to the dead load on the steel section only. (LRFD 6.10.3 - ConstructabilityRequirements
Reduction factor for construction ϕconst 0.9
Load Combination for construction 1.25 MDC
Max Moment applied, Phase 1:(at midspan)
Mint_P1 1.25 MDC1_int
Lstr
2277.8 kip ft Interior( )
Mext_P1 1.25 MDC1_ext
Lstr
2283.8 kip ft Exterior( )
Maximum Stress, Phase 1:fint_P1
Mint_P1 ysteel
Izsteel
12.2 ksi Interior( )
fext_P1
Mext_P1 ysteel
Izsteel
12.4 ksi Exterior( )
Stress limits: fP1_max ϕconst Fy
fint_P1 fP1_max 1 fext_P1 fP1_max 1
Phase 2: Second, check the stress due to dead load on the composite section (with barriers added)
Reduction factor for construction ϕconst 0.9
Load Combination for construction 1.25 MDC
Max Moment applied, Phase 2:(at midspan) M2_STR_I 403.7 kip ft
A-88
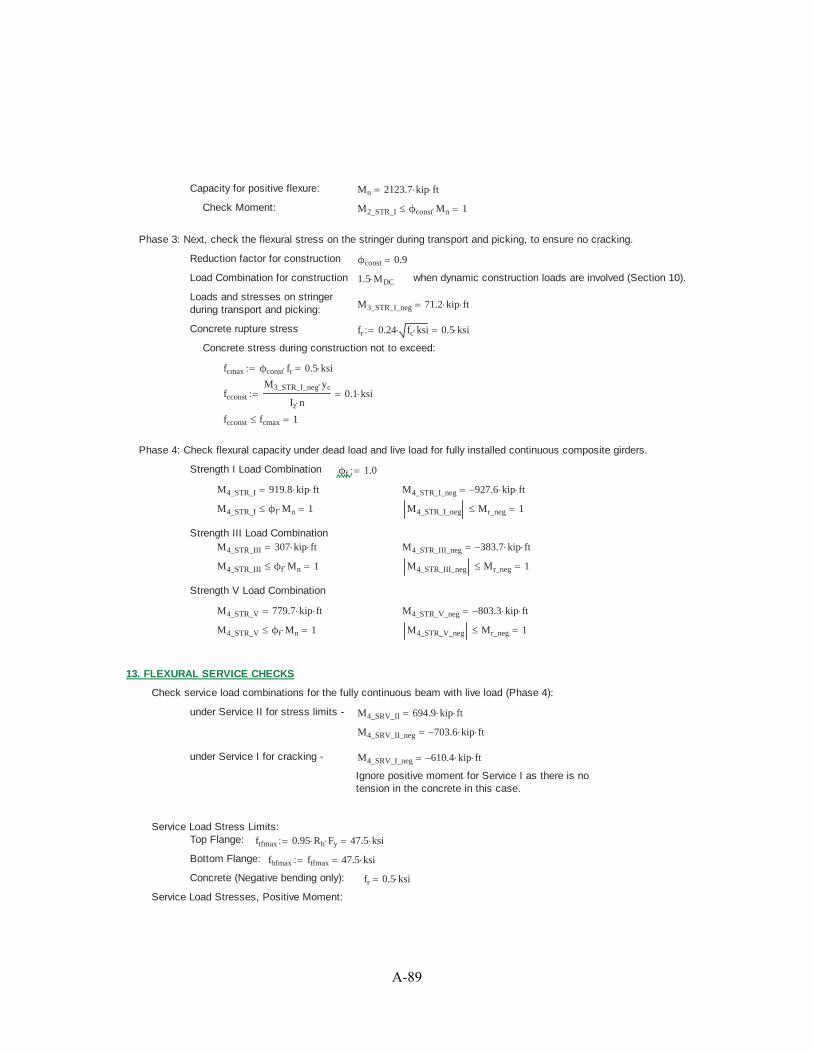
Capacity for positive flexure: Mn 2123.7 kip ft
Check Moment: M2_STR_I ϕconst Mn 1
Phase 3: Next, check the flexural stress on the stringer during transport and picking, to ensure no cracking.
Reduction factor for construction ϕconst 0.9
Load Combination for construction 1.5 MDC when dynamic construction loads are involved (Section 10).
Loads and stresses on stringerduring transport and picking: M3_STR_I_neg 71.2 kip ft
Concrete rupture stress fr 0.24 fc ksi 0.5 ksi
Concrete stress during construction not to exceed:
fcmax ϕconst fr 0.5 ksi
fcconst
M3_STR_I_neg yc
Iz n0.1 ksi
fcconst fcmax 1
Phase 4: Check flexural capacity under dead load and live load for fully installed continuous composite girders.
Strength I Load Combination ϕf 1.0
M4_STR_I 919.8 kip ft M4_STR_I_neg 927.6 kip ft
M4_STR_I ϕf Mn 1 M4_STR_I_neg Mr_neg 1
Strength III Load CombinationM4_STR_III 307 kip ft M4_STR_III_neg 383.7 kip ft
M4_STR_III ϕf Mn 1 M4_STR_III_neg Mr_neg 1
Strength V Load Combination
M4_STR_V 779.7 kip ft M4_STR_V_neg 803.3 kip ft
M4_STR_V ϕf Mn 1 M4_STR_V_neg Mr_neg 1
13. FLEXURAL SERVICE CHECKS
Check service load combinations for the fully continuous beam with live load (Phase 4):
under Service II for stress limits - M4_SRV_II 694.9 kip ft
M4_SRV_II_neg 703.6 kip ft
under Service I for cracking - M4_SRV_I_neg 610.4 kip ft
Ignore positive moment for Service I as there is notension in the concrete in this case.
Service Load Stress Limits:Top Flange: ftfmax 0.95 Rh Fy 47.5 ksi
Bottom Flange: fbfmax ftfmax 47.5 ksi
Concrete (Negative bending only): fr 0.5 ksi
Service Load Stresses, Positive Moment:
A-89

Top Flange: fSRVII_tf M4_SRV_II
yc tslab
Iz
2.9 ksi
fSRVII_tf ftfmax 1
Bottom Flange: fbfs2 M4_SRV_II
tslab ttf Dw tbf yc
Iz
20.7 ksi
fl 0 fbfs2
fl
2fbfmax 1
Service Load Stresses, Negative Moment:Top (Concrete):
fcon.neg
M4_SRV_I_neg ycneg
n Izneg
1.3 ksi Using Service I Loading
fcon.neg fr 0
Bottom Flange: fbfs2.neg
M4_SRV_I_neg tslab ttf Dw tbf ycneg
Izneg
32.3 ksi
fbfs2.neg fbfmax 1
Check LL Deflection:
ΔDT 1.104 in from independent Analysis - includes 100% design truck (w/impact), or 25% designtruck (w/impact) + 100% lane load
DFδ3
120.3 Deflection distribution factor = (no. lanes)/(no. stringers)
Lstr
ΔDT DFδ2587 Equivalent X, where L/X = Deflection*Distribution Factor
Lstr
ΔDT DFδ800 1
14. SHEAR STRENGTHShear Capacity based on AASHTO LRFD 6.10.9
Nominal resistance of unstiffened web:Fy 50.0 ksi Dw 31.4 in tw 0.5 in ϕv 1.0 k 5
Vp 0.58 Fy Dw tw 428.0 kip
A-90
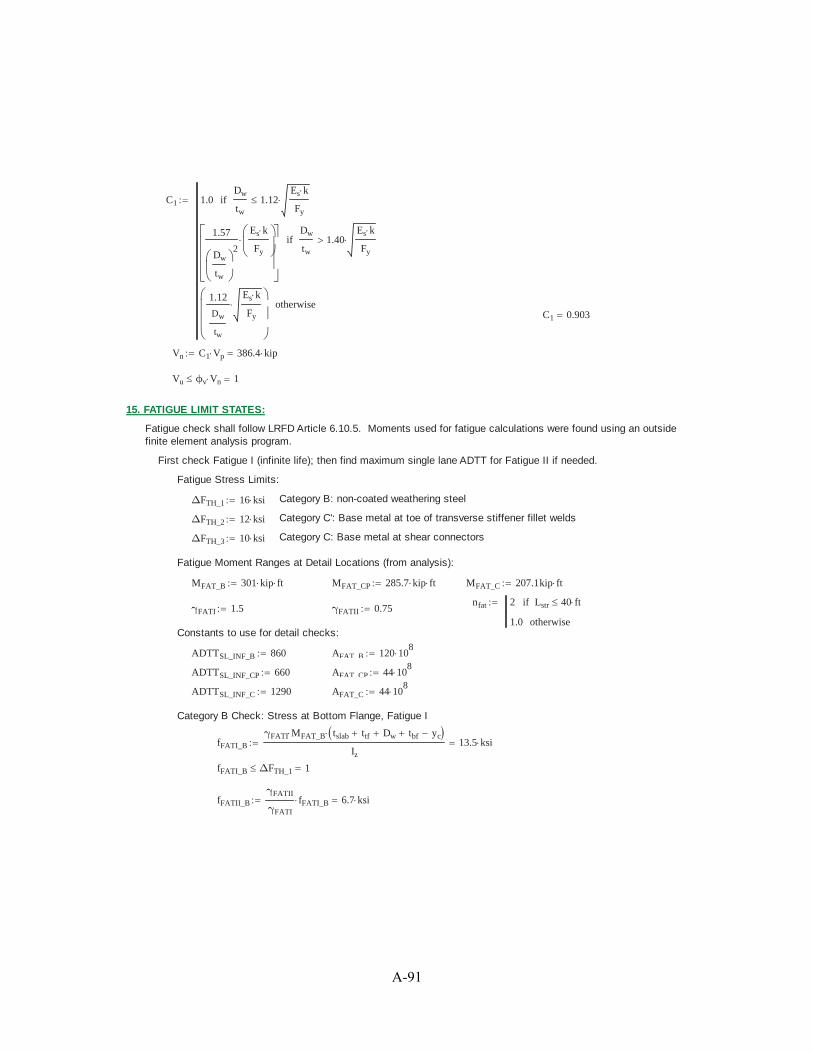
C1 1.0Dw
tw
1.12Es k
Fy
if
1.57
Dw
tw
2
Es k
Fy
Dw
tw
1.40Es k
Fy
if
1.12
Dw
tw
Es k
Fy
otherwiseC1 0.903
Vn C1 Vp 386.4 kip
Vu ϕv Vn 1
15. FATIGUE LIMIT STATES:
Fatigue check shall follow LRFD Article 6.10.5. Moments used for fatigue calculations were found using an outsidefinite element analysis program.
First check Fatigue I (infinite life); then find maximum single lane ADTT for Fatigue II if needed.
Fatigue Stress Limits:
ΔFTH_1 16 ksi Category B: non-coated weathering steel
ΔFTH_2 12 ksi Category C': Base metal at toe of transverse stiffener fillet welds
ΔFTH_3 10 ksi Category C: Base metal at shear connectors
Fatigue Moment Ranges at Detail Locations (from analysis):
MFAT_B 301 kip ft MFAT_CP 285.7 kip ft MFAT_C 207.1kip ft
nfat 2 Lstr 40 ftif
1.0 otherwiseγFATI 1.5 γFATII 0.75
Constants to use for detail checks:
ADTTSL_INF_B 860 AFAT_B 120 108
ADTTSL_INF_CP 660 AFAT_CP 44 108
ADTTSL_INF_C 1290 AFAT_C 44 108
Category B Check: Stress at Bottom Flange, Fatigue I
fFATI_B
γFATI MFAT_B tslab ttf Dw tbf yc
Iz
13.5 ksi
fFATI_B ΔFTH_1 1
fFATII_B
γFATII
γFATI
fFATI_B 6.7 ksi
A-91
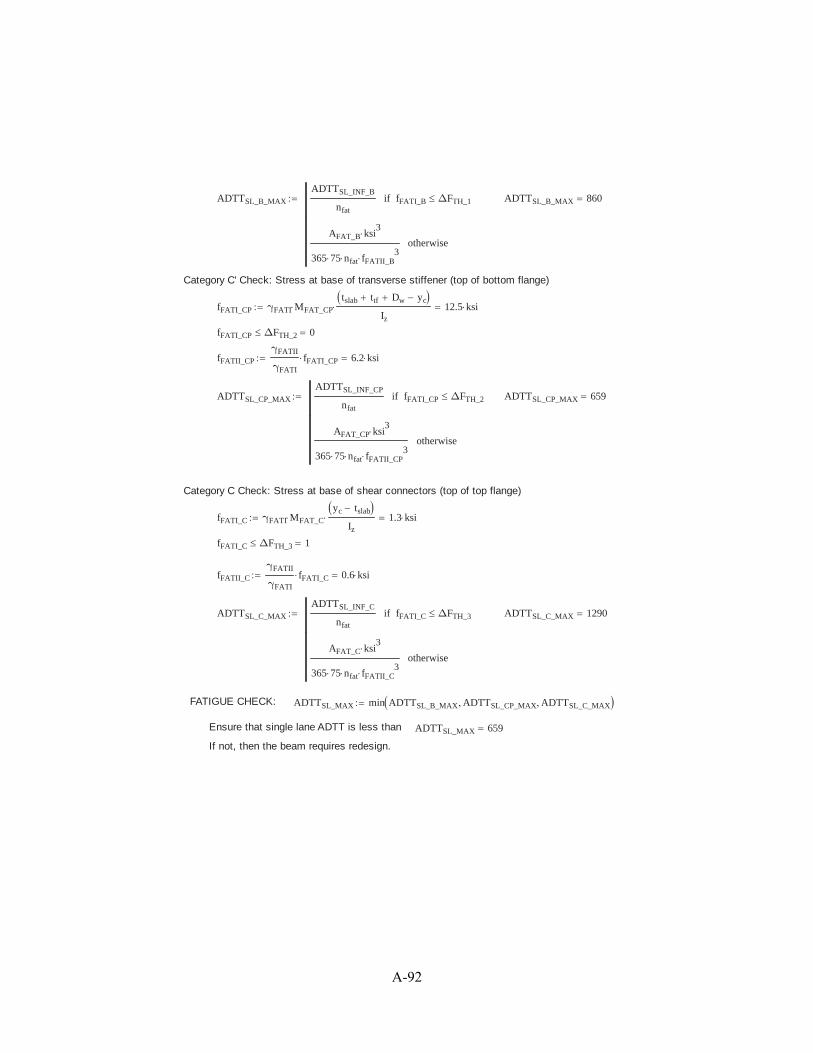
ADTTSL_B_MAX
ADTTSL_INF_B
nfat
fFATI_B ΔFTH_1if
AFAT_B ksi3
365 75 nfat fFATII_B3
otherwise
ADTTSL_B_MAX 860
Category C' Check: Stress at base of transverse stiffener (top of bottom flange)
fFATI_CP γFATI MFAT_CP
tslab ttf Dw yc
Iz
12.5 ksi
fFATI_CP ΔFTH_2 0
fFATII_CP
γFATII
γFATI
fFATI_CP 6.2 ksi
ADTTSL_CP_MAX
ADTTSL_INF_CP
nfat
fFATI_CP ΔFTH_2if
AFAT_CP ksi3
365 75 nfat fFATII_CP3
otherwise
ADTTSL_CP_MAX 659
Category C Check: Stress at base of shear connectors (top of top flange)
fFATI_C γFATI MFAT_C
yc tslab
Iz
1.3 ksi
fFATI_C ΔFTH_3 1
fFATII_C
γFATII
γFATI
fFATI_C 0.6 ksi
ADTTSL_C_MAX
ADTTSL_INF_C
nfat
fFATI_C ΔFTH_3if
AFAT_C ksi3
365 75 nfat fFATII_C3
otherwise
ADTTSL_C_MAX 1290
FATIGUE CHECK: ADTTSL_MAX min ADTTSL_B_MAX ADTTSL_CP_MAX ADTTSL_C_MAX
Ensure that single lane ADTT is less than ADTTSL_MAX 659
If not, then the beam requires redesign.
A-92

16. BEARING STIFFENERSbp x tpUsing LRFD Article 6.10.11 for stiffeners:
tp5
8in bp 5in ϕb 1.0 tp_weld
5
16in 9tw x tw 9tw x tw
*Check min weld sizeProjecting Width Slenderness Check:
bp 0.48tp
Es
Fy
1
bp x tpStiffener Bearing Resistance:
Apn 2 bp tp_weld tp Apn 5.9 in2
Rsb_n 1.4 Apn Fy Rsb_n 410.2 kip
Rsb_r ϕb Rsb_n Rsb_r 410.2 kip
RDC 26.721kip RDW 2.62kip RLL 53.943kip
ϕDC_STR_I 1.25 ϕDW_STR_I 1.5 ϕLL_STR_I 1.75
Ru ϕDC_STR_I RDC ϕDW_STR_I RDW ϕLL_STR_I RLL Ru 131.7 kip
Ru Rsb_r 1
Weld Check:
throat tp_weld2
2throat 0.2 in
Lweld Dw 2 3in Lweld 25.4 in
Aeff_weld throat Lweld Aeff_weld 5.6 in2
Fexx 70ksi ϕe2 0.8
Rr_weld 0.6 ϕe2 Fexx Rr_weld 33.6 ksi
Ru_weld
Ru
4 Aeff_weld
Ru_weld 5.9 ksi
Ru_weld Ru_weld 1
Axial Resistance of Bearing Stiffeners: ϕc 0.9
Aeff 2 9 tw tp tw 2 bp tp Aeff 10.5 in2
Leff 0.75 Dw Leff 23.6 in
Ixp
2 9 tw tw3
12
tp 2 bp tw3
12Ixp 59.9 in
4
Iyp
tw tp 2 9 tw3
12
2bp tp3
12Iyp 29.6 in
4
rp
min Ixp Iyp
Aeff
rp 1.7 in
Q 1 for bearing stiffeners Kp 0.75
Po Q Fy Aeff 526 kip
A-93
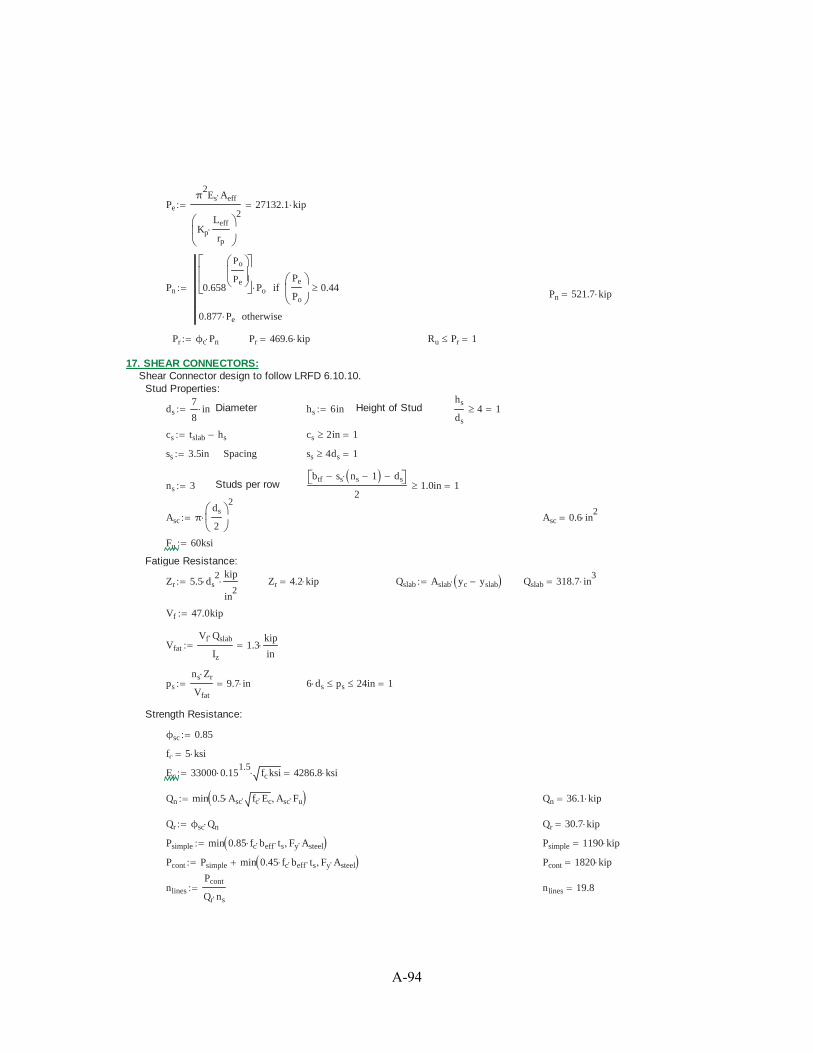
Pe
π2Es Aeff
Kp
Leff
rp
227132.1 kip
Pn 0.658
Po
PePo
Pe
Po
0.44if
0.877 Pe otherwise
Pn 521.7 kip
Pr ϕc Pn Pr 469.6 kip Ru Pr 1
17. SHEAR CONNECTORS:Shear Connector design to follow LRFD 6.10.10.
Stud Properties:
ds7
8in Diameter hs 6in Height of Stud
hs
ds
4 1
cs tslab hs cs 2in 1
ss 3.5in Spacing ss 4ds 1
ns 3 Studs per rowbtf ss ns 1 ds
21.0in 1
Asc πds
2
2
Asc 0.6 in2
Fu 60ksi
Fatigue Resistance:
Zr 5.5 ds2 kip
in2
Zr 4.2 kip Qslab Aslab yc yslab Qslab 318.7 in3
Vf 47.0kip
Vfat
Vf Qslab
Iz
1.3kip
in
ps
ns Zr
Vfat
9.7 in 6 ds ps 24in 1
Strength Resistance:
ϕsc 0.85
fc 5 ksi
Ec 33000 0.151.5
fc ksi 4286.8 ksi
Qn min 0.5 Asc fc Ec Asc Fu Qn 36.1 kip
Qr ϕsc Qn Qr 30.7 kip
Psimple min 0.85 fc beff ts Fy Asteel Psimple 1190 kip
Pcont Psimple min 0.45 fc beff ts Fy Asteel Pcont 1820 kip
nlines
Pcont
Qr ns
nlines 19.8
A-94

Find required stud spacing along the girder (varies as applied shear varies)
i 0 23
x
0.00
1.414
4.947
8.480
12.013
15.546
19.079
22.612
26.145
29.678
33.210
33.917
34.624
36.037
36.743
40.276
43.809
47.342
50.875
54.408
57.941
61.474
65.007
67.833
ft Vfi
61.5
59.2
56.8
54.4
52.0
49.5
47.1
44.7
42.7
40.6
40.6
40.6
40.6
40.6
40.6
42.3
44.2
46.6
49.1
51.5
53.9
56.3
58.7
61.5
kip Vfati
Vfi Qslab
Iz
0
01
2
3
4
5
6
7
8
9
10
11
12
13
14
15
1.71.6
1.6
1.5
1.4
1.4
1.3
1.2
1.2
1.1
1.1
1.1
1.1
1.1
1.1
...
kip
inPmax
ns Zr
Vfati
0
01
2
3
4
5
6
7
8
9
10
11
12
13
14
15
7.47.7
8.1
8.4
8.8
9.2
9.7
10.2
10.7
11.3
11.3
11.3
11.3
11.3
11.3
...
in
min Pmax 7.4 in
max Pmax 11.3 in
18. SLAB PROPERTIES
This section details the geometric and material properties of the deck. Because the equivalent strip method is used inaccordance with AASHTO LRFD Section 4, different loads are used for positive and negative bending.
Unit Weight Concrete wc 150 pcf
Deck Thickness for Design tdeck 8.0in tdeck 7in 1
Deck Thickness for Loads td 10.5 in
Rebar yield strength Fs 60 ksi Strength of concrete fc 5 ksi
Concrete clear cover Bottom Top
cb 1.0in cb 1.0in 1 ct 2.5in ct 2.5in 1
A-95

Transverse reinforcement Bottom Reinforcing ϕtb6
8in ϕtt
5
8inTop Reinforcing
Bottom Spacing stb 8in Top Spacing stt 8in
stb 1.5ϕtb 1.5in 1 stt 1.5ϕtt 1.5in 1
stb 1.5 tdeck 18in 1 stt 1.5 tdeck 18in 1
Astb12in
stb
πϕtb
2
2
0.7 in2
Astt12in
stt
πϕtt
2
2
0.5 in2
Design depth of Bar dtb tdeck cb
ϕtb
26.6 in dtt tdeck ct
ϕtt
25.2 in
Girder Spacing spacingint_max 2ft 11in
spacingext 3 ft
Equivalent Strip, +M wposM 26 6.6spacingint_max
ftin wposM 45.3 in
Equivalent Strip, -M wnegM 48 3.0spacingint_max
ftin wnegM 56.8 in
Once the strip widths are determined, the dead loads can be calculated.
19. PERMANENT LOADSThis section calculates the dead loads on the slab. These are used later for analysis to determine the design moments.
Weight of deck, +M wdeck_pos wc td wposM wdeck_pos 494.9 plf
Weight of deck, -M wdeck_neg wc td wnegM wdeck_neg 620.7 plf
Unit weight of barrier wb 433.5plf
Barrier point load, +M Pb_pos wb wposM Pb_pos 1.63 kip
Barrier point load, -M Pb_neg wb wnegM Pb_neg 2.05 kip
20. LIVE LOADSThis section calculates the live loads on the slab. These loads are analyzed in a separate program with the permanentloads to determine the design moments.
Truck wheel load Pwheel 16kip
Impact Factor IM 1.33
Multiple presence factors MP1 1.2 MP2 1.0 MP3 0.85
Wheel Loads P1 IM MP1 Pwheel P2 IM MP2 Pwheel P3 IM MP3 Pwheel
P1 25.54 kip P2 21.3 kip P3 18.09 kip
21. LOAD RESULTS
The separate MathCAD design aides (available in Appendix of the final report) was used to analyze the deck as an11-span continuous beam without cantilevered overhangs on either end, with supports stationed at girder locations. The dead and live loads were applied separately. The results are represented here as input values, highlighted.
Design Moments
A-96
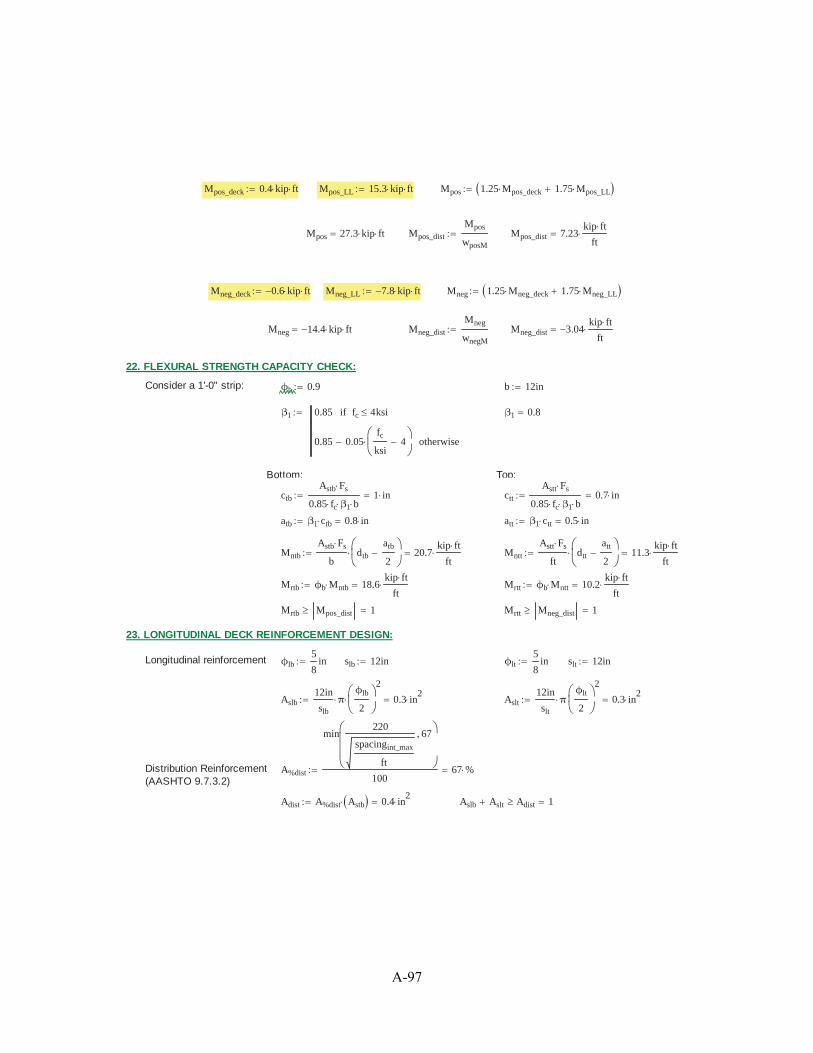
Mpos_deck 0.4 kip ft Mpos_LL 15.3 kip ft Mpos 1.25 Mpos_deck 1.75 Mpos_LL
Mpos 27.3 kip ft Mpos_dist
Mpos
wposM
Mpos_dist 7.23kip ft
ft
Mneg_deck 0.6 kip ft Mneg_LL 7.8 kip ft Mneg 1.25 Mneg_deck 1.75 Mneg_LL
Mneg 14.4 kip ft Mneg_dist
Mneg
wnegM
Mneg_dist 3.04kip ft
ft
22. FLEXURAL STRENGTH CAPACITY CHECK:
Consider a 1'-0" strip: ϕb 0.9 b 12in
β1 0.85 fc 4ksiif
0.85 0.05fc
ksi4 otherwise
β1 0.8
Bottom: Top:
ctb
Astb Fs
0.85 fc β1 b1 in ctt
Astt Fs
0.85 fc β1 b0.7 in
atb β1 ctb 0.8 in att β1 ctt 0.5 in
Mntb
Astb Fs
bdtb
atb
220.7
kip ft
ftMntt
Astt Fs
ftdtt
att
211.3
kip ft
ft
Mrtb ϕb Mntb 18.6kip ft
ftMrtt ϕb Mntt 10.2
kip ft
ft
Mrtb Mpos_dist 1 Mrtt Mneg_dist 1
23. LONGITUDINAL DECK REINFORCEMENT DESIGN:
Longitudinal reinforcement ϕlb5
8in slb 12in ϕlt
5
8in slt 12in
Aslb12in
slb
πϕlb
2
2
0.3 in2
Aslt12in
slt
πϕlt
2
2
0.3 in2
Distribution Reinforcement(AASHTO 9.7.3.2)
A%dist
min220
spacingint_max
ft
67
10067 %
Adist A%dist Astb 0.4 in2
Aslb Aslt Adist 1
A-97
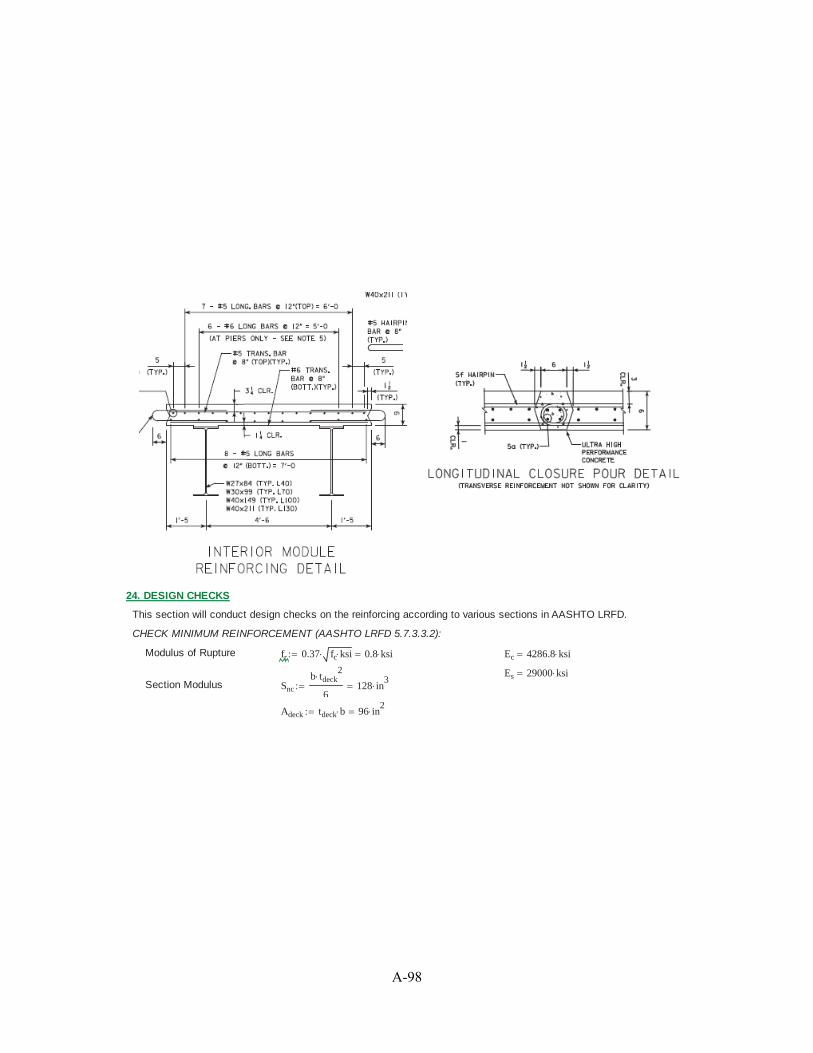
24. DESIGN CHECKS
This section will conduct design checks on the reinforcing according to various sections in AASHTO LRFD.
CHECK MINIMUM REINFORCEMENT (AASHTO LRFD 5.7.3.3.2):
Modulus of Rupture fr 0.37 fc ksi 0.8 ksi Ec 4286.8 ksi
Es 29000 ksiSection Modulus Snc
b tdeck2
6128 in
3
Adeck tdeck b 96 in2
A-98

ybar_tb
Adeck
tdeck
2n 1( ) Astb dtb
Adeck n 1( ) Astb
4.1 in
ybar_tt
Adeck
tdeck
2n 1( ) Astt dtt
Adeck n 1( ) Astt
4 in
Itb
b tdeck3
12Adeck
tdeck
2ybar_tb
2
n 1( ) Astb dtb ybar_tb2
538.3 in4
Itt
b tdeck3
12Adeck
tdeck
2ybar_tt
2
n 1( ) Astt dtt ybar_tt2
515.8 in4
Sc_tb
Itb
tdeck ybar_tb
138.2 in3
Sc_tt
Itt
tdeck ybar_tt
130 in3
Unfactored Dead Load Mdnc_pos_t 1.25kip ft
ftMdnc_neg_t 0.542
kip ft
ft
S 5.7.3.3.2Cracking Moment Mcr_tb max
Sc_tb fr
ftMdnc_pos_t
Sc_tb
Snc
1Sc_tb fr
ft9.5
kip ft
ft
Mcr_tt maxSc_tt fr
ftMdnc_neg_t
Sc_tt
Snc
1Sc_tt fr
ft9
kip ft
ft
Minimum FactoredFlexural Resistance
Mr_min_tb min 1.2 Mcr_tb 1.33 Mpos_dist 9.6kip ft
ftMrtb Mr_min_tb 1
Mr_min_tt min 1.2 Mcr_tt 1.33 Mneg_dist 4kip ft
ftMrtt Mr_min_tt 1
CHECK CRACK CONTROL (AASHTO LRFD 5.7.3.4):γeb 1.0 γet 0.75
MSL_pos 29.64kip ft MSL_neg 29.64kip ft
MSL_pos_dist
MSL_pos
wposM
7.9kip ft
ftMSL_neg_dist
MSL_neg
wnegM
6.3kip ft
ft
fssb
MSL_pos_dist b n
Itb
dtb ybar_tb
3.1 ksi fsst
MSL_neg_dist b n
Itt
dtt ybar_tt
1.2 ksi
dcb cb
ϕtb
21.4 in dct ct
ϕtt
22.8 in
βsb 1dcb
0.7 tdeck dcb
1.3 βst 1dct
0.7 tdeck dct
1.8
sb
700 γeb kip
βsb fssb in2 dcb 171.9 in st
700 γet kip
βst fsst in2 dct 245.5 in
stb sb 1 stt st 1
A-99
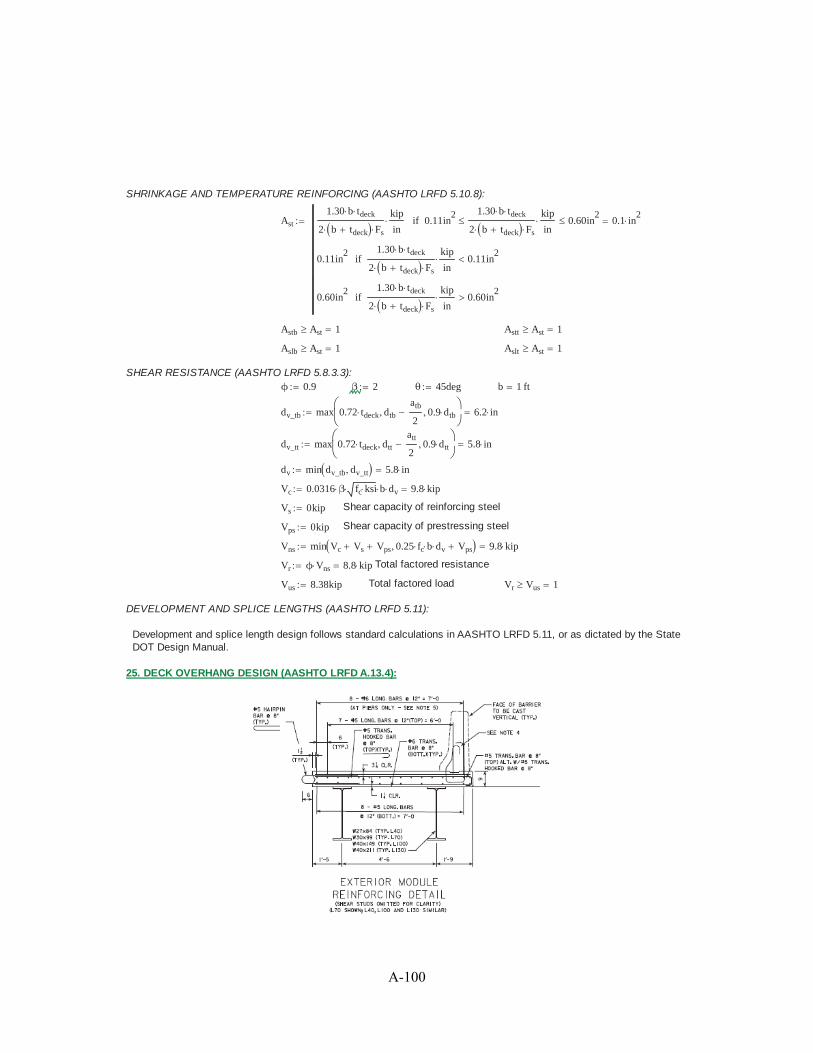
SHRINKAGE AND TEMPERATURE REINFORCING (AASHTO LRFD 5.10.8):
Ast
1.30 b tdeck
2 b tdeck Fs
kip
in0.11in
2 1.30 b tdeck
2 b tdeck Fs
kip
in0.60in
2if
0.11in2 1.30 b tdeck
2 b tdeck Fs
kip
in0.11in
2if
0.60in2 1.30 b tdeck
2 b tdeck Fs
kip
in0.60in
2if
0.1 in2
Astb Ast 1 Astt Ast 1
Aslb Ast 1 Aslt Ast 1
SHEAR RESISTANCE (AASHTO LRFD 5.8.3.3):ϕ 0.9 β 2 θ 45deg b 1 ft
dv_tb max 0.72 tdeck dtb
atb
20.9 dtb 6.2 in
dv_tt max 0.72 tdeck dtt
att
20.9 dtt 5.8 in
dv min dv_tb dv_tt 5.8 in
Vc 0.0316 β fc ksi b dv 9.8 kip
Vs 0kip Shear capacity of reinforcing steel
Vps 0kip Shear capacity of prestressing steel
Vns min Vc Vs Vps 0.25 fc b dv Vps 9.8 kip
Vr ϕ Vns 8.8 kip Total factored resistance
Vus 8.38kip Total factored load Vr Vus 1
DEVELOPMENT AND SPLICE LENGTHS (AASHTO LRFD 5.11):
Development and splice length design follows standard calculations in AASHTO LRFD 5.11, or as dictated by the StateDOT Design Manual.
25. DECK OVERHANG DESIGN (AASHTO LRFD A.13.4):
A-100

Deck Properties:
Deck Overhang Length Lo 1ft 9in
Parapet Properties:
Note: Parapet properties are per unit length. Compression reinforcement is ignored.
Cross Sectional Area Ap 2.84ft2 Height of Parapet Hpar 2ft 10in
Parapet Weight Wpar wc Ap 426 plf
Width at base wbase 1ft 5in Average width of wall wwall13in 9.5in
211.3 in
Height of top portion ofparapet
h1 2ft Width at top of parapet width1 9.5 in 9.5 in
Height of middle portion ofparapet
h2 7in Width at middle transitionof parapet
width2 12 in 12 in
Height of lower portion ofparapet
h3 3in Width at base of parapet width3 1ft 5 in 17 in
b1 width1 b2 width2 width1 b3 width3 width2
Parapet Center of Gravity CGp
h1 h2 h3
b12
2
1
2h1 b2 b1
b2
3
h2 h3 b2 b3 b1
b2 b3
2
1
2h2 b3 b1 b2
2b3
3
h1 h2 h3 b11
2h1 b2 h2 h3 b2 b3
1
2h2 b3
6.3 in
Parapet Reinforcement Vertically Aligned Bars in Wall Horizontal BarsRebar spacing: spa 12in npl 5
Rebar Diameter: ϕpa5
8in ϕpl
5
8in
Rebar Area: Ast_p πϕpa
2
2b
spa
0.3 in2
Asl_p πϕpl
2
2
0.3 in2
Cover: cst 3in csl 2in ϕpa 2.6 in
Effective Depth: dst wbase cst
ϕpa
213.7 in dsl wwall csl
ϕpl
28.3 in
Parapet MomentResistance AboutHorizontal Axis:
ϕext 1.0
S 5.7.3.1.2-4S 5.7.3.2.3
Depth of EquivalentStress Block:
ah
Ast_p Fs
0.85 fc b0.4 in
Moment Capacity of Upper Segment of Barrier (about longitudinal axis):
Average width of section w1
width1 width2
210.7 in
Cover cst1 2in
dh1 w1 cst1
ϕpa
28.4 inDepth
Factored MomentResistance
ϕMnh1
ϕext Ast_p Fs dh1
ah
2
b12.7
kip ft
ft
Moment Capacity of Middle Segment of Barrier (about longitudinal axis):
A-101

Average width of section w2
width2 width3
214.5 in
Cover cst2 3in
dh2 w2 cst2
ϕpa
211.2 inDepth
Factored MomentResistance ϕMnh2
ϕext Ast_p Fs dh2
ah
2
b16.9
kip ft
ft
Parapet Base Moment Resistance (about longitudinal axis):
development in tension cst3 3in coverbase_vert cst3
ϕpa
23.3 in
minc_ta 1.5 cst3 3 ϕpa spa ϕpa 6 ϕpaif
1.2 otherwise
1.2
mdec_ta 0.8 spa 6inif
1.0 otherwise
0.8
ldb_ta max
1.25in Ast_p
Fs
kip
fc
ksi
0.4 ϕpa
Fs
ksiϕpa
11
8inif
2.70inFs
ksi
fc
ksi
ϕpa14
8in=if
3.50inFs
ksi
fc
ksi
ϕpa18
8in=if
ldt_ta ldb_ta minc_ta mdec_ta 14.4 in
hooked bar developed intension
lhb_ta
38 ϕpa
fc
ksi
10.6 in minc 1.2
ldh_ta max 6in 8 ϕpa minc lhb_ta 12.7 in
lap splice in tension llst_ta max 12in 1.3 ldt_ta 18.7 in
benefit ldt_ta ldh_ta 1.7 in
ldev_a 713
16in
Fdev
benefit ldev_a
ldt_ta
0.7
Fd 0.75
Distance from NA toCompressive Face
ct_b
Fd Ast_p Fs
0.85 fc β1 b0.3 in S 5.7.3.1.2-4
A-102
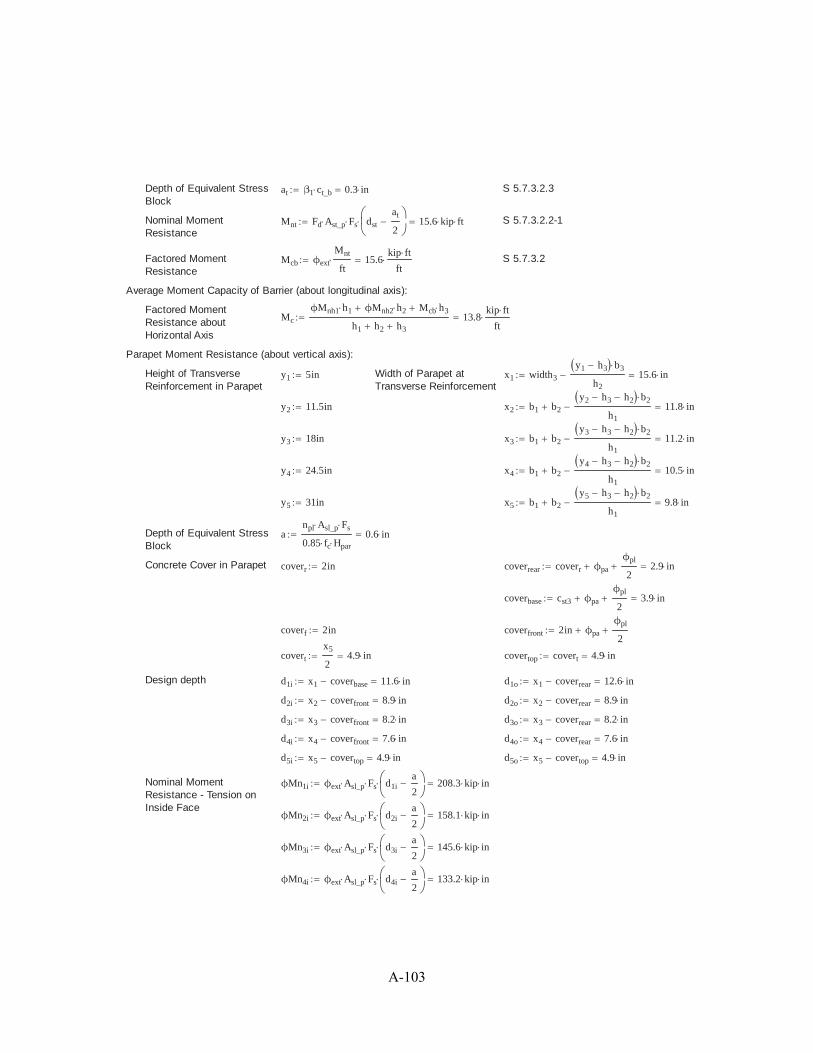
Depth of Equivalent StressBlock
at β1 ct_b 0.3 in S 5.7.3.2.3
Nominal MomentResistance
Mnt Fd Ast_p Fs dst
at
215.6 kip ft S 5.7.3.2.2-1
Factored MomentResistance
Mcb ϕext
Mnt
ft15.6
kip ft
ftS 5.7.3.2
Average Moment Capacity of Barrier (about longitudinal axis):
Factored MomentResistance aboutHorizontal Axis
Mc
ϕMnh1 h1 ϕMnh2 h2 Mcb h3
h1 h2 h3
13.8kip ft
ft
Parapet Moment Resistance (about vertical axis):
Height of TransverseReinforcement in Parapet
y1 5in Width of Parapet atTransverse Reinforcement
x1 width3
y1 h3 b3
h2
15.6 in
y2 11.5in x2 b1 b2
y2 h3 h2 b2
h1
11.8 in
y3 18in x3 b1 b2
y3 h3 h2 b2
h1
11.2 in
y4 24.5in x4 b1 b2
y4 h3 h2 b2
h1
10.5 in
y5 31in x5 b1 b2
y5 h3 h2 b2
h1
9.8 in
Depth of Equivalent StressBlock
anpl Asl_p Fs
0.85 fc Hpar
0.6 in
Concrete Cover in Parapet coverr 2in coverrear coverr ϕpa
ϕpl
22.9 in
coverbase cst3 ϕpa
ϕpl
23.9 in
coverf 2in coverfront 2in ϕpa
ϕpl
2
covert
x5
24.9 in covertop covert 4.9 in
Design depth d1i x1 coverbase 11.6 in d1o x1 coverrear 12.6 in
d2i x2 coverfront 8.9 in d2o x2 coverrear 8.9 in
d3i x3 coverfront 8.2 in d3o x3 coverrear 8.2 in
d4i x4 coverfront 7.6 in d4o x4 coverrear 7.6 in
d5i x5 covertop 4.9 in d5o x5 covertop 4.9 in
Nominal MomentResistance - Tension onInside Face
ϕMn1i ϕext Asl_p Fs d1ia
2208.3 kip in
ϕMn2i ϕext Asl_p Fs d2ia
2158.1 kip in
ϕMn3i ϕext Asl_p Fs d3ia
2145.6 kip in
ϕMn4i ϕext Asl_p Fs d4ia
2133.2 kip in
A-103

ϕMn5i ϕext Asl_p Fs d5ia
284.5 kip in
Mwi ϕMn1i ϕMn2i ϕMn3i ϕMn4i ϕMn5i 60.8 kip ft
Nominal MomentResistance - Tension onOutside Face
ϕMn1o ϕext Asl_p Fs d1oa
218.9 kip ft
ϕMn2o ϕext Asl_p Fs d2oa
213.2 kip ft
ϕMn3o ϕext Asl_p Fs d3oa
212.1 kip ft
ϕMn4o ϕext Asl_p Fs d4oa
211.1 kip ft
ϕMn5o ϕext Asl_p Fs d5oa
27 kip ft
Mwo ϕMn1o ϕMn2o ϕMn3o ϕMn4o ϕMn5o 62.3 kip ft
Vertical Nominal MomentResistance of Parapet
Mw
2 Mwi Mwo
361.3 kip ft
Parapet Design Factors:
Crash Level CL "TL-4"
Transverse Design Force Ft 13.5kip CL "TL-1"=if
27.0kip CL "TL-2"=if
54.0kip CL "TL-3"=if
54.0kip CL "TL-4"=if
124.0kip CL "TL-5"=if
175.0kip otherwise
54 kip Lt 4.0ft CL "TL-1"=if
4.0ft CL "TL-2"=if
4.0ft CL "TL-3"=if
3.5ft CL "TL-4"=if
8.0ft CL "TL-5"=if
8.0ft otherwise
3.5 ft
Longitudinal Design Force Fl 4.5kip CL "TL-1"=if
9.0kip CL "TL-2"=if
18.0kip CL "TL-3"=if
18.0kip CL "TL-4"=if
41.0kip CL "TL-5"=if
58.0kip otherwise
18 kip Ll 4.0ft CL "TL-1"=if
4.0ft CL "TL-2"=if
4.0ft CL "TL-3"=if
3.5ft CL "TL-4"=if
8.0ft CL "TL-5"=if
8.0ft otherwise
3.5 ft
Vertical Design Force(Down)
Fv 4.5kip CL "TL-1"=if
4.5kip CL "TL-2"=if
4.5kip CL "TL-3"=if
18.0kip CL "TL-4"=if
80.0kip CL "TL-5"=if
80.0kip otherwise
18 kip Lv 18.0ft CL "TL-1"=if
18.0ft CL "TL-2"=if
18.0ft CL "TL-3"=if
18.0ft CL "TL-4"=if
40.0ft CL "TL-5"=if
40.0ft otherwise
18 ft
Critical Length of Yield Line Failure Pattern:
Mb 0kip ft
A-104

Lc
Lt
2
Lt
2
28 Hpar Mb Mw
Mc
11.9 ft S A13.3.1-2
Rw2
2 Lc Lt
8 Mb 8 Mw
Mc Lc2
Hpar
116.2 kip S A13.3.1-1
TRw b
Lc 2 Hpar
6.6 kip S A13.4.2-1
The parapet design must consider three design cases. Design Case 1 is for longitudinal and transverse collision loadsunder Extreme Event Load Combination II. Design Case 2 represents vertical collision loads under Extreme Event LoadCombination II; however, this case does not govern for decks with concrete parapets or barriers. Design Case 3 is for deadand live load under Strength Load Combination I; however, the parapet will not carry wheel loads and therefore this casedoes not govern. Design Case 1 is the only case that requires a check.
Design Case 1: Longitudinal and Transverse Collision Loads, Extreme Event Load Combination II
DC - 1A: Inside face of parapetS A13.4.1S Table 3.4.1-1ϕext 1 γDC 1.0 γDW 1.0 γLL 0.5
llip 2in wbase 17 in
Adeck_1A tdeck llip wbase 152 in2
Ap 2.8 ft2
Wdeck_1A wc Adeck_1A 0.2 klf Wpar 0.4 klf
MDCdeck_1A γDC Wdeck_1A
llip wbase
20.1
kip ft
ft
MDCpar_1A γDC Wpar llip CGp 0.3kip ft
ft
Mtotal_1A Mcb MDCdeck_1A MDCpar_1A 16kip ft
ft
ϕtt_add5
8in stt_add 8in
Astt_p12in
stt
πϕtt
2
212in
stt_add
πϕtt_add
2
2
0.9 in2
dtt_add tdeck ct
ϕtt_add
25.2 in
ctt_p
Astt_p Fs
0.85 fc β1 b1.4 in att_p β1 ctt_p 1.1 in
Mntt_p
Astt_p Fs
ftdtt_add
att_p
221.4
kip ft
ft
Mrtt_p ϕb Mntt_p 19.2kip ft
ftMrtt_p Mtotal_1A 1
AsT Astt Astb 1.1 in2
ϕPn ϕext AsT Fs 67.4 kip ϕPn T 1
Mu_1A Mrtt_p 1T
ϕPn
17.4kip ft
ftMu_1A Mtotal_1A 1
A-105

DC - 1B: Design Section in OverhangNotes: Distribution length is assumed to increase based on a 30 degree angle from the face of parapet.
Moment of collision loads is distributed over the length Lc + 30 degree spread from face of parapet tolocation of overhang design section.
Axial force of collision loads is distributed over the length Lc + 2Hpar + 30 degree spread from face ofparapet to location of overhang design section.
Future wearing surface is neglected as contribution is negligible.
Adeck_1B tdeck Lo 168 in2
Ap 2.8 ft2
Wdeck_1B wc Adeck_1B 0.2 klf Wpar 0.4 klf
MDCdeck_1B γDC Wdeck_1B
Lo
20.2
kip ft
ft
MDCpar_1B γDC Wpar Lo llip CGp 0.5kip ft
ft
Lspread_B Lo llip width3 2 in spread 30deg
wspread_B Lspread_B tan spread( ) 1.2 in
Mcb_1B
Mcb Lc
Lc 2 wspread_B
15.3kip ft
ft
Mtotal_1B Mcb_1B MDCdeck_1B MDCpar_1B 15.9kip ft
ft
Mrtt_p 19.2kip ft
ftMrtt_p Mtotal_1B 1
ϕPn 67.4 kip
Pu
T Lc 2 Hpar
Lc 2 Hpar 2 wspread_B
6.5 kip ϕPn Pu 1
Mu_1B Mrtt_p 1Pu
ϕPn
17.4kip ft
ftMu_1B Mtotal_1B 1
DC - 1C: Design Section in First SpanAssumptions: Moment of collision loads is distributed over the length Lc + 30 degree spread from face of
parapet to location of overhang design section.Axial force of collision loads is distributed over the length Lc + 2Hpar + 30 degree spread from
face of parapet to location of overhang design section.Future wearing surface is neglected as contribution is negligible.
Mpar_G1 MDCpar_1B 0.5kip ft
ft
Mpar_G2 0.137kip ft
ft(From model output)
M1 Mcb 15.6kip ft
ft
M2 M1
Mpar_G2
Mpar_G1
4.7kip ft
ft
bf 10.5in
Mc_M2M1 M1
1
4bf M1 M2
spacingint_max
14.1kip ft
ft
A-106

Lspread_C Lo llip wbase
bf
44.6 in
wspread_C Lspread_C tan spread( ) 2.7 in
Mcb_1C
Mc_M2M1 Lc
Lc 2 wspread_C
13.6kip ft
ft
Mtotal_1C Mcb_1C MDCdeck_1B MDCpar_1B 14.2kip ft
ft
Mrtt_p 19.2kip ft
ftMrtt_p Mtotal_1C 1
ϕPn 67.4 kip
PuC
T Lc 2 Hpar
Lc 2 Hpar 2 wspread_C
6.4 kip ϕPn PuC 1
Mu_1C Mrtt_p 1Pu
ϕPn
17.4kip ft
ftMu_1B Mtotal_1B 1
Compute Overhang Reinforcement Cut-off Length Requirement
Maximum crash load moment at theoretical cut-ff point:
Mc_max Mrtt 10.2kip ft
ft
LMc_max
M2 Mrtt
M2 M1
spacingint_max 2.1 ft
Lspread_D Lo llip wbase LMc_max 27.7 in
wspread_D Lspread_D tan spread( ) 16 in
Mcb_max
Mc_max Lc
Lc 2 wspread_D
8.3kip ft
ft
extension max dtt_add 12 ϕtt_add 0.0625 spacingint_max 7.5 in
cutt_off LMc_max extension 33.2 in
Att_add πϕtt_add
2
2
0.3 in2
mthick_tt_add 1.4 tdeck ct 12inif
1.0 otherwise
1
mepoxy_tt_add 1.5 ct 3 ϕtt_add
stt_add
2ϕtt_add 6 ϕtt_addif
1.2 otherwise
1.5
minc_tt_add min mthick_tt_add mepoxy_tt_add 1.7 1.5
mdec_tt_add 0.8stt_add
26inif
1.0 otherwise
1
A-107

ldb_tt_add max
1.25in Att_add
Fs
kip
fc
ksi
0.4 ϕtt_add
Fs
ksiϕtt_add
11
8inif
2.70inFs
ksi
fc
ksi
ϕtt_add14
8in=if
3.50inFs
ksi
fc
ksi
ϕtt_add18
8in=if
ldb_tt_add 15 in
ldt_tt_add ldb_tt_add minc_tt_add mdec_tt_add 22.5 in
Cuttoffpoint LMc_max ldt_tt_add spacingint_max 13.2 in extension past second interior girder
Check for Cracking in Overhang under Service Limit State:
Does not govern - no live load on overhang.
25. COMPRESSION SPLICE:
See sheet S7 for drawing.
Ensure compression splice and connection can handle the compressive force in the force couple due to the negativemoment over the pier.
Live load negative moment over pier: MLLPier 541.8 kip ft
Factored LL moment: MUPier 1.75 MLLPier 948.1 kip ft
The compression splice is comprised of a splice plate on the underside of the bottom flange, and built-up angles oneither side of the web, connecting to the bottom flange as well.
Calculate Bottom Flange Stress:
Composite moment of inertia: Iz 11538.5 in4
Distance to center of bottom flange from composite section centroid:
ybf
tbf
2Dw ttf tslab yc 28.3 in
Stress in bottom flange: fbf MUPier
ybf
Iz
28 ksi
Calculate Bottom Flange Force:
Design Stress: Fbf maxfbf Fy
20.75 Fy 39 ksi
Effective Flange Area: Aef bbf tbf 6.3 in2
Force in Flange: Cnf Fbf Aef 247.3 kip
Calculate Bottom Flange Stress, Ignoring Concrete:
Moment of inertia: Izsteel 4463.1 in4
Distance to center of bottom flange: ybfsteel
tbf
2Dw ttf ysteel 16 in
A-108

Stress in bottom flange: fbfsteel MUPier
ybfsteel
Izsteel
40.8 ksi
Bottom Flange Force for design:
Design Stress: Fcf maxfbfsteel Fy
20.75 Fy 45.4 ksi
Design Force: Cn max Fbf Fcf Aef 288 kip
Compression Splice Plate Dimensions:
Bottom Splice Plate: bbsp bbf 10.4 in tbsp 0.75in Absp bbsp tbsp 7.8 in2
Built-Up Angle Splice PlateHorizontal Leg: basph 4.25in tasph 0.75in Aasph 2 basph tasph 6.4 in
2
Built-Up Angle Splice Plate VerticalLeg: baspv 7.75in taspv 0.75in Aaspv 2 baspv taspv 11.6 in
2
Total Area: Acsp Absp Aasph Aaspv 25.8 in2
Average Stress: fcs
Cn
Acsp
11.2 ksi
Proportion Load into each plate based on area:
Cbsp
Cn Absp
Acsp
87.1 kip Casph
Cn Aasph
Acsp
71.2 kip Caspv
Cn Aaspv
Acsp
129.8 kip
Check Plates Compression Capacity:
Bottom Splice Plate: kcps 0.75 for bolted connection
lcps 9in
rbsp
minbbsp tbsp
3
12
tbsp bbsp3
12
Absp
0.2 in
Pebsp
π2
Es Absp
kcps lcps
rbsp
22296.8 kip
Qbsp 1.0bbsp
tbsp
0.45Es
Fy
if
1.34 0.76bbsp
tbsp
Fy
Es
0.45Es
Fy
bbsp
tbsp
0.91Es
Fy
if
0.53 Es
Fy
bbsp
tbsp
2otherwise
0.902
Pobsp Qbsp Fy Absp 351.9 kip
A-109

Pnbsp 0.658
Pobsp
PebspPobsp
Pebsp
Pobsp
0.44if
0.877 Pebsp otherwise
330.1 kip
Pnbsp_allow 0.9 Pnbsp 297.1 kip Check "NG" Cbsp Pnbsp_allowif
"OK" Pnbsp_allow Cbspif
"OK"
Horizontal Angle Leg: kcps 0.75 for bolted connection
lcps 9 in
rasph
minbasph tasph
3
12
tasph basph3
12
Aasph
0.153 in
Peasph
π2
Es Aasph
kcps lcps
rasph
2938.6 kip
Qasph 1.0basph
tasph
0.45Es
Fy
if
1.34 0.76basph
tasph
Fy
Es
0.45Es
Fy
basph
tasph
0.91Es
Fy
if
0.53 Es
Fy
basph
tasph
2otherwise
1
Poasph Qasph Fy Aasph 318.7 kip
Pnasph 0.658
Poasph
PeasphPoasph
Peasph
Poasph
0.44if
0.877 Peasph otherwise
276.5 kip
Pnasph_allow 0.9 Pnasph 248.9 kip Check2 "NG" Casph Pnasph_allowif
"OK" Pnasph_allow Casphif
"OK"
Vertical Angle Leg: kcps 0.75 for bolted connection
lcps 9 in
raspv
minbaspv taspv
3
12
taspv baspv3
12
Aaspv
0.153 in
Peaspv
π2
Es Aaspv
kcps lcps
raspv
21711.6 kip
A-110

Qaspv 1.0baspv
taspv
0.45Es
Fy
if
1.34 0.76baspv
taspv
Fy
Es
0.45Es
Fy
baspv
taspv
0.91Es
Fy
if
0.53 Es
Fy
baspv
taspv
2otherwise
1
Poaspv Qaspv Fy Aaspv 581.2 kip
Pnaspv 0.658
Poaspv
PeaspvPoaspv
Peaspv
Poaspv
0.44if
0.877 Peaspv otherwise
504.2 kip
Pnaspv_allow 0.9 Pnaspv 453.8 kip Check3 "NG" Caspv Pnaspv_allowif
"OK" Pnaspv_allow Caspvif
"OK"
Additional Checks: Design Bolted Connections of the splice plates to the girders, checking for shear, bearing, andslip critical connections.
26. CLOSURE POUR DESIGN:
See sheet S2 for drawing of closure pour.
Check the closure pour according to the negative bending capacity of the section.
Use the minimum reinforcing properties for design, to be conservative.
Asteel 27.4 in2
Art 1.4 in2
Arb 1.9 in2
cgsteel tslab ysteel 24.3 in cgrt 3in 1.55
8in 3.9 in cgrb tslab 1in 1.5
5
8in 6.1 in
Overall CG: Aneg Asteel Art Arb 30.7 in2
cgneg
Asteel cgsteel Art cgrt Arb cgrb
Aneg
22.3 in
Moment of Inertia: Izstl 3990in4
Ineg Izstl Asteel cgsteel cgneg2
Art cgrt cgneg2
Arb cgrb cgneg2
5065.7 in4
Section Moduli: Stop_neg
Ineg
cgneg cgrt
276.4 in3
rneg
Ineg
Aneg
12.8 in
Sbot_neg
Ineg
tslab ttf Dw tbf cgneg
276 in3
Concrete Properties: fc 5 ksi Steel Properties: Fy 50 ksi Lbneg 13.42ft
Ec 4286.8 ksi Es 29000 ksi
A-111
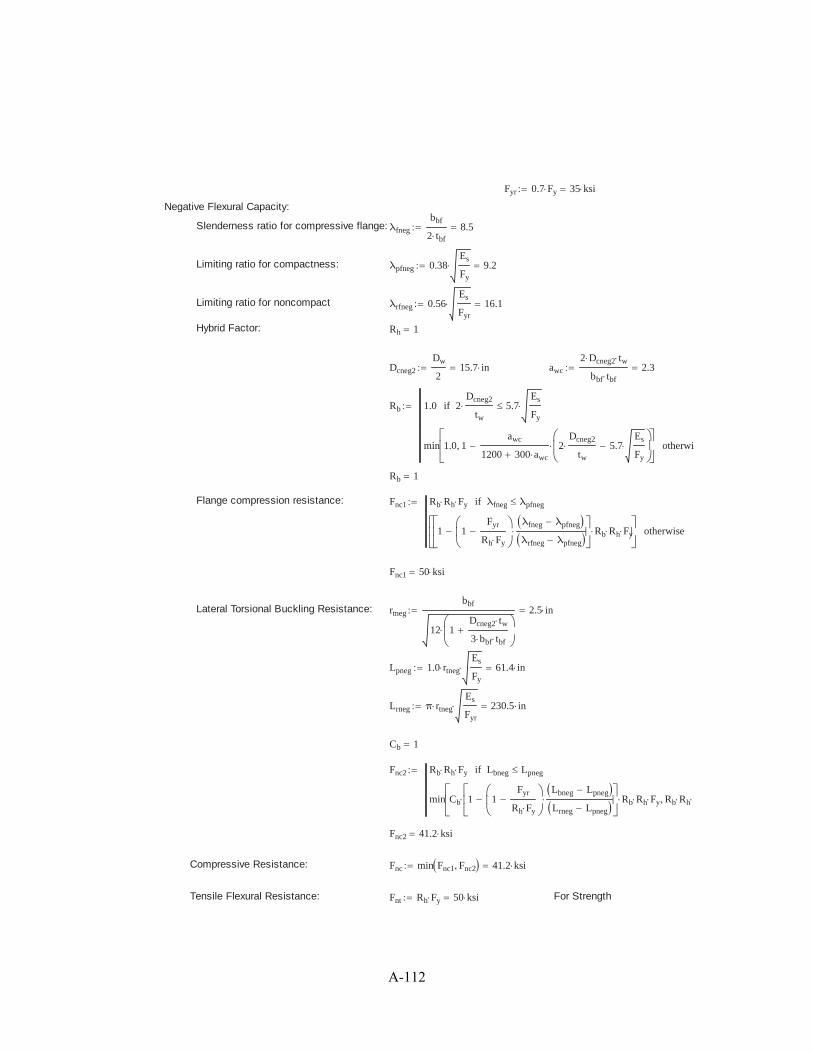
Fyr 0.7 Fy 35 ksi
Negative Flexural Capacity:
Slenderness ratio for compressive flange: λfneg
bbf
2 tbf
8.5
Limiting ratio for compactness: λpfneg 0.38Es
Fy
9.2
Limiting ratio for noncompact λrfneg 0.56Es
Fyr
16.1
Hybrid Factor: Rh 1
Dcneg2
Dw
215.7 in awc
2 Dcneg2 tw
bbf tbf
2.3
Rb 1.0 2Dcneg2
tw
5.7Es
Fy
if
min 1.0 1awc
1200 300 awc
2Dcneg2
tw
5.7Es
Fy
otherwi
Rb 1
Flange compression resistance: Fnc1 Rb Rh Fy λfneg λpfnegif
1 1Fyr
Rh Fy
λfneg λpfneg
λrfneg λpfneg
Rb Rh Fy otherwise
Fnc1 50 ksi
Lateral Torsional Buckling Resistance: rtneg
bbf
12 1Dcneg2 tw
3 bbf tbf
2.5 in
Lpneg 1.0 rtneg
Es
Fy
61.4 in
Lrneg π rtneg
Es
Fyr
230.5 in
Cb 1
Fnc2 Rb Rh Fy Lbneg Lpnegif
min Cb 1 1Fyr
Rh Fy
Lbneg Lpneg
Lrneg Lpneg
Rb Rh Fy Rb Rh F
Fnc2 41.2 ksi
Compressive Resistance: Fnc min Fnc1 Fnc2 41.2 ksi
Tensile Flexural Resistance: Fnt Rh Fy 50 ksi For Strength
A-112

Fnt_Serv 0.95 Rh Fy 47.5 ksi For Service
Ultimate Moment Resistance: Mn_neg min Fnt Stop_neg Fnc Sbot_neg 946.7 kip ft
MUPier 948.1 kip ft from external FE analysis
Check4 Mn_neg MUPier 0
For additional design, one may calculate the force couple at the section over the pier to find the force in theUHPC closure joint. This force can be used to design any additional reinforcement used in the joint.
A-113

Summary of changes from SHRP2:
Adapted the AASHTO LRFD Bridge Design Specifications, 6th Edition (2012) and GDOT Standards MathCAD Design Aides provided in Appendix of the final report
- Design loadings calucation (moment, shear, and reaction) for girders - Design loadings calucation for deck
List of variable definitions added Enhanced the descriptions for all design steps Expansion of detail regarding girder sizingNew cross-section drawingsLoad combination explanations12 ft travel lanes, 6 ft shoulders and 2% slope from crown to comply with GDOT standards
A-114
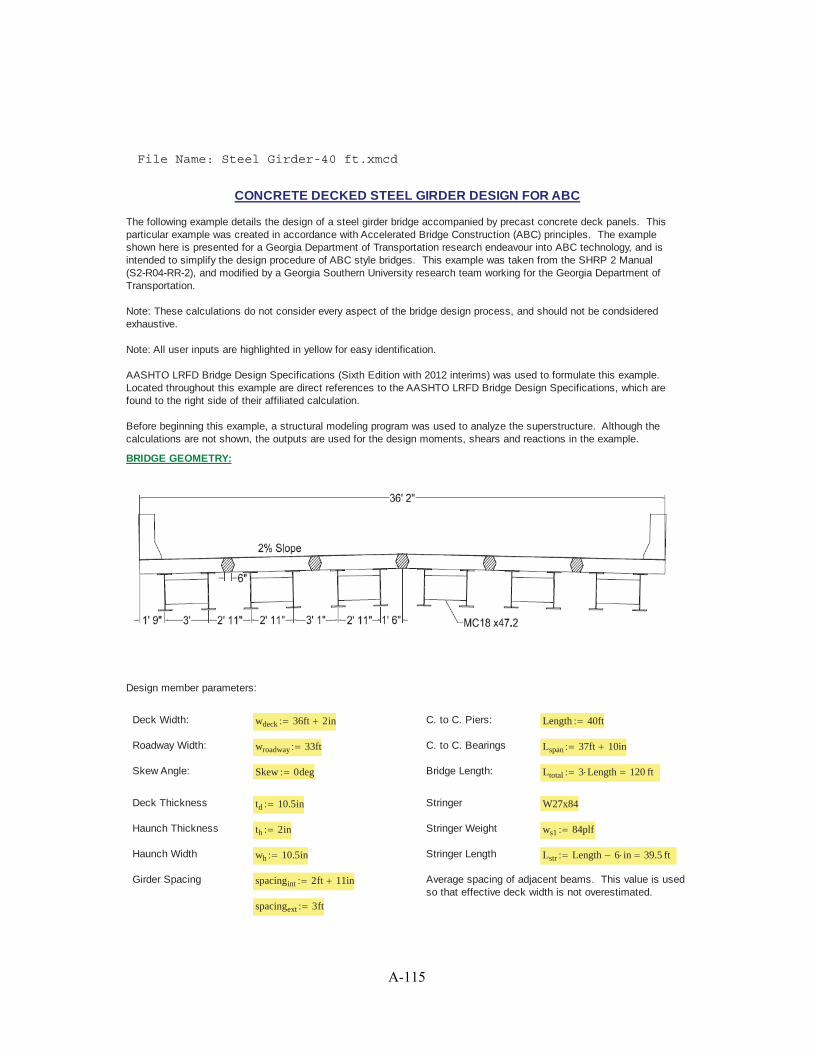
CONCRETE DECKED STEEL GIRDER DESIGN FOR ABC
The following example details the design of a steel girder bridge accompanied by precast concrete deck panels. Thisparticular example was created in accordance with Accelerated Bridge Construction (ABC) principles. The exampleshown here is presented for a Georgia Department of Transportation research endeavour into ABC technology, and isintended to simplify the design procedure of ABC style bridges. This example was taken from the SHRP 2 Manual(S2-R04-RR-2), and modified by a Georgia Southern University research team working for the Georgia Department ofTransportation.
Note: These calculations do not consider every aspect of the bridge design process, and should not be condsideredexhaustive.
Note: All user inputs are highlighted in yellow for easy identification.
AASHTO LRFD Bridge Design Specifications (Sixth Edition with 2012 interims) was used to formulate this example.Located throughout this example are direct references to the AASHTO LRFD Bridge Design Specifications, which arefound to the right side of their affiliated calculation.
Before beginning this example, a structural modeling program was used to analyze the superstructure. Although thecalculations are not shown, the outputs are used for the design moments, shears and reactions in the example.
BRIDGE GEOMETRY:
Design member parameters:
Deck Width: wdeck 36ft 2in C. to C. Piers: Length 40ft
Roadway Width: wroadway 33ft C. to C. Bearings Lspan 37ft 10in
Skew Angle: Skew 0deg Bridge Length: Ltotal 3 Length 120 ft
Deck Thickness td 10.5in Stringer W27x84
Haunch Thickness th 2in Stringer Weight ws1 84plf
Haunch Width wh 10.5in Stringer Length Lstr Length 6 in 39.5 ft
Girder Spacing spacingint 2ft 11in Average spacing of adjacent beams. This value is usedso that effective deck width is not overestimated.
spacingext 3ft
File Name: Steel Girder-40 ft.xmcd
A-115

TABLE OF CONTENTS:
General:1. Introduction2. Design Philosophy3. Design Criteria4. Material Properties5. Load Combinations
Girder Design:6. Beam Section Properties7. Permanent Loads8. Precast Lifting Weight9. Live Load Distribution Factors10. Load Results11. Flexural Strength
12. Flexural Strength Checks 13. Flexural Service Checks 14. Shear Strength 15. Fatigue Limit States 16. Bearing Stiffeners 17. Shear ConnectorsDeck Design:
18. Slab Properties 19. Permanent Loads 20. Live Loads
21. Load Results22. Flexural Strength Capacity Check23. Longitudinal Deck Reinforcing Design24. Design Checks25. Deck Overhang Design
Continuity Design:26. Compression Splice27. Closure Pour Design
A-116
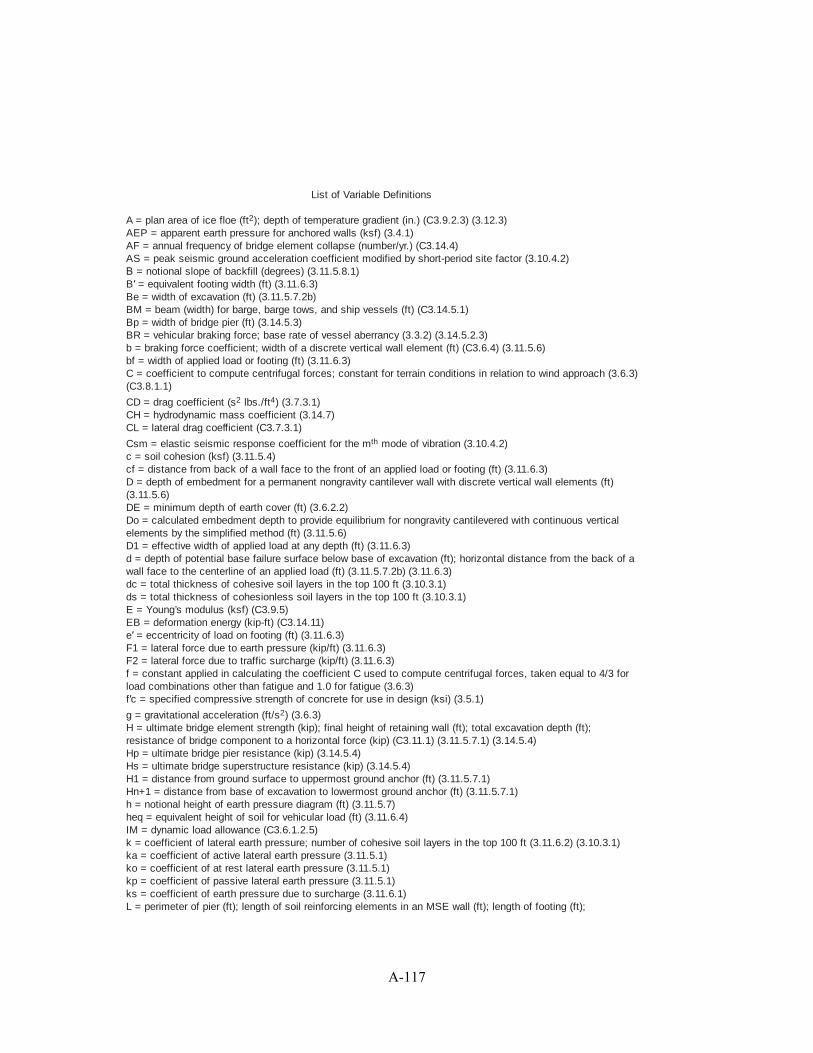
List of Variable Definitions
A = plan area of ice floe (ft2); depth of temperature gradient (in.) (C3.9.2.3) (3.12.3)AEP = apparent earth pressure for anchored walls (ksf) (3.4.1)AF = annual frequency of bridge element collapse (number/yr.) (C3.14.4)AS = peak seismic ground acceleration coefficient modified by short-period site factor (3.10.4.2)
= notional slope of backfill (degrees) (3.11.5.8.1)B = equivalent footing width (ft) (3.11.6.3)Be = width of excavation (ft) (3.11.5.7.2b)BM = beam (width) for barge, barge tows, and ship vessels (ft) (C3.14.5.1)Bp = width of bridge pier (ft) (3.14.5.3)BR = vehicular braking force; base rate of vessel aberrancy (3.3.2) (3.14.5.2.3)b = braking force coefficient; width of a discrete vertical wall element (ft) (C3.6.4) (3.11.5.6)bf = width of applied load or footing (ft) (3.11.6.3)C = coefficient to compute centrifugal forces; constant for terrain conditions in relation to wind approach (3.6.3)(C3.8.1.1)
CD = drag coefficient (s2 lbs./ft4) (3.7.3.1)CH = hydrodynamic mass coefficient (3.14.7)CL = lateral drag coefficient (C3.7.3.1)
Csm = elastic seismic response coefficient for the mth mode of vibration (3.10.4.2) c = soil cohesion (ksf) (3.11.5.4)cf = distance from back of a wall face to the front of an applied load or footing (ft) (3.11.6.3)D = depth of embedment for a permanent nongravity cantilever wall with discrete vertical wall elements (ft)(3.11.5.6)DE = minimum depth of earth cover (ft) (3.6.2.2)Do = calculated embedment depth to provide equilibrium for nongravity cantilevered with continuous verticalelements by the simplified method (ft) (3.11.5.6)D1 = effective width of applied load at any depth (ft) (3.11.6.3)d = depth of potential base failure surface below base of excavation (ft); horizontal distance from the back of awall face to the centerline of an applied load (ft) (3.11.5.7.2b) (3.11.6.3)dc = total thickness of cohesive soil layers in the top 100 ft (3.10.3.1)ds = total thickness of cohesionless soil layers in the top 100 ft (3.10.3.1)E = Young’s modulus (ksf) (C3.9.5)EB = deformation energy (kip-ft) (C3.14.11)e = eccentricity of load on footing (ft) (3.11.6.3)F1 = lateral force due to earth pressure (kip/ft) (3.11.6.3)F2 = lateral force due to traffic surcharge (kip/ft) (3.11.6.3)f = constant applied in calculating the coefficient C used to compute centrifugal forces, taken equal to 4/3 forload combinations other than fatigue and 1.0 for fatigue (3.6.3)f c = specified compressive strength of concrete for use in design (ksi) (3.5.1)
g = gravitational acceleration (ft/s2) (3.6.3)H = ultimate bridge element strength (kip); final height of retaining wall (ft); total excavation depth (ft);resistance of bridge component to a horizontal force (kip) (C3.11.1) (3.11.5.7.1) (3.14.5.4)Hp = ultimate bridge pier resistance (kip) (3.14.5.4)Hs = ultimate bridge superstructure resistance (kip) (3.14.5.4)H1 = distance from ground surface to uppermost ground anchor (ft) (3.11.5.7.1)Hn+1 = distance from base of excavation to lowermost ground anchor (ft) (3.11.5.7.1)h = notional height of earth pressure diagram (ft) (3.11.5.7)heq = equivalent height of soil for vehicular load (ft) (3.11.6.4)IM = dynamic load allowance (C3.6.1.2.5)k = coefficient of lateral earth pressure; number of cohesive soil layers in the top 100 ft (3.11.6.2) (3.10.3.1)ka = coefficient of active lateral earth pressure (3.11.5.1)ko = coefficient of at rest lateral earth pressure (3.11.5.1)kp = coefficient of passive lateral earth pressure (3.11.5.1)ks = coefficient of earth pressure due to surcharge (3.11.6.1)L = perimeter of pier (ft); length of soil reinforcing elements in an MSE wall (ft); length of footing (ft);
A-117

expansion length (in.) (3.9.5) (3.11.5.8) (3.11.6.3) (3.12.2.3) = characteristic length (ft); center-to-center spacing of vertical wall elements (ft) (C3.9.5) (3.11.5.6)
m = multiple presence factor; number of cohesionless soil layers in the top 100 ft (3.6.1.1.2) (3.10.3.1)N = average Standard Penetration Test (SPT) blow count (blows/ft) (ASTM D1586) for the upper 100 ft of thesoil profile (3.10.3.1)
Nch = average Standard Penetration Test (SPT) blow count (blows/ft) (ASTM D1586) for cohesive soil layers in theupper 100 ft of the soil profile and us for cohesive soil layers (PI > 20) in the top 100 ft ( us method) (3.10.3.1)Nchi = blowcount for a cohesionless soil layer (not to exceed 100 blows/ft in the above expression) (3.10.3.1)Ni = Standard Penetration Test blow count of a layer (not to exceed 100 blows/ft in the above expression). Notethat when using Method B, N values are for cohesionless soils and cohesive soil and rock layers within theupper 100 ft Where refusal is met for a rock layer, Nishould be taken as 100 blows/ft (3.10.3.1)Ns = stability number (3.11.5.6)OCR = overconsolidation ratio (3.11.5.2)P = maximum vertical force for single ice wedge (kip); load resulting from vessel impact (kip); concentratedwheel load (kip); live load intensity; point load (kip) (C3.9.5) (3.14.5.4) (C3.6.1.2.5) (C3.11.6.2) (3.11.6.1)Pa = force resultant per unit width of wall (kip/ft) (3.11.5.8.1)PC = probability of bridge collapse (3.14.5)PD = design wind pressure (ksf) (3.8.1.2.1)PGA = peak seismic ground acceleration coefficient on rock (Site Class B) (3.10.2.1) (3.10.4.2)PH = lateral force due to superstructure or other concentrated lateral loads (kip/ft) (3.11.6.3)Ph = horizontal component of resultant earth pressure on wall (kip/ft) (3.11.5.5)PI = plasticity index (ASTM D4318) (3.10.3.1)Pp = passive earth pressure (kip/ft) (3.11.5.4)Pv = vertical component of resultant earth pressure on wall (kip/ft); load per linear foot of strip footing (kip/ft)(3.11.5.5) (3.11.6.3)P v = load on isolated rectangular footing or point load (kip) (3.11.6.3)p = effective ice crushing strength (ksf); stream pressure (ksf); basic earth pressure (psf); fraction of truck trafficin a single lane; load intensity (ksf) (3.9.2.2) (3.7.3.1) (3.11.5.1) (3.6.1.4.2) (3.11.6.1)pa = apparent earth pressure (ksf); maximum ordinate of pressure diagram (ksf) (3.11.5.3) (3.11.5.7.1)pp = passive earth pressure (ksf) (3.11.5.4)Q = total factored load; load intensity for infinitely long line loading (kip/ft) (3.4.1) (3.11.6.2)Qi = force effects (3.4.1)q = surcharge pressure (ksf) (3.11.6.3)qs = uniform surcharge pressure (ksf) (3.11.6.1)R = radius of curvature (ft); radius of circular pier (ft); seismic response modification factor; reduction factor oflateral passive earth pressure; radial distance from point of load application to a point on the wall (ft);reaction force to be resisted by subgrade below base of excavation (kip/ft) (3.6.3) (3.9.5) (3.10.7.1) (3.11.5.4)(3.11.6.1) (3.11.5.7.1)Sm = shear strength of rock mass (ksf) (3.11.5.6)Su = undrained shear strength of cohesive soil (ksf) (3.11.5.6)Sub = undrained strength of soil below excavation base (ksf) (3.11.5.7.2b)Sv = vertical spacing of reinforcements (ft) (3.11.5.8.1)us = average undrained shear strength in ksf (ASTM D2166 or ASTM D2850) for the upper 100 ft of the soil profile(3.10.3.1)sui = undrained shear strength for a cohesive soil layer (not to exceed 5.0 ksf in the above expression) (3.10.3.1)S1 = horizontal response spectral acceleration coefficient at 1.0-s period on rock (Site Class B) (3.10.2.1)(3.10.4.2)T = mean daily air temperature (°F) (C3.9.2.2)TF = period of fundamental mode of vibration of bridge (s) (3.10.2.2)Thi = horizontal load in anchor i (kip/ft) (3.11.5.7.1)Tm = period of vibration for mth mode (s) (3.10.4.2)Tmax = applied load to reinforcement in a mechanically stabilized earth wall (kip/ft) (3.11.5.8.2)TMaxDesign= maximum design temperature used for thermal movement effects (°F) (3.12.2.1) (3.12.2.2) (3.12.2.3)TMinDesign = minimum design temperature used for thermal movement effects (°F) (3.12.2.1) (3.12.2.2) (3.12.2.3)TS = corner period at which acceleration response spectrum changes from being independent of period to beinginversely proportional to period (s) (3.10.4.2)T0 = reference period used to define shape of acceleration response spectrum (s) (3.10.4.2)
A-118
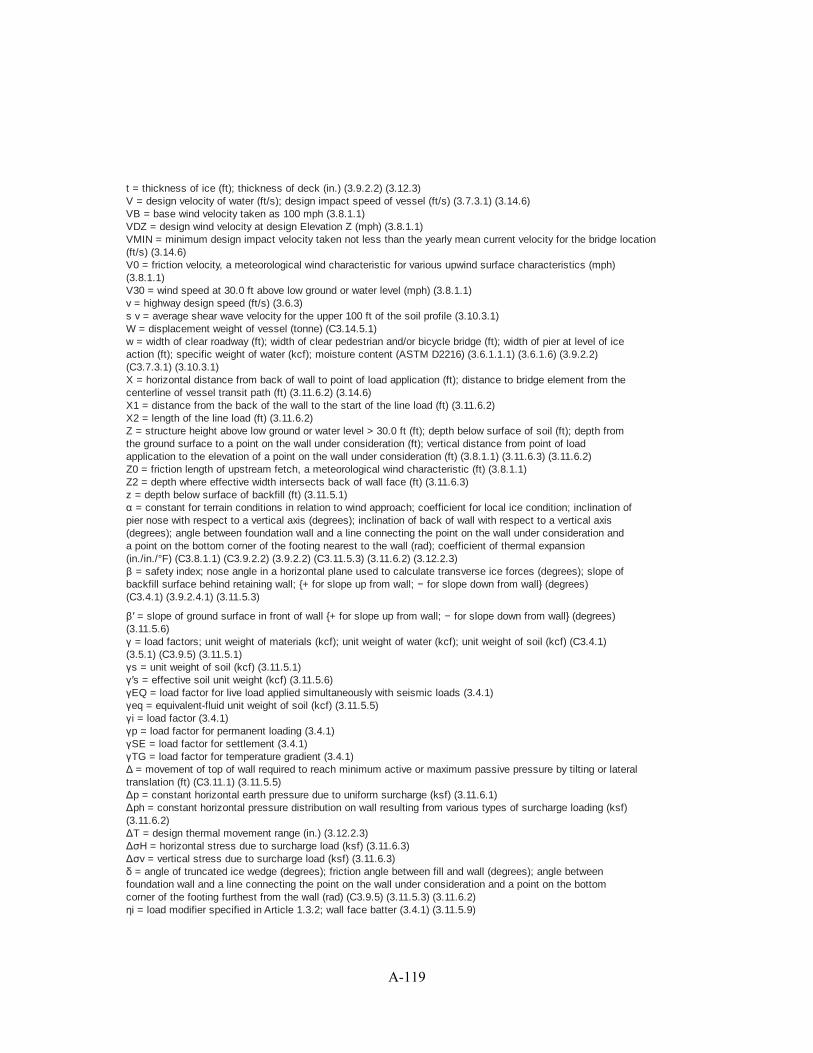
t = thickness of ice (ft); thickness of deck (in.) (3.9.2.2) (3.12.3)V = design velocity of water (ft/s); design impact speed of vessel (ft/s) (3.7.3.1) (3.14.6)VB = base wind velocity taken as 100 mph (3.8.1.1)VDZ = design wind velocity at design Elevation Z (mph) (3.8.1.1)VMIN = minimum design impact velocity taken not less than the yearly mean current velocity for the bridge location(ft/s) (3.14.6)V0 = friction velocity, a meteorological wind characteristic for various upwind surface characteristics (mph)(3.8.1.1)V30 = wind speed at 30.0 ft above low ground or water level (mph) (3.8.1.1)v = highway design speed (ft/s) (3.6.3)s v = average shear wave velocity for the upper 100 ft of the soil profile (3.10.3.1)W = displacement weight of vessel (tonne) (C3.14.5.1)w = width of clear roadway (ft); width of clear pedestrian and/or bicycle bridge (ft); width of pier at level of iceaction (ft); specific weight of water (kcf); moisture content (ASTM D2216) (3.6.1.1.1) (3.6.1.6) (3.9.2.2)(C3.7.3.1) (3.10.3.1)X = horizontal distance from back of wall to point of load application (ft); distance to bridge element from thecenterline of vessel transit path (ft) (3.11.6.2) (3.14.6)X1 = distance from the back of the wall to the start of the line load (ft) (3.11.6.2)X2 = length of the line load (ft) (3.11.6.2)Z = structure height above low ground or water level > 30.0 ft (ft); depth below surface of soil (ft); depth fromthe ground surface to a point on the wall under consideration (ft); vertical distance from point of loadapplication to the elevation of a point on the wall under consideration (ft) (3.8.1.1) (3.11.6.3) (3.11.6.2)Z0 = friction length of upstream fetch, a meteorological wind characteristic (ft) (3.8.1.1)Z2 = depth where effective width intersects back of wall face (ft) (3.11.6.3)z = depth below surface of backfill (ft) (3.11.5.1)
= constant for terrain conditions in relation to wind approach; coefficient for local ice condition; inclination ofpier nose with respect to a vertical axis (degrees); inclination of back of wall with respect to a vertical axis(degrees); angle between foundation wall and a line connecting the point on the wall under consideration anda point on the bottom corner of the footing nearest to the wall (rad); coefficient of thermal expansion(in./in./°F) (C3.8.1.1) (C3.9.2.2) (3.9.2.2) (C3.11.5.3) (3.11.6.2) (3.12.2.3)
= safety index; nose angle in a horizontal plane used to calculate transverse ice forces (degrees); slope ofbackfill surface behind retaining wall; {+ for slope up from wall; for slope down from wall} (degrees)(C3.4.1) (3.9.2.4.1) (3.11.5.3)
= slope of ground surface in front of wall {+ for slope up from wall; for slope down from wall} (degrees)(3.11.5.6) = load factors; unit weight of materials (kcf); unit weight of water (kcf); unit weight of soil (kcf) (C3.4.1)
(3.5.1) (C3.9.5) (3.11.5.1)s = unit weight of soil (kcf) (3.11.5.1)s = effective soil unit weight (kcf) (3.11.5.6)EQ = load factor for live load applied simultaneously with seismic loads (3.4.1)eq = equivalent-fluid unit weight of soil (kcf) (3.11.5.5)i = load factor (3.4.1)p = load factor for permanent loading (3.4.1)SE = load factor for settlement (3.4.1)TG = load factor for temperature gradient (3.4.1) = movement of top of wall required to reach minimum active or maximum passive pressure by tilting or lateral
translation (ft) (C3.11.1) (3.11.5.5)p = constant horizontal earth pressure due to uniform surcharge (ksf) (3.11.6.1)ph = constant horizontal pressure distribution on wall resulting from various types of surcharge loading (ksf)
(3.11.6.2)T = design thermal movement range (in.) (3.12.2.3)
H = horizontal stress due to surcharge load (ksf) (3.11.6.3)v = vertical stress due to surcharge load (ksf) (3.11.6.3)
= angle of truncated ice wedge (degrees); friction angle between fill and wall (degrees); angle betweenfoundation wall and a line connecting the point on the wall under consideration and a point on the bottomcorner of the footing furthest from the wall (rad) (C3.9.5) (3.11.5.3) (3.11.6.2)i = load modifier specified in Article 1.3.2; wall face batter (3.4.1) (3.11.5.9)
A-119
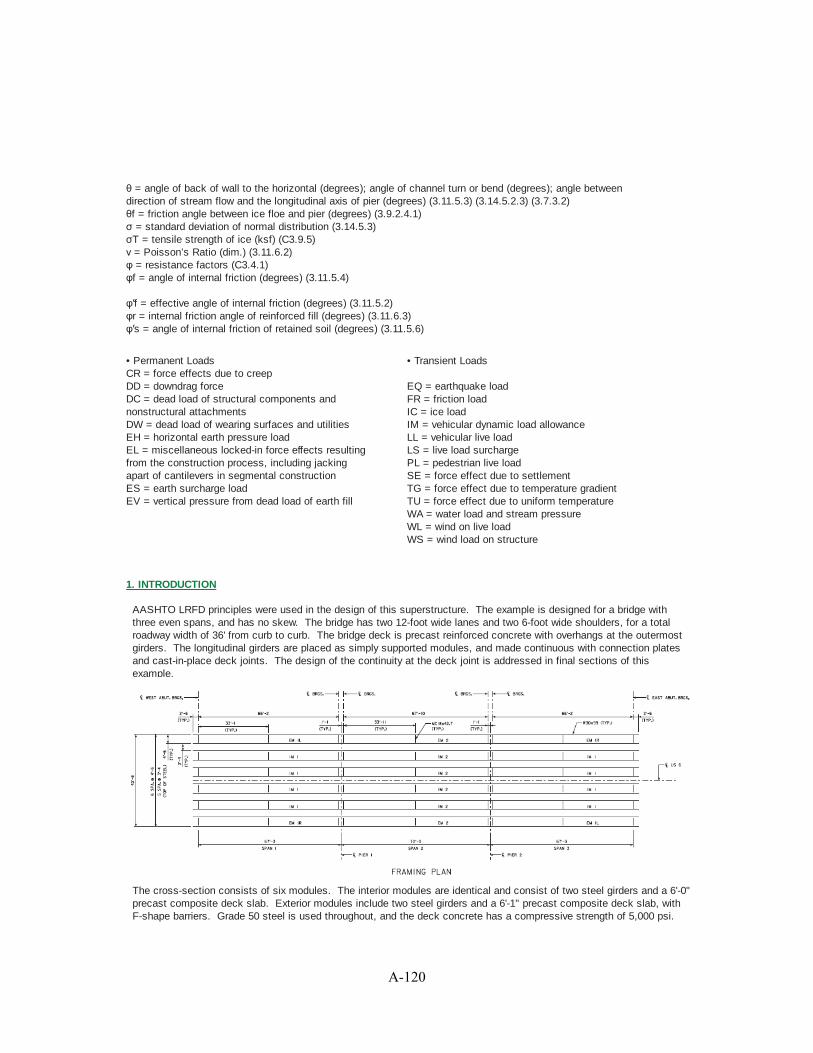
= angle of back of wall to the horizontal (degrees); angle of channel turn or bend (degrees); angle betweendirection of stream flow and the longitudinal axis of pier (degrees) (3.11.5.3) (3.14.5.2.3) (3.7.3.2)f = friction angle between ice floe and pier (degrees) (3.9.2.4.1) = standard deviation of normal distribution (3.14.5.3)T = tensile strength of ice (ksf) (C3.9.5) = Poisson’s Ratio (dim.) (3.11.6.2) = resistance factors (C3.4.1)f = angle of internal friction (degrees) (3.11.5.4)
f = effective angle of internal friction (degrees) (3.11.5.2)r = internal friction angle of reinforced fill (degrees) (3.11.6.3)s = angle of internal friction of retained soil (degrees) (3.11.5.6)
• Permanent LoadsCR = force effects due to creepDD = downdrag forceDC = dead load of structural components andnonstructural attachmentsDW = dead load of wearing surfaces and utilitiesEH = horizontal earth pressure loadEL = miscellaneous locked-in force effects resultingfrom the construction process, including jackingapart of cantilevers in segmental constructionES = earth surcharge loadEV = vertical pressure from dead load of earth fill
• Transient Loads
EQ = earthquake loadFR = friction loadIC = ice loadIM = vehicular dynamic load allowanceLL = vehicular live loadLS = live load surchargePL = pedestrian live loadSE = force effect due to settlementTG = force effect due to temperature gradientTU = force effect due to uniform temperatureWA = water load and stream pressureWL = wind on live loadWS = wind load on structure
1. INTRODUCTION
AASHTO LRFD principles were used in the design of this superstructure. The example is designed for a bridge withthree even spans, and has no skew. The bridge has two 12-foot wide lanes and two 6-foot wide shoulders, for a totalroadway width of 36' from curb to curb. The bridge deck is precast reinforced concrete with overhangs at the outermostgirders. The longitudinal girders are placed as simply supported modules, and made continuous with connection platesand cast-in-place deck joints. The design of the continuity at the deck joint is addressed in final sections of thisexample.
The cross-section consists of six modules. The interior modules are identical and consist of two steel girders and a 6'-0"precast composite deck slab. Exterior modules include two steel girders and a 6'-1" precast composite deck slab, withF-shape barriers. Grade 50 steel is used throughout, and the deck concrete has a compressive strength of 5,000 psi.
A-120
The closure pour joints between the modules use Ultra High Performance Concrete with a strength of 21,000 psi.
Steel girder design steps, including constructability checks, fatigue design for infinite fatigue lift (unless otherwise noted),and bearing stiffener design comprise the majority of the example. Diaphragm and deck design procedures are present,but not detailed.
Tips for reading this Design Example:
This calculation was prepared with Mathcad version 14. Mathcad was used in this instance to provide a clearrepresentation of formulas, and their execution. Design software other than Mathcad is recommended for aspeedier and more accurate design.
Mathcad is not a design software. Mathcad executes user mathematical and simple logic commands.
Example 1: User inputs are noted with dark shaded boxes. Shading of boxes allows the user to easily find thelocation of a desired variable. Given that equations are written in mathcad in the same fashion as they are onpaper, except that they are interactive, shading input cells allows the user to quicly locate inputs amongst otherdata on screen. Units are user inputs.
Height ofStructure:
Hstructure 25ft
Example 2: Equations are typed directly into the workspace. Mathcad then reads the operators and executesthe calculations.
Panels are 2.5' Npanels
Hstructure
2.5ftNpanels 10
Example 3: If Statements are an important operator that allow for the user to dictate a future value with givenparameters. They are marked by a solid bar and operate with the use of program specific logic commands.
Operator offers discountper volume of panels Discount .75 Npanels 6if
.55 Npanels 10if
1 otherwise
Discount 0.6
Example 4: True or False Verification Statements are an important operator that allow for the user to verify asystem criteria that has been manually input. They are marked by lighter shading to make a distinctionbetween the user inputs. True or false statements check a single or pairs of variables and return a Zero or One.
Owner to proceed if discountson retail below 60% Discount .55 1
2. DESIGN PHILOSOPHY
The superstructure of the bridge in this example consists of modules, which are two rolled steel girders supporting abridge deck panel along their length. The girders are assumed to be simply supported under the weight of the deckpanels. In each module, one girder is assumed to support half the weight of its respective deck panel.
The barrier wall is added to exterior modules once the deck and girders are joined. When working with the barrier deadload, the weight is assumed to be evenly distributed between the two modules. Under the additional barrier dead load, thegirders are again assumed to be simply supported.
Concerning transportation of modules, it is assumed that the deck has reached 28-day concrete strength, and the deck isfully composite with the girders. The self-weight of the module during lifting and placement is assumed as evenlydistributed to four pick points (two per girder).
The modules are placed such that there is a bearing on each end and are again simply supported. The continuous span
A-121
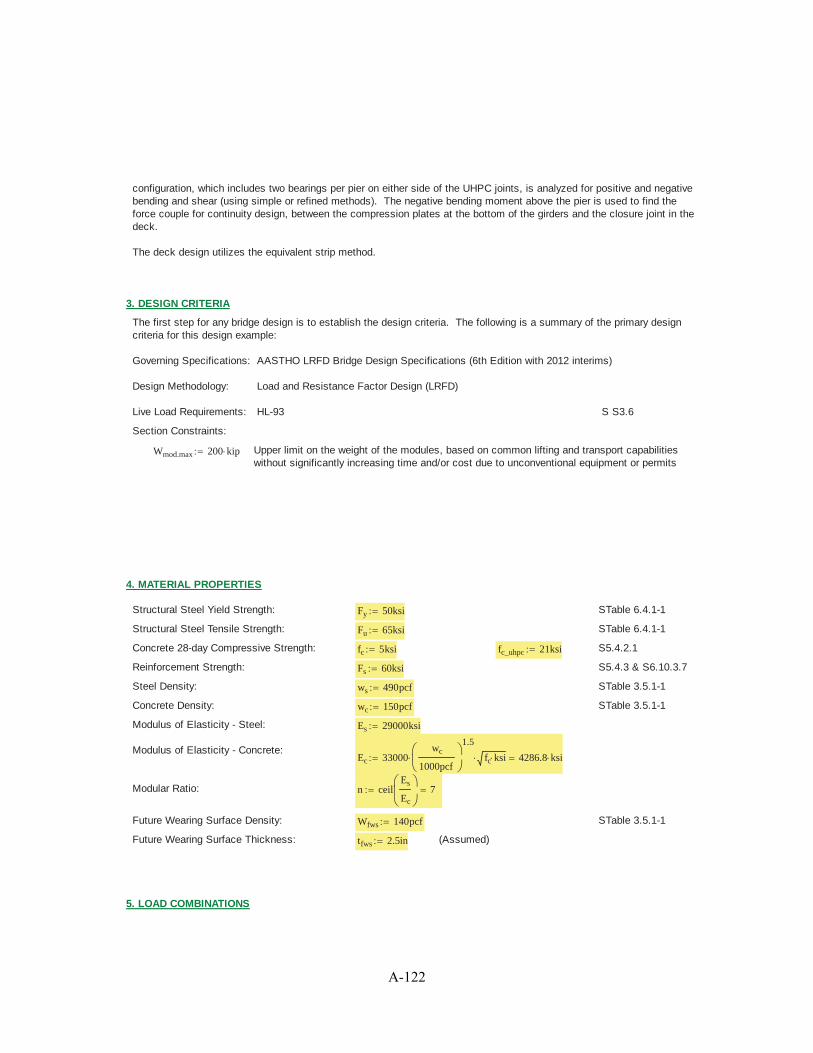
configuration, which includes two bearings per pier on either side of the UHPC joints, is analyzed for positive and negativebending and shear (using simple or refined methods). The negative bending moment above the pier is used to find theforce couple for continuity design, between the compression plates at the bottom of the girders and the closure joint in thedeck.
The deck design utilizes the equivalent strip method.
3. DESIGN CRITERIA
The first step for any bridge design is to establish the design criteria. The following is a summary of the primary designcriteria for this design example:
Governing Specifications: AASTHO LRFD Bridge Design Specifications (6th Edition with 2012 interims)
Design Methodology: Load and Resistance Factor Design (LRFD)
Live Load Requirements: HL-93 S S3.6
Section Constraints:
Wmod.max 200 kip Upper limit on the weight of the modules, based on common lifting and transport capabilitieswithout significantly increasing time and/or cost due to unconventional equipment or permits
4. MATERIAL PROPERTIES
Structural Steel Yield Strength: Fy 50ksi STable 6.4.1-1
Structural Steel Tensile Strength: Fu 65ksi STable 6.4.1-1
Concrete 28-day Compressive Strength: fc 5ksi fc_uhpc 21ksi S5.4.2.1
Reinforcement Strength: Fs 60ksi S5.4.3 & S6.10.3.7
Steel Density: ws 490pcf STable 3.5.1-1
Concrete Density: wc 150pcf STable 3.5.1-1
Modulus of Elasticity - Steel: Es 29000ksi
Modulus of Elasticity - Concrete:Ec 33000
wc
1000pcf
1.5
fc ksi 4286.8 ksi
Modular Ratio: n ceilEs
Ec
7
Future Wearing Surface Density: Wfws 140pcf STable 3.5.1-1
Future Wearing Surface Thickness: tfws 2.5in (Assumed)
5. LOAD COMBINATIONS
A-122

The following load combinations will be used in this design example, in accordance with Table 3.4.1-1.
Strength I—Basic load combination relating to thenormal vehicular use of the bridge without wind.
Strength III—Load combination relating to the bridgeexposed to wind velocity exceeding 55 mph.
Strength V—Load combination relating to normalvehicular use of the bridge with wind of 55 mphvelocity.
Service I—Load combination relating to the normaloperational use of the bridge with a 55 mph wind andall loads taken at their nominal values. Also related todeflection control in buried metal structures, tunnelliner plate, and thermoplastic pipe, to control crackwidth in reinforced concrete structures, and fortransverse analysis relating to tension in concretesegmental girders. This load combination should alsobe used for the investigation of slope stability.
Service II—Load combination intended to controlyielding of steel structures and slip of slip-criticalconnections due to vehicular live load.
Fatigue I—Fatigue and fracture load combinationrelated to infinite load-induced fatigue life.
Strength I = 1.25DC + 1.5DW + 1.75(LL+IM), where IM = 33%
Strength III = 1.25DC + 1.5DW + 1.40WS
Strength V = 1.25DC + 1.5DW + 1.35(LL+IM) + 0.40WS + 1.0WL, where IM = 33%
Service I = 1.0DC + 1.0DW + 1.0(LL+IM) + 0.3WS + 1.0WL, where IM = 33%
Service II = 1.0DC + 1.0DW + 1.3(LL+IM), where IM = 33%
Fatigue I = 1.5(LL+IM), where IM = 15%
6. BEAM SECTION
Determining the proper girder depth and dimensions is a vital part of any bridge designprocess. The size of the girder is a major factor in the cost of the bridge. From Table2.5.2.6.3-1, the suggested minimum overall depth of the composite I-section in a continuousspan is equal to 0.032L.
Thus we have, (.032*40ft) = 1.28’ = 15.36” (this is a minimum and can be adjusted to meetcriteria)
The following girder dimensions were taken from the AISC Steel Construction Manual (14th Edition).
Determine Beam Section Properties:btfx ttfGirder W27x84
A-123

Top Flange btf 10.0in ttf 0.64in
Bottom Flange bbf 10.0in tbf 0.64in
Dw x twWeb Dw 25.4in tw 0.46in
Girder Depth dgird 26.7inbbfx tbf
Check Flange Proportion Requeirements Met: S 6.10.2.2
btf
2 ttf
12.0 1bbf
2 tbf
12.0 1
btf
Dw
61 bbf
Dw
61
ttf 1.1 tw 1 tbf 1.1 tw 1
0.1
tbf3
bbf
12
ttf3
btf
12
10 1
tbf bbf
12
ttf btf
12
0.3 1
Properties for use when analyzing under beam self weight (steel only):
Atf btf ttf Abf bbf tbf Aw Dw tw
Asteel Abf Atf Aw Asteel 24.5 in2 Total steel area.
Steel centroid from top.ysteel
Atf
ttf
2Abf
tbf
2Dw ttf Aw
Dw
2ttf
Asteel
ysteel 13.3 in
Calculate Iz: Moment of inertia about Z axis.
Izsteel
tw Dw3
12
btf ttf3
12
bbf tbf3
12Aw
Dw
2ttf ysteel
2
Atf ysteel
ttf
2
2
Abf Dw
tbf
2ttf ysteel
2
Calculate Iy:
Iysteel
Dw tw3
ttf btf3
tbf bbf3
12Moment of inertia about Y axis.
Calculate Ix:Moment of inertia about X axis.
Ixsteel1
3btf ttf
3bbf tbf
3Dw tw
3
Izsteel 2798.469 in4
Iysteel 106.873 in4
Ixsteel 2.6 in4
Asteel 24.5 in2
A-124

Composite Section Properties (Uncracked Section - used for barrier dead load and live load positive bending):
Determine composite slab and reinforcing properties
Slab thickness assumes some sacrificial thickness; use: tslab 8in
Dt tslab ttf Dw tbf 34.7 in Total section depth
beff spacingint beff 35 in Effective width. S 4.6.2.6.1 LRFD
Transformed slab width assteel.btr
beff
n
Transformed slab moment ofinertia about z axis as steel.Izslab btr
tslab3
12
Aslab btr tslab Transformed slab area assteel.
Slab reinforcement: (Use #5 @ 8" top, and #6 @ 8" bottom; additional bar for continuous segments of #6 @ 12")
Typical Cross Section Cross Section Over Support
Art 0.465in
2
ftbeff 1.4 in
2Arb 0.66
in2
ftbeff 1.9 in
2Artadd 0.44
in2
ftbeff 1.3 in
2
A-125

Ar Art Arb 3.3 in2
Arneg Ar Artadd 4.6 in2
crt 2.5in 0.625in5
16in 3.4 in crb tslab 1.75in
6
16in 5.9 in ref from top of slab
cr
Art crt Arb crb
Ar
4.9 in crneg
Art crt Arb crb Artadd crt
Arneg
4.5 in
Find composite section centroid:
Ax Asteel
Ar n 1( )
nAslab yslab
tslab
2
Centroid of steel from top ofslab.yst
Atf
ttf
2tslab Abf
tbf
2Dw ttf tslab Aw
Dw
2ttf tslab
Asteel
Centroid of transformedcomposite section from topof slab.yc
yst Asteel
cr Ar n 1( )
nAslab yslab
Ax
yc 10.3 in
Calculate Transformed Iz for composite section:
Transformed moment of inertiaabout the z axis.Iz Izsteel Asteel yst yc
2Izslab Aslab yslab yc
2 Ar n 1( )
ncr yc
2
Calculate Transformed Iy for composite section:
ttr
tslab
nTransformed slab thickness.
Iyslab
ttr beff3
12Transformed moment of inertia about y axis of slab.
Transformed moment of inertiaabout the y axis (ignoringreinforcement).
Iy Iysteel Iyslab
Calculate Transformed Ix for composite section:
Transformed moment of inertiaabout the x axis.Ix
1
3btf ttf
3bbf tbf
3Dw tw
3btr tslab
3
Results: Ax 67.3 in2
Iy 4190.2 in4
Iz 7666.4 in4
Ix 855.9 in4
Composite Section Properties (Uncracked Section - used for live load negative bending):
Find composite section area and centroid:
Axneg Asteel
Arneg n 1( )
nAslab
Centroid of transformedcomposite section from topof slab.ycneg
ysteel Asteel
crneg Arneg n 1( )
nAslab yslab
Axneg
ycneg 7.4 in
A-126
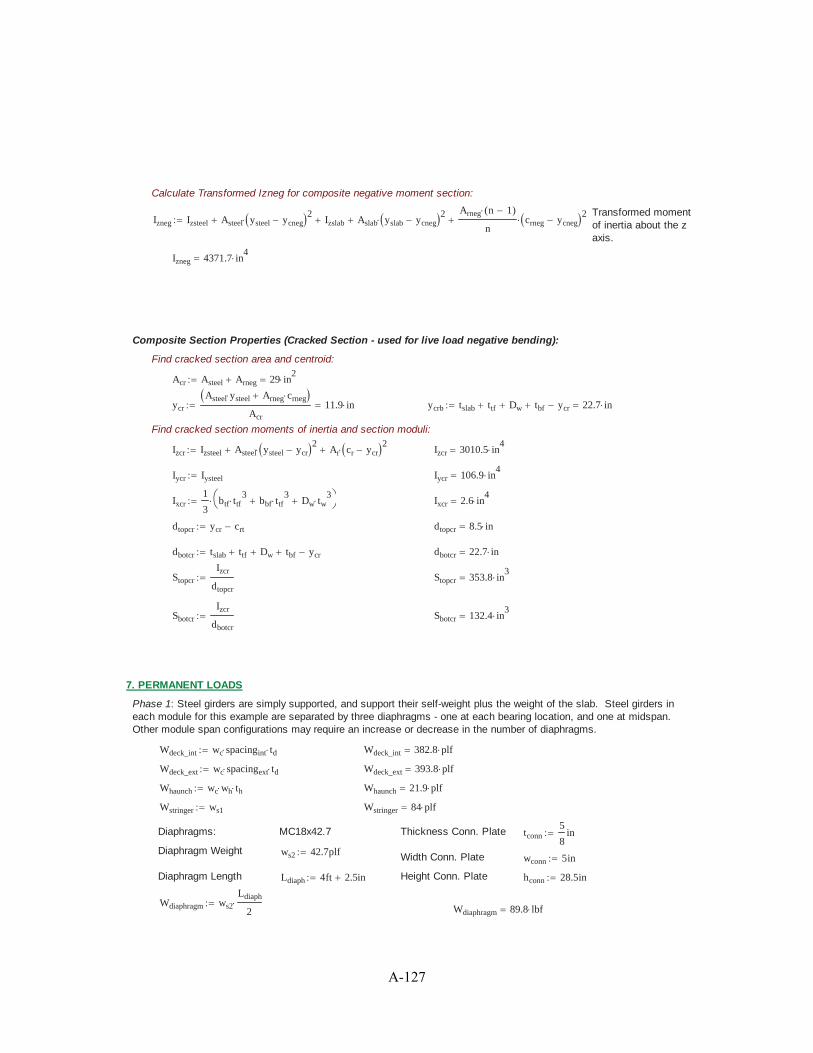
Calculate Transformed Izneg for composite negative moment section:
Transformed momentof inertia about the zaxis.
Izneg Izsteel Asteel ysteel ycneg2
Izslab Aslab yslab ycneg2 Arneg n 1( )
ncrneg ycneg
2
Izneg 4371.7 in4
Composite Section Properties (Cracked Section - used for live load negative bending):
Find cracked section area and centroid:
Acr Asteel Arneg 29 in2
ycr
Asteel ysteel Arneg crneg
Acr
11.9 in ycrb tslab ttf Dw tbf ycr 22.7 in
Find cracked section moments of inertia and section moduli:
Izcr Izsteel Asteel ysteel ycr2
Ar cr ycr2
Izcr 3010.5 in4
Iycr Iysteel Iycr 106.9 in4
Ixcr1
3btf ttf
3bbf ttf
3Dw tw
3Ixcr 2.6 in
4
dtopcr ycr crt dtopcr 8.5 in
dbotcr tslab ttf Dw tbf ycr dbotcr 22.7 in
Stopcr
Izcr
dtopcr
Stopcr 353.8 in3
Sbotcr
Izcr
dbotcr
Sbotcr 132.4 in3
7. PERMANENT LOADS
Phase 1: Steel girders are simply supported, and support their self-weight plus the weight of the slab. Steel girders ineach module for this example are separated by three diaphragms - one at each bearing location, and one at midspan.Other module span configurations may require an increase or decrease in the number of diaphragms.
Wdeck_int wc spacingint td Wdeck_int 382.8 plf
Wdeck_ext wc spacingext td Wdeck_ext 393.8 plf
Whaunch wc wh th Whaunch 21.9 plf
Wstringer ws1 Wstringer 84 plf
Diaphragms: MC18x42.7 Thickness Conn. Plate tconn5
8in
Diaphragm Weight ws2 42.7plf Width Conn. Plate wconn 5in
Diaphragm Length Ldiaph 4ft 2.5in Height Conn. Plate hconn 28.5in
Wdiaphragm ws2
Ldiaph
2 Wdiaphragm 89.8 lbf
A-127

Wconn 2 ws tconn wconn hconn Wconn 50.5 lbf
WDCpoint Wdiaphragm Wconn 1.05WDCpoint 147.4 lbf
Equivalent distributed load from DC point loads: wDCpt_equiv
3 WDCpoint
Lstr
11.2 plf
Interior Uniform Dead Load, Phase 1: WDCuniform1_int Wdeck_int Whaunch Wstringer wDCpt_equiv 499.9 plf
Exterior Uniform Dead Load, Phase 1: WDCuniform1_ext Wdeck_ext Whaunch Wstringer wDCpt_equiv 510.8 plf
Moments due to Phase 1 DL: MDC1_int x( )WDCuniform1_int x
2Lstr x MDC1_ext x( )
WDCuniform1_ext x
2Lstr x
Shear due to Phase 1 DL: VDC1_int x( ) WDCuniform1_int
Lstr
2x VDC1_ext x( ) WDCuniform1_ext
Lstr
2x
Phase 2: Steel girders are simply supported and composite with the deck slab, and support their self-weight plus theweight of the slab in addition to barriers on exterior modules. Barriers are assumed to be evenly distributed betweenthe two exterior module girders.
Barrier Area Abarrier 2.89ft2
Barrier Weight Wbarrier
wc Abarrier
2Wbarrier 216.8 plf
Interior Dead Load, Phase 2: WDCuniform_int WDCuniform1_int 499.9 plf
Exterior Dead Load, Phase 2: WDCuniform_ext WDCuniform1_ext Wbarrier 727.6 plf
Moments due to Phase 2 DL: MDC2_int x( )WDCuniform_int x
2Lstr x MDC2_ext x( )
WDCuniform_ext x
2Lstr x
Shear due to Phase 2 DL: VDC2_int x( ) WDCuniform_int
Lstr
2x VDC2_ext x( ) WDCuniform_ext
Lstr
2x
Phase 3: Girders are composite and have been made continuous. Utilities and future wearing surface are applied.
Unit Weight Overlay wws 30psf
Wws_int wws spacingint Wws_int 87.5 plfWws_ext wws spacingext 1 ft 7in
Wws_ext 42.5 plf
Unit Weight Utilities Wu 15plf
WDWuniform_int Wws_int Wu WDWuniform_int 102.5 plfWDWuniform_ext Wws_ext Wu WDWuniform_ext 57.5 plf
Moments due to DW: MDW_int x( )WDWuniform_int x
2Lstr x MDW_ext x( )
WDWuniform_ext x
2Lstr x
Shears due to DW: VDW_int x( ) WDWuniform_int
Lstr
2x VDW_ext x( ) WDWuniform_ext
Lstr
2x
A-128

8. PRECAST LIFTING WEIGHTS AND FORCES
This section addresses the construction loads for lifting the module into place. The module is lifted from four points, atsome distance, Dlift from each end of each girder.
Distance from end of lifting point: Dlift 8.75ft
Assume weight uniformly distributed along girder, with 30% Dynamic Dead Load Allowance:
Dynamic Dead Load Allowance: DLIM 30%
Interior Module:Total Interior Module Weight: Wint Lstr WDCuniform_int 3 WDCpoint 2 1 DLIM( ) 52.5 kip
Vertical force at lifting point: Flift_int
Wint
413.1 kip
Equivalent distributed load: wint_IM
Wint
2 Lstr
664.4 plf
Min (Neg.) Moment during lifting: Mlift_neg_max_int wint_IM
Dlift2
2Mlift_neg_max_int 25.4 kip ft
Max (Pos.) Moment during lifting: Mlift_pos_max_int 0wint_IM Lstr 2 Dlift
2
8Mlift_neg_max_int 0if
wint_IM Lstr 2 Dlift2
8Mlift_neg_max_int
Mlift_pos_max_int 14.8 kip ft
Exterior Module:
Total Exterior Module Weight: Wext Lstr WDCuniform_ext 3 WDCpoint Wbarrier Lstr 2 1 DLIM( ) 98.1 kip
Vertical force at lifting point: Flift_ext
Wext
424.5 kip
Equivalent distributed load: wext_IM
Wext
2 Lstr
1242.2 plf
Min (Neg.) Moment during lifting: Mlift_neg_max_ext wext_IM
Dlift2
2Mlift_neg_max_ext 47.6 kip ft
A-129

Max (Pos.) Moment during lifting: Mlift_pos_max_ext 0wext_IM Lstr 2 Dlift
2
8Mlift_neg_max_ext 0if
wext_IM Lstr 2 Dlift2
8Mlift_neg_max_ext
Mlift_pos_max_ext 27.6 kip ft
Max Shear during lifting: Vlift max wext_IM Dlift Flift_ext wext_IM Dlift 13.7 kip
9. LIVE LOAD DISTRIBUTION FACTORS
These factors represent the distribution of live load from the deck to the girders in accordance with AASHTO Section 4,and assumes the deck is fully continuous across the joints.
Girder Section Modulus: Izsteel 2798.5 in4
Girder Area: Asteel 24.5 in2
Girder Depth: dgird 26.7 in
Distance betweencentroid of deck andcentroid of beam:
eg
td
2th
dgird
220.6 in
Modular Ratio: n 7
Multiple PresenceFactors:
MP1 1.2 MP2 1.0 S3.6.1.1.2-1
Interior Stringers for Moment:S4.6.2.2.1-1
One Lane Loaded: Kg n Izsteel Asteel eg2
92319.5 in4
gint_1m 0.06spacingint
14ft
0.4spacingint
Lspan
0.3Kg
Lspan td3
0.1
0.268
Two Lanes Loaded: gint_2m 0.075spacingint
9.5ft
0.6spacingint
Lspan
0.2Kg
Lspan td3
0.1
0.323
Governing Factor: gint_m max gint_1m gint_2m 0.323
Interior Stringers for Shear:One Lane Loaded: gint_1v 0.36
spacingint
25ft0.477
Two Lanes Loaded: gint_2v 0.2spacingint
12ft
spacingint
35ft
2
0.436
Governing Factor: gint_v max gint_1v gint_2v 0.477
Exterior Stringers for Moment:
A-130

One Lane Loaded: Use Lever Rule. Wheel is 2' from barrier; barrier is 2" beyond exterior stringer.de 2in
Lspa 4.5ft r Lspa de 2ft 2.7 ft
gext_1m MP10.5r
Lspa
0.356
Two Lanes Loaded: e2m 0.77de
9.1ft0.7883
gext_2m e2m gint_2m 0.254
Governing Factor: gext_m max gext_1m gext_2m 0.356
Exterior Stringers for Shear:One Lane Loaded: Use Lever Rule.
gext_1v gext_1m 0.356
Two Lanes Loaded: e2v 0.6de
10ft0.62
gext_2v e2v gint_2v 0.269
Governing Factor: gext_v max gext_1v gext_2v 0.356
FACTOR TO USE FOR SHEAR: gv max gint_v gext_v 0.477
FACTOR TO USE FOR MOMENT: gm max gint_m gext_m 0.356
10. LOAD RESULTS
Case 1: Dead Load on Steel Only (calculated in Section 7). Negative moments are zero and are not considered.Because the girder is simply supported, the maximum moment is at x = Lstr/2 and the maximum shear is at x = 0.
Interior Girder MDC1int MDC1_int
Lstr
297.5 kip ft MDW1int 0 kip ft MLL1int 0kip ft
VDC1int VDC1_int 0( ) 9.9 kip VDW1int 0 kip VLL1int 0 kip
Exterior Girder MDC1ext MDC1_ext
Lstr
299.6 kip ft MDW1ext 0 kip ft MLL1ext 0 kip ft
VDC1ext VDC1_ext 0( ) 10.1 kip VDW1ext 0 kip VLL1ext 0 kip ftLoad Cases:
M1_STR_I max 1.25 MDC1int 1.5 MDW1int 1.75 MLL1int 1.25 MDC1ext 1.5 MDW1ext 1.75 MLL1ext 124.5 kip f
V1_STR_I max 1.25 VDC1int 1.5 VDW1int 1.75 VLL1int 1.25 VDC1ext 1.5 VDW1ext 1.75 VLL1ext 12.6 kip
Case 2: Dead Load on Composite Section (calculated in Section 7). Negative moments are zero and are not considered.Again, the maximum moment occur at x = Lstr/2 and the maximum shear is at x = 0.
Interior Girder MDC2int MDC2_int
Lstr
297.5 kip ft MDW2int 0 kip ft MLL2int 0 kip ft
VDC2int VDC2_int 0( ) 9.9 kip VDW2int 0 kip VLL2int 0 kip
Exterior Girder MDC2ext MDC2_ext
Lstr
2141.9 kip ft MDW2ext 0 kip ft MLL2ext 0 kip ft
VDC2ext VDC2_ext 0( ) 14.4 kip VDW2ext 0 kip VLL2ext 0 kip
Load Cases:M2_STR_I max 1.25 MDC2int 1.5 MDW2int 1.75 MLL2int 1.25 MDC2ext 1.5 MDW2ext 1.75 MLL2ext 177.4 kip f
A-131

V2_STR_I max 1.25 VDC2int 1.5 VDW2int 1.75 VLL2int 1.25 VDC2ext 1.5 VDW2ext 1.75 VLL2ext 18 kip
Case 3: Composite girders are lifted into place from lifting points located distance Dlift from the girder edges.
Maximum moments and shears were calculated in Section 8.
Interior Girder MDC3int Mlift_pos_max_int 14.8 kip ft MDW3int 0 kip ft MLL3int 0 kip ft
MDC3int_neg Mlift_neg_max_int 25.4 kip ft MDW3int_neg 0 kip ft MLL3int_neg 0 kip ft
VDC3int Vlift 13.7 kip VDW3int 0 kip VLL3int 0 kip
Exterior Girder MDC3ext Mlift_pos_max_ext 27.6 kip ft MDW3ext 0 kip ft MLL3ext 0 kip ft
MDC3ext_neg Mlift_neg_max_ext 47.6 kip ft MDW3ext_neg 0 kip ft MLL3ext_neg 0 kip ft
VDC3ext Vlift 13.7 kip VDW3ext 0 kip VLL3ext 0 kip
Load Cases:M3_STR_I max 1.5 MDC3int 1.5 MDW3int 1.5 MDC3ext 1.5 MDW3ext 41.4 kip ft
M3_STR_I_neg max 1.5 MDC3int_neg 1.5 MDW3int_neg 1.5 MDC3ext_neg 1.5 MDW3ext_neg 71.3 kip ft
V3_STR_I max 1.5 VDC3int 1.5 VDW3int 1.5 VDC3ext 1.5 VDW3ext 20.5 kip
Case 4: Composite girders made continuous. Utilities and future wearing surface are applied, and live load. Maximummoment and shear results are from a finite element analysis not included in this design example. The live load valueincludes the lane fraction calculated in Section 9, and impact.
Governing Loads: MDC4 93.4 kip ft MDW4 13.1 kip ft MLL4 201.6 kip ft
MWS4 0kip ft MW4 0kip ft
MDC4neg 116.8 kip ft MDW4neg 16.4 kip ft MLL4neg 134.7kip ft
MWS4neg 0 kip ft MWL4neg 0 kip ft
VDC 17.5kip VDW 2.5kip VLL 87.6kip
Vu 1.25 VDC 1.5 VDW 1.75 VLL gv 98.7 kip
Load Cases:M4_STR_I 1.25 MDC4 1.5 MDW4 1.75 MLL4 489.2 kip ft
M4_STR_I_neg 1.25 MDC4neg 1.5 MDW4neg 1.75 MLL4neg 406.3 kip ft
M4_STR_III 1.25 MDC4 1.5 MDW4 1.4 MWS4 136.4 kip ft
M4_STR_III_neg 1.25 MDC4neg 1.5 MDW4neg 1.4 MWS4 170.6 kip ft
M4_STR_V 1.25 MDC4 1.5 MDW4 1.35 MLL4 0.4 MWS4 1.0 MW4 408.6 kip ft
M4_STR_V_neg 1.25 MDC4neg 1.5 MDW4neg 1.35 MLL4neg 0.4 MWS4neg 1.0 MWL4neg 352.4 kip ft
M4_SRV_I 1.0 MDC4 1.0 MDW4 1.0 MLL4 0.3 MWS4 1.0 MW4 308.1 kip ft
M4_SRV_I_neg 1.0 MDC4neg 1.0 MDW4neg 1.0 MLL4neg 0.3 MWS4neg 1.0 MWL4neg 267.9 kip ft
M4_SRV_II 1.0 MDC4 1.0 MDW4 1.3 MLL4 368.6 kip ft
M4_SRV_II_neg 1.0 MDC4neg 1.0 MDW4neg 1.3 MLL4neg 308.3 kip ft
A-132

11. FLEXURAL STRENGTH
The flexural resistance shall be determined as specified in LRFD Design Article 6.10.6.2. Determine Stringer PlasticMoment Capacity First.
LFRD Appendix D6 Plastic Moment
Find location of PNA:
Forces:
Prt Art Fs 81.4 kip Ps 0.85 fc beff tslab 1190 kip Pw Fy Dw tw 584.2 kip
Prb Arb Fs 115.5 kip Pc Fy btf ttf 320 kip Pt Fy bbf tbf 320 kip
A-133

PNApos "case 1" Pt Pw Pc Ps Prt Prbif
"case 2" Pt Pw Pc Ps Prt Prbif
"case 3" Pt Pw Pc
crb
tslab
Ps Prt Prbif
"case 4" Pt Pw Pc Prb
crb
tslab
Ps Prtif
"case 5" Pt Pw Pc Prb
crt
tslab
Ps Prtif
"case 6" Pt Pw Pc Prb Prt
crt
tslab
Psif
"case 7" Pt Pw Pc Prb Prt
crt
tslab
Psif otherwise
otherwise
otherwise
otherwise
otherwise
otherwise
PNApos "case 3"
PNAneg "case 1" Pc Pw Pt Prt Prbif
"case 2" Pt Pw Pc Prt Prbif otherwise PNAneg "case 1"
Calculate Y, Dp, and Mp: D Dw ts tslab th 0 Crt crt Crb crb
Case I : Plastic Nuetral Axis in the Steel Web
Y1D
2
Pt Pc Ps Prt Prb
Pw
1 DP1 ts th ttf Y1
MP1
Pw
2DY1
2D Y1
2Ps Y1
ts
2ttf th Prt ts Crt ttf Y1 th Prb ts Crb ttf Y1 th
Pc Y1
ttf
2Pt D Y1
tbf
2
Y1negD
21
Pc Pt Prt Prb
Pw
Dp1neg ts th ttf Y1neg
DCP1negD
2 Pw
Pt Pw Prb Prt Pc
A-134

Mp1neg
Pw
2 DY1neg
2Dw Y1neg
2Prt ts Crt ttf Y1neg th Prb ts Crb ttf Y1neg th
Pt D Y1neg
tbf
2Pc Y1neg
ttf
2
Case II: Plastic Nuetral Axis in the Steel Top Flange
Y2
ttf
2
Pw Pt Ps Prt Prb
Pc
1 DP2 ts th Y2
MP2
Pc
2ttf
Y22
ttf Y22
Ps Y2
ts
2th Prt ts Crt th Y2 Prb ts Crb th Y2
PwD
2ttf Y2 Pt D Y2
tbf
2ttf
Y2neg
ttf
21
Pw Pc Prt Prb
Pt
DP2neg ts th Y2neg DCP2neg D
Mp2neg
Pt
2 ttf
Y2neg2
ttf Y2neg2
Prt ts Crt th Y2neg Prb ts Crb th Y2neg
Pw ttf Y2negD
2Pc ts th Y2neg
ttf
2
Case III: Plastic Nuetral Axis in the Concrete Deck Below the Bottom Reinforcing
Y3 ts
Pc Pw Pt Prt Prb
Ps
DP3 Y3
MP3
Ps
2ts
Y32
Prt Y3 Crt Prb Crb Y3 Pc
ttf
2ts th Y3 Pw
D
2ttf th ts Y3
Pt Dtbf
2ttf ts th Y3
Case IV: Plastic Nuetral Axis in the Concrete Deck in the bottom reinforcing layer
Y4 Crb DP4 Y4
MP4
Ps
2ts
Y42
Prt Y4 Crt Pc
ttf
2th ts Y4 Pw
D
2ttf th ts Y4
Pt Dtbf
2ttf th ts Y4
Case V: Plastic Nuetral Axis in the Concrete Deck between top and bot reinforcing layers
Y5 ts
Prb Pc Pw Pt Prt
Ps
DP5 Y5
MP5
Ps
2ts
Y52
Prt Y5 Crt Prb ts Crb Y5 Pc
ttf
2ts th Y5 Pw
D
2ttf th ts Y5
Pt Dtbf
2ttf ts th Y5
A-135
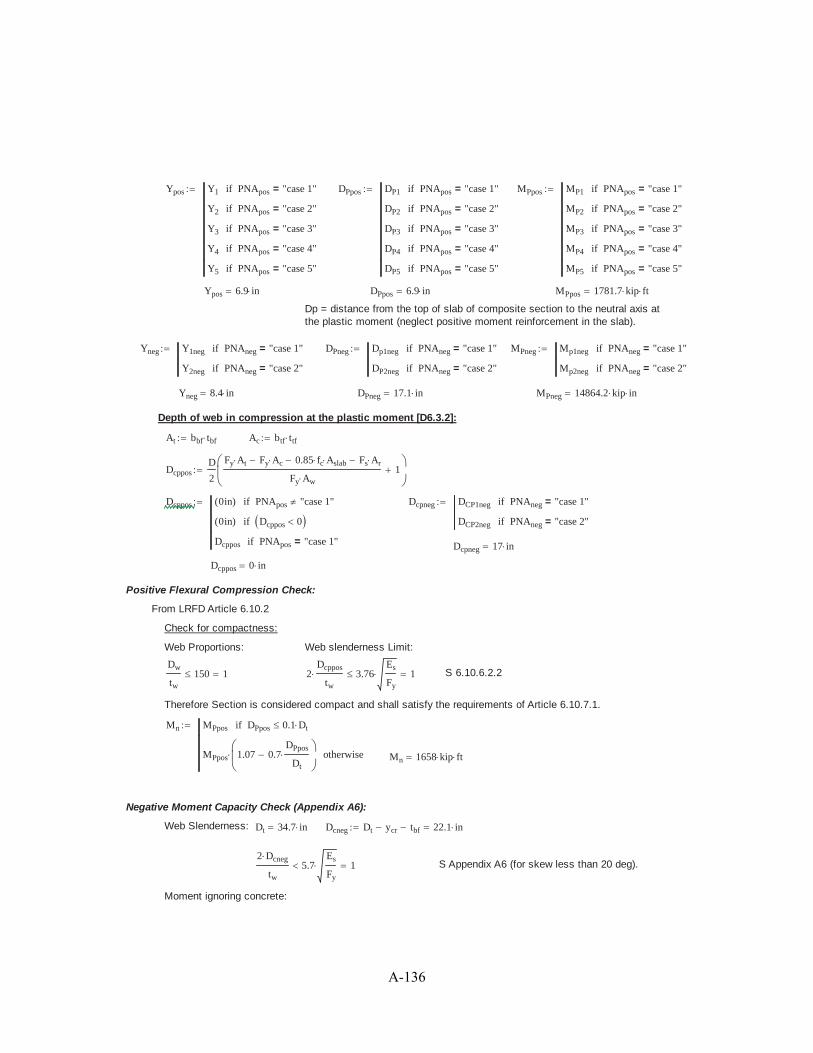
Ypos Y1 PNApos "case 1"=if
Y2 PNApos "case 2"=if
Y3 PNApos "case 3"=if
Y4 PNApos "case 4"=if
Y5 PNApos "case 5"=if
DPpos DP1 PNApos "case 1"=if
DP2 PNApos "case 2"=if
DP3 PNApos "case 3"=if
DP4 PNApos "case 4"=if
DP5 PNApos "case 5"=if
MPpos MP1 PNApos "case 1"=if
MP2 PNApos "case 2"=if
MP3 PNApos "case 3"=if
MP4 PNApos "case 4"=if
MP5 PNApos "case 5"=if
Ypos 6.9 in DPpos 6.9 in MPpos 1781.7 kip ft
Dp = distance from the top of slab of composite section to the neutral axis atthe plastic moment (neglect positive moment reinforcement in the slab).
Yneg Y1neg PNAneg "case 1"=if
Y2neg PNAneg "case 2"=if
DPneg Dp1neg PNAneg "case 1"=if
DP2neg PNAneg "case 2"=if
MPneg Mp1neg PNAneg "case 1"=if
Mp2neg PNAneg "case 2"=if
Yneg 8.4 in DPneg 17.1 in MPneg 14864.2 kip in
Depth of web in compression at the plastic moment [D6.3.2]:
At bbf tbf Ac btf ttf
DcpposD
2
Fy At Fy Ac 0.85 fc Aslab Fs Ar
Fy Aw
1
Dcppos 0in( ) PNApos "case 1"if
0in( ) Dcppos 0if
Dcppos PNApos "case 1"=if
Dcpneg DCP1neg PNAneg "case 1"=if
DCP2neg PNAneg "case 2"=if
Dcpneg 17 in
Dcppos 0 in
Positive Flexural Compression Check:
From LRFD Article 6.10.2
Check for compactness:
Web Proportions: Web slenderness Limit:
Dw
tw
150 1 2Dcppos
tw
3.76Es
Fy
1 S 6.10.6.2.2
Therefore Section is considered compact and shall satisfy the requirements of Article 6.10.7.1.
Mn MPpos DPpos 0.1 Dtif
MPpos 1.07 0.7DPpos
Dt
otherwise Mn 1658 kip ft
Negative Moment Capacity Check (Appendix A6):
Web Slenderness: Dt 34.7 in Dcneg Dt ycr tbf 22.1 in
2 Dcneg
tw
5.7Es
Fy
1 S Appendix A6 (for skew less than 20 deg).
Moment ignoring concrete:
A-136
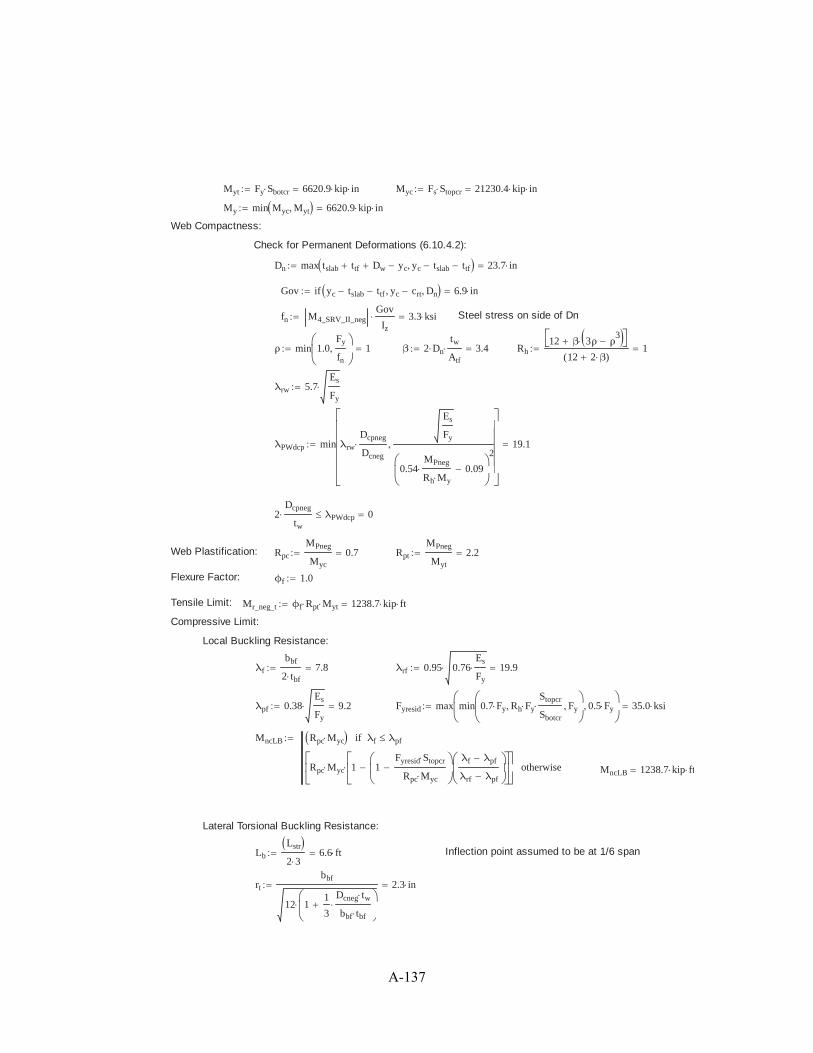
Myt Fy Sbotcr 6620.9 kip in Myc Fs Stopcr 21230.4 kip in
My min Myc Myt 6620.9 kip in
Web Compactness:
Check for Permanent Deformations (6.10.4.2):
Dn max tslab ttf Dw yc yc tslab ttf 23.7 in
Gov if yc tslab ttf yc crt Dn 6.9 in
fn M4_SRV_II_negGov
Iz
3.3 ksi Steel stress on side of Dn
ρ min 1.0Fy
fn
1 β 2 Dn
tw
Atf
3.4 Rh12 β 3ρ ρ
3
12 2 β( )1
λrw 5.7Es
Fy
λPWdcp min λrw
Dcpneg
Dcneg
Es
Fy
0.54MPneg
Rh My
0.09
219.1
2Dcpneg
tw
λPWdcp 0
Web Plastification: Rpc
MPneg
Myc
0.7 Rpt
MPneg
Myt
2.2
Flexure Factor: ϕf 1.0
Tensile Limit: Mr_neg_t ϕf Rpt Myt 1238.7 kip ft
Compressive Limit:
Local Buckling Resistance:
λf
bbf
2 tbf
7.8 λrf 0.95 0.76Es
Fy
19.9
λpf 0.38Es
Fy
9.2 Fyresid max min 0.7 Fy Rh Fy
Stopcr
Sbotcr
Fy 0.5 Fy 35.0 ksi
MncLB Rpc Myc λf λpfif
Rpc Myc 1 1Fyresid Stopcr
Rpc Myc
λf λpf
λrf λpf
otherwise MncLB 1238.7 kip ft
Lateral Torsional Buckling Resistance:
Lb
Lstr
2 36.6 ft Inflection point assumed to be at 1/6 span
rt
bbf
12 11
3
Dcneg tw
bbf tbf
2.3 in
A-137

Lp 1.0 rt
Es
Fy
56.2 in h D tbf 26 in Cb 1.0
Jb
D tw3
3
bbf tbf3
31 0.63
tbf
bbf
btf ttf3
31 0.63
ttf
btf
2.5 in4
Lr 1.95 rt
Es
Fyresid
Jb
Sbotcr h1 1 6.76
Fyresid
Es
Sbotcr h
Jb
2
236.9 in
Fcr
Cb π2
Es
Lb
rt
21 0.078
Jb
Sbotcr h
Lb
rt
2
257.9 ksi
MncLTB Rpc Myc Lb Lpif
min Cb 1 1Fyresid Sbotcr
Rpc Myc
Lb Lp
Lr Lp
Rpc Myc Rpc Myc Lp Lb Lrif
min Fcr Sbotcr Rpc Myc Lb Lrif
MncLTB 1131.2 kip ft
Mr_neg_c ϕf min MncLB MncLTB 1131.2 kip ft
Governing negative moment capacity: Mr_neg min Mr_neg_t Mr_neg_c 1131.2 kip ft
12. FLEXURAL STRENGTH CHECKS
Phase 1: First, check the stress due to the dead load on the steel section only. (LRFD 6.10.3 - ConstructabilityRequirements
Reduction factor for construction ϕconst 0.9
Load Combination for construction 1.25 MDC
Max Moment applied, Phase 1:(at midspan)
Mint_P1 1.25 MDC1_int
Lstr
2121.9 kip ft Interior( )
Mext_P1 1.25 MDC1_ext
Lstr
2124.5 kip ft Exterior( )
Maximum Stress, Phase 1:fint_P1
Mint_P1 ysteel
Izsteel
7 ksi Interior( )
fext_P1
Mext_P1 ysteel
Izsteel
7.1 ksi Exterior( )
Stress limits: fP1_max ϕconst Fy
fint_P1 fP1_max 1 fext_P1 fP1_max 1
Phase 2: Second, check the stress due to dead load on the composite section (with barriers added)
Reduction factor for construction ϕconst 0.9
Load Combination for construction 1.25 MDC
Max Moment applied, Phase 2:(at midspan) M2_STR_I 177.4 kip ft
A-138

Capacity for positive flexure: Mn 1658 kip ft
Check Moment: M2_STR_I ϕconst Mn 1
Phase 3: Next, check the flexural stress on the stringer during transport and picking, to ensure no cracking.
Reduction factor for construction ϕconst 0.9
Load Combination for construction 1.5 MDC when dynamic construction loads are involved (Section 10).
Loads and stresses on stringerduring transport and picking: M3_STR_I_neg 71.3 kip ft
Concrete rupture stress fr 0.24 fc ksi 0.5 ksi
Concrete stress during construction not to exceed:
fcmax ϕconst fr 0.5 ksi
fcconst
M3_STR_I_neg yc
Iz n0.2 ksi
fcconst fcmax 1
Phase 4: Check flexural capacity under dead load and live load for fully installed continuous composite girders.
Strength I Load Combination ϕf 1.0
M4_STR_I 489.2 kip ft M4_STR_I_neg 406.3 kip ft
M4_STR_I ϕf Mn 1 M4_STR_I_neg Mr_neg 1
Strength III Load CombinationM4_STR_III 136.4 kip ft M4_STR_III_neg 170.6 kip ft
M4_STR_III ϕf Mn 1 M4_STR_III_neg Mr_neg 1
Strength V Load Combination
M4_STR_V 408.6 kip ft M4_STR_V_neg 352.4 kip ft
M4_STR_V ϕf Mn 1 M4_STR_V_neg Mr_neg 1
13. FLEXURAL SERVICE CHECKS
Check service load combinations for the fully continuous beam with live load (Phase 4):
under Service II for stress limits - M4_SRV_II 368.6 kip ft
M4_SRV_II_neg 308.3 kip ft
under Service I for cracking - M4_SRV_I_neg 267.9 kip ft
Ignore positive moment for Service I as there is notension in the concrete in this case.
Service Load Stress Limits:Top Flange: ftfmax 0.95 Rh Fy 47.5 ksi
Bottom Flange: fbfmax ftfmax 47.5 ksi
Concrete (Negative bending only): fr 0.5 ksi
Service Load Stresses, Positive Moment:
A-139

Top Flange: fSRVII_tf M4_SRV_II
yc tslab
Iz
1.4 ksi
fSRVII_tf ftfmax 1
Bottom Flange: fbfs2 M4_SRV_II
tslab ttf Dw tbf yc
Iz
14 ksi
fl 0 fbfs2
fl
2fbfmax 1
Service Load Stresses, Negative Moment:Top (Concrete):
fcon.neg
M4_SRV_I_neg ycneg
n Izneg
0.8 ksi Using Service I Loading
fcon.neg fr 0
Bottom Flange: fbfs2.neg
M4_SRV_I_neg tslab ttf Dw tbf ycneg
Izneg
20.1 ksi
fbfs2.neg fbfmax 1
Check LL Deflection:
ΔDT 1.104 in from independent Analysis - includes 100% design truck (w/impact), or 25% designtruck (w/impact) + 100% lane load
DFδ3
120.3 Deflection distribution factor = (no. lanes)/(no. stringers)
Lstr
ΔDT DFδ1717.4 Equivalent X, where L/X = Deflection*Distribution Factor
Lstr
ΔDT DFδ800 1
14. SHEAR STRENGTHShear Capacity based on AASHTO LRFD 6.10.9
Nominal resistance of unstiffened web:Fy 50.0 ksi Dw 25.4 in tw 0.5 in ϕv 1.0 k 5
Vp 0.58 Fy Dw tw 338.8 kip
A-140
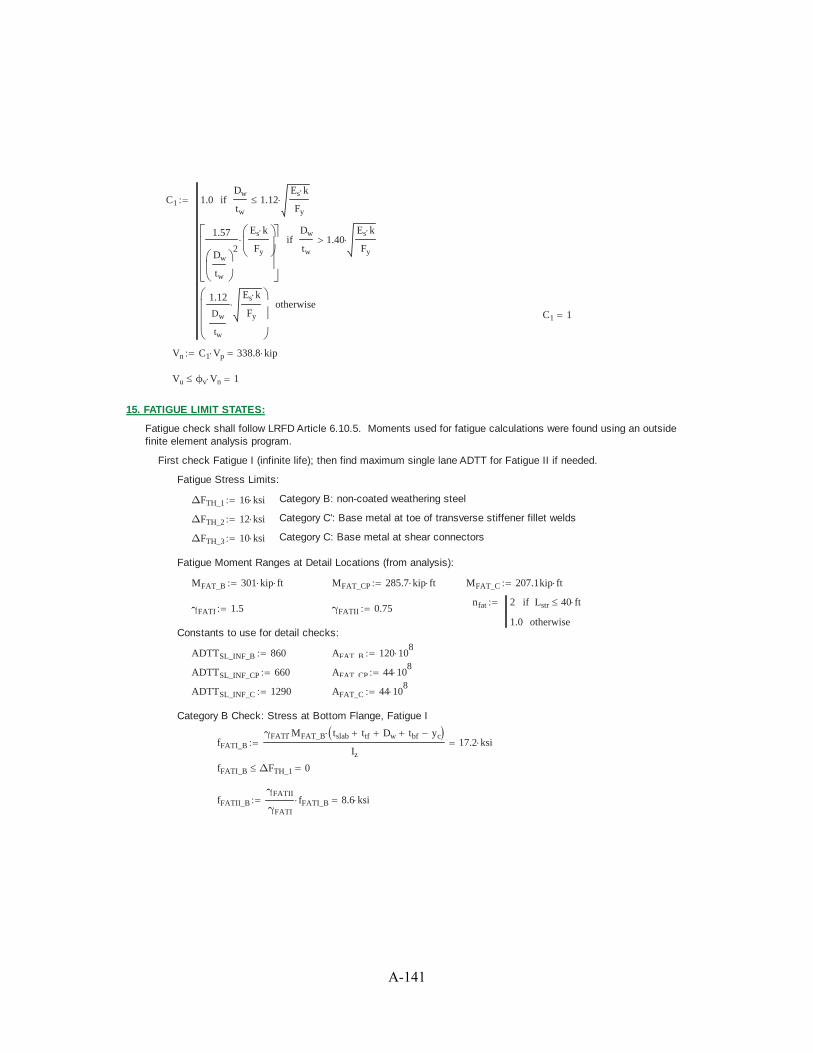
C1 1.0Dw
tw
1.12Es k
Fy
if
1.57
Dw
tw
2
Es k
Fy
Dw
tw
1.40Es k
Fy
if
1.12
Dw
tw
Es k
Fy
otherwiseC1 1
Vn C1 Vp 338.8 kip
Vu ϕv Vn 1
15. FATIGUE LIMIT STATES:
Fatigue check shall follow LRFD Article 6.10.5. Moments used for fatigue calculations were found using an outsidefinite element analysis program.
First check Fatigue I (infinite life); then find maximum single lane ADTT for Fatigue II if needed.
Fatigue Stress Limits:
ΔFTH_1 16 ksi Category B: non-coated weathering steel
ΔFTH_2 12 ksi Category C': Base metal at toe of transverse stiffener fillet welds
ΔFTH_3 10 ksi Category C: Base metal at shear connectors
Fatigue Moment Ranges at Detail Locations (from analysis):
MFAT_B 301 kip ft MFAT_CP 285.7 kip ft MFAT_C 207.1kip ft
nfat 2 Lstr 40 ftif
1.0 otherwiseγFATI 1.5 γFATII 0.75
Constants to use for detail checks:
ADTTSL_INF_B 860 AFAT_B 120 108
ADTTSL_INF_CP 660 AFAT_CP 44 108
ADTTSL_INF_C 1290 AFAT_C 44 108
Category B Check: Stress at Bottom Flange, Fatigue I
fFATI_B
γFATI MFAT_B tslab ttf Dw tbf yc
Iz
17.2 ksi
fFATI_B ΔFTH_1 0
fFATII_B
γFATII
γFATI
fFATI_B 8.6 ksi
A-141

ADTTSL_B_MAX
ADTTSL_INF_B
nfat
fFATI_B ΔFTH_1if
AFAT_B ksi3
365 75 nfat fFATII_B3
otherwise
ADTTSL_B_MAX 345
Category C' Check: Stress at base of transverse stiffener (top of bottom flange)
fFATI_CP γFATI MFAT_CP
tslab ttf Dw yc
Iz
15.9 ksi
fFATI_CP ΔFTH_2 0
fFATII_CP
γFATII
γFATI
fFATI_CP 7.9 ksi
ADTTSL_CP_MAX
ADTTSL_INF_CP
nfat
fFATI_CP ΔFTH_2if
AFAT_CP ksi3
365 75 nfat fFATII_CP3
otherwise
ADTTSL_CP_MAX 160
Category C Check: Stress at base of shear connectors (top of top flange)
fFATI_C γFATI MFAT_C
yc tslab
Iz
1.1 ksi
fFATI_C ΔFTH_3 1
fFATII_C
γFATII
γFATI
fFATI_C 0.6 ksi
ADTTSL_C_MAX
ADTTSL_INF_C
nfat
fFATI_C ΔFTH_3if
AFAT_C ksi3
365 75 nfat fFATII_C3
otherwise
ADTTSL_C_MAX 645
FATIGUE CHECK: ADTTSL_MAX min ADTTSL_B_MAX ADTTSL_CP_MAX ADTTSL_C_MAX
Ensure that single lane ADTT is less than ADTTSL_MAX 160
If not, then the beam requires redesign.
A-142
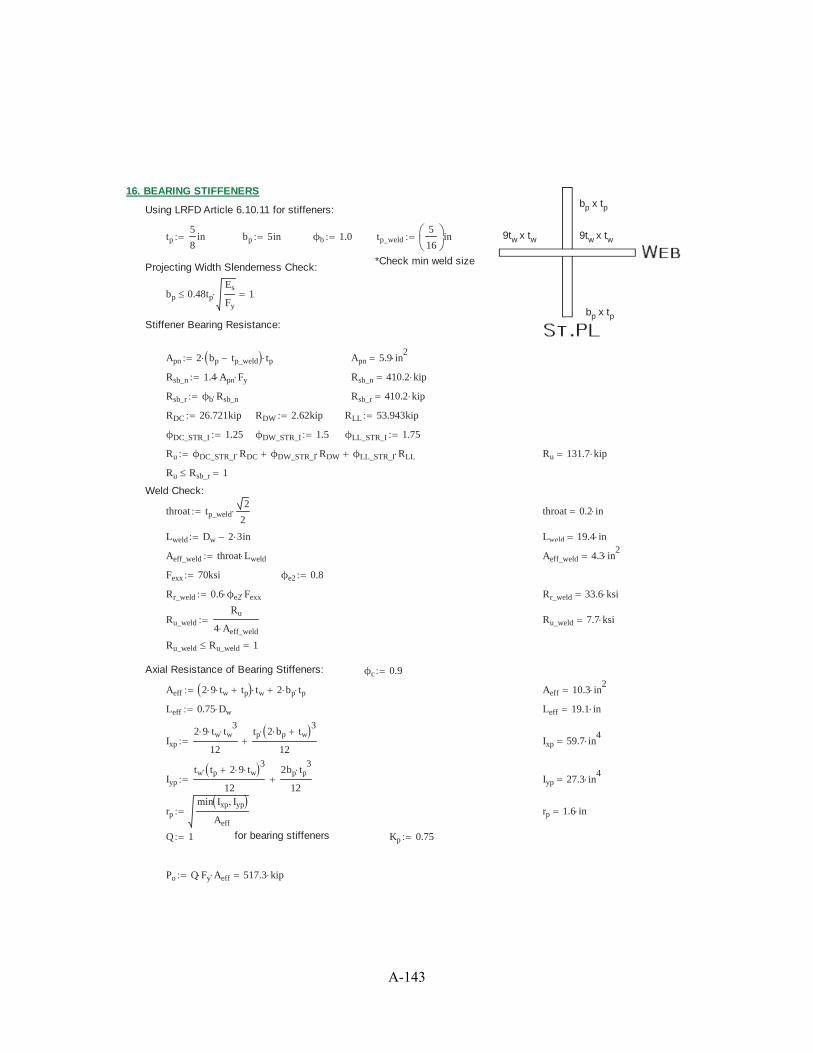
16. BEARING STIFFENERSbp x tpUsing LRFD Article 6.10.11 for stiffeners:
tp5
8in bp 5in ϕb 1.0 tp_weld
5
16in 9tw x tw 9tw x tw
*Check min weld sizeProjecting Width Slenderness Check:
bp 0.48tp
Es
Fy
1
bp x tpStiffener Bearing Resistance:
Apn 2 bp tp_weld tp Apn 5.9 in2
Rsb_n 1.4 Apn Fy Rsb_n 410.2 kip
Rsb_r ϕb Rsb_n Rsb_r 410.2 kip
RDC 26.721kip RDW 2.62kip RLL 53.943kip
ϕDC_STR_I 1.25 ϕDW_STR_I 1.5 ϕLL_STR_I 1.75
Ru ϕDC_STR_I RDC ϕDW_STR_I RDW ϕLL_STR_I RLL Ru 131.7 kip
Ru Rsb_r 1
Weld Check:
throat tp_weld2
2throat 0.2 in
Lweld Dw 2 3in Lweld 19.4 in
Aeff_weld throat Lweld Aeff_weld 4.3 in2
Fexx 70ksi ϕe2 0.8
Rr_weld 0.6 ϕe2 Fexx Rr_weld 33.6 ksi
Ru_weld
Ru
4 Aeff_weld
Ru_weld 7.7 ksi
Ru_weld Ru_weld 1
Axial Resistance of Bearing Stiffeners: ϕc 0.9
Aeff 2 9 tw tp tw 2 bp tp Aeff 10.3 in2
Leff 0.75 Dw Leff 19.1 in
Ixp
2 9 tw tw3
12
tp 2 bp tw3
12Ixp 59.7 in
4
Iyp
tw tp 2 9 tw3
12
2bp tp3
12Iyp 27.3 in
4
rp
min Ixp Iyp
Aeff
rp 1.6 in
Q 1 for bearing stiffeners Kp 0.75
Po Q Fy Aeff 517.3 kip
A-143

Pe
π2Es Aeff
Kp
Leff
rp
238239.8 kip
Pn 0.658
Po
PePo
Pe
Po
0.44if
0.877 Pe otherwise
Pn 514.4 kip
Pr ϕc Pn Pr 463 kip Ru Pr 1
17. SHEAR CONNECTORS:Shear Connector design to follow LRFD 6.10.10.
Stud Properties:
ds7
8in Diameter hs 6in Height of Stud
hs
ds
4 1
cs tslab hs cs 2in 1
ss 3.5in Spacing ss 4ds 1
ns 3 Studs per rowbtf ss ns 1 ds
21.0in 1
Asc πds
2
2
Asc 0.6 in2
Fu 60ksi
Fatigue Resistance:
Zr 5.5 ds2 kip
in2
Zr 4.2 kip Qslab Aslab yc yslab Qslab 253.8 in3
Vf 47.0kip
Vfat
Vf Qslab
Iz
1.6kip
in
ps
ns Zr
Vfat
8.1 in 6 ds ps 24in 1
Strength Resistance:
ϕsc 0.85
fc 5 ksi
Ec 33000 0.151.5
fc ksi 4286.8 ksi
Qn min 0.5 Asc fc Ec Asc Fu Qn 36.1 kip
Qr ϕsc Qn Qr 30.7 kip
Psimple min 0.85 fc beff ts Fy Asteel Psimple 1190 kip
Pcont Psimple min 0.45 fc beff ts Fy Asteel Pcont 1820 kip
nlines
Pcont
Qr ns
nlines 19.8
A-144

Find required stud spacing along the girder (varies as applied shear varies)
i 0 23
x
0.00
1.414
4.947
8.480
12.013
15.546
19.079
22.612
26.145
29.678
33.210
33.917
34.624
36.037
36.743
40.276
43.809
47.342
50.875
54.408
57.941
61.474
65.007
67.833
ft Vfi
61.5
59.2
56.8
54.4
52.0
49.5
47.1
44.7
42.7
40.6
40.6
40.6
40.6
40.6
40.6
42.3
44.2
46.6
49.1
51.5
53.9
56.3
58.7
61.5
kip Vfati
Vfi Qslab
Iz
0
01
2
3
4
5
6
7
8
9
10
11
12
13
14
15
22
1.9
1.8
1.7
1.6
1.6
1.5
1.4
1.3
1.3
1.3
1.3
1.3
1.3
...
kip
inPmax
ns Zr
Vfati
0
01
2
3
4
5
6
7
8
9
10
11
12
13
14
15
6.26.4
6.7
7
7.3
7.7
8.1
8.5
8.9
9.4
9.4
9.4
9.4
9.4
9.4
...
in
min Pmax 6.2 in
max Pmax 9.4 in
18. SLAB PROPERTIES
This section details the geometric and material properties of the deck. Because the equivalent strip method is used inaccordance with AASHTO LRFD Section 4, different loads are used for positive and negative bending.
Unit Weight Concrete wc 150 pcf
Deck Thickness for Design tdeck 8.0in tdeck 7in 1
Deck Thickness for Loads td 10.5 in
Rebar yield strength Fs 60 ksi Strength of concrete fc 5 ksi
Concrete clear cover Bottom Top
cb 1.0in cb 1.0in 1 ct 2.5in ct 2.5in 1
A-145

Transverse reinforcement Bottom Reinforcing ϕtb6
8in ϕtt
5
8inTop Reinforcing
Bottom Spacing stb 8in Top Spacing stt 8in
stb 1.5ϕtb 1.5in 1 stt 1.5ϕtt 1.5in 1
stb 1.5 tdeck 18in 1 stt 1.5 tdeck 18in 1
Astb12in
stb
πϕtb
2
2
0.7 in2
Astt12in
stt
πϕtt
2
2
0.5 in2
Design depth of Bar dtb tdeck cb
ϕtb
26.6 in dtt tdeck ct
ϕtt
25.2 in
Girder Spacing spacingint_max 2ft 11in
spacingext 3 ft
Equivalent Strip, +M wposM 26 6.6spacingint_max
ftin wposM 45.3 in
Equivalent Strip, -M wnegM 48 3.0spacingint_max
ftin wnegM 56.8 in
Once the strip widths are determined, the dead loads can be calculated.
19. PERMANENT LOADSThis section calculates the dead loads on the slab. These are used later for analysis to determine the design moments.
Weight of deck, +M wdeck_pos wc td wposM wdeck_pos 494.9 plf
Weight of deck, -M wdeck_neg wc td wnegM wdeck_neg 620.7 plf
Unit weight of barrier wb 433.5plf
Barrier point load, +M Pb_pos wb wposM Pb_pos 1.63 kip
Barrier point load, -M Pb_neg wb wnegM Pb_neg 2.05 kip
20. LIVE LOADSThis section calculates the live loads on the slab. These loads are analyzed in a separate program with the permanentloads to determine the design moments.
Truck wheel load Pwheel 16kip
Impact Factor IM 1.33
Multiple presence factors MP1 1.2 MP2 1.0 MP3 0.85
Wheel Loads P1 IM MP1 Pwheel P2 IM MP2 Pwheel P3 IM MP3 Pwheel
P1 25.54 kip P2 21.3 kip P3 18.09 kip
21. LOAD RESULTS
The separate MathCAD design aides (available in Appendix of the final report) was used to analyze the deck as an11-span continuous beam without cantilevered overhangs on either end, with supports stationed at girder locations. The dead and live loads were applied separately. The results are represented here as input values, highlighted.
A-146

Design Moments
Mpos_deck 0.4 kip ft Mpos_LL 15.3 kip ft Mpos 1.25 Mpos_deck 1.75 Mpos_LL
Mpos 27.3 kip ft Mpos_dist
Mpos
wposM
Mpos_dist 7.23kip ft
ft
Mneg_deck 0.6 kip ft Mneg_LL 7.8 kip ft Mneg 1.25 Mneg_deck 1.75 Mneg_LL
Mneg 14.4 kip ft Mneg_dist
Mneg
wnegM
Mneg_dist 3.04kip ft
ft
22. FLEXURAL STRENGTH CAPACITY CHECK:
Consider a 1'-0" strip: ϕb 0.9 b 12in
β1 0.85 fc 4ksiif
0.85 0.05fc
ksi4 otherwise
β1 0.8
Bottom: Top:
ctb
Astb Fs
0.85 fc β1 b1 in ctt
Astt Fs
0.85 fc β1 b0.7 in
atb β1 ctb 0.8 in att β1 ctt 0.5 in
Mntb
Astb Fs
bdtb
atb
220.7
kip ft
ftMntt
Astt Fs
ftdtt
att
211.3
kip ft
ft
Mrtb ϕb Mntb 18.6kip ft
ftMrtt ϕb Mntt 10.2
kip ft
ft
Mrtb Mpos_dist 1 Mrtt Mneg_dist 1
23. LONGITUDINAL DECK REINFORCEMENT DESIGN:
Longitudinal reinforcement ϕlb5
8in slb 12in ϕlt
5
8in slt 12in
Aslb12in
slb
πϕlb
2
2
0.3 in2
Aslt12in
slt
πϕlt
2
2
0.3 in2
Distribution Reinforcement(AASHTO 9.7.3.2)
A%dist
min220
spacingint_max
ft
67
10067 %
Adist A%dist Astb 0.4 in2
Aslb Aslt Adist 1
A-147
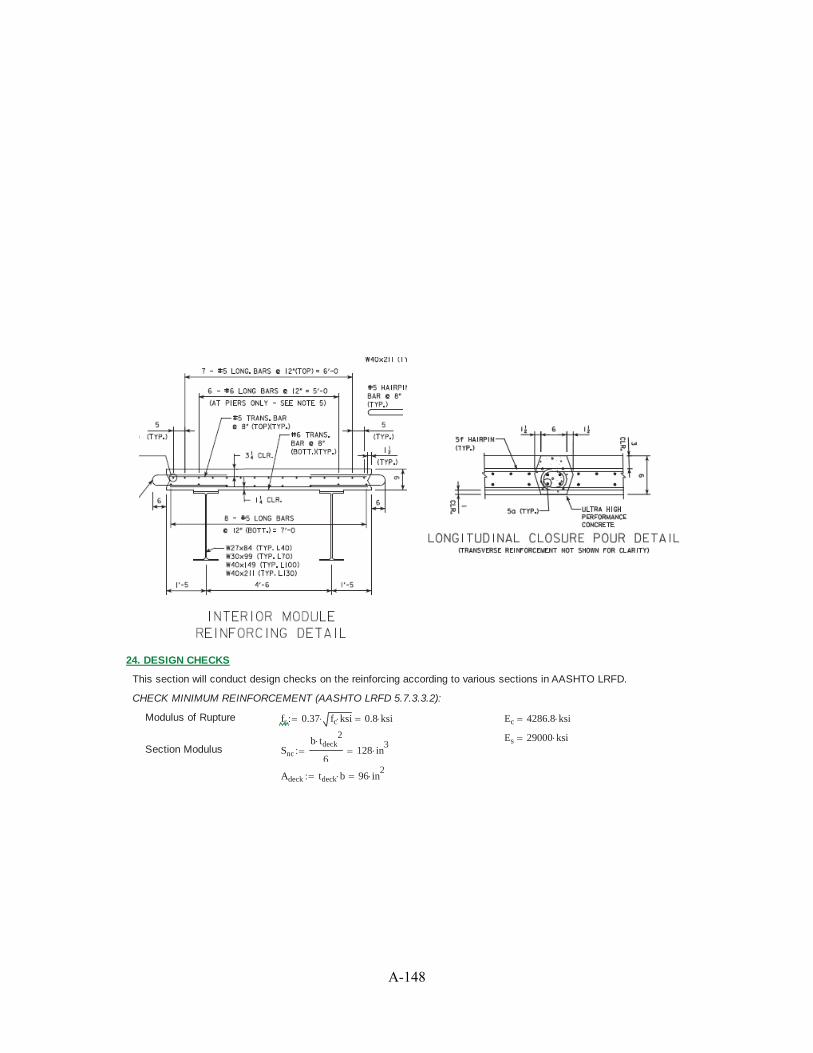
24. DESIGN CHECKS
This section will conduct design checks on the reinforcing according to various sections in AASHTO LRFD.
CHECK MINIMUM REINFORCEMENT (AASHTO LRFD 5.7.3.3.2):
Modulus of Rupture fr 0.37 fc ksi 0.8 ksi Ec 4286.8 ksi
Es 29000 ksiSection Modulus Snc
b tdeck2
6128 in
3
Adeck tdeck b 96 in2
A-148
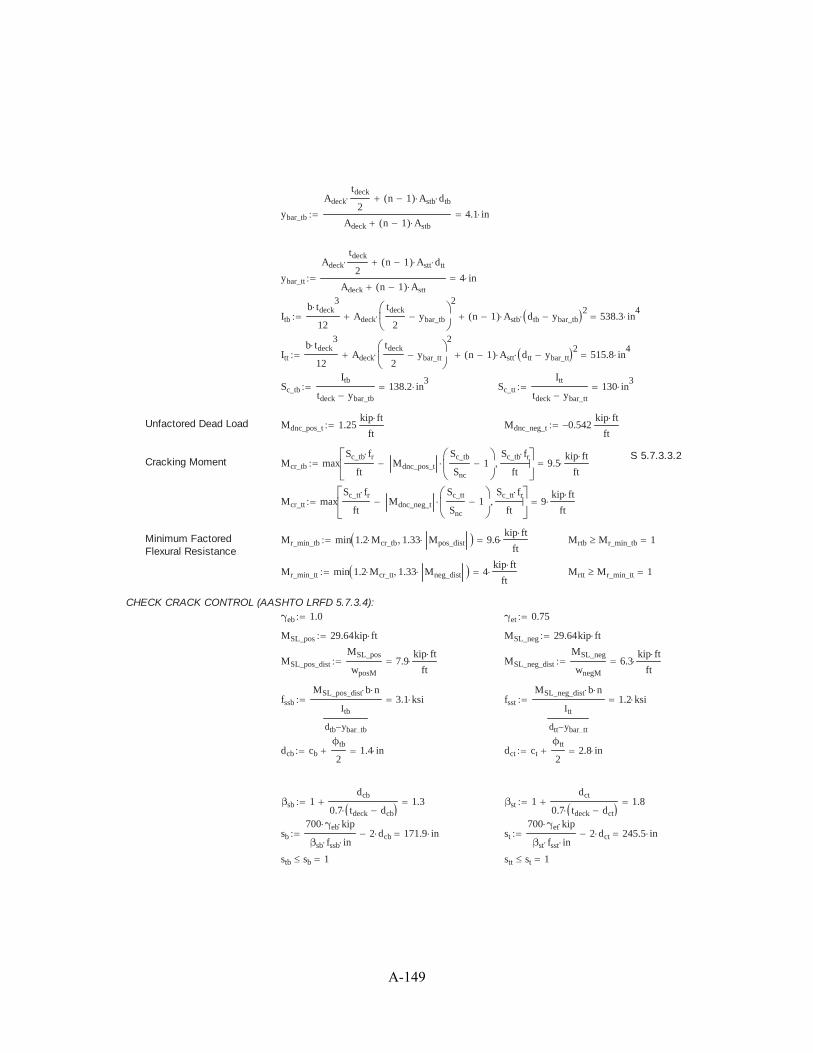
ybar_tb
Adeck
tdeck
2n 1( ) Astb dtb
Adeck n 1( ) Astb
4.1 in
ybar_tt
Adeck
tdeck
2n 1( ) Astt dtt
Adeck n 1( ) Astt
4 in
Itb
b tdeck3
12Adeck
tdeck
2ybar_tb
2
n 1( ) Astb dtb ybar_tb2
538.3 in4
Itt
b tdeck3
12Adeck
tdeck
2ybar_tt
2
n 1( ) Astt dtt ybar_tt2
515.8 in4
Sc_tb
Itb
tdeck ybar_tb
138.2 in3
Sc_tt
Itt
tdeck ybar_tt
130 in3
Unfactored Dead Load Mdnc_pos_t 1.25kip ft
ftMdnc_neg_t 0.542
kip ft
ft
S 5.7.3.3.2Cracking Moment Mcr_tb max
Sc_tb fr
ftMdnc_pos_t
Sc_tb
Snc
1Sc_tb fr
ft9.5
kip ft
ft
Mcr_tt maxSc_tt fr
ftMdnc_neg_t
Sc_tt
Snc
1Sc_tt fr
ft9
kip ft
ft
Minimum FactoredFlexural Resistance
Mr_min_tb min 1.2 Mcr_tb 1.33 Mpos_dist 9.6kip ft
ftMrtb Mr_min_tb 1
Mr_min_tt min 1.2 Mcr_tt 1.33 Mneg_dist 4kip ft
ftMrtt Mr_min_tt 1
CHECK CRACK CONTROL (AASHTO LRFD 5.7.3.4):γeb 1.0 γet 0.75
MSL_pos 29.64kip ft MSL_neg 29.64kip ft
MSL_pos_dist
MSL_pos
wposM
7.9kip ft
ftMSL_neg_dist
MSL_neg
wnegM
6.3kip ft
ft
fssb
MSL_pos_dist b n
Itb
dtb ybar_tb
3.1 ksi fsst
MSL_neg_dist b n
Itt
dtt ybar_tt
1.2 ksi
dcb cb
ϕtb
21.4 in dct ct
ϕtt
22.8 in
βsb 1dcb
0.7 tdeck dcb
1.3 βst 1dct
0.7 tdeck dct
1.8
sb
700 γeb kip
βsb fssb in2 dcb 171.9 in st
700 γet kip
βst fsst in2 dct 245.5 in
stb sb 1 stt st 1
A-149

SHRINKAGE AND TEMPERATURE REINFORCING (AASHTO LRFD 5.10.8):
Ast
1.30 b tdeck
2 b tdeck Fs
kip
in0.11in
2 1.30 b tdeck
2 b tdeck Fs
kip
in0.60in
2if
0.11in2 1.30 b tdeck
2 b tdeck Fs
kip
in0.11in
2if
0.60in2 1.30 b tdeck
2 b tdeck Fs
kip
in0.60in
2if
0.1 in2
Astb Ast 1 Astt Ast 1
Aslb Ast 1 Aslt Ast 1
SHEAR RESISTANCE (AASHTO LRFD 5.8.3.3):ϕ 0.9 β 2 θ 45deg b 1 ft
dv_tb max 0.72 tdeck dtb
atb
20.9 dtb 6.2 in
dv_tt max 0.72 tdeck dtt
att
20.9 dtt 5.8 in
dv min dv_tb dv_tt 5.8 in
Vc 0.0316 β fc ksi b dv 9.8 kip
Vs 0kip Shear capacity of reinforcing steel
Vps 0kip Shear capacity of prestressing steel
Vns min Vc Vs Vps 0.25 fc b dv Vps 9.8 kip
Vr ϕ Vns 8.8 kip Total factored resistance
Vus 8.38kip Total factored load Vr Vus 1
DEVELOPMENT AND SPLICE LENGTHS (AASHTO LRFD 5.11):
Development and splice length design follows standard calculations in AASHTO LRFD 5.11, or as dictated by the StateDOT Design Manual.
25. DECK OVERHANG DESIGN (AASHTO LRFD A.13.4):
A-150

Deck Properties:
Deck Overhang Length Lo 1ft 9in
Parapet Properties:
Note: Parapet properties are per unit length. Compression reinforcement is ignored.
Cross Sectional Area Ap 2.84ft2 Height of Parapet Hpar 2ft 10in
Parapet Weight Wpar wc Ap 426 plf
Width at base wbase 1ft 5in Average width of wall wwall13in 9.5in
211.3 in
Height of top portion ofparapet
h1 2ft Width at top of parapet width1 9.5 in 9.5 in
Height of middle portion ofparapet
h2 7in Width at middle transitionof parapet
width2 12 in 12 in
Height of lower portion ofparapet
h3 3in Width at base of parapet width3 1ft 5 in 17 in
b1 width1 b2 width2 width1 b3 width3 width2
Parapet Center of Gravity CGp
h1 h2 h3
b12
2
1
2h1 b2 b1
b2
3
h2 h3 b2 b3 b1
b2 b3
2
1
2h2 b3 b1 b2
2b3
3
h1 h2 h3 b11
2h1 b2 h2 h3 b2 b3
1
2h2 b3
6.3 in
Parapet Reinforcement Vertically Aligned Bars in Wall Horizontal BarsRebar spacing: spa 12in npl 5
Rebar Diameter: ϕpa5
8in ϕpl
5
8in
Rebar Area: Ast_p πϕpa
2
2b
spa
0.3 in2
Asl_p πϕpl
2
2
0.3 in2
Cover: cst 3in csl 2in ϕpa 2.6 in
Effective Depth: dst wbase cst
ϕpa
213.7 in dsl wwall csl
ϕpl
28.3 in
Parapet MomentResistance AboutHorizontal Axis:
ϕext 1.0
S 5.7.3.1.2-4S 5.7.3.2.3
Depth of EquivalentStress Block:
ah
Ast_p Fs
0.85 fc b0.4 in
Moment Capacity of Upper Segment of Barrier (about longitudinal axis):
Average width of section w1
width1 width2
210.7 in
Cover cst1 2in
dh1 w1 cst1
ϕpa
28.4 inDepth
Factored MomentResistance
ϕMnh1
ϕext Ast_p Fs dh1
ah
2
b12.7
kip ft
ft
Moment Capacity of Middle Segment of Barrier (about longitudinal axis):
A-151
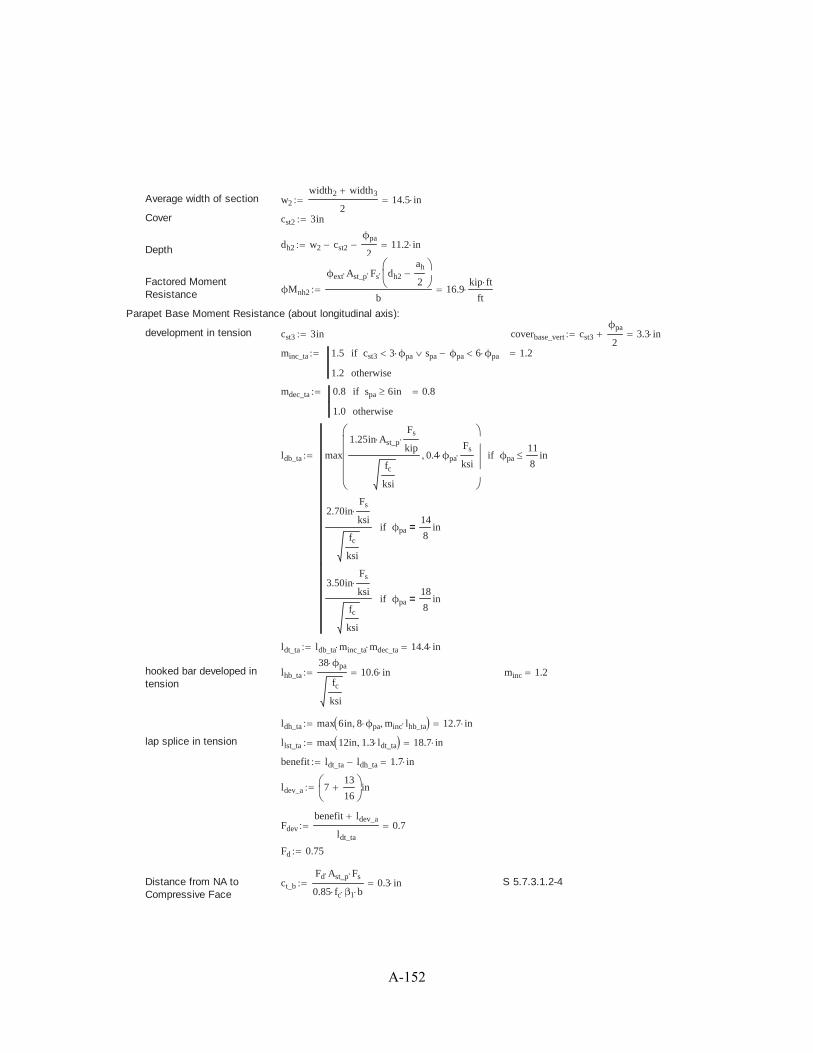
Average width of section w2
width2 width3
214.5 in
Cover cst2 3in
dh2 w2 cst2
ϕpa
211.2 inDepth
Factored MomentResistance ϕMnh2
ϕext Ast_p Fs dh2
ah
2
b16.9
kip ft
ft
Parapet Base Moment Resistance (about longitudinal axis):
development in tension cst3 3in coverbase_vert cst3
ϕpa
23.3 in
minc_ta 1.5 cst3 3 ϕpa spa ϕpa 6 ϕpaif
1.2 otherwise
1.2
mdec_ta 0.8 spa 6inif
1.0 otherwise
0.8
ldb_ta max
1.25in Ast_p
Fs
kip
fc
ksi
0.4 ϕpa
Fs
ksiϕpa
11
8inif
2.70inFs
ksi
fc
ksi
ϕpa14
8in=if
3.50inFs
ksi
fc
ksi
ϕpa18
8in=if
ldt_ta ldb_ta minc_ta mdec_ta 14.4 in
hooked bar developed intension
lhb_ta
38 ϕpa
fc
ksi
10.6 in minc 1.2
ldh_ta max 6in 8 ϕpa minc lhb_ta 12.7 in
lap splice in tension llst_ta max 12in 1.3 ldt_ta 18.7 in
benefit ldt_ta ldh_ta 1.7 in
ldev_a 713
16in
Fdev
benefit ldev_a
ldt_ta
0.7
Fd 0.75
Distance from NA toCompressive Face
ct_b
Fd Ast_p Fs
0.85 fc β1 b0.3 in S 5.7.3.1.2-4
A-152

Depth of Equivalent StressBlock
at β1 ct_b 0.3 in S 5.7.3.2.3
Nominal MomentResistance
Mnt Fd Ast_p Fs dst
at
215.6 kip ft S 5.7.3.2.2-1
Factored MomentResistance
Mcb ϕext
Mnt
ft15.6
kip ft
ftS 5.7.3.2
Average Moment Capacity of Barrier (about longitudinal axis):
Factored MomentResistance aboutHorizontal Axis
Mc
ϕMnh1 h1 ϕMnh2 h2 Mcb h3
h1 h2 h3
13.8kip ft
ft
Parapet Moment Resistance (about vertical axis):
Height of TransverseReinforcement in Parapet
y1 5in Width of Parapet atTransverse Reinforcement
x1 width3
y1 h3 b3
h2
15.6 in
y2 11.5in x2 b1 b2
y2 h3 h2 b2
h1
11.8 in
y3 18in x3 b1 b2
y3 h3 h2 b2
h1
11.2 in
y4 24.5in x4 b1 b2
y4 h3 h2 b2
h1
10.5 in
y5 31in x5 b1 b2
y5 h3 h2 b2
h1
9.8 in
Depth of Equivalent StressBlock
anpl Asl_p Fs
0.85 fc Hpar
0.6 in
Concrete Cover in Parapet coverr 2in coverrear coverr ϕpa
ϕpl
22.9 in
coverbase cst3 ϕpa
ϕpl
23.9 in
coverf 2in coverfront 2in ϕpa
ϕpl
2
covert
x5
24.9 in covertop covert 4.9 in
Design depth d1i x1 coverbase 11.6 in d1o x1 coverrear 12.6 in
d2i x2 coverfront 8.9 in d2o x2 coverrear 8.9 in
d3i x3 coverfront 8.2 in d3o x3 coverrear 8.2 in
d4i x4 coverfront 7.6 in d4o x4 coverrear 7.6 in
d5i x5 covertop 4.9 in d5o x5 covertop 4.9 in
Nominal MomentResistance - Tension onInside Face
ϕMn1i ϕext Asl_p Fs d1ia
2208.3 kip in
ϕMn2i ϕext Asl_p Fs d2ia
2158.1 kip in
ϕMn3i ϕext Asl_p Fs d3ia
2145.6 kip in
ϕMn4i ϕext Asl_p Fs d4ia
2133.2 kip in
A-153

ϕMn5i ϕext Asl_p Fs d5ia
284.5 kip in
Mwi ϕMn1i ϕMn2i ϕMn3i ϕMn4i ϕMn5i 60.8 kip ft
Nominal MomentResistance - Tension onOutside Face
ϕMn1o ϕext Asl_p Fs d1oa
218.9 kip ft
ϕMn2o ϕext Asl_p Fs d2oa
213.2 kip ft
ϕMn3o ϕext Asl_p Fs d3oa
212.1 kip ft
ϕMn4o ϕext Asl_p Fs d4oa
211.1 kip ft
ϕMn5o ϕext Asl_p Fs d5oa
27 kip ft
Mwo ϕMn1o ϕMn2o ϕMn3o ϕMn4o ϕMn5o 62.3 kip ft
Vertical Nominal MomentResistance of Parapet
Mw
2 Mwi Mwo
361.3 kip ft
Parapet Design Factors:
Crash Level CL "TL-4"
Transverse Design Force Ft 13.5kip CL "TL-1"=if
27.0kip CL "TL-2"=if
54.0kip CL "TL-3"=if
54.0kip CL "TL-4"=if
124.0kip CL "TL-5"=if
175.0kip otherwise
54 kip Lt 4.0ft CL "TL-1"=if
4.0ft CL "TL-2"=if
4.0ft CL "TL-3"=if
3.5ft CL "TL-4"=if
8.0ft CL "TL-5"=if
8.0ft otherwise
3.5 ft
Longitudinal Design Force Fl 4.5kip CL "TL-1"=if
9.0kip CL "TL-2"=if
18.0kip CL "TL-3"=if
18.0kip CL "TL-4"=if
41.0kip CL "TL-5"=if
58.0kip otherwise
18 kip Ll 4.0ft CL "TL-1"=if
4.0ft CL "TL-2"=if
4.0ft CL "TL-3"=if
3.5ft CL "TL-4"=if
8.0ft CL "TL-5"=if
8.0ft otherwise
3.5 ft
Vertical Design Force(Down)
Fv 4.5kip CL "TL-1"=if
4.5kip CL "TL-2"=if
4.5kip CL "TL-3"=if
18.0kip CL "TL-4"=if
80.0kip CL "TL-5"=if
80.0kip otherwise
18 kip Lv 18.0ft CL "TL-1"=if
18.0ft CL "TL-2"=if
18.0ft CL "TL-3"=if
18.0ft CL "TL-4"=if
40.0ft CL "TL-5"=if
40.0ft otherwise
18 ft
Critical Length of Yield Line Failure Pattern:
Mb 0kip ft
A-154

Lc
Lt
2
Lt
2
28 Hpar Mb Mw
Mc
11.9 ft S A13.3.1-2
Rw2
2 Lc Lt
8 Mb 8 Mw
Mc Lc2
Hpar
116.2 kip S A13.3.1-1
TRw b
Lc 2 Hpar
6.6 kip S A13.4.2-1
The parapet design must consider three design cases. Design Case 1 is for longitudinal and transverse collision loadsunder Extreme Event Load Combination II. Design Case 2 represents vertical collision loads under Extreme Event LoadCombination II; however, this case does not govern for decks with concrete parapets or barriers. Design Case 3 is for deadand live load under Strength Load Combination I; however, the parapet will not carry wheel loads and therefore this casedoes not govern. Design Case 1 is the only case that requires a check.
Design Case 1: Longitudinal and Transverse Collision Loads, Extreme Event Load Combination II
DC - 1A: Inside face of parapetS A13.4.1S Table 3.4.1-1ϕext 1 γDC 1.0 γDW 1.0 γLL 0.5
llip 2in wbase 17 in
Adeck_1A tdeck llip wbase 152 in2
Ap 2.8 ft2
Wdeck_1A wc Adeck_1A 0.2 klf Wpar 0.4 klf
MDCdeck_1A γDC Wdeck_1A
llip wbase
20.1
kip ft
ft
MDCpar_1A γDC Wpar llip CGp 0.3kip ft
ft
Mtotal_1A Mcb MDCdeck_1A MDCpar_1A 16kip ft
ft
ϕtt_add5
8in stt_add 8in
Astt_p12in
stt
πϕtt
2
212in
stt_add
πϕtt_add
2
2
0.9 in2
dtt_add tdeck ct
ϕtt_add
25.2 in
ctt_p
Astt_p Fs
0.85 fc β1 b1.4 in att_p β1 ctt_p 1.1 in
Mntt_p
Astt_p Fs
ftdtt_add
att_p
221.4
kip ft
ft
Mrtt_p ϕb Mntt_p 19.2kip ft
ftMrtt_p Mtotal_1A 1
AsT Astt Astb 1.1 in2
ϕPn ϕext AsT Fs 67.4 kip ϕPn T 1
Mu_1A Mrtt_p 1T
ϕPn
17.4kip ft
ftMu_1A Mtotal_1A 1
A-155
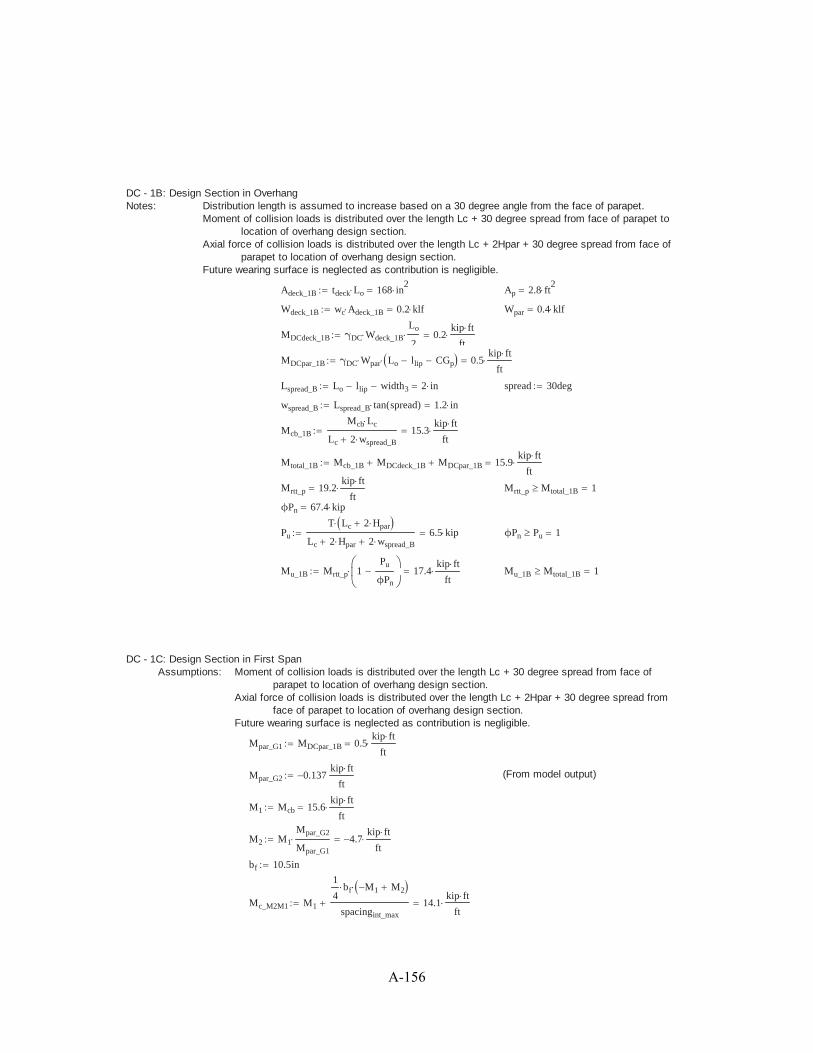
DC - 1B: Design Section in OverhangNotes: Distribution length is assumed to increase based on a 30 degree angle from the face of parapet.
Moment of collision loads is distributed over the length Lc + 30 degree spread from face of parapet tolocation of overhang design section.
Axial force of collision loads is distributed over the length Lc + 2Hpar + 30 degree spread from face ofparapet to location of overhang design section.
Future wearing surface is neglected as contribution is negligible.
Adeck_1B tdeck Lo 168 in2
Ap 2.8 ft2
Wdeck_1B wc Adeck_1B 0.2 klf Wpar 0.4 klf
MDCdeck_1B γDC Wdeck_1B
Lo
20.2
kip ft
ft
MDCpar_1B γDC Wpar Lo llip CGp 0.5kip ft
ft
Lspread_B Lo llip width3 2 in spread 30deg
wspread_B Lspread_B tan spread( ) 1.2 in
Mcb_1B
Mcb Lc
Lc 2 wspread_B
15.3kip ft
ft
Mtotal_1B Mcb_1B MDCdeck_1B MDCpar_1B 15.9kip ft
ft
Mrtt_p 19.2kip ft
ftMrtt_p Mtotal_1B 1
ϕPn 67.4 kip
Pu
T Lc 2 Hpar
Lc 2 Hpar 2 wspread_B
6.5 kip ϕPn Pu 1
Mu_1B Mrtt_p 1Pu
ϕPn
17.4kip ft
ftMu_1B Mtotal_1B 1
DC - 1C: Design Section in First SpanAssumptions: Moment of collision loads is distributed over the length Lc + 30 degree spread from face of
parapet to location of overhang design section.Axial force of collision loads is distributed over the length Lc + 2Hpar + 30 degree spread from
face of parapet to location of overhang design section.Future wearing surface is neglected as contribution is negligible.
Mpar_G1 MDCpar_1B 0.5kip ft
ft
Mpar_G2 0.137kip ft
ft(From model output)
M1 Mcb 15.6kip ft
ft
M2 M1
Mpar_G2
Mpar_G1
4.7kip ft
ft
bf 10.5in
Mc_M2M1 M1
1
4bf M1 M2
spacingint_max
14.1kip ft
ft
A-156

Lspread_C Lo llip wbase
bf
44.6 in
wspread_C Lspread_C tan spread( ) 2.7 in
Mcb_1C
Mc_M2M1 Lc
Lc 2 wspread_C
13.6kip ft
ft
Mtotal_1C Mcb_1C MDCdeck_1B MDCpar_1B 14.2kip ft
ft
Mrtt_p 19.2kip ft
ftMrtt_p Mtotal_1C 1
ϕPn 67.4 kip
PuC
T Lc 2 Hpar
Lc 2 Hpar 2 wspread_C
6.4 kip ϕPn PuC 1
Mu_1C Mrtt_p 1Pu
ϕPn
17.4kip ft
ftMu_1B Mtotal_1B 1
Compute Overhang Reinforcement Cut-off Length Requirement
Maximum crash load moment at theoretical cut-ff point:
Mc_max Mrtt 10.2kip ft
ft
LMc_max
M2 Mrtt
M2 M1
spacingint_max 2.1 ft
Lspread_D Lo llip wbase LMc_max 27.7 in
wspread_D Lspread_D tan spread( ) 16 in
Mcb_max
Mc_max Lc
Lc 2 wspread_D
8.3kip ft
ft
extension max dtt_add 12 ϕtt_add 0.0625 spacingint_max 7.5 in
cutt_off LMc_max extension 33.2 in
Att_add πϕtt_add
2
2
0.3 in2
mthick_tt_add 1.4 tdeck ct 12inif
1.0 otherwise
1
mepoxy_tt_add 1.5 ct 3 ϕtt_add
stt_add
2ϕtt_add 6 ϕtt_addif
1.2 otherwise
1.5
minc_tt_add min mthick_tt_add mepoxy_tt_add 1.7 1.5
mdec_tt_add 0.8stt_add
26inif
1.0 otherwise
1
A-157

ldb_tt_add max
1.25in Att_add
Fs
kip
fc
ksi
0.4 ϕtt_add
Fs
ksiϕtt_add
11
8inif
2.70inFs
ksi
fc
ksi
ϕtt_add14
8in=if
3.50inFs
ksi
fc
ksi
ϕtt_add18
8in=if
ldb_tt_add 15 in
ldt_tt_add ldb_tt_add minc_tt_add mdec_tt_add 22.5 in
Cuttoffpoint LMc_max ldt_tt_add spacingint_max 13.2 in extension past second interior girder
Check for Cracking in Overhang under Service Limit State:
Does not govern - no live load on overhang.
25. COMPRESSION SPLICE:
See sheet S7 for drawing.
Ensure compression splice and connection can handle the compressive force in the force couple due to the negativemoment over the pier.
Live load negative moment over pier: MLLPier 541.8 kip ft
Factored LL moment: MUPier 1.75 MLLPier 948.1 kip ft
The compression splice is comprised of a splice plate on the underside of the bottom flange, and built-up angles oneither side of the web, connecting to the bottom flange as well.
Calculate Bottom Flange Stress:
Composite moment of inertia: Iz 7666.4 in4
Distance to center of bottom flange from composite section centroid:
ybf
tbf
2Dw ttf tslab yc 24 in
Stress in bottom flange: fbf MUPier
ybf
Iz
35.6 ksi
Calculate Bottom Flange Force:
Design Stress: Fbf maxfbf Fy
20.75 Fy 42.8 ksi
Effective Flange Area: Aef bbf tbf 6.4 in2
Force in Flange: Cnf Fbf Aef 274.1 kip
Calculate Bottom Flange Stress, Ignoring Concrete:
Moment of inertia: Izsteel 2798.5 in4
Distance to center of bottom flange: ybfsteel
tbf
2Dw ttf ysteel 13 in
A-158

Stress in bottom flange: fbfsteel MUPier
ybfsteel
Izsteel
52.9 ksi
Bottom Flange Force for design:
Design Stress: Fcf maxfbfsteel Fy
20.75 Fy 51.5 ksi
Design Force: Cn max Fbf Fcf Aef 329.4 kip
Compression Splice Plate Dimensions:
Bottom Splice Plate: bbsp bbf 10 in tbsp 0.75in Absp bbsp tbsp 7.5 in2
Built-Up Angle Splice PlateHorizontal Leg: basph 4.25in tasph 0.75in Aasph 2 basph tasph 6.4 in
2
Built-Up Angle Splice Plate VerticalLeg: baspv 7.75in taspv 0.75in Aaspv 2 baspv taspv 11.6 in
2
Total Area: Acsp Absp Aasph Aaspv 25.5 in2
Average Stress: fcs
Cn
Acsp
12.9 ksi
Proportion Load into each plate based on area:
Cbsp
Cn Absp
Acsp
96.9 kip Casph
Cn Aasph
Acsp
82.3 kip Caspv
Cn Aaspv
Acsp
150.2 kip
Check Plates Compression Capacity:
Bottom Splice Plate: kcps 0.75 for bolted connection
lcps 9in
rbsp
minbbsp tbsp
3
12
tbsp bbsp3
12
Absp
0.2 in
Pebsp
π2
Es Absp
kcps lcps
rbsp
22208.5 kip
Qbsp 1.0bbsp
tbsp
0.45Es
Fy
if
1.34 0.76bbsp
tbsp
Fy
Es
0.45Es
Fy
bbsp
tbsp
0.91Es
Fy
if
0.53 Es
Fy
bbsp
tbsp
2otherwise
0.919
Pobsp Qbsp Fy Absp 344.7 kip
A-159
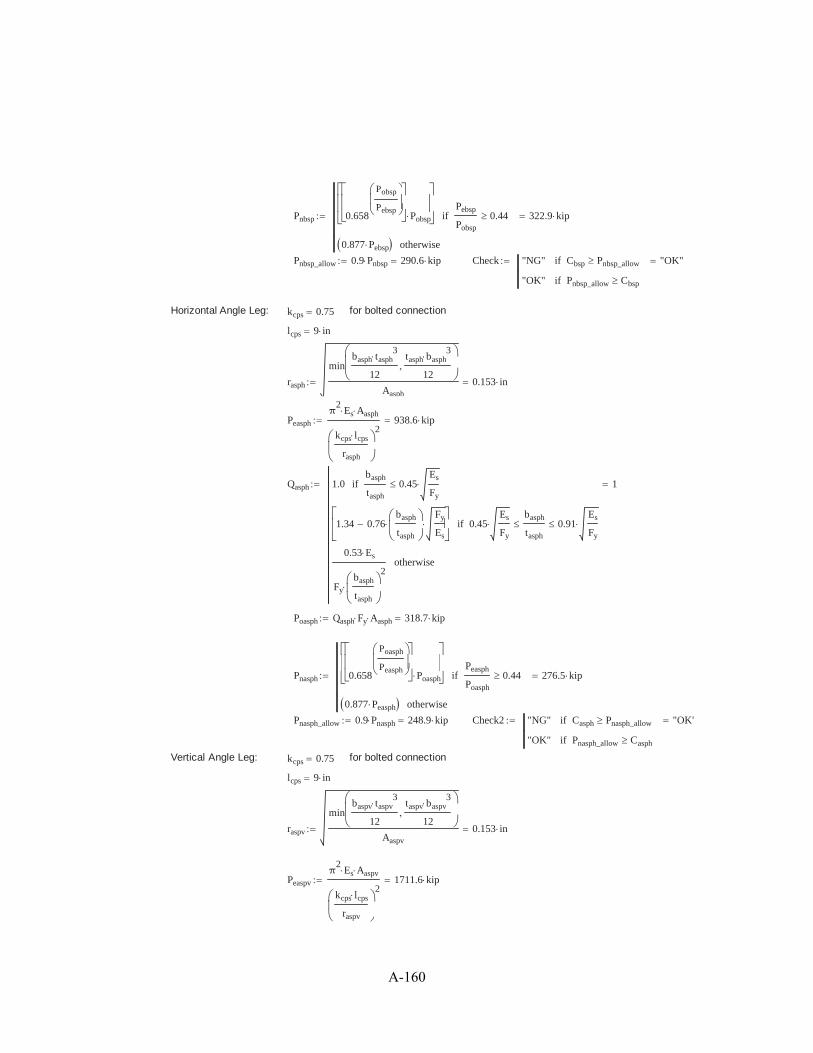
Pnbsp 0.658
Pobsp
PebspPobsp
Pebsp
Pobsp
0.44if
0.877 Pebsp otherwise
322.9 kip
Pnbsp_allow 0.9 Pnbsp 290.6 kip Check "NG" Cbsp Pnbsp_allowif
"OK" Pnbsp_allow Cbspif
"OK"
Horizontal Angle Leg: kcps 0.75 for bolted connection
lcps 9 in
rasph
minbasph tasph
3
12
tasph basph3
12
Aasph
0.153 in
Peasph
π2
Es Aasph
kcps lcps
rasph
2938.6 kip
Qasph 1.0basph
tasph
0.45Es
Fy
if
1.34 0.76basph
tasph
Fy
Es
0.45Es
Fy
basph
tasph
0.91Es
Fy
if
0.53 Es
Fy
basph
tasph
2otherwise
1
Poasph Qasph Fy Aasph 318.7 kip
Pnasph 0.658
Poasph
PeasphPoasph
Peasph
Poasph
0.44if
0.877 Peasph otherwise
276.5 kip
Pnasph_allow 0.9 Pnasph 248.9 kip Check2 "NG" Casph Pnasph_allowif
"OK" Pnasph_allow Casphif
"OK"
Vertical Angle Leg: kcps 0.75 for bolted connection
lcps 9 in
raspv
minbaspv taspv
3
12
taspv baspv3
12
Aaspv
0.153 in
Peaspv
π2
Es Aaspv
kcps lcps
raspv
21711.6 kip
A-160
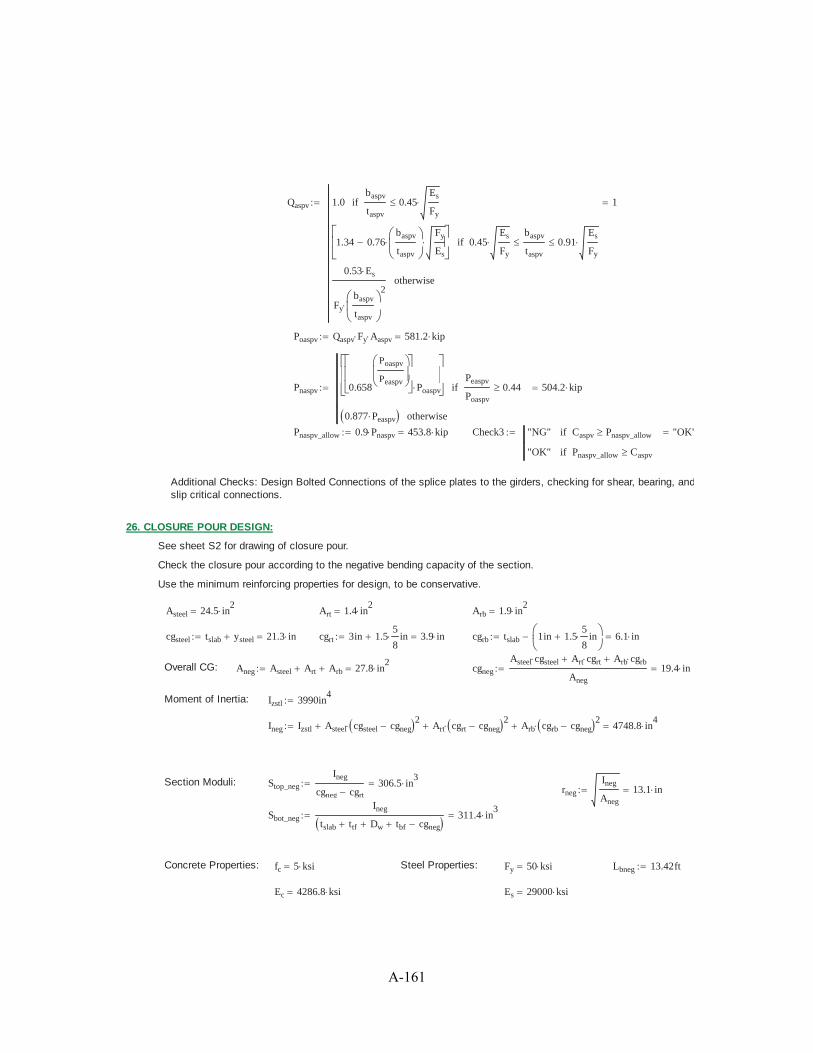
Qaspv 1.0baspv
taspv
0.45Es
Fy
if
1.34 0.76baspv
taspv
Fy
Es
0.45Es
Fy
baspv
taspv
0.91Es
Fy
if
0.53 Es
Fy
baspv
taspv
2otherwise
1
Poaspv Qaspv Fy Aaspv 581.2 kip
Pnaspv 0.658
Poaspv
PeaspvPoaspv
Peaspv
Poaspv
0.44if
0.877 Peaspv otherwise
504.2 kip
Pnaspv_allow 0.9 Pnaspv 453.8 kip Check3 "NG" Caspv Pnaspv_allowif
"OK" Pnaspv_allow Caspvif
"OK"
Additional Checks: Design Bolted Connections of the splice plates to the girders, checking for shear, bearing, andslip critical connections.
26. CLOSURE POUR DESIGN:
See sheet S2 for drawing of closure pour.
Check the closure pour according to the negative bending capacity of the section.
Use the minimum reinforcing properties for design, to be conservative.
Asteel 24.5 in2
Art 1.4 in2
Arb 1.9 in2
cgsteel tslab ysteel 21.3 in cgrt 3in 1.55
8in 3.9 in cgrb tslab 1in 1.5
5
8in 6.1 in
Overall CG: Aneg Asteel Art Arb 27.8 in2
cgneg
Asteel cgsteel Art cgrt Arb cgrb
Aneg
19.4 in
Moment of Inertia: Izstl 3990in4
Ineg Izstl Asteel cgsteel cgneg2
Art cgrt cgneg2
Arb cgrb cgneg2
4748.8 in4
Section Moduli: Stop_neg
Ineg
cgneg cgrt
306.5 in3
rneg
Ineg
Aneg
13.1 in
Sbot_neg
Ineg
tslab ttf Dw tbf cgneg
311.4 in3
Concrete Properties: fc 5 ksi Steel Properties: Fy 50 ksi Lbneg 13.42ft
Ec 4286.8 ksi Es 29000 ksi
A-161

Fyr 0.7 Fy 35 ksi
Negative Flexural Capacity:
Slenderness ratio for compressive flange: λfneg
bbf
2 tbf
7.8
Limiting ratio for compactness: λpfneg 0.38Es
Fy
9.2
Limiting ratio for noncompact λrfneg 0.56Es
Fyr
16.1
Hybrid Factor: Rh 1
Dcneg2
Dw
212.7 in awc
2 Dcneg2 tw
bbf tbf
1.8
Rb 1.0 2Dcneg2
tw
5.7Es
Fy
if
min 1.0 1awc
1200 300 awc
2Dcneg2
tw
5.7Es
Fy
otherwi
Rb 1
Flange compression resistance: Fnc1 Rb Rh Fy λfneg λpfnegif
1 1Fyr
Rh Fy
λfneg λpfneg
λrfneg λpfneg
Rb Rh Fy otherwise
Fnc1 50 ksi
Lateral Torsional Buckling Resistance: rtneg
bbf
12 1Dcneg2 tw
3 bbf tbf
2.5 in
Lpneg 1.0 rtneg
Es
Fy
60.9 in
Lrneg π rtneg
Es
Fyr
228.6 in
Cb 1
Fnc2 Rb Rh Fy Lbneg Lpnegif
min Cb 1 1Fyr
Rh Fy
Lbneg Lpneg
Lrneg Lpneg
Rb Rh Fy Rb Rh F
Fnc2 41 ksi
Compressive Resistance: Fnc min Fnc1 Fnc2 41 ksi
Tensile Flexural Resistance: Fnt Rh Fy 50 ksi For Strength
A-162

Fnt_Serv 0.95 Rh Fy 47.5 ksi For Service
Ultimate Moment Resistance: Mn_neg min Fnt Stop_neg Fnc Sbot_neg 1065.1 kip ft
MUPier 948.1 kip ft from external FE analysis
Check4 Mn_neg MUPier 1
For additional design, one may calculate the force couple at the section over the pier to find the force in theUHPC closure joint. This force can be used to design any additional reinforcement used in the joint.
A-163

DECKED PRECAST PRESTRESSED CONCRETE GIRDER DESIGN FOR ABC
Unit Definition: kcf kip ft3
This example is for the design of a superstructure system that can be used for rapid bridge replacement in an AcceleratedBridge Construction (ABC) application. The following calculations are intended to provide the designer guidance indeveloping a similar design with regard to design considerationS characteristic of this type of construction, and they shallnot be considered fully exhaustive.
Overall Width, W
Roadway Width, WrBarrierWidth, Wb Joint Width, Wj
Slope, CS
Beam Spacing, SS Wj
2
TYPICAL SECTION THROUGH SPAN
Lend Design Span Length, L
Girder Length, Lg
GIRDER ELEVATION
Bridge Geometry: L 80 ft Lend 2 ft skew 0 deg
W 63 ft Wb 1.5 ft
Smax 8 ft Wj 0.5 ft
Ng ceilW Wj
Smax
8 Minimum number of girders in cross-section
SW Wj
Ng
7.938 ft Girder spacing
File Name: Prestressed Concrete Girder-80ft.xmcd
A-164

ORDER OF CALCULATIONS
Introduction1.Design Philosophy2.Design Criteria3.Beam Section4.Material Properties5.Permanent Loads6.Precast Lifting Weight7.Live Load8.Prestress Properties9.Prestress Losses10.Concrete Stresses11.Flexural Strength12.Shear Strength13.Splitting Resistance14.Camber and Deflections15.Negative Moment Flexural Strength16.
1. INTRODUCTION
The bridge that is designed in this example consists of precast prestressed concrete girders with a top flange equal to thebeam spacing, so the top flange will be the riding surface of the designed bridge. The purpose for these girders is torapidly construct the bridge by providing a precast deck on the girders, which eliminates cast-in-place decks in the fieldand improves safety.
The concepts used in this example have been taken from on-going research, which focuses on the benefits of deckedprecast beams and promoting widespread acceptance from transportation and construction industries. The cross-sectionis adapted from the optimized girder sections recommended by NCHRP Project No. 12-69, Design and ConstructionGuidelines for Long-Span Decked Precast, Prestressed Concrete Girder Bridges. The girder design has not taken intoaccount the option to re-deck due to the final re-decked girder, without additional prestressed, having a shorter life span.Use of stainless steal rebar and the application of a future membrane can get ride of the need to replace the deck. Thiscase is included in “re-deckability”.
The bridge used in this example is a general design of a typical bridge in Georgia. The calculations can be modified forsingle-span and multiple-span bridges due to the beam design moments are not reduced for continuity at intermediatesupports (continuity details are not shown in this example). The cross-section consists of a four-lane roadway withnormal crown, with standard shoulder lengths and barrier walls. The precast prestressed concrete girder has beenuniformly designed to simplify bearing details. The girder flanges are 9’’ at the tips, imitating a 8’’ slab with a ½’’ allowablewear and another ½’’ for smoothness and profile adjustments.
This example is intended to illustrate design aspect specific to precast prestressed concrete girders used for ABCapplication. Girders with uncommon cross-sections, high self-weight, or unconventional load application create majorconcerns and more detailed calculations must be done.
A-165
2. DESIGN PHILOSOPHY
The geometry of the section is based on GDOT standards and general bridges across the state of Georgia. Depthvariations are dependent on the construction company but must maintain the shapes of the top flange and the bottombulb.
Concrete strengths can vary but are mostly between 6 ksi and 10 ksi. For the purpose of these calculations theconcrete with a 28-day minimum compressive strength of 8 ksi is used. Due to its casting sequence this beam isunable to take advantage of composite sequences along with tension at the bottom of the beam at the service limit statebeing limited. This is further discussed in section 4 along with end region stresses being critical. Therefore theminimum concrete strength at release must be 80 percent of the 28-day compressive strength, which increases theallowable stresses at the top and bottom of the section. The prestressed steel can also be optimized to minimizestresses at the end region.
The prestressed steel is arranged in a draped, or harped, pattern to maximize the midspan effectiveness while itminimizes the failure at the end of the beam where is concrete is easily overstressed due to the lack of dead load actingon the beam. The strand group is optimized at the midspan by bundling the strands between hold-points, maximizingthe stiffness of the strand group. The number and deflection angles are depended on the type of single strands you areusing for the girder. In longer span cases the concrete at the end of the girder will be too large and will debond. Withoutharped strands it is unlikely to reduce stresses to the allowable limit, since harped strands are required this method ofstress relief will be used without debonding for long spans.
3. DESIGN CRITERIA
Criteria has been selected to govern the design of these concrete girders while following provisions set by AASHTO,GDOT design specifications, as well as criteria of past projects and current research related to ABC and decked precastsections. A summary of the limiting design values are categorized as section constraints, prestress limits, and concretelimits.
Section Constraints:
Wpc.max 200 kip Upper limit on the weight of the entire precast element, based on common lifting andtransport capabilities without significantly increasing time and/or cost due tounconventional equipment or permits
Smax 8 ft Upper limit on girder spacing and, therefore, girder flange width (defined on first page)
Prestress Limits:
Fhd.single 4 kip Maximum hold-down force for a single strand
Fhd.group 48 kip Maximum hold-down force for the group of harped strands
Stress limits in the prestressing steel immediately prior to prestress and at the service limit state after all losses are asprescribed by AASHTO LRFD.
A-166

3. DESIGN CRITERIA (cont'd)
Concrete Limits:
Allowable concrete stresses meet standards set by AASHTO LRFD with one exception that at Service III Limit State,allowable bottom fiber tension when camber leveling forces are to be neglected, regardless of exposure, are to be 0-ksi.Minimum strength of concrete at release is 80 percent of the 28-day minimum compressive strength (f-ksi).
ft.all.ser 0 ksi Allowable bottom fiber tension at the Service III Limit State, when camber levelingforces are to be neglected, regardless of exposure
As previously mentioned, release concrete strength is specified as 80 percent of the minimum 28-day compressivestrength to maximize allowable stresses in the end region of beam at release.
fc.rel f( ) 0.80 f Minimum strength of concrete at release
Due to various lifting and transportation conditions, stresses in the concrete need to be considered. A “no cracking”approach is used for allowable tension due to reduced lateral stability after cracking. Assuming the girders will be liftedbefore the 28-day minimum strength is attained, the strength of concrete during lifting and transportation is assumed to be90 percent of the 28-day minimum compressive strength. A dynamic dead load allowance of 30 percent is used forcompression during handling. A factor of safety (FS) of 1.5 is used against cracking during handling.
DIM 30% Dynamic dead load allowance
fc.erec f( ) 0.90 f Assumed attained concrete strength during lifting and transportation
FSc 1.5 Factor of safety against cracking during lifting transportation
ft.erec f( )0.24 f ksi
FSc
Allowable tension in concrete during lifting and transportation to avoid cracking
A-167

b1
b2
b3
bn+1
bn
bn-1
bn-2
dn
dn-1
dn-2
d1
d2
TYPICAL GIRDER SECTION COMPRISED
OF n TRAPEZOIDAL REGIONS
y
x
4. BEAM SECTION
Use trapezoidal areas to define the cross-section. The flange width is defined as the beam spacing less the width of thelongitudinal closure joint to reflect pre-erection conditions. Live load can be conservatively applied to this section, as well.
h 49.5 in Beam section depth
tflange 9 in Flange thickness at tip
tsac 1 in Total sacrificial depth for grinding and wear
b1
26 in b2
26 in d1
6 in
b2
26 in b3
6 in d2
4.5 in
b3
6 in b4
6 in
b4
6 in b5
10 in d4
2 in
b5
10 in b6
42 in d5
2 in
b6
42 in b7
S Wj d6
0 in
b7
89.25 in b8
S Wj d7
tflange tsac
d3
h tsac d d3
26 in
Gross Section Properties
bf 89.25 in Precast girder flange width
Ag 1166 in2 Cross-sectional area (does not include sacrifical thickness)
Ixg 310192 in4 Moment of inertia (does not include sacrificial thickness)
ytg 14.938 in ybg 33.562 in Top and bottom fiber distances from neutal axis (positive up)
Stg 20765.3 in3
Sbg 9242.4 in3 Top and bottom section moduli
Iyg 487758 in4 Weak-axis moment of inertia
50 40 30 20 10 0 10 20 30 40 502
4.687
11.375
18.062
24.75
31.437
38.125
44.812
51.5GIRDER SECTION PLOT (N.T.S.)
A-168
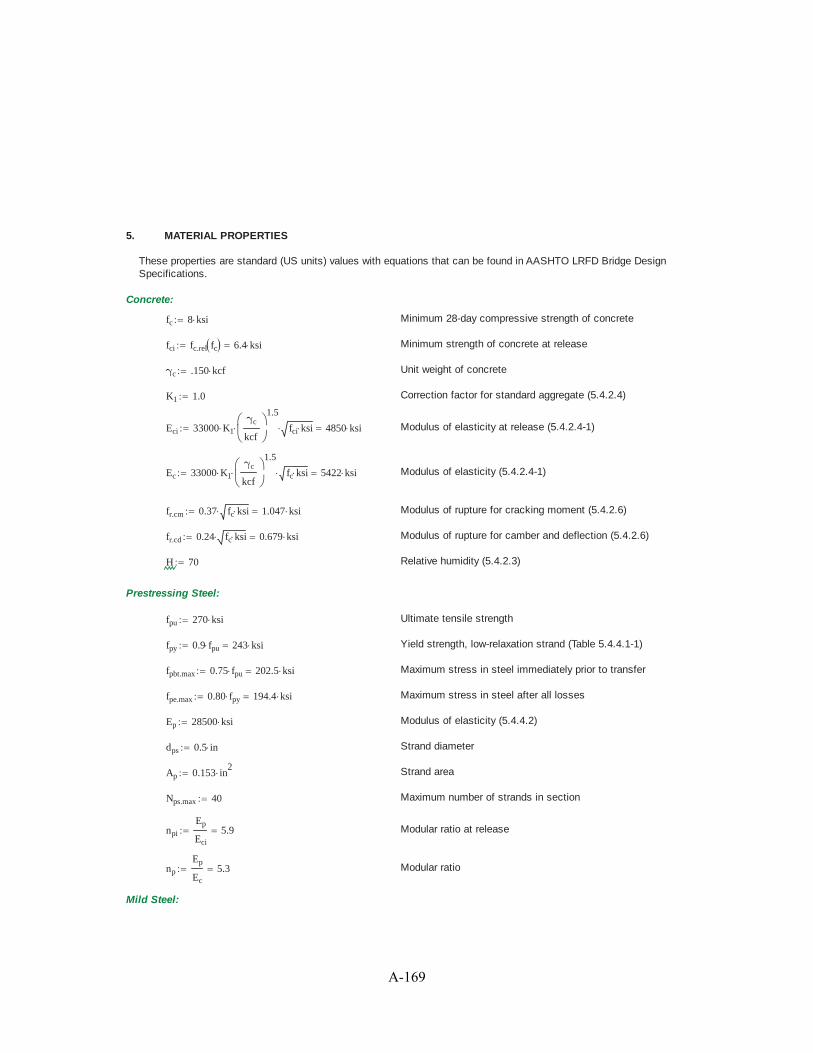
5. MATERIAL PROPERTIES
These properties are standard (US units) values with equations that can be found in AASHTO LRFD Bridge DesignSpecifications.
Concrete:
fc 8 ksi Minimum 28-day compressive strength of concrete
fci fc.rel fc 6.4 ksi Minimum strength of concrete at release
γc .150 kcf Unit weight of concrete
K1 1.0 Correction factor for standard aggregate (5.4.2.4)
Eci 33000 K1
γc
kcf
1.5
fci ksi 4850 ksi Modulus of elasticity at release (5.4.2.4-1)
Ec 33000 K1
γc
kcf
1.5
fc ksi 5422 ksi Modulus of elasticity (5.4.2.4-1)
fr.cm 0.37 fc ksi 1.047 ksi Modulus of rupture for cracking moment (5.4.2.6)
fr.cd 0.24 fc ksi 0.679 ksi Modulus of rupture for camber and deflection (5.4.2.6)
H 70 Relative humidity (5.4.2.3)
Prestressing Steel:
fpu 270 ksi Ultimate tensile strength
fpy 0.9 fpu 243 ksi Yield strength, low-relaxation strand (Table 5.4.4.1-1)
fpbt.max 0.75 fpu 202.5 ksi Maximum stress in steel immediately prior to transfer
fpe.max 0.80 fpy 194.4 ksi Maximum stress in steel after all losses
Ep 28500 ksi Modulus of elasticity (5.4.4.2)
dps 0.5 in Strand diameter
Ap 0.153 in2 Strand area
Nps.max 40 Maximum number of strands in section
npi
Ep
Eci
5.9 Modular ratio at release
np
Ep
Ec
5.3 Modular ratio
Mild Steel:
A-169

fy 60 ksi Specified minimum yield strength
Es 29000 ksi Modulus of elasticity (5.4.3.2)
A-170

6. PERMANENT LOADS
Permanent loads or dead loads that must be considered are self-weight, diaphragms, barriers, and future wearing surface.The barrier can be cast to the beam before it is taken on sight or attached to the bridge after the joints have reachedsufficient strength. Distribution of the barriers weight should be established once you decide when it would be attached tothe bridge. For this example the barrier has been cast on the exterior girder in the casting yard, before shipping but afterrelease of prestresses. Due to this the dead load is increased on the exterior girders but it eliminates the time-consumingtask that would have been completed in the field.
BeamLoc 1 Location of beam within the cross-section (0 - Interior, 1 - Exterior)
Load at Release:
γc.DL .155 kcf Concrete density used for weight calculations
Ag.DL Ag tsac S Wj 1255.25 in2 Area used for weight calculations, including sacrificial thickness
wg Ag.DL γc.DL 1.351 klf Uniform load due to self-weight, including sacrificial thickness
Lg L 2 Lend 84 ft Span length at release
Mgr x( )wg x
2Lg x Moment due to beam self-weight (supported at ends)
Vgr x( ) wg
Lg
2x Shear due to beam self-weight (supported at ends)
Load at Erection:
Mg x( )wg x
2L x( ) Moment due to beam self-weight
Vg x( ) wgL
2x Shear due to beam self-weight
wbar 0.430 klf Uniform load due to barrier weight, exterior beams only
wbar if BeamLoc 1= wbar 0 0.43 klf Redfine to 0 if interior beam (BeamLoc = 0)
Mbar x( )wbar x
2L x( ) Moment due to beam self-weight
Vbar x( ) wbarL
2x Shear due to beam self-weight
A-171

6. PERMANENT LOADS (cont'd)
Load at Service:
pfws 25 psf Assumed weight of future wearing surface
wfws pfws S 0.198 klf Uniform load due to future wearing surface
Mfws x( )wfws x
2L x( ) Moment due to future wearing surface
Vfws x( ) wfwsL
2x Shear due to future wearing surface
wj Wj d7γc.DL 0.052 klf Uniform load due to weight of longitudinal closure joint
Mj x( )wj x
2L x( ) Moment due to longitudinal closure joint
Vj x( ) wjL
2x Shear due to longitudinal closure joint
A-172

7. PRECAST LIFTING WEIGHT
For Accelerated Bridge Construction the beams are casted in a factory and transported to the job site. When theyarrive at the site they must be lifted and put into place. When designing we have to consider the weight of each slab toinsure safety and design for possible cracking.
Precast Superstructure
Wg wg wbar Lg 149.6 kip Precast girder, including barrier if necessary
Substructure Precast with Superstructure
Lcorb 1 ft Length of approach slab corbel
Bcorb bf bf 89.25 in Width of corbel cast with girder
Dcorb 1.5 ft Average depth of corbel
Vcorb Lcorb Bcorb Dcorb 11.16 ft3 Volume of corbel
Lia 2.167 ft Length of integral abutment
Lgia 1.167 ft Length of girder embedded in integral abutment
Bia S Wj 7.438 ft Width of integral abutment cast with girder
Dia h 4 in 53.5 in Depth of integral abutment
Via Vcorb Lia Bia Dia Ag tflange bf Lgia 80.07 ft3 Volume of integral abutment cast with girder
Wia Via γc 12 kip Weight of integral abutment cast with girder
Lsa 2.167 ft Length of semi-integral abutment
Lgsa 4 in Length of girder embedded in semi-integral abutment
Bsa S Wj 7.438 ft Width of semi-integral abutment cast with girder
Dsa h 16 in 65.5 in Depth of semi-integral abutment
Vsa Vcorb Lsa Bsa Dsa Ag tflange bf Lgsa 98.29 ft3 Volume of semi-integral abutment cast with girder
Wsa Vsa γc 15 kip Weight of semi-integral abutment cast with girder
A-173

Semi-Integral Abutment Backwall Integral Abutment Backwall
A-174

8. LIVE LOAD
When considering Live Loads you must refer to the vertical load section HL-93 in the AASHTO manual. If the project youare working on requires the bridge to support construction loads at any stage, these loads must be considered separatelyand applied. The longitudinal joints are designed for full moment connections so the beams will act as a unit whensufficiently connected. The distribution factors are then computed for cross-section type “j” (defined in AASHTO 4.6.2.2).When calculating the stiffness parameter, the constant- depth region at the top flange is treated like the slab and theremaining area of the beam will be considered a non-composite beam.
Definitions:
Ibb = moment of inertia of section below the top flange
Abb = area of beam section below the top flange
ybb = distance of top fiber below the top flange from neutral axis
ts = thickness of slab not including sacrificial thickness
Distribution Factors for Moment:
From Table 4.6.2.2.2b-1 for moment in interior girders,
Ibb 86022 in4 Moment of inertia of section below the top flange
Abb 452 in2 Area of beam section below the top flange
eg h tsac
ts
2ybb 28.216 in Distance between c.g.'s of beam and flange
Kg 1.0 Ibb Abb eg2
445885 in4 Longitudinal stiffness parameter (Eqn. 4.6.2.2.1-1)
Verify this girder design is within the range of applicability for Table 4.6.2.2.2b-1.
CheckMint if S 16 ft( ) S 3.5 ft( ) ts 4.5 in ts 12.0 in L 20 ft( ) L 240 ft( ) "OK" "No Good"
CheckMint if CheckMint "OK"=( ) Ng 4 Kg 10000 in4
Kg 7000000 in4
"OK" "No Good"
CheckMint "OK"
gmint1 0.06S
14 ft
0.4S
L
0.3 Kg
L ts3
0.1
0.455 Single loaded lane
gmint2 0.075S
9.5 ft
0.6S
L
0.2 Kg
L ts3
0.1
0.635 Two or more loaded lanes
gmint max gmint1 gmint2 0.635 Distribution factor for moment at interior beams
A-175

8. LIVE LOAD (cont'd)
From Table 4.6.2.2.2d-1 for moment in exterior girders,
Distance from centerline of exterior beam to edgeof curb or barrierde
S
2Wb 29.625 in
CheckMext if de 1 ft de 5.5 ft Ng 4 "OK" "No Good" "OK"
For a single loaded lane, use the Lever Rule.
gmext1
S 0.5 bf Wb 5 ft
S0.65 Single loaded lane
em 0.77de
9.1 ft1.041 Correction factor for moment (Table 4.6.2.2.2d-1)
gmext2 em gmint 0.661 Two or more loaded lanes
gmext max gmext1 gmext2 0.661 Distribution factor for moment at exterior beams
Distribution Factors for Shear:
From Table 4.6.2.2.3a-1 for shear in interior girders,
Verify this girder design is within the range of applicability for Table 4.6.2.2.3a-1.
CheckVint if S 16 ft( ) S 3.5 ft( ) ts 4.5 in ts 12.0in L 20 ft( ) L 240 ft( ) "OK" "No Good"
CheckVint if CheckMint "OK"=( ) Ng 4 "OK" "No Good"
CheckVint "OK"
gvint1 0.36S
25 ft0.678 Single loaded lane
gvint2 0.2S
12 ft
S
35 ft
2.0
0.81 Two or more loaded lanes
gvint max gvint1 gvint2 0.81 Distribution factor for shear at interior beams
A-176

8. LIVE LOAD (cont'd)
From Table 4.6.2.2.3b-1 for shear in exterior girders,
For a single loaded lane, use the Lever Rule.
CheckVext if de 1 ft de 5.5 ft Ng 4 "OK" "No Good" "OK"
g1
S 0.5 bf Wb 5 ft
S0.65 Single loaded lane (same as for moment)
Correction factor for shear (Table 4.6.2.2.3b-1)ev 0.6
de
10 ft0.847
g2 ev gvint 0.686 Two or more loaded lanes
gvext max g1 g2 0.686 Distribution factor for shear at exterior beams
From Table 4.6.2.2.3c-1 for skewed bridges,
θ skew 0 deg
CheckSkew if θ 60 deg( ) 3.5 ft S 16 ft( ) 20 ft L 240 ft( ) Ng 4 "OK" "No Good" "OK"
cskew 1.0 0.20L ts
3
Kg
0.3
tan θ( ) 1.00 Correction factor for skew
A-177

8. LIVE LOAD (cont'd)
Design Live Load Moment at Midspan:
wlane 0.64 klf Design lane load
Ptruck 32 kip Design truck axle load
IM 33% Dynamic load allowance (truck only)
Mlane x( )wlane x
2L x( ) Design lane load moment
Influence coefficient for truck moment calculationδ x( )
x L x2
L
Mtruck x( ) Ptruck δ x( ) max9 x L x( ) 14 ft 3 x L( )
4 x L x( )
9 L x( ) 84 ft
4 L x( )Design truck moment
MHL93 x( ) Mlane x( ) 1 IM( ) Mtruck x( ) HL93 design live load moment per lane
Mll.i x( ) MHL93 x( ) gmint Design live load moment at interior beam
Mll.e x( ) MHL93 x( ) gmext Design live load moment at exterior beam
Mll x( ) if BeamLoc 1= Mll.e x( ) Mll.i x( ) Design live load moment
Design Live Load Shear:
Vlane x( ) wlaneL
2x Design lane load shear
Vtruck x( ) Ptruck9 L 9 x 84 ft
4 LDesign truck shear
VHL93 x( ) Vlane x( ) 1 IM( ) Vtruck x( ) HL93 design live load shear
Vll.i x( ) VHL93 x( ) gvint Design live load shear at interior beam
Vll.e x( ) VHL93 x( ) gvext Design live load shear at exterior beam
Vll x( ) if BeamLoc 1= Vll.e x( ) Vll.i x( ) Design live load shear
A-178
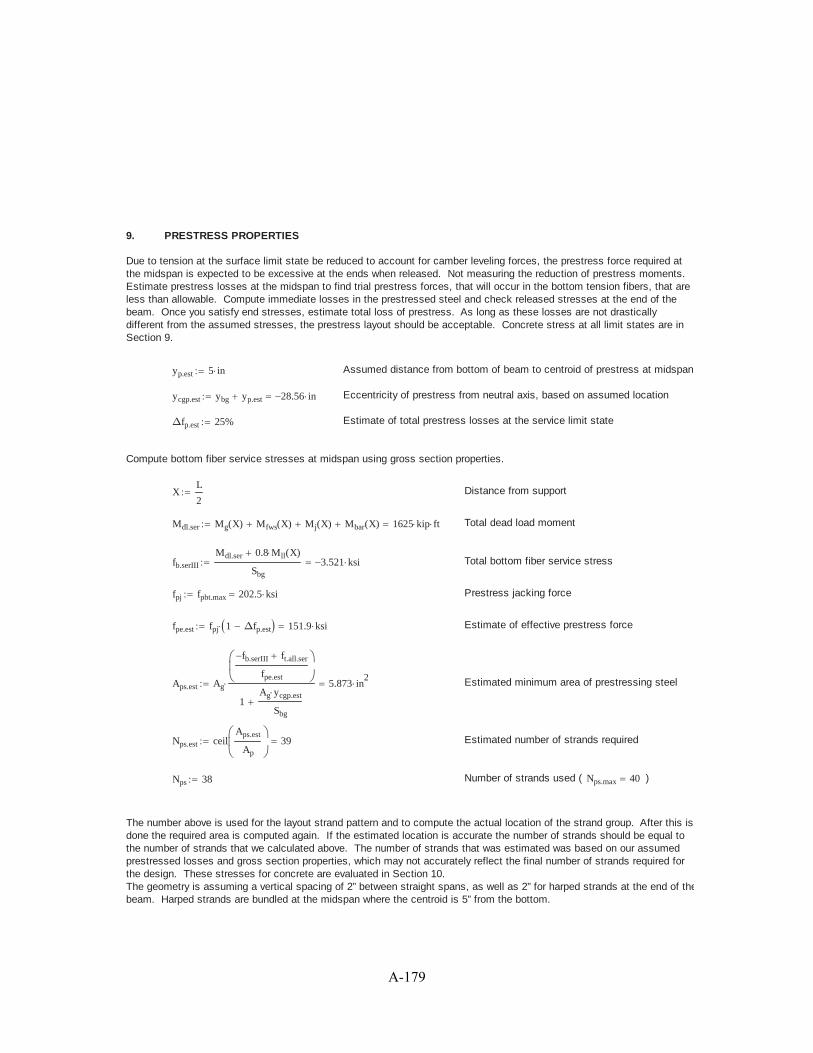
9. PRESTRESS PROPERTIES
Due to tension at the surface limit state be reduced to account for camber leveling forces, the prestress force required atthe midspan is expected to be excessive at the ends when released. Not measuring the reduction of prestress moments.Estimate prestress losses at the midspan to find trial prestress forces, that will occur in the bottom tension fibers, that areless than allowable. Compute immediate losses in the prestressed steel and check released stresses at the end of thebeam. Once you satisfy end stresses, estimate total loss of prestress. As long as these losses are not drasticallydifferent from the assumed stresses, the prestress layout should be acceptable. Concrete stress at all limit states are inSection 9.
yp.est 5 in Assumed distance from bottom of beam to centroid of prestress at midspan
ycgp.est ybg yp.est 28.56 in Eccentricity of prestress from neutral axis, based on assumed location
Δfp.est 25% Estimate of total prestress losses at the service limit state
Compute bottom fiber service stresses at midspan using gross section properties.
XL
2Distance from support
Mdl.ser Mg X( ) Mfws X( ) Mj X( ) Mbar X( ) 1625 kip ft Total dead load moment
fb.serIII
Mdl.ser 0.8 Mll X( )
Sbg
3.521 ksi Total bottom fiber service stress
fpj fpbt.max 202.5 ksi Prestress jacking force
fpe.est fpj 1 Δfp.est 151.9 ksi Estimate of effective prestress force
Aps.est Ag
fb.serIII ft.all.ser
fpe.est
1Ag ycgp.est
Sbg
5.873 in2 Estimated minimum area of prestressing steel
Nps.est ceilAps.est
Ap
39 Estimated number of strands required
Nps 38 Number of strands used ( Nps.max 40 )
The number above is used for the layout strand pattern and to compute the actual location of the strand group. After this isdone the required area is computed again. If the estimated location is accurate the number of strands should be equal tothe number of strands that we calculated above. The number of strands that was estimated was based on our assumedprestressed losses and gross section properties, which may not accurately reflect the final number of strands required forthe design. These stresses for concrete are evaluated in Section 10. The geometry is assuming a vertical spacing of 2” between straight spans, as well as 2” for harped strands at the end of thebeam. Harped strands are bundled at the midspan where the centroid is 5” from the bottom.
A-179

9. PRESTRESS PROPERTIES (cont'd)
Nh 2 Nps 12if
4 12 Nps 24if
6 24 Nps 30if
6 Nps 30 Nps 30if
Nh 14 Assumes all flange rows are filled prior to fillingrows in web above the flange, which maximizedefficiency. Use override below to shift strandsfrom flange to web if needed to satisfy endstresses.
Additional harped strands in web (strands to bemoved from flange to web)Nh.add 16
16 strands or half of total strands maximumharped in webNh min Nh Nh.add 16 2 floor
Nps
4Nh 16
yh 1 in 2 in( ) 10.5 Nh 1
2yh 10 in Centroid of harped strands from bottom, equally
spaced
yhb 5 in Centroid of harped strands from bottom, bundled
Ns Nps Nh Ns 22 Number of straight strands in flange
ys 1 in 2 in Ns 10if
4 in( ) Ns 20 in
Ns
10 Ns 20if
6 in( ) Ns 60 in
Ns
20 Ns 24if
3.5 in otherwise
ys 4.273 in Centroid of straight strands from bottom
yp
Ns ys Nh yhb
Ns Nh
4.579 in Centroid of prestress from bottom at midspan
ycgp ybg yp 28.98 in Eccentricity of prestress from neutral axis
Aps.req Ag
fb.serIII ft.all.ser
fpe.est
1Ag ycgp
Sbg
5.806 in2 Estimated minimum area of prestressing steel
Nps.req ceilAps.req
Ap
38 Estimated number of strands required
CheckNps if Nps Nps.max Nps.req Nps "OK" "No Good" "OK"
Aps.h Nh Ap 2.448 in2 Area of prestress in web (harped)
Aps.s Ns Ap 3.366 in2 Area of prestress in flange (straight)
Aps Aps.h Aps.s 5.814 in2 Total area of prestress
A-180
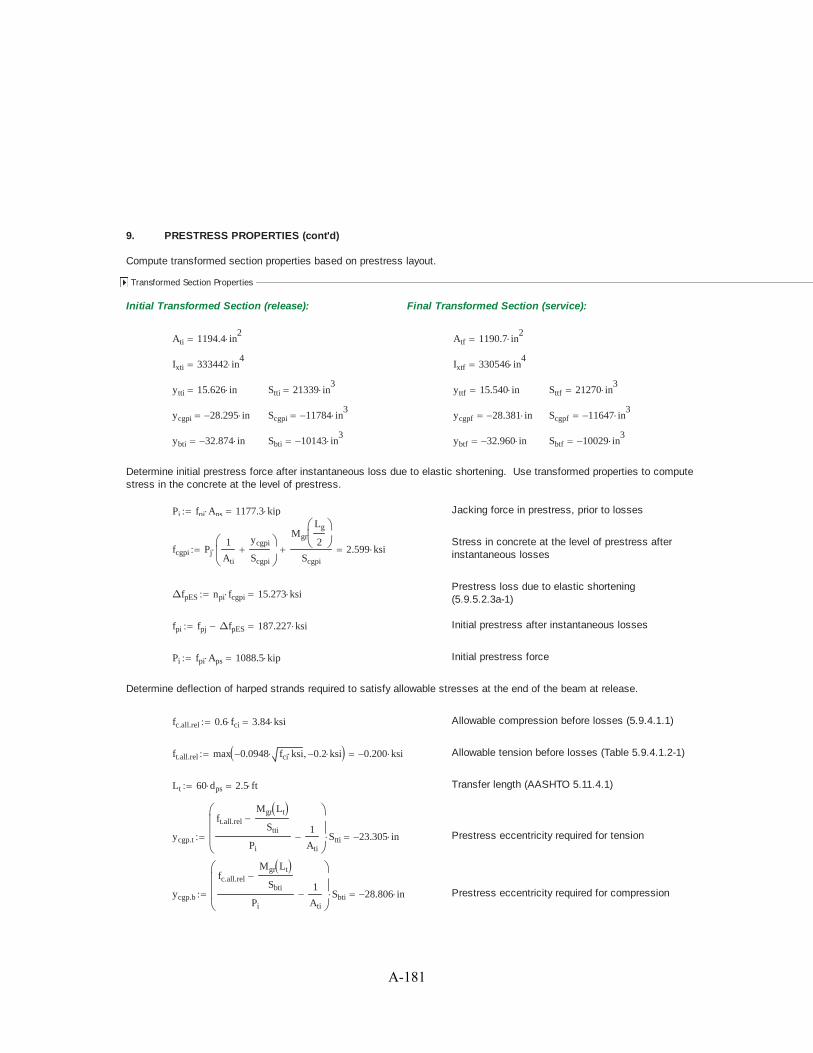
9. PRESTRESS PROPERTIES (cont'd)
Compute transformed section properties based on prestress layout.
Transformed Section Properties
Initial Transformed Section (release): Final Transformed Section (service):
Ati 1194.4 in2
Atf 1190.7 in2
Ixti 333442 in4
Ixtf 330546 in4
ytti 15.626 in Stti 21339 in3
yttf 15.540 in Sttf 21270 in3
ycgpi 28.295 in Scgpi 11784 in3
ycgpf 28.381 in Scgpf 11647 in3
ybti 32.874 in Sbti 10143 in3
ybtf 32.960 in Sbtf 10029 in3
Determine initial prestress force after instantaneous loss due to elastic shortening. Use transformed properties to computestress in the concrete at the level of prestress.
Pj fpj Aps 1177.3 kip Jacking force in prestress, prior to losses
Stress in concrete at the level of prestress afterinstantaneous lossesfcgpi Pj
1
Ati
ycgpi
Scgpi
Mgr
Lg
2
Scgpi
2.599 ksi
Prestress loss due to elastic shortening(5.9.5.2.3a-1)ΔfpES npi fcgpi 15.273 ksi
fpi fpj ΔfpES 187.227 ksi Initial prestress after instantaneous losses
Pi fpi Aps 1088.5 kip Initial prestress force
Determine deflection of harped strands required to satisfy allowable stresses at the end of the beam at release.
fc.all.rel 0.6 fci 3.84 ksi Allowable compression before losses (5.9.4.1.1)
ft.all.rel max 0.0948 fci ksi 0.2 ksi 0.200 ksi Allowable tension before losses (Table 5.9.4.1.2-1)
Lt 60 dps 2.5 ft Transfer length (AASHTO 5.11.4.1)
ycgp.t
ft.all.rel
Mgr Lt
Stti
Pi
1
Ati
Stti 23.305 in Prestress eccentricity required for tension
ycgp.b
fc.all.rel
Mgr Lt
Sbti
Pi
1
Ati
Sbti 28.806 in Prestress eccentricity required for compression
A-181

9. PRESTRESS PROPERTIES (cont'd)
ycgp.req max ycgp.t ycgp.b 23.305 in Required prestress eccentricity at end of beam
Minimum distance to harped prestress centroidfrom bottom of beam at centerline of bearingyh.brg.req
ycgp.req ybti Ns Nh ys Ns
Nh
16.852 in
Minimum distance between uppermost strand andtop of beamytop.min 18 in
αhd 0.4 Hold-down point, fraction of the design span length
Maximum slope of an individual strand to limithold-down force to 4 kips/strandslopemax if dps 0.6 in=
1
12
1
80.125
Set centroid of harped strands as high as possibleto minimize release and handling stressesyh.brg h ytop.min
0.5 Nh 1
22 in( ) 24.5 in
yh.brg min yh.brg yhb slopemax αhd L 24.5 in Verify that slope requirement is satisfied atuppermost strand
CheckEndPrestress if yh.brg yh.brg.req "OK" "Verify release stresses." "OK"
yp.brg
Ns ys Nh yh.brg
Ns Nh
12.789 in Centroid of prestress from bottom at bearing
slopecgp
yp.brg yp
αhd L0.021 Slope of prestress centroid within the harping length
ypx x( ) yp slopecgp Lend αhd L x x Lend αhd Lif
yp otherwise
Distance to center of prestress from thebottom of the beam at any position
A-182

10. PRESTRESS LOSSES
Prestressed losses can be evaluated like regular concrete, in short-term and long-term losses. When the beam is apretension girder there are instantaneous losses when the beam is shortened upon release of the prestress forces.Time-dependent losses happen when the beam is under creep and shrinkage of the beam concrete, creep and shrinkage othe deck concrete, and the relaxation of prestressed steel. These long term effects are separated into two stages thatrepresent significant events in bridge construction. The first stage is the time between transfer of the prestress forces andplacement of the decked beam and the second is the period of time between placement of the deck and the final serviceload. For decked beams the computation of long-term losses is slightly simplified due to the cross-section not changingbetween the two stages and the shrinkage term of the deck concrete is eliminated since the deck and beam being casttogether. No losses or gains in the steel associated with deck placement after transfer.
AASHTO methods for estimating time-dependent losses: Approximate Estimate (5.9.5.3)Refined Estimate (5.9.5.4)
The Approximate method is based on systems with composite decks and is based on the following assumptions: timing ofload application, the cross-section in which the load is applied, and the ratio of dead and live loads to the total load. Theconditions for the beams to be fabricated, formed and loaded depend on conditions assumed in the development of theapproximate method. The refined method is used to estimate time-dependent losses in the prestressed steel.
Equations 5.9.5.4 are time-dependent and calculate the age-adjustment factors that effect losses using gross sectionproperties.
ti 1 Time (days) between casting and release of prestress
tb 20 Time (days) to barrier casting (exterior girder only)
td 30 Time (days) to erection of precast section, closure joint pour
tf 20000 Time (days) to end of service life
Terms and equations used in the loss calculations:
Prestressing steel factor for low-relaxation strands(C5.9.5.4.2c)KL 45
VSAg
Peri3.857 in Volume-to-surface ratio of the precast section
ks max 1.45 0.13VS
in1.0 1.00 Factor for volume-to-surface ratio (5.4.2.3.2-2)
khc 1.56 0.008 H 1.00 Humidity factor for creep (5.4.2.3.2-3)
khs 2.00 0.014 H 1.02 Humidity factor for shrinkage (5.4.2.3.3-2)
kf5
1fci
ksi
0.676 Factor for effect of concrete strength (5.4.2.3.2-4)
A-183

10. PRESTRESS LOSSES (cont'd)
ktd t( )t
61 4fci
ksit
Time development factor (5.4.2.3.2-5)
ψ t tinit 1.9 ks khc kf ktd t( ) tinit0.118 Creep coefficient (5.4.2.3.2-1)
εsh t( ) ks khs kf ktd t( ) 0.48 103 Concrete shrinkage strain (5.4.2.3.3-1)
Time from Transfer to Erection:
Eccentricity of prestress force with respect to the neutral axis of thegross non-composite beam, positive below the beam neutral axisepg yp ybg 28.983 in
Stress in the concrete at the center prestressimmediately after transferfcgp Pi
1
Ag
epg2
Ixg
MgL
2
Ixg
yp ybg 2.669 ksi
fpt max fpi 0.55 fpy 187.227 ksi Stress in strands immediately after transfer (5.9.5.4.2c-1)
ψbid ψ td ti 0.589 Creep coefficient at erection due to loading at transfer
ψbif ψ tf ti 1.282 Creep coefficient at final due to loading at transfer
εbid εsh td ti 1.490 104 Concrete shrinkage between transfer and erection
Kid1
1 npi
Aps
Ag
1Ag epg
2
Ixg
1 0.7 ψbif
0.812 Age-adjusted transformed section coefficient(5.9.5.4.2a-2)
ΔfpSR εbid Ep Kid 3.449 ksi Loss due to beam shrinkage(5.9.5.4.2a-1)
ΔfpCR npi fcgp ψbid Kid 7.504 ksi Loss due to creep(5.9.5.4.2b-1)
ΔfpR1
fpt
KL
log 24 td
log 24 ti
fpt
fpy
0.55 13 ΔfpSR ΔfpCR
fpt
Kid 1.272 ksi Loss due to relaxation(C5.9.5.4.2c-1
Δfpid ΔfpSR ΔfpCR ΔfpR1 12.224 ksi
A-184
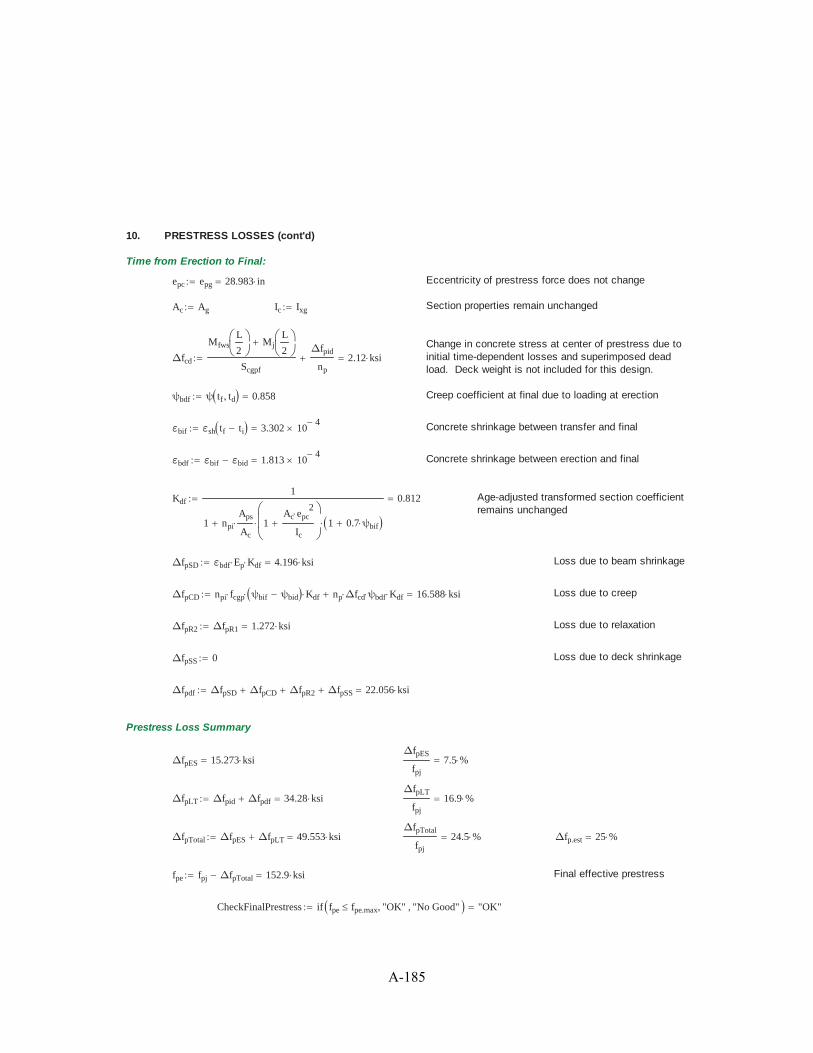
10. PRESTRESS LOSSES (cont'd)
Time from Erection to Final:
epc epg 28.983 in Eccentricity of prestress force does not change
Ac Ag Ic Ixg Section properties remain unchanged
Change in concrete stress at center of prestress due toinitial time-dependent losses and superimposed deadload. Deck weight is not included for this design.
Δfcd
MfwsL
2Mj
L
2
Scgpf
Δfpid
np
2.12 ksi
ψbdf ψ tf td 0.858 Creep coefficient at final due to loading at erection
εbif εsh tf ti 3.302 104 Concrete shrinkage between transfer and final
εbdf εbif εbid 1.813 104 Concrete shrinkage between erection and final
Kdf1
1 npi
Aps
Ac
1Ac epc
2
Ic
1 0.7 ψbif
0.812 Age-adjusted transformed section coefficientremains unchanged
ΔfpSD εbdf Ep Kdf 4.196 ksi Loss due to beam shrinkage
ΔfpCD npi fcgp ψbif ψbid Kdf np Δfcd ψbdf Kdf 16.588 ksi Loss due to creep
ΔfpR2 ΔfpR1 1.272 ksi Loss due to relaxation
ΔfpSS 0 Loss due to deck shrinkage
Δfpdf ΔfpSD ΔfpCD ΔfpR2 ΔfpSS 22.056 ksi
Prestress Loss Summary
ΔfpES 15.273 ksiΔfpES
fpj
7.5 %
ΔfpLT Δfpid Δfpdf 34.28 ksiΔfpLT
fpj
16.9 %
ΔfpTotal ΔfpES ΔfpLT 49.553 ksiΔfpTotal
fpj
24.5 % Δfp.est 25 %
fpe fpj ΔfpTotal 152.9 ksi Final effective prestress
CheckFinalPrestress if fpe fpe.max "OK" "No Good" "OK"
A-185
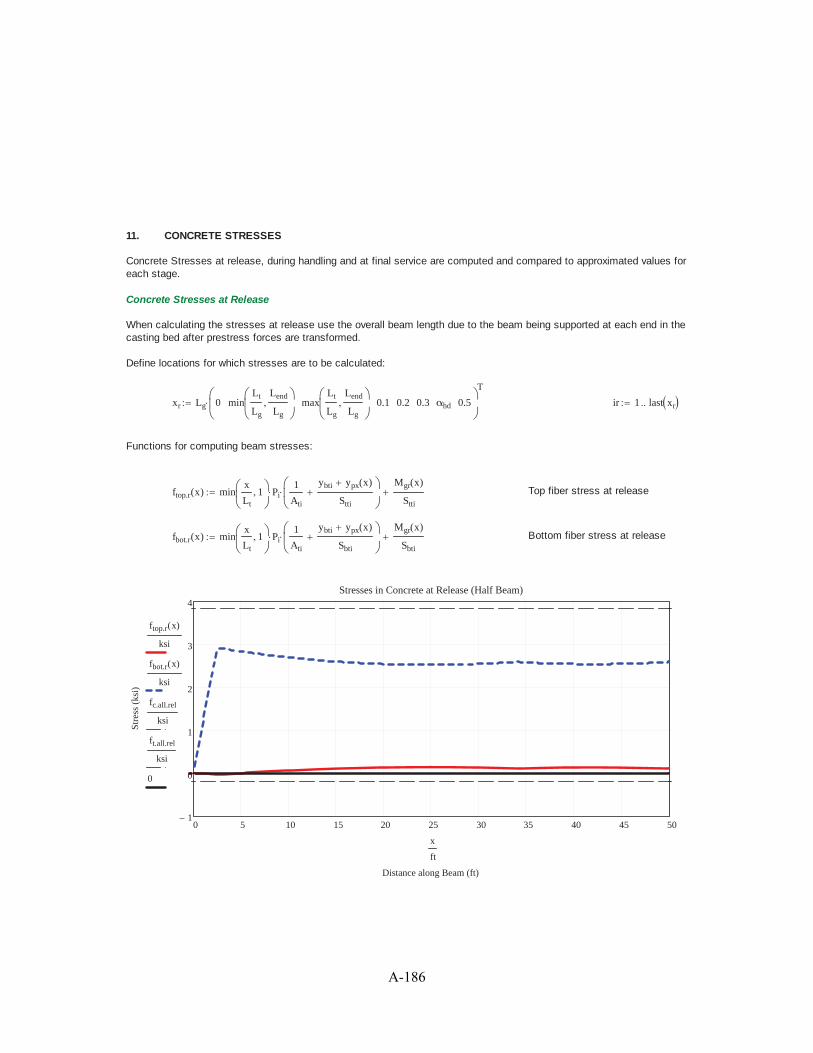
11. CONCRETE STRESSES
Concrete Stresses at release, during handling and at final service are computed and compared to approximated values foreach stage.
Concrete Stresses at Release
When calculating the stresses at release use the overall beam length due to the beam being supported at each end in thecasting bed after prestress forces are transformed.
Define locations for which stresses are to be calculated:
xr Lg 0 minLt
Lg
Lend
Lg
maxLt
Lg
Lend
Lg
0.1 0.2 0.3 αhd 0.5
T
ir 1 last xr
Functions for computing beam stresses:
ftop.r x( ) minx
Lt
1 Pi1
Ati
ybti ypx x( )
Stti
Mgr x( )
Stti
Top fiber stress at release
fbot.r x( ) minx
Lt
1 Pi1
Ati
ybti ypx x( )
Sbti
Mgr x( )
Sbti
Bottom fiber stress at release
0 5 10 15 20 25 30 35 40 45 501
0
1
2
3
4Stresses in Concrete at Release (Half Beam)
Distance along Beam (ft)
Str
ess
(ksi
)
ftop.r x( )
ksi
fbot.r x( )
ksi
fc.all.rel
ksi
ft.all.rel
ksi
0
x
ft
A-186

11. CONCRETE STRESSES (cont'd)
Compare beam stresses to allowable stresses.
ft.all.rel 0.2 ksi Allowable tension at release
fc.all.rel 3.84 ksi Allowable compression at release
TopRelir
ftop.r xrir
TopRelT
0.000 0.028 0.042 0.044 0.122 0.146 0.117 0.138( ) ksi
CheckTopRel if max TopRel( ) fc.all.rel min TopRel( ) ft.all.rel "OK" "No Good" "OK"
BotRelir
fbot.r xrir
BotRelT
0.000 2.322 2.918 2.736 2.572 2.521 2.583 2.538( ) ksi
CheckBotRel if max BotRel( ) fc.all.rel min BotRel( ) ft.all.rel "OK" "No Good" "OK"
Concrete Stresses During Lifting and Transportation
Lifting and transportation stresses can govern over final stresses due to different support locations, dynamic effects thatdead load can cause during movement, bending stresses during lifting and superelevation of the roadway in shipping. Enddiaphragms on both ends are assumed. For prestressing effects, calculate the effective prestressed force losses betweentransfer and building.
a h 4.125 ft Maximum distance to lift point from bearing line
a' a Lend 6.125 ft Distance to lift point from end of beam
Pdia max Wia Wsa 14.7 kip Approximate abutment weight
Pm Pj 1ΔfpES Δfpid
fpj
1017.5 kip Effective prestress during lifting and shipping
Define locations for which stresses are to be calculated:
xe Lg 0 minLt
Lg
Lend
Lg
maxLt
Lg
Lend
Lg
a'
Lg
αhd 0.5
T
ie 1 last xe
Compute moment in the girder during lifting with supports at the lift points.
Mlift x( )wg wbar x
2
2Pdia x x a'if
Mgr x( ) Mgr a'( )wg wbar a'( )
2
2Pdia a' otherwise
A-187

11. CONCRETE STRESSES (cont'd)
Functions for computing beam stresses:
ftop.lift x( ) minx
Lt
1 Pm1
Atf
ybtf ypx x( )
Sttf
Mlift x( )
Sttf
Top fiber stress during lifting
Top fiber stress during lifting,impact increasing dead loadftop.DIM.inc x( ) min
x
Lt
1 Pm1
Atf
ybtf ypx x( )
Sttf
Mlift x( )
Sttf
1 DIM( )
Top fiber stress during lifting,impact decreasing dead loadftop.DIM.dec x( ) min
x
Lt
1 Pm1
Atf
ybtf ypx x( )
Sttf
Mlift x( )
Sttf
1 DIM( )
TopLift1ie
ftop.lift xeie
TopLift1T
0.000 0.107 0.140 0.231 0.104 0.082( ) ksi
TopLift2ie
ftop.DIM.inc xeie
TopLift2T
0.000 0.113 0.148 0.252 0.014 0.044( ) ksi
TopLift3ie
ftop.DIM.dec xeie
TopLift3T
0.000 0.101 0.133 0.210 0.223 0.209( ) ksi
fbot.lift x( ) minx
Lt
1 Pm1
Atf
ybtf ypx x( )
Sbtf
Mlift x( )
Sbtf
Bottom fiber stress during lifting
Bottom fiber stress during lifting,impact increasing dead loadfbot.DIM.inc x( ) min
x
Lt
1 Pm1
Atf
ybtf ypx x( )
Sbtf
Mlift x( )
Sbtf
1 DIM( )
Bottom fiber stress during lifting,impact decreasing dead loadfbot.DIM.dec x( ) min
x
Lt
1 Pm1
Atf
ybtf ypx x( )
Sbtf
Mlift x( )
Sbtf
1 DIM( )
BotLift1ie
fbot.lift xeie
BotLift1T
0.000 2.360 2.965 3.156 2.888 2.842( ) ksi
BotLift2ie
fbot.DIM.inc xeie
BotLift2T
0.000 2.372 2.980 3.201 2.638 2.574( ) ksi
BotLift3ie
fbot.DIM.dec xeie
BotLift3T
0.000 2.348 2.949 3.112 3.139 3.109( ) ksi
Allowable stresses during handling:
fcm fc.erec fc 7.2 ksi Assumed concrete strength when handling operations begin
fc.all.erec 0.6 fcm 4.32 ksi Allowable compression during lifting and shipping
ft.all.erec ft.erec fcm 0.429 ksi Allowable tension during lifting and shipping
A-188
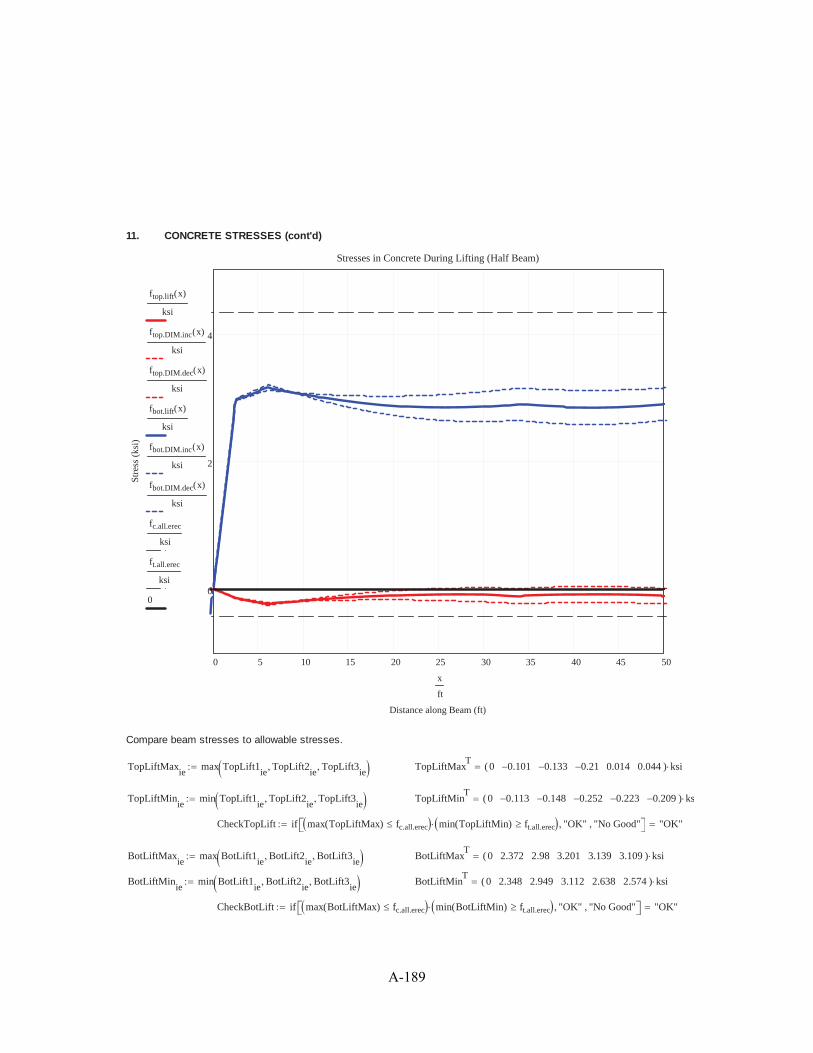
11. CONCRETE STRESSES (cont'd)
0 5 10 15 20 25 30 35 40 45 50
0
2
4
Stresses in Concrete During Lifting (Half Beam)
Distance along Beam (ft)
Str
ess
(ksi
)
ftop.lift x( )
ksi
ftop.DIM.inc x( )
ksi
ftop.DIM.dec x( )
ksi
fbot.lift x( )
ksi
fbot.DIM.inc x( )
ksi
fbot.DIM.dec x( )
ksi
fc.all.erec
ksi
ft.all.erec
ksi
0
x
ft
Compare beam stresses to allowable stresses.
TopLiftMaxie
max TopLift1ie
TopLift2ie
TopLift3ie
TopLiftMaxT
0 0.101 0.133 0.21 0.014 0.044( ) ksi
TopLiftMinie
min TopLift1ie
TopLift2ie
TopLift3ie
TopLiftMinT
0 0.113 0.148 0.252 0.223 0.209( ) ks
CheckTopLift if max TopLiftMax( ) fc.all.erec min TopLiftMin( ) ft.all.erec "OK" "No Good" "OK"
BotLiftMaxie
max BotLift1ie
BotLift2ie
BotLift3ie
BotLiftMaxT
0 2.372 2.98 3.201 3.139 3.109( ) ksi
BotLiftMinie
min BotLift1ie
BotLift2ie
BotLift3ie
BotLiftMinT
0 2.348 2.949 3.112 2.638 2.574( ) ksi
CheckBotLift if max BotLiftMax( ) fc.all.erec min BotLiftMin( ) ft.all.erec "OK" "No Good" "OK"
A-189

11. CONCRETE STRESSES (cont'd)
Concrete Stresses at Final
Stresses are calculated using design span length. The top flange compression and bottom flange under tension arecomputed at Service I and Service III states.
fc.all.ser1 0.4 fc 3.2 ksi Allowable compression due to effective prestress and dead load (Table 5.9.4.2.1-1)
Allowable compression due to effective prestress, permanent load, andtransient loads, as well as stresses during shipping and handling (Table 5.9.4.2.1-1)fc.all.ser2 0.6 fc 4.8 ksi
ft.all.ser 0 ksi Allowable tension (computed previously)
Pe fpe Aps 889.2 kip Effective prestress after all losses
Compute stresses at midspan and compare to allowable values.
ftop.ser1 x( ) minLend x
Lt
1 Pe1
Atf
ybtf ypx x( )
Sttf
Mg x Lend
Stti
Mbar x( ) Mfws x( ) Mj x( )
Sttf
ftop.ser2 x( ) minLend x
Lt
1 Pe1
Atf
ybtf ypx x( )
Sttf
Mg x Lend
Stti
Mbar x( ) Mfws x( ) Mj x( ) Mll x( )
Sttf
fbot.ser x( ) minLend x
Lt
1 Pe1
Atf
ybtf ypx x( )
Sbtf
Mg x Lend
Sbti
Mbar x( ) Mfws x( ) Mj x( ) 0.8 Mll x( )
Sbtf
0 5 10 15 20 25 30 35 40 45 50
0
2
4
6Stresses in Concrete at Service (Half Beam)
Distance along Beam (ft)
Str
ess
(ksi
)
ftop.ser1 x( )
ksi
ftop.ser2 x( )
ksi
fbot.ser x( )
ksi
ft.all.ser
ksi
fc.all.ser1
ksi
fc.all.ser2
ksi
x
ft
A-190

11. CONCRETE STRESSES (cont'd)
Compare beam stresses to allowable stresses.
xs LLt
L0.1 0.15 0.2 0.25 0.3 0.35 αhd 0.45 0.5
T
is 1 last xs
TopSer1is
ftop.ser1 xsis
TopSer1T
0.064 0.216 0.304 0.374 0.425 0.459 0.474 0.471 0.471 0.474( ) ksi
TopSer2is
ftop.ser2 xsis
TopSer2T
0.164 0.508 0.716 0.887 1.021 1.119 1.184 1.218 1.236 1.240( ) ksi
CheckCompSerI if max TopSer1( ) fc.all.ser1 max TopSer2( ) fc.all.ser2 "OK" "No Good" "OK"
BotSeris
fbot.ser xsis
BotSerT
2.028 1.381 0.993 0.675 0.426 0.246 0.131 0.075 0.044 0.036( ) ksi
CheckTenSerIII if min BotSer( ) ft.all.ser "OK" "No Good" "OK"
12. FLEXURAL STRENGTH
Confirm flexural resistance at Strength Limit State. Calculate Factored moment at midspan during Strength I loadcombination. Compare this to factored resistance in AASHTO LRFD 5.7.3.
MDC x( ) Mg x( ) Mbar x( ) Mj x( ) Self weight of components
MDW x( ) Mfws x( ) Weight of future wearing surface
MLL x( ) Mll x( ) Live load
MStrI x( ) 1.25 MDC x( ) 1.5 MDW x( ) 1.75 MLL x( ) Factored design moment
For minimum reinforcement check, per 5.7.3.3.2
fcpe Pe1
Ag
ycgp
Sbg
3.551 ksi Concrete compression at extreme fiber due toeffective prestress
Mcr fr.cm fcpe Sbg 3541 kip ft Cracking moment (5.7.3.3.2-1)
Mu x( ) max MStrI x( ) min 1.33 MStrI x( ) 1.2 Mcr Design moment
A-191

12. FLEXURAL STRENGTH (cont'd)
Compute factored flexural resistance.
β1 max 0.65 0.85 0.05fc
ksi4 0.65 Stress block factor (5.7.2.2)
k 2 1.04fpy
fpu
0.28 Tendon type factor (5.7.3.1.1-2)
Distance from compression fiber to prestresscentroiddp x( ) h ypx x Lend dp X( ) 44.921 in
hf d7
8 in Structural flange thickness
btaper
b6
b5
216 in Average width of taper at bottom of flange
htaper d5
2 in Depth of taper at bottom of flange
a x( )Aps fpu
0.85 fc bfk
β1
Aps
fpu
dp x( )
a X( ) 2.524 in Depth of equivalent stress block for rectangularsection
c x( )a x( )
β1
c X( ) 3.883 in Neutral axis location
CheckTC ifc X( )
dp X( )
.003
.003 .005"OK" "NG" "OK" Tension-controlled section check (midspan)
Resistance factor for prestressed concrete(5.5.4.2)φf min 1.0 max 0.75 0.583 0.25
dp X( )
c X( )1 1.00
fps fpu 1 kc X( )
dp X( )263.5 ksi Average stress in the prestressing steel
(5.7.3.1.1-1)
Ld1.6
ksifps
2
3fpe dps 10.767 ft Bonded strand devlepment length (5.11.4.2-1)
fpx x( )fpe x Lend
Lt
x Lt Lendif
fpe
x Lend Lt
Ld Lt
fps fpe Lt Lend x Ld Lendif
fps otherwise
Stress in prestressing steel along thelength for bonded strand (5.11.4.2)
Mr x( ) φf Aps fpx x( ) dp x( )a x( )
2Flexure resistance along the length
A-192

12. FLEXURAL STRENGTH (cont'd)
xmom L 0.01Lt Lend
L
Ld Lend
Lαhd 0.5
T
imom 1 last xmom
Mrximom
Mr xmomimom
Muximom
Mu xmomimom
DCmom
Mux
Mrx
max DCmom 0.798 Demand-Capacity ratio for moment
CheckMom if max DCmom 1.0 "OK" "No Good" "OK" Flexure resistance check
0 5 10 15 20 25 30 35 40 45 500
2000
4000
Design Moment and Flexure Resistance (Half Beam)
Distance along Beam (ft)
Mom
ent (
kip·
ft)
MStrI x( )
kip ft
1.2 Mcr
kip ft
1.33 MStrI x( )
kip ft
Mu x( )
kip ft
Mr x( )
kip ft
x
ft
A-193

13. SHEAR STRENGTH
Shear Resistance
Use Strength I load combination to calculate factored shear at the critical shear section and at tenth points along the span.Compare it to factored resistance in AASHTO LRFD 5.8.
VDC x( ) Vg x( ) Vbar x( ) Vj x( ) Self weight of components
VDW x( ) Vfws x( ) Weight of future wearing surface
VLL x( ) Vll x( ) Live load
Vu x( ) 1.25 VDC x( ) 1.5 VDW x( ) 1.75 VLL x( ) Factored design shear
Resistance factor for shear in normal weightconcrete (AASHTO LRFD 5.5.4.2)φv 0.90
dend h ypx Lend 36.711 in Depth to steel centroid at bearing
dv min 0.9 dend 0.72 h 33.039 in Effective shear depth lower limit at end
Vp x( ) Pe slopecgp
x Lend
Lt
x Lt Lendif
Pe slopecgp Lt Lend x αhd Lif
0 otherwise
Vertical component of effective prestress force
bv b3
6 in Web thickness
Shear stress on concrete (5.8.2.9-1)vu x( )
Vu x( ) φv Vp x( )
φv bv dv
Mushr x( ) max MStrI x( ) Vu x( ) Vp x( ) dv Factored moment for shear
Stress in prestressing steel due to locked-instrain after casting concretefpo 0.7 fpu 189 ksi
Steel strain at the centroid of the prestressingsteelεs x( ) max 0.4 10
3
Mu x( )
dv
Vu x( ) Vp x( ) Aps fpo
Ep Aps
β x( )4.8
1 750 εs x( )Shear resistance parameter
θ x( ) 29 3500 εs x( ) deg Principal compressive stress angle
Vc x( ) 0.0316 ksi β x( )fc
ksibv dv Concrete contribution to total shear resistance
A-194

13. SHEAR STRENGTH (cont'd)
α 90 deg Angle of inclination of transverse reinforcement
Transverse reinforcement area andspacing providedAv 1.02 0.62 0.62 0.62 0.31( )
Tin
2sv 3 6 6 12 12( )
Tin
xv 0 0.25 h 1.5 h 0.3 L 0.5 L 0.6 L( )T
xvT
0 1.031 6.187 24 40 48( ) ft
Avs x( )
outAv
i
svi
xvi
x xvi 1
if
i 1 last Avfor
out.
Vs x( ) Avs x( ) fy dv cot θ x( )( ) cot α( )( ) sin α( ) Steel contribution to total shear resistance
Vr x( ) φv Vc x( ) Vs x( ) Vp x( ) Factored shear resistance
xshr
outi
i0.5 L
100
i 1 100for
out
ishr 1 last xshr
Vuxishr
Vu xshrishr
Vrxishr
Vr xshrishr
DCshr
Vux
Vrx
max DCshr 0.822
CheckShear if max DCshr 1.0 "OK" "No Good" "OK" Shear resistance check
0 5 10 15 20 25 30 35 40 45 500
200
400
Design Shear and Resistance (Half Beam)
Distance along Beam (ft)
She
ar (
kips
) Vu x( )
kip
Vr x( )
kip
x
ft
A-195

13. SHEAR STRENGTH (cont'd)
Longitudinal Reinforcement
Al.req x( ) a1MStrI x( )
φf fpx x( ) dp x( )a x( )
2
a2
Vu x( )
φv
0.5 Vs x( ) Vp x( ) cot θ x( )( )
fpx x( )
a3
Mushr x( )
dv φf
Vu x( )
φv
Vp x( ) 0.5 Vs x( ) cot θ x( )( )
fpx x( )
min a1 a2( ) x dv 5 inif
min a1 a3( ) otherwise
Longitudinal reinforcement required forshear (5.8.3.5)
As.add 0.40 in2
Ld.add 18.67 ft Additional longitudinal steel and developed length from end of beam
Al.prov x( ) if x Ld.add Lend As.add 0 Ap Ns
x Lend
Ld
x Ld Lendif
Ap Ns Ld Lend xyh.brg 0.5 h
slopecgp
0.5 Nh 1
22 in( ) cot slopecgpif
Ap Nh Ns otherwise
0 5 10 15 20 25 30 35 40 45 500
2
4
6
Longitudinal Reinforcement Required and Provided (Half Beam)
Distance along Beam (ft)
Ste
el A
rea
(in2
) Al.req x( )
in2
Al.prov x( )
in2
x
ft
Al.reqishr
Al.req xshrishr
Al.provishr
Al.prov xshrishr
DClong
Al.req
Al.prov
max DClong 1.268
CheckLong if max DClong 1.0 "OK" "No Good" "No Good" Longitudinal reinforcement check
A-196

14. SPLITTING RESISTANCE
Splitting Resistance
Checking splitting by zone of transverse reinforcement. Defined in Shear Strength section.
As
Av1
xv2
sv1
4.208 in2
fs 20 ksi Limiting stress in steel for crack control (5.10.10.1)
Pr fs As 84.2 kip Splitting resistance provided (5.10.10.1-1)
Pr.min 0.04 Pj 47.1 kip Minimum splitting resistance required
CheckSplit if Pr Pr.min "OK" "No Good" "OK" Splitting resistance check
15. CAMBER AND DEFLECTIONS
Calculate Deflections due to different weights, joints, and future wearings.
Δps
Pi
Eci Ixg
ycgp Lg2
8
ybg yp.brg αhd L Lend2
62.246 in Deflection due to prestress at release
Δgr5
384
wg Lg4
Eci Ixg
1.006 in Deflection due to self-weight at release
Δbar5
384
wbar Lg4
Ec Ixg
0.286 in Deflection due to barrier weight
2Δj
5
384
wj L4
Ec Ixg
if BeamLoc 0= 1 0.5( ) 0.014 in Deflection due to longitudinal joint
Δfws5
384
wfws L4
Ec Ixg
if BeamLoc 0= 1S Wb
S0.088 in Deflection due to future wearing surface
tbar 20 Age at which barrier is assumed to be cast
T ti 7 14 21 28 60 120 240 ∞T Concrete ages at which camber is computed
A-197

15. CAMBER AND DEFLECTIONS (cont'd)
Δcr1 t( ) ψ t ti ti Δgr Δps
Δcr2 t( ) ψ t ti ti ψ tbar ti ti Δgr Δps ψ t tbar tbar Δbar
Δcr3 t( ) ψ t ti ti ψ td ti ti Δgr Δps ψ t tbar tbar ψ td tbar tbar Δbar
ψ t td td Δj
Δcr t( ) Δcr1 t( ) t tbarif
Δcr1 tbar Δcr2 t( ) tbar t tdif
Δcr1 tbar Δcr2 td Δcr3 t( ) t tdif
Defl t( ) Δgr Δps Δcr1 t( ) t tbarif
Δgr Δps Δcr1 tbar Δbar Δcr2 t( ) tbar t tdif
Δgr Δps Δcr1 tbar Δbar Δcr2 td Δj Δcr3 t( ) t tdif
C
outj
Defl Tj
j 1 last T( )for
out
CT
1.24 1.471 1.668 1.522 1.595 1.793 1.968 2.094 2.262( ) in
0 20 40 600
1
2
360-Day Deflection at Midspan
Age of Concrete (days)
Def
lect
ion
(in) Δcr t( )
in
Defl t( )
in
t
0 500 1000 1500 20000
1
2
3Long-term Deflection at Midspan
Age of Concrete (days)
Def
lect
ion
(in) Δcr t( )
in
Defl t( )
in
t
A-198
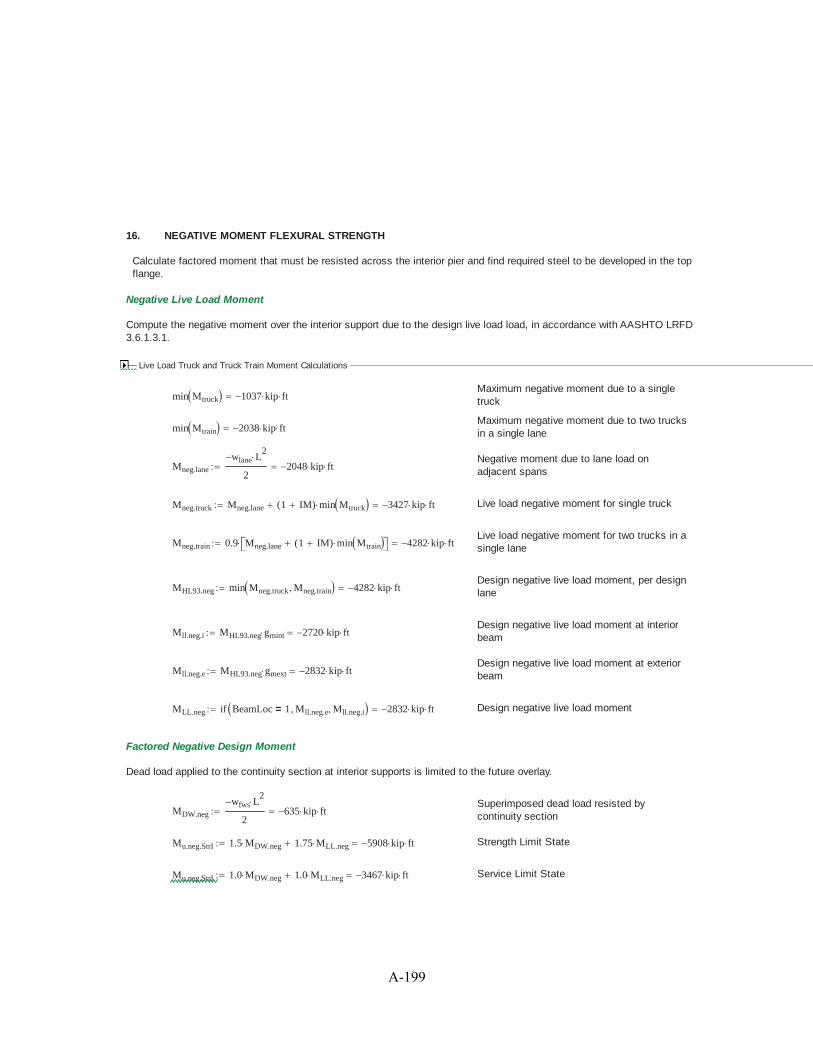
16. NEGATIVE MOMENT FLEXURAL STRENGTH
Calculate factored moment that must be resisted across the interior pier and find required steel to be developed in the topflange.
Negative Live Load Moment
Compute the negative moment over the interior support due to the design live load load, in accordance with AASHTO LRFD3.6.1.3.1.
Live Load Truck and Truck Train Moment Calculations
Maximum negative moment due to a singletruckmin Mtruck 1037 kip ft
Maximum negative moment due to two trucksin a single lanemin Mtrain 2038 kip ft
Negative moment due to lane load onadjacent spansMneg.lane
wlane L2
22048 kip ft
Mneg.truck Mneg.lane 1 IM( ) min Mtruck 3427 kip ft Live load negative moment for single truck
Live load negative moment for two trucks in asingle laneMneg.train 0.9 Mneg.lane 1 IM( ) min Mtrain 4282 kip ft
Design negative live load moment, per designlaneMHL93.neg min Mneg.truck Mneg.train 4282 kip ft
Design negative live load moment at interiorbeamMll.neg.i MHL93.neg gmint 2720 kip ft
Design negative live load moment at exteriorbeamMll.neg.e MHL93.neg gmext 2832 kip ft
MLL.neg if BeamLoc 1= Mll.neg.e Mll.neg.i 2832 kip ft Design negative live load moment
Factored Negative Design Moment
Dead load applied to the continuity section at interior supports is limited to the future overlay.
Superimposed dead load resisted bycontinuity sectionMDW.neg
wfws L2
2635 kip ft
Mu.neg.StrI 1.5 MDW.neg 1.75 MLL.neg 5908 kip ft Strength Limit State
Mu.neg.StrI 1.0 MDW.neg 1.0 MLL.neg 3467 kip ft Service Limit State
A-199

16. NEGATIVE MOMENT FLEXURAL STRENGTH (cont'd)
Reinforcing Steel Requirement in the Top Flange for Strength
Reduction factor for strength in tension-controlled reinforced concrete (5.5.4.2)φf 0.90
bc b1
26 in Width of compression block at bottom flange
Distance to centroid of negative moment steel,taken at mid-depth of top flangednms h tsac 0.5 tflange tsac 44.5 in
Factored load, in terms of stress in concreteat depth of steel, for computing steelrequirement
Ru
Mu.neg.StrI
φf bc dnms2
0.898 ksi
mfy
0.85 fc
8.824 Steel-to-concrete strength ratio
ρreq1
m1 1
2 m Ru
fy
0.0161 Required negative moment steel ratio
Anms.req ρreq bc dnms 18.638 in2 Required negative moment steel in top flange
Full-length longitudinal reinforcement to bemade continuous across jointAs.long.t 2.0 in
2As.long.b 2.0 in
2
Additional negative moment reinforcing barareaAbar 0.44 in
2
Additional reinforcement area required in thetop mat (2/3 of total)Anms.t
2
3Anms.req As.long.t 10.425 in
2
nbar.t ceilAnms.t
Abar
24 Additional bars required in the top mat
Additional reinforcement area required in thebottom matAnms.b
1
3Anms.req As.long.b 4.213 in
2
nbar.b ceilAnms.b
Abar
10 Additional bars required in the top mat
sbar.top
S Wj 6 in
nbar.t 13.62 in Spacing of bars in top mat
As.nms nbar.t nbar.b Abar As.long.t As.long.b 18.96 in2 Total reinforcing steel provided over pier
aAs.nms fy
0.85 fc bc
6.434 in Depth of compression block
Mr.neg φf As.nms fy dnmsa
23522 kip ft Factored flexural resistance at interior pier
DCneg.mom
Mu.neg.StrI
Mr.neg
0.984
CheckNegMom if DCneg.mom 1.0 "OK" "No Good" "OK" Negative flexure resistance check
A-200

DECKED PRECAST PRESTRESSED CONCRETE GIRDER DESIGN FOR ABC
Unit Definition: kcf kip ft3
This example is for the design of a superstructure system that can be used for rapid bridge replacement in an AcceleratedBridge Construction (ABC) application. The following calculations are intended to provide the designer guidance indeveloping a similar design with regard to design considerationS characteristic of this type of construction, and they shallnot be considered fully exhaustive.
Overall Width, W
Roadway Width, WrBarrierWidth, Wb Joint Width, Wj
Slope, CS
Beam Spacing, SS Wj
2
TYPICAL SECTION THROUGH SPAN
Lend Design Span Length, L
Girder Length, Lg
GIRDER ELEVATION
Bridge Geometry: L 60 ft Lend 2 ft skew 0 deg
W 63 ft Wb 1.5 ft
Smax 8 ft Wj 0.5 ft
Ng ceilW Wj
Smax
8 Minimum number of girders in cross-section
SW Wj
Ng
7.938 ft Girder spacing
File Name: Prestressed Concrete Girder-60ft.xmcd
A-201

ORDER OF CALCULATIONS
Introduction1.Design Philosophy2.Design Criteria3.Beam Section4.Material Properties5.Permanent Loads6.Precast Lifting Weight7.Live Load8.Prestress Properties9.Prestress Losses10.Concrete Stresses11.Flexural Strength12.Shear Strength13.Splitting Resistance14.Camber and Deflections15.Negative Moment Flexural Strength16.
1. INTRODUCTION
The bridge that is designed in this example consists of precast prestressed concrete girders with a top flange equal to thebeam spacing, so the top flange will be the riding surface of the designed bridge. The purpose for these girders is torapidly construct the bridge by providing a precast deck on the girders, which eliminates cast-in-place decks in the fieldand improves safety.
The concepts used in this example have been taken from on-going research, which focuses on the benefits of deckedprecast beams and promoting widespread acceptance from transportation and construction industries. The cross-sectionis adapted from the optimized girder sections recommended by NCHRP Project No. 12-69, Design and ConstructionGuidelines for Long-Span Decked Precast, Prestressed Concrete Girder Bridges. The girder design has not taken intoaccount the option to re-deck due to the final re-decked girder, without additional prestressed, having a shorter life span.Use of stainless steal rebar and the application of a future membrane can get ride of the need to replace the deck. Thiscase is included in “re-deckability”.
The bridge used in this example is a general design of a typical bridge in Georgia. The calculations can be modified forsingle-span and multiple-span bridges due to the beam design moments are not reduced for continuity at intermediatesupports (continuity details are not shown in this example). The cross-section consists of a four-lane roadway withnormal crown, with standard shoulder lengths and barrier walls. The precast prestressed concrete girder has beenuniformly designed to simplify bearing details. The girder flanges are 9’’ at the tips, imitating a 8’’ slab with a ½’’ allowablewear and another ½’’ for smoothness and profile adjustments.
This example is intended to illustrate design aspect specific to precast prestressed concrete girders used for ABCapplication. Girders with uncommon cross-sections, high self-weight, or unconventional load application create majorconcerns and more detailed calculations must be done.
A-202

2. DESIGN PHILOSOPHY
The geometry of the section is based on GDOT standards and general bridges across the state of Georgia. Depthvariations are dependent on the construction company but must maintain the shapes of the top flange and the bottombulb.
Concrete strengths can vary but are mostly between 6 ksi and 10 ksi. For the purpose of these calculations theconcrete with a 28-day minimum compressive strength of 8 ksi is used. Due to its casting sequence this beam isunable to take advantage of composite sequences along with tension at the bottom of the beam at the service limit statebeing limited. This is further discussed in section 4 along with end region stresses being critical. Therefore theminimum concrete strength at release must be 80 percent of the 28-day compressive strength, which increases theallowable stresses at the top and bottom of the section. The prestressed steel can also be optimized to minimizestresses at the end region.
The prestressed steel is arranged in a draped, or harped, pattern to maximize the midspan effectiveness while itminimizes the failure at the end of the beam where is concrete is easily overstressed due to the lack of dead load actingon the beam. The strand group is optimized at the midspan by bundling the strands between hold-points, maximizingthe stiffness of the strand group. The number and deflection angles are depended on the type of single strands you areusing for the girder. In longer span cases the concrete at the end of the girder will be too large and will debond. Withoutharped strands it is unlikely to reduce stresses to the allowable limit, since harped strands are required this method ofstress relief will be used without debonding for long spans.
3. DESIGN CRITERIA
Criteria has been selected to govern the design of these concrete girders while following provisions set by AASHTO,GDOT design specifications, as well as criteria of past projects and current research related to ABC and decked precastsections. A summary of the limiting design values are categorized as section constraints, prestress limits, and concretelimits.
Section Constraints:
Wpc.max 200 kip Upper limit on the weight of the entire precast element, based on common lifting andtransport capabilities without significantly increasing time and/or cost due tounconventional equipment or permits
Smax 8 ft Upper limit on girder spacing and, therefore, girder flange width (defined on first page)
Prestress Limits:
Fhd.single 4 kip Maximum hold-down force for a single strand
Fhd.group 48 kip Maximum hold-down force for the group of harped strands
Stress limits in the prestressing steel immediately prior to prestress and at the service limit state after all losses are asprescribed by AASHTO LRFD.
A-203

3. DESIGN CRITERIA (cont'd)
Concrete Limits:
Allowable concrete stresses meet standards set by AASHTO LRFD with one exception that at Service III Limit State,allowable bottom fiber tension when camber leveling forces are to be neglected, regardless of exposure, are to be 0-ksi.Minimum strength of concrete at release is 80 percent of the 28-day minimum compressive strength (f-ksi).
ft.all.ser 0 ksi Allowable bottom fiber tension at the Service III Limit State, when camber levelingforces are to be neglected, regardless of exposure
As previously mentioned, release concrete strength is specified as 80 percent of the minimum 28-day compressivestrength to maximize allowable stresses in the end region of beam at release.
fc.rel f( ) 0.80 f Minimum strength of concrete at release
Due to various lifting and transportation conditions, stresses in the concrete need to be considered. A “no cracking”approach is used for allowable tension due to reduced lateral stability after cracking. Assuming the girders will be liftedbefore the 28-day minimum strength is attained, the strength of concrete during lifting and transportation is assumed to be90 percent of the 28-day minimum compressive strength. A dynamic dead load allowance of 30 percent is used forcompression during handling. A factor of safety (FS) of 1.5 is used against cracking during handling.
DIM 30% Dynamic dead load allowance
fc.erec f( ) 0.90 f Assumed attained concrete strength during lifting and transportation
FSc 1.5 Factor of safety against cracking during lifting transportation
ft.erec f( )0.24 f ksi
FSc
Allowable tension in concrete during lifting and transportation to avoid cracking
A-204

b1
b2
b3
bn+1
bn
bn-1
bn-2
dn
dn-1
dn-2
d1
d2
TYPICAL GIRDER SECTION COMPRISED
OF n TRAPEZOIDAL REGIONS
y
x
4. BEAM SECTION
Use trapezoidal areas to define the cross-section. The flange width is defined as the beam spacing less the width of thelongitudinal closure joint to reflect pre-erection conditions. Live load can be conservatively applied to this section, as well.
h 45 in Beam section depth
tflange 9 in Flange thickness at tip
tsac 1 in Total sacrificial depth for grinding and wear
b1
26 in b2
26 in d1
6 in
b2
26 in b3
6 in d2
4.5 in
b3
6 in b4
6 in
b4
6 in b5
10 in d4
2 in
b5
10 in b6
42 in d5
2 in
b6
42 in b7
S Wj d6
0 in
b7
89.25 in b8
S Wj d7
tflange tsac
d3
h tsac d d3
21.5 in
Gross Section Properties
bf 89.25 in Precast girder flange width
Ag 1139 in2 Cross-sectional area (does not include sacrifical thickness)
Ixg 241240 in4 Moment of inertia (does not include sacrificial thickness)
ytg 13.544 in ybg 30.456 in Top and bottom fiber distances from neutal axis (positive up)
Stg 17811.7 in3
Sbg 7920.9 in3 Top and bottom section moduli
Iyg 487677 in4 Weak-axis moment of inertia
50 40 30 20 10 0 10 20 30 40 502
4.125
10.25
16.375
22.5
28.625
34.75
40.875
47GIRDER SECTION PLOT (N.T.S.)
A-205

5. MATERIAL PROPERTIES
These properties are standard (US units) values with equations that can be found in AASHTO LRFD Bridge DesignSpecifications.
Concrete:
fc 8 ksi Minimum 28-day compressive strength of concrete
fci fc.rel fc 6.4 ksi Minimum strength of concrete at release
γc .150 kcf Unit weight of concrete
K1 1.0 Correction factor for standard aggregate (5.4.2.4)
Eci 33000 K1
γc
kcf
1.5
fci ksi 4850 ksi Modulus of elasticity at release (5.4.2.4-1)
Ec 33000 K1
γc
kcf
1.5
fc ksi 5422 ksi Modulus of elasticity (5.4.2.4-1)
fr.cm 0.37 fc ksi 1.047 ksi Modulus of rupture for cracking moment (5.4.2.6)
fr.cd 0.24 fc ksi 0.679 ksi Modulus of rupture for camber and deflection (5.4.2.6)
H 70 Relative humidity (5.4.2.3)
Prestressing Steel:
fpu 270 ksi Ultimate tensile strength
fpy 0.9 fpu 243 ksi Yield strength, low-relaxation strand (Table 5.4.4.1-1)
fpbt.max 0.75 fpu 202.5 ksi Maximum stress in steel immediately prior to transfer
fpe.max 0.80 fpy 194.4 ksi Maximum stress in steel after all losses
Ep 28500 ksi Modulus of elasticity (5.4.4.2)
dps 0.5 in Strand diameter
Ap 0.153 in2 Strand area
Nps.max 40 Maximum number of strands in section
npi
Ep
Eci
5.9 Modular ratio at release
np
Ep
Ec
5.3 Modular ratio
Mild Steel:
A-206

fy 60 ksi Specified minimum yield strength
Es 29000 ksi Modulus of elasticity (5.4.3.2)
A-207

6. PERMANENT LOADS
Permanent loads or dead loads that must be considered are self-weight, diaphragms, barriers, and future wearing surface.The barrier can be cast to the beam before it is taken on sight or attached to the bridge after the joints have reachedsufficient strength. Distribution of the barriers weight should be established once you decide when it would be attached tothe bridge. For this example the barrier has been cast on the exterior girder in the casting yard, before shipping but afterrelease of prestresses. Due to this the dead load is increased on the exterior girders but it eliminates the time-consumingtask that would have been completed in the field.
BeamLoc 1 Location of beam within the cross-section (0 - Interior, 1 - Exterior)
Load at Release:
γc.DL .155 kcf Concrete density used for weight calculations
Ag.DL Ag tsac S Wj 1228.25 in2 Area used for weight calculations, including sacrificial thickness
wg Ag.DL γc.DL 1.322 klf Uniform load due to self-weight, including sacrificial thickness
Lg L 2 Lend 64 ft Span length at release
Mgr x( )wg x
2Lg x Moment due to beam self-weight (supported at ends)
Vgr x( ) wg
Lg
2x Shear due to beam self-weight (supported at ends)
Load at Erection:
Mg x( )wg x
2L x( ) Moment due to beam self-weight
Vg x( ) wgL
2x Shear due to beam self-weight
wbar 0.430 klf Uniform load due to barrier weight, exterior beams only
wbar if BeamLoc 1= wbar 0 0.43 klf Redfine to 0 if interior beam (BeamLoc = 0)
Mbar x( )wbar x
2L x( ) Moment due to beam self-weight
Vbar x( ) wbarL
2x Shear due to beam self-weight
A-208

6. PERMANENT LOADS (cont'd)
Load at Service:
pfws 25 psf Assumed weight of future wearing surface
wfws pfws S 0.198 klf Uniform load due to future wearing surface
Mfws x( )wfws x
2L x( ) Moment due to future wearing surface
Vfws x( ) wfwsL
2x Shear due to future wearing surface
wj Wj d7γc.DL 0.052 klf Uniform load due to weight of longitudinal closure joint
Mj x( )wj x
2L x( ) Moment due to longitudinal closure joint
Vj x( ) wjL
2x Shear due to longitudinal closure joint
A-209
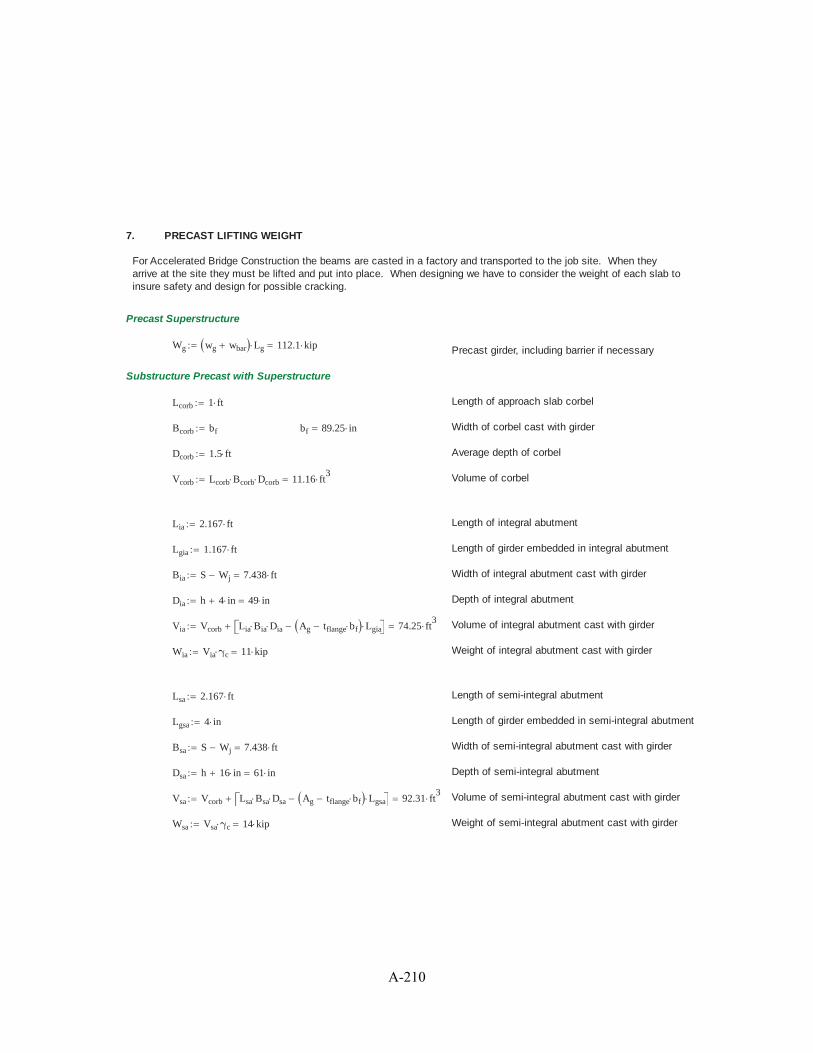
7. PRECAST LIFTING WEIGHT
For Accelerated Bridge Construction the beams are casted in a factory and transported to the job site. When theyarrive at the site they must be lifted and put into place. When designing we have to consider the weight of each slab toinsure safety and design for possible cracking.
Precast Superstructure
Wg wg wbar Lg 112.1 kip Precast girder, including barrier if necessary
Substructure Precast with Superstructure
Lcorb 1 ft Length of approach slab corbel
Bcorb bf bf 89.25 in Width of corbel cast with girder
Dcorb 1.5 ft Average depth of corbel
Vcorb Lcorb Bcorb Dcorb 11.16 ft3 Volume of corbel
Lia 2.167 ft Length of integral abutment
Lgia 1.167 ft Length of girder embedded in integral abutment
Bia S Wj 7.438 ft Width of integral abutment cast with girder
Dia h 4 in 49 in Depth of integral abutment
Via Vcorb Lia Bia Dia Ag tflange bf Lgia 74.25 ft3 Volume of integral abutment cast with girder
Wia Via γc 11 kip Weight of integral abutment cast with girder
Lsa 2.167 ft Length of semi-integral abutment
Lgsa 4 in Length of girder embedded in semi-integral abutment
Bsa S Wj 7.438 ft Width of semi-integral abutment cast with girder
Dsa h 16 in 61 in Depth of semi-integral abutment
Vsa Vcorb Lsa Bsa Dsa Ag tflange bf Lgsa 92.31 ft3 Volume of semi-integral abutment cast with girder
Wsa Vsa γc 14 kip Weight of semi-integral abutment cast with girder
A-210

Semi-Integral Abutment Backwall Integral Abutment Backwall
A-211

8. LIVE LOAD
When considering Live Loads you must refer to the vertical load section HL-93 in the AASHTO manual. If the project youare working on requires the bridge to support construction loads at any stage, these loads must be considered separatelyand applied. The longitudinal joints are designed for full moment connections so the beams will act as a unit whensufficiently connected. The distribution factors are then computed for cross-section type “j” (defined in AASHTO 4.6.2.2).When calculating the stiffness parameter, the constant- depth region at the top flange is treated like the slab and theremaining area of the beam will be considered a non-composite beam.
Definitions:
Ibb = moment of inertia of section below the top flange
Abb = area of beam section below the top flange
ybb = distance of top fiber below the top flange from neutral axis
ts = thickness of slab not including sacrificial thickness
Distribution Factors for Moment:
From Table 4.6.2.2.2b-1 for moment in interior girders,
Ibb 63137 in4 Moment of inertia of section below the top flange
Abb 425 in2 Area of beam section below the top flange
eg h tsac
ts
2ybb 25.578 in Distance between c.g.'s of beam and flange
Kg 1.0 Ibb Abb eg2
341179 in4 Longitudinal stiffness parameter (Eqn. 4.6.2.2.1-1)
Verify this girder design is within the range of applicability for Table 4.6.2.2.2b-1.
CheckMint if S 16 ft( ) S 3.5 ft( ) ts 4.5 in ts 12.0 in L 20 ft( ) L 240 ft( ) "OK" "No Good"
CheckMint if CheckMint "OK"=( ) Ng 4 Kg 10000 in4
Kg 7000000 in4
"OK" "No Good"
CheckMint "OK"
gmint1 0.06S
14 ft
0.4S
L
0.3 Kg
L ts3
0.1
0.491 Single loaded lane
gmint2 0.075S
9.5 ft
0.6S
L
0.2 Kg
L ts3
0.1
0.669 Two or more loaded lanes
gmint max gmint1 gmint2 0.669 Distribution factor for moment at interior beams
A-212

8. LIVE LOAD (cont'd)
From Table 4.6.2.2.2d-1 for moment in exterior girders,
Distance from centerline of exterior beam to edgeof curb or barrierde
S
2Wb 29.625 in
CheckMext if de 1 ft de 5.5 ft Ng 4 "OK" "No Good" "OK"
For a single loaded lane, use the Lever Rule.
gmext1
S 0.5 bf Wb 5 ft
S0.65 Single loaded lane
em 0.77de
9.1 ft1.041 Correction factor for moment (Table 4.6.2.2.2d-1)
gmext2 em gmint 0.697 Two or more loaded lanes
gmext max gmext1 gmext2 0.697 Distribution factor for moment at exterior beams
Distribution Factors for Shear:
From Table 4.6.2.2.3a-1 for shear in interior girders,
Verify this girder design is within the range of applicability for Table 4.6.2.2.3a-1.
CheckVint if S 16 ft( ) S 3.5 ft( ) ts 4.5 in ts 12.0in L 20 ft( ) L 240 ft( ) "OK" "No Good"
CheckVint if CheckMint "OK"=( ) Ng 4 "OK" "No Good"
CheckVint "OK"
gvint1 0.36S
25 ft0.678 Single loaded lane
gvint2 0.2S
12 ft
S
35 ft
2.0
0.81 Two or more loaded lanes
gvint max gvint1 gvint2 0.81 Distribution factor for shear at interior beams
A-213

8. LIVE LOAD (cont'd)
From Table 4.6.2.2.3b-1 for shear in exterior girders,
For a single loaded lane, use the Lever Rule.
CheckVext if de 1 ft de 5.5 ft Ng 4 "OK" "No Good" "OK"
g1
S 0.5 bf Wb 5 ft
S0.65 Single loaded lane (same as for moment)
Correction factor for shear (Table 4.6.2.2.3b-1)ev 0.6
de
10 ft0.847
g2 ev gvint 0.686 Two or more loaded lanes
gvext max g1 g2 0.686 Distribution factor for shear at exterior beams
From Table 4.6.2.2.3c-1 for skewed bridges,
θ skew 0 deg
CheckSkew if θ 60 deg( ) 3.5 ft S 16 ft( ) 20 ft L 240 ft( ) Ng 4 "OK" "No Good" "OK"
cskew 1.0 0.20L ts
3
Kg
0.3
tan θ( ) 1.00 Correction factor for skew
A-214

8. LIVE LOAD (cont'd)
Design Live Load Moment at Midspan:
wlane 0.64 klf Design lane load
Ptruck 32 kip Design truck axle load
IM 33% Dynamic load allowance (truck only)
Mlane x( )wlane x
2L x( ) Design lane load moment
Influence coefficient for truck moment calculationδ x( )
x L x2
L
Mtruck x( ) Ptruck δ x( ) max9 x L x( ) 14 ft 3 x L( )
4 x L x( )
9 L x( ) 84 ft
4 L x( )Design truck moment
MHL93 x( ) Mlane x( ) 1 IM( ) Mtruck x( ) HL93 design live load moment per lane
Mll.i x( ) MHL93 x( ) gmint Design live load moment at interior beam
Mll.e x( ) MHL93 x( ) gmext Design live load moment at exterior beam
Mll x( ) if BeamLoc 1= Mll.e x( ) Mll.i x( ) Design live load moment
Design Live Load Shear:
Vlane x( ) wlaneL
2x Design lane load shear
Vtruck x( ) Ptruck9 L 9 x 84 ft
4 LDesign truck shear
VHL93 x( ) Vlane x( ) 1 IM( ) Vtruck x( ) HL93 design live load shear
Vll.i x( ) VHL93 x( ) gvint Design live load shear at interior beam
Vll.e x( ) VHL93 x( ) gvext Design live load shear at exterior beam
Vll x( ) if BeamLoc 1= Vll.e x( ) Vll.i x( ) Design live load shear
A-215

9. PRESTRESS PROPERTIES
Due to tension at the surface limit state be reduced to account for camber leveling forces, the prestress force required atthe midspan is expected to be excessive at the ends when released. Not measuring the reduction of prestress moments.Estimate prestress losses at the midspan to find trial prestress forces, that will occur in the bottom tension fibers, that areless than allowable. Compute immediate losses in the prestressed steel and check released stresses at the end of thebeam. Once you satisfy end stresses, estimate total loss of prestress. As long as these losses are not drasticallydifferent from the assumed stresses, the prestress layout should be acceptable. Concrete stress at all limit states are inSection 9.
yp.est 5 in Assumed distance from bottom of beam to centroid of prestress at midspan
ycgp.est ybg yp.est 25.46 in Eccentricity of prestress from neutral axis, based on assumed location
Δfp.est 25% Estimate of total prestress losses at the service limit state
Compute bottom fiber service stresses at midspan using gross section properties.
XL
2Distance from support
Mdl.ser Mg X( ) Mfws X( ) Mj X( ) Mbar X( ) 901 kip ft Total dead load moment
fb.serIII
Mdl.ser 0.8 Mll X( )
Sbg
2.507 ksi Total bottom fiber service stress
fpj fpbt.max 202.5 ksi Prestress jacking force
fpe.est fpj 1 Δfp.est 151.9 ksi Estimate of effective prestress force
Aps.est Ag
fb.serIII ft.all.ser
fpe.est
1Ag ycgp.est
Sbg
4.035 in2 Estimated minimum area of prestressing steel
Nps.est ceilAps.est
Ap
27 Estimated number of strands required
Nps 38 Number of strands used ( Nps.max 40 )
The number above is used for the layout strand pattern and to compute the actual location of the strand group. After this isdone the required area is computed again. If the estimated location is accurate the number of strands should be equal tothe number of strands that we calculated above. The number of strands that was estimated was based on our assumedprestressed losses and gross section properties, which may not accurately reflect the final number of strands required forthe design. These stresses for concrete are evaluated in Section 10. The geometry is assuming a vertical spacing of 2” between straight spans, as well as 2” for harped strands at the end of thebeam. Harped strands are bundled at the midspan where the centroid is 5” from the bottom.
A-216

9. PRESTRESS PROPERTIES (cont'd)
Nh 2 Nps 12if
4 12 Nps 24if
6 24 Nps 30if
6 Nps 30 Nps 30if
Nh 14 Assumes all flange rows are filled prior to fillingrows in web above the flange, which maximizedefficiency. Use override below to shift strandsfrom flange to web if needed to satisfy endstresses.
Additional harped strands in web (strands to bemoved from flange to web)Nh.add 16
16 strands or half of total strands maximumharped in webNh min Nh Nh.add 16 2 floor
Nps
4Nh 16
yh 1 in 2 in( ) 10.5 Nh 1
2yh 10 in Centroid of harped strands from bottom, equally
spaced
yhb 5 in Centroid of harped strands from bottom, bundled
Ns Nps Nh Ns 22 Number of straight strands in flange
ys 1 in 2 in Ns 10if
4 in( ) Ns 20 in
Ns
10 Ns 20if
6 in( ) Ns 60 in
Ns
20 Ns 24if
3.5 in otherwise
ys 4.273 in Centroid of straight strands from bottom
yp
Ns ys Nh yhb
Ns Nh
4.579 in Centroid of prestress from bottom at midspan
ycgp ybg yp 25.88 in Eccentricity of prestress from neutral axis
Aps.req Ag
fb.serIII ft.all.ser
fpe.est
1Ag ycgp
Sbg
3.983 in2 Estimated minimum area of prestressing steel
Nps.req ceilAps.req
Ap
27 Estimated number of strands required
CheckNps if Nps Nps.max Nps.req Nps "OK" "No Good" "OK"
Aps.h Nh Ap 2.448 in2 Area of prestress in web (harped)
Aps.s Ns Ap 3.366 in2 Area of prestress in flange (straight)
Aps Aps.h Aps.s 5.814 in2 Total area of prestress
A-217

9. PRESTRESS PROPERTIES (cont'd)
Compute transformed section properties based on prestress layout.
Transformed Section Properties
Initial Transformed Section (release): Final Transformed Section (service):
Ati 1167.4 in2
Atf 1163.7 in2
Ixti 259764 in4
Ixtf 257457 in4
ytti 14.172 in Stti 18329 in3
yttf 14.094 in Sttf 18267 in3
ycgpi 25.249 in Scgpi 10288 in3
ycgpf 25.327 in Scgpf 10165 in3
ybti 29.828 in Sbti 8709 in3
ybtf 29.906 in Sbtf 8609 in3
Determine initial prestress force after instantaneous loss due to elastic shortening. Use transformed properties to computestress in the concrete at the level of prestress.
Pj fpj Aps 1177.3 kip Jacking force in prestress, prior to losses
Stress in concrete at the level of prestress afterinstantaneous lossesfcgpi Pj
1
Ati
ycgpi
Scgpi
Mgr
Lg
2
Scgpi
3.108 ksi
Prestress loss due to elastic shortening(5.9.5.2.3a-1)ΔfpES npi fcgpi 18.266 ksi
fpi fpj ΔfpES 184.234 ksi Initial prestress after instantaneous losses
Pi fpi Aps 1071.1 kip Initial prestress force
Determine deflection of harped strands required to satisfy allowable stresses at the end of the beam at release.
fc.all.rel 0.6 fci 3.84 ksi Allowable compression before losses (5.9.4.1.1)
ft.all.rel max 0.0948 fci ksi 0.2 ksi 0.200 ksi Allowable tension before losses (Table 5.9.4.1.2-1)
Lt 60 dps 2.5 ft Transfer length (AASHTO 5.11.4.1)
ycgp.t
ft.all.rel
Mgr Lt
Stti
Pi
1
Ati
Stti 20.262 in Prestress eccentricity required for tension
ycgp.b
fc.all.rel
Mgr Lt
Sbti
Pi
1
Ati
Sbti 24.899 in Prestress eccentricity required for compression
A-218
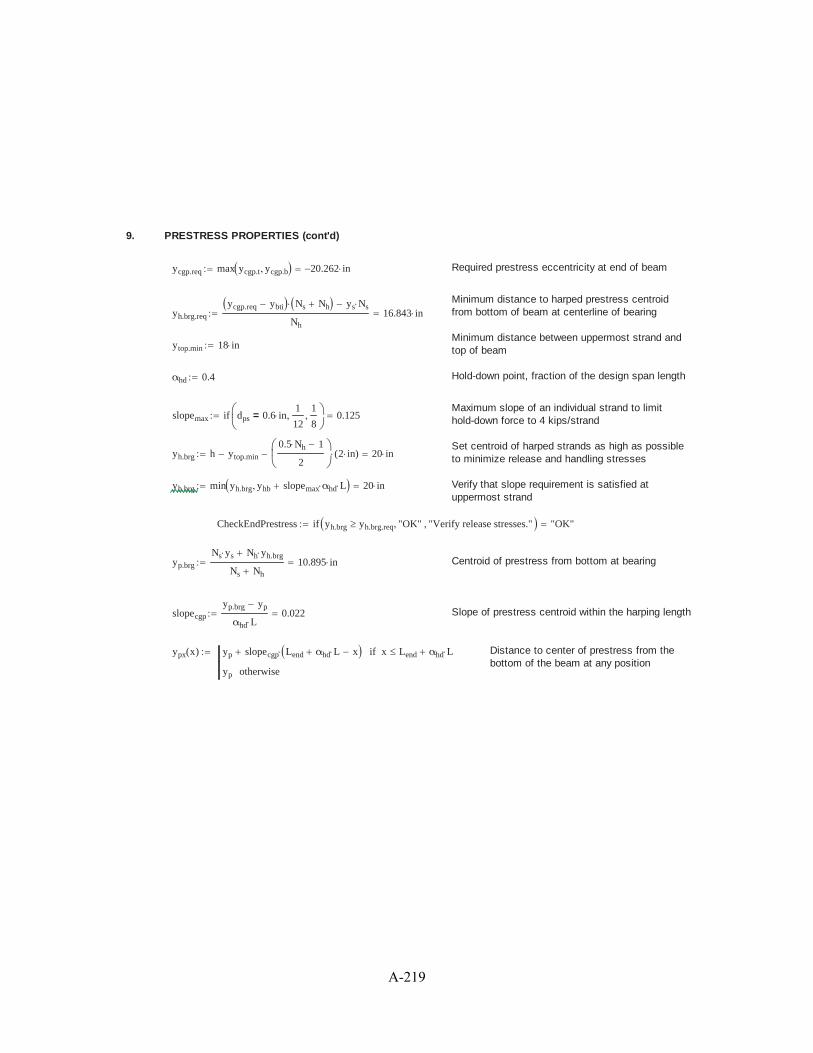
9. PRESTRESS PROPERTIES (cont'd)
ycgp.req max ycgp.t ycgp.b 20.262 in Required prestress eccentricity at end of beam
Minimum distance to harped prestress centroidfrom bottom of beam at centerline of bearingyh.brg.req
ycgp.req ybti Ns Nh ys Ns
Nh
16.843 in
Minimum distance between uppermost strand andtop of beamytop.min 18 in
αhd 0.4 Hold-down point, fraction of the design span length
Maximum slope of an individual strand to limithold-down force to 4 kips/strandslopemax if dps 0.6 in=
1
12
1
80.125
Set centroid of harped strands as high as possibleto minimize release and handling stressesyh.brg h ytop.min
0.5 Nh 1
22 in( ) 20 in
yh.brg min yh.brg yhb slopemax αhd L 20 in Verify that slope requirement is satisfied atuppermost strand
CheckEndPrestress if yh.brg yh.brg.req "OK" "Verify release stresses." "OK"
yp.brg
Ns ys Nh yh.brg
Ns Nh
10.895 in Centroid of prestress from bottom at bearing
slopecgp
yp.brg yp
αhd L0.022 Slope of prestress centroid within the harping length
ypx x( ) yp slopecgp Lend αhd L x x Lend αhd Lif
yp otherwise
Distance to center of prestress from thebottom of the beam at any position
A-219

10. PRESTRESS LOSSES
Prestressed losses can be evaluated like regular concrete, in short-term and long-term losses. When the beam is apretension girder there are instantaneous losses when the beam is shortened upon release of the prestress forces.Time-dependent losses happen when the beam is under creep and shrinkage of the beam concrete, creep and shrinkage othe deck concrete, and the relaxation of prestressed steel. These long term effects are separated into two stages thatrepresent significant events in bridge construction. The first stage is the time between transfer of the prestress forces andplacement of the decked beam and the second is the period of time between placement of the deck and the final serviceload. For decked beams the computation of long-term losses is slightly simplified due to the cross-section not changingbetween the two stages and the shrinkage term of the deck concrete is eliminated since the deck and beam being casttogether. No losses or gains in the steel associated with deck placement after transfer.
AASHTO methods for estimating time-dependent losses: Approximate Estimate (5.9.5.3)Refined Estimate (5.9.5.4)
The Approximate method is based on systems with composite decks and is based on the following assumptions: timing ofload application, the cross-section in which the load is applied, and the ratio of dead and live loads to the total load. Theconditions for the beams to be fabricated, formed and loaded depend on conditions assumed in the development of theapproximate method. The refined method is used to estimate time-dependent losses in the prestressed steel.
Equations 5.9.5.4 are time-dependent and calculate the age-adjustment factors that effect losses using gross sectionproperties.
ti 1 Time (days) between casting and release of prestress
tb 20 Time (days) to barrier casting (exterior girder only)
td 30 Time (days) to erection of precast section, closure joint pour
tf 20000 Time (days) to end of service life
Terms and equations used in the loss calculations:
Prestressing steel factor for low-relaxation strands(C5.9.5.4.2c)KL 45
VSAg
Peri3.883 in Volume-to-surface ratio of the precast section
ks max 1.45 0.13VS
in1.0 1.00 Factor for volume-to-surface ratio (5.4.2.3.2-2)
khc 1.56 0.008 H 1.00 Humidity factor for creep (5.4.2.3.2-3)
khs 2.00 0.014 H 1.02 Humidity factor for shrinkage (5.4.2.3.3-2)
kf5
1fci
ksi
0.676 Factor for effect of concrete strength (5.4.2.3.2-4)
A-220

10. PRESTRESS LOSSES (cont'd)
ktd t( )t
61 4fci
ksit
Time development factor (5.4.2.3.2-5)
ψ t tinit 1.9 ks khc kf ktd t( ) tinit0.118 Creep coefficient (5.4.2.3.2-1)
εsh t( ) ks khs kf ktd t( ) 0.48 103 Concrete shrinkage strain (5.4.2.3.3-1)
Time from Transfer to Erection:
Eccentricity of prestress force with respect to the neutral axis of thegross non-composite beam, positive below the beam neutral axisepg yp ybg 25.877 in
Stress in the concrete at the center prestressimmediately after transferfcgp Pi
1
Ag
epg2
Ixg
MgL
2
Ixg
yp ybg 3.148 ksi
fpt max fpi 0.55 fpy 184.234 ksi Stress in strands immediately after transfer (5.9.5.4.2c-1)
ψbid ψ td ti 0.589 Creep coefficient at erection due to loading at transfer
ψbif ψ tf ti 1.282 Creep coefficient at final due to loading at transfer
εbid εsh td ti 1.490 104 Concrete shrinkage between transfer and erection
Kid1
1 npi
Aps
Ag
1Ag epg
2
Ixg
1 0.7 ψbif
0.809 Age-adjusted transformed section coefficient(5.9.5.4.2a-2)
ΔfpSR εbid Ep Kid 3.433 ksi Loss due to beam shrinkage(5.9.5.4.2a-1)
ΔfpCR npi fcgp ψbid Kid 8.807 ksi Loss due to creep(5.9.5.4.2b-1)
ΔfpR1
fpt
KL
log 24 td
log 24 ti
fpt
fpy
0.55 13 ΔfpSR ΔfpCR
fpt
Kid 1.142 ksi Loss due to relaxation(C5.9.5.4.2c-1
Δfpid ΔfpSR ΔfpCR ΔfpR1 13.382 ksi
A-221

10. PRESTRESS LOSSES (cont'd)
Time from Erection to Final:
epc epg 25.877 in Eccentricity of prestress force does not change
Ac Ag Ic Ixg Section properties remain unchanged
Change in concrete stress at center of prestress due toinitial time-dependent losses and superimposed deadload. Deck weight is not included for this design.
Δfcd
MfwsL
2Mj
L
2
Scgpf
Δfpid
np
2.413 ksi
ψbdf ψ tf td 0.858 Creep coefficient at final due to loading at erection
εbif εsh tf ti 3.302 104 Concrete shrinkage between transfer and final
εbdf εbif εbid 1.813 104 Concrete shrinkage between erection and final
Kdf1
1 npi
Aps
Ac
1Ac epc
2
Ic
1 0.7 ψbif
0.809 Age-adjusted transformed section coefficientremains unchanged
ΔfpSD εbdf Ep Kdf 4.177 ksi Loss due to beam shrinkage
ΔfpCD npi fcgp ψbif ψbid Kdf np Δfcd ψbdf Kdf 19.157 ksi Loss due to creep
ΔfpR2 ΔfpR1 1.142 ksi Loss due to relaxation
ΔfpSS 0 Loss due to deck shrinkage
Δfpdf ΔfpSD ΔfpCD ΔfpR2 ΔfpSS 24.476 ksi
Prestress Loss Summary
ΔfpES 18.266 ksiΔfpES
fpj
9 %
ΔfpLT Δfpid Δfpdf 37.858 ksiΔfpLT
fpj
18.7 %
ΔfpTotal ΔfpES ΔfpLT 56.124 ksiΔfpTotal
fpj
27.7 % Δfp.est 25 %
fpe fpj ΔfpTotal 146.4 ksi Final effective prestress
CheckFinalPrestress if fpe fpe.max "OK" "No Good" "OK"
A-222

11. CONCRETE STRESSES
Concrete Stresses at release, during handling and at final service are computed and compared to approximated values foreach stage.
Concrete Stresses at Release
When calculating the stresses at release use the overall beam length due to the beam being supported at each end in thecasting bed after prestress forces are transformed.
Define locations for which stresses are to be calculated:
xr Lg 0 minLt
Lg
Lend
Lg
maxLt
Lg
Lend
Lg
0.1 0.2 0.3 αhd 0.5
T
ir 1 last xr
Functions for computing beam stresses:
ftop.r x( ) minx
Lt
1 Pi1
Ati
ybti ypx x( )
Stti
Mgr x( )
Stti
Top fiber stress at release
fbot.r x( ) minx
Lt
1 Pi1
Ati
ybti ypx x( )
Sbti
Mgr x( )
Sbti
Bottom fiber stress at release
0 4 8 12 16 20 24 28 32 36 401
0
1
2
3
4Stresses in Concrete at Release (Half Beam)
Distance along Beam (ft)
Str
ess
(ksi
)
ftop.r x( )
ksi
fbot.r x( )
ksi
fc.all.rel
ksi
ft.all.rel
ksi
0
x
ft
A-223

11. CONCRETE STRESSES (cont'd)
Compare beam stresses to allowable stresses.
ft.all.rel 0.2 ksi Allowable tension at release
fc.all.rel 3.84 ksi Allowable compression at release
TopRelir
ftop.r xrir
TopRelT
0.000 0.097 0.130 0.097 0.071 0.081 0.126 0.115( ) ksi
CheckTopRel if max TopRel( ) fc.all.rel min TopRel( ) ft.all.rel "OK" "No Good" "OK"
BotRelir
fbot.r xrir
BotRelT
0.000 2.484 3.122 3.053 2.999 3.019 3.115 3.090( ) ksi
CheckBotRel if max BotRel( ) fc.all.rel min BotRel( ) ft.all.rel "OK" "No Good" "OK"
Concrete Stresses During Lifting and Transportation
Lifting and transportation stresses can govern over final stresses due to different support locations, dynamic effects thatdead load can cause during movement, bending stresses during lifting and superelevation of the roadway in shipping. Enddiaphragms on both ends are assumed. For prestressing effects, calculate the effective prestressed force losses betweentransfer and building.
a h 3.75 ft Maximum distance to lift point from bearing line
a' a Lend 5.75 ft Distance to lift point from end of beam
Pdia max Wia Wsa 13.8 kip Approximate abutment weight
Pm Pj 1ΔfpES Δfpid
fpj
993.3 kip Effective prestress during lifting and shipping
Define locations for which stresses are to be calculated:
xe Lg 0 minLt
Lg
Lend
Lg
maxLt
Lg
Lend
Lg
a'
Lg
αhd 0.5
T
ie 1 last xe
Compute moment in the girder during lifting with supports at the lift points.
Mlift x( )wg wbar x
2
2Pdia x x a'if
Mgr x( ) Mgr a'( )wg wbar a'( )
2
2Pdia a' otherwise
A-224

11. CONCRETE STRESSES (cont'd)
Functions for computing beam stresses:
ftop.lift x( ) minx
Lt
1 Pm1
Atf
ybtf ypx x( )
Sttf
Mlift x( )
Sttf
Top fiber stress during lifting
Top fiber stress during lifting,impact increasing dead loadftop.DIM.inc x( ) min
x
Lt
1 Pm1
Atf
ybtf ypx x( )
Sttf
Mlift x( )
Sttf
1 DIM( )
Top fiber stress during lifting,impact decreasing dead loadftop.DIM.dec x( ) min
x
Lt
1 Pm1
Atf
ybtf ypx x( )
Sttf
Mlift x( )
Sttf
1 DIM( )
TopLift1ie
ftop.lift xeie
TopLift1T
0.000 0.165 0.214 0.305 0.308 0.296( ) ksi
TopLift2ie
ftop.DIM.inc xeie
TopLift2T
0.000 0.171 0.222 0.327 0.245 0.227( ) ksi
TopLift3ie
ftop.DIM.dec xeie
TopLift3T
0.000 0.159 0.206 0.284 0.371 0.364( ) ksi
fbot.lift x( ) minx
Lt
1 Pm1
Atf
ybtf ypx x( )
Sbtf
Mlift x( )
Sbtf
Bottom fiber stress during lifting
Bottom fiber stress during lifting,impact increasing dead loadfbot.DIM.inc x( ) min
x
Lt
1 Pm1
Atf
ybtf ypx x( )
Sbtf
Mlift x( )
Sbtf
1 DIM( )
Bottom fiber stress during lifting,impact decreasing dead loadfbot.DIM.dec x( ) min
x
Lt
1 Pm1
Atf
ybtf ypx x( )
Sbtf
Mlift x( )
Sbtf
1 DIM( )
BotLift1ie
fbot.lift xeie
BotLift1T
0.000 2.481 3.118 3.312 3.318 3.292( ) ksi
BotLift2ie
fbot.DIM.inc xeie
BotLift2T
0.000 2.494 3.135 3.358 3.184 3.147( ) ksi
BotLift3ie
fbot.DIM.dec xeie
BotLift3T
0.000 2.468 3.101 3.267 3.452 3.437( ) ksi
Allowable stresses during handling:
fcm fc.erec fc 7.2 ksi Assumed concrete strength when handling operations begin
fc.all.erec 0.6 fcm 4.32 ksi Allowable compression during lifting and shipping
ft.all.erec ft.erec fcm 0.429 ksi Allowable tension during lifting and shipping
A-225

11. CONCRETE STRESSES (cont'd)
0 4 8 12 16 20 24 28 32 36 40
0
2
4
Stresses in Concrete During Lifting (Half Beam)
Distance along Beam (ft)
Str
ess
(ksi
)
ftop.lift x( )
ksi
ftop.DIM.inc x( )
ksi
ftop.DIM.dec x( )
ksi
fbot.lift x( )
ksi
fbot.DIM.inc x( )
ksi
fbot.DIM.dec x( )
ksi
fc.all.erec
ksi
ft.all.erec
ksi
0
x
ft
Compare beam stresses to allowable stresses.
TopLiftMaxie
max TopLift1ie
TopLift2ie
TopLift3ie
TopLiftMaxT
0 0.159 0.206 0.284 0.245 0.227( ) ks
TopLiftMinie
min TopLift1ie
TopLift2ie
TopLift3ie
TopLiftMinT
0 0.171 0.222 0.327 0.371 0.364( ) ks
CheckTopLift if max TopLiftMax( ) fc.all.erec min TopLiftMin( ) ft.all.erec "OK" "No Good" "OK"
BotLiftMaxie
max BotLift1ie
BotLift2ie
BotLift3ie
BotLiftMaxT
0 2.494 3.135 3.358 3.452 3.437( ) ksi
BotLiftMinie
min BotLift1ie
BotLift2ie
BotLift3ie
BotLiftMinT
0 2.468 3.101 3.267 3.184 3.147( ) ksi
CheckBotLift if max BotLiftMax( ) fc.all.erec min BotLiftMin( ) ft.all.erec "OK" "No Good" "OK"
A-226

11. CONCRETE STRESSES (cont'd)
Concrete Stresses at Final
Stresses are calculated using design span length. The top flange compression and bottom flange under tension arecomputed at Service I and Service III states.
fc.all.ser1 0.4 fc 3.2 ksi Allowable compression due to effective prestress and dead load (Table 5.9.4.2.1-1)
Allowable compression due to effective prestress, permanent load, andtransient loads, as well as stresses during shipping and handling (Table 5.9.4.2.1-1)fc.all.ser2 0.6 fc 4.8 ksi
ft.all.ser 0 ksi Allowable tension (computed previously)
Pe fpe Aps 851.0 kip Effective prestress after all losses
Compute stresses at midspan and compare to allowable values.
ftop.ser1 x( ) minLend x
Lt
1 Pe1
Atf
ybtf ypx x( )
Sttf
Mg x Lend
Stti
Mbar x( ) Mfws x( ) Mj x( )
Sttf
ftop.ser2 x( ) minLend x
Lt
1 Pe1
Atf
ybtf ypx x( )
Sttf
Mg x Lend
Stti
Mbar x( ) Mfws x( ) Mj x( ) Mll x( )
Sttf
fbot.ser x( ) minLend x
Lt
1 Pe1
Atf
ybtf ypx x( )
Sbtf
Mg x Lend
Sbti
Mbar x( ) Mfws x( ) Mj x( ) 0.8 Mll x( )
Sbtf
0 4 8 12 16 20 24 28 32 36 40
0
2
4
6Stresses in Concrete at Service (Half Beam)
Distance along Beam (ft)
Str
ess
(ksi
)
ftop.ser1 x( )
ksi
ftop.ser2 x( )
ksi
fbot.ser x( )
ksi
ft.all.ser
ksi
fc.all.ser1
ksi
fc.all.ser2
ksi
x
ft
A-227

11. CONCRETE STRESSES (cont'd)
Compare beam stresses to allowable stresses.
xs LLt
L0.1 0.15 0.2 0.25 0.3 0.35 αhd 0.45 0.5
T
is 1 last xs
TopSer1is
ftop.ser1 xsis
TopSer1T
0.020 0.049 0.096 0.130 0.153 0.165 0.164 0.151 0.139 0.140( ) ksi
TopSer2is
ftop.ser2 xsis
TopSer2T
0.089 0.292 0.437 0.554 0.643 0.705 0.743 0.759 0.761 0.759( ) ksi
CheckCompSerI if max TopSer1( ) fc.all.ser1 max TopSer2( ) fc.all.ser2 "OK" "No Good" "OK"
BotSeris
fbot.ser xsis
BotSerT
2.143 1.769 1.505 1.292 1.131 1.022 0.959 0.936 0.939 0.941( ) ksi
CheckTenSerIII if min BotSer( ) ft.all.ser "OK" "No Good" "OK"
12. FLEXURAL STRENGTH
Confirm flexural resistance at Strength Limit State. Calculate Factored moment at midspan during Strength I loadcombination. Compare this to factored resistance in AASHTO LRFD 5.7.3.
MDC x( ) Mg x( ) Mbar x( ) Mj x( ) Self weight of components
MDW x( ) Mfws x( ) Weight of future wearing surface
MLL x( ) Mll x( ) Live load
MStrI x( ) 1.25 MDC x( ) 1.5 MDW x( ) 1.75 MLL x( ) Factored design moment
For minimum reinforcement check, per 5.7.3.3.2
fcpe Pe1
Ag
ycgp
Sbg
3.527 ksi Concrete compression at extreme fiber due toeffective prestress
Mcr fr.cm fcpe Sbg 3019 kip ft Cracking moment (5.7.3.3.2-1)
Mu x( ) max MStrI x( ) min 1.33 MStrI x( ) 1.2 Mcr Design moment
A-228

12. FLEXURAL STRENGTH (cont'd)
Compute factored flexural resistance.
β1 max 0.65 0.85 0.05fc
ksi4 0.65 Stress block factor (5.7.2.2)
k 2 1.04fpy
fpu
0.28 Tendon type factor (5.7.3.1.1-2)
Distance from compression fiber to prestresscentroiddp x( ) h ypx x Lend dp X( ) 40.421 in
hf d7
8 in Structural flange thickness
btaper
b6
b5
216 in Average width of taper at bottom of flange
htaper d5
2 in Depth of taper at bottom of flange
a x( )Aps fpu
0.85 fc bfk
β1
Aps
fpu
dp x( )
a X( ) 2.517 in Depth of equivalent stress block for rectangularsection
c x( )a x( )
β1
c X( ) 3.873 in Neutral axis location
CheckTC ifc X( )
dp X( )
.003
.003 .005"OK" "NG" "OK" Tension-controlled section check (midspan)
Resistance factor for prestressed concrete(5.5.4.2)φf min 1.0 max 0.75 0.583 0.25
dp X( )
c X( )1 1.00
fps fpu 1 kc X( )
dp X( )262.8 ksi Average stress in the prestressing steel
(5.7.3.1.1-1)
Ld1.6
ksifps
2
3fpe dps 11.012 ft Bonded strand devlepment length (5.11.4.2-1)
fpx x( )fpe x Lend
Lt
x Lt Lendif
fpe
x Lend Lt
Ld Lt
fps fpe Lt Lend x Ld Lendif
fps otherwise
Stress in prestressing steel along thelength for bonded strand (5.11.4.2)
Mr x( ) φf Aps fpx x( ) dp x( )a x( )
2Flexure resistance along the length
A-229
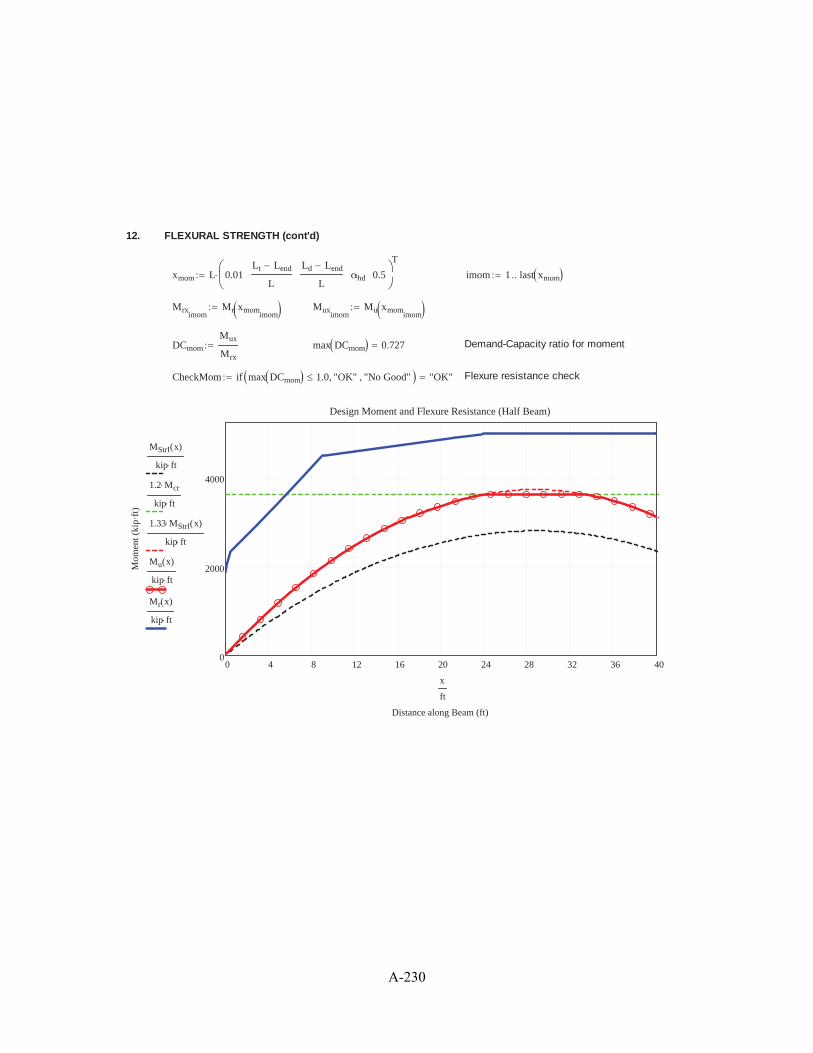
12. FLEXURAL STRENGTH (cont'd)
xmom L 0.01Lt Lend
L
Ld Lend
Lαhd 0.5
T
imom 1 last xmom
Mrximom
Mr xmomimom
Muximom
Mu xmomimom
DCmom
Mux
Mrx
max DCmom 0.727 Demand-Capacity ratio for moment
CheckMom if max DCmom 1.0 "OK" "No Good" "OK" Flexure resistance check
0 4 8 12 16 20 24 28 32 36 400
2000
4000
Design Moment and Flexure Resistance (Half Beam)
Distance along Beam (ft)
Mom
ent (
kip·
ft)
MStrI x( )
kip ft
1.2 Mcr
kip ft
1.33 MStrI x( )
kip ft
Mu x( )
kip ft
Mr x( )
kip ft
x
ft
A-230

13. SHEAR STRENGTH
Shear Resistance
Use Strength I load combination to calculate factored shear at the critical shear section and at tenth points along the span.Compare it to factored resistance in AASHTO LRFD 5.8.
VDC x( ) Vg x( ) Vbar x( ) Vj x( ) Self weight of components
VDW x( ) Vfws x( ) Weight of future wearing surface
VLL x( ) Vll x( ) Live load
Vu x( ) 1.25 VDC x( ) 1.5 VDW x( ) 1.75 VLL x( ) Factored design shear
Resistance factor for shear in normal weightconcrete (AASHTO LRFD 5.5.4.2)φv 0.90
dend h ypx Lend 34.105 in Depth to steel centroid at bearing
dv min 0.9 dend 0.72 h 30.695 in Effective shear depth lower limit at end
Vp x( ) Pe slopecgp
x Lend
Lt
x Lt Lendif
Pe slopecgp Lt Lend x αhd Lif
0 otherwise
Vertical component of effective prestress force
bv b3
6 in Web thickness
Shear stress on concrete (5.8.2.9-1)vu x( )
Vu x( ) φv Vp x( )
φv bv dv
Mushr x( ) max MStrI x( ) Vu x( ) Vp x( ) dv Factored moment for shear
Stress in prestressing steel due to locked-instrain after casting concretefpo 0.7 fpu 189 ksi
Steel strain at the centroid of the prestressingsteelεs x( ) max 0.4 10
3
Mu x( )
dv
Vu x( ) Vp x( ) Aps fpo
Ep Aps
β x( )4.8
1 750 εs x( )Shear resistance parameter
θ x( ) 29 3500 εs x( ) deg Principal compressive stress angle
Vc x( ) 0.0316 ksi β x( )fc
ksibv dv Concrete contribution to total shear resistance
A-231

13. SHEAR STRENGTH (cont'd)
α 90 deg Angle of inclination of transverse reinforcement
Transverse reinforcement area andspacing providedAv 1.02 0.62 0.62 0.62 0.31( )
Tin
2sv 3 6 6 12 12( )
Tin
xv 0 0.25 h 1.5 h 0.3 L 0.5 L 0.6 L( )T
xvT
0 0.938 5.625 18 30 36( ) ft
Avs x( )
outAv
i
svi
xvi
x xvi 1
if
i 1 last Avfor
out.
Vs x( ) Avs x( ) fy dv cot θ x( )( ) cot α( )( ) sin α( ) Steel contribution to total shear resistance
Vr x( ) φv Vc x( ) Vs x( ) Vp x( ) Factored shear resistance
xshr
outi
i0.5 L
100
i 1 100for
out
ishr 1 last xshr
Vuxishr
Vu xshrishr
Vrxishr
Vr xshrishr
DCshr
Vux
Vrx
max DCshr 0.574
CheckShear if max DCshr 1.0 "OK" "No Good" "OK" Shear resistance check
0 4 8 12 16 20 24 28 32 36 400
100
200
300
400
Design Shear and Resistance (Half Beam)
Distance along Beam (ft)
She
ar (
kips
) Vu x( )
kip
Vr x( )
kip
x
ft
A-232

13. SHEAR STRENGTH (cont'd)
Longitudinal Reinforcement
Al.req x( ) a1MStrI x( )
φf fpx x( ) dp x( )a x( )
2
a2
Vu x( )
φv
0.5 Vs x( ) Vp x( ) cot θ x( )( )
fpx x( )
a3
Mushr x( )
dv φf
Vu x( )
φv
Vp x( ) 0.5 Vs x( ) cot θ x( )( )
fpx x( )
min a1 a2( ) x dv 5 inif
min a1 a3( ) otherwise
Longitudinal reinforcement required forshear (5.8.3.5)
As.add 0.40 in2
Ld.add 18.67 ft Additional longitudinal steel and developed length from end of beam
Al.prov x( ) if x Ld.add Lend As.add 0 Ap Ns
x Lend
Ld
x Ld Lendif
Ap Ns Ld Lend xyh.brg 0.5 h
slopecgp
0.5 Nh 1
22 in( ) cot slopecgpif
Ap Nh Ns otherwise
0 4 8 12 16 20 24 28 32 36 400
2
4
6
Longitudinal Reinforcement Required and Provided (Half Beam)
Distance along Beam (ft)
Ste
el A
rea
(in2
) Al.req x( )
in2
Al.prov x( )
in2
x
ft
Al.reqishr
Al.req xshrishr
Al.provishr
Al.prov xshrishr
DClong
Al.req
Al.prov
max DClong 0.844
CheckLong if max DClong 1.0 "OK" "No Good" "OK" Longitudinal reinforcement check
A-233

14. SPLITTING RESISTANCE
Splitting Resistance
Checking splitting by zone of transverse reinforcement. Defined in Shear Strength section.
As
Av1
xv2
sv1
3.825 in2
fs 20 ksi Limiting stress in steel for crack control (5.10.10.1)
Pr fs As 76.5 kip Splitting resistance provided (5.10.10.1-1)
Pr.min 0.04 Pj 47.1 kip Minimum splitting resistance required
CheckSplit if Pr Pr.min "OK" "No Good" "OK" Splitting resistance check
15. CAMBER AND DEFLECTIONS
Calculate Deflections due to different weights, joints, and future wearings.
Δps
Pi
Eci Ixg
ycgp Lg2
8
ybg yp.brg αhd L Lend2
61.456 in Deflection due to prestress at release
Δgr5
384
wg Lg4
Eci Ixg
0.427 in Deflection due to self-weight at release
Δbar5
384
wbar Lg4
Ec Ixg
0.124 in Deflection due to barrier weight
2Δj
5
384
wj L4
Ec Ixg
if BeamLoc 0= 1 0.5( ) 0.006 in Deflection due to longitudinal joint
Δfws5
384
wfws L4
Ec Ixg
if BeamLoc 0= 1S Wb
S0.036 in Deflection due to future wearing surface
tbar 20 Age at which barrier is assumed to be cast
T ti 7 14 21 28 60 120 240 ∞T Concrete ages at which camber is computed
A-234
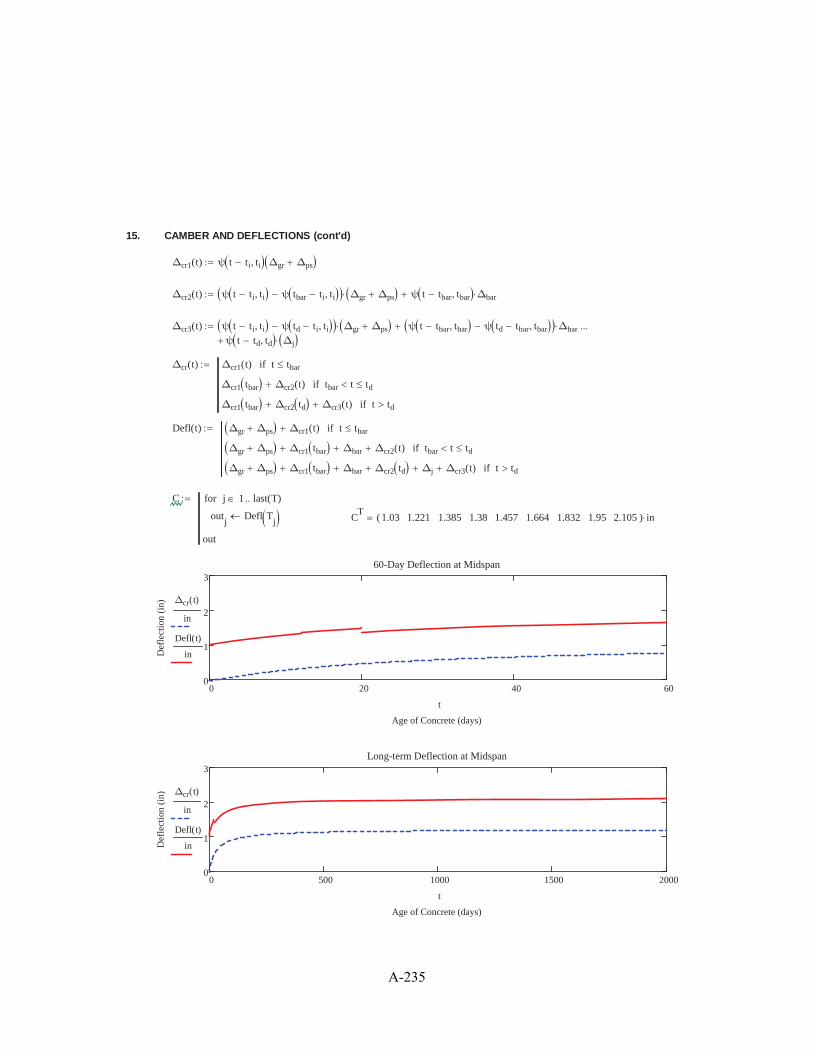
15. CAMBER AND DEFLECTIONS (cont'd)
Δcr1 t( ) ψ t ti ti Δgr Δps
Δcr2 t( ) ψ t ti ti ψ tbar ti ti Δgr Δps ψ t tbar tbar Δbar
Δcr3 t( ) ψ t ti ti ψ td ti ti Δgr Δps ψ t tbar tbar ψ td tbar tbar Δbar
ψ t td td Δj
Δcr t( ) Δcr1 t( ) t tbarif
Δcr1 tbar Δcr2 t( ) tbar t tdif
Δcr1 tbar Δcr2 td Δcr3 t( ) t tdif
Defl t( ) Δgr Δps Δcr1 t( ) t tbarif
Δgr Δps Δcr1 tbar Δbar Δcr2 t( ) tbar t tdif
Δgr Δps Δcr1 tbar Δbar Δcr2 td Δj Δcr3 t( ) t tdif
C
outj
Defl Tj
j 1 last T( )for
out
CT
1.03 1.221 1.385 1.38 1.457 1.664 1.832 1.95 2.105( ) in
0 20 40 600
1
2
360-Day Deflection at Midspan
Age of Concrete (days)
Def
lect
ion
(in) Δcr t( )
in
Defl t( )
in
t
0 500 1000 1500 20000
1
2
3Long-term Deflection at Midspan
Age of Concrete (days)
Def
lect
ion
(in) Δcr t( )
in
Defl t( )
in
t
A-235

16. NEGATIVE MOMENT FLEXURAL STRENGTH
Calculate factored moment that must be resisted across the interior pier and find required steel to be developed in the topflange.
Negative Live Load Moment
Compute the negative moment over the interior support due to the design live load load, in accordance with AASHTO LRFD3.6.1.3.1.
Live Load Truck and Truck Train Moment Calculations
Maximum negative moment due to a singletruckmin Mtruck 738 kip ft
Maximum negative moment due to two trucksin a single lanemin Mtrain 1186 kip ft
Negative moment due to lane load onadjacent spansMneg.lane
wlane L2
21152 kip ft
Mneg.truck Mneg.lane 1 IM( ) min Mtruck 2134 kip ft Live load negative moment for single truck
Live load negative moment for two trucks in asingle laneMneg.train 0.9 Mneg.lane 1 IM( ) min Mtrain 2456 kip ft
Design negative live load moment, per designlaneMHL93.neg min Mneg.truck Mneg.train 2456 kip ft
Design negative live load moment at interiorbeamMll.neg.i MHL93.neg gmint 1644 kip ft
Design negative live load moment at exteriorbeamMll.neg.e MHL93.neg gmext 1712 kip ft
MLL.neg if BeamLoc 1= Mll.neg.e Mll.neg.i 1712 kip ft Design negative live load moment
Factored Negative Design Moment
Dead load applied to the continuity section at interior supports is limited to the future overlay.
Superimposed dead load resisted bycontinuity sectionMDW.neg
wfws L2
2357 kip ft
Mu.neg.StrI 1.5 MDW.neg 1.75 MLL.neg 3532 kip ft Strength Limit State
Mu.neg.StrI 1.0 MDW.neg 1.0 MLL.neg 2069 kip ft Service Limit State
A-236
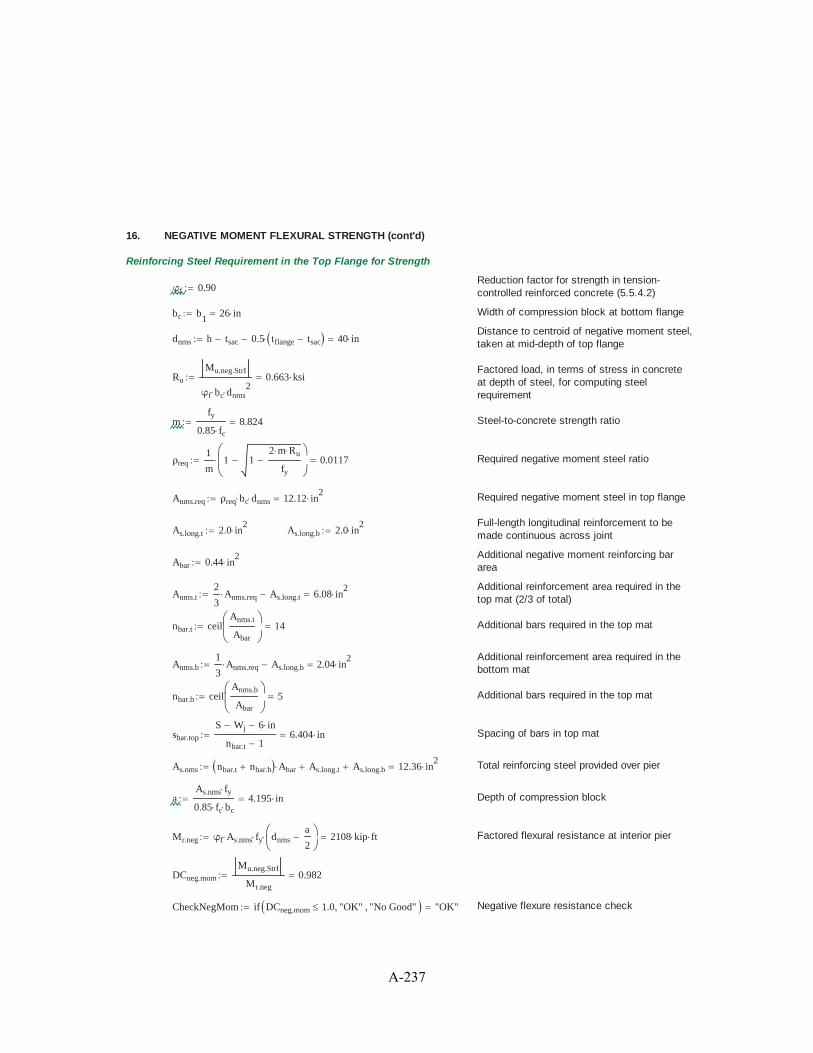
16. NEGATIVE MOMENT FLEXURAL STRENGTH (cont'd)
Reinforcing Steel Requirement in the Top Flange for Strength
Reduction factor for strength in tension-controlled reinforced concrete (5.5.4.2)φf 0.90
bc b1
26 in Width of compression block at bottom flange
Distance to centroid of negative moment steel,taken at mid-depth of top flangednms h tsac 0.5 tflange tsac 40 in
Factored load, in terms of stress in concreteat depth of steel, for computing steelrequirement
Ru
Mu.neg.StrI
φf bc dnms2
0.663 ksi
mfy
0.85 fc
8.824 Steel-to-concrete strength ratio
ρreq1
m1 1
2 m Ru
fy
0.0117 Required negative moment steel ratio
Anms.req ρreq bc dnms 12.12 in2 Required negative moment steel in top flange
Full-length longitudinal reinforcement to bemade continuous across jointAs.long.t 2.0 in
2As.long.b 2.0 in
2
Additional negative moment reinforcing barareaAbar 0.44 in
2
Additional reinforcement area required in thetop mat (2/3 of total)Anms.t
2
3Anms.req As.long.t 6.08 in
2
nbar.t ceilAnms.t
Abar
14 Additional bars required in the top mat
Additional reinforcement area required in thebottom matAnms.b
1
3Anms.req As.long.b 2.04 in
2
nbar.b ceilAnms.b
Abar
5 Additional bars required in the top mat
sbar.top
S Wj 6 in
nbar.t 16.404 in Spacing of bars in top mat
As.nms nbar.t nbar.b Abar As.long.t As.long.b 12.36 in2 Total reinforcing steel provided over pier
aAs.nms fy
0.85 fc bc
4.195 in Depth of compression block
Mr.neg φf As.nms fy dnmsa
22108 kip ft Factored flexural resistance at interior pier
DCneg.mom
Mu.neg.StrI
Mr.neg
0.982
CheckNegMom if DCneg.mom 1.0 "OK" "No Good" "OK" Negative flexure resistance check
A-237

DECKED PRECAST PRESTRESSED CONCRETE GIRDER DESIGN FOR ABC
Unit Definition: kcf kip ft3
This example is for the design of a superstructure system that can be used for rapid bridge replacement in an AcceleratedBridge Construction (ABC) application. The following calculations are intended to provide the designer guidance indeveloping a similar design with regard to design considerationS characteristic of this type of construction, and they shallnot be considered fully exhaustive.
Overall Width, W
Roadway Width, WrBarrierWidth, Wb Joint Width, Wj
Slope, CS
Beam Spacing, SS Wj
2
TYPICAL SECTION THROUGH SPAN
Lend Design Span Length, L
Girder Length, Lg
GIRDER ELEVATION
Bridge Geometry: L 40 ft Lend 2 ft skew 0 deg
W 63 ft Wb 1.5 ft
Smax 8 ft Wj 0.5 ft
Ng ceilW Wj
Smax
8 Minimum number of girders in cross-section
SW Wj
Ng
7.938 ft Girder spacing
File Name: Prestressed Concrete Girder-40ft.xmcd
A-238

ORDER OF CALCULATIONS
Introduction1.Design Philosophy2.Design Criteria3.Beam Section4.Material Properties5.Permanent Loads6.Precast Lifting Weight7.Live Load8.Prestress Properties9.Prestress Losses10.Concrete Stresses11.Flexural Strength12.Shear Strength13.Splitting Resistance14.Camber and Deflections15.Negative Moment Flexural Strength16.
1. INTRODUCTION
The bridge that is designed in this example consists of precast prestressed concrete girders with a top flange equal to thebeam spacing, so the top flange will be the riding surface of the designed bridge. The purpose for these girders is torapidly construct the bridge by providing a precast deck on the girders, which eliminates cast-in-place decks in the fieldand improves safety.
The concepts used in this example have been taken from on-going research, which focuses on the benefits of deckedprecast beams and promoting widespread acceptance from transportation and construction industries. The cross-sectionis adapted from the optimized girder sections recommended by NCHRP Project No. 12-69, Design and ConstructionGuidelines for Long-Span Decked Precast, Prestressed Concrete Girder Bridges. The girder design has not taken intoaccount the option to re-deck due to the final re-decked girder, without additional prestressed, having a shorter life span.Use of stainless steal rebar and the application of a future membrane can get ride of the need to replace the deck. Thiscase is included in “re-deckability”.
The bridge used in this example is a general design of a typical bridge in Georgia. The calculations can be modified forsingle-span and multiple-span bridges due to the beam design moments are not reduced for continuity at intermediatesupports (continuity details are not shown in this example). The cross-section consists of a four-lane roadway withnormal crown, with standard shoulder lengths and barrier walls. The precast prestressed concrete girder has beenuniformly designed to simplify bearing details. The girder flanges are 9’’ at the tips, imitating a 8’’ slab with a ½’’ allowablewear and another ½’’ for smoothness and profile adjustments.
This example is intended to illustrate design aspect specific to precast prestressed concrete girders used for ABCapplication. Girders with uncommon cross-sections, high self-weight, or unconventional load application create majorconcerns and more detailed calculations must be done.
A-239

2. DESIGN PHILOSOPHY
The geometry of the section is based on GDOT standards and general bridges across the state of Georgia. Depthvariations are dependent on the construction company but must maintain the shapes of the top flange and the bottombulb.
Concrete strengths can vary but are mostly between 6 ksi and 10 ksi. For the purpose of these calculations theconcrete with a 28-day minimum compressive strength of 8 ksi is used. Due to its casting sequence this beam isunable to take advantage of composite sequences along with tension at the bottom of the beam at the service limit statebeing limited. This is further discussed in section 4 along with end region stresses being critical. Therefore theminimum concrete strength at release must be 80 percent of the 28-day compressive strength, which increases theallowable stresses at the top and bottom of the section. The prestressed steel can also be optimized to minimizestresses at the end region.
The prestressed steel is arranged in a draped, or harped, pattern to maximize the midspan effectiveness while itminimizes the failure at the end of the beam where is concrete is easily overstressed due to the lack of dead load actingon the beam. The strand group is optimized at the midspan by bundling the strands between hold-points, maximizingthe stiffness of the strand group. The number and deflection angles are depended on the type of single strands you areusing for the girder. In longer span cases the concrete at the end of the girder will be too large and will debond. Withoutharped strands it is unlikely to reduce stresses to the allowable limit, since harped strands are required this method ofstress relief will be used without debonding for long spans.
3. DESIGN CRITERIA
Criteria has been selected to govern the design of these concrete girders while following provisions set by AASHTO,GDOT design specifications, as well as criteria of past projects and current research related to ABC and decked precastsections. A summary of the limiting design values are categorized as section constraints, prestress limits, and concretelimits.
Section Constraints:
Wpc.max 200 kip Upper limit on the weight of the entire precast element, based on common lifting andtransport capabilities without significantly increasing time and/or cost due tounconventional equipment or permits
Smax 8 ft Upper limit on girder spacing and, therefore, girder flange width (defined on first page)
Prestress Limits:
Fhd.single 4 kip Maximum hold-down force for a single strand
Fhd.group 48 kip Maximum hold-down force for the group of harped strands
Stress limits in the prestressing steel immediately prior to prestress and at the service limit state after all losses are asprescribed by AASHTO LRFD.
A-240

3. DESIGN CRITERIA (cont'd)
Concrete Limits:
Allowable concrete stresses meet standards set by AASHTO LRFD with one exception that at Service III Limit State,allowable bottom fiber tension when camber leveling forces are to be neglected, regardless of exposure, are to be 0-ksi.Minimum strength of concrete at release is 80 percent of the 28-day minimum compressive strength (f-ksi).
ft.all.ser 0 ksi Allowable bottom fiber tension at the Service III Limit State, when camber levelingforces are to be neglected, regardless of exposure
As previously mentioned, release concrete strength is specified as 80 percent of the minimum 28-day compressivestrength to maximize allowable stresses in the end region of beam at release.
fc.rel f( ) 0.80 f Minimum strength of concrete at release
Due to various lifting and transportation conditions, stresses in the concrete need to be considered. A “no cracking”approach is used for allowable tension due to reduced lateral stability after cracking. Assuming the girders will be liftedbefore the 28-day minimum strength is attained, the strength of concrete during lifting and transportation is assumed to be90 percent of the 28-day minimum compressive strength. A dynamic dead load allowance of 30 percent is used forcompression during handling. A factor of safety (FS) of 1.5 is used against cracking during handling.
DIM 30% Dynamic dead load allowance
fc.erec f( ) 0.90 f Assumed attained concrete strength during lifting and transportation
FSc 1.5 Factor of safety against cracking during lifting transportation
ft.erec f( )0.24 f ksi
FSc
Allowable tension in concrete during lifting and transportation to avoid cracking
A-241
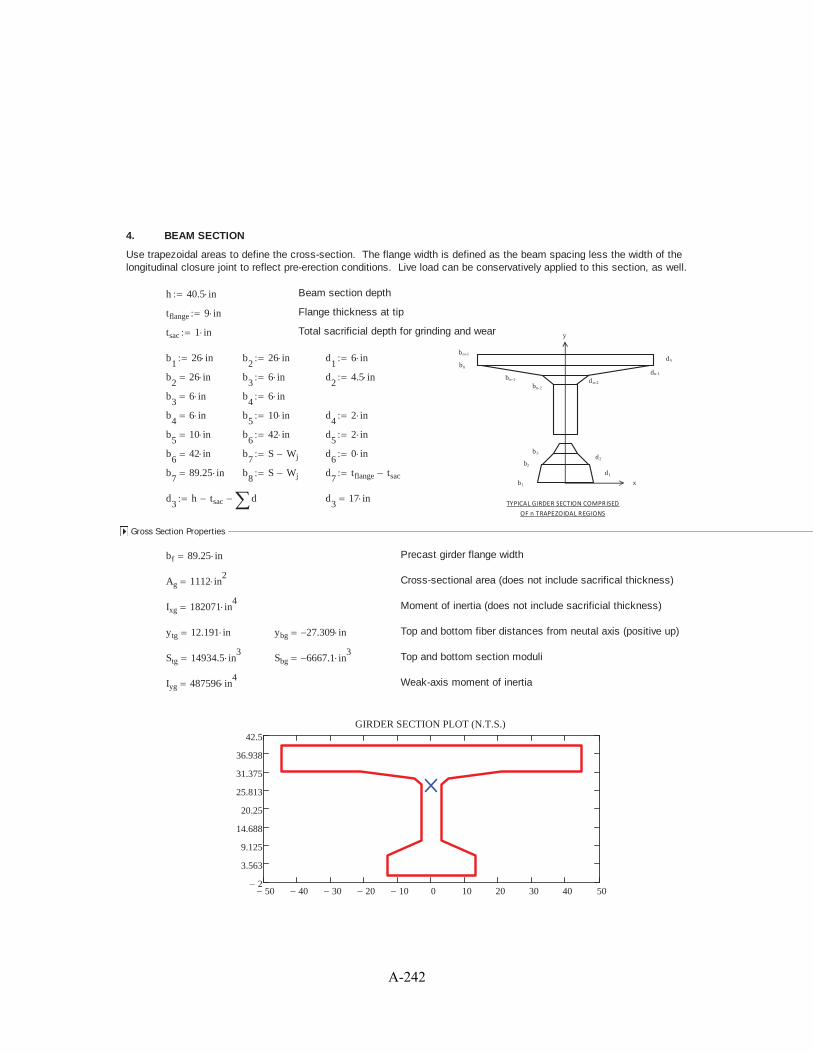
b1
b2
b3
bn+1
bn
bn-1
bn-2
dn
dn-1
dn-2
d1
d2
TYPICAL GIRDER SECTION COMPRISED
OF n TRAPEZOIDAL REGIONS
y
x
4. BEAM SECTION
Use trapezoidal areas to define the cross-section. The flange width is defined as the beam spacing less the width of thelongitudinal closure joint to reflect pre-erection conditions. Live load can be conservatively applied to this section, as well.
h 40.5 in Beam section depth
tflange 9 in Flange thickness at tip
tsac 1 in Total sacrificial depth for grinding and wear
b1
26 in b2
26 in d1
6 in
b2
26 in b3
6 in d2
4.5 in
b3
6 in b4
6 in
b4
6 in b5
10 in d4
2 in
b5
10 in b6
42 in d5
2 in
b6
42 in b7
S Wj d6
0 in
b7
89.25 in b8
S Wj d7
tflange tsac
d3
h tsac d d3
17 in
Gross Section Properties
bf 89.25 in Precast girder flange width
Ag 1112 in2 Cross-sectional area (does not include sacrifical thickness)
Ixg 182071 in4 Moment of inertia (does not include sacrificial thickness)
ytg 12.191 in ybg 27.309 in Top and bottom fiber distances from neutal axis (positive up)
Stg 14934.5 in3
Sbg 6667.1 in3 Top and bottom section moduli
Iyg 487596 in4 Weak-axis moment of inertia
50 40 30 20 10 0 10 20 30 40 502
3.563
9.125
14.688
20.25
25.813
31.375
36.938
42.5GIRDER SECTION PLOT (N.T.S.)
A-242

5. MATERIAL PROPERTIES
These properties are standard (US units) values with equations that can be found in AASHTO LRFD Bridge DesignSpecifications.
Concrete:
fc 8 ksi Minimum 28-day compressive strength of concrete
fci fc.rel fc 6.4 ksi Minimum strength of concrete at release
γc .150 kcf Unit weight of concrete
K1 1.0 Correction factor for standard aggregate (5.4.2.4)
Eci 33000 K1
γc
kcf
1.5
fci ksi 4850 ksi Modulus of elasticity at release (5.4.2.4-1)
Ec 33000 K1
γc
kcf
1.5
fc ksi 5422 ksi Modulus of elasticity (5.4.2.4-1)
fr.cm 0.37 fc ksi 1.047 ksi Modulus of rupture for cracking moment (5.4.2.6)
fr.cd 0.24 fc ksi 0.679 ksi Modulus of rupture for camber and deflection (5.4.2.6)
H 70 Relative humidity (5.4.2.3)
Prestressing Steel:
fpu 270 ksi Ultimate tensile strength
fpy 0.9 fpu 243 ksi Yield strength, low-relaxation strand (Table 5.4.4.1-1)
fpbt.max 0.75 fpu 202.5 ksi Maximum stress in steel immediately prior to transfer
fpe.max 0.80 fpy 194.4 ksi Maximum stress in steel after all losses
Ep 28500 ksi Modulus of elasticity (5.4.4.2)
dps 0.5 in Strand diameter
Ap 0.153 in2 Strand area
Nps.max 40 Maximum number of strands in section
npi
Ep
Eci
5.9 Modular ratio at release
np
Ep
Ec
5.3 Modular ratio
Mild Steel:
A-243

fy 60 ksi Specified minimum yield strength
Es 29000 ksi Modulus of elasticity (5.4.3.2)
A-244

6. PERMANENT LOADS
Permanent loads or dead loads that must be considered are self-weight, diaphragms, barriers, and future wearing surface.The barrier can be cast to the beam before it is taken on sight or attached to the bridge after the joints have reachedsufficient strength. Distribution of the barriers weight should be established once you decide when it would be attached tothe bridge. For this example the barrier has been cast on the exterior girder in the casting yard, before shipping but afterrelease of prestresses. Due to this the dead load is increased on the exterior girders but it eliminates the time-consumingtask that would have been completed in the field.
BeamLoc 1 Location of beam within the cross-section (0 - Interior, 1 - Exterior)
Load at Release:
γc.DL .155 kcf Concrete density used for weight calculations
Ag.DL Ag tsac S Wj 1201.25 in2 Area used for weight calculations, including sacrificial thickness
wg Ag.DL γc.DL 1.293 klf Uniform load due to self-weight, including sacrificial thickness
Lg L 2 Lend 44 ft Span length at release
Mgr x( )wg x
2Lg x Moment due to beam self-weight (supported at ends)
Vgr x( ) wg
Lg
2x Shear due to beam self-weight (supported at ends)
Load at Erection:
Mg x( )wg x
2L x( ) Moment due to beam self-weight
Vg x( ) wgL
2x Shear due to beam self-weight
wbar 0.430 klf Uniform load due to barrier weight, exterior beams only
wbar if BeamLoc 1= wbar 0 0.43 klf Redfine to 0 if interior beam (BeamLoc = 0)
Mbar x( )wbar x
2L x( ) Moment due to beam self-weight
Vbar x( ) wbarL
2x Shear due to beam self-weight
A-245

6. PERMANENT LOADS (cont'd)
Load at Service:
pfws 25 psf Assumed weight of future wearing surface
wfws pfws S 0.198 klf Uniform load due to future wearing surface
Mfws x( )wfws x
2L x( ) Moment due to future wearing surface
Vfws x( ) wfwsL
2x Shear due to future wearing surface
wj Wj d7γc.DL 0.052 klf Uniform load due to weight of longitudinal closure joint
Mj x( )wj x
2L x( ) Moment due to longitudinal closure joint
Vj x( ) wjL
2x Shear due to longitudinal closure joint
A-246
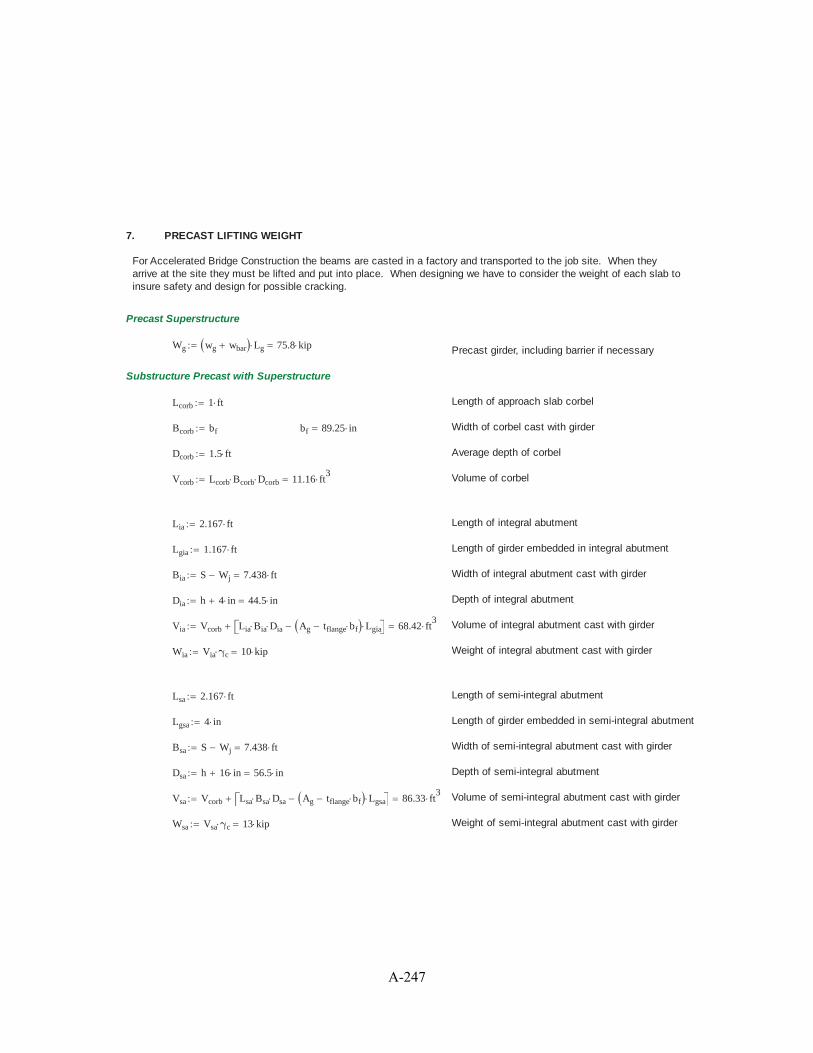
7. PRECAST LIFTING WEIGHT
For Accelerated Bridge Construction the beams are casted in a factory and transported to the job site. When theyarrive at the site they must be lifted and put into place. When designing we have to consider the weight of each slab toinsure safety and design for possible cracking.
Precast Superstructure
Wg wg wbar Lg 75.8 kip Precast girder, including barrier if necessary
Substructure Precast with Superstructure
Lcorb 1 ft Length of approach slab corbel
Bcorb bf bf 89.25 in Width of corbel cast with girder
Dcorb 1.5 ft Average depth of corbel
Vcorb Lcorb Bcorb Dcorb 11.16 ft3 Volume of corbel
Lia 2.167 ft Length of integral abutment
Lgia 1.167 ft Length of girder embedded in integral abutment
Bia S Wj 7.438 ft Width of integral abutment cast with girder
Dia h 4 in 44.5 in Depth of integral abutment
Via Vcorb Lia Bia Dia Ag tflange bf Lgia 68.42 ft3 Volume of integral abutment cast with girder
Wia Via γc 10 kip Weight of integral abutment cast with girder
Lsa 2.167 ft Length of semi-integral abutment
Lgsa 4 in Length of girder embedded in semi-integral abutment
Bsa S Wj 7.438 ft Width of semi-integral abutment cast with girder
Dsa h 16 in 56.5 in Depth of semi-integral abutment
Vsa Vcorb Lsa Bsa Dsa Ag tflange bf Lgsa 86.33 ft3 Volume of semi-integral abutment cast with girder
Wsa Vsa γc 13 kip Weight of semi-integral abutment cast with girder
A-247

Semi-Integral Abutment Backwall Integral Abutment Backwall
A-248

8. LIVE LOAD
When considering Live Loads you must refer to the vertical load section HL-93 in the AASHTO manual. If the project youare working on requires the bridge to support construction loads at any stage, these loads must be considered separatelyand applied. The longitudinal joints are designed for full moment connections so the beams will act as a unit whensufficiently connected. The distribution factors are then computed for cross-section type “j” (defined in AASHTO 4.6.2.2).When calculating the stiffness parameter, the constant- depth region at the top flange is treated like the slab and theremaining area of the beam will be considered a non-composite beam.
Definitions:
Ibb = moment of inertia of section below the top flange
Abb = area of beam section below the top flange
ybb = distance of top fiber below the top flange from neutral axis
ts = thickness of slab not including sacrificial thickness
Distribution Factors for Moment:
From Table 4.6.2.2.2b-1 for moment in interior girders,
Ibb 44410 in4 Moment of inertia of section below the top flange
Abb 398 in2 Area of beam section below the top flange
eg h tsac
ts
2ybb 22.886 in Distance between c.g.'s of beam and flange
Kg 1.0 Ibb Abb eg2
252876 in4 Longitudinal stiffness parameter (Eqn. 4.6.2.2.1-1)
Verify this girder design is within the range of applicability for Table 4.6.2.2.2b-1.
CheckMint if S 16 ft( ) S 3.5 ft( ) ts 4.5 in ts 12.0 in L 20 ft( ) L 240 ft( ) "OK" "No Good"
CheckMint if CheckMint "OK"=( ) Ng 4 Kg 10000 in4
Kg 7000000 in4
"OK" "No Good"
CheckMint "OK"
gmint1 0.06S
14 ft
0.4S
L
0.3 Kg
L ts3
0.1
0.552 Single loaded lane
gmint2 0.075S
9.5 ft
0.6S
L
0.2 Kg
L ts3
0.1
0.727 Two or more loaded lanes
gmint max gmint1 gmint2 0.727 Distribution factor for moment at interior beams
A-249

8. LIVE LOAD (cont'd)
From Table 4.6.2.2.2d-1 for moment in exterior girders,
Distance from centerline of exterior beam to edgeof curb or barrierde
S
2Wb 29.625 in
CheckMext if de 1 ft de 5.5 ft Ng 4 "OK" "No Good" "OK"
For a single loaded lane, use the Lever Rule.
gmext1
S 0.5 bf Wb 5 ft
S0.65 Single loaded lane
em 0.77de
9.1 ft1.041 Correction factor for moment (Table 4.6.2.2.2d-1)
gmext2 em gmint 0.757 Two or more loaded lanes
gmext max gmext1 gmext2 0.757 Distribution factor for moment at exterior beams
Distribution Factors for Shear:
From Table 4.6.2.2.3a-1 for shear in interior girders,
Verify this girder design is within the range of applicability for Table 4.6.2.2.3a-1.
CheckVint if S 16 ft( ) S 3.5 ft( ) ts 4.5 in ts 12.0in L 20 ft( ) L 240 ft( ) "OK" "No Good"
CheckVint if CheckMint "OK"=( ) Ng 4 "OK" "No Good"
CheckVint "OK"
gvint1 0.36S
25 ft0.678 Single loaded lane
gvint2 0.2S
12 ft
S
35 ft
2.0
0.81 Two or more loaded lanes
gvint max gvint1 gvint2 0.81 Distribution factor for shear at interior beams
A-250

8. LIVE LOAD (cont'd)
From Table 4.6.2.2.3b-1 for shear in exterior girders,
For a single loaded lane, use the Lever Rule.
CheckVext if de 1 ft de 5.5 ft Ng 4 "OK" "No Good" "OK"
g1
S 0.5 bf Wb 5 ft
S0.65 Single loaded lane (same as for moment)
Correction factor for shear (Table 4.6.2.2.3b-1)ev 0.6
de
10 ft0.847
g2 ev gvint 0.686 Two or more loaded lanes
gvext max g1 g2 0.686 Distribution factor for shear at exterior beams
From Table 4.6.2.2.3c-1 for skewed bridges,
θ skew 0 deg
CheckSkew if θ 60 deg( ) 3.5 ft S 16 ft( ) 20 ft L 240 ft( ) Ng 4 "OK" "No Good" "OK"
cskew 1.0 0.20L ts
3
Kg
0.3
tan θ( ) 1.00 Correction factor for skew
A-251

8. LIVE LOAD (cont'd)
Design Live Load Moment at Midspan:
wlane 0.64 klf Design lane load
Ptruck 32 kip Design truck axle load
IM 33% Dynamic load allowance (truck only)
Mlane x( )wlane x
2L x( ) Design lane load moment
Influence coefficient for truck moment calculationδ x( )
x L x2
L
Mtruck x( ) Ptruck δ x( ) max9 x L x( ) 14 ft 3 x L( )
4 x L x( )
9 L x( ) 84 ft
4 L x( )Design truck moment
MHL93 x( ) Mlane x( ) 1 IM( ) Mtruck x( ) HL93 design live load moment per lane
Mll.i x( ) MHL93 x( ) gmint Design live load moment at interior beam
Mll.e x( ) MHL93 x( ) gmext Design live load moment at exterior beam
Mll x( ) if BeamLoc 1= Mll.e x( ) Mll.i x( ) Design live load moment
Design Live Load Shear:
Vlane x( ) wlaneL
2x Design lane load shear
Vtruck x( ) Ptruck9 L 9 x 84 ft
4 LDesign truck shear
VHL93 x( ) Vlane x( ) 1 IM( ) Vtruck x( ) HL93 design live load shear
Vll.i x( ) VHL93 x( ) gvint Design live load shear at interior beam
Vll.e x( ) VHL93 x( ) gvext Design live load shear at exterior beam
Vll x( ) if BeamLoc 1= Vll.e x( ) Vll.i x( ) Design live load shear
A-252

9. PRESTRESS PROPERTIES
Due to tension at the surface limit state be reduced to account for camber leveling forces, the prestress force required atthe midspan is expected to be excessive at the ends when released. Not measuring the reduction of prestress moments.Estimate prestress losses at the midspan to find trial prestress forces, that will occur in the bottom tension fibers, that areless than allowable. Compute immediate losses in the prestressed steel and check released stresses at the end of thebeam. Once you satisfy end stresses, estimate total loss of prestress. As long as these losses are not drasticallydifferent from the assumed stresses, the prestress layout should be acceptable. Concrete stress at all limit states are inSection 9.
yp.est 5 in Assumed distance from bottom of beam to centroid of prestress at midspan
ycgp.est ybg yp.est 22.31 in Eccentricity of prestress from neutral axis, based on assumed location
Δfp.est 25% Estimate of total prestress losses at the service limit state
Compute bottom fiber service stresses at midspan using gross section properties.
XL
2Distance from support
Mdl.ser Mg X( ) Mfws X( ) Mj X( ) Mbar X( ) 395 kip ft Total dead load moment
fb.serIII
Mdl.ser 0.8 Mll X( )
Sbg
1.487 ksi Total bottom fiber service stress
fpj fpbt.max 202.5 ksi Prestress jacking force
fpe.est fpj 1 Δfp.est 151.9 ksi Estimate of effective prestress force
Aps.est Ag
fb.serIII ft.all.ser
fpe.est
1Ag ycgp.est
Sbg
2.307 in2 Estimated minimum area of prestressing steel
Nps.est ceilAps.est
Ap
16 Estimated number of strands required
Nps 38 Number of strands used ( Nps.max 40 )
The number above is used for the layout strand pattern and to compute the actual location of the strand group. After this isdone the required area is computed again. If the estimated location is accurate the number of strands should be equal tothe number of strands that we calculated above. The number of strands that was estimated was based on our assumedprestressed losses and gross section properties, which may not accurately reflect the final number of strands required forthe design. These stresses for concrete are evaluated in Section 10. The geometry is assuming a vertical spacing of 2” between straight spans, as well as 2” for harped strands at the end of thebeam. Harped strands are bundled at the midspan where the centroid is 5” from the bottom.
A-253

9. PRESTRESS PROPERTIES (cont'd)
Nh 2 Nps 12if
4 12 Nps 24if
6 24 Nps 30if
6 Nps 30 Nps 30if
Nh 14 Assumes all flange rows are filled prior to fillingrows in web above the flange, which maximizedefficiency. Use override below to shift strandsfrom flange to web if needed to satisfy endstresses.
Additional harped strands in web (strands to bemoved from flange to web)Nh.add 16
16 strands or half of total strands maximumharped in webNh min Nh Nh.add 16 2 floor
Nps
4Nh 16
yh 1 in 2 in( ) 10.5 Nh 1
2yh 10 in Centroid of harped strands from bottom, equally
spaced
yhb 5 in Centroid of harped strands from bottom, bundled
Ns Nps Nh Ns 22 Number of straight strands in flange
ys 1 in 2 in Ns 10if
4 in( ) Ns 20 in
Ns
10 Ns 20if
6 in( ) Ns 60 in
Ns
20 Ns 24if
3.5 in otherwise
ys 4.273 in Centroid of straight strands from bottom
yp
Ns ys Nh yhb
Ns Nh
4.579 in Centroid of prestress from bottom at midspan
ycgp ybg yp 22.73 in Eccentricity of prestress from neutral axis
Aps.req Ag
fb.serIII ft.all.ser
fpe.est
1Ag ycgp
Sbg
2.273 in2 Estimated minimum area of prestressing steel
Nps.req ceilAps.req
Ap
15 Estimated number of strands required
CheckNps if Nps Nps.max Nps.req Nps "OK" "No Good" "OK"
Aps.h Nh Ap 2.448 in2 Area of prestress in web (harped)
Aps.s Ns Ap 3.366 in2 Area of prestress in flange (straight)
Aps Aps.h Aps.s 5.814 in2 Total area of prestress
A-254

9. PRESTRESS PROPERTIES (cont'd)
Compute transformed section properties based on prestress layout.
Transformed Section Properties
Initial Transformed Section (release): Final Transformed Section (service):
Ati 1140.4 in2
Atf 1136.7 in2
Ixti 196354 in4
Ixtf 194576 in4
ytti 12.756 in Stti 15393 in3
yttf 12.686 in Sttf 15338 in3
ycgpi 22.165 in Scgpi 8859 in3
ycgpf 22.235 in Scgpf 8751 in3
ybti 26.744 in Sbti 7342 in3
ybtf 26.814 in Sbtf 7257 in3
Determine initial prestress force after instantaneous loss due to elastic shortening. Use transformed properties to computestress in the concrete at the level of prestress.
Pj fpj Aps 1177.3 kip Jacking force in prestress, prior to losses
Stress in concrete at the level of prestress afterinstantaneous lossesfcgpi Pj
1
Ati
ycgpi
Scgpi
Mgr
Lg
2
Scgpi
3.554 ksi
Prestress loss due to elastic shortening(5.9.5.2.3a-1)ΔfpES npi fcgpi 20.886 ksi
fpi fpj ΔfpES 181.614 ksi Initial prestress after instantaneous losses
Pi fpi Aps 1055.9 kip Initial prestress force
Determine deflection of harped strands required to satisfy allowable stresses at the end of the beam at release.
fc.all.rel 0.6 fci 3.84 ksi Allowable compression before losses (5.9.4.1.1)
ft.all.rel max 0.0948 fci ksi 0.2 ksi 0.200 ksi Allowable tension before losses (Table 5.9.4.1.2-1)
Lt 60 dps 2.5 ft Transfer length (AASHTO 5.11.4.1)
ycgp.t
ft.all.rel
Mgr Lt
Stti
Pi
1
Ati
Stti 17.176 in Prestress eccentricity required for tension
ycgp.b
fc.all.rel
Mgr Lt
Sbti
Pi
1
Ati
Sbti 21.025 in Prestress eccentricity required for compression
A-255

9. PRESTRESS PROPERTIES (cont'd)
ycgp.req max ycgp.t ycgp.b 17.176 in Required prestress eccentricity at end of beam
Minimum distance to harped prestress centroidfrom bottom of beam at centerline of bearingyh.brg.req
ycgp.req ybti Ns Nh ys Ns
Nh
16.848 in
Minimum distance between uppermost strand andtop of beamytop.min 18 in
αhd 0.4 Hold-down point, fraction of the design span length
Maximum slope of an individual strand to limithold-down force to 4 kips/strandslopemax if dps 0.6 in=
1
12
1
80.125
Set centroid of harped strands as high as possibleto minimize release and handling stressesyh.brg h ytop.min
0.5 Nh 1
22 in( ) 15.5 in
yh.brg min yh.brg yhb slopemax αhd L 15.5 in Verify that slope requirement is satisfied atuppermost strand
CheckEndPrestress if yh.brg yh.brg.req "OK" "Verify release stresses." "Verify release stresses."
yp.brg
Ns ys Nh yh.brg
Ns Nh
9 in Centroid of prestress from bottom at bearing
slopecgp
yp.brg yp
αhd L0.023 Slope of prestress centroid within the harping length
ypx x( ) yp slopecgp Lend αhd L x x Lend αhd Lif
yp otherwise
Distance to center of prestress from thebottom of the beam at any position
A-256

10. PRESTRESS LOSSES
Prestressed losses can be evaluated like regular concrete, in short-term and long-term losses. When the beam is apretension girder there are instantaneous losses when the beam is shortened upon release of the prestress forces.Time-dependent losses happen when the beam is under creep and shrinkage of the beam concrete, creep and shrinkage othe deck concrete, and the relaxation of prestressed steel. These long term effects are separated into two stages thatrepresent significant events in bridge construction. The first stage is the time between transfer of the prestress forces andplacement of the decked beam and the second is the period of time between placement of the deck and the final serviceload. For decked beams the computation of long-term losses is slightly simplified due to the cross-section not changingbetween the two stages and the shrinkage term of the deck concrete is eliminated since the deck and beam being casttogether. No losses or gains in the steel associated with deck placement after transfer.
AASHTO methods for estimating time-dependent losses: Approximate Estimate (5.9.5.3)Refined Estimate (5.9.5.4)
The Approximate method is based on systems with composite decks and is based on the following assumptions: timing ofload application, the cross-section in which the load is applied, and the ratio of dead and live loads to the total load. Theconditions for the beams to be fabricated, formed and loaded depend on conditions assumed in the development of theapproximate method. The refined method is used to estimate time-dependent losses in the prestressed steel.
Equations 5.9.5.4 are time-dependent and calculate the age-adjustment factors that effect losses using gross sectionproperties.
ti 1 Time (days) between casting and release of prestress
tb 20 Time (days) to barrier casting (exterior girder only)
td 30 Time (days) to erection of precast section, closure joint pour
tf 20000 Time (days) to end of service life
Terms and equations used in the loss calculations:
Prestressing steel factor for low-relaxation strands(C5.9.5.4.2c)KL 45
VSAg
Peri3.911 in Volume-to-surface ratio of the precast section
ks max 1.45 0.13VS
in1.0 1.00 Factor for volume-to-surface ratio (5.4.2.3.2-2)
khc 1.56 0.008 H 1.00 Humidity factor for creep (5.4.2.3.2-3)
khs 2.00 0.014 H 1.02 Humidity factor for shrinkage (5.4.2.3.3-2)
kf5
1fci
ksi
0.676 Factor for effect of concrete strength (5.4.2.3.2-4)
A-257

10. PRESTRESS LOSSES (cont'd)
ktd t( )t
61 4fci
ksit
Time development factor (5.4.2.3.2-5)
ψ t tinit 1.9 ks khc kf ktd t( ) tinit0.118 Creep coefficient (5.4.2.3.2-1)
εsh t( ) ks khs kf ktd t( ) 0.48 103 Concrete shrinkage strain (5.4.2.3.3-1)
Time from Transfer to Erection:
Eccentricity of prestress force with respect to the neutral axis of thegross non-composite beam, positive below the beam neutral axisepg yp ybg 22.73 in
Stress in the concrete at the center prestressimmediately after transferfcgp Pi
1
Ag
epg2
Ixg
MgL
2
Ixg
yp ybg 3.558 ksi
fpt max fpi 0.55 fpy 181.614 ksi Stress in strands immediately after transfer (5.9.5.4.2c-1)
ψbid ψ td ti 0.589 Creep coefficient at erection due to loading at transfer
ψbif ψ tf ti 1.282 Creep coefficient at final due to loading at transfer
εbid εsh td ti 1.490 104 Concrete shrinkage between transfer and erection
Kid1
1 npi
Aps
Ag
1Ag epg
2
Ixg
1 0.7 ψbif
0.805 Age-adjusted transformed section coefficient(5.9.5.4.2a-2)
ΔfpSR εbid Ep Kid 3.418 ksi Loss due to beam shrinkage(5.9.5.4.2a-1)
ΔfpCR npi fcgp ψbid Kid 9.913 ksi Loss due to creep(5.9.5.4.2b-1)
ΔfpR1
fpt
KL
log 24 td
log 24 ti
fpt
fpy
0.55 13 ΔfpSR ΔfpCR
fpt
Kid 1.035 ksi Loss due to relaxation(C5.9.5.4.2c-1
Δfpid ΔfpSR ΔfpCR ΔfpR1 14.366 ksi
A-258

10. PRESTRESS LOSSES (cont'd)
Time from Erection to Final:
epc epg 22.73 in Eccentricity of prestress force does not change
Ac Ag Ic Ixg Section properties remain unchanged
Change in concrete stress at center of prestress due toinitial time-dependent losses and superimposed deadload. Deck weight is not included for this design.
Δfcd
MfwsL
2Mj
L
2
Scgpf
Δfpid
np
2.665 ksi
ψbdf ψ tf td 0.858 Creep coefficient at final due to loading at erection
εbif εsh tf ti 3.302 104 Concrete shrinkage between transfer and final
εbdf εbif εbid 1.813 104 Concrete shrinkage between erection and final
Kdf1
1 npi
Aps
Ac
1Ac epc
2
Ic
1 0.7 ψbif
0.805 Age-adjusted transformed section coefficientremains unchanged
ΔfpSD εbdf Ep Kdf 4.159 ksi Loss due to beam shrinkage
ΔfpCD npi fcgp ψbif ψbid Kdf np Δfcd ψbdf Kdf 21.331 ksi Loss due to creep
ΔfpR2 ΔfpR1 1.035 ksi Loss due to relaxation
ΔfpSS 0 Loss due to deck shrinkage
Δfpdf ΔfpSD ΔfpCD ΔfpR2 ΔfpSS 26.525 ksi
Prestress Loss Summary
ΔfpES 20.886 ksiΔfpES
fpj
10.3 %
ΔfpLT Δfpid Δfpdf 40.891 ksiΔfpLT
fpj
20.2 %
ΔfpTotal ΔfpES ΔfpLT 61.777 ksiΔfpTotal
fpj
30.5 % Δfp.est 25 %
fpe fpj ΔfpTotal 140.7 ksi Final effective prestress
CheckFinalPrestress if fpe fpe.max "OK" "No Good" "OK"
A-259
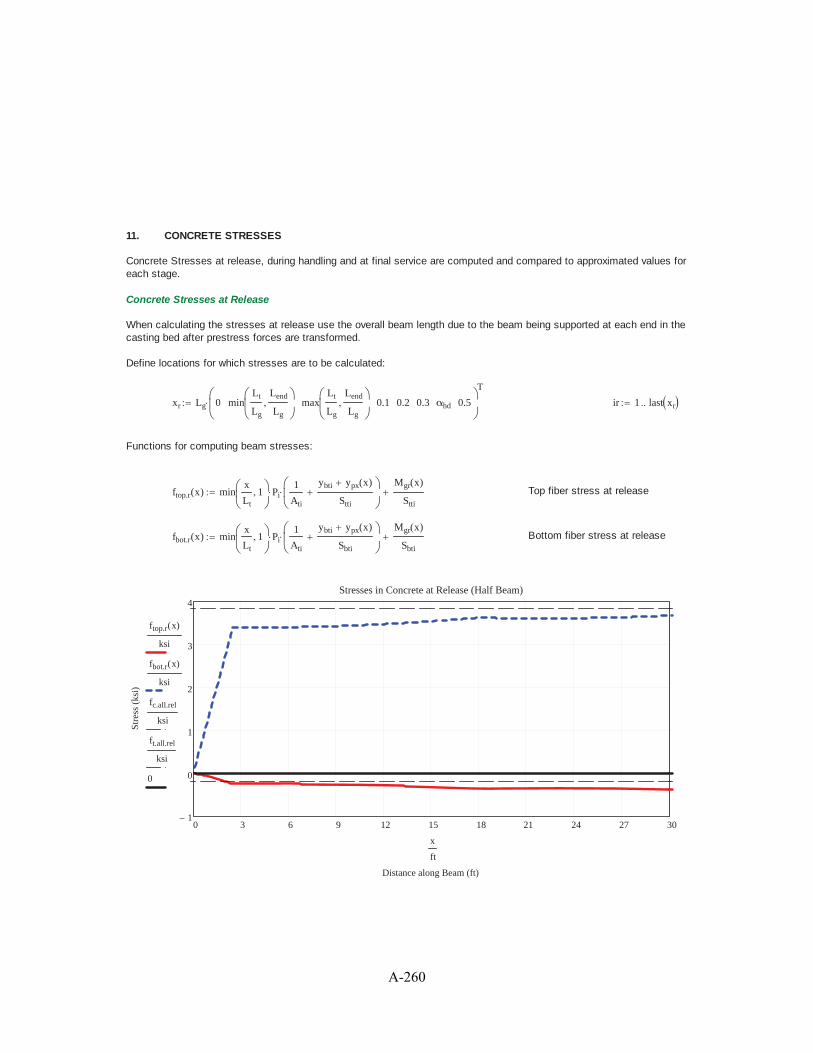
11. CONCRETE STRESSES
Concrete Stresses at release, during handling and at final service are computed and compared to approximated values foreach stage.
Concrete Stresses at Release
When calculating the stresses at release use the overall beam length due to the beam being supported at each end in thecasting bed after prestress forces are transformed.
Define locations for which stresses are to be calculated:
xr Lg 0 minLt
Lg
Lend
Lg
maxLt
Lg
Lend
Lg
0.1 0.2 0.3 αhd 0.5
T
ir 1 last xr
Functions for computing beam stresses:
ftop.r x( ) minx
Lt
1 Pi1
Ati
ybti ypx x( )
Stti
Mgr x( )
Stti
Top fiber stress at release
fbot.r x( ) minx
Lt
1 Pi1
Ati
ybti ypx x( )
Sbti
Mgr x( )
Sbti
Bottom fiber stress at release
0 3 6 9 12 15 18 21 24 27 301
0
1
2
3
4Stresses in Concrete at Release (Half Beam)
Distance along Beam (ft)
Str
ess
(ksi
)
ftop.r x( )
ksi
fbot.r x( )
ksi
fc.all.rel
ksi
ft.all.rel
ksi
0
x
ft
A-260

11. CONCRETE STRESSES (cont'd)
Compare beam stresses to allowable stresses.
ft.all.rel 0.2 ksi Allowable tension at release
fc.all.rel 3.84 ksi Allowable compression at release
TopRelir
ftop.r xrir
TopRelT
0.000 0.191 0.248 0.249 0.264 0.299 0.353 0.351( ) ksi
CheckTopRel if max TopRel( ) fc.all.rel min TopRel( ) ft.all.rel "OK" "No Good" "No Good"
BotRelir
fbot.r xrir
BotRelT
0.000 2.693 3.388 3.389 3.421 3.493 3.607 3.602( ) ksi
CheckBotRel if max BotRel( ) fc.all.rel min BotRel( ) ft.all.rel "OK" "No Good" "OK"
Concrete Stresses During Lifting and Transportation
Lifting and transportation stresses can govern over final stresses due to different support locations, dynamic effects thatdead load can cause during movement, bending stresses during lifting and superelevation of the roadway in shipping. Enddiaphragms on both ends are assumed. For prestressing effects, calculate the effective prestressed force losses betweentransfer and building.
a h 3.375 ft Maximum distance to lift point from bearing line
a' a Lend 5.375 ft Distance to lift point from end of beam
Pdia max Wia Wsa 12.9 kip Approximate abutment weight
Pm Pj 1ΔfpES Δfpid
fpj
972.4 kip Effective prestress during lifting and shipping
Define locations for which stresses are to be calculated:
xe Lg 0 minLt
Lg
Lend
Lg
maxLt
Lg
Lend
Lg
a'
Lg
αhd 0.5
T
ie 1 last xe
Compute moment in the girder during lifting with supports at the lift points.
Mlift x( )wg wbar x
2
2Pdia x x a'if
Mgr x( ) Mgr a'( )wg wbar a'( )
2
2Pdia a' otherwise
A-261

11. CONCRETE STRESSES (cont'd)
Functions for computing beam stresses:
ftop.lift x( ) minx
Lt
1 Pm1
Atf
ybtf ypx x( )
Sttf
Mlift x( )
Sttf
Top fiber stress during lifting
Top fiber stress during lifting,impact increasing dead loadftop.DIM.inc x( ) min
x
Lt
1 Pm1
Atf
ybtf ypx x( )
Sttf
Mlift x( )
Sttf
1 DIM( )
Top fiber stress during lifting,impact decreasing dead loadftop.DIM.dec x( ) min
x
Lt
1 Pm1
Atf
ybtf ypx x( )
Sttf
Mlift x( )
Sttf
1 DIM( )
TopLift1ie
ftop.lift xeie
TopLift1T
0.000 0.242 0.312 0.407 0.491 0.488( ) ksi
TopLift2ie
ftop.DIM.inc xeie
TopLift2T
0.000 0.249 0.321 0.429 0.474 0.469( ) ksi
TopLift3ie
ftop.DIM.dec xeie
TopLift3T
0.000 0.235 0.303 0.385 0.508 0.508( ) ksi
fbot.lift x( ) minx
Lt
1 Pm1
Atf
ybtf ypx x( )
Sbtf
Mlift x( )
Sbtf
Bottom fiber stress during lifting
Bottom fiber stress during lifting,impact increasing dead loadfbot.DIM.inc x( ) min
x
Lt
1 Pm1
Atf
ybtf ypx x( )
Sbtf
Mlift x( )
Sbtf
1 DIM( )
Bottom fiber stress during lifting,impact decreasing dead loadfbot.DIM.dec x( ) min
x
Lt
1 Pm1
Atf
ybtf ypx x( )
Sbtf
Mlift x( )
Sbtf
1 DIM( )
BotLift1ie
fbot.lift xeie
BotLift1T
0.000 2.643 3.323 3.524 3.702 3.696( ) ksi
BotLift2ie
fbot.DIM.inc xeie
BotLift2T
0.000 2.657 3.342 3.571 3.666 3.654( ) ksi
BotLift3ie
fbot.DIM.dec xeie
BotLift3T
0.000 2.628 3.305 3.477 3.737 3.737( ) ksi
Allowable stresses during handling:
fcm fc.erec fc 7.2 ksi Assumed concrete strength when handling operations begin
fc.all.erec 0.6 fcm 4.32 ksi Allowable compression during lifting and shipping
ft.all.erec ft.erec fcm 0.429 ksi Allowable tension during lifting and shipping
A-262
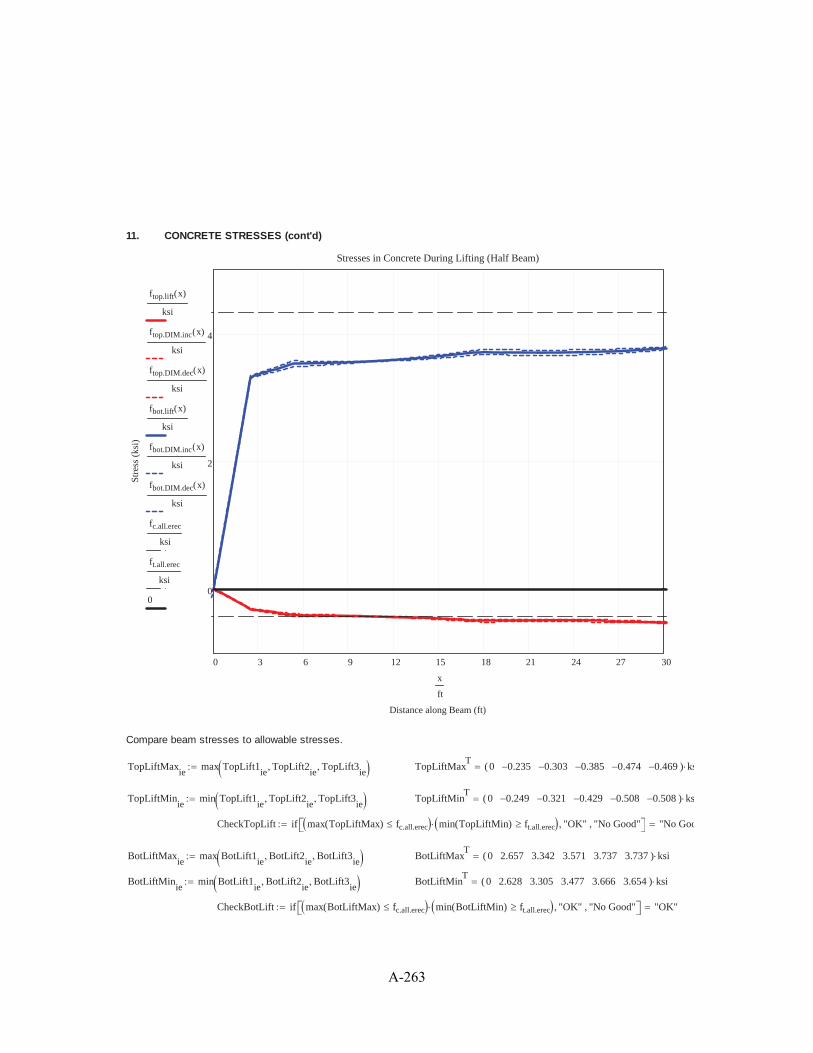
11. CONCRETE STRESSES (cont'd)
0 3 6 9 12 15 18 21 24 27 30
0
2
4
Stresses in Concrete During Lifting (Half Beam)
Distance along Beam (ft)
Str
ess
(ksi
)
ftop.lift x( )
ksi
ftop.DIM.inc x( )
ksi
ftop.DIM.dec x( )
ksi
fbot.lift x( )
ksi
fbot.DIM.inc x( )
ksi
fbot.DIM.dec x( )
ksi
fc.all.erec
ksi
ft.all.erec
ksi
0
x
ft
Compare beam stresses to allowable stresses.
TopLiftMaxie
max TopLift1ie
TopLift2ie
TopLift3ie
TopLiftMaxT
0 0.235 0.303 0.385 0.474 0.469( ) ks
TopLiftMinie
min TopLift1ie
TopLift2ie
TopLift3ie
TopLiftMinT
0 0.249 0.321 0.429 0.508 0.508( ) ks
CheckTopLift if max TopLiftMax( ) fc.all.erec min TopLiftMin( ) ft.all.erec "OK" "No Good" "No Goo
BotLiftMaxie
max BotLift1ie
BotLift2ie
BotLift3ie
BotLiftMaxT
0 2.657 3.342 3.571 3.737 3.737( ) ksi
BotLiftMinie
min BotLift1ie
BotLift2ie
BotLift3ie
BotLiftMinT
0 2.628 3.305 3.477 3.666 3.654( ) ksi
CheckBotLift if max BotLiftMax( ) fc.all.erec min BotLiftMin( ) ft.all.erec "OK" "No Good" "OK"
A-263
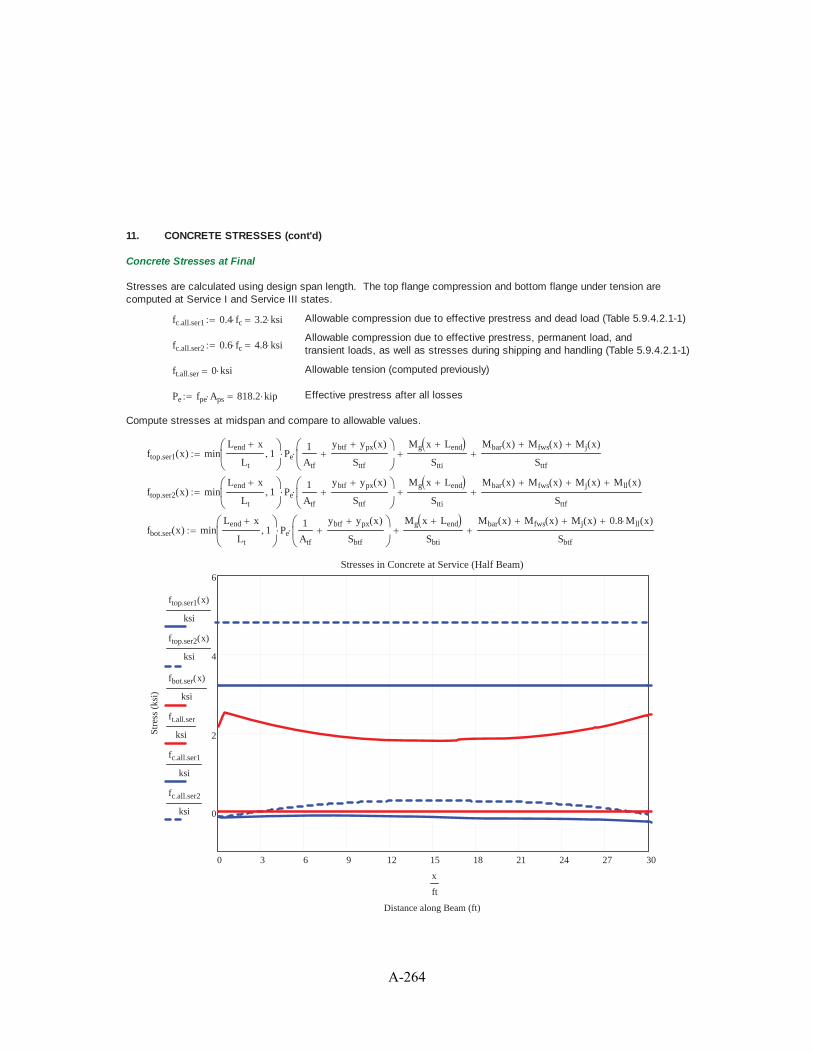
11. CONCRETE STRESSES (cont'd)
Concrete Stresses at Final
Stresses are calculated using design span length. The top flange compression and bottom flange under tension arecomputed at Service I and Service III states.
fc.all.ser1 0.4 fc 3.2 ksi Allowable compression due to effective prestress and dead load (Table 5.9.4.2.1-1)
Allowable compression due to effective prestress, permanent load, andtransient loads, as well as stresses during shipping and handling (Table 5.9.4.2.1-1)fc.all.ser2 0.6 fc 4.8 ksi
ft.all.ser 0 ksi Allowable tension (computed previously)
Pe fpe Aps 818.2 kip Effective prestress after all losses
Compute stresses at midspan and compare to allowable values.
ftop.ser1 x( ) minLend x
Lt
1 Pe1
Atf
ybtf ypx x( )
Sttf
Mg x Lend
Stti
Mbar x( ) Mfws x( ) Mj x( )
Sttf
ftop.ser2 x( ) minLend x
Lt
1 Pe1
Atf
ybtf ypx x( )
Sttf
Mg x Lend
Stti
Mbar x( ) Mfws x( ) Mj x( ) Mll x( )
Sttf
fbot.ser x( ) minLend x
Lt
1 Pe1
Atf
ybtf ypx x( )
Sbtf
Mg x Lend
Sbti
Mbar x( ) Mfws x( ) Mj x( ) 0.8 Mll x( )
Sbtf
0 3 6 9 12 15 18 21 24 27 30
0
2
4
6Stresses in Concrete at Service (Half Beam)
Distance along Beam (ft)
Str
ess
(ksi
)
ftop.ser1 x( )
ksi
ftop.ser2 x( )
ksi
fbot.ser x( )
ksi
ft.all.ser
ksi
fc.all.ser1
ksi
fc.all.ser2
ksi
x
ft
A-264
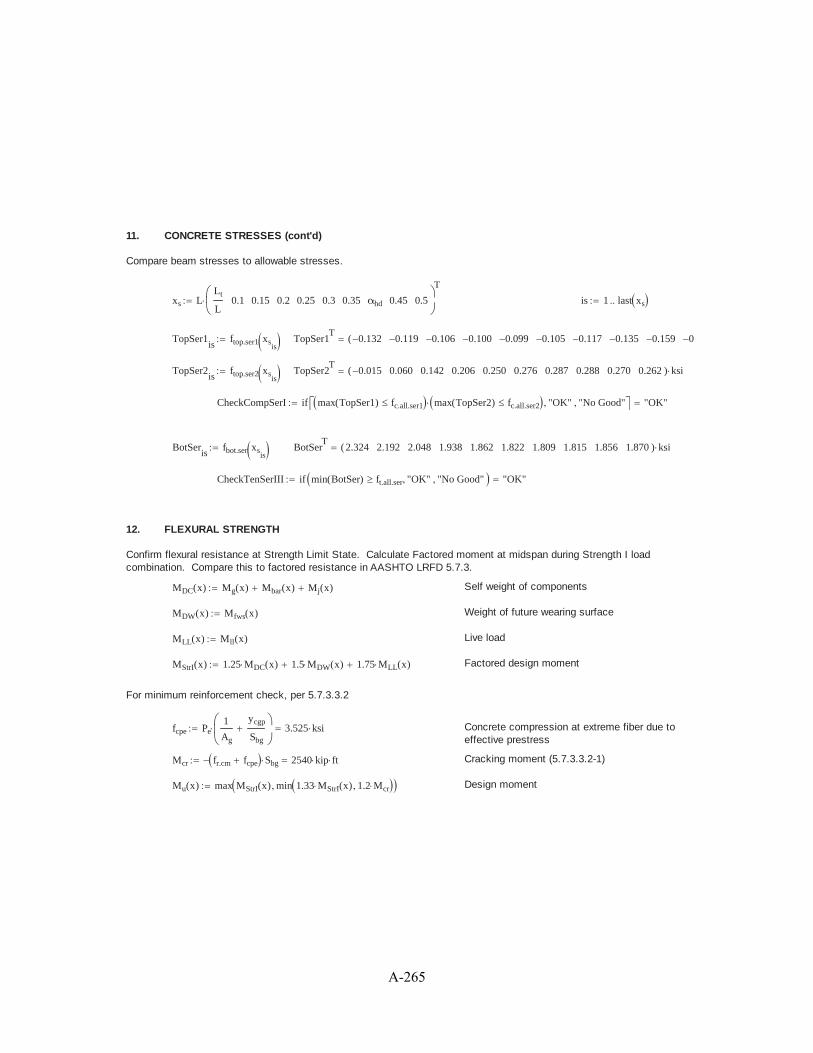
11. CONCRETE STRESSES (cont'd)
Compare beam stresses to allowable stresses.
xs LLt
L0.1 0.15 0.2 0.25 0.3 0.35 αhd 0.45 0.5
T
is 1 last xs
TopSer1is
ftop.ser1 xsis
TopSer1T
0.132 0.119 0.106 0.100 0.099 0.105 0.117 0.135 0.159 0(
TopSer2is
ftop.ser2 xsis
TopSer2T
0.015 0.060 0.142 0.206 0.250 0.276 0.287 0.288 0.270 0.262( ) ksi
CheckCompSerI if max TopSer1( ) fc.all.ser1 max TopSer2( ) fc.all.ser2 "OK" "No Good" "OK"
BotSeris
fbot.ser xsis
BotSerT
2.324 2.192 2.048 1.938 1.862 1.822 1.809 1.815 1.856 1.870( ) ksi
CheckTenSerIII if min BotSer( ) ft.all.ser "OK" "No Good" "OK"
12. FLEXURAL STRENGTH
Confirm flexural resistance at Strength Limit State. Calculate Factored moment at midspan during Strength I loadcombination. Compare this to factored resistance in AASHTO LRFD 5.7.3.
MDC x( ) Mg x( ) Mbar x( ) Mj x( ) Self weight of components
MDW x( ) Mfws x( ) Weight of future wearing surface
MLL x( ) Mll x( ) Live load
MStrI x( ) 1.25 MDC x( ) 1.5 MDW x( ) 1.75 MLL x( ) Factored design moment
For minimum reinforcement check, per 5.7.3.3.2
fcpe Pe1
Ag
ycgp
Sbg
3.525 ksi Concrete compression at extreme fiber due toeffective prestress
Mcr fr.cm fcpe Sbg 2540 kip ft Cracking moment (5.7.3.3.2-1)
Mu x( ) max MStrI x( ) min 1.33 MStrI x( ) 1.2 Mcr Design moment
A-265

12. FLEXURAL STRENGTH (cont'd)
Compute factored flexural resistance.
β1 max 0.65 0.85 0.05fc
ksi4 0.65 Stress block factor (5.7.2.2)
k 2 1.04fpy
fpu
0.28 Tendon type factor (5.7.3.1.1-2)
Distance from compression fiber to prestresscentroiddp x( ) h ypx x Lend dp X( ) 35.921 in
hf d7
8 in Structural flange thickness
btaper
b6
b5
216 in Average width of taper at bottom of flange
htaper d5
2 in Depth of taper at bottom of flange
a x( )Aps fpu
0.85 fc bfk
β1
Aps
fpu
dp x( )
a X( ) 2.509 in Depth of equivalent stress block for rectangularsection
c x( )a x( )
β1
c X( ) 3.86 in Neutral axis location
CheckTC ifc X( )
dp X( )
.003
.003 .005"OK" "NG" "OK" Tension-controlled section check (midspan)
Resistance factor for prestressed concrete(5.5.4.2)φf min 1.0 max 0.75 0.583 0.25
dp X( )
c X( )1 1.00
fps fpu 1 kc X( )
dp X( )261.9 ksi Average stress in the prestressing steel
(5.7.3.1.1-1)
Ld1.6
ksifps
2
3fpe dps 11.204 ft Bonded strand devlepment length (5.11.4.2-1)
fpx x( )fpe x Lend
Lt
x Lt Lendif
fpe
x Lend Lt
Ld Lt
fps fpe Lt Lend x Ld Lendif
fps otherwise
Stress in prestressing steel along thelength for bonded strand (5.11.4.2)
Mr x( ) φf Aps fpx x( ) dp x( )a x( )
2Flexure resistance along the length
A-266

12. FLEXURAL STRENGTH (cont'd)
xmom L 0.01Lt Lend
L
Ld Lend
Lαhd 0.5
T
imom 1 last xmom
Mrximom
Mr xmomimom
Muximom
Mu xmomimom
DCmom
Mux
Mrx
max DCmom 0.438 Demand-Capacity ratio for moment
CheckMom if max DCmom 1.0 "OK" "No Good" "OK" Flexure resistance check
0 3 6 9 12 15 18 21 24 27 300
1000
2000
3000
4000
Design Moment and Flexure Resistance (Half Beam)
Distance along Beam (ft)
Mom
ent (
kip·
ft)
MStrI x( )
kip ft
1.2 Mcr
kip ft
1.33 MStrI x( )
kip ft
Mu x( )
kip ft
Mr x( )
kip ft
x
ft
A-267

13. SHEAR STRENGTH
Shear Resistance
Use Strength I load combination to calculate factored shear at the critical shear section and at tenth points along the span.Compare it to factored resistance in AASHTO LRFD 5.8.
VDC x( ) Vg x( ) Vbar x( ) Vj x( ) Self weight of components
VDW x( ) Vfws x( ) Weight of future wearing surface
VLL x( ) Vll x( ) Live load
Vu x( ) 1.25 VDC x( ) 1.5 VDW x( ) 1.75 VLL x( ) Factored design shear
Resistance factor for shear in normal weightconcrete (AASHTO LRFD 5.5.4.2)φv 0.90
dend h ypx Lend 31.5 in Depth to steel centroid at bearing
dv min 0.9 dend 0.72 h 28.35 in Effective shear depth lower limit at end
Vp x( ) Pe slopecgp
x Lend
Lt
x Lt Lendif
Pe slopecgp Lt Lend x αhd Lif
0 otherwise
Vertical component of effective prestress force
bv b3
6 in Web thickness
Shear stress on concrete (5.8.2.9-1)vu x( )
Vu x( ) φv Vp x( )
φv bv dv
Mushr x( ) max MStrI x( ) Vu x( ) Vp x( ) dv Factored moment for shear
Stress in prestressing steel due to locked-instrain after casting concretefpo 0.7 fpu 189 ksi
Steel strain at the centroid of the prestressingsteelεs x( ) max 0.4 10
3
Mu x( )
dv
Vu x( ) Vp x( ) Aps fpo
Ep Aps
β x( )4.8
1 750 εs x( )Shear resistance parameter
θ x( ) 29 3500 εs x( ) deg Principal compressive stress angle
Vc x( ) 0.0316 ksi β x( )fc
ksibv dv Concrete contribution to total shear resistance
A-268

13. SHEAR STRENGTH (cont'd)
α 90 deg Angle of inclination of transverse reinforcement
Transverse reinforcement area andspacing providedAv 1.02 0.62 0.62 0.62 0.31( )
Tin
2sv 3 6 6 12 12( )
Tin
xv 0 0.25 h 1.5 h 0.3 L 0.5 L 0.6 L( )T
xvT
0 0.844 5.063 12 20 24( ) ft
Avs x( )
outAv
i
svi
xvi
x xvi 1
if
i 1 last Avfor
out.
Vs x( ) Avs x( ) fy dv cot θ x( )( ) cot α( )( ) sin α( ) Steel contribution to total shear resistance
Vr x( ) φv Vc x( ) Vs x( ) Vp x( ) Factored shear resistance
xshr
outi
i0.5 L
100
i 1 100for
out
ishr 1 last xshr
Vuxishr
Vu xshrishr
Vrxishr
Vr xshrishr
DCshr
Vux
Vrx
max DCshr 0.357
CheckShear if max DCshr 1.0 "OK" "No Good" "OK" Shear resistance check
0 3 6 9 12 15 18 21 24 27 300
100
200
300
400
Design Shear and Resistance (Half Beam)
Distance along Beam (ft)
She
ar (
kips
) Vu x( )
kip
Vr x( )
kip
x
ft
A-269

13. SHEAR STRENGTH (cont'd)
Longitudinal Reinforcement
Al.req x( ) a1MStrI x( )
φf fpx x( ) dp x( )a x( )
2
a2
Vu x( )
φv
0.5 Vs x( ) Vp x( ) cot θ x( )( )
fpx x( )
a3
Mushr x( )
dv φf
Vu x( )
φv
Vp x( ) 0.5 Vs x( ) cot θ x( )( )
fpx x( )
min a1 a2( ) x dv 5 inif
min a1 a3( ) otherwise
Longitudinal reinforcement required forshear (5.8.3.5)
As.add 0.40 in2
Ld.add 18.67 ft Additional longitudinal steel and developed length from end of beam
Al.prov x( ) if x Ld.add Lend As.add 0 Ap Ns
x Lend
Ld
x Ld Lendif
Ap Ns Ld Lend xyh.brg 0.5 h
slopecgp
0.5 Nh 1
22 in( ) cot slopecgpif
Ap Nh Ns otherwise
0 3 6 9 12 15 18 21 24 27 300
2
4
6
Longitudinal Reinforcement Required and Provided (Half Beam)
Distance along Beam (ft)
Ste
el A
rea
(in2
) Al.req x( )
in2
Al.prov x( )
in2
x
ft
Al.reqishr
Al.req xshrishr
Al.provishr
Al.prov xshrishr
DClong
Al.req
Al.prov
max DClong 0.395
CheckLong if max DClong 1.0 "OK" "No Good" "OK" Longitudinal reinforcement check
A-270
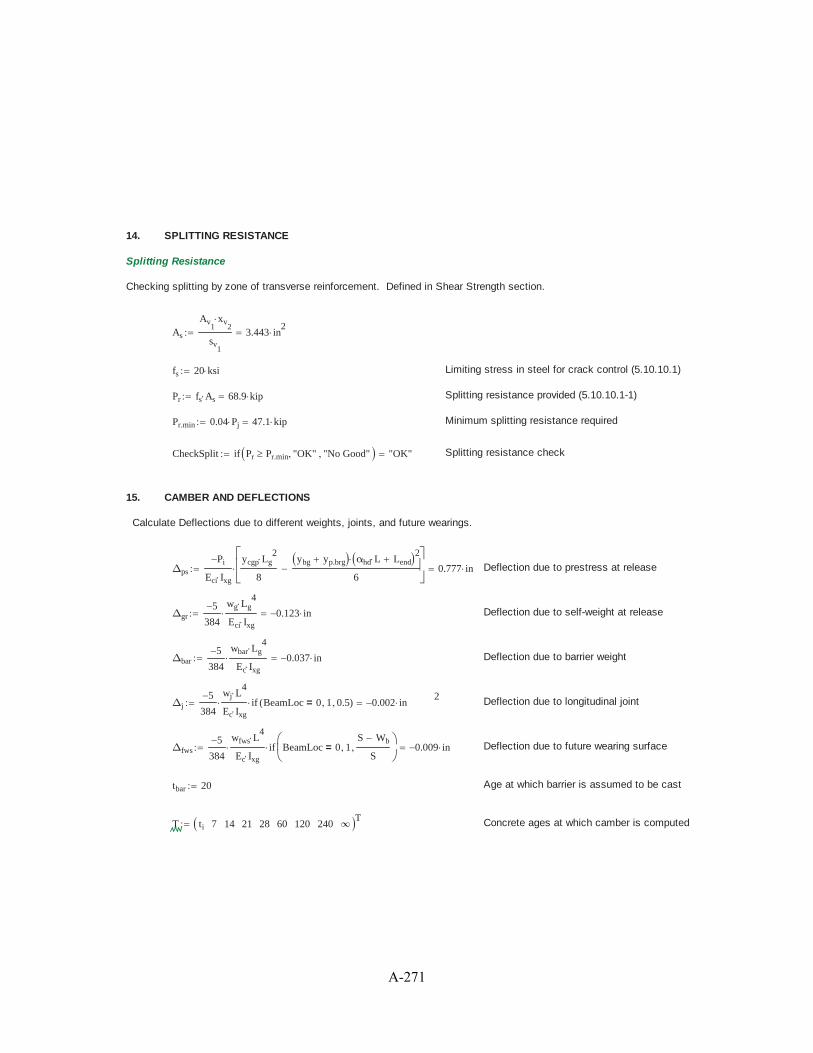
14. SPLITTING RESISTANCE
Splitting Resistance
Checking splitting by zone of transverse reinforcement. Defined in Shear Strength section.
As
Av1
xv2
sv1
3.443 in2
fs 20 ksi Limiting stress in steel for crack control (5.10.10.1)
Pr fs As 68.9 kip Splitting resistance provided (5.10.10.1-1)
Pr.min 0.04 Pj 47.1 kip Minimum splitting resistance required
CheckSplit if Pr Pr.min "OK" "No Good" "OK" Splitting resistance check
15. CAMBER AND DEFLECTIONS
Calculate Deflections due to different weights, joints, and future wearings.
Δps
Pi
Eci Ixg
ycgp Lg2
8
ybg yp.brg αhd L Lend2
60.777 in Deflection due to prestress at release
Δgr5
384
wg Lg4
Eci Ixg
0.123 in Deflection due to self-weight at release
Δbar5
384
wbar Lg4
Ec Ixg
0.037 in Deflection due to barrier weight
2Δj
5
384
wj L4
Ec Ixg
if BeamLoc 0= 1 0.5( ) 0.002 in Deflection due to longitudinal joint
Δfws5
384
wfws L4
Ec Ixg
if BeamLoc 0= 1S Wb
S0.009 in Deflection due to future wearing surface
tbar 20 Age at which barrier is assumed to be cast
T ti 7 14 21 28 60 120 240 ∞T Concrete ages at which camber is computed
A-271

15. CAMBER AND DEFLECTIONS (cont'd)
Δcr1 t( ) ψ t ti ti Δgr Δps
Δcr2 t( ) ψ t ti ti ψ tbar ti ti Δgr Δps ψ t tbar tbar Δbar
Δcr3 t( ) ψ t ti ti ψ td ti ti Δgr Δps ψ t tbar tbar ψ td tbar tbar Δbar
ψ t td td Δj
Δcr t( ) Δcr1 t( ) t tbarif
Δcr1 tbar Δcr2 t( ) tbar t tdif
Δcr1 tbar Δcr2 td Δcr3 t( ) t tdif
Defl t( ) Δgr Δps Δcr1 t( ) t tbarif
Δgr Δps Δcr1 tbar Δbar Δcr2 t( ) tbar t tdif
Δgr Δps Δcr1 tbar Δbar Δcr2 td Δj Δcr3 t( ) t tdif
C
outj
Defl Tj
j 1 last T( )for
out
CT
0.653 0.775 0.879 0.919 0.974 1.121 1.236 1.316 1.42( ) in
0 20 40 600
0.5
1
1.5
260-Day Deflection at Midspan
Age of Concrete (days)
Def
lect
ion
(in) Δcr t( )
in
Defl t( )
in
t
0 500 1000 1500 20000
0.5
1
1.5
2Long-term Deflection at Midspan
Age of Concrete (days)
Def
lect
ion
(in) Δcr t( )
in
Defl t( )
in
t
A-272

16. NEGATIVE MOMENT FLEXURAL STRENGTH
Calculate factored moment that must be resisted across the interior pier and find required steel to be developed in the topflange.
Negative Live Load Moment
Compute the negative moment over the interior support due to the design live load load, in accordance with AASHTO LRFD3.6.1.3.1.
Live Load Truck and Truck Train Moment Calculations
Maximum negative moment due to a singletruckmin Mtruck 530 kip ft
Maximum negative moment due to two trucksin a single lanemin Mtrain 450 kip ft
Negative moment due to lane load onadjacent spansMneg.lane
wlane L2
2512 kip ft
Mneg.truck Mneg.lane 1 IM( ) min Mtruck 1217 kip ft Live load negative moment for single truck
Live load negative moment for two trucks in asingle laneMneg.train 0.9 Mneg.lane 1 IM( ) min Mtrain 999 kip ft
Design negative live load moment, per designlaneMHL93.neg min Mneg.truck Mneg.train 1217 kip ft
Design negative live load moment at interiorbeamMll.neg.i MHL93.neg gmint 884 kip ft
Design negative live load moment at exteriorbeamMll.neg.e MHL93.neg gmext 921 kip ft
MLL.neg if BeamLoc 1= Mll.neg.e Mll.neg.i 921 kip ft Design negative live load moment
Factored Negative Design Moment
Dead load applied to the continuity section at interior supports is limited to the future overlay.
Superimposed dead load resisted bycontinuity sectionMDW.neg
wfws L2
2159 kip ft
Mu.neg.StrI 1.5 MDW.neg 1.75 MLL.neg 1850 kip ft Strength Limit State
Mu.neg.StrI 1.0 MDW.neg 1.0 MLL.neg 1080 kip ft Service Limit State
A-273

16. NEGATIVE MOMENT FLEXURAL STRENGTH (cont'd)
Reinforcing Steel Requirement in the Top Flange for Strength
Reduction factor for strength in tension-controlled reinforced concrete (5.5.4.2)φf 0.90
bc b1
26 in Width of compression block at bottom flange
Distance to centroid of negative moment steel,taken at mid-depth of top flangednms h tsac 0.5 tflange tsac 35.5 in
Factored load, in terms of stress in concreteat depth of steel, for computing steelrequirement
Ru
Mu.neg.StrI
φf bc dnms2
0.439 ksi
mfy
0.85 fc
8.824 Steel-to-concrete strength ratio
ρreq1
m1 1
2 m Ru
fy
0.0076 Required negative moment steel ratio
Anms.req ρreq bc dnms 6.992 in2 Required negative moment steel in top flange
Full-length longitudinal reinforcement to bemade continuous across jointAs.long.t 2.0 in
2As.long.b 2.0 in
2
Additional negative moment reinforcing barareaAbar 0.44 in
2
Additional reinforcement area required in thetop mat (2/3 of total)Anms.t
2
3Anms.req As.long.t 2.661 in
2
nbar.t ceilAnms.t
Abar
7 Additional bars required in the top mat
Additional reinforcement area required in thebottom matAnms.b
1
3Anms.req As.long.b 0.331 in
2
nbar.b ceilAnms.b
Abar
1 Additional bars required in the top mat
sbar.top
S Wj 6 in
nbar.t 113.875 in Spacing of bars in top mat
As.nms nbar.t nbar.b Abar As.long.t As.long.b 7.52 in2 Total reinforcing steel provided over pier
aAs.nms fy
0.85 fc bc
2.552 in Depth of compression block
Mr.neg φf As.nms fy dnmsa
21158 kip ft Factored flexural resistance at interior pier
DCneg.mom
Mu.neg.StrI
Mr.neg
0.932
CheckNegMom if DCneg.mom 1.0 "OK" "No Good" "OK" Negative flexure resistance check
A-274
APPENDIX C
ABC CONSTRUCTION PRACTICE FLOWCHARTS
A-275
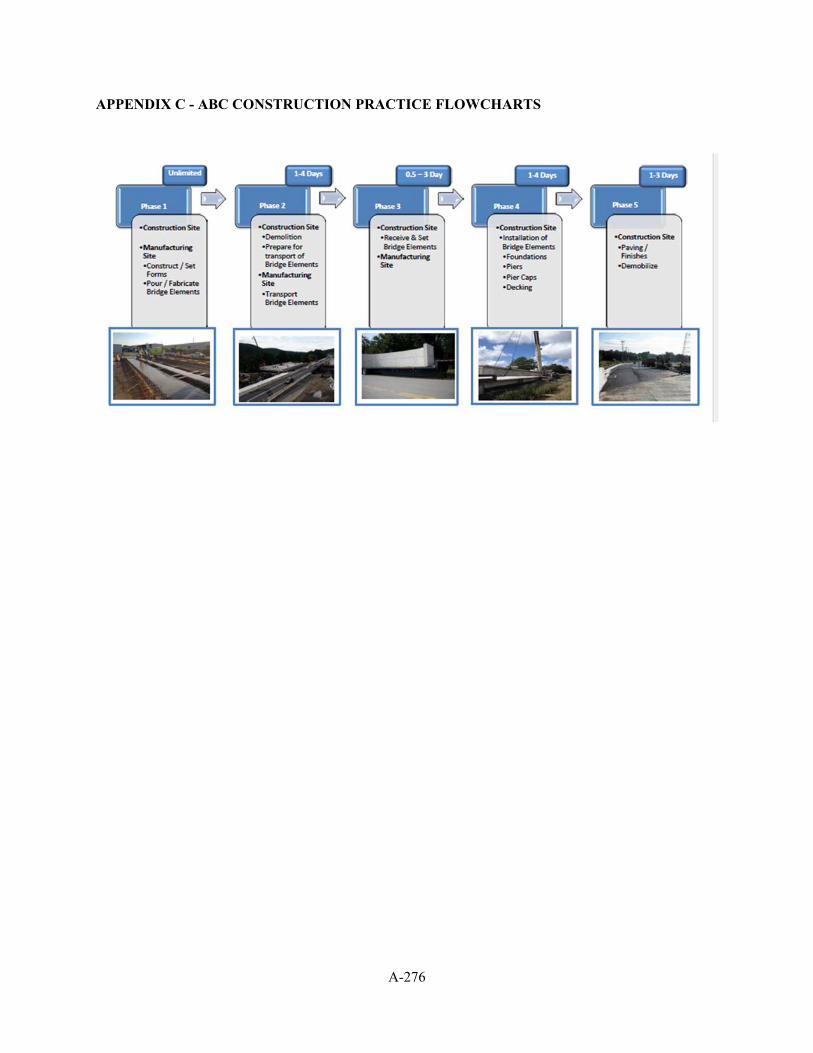
APPENDIX C - ABC CONSTRUCTION PRACTICE FLOWCHARTS
A-276
APPENDIX D
RISK ANALYSIS EXAMPLES AND INTERACTIVE FLOWCHART
A-277

APPENDIX D - RISK ANALYSIS EXAMPLES AND INTERACTIVE FLOWCHART Example Problem 1: As part of project involving the reconstruction of a portion of a state owned roadway, officials from Floyd County are considering replacing the three (3) 42” multi-barrel corrugated steel pipe culverts with larger size culverts. Rather than manually delineating the watershed, they use the USGS StreamStats application which reveals that the drainage area is 0.21miles2 (134 acres), 3.5% of which is impervious (see Figure 1).
Figure 1. Output from USGS StreamStats Application Using the USGS regression equations shown in Table 1 for a 50 year return period within Region 1, the peak flow is calculated to be:
Qp = 661(DA)0.600 = 661 (.21)0.600 = 259. 14 ft3/s Computing the waterway area for V = 3 ft/s and 5 ft/s yields:
V = 3 ft/s: . /
/86.38
V = 5 ft/s: . /
/51.83
Based on the area information shown in Table 5, a single corrugated pipe culvert would have a size of 126” (for V = 3 ft/s) or 102” (for V = 5 ft/s). Using the more conservative size (126”), Table 7 indicates that the county could replace the existing culverts with three (3) 78” or four (4) 66” multi-barrel culverts.
A-278

Example Problem 2: County officials from the same county (Floyd) are examining another state roadway project in which a single 4’ x 4’ concrete box culvert might have to be replaced. The location of the culvert is in an urbanized area with a total area of 0.125 miles2 (80 acres). A site investigation reveals that the area is predominately flat, with 30% (24 acres) single family residential, 25% (20 acres) apartment homes, 35% (28 acres) lawns (clay soil), and the remaining 10% (8 acres) woodlands and forests. Applying the Rational Method, the runoff coefficients for a 50 year return period are:
Single family residential: (0.30 * 1.2) = 0.36 Apartment homes: (0.50 * 1.2) = 0.60 Lawns (clay soil): (0.17 * 1.2) = 0.20 Woodlands and forests: (0.10 * 1.2) = 0.12
The weighted runoff coefficient is computed as follows:
0.36 24 0.60 20 0.20 28 0.12 880
0.34
Since the project location is near the City of Rome, the rainfall intensity data can be taken directly from Table 4: I = 3.12 in/hr Using the runoff coefficient, rainfall intensity, and area information, the peak flow is computed as: Qp = CIA = (0.34) *(3.12 in/hr)*(80 acres) = 84.86 ft3/s Computing the waterway area for V = 3 ft/s and 5 ft/s yields:
V = 3 ft/s: . /
/28.29
V = 5 ft/s: . /
/16.97
Based on the area information shown in Table 6, a single box culvert would have a size of 6’ x 5’ (for V = 3 ft/s) or 6’ x 3’ (for V = 5 ft/s). Using the more conservative size, the county could replace the existing 4’ x 4’ culvert with a 6’ x 5’ culvert.
A-279
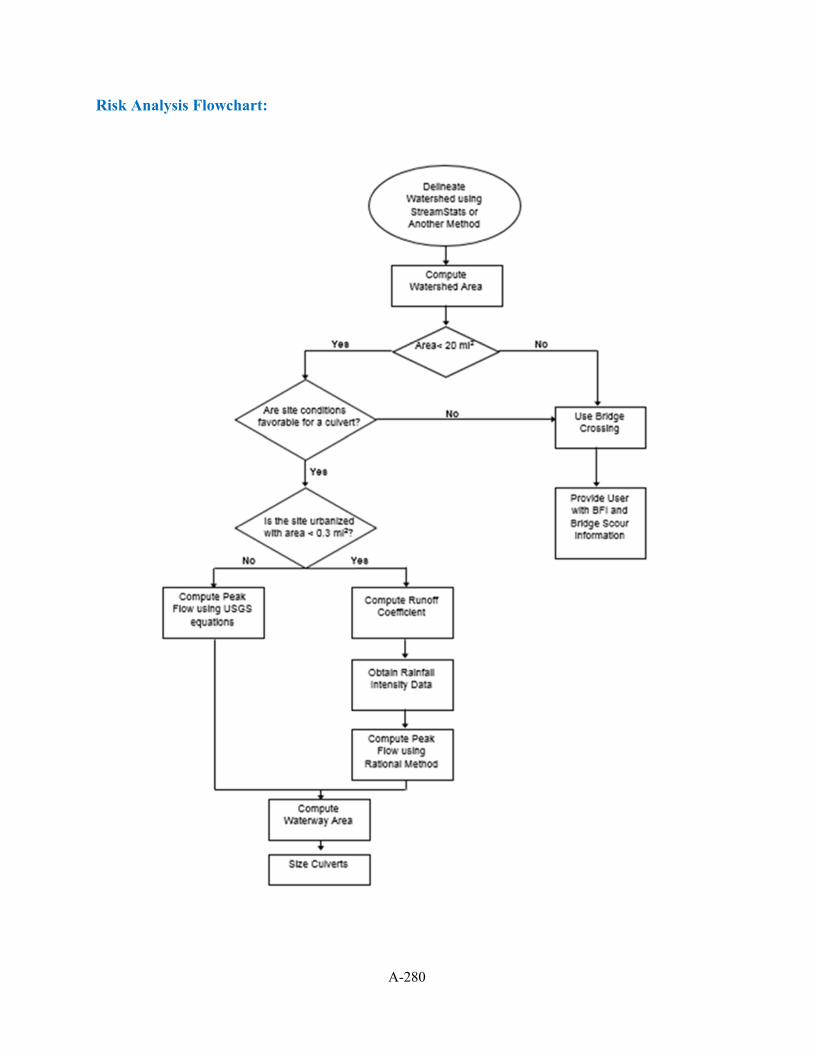
Risk Analysis Flowchart:
A-280

APPENDIX E
CONCEPTUAL COST ESTIMATES EXAMPLES
A-281

APPENDIX E - CONCEPTUAL COST ESTIMATES EXAMPLES Case study 1 summary - Interstate Bridge Replacement over Local Road in Urban Environment (FHWA-Every Day Counts)
Construction Type
Labor ($,%, Hrs)
Material ($,%)
Subcontractors($,%)
Equipment($,%, Hrs)
Other ($,%)
Total ($)
Prefabricated $1,889,726 35.38%
10,4449.281 Hours
$1,887,855 35.35%
$789,209 14.78%
$679,331 12.72%
3,261.644 Hours
$94,564 1.77%
$5,340,685
Conventional $2,119,985 38.82%
21,670.339 Hours
$1,210,878 17.60%
$0.00 0%
$418,030 6.08%
2,561.883 Hours
$3,129,659 45.50%
$6,878,552
Details for the breakdown of direct cost components, quantity takeoffs and total cost/units are shown in exhibits E1 and E2. Users may refer also to the notes provided to each case study for additional information regarding durations and pricing. Case study 2 summary - Route 10 over Passaic River Superstructure Replacement estimate report. This particular example was obtained from an experienced contractor. The cost estimate report is a detailed report of break down costs obtained by construction items assigned individually and their total units for total cost calculations on the bridge replacement job. Therefore, the job estimate report is presented as a guidance for cost estimators and it is presented in exhibit E3 of this appendix. The responses of the special survey are attached to this Appendix E, as exhibit E4. They can be used as further guidance to potential users and to complement the decision-making matrix with inclusive items affecting directly the conceptual cost estimates. They were a total of eighteen responses collected and they are all attached to this report. The followings are the special survey questions on conceptual cost estimates factors and cost components deployed to all state DOTs: 1) Based on your experience with ABC, are prefabricated bridges more costly than conventional bridges? 2) Have you ever used another contracting method besides Design-Bid-Build for ABC? If yes, under what circumstances? 3) What ABC elements have been more costly than conventional bridge construction? 4) Have any of your contractors had cost concerns when using ABC? 5) Did federal and/or state requirements affect the overall ABC cost/duration of the project? If yes, how? 6) What, if any, environmental factors/policies affected your ABC projects? How did these affect the overall cost?
A-282

Cost Estimating Spreadsheet ReportPrefabricated Alt. CS 1
Page 1
Every Day Counts Case Study 1
Project name Prefabricated Alt. CS 1 Fla.
Labor rate table Labor 2011
Equipment rate table Equip 2011
Notes 1. Pricing is 2011 $. 2. Construction Schedule of 12 mos. 3. Rates reflect majority of work performed days with the exception of actual installation of bridges. 4. 2 Bridges. 5. Labor Cost/Unit - This reflects the cost of Labor to put one unit of measure of work in place. This is comprised of a typical crew with associated productivity required to perform the activity. Labor is priced up to include base rate, fringes, taxes, insurance, etc. 6. Material Cost/Unit - This cost represents the final installed cost for all the materials associated with the item of work. 7. Sub Contract Cost/Unit - this represents the Sub Contract all in Cost to put one unit of work in place. This cost includes all costs necessary to reflect a total installed cost (includes Labor, equipment and material). 8. Equipment Cost/Unit - This represents the cost of Construction Equipment necessary to put one unit of work in place. This cost includes equipment ownership and maintenance and operational costs. 9. Other Cost/Unit - This cost represents all other costs necessary to perform the item of work and not covered by the abovementioned costs. 10. Total cost/unit - This is the summation of all unit costs to arrive at a total cost per unit to put one item of work in place. 11. Total Amount - Total cost to put the quantity of units specified in place.
A-283
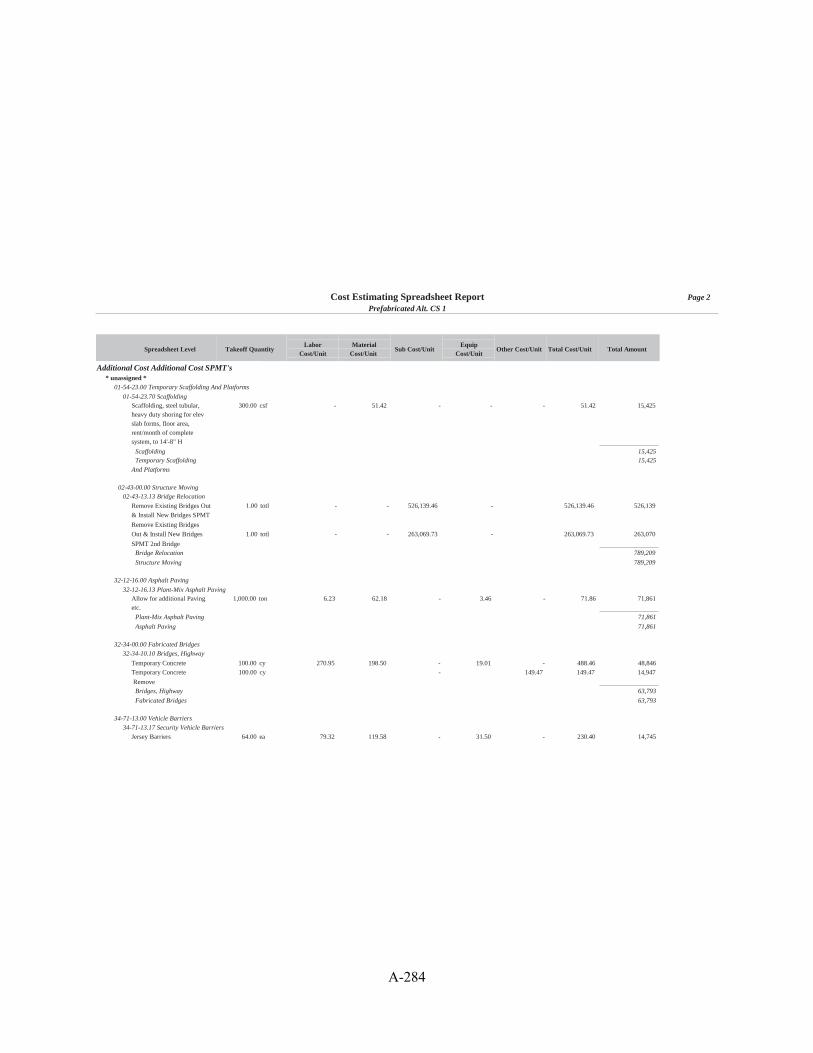
Cost Estimating Spreadsheet ReportPrefabricated Alt. CS 1
Page 2
dditional Cost Additional Cost SPMT'sAnassigned ** u
1-54-23.00 Temporary Scaffolding And Platforms01-54-23.70 Scaffolding0
2-43-00.00 Structure Moving02-43-13.13 Bridge Relocation0
2-12-16.00 Asphalt Paving32-12-16.13 Plant-Mix Asphalt Paving3
2-34-00.00 Fabricated Bridges32-34-10.10 Bridges, Highway3
4-71-13.00 Vehicle Barriers34-71-13.17 Security Vehicle Barriers3
Spreadsheet Level Takeoff Quantity
Additional Cost Additional Cost SPMT's* unassigned *
01-54-23.00 Temporary Scaffolding And Platforms
01-54-23.70 Scaffolding
LaborCost/Unit
MaterialCost/Unit
Sub Cost/UnitEquip
Cost/UnitOther Cost/Unit Total Cost/Unit Total Amount
Scaffolding, steel tubular, heavy duty shoring for elev slab forms, floor area, rent/month of complete system, to 14'-8" H
300.00 csf - 51.42 - - - 51.42 15,425
Scaffolding 15,425Temporary Scaffolding
And Platforms
15,425
02-43-00.00 Structure Moving02-43-13.13 Bridge Relocation
Remove Existing Bridges Out
& Install New Bridges SPMT
Remove Existing Bridges
Out & Install New Bridges
SPMT 2nd Bridge
1.00 totl - - 526,139.46 - 526,139.46 526,139
1.00 totl - - 263,069.73 - 263,069.73 263,070
Bridge Relocation 789,209
Structure Moving 789,209
32-12-16.00 Asphalt Paving
32-12-16.13 Plant-Mix Asphalt PavingAllow for additional Paving etc.
1,000.00 ton 6.23 62.18 - 3.46 - 71.86 71,861
Plant-Mix Asphalt Paving 71,861
Asphalt Paving 71,861
32-34-00.00 Fabricated Bridges
32-34-10.10 Bridges, Highway
Temporary Concrete 100.00 cy 270.95 198.50 - 19.01 - 488.46 48,846
Temporary Concrete
Remove
100.00 cy - 149.47 149.47 14,947
Bridges, Highway 63,793
Fabricated Bridges 63,793
34-71-13.00 Vehicle Barriers
34-71-13.17 Security Vehicle Barriers
Jersey Barriers 64.00 ea 79.32 119.58 - 31.50 - 230.40 14,745
A-284

Cost Estimating Spreadsheet ReportPrefabricated Alt. CS 1
Page 3
4-71-13.17 Security Vehicle Barriers3
eneral Conditions General ConditionsGnassigned ** u
1-31-00.00 Project Management And Coordination01-31-13.20 Field Personnel0
1-32-33.00 Photographic Documentation01-32-33.50 Photographs0
1-45-00.00 Quality Control01-45-23.50 Testing0
1-52-13.00 Field Offices And Sheds01-52-13.20 Office And Storage Space0
Spreadsheet Level Takeoff Quantity
34-71-13.17 Security Vehicle Barriers
LaborCost/Unit
MaterialCost/Unit
Sub Cost/UnitEquip
Cost/UnitOther Cost/Unit Total Cost/Unit Total Amount
Jersey Barriers Pier
Expansion
200.00 ea 79.32 119.58 - 31.50 - 230.40 46,080
Detour 2.00 Day - - - - 3,826.47 3,826.47 7,653
Security Vehicle Barriers 68,478
Vehicle Barriers 68,478
* unassigned * 1,008,766
Additional Cost Additional Cost SPMT's
1,008,766
General Conditions General Conditions* unassigned *
01-31-00.00 Project Management And Coordination
01-31-13.20 Field PersonnelField Personnel, clerk, average
42.00 week 436.46 - - - - 436.46 18,331
Field engineer, average 47.00 week 1,345.24 - - - - 1,345.24 63,226
Field Personnel, project
manager, average
Field Personnel,
superintendent, average
47.00 week 2,212.18 - - - - 2,212.18 103,972
42.00 week 2,032.81 - - - - 2,032.81 85,378
Field Personnel 270,908Project Management And
Coordination
270,908
01-32-33.00 Photographic Documentation01-32-33.50 Photographs
Construction Photographs 42.00 set - 567.99 - - - 567.99 23,856
Photographs 23,856Photographic
Documentation
23,856
01-45-00.00 Quality Control
01-45-23.50 Testing
Field Testing 2.00 prjc - - - - 35,981.96 35,981.96 71,964
Testing 71,964
Quality Control 71,964
01-52-13.00 Field Offices And Sheds
01-52-13.20 Office And Storage Space
A-285
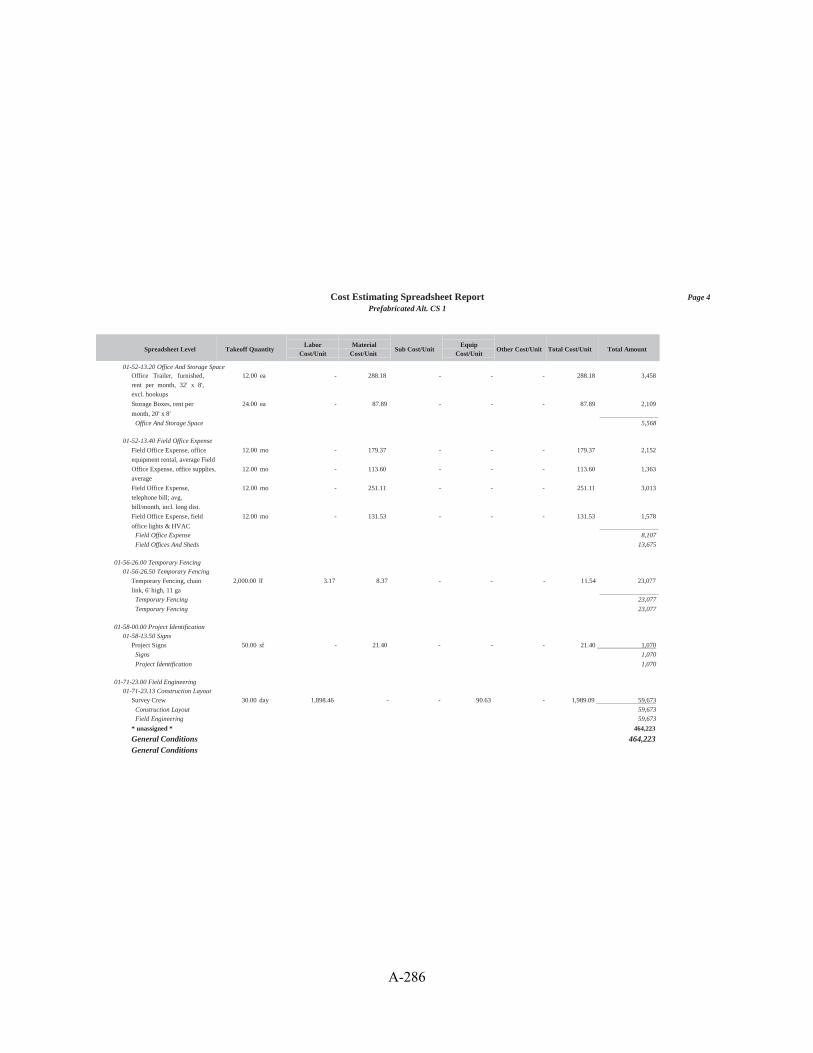
Cost Estimating Spreadsheet ReportPrefabricated Alt. CS 1
Page 4
1-52-13.20 Office And Storage Space0
1-52-13.40 Field Office Expense0
1-56-26.00 Temporary Fencing01-56-26.50 Temporary Fencing0
1-58-00.00 Project Identification01-58-13.50 Signs0
1-71-23.00 Field Engineering01-71-23.13 Construction Layout0
Spreadsheet Level Takeoff Quantity
01-52-13.20 Office And Storage Space
LaborCost/Unit
MaterialCost/Unit
Sub Cost/UnitEquip
Cost/UnitOther Cost/Unit Total Cost/Unit Total Amount
Office Trailer, furnished,
rent per month, 32' x 8',
excl. hookups
Storage Boxes, rent per
month, 20' x 8'
12.00 ea - 288.18 - - - 288.18 3,458
24.00 ea - 87.89 - - - 87.89 2,109
Office And Storage Space 5,568
01-52-13.40 Field Office Expense
Field Office Expense, office
equipment rental, average Field
Office Expense, office supplies,
average
Field Office Expense,
telephone bill; avg.
bill/month, incl. long dist.
Field Office Expense, field
office lights & HVAC
12.00 mo - 179.37 - - - 179.37 2,152
12.00 mo - 113.60 - - - 113.60 1,363
12.00 mo - 251.11 - - - 251.11 3,013
12.00 mo - 131.53 - - - 131.53 1,578
Field Office Expense 8,107
Field Offices And Sheds 13,675
01-56-26.00 Temporary Fencing01-56-26.50 Temporary Fencing
Temporary Fencing, chain
link, 6' high, 11 ga
2,000.00 lf 3.17 8.37 - - - 11.54 23,077
Temporary Fencing 23,077
Temporary Fencing 23,077
01-58-00.00 Project Identification01-58-13.50 Signs
Project Signs 50.00 sf - 21.40 - - - 21.40 1,070
Signs 1,070
Project Identification 1,070
01-71-23.00 Field Engineering01-71-23.13 Construction Layout
Survey Crew 30.00 day 1,898.46 - - 90.63 - 1,989.09 59,673
Construction Layout 59,673
Field Engineering 59,673
* unassigned * 464,223
General ConditionsGeneral Conditions
464,223
A-286
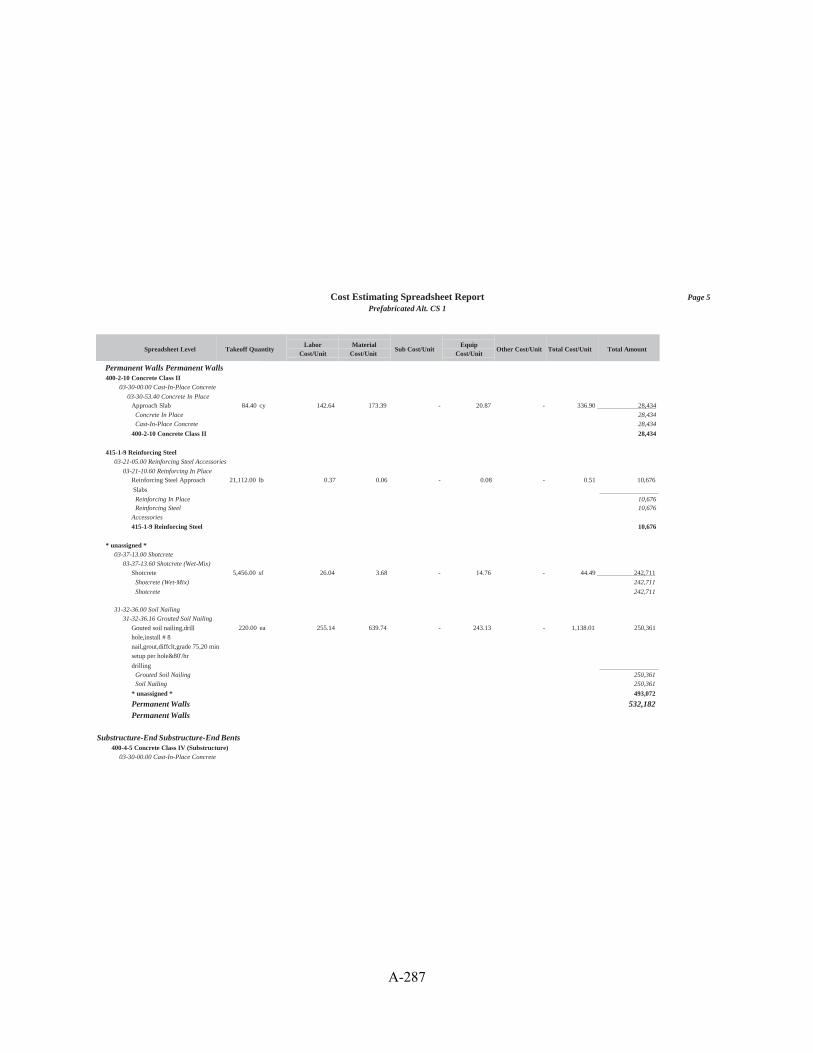
Cost Estimating Spreadsheet ReportPrefabricated Alt. CS 1
Page 5
er anent Walls Permanent WallsP m00-2-10 Concrete Class II4
3-30-00.00 Cast-In-Place Concrete03-30-53.40 Concrete In Place0
15-1-9 Reinforcing Steel4
3-21-05.00 Reinforcing Steel Accessories03-21-10.60 Reinforcing In Place0
nassigned ** u
3-37-13.00 Shotcrete03-37-13.60 Shotcrete (Wet-Mix)0
1-32-36.00 Soil Nailing31-32-36.16 Grouted Soil Nailing3
ubstructure-End Substructure-End BentsS00-4-5 Concrete Class IV (Substructure)4
3-30-00.00 Cast-In-Place Concrete0
Spreadsheet Level Takeoff Quantity
Permanent Walls Permanent Walls400-2-10 Concrete Class II
03-30-00.00 Cast-In-Place Concrete
03-30-53.40 Concrete In Place
LaborCost/Unit
MaterialCost/Unit
Sub Cost/UnitEquip
Cost/UnitOther Cost/Unit Total Cost/Unit Total Amount
Approach Slab 84.40 cy 142.64 173.39 - 20.87 - 336.90 28,434
Concrete In Place 28,434
Cast-In-Place Concrete 28,434
400-2-10 Concrete Class II 28,434
415-1-9 Reinforcing Steel03-21-05.00 Reinforcing Steel Accessories
03-21-10.60 Reinforcing In PlaceReinforcing Steel Approach
Slabs
21,112.00 lb 0.37 0.06 - 0.08 - 0.51 10,676
Reinforcing In Place 10,676Reinforcing Steel
Accessories
10,676
415-1-9 Reinforcing Steel 10,676
* unassigned *03-37-13.00 Shotcrete
03-37-13.60 Shotcrete (Wet-Mix)
Shotcrete 5,456.00 sf 26.04 3.68 - 14.76 - 44.49 242,711
Shotcrete (Wet-Mix) 242,711
Shotcrete 242,711
31-32-36.00 Soil Nailing31-32-36.16 Grouted Soil Nailing
Gouted soil nailing,drill
hole,install # 8
nail,grout,diffclt,grade 75,20 min
setup per hole&80'/hr
drilling
220.00 ea 255.14 639.74 - 243.13 - 1,138.01 250,361
Grouted Soil Nailing 250,361Soil Nailing 250,361
* unassigned * 493,072
Permanent WallsPermanent Walls
532,182
Substructure-End Substructure-End Bents400-4-5 Concrete Class IV (Substructure)
03-30-00.00 Cast-In-Place Concrete
A-287
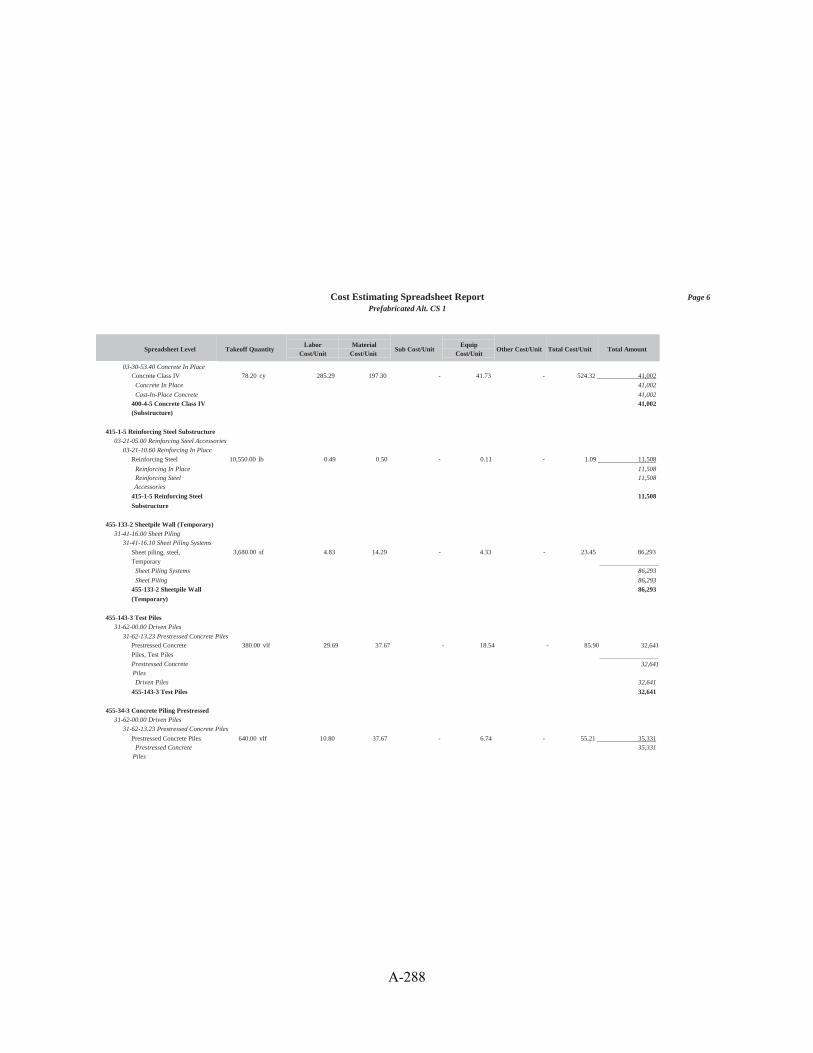
Cost Estimating Spreadsheet ReportPrefabricated Alt. CS 1
Page 6
3-30-53.40 Concrete In Place0
15-1-5 Reinforcing Steel Substructure4
3-21-05.00 Reinforcing Steel Accessories03-21-10.60 Reinforcing In Place0
55-133-2 Sheetpile Wall (Temporary)41-41-16.00 Sheet Piling3
1-41-16.10 Sheet Piling Syste s3 m
55-143-3 Test Piles4
1-62-00.00 Driven Piles31-62-13.23 Prestressed Concrete Piles3
55-34-3 Concrete Piling Prestressed4
1-62-00.00 Driven Piles31-62-13.23 Prestressed Concrete Piles3
Spreadsheet Level Takeoff Quantity
03-30-53.40 Concrete In Place
LaborCost/Unit
MaterialCost/Unit
Sub Cost/UnitEquip
Cost/UnitOther Cost/Unit Total Cost/Unit Total Amount
Concrete Class IV 78.20 cy 285.29 197.30 - 41.73 - 524.32 41,002
Concrete In Place 41,002
Cast-In-Place Concrete 41,002400-4-5 Concrete Class IV (Substructure)
41,002
415-1-5 Reinforcing Steel Substructure03-21-05.00 Reinforcing Steel Accessories
03-21-10.60 Reinforcing In Place
Reinforcing Steel 10,550.00 lb 0.49 0.50 - 0.11 - 1.09 11,508
Reinforcing In Place 11,508Reinforcing SteelAccessories
415-1-5 Reinforcing Steel
Substructure
11,508
11,508
455-133-2 Sheetpile Wall (Temporary)
31-41-16.00 Sheet Piling31-41-16.10 Sheet Piling Systems
Sheet piling, steel,
Temporary
3,680.00 sf 4.83 14.29 - 4.33 - 23.45 86,293
Sheet Piling Systems 86,293
Sheet Piling 86,293
455-133-2 Sheetpile Wall
(Temporary)
86,293
455-143-3 Test Piles31-62-00.00 Driven Piles
31-62-13.23 Prestressed Concrete PilesPrestressed Concrete
Piles, Test Piles
Prestressed ConcretePiles
380.00 vlf 29.69 37.67 - 18.54 - 85.90 32,641
32,641
Driven Piles 32,641
455-143-3 Test Piles 32,641
455-34-3 Concrete Piling Prestressed31-62-00.00 Driven Piles
31-62-13.23 Prestressed Concrete Piles
Prestressed Concrete Piles 640.00 vlf 10.80 37.67 - 6.74 - 55.21 35,331Prestressed Concrete
Piles35,331
A-288

Cost Estimating Spreadsheet ReportPrefabricated Alt. CS 1
Page 7
ubstructure-Piers Substructure-PiersS00-4-25 Concrete Class V Superstructure4
3-30-00.00 Cast-In-Place Concrete03-30-53.40 Concrete In Place0
00-4-5 Concrete Class IV (Substructure)4
3-30-00.00 Cast-In-Place Concrete03-30-53.40 Concrete In Place0
15-1-5 Reinforcing Steel Substructure43-21-05.00 Reinforcing Steel Accessories0
3-21-10.60 Reinforcing In Place0
55-143-5 Test Piles4
1-62-00.00 Driven Piles31-62-13.23 Prestressed Concrete Piles3
Spreadsheet Level Takeoff QuantityLabor
Cost/Unit
Material
Cost/UnitSub Cost/Unit
Equip
Cost/UnitOther Cost/Unit Total Cost/Unit Total Amount
Driven Piles 35,331455-34-3 Concrete Piling
Prestressed
Substructure-End Substructure-End Bents
Substructure-Piers Substructure-Piers400-4-25 Concrete Class V Superstructure
03-30-00.00 Cast-In-Place Concrete
03-30-53.40 Concrete In Place
35,331
206,775
Concrete Class V 94.60 cy 228.23 179.37 - 33.38 - 440.98 41,717
Concrete In Place 41,717
Cast-In-Place Concrete 41,717
400-4-25 Concrete Class
V Superstructure
41,717
400-4-5 Concrete Class IV (Substructure)03-30-00.00 Cast-In-Place Concrete
03-30-53.40 Concrete In Place
Concrete Class IV 39.20 cy 285.29 197.30 - 41.73 - 524.32 20,553
Concrete In Place 20,553
Cast-In-Place Concrete 20,553400-4-5 Concrete Class IV
(Substructure)
20,553
415-1-5 Reinforcing Steel Substructure
03-21-05.00 Reinforcing Steel Accessories03-21-10.60 Reinforcing In Place
Reinforcing Steel 20,042.00 lb 0.49 0.50 - 0.11 - 1.09 21,861
Reinforcing In Place 21,861Reinforcing SteelAccessories
415-1-5 Reinforcing Steel
Substructure
21,861
21,861
455-143-5 Test Piles31-62-00.00 Driven Piles
31-62-13.23 Prestressed Concrete PilesPrestressed concrete piles,
24" square, Test Pile Prestressed Concrete
Piles
210.00 vlf 29.69 65.77 - 18.54 - 114.00 23,940
23,940
A-289

Cost Estimating Spreadsheet ReportPrefabricated Alt. CS 1
Page 8
55-34-5 Concrete Piling Prestressed41-62-00.00 Driven Piles3
1-62-13.23 Prestressed Concrete Piles3
uperstructure SuperstructureS10-3 Structure Removal of Existing1
2-41-16.00 Structure Demolition02-41-16.33 Bridge Demolition0
00-147 Composite Neoprene Pads4
5-05-23.00 Metal Fastenings05-05-23.80 Vibration & Bearing Pads0
00-2-4 Concrete Class II43-30-00.00 Cast-In-Place Concrete0
3-30-53.40 Concrete In Place0
Spreadsheet Level Takeoff QuantityLabor
Cost/Unit
Material
Cost/UnitSub Cost/Unit
Equip
Cost/UnitOther Cost/Unit Total Cost/Unit Total Amount
Driven Piles 23,940
455-143-5 Test Piles 23,940
455-34-5 Concrete Piling Prestressed
31-62-00.00 Driven Piles
31-62-13.23 Prestressed Concrete PilesPrestressed concrete piles,
24" square,
Prestressed Concrete
Piles
1,800.00 vlf 10.80 65.77 - 6.74 - 83.31 149,951
149,951
Driven Piles 149,951
455-34-5 Concrete Piling
Prestressed
Substructure-PiersSubstructure-Piers
149,951
258,022
Superstructure Superstructure110-3 Structure Removal of Existing
02-41-16.00 Structure Demolition02-41-16.33 Bridge Demolition
Bridge demolition 21,048.00 sf 12.72 - - 8.26 - 20.98 441,610
Bridge Demolition 441,610
Structure Demolition 441,610
110-3 Structure Removal of
Existing
441,610
400-147 Composite Neoprene Pads05-05-23.00 Metal Fastenings
05-05-23.80 Vibration & Bearing Pads
Bearing Pads 10.60 cf 78.49 717.46 - - - 795.95 8,437
Vibration & Bearing Pads 8,437
Metal Fastenings 8,437400-147 Composite
Neoprene Pads
8,437
400-2-4 Concrete Class II
03-30-00.00 Cast-In-Place Concrete03-30-53.40 Concrete In Place
Concrete Class II 866.20 cy 142.65 173.39 - 20.87 - 336.90 291,820
Concrete In Place 291,820
Cast-In-Place Concrete 291,820
A-290

Cost Estimating Spreadsheet ReportPrefabricated Alt. CS 1
Page 9
00-5-25 Concrete Class V Superstructure43-30-00.00 Cast-In-Place Concrete0
3-30-53.40 Concrete In Place0
00-9 Bridge Floor Grooving4
2-13-13.00 Concrete Paving32-13-13.23 Concrete Paving Surface Treatment3
15-1-4 Reinforcing Steel43-21-05.00 Reinforcing Steel Accessories0
3-21-10.60 Reinforcing In Place0
58-1-12 Bridge Deck Expansion Joint42-34-00.00 Fabricated Bridges3
2-34-10.10 Bridges, Highway3
60-2-1 Structural Steel45-12-23.00 Structural Steel For Bridges0
Spreadsheet Level Takeoff QuantityLabor
Cost/Unit
Material
Cost/UnitSub Cost/Unit
Equip
Cost/UnitOther Cost/Unit Total Cost/Unit Total Amount
400-2-4 Concrete Class II 291,820
400-5-25 Concrete Class V Superstructure
03-30-00.00 Cast-In-Place Concrete03-30-53.40 Concrete In Place
Concrete Class V 162.60 cy 228.23 179.37 - 33.38 - 440.98 71,703
Concrete In Place 71,703
Cast-In-Place Concrete 71,703
400-5-25 Concrete Class
V Superstructure
71,703
400-9 Bridge Floor Grooving32-13-13.00 Concrete Paving
32-13-13.23 Concrete Paving Surface Treatment
Concrete Grooving 3,536.00 sy 2.31 - - 5.20 - 7.52 26,581Concrete Paving Surface
Treatment
26,581
Concrete Paving 26,581
400-9 Bridge Floor
Grooving
26,581
415-1-4 Reinforcing Steel
03-21-05.00 Reinforcing Steel Accessories
03-21-10.60 Reinforcing In PlaceReinforcing Steel
Superstructure
201,944.00 lb 0.37 0.06 - 0.08 - 0.51 102,118
Reinforcing In Place 102,118Reinforcing Steel
Accessories
102,118
415-1-4 Reinforcing Steel 102,118
458-1-12 Bridge Deck Expansion Joint32-34-00.00 Fabricated Bridges
32-34-10.10 Bridges, Highway
Bridge Deck Expansion
Joint
274.00 lf 105.39 326.45 - 3.69 - 435.53 119,335
Bridges, Highway 119,335
Fabricated Bridges 119,335
458-1-12 Bridge Deck 119,335
Expansion Joint
460-2-1 Structural Steel05-12-23.00 Structural Steel For Bridges
A-291
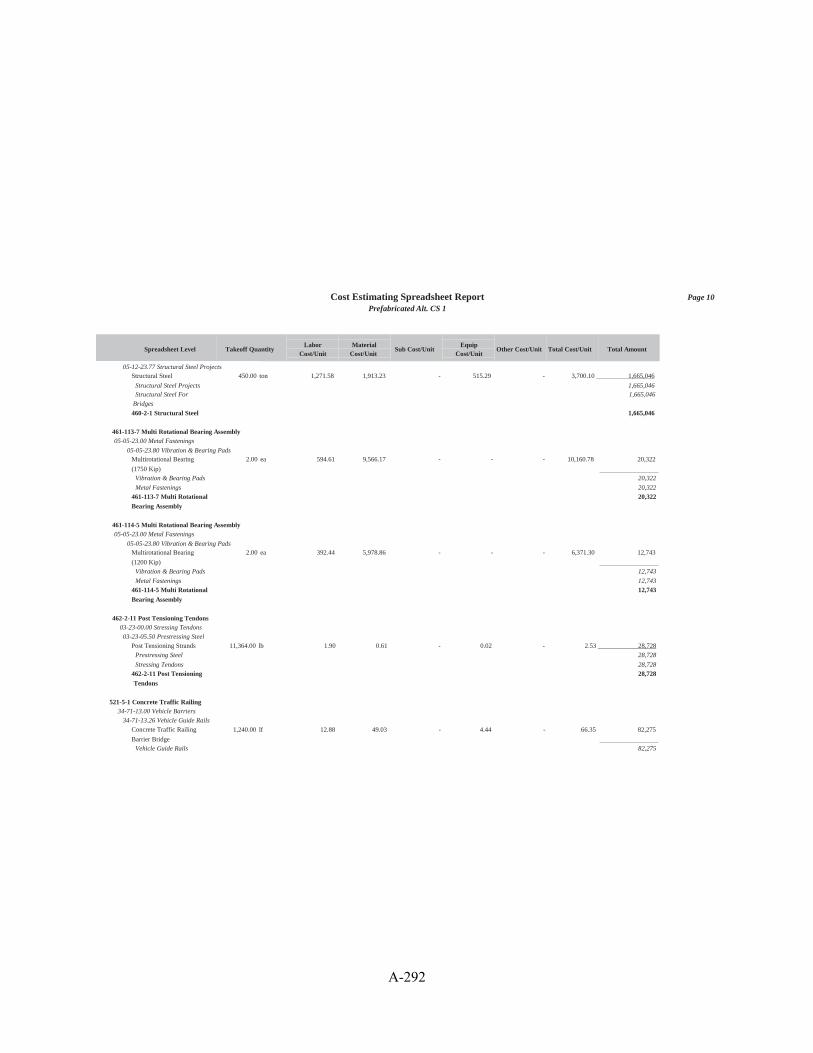
Cost Estimating Spreadsheet ReportPrefabricated Alt. CS 1
Page 10
5-12-23.77 Structural Steel Projects0
61-113-7 Multi Rotational Bearing Assembly4
5-05-23.00 Metal Fastenings05-05-23.80 Vibration & Bearing Pads0
61-114-5 Multi Rotational Bearing Assembly4
5-05-23.00 Metal Fastenings05-05-23.80 Vibration & Bearing Pads0
62-2-11 Post Tensioning Tendons4
3-23-00.00 Stressing Tendons03-23-05.50 Prestressing Steel0
21-5-1 Concrete Traffic Railing54-71-13.00 Vehicle Barriers3
4-71-13.26 Vehicle Guide Rails3
Spreadsheet Level Takeoff Quantity
05-12-23.77 Structural Steel Projects
LaborCost/Unit
MaterialCost/Unit
Sub Cost/UnitEquip
Cost/UnitOther Cost/Unit Total Cost/Unit Total Amount
Structural Steel 450.00 ton 1,271.58 1,913.23 - 515.29 - 3,700.10 1,665,046
Structural Steel Projects 1,665,046Structural Steel For
Bridges
1,665,046
460-2-1 Structural Steel 1,665,046
461-113-7 Multi Rotational Bearing Assembly05-05-23.00 Metal Fastenings
05-05-23.80 Vibration & Bearing PadsMultirotational Bearing
(1750 Kip)
2.00 ea 594.61 9,566.17 - - - 10,160.78 20,322
Vibration & Bearing Pads 20,322
Metal Fastenings 20,322
461-113-7 Multi Rotational
Bearing Assembly
20,322
461-114-5 Multi Rotational Bearing Assembly05-05-23.00 Metal Fastenings
05-05-23.80 Vibration & Bearing PadsMultirotational Bearing
(1200 Kip)
2.00 ea 392.44 5,978.86 - - - 6,371.30 12,743
Vibration & Bearing Pads 12,743
Metal Fastenings 12,743
461-114-5 Multi Rotational
Bearing Assembly
12,743
462-2-11 Post Tensioning Tendons03-23-00.00 Stressing Tendons
03-23-05.50 Prestressing Steel
Post Tensioning Strands 11,364.00 lb 1.90 0.61 - 0.02 - 2.53 28,728
Prestressing Steel 28,728
Stressing Tendons 28,728
462-2-11 Post Tensioning
Tendons
28,728
521-5-1 Concrete Traffic Railing34-71-13.00 Vehicle Barriers
34-71-13.26 Vehicle Guide Rails
Concrete Traffic Railing
Barrier Bridge
1,240.00 lf 12.88 49.03 - 4.44 - 66.35 82,275
Vehicle Guide Rails 82,275
A-292
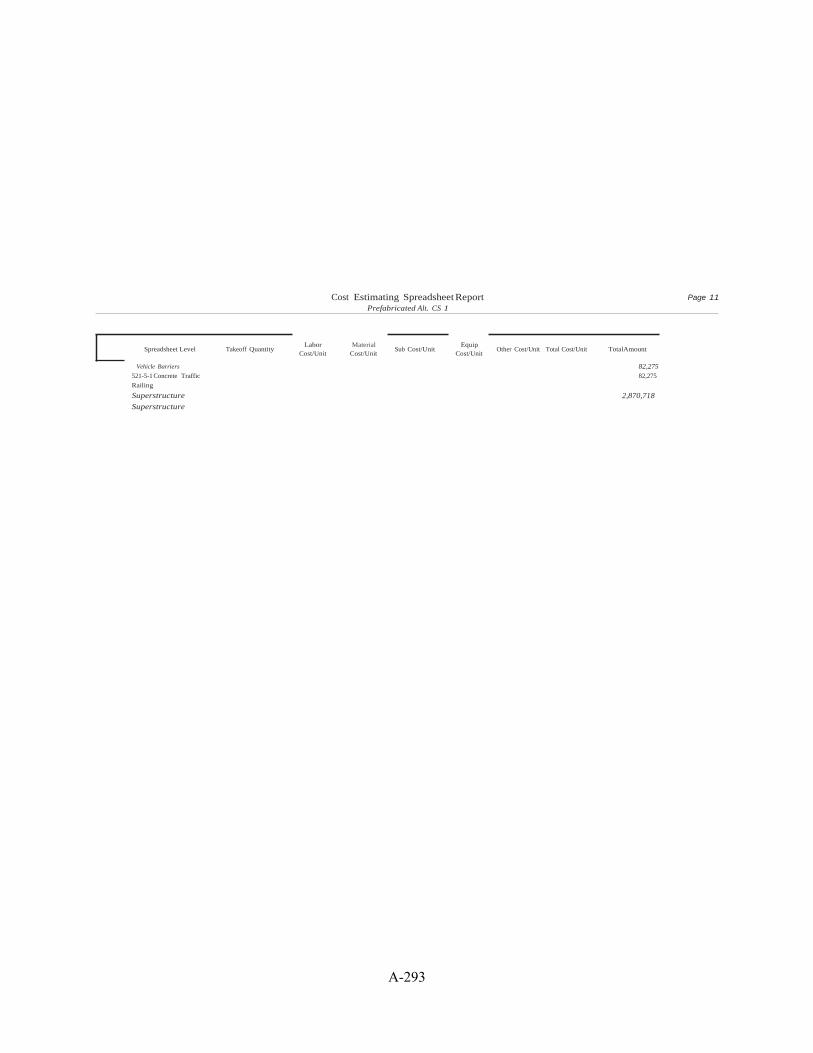
Cost Estimating Spreadsheet ReportPrefabricated Alt. CS 1
Page 11
Spreadsheet Level
Vehicle Barriers
521-5-1 Concrete Traffic
Railing
Superstructure
Superstructure
Takeoff QuantityLabor
Cost/UnitMaterial
Cost/UnitSub Cost/Unit
EquipCost/Unit
Other Cost/Unit Total Cost/Unit TotalAmount
82,27582,275
2,870,718
A-293

Cost Estimating Spreadsheet ReportPrefabricated Alt. CS 1
Page 12
Estimate Totals
Description Amount Net Amount Totals Hours Rate Cost Basis Percent of TotalLabor 1,889,726 1,889,726 10,449.281 ch 35.38%
Material 1,887,855 1,887,855 35.35%
Subcontract 789,209 789,209 14.78%
Equipment 679,331 679,331 3,261.644 ch 12.72%
Other 94,564 94,564 1.77%
5,340,685 5,340,685 100.00 100.00%
Total 5,340,685
A-294
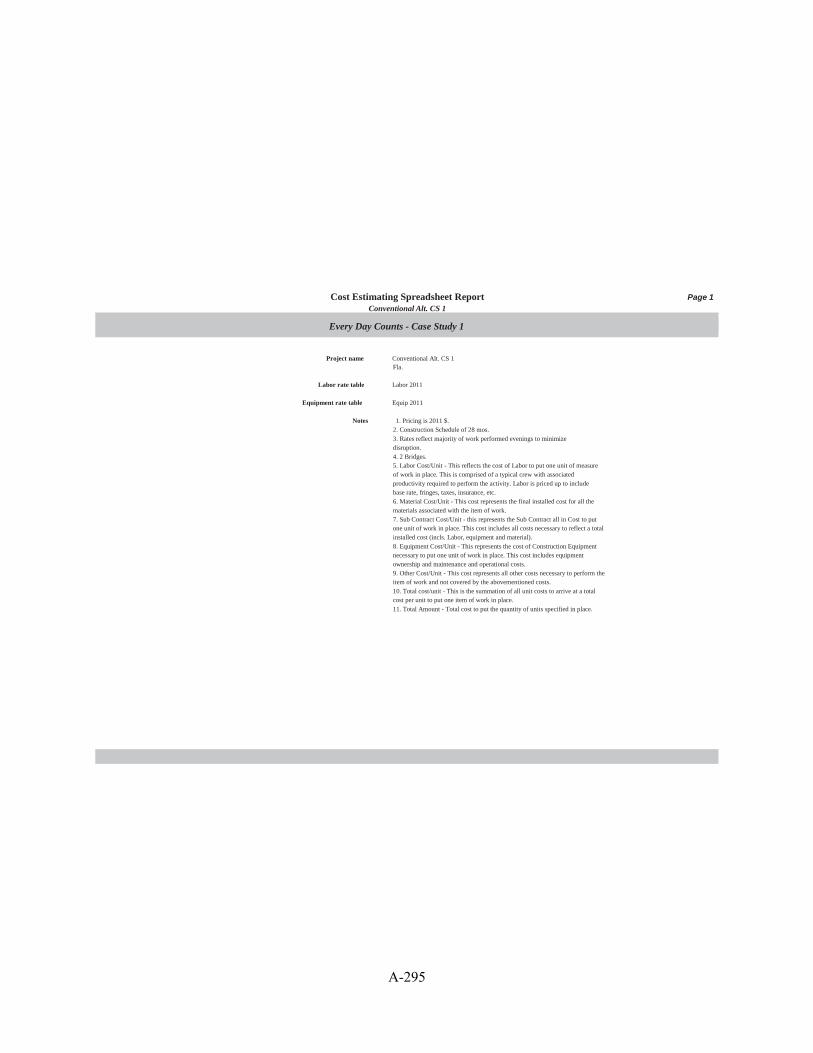
Cost Estimating Spreadsheet ReportConventional Alt. CS 1
Page 1
Every Day Counts - Case Study 1
Project name Conventional Alt. CS 1 Fla.
Labor rate table Labor 2011
Equipment rate table Equip 2011
Notes 1. Pricing is 2011 $. 2. Construction Schedule of 28 mos. 3. Rates reflect majority of work performed evenings to minimize disruption. 4. 2 Bridges. 5. Labor Cost/Unit - This reflects the cost of Labor to put one unit of measure of work in place. This is comprised of a typical crew with associated productivity required to perform the activity. Labor is priced up to include base rate, fringes, taxes, insurance, etc. 6. Material Cost/Unit - This cost represents the final installed cost for all the materials associated with the item of work. 7. Sub Contract Cost/Unit - this represents the Sub Contract all in Cost to put one unit of work in place. This cost includes all costs necessary to reflect a total installed cost (incls. Labor, equipment and material). 8. Equipment Cost/Unit - This represents the cost of Construction Equipment necessary to put one unit of work in place. This cost includes equipment ownership and maintenance and operational costs. 9. Other Cost/Unit - This cost represents all other costs necessary to perform the item of work and not covered by the abovementioned costs. 10. Total cost/unit - This is the summation of all unit costs to arrive at a total cost per unit to put one item of work in place. 11. Total Amount - Total cost to put the quantity of units specified in place.
A-295
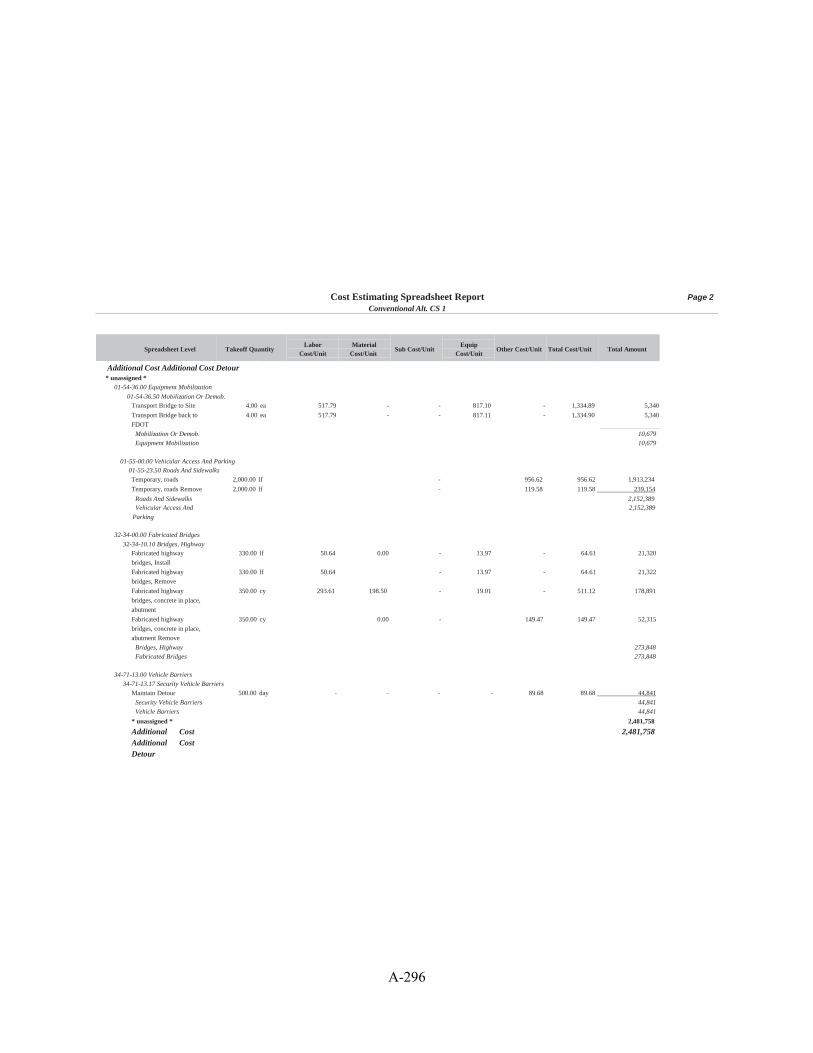
Cost Estimating Spreadsheet ReportConventional Alt. CS 1
Page 2
dditional Cost Additional Cost DetourAnassigned ** u
1-54-36.00 Equipment Mobilization01-54-36.50 Mobilization Or De ob.0 m
1-55-00.00 Vehicular Access And Parking01-55-23.50 Roads And Sidewalks0
2-34-00.00 Fabricated Bridges32-34-10.10 Bridges, Highway3
4-71-13.00 Vehicle Barriers34-71-13.17 Security Vehicle Barriers3
Spreadsheet Level Takeoff Quantity
Additional Cost Additional Cost Detour* unassigned *
01-54-36.00 Equipment Mobilization
01-54-36.50 Mobilization Or Demob.
LaborCost/Unit
MaterialCost/Unit
Sub Cost/UnitEquip
Cost/UnitOther Cost/Unit Total Cost/Unit Total Amount
Transport Bridge to Site 4.00 ea 517.79 - - 817.10 - 1,334.89 5,340
Transport Bridge back to 4.00 ea 517.79 - - 817.11 - 1,334.90 5,340
FDOT
Mobilization Or Demob. 10,679
Equipment Mobilization 10,679
01-55-00.00 Vehicular Access And Parking01-55-23.50 Roads And Sidewalks
Temporary, roads 2,000.00 lf - 956.62 956.62 1,913,234
Temporary, roads Remove 2,000.00 lf - 119.58 119.58 239,154
Roads And Sidewalks 2,152,389Vehicular Access And
Parking
2,152,389
32-34-00.00 Fabricated Bridges
32-34-10.10 Bridges, HighwayFabricated highway 330.00 lf 50.64 0.00 - 13.97 - 64.61 21,320
bridges, Install
Fabricated highway 330.00 lf 50.64 - 13.97 - 64.61 21,322
bridges, Remove
Fabricated highway 350.00 cy 293.61 198.50 - 19.01 - 511.12 178,891
bridges, concrete in place,
abutment
Fabricated highway 350.00 cy 0.00 - 149.47 149.47 52,315
bridges, concrete in place,
abutment Remove
Bridges, Highway 273,848Fabricated Bridges 273,848
34-71-13.00 Vehicle Barriers
34-71-13.17 Security Vehicle Barriers
Maintain Detour 500.00 day - - - - 89.68 89.68 44,841
Security Vehicle Barriers 44,841
Vehicle Barriers 44,841
* unassigned * 2,481,758
Additional Cost Additional Cost Detour
2,481,758
A-296
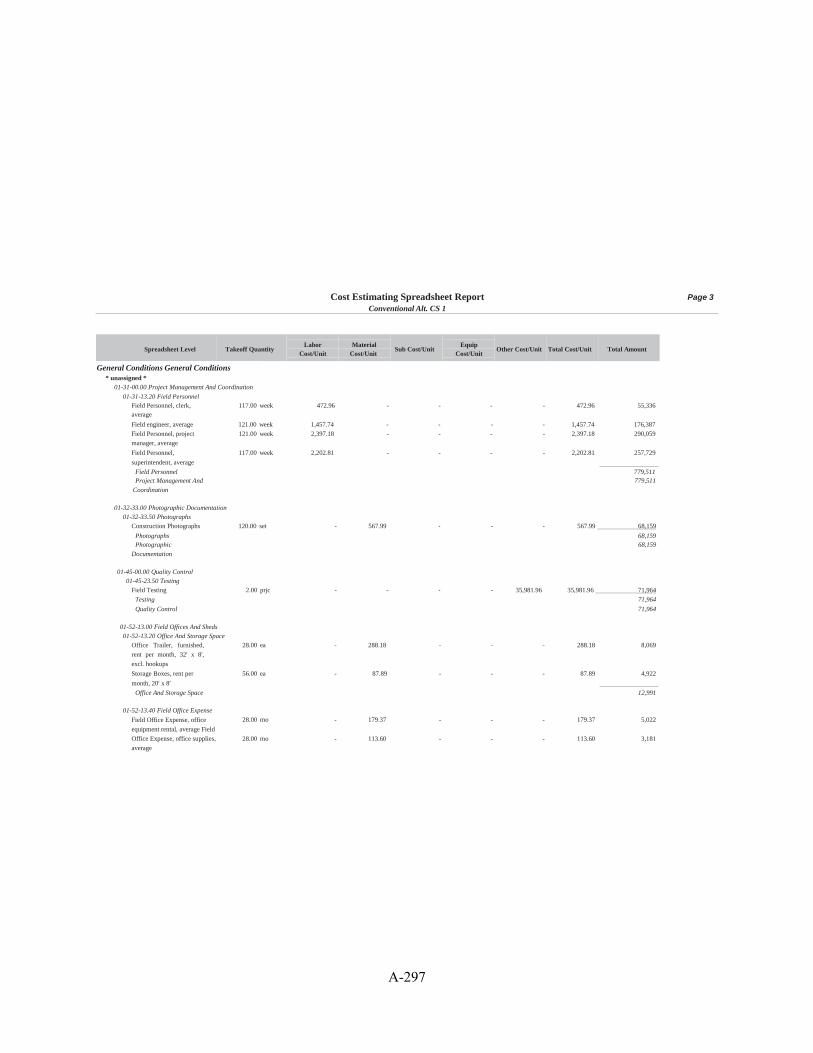
Cost Estimating Spreadsheet ReportConventional Alt. CS 1
Page 3
eneral Conditions General ConditionsGnassigned ** u
1-31-00.00 Project Management And Coordination01-31-13.20 Field Personnel0
1-32-33.00 Photographic Documentation01-32-33.50 Photographs0
1-45-00.00 Quality Control01-45-23.50 Testing0
1-52-13.00 Field Offices And Sheds01-52-13.20 Office And Storage Space0
1-52-13.40 Field Office Expense0
Spreadsheet Level Takeoff Quantity
General Conditions General Conditions* unassigned *
01-31-00.00 Project Management And Coordination
01-31-13.20 Field Personnel
LaborCost/Unit
MaterialCost/Unit
Sub Cost/UnitEquip
Cost/UnitOther Cost/Unit Total Cost/Unit Total Amount
Field Personnel, clerk, average
117.00 week 472.96 - - - - 472.96 55,336
Field engineer, average 121.00 week 1,457.74 - - - - 1,457.74 176,387
Field Personnel, project
manager, average
Field Personnel,
superintendent, average
121.00 week 2,397.18 - - - - 2,397.18 290,059
117.00 week 2,202.81 - - - - 2,202.81 257,729
Field Personnel 779,511Project Management And
Coordination
779,511
01-32-33.00 Photographic Documentation01-32-33.50 Photographs
Construction Photographs 120.00 set - 567.99 - - - 567.99 68,159
Photographs 68,159Photographic
Documentation
68,159
01-45-00.00 Quality Control01-45-23.50 Testing
Field Testing 2.00 prjc - - - - 35,981.96 35,981.96 71,964
Testing 71,964
Quality Control 71,964
01-52-13.00 Field Offices And Sheds01-52-13.20 Office And Storage Space
Office Trailer, furnished,
rent per month, 32' x 8',
excl. hookups
Storage Boxes, rent per
month, 20' x 8'
28.00 ea - 288.18 - - - 288.18 8,069
56.00 ea - 87.89 - - - 87.89 4,922
Office And Storage Space 12,991
01-52-13.40 Field Office Expense
Field Office Expense, office
equipment rental, average Field
Office Expense, office supplies,
average
28.00 mo - 179.37 - - - 179.37 5,022
28.00 mo - 113.60 - - - 113.60 3,181
A-297
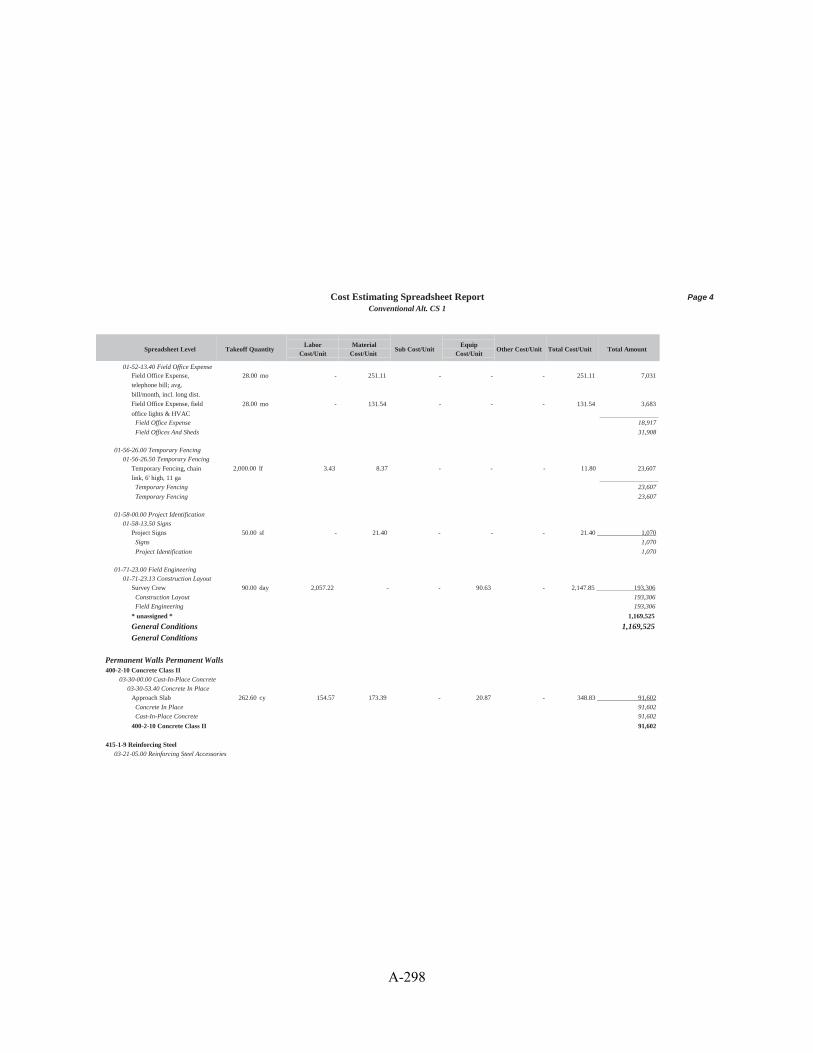
Cost Estimating Spreadsheet ReportConventional Alt. CS 1
Page 4
1-52-13.40 Field Office Expense0
1-56-26.00 Temporary Fencing01-56-26.50 Temporary Fencing0
1-58-00.00 Project Identification01-58-13.50 Signs0
1-71-23.00 Field Engineering01-71-23.13 Construction Layout0
er anent Walls Permanent WallsP m00-2-10 Concrete Class II4
3-30-00.00 Cast-In-Place Concrete03-30-53.40 Concrete In Place0
15-1-9 Reinforcing Steel4
3-21-05.00 Reinforcing Steel Accessories0
Spreadsheet Level Takeoff Quantity
01-52-13.40 Field Office Expense
LaborCost/Unit
MaterialCost/Unit
Sub Cost/UnitEquip
Cost/UnitOther Cost/Unit Total Cost/Unit Total Amount
Field Office Expense,
telephone bill; avg.
bill/month, incl. long dist.
Field Office Expense, field
office lights & HVAC
28.00 mo - 251.11 - - - 251.11 7,031
28.00 mo - 131.54 - - - 131.54 3,683
Field Office Expense 18,917
Field Offices And Sheds 31,908
01-56-26.00 Temporary Fencing01-56-26.50 Temporary Fencing
Temporary Fencing, chain
link, 6' high, 11 ga
2,000.00 lf 3.43 8.37 - - - 11.80 23,607
Temporary Fencing 23,607
Temporary Fencing 23,607
01-58-00.00 Project Identification01-58-13.50 Signs
Project Signs 50.00 sf - 21.40 - - - 21.40 1,070
Signs 1,070
Project Identification 1,070
01-71-23.00 Field Engineering01-71-23.13 Construction Layout
Survey Crew 90.00 day 2,057.22 - - 90.63 - 2,147.85 193,306
Construction Layout 193,306
Field Engineering 193,306
* unassigned * 1,169,525
General ConditionsGeneral Conditions
1,169,525
Permanent Walls Permanent Walls400-2-10 Concrete Class II
03-30-00.00 Cast-In-Place Concrete
03-30-53.40 Concrete In Place
Approach Slab 262.60 cy 154.57 173.39 - 20.87 - 348.83 91,602
Concrete In Place 91,602
Cast-In-Place Concrete 91,602
400-2-10 Concrete Class II 91,602
415-1-9 Reinforcing Steel
03-21-05.00 Reinforcing Steel Accessories
A-298

Cost Estimating Spreadsheet ReportConventional Alt. CS 1
Page 5
3-21-10.60 Reinforcing In Place0
21-8-1 Concret Traffic Railing54-71-13.00 Vehicle Barriers3
4-71-13.26 Vehicle Guide Rails3
48-12 Retainig Wall System5
2-32-23.00 Retaining Walls32-32-23.13 Retaining Walls3
ubstructure-End Substructure-End BentsS00-4-5 Concrete Class IV (Substructure)4
3-30-00.00 Cast-In-Place Concrete03-30-53.40 Concrete In Place0
15-1-5 Reinforcing Steel Substructure4
3-21-05.00 Reinforcing Steel Accessories03-21-10.60 Reinforcing In Place0
Spreadsheet Level Takeoff Quantity
03-21-10.60 Reinforcing In Place
LaborCost/Unit
MaterialCost/Unit
Sub Cost/UnitEquip
Cost/UnitOther Cost/Unit Total Cost/Unit Total Amount
Reinforcing Steel Approach
Slabs
53,832.00 lb 0.40 0.06 - 0.08 - 0.54 28,866
Reinforcing In Place 28,866Reinforcing Steel
Accessories
28,866
415-1-9 Reinforcing Steel 28,866
521-8-1 Concret Traffic Railing34-71-13.00 Vehicle Barriers
34-71-13.26 Vehicle Guide Rails
Concrete Traffic Railing
Barrier Retaining Wall
100.00 lf 13.96 49.03 - 4.44 - 67.43 6,743
Vehicle Guide Rails 6,743
Vehicle Barriers 6,743
521-8-1 Concret Traffic
Railing
6,743
548-12 Retainig Wall System32-32-23.00 Retaining Walls
32-32-23.13 Retaining Walls
Retaining Wall System 13,826.00 sf 8.28 14.05 - 4.24 - 26.58 367,434
Retaining Walls 367,434
Retaining Walls 367,434548-12 Retainig Wall
System
Permanent WallsPermanent Walls
367,434
494,644
Substructure-End Substructure-End Bents400-4-5 Concrete Class IV (Substructure)
03-30-00.00 Cast-In-Place Concrete03-30-53.40 Concrete In Place
Concrete Class IV 144.00 cy 309.15 197.30 - 41.73 - 548.18 78,938
Concrete In Place 78,938
Cast-In-Place Concrete 78,938
400-4-5 Concrete Class IV
(Substructure)
78,938
415-1-5 Reinforcing Steel Substructure03-21-05.00 Reinforcing Steel Accessories
03-21-10.60 Reinforcing In Place
A-299

Cost Estimating Spreadsheet ReportConventional Alt. CS 1
Page 6
3-21-10.60 Reinforcing In Place0
55-143-5 Test Piles4
1-62-00.00 Driven Piles31-62-13.23 Prestressed Concrete Piles3
55-34-5 Concrete Piling Prestressed4
1-62-00.00 Driven Piles31-62-13.23 Prestressed Concrete Piles3
ubstructure-Piers Substructure-PiersS00-4-5 Concrete Class IV (Substructure)4
3-30-00.00 Cast-In-Place Concrete03-30-53.40 Concrete In Place0
Spreadsheet Level Takeoff Quantity
03-21-10.60 Reinforcing In Place
LaborCost/Unit
MaterialCost/Unit
Sub Cost/UnitEquip
Cost/UnitOther Cost/Unit Total Cost/Unit Total Amount
Reinforcing Steel 19,440.00 lb 0.53 0.50 - 0.11 - 1.13 21,996
Reinforcing In Place 21,996Reinforcing SteelAccessories
415-1-5 Reinforcing Steel
Substructure
21,996
21,996
455-143-5 Test Piles31-62-00.00 Driven Piles
31-62-13.23 Prestressed Concrete PilesPrestressed concrete piles,
24" square, Test Pile
Prestressed Concrete
Piles
380.00 vlf 32.18 65.77 - 18.54 - 116.48 44,263
44,263
Driven Piles 44,263
455-143-5 Test Piles 44,263
455-34-5 Concrete Piling Prestressed31-62-00.00 Driven Piles
31-62-13.23 Prestressed Concrete PilesPrestressed concrete piles,
24" square,
Prestressed Concrete
Piles
2,240.00 vlf 11.70 65.77 - 6.74 - 84.21 188,628
188,628
Driven Piles 188,628455-34-5 Concrete Piling
Prestressed
Substructure-End Substructure-EndBents
188,628
333,825
Substructure-Piers Substructure-Piers400-4-5 Concrete Class IV (Substructure)
03-30-00.00 Cast-In-Place Concrete
03-30-53.40 Concrete In Place
Concrete Class IV 283.40 cy 309.15 197.30 - 41.73 - 548.18 155,354
Concrete In Place 155,354
Cast-In-Place Concrete 155,354
400-4-5 Concrete Class IV
(Substructure)
155,354
A-300

Cost Estimating Spreadsheet ReportConventional Alt. CS 1
Page 7
15-1-5 Reinforcing Steel Substructure43-21-05.00 Reinforcing Steel Accessories0
3-21-10.60 Reinforcing In Place0
55-143-5 Test Piles4
1-62-00.00 Driven Piles31-62-13.23 Prestressed Concrete Piles3
55-34-5 Concrete Piling Prestressed4
1-62-00.00 Driven Piles31-62-13.23 Prestressed Concrete Piles3
uperstructure SuperstructureS10-3 Structure Removal of Existing1
2-41-16.00 Structure Demolition02-41-16.33 Bridge Demolition0
Spreadsheet Level Takeoff QuantityLabor
Cost/Unit
Material
Cost/UnitSub Cost/Unit
Equip
Cost/UnitOther Cost/Unit Total Cost/Unit Total Amount
415-1-5 Reinforcing Steel Substructure
03-21-05.00 Reinforcing Steel Accessories03-21-10.60 Reinforcing In Place
Reinforcing Steel 42,510.00 lb 0.53 0.50 - 0.11 - 1.13 48,100
Reinforcing In Place 48,100Reinforcing SteelAccessories
415-1-5 Reinforcing Steel
Substructure
48,100
48,100
455-143-5 Test Piles31-62-00.00 Driven Piles
31-62-13.23 Prestressed Concrete PilesPrestressed concrete piles,
24" square, Test Pile
Prestressed Concrete
Piles
170.00 vlf 32.18 65.77 - 18.54 - 116.48 19,802
19,802
Driven Piles 19,802
455-143-5 Test Piles 19,802
455-34-5 Concrete Piling Prestressed
31-62-00.00 Driven Piles
31-62-13.23 Prestressed Concrete PilesPrestressed concrete piles,
24" square,
Prestressed Concrete
Piles
1,960.00 vlf 11.70 65.77 - 6.74 - 84.21 165,050
165,050
Driven Piles 165,050
455-34-5 Concrete Piling
Prestressed
Substructure-PiersSubstructure-Piers
165,050
388,305
Superstructure Superstructure110-3 Structure Removal of Existing
02-41-16.00 Structure Demolition
02-41-16.33 Bridge Demolition
Bridge demolition 21,048.00 sf 15.31 - - 9.18 - 24.49 515,552
Bridge Demolition 515,552
Structure Demolition 515,552
A-301

Cost Estimating Spreadsheet ReportConventional Alt. CS 1
Page 8
00-147 Composite Neoprene Pads4
5-05-23.00 Metal Fastenings05-05-23.80 Vibration & Bearing Pads0
00-2-4 Concrete Class II4
3-30-00.00 Cast-In-Place Concrete03-30-53.40 Concrete In Place0
00-9 Bridge Floor Grooving42-13-13.00 Concrete Paving3
2-13-13.23 Concrete Paving Surface Treatment3
15-1-4 Reinforcing Steel4
3-21-05.00 Reinforcing Steel Accessories03-21-10.60 Reinforcing In Place0
50-2-54 Prestressed Beams42-34-00.00 Fabricated Bridges3
2-34-10.10 Bridges, Highway3
Spreadsheet Level Takeoff Quantity
110-3 Structure Removal of Existing
LaborCost/Unit
MaterialCost/Unit
Sub Cost/UnitEquip
Cost/UnitOther Cost/Unit Total Cost/Unit Total Amount
515,552
400-147 Composite Neoprene Pads05-05-23.00 Metal Fastenings
05-05-23.80 Vibration & Bearing Pads
Bearing Pads 37.80 cf 85.05 717.46 - - - 802.51 30,335
Vibration & Bearing Pads 30,335
Metal Fastenings 30,335
400-147 Composite
Neoprene Pads
30,335
400-2-4 Concrete Class II03-30-00.00 Cast-In-Place Concrete
03-30-53.40 Concrete In Place
Concrete Class II 905.20 cy 154.57 173.39 - 20.87 - 348.83 315,757
Concrete In Place 315,757
Cast-In-Place Concrete 315,757
400-2-4 Concrete Class II 315,757
400-9 Bridge Floor Grooving32-13-13.00 Concrete Paving
32-13-13.23 Concrete Paving Surface Treatment
Concrete grooving 4,158.00 sy 2.51 - - 5.20 - 7.71 32,061Concrete Paving Surface
Treatment
32,061
Concrete Paving 32,061400-9 Bridge Floor
Grooving
32,061
415-1-4 Reinforcing Steel
03-21-05.00 Reinforcing Steel Accessories
03-21-10.60 Reinforcing In PlaceReinforcing Steel
Superstructure
185,566.00 lb 0.40 0.06 - 0.08 - 0.54 99,503
Reinforcing In Place 99,503Reinforcing Steel
Accessories
99,503
415-1-4 Reinforcing Steel 99,503
450-2-54 Prestressed Beams
32-34-00.00 Fabricated Bridges32-34-10.10 Bridges, Highway
A-302

Cost Estimating Spreadsheet ReportConventional Alt. CS 1
Page 9
2-34-10.10 Bridges, Highway3
58-1-12 Bridge Deck Expansion Joint42-34-00.00 Fabricated Bridges3
2-34-10.10 Bridges, Highway3
21-5-1 Concrete Traffic Railing54-71-13.00 Vehicle Barriers3
4-71-13.26 Vehicle Guide Rails3
Spreadsheet Level Takeoff Quantity
32-34-10.10 Bridges, Highway
LaborCost/Unit
MaterialCost/Unit
Sub Cost/UnitEquip
Cost/UnitOther Cost/Unit Total Cost/Unit Total Amount
Fabricated highway
bridges, precast,
prestressed concrete, I
beams
4,224.00 lf - - - - 191.32 191.32 808,150
Bridges, Highway 808,150
Fabricated Bridges 808,150
450-2-54 Prestressed
Beams
808,150
458-1-12 Bridge Deck Expansion Joint32-34-00.00 Fabricated Bridges
32-34-10.10 Bridges, Highway
Bridge Deck Expansion
Joint
274.00 lf 114.21 326.45 - 3.69 - 444.34 121,750
Bridges, Highway 121,750
Fabricated Bridges 121,750
458-1-12 Bridge Deck 121,750
Expansion Joint
521-5-1 Concrete Traffic Railing34-71-13.00 Vehicle Barriers
34-71-13.26 Vehicle Guide Rails
Concrete Traffic Railing
Barrier Bridge
1,296.00 lf 13.96 49.03 - 4.44 - 67.43 87,387
Vehicle Guide Rails 87,387
Vehicle Barriers 87,387521-5-1 Concrete Traffic
Railing Superstructure Superstructure
87,387
2,010,495
A-303

Cost Estimating Spreadsheet ReportConventional Alt. CS 1
Page 10
Estimate Totals
Description Amount Cuts/Adds Net Amount Totals Hours Rate Cost Basis Percent of Total
Labor 2,119,985 2,119,985 21,670.339 ch 30.82% Material 1,210,878 1,210,878 17.60%
Subcontract
Equipment 418,030 418,030 2,561.883 ch 6.08%
Other 3,129,659 3,129,659 45.50%
6,878,552 6,878,552 100.00 100.00%
Total 6,878,552
A-304

New Jersey Department of TransportationDATE : 11/15/2013PAGE : 1
JOB ESTIMATE REPORT====================================================================================================================================
JOB NUMBER : 960694 SPEC YEAR: 07 DESCRIPTION: N.J. ROUTE 10 OVER PASSAIC RIVER SUPERSTRUCTURE REPLACEMENT
ITEMS FOR JOB 960694
LINE ITEM ALT UNITS DESCRIPTION QUANTITY PRICE AMOUNT ---------------------------------------------------------------------------------------------------------------------------------- 0001 151006M DOLL PERFORMANCE BOND AND PAYMENT BOND 1.000 27000.00 27000.00 0002 152004P DOLL OWNER'S AND CONTRACTOR'S PROTECTIVE 1.000 10000.00 10000.00 LIAB 0003 152015P DOLL POLLUTION LIABILITY INSURANCE 1.000 10000.00 10000.00 0004 153003P LS PROGRESS SCHEDULE 1.000 10000.00 10000.00 0005 153006P U PROGRESS SCHEDULE UPDATE 2.000 500.00 1000.00 0006 153012P HOUR TRAINEES 300.000 1.00 300.00 0007 154003P LS MOBILIZATION 1.000 380000.00 380000.00 0008 155009M U FIELD OFFICE TYPE C SET UP 1.000 25000.00 25000.00 0009 155027M MO FIELD OFFICE TYPE C MAINTENANCE 10.000 3400.00 34000.00 0010 157004M DOLL CONSTRUCTION LAYOUT 1.000 45000.00 45000.00 0011 158009M LF HEAVY DUTY SILT FENCE, ORANGE 1944.000 7.00 13608.00 0012 158030M U INLET FILTER TYPE 2, 2' X 4' 27.000 124.00 3348.00 0013 158033M U INLET FILTER TYPE 2, 4' X 4' 8.000 165.00 1320.00 0014 158045M LF FLOATING TURBIDITY BARRIER, TYPE 2 312.000 20.00 6240.00 0015 158055M U SEDIMENT CONTROL BAG 1.000 700.00 700.00 0016 158063P LS CONCRETE WASHOUT SYSTEM 1.000 1000.00 1000.00 0017 158072M U OIL ONLY EMERGENCY SPILL KIT, TYPE 1 2.000 800.00 1600.00 0018 159003M U BREAKAWAY BARRICADE 20.000 65.00 1300.00 0019 159006M U DRUM 140.000 45.00 6300.00 0020 159009M U TRAFFIC CONE 100.000 12.00 1200.00 0021 159012M SF CONSTRUCTION SIGNS 1750.000 11.00 19250.00 0022 159015M U CONSTRUCTION IDENTIFICATION SIGN, 4' X 2.000 1200.00 2400.00 8 0023 159021P LF CONSTRUCTION BARRIER CURB 1500.000 50.00 75000.00 0024 159027M U FLASHING ARROW BOARD, 4' X 8' 2.000 2500.00 5000.00 0025 159030M U PORTABLE VARIABLE MESSAGE SIGN 8.000 10000.00 80000.00 0026 159051M U TEMPORARY CRASH CUSHION, INERTIAL 1.000 11000.00 11000.00 BARRIE 0027 159108M U TRAFFIC CONTROL TRUCK WITH MOUNTED 2.000 12500.00 25000.00 CRASH 0028 159114M LF REMOVABLE BLACK LINE MASKING TAPE, 6" 16000.000 2.00 32000.00
0029 159120M LF TEMPORARY PAVEMENT MARKING TAPE, 4" 900.000 1.00 900.00 0030 159126M LF TEMPORARY TRAFFIC STRIPES, 4" 36000.000 0.25 9000.00 0031 159132M SF TEMPORARY PAVEMENT MARKINGS 650.000 3.00 1950.00 0032 159141M HOUR TRAFFIC DIRECTOR, FLAGGER 120.000 95.00 11400.00 0033 160004M DOLL FUEL PRICE ADJUSTMENT 1.000 1400.00 1400.00 0034 160007M DOLL ASPHALT PRICE ADJUSTMENT 1.000 5700.00 5700.00 0035 161003P LS FINAL CLEANUP 1.000 7500.00 7500.00 0036 201003P LS CLEARING SITE 1.000 40000.00 40000.00 0037 202006M CY EXCAVATION, TEST PIT 10.000 265.00 2650.00 0038 202009P CY EXCAVATION, UNCLASSIFIED 755.000 30.00 22650.00 0039 202021P SY REMOVAL OF PAVEMENT 1156.000 28.00 32368.00
A-305

New Jersey Department of TransportationDATE : 11/15/2013PAGE : 2
JOB ESTIMATE REPORT==================================================================================================================================== 0040 203054M CY FLOWABLE CONCRETE FILL 5.000 28.00 140.00 0041 301006P CY SUBBASE 337.000 40.00 13480.00 0042 302036P SY DENSE-GRADED AGGREGATE BASE COURSE, 6" 1160.000 13.00 15080.00 T 0043 304006P SY CONCRETE BASE COURSE, 9" THICK 97.000 108.00 10476.00 0044 401009P SY HMA MILLING, 3" OR LESS 18927.000 3.00 56781.00 0045 401021M SY HOT MIX ASPHALT PAVEMENT REPAIR 100.000 38.00 3800.00 0046 401027M LF POLYMERIZED JOINT ADHESIVE 16500.000 0.25 4125.00 0047 401030M GAL TACK COAT 2049.000 1.50 3073.50 0048 401036M GAL PRIME COAT 373.000 2.50 932.50 0049 401048M T HOT MIX ASPHALT 9.5 M 76 SURFACE COURSE 1200.000 110.00 132000.00
0050 401060M T HOT MIX ASPHALT 12.5 M 76 SURFACE 1197.000 100.00 119700.00 COURSE 0051 401078M T HOT MIX ASPHALT 12.5 M 76 INTERMEDIATE 188.000 95.00 17860.00 C 0052 401099M T HOT MIX ASPHALT 25 M 64 BASE COURSE 437.000 135.00 58995.00 0053 401108M U CORE SAMPLES, HOT MIX ASPHALT 5.000 150.00 750.00 0054 453006M SY FULL DEPTH CONCRETE PAVEMENT REPAIR, 420.000 220.00 92400.00 HMA 0055 501009P LS TEMPORARY COFFERDAM 1.000 5000.00 5000.00 0056 601122P LF 15" REINFORCED CONCRETE PIPE 102.000 74.00 7548.00 0057 601249P LF 6" HIGH DENSITY POLYETHYLENE PIPE 45.000 40.00 1800.00 0058 601404P LF SUBBASE OUTLET DRAIN 106.000 40.00 4240.00 0059 602012M U INLET, TYPE B 7.000 2750.00 19250.00 0060 602099M U RESET EXISTING CASTING 37.000 490.00 18130.00 0061 602210M U BICYCLE SAFE GRATE 2.000 430.00 860.00 0062 602213M U CURB PIECE 11.000 360.00 3960.00 0063 602290M U INLET, NON-STANDARD SEE CONSTRUCTION 3.000 5100.00 15300.00 DETAILS 0064 603103P CY RIPRAP STONE SCOUR PROTECTION (D50=12") 22.000 115.00 2530.00
0065 605209P LF ORNAMENTAL FENCE 95.000 55.00 5225.00 0066 605212P LF RESET FENCE 85.000 35.00 2975.00 0067 606024P SY CONCRETE SIDEWALK, REINFORCED, 6" THICK 50.000 65.00 3250.00
0068 606039P SY HOT MIX ASPHALT DRIVEWAY, 6" THICK 106.000 58.00 6148.00 0069 606075P SY CONCRETE ISLAND, 4" THICK 24.000 105.00 2520.00 0070 606084P SY DETECTABLE WARNING SURFACE 4.000 290.00 1160.00 0071 607018P LF 9" X 16" CONCRETE VERTICAL CURB 767.000 25.00 19175.00 0072 607030P LF 12" X 13" CONCRETE SLOPING CURB 112.000 25.00 2800.00 0073 607039P LF 24" X 35" CONCRETE BARRIER CURB, 1279.000 450.00 575550.00 DOWELLE 0074 607076P LF BELGIAN BLOCK CURB 420.000 35.00 14700.00 0075 608003P SY NONVEGETATIVE SURFACE, HOT MIX ASPHALT 233.000 26.00 6058.00
0076 609003M LF BEAM GUIDE RAIL 232.000 15.00 3480.00 0077 609024M U FLARED GUIDE RAIL TERMINAL 2.000 2000.00 4000.00 0078 609039M U BEAM GUIDE RAIL ANCHORAGE 3.000 750.00 2250.00 0079 609075M LF REMOVAL OF BEAM GUIDE RAIL 268.000 2.00 536.00 0080 610003M LF TRAFFIC STRIPES, 4" 16785.000 0.30 5035.50 0081 610006M LF TRAFFIC STRIPES, 6" 1070.000 0.70 749.00 0082 610009M SF TRAFFIC MARKINGS 932.000 9.00 8388.00 0083 610012M U RPM, MONO-DIRECTIONAL, WHITE LENS 72.000 27.00 1944.00
A-306
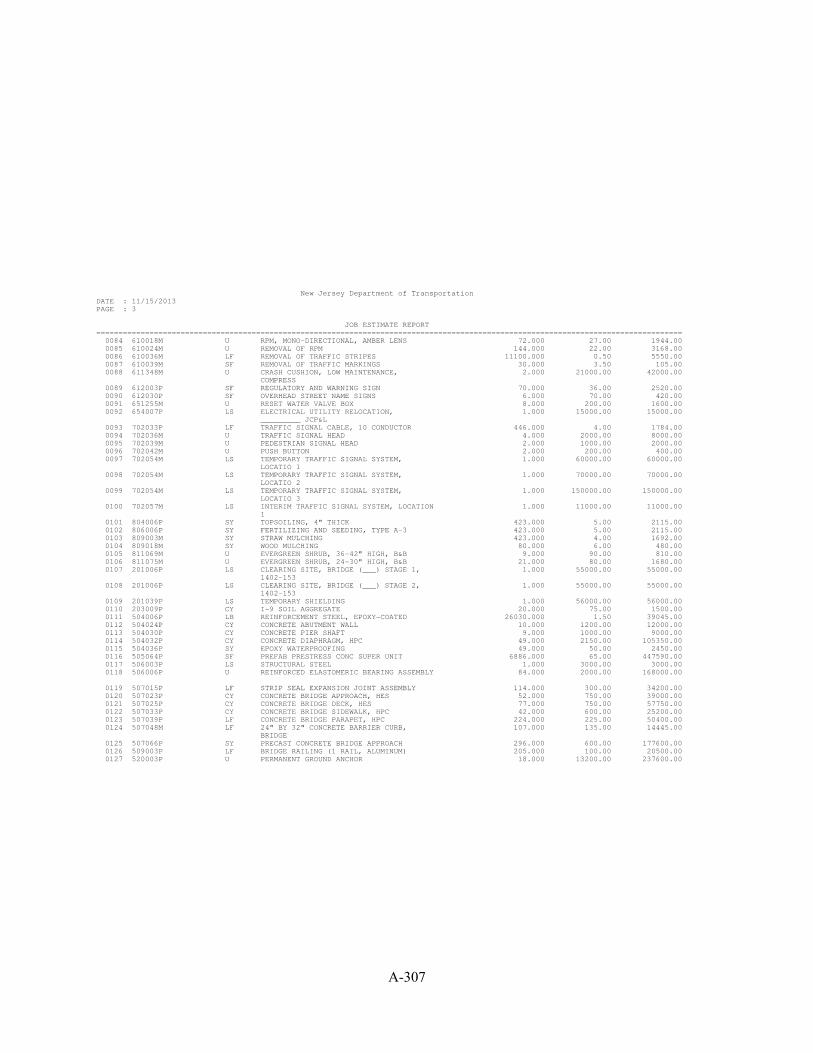
New Jersey Department of TransportationDATE : 11/15/2013PAGE : 3
JOB ESTIMATE REPORT==================================================================================================================================== 0084 610018M U RPM, MONO-DIRECTIONAL, AMBER LENS 72.000 27.00 1944.00 0085 610024M U REMOVAL OF RPM 144.000 22.00 3168.00 0086 610036M LF REMOVAL OF TRAFFIC STRIPES 11100.000 0.50 5550.00 0087 610039M SF REMOVAL OF TRAFFIC MARKINGS 30.000 3.50 105.00 0088 611348M U CRASH CUSHION, LOW MAINTENANCE, 2.000 21000.00 42000.00 COMPRESS 0089 612003P SF REGULATORY AND WARNING SIGN 70.000 36.00 2520.00 0090 612030P SF OVERHEAD STREET NAME SIGNS 6.000 70.00 420.00 0091 651255M U RESET WATER VALVE BOX 8.000 200.00 1600.00 0092 654007P LS ELECTRICAL UTILITY RELOCATION, 1.000 15000.00 15000.00 _________ JCP&L 0093 702033P LF TRAFFIC SIGNAL CABLE, 10 CONDUCTOR 446.000 4.00 1784.00 0094 702036M U TRAFFIC SIGNAL HEAD 4.000 2000.00 8000.00 0095 702039M U PEDESTRIAN SIGNAL HEAD 2.000 1000.00 2000.00 0096 702042M U PUSH BUTTON 2.000 200.00 400.00 0097 702054M LS TEMPORARY TRAFFIC SIGNAL SYSTEM, 1.000 60000.00 60000.00 LOCATIO 1 0098 702054M LS TEMPORARY TRAFFIC SIGNAL SYSTEM, 1.000 70000.00 70000.00 LOCATIO 2 0099 702054M LS TEMPORARY TRAFFIC SIGNAL SYSTEM, 1.000 150000.00 150000.00 LOCATIO 3 0100 702057M LS INTERIM TRAFFIC SIGNAL SYSTEM, LOCATION 1.000 11000.00 11000.00 1 0101 804006P SY TOPSOILING, 4" THICK 423.000 5.00 2115.00 0102 806006P SY FERTILIZING AND SEEDING, TYPE A-3 423.000 5.00 2115.00 0103 809003M SY STRAW MULCHING 423.000 4.00 1692.00 0104 809018M SY WOOD MULCHING 80.000 6.00 480.00 0105 811069M U EVERGREEN SHRUB, 36-42" HIGH, B&B 9.000 90.00 810.00 0106 811075M U EVERGREEN SHRUB, 24-30" HIGH, B&B 21.000 80.00 1680.00 0107 201006P LS CLEARING SITE, BRIDGE (___) STAGE 1, 1.000 55000.00 55000.00 1402-153 0108 201006P LS CLEARING SITE, BRIDGE (___) STAGE 2, 1.000 55000.00 55000.00 1402-153 0109 201039P LS TEMPORARY SHIELDING 1.000 56000.00 56000.00 0110 203009P CY I-9 SOIL AGGREGATE 20.000 75.00 1500.00 0111 504006P LB REINFORCEMENT STEEL, EPOXY-COATED 26030.000 1.50 39045.00 0112 504024P CY CONCRETE ABUTMENT WALL 10.000 1200.00 12000.00 0113 504030P CY CONCRETE PIER SHAFT 9.000 1000.00 9000.00 0114 504032P CY CONCRETE DIAPHRAGM, HPC 49.000 2150.00 105350.00 0115 504036P SY EPOXY WATERPROOFING 49.000 50.00 2450.00 0116 505064P SF PREFAB PRESTRESS CONC SUPER UNIT 6886.000 65.00 447590.00 0117 506003P LS STRUCTURAL STEEL 1.000 3000.00 3000.00 0118 506006P U REINFORCED ELASTOMERIC BEARING ASSEMBLY 84.000 2000.00 168000.00
0119 507015P LF STRIP SEAL EXPANSION JOINT ASSEMBLY 114.000 300.00 34200.00 0120 507023P CY CONCRETE BRIDGE APPROACH, HES 52.000 750.00 39000.00 0121 507025P CY CONCRETE BRIDGE DECK, HES 77.000 750.00 57750.00 0122 507033P CY CONCRETE BRIDGE SIDEWALK, HPC 42.000 600.00 25200.00 0123 507039P LF CONCRETE BRIDGE PARAPET, HPC 224.000 225.00 50400.00 0124 507048M LF 24" BY 32" CONCRETE BARRIER CURB, 107.000 135.00 14445.00 BRIDGE 0125 507066P SY PRECAST CONCRETE BRIDGE APPROACH 296.000 600.00 177600.00 0126 509003P LF BRIDGE RAILING (1 RAIL, ALUMINUM) 205.000 100.00 20500.00 0127 520003P U PERMANENT GROUND ANCHOR 18.000 13200.00 237600.00
A-307

New Jersey Department of TransportationDATE : 11/15/2013PAGE : 4
JOB ESTIMATE REPORT==================================================================================================================================== 0128 520006P U GROUND ANCHOR PERFORMANCE LOAD TEST 4.000 1500.00 6000.00 0129 555003M SF SUBSTRUCTURE CONCRETE REPAIR 115.000 240.00 27600.00 0130 701021P LF 3" RIGID METALLIC CONDUIT 560.000 35.00 19600.00
---------------------------------------------------------------------------------------------------------------------------------- ITEM TOTAL 4286451.50 INFLATED ITEM TOTAL 4286451.50
TOTALS FOR JOB 960694 ---------------------------------------------------------------------------------------------------------------------------------- ESTIMATED COST: 4286451.50 CONTINGENCY PERCENT ( 0.0 ): 0.00 ESTIMATED TOTAL: 4286451.50 ----------------------------------------------------------------------------------------------------------------------------------
A-308
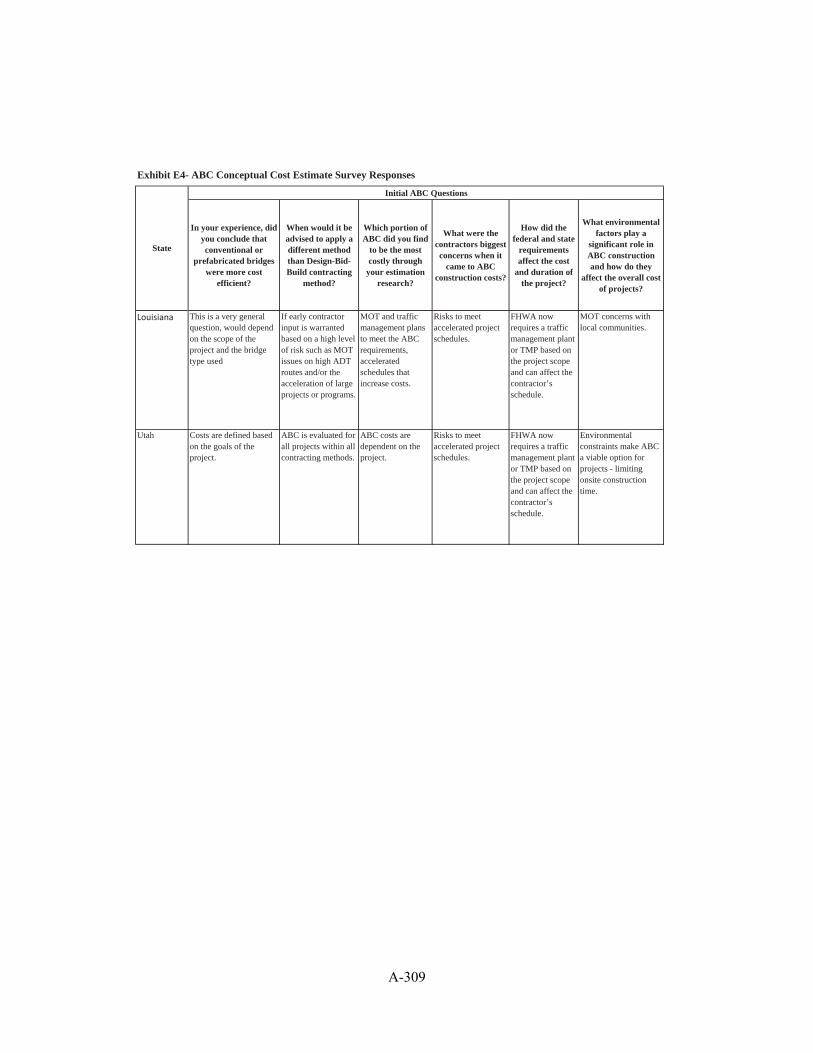
Exhibit E4- ABC Conceptual Cost Estimate Survey Responses
Initial ABC Questions
In your experience, did you conclude that conventional or
prefabricated bridges were more cost
efficient?
When would it be advised to apply a different method than Design-Bid-Build contracting
method?
Which portion of ABC did you find
to be the most costly through
your estimation research?
What were the contractors biggest concerns when it
came to ABC construction costs?
How did the federal and state
requirementsaffect the cost
and duration of the project?
What environmental factors play a
significant role in ABC construction and how do they
affect the overall cost of projects?
Louisiana This is a very general question, would depend on the scope of the project and the bridge type used
If early contractor input is warranted based on a high level of risk such as MOT issues on high ADT routes and/or the acceleration of large projects or programs.
MOT and traffic management plans to meet the ABC requirements, acceleratedschedules that increase costs.
Risks to meet accelerated project schedules.
FHWA now requires a traffic management plant or TMP based on the project scope and can affect the contractor’s schedule.
MOT concerns with local communities.
Utah Costs are defined based on the goals of the project.
ABC is evaluated for all projects within all contracting methods.
ABC costs are dependent on the project.
Risks to meet accelerated project schedules.
FHWA now requires a traffic management plant or TMP based on the project scope and can affect the contractor’s schedule.
Environmental constraints make ABC a viable option for projects - limiting onsite construction time.
State
A-309

Initial ABC Questions
In your experience, did you conclude that conventional or
prefabricated bridges were more cost
efficient?
When would it be advised to apply a different method than Design-Bid-Build contracting
method?
Which portion of ABC did you find
to be the most costly through
your estimation research?
What were the contractors biggest concerns when it
came to ABC construction costs?
How did the federal and state
requirementsaffect the cost
and duration of the project?
What environmental factors play a
significant role in ABC construction and how do they
affect the overall cost of projects?
State
Hawaii If the contractor has adequate time with no restrictions on opening the bridge to traffic, conventionalconstruction techniques may be more cost effective. Prefabrication of girders has been proven to be cost effective because it can eliminate forming and shoring. However, prefabricating bridges and other components of bridges to minimize construction time and inconveniences to the traveling public is not necessarily cost effective. The major benefit is that the bridge can be opened to traffic faster thereby inconveniencing the public less.
In emergencies and other situations where a highway needs to be opened to traffic very quickly as a result of a catastrophic event or complete closure of a highway or bridge for construction, etc.
Not available. Finding qualified precastingfabricators is always a problem in Hawaii. We have only one fabricator that is certified and only for specific products.
No significant effect
Permits and environmental clearances play a major part in any project. In some cases, use of ABC techniques such as prefabrication of girders can eliminating permits required if constructing within a stream by completely spanning over the affected area saving some cost in design and construction.
New Jersey #1
Conventional bridges are more cost efficient, because you have more contractors bidding on the jobs, you do not need large cranes, or special materials for the closure pours.
NJDOT uses ABC construction, A+B Bidding and Incentive/Disincentive provisions only when the anticipated traffic impacts are significant and cannot be staged or detouredpermanently.
Production and Erection of Pre-Cast Structure was most costly on my project.
It was critical for the contractors’ to have the best estimate, be awarded & monitor the job closely, effective planning and timely execution of ABC structural members.
The federal/state government encourages using ABC technique where it is cost-effective and benefits to road users are significant. NJDOT’s priority is minimizing traffic impacts and construction duration at a reasonable additional cost.
Seasonal restrictions to construct ABC bridge must be clearly defined in contract documents and at times will cost a little bit more when the construction window is narrow.
A-310

Initial ABC Questions
In your experience, did you conclude that conventional or
prefabricated bridges were more cost
efficient?
When would it be advised to apply a different method than Design-Bid-Build contracting
method?
Which portion of ABC did you find
to be the most costly through
your estimation research?
What were the contractors biggest concerns when it
came to ABC construction costs?
How did the federal and state
requirementsaffect the cost
and duration of the project?
What environmental factors play a
significant role in ABC construction and how do they
affect the overall cost of projects?
State
New Jersey
#2
On our project, I believe the ABC bridges were very competitive in terms of cost to conventional construction. We replaced three single-span bridges in three separate weekends.Costs for the Maintenance and Protection of Traffic over a long duration were avoided. Traffic impacts to motorists were during a weekend period that only impacted discretionary traffic and not the high volume workday traffic. The design of certain ABC or precast composite structures/bridges can actually be less costly than a conventional bridge because the precast manufacturer completes much of the design.
We used A+B Bidding (Incentive/Disincentive) on the Route 1 Freeway ABC projects because it allowed the Department to obtain bids that considered the construction duration/schedule. On each of the three bridges, the contractor beat the deadline and opened the three bridges ahead of schedule, which was important for the heavily travel and congested Route 1 Corridor.
The cost of the precast structure was the most costly part of the ABC effort on my project.
The only major concern of the contractor on my ABC project was the penalty or disincentive of not meeting the deadline in opening the roadway back up to traffic in time.
On my project, the federal and state requirements were typically the same whether utilizing conventionalconstruction or ABC construction. My team did not see any significant difference.
ABC construction can be a benefit in reducing the duration of impact on environmental factors. More and more of the environmental regulations tend to impact the construction season and the time available for construction. ABC construction can be done in a fraction of the time ofconventionalconstruction. This means ABC construction can be completed, in a narrow environmental window, without the need for additional mobilizations from the contractor. Completion of construction in a short time can also reduce the risk or delay claims when the project is constructed over more than one construction season.
California When considering just structure costs conventional methods tend to be less expensive unless the site is a long distance from the nearest batch plant, in which case the precast alternative can be less expensive. However, one must consider costs of the overall project to properly evaluate the most cost efficient alternative.
Projects that present challenges in the area of constructability, staging, and constrained work windows would benefit from the innovation and practical feedback delivered by the ContractManager/General Contractor (CM/GC) method.
In the case of the 3 main ABC methods (precast, slide-in, and large bridge moves) we have found, based on limited experience in state and through evaluation national data, that large bridge moves are the most expensive, followed by slide-in, then precast.
The California bridge construction industry is built upon cast-in-place concrete bridges.Contractors have invested heavily over the years in training their labor force and purchasing forms and false work for this type of construction.
We do not have information on this topic.
Wetland mitigation plays a large role in ABC construction. Wetlands impacted by conventional construction must be mitigated by up to a 10:1 ratio (for each square foot of wetland impacted, 10 square feet must be developed elsewhere) and then the new wetlands must be monitored for years after the project is complete.
A-311

Initial ABC Questions
In your experience, did you conclude that conventional or
prefabricated bridges were more cost
efficient?
When would it be advised to apply a different method than Design-Bid-Build contracting
method?
Which portion of ABC did you find
to be the most costly through
your estimation research?
What were the contractors biggest concerns when it
came to ABC construction costs?
How did the federal and state
requirementsaffect the cost
and duration of the project?
What environmental factors play a
significant role in ABC construction and how do they
affect the overall cost of projects?
State
Maryland Maryland does not have much cost data comparing the two. Our limited information does conclude that prefabricated elements tend to be more expensive. The decision to use them, however, is based on many other factors such as time and durability. ***(Maryland’s typical ABC project is the use of prestressed slab to replace small rural bridges. The typical cost for this type of bridge is $225 per square foot.
When design time is limited, design-bid –build offers an advantage of being able to be under construction and designing at the same time.
Don’t have enough information to respond to this.
Time constraints is the biggest concern. ABC methods are often used with extremely time constrained projects, which often include large monetary penalties for not meeting deadlines. ABC methods are often new to contractors and they are unsure how to handle the risk in the bidding process.
Some ABC methods / technologies are proprietary so it is difficult to get exactly what you want since sole sourcing is not allowed. This is an area where design / build can be advantageous.
Maryland is often cautious to try new methods of construction and new materials when there is uncertainty of how it will perform long term under environmental influences.
Iowa The direct cost of prefabricated (ABC) bridges tend to be more expensive but they become more cost efficient if you consider the indirect cost (cost incurred by the traveling public).
Tight overall schedule (design and construction) would make Design-Build method more favorable if allowed by state laws.
N/A Very short schedule requires contractors to anticipate high dollar liquidated damages in their bids. Also, having subcontractors (precasters) take significant amount of their work.
Not a factor. Environmental issues can be minimized by ABC methods, so they do not play a significant role. However, this is always on a case by case basis.
A-312

Initial ABC Questions
In your experience, did you conclude that conventional or
prefabricated bridges were more cost
efficient?
When would it be advised to apply a different method than Design-Bid-Build contracting
method?
Which portion of ABC did you find
to be the most costly through
your estimation research?
What were the contractors biggest concerns when it
came to ABC construction costs?
How did the federal and state
requirementsaffect the cost
and duration of the project?
What environmental factors play a
significant role in ABC construction and how do they
affect the overall cost of projects?
State
Florida This depends on many factors. The size of the bridge is a major factor. The larger the bridge the more repetition and thus the most cost efficient it is to use prefabricated elements. It is almost impossible to be cost effective with unique prefabricated elements on small structures. Using standardized prefabricated elements across the state on numerous projects does aid greatly in making prefabricated elements more cost effective on small projects.
In Florida, almost all projects cost more using ABC methods. I believe you will find this is true of projects across many states. The real cost savings is in the reduction in what is called user delay costs. The costs of sitting in traffic and moving slower. This is frequently more costs than he actual construction costs increases for using ABC. ABC is best utilized when there is an overall cost savings approach realized, not just construction dollars.
In Florida, almost all projects cost more using ABC methods. I believe you will find this is true of projects across many states. The real cost savings is in the reduction in what is called user delay costs. The costs of sitting in traffic and moving slower. This is frequently more costs than he actual construction costs increases for using ABC.
RISK. Many ABC projects contain incentive/disincentive clause and they usually bid assuming the incentive will be realized. If something delays the project the risk in loosing the incentive and pay disincentives is a real issue.
This varies on every project and there is no good single answer.
Many times with ABC methods, the environmental exposure is decreased either with more efficient construction methods or shorter periods of disturbance. For large waterborne projects, the cost is usually less than using conventional methods.
A-313

Revised Questions
Based on your experience with ABC,
are prefabricated bridges more costly than conventional
bridges?
Have you ever used another contracting
method besides Design-Bid-Buildfor ABC? If yes,
under what circumstances?
What ABC elements have
been more costly than conventional
bridge construction?
Have any of your contractors had
cost concerns when using ABC?
Did federal and/or state
requirementsaffect the overall
ABCcost/duration of the project? If
yes, how?
What, if any, environmentalfactors/policies
affected your ABC projects? How did
these affect the overall cost?
Michigan Yes. A little, but hard to place hard values on. Probably about 10 more per project.
Yes, CMGC Elements we have done a precast abutment walls, pier columns, pier caps, decked beams. I can not say that any of these was significantly more costly than others.
If the project progress schedule would make cast in place construction feasible, the contractor will value engineer the project to remove PBES.
No No
South Dakota Not a lot of experience with ABC but we would say yes.
No Pre-cast deck units and pre-cast sleeper slabs for us
No No None on our limited projects
Minnesota Yes Yes. CMGC and Design Build. We evaluate the characteristics of each project to determine the contractadministration method.
Full depth deck panels. Precast substructure units, inverted tee superstructures.
Yes, have asked to do the work using conventionalmethods.
No Use of precast products in lieu of cast-in-place concrete over water is generally faster and less likely to cause environmental issues, but is more expensive.
Illinois Our first projects are in plan development so we don't have cost history yet.
No, not yet. No cost data yet. No concerns known yet.
No Not yet
State
A-314

Revised Questions
Based on your experience with ABC,
are prefabricated bridges more costly than conventional
bridges?
Have you ever used another contracting
method besides Design-Bid-Buildfor ABC? If yes,
under what circumstances?
What ABC elements have
been more costly than conventional
bridge construction?
Have any of your contractors had
cost concerns when using ABC?
Did federal and/or state
requirementsaffect the overall
ABCcost/duration of the project? If
yes, how?
What, if any, environmentalfactors/policies
affected your ABC projects? How did
these affect the overall cost?
State
Missouri Yes Yes. We did a single contract design-build project to replace 554 bridges across the state. One of the main goals was to build the replacement bridges quickly.
We haven't identifiedindividualelements. We just see an increase in all the pay items.
We don't have enough experience to answer this one.
No federal requirements. We have had a few isolated incidents where we were willing to pay a higher price for faster bridge construction to limit the number of days of head-to-head traffic on interstate.
N/A
North Dakota We have no direct experience with ABC construction.
N/A N/A N/A N/A N/A
Kansas Yes, our attempt to let an ABC bridge project using Prefabricated Bridge Elements cost more than $1 million more than a conventional bridge.
No. KDOT is prohibited by Kansas law from using Design-Build or CM/GC. (There was on special exception made for a large interchange project in Kansas City to use Design-Build.)
Precast columns; precast pier caps; precast abutment grade beams; precast deck sections.
We attempted one ABC bridge project and let it twice. Both times, the cost of the ABC bridge was more than the cost of the conventional + local detour. The contractors were "concerned" that we did not go ahead and award the bids. We rejected both bids and are in the process of redesigning the bridge to use conventionalconstruction.
The one ABC project was attempted was financed in a conventionalmanner with a mix of sate and federal funds, without any special grants. KDOT chose a schedule based on local concerns and a reasonable traffic closure (30 days) for the ABC methods employed.
No environmental factors weighed on the ABC project we attempted.
A-315

Revised Questions
Based on your experience with ABC,
are prefabricated bridges more costly than conventional
bridges?
Have you ever used another contracting
method besides Design-Bid-Buildfor ABC? If yes,
under what circumstances?
What ABC elements have
been more costly than conventional
bridge construction?
Have any of your contractors had
cost concerns when using ABC?
Did federal and/or state
requirementsaffect the overall
ABCcost/duration of the project? If
yes, how?
What, if any, environmentalfactors/policies
affected your ABC projects? How did
these affect the overall cost?
State
Pennsylvania Based on typical unit bridge construction costs we typically spend about $250/SF but a prefabricated ABC bridge is around $450/sf.
A. Recently completed 581 project in Harrisburg, we bid that superstructure replacement with ABC as a Design Build. This project was recently presented via the FIU WebEx. B. A couple of years ago a contractor submitted a value engineering proposal to change a stage construction bridge to an all precast ABC bridge.
Primarily the precast pieces for full height abutments. These full height abutment pieces are relatively heavy and thus require large cranes. The cost to rent a large crane to set the pieces is a significant cost factor.
Contractor’s has various concerns with ABC projects. The primary issue is the very tight timeframes to complete the project and the risk of liquated damages if the project is not completed per the contract schedule.
One issue is the various rules in determining/calculating the “liquidated damages” if the contract completion date is exceeded.The rules in calculatingliquidated damages are such that for low volume roads the cost for liquidated damages is minimal thus contractors ignore the use of ABC and go conventional by simply including in the contract bid the costs for liquidated damages. Thus, the rules for calculating liquidated damages need to be revised.
Not aware of any environmental issues.
A-316

APPENDIX F
ABC DECISION-MAKING TOOLS
A-317

APPENDIX F - ABC DECISION-MAKING TOOLS
% Possible Points
Weight Category Decision-Making-Item Points Allocated Scoring Guidance
17% Disruptions (on/under
Bridge)
Railroad on Bridge? 8 0 No
4 Yes: Little Traffic
8 Yes: Heavy Traffic
Railroad Under Bridge? 3 0 No
1
Yes: Minor Railroad Track
3
Yes: Major Railroad Track
Over Navigation Channel that needs to remain open? 6 0 No
3
Yes: Minor amount of traffic
6 Yes: Considerable amount of traffic
8% Urgency
Emergency Replacement? 8 0 No
4
Yes: Minor Roadway
8 Yes: Major Roadway
23% User Costs and Delays
ADT and/or ADTT 6 0 No Traffic Impacts
(Combined Construction Year ADT on and under
bridge)
1 < 10,000
2 10,000 to 25,000
3 25,000 to 50,000
4 50,000 to 75,000
A-318

5 75,000 to 100,000
6 100,000 or more
Required Lane Closure/Detours? 6 0 Delay 0-5 minutes
(Length of Delay to Traveling Public)
1 5-10 minutes
2 15-25 minutes
3 25-35 minutes
4 35-45 minutes
5 45-55 minutes
6 55 or more minutes
Are only Short Term Closures Allowable? 5 0
Available alternatives for
staged construction
3
Available alternatives for
staged construction, undesirable
5
No available alternatives
Impact to Economy? 6 0 Little to no impact
(Local Business Access, impact to manufacturing,
etc.)
3 Moderate impact
6 Considerable Impact
14% Construction Time
Impacts Critical Path of the Total Project? 6 0 Little to no impact
3 Moderate impact
6 Considerable Impact
A-319

Restricted Construction Time 8 0 No restrictions
(Environmental schedules, Economic Impact - e.g. local business access,
Holiday schedules, special events, etc.)
3 Minor restrictions
6 Moderate
restrictions
8 Considerable restrictions
5% Environment
Does ABC mitigate a critical environmental
impact or sensitive environmental issue?
5 0 No
2 Minor
3 Several Minor
4 Considerable
5 Several
Considerable
3% Cost
Compare Comprehensive Construction Costs 3 0
25% or higher than conventional
(Compare conventional vs. prefabrication)
1
1% to 25% higher than conventional
2
Equal to conventional
3 Lower than conventional
18% Risk Management
Does ABC Allow Management of a Particular Risk? 6 0-6
Determine if risks can be managed
through ABC that aren't discussed in
other topics
Safety (Worker Concerns) 6 0 TMP type 1
3 TMP type 2
6 TMP type 3-4
A-320

Safety (Traveling Public Concerns) 6 0 TMP type 1
3 TMP type 2
6 TMP type 3-4
12% Other
Economy of Scale 5 0 1 span
(Repetition of components in a bridge or bridges in a
project)
1 2 spans
(Total spans = sum of all spans on all bridges on the
project)
2 3 spans
3 4 spans
4 5 spans
5 6 or more spans
Weather Limitations for Conventional Construction? 2 0 No
1 Moderate
2 Considerable
Use of Typical Standard Details (Complexity) 5 0 No
3 Some
5 All details
Sum of
Points: max. 100 Possible Points
A-321

Decision-Making Item Scoring Guidance Description
Railroad on Bridge?
This is a measure of how railroad traffic on the bridge will be affected by the project. If a major railroad line runs over the bridge that requires minimum closures and a shoo fly (a temporary railroad bridge bypass) cannot be used, provide a high score here. If a railroad line that is rarely used runs over the bridge, consider providing a mid-range or low score here. If there is no railroad on the bridge, assign a value of zero here.
Railroad under Bridge?
This is a measure of how railroad traffic under the bridge will be affected by the project. If a major railroad line runs under the bridge that would disrupt construction progress significantly, provide a high score here. If a railroad track runs under the structure, but it is used rarely enough that it will not disrupt construction progress significantly, provide a low score here. Consider if the railroad traffic is able to be suspended long enough to move a new bridge into place. If there is not a large enough window to move a new bridge into place, SPMT could be eliminated as an alternative for this project. For this case, PBES may be a more applicable alternative. If there is no railroad under the bridge, assign a value of zero here.
Over Navigation Channel that needs to remain open?
This is a measure of how a navigation channel under a bridge will be affected by the project. If a navigation channel is highly traveled and needs to remain open for shipments, provide a high score here. If a navigation channel is rarely traveled and there are not requirements for it to remain open at certain time periods, provide a low score here. If there is no navigation channel under the bridge, assign a value of zero here.
Emergency Replacement?
This is a measure of the urgency of the bridge replacement. A more urgent replacement supports the use of accelerated bridge construction methods, since demolition and construction can be progressing concurrently. Depending on the particular project, accelerated bridge construction methods can also allow multiple components of the bridge to be constructed concurrently. If the bridge replacement is extremely urgent and the bridge can be replaced quicker by using accelerated construction methods, provide a high score here.
A-322
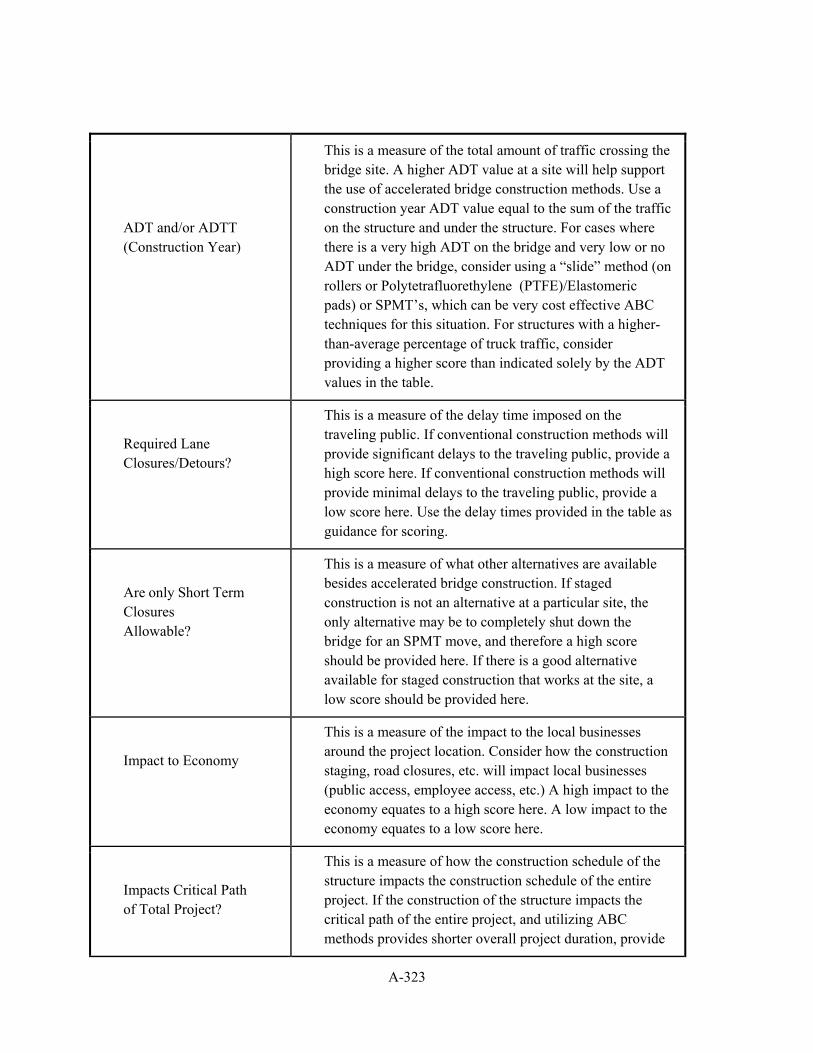
ADT and/or ADTT (Construction Year)
This is a measure of the total amount of traffic crossing the bridge site. A higher ADT value at a site will help support the use of accelerated bridge construction methods. Use a construction year ADT value equal to the sum of the traffic on the structure and under the structure. For cases where there is a very high ADT on the bridge and very low or no ADT under the bridge, consider using a “slide” method (on rollers or Polytetrafluorethylene (PTFE)/Elastomeric pads) or SPMT’s, which can be very cost effective ABC techniques for this situation. For structures with a higher-than-average percentage of truck traffic, consider providing a higher score than indicated solely by the ADT values in the table.
Required Lane Closures/Detours?
This is a measure of the delay time imposed on the traveling public. If conventional construction methods will provide significant delays to the traveling public, provide a high score here. If conventional construction methods will provide minimal delays to the traveling public, provide a low score here. Use the delay times provided in the table as guidance for scoring.
Are only Short Term Closures Allowable?
This is a measure of what other alternatives are available besides accelerated bridge construction. If staged construction is not an alternative at a particular site, the only alternative may be to completely shut down the bridge for an SPMT move, and therefore a high score should be provided here. If there is a good alternative available for staged construction that works at the site, a low score should be provided here.
Impact to Economy
This is a measure of the impact to the local businesses around the project location. Consider how the construction staging, road closures, etc. will impact local businesses (public access, employee access, etc.) A high impact to the economy equates to a high score here. A low impact to the economy equates to a low score here.
Impacts Critical Path of Total Project?
This is a measure of how the construction schedule of the structure impacts the construction schedule of the entire project. If the construction of the structure impacts the critical path of the entire project, and utilizing ABC methods provides shorter overall project duration, provide
A-323

a high score here. If other project factors are more critical for the overall project schedule and utilizing ABC methods will not affect the overall project duration, provide a low score here.
Restricted Construction Time
This is a measure of how the construction schedule is impacted by environmental and community concerns or requirements. Items to consider are local business access windows, holiday schedules and traffic, special event traffic, etc. If there are significant restrictions on construction schedule, provide a high score here. If there are little to no restrictions on the construction schedule, provide a low score here.
Does ABC mitigate a critical environmental impact or sensitive environmental issue?
This is a measure of how using accelerated bridge construction methods can help mitigate impacts to the environment surrounding the project. Since accelerated methods allow a shorter on-site construction time, the impacts to the environment can be reduced. If the reduced on-site construction time provided by accelerated bridge construction methods mitigates a significant or critical environmental concern or issue, provide a high score here. If there are no environmental concerns that can be mitigated with accelerated construction methods, provide a low score here.
Compare Comprehensive Construction Costs
This is a measure of the complete comprehensive cost difference between conventional construction methods versus using an accelerated bridge construction method. Some costs will increase with the use of accelerated construction methods, such as the cost of the SPMT equipment and the learning curve that will be incorporated into using new technologies. However, some costs will decrease with the use of accelerated construction methods, such as the reduced cost for traffic control, equipment rentals, inspector wages, etc. Many of the reduced costs are a direct result of completing the project in less time. Use the cost comparisons in the table as guidance for scoring here.
A-324
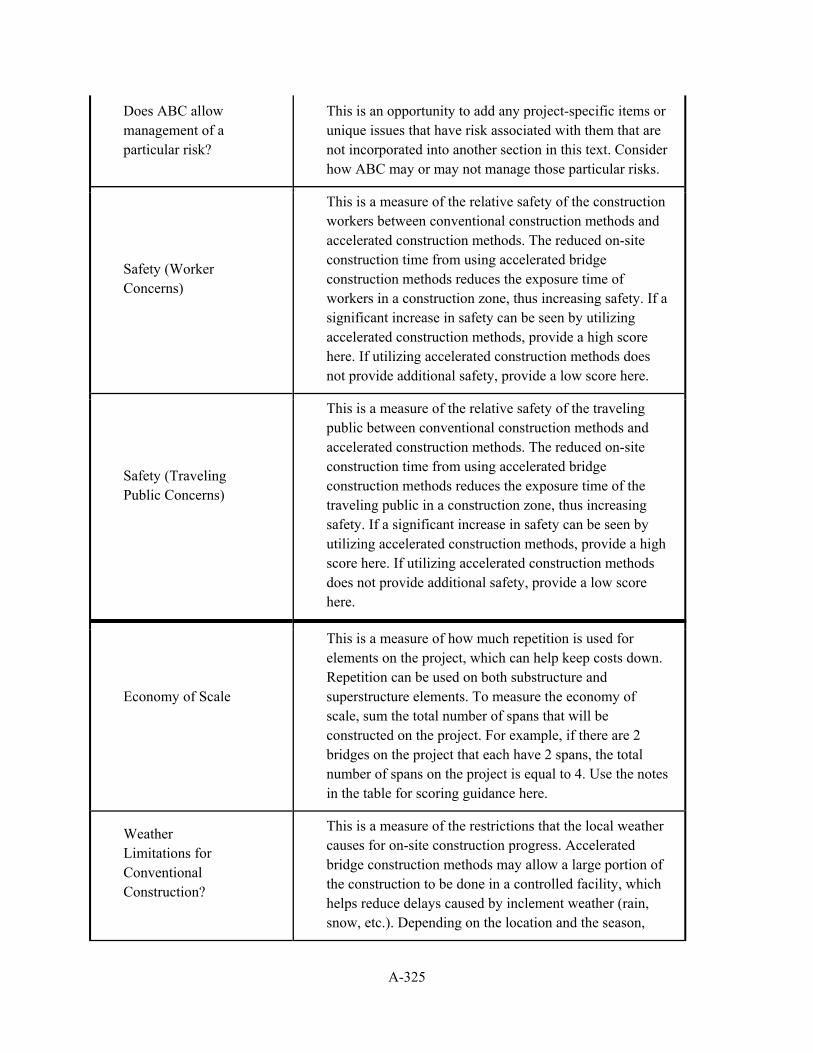
Does ABC allow management of a particular risk?
This is an opportunity to add any project-specific items or unique issues that have risk associated with them that are not incorporated into another section in this text. Consider how ABC may or may not manage those particular risks.
Safety (Worker Concerns)
This is a measure of the relative safety of the construction workers between conventional construction methods and accelerated construction methods. The reduced on-site construction time from using accelerated bridge construction methods reduces the exposure time of workers in a construction zone, thus increasing safety. If a significant increase in safety can be seen by utilizing accelerated construction methods, provide a high score here. If utilizing accelerated construction methods does not provide additional safety, provide a low score here.
Safety (Traveling Public Concerns)
This is a measure of the relative safety of the traveling public between conventional construction methods and accelerated construction methods. The reduced on-site construction time from using accelerated bridge construction methods reduces the exposure time of the traveling public in a construction zone, thus increasing safety. If a significant increase in safety can be seen by utilizing accelerated construction methods, provide a high score here. If utilizing accelerated construction methods does not provide additional safety, provide a low score here.
Economy of Scale
This is a measure of how much repetition is used for elements on the project, which can help keep costs down. Repetition can be used on both substructure and superstructure elements. To measure the economy of scale, sum the total number of spans that will be constructed on the project. For example, if there are 2 bridges on the project that each have 2 spans, the total number of spans on the project is equal to 4. Use the notes in the table for scoring guidance here.
Weather Limitations for Conventional Construction?
This is a measure of the restrictions that the local weather causes for on-site construction progress. Accelerated bridge construction methods may allow a large portion of the construction to be done in a controlled facility, which helps reduce delays caused by inclement weather (rain, snow, etc.). Depending on the location and the season,
A-325
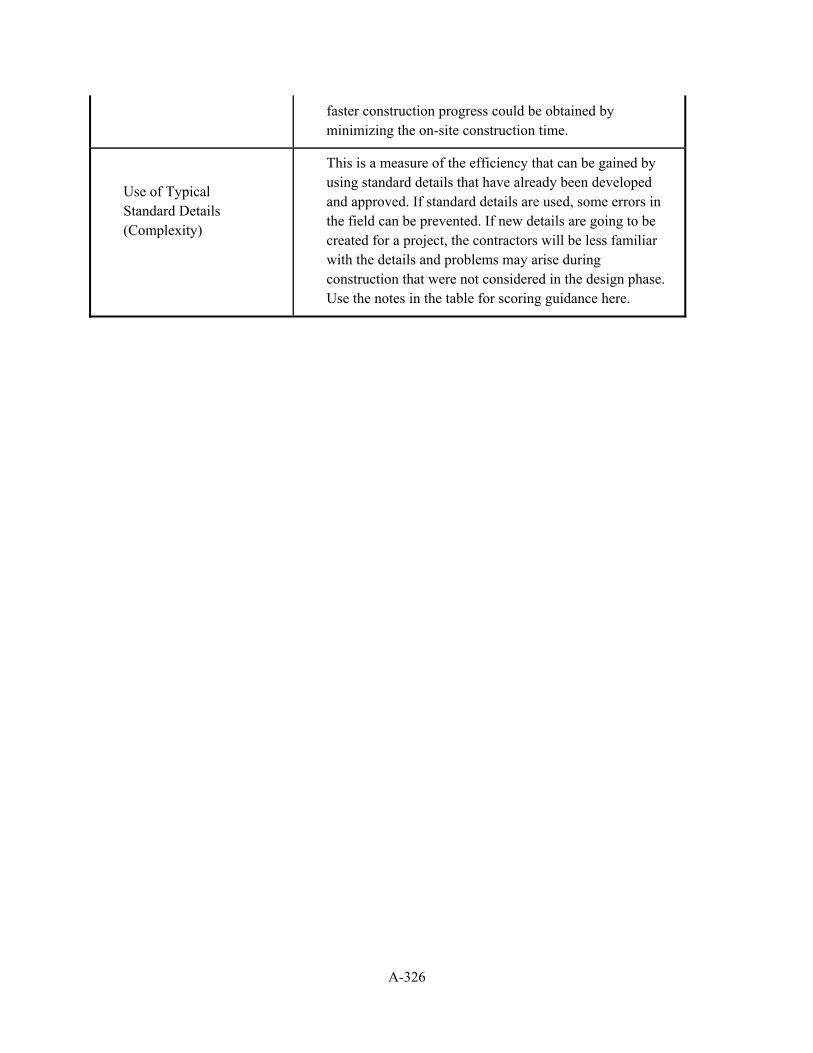
faster construction progress could be obtained by minimizing the on-site construction time.
Use of Typical Standard Details (Complexity)
This is a measure of the efficiency that can be gained by using standard details that have already been developed and approved. If standard details are used, some errors in the field can be prevented. If new details are going to be created for a project, the contractors will be less familiar with the details and problems may arise during construction that were not considered in the design phase. Use the notes in the table for scoring guidance here.
A-326

F1 – Decision Making Flowchart (adapted WisDOT, 2015)
No
No
Yes
Yes
No
Yes
Yes No
Objective to reduce bridge/roadway out‐of‐service time?
Yes
Is there a location to build the bridge off site?
Identify a need or opportunity for ABC
ABC Rating of 50+ points ABC Rating 49 to 21 points ABC Rating of 0 to 20
Faster implementation of bridge with ABC?
Do the overall advantages of ABC negate any additional costs? (Consider schedule, traffic impacts, funding, user costs, etc.)
Do the site location allow for an ABC approach?
Program Initiative
Develop a useful ABC approach for the project
Use conventional construction method
Alternate Contracting
Media Outreach
Yes Any window of time available to close the
bridge to move in a new bridge?
Yes
Objective to Minimize Total Project Construction Window?
No No Are site conditions appropriate for PBES or GRS?
Consider another ABC
Alternative, Conventional
Construction Method, or
Alternate Contracting
Yes
Slide SPMT PBES GRS‐IBS
Yes
No
A-327

APPENDIX G
ABC TOOLKIT TEMPLATE
A-328

APPENDIX G - ABC TOOLKIT TEMPLATE The summary of ABC toolkit components below can be used as a template of the web-based toolkit.
ABC Components Contents Related Chapters from the Final Report
Decision-Making Tool Decision-making matrix
Decision-making flowchart
CHAPTER 3
APPENDIX F
Design Design concepts
Pre-design examples
Design aides
CHAPTER 4
APPENDIX B
APPENDIX H
Construction Construction guidelines
Construction flowcharts
CHAPTER 7
APPENDIX C
Risk Analysis Risk analysis guidelines
Interactive flowcharts
CHAPTER 5
APPENDIX D
Cost Estimates Cost estimates guidelines
Examples of cost estimates
CHAPTER 6
APPENDIX E
A-329

APPENDIX H
DESIGN AIDES Using Mathcad
A-330

APPENDIX H - DESIGN AIDES Using Mathcad An analysis of the superstructure can be performed using structural modeling software or computational aide to calculate the design moments, shears, and reactions. However, the SHRP2 design examples just provided the results from finite element analyses. It is desirable that this toolkit can be used without any additional computational supports from other sources. Therefore, this study provided the Mathcad examples to evaluate the maximum design loadings using qBridge software, a Mathcad program developed by Professor Emeritus, Noyan Turkkan at the University of Montana, Canada. Dr. Turkkan granted a permission to use this software for this project. The Authors gratefully acknowledge his permission and support. H1-Mathcad Examples to calculate the design loadings for concrete decked steel girder examples
1. Design loadings for girders (Design Step 10. Load Results. Case 4)
1) 80ft span - Design Loads-Steel Girder-80ft-MDC4.xmcd - Design Loads-Steel Girder-80ft-MDW4.xmcd - Design Loads-Steel Girder-80ft-MLL4.xmcd - Design Loads-Steel Girder-80ft-MLL4_neg.xmcd
2) 60ft span - Design Loads-Steel Girder-60ft-MDC4.xmcd - Design Loads-Steel Girder-60ft-MDW4.xmcd - Design Loads-Steel Girder-60ft-MLL4.xmcd - Design Loads-Steel Girder-60ft-MLL4_neg.xmcd
3) 40ft span - Design Loads-Steel Girder-40ft-MDC4.xmcd - Design Loads-Steel Girder-40ft-MDW4.xmcd - Design Loads-Steel Girder-40ft-MLL4.xmcd - Design Loads-Steel Girder-40ft-MLL4_neg.xmcd
2. Design loadings for deck (Design Step 21. Load Results) - Design Loads_Deck_MDC.xmcd - Design Loads_Deck_MLL.xmcd
Note: The electronic files of these Mathcad examples are provided through an external hard drive or email.
A-331

H2- AASHTO HL-93 Loading
The AASHTO HL-93 loading is a hypothetical live load model proposed by AASHTO for analysis of high bridges. Reason for proposing this live load model is to prescribe a set of loads such that it produces an extreme load effect approximately same as that produced by the exclusion vehicles. Exclusion vehicles were the vehicles above the legal limit but due to grand fathering provision in the state they were allowed to operate routinely.
It has 3 basic live loads for bridges called HL-93 Loading, where H stands for highway and L stands for Loading, developed in 1993.
1. Design Truck 2. Design Tandem 3. Design Lane
1. Design Truck
It is commonly called as HS-20 44 (where H stands for highway, S for semi-trailer, 20 TON weight of the tractor (1st two axles) and was proposed in 1994).
2. Design Tandem
It consists of two axles weighing 25 kips (110 KN) each spaced at 4 ft (1.2 m).
Figure H1. HS-20 truck and tandem loadings
3. Design Lane
It consists of uniformly distributed load of 0.64 kip/ft (9.3 N/mm) and assumed to occupy 10 ft (3 m) transversely.
Figure H2. Lane loading
A-332

Design loading is the maximum of the three cases:
1. Design Tandem + Design Lane: referred as HL-93M 2. Design Truck + Design Lane: referred as HL-93K 3. 90% of (2 Design Trucks + Design Lane): referred as HL-93S
Figure H3. HL-93 load cases.
A-333

This program is wri en using Mathcad 14.0 M020.This program was developed by Professor Emeritus, Noyan Turkkan atthe University of Montana. He granted a permission to use thisSo ware for this project. The Authors gratefully acknowledge hispermission and support.
qBridge Quick analysis of bridge structures
User defined moving truckMultiple span continuous bridge beams, EI constantMoment and shear (absolute value) envelopesSupport reactionsLane load
USAGE : M
R:= qBridge(T,B)
T : Truck definitionB : Bridge definitionM : Vector (4 x 1) - xcoordinates, Vmax, Mmin and MmaxR : Vector (2 x 1) - Support reactions : Rmin and Rmax
Truck definition : a matrix of nAxles x 2 First column: Axle x-coordinates in ascending order (not axlespacing), beginning with 0 (zero).Second column: axle weights Note: there must be at least two (2) axles.
Bridge definition : a matrix of nSpans x 3First column: span lengthsSecond column: uniform load (lane load) on the corresponding spanThird column: number of divisions on a span. Critical values of shearsand moments are computed on each division point along the beam.
INPUT Notes: Truck will move in one direction only. Reverse the truckgeometry to simulate moving in the other direction. Consistent unitsmust be used (for example : Kips and feets or kN and m).When using two or more spans, lane loads should be applied in acheckerboard fashion in order to obtain maximum (or minimum)moments, shears and reactions. IM (Impact Factor)= 33%Design values= LLDF*Maximum ValuesWhere, LLDF= live load distribution factor, and Maximum Valuescalculated from this MathCAD program
HS20
0
14
28
8 1.33
32 1.33
32 1.33
B
80
80
80
0.64
0.64
0.64
10
10
10
TD0
4
25 1.33
25 1.33
A-334

qBridge routines
Example : 3-span bridge beam with HL-93 loading (HS-20 and Tandem)2 LC shown here. Loa
M1
R1qBridge HS20 B( )
M2
R2qBridge TD B( )
Loading case 1 envelopes
x M1 1 Vmax1 M1 2 Mmin1 M1 3 Mmax1 M1 4
Rmin1 R1 1 Rmax1 R1 2
Loading case 2 envelopes
Vmax2 M2 2 Mmin2 M2 3 Mmax2 M2 4
Rmin2 R2 1 Rmax2 R2 2
n rows x( ) m rows Rmin1( )
i 1 n j 1 m
A-335

Resulting envelopes
Vmaxi max Vmax1i Vmax2i Mmini min Mmin1i Mmin2i Mmaxi max Mmax1i Mmax2i
Rminj min Rmin1j Rmin2j Rmaxj max Rmax1j Rmax2j
xh xn yv1 1.2 round max Mmax( )( ) yv3 1.2 round max Vmax( )( )
yv2 1.2 round min Mmin( )( )
Moment envelopes
0 100 200
1 103
0
1 103
Mmax
Mmin
xShear envelopes (absolute values)
A-336
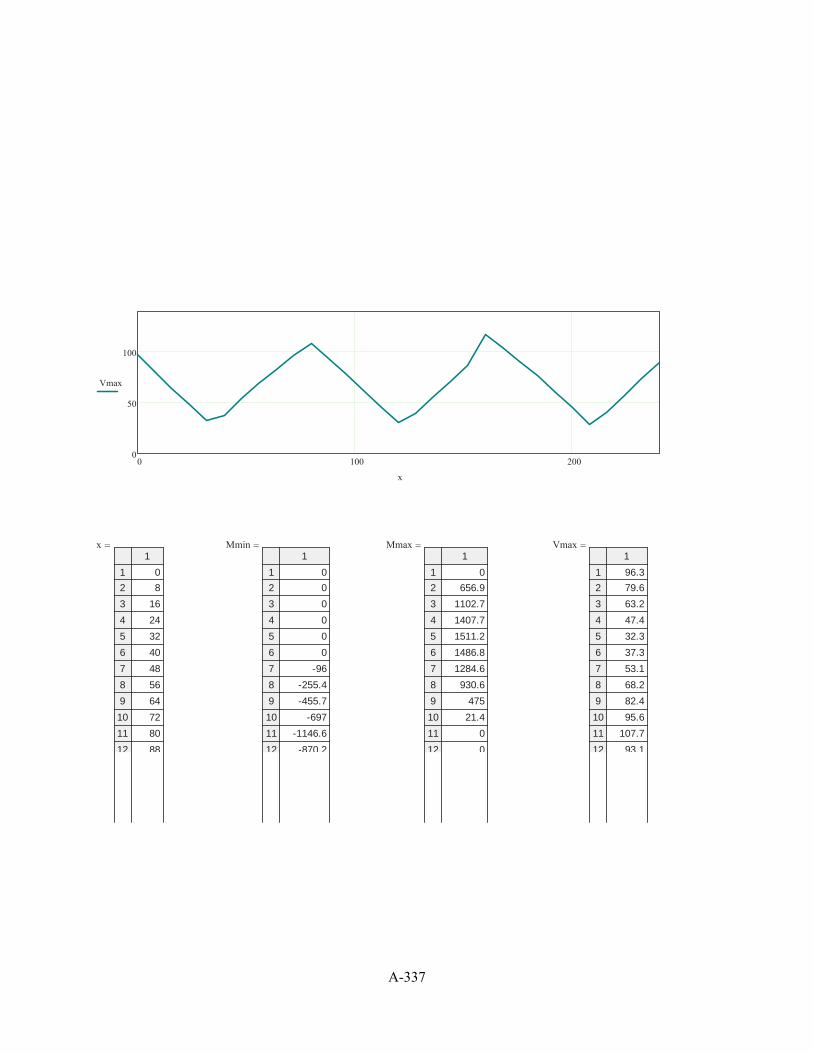
0 100 2000
50
100
Vmax
x
x1
12
3
4
5
6
7
8
9
10
11
12
08
16
24
32
40
48
56
64
72
80
88
Mmin1
12
3
4
5
6
7
8
9
10
11
12
00
0
0
0
0
-96
-255.4
-455.7
-697
-1146.6
-870.2
Mmax1
12
3
4
5
6
7
8
9
10
11
12
0656.9
1102.7
1407.7
1511.2
1486.8
1284.6
930.6
475
21.4
0
0
Vmax1
12
3
4
5
6
7
8
9
10
11
12
96.379.6
63.2
47.4
32.3
37.3
53.1
68.2
82.4
95.6
107.7
93.1
A-337
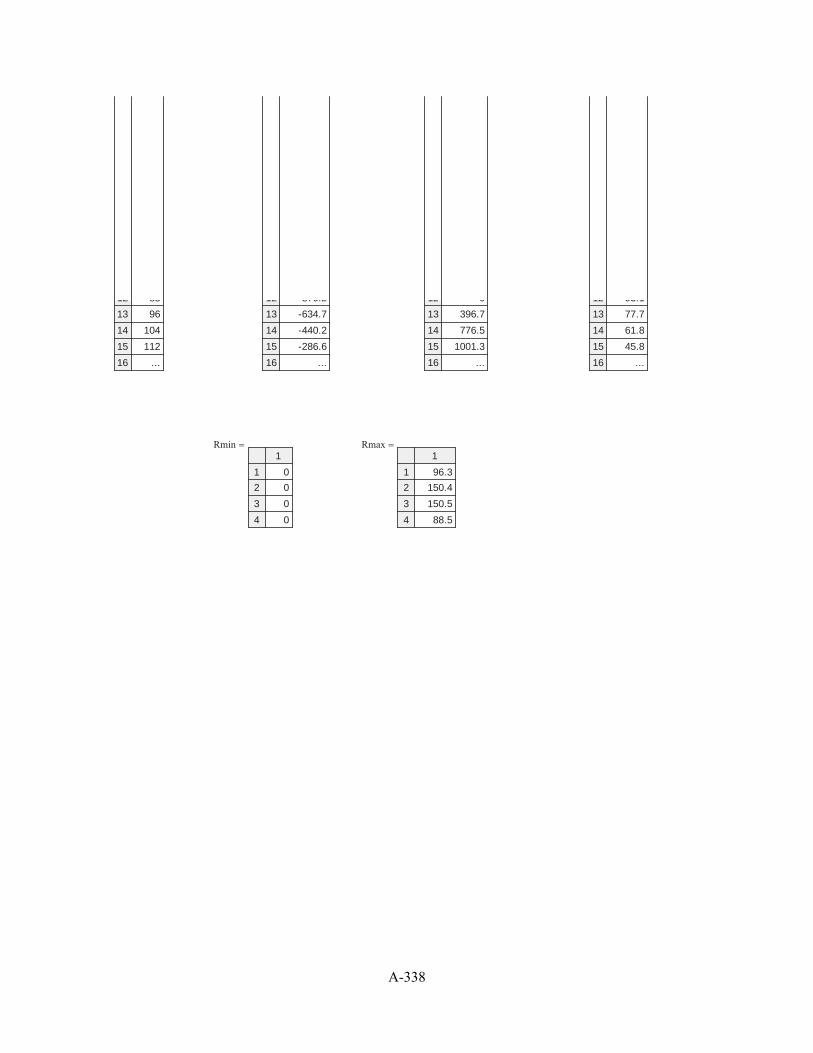
12
13
14
15
16
88
96
104
112
...
12
13
14
15
16
870.2
-634.7
-440.2
-286.6
...
12
13
14
15
16
0
396.7
776.5
1001.3
...
12
13
14
15
16
93.1
77.7
61.8
45.8
...
Rmin1
12
3
4
00
0
0
Rmax1
12
3
4
96.3150.4
150.5
88.5
A-338

This program is wri en using Mathcad 14.0 M020 qBridge Quick analysis of bridge structures
User defined moving truckMultiple span continuous bridge beams, EI constantMoment and shear (absolute value) envelopesSupport reactionsLane load
USAGE : M
R:= qBridge(T,B)
T : Truck definitionB : Bridge definitionM : Vector (4 x 1) - xcoordinates, Vmax, Mmin and MmaxR : Vector (2 x 1) - Support reactions : Rmin and Rmax
Truck definition : a matrix of nAxles x 2 First column: Axle x-coordinates in ascending order (not axlespacing), beginning with 0 (zero).Second column: axle weights Note: there must be at least two (2) axles. B
3
21112
21112
3112
21112
3
21112
3112
21112
21112
3
0
0
0
0
0
0
0
0
0
0
0
4
4
4
4
4
4
4
4
4
4
4
INPUT
HS20
0
6
12
25.54
25.54
0
TD0
4
0
0
A-339

qBridge routines
Example : 2-span bridge beam with HL-93 loading (HS-20 and Tandem)2 LC shown here.
M1
R1qBridge HS20 B( )
M2
R2qBridge TD B( )
Loading case 1 envelopes
x M1 1 Vmax1 M1 2 Mmin1 M1 3 Mmax1 M1 4
Rmin1 R1 1 Rmax1 R1 2
Loading case 2 envelopes
Vmax2 M2 2 Mmin2 M2 3 Mmax2 M2 4
Rmin2 R2 1 Rmax2 R2 2
n rows x( ) m rows Rmin1( )
i 1 n j 1 m
A-340

Resulting envelopes
Vmaxi max Vmax1i Vmax2i Mmini min Mmin1i Mmin2i Mmaxi max Mmax1i Mmax2i
Rminj min Rmin1j Rmin2j Rmaxj max Rmax1j Rmax2j
xh xn yv1 1.2 round max Mmax( )( ) yv3 1.2 round max Vmax( )( )
yv2 1.2 round min Mmin( )( )
Moment envelopes
0 10 20 30
0
10Mmax
Mmin
x
Shear envelopes (absolute values)
A-341

0 10 20 300
10
20
30
Vmax
x
x1
12
3
4
5
6
7
8
9
10
11
12
00.8
1.5
2.3
3
3.7
4.5
5.2
5.9
6.6
7.4
8.1
Mmin1
12
3
4
5
6
7
8
9
10
11
12
0-1.5
-3
-4.5
-7.8
-5.5
-5
-4.4
-6.3
-4.3
-4.5
-4.7
Mmax1
12
3
4
5
6
7
8
9
10
11
12
013.1
15.3
9.2
1.6
9.2
12.9
9.1
2.1
9.7
13.5
9.6
Vmax1
12
3
4
5
6
7
8
9
10
11
12
25.517.5
13.7
20.1
25.5
19.8
12.6
19.4
25.5
20.7
13.5
13.6
A-342

12
13
14
15
16
8.1
8.8
9.6
10.4
...
12
13
14
15
16
4.7
-6.9
-4.3
-4.2
...
12
13
14
15
16
9.6
1.7
9.8
13.9
...
12
13
14
15
16
13.6
25.6
19.8
12.1
...
Rmin1
12
3
4
5
6
7
8
9
10
11
12
-2-3.2
-4.3
-3.4
-3.6
-3.7
-3.8
-3.6
-3.3
-4.3
-3.2
-1.9
Rmax1
12
3
4
5
6
7
8
9
10
11
12
25.525.8
25.5
25.8
25.5
25.5
25.7
25.7
25.5
25.5
25.8
25.5
A-343

Bridge definition : a matrix of nSpans x 3First column: span lengthsSecond column: uniform load (lane load) on the corresponding spanThird column: number of divisions on a span. Critical values of shearsand moments are computed on each division point along the beam.
Notes: Truck will move in one direction only. Reverse thetruck geometry to simulate moving in the other direction.Consistent units must be used (for example : Kips andfeets or kN and m).When using two or more spans, lane loads should beapplied in a checkerboard fashion in order to obtainmaximum (or minimum) moments, shears and reactions.
A-344

APPENDIX I
IMPLEMENTATION PLAN
A-345
APPENDIX I - IMPLEMENTATION PLAN The primary implementation of this toolkit is to share its contents with GDOT, LGs, and other local bridge professionals through the technology transfer activities. The proposed toolkit including currently available ABC-related information websites will be used as educational tools accordingly. Specific technology transfer activities were done as below.
Presentation at the 2015 National ABC Conference, December 7-8, 2015, in Miami, FL
Presentation at the SHRP2 R04 Peer-to-Peer Workshop, November 18, Atlanta, GA In the future, using feedback obtained from GDOT, ABC Conference, and SHRP2 R04 Peer-to-Peer Workshop, the research team can develop specific implementation tasks such as outreach and training, including workshops, webinars, peer exchanges and demonstration projects for local governments in GA.
A-346