Embed Size (px)
DESCRIPTION
Cultural Needs and Habits
Citation preview


This document has been produced with the financial assistance of the European Cultural Foundation. The views expressed herein are those of the Committe for Civic Initiative and can therefore in no way be taken to reflect the official opinion of the European Cultural Foundation.
Cultural Needs,
Habits and Taste of
Citizens of Serbia and Macedonia
Predrag Cvetičanin
Committee for Civic InitiativeNiš, 2007
Translated by:
Mihailo Antović
Cultural Needs, Habits aNd taste of CitizeNs of serbia aNd MaCedoNia
Published by: Committee for Civic Initiative
Reviewers: prof. dr Milena Dragićević-Šešić
prof. dr Dragan Žunić
Design and layout: Ivan Stojić
Graphic design: Zoran Jovanović
Cover photo: Dušan Mitić - Car
Idea for cover design: Oliver Musovik
Copies printed: 500
Printed by: Sven, Niš
Niš, 2007.
5
Cultural Needs, Habits and Taste of Citizens of Serbia and Macedonia
This book is intended for those creating cultural policy in Serbia and Macedonia – at the level of states, regions, and cities, and to those defining artistic and
business policy of cultural institutions, non-governmental organizations and art groups. And, in particular, for those who wish to help improve cooperation between Macedonia and Serbia.
The book is part of the project “Cultural Needs, Habits and Taste of Citizens of Serbia and Macedonia” of the Committee for Civic Initiative from Nis (Serbia), Centre for Contemporary Art from Skopje and Centre for Balkan Cooperation
“Loja” from Tetovo (Macedonia), financially supported by European Cultural Foundation. The core of the project is a survey-based research whose aim was for us to gain insight into the cultural practices of citizens of Serbia and Macedonia. Within the project, we will also familiarize official and independent cultural insti-tutions, non-governmental organizations and art groups in Serbia and Macedonia with the results of this study – to whom this book should be helpful in creating an innovative cultural policy, starting individual and joint projects, and other kinds of cooperation in the domain of culture.
Surveying in the field was carried out in the period October – December 2005. Out of the planned 1,485 subjects, in Serbia 1,364 were surveyed (91.9% of the planned sample), while in Macedonia, out of the planned 990 persons, 896 were surveyed (90.5% of the planned sample). In Serbia, for the implementation of 1,364 surveys we needed 1,650 contacts, while in Macedonia for 896 interviews we needed almost 1,100 contacts. In other words, with this number of refusals to participate, for both countries we may conclude that almost 20% of the population is not represented in the sample.
The surveying was carried out with the help of a standardized questionnaire which had one hundred questions in Serbia and ninety five questions in Macedonia,. In Serbia we used a questionnaire in the Serbian language, while in Macedonia there were two questionnaires: in Macedonian and Albanian (where there was some adaptation of certain questions in the Albanian version).
In both Serbia and Macedonia the questionnaire contained seven question batteries. The first group of questions dealt with standard socio-demographic variables such as gender, year of birth, place of birth, place of residence, nationality, confession, education and occupation. To these questions we added questions on the place of birth, education, and occupation of both subject’s parents and their parents (the subject’s paternal and maternal grandmothers and grandfathers). The second battery of questions aimed to provide insight into the financial condition of the subject’s
6
Cultural Needs, Habits aNd taste of CitizeNs of serbia aNd MaCedoNia
family and their consumer habits. The third question group was used with the aim to give us answers on the subjects’ worldview, i.e. their value preferences other than aesthetic (in moral, religious, and political spheres), so that we could determine whether there is some kind of homology within subjects’ aesthetic choices and other value choices (as one would expect). The second part of the questionnaire in this research was dedicated to dependent variables: cultural needs and cultural habits of citizens of Serbia and Macedonia, their aesthetic preferences (tastes), and cultural offer in their places of residence, i.e. their assessment of this offer.
Through these seven question batteries, and also with the help of the data from the supplementary leaflet, we obtained abundance of data on what, in the domain of culture, subjects from our sample and (with some statistical error in transfer-ring the findings from the sample to the population) what citizens of Serbia and Macedonia like, what they do in the realm of culture, what they know about culture, how much they spend on culture, and what cultural products and equipment they have (together, this corresponds to their cultural style). To this we should add the variety of the so-called socio-demographic data on subjects and their ancestors, which allow us not only to identify the position of subjects in the social space today and their (and their personal social trajectories), but also to identify their family professional, educational, and urban trajectories down three generations. Out of such abundance of information, in this study we have analyzed only those data we believe can be very useful to those creating cultural policy – on the level of states (Macedonia and Serbia), cities and municipalities, cultural institutions, non-governmental organizations, formal and informal art groups.
For that reason this study remains largely descriptive. In other words, it describes cultural practices (cultural needs, cultural habits, tastes and cultural styles) of citizens of Macedonia and Serbia and provides their distribution among gender, age, territorial, educational, and occupational groups.
The book first offers data on favourite ways of spending leisure time among citizens of Serbia and Macedonia, importance of cultural activities during such time, and on how subjects (in the sample), or citizens (in the population) may be classified according to kinds of favourite free time activities. There follows in-formation on what kind of cultural habits citizens of Macedonia and Serbia have, i.e. how they actually behave in the domain of cultural reception (reading books, listening to music, going to concerts, theatre, cinemas, galleries, museums) and in the domain of cultural production (whether they practice an art - as amateurs or professionals - if yes which ones, and whether they have a hobby). All these data allow us to compare cultural needs and habits of subjects and differentiate between four groups (active audience, passive audience, forced audience, and non-audience) within audiences for theatre, concerts, fine arts, cinemas, and literature. This also enables us to identify the creative and the non-creative group in the domain
7
iNtroduCtioN
of cultural production. Further, we are thus given opportunity to compare these cultural groups with socio-demographic groups, i.e. to observe their distribution among the sexes, the young, middle-aged and older generations, various educa-tion groups, and various occupations. Finally, we may this way see the territorial distribution of these groups in Serbia and Macedonia.
In the research, we also tested the validity of the typology of taste proposing six taste types: four “pure” tastes (folklore taste, urban taste, conventional taste, and elite taste) and two types of omnivores (elite omnivores and rurban omnivores), first introduced in our research “Cultural Needs, Habits, and Taste of Citizens of Serbia” (OGI/Pro Helvetia, 2002). We also constructed and for the first time introduced the synthetic category of cultural style unifying the dimensions of cultural needs, cultural habits, taste and possession of culturally relevant goods and equipment. This category points to the role and importance of cultural resources and cultural practices in the lifestyle of our subjects, or, in other words, the position of aesthetic culture (culture in the narrower sense) in their way of life (culture in the broader, anthropological sense).
Apart from providing insight into the cultural practices of citizens of Macedonia and Serbia and opportunity for observing their mutual similarities and differences, the research also allows us to compare cultural activities of citizens of Macedonia and Serbia with activities of citizens of twenty eight European countries. In fact, we incorporated in the survey a large number of questions from the research ”Eu-ropeans’ Participation in Cultural Activities“ conducted by EUROSTAT in April 2002 in then fifteen EU member states, and also from the research ”New Europeans and Culture“, carried out in March-April 2003 in (then) ten EU member candidate countries, and also in Bulgaria, Romania, and Turkey1.
Finally, in the last chapter, in spite of the fact this book is primarily practical in its purpose, we were not able to avoid a theoretical discussion of issues – why cultural needs, cultural habits, tastes, and cultural styles of citizens of Serbia and Macedonia are the way they are, why their social distribution is the way it is – and the question of function that cultural practices play in the two societies.
Sample Data
Both samples were made as stratified, four-stage, random samples. Strata were determined based on territorial distribution of the population. Within each stratum, the population was divided into segments of approximately 1% of population of
1 Like ours, both research projects were carried out on nationally proportional samples averag-ing 1,000 subjects per country. Thus, in the 2002 survey 16,162 people were surveyed, and in the 2003 research 12,124 subjects were interviewed.
8
Cultural Needs, Habits aNd taste of CitizeNs of serbia aNd MaCedoNia
legal age (60,000 in Serbia, and 20,000 in Macedonia). In this way, approximately 100 segments were ascribed to each population. In the second phase, within each segment we defined random paths where we randomly defined the starting point and the direction of movement. This way we selected the group of 100 households, totalling a bit over 300 citizens, from which subjects would be selected. In the third stage we chose flats (households) for the surveying, and in the final, fourth phase, we chose one person from the household for the actual surveying. For the selec-tion of segments and households we used randomly generated numbers from the on-line random number generator available on www.random.org. Starting points and subjects in the households were selected with the help of Kisch tables.
The population that we studied, from which the sample was taken, represents the population of legal age from the Republic of Serbia (without Kosovo) and the Republic of Macedonia. Population data were taken over from official statistical publications: “The Census of Population, Households, and Flats 2002. First Results of the Census by Municipalities and Settlements of the Republic of Serbia”, (Bel-grade, 2003, Federal Statistics Bureau and Serbian National Statistics Bureau), and the “Census of Population, Households, and Flats of the Republic of Macedonia 2002 – Volume XIII” (Skopje, 2005, State Statistics Bureau “Dame Gruev”). In both cases persons from the sample are majors, permanently residing in Serbia or Macedonia, who were during the research period available and able to provide answers to survey questions. The sample is not representative of persons who were, at the time of the research or three days after it, located outside their permanent place of residence, persons who were, at the time, located in closed institutions (military barracks, prisons, hospitals), and persons unable to communicate for any reason. Likewise, the sample is not representative of the population of settlements with less than 500 residents, if they are located more than 30km from a regional centre. With regard to the total population, the sample frame is lower for less than half a percent of the total population.
As for strata, there were six for the Serbian population: 1. Belgrade, 2. Vojvo-dina, 3. Posavina, Šumadija and Pomoravlje, 4. Podunavlje and Timočka krajina, 5. Southwest Serbia, and 6. Southeast Serbia. Within each stratum, we specifi-cally sampled urban and non-urban population, based on their proportional ratio in the total population. The total sample in Serbia contained 1,485 subjects, out of whom village population accounted for 43.7% of the sample in central Serbia, 43.3% in Vojvodina, and 18.6% in Belgrade area. In Macedonia, the population was classified into five strata: 1. Skopje and its vicinity, 2. Northeast (the area of Kumanovo), 3. Northwest (Tetovo, Gostivar, Debar), 4. Southwest (Prilep, Bitola, Ohrid), and 5. Southeast (the Vardar valley south of Skopje, the vicinity of Štip and Strumica). The Macedonian sample contained 990 subjects, out of whom 12.4%
9
iNtroduCtioN
included village population from Skopje area, and 36.1% village population from the rest of the country2.
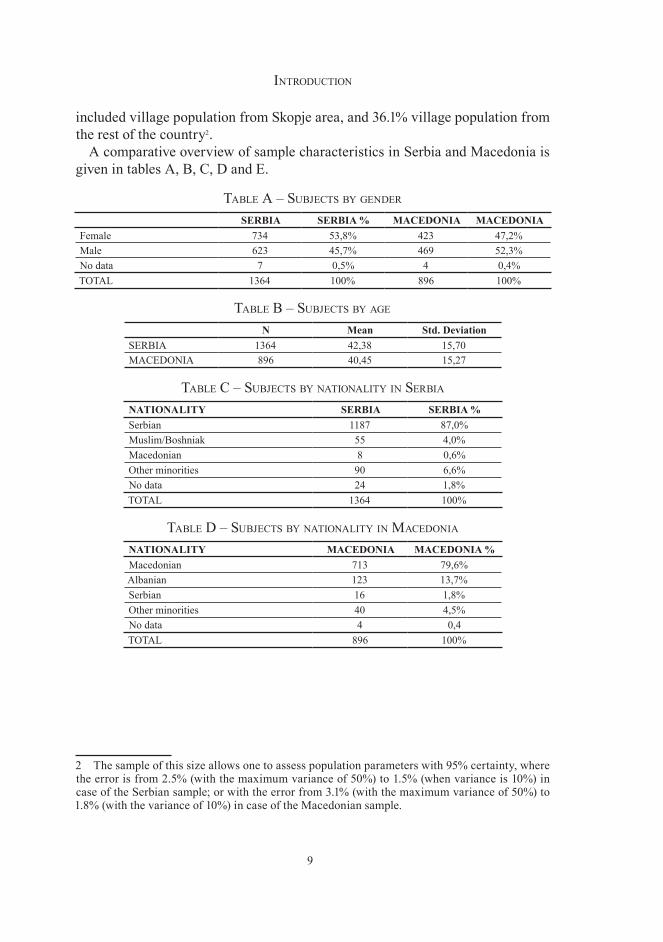
A comparative overview of sample characteristics in Serbia and Macedonia is given in tables A, B, C, D and E.
table a – subjeCts by geNder SERBIA SERBIA % MACEDONIA MACEDONIA
Female 734 53,8% 423 47,2%Male 623 45,7% 469 52,3%No data 7 0,5% 4 0,4%TOTAL 1364 100% 896 100%
table b – subjeCts by age N Mean Std. Deviation
SERBIA 1364 42,38 15,70MACEDONIA 896 40,45 15,27
table C – subjeCts by NatioNality iN serbia NATIONALITY SERBIA SERBIA %Serbian 1187 87,0%Muslim/Boshniak 55 4,0%Macedonian 8 0,6%Other minorities 90 6,6%No data 24 1,8%TOTAL 1364 100%
table d – subjeCts by NatioNality iN MaCedoNia NATIONALITY MACEDONIA MACEDONIA %Macedonian 713 79,6%Albanian 123 13,7%Serbian 16 1,8%Other minorities 40 4,5%No data 4 0,4TOTAL 896 100%
2 The sample of this size allows one to assess population parameters with 95% certainty, where the error is from 2.5% (with the maximum variance of 50%) to 1.5% (when variance is 10%) in case of the Serbian sample; or with the error from 3.1% (with the maximum variance of 50%) to 1.8% (with the variance of 10%) in case of the Macedonian sample.
10
Cultural Needs, Habits aNd taste of CitizeNs of serbia aNd MaCedoNia
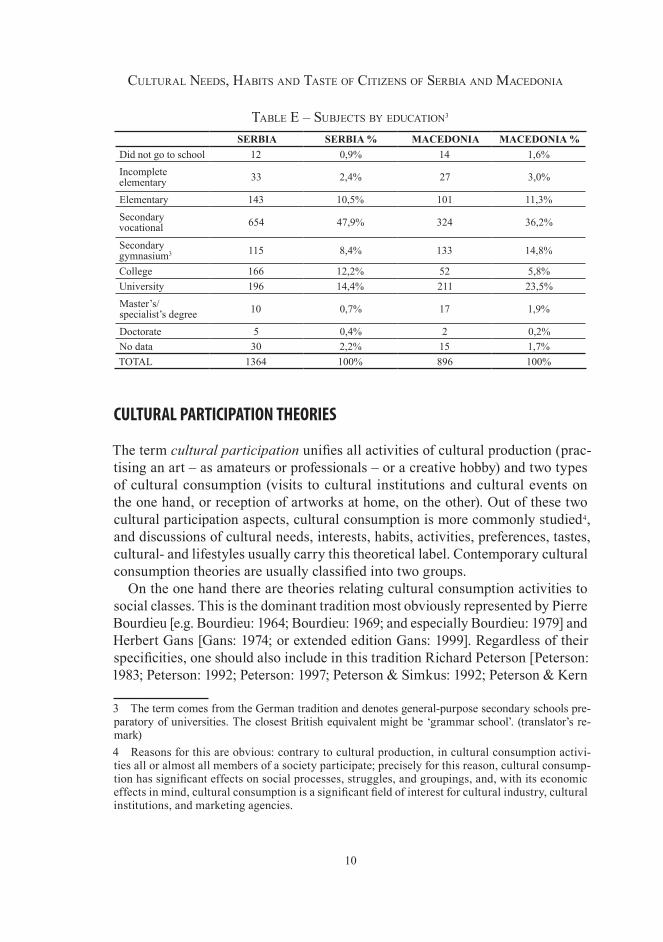
table e – subjeCts by eduCatioN� SERBIA SERBIA % MACEDONIA MACEDONIA %
Did not go to school 12 0,9% 14 1,6%Incomplete elementary 33 2,4% 27 3,0%
Elementary 143 10,5% 101 11,3%Secondary vocational 654 47,9% 324 36,2%
Secondary gymnasium3 115 8,4% 133 14,8%
College 166 12,2% 52 5,8%University 196 14,4% 211 23,5%Master’s/specialist’s degree 10 0,7% 17 1,9%
Doctorate 5 0,4% 2 0,2%No data 30 2,2% 15 1,7%TOTAL 1364 100% 896 100%
CULTURAL PARTICIPATION THEORIES
The term cultural participation unifies all activities of cultural production (prac-tising an art – as amateurs or professionals – or a creative hobby) and two types of cultural consumption (visits to cultural institutions and cultural events on the one hand, or reception of artworks at home, on the other). Out of these two cultural participation aspects, cultural consumption is more commonly studied4, and discussions of cultural needs, interests, habits, activities, preferences, tastes, cultural- and lifestyles usually carry this theoretical label. Contemporary cultural consumption theories are usually classified into two groups.
On the one hand there are theories relating cultural consumption activities to social classes. This is the dominant tradition most obviously represented by Pierre Bourdieu [e.g. Bourdieu: 1964; Bourdieu: 1969; and especially Bourdieu: 1979] and Herbert Gans [Gans: 1974; or extended edition Gans: 1999]. Regardless of their specificities, one should also include in this tradition Richard Peterson [Peterson: 1983; Peterson: 1992; Peterson: 1997; Peterson & Simkus: 1992; Peterson & Kern
3 The term comes from the German tradition and denotes general-purpose secondary schools pre-paratory of universities. The closest British equivalent might be ‘grammar school’. (translator’s re-mark)4 Reasons for this are obvious: contrary to cultural production, in cultural consumption activi-ties all or almost all members of a society participate; precisely for this reason, cultural consump-tion has significant effects on social processes, struggles, and groupings, and, with its economic effects in mind, cultural consumption is a significant field of interest for cultural industry, cultural institutions, and marketing agencies.
11
iNtroduCtioN
1996] and Paul DiMaggio [DiMaggio: 1987; DiMaggio & Peterson: 1975; DiMag-gio & Useim: 1978; DiMaggio & Mohr: 1985].
On the other hand, one finds several groups of theories claiming that the link be-tween cultural consumption and social classes loses its importance in post-industrial societies. One of these, most often defined as the conception of the “new middle class” assumes that in modern post-industrial societies most citizens have similar standard of living, where differences among the lifestyles of different classes are small. On such views, reduced differences in lifestyles and expanded production of goods have made leisure and consumption activities very significant in everyday life. In their opinion, social grouping in post-industrial societies no longer stems from the struggle over distribution of material goods, but rather from different cultural styles which cross the boundaries of classes and occupations. In the conditions of advanced welfare, consumption styles, rather than professional occupations, are becoming new social markers [e.g. Saunders: 1986; Featherstone: 1991; Bonner & du Gay: 1992; Wilson: 1980; Barbalet: 1986; Neveu: 1990; Pakulski & Waters: 1996].
The second group of theories within this approach, known as the “new identity” conception, starts from the idea that increased complexity of modern societies makes identities ever more flexible, where influence of class membership on lifestyles is just one of many factors (the same way culture is becoming only one means to create social boundaries). The theory thus claims that communities are formed on the grounds of ethnic, gender, religious, national, and territorial identi-ties [Kellner: 1992; Castells: 1996; Maffesoli: 1993; Maffesoli: 1996]. Moreover, according to this conception, class subcultures are becoming so divided that one may find a more credible link between race, ethnicity, and territorial membership and culture, than one can find between culture and classes [Hall: 1992].
According to the third group of theories from this domain “the welfare state” conceptions, the welfare state may influence cultural consumption in two ways. One approach believes that mechanisms of the welfare state strengthen the link between cultural consumption and class membership, because by equalizing the financial consumption of members the state forces the elite groups to find a source for their own distinction in cultural activities [Sobel: 1983]. The second approach vouches for the position that the welfare state and its activities allow more individual freedom and weaken the link between economic classes and cultural consump-tion, so that the welfare state is the fundamental promoter of equality and class decomposition in contemporary societies [Warde: 1994].
It is a fact that Serbian and Macedonian societies are not post-industrial and post-modern5, but that in consequence to social traumas caused by the break-up of
5 This of course does not deny that in both societies there are post-modern phenomena, or post-modern lifestyles. However, they are an exotic exception to the rule. Precisely this incredible mix-ture of pre-modern, modern, and post-modern phenomena makes these societies immeasurably interesting for sociological analysis.
12
Cultural Needs, Habits aNd taste of CitizeNs of serbia aNd MaCedoNia
the former Yugoslavia, they largely returned to the pre-industrial and pre-modern condition; that increased importance of ethnic, religious, and sexual identities among the population of Macedonia and Serbia is not a consequence of new flex-ibility of identities, but rather a consequence of their attempt to become rooted in traditional, fixed collective identities; that the welfare state in the true sense of the term cannot be said to exist. Therefore, the second group of theories proposed above is, in our view, inappropriate in the local conditions. In addition, our decision to organize this research so that it could test the so-called “strong” sociological variables has been influenced by the results of our research of cultural needs, hab-its, and taste of citizens of Serbia of 2002. To the total surprise of the researchers, these results suggested very strong influence of respondents’ social background, formal education, and occupation on their cultural needs, habits, and taste. The surprise did not come from any theoretical incongruity – to the contrary, the fact cultural practices are conditioned by class affiliation has been well documented in numerous studies of the last quarter of the century, from France, over Italy, Germany, the Netherlands, Sweden, Czechoslovakia, Hungary, to Israel and the United States. The shock rather came from our assumption that, in the conditions present in Serbia in the last fifteen years – the combination of mass unemployment, black market, and total degradation of the educational system – these factors could not be very significant. It turned out, however, that effects of explicit education through the educational system and also implicit education, in which existential conditions (class, gender, age, territory) were imprinted into people – were much stronger and more stable than we thought.
SOCIAL DISPOSITION OF CULTURAL PRACTICES
Obviously, in the book of this size and intention we have no room (nor need) to give a detailed presentation of any complex cultural participation theory. Instead, in the beginning of this chapter we will attempt to sketch the principal positions of the studies “Distinction: a Social Critique of the Judgment of Taste” by Pierre Bourdieu6, “Popular Culture and High Culture: an Analysis and Evaluation of Taste” by Herbert Gans7, and a series of texts by Richard Peterson that served as the main inspiration in defining our research. As it will become clear upon reading the book, hardly any of their positions and findings have been fully taken over. However, we hope that deviations and specificities that we tried to apply in our study of the cultural practices of Serbian and Macedonian population will be 6 Pierre Bourdieu: “La distinction: critique sociale du jugement“, Les Éditions de Minuit, Paris, 19797 Herbert J. Gans: “Popular Culture and High Culture: An Analysis and Evaluation of Taste, Basic Books, New York 1974, extended edition, 1999
13
iNtroduCtioN
intelligible as compared with these very familiar positions from cultural participa-tion theory. Our hope remains that these ultra-short overviews will somehow be understandable to laypersons, and still not too trivial to experts8.
Distinction: a Social Critique of the Judgment of Taste
Bourdieu’s book “Distinction: a Social Critique of the Judgment of Taste” is clearly the central study in the field, against which both similar and opposing theoretical viewpoints are defined. Since its appearance in 1979 (and in particular since its English translation became available in 19849) the theory formulated within it and empirical findings have generated a myriad of eulogies and critiques, and, more importantly, empirical tests round the world – from France to Sweden, Holland to Israel, the USA to China. In Bourdieu’s rich and complex sociological opus, where sociological, philosophical, and ethnographic findings intertwine, this study, along with his “Reproduction: in Education, Society and Culture”10 assumes the central point and represents a fundamental re-formulation of Bourdieu’s principal sociological position, rather than just a study of cultural consumption. In the book, Bourdieu sets before him two “immodest” tasks: an attempt to give scientific answers to questions posed in Kant’s “Critique of Judgment”, where in the struc-ture of social classes he finds the basis of a system of classification structuring the perception of the social world and defining objects of aesthetic pleasure and, second, to reconceptualize Weber’s social stratification model – i.e. “reconsiders the relationship between class and status (Stand)“.
One may claim that the central issue in Bourdieu’s work is re-integration of economic and cultural dimensions of society, i.e. introduction of the cultural dimen-sion into sociological study of stratification and classes. In his work “Distinction: a Social Critique of the Judgement of Taste”, following Weber’s multidimensional view of society characterized by mutual cross-sections and conflicts among classes, status groups and parties, Bourdieu develops a theory on how culture and cultural consumption contribute to the reproduction of the class system in modern societies. Contrary to Weber, who does not presuppose a universal model of relationship be-tween class and status, Bourdieu attempts to show that between economic positions (class) and lifestyles (status group) there is an invariant relationship: classes always
8 Those who would rather not delve in any theories, i.e. reasons why we used specific solutions, may right away skip this part and move to the results section. 9 Pierre Bourdieu “Distinction: A Social Critique of the Judgment of Taste”, Routledge and Kegan Paul, London 198410 Pierre Bourdieu, J-C. Passeron “La reproduction: Eléments pour une théorie du système d’enseignement“, Ed. de Minuit, Paris, 1970, English version “Reproduction: in Education, Soci-ety and Culture”, Sage, London, 1990.
14
Cultural Needs, Habits aNd taste of CitizeNs of serbia aNd MaCedoNia
appear as status groups whose culturally stratified tastes and goods legitimize the system of economic domination, presenting it in an unrecognizable form.
In his view, interest-oriented behaviour cannot be reserved only for the economic sphere. Rather, it is present in all other domains, including those of culture. People use their resources (their capital11) and try to maximize their profits, not only in the realm of economy, but also in the domain of culture. And in the domain of culture resources are symbolic abilities, tastes and goods (cultural capital12) which help one achieve symbolic profit (social reputation or prestige). Such use of capital in order to get profit is in the cultural domain presented as a non-interest-based search for universally accepted symbolic goods, and those using their inherited cultural capital are represented as individuals different from ordinary folk not due to their accidentally acquired wealth, but due to their inborn superiority of taste and cultural abilities, which legitimizes their domination13.
Bourdieu thinks that all cultures are equally arbitrary, and that the model of pure aesthetic judgment of taste, as defined by Kant in the “Critique of Judgment” is the key element in the (arbitrary) dominant culture of western societies14. Bourdieu 11 According to Bourdieu, one cannot understand the structure and functioning of a society unless one introduces the concept of the capital in all its forms, i.e. not only in the form used in the economic science. Economic interest is but one of many – there are as many interests as there are values to be maximized. In this author’s words, capital assumes three basic forms: economic capital, directly convertible into money and prone to be institutionalized in the form of owner-ship rights; cultural capital, which under certain conditions can convert into economic capital and become institutionalized in the form of educational qualifications; and social capital, which accounts for the system of social connections that can, under certain conditions, be converted into economic capital and institutionalized in the forms of a title of nobility. As can be seen, this economic metaphor of the functioning of a society entails accumulation of all capital types and conversion and reconversion of one type into others. 12 Cultural capital occurs in three forms: the embodied state, i.e. in the form of dispositions of the body and mind; in objectivized state – in the form of cultural goods (paintings, books, instru-ments...) and in the institutionalized state, in the form of academic qualifications.13 The position on taste and cultural abilities being inborn, thus legitimizing the system of domination by presenting it in an unrecognizable form – as a consequence of personal talent – is what Bourdieu calls “charismatic ideology”. With this idea in mind, he derives the concept that cultural needs and preferences are a result of learning. Communication with art is, on its first level, always an act of decoding, entailing that one knows the code. Those who lack this knowledge feel lost in the chaos of sounds and rhythms, colours and lines. In Bourdieu’s words, such an intellec-tualist conception seemingly contradicts the experience of art lovers, for in their case mastery of the codes needed for enjoying art has been gained unconsciously, in contact with works of art, in their earliest memory, in the circle of the family.14 According to Bourdieu, social order and social norms are re-produced through a process in which the main role is played by indirect cultural mechanisms, rather than direct social control based on force. This process of imposition of symbolic systems and meaning (i.e. culture) on groups and classes in the way they experience as legitimate is what Bourdieu calls “symbolic violence”. The fact that this process is perceived as legitimate smears the power structure lying be-hind its success. At the same time, a culture so adopted contributes to the systematic reproduction of such a power structure. Symbolic violence is mainly exercised through “pedagogical action”. Culture is acquired through three types of education: education in the family, diffuse education
15
iNtroduCtioN
claims that the pure aesthetic judgment of taste, whose basic trait is disinterest, is not, as Kant thought, based on apriori principles and universal human traits, but rather on the way of life of social groups spared of any economic trouble. Attitude to works of art and the world of the aesthetic in general [aesthetic disposition], characterized by the ability to sublimate primary needs and impulses [disinterest], is but one aspect of their total relation with reality (possible due to safe distance from any daily struggle for survival), marked by a stylization of life, supremacy of form over function, domination of manners over content. Likewise, popular, vulgar taste, based on the continuity of art and life, which presupposes submission of form to function, is but one aspect of the relation to reality of those groups which cannot keep economic necessities at bay. Their aesthetic choices are always based on the reduction of art to the standpoint of life – the satisfaction of the senses and ethical judgements. They are, therefore, a complete opposite to Kantian aesthetics.
Bourdieu differs among three zones of taste, approximately corresponding to educational levels and social classes: 1) the legitimate taste, i.e. the taste of legiti-mate works of art – in real aesthetes combined with their inclination toward top works in those arts that are still in the process of legitimation, such as film, jazz, or popular music – which increases along with the educational level, and is strongest in those fractions of the dominant class richest in educational capital; 2) the average, ‘middle-brow’ taste, which prefers lesser important works of legitimate arts and best works of popular arts, more typical of the middle class than of labourers; and 3) popular taste, whose representatives tend to favour those works of legitimate arts that have lost their prestige in the popularization process, and those works of popular art that have no artistic pretensions – this type of taste is most prevalent among workers and is inversely proportional to educational capital.
If aesthetic judgments are but one aspect of the total relation of social groups to reality, then, in Bourdieu’s view, the borderline between the aesthetic domain (culture in the narrower sense) and way of life (culture in the anthropological sense) is in fact shown to be arbitrary. The first step in a scientific study of taste and cultural consumption is therefore to break the barriers which make legitimate culture a separate universe and to reintegrate aesthetic consumption into the world of ordinary consumption, so that one could define the meaningful relations which unite – into lifestyles – the seemingly incommensurable choices “such as prefer-ences in music and food, painting and sport, literature and hairstyle”.
acquired through contacts with other members of society, and institutional education, gained in the education system. Pedagogical action, perceived as legitimate and neutral, actually protects the interests of dominant groups and tends to reproduce the unequal distribution of cultural capital among the classes, thus reproducing social structure. Culture transferred by means of “symbolic violence” is arbitrary as any other culture, by both its contents and the way it is acquired. It is made dominant by the factors of power lying behind it.
16
Cultural Needs, Habits aNd taste of CitizeNs of serbia aNd MaCedoNia
The instance acting as an intermediary between objective existential conditions and lifestyles is a system of relatively durable dispositions that Bourdieu calls the habitus. Habitus, along with the concepts of field and capital, is one of the key terms in his theory of practice. It is considered to be one of the more successful attempts of overcoming the conflict between subjectivism and objectivism in social theory, i.e. mutually exclusive views of human activity as a result of individual decisions or as a consequence of influence of supra-individual structures. One of the reasons for Bourdieu’s distancing from structuralism was his insight that the actual behaviour of people is not accorded with norms and rules. Instead of social behaviour determined by rules, in Bourdieu’s system we find the concept of social practices characterized by fluidity and necessary improvisation. This improvisational character of practices in which individuals are guided by practi-cal feeling or practical logic is simultaneously enabled and limited by the exist-ence of habitus – an acquired system of relatively stable dispositions adapted to objective conditions in which they have been constituted. Dispositions making up the habitus represent the basis for the generation of practices and meaningful perceptions and assessments. They predispose actors [importantly – they do not condition, or cause them] to do certain things and perceive and assess things in a particular way. Habitus is largely acquired through experience, and is only to a small extent available through explicit learning. It generates socially competent behaviours through habit and routine, rather than through conscious use of certain types of knowledge.
As Bourdieu claims, dispositions and generative classificatory schemes, which make up the basis of habitus, are embodied in human beings. He sees the body as a mnemonic device into which during the socialization process the very basis of culture is coded – the practical taxonomy of habitus. From this fact habitus’s durability emerges. Habitus defined in the early years of one’s life influences any subsequent learning or social experience. On the other hand, habitus acts only in relation with the social field – so that the same habitus can produce varying prac-tices, depending on what is happening in the field. But, these practices in different social fields are still marked by stylistic coherence or thematic unity. This points to the transferability of dispositions (habitus) – the tendency of basic dispositions to structure and create behaviours in social fields other than those in which they have originally been created. During this process, dispositions adapted to one field are turned into practices accorded with the logic of the other field.
In Bourdieu’s terms, society consists of a multitude of social fields. Fields rep-resent social arenas in which fights around specific resources and goods occur. He defines fields as structured systems of social positions, which determine the situation of individuals or institutions occupying them. Social fields are structured on the basis of the power balance between those occupying positions in the field,
17
iNtroduCtioN
who are dominant, subjugated, or equivalent, depending on how much they are in possession of resources and goods over which the struggle is conducted. Those goods can be classified into three categories: economic capital, cultural capital, and social capital [see footnote 11]. Strategies of agents in the field, i.e. their practices, are devoted to preservation or improvement of their position in relation to the capital defined by the field.
Social practices, Bourdieu continues, are generated in the relation between the habitus, which is a product of objective existential circumstances and the relational position in the structure of existential conditions, capital in one of its forms, and social fields, in which struggles through and over economic, cultural, and social capital are waged. For this, Bourdieu uses a pseudo-scientific formula [(habitus) (capital)] + field = practices.
The second central topic in this book by Bourdieu deals with a reconceptuali-zation of Weber’s social stratification model, in particular the relation between classes and status. Attempting to redefine the relation between classes and status, Bourdieu introduces new concepts: objective class, constructed class, class frac-tions, and lifestyles. The first step in formulating the stratification model is to identify objective classes, based on professional affiliations. The second step is to determine, based on data from national statistics, the economic and cultural capitals of these classes and their mutual interrelation. If the total capital (economic and cultural) defines belonging to a certain class, then the composition of the capital (the relationship of economic and cultural capital) defines belonging to class frac-tions. The general rule is that both forms of capital within classes are inversely proportional: fractions richer in economic capital are poorer in cultural capital. This way, a three-dimensional social space is created, the dimensions being the total size of capital, the composition of capital, and changes of these two characteristics in time (expressed through past and future trajectories). This model unites, not boiling one down to the other, Weber’s dimensions of class and status15. Classes so constructed, says Bourdieu, are groups of agents occupying similar positions in this three-dimensional social space, who, having similar conditions of living, and being exposed to similar types of conditioning, are very likely to develop similar dispositions and interests (habitus), and thus produce similar practices and adopt similar attitudes.
The theoretical model presenting the relation between objective existential conditions, classes, class fractions, and lifestyles would be as follows: objective existential conditions combined with the position in social structure produce the
15 In this stratification system different kinds of social mobility are possible. Vertical social mo-bility (upward and downward) is but one of them. Especially important, according to Bourdieu, is transversal mobility, a result of conversion and re-conversion strategies, for instance, investment of economic capital so as to gain cultural capital (education) of one’s offspring, which will in turn be used to enlarge economic capital in the future.
18
Cultural Needs, Habits aNd taste of CitizeNs of serbia aNd MaCedoNia
habitus, which consists of the system of schemes generating practices and works, and the system of schemes for perception and assessment (taste), which, together, produce practices and works, which make lifestyle.
According to Bourdieu, two basic organizational principles of social space (society) – the total capital and its composition – determine both the structure and changes of cultural consumption, and, even further than that, the entire universe of lifestyles. In cultural consumption the principal opposition, based on the total capital, is found between those practices deemed, due to their rarity, as extraordi-nary and aristocratic, related to fractions richest in economic and cultural capital, and those socially identified as vulgar, because they are simple and related to frac-tions poorest in both capital types. The position in between the two is occupied by practices perceived in society as pretentious, for obvious disaccord between their ambitions and potentials.
This fundamental opposition is specified depending on the composition of capital. Thus, for instance, the dominant class, in possession of a lot of capital, is characterized by the “taste of freedom” (aesthetic disposition) – a tendency to stylize and formalize natural functions, through which these are elevated above vulgar materialism. At the same time, this tendency points to how distant the life of these classes is from the direct influence of economic and social necessities. Within this class, the dominant fraction (bourgeoisie), which owes its position to the possession of economic capital, prefers the art characterized by a denial of the social world, hedonism, and lightness. Inferior fractions of the dominant class (intellectuals and artists) owe their position to the possession of cultural capital, and therefore oppose bourgeois fondness of ornamentation and bragging, in the name of the aesthetics of simplicity and cleanliness. In contrast of the taste of the dominant class, we find the “taste of necessity” found in the working classes (farmers and labourers). Without either economic or cultural capital, they are in the state of constant struggle against economic and social necessities which shape their habitus. Hence, they develop tendencies towards functional, informal, natural, and sensuous. Between these two extremes, we find parvenus, characterized by
“pretentious taste”. They would like to detach themselves from the working classes and present themselves as part of the dominant class, but they lack both capital and corresponding habitus. For this reason, they are trying to adopt external tokens of the lifestyle of dominant classes, acting as someone they are not.
In Bourdieu’s terms, taste classifies, and it classifies the classifier. Taste unites and separates. As a product of activity of certain existential conditions, taste unites all those who share similar existential conditions, and separates them from those whose existential conditions are different. This delineates the two groups dramatically, as taste is the basis for the choice of everything else that surrounds people in their lives – other people and things – and of everything they represent
19
iNtroduCtioN
for other people16. Presented as a result of individual, natural gifts, and not social conditioning and learning, cultural practices and tastes, claims Bourdieu, through social selection and legitimation of social differences, contribute to the reproduc-tion of class domination.
Popular Culture and High Culture: Analysis and Evaluation of Taste
The book “Popular Culture and High Culture: an Analysis and Evaluation of Taste” came out in 197417. In it, Herbert J. Gans covers three topics relevant to our study as well: the relationship between high and popular culture, the typology of taste, and instruments of cultural policy based on the cultural democracy model.
In the words of Gans himself, although the book is a sociological study of popular and high culture and their place in American society, it is still based on two value judgements: (1) that popular culture reflects and expresses aesthetic and other needs of many people, which makes it culture, rather than a mere commercial endeavour; and (2) that all people have the right to the culture they choose, irrespective of whether it is high or popular culture. [Gans:1999:xi]
The criticism of mass or popular culture is at least two centuries old18. Four main topics in its contemporary variant pertain to the negative character of mass culture production, and negative effects of mass culture onto high culture, mass culture audience, and society at large. According to Gans, although one should not easily dismiss charges usually pressed against mass culture, the essence of this conflict lies much deeper. While proponents of high culture accuse mass culture of being vulgar and pathological, proponents of mass culture accordingly claim that high culture is snobbish, feminized, and quasi-intellectual. While criticizers of mass culture abhor the standardization and schematization of mass culture, especially its forms glorifying violence, consumers of mass culture detest deviant behaviour of high artists and their topics. Both sides view the confronting culture on grounds of their own values systems, and are therefore dissatisfied with what they see. While high culture attacks mass culture through books and magazines, the common folk calls upon censorship, police and courts, and puts political pressure on institutions supporting elite art. In view of such conflicts over culture the debate is, therefore,
16 Perhaps the most dramatic Bourdieu’s example is class endogamy – where individuals usually meet and marry within the same, and not different lifestyles, and therefore within the same, and not different classes and class fractions.17 The extended edition of the book appeared in 1999. The principal text remained unchanged, while additions include a new introduction and postscripts after each of the three chapters.18 On criticism of mass culture see also: Dominic Strinati: “An Introduction to Theories of Popular Culture”, Routledge, London, New York, 1995. and Antonina Kloskowska: ”Mass Culture
– Critique and Defence“; Matica srpska, Novi Sad, 1985
20
Cultural Needs, Habits aNd taste of CitizeNs of serbia aNd MaCedoNia
much more serious – it deals with the essence of good living and, especially, what culture and whose culture should be dominant in society.
Gans claims that the dichotomous classification of culture and taste into high and mass culture, i.e. elite taste and mass taste, is oversimplified19. Instead of this sharp division into high taste and unified, homogeneous mass taste, Gans proposes a taste typology of five taste cultures and five taste audiences. The very idea of a taste typology, in this, as in other cases, is based on daily insights and research results, showing that aesthetic choices are not random, but rather show a clear pattern, which remains stable when switching from one domain into the other (e.g. music, film, magazines, clothing, food…) In Gans’s words, this relatively coherent system of preferences is based on similar values and aesthetic standards. These values and standards stand for what he calls taste culture, while people who make similar choices for similar reasons – i.e. share such values and standards – are, in his words, members of the same taste public. Gans insists that taste cultures are not coherent value systems, nor are taste publics organized groups. Taste cultures are aggregations of similar values and of, usually, but not always, similar contents, while taste publics are aggregations of people who usually (but not always), based on similar values, choose similar things available in the cultural offer.
Gans asserts that there is no simple correlation between taste cultures and higher or lower classes, but also says that the selection of an art or entertainment is still decisively conditioned by available socio-economic resources, material and symbolic. In other words, taste types are – even though he does not recognize the influence of other factors, such as age, racial, ethnic, and religious affiliation, or place of residence – primarily determined by class. He calls these five taste types high culture, upper-middle culture, lower-middle culture, low culture, and quasi-folklore culture of taste. In his theoretical system, these terms do not denote hierarchical levels of taste cultures, but rather the social position of representatives of those taste types. In his words, all taste cultures are based on certain values and aesthetic standards, and all (not only high taste culture) apply these (different) standards in their choices20. One can therefore claim that – if we viewed them from 19 In his words, as such could also be taken the three-degree classification into Highbrow, Middlebrow and Lowbrow taste, almost universally used ever since the book by Russell Lynes “The Tastemakers”.20 Standards of high taste culture are explicit, to a point codified, and constantly used in the work of theoreticians, art critics, and educated public. Contrary to this, standards of all other taste cultures are implicit, not codified, and seldom discussed in public, in magazines or academic in-stitutions. They are, therefore, largely invisible. For this reason, high taste culture is much more influential than it would be guaranteed by its sheer size or numbers of its audience. Gans explains that all other cultures are also based on aesthetic standards, where they all have criteria to distin-guish between successful and unsuccessful cultural creations. People loving westerns can distin-guish between good and bad such movies equally well as people differentiating between good and bad theatrical performances. In the words of this author, the difference between these two publics lies in the degree of aesthetic education and ability to express their own feelings in the appropriate aesthetic vocabulary. The similarity is in the fact both strive for beauty.
21
iNtroduCtioN
the standpoint of needs of corresponding groups in the audience – taste cultures are not better or worse than one another, but just different.
High culture is different from other taste cultures by the fact it is predominantly occupied by artists, critics, and audience sharing the standards and perspectives of artists. Both these groups consist largely of the highly educated, belonging to upper or upper-middle class, those with academic affiliations or members of esteemed professions (doctors, lawyers, etc.) This culture is more diversified and changes more quickly than other taste cultures. Works of art which members of this public enjoy include both traditional and contemporary pieces, and art diverse in both form and content. What makes this culture even more different from all others is the fact that its members pay special attention to issues pertaining to construction of cultural products – form and substance, method, concealed and open symbolism.
Upper-middle culture represents the taste culture of the majority of upper-middle classes of the American society. Although well educated, these population layers do not find high taste culture satisfactory. They prefer an art primarily oriented towards content, rather than towards formal experiments and innovation. Still, Gans says, one would have problems singling out an art specific to this taste culture. Rather, its members largely consume those works of high art which have become popular. Proponents of this taste culture by and large follow the opinion of art critics, who are there to help them differentiate between their own art and that of high taste on one hand, or that of lower-middle class on the other, especially when these are propagated through the same media. In Gans’s terms, this taste culture is spreading most rapidly throughout the United States, as a consequence of the explosion of high education.
Lower-middle culture is, in terms of numbers, the dominant culture of American society. It attracts members of middle and lower-middle social strata (accountants, teachers, lower “white collars”). This public is not particularly interested in “culture” (which for them means high and higher-middle culture), but is not hostile to it, either. Lower-middle public comprises the biggest segment of mass media audience, and is indeed the group for which most media programs are made. In Gans’s terms, more than any other taste public, this public can be divided into conservative and progressive fractions, depending on which content they find acceptable in the arts and the media.
Low culture is the culture of older lower-middle classes, in particular non-qualified and semi-qualified workers. Gans claims that by mid 1950s this was the dominant taste culture, after which it was replaced by lower-middle taste culture. The audience of low culture is openly hostile to “Culture” – by which they mean high and higher-middle culture. As social practices of the working classes are strictly divided by gender, “male” and “female” contents are clearly delineated in this culture. The public of low culture receives most products from the media, so it is compelled to share many programs with the lower-middle culture audience, reinterpreting them to fit the values of the working class.
22
Cultural Needs, Habits aNd taste of CitizeNs of serbia aNd MaCedoNia
Quasi-folk low culture is a mixture of folklore culture and commercial low culture from the times before World War Two. This is the taste culture of poor people, who carry out non-qualified manual jobs, who are mostly rural, whose education ended after primary school, and who are largely non-white. Although this public is still numerous, its low status and small purchasing power result in its cultural needs being paid little attention. Therefore, these people must be content with the products offered to the low culture audience. Data on this public are insufficient, but it seems to represent a simpli-fied version of low culture, with equal gender divisions, popularity of melodrama, action comedies and moral dramas, tabloids, comic books, old westerns, and soap operas.
Based on this classification, in the penultimate chapter of the book, Gans stated the principles and instruments of cultural policy, at whose basis lies aesthetic and cultural pluralism. Of the two basic positions this policy is based on, one pertains to taste cultures, and the other to taste publics.
According to Gans, if we observed only taste cultures, separated from the publics making them, we could state that higher cultures are better or at least more compre-hensive and informative than the lower ones. However, he also adds that, in democratic societies, it is not possible to formulate policy without taking into consideration the needs of people this policy will affect. Thus, in this case, too, it is impossible to evaluate taste cultures independently of their audiences. In this reasoning we need to keep in mind that different public groups have different cultural capacities, and in particular different socio-economic and educational background to acquire such capacities. How unsuitable the requirements of mass culture critics are becomes clear when one realizes that they practically demand that all members of society adopt standards set by high culture – in acting so, they require from people to acquire cultural skills for which society has never provided them with any opportunities (primarily in terms of education). The second basic position that Gans expresses is therefore that evaluation of any taste culture must take into consideration the corresponding taste public, i.e. that evaluation of any cultural product must be related to the aesthetic standards and other basic characteristics of its audience. If taste cultures express the characteristics and standards of their publics, they are, Gans says, equal in value.
These two seemingly contradictory positions lie at the basis of the cultural policy proposed by Gans. In his view, a society should try to conduct the policy which allows to everyone maximal educational and other prerequisites to participate in high culture. Meanwhile, until such prerequisites are available to all, society should support and encourage cultural contents which will satisfy the needs and suit the standards of existing taste publics. These two alternatives in cultural policy are named by Gans (1) “cultural mobility”, which gives all citizens equal economic and educational op-portunity to select high culture; and (2) “subcultural programming” (for which Gans vouches), where all taste cultures are supported – high and low, to equal extent.
23
iNtroduCtioN
Omnivores and Univores – Different Ways to Express Social Conditioning of Taste
Richard Peterson, along with Paul Hirsch, Howard Becker, and Diana Crane, is usually taken to be the founder of the dominant approach in American sociology of culture of the 1970’s and 1980’s, known as the production of culture approach21. Although within this perspective we find significant numbers of sociologists of culture today, Peterson’s influence is nowadays more related to the series of texts in which he (and his associates) dealt with the problems of cultural consumption – such as Understanding Audience Segmentation: From Elite and Mass to Omni-vore and Univore22; How Musical Tastes Mark Occupational Status Groups (with Albert Simkus)23; Changing Highbrow Taste: from Snob to Omnivore (with Roger Kern)24 and The Rise and Fall of Highbrow Snobbery as a Status Marker 25.
One of the social functions of taste is to mark symbolic boundaries between social groups. Researchers and theoreticians of the first half of 20th century, from Max Weber and Emil Durkheim, over Torsten Veblen, Georg Simmel and Lloyd Warner, to David Riesman and Erving Goffman, largely dealt with the connection between social status and taste. Peterson’s project in this field could be described as an attempt to empirically establish and theoretically justify the changed relation between cultural consumption and social status in post-industrial societies of the late 20th century.
In one of his early texts, that he wrote together with (another classic of American sociology of culture) Paul DiMaggio26, using the development of American folk music as an example, Peterson showed that the hypothesis of massification – presupposing the decreased influence of regional, ethnic, religious, professional, and other sources of cultural diversity and the emergence of a homogenized mass culture – is false. However, he also found that it is no longer possible to establish simple correlation
21 In the words of Peterson himself, this approach includes the study of how symbolic elements of culture are shaped in the systems in which they are created, distributed, evaluated, studied, and preserved. He claims that the four domains in which the approach of cultural production has been most fruitful are the study of: 1) “gatekeepers”, 2) system of rewarding, 3) market structures, and 4) artistic careers.22 Richard A. Peterson “Understanding audience segmentation: From elite and mass to omni-vore and univore”. Poetics 21, p. 243-258, 1992.23 Richard A. Peterson and Albert Simkus “How musical tastes mark occupational status groups”. In: Michele Lamont and Marcel Fournier (eds.), Cultivating differences: Symbolic boundaries and the making of inequality, p. 152-186. Chicago, IL: The University of Chicago Press, 1992.24 Richard A. Peterson and Roger M. Kern “Changing highbrow taste: From snob to omnivore”, American Sociological Review 61, p. 900-907, 1996.25 Richard A. Peterson “The rise and fall of highbrow snobbery as a status marker”. Poetics 25, p. 75-92, 1997.26 Richard A. Peterson and Paul DiMaggio, “From Region to Class, The Changing Locus of Coun-try Music: A Test of the Massification Hypothesis”, Social Forces, vol 53:3, 1975, p. 497 - 506
24
Cultural Needs, Habits aNd taste of CitizeNs of serbia aNd MaCedoNia
between cultural classes (defined in relation to profession, income, and education) and musical tastes. In the case of country music, race (the audience of such music is exclusively white) and age group (mostly middle-aged individuals) was equally strong a predictor of cultural choice as was belonging to workers’ professions27. For this reason, Peterson and DiMaggio believe that in further empirical research of contemporary culture, instead of social classes, it would be much more fruitful to start from “cultural classes” – groups sharing similar cultural consumption patterns. Only after this could one attempt to find their social correlates.
A few years later, Peterson took this direction while editing an issue of the journal “American Behavioral Scientist”28 dedicated to “cultural choice patterns”. In a text he wrote with Michael Hughes29, considering a wide range of activities (apart from cultural activities in the narrower sense, he included athletic activities, travels, household activi-ties, etc.), Peterson pinpointed eight patterns of cultural choices in American society, where he showed that there was no empirical confirmation for the clear-cut division into lowbrow, middlebrow and highbrow cultural pattern30. The research showed that only 1% of the subjects were to be viewed as pure highbrow audience, while most of those participating in cultural events also participated in all other activities. This made the authors assume that the basic dimension in relation to which cultural choice patterns are defined may be presented as a continuum, with the active ones (in all given aspects) on one end, and passive or alienated ones on the other.
It took a small step to get from these results to the viewpoint on the different nature of relationship between social status and cultural activities in late 20th cen-tury societies. In his texts How Musical Tastes Mark Occupational Status Groups (with Albert Simkus) and Understanding Audience Segmentation: From Elite and Mass to Omnivore and Univore of 1992, Peterson defined his conception, claiming that the range of activities in spare time and diversity of cultural choices today present itself as the principal difference among status groups.
Two key findings in the study of relationship between professional status and musical taste, carried out by Peterson and Simkus, are that, first, taste hierarchy can today no longer be visually presented as a column in which tastes are located one above the other, but rather as a pyramid on whose top one finds elite taste, with ever more alternative forms on the same level as we go down this pyramid of taste. At the same time, as we approach the bottom of the pyramid, musical tastes ever
27 Moreover, according to the authors, the fact that the audience of American easy listening music is also predominantly white, middle-aged and from the population of workers, shows that social and cultural grouping changed quite a bit in the last quarter of the 20th century.28 American Behavioral Scientist, vol. 26, 1983.29 Michael Hughes and Richard A. Peterson, “Isolating cultural choice patters in the U.S. popu-lation, American Behavioral Scientists, 26, 1983, p. 459 - 48730 Other authors presenting their research in this issue of the journal also noticed quite a large number of cultural patterns in the American public – from four (Sobel) to fourteen (Greenberg and Franck).
25
iNtroduCtioN
more mark not only professional status, but also status borders between age, gender, race, regional, religious, and lifestyle groups, which all share the same status level in terms of profession. Secondly, cultural elite no longer marks its excellence by means of exclusive high taste and exclusive (“snobbish”) activities, but rather by means of the knowledge and consumption of all other art forms, too (including those of mass culture), and by means of its more significant participation in a wide variety of spare time activities. If such a heterogeneous taste and activities of elite are best described by the term “omnivores”, then their opposite at the bottom of the pyramid would be groups whose members assume low social status, carry out a narrow range of cultural activities, and have a relatively homogeneous (monodi-rectional) taste. Peterson and Simkus call this latter group “univores”.
In 1990s these terms started to be widely used, and proved to be useful theoreti-cal tools for understanding the changed nature of cultural practices in the age still labelled postmodernism or globalization era31. In a text written in collaboration with Roger Kern in 1996, entitled Changing Highbrow Taste: from Snob to Omnivore, Peterson himself tried to point to possible reasons for this change in expressing elite status. In his view, omnivores are not characterized by a non-discriminative acceptance of everything offered in the cultural market, but primarily by an open-ness to different cultural practices. That way omnivores are the true opposite to the snobbery based on inflexible rules on what cannot under any circumstances be the object of pleasure for the cultural elite.
Possible reasons that brought about such changes in behaviour, believe Peterson and Kern, are: (1) structural changes, related to the rise in the standard of living, broader education, geographic and social mobility. This provides more contact among people of different tastes, which, along with the presentation of the arts through the mass media, reduces the possibility for knowing art to be used as a grounds for social exclusion; (2) value changes, including the historical trend leading to ever bigger tolerance of those representing different social (cultural values); (3) changes in the world of art, which, mostly through avantgarde movements and growth of artistic market, resulted in the disruption of the 19th century unified standard on what high art was, where everything not conforming with the standard was rejected; (4) change in the generation policy, where members of the generations from the last quarter of the 20th century no longer opted for popular culture in a transient phase in their own maturation process, but rather accepted it permanently as an alternative to the well-established elite culture; and (5) change in the policy of dominant status groups, who replaced the old strategy of rejecting popular culture by the strategy of neutralizing its subversive potentials by incorporating it into the dominant culture.
31 In the last ten years, this Peterson’s conception has induced a lot of research, many studies and articles testing the theses – from the United States, through the Netherlands and Germany, all the way to post-Soviet Russia.
26
Cultural Needs, Habits aNd taste of CitizeNs of serbia aNd MaCedoNia
In a series of texts primarily dedicated to testing and further specifying Peterson’s findings, Koen van Eijck32 pointed to social processes resulting in the emergence of omnivores, to dimensions (patterns and discourses) lying at the basis of modern cultural choice patterns, and social carriers of omnivore taste. An early insight by van Eijck is that the conclusions of Peterson and Simkus (reached with the help of data from the US General Social Survey 1982) and Peterson and Kern (based on the US General Social Survey 1992) refer to aggregates, i.e. social status groups, and cannot be directly translated to the level of individuals. Results suggesting that certain status groups are typically omnivorous in taste do not immediately imply that individual members of these status groups are omnivores. It may just be the case that these status groups are simply culturally heterogeneous, so that the omnivore taste of the status groups stems from this heterogeneity33.
Van Eijck also suggests that even Peterson, although he practically introduced into the theory the problem of cultural choice patterns, paid very little attention to the ways in which individuals combine cultural products in their consumption. His conception of omnivores and univores primarily dealt with the scope of cultural choices (how many genres are combined), while it neglected the content of the choices (i.e. which genres are combined).
In his text “Social Differentiation of Musical Taste Patterns” (2001) Van Eijck on one hand discusses the process leading to cultural practices of elite groups being interpretable as omnivorous, and, on the other, attempts to define the grounds on which combining musical genres into cultural choice patterns is based.
Working on the data acquired in the survey “Participation in Cultural Activities of Dutch Population” (Intomart 1987), Van Eijck concluded that, although there were differences between elite social groups and other status groups in terms of diversity of cultural choices, they were not significant. This was particularly so because differences mostly occurred in terms of the number of musical genres subjects claimed to listen to “occasionally”, and not really in terms of the number of really favourite musical genres.
For this reason, acknowledging the theoretical insights of Gerhard Schulze and Simon Frith, Van Eijck went on to study the content of cultural choice patterns. In his work “Die Erlebnisgeselschaft” (“Society of Experience”), Schulze identi-
32 Koen van Eijck, “Socialization, education and life-style: How social mobility increases the cul-tural homogeneity of status groups“, Poetics, vol. 25, 1999, p. 195 – 224; also Koen van Eijck, “Richard A. Peterson and the culture of consumption“ Poetics, vol. 28, 2000, p. 207 – 224; and Koen van Eijck “Social differentiation in musical taste patterns“, Social Forces, vol. 79, No. 3, 2001, p. 1163 - 1185 33 Peterson related omnivore taste to the social mobility phenomenon. On one hand, many so-cially mobile persons at least partially preserve cultural preferences and habits from the youth throughout their lives. This could lead to the omnivorous taste on the level of individuals. On the other hand, since as a result of the spread of high education social mobility in modern societies is mostly going upward, this leads to the fact that in the groups of high status one also finds individu-als recruited from various social strata, with different tastes.
27
iNtroduCtioN
fied three patterns as the grounds for shaping cultural choices. He calls them the “high culture scheme” (Hochkulturschema), “trivial scheme” (Trivialschema), and “excitement scheme” (Spannungschema)34. The high culture scheme entails the dif-ference between art and life – art pertains to the sublime, spiritual, and absolute. According to this scheme, art is not only meant to be enjoyed, but also to be learnt from, while typical behaviour of the audience is restricted, where individuals fully concentrate on what is offered by the performers. In the trivial scheme, life and art are less delineated. The most important things in this discourse are authenticity and the social function of the arts. The audience is allowed to participate in the performance by clapping or shouting, by which it contributes to a more relaxed set-ting. This art expresses traditional, folklore values, while its audience seeks security through conformism, rather than intellectual and spiritual elevation. The excitement scheme is historically the youngest of the three, and is characterized by performers such as Elvis Priestley, Fats Domino, Bill Haley and others. The scheme is best described as commercial and entertaining, while its primary function is escapism. Delight in this art is taken through bodily activity – dance, laughter, unconventional behaviour – in particular in the musical arts. Schulze also identifies the audience crossing traditional boundaries of artistic patterns, i.e. people belonging to more than one scheme. In his view, these are young, well-educated individuals, moving upwards on the social scale, who make up the new middle class and whose lifestyle can be defined as postmodern. Their cultural consumption patterns include cultural choices and leisure activities which are traditionally cannot go together – visits to luna parks and museums, listening to classical and pop music. Schulze says that members of this group combine classical music and pop or jazz, but do not include in their choices the music from the trivial scheme or folk discourse.
On his sample, using factor analysis, Van Eijck managed to quite clearly dif-ferentiate precisely among the four patterns introduced by Schulze: the highbrow factor, the folk factor, the pop factor, and the factor of new omnivores. The four did not differ only by the content, but also by the scope of their choices. It turned out that the group Van Eijck defined as “new omnivores” had a much broader range of preferences than the other groups. By analyzing their social background, he showed that they, as Schulze assumed, indeed came from among the highly edu-cated young people, moving upward on the social scale. This way Van Eijck was able to explain why there were no significant differences among the status groups in terms of education/occupation. It turned out that the highly educated group had two segments: the older group, whose preferences aimed at the classical arts, and the younger group, made up of new omnivores. This also suggested that for one to understand contemporary cultural practices one needs to study the content of cul-34 Van Eijck suggests that three discourses identified by Simon Frith in the text “What is Good Music“, (Canadian University Music Review, Vol. 10, 1990, p. 92 – 102) – art discourse, folklore discourse and pop discourse basically match Schulze’s schemes.
28
Cultural Needs, Habits aNd taste of CitizeNs of serbia aNd MaCedoNia
tural choice patterns at least as much as their scope, as well as that, again contrary to Peterson’s findings, elite status groups in terms of occupation and education do not become ever more omnivorous as wholes; rather, in them there emerge clearly defined social bearers of the omnivore taste – the new middle class.
Assumptions
Before presenting our results, let us just point to some of the principal assumptions used in the research. In the line of suggestions found in Peterson and DiMaggio we decided to start from cultural stratification. Instead of grouping subjects into class, status or educational groups and then testing their cultural needs, habits, and taste, we opted for the opposite approach. Based on the research data we re-constructed cultural groups: audience types (having in mind their motivation for and their participation in cultural activities, i.e. their cultural needs and habits); groups sharing the same types of taste and discourse (based on their preferences and knowledge in/on the arts); finally, groups belonging to the same cultural style (synthetic variable unifying all aspects, plus the subjects’ possession of culturally relevant goods). Then we tried to determine their socio-demographic correlates.
Following (mostly) Bourdieu, we assumed that basic determinants of cultural prac-tices (cultural needs, habits, and taste) of citizens of Serbia and Macedonia will be, on the one hand, conditions of their primary socialization (operationalized through the influence of education and occupation of their parents and respondents’ place of birth) and, on the other hand, their actual position in the social structure, i.e. their existential conditions (operationalized through respondents’ education and occupa-tion and their place of residence). Numerous empirical studies conducted around the world show that these two groups of social factors shape cultural participation, and also that their combinations produce various types of cultural practices. In order to determine the relative strength of these factors in Serbia and Macedonia, we posited two alternative hypotheses, that we labelled “hypothesis of primary socialization” and “hypothesis of cultural adaptation”. According to the hypothesis of primary socialization, informal education tacitly acquired in the family during childhood and youth decisively determines the individual’s cultural affinities and resources, leaving little room for their maturation, development, or change. The hypothesis of cultural adaptation, however, ascribes greater importance to experience gained by the individual through his or her own formal education, relationships in professional environment and place of residence, and also to the adaptation to the social environ-ment the individual is going through, thus proposing greater flexibility in shaping and changing cultural practices. We should also mention that these influences are not mutually exclusive, but rather complementary, and that the two alternative ap-
29
iNtroduCtioN
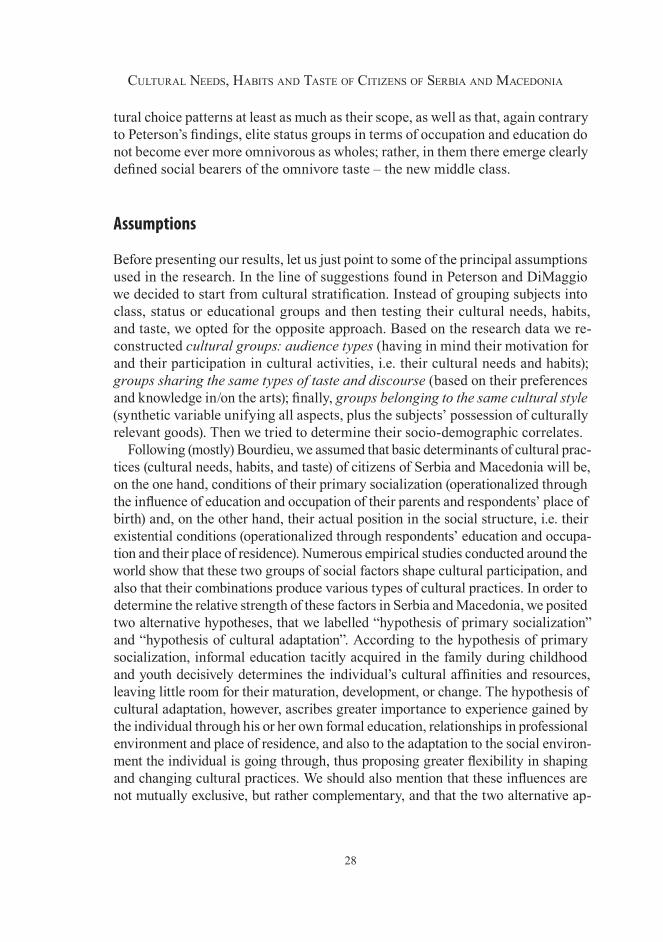
proaches have been devised only to measure the explanatory force of each individual hypothesis. Let us only add here that, apart from factors influencing all aspects of cultural practices, we also assumed that shaping of cultural habits is influenced by the total income of respondents and their families, as there is a (perhaps prosaic, but still present) financial (in)ability of some respondents to afford attendance at cultural events, participation in a private cultural activity or purchase of cultural goods.
Assumptions on the influences on the development of cultural practices could be graphically presented as follows:
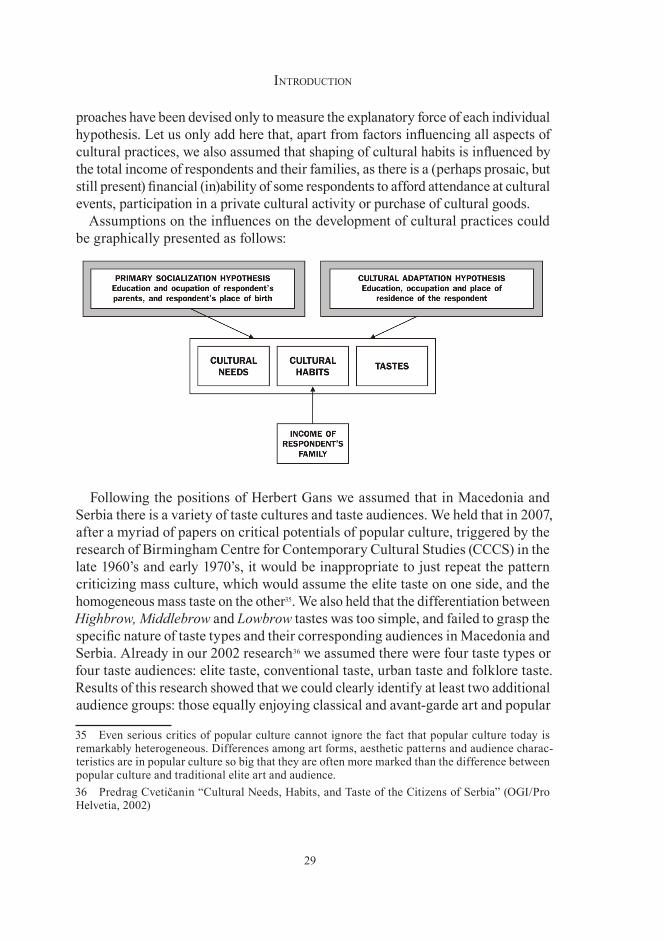
Following the positions of Herbert Gans we assumed that in Macedonia and Serbia there is a variety of taste cultures and taste audiences. We held that in 2007, after a myriad of papers on critical potentials of popular culture, triggered by the research of Birmingham Centre for Contemporary Cultural Studies (CCCS) in the late 1960’s and early 1970’s, it would be inappropriate to just repeat the pattern criticizing mass culture, which would assume the elite taste on one side, and the homogeneous mass taste on the other35. We also held that the differentiation between Highbrow, Middlebrow and Lowbrow tastes was too simple, and failed to grasp the specific nature of taste types and their corresponding audiences in Macedonia and Serbia. Already in our 2002 research36 we assumed there were four taste types or four taste audiences: elite taste, conventional taste, urban taste and folklore taste. Results of this research showed that we could clearly identify at least two additional audience groups: those equally enjoying classical and avant-garde art and popular
35 Even serious critics of popular culture cannot ignore the fact that popular culture today is remarkably heterogeneous. Differences among art forms, aesthetic patterns and audience charac-teristics are in popular culture so big that they are often more marked than the difference between popular culture and traditional elite art and audience. 36 Predrag Cvetičanin “Cultural Needs, Habits, and Taste of the Citizens of Serbia” (OGI/Pro Helvetia, 2002)
30
Cultural Needs, Habits aNd taste of CitizeNs of serbia aNd MaCedoNia
urban culture (we called them elite omnivores), and groups whose taste can hardly be labelled either folklore or urban, as they cross the borderline of popular and folklore discourses (we called them “rurban omnivores”). Contrary to Peterson, except in the case of elite omnivores, who combined the products of traditional, avant-garde and urban popular culture (but who were also very few in numbers), the social position of omnivores in Serbia did not single them out as elite social groups – quite the contrary. These were mostly unemployed young people, raised in the suburbs, whose education as a rule ended in vocational secondary schools.
With these results in mind, but also based on the positions of Koen Van Eijck, Simon Frith and Gerhard Schulze, we assumed that in Serbia and Macedonia there were four taste audience types (elite taste, conventional taste, urban taste, and folklore taste), classifiable into three cultural discourses (global elite cultural discourse, global popular cultural discourse, and folklore cultural discourse), and also two taste audiences cross-ing the borderlines of these discourses: elite omnivores, and rurban omnivores37.
A graphic representation of this pattern could look as follows:
Apart from the expected influence of profession, education, and place of birth of subjects and their parents, which we mentioned above, we also expected that
37 On defining these taste types and their operationalization in this research, see chapter “On Tastes and Discourses” in this study.
31
iNtroduCtioN
taste audiences would be classifiable by age: 1) that folklore taste and traditional elite taste would be typical of older generations: 2) that within global popular cultural discourse the young would be bearers of urban taste, and the older of conventional taste, and 3) that carriers of both omnivore taste types would come from the younger generations.
It is important to note that the scheme is not value-based. The model presupposes that certain social groups (in terms of education, occupation, and conditions of primary socialization), wishing to satisfy their aesthetic needs predominantly turn to certain genre types (musical, film, television, fine-artistic, literary, etc.), and that some genres do not appear, or appear less frequently in their cultural practices. Likewise, the model acknowledges that there are good and bad novels, good and bad theatre, good and bad opera, good and bad comics, and good and bad folk songs. Whether a taste is good or bad is decided on the level of concrete judgment of concrete works of art and within genres, and not among them.
The fact this scheme is not value based does not mean, however, that the very agents of cultural life treat their own tastes and the tastes of others as equal in value. Culture is a typically hierarchical domain, where differences in taste are set not only between cultural milieus, discourses and genres, but also within genres, between artists, performers, and individual works of art. In disputes around taste the stakes are, actually, much higher. The nature of these disputes pertains, in Gans’ words, to the nature of good living and especially to the fact what culture and whose culture should be dominant in a society38. As every social contact is simultaneously an act of estimating the other, people use tastes to put up symbolic boundaries between themselves and those categories of people that they do not like, where rejection and contempt are not “a privilege” of only one social group. If the higher classes despise vulgar and primitive practices of the uneducated and of physical workers, the latter equally reject the former’s culture as alienated , artificial, and feminized.
The study of symbolic and social boundaries has been central to a series of re-search disciplines in recent years: anthropology, history, political science, social psychology, and sociology. The central topic appearing in all the disciplines deals with an attempt to understand the role that symbolical resources (conceptual differ-ences, interpretive strategies, cultural traditions) play in the creation, maintenance, rejection, and destruction of institutionalized social borders (in terms of class, gender, race, and territory)39.
38 On the same topic, Bourdieu says: “This means that the games of artists and aesthetes and their struggles over the monopoly of artistic legitimacy are less innocent than they appear. In each conflict over art the issue is that of imposition of art of life, i.e. the transformation of arbitrary lifestyle into legitimate lifestyle, rejecting all other lifestyles as arbitrary [ Bourdieu:1984:57] 39 The question of relationship of symbolic and social borders, i.e. use of cultural practices for putting up symbolical barriers among groups was of specific interest to Michele Lamont. See,
32
Cultural Needs, Habits aNd taste of CitizeNs of serbia aNd MaCedoNia
The role that cultural practices play in the establishment of symbolic and social borders has also been the subject matter of numerous studies [Bourdieu: 1979; Hebdige: 1979; Douglas and Isherwood: 1979; Hughes and Peterson: 1984; Lamont: 1992; Bryson: 1996; Bryson: 1997]. Thus, for instance, Bettany Bryson in the well-known text “Anything But Heavy Metal”40 studied how people use tastes to put up symbolical obstacles between themselves and those categories of people they do not like, i.e. how tastes are used as a basis for symbolic and social exclusion. Laurence Levine, in the book “Highbrow/Lowbrow – the Emergence of Cultural Hierarchy in America” 41 showed that enjoying high art had become a token of high status in America only late in the 19th century, as part of the attempt of highbrow Anglo-Saxons to detach themselves from lowbrow immigrants whose popular entertainment was treated as trash and danger to morality. Bourideu’s conception of cultural capital is also an attempt to understand the role of cultural resources in the reproduction of class inequalities.
In our research, struggles on the symbolic borders in the domain of cultural participation make up the core of the cultural adaptation hypothesis: that cultural adaptation – accommodation to cultural practices and tastes of “relevant others” and establishment of symbolic borders to social groups from which we wish to distance ourselves – decisively determines our cultural practices, cultural styles and tastes.
We hope that these introductory remarks are sufficient for the reader to easily follow the presentation of results. Naturally, a more detailed discussion will be given in the chapters that follow.
for instance, Michèle Lamont “Money, Morals and Manners: The Culture of the French and the American Upper-Middle Class”, The University of Chicago Press, Chicago and London, 1992; Michèle Lamont and Marcel Fournier (eds), “Cultivating Differences: Symbolic Boundaries and the Making of Inequality”, The University of Chicago Press, Chicago and London, 1992; Michèle Lamont and Annette Lareau, “Cultural Capital: Allusions, Gaps and Glissandos in Recent Theo-retical Developments”, Sociological Theory, vol. 6, no. 2, 1988, p. 153 – 168; Michèle Lamont, John Schmalzbauer, Maureen Waller, Daniel Weber “Cultural and moral boundaries in the United States: structural position, geographic location and lifestyle explanations”, Poetics, vol. 24, 1996, p. 31 – 56; and Michèle Lamont and Virág Molnár, “The Study of Boundaries in the Social Sci-ences”, Annual Review of Sociology, vol. 28, 2002, p. 167 - 19540 Bethany Bryson, “Anything but heavy metal: Symbolic Exclusion and Musical Dislikes”, American Sociological Review, vol. 61, 1996, p. 884 - 89941 Lawrence W. Levine, “Highbrow/Lowbrow: the Emergence of Cultural Hierarchy in Ameri-ca”, Harvard University Press, Cambridge, MA, 1988,
33
Cultural Needs aNd Habits
Cultural Needs and Habits
Cultural participation encompasses three groups of mutually very different ac-tivities: cultural production, including amateur or professional art practice or a
creative hobby; cultural consumption in the public sphere occurring through visits to programs of cultural institutions or, broader, cultural events; and cultural consump-tion in the private sphere most commonly through the media (television, radio, video players, DVD, walkmen, discmen, MP3 players) and in recipients’ homes42.
As mentioned, studies of cultural participation usually focus on cultural recep-tion (consumption). In cultural consumption research we distinguish between four principal approaches, which we might label marketing, economic, psychological, and sociological.
The marketing approach to studying cultural consumption is part of market segmentation and target marketing. In its ambitions, the approach is practical, not theoretical. Market segmentation rests on the insight that potential audience is not unified, but rather consists of groups of individuals with similar needs, wishes, characteristics, motivation and consumption activities – so that the audience (market) can be classified in such segments, which then serve as a foundation to develop specific marketing strategies (target marketing).
The usual classification introduces four backgrounds for market segmentation: geographic segmentation, demographic segmentation, psychographic segmenta-tion and behavioural segmentation43. Geographic segmentation views the audience (market) by location (borough, part of the city) they live in. Specifically in those societies in which class divisions are expressed through clear divisions among residential areas, knowing the addresses of prospective users can be an indicator sufficient for the choice of marketing strategy. Demographic segmentation means that the audience is classified according to gender, age, race, ethnic groups, educa-tion, profession, etc. Research of participation trends has shown that some of these characteristics are very good predictors of behaviour and preferences of the audience. Within the marketing approach, psychographic segmentation usually pertains to
42 There are also exceptions to this rule, e.g. reading books, which is a cultural consumption activity in the private sphere, but does not occur over the media, or listening to music through a walkman, discman or MP3 player, which is much more common in public (on the bus, train, in the street) than in the recipient’s home.43 Very well known market segmentation systems are “Mosaic” and “ACORN” in Great Brit-ain. Both these systems combine geographic and demographic segmentation and are based on the idea that similar neighbourhoods (defined by zip or postcodes) represent residential areas in which one finds people with similar interests, income and consumer habits. “Mosaic” classifies all neighbourhoods in the UK (defined by postcodes) into 12 groups with similar lifestyles and within them differentiates between 52 personality types. “ACORN” (acronym for A Classification of Residential Neighbourhoods) segments the audience into six categories, 17 lifestyle groups and 54 personality types in all.
34
Cultural Needs, Habits aNd taste of CitizeNs of serbia aNd MaCedoNia
group attitudes to culture and art. Keath Diggle thus observes four groups in the audience: attenders, who have a positive attitude to art and translate this attitude into actual cultural participation; 2) intenders who have a positive attitude to art and like to attend cultural events, but for some reason fail to do so; 3) the indiffer-ent, who do not have particular attitudes to art, nor a wish to attend cultural and artistic performances; and 4) the hostile who have a negative attitude to art and do not intend to visit events in culture and arts. Behavioural market segmentation, i.e. audience segmentation according to behaviour, is basically conducted on the basis of five criteria: a) when they attend cultural events (on workdays or weekends, evening shows or matinees); b) why they attend cultural events (for celebration, friendliness, business, self-education, etc.) c) on which circumstances they visit cultural events (e.g. only while on vacation, when they come to town for shopping, etc.); d) what is their knowledge of cultural events (whether they attend popular or elite cultural events); and e) how often they attend cultural events (regular, oc-casional, and infrequent visitors)44.
Cultural institutions and cultural policy partakers in general, who are interested in trends and trend changes in cultural participation, their socio-cultural and de-mographic correlates and segmentation of their audience, logically show the most interest in results of the marketing approach to studying cultural participation. However, the problem with this type of research is that it very often leaves the purely descriptive level (where it can only be conducted with certainty), and names established trends, patterns or clusters so as to “introduce” naive explanations of established facts (as in the cases of Mosaic and ACORN that we have mentioned).
Traditional economic approach to studying cultural participation assumes that individuals are rational consumers, who wish to maximize pleasure by choosing those forms of cultural participation that satisfy their preferences, having in mind the limitations of their income on the one hand, and participation expenses on the other. In this model, precisely the relationship between the income and expenses has the key explanatory role, while individual preferences (tastes) are treated as fixed – dependent on a variety of socio-demographic and psychological factors – and therefore beyond the scope of this model. In this approach, participation level is seen as dependent on the relationship of participation expenses in a particular cultural activity and ex-penses of some other, alternative ways of spending spare time [Thorsby and Winter: 1979, Nardone: 1982, Vogel: 2000]. The alternative economic approach [Stigler and Becker 1977] presupposes that pleasure individuals get from cultural participation 44 Although one can reach this information through research, in developed countries almost all such data are available in cultural institutions and marketing agencies, through computerized box offices which, due to the habit of payment by credit or cash cards, automatically store the time of your visits, the number of visits, whether you come alone or have company, what type of cultural events you attend, etc. After your first attendance, it is also commonplace for them to ask you to fill out a short questionnaire with questions on your address, age, education, profession, preferred type of program, etc.
35
Cultural Needs aNd Habits
depends not only on income, expenses and taste, but also on factors such as prior artistic experience, knowledge of art, education and family tradition, which make it possible for the same participation level to be used more efficiently.
A problem with economic approaches to cultural participation is found in the fact that almost all empirical studies point to very limited influence of purely economic factors (such as income, wealth, and cultural participation expenses). It has been shown that these factors have some influence only on those cultural participants who already have a positive attitude to culture and arts and developed cultural habits, where changes in economic factors (e.g. ticket prices) only make those people prefer some cultural events to others.
Psychological approaches to the study of cultural participation assume that psychological traits of individuals (their characters or value systems) structure the modes and trends of consumption. In practice, the most common psychological ap-proaches in the field of cultural consumption are consumer categorization systems known as “VALS” (Values and Life-styles) and “LOV” (The List of Values). Both these approaches have been developed in response to the criticism of marketing segmentation procedures which were not really based on any theoretical postula-tions. They represent an attempt not to analyze direct interrelations of socio-demo-graphic traits of consumers on the one hand and their consumption activities on the other, but an effort to analyze such relationships via the intermediary concept of
“lifestyle”. A kind of psychological profile of consumers, lifestyle would subsume a multitude of social factors, and it would also be based on accepted psychological theories of personality and value.
Research based on personality theories has treated lifestyles as behaviours ex-pressing the character personality traits. In the now classic marketing study “Nine American Lifestyles”45, combining motivation research results of Abraham Maslow and social character studies of David Reisman, Arnold Mitchell devised a market segmentation model based on personality types, rather than usual demographic fac-tors. The model known as VALS (Values and Life-Styles) lists nine personality types, classified in three basic groups. The first one includes people whose behaviour is aimed at satisfying basic needs. This group comprises personality types that Mitch-ell calls Survivors and Sustainers. The second group gathers individuals primarily striving for social affirmation and acceptance by the environment. Mitchell calls them Outer-directed consumers. Three personality types classified here are called Belongers, Emulators, and Achievers. Contrary to this, the third basic group from this typology includes Inner-directed consumers, whose behaviour is primarily determined by their inner needs. Mitchell also sees three types in this group and labels them I-am-Me, Experientals and Socially conscious individuals. Outside these basic groups we find the personality type defined as Integrateds, expressing
45 Arnold Mitchell “The Nine American Life-Styles”, Warner, New York, 1983
36
Cultural Needs, Habits aNd taste of CitizeNs of serbia aNd MaCedoNia
a fine balance between internal orientation and orientation toward others. Each of these personality types in Mitchell’s study has a detailed psychological profile46 including potential consumer habits.
The second group of psychological approaches does not find the basis for dif-ferent lifestyles and consumption activities in the character of individuals, but in different value systems they adopt. The model called LOV (The List of Values) was developed by Lynn Kahle47. It is based on the research on values by Milton Rokeach. Rokeach devised an instrument (Rokeach’s Value Survey) which asked participants to rank 18 instrumental values and 18 basic values in their lives by importance. LOV is a classification scheme using a modified, abridged version of this instrument. It constructs lifestyles and predicts consumption trends based on the ranking of nine principal values (self-esteem, security, close relations with others, sense of fulfillment, self-fulfillment, respect of others, sense of belonging, excitement, fun and enjoying life).
In spite of significant differences, there are similarities between these approaches. One of them lies in the fact that both approaches operationalize lifestyles as pat-terns of consumer behaviour. Another one (also a weakness in both approaches) is that they assume that individual personalities, i.e. their value systems, are not influenced by the social and historical context, so that lifestyles are a-historic and, therefore, relatively stable phenomena.
Sociological interest in the study of cultural participation focuses on inspecting how cultural participation trends reflect, reproduce and potentially transform social collectivities. Traditional sociological approach to cultural participation studies tests the link between cultural consumption and key cultural grouping forms (such as gender, age groups, ethnic groups, classes, races, etc.), established by consuming certain types of objects (works, activities, events) taken to signal affiliation with those social collectivities. This approach assumes that objects of consumption (e.g. certain works of art) carry unambiguous meanings expressing identities of social groups, so that, based on knowledge of cultural consumption objects (types of art-works, artistic genres, types of cultural activities etc.), it is possible to reach direct conclusions on the taste of members of these social groups. Apart from the classical sociological studies of Torsten Veblen, Georg Simmel and Lloyd Warner, this type of research includes contemporary texts we have mentioned, namely by Richard Peterson48 and Paul di Maggio49. The problem of this approach is that it is based on
46 Thus, for instance, belongers are traditionalists, puritans, unwilling to experiment; emula-tors are ambitious, status-longing, competitive, but also incredulous that they will be treated on equal basis by the establishment; experientals are focused on internal growth and maturation, on direct experience and involvement, etc. 47 Lynn R. Kahle “Social Values and Social Change”, Praeger, New York, 198348 For instance, Peterson and DiMaggio 1975; Hughes and Peterson 1983; Peterson and Simkus 1992.49 For instance, DiMaggio and Useim 1978; DiMaggio and Mohr 1985; DiMaggio and Ostower 1990.
37
Cultural Needs aNd Habits
the essentialist conception of meaning, where cultural objects carry stable mean-ings transcending the social and historical contexts they are part of. In the time in which the borderline between elite and popular culture is vanishing and consumer habits of different social groups overlap - this assumption has turned problematic. Moreover, it has led to conceptions, influential today, that in postmodern societies the link between cultural consumption and social collectivities breaks.
With such drawbacks in mind, Douglas B. Holt, following the research of Pierre Bourdieu in sociology of culture, Stewart Hall, Dick Hebdige and Paul Willis in cultural studies, and the semiotic work of Roland Barthes, Jean Baudrillard and Mark Gottdiener, formulated an alternative approach opening up a new way of studying the influence collectivities exercise on cultural participation. He defined it as the post-structuralist approach.
On his view, the basic principles of the post-structural approach are that meanings of objects and activities are (as in structuralism) relationally constructed, a product of systematic difference relations, but that (contrary to structuralism) they are essen-tially unstable, constituted in human action in certain social contexts, undetachable from history and never structured by only one semiotic system. For such reasons, trends in cultural consumption must be viewed as structured by contextualized (lo-cal) understanding schemas, rather than by decontextualized, universal personality traits or value systems, as is the case in the psychological approaches.
In addition, in the post-structuralist approach cultural objects are treated as polysemic, where their potentially multifold interpretation and use is stressed. This implies that equal forms of consumer behaviour may have different mean-ings, and that equal objects may have different use for members of different col-lectivities. For that reason, in this approach, consumption models are viewed as regularities in consumer practice, not consumer behaviour. This means that the same cultural consumption models entail the same schemes in interpretation and use (how consumers understand, value and use objects), but not necessarily the same objects of cultural consumption. In addition, contrary to the psychological approach and the traditional sociological approach, defining consumption models and lifestyles as individual characteristics common to certain groups of people, the post-structuralist approach defines these as relevant social phenomena. Indeed, in this approach, cultural behaviours and cultural objects do not have immanent meanings. Rather, their meanings are constituted through the establishment of symbolical boundaries with cultural behaviours and objects in relation to which they stress their difference. Consumption models and lifestyles are not viewed in isolation. In fact, their meanings are understood in relation to alternative consump-tion models and lifestyles they are opposed to. For this reason they are treated as collective phenomena, with numerous collectivities taking part in their structuring. The activities of these collectivities may be synergetic (harmonized) or conflict-
38
Cultural Needs, Habits aNd taste of CitizeNs of serbia aNd MaCedoNia
ual (opposed). Finally, consumption models and lifestyles are viewed as dynamic socio-historical constructs. These phenomena are constantly changing, because people, as agents, change them, but also because changes in social circumstances change the meaning even of those consumption models and lifestyles that remain unchanged.
Even though it offers a more adequate understanding of the social character of cultural participation, reflected in the social nature of understanding, valuation and use of cultural objects, and even though it directs cultural participation research towards the study of interpretive systems (in Bourdieu’s words, cultural capital in its embodied, rather than objectified form), this approach, in its accentuation of contextualized (local) understanding schemas and construction of the meaning of consumption models and lifestyles as opposed to their local alternatives, has numerous limitations. Among them, it is most important that such type of analysis requires considerable limitation of the social, historical, and spatial scope of the research, so that it is practically adapted only to ethnographic studies. In massive survey-based research it is only partially applicable.
* * *
After an overview of these research experiences, we may now clearly define the features of our research. First of all, contrary to most cultural participation studies, our research deals with all aspects of cultural participation: cultural production, cultural consumption in the public sphere and cultural consumption in the private sphere of citizens of Macedonia and Serbia.
Second, numerous cultural consumption studies are limited only to the study of the actual aspect of recipient behaviour50, leaving out the question of motivation (interest) of agents to participate in cultural consumption, and also leaving out the entire segment of cultural offer. Following the research tradition studying consumer behaviour in general, better known as the Motivation/Ability/Opportunity Model and its use in the field of cultural participation as offered by Jennifer Wiggins51, we surmised that, in order to have cultural reception at all, it is necessary for re-cipients to have motivation to participate, ability to participate, and opportunity to participate, so that the research should be so formulated as to explore all these three necessary aspects. For this reason we separately studied the participants’ interests, their attitude to art and favourite ways to spend their leisure time (a potential aspect
50 Questions usually asked in such studies related solely to physical activities in the given pe-riod, e.g. number of visits to theatres, cinemas, concerts, museums and galleries in the year (or month) prior to surveying, the number of books read, the frequency of reading press; or they per-tain to the time spent in front of the TV or radio.51 See the text by Jennifer Wiggins “Motivation, Ability and Opportunity to Participate: A Reconceptualization of the RAND model of Audience Development”
39
Cultural Needs aNd Habits
of cultural practices), which we labelled “cultural needs”52. On the other hand, we inquired into their actual behaviour in the domain of cultural consumption and cultural production, which we called “cultural habits”53. The principal intention of our research was to note all those people who have well developed cultural needs – who like to go to the theatre, wish to go to the movies, enjoy the concerts of clas-sical, jazz or folk music, but, for lack of time, money, or cultural institutions in their place of residence –are not able to satisfy such needs. After this, in a series of questions, formed as pseudo-tests, we studied the knowledge of our subjects, i.e. their competence for cultural reception. In the end, we asked the subjects of the number and type of cultural institutions in their location, number and types of programs staged in their location in the previous year (cultural offer), and whether they attend cultural programs in nearby towns (if yes, which ones).
With regard to the four research traditions we discussed above, one may claim that our research has the features of both marketing54 and traditional sociological approach55. The interests of cultural policy partakers and researchers of cultural 52 Cultural needs represent a part of human motivational structure – they are longings satisfied through symbolic communication. The very term “cultural needs” is today considered obsolete. The reason for this is that it was mainly used in the Marxist research tradition. In particular, the use of the concept in Frankfurt and Budapest schools and their distinction between “real” and “ar-tificial” needs are treated in contemporary theories as an ideological dead-end. Today, much com-moner are terms such as “cultural interests”, accorded with contemporary post-modern theories stressing the instability of interests and practices and instability and fragmentation of identities built through them. The reason we opted for the (not standard) use of this “non-contemporary” phrase to landmark the potential aspect of cultural practices is found in the insight of our empiri-cal research that cultural interests are stable: moreover, that, once formed, they are almost rigid and “require” satisfaction, i.e. assume the characteristics of needs; second, they do appear in almost limitless variation, but still within a few clearly delineated segments whose borderlines are socially delineated – i.e. cultural interests are socially defined. [On the conception of social forma-tion of types of needs, but not in the sense of their rootedness in “inalienated/alienated humanity” see: Don Slater “Consumer Culture and Modernity”; on the flexible approach to the identity phe-nomenon accepting the ideological character of the conception “you-can-be-whatever-you-wish” see Harriet Bradley “Fractured Identities: Changing Patterns of Inequality”.]53 Cultural habits are treated as actualization of cultural needs. Therefore, they are only two sides of the same coin. Apart from visits to the theatre, cinema, concerts, museums, galleries, we also studied reading books, listening to music, use of computers and the Internet, playing instruments, painting, writing and pursuing certain creative crafts – such as knitting, weaving, woodcraft, etc. 54 “Marketing” here means that in most of our study we limited ourselves only to descriptive approach. Perhaps it would be more accurate to say that in this aspect the study belongs to the domain of cultural statistics. 55 By traditional sociological approach we mean what Douglas Holt calls the “object signifi-cation approach”, an approach reaching conclusions on the properties of cultural participation through the meaning of cultural products produced/consumed, i.e. through meaning of cultural activities subjects participate in. We have mentioned above that this approach suffers from signifi-cant limitations, and that it is primarily inadequate as it presupposes stable, essentialist meanings, which somehow “dwell” in the very cultural objects and cultural activities, and thus signalize af-filiation with certain social groups. Since the research took the form of a survey on a large sample,
40
Cultural Needs, Habits aNd taste of CitizeNs of serbia aNd MaCedoNia
phenomena are different. Those creating the cultural policy of states, regions or cities or define the business and creative policy of cultural institutions are prima-rily interested in cultural participation trends and changes to these trends, in the characteristics of potential audience and their socio-demographic distribution, and also in reasons for such audience to participate and reasons hindering this participation. On the other hand, researchers studying cultural phenomena are interested primarily in explaining the causes of cultural practices and their social (or individual) functions, and in understanding these phenomena.
With readers of this book in mind, cultural policy creators it is primarily intended for, the central part of the text deals with the identification of cultural groups in Serbia and Macedonia (based on the similarity of cultural needs, cultural habits, tastes, discourses and cultural styles) and their distribution per gender, age, edu-cation, occupational and territorial groups, and also the identification of trends in their cultural participation. Therefore, this study should be viewed as an attempt to make a map of cultural participation in Serbia and Macedonia, as a circumscription of a cultural atlas, where marketing studies of cultural participations, narrower in focus and territory covered, should follow.
In the final chapter we have attempted to respond to the interest of theoreticians and researchers of cultural participation. In it we tested the theoretical model given in the introduction to this study, which presupposes that cultural practices are shaped by primary socialization conditions and, on the other hand, cultural adaptation, i.e. the process of identification with social groups respondents belong to and by the establishment of symbolic boundaries toward social groups they wish to differ from.
The fact the study is comparative and is conducted in societies which had until re-cently been part of a broader community should facilitate both our tasks so defined.
CULTURAL NEEDS – A POTENTIAL ASPECT OF CULTURAL PARTICIPATION
In our research, this aspect of cultural participation has been operationalized through two questions in which we asked our subjects to state how they preferred to spend their spare time. The first question was open-ended, i.e. we asked them to themselves
in spite of these well known drawbacks, the approach was the lesser evil. Following Holt’s advice, we tried to mitigate its disadvantages by specifying survey questions with enough detail, so that they allowed us to reach conclusions on contextualized (local) interpretive schemas (i.e. on cultur-al capital in its embodied form); by ascribing meaning to cultural goods and activities in relation to interpretive communities they are addressing; by triangulating results through various fields of cultural consumption and making basic ethnographic records on respondents and their homes in a supplementary leaflet that surveyors filled out immediately upon the completed interview.
41
Cultural Needs aNd Habits
list three favourite leisure time activities. In the second question (that followed later in the questionnaire) we offered them twenty one activities56 and asked them to assess them (from within the range “I like this the most” to “I don’t like this at all”).
Apart from the description of favourite ways to spend free time (in the open-ended question) and insight into attitude to various activities gained in the close-ended question, in this part of the research we used cluster analysis to identify groups of respondents based on specific combinations of favourite/least favourite leisure activities. We then crosstabulated all these cultural groups and identified trends with standard socio-demographic variables (gender, age groups57, education58, occupation59, job position60, place of residence61 and region of residence62), where
56 The range included going to the theatre, watching TV, listening to classical, jazz, rock or folk music, talk to friends, going for a walk, visiting cafes, restaurants and family celebrations, all the way to athletic activities, reading papers, interior design and pursuing a hobby. 57 Subjects were classified in four age groups: a) 18 to 30 years of age; b) 31 do 45; c) 46 to 65; and d) over 65.58 The basic eight-degree scale of educational levels was for this purpose recoded into three basic educational groups, for which the highest education was: a) primary school; b) secondary school; c) college or university. 59 The basic scale contained 27 occupational groups. In order to define these elementary dis-tributions, we recoded them into three occupational groups: a) farmers and workers; b) middle strata occupations; c) experts, managers and owners. Pensioners were coded according to their previous occupation, pupils and students were classified according to their fathers’ occupations, while unemployed individuals and housewives were classified according to the occupation of their employed partners or (if unmarried) the occupation of their fathers. 60 Having in mind that people’s professional education in Serbia and Macedonia often does not match their actual job positions, in our research we asked for two types of data: 1) their occupation, what they are trained for and what they might have actually been employed in some period; and 2) what is their current job position, i.e. how they actually earn their living at this moment. Apart from this, we had in mind that we could reasonably assume differences in the cultural practices of pupils and students (on the one hand), employed people working in specific positions (on the other), and supported individuals (pensioners, housewives and the unemployed) on yet another
– even they all might belong to the same occupational group. This is why we recoded the original scale giving the current job positions of subjects into nine groups: a) farmers; b) workers; c) clerks; d) lower executives; e) small business owners; f) experts; g) managers and owners; h) pupils and students, and i) supported persons (pensioners, housewives, and unemployed individuals). The advantage of this scale is that it classifies subjects based on their current, actual work situation. Its possible drawback is that with “pupils and students” it also involves the age dimension, while in
“supported individuals” it, to an extent, includes the age and gender dimension. 61 Due to the fact that results of numerous studies point that not only cultural habits (i.e. actual cultural participation) but also cultural needs (dispositions for cultural participation) may differ depending on the current cultural infrastructure in the place of residence, we tested these influ-ences, too. Places of residence were recoded into four groups: the capital (Belgrade and Skopje); major cities with over 100,000 inhabitants; medium and small towns with population smaller than 100,000; and villages. 62 Having in mind the statements on cultural differences existing between the regions within Serbia (and Macedonia), often heard in public, and also the actual differences in terms of numbers and quality of cultural institutions among these regions, we divided Serbia into five and Mac-
42
Cultural Needs, Habits aNd taste of CitizeNs of serbia aNd MaCedoNia
we wished to define and describe similarities and differences in cultural needs among gender, age, educational, occupational and territorial groups. The benefit of comparative research is seen in the fact that, once we find there are regularities in one society, we may immediately check whether they exist in the other society – in case there are similarities, we may then test the causes of such outcomes, i.e., in case of differences, we could search for factors causing them. Naturally, we attempted to do this, too.
It is important to bear in mind, once again, that in the case of what we labelled cultural needs (cultural dispositions or cultural interests) we did not reach conclu-sions on what subjects actually do in their spare time (this will be the subject of the book segment on cultural habits), but on what they like to do in their spare time – per activity they are inclined to do (even if they do not carry out these activities for some reason). Following the idea of Bettany Bryson the scale of responses in the closed question also included the options “I don’t like this” and “I don’t like this at all”, which helped us not only determine the preferences of our subjects in terms of the way they spend their spare time, but also in terms of activities in their spare time they show repulsion to.
We mentioned that our open-ended question allowed the subjects to themselves list three favourite leisure activities. One might say that it is a small (and somewhat unpleasant) surprise to ask more than two thousand people63 of their favourite spare time activities, expecting a myriad of different answers – from stamp collection, to mushroom growing, from pigeon breeding to high fashion, from diving to ten-nis – where what you actually get is answers pointing to just a few basic activities, such as watching TV, walking, keeping friends, reading books, watching films, pursuing sports.64.
Thus, for instance, in Serbia, six most commonly mentioned activities – watching television, keeping friends, reading books, walking, sleeping/resting and pursuing sports – cover more than 60% of all answers (see Table 1A). Out of activities rep-resenting cultural participation in the narrower sense, apart from watching TV and reading books, there were mentioned listening to music, reading papers/magazines, watching films and practising a form of art.
edonia into four regions. Our division does not coincide with accepted administrative regional borders, but rather attempts to follow rooted cultural stereotypes. Naturally, this opens up the way for criticism, of which we are aware. Yet, we still decided to classify Serbia into a) Belgrade and surrounding towns and villages; b) Vojvodina; c) Šumadija and Pomoravlje; d) Sandžak and e) south and east Serbia. In Macedonia, this would be a) Skopje and small towns and villages sur-rounding it; b) south Macedonia; c) east Macedonia, and d) west Macedonia. 63 Coming from different age, education, profession, and ethnic groups.64 It is possible that these answers are given in very formal situations such as surveying, and that informal answers would provide a different set of responses. Yet, it is equally possible that in our everyday lives nothing spectacular actually happens.
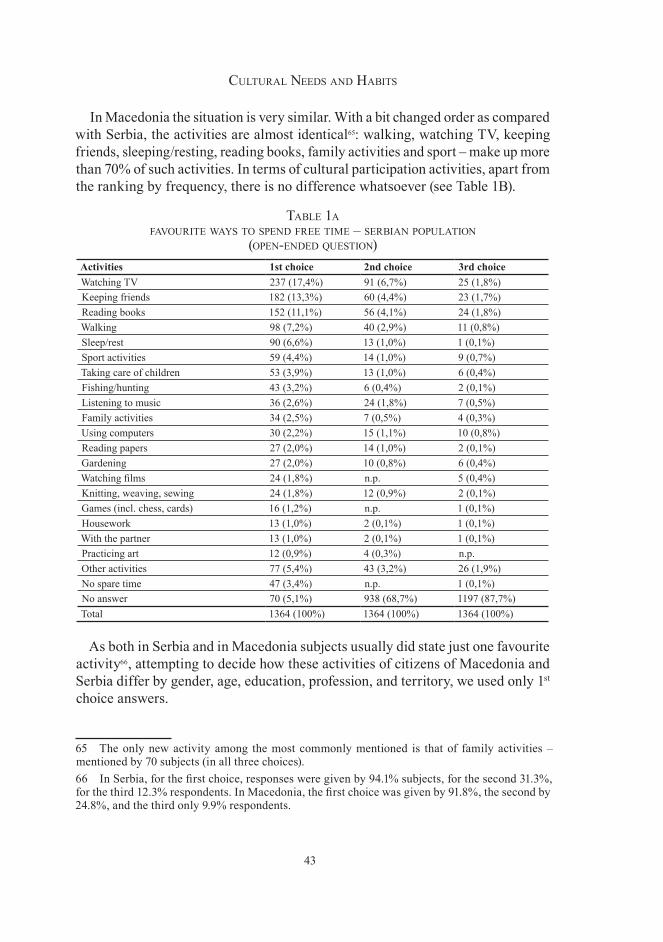
43
Cultural Needs aNd Habits
In Macedonia the situation is very similar. With a bit changed order as compared with Serbia, the activities are almost identical65: walking, watching TV, keeping friends, sleeping/resting, reading books, family activities and sport – make up more than 70% of such activities. In terms of cultural participation activities, apart from the ranking by frequency, there is no difference whatsoever (see Table 1B).
table 1a favourite ways to speNd free tiMe – serbiaN populatioN
(opeN-eNded questioN)Activities 1st choice 2nd choice 3rd choiceWatching TV 237 (17,4%) 91 (6,7%) 25 (1,8%)Keeping friends 182 (13,3%) 60 (4,4%) 23 (1,7%)Reading books 152 (11,1%) 56 (4,1%) 24 (1,8%)Walking 98 (7,2%) 40 (2,9%) 11 (0,8%)Sleep/rest 90 (6,6%) 13 (1,0%) 1 (0,1%)Sport activities 59 (4,4%) 14 (1,0%) 9 (0,7%)Taking care of children 53 (3,9%) 13 (1,0%) 6 (0,4%)Fishing/hunting 43 (3,2%) 6 (0,4%) 2 (0,1%)Listening to music 36 (2,6%) 24 (1,8%) 7 (0,5%)Family activities 34 (2,5%) 7 (0,5%) 4 (0,3%)Using computers 30 (2,2%) 15 (1,1%) 10 (0,8%)Reading papers 27 (2,0%) 14 (1,0%) 2 (0,1%)Gardening 27 (2,0%) 10 (0,8%) 6 (0,4%)Watching films 24 (1,8%) n.p. 5 (0,4%)Knitting, weaving, sewing 24 (1,8%) 12 (0,9%) 2 (0,1%)Games (incl. chess, cards) 16 (1,2%) n.p. 1 (0,1%)Housework 13 (1,0%) 2 (0,1%) 1 (0,1%)With the partner 13 (1,0%) 2 (0,1%) 1 (0,1%)Practicing art 12 (0,9%) 4 (0,3%) n.p.Other activities 77 (5,4%) 43 (3,2%) 26 (1,9%)No spare time 47 (3,4%) n.p. 1 (0,1%)No answer 70 (5,1%) 938 (68,7%) 1197 (87,7%)Total 1364 (100%) 1364 (100%) 1364 (100%)
As both in Serbia and in Macedonia subjects usually did state just one favourite activity66, attempting to decide how these activities of citizens of Macedonia and Serbia differ by gender, age, education, profession, and territory, we used only 1st choice answers.
65 The only new activity among the most commonly mentioned is that of family activities – mentioned by 70 subjects (in all three choices).66 In Serbia, for the first choice, responses were given by 94.1% subjects, for the second 31.3%, for the third 12.3% respondents. In Macedonia, the first choice was given by 91.8%, the second by 24.8%, and the third only 9.9% respondents.
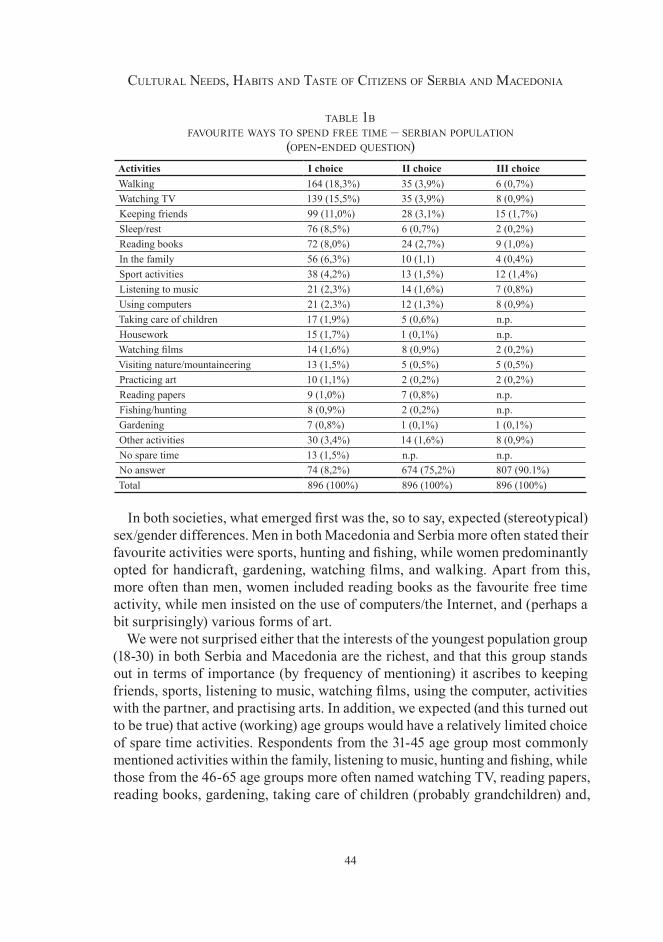
44
Cultural Needs, Habits aNd taste of CitizeNs of serbia aNd MaCedoNia
table 1b favourite ways to speNd free tiMe – serbiaN populatioN
(opeN-eNded questioN)Activities I choice II choice III choiceWalking 164 (18,3%) 35 (3,9%) 6 (0,7%)Watching TV 139 (15,5%) 35 (3,9%) 8 (0,9%)Keeping friends 99 (11,0%) 28 (3,1%) 15 (1,7%)Sleep/rest 76 (8,5%) 6 (0,7%) 2 (0,2%)Reading books 72 (8,0%) 24 (2,7%) 9 (1,0%)In the family 56 (6,3%) 10 (1,1) 4 (0,4%)Sport activities 38 (4,2%) 13 (1,5%) 12 (1,4%)Listening to music 21 (2,3%) 14 (1,6%) 7 (0,8%)Using computers 21 (2,3%) 12 (1,3%) 8 (0,9%)Taking care of children 17 (1,9%) 5 (0,6%) n.p.Housework 15 (1,7%) 1 (0,1%) n.p.Watching films 14 (1,6%) 8 (0,9%) 2 (0,2%)Visiting nature/mountaineering 13 (1,5%) 5 (0,5%) 5 (0,5%)Practicing art 10 (1,1%) 2 (0,2%) 2 (0,2%)Reading papers 9 (1,0%) 7 (0,8%) n.p.Fishing/hunting 8 (0,9%) 2 (0,2%) n.p. Gardening 7 (0,8%) 1 (0,1%) 1 (0,1%)Other activities 30 (3,4%) 14 (1,6%) 8 (0,9%)No spare time 13 (1,5%) n.p. n.p.No answer 74 (8,2%) 674 (75,2%) 807 (90.1%)Total 896 (100%) 896 (100%) 896 (100%)
In both societies, what emerged first was the, so to say, expected (stereotypical) sex/gender differences. Men in both Macedonia and Serbia more often stated their favourite activities were sports, hunting and fishing, while women predominantly opted for handicraft, gardening, watching films, and walking. Apart from this, more often than men, women included reading books as the favourite free time activity, while men insisted on the use of computers/the Internet, and (perhaps a bit surprisingly) various forms of art.
We were not surprised either that the interests of the youngest population group (18-30) in both Serbia and Macedonia are the richest, and that this group stands out in terms of importance (by frequency of mentioning) it ascribes to keeping friends, sports, listening to music, watching films, using the computer, activities with the partner, and practising arts. In addition, we expected (and this turned out to be true) that active (working) age groups would have a relatively limited choice of spare time activities. Respondents from the 31-45 age group most commonly mentioned activities within the family, listening to music, hunting and fishing, while those from the 46-65 age groups more often named watching TV, reading papers, reading books, gardening, taking care of children (probably grandchildren) and,
45
Cultural Needs aNd Habits
in Macedonia – mountaineering. It is interesting, and indeed logical with all the free time in mind, that participants older than 65 comprise a group second only to the youngest according to the multitude of activities listed as favourite, and also according to the frequency of mentioning. Naturally, these activities are a bit
“steadier” as compared to the youngest group – keeping friends, walking, watch-ing TV, reading the papers, handicraft, taking care of (grand)children, gardening, board games (including chess, cards, etc.).
In terms of the level of education, we classified subjects into three groups: those whose highest degree was that of an elementary school (the group included those who never attended or completed elementary school); those with secondary school diplomas (either vocational or general-purpose ‘gymnasium’) and those with col-lege degrees or above (university, specialist/master’s or doctoral degrees). It turned out that groups with elementary education more often reported watching TV as a favourite free time activity. They also picked out gardening and handicraft (in Serbia) and sleep/rest (in Macedonia). Typical favourite spare time activities of subjects with secondary school degrees include watching movies, listening to music, pursuing sports, while respondents with higher education more often report reading books, practising arts, and, in Macedonia, mountaineering, hunting and fishing.
As expected, a similar division emerged when the sample was viewed by oc-cupational groups. Out of three occupational groups67 [also see footnote 59) and nine job position groups68 [also see footnote 60], farmers, workers and supported individuals (pensioners, housewives, and the unemployed) most commonly re-port their favourite activity is watching TV and keeping friends. Sport activities, listening to music, reading papers, and watching films are favourite activities of middle-class professions (mostly civil servants), and also pupils and students. Experts, managers, and owners, however, more often stress reading books and practising an art.
There are no specific differences in terms of favourite activities of territorial groups (based on the size of the place and region of residence). Only in villages, in both Serbia and Macedonia, does one find a higher prevalence of activities within the family and sleep/rest (which is probably correlated with the strain caused by working the land).
Although statistical tests have shown that these differences are not only preva-lent in the sample, but also in the population (significance on the level p < 0,01), only when we set aside cultural participation activities in the narrower sense did
67 Groups based on occupation: a) farmers / workers; b) middle class professions; c) experts /Groups based on occupation: a) farmers / workers; b) middle class professions; c) experts /occupation: a) farmers / workers; b) middle class professions; c) experts /: a) farmers / workers; b) middle class professions; c) experts / managers / owners. 68 Groups based on job position: a) farmers; b) workers; c) clerks; d) junior executives; e) smallGroups based on job position: a) farmers; b) workers; c) clerks; d) junior executives; e) small business owners; f) experts; g) managers and owners; h) pupils and students; i) supported indi-viduals (pensioners, housewives and unemployed persons).
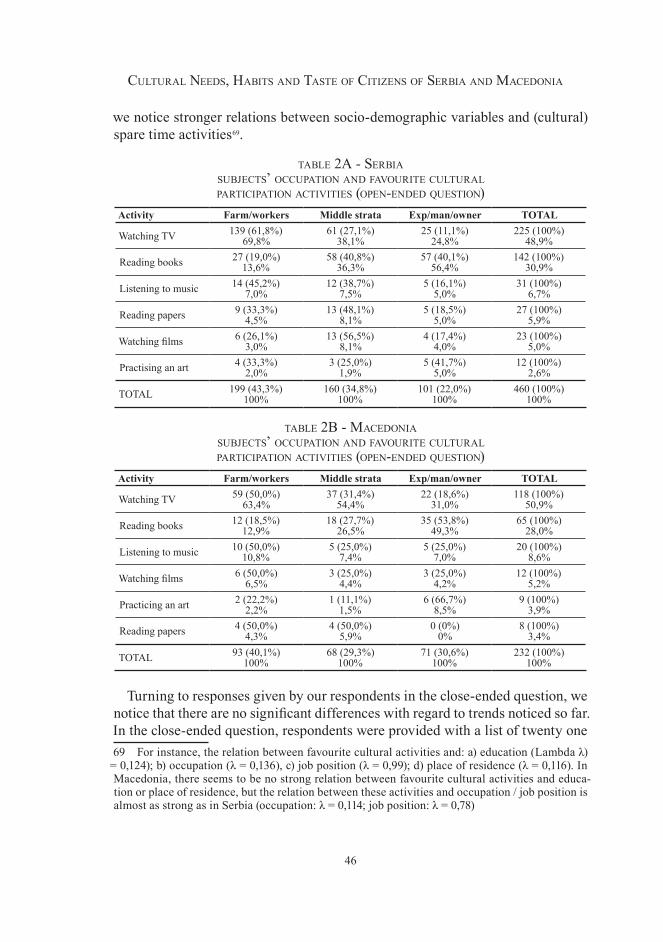
46
Cultural Needs, Habits aNd taste of CitizeNs of serbia aNd MaCedoNia
we notice stronger relations between socio-demographic variables and (cultural) spare time activities69.
table 2a - serbia subjeCts’ oCCupatioN aNd favourite Cultural partiCipatioN aCtivities (opeN-eNded questioN)
Activity Farm/workers Middle strata Exp/man/owner TOTAL
Watching TV 139 (61,8%)69,8%
61 (27,1%)38,1%
25 (11,1%)24,8%
225 (100%)48,9%
Reading books 27 (19,0%)13,6%
58 (40,8%)36,3%
57 (40,1%)56,4%
142 (100%)30,9%
Listening to music 14 (45,2%)7,0%
12 (38,7%)7,5%
5 (16,1%)5,0%
31 (100%)6,7%
Reading papers 9 (33,3%)4,5%
13 (48,1%)8,1%
5 (18,5%)5,0%
27 (100%)5,9%
Watching films 6 (26,1%)3,0%
13 (56,5%)8,1%
4 (17,4%)4,0%
23 (100%)5,0%
Practising an art 4 (33,3%)2,0%
3 (25,0%)1,9%
5 (41,7%)5,0%
12 (100%)2,6%
TOTAL 199 (43,3%)100%
160 (34,8%)100%
101 (22,0%)100%
460 (100%)100%
table 2b - MaCedoNia subjeCts’ oCCupatioN aNd favourite Cultural partiCipatioN aCtivities (opeN-eNded questioN)
Activity Farm/workers Middle strata Exp/man/owner TOTAL
Watching TV 59 (50,0%)63,4%
37 (31,4%)54,4%
22 (18,6%)31,0%
118 (100%)50,9%
Reading books 12 (18,5%)12,9%
18 (27,7%)26,5%
35 (53,8%)49,3%
65 (100%)28,0%
Listening to music 10 (50,0%)10,8%
5 (25,0%)7,4%
5 (25,0%)7,0%
20 (100%)8,6%
Watching films 6 (50,0%)6,5%
3 (25,0%)4,4%
3 (25,0%)4,2%
12 (100%)5,2%
Practicing an art 2 (22,2%)2,2%
1 (11,1%)1,5%
6 (66,7%)8,5%
9 (100%)3,9%
Reading papers 4 (50,0%)4,3%
4 (50,0%)5,9%
0 (0%)0%
8 (100%)3,4%
TOTAL 93 (40,1%)100%
68 (29,3%)100%
71 (30,6%)100%
232 (100%)100%
Turning to responses given by our respondents in the close-ended question, we notice that there are no significant differences with regard to trends noticed so far. In the close-ended question, respondents were provided with a list of twenty one 69 For instance, the relation between favourite cultural activities and: a) education (Lambda λ)
= 0,124); b) occupation (λ = 0,136), c) job position (λ = 0,99); d) place of residence (λ = 0,116). In Macedonia, there seems to be no strong relation between favourite cultural activities and educa-tion or place of residence, but the relation between these activities and occupation / job position is almost as strong as in Serbia (occupation: λ = 0,114; job position: λ = 0,78)
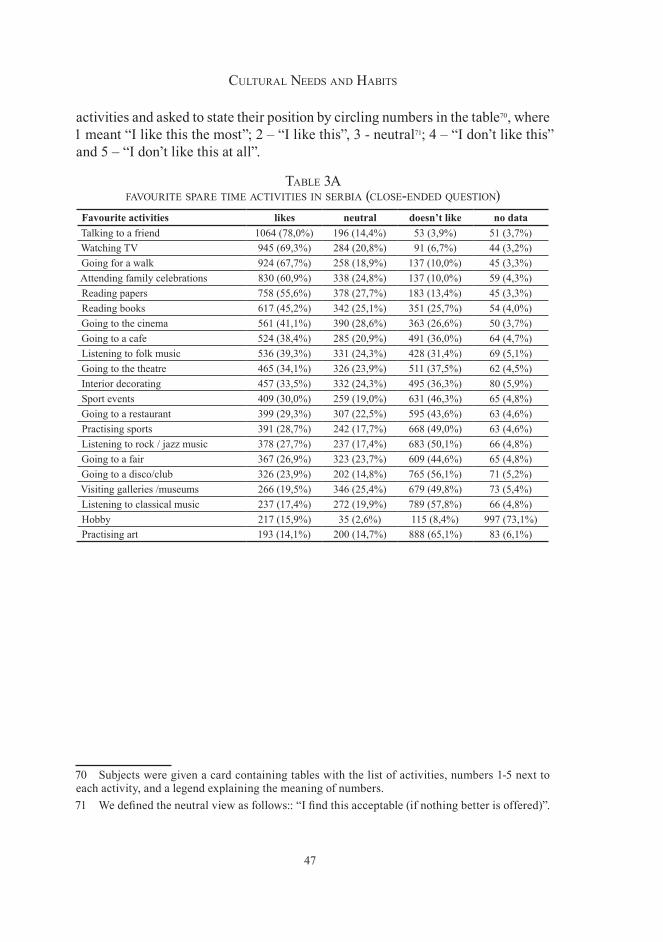
47
Cultural Needs aNd Habits
activities and asked to state their position by circling numbers in the table70, where 1 meant “I like this the most”; 2 – “I like this”, 3 - neutral71; 4 – “I don’t like this” and 5 – “I don’t like this at all”.
table �a favourite spare tiMe aCtivities iN serbia (Close-eNded questioN)
Favourite activities likes neutral doesn’t like no dataTalking to a friend 1064 (78,0%) 196 (14,4%) 53 (3,9%) 51 (3,7%)Watching TV 945 (69,3%) 284 (20,8%) 91 (6,7%) 44 (3,2%)Going for a walk 924 (67,7%) 258 (18,9%) 137 (10,0%) 45 (3,3%)Attending family celebrations 830 (60,9%) 338 (24,8%) 137 (10,0%) 59 (4,3%)Reading papers 758 (55,6%) 378 (27,7%) 183 (13,4%) 45 (3,3%)Reading books 617 (45,2%) 342 (25,1%) 351 (25,7%) 54 (4,0%)Going to the cinema 561 (41,1%) 390 (28,6%) 363 (26,6%) 50 (3,7%)Going to a cafe 524 (38,4%) 285 (20,9%) 491 (36,0%) 64 (4,7%)Listening to folk music 536 (39,3%) 331 (24,3%) 428 (31,4%) 69 (5,1%)Going to the theatre 465 (34,1%) 326 (23,9%) 511 (37,5%) 62 (4,5%)Interior decorating 457 (33,5%) 332 (24,3%) 495 (36,3%) 80 (5,9%)Sport events 409 (30,0%) 259 (19,0%) 631 (46,3%) 65 (4,8%)Going to a restaurant 399 (29,3%) 307 (22,5%) 595 (43,6%) 63 (4,6%)Practising sports 391 (28,7%) 242 (17,7%) 668 (49,0%) 63 (4,6%)Listening to rock / jazz music 378 (27,7%) 237 (17,4%) 683 (50,1%) 66 (4,8%)Going to a fair 367 (26,9%) 323 (23,7%) 609 (44,6%) 65 (4,8%)Going to a disco/club 326 (23,9%) 202 (14,8%) 765 (56,1%) 71 (5,2%)Visiting galleries /museums 266 (19,5%) 346 (25,4%) 679 (49,8%) 73 (5,4%)Listening to classical music 237 (17,4%) 272 (19,9%) 789 (57,8%) 66 (4,8%)Hobby 217 (15,9%) 35 (2,6%) 115 (8,4%) 997 (73,1%)Practising art 193 (14,1%) 200 (14,7%) 888 (65,1%) 83 (6,1%)
70 Subjects were given a card containing tables with the list of activities, numbers 1-5 next to each activity, and a legend explaining the meaning of numbers.71 We defined the neutral view as follows:: “I find this acceptable (if nothing better is offered)”.
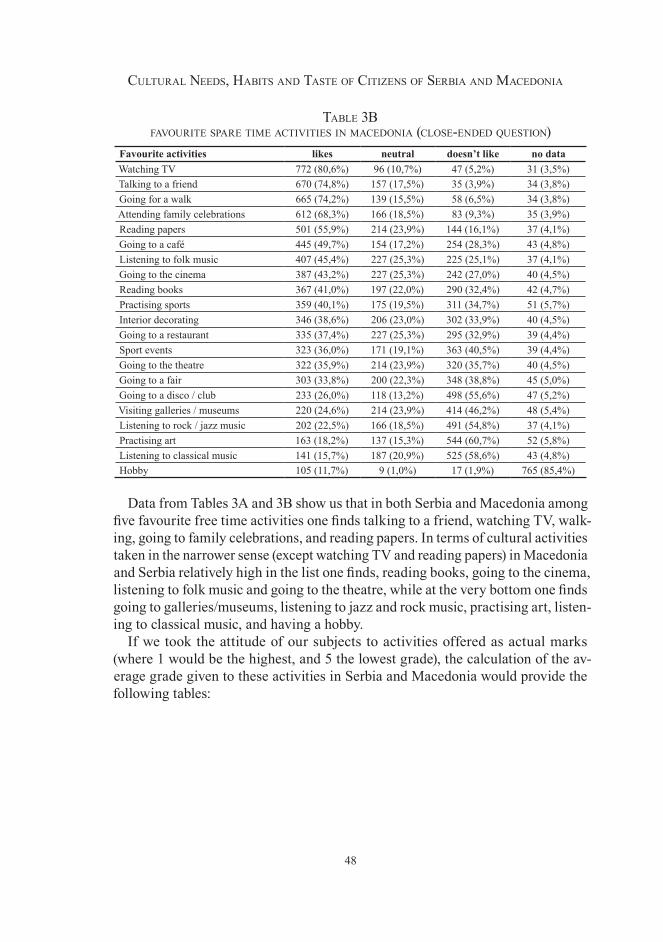
48
Cultural Needs, Habits aNd taste of CitizeNs of serbia aNd MaCedoNia
table �b favourite spare tiMe aCtivities iN MaCedoNia (Close-eNded questioN)
Favourite activities likes neutral doesn’t like no dataWatching TV 772 (80,6%) 96 (10,7%) 47 (5,2%) 31 (3,5%)Talking to a friend 670 (74,8%) 157 (17,5%) 35 (3,9%) 34 (3,8%)Going for a walk 665 (74,2%) 139 (15,5%) 58 (6,5%) 34 (3,8%)Attending family celebrations 612 (68,3%) 166 (18,5%) 83 (9,3%) 35 (3,9%)Reading papers 501 (55,9%) 214 (23,9%) 144 (16,1%) 37 (4,1%)Going to a café 445 (49,7%) 154 (17,2%) 254 (28,3%) 43 (4,8%)Listening to folk music 407 (45,4%) 227 (25,3%) 225 (25,1%) 37 (4,1%)Going to the cinema 387 (43,2%) 227 (25,3%) 242 (27,0%) 40 (4,5%)Reading books 367 (41,0%) 197 (22,0%) 290 (32,4%) 42 (4,7%)Practising sports 359 (40,1%) 175 (19,5%) 311 (34,7%) 51 (5,7%)Interior decorating 346 (38,6%) 206 (23,0%) 302 (33,9%) 40 (4,5%)Going to a restaurant 335 (37,4%) 227 (25,3%) 295 (32,9%) 39 (4,4%)Sport events 323 (36,0%) 171 (19,1%) 363 (40,5%) 39 (4,4%)Going to the theatre 322 (35,9%) 214 (23,9%) 320 (35,7%) 40 (4,5%)Going to a fair 303 (33,8%) 200 (22,3%) 348 (38,8%) 45 (5,0%)Going to a disco / club 233 (26,0%) 118 (13,2%) 498 (55,6%) 47 (5,2%)Visiting galleries / museums 220 (24,6%) 214 (23,9%) 414 (46,2%) 48 (5,4%)Listening to rock / jazz music 202 (22,5%) 166 (18,5%) 491 (54,8%) 37 (4,1%)Practising art 163 (18,2%) 137 (15,3%) 544 (60,7%) 52 (5,8%)Listening to classical music 141 (15,7%) 187 (20,9%) 525 (58,6%) 43 (4,8%)Hobby 105 (11,7%) 9 (1,0%) 17 (1,9%) 765 (85,4%)
Data from Tables 3A and 3B show us that in both Serbia and Macedonia among five favourite free time activities one finds talking to a friend, watching TV, walk-ing, going to family celebrations, and reading papers. In terms of cultural activities taken in the narrower sense (except watching TV and reading papers) in Macedonia and Serbia relatively high in the list one finds, reading books, going to the cinema, listening to folk music and going to the theatre, while at the very bottom one finds going to galleries/museums, listening to jazz and rock music, practising art, listen-ing to classical music, and having a hobby.
If we took the attitude of our subjects to activities offered as actual marks (where 1 would be the highest, and 5 the lowest grade), the calculation of the av-erage grade given to these activities in Serbia and Macedonia would provide the following tables:
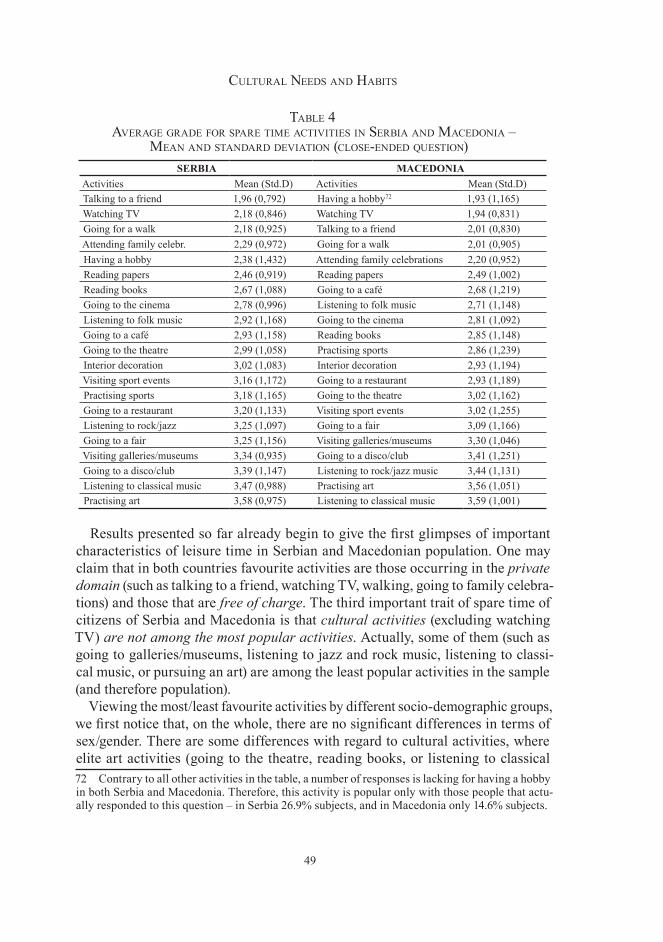
49
Cultural Needs aNd Habits
table 4 average grade for spare tiMe aCtivities iN serbia aNd MaCedoNia –
MeaN aNd staNdard deviatioN (Close-eNded questioN)SERBIA MACEDONIA
Activities Mean (Std.D) Activities Mean (Std.D)Talking to a friend 1,96 (0,792) Having a hobby72 1,93 (1,165)Watching TV 2,18 (0,846) Watching TV 1,94 (0,831)Going for a walk 2,18 (0,925) Talking to a friend 2,01 (0,830)Attending family celebr. 2,29 (0,972) Going for a walk 2,01 (0,905)Having a hobby 2,38 (1,432) Attending family celebrations 2,20 (0,952)Reading papers 2,46 (0,919) Reading papers 2,49 (1,002)Reading books 2,67 (1,088) Going to a café 2,68 (1,219)Going to the cinema 2,78 (0,996) Listening to folk music 2,71 (1,148)Listening to folk music 2,92 (1,168) Going to the cinema 2,81 (1,092)Going to a café 2,93 (1,158) Reading books 2,85 (1,148)Going to the theatre 2,99 (1,058) Practising sports 2,86 (1,239)Interior decoration 3,02 (1,083) Interior decoration 2,93 (1,194)Visiting sport events 3,16 (1,172) Going to a restaurant 2,93 (1,189)Practising sports 3,18 (1,165) Going to the theatre 3,02 (1,162) Going to a restaurant 3,20 (1,133) Visiting sport events 3,02 (1,255)Listening to rock/jazz 3,25 (1,097) Going to a fair 3,09 (1,166)Going to a fair 3,25 (1,156) Visiting galleries/museums 3,30 (1,046)Visiting galleries/museums 3,34 (0,935) Going to a disco/club 3,41 (1,251)Going to a disco/club 3,39 (1,147) Listening to rock/jazz music 3,44 (1,131)Listening to classical music 3,47 (0,988) Practising art 3,56 (1,051)Practising art 3,58 (0,975) Listening to classical music 3,59 (1,001)
Results presented so far already begin to give the first glimpses of important characteristics of leisure time in Serbian and Macedonian population. One may claim that in both countries favourite activities are those occurring in the private domain (such as talking to a friend, watching TV, walking, going to family celebra-tions) and those that are free of charge. The third important trait of spare time of citizens of Serbia and Macedonia is that cultural activities (excluding watching TV) are not among the most popular activities. Actually, some of them (such as going to galleries/museums, listening to jazz and rock music, listening to classi-cal music, or pursuing an art) are among the least popular activities in the sample (and therefore population).
Viewing the most/least favourite activities by different socio-demographic groups, we first notice that, on the whole, there are no significant differences in terms of sex/gender. There are some differences with regard to cultural activities, where elite art activities (going to the theatre, reading books, or listening to classical 72 Contrary to all other activities in the table, a number of responses is lacking for having a hobby in both Serbia and Macedonia. Therefore, this activity is popular only with those people that actu-ally responded to this question – in Serbia 26.9% subjects, and in Macedonia only 14.6% subjects.
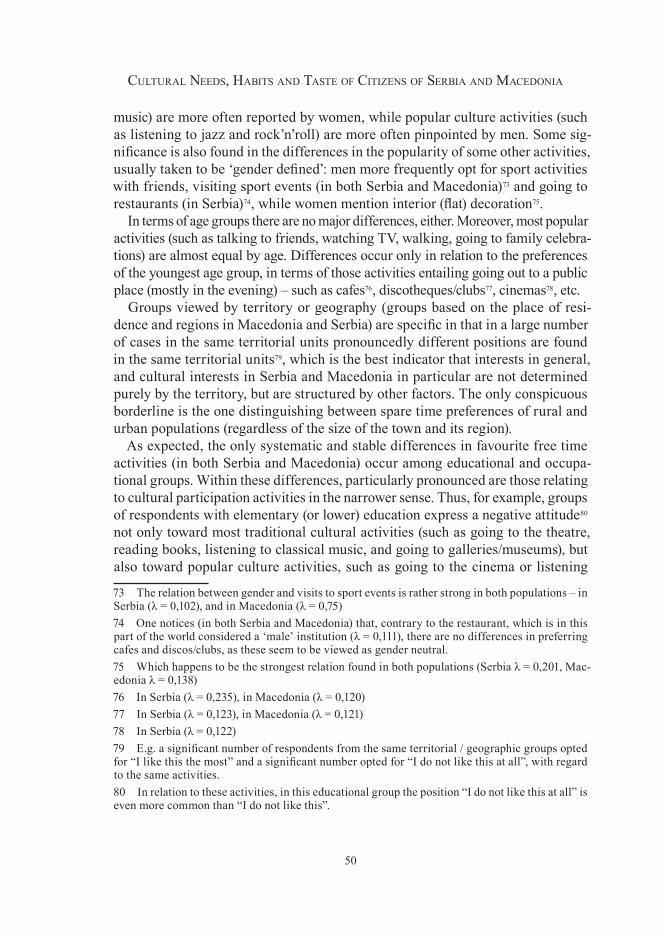
50
Cultural Needs, Habits aNd taste of CitizeNs of serbia aNd MaCedoNia
music) are more often reported by women, while popular culture activities (such as listening to jazz and rock’n’roll) are more often pinpointed by men. Some sig-nificance is also found in the differences in the popularity of some other activities, usually taken to be ‘gender defined’: men more frequently opt for sport activities with friends, visiting sport events (in both Serbia and Macedonia)73 and going to restaurants (in Serbia)74, while women mention interior (flat) decoration75.
In terms of age groups there are no major differences, either. Moreover, most popular activities (such as talking to friends, watching TV, walking, going to family celebra-tions) are almost equal by age. Differences occur only in relation to the preferences of the youngest age group, in terms of those activities entailing going out to a public place (mostly in the evening) – such as cafes76, discotheques/clubs77, cinemas78, etc.
Groups viewed by territory or geography (groups based on the place of resi-dence and regions in Macedonia and Serbia) are specific in that in a large number of cases in the same territorial units pronouncedly different positions are found in the same territorial units79, which is the best indicator that interests in general, and cultural interests in Serbia and Macedonia in particular are not determined purely by the territory, but are structured by other factors. The only conspicuous borderline is the one distinguishing between spare time preferences of rural and urban populations (regardless of the size of the town and its region).
As expected, the only systematic and stable differences in favourite free time activities (in both Serbia and Macedonia) occur among educational and occupa-tional groups. Within these differences, particularly pronounced are those relating to cultural participation activities in the narrower sense. Thus, for example, groups of respondents with elementary (or lower) education express a negative attitude80 not only toward most traditional cultural activities (such as going to the theatre, reading books, listening to classical music, and going to galleries/museums), but also toward popular culture activities, such as going to the cinema or listening
73 The relation between gender and visits to sport events is rather strong in both populations – in Serbia (λ = 0,102), and in Macedonia (λ = 0,75)74 One notices (in both Serbia and Macedonia) that, contrary to the restaurant, which is in this part of the world considered a ‘male’ institution (λ = 0,111), there are no differences in preferring cafes and discos/clubs, as these seem to be viewed as gender neutral. 75 Which happens to be the strongest relation found in both populations (Serbia λ = 0,201, Mac-edonia λ = 0,138)76 In Serbia (λ = 0,235), in Macedonia (λ = 0,120)77 In Serbia (λ = 0,123), in Macedonia (λ = 0,121)78 In Serbia (λ = 0,122)79 E.g. a significant number of respondents from the same territorial / geographic groups opted for “I like this the most” and a significant number opted for “I do not like this at all”, with regard to the same activities.80 In relation to these activities, in this educational group the position “I do not like this at all” is even more common than “I do not like this”.
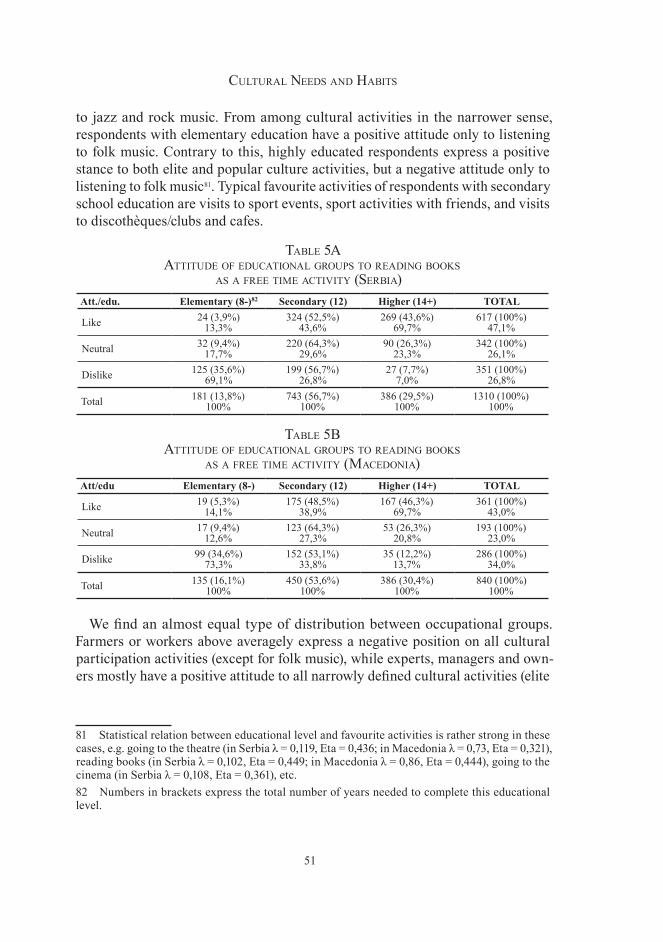
51
Cultural Needs aNd Habits
to jazz and rock music. From among cultural activities in the narrower sense, respondents with elementary education have a positive attitude only to listening to folk music. Contrary to this, highly educated respondents express a positive stance to both elite and popular culture activities, but a negative attitude only to listening to folk music81. Typical favourite activities of respondents with secondary school education are visits to sport events, sport activities with friends, and visits to discothèques/clubs and cafes.
table 5a attitude of eduCatioNal groups to readiNg books
as a free tiMe aCtivity (serbia)Att./edu. Elementary (8-)82 Secondary (12) Higher (14+) TOTAL
Like 24 (3,9%)13,3%
324 (52,5%)43,6%
269 (43,6%)69,7%
617 (100%)47,1%
Neutral 32 (9,4%)17,7%
220 (64,3%)29,6%
90 (26,3%)23,3%
342 (100%)26,1%
Dislike 125 (35,6%)69,1%
199 (56,7%)26,8%
27 (7,7%)7,0%
351 (100%)26,8%
Total 181 (13,8%)100%
743 (56,7%)100%
386 (29,5%)100%
1310 (100%)100%
table 5b attitude of eduCatioNal groups to readiNg books
as a free tiMe aCtivity (MaCedoNia)Att/edu Elementary (8-) Secondary (12) Higher (14+) TOTAL
Like 19 (5,3%)14,1%
175 (48,5%)38,9%
167 (46,3%)69,7%
361 (100%)43,0%
Neutral 17 (9,4%)12,6%
123 (64,3%)27,3%
53 (26,3%)20,8%
193 (100%)23,0%
Dislike 99 (34,6%)73,3%
152 (53,1%)33,8%
35 (12,2%)13,7%
286 (100%)34,0%
Total 135 (16,1%)100%
450 (53,6%)100%
386 (30,4%)100%
840 (100%)100%
We find an almost equal type of distribution between occupational groups. Farmers or workers above averagely express a negative position on all cultural participation activities (except for folk music), while experts, managers and own-ers mostly have a positive attitude to all narrowly defined cultural activities (elite
81 Statistical relation between educational level and favourite activities is rather strong in these cases, e.g. going to the theatre (in Serbia λ = 0,119, Eta = 0,436; in Macedonia λ = 0,73, Eta = 0,321), reading books (in Serbia λ = 0,102, Eta = 0,449; in Macedonia λ = 0,86, Eta = 0,444), going to the cinema (in Serbia λ = 0,108, Eta = 0,361), etc. 82 Numbers in brackets express the total number of years needed to complete this educational level.
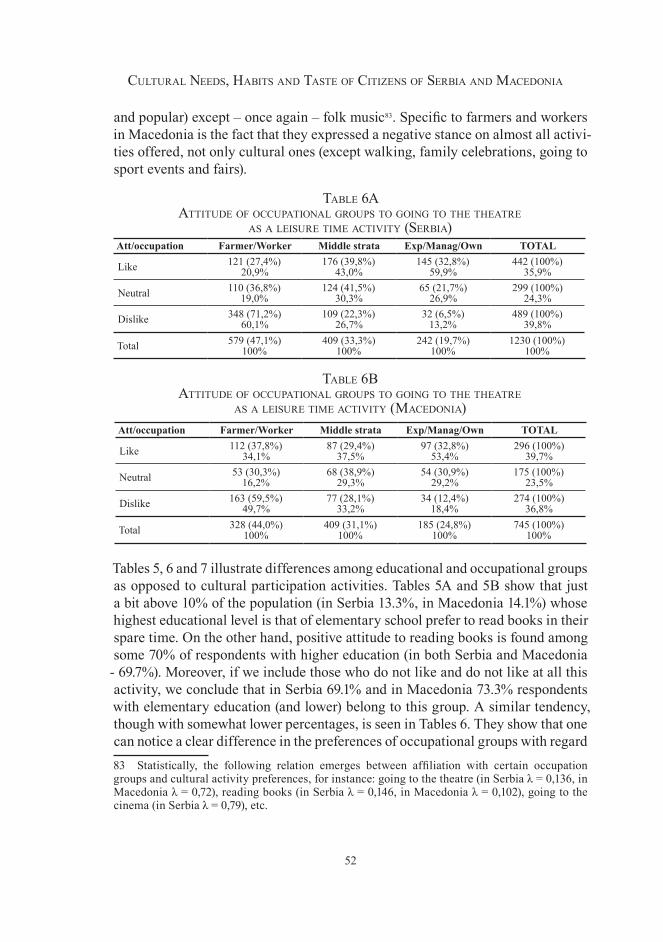
52
Cultural Needs, Habits aNd taste of CitizeNs of serbia aNd MaCedoNia
and popular) except – once again – folk music83. Specific to farmers and workers in Macedonia is the fact that they expressed a negative stance on almost all activi-ties offered, not only cultural ones (except walking, family celebrations, going to sport events and fairs).
table 6a attitude of oCCupatioNal groups to goiNg to tHe tHeatre
as a leisure tiMe aCtivity (serbia)Att/occupation Farmer/Worker Middle strata Exp/Manag/Own TOTAL
Like 121 (27,4%)20,9%
176 (39,8%)43,0%
145 (32,8%)59,9%
442 (100%)35,9%
Neutral 110 (36,8%)19,0%
124 (41,5%)30,3%
65 (21,7%)26,9%
299 (100%)24,3%
Dislike 348 (71,2%)60,1%
109 (22,3%)26,7%
32 (6,5%)13,2%
489 (100%)39,8%
Total 579 (47,1%)100%
409 (33,3%)100%
242 (19,7%)100%
1230 (100%)100%
table 6b attitude of oCCupatioNal groups to goiNg to tHe tHeatre
as a leisure tiMe aCtivity (MaCedoNia)Att/occupation Farmer/Worker Middle strata Exp/Manag/Own TOTAL
Like 112 (37,8%)34,1%
87 (29,4%)37,5%
97 (32,8%)53,4%
296 (100%)39,7%
Neutral 53 (30,3%)16,2%
68 (38,9%)29,3%
54 (30,9%)29,2%
175 (100%)23,5%
Dislike 163 (59,5%)49,7%
77 (28,1%)33,2%
34 (12,4%)18,4%
274 (100%)36,8%
Total 328 (44,0%)100%
409 (31,1%)100%
185 (24,8%)100%
745 (100%)100%
Tables 5, 6 and 7 illustrate differences among educational and occupational groups as opposed to cultural participation activities. Tables 5A and 5B show that just a bit above 10% of the population (in Serbia 13.3%, in Macedonia 14.1%) whose highest educational level is that of elementary school prefer to read books in their spare time. On the other hand, positive attitude to reading books is found among some 70% of respondents with higher education (in both Serbia and Macedonia
- 69.7%). Moreover, if we include those who do not like and do not like at all this activity, we conclude that in Serbia 69.1% and in Macedonia 73.3% respondents with elementary education (and lower) belong to this group. A similar tendency, though with somewhat lower percentages, is seen in Tables 6. They show that one can notice a clear difference in the preferences of occupational groups with regard 83 Statistically, the following relation emerges between affiliation with certain occupation groups and cultural activity preferences, for instance: going to the theatre (in Serbia λ = 0,136, in Macedonia λ = 0,72), reading books (in Serbia λ = 0,146, in Macedonia λ = 0,102), going to the cinema (in Serbia λ = 0,79), etc.
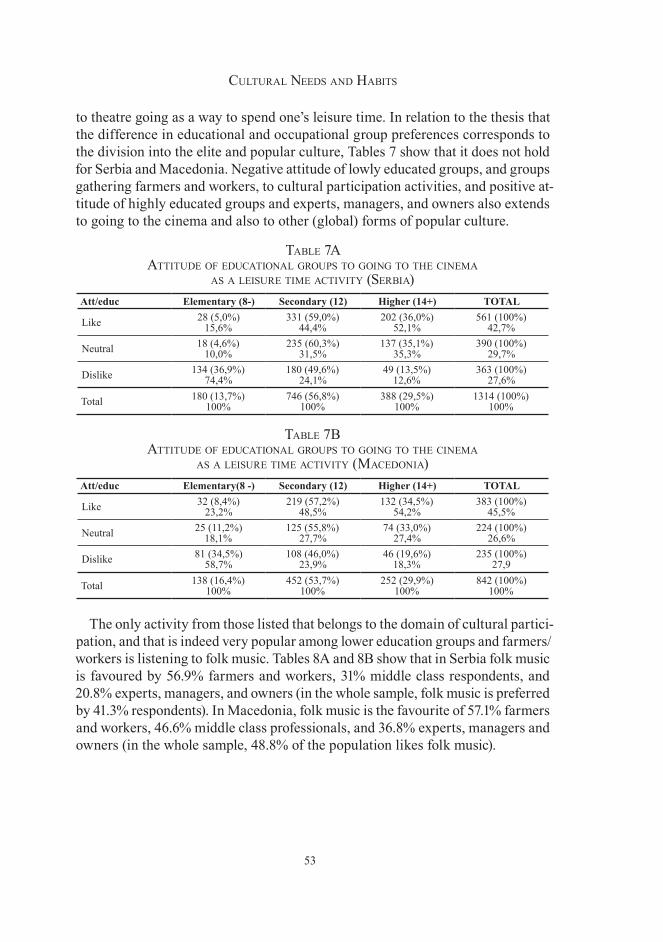
53
Cultural Needs aNd Habits
to theatre going as a way to spend one’s leisure time. In relation to the thesis that the difference in educational and occupational group preferences corresponds to the division into the elite and popular culture, Tables 7 show that it does not hold for Serbia and Macedonia. Negative attitude of lowly educated groups, and groups gathering farmers and workers, to cultural participation activities, and positive at-titude of highly educated groups and experts, managers, and owners also extends to going to the cinema and also to other (global) forms of popular culture.
table 7a attitude of eduCatioNal groups to goiNg to tHe CiNeMa
as a leisure tiMe aCtivity (serbia)Att/educ Elementary (8-) Secondary (12) Higher (14+) TOTAL
Like 28 (5,0%)15,6%
331 (59,0%)44,4%
202 (36,0%)52,1%
561 (100%)42,7%
Neutral 18 (4,6%)10,0%
235 (60,3%)31,5%
137 (35,1%)35,3%
390 (100%)29,7%
Dislike 134 (36,9%)74,4%
180 (49,6%)24,1%
49 (13,5%)12,6%
363 (100%)27,6%
Total 180 (13,7%)100%
746 (56,8%)100%
388 (29,5%)100%
1314 (100%)100%
table 7b attitude of eduCatioNal groups to goiNg to tHe CiNeMa
as a leisure tiMe aCtivity (MaCedoNia)Att/educ Elementary(8 -) Secondary (12) Higher (14+) TOTAL
Like 32 (8,4%)23,2%
219 (57,2%)48,5%
132 (34,5%)54,2%
383 (100%)45,5%
Neutral 25 (11,2%)18,1%
125 (55,8%)27,7%
74 (33,0%)27,4%
224 (100%)26,6%
Dislike 81 (34,5%)58,7%
108 (46,0%)23,9%
46 (19,6%)18,3%
235 (100%)27,9
Total 138 (16,4%)100%
452 (53,7%)100%
252 (29,9%)100%
842 (100%)100%
The only activity from those listed that belongs to the domain of cultural partici-pation, and that is indeed very popular among lower education groups and farmers/ workers is listening to folk music. Tables 8A and 8B show that in Serbia folk music is favoured by 56.9% farmers and workers, 31% middle class respondents, and 20.8% experts, managers, and owners (in the whole sample, folk music is preferred by 41.3% respondents). In Macedonia, folk music is the favourite of 57.1% farmers and workers, 46.6% middle class professionals, and 36.8% experts, managers and owners (in the whole sample, 48.8% of the population likes folk music).
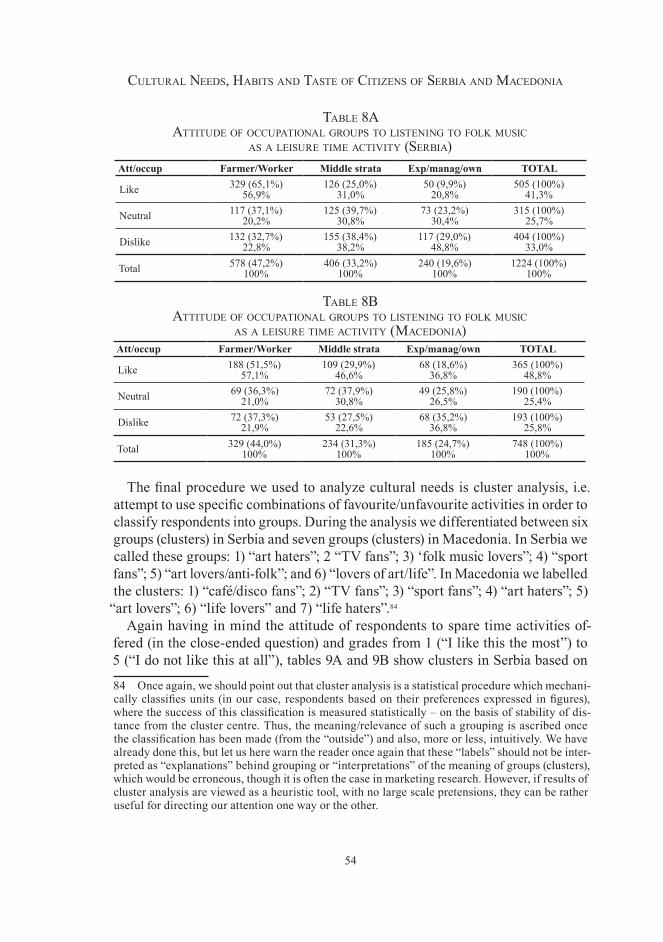
54
Cultural Needs, Habits aNd taste of CitizeNs of serbia aNd MaCedoNia
table 8a attitude of oCCupatioNal groups to listeNiNg to folk MusiC
as a leisure tiMe aCtivity (serbia)Att/occup Farmer/Worker Middle strata Exp/manag/own TOTAL
Like 329 (65,1%)56,9%
126 (25,0%)31,0%
50 (9,9%)20,8%
505 (100%)41,3%
Neutral 117 (37,1%)20,2%
125 (39,7%)30,8%
73 (23,2%)30,4%
315 (100%)25,7%
Dislike 132 (32,7%)22,8%
155 (38,4%)38,2%
117 (29,0%)48,8%
404 (100%)33,0%
Total 578 (47,2%)100%
406 (33,2%)100%
240 (19,6%)100%
1224 (100%)100%
table 8b attitude of oCCupatioNal groups to listeNiNg to folk MusiC
as a leisure tiMe aCtivity (MaCedoNia)Att/occup Farmer/Worker Middle strata Exp/manag/own TOTAL
Like 188 (51,5%)57,1%
109 (29,9%)46,6%
68 (18,6%)36,8%
365 (100%)48,8%
Neutral 69 (36,3%)21,0%
72 (37,9%)30,8%
49 (25,8%)26,5%
190 (100%)25,4%
Dislike 72 (37,3%)21,9%
53 (27,5%)22,6%
68 (35,2%)36,8%
193 (100%)25,8%
Total 329 (44,0%)100%
234 (31,3%)100%
185 (24,7%)100%
748 (100%)100%
The final procedure we used to analyze cultural needs is cluster analysis, i.e. attempt to use specific combinations of favourite/unfavourite activities in order to classify respondents into groups. During the analysis we differentiated between six groups (clusters) in Serbia and seven groups (clusters) in Macedonia. In Serbia we called these groups: 1) “art haters”; 2 “TV fans”; 3) ‘folk music lovers”; 4) “sport fans”; 5) “art lovers/anti-folk”; and 6) “lovers of art/life”. In Macedonia we labelled the clusters: 1) “café/disco fans”; 2) “TV fans”; 3) “sport fans”; 4) “art haters”; 5)
“art lovers”; 6) “life lovers” and 7) “life haters”.84 Again having in mind the attitude of respondents to spare time activities of-
fered (in the close-ended question) and grades from 1 (“I like this the most”) to 5 (“I do not like this at all”), tables 9A and 9B show clusters in Serbia based on
84 Once again, we should point out that cluster analysis is a statistical procedure which mechani-cally classifies units (in our case, respondents based on their preferences expressed in figures), where the success of this classification is measured statistically – on the basis of stability of dis-tance from the cluster centre. Thus, the meaning/relevance of such a grouping is ascribed once the classification has been made (from the “outside”) and also, more or less, intuitively. We have already done this, but let us here warn the reader once again that these “labels” should not be inter-preted as “explanations” behind grouping or “interpretations” of the meaning of groups (clusters), which would be erroneous, though it is often the case in marketing research. However, if results of cluster analysis are viewed as a heuristic tool, with no large scale pretensions, they can be rather useful for directing our attention one way or the other.
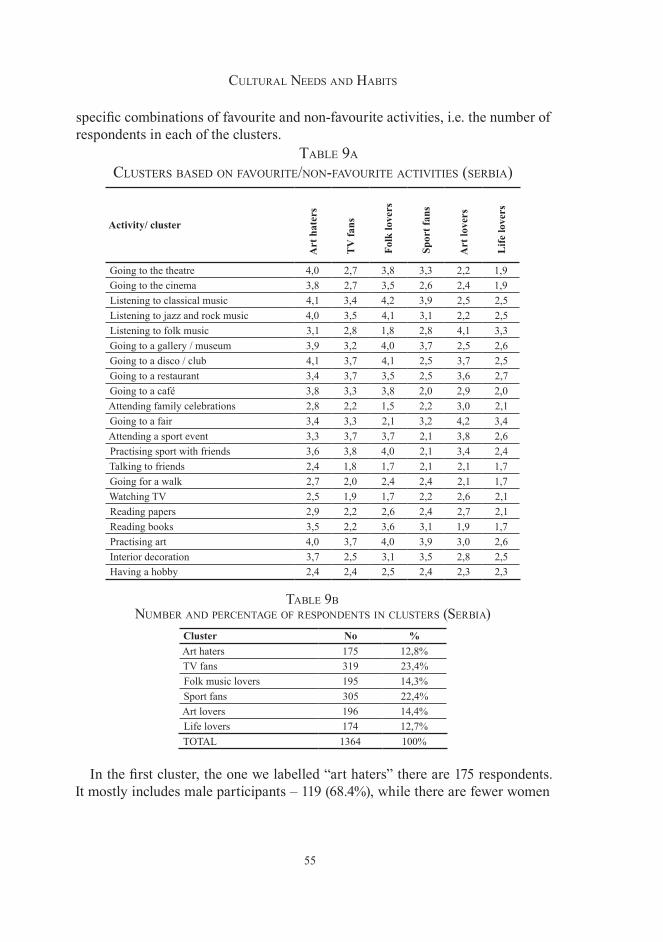
55
Cultural Needs aNd Habits
specific combinations of favourite and non-favourite activities, i.e. the number of respondents in each of the clusters.
table 9a Clusters based oN favourite/NoN-favourite aCtivities (serbia)
Activity/ cluster
Art
hat
ers
TV
fans
Folk
love
rs
Spor
t fan
s
Art
love
rs
Life
love
rs
Going to the theatre 4,0 2,7 �,8 �,� 2,2 1,9Going to the cinema �,8 2,7 �,5 2,6 2,4 1,9Listening to classical music 4,1 �,4 4,2 �,9 2,5 2,5Listening to jazz and rock music 4,0 �,5 4,1 �,1 2,2 2,5Listening to folk music �,1 2,8 1,8 2,8 4,1 �,�Going to a gallery / museum �,9 �,2 4,0 �,7 2,5 2,6Going to a disco / club 4,1 �,7 4,1 2,5 �,7 2,5Going to a restaurant �,4 �,7 �,5 2,5 �,6 2,7Going to a café �,8 �,� �,8 2,0 2,9 2,0Attending family celebrations 2,8 2,2 1,5 2,2 �,0 2,1Going to a fair �,4 �,� 2,1 �,2 4,2 �,4Attending a sport event �,� �,7 �,7 2,1 �,8 2,6Practising sport with friends �,6 �,8 4,0 2,1 �,4 2,4Talking to friends 2,4 1,8 1,7 2,1 2,1 1,7Going for a walk 2,7 2,0 2,4 2,4 2,1 1,7Watching TV 2,5 1,9 1,7 2,2 2,6 2,1Reading papers 2,9 2,2 2,6 2,4 2,7 2,1Reading books �,5 2,2 �,6 �,1 1,9 1,7Practising art 4,0 �,7 4,0 �,9 �,0 2,6Interior decoration �,7 2,5 �,1 �,5 2,8 2,5Having a hobby 2,4 2,4 2,5 2,4 2,� 2,�
table 9b NuMber aNd perCeNtage of respoNdeNts iN Clusters (serbia)
Cluster No %Art haters 175 12,8%TV fans 319 23,4%Folk music lovers 195 14,3%Sport fans 305 22,4%Art lovers 196 14,4%Life lovers 174 12,7%TOTAL 1364 100%
In the first cluster, the one we labelled “art haters” there are 175 respondents. It mostly includes male participants – 119 (68.4%), while there are fewer women
56
Cultural Needs, Habits aNd taste of CitizeNs of serbia aNd MaCedoNia
(54, or 31%).85 The average age of these respondents is 52. They mostly include persons with a secondary school diploma (53.7%), while the rest is mainly made up of participants with elementary education (31.4%). Most belong to the group we labelled ‘supported individuals’ (housewives, unemployed and retired – 43.3%), while additional 39% of this group are farmers and workers (altogether, they com-prise 82.3% of the cluster). They mostly live in Serbian countryside (42.3%) and in towns populated by less than 100,000 (41.7%). As for regions, more than two thirds of respondents from this cluster live in Šumadija and Pomoravlje (36.6%) and south and east Serbia (30.9%). Their most favourite leisure activities are talk-ing to friends (2.3886), watching television (2.53), walking (2.69), reading papers (2.91), while their least favourite activities are listening to classical music (4.09), practising an art (4.02), listening to jazz and rock music (4.00), going to the theatre (3.96), going to a gallery/museum (3.96) and going to the cinema (3.79) – which helped us give the cluster its label.
The second cluster “TV fans” mostly gathers women – out of 319 respondents, 254 are women (79.6%). The average age of respondents from this cluster is 45, but they are evenly distributed by age groups (with a bit fewer persons in the oldest group – that of over 65). Most respondents have secondary school degrees (191 or 59.9%), but there are quite a few persons with college or university diplomas (102 or 32%). As most of them are supported individuals (121 or 45.2%), and women, while there are the fewest such persons in the oldest age group, it is very likely that this group primarily consists of housewives. Almost a half of this group (143 respondents or 44.8%) lives in towns with fewer than 100,000 inhabitants, and this is mostly the case in Vojvodina (30.4%) and smaller towns surrounding Belgrade (28.8%). Favourite spare time activities of members of this cluster are watching TV (1.94), talking to friends (1.83) and going for a walk (1.95)87, while least favourite are going to a disco/club (3.73), pursuing sports with friends (3.77), going to a sport event (3.69), going to a restaurant (3.67), practising an art from (3.67) and listening to jazz and rock music (3.55).
More than 80% of the third cluster, the one we called “folk music lovers” com-prises supported individuals (50.3%) and farmers and workers (30.3%), while more
85 There were no data on sex for two respondents. In all other cases, too, in which the sum does not equal 100%, this is because some of the data were lacking.86 In brackets one finds average grades (means) of preferences expressed by numbers 1 through 5, where 1 meant “I like this the most”, 2 – “I like this” , 3 – neutral, 4 – “I don’t like this” and 5 – “I don’t like this at all”. Accordingly, the closer the average grade was to one, the more positive were the attitudes of subjects to this activity, and the other way round – the closer to grade 5, the more negative the attitude. 87 Activities such as talking to friends and going for a walk turned out to be the most popular and popular in all respondent groups, and thus not discriminative – this is why we decided to form this group in accordance with the high score that watching TV has among respondents from this cluster.
57
Cultural Needs aNd Habits
than a half come from Serbian villages (54.4%). The cluster gathered a total of 195 respondents. Again, this group hosts a majority of women (62% women : 38% men). The average age of the subjects in this cluster is 53. As for regions in Serbia, members of this group are evenly distributed across Šumadija and Pomoravlje, south and east Serbia and Vojvodina. Their least favourite free time activities are listening to classical music (4.17), listening to jazz and rock music (4.11), going to a disco/club (4.09) and practising an art (4.01). Their most favourite activities, on the other hand, are visiting family celebrations (1.54), going to a friend and talking (1.73), watching TV (1.75) and listening to folk music (1.83), which was not high in the list of priorities in the previous two groups with similar preferences, and was therefore taken as a distinctive factor in this cluster.
The fourth cluster was labelled “sport fans”. This group predominantly gathers men – out of 305 respondents there is a total of 240 men (78.7%) and 65 women (21.3%). Participants from this group are significantly younger than respondents from the previous three clusters. Their average age is 32 and more than a half (53.8%) belong to the 18-30 age group. Three quarters of these respondents have received secondary education (76.1%), and they are evenly distributed into farmers and workers (32.1%), middle class professions (25.7%), and supported individu-als (23.9%). As these are mainly younger males, the unemployed are most likely dominant in the group. Seventy percent of these respondents live in towns of fewer than 100,000 citizens and villages, and they are most commonly found in Šumadija and Pomoravlje and Vojvodina. Their most favourite spare time activities are go-ing to a café (2.04), going to a friend for a conversation (2.06), practising sport with friends (2.08), going to a sport event (2.11), and going to family celebrations (2.18). The least favourite activities are practising an art (3.93), listening to classi-cal music (3.86), going to a gallery/museum (3.68), going to the theatre (3.29) and reading books (3.1).
We labelled the fifth cluster “art lovers/ anti-folk music” because their favourite free time activities are reading books (1.94), listening to jazz and rock music (2.16), going to the theatre (2.24) and going to the movies (2.42)88, and their least favour-ite such activities, also distinctive for the group, are going to the fair (4.19) and listening to folk music (4.07). About two thirds of this cluster are women (65.3%), while the average age of respondents is 41. A vast majority of respondents from the cluster is highly educated (60.2%) with only three respondents from the group (1.5%) with only elementary education. The group mostly gathers experts, middle class professions, and pupils/students, where most live in Belgrade and smaller towns in Vojvodina. The cluster gathers a total of 196 respondents.
Respondents assigned to the sixth cluster share attitude to art with respondents from the previous cluster, but they do not shun going to discotheques, cafes, sport
88 In addition to talking with friends (2.10) and going for a walk (2.11), present in all groups.
58
Cultural Needs, Habits aNd taste of CitizeNs of serbia aNd MaCedoNia
events and family celebrations. Additionally, negative attitude to folk music is not so prominent in this group. Perhaps the most distinctive of the features of this cluster is exactly the positive attitude that respondents show to most activities listed in this question. Since preferring artistic activities in spare time is even more pronounced here than in the group of respondents from the fifth cluster, we labelled this cluster “art/life lovers” (omnivors). Their favourite activities are read-ing books (1.73), going to the cinema (1.76), going to the theatre (1.94), listening to jazz and rock music (2.49), listening to classical music (2.51), but also going to a café (2.02), attending family celebrations (2.13), practising sport with friends (2.45), going to sport events (2.58) and going to disco/clubs (2.52). As expected, most of the 174 respondents from this cluster are from the younger groups – 18 to 30 (41.4%) and 31-45 (35.6%). The average age of these respondents is 36 – which means this cluster has the youngest respondents, excluding the “sport fans” cluster. In this cluster, too, women comprise an almost two-third majority (64.4% women : 35.1% men), while 85 respondents each (48.9%) have received secondary and higher education (four respondents with elementary education altogether in this group). Subjects from this group are also mostly experts, middle class professionals, and pupils/students. Almost half of them (44.8%) are from Belgrade, and more than a half (55.2%) come from Belgrade and around.
Turning to clusters from Macedonia, we recognize similar foundations for grouping. Apart from the clusters almost identical to the ones in Serbia in terms of preferences and socio-demographic characteristics (such as TV fans, sport fans, art lovers, and art haters), and also one cluster which is mostly similar to its Serbian counterpart (“life lovers”)89 in Macedonia two “new” clusters emerged. We labelled them “café/disco fans” and “life haters”. The cluster that in Serbia we called “folk music lovers” does not occur in Macedonia.
89 In Macedonia, this group does not show an intensive attitude to art. Therefore, here we la-In Macedonia, this group does not show an intensive attitude to art. Therefore, here we la-belled them only “life lovers” and not “life/art lovers”, as in Serbia.
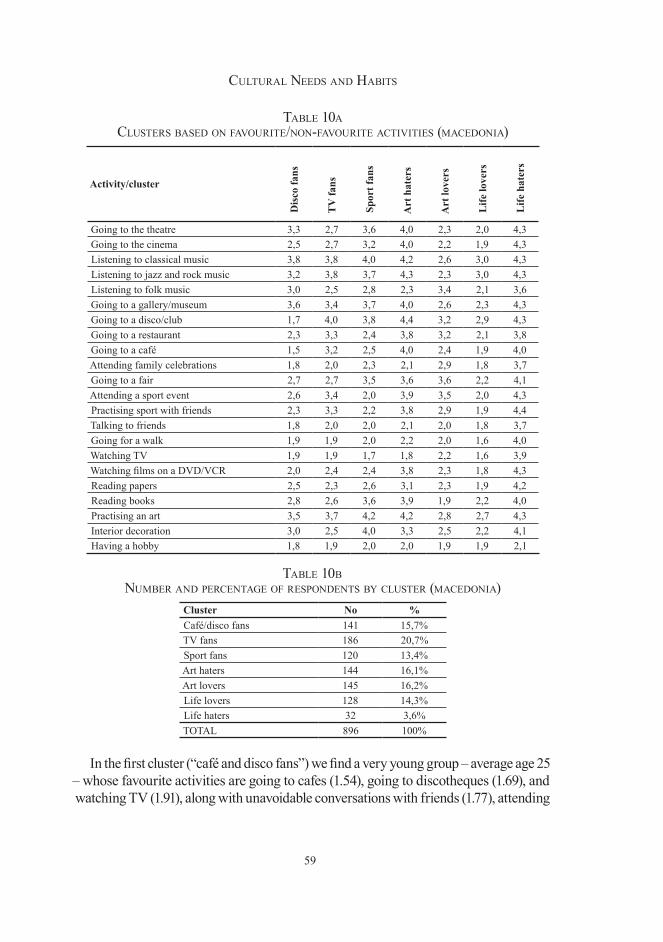
59
Cultural Needs aNd Habits
table 10a Clusters based oN favourite/NoN-favourite aCtivities (MaCedoNia)
Activity/cluster
Dis
co fa
ns
TV
fans
Spor
t fan
s
Art
hat
ers
Art
love
rs
Life
love
rs
Life
hat
ers
Going to the theatre �,� 2,7 �,6 4,0 2,� 2,0 4,�Going to the cinema 2,5 2,7 �,2 4,0 2,2 1,9 4,�Listening to classical music �,8 �,8 4,0 4,2 2,6 �,0 4,�Listening to jazz and rock music �,2 �,8 �,7 4,� 2,� �,0 4,�Listening to folk music �,0 2,5 2,8 2,� �,4 2,1 �,6Going to a gallery/museum �,6 �,4 �,7 4,0 2,6 2,� 4,�Going to a disco/club 1,7 4,0 �,8 4,4 �,2 2,9 4,�Going to a restaurant 2,� �,� 2,4 �,8 �,2 2,1 �,8Going to a café 1,5 �,2 2,5 4,0 2,4 1,9 4,0Attending family celebrations 1,8 2,0 2,� 2,1 2,9 1,8 �,7Going to a fair 2,7 2,7 �,5 �,6 �,6 2,2 4,1Attending a sport event 2,6 �,4 2,0 �,9 �,5 2,0 4,�Practising sport with friends 2,� �,� 2,2 �,8 2,9 1,9 4,4Talking to friends 1,8 2,0 2,0 2,1 2,0 1,8 �,7Going for a walk 1,9 1,9 2,0 2,2 2,0 1,6 4,0Watching TV 1,9 1,9 1,7 1,8 2,2 1,6 �,9Watching films on a DVD/VCR 2,0 2,4 2,4 �,8 2,� 1,8 4,�Reading papers 2,5 2,� 2,6 �,1 2,� 1,9 4,2Reading books 2,8 2,6 �,6 �,9 1,9 2,2 4,0Practising an art �,5 �,7 4,2 4,2 2,8 2,7 4,�Interior decoration �,0 2,5 4,0 �,� 2,5 2,2 4,1Having a hobby 1,8 1,9 2,0 2,0 1,9 1,9 2,1
table 10b NuMber aNd perCeNtage of respoNdeNts by Cluster (MaCedoNia)
Cluster No %Café/disco fans 141 15,7%TV fans 186 20,7%Sport fans 120 13,4%Art haters 144 16,1%Art lovers 145 16,2%Life lovers 128 14,3%Life haters 32 3,6%TOTAL 896 100%
In the first cluster (“café and disco fans”) we find a very young group – average age 25 – whose favourite activities are going to cafes (1.54), going to discotheques (1.69), and watching TV (1.91), along with unavoidable conversations with friends (1.77), attending
60
Cultural Needs, Habits aNd taste of CitizeNs of serbia aNd MaCedoNia
family celebrations (1.82) and walks (1.90). Least favourite activities in this group are listening to classical music (3.82), going to a gallery/museum (3.65), practising an art (3.49) and going to the theatre (3.33). In this cluster we find an almost equal number of ladies and men, and three quarters of the group (75.9%) have received secondary education as the highest qualification. It comprises mostly unemployed young people and pupils/students who usually live in Skopje (31.9%), and smaller Macedonian towns (36.2%), and Skopje and its vicinity (45.7%) and south Macedonia (34.1%). This cluster gathers 141 respondents, equalling 15.7% of the sample in Macedonia.
The second cluster is that of the group which we labelled “TV fans” in Serbia. Their free time preferences and demographic features are akin to those of the Serbian group. In this cluster we find 186 respondents, most of whom are women (60.8% women : 38.7% men). The average age of the subjects is 46. Most are found in the age groups 46-65 (46.5%) and 31-45 (29.7%), and least in the 65+ age group (5.9%). More than a half of respondents from this cluster have secondary education, but there are also a lot of people with higher education here (35.5%). Most people from the cluster belong to the group we labelled supported individuals (41.6% - again, having the gender structure in mind, we assume these are mostly housewives) and middle class professions (30.6% - mainly civil servants). Most live in Skopje and towns with a population smaller than 100,000 in south Macedonia. Favourite spare time activities for these people are watching TV (1.86), going for a walk (1.93), talking to friends (1.96), attending family celebrations (1.97), reading papers (2.26); the least favoured activities include going to a disco/club (4.02), listening to rock and jazz music (3.78), listening to classical music (3.77), practising an art (3.72), attending a sport event (3.43) and practising a sport with friends (3.35).
The third cluster in Macedonia is that of “sport fans”. It hosts 120 respondents, the majority of whom are men (85%). The average age of respondents in the cluster is 40, and most belong to the 31-45 age group. More than 60% of these respondents have earned secondary school degrees. By profession they are workers, farmers, and middle class civil servants, while there is also a significant number of supported individuals (unemployed). As for their place of residence, they mostly live in smaller towns (33.3%) and villages around Skopje (29.1%), but also in Skopje itself (28.2%). There are comparatively few such people in eastern and western Macedonia. The most favourite activities of this group include watching TV (1.75), attending a sport event (2.00), practising sports with friends (2.18), along with the ever-present going for a walk (1.96) and talking to friends (2.04). Among non-favoured leisure activities we find practising an art (4.24), listening to classical music (3.97), interior decoration (3.96), going to a disco/club (3.84), going to a gallery/museum (3.69), listening to jazz and rock music (3.66) and reading books ( 3.63).
The same negative attitude to activities from the field of (elite and popular) culture – but much more pronounced – is found in the fourth cluster, which we therefore
61
Cultural Needs aNd Habits
labelled the cluster of “art haters” (as we did in Serbia). The least favourite free time activities of these people include going to a disco (4.41), listening to jazz and rock music (4.31), practising an art (4.22), listening to classical music (4.21), go-ing to the theatre (4.05), etc. Precisely due to the intensity of the negative attitude to these activities90 and for the lack of clear preferences for one of the remaining activities (apart from standard walks, talks to friends, and watching TV), this cluster was labelled accordingly. The cluster gathers 144 respondents (16.1% of the sample), with an almost equal number of men and women. The average age here is 52, with more than a half belonging to the 46-65 age group. Out of them, 44% have only elementary education, 44.7% secondary education, and 11.3% higher education. Most are supported individuals (housewives, unemployed, pensioners – 50.7%), followed by farmers and workers (29.9%). They usually live in smaller towns and villages in central/south and west Macedonia.
Fifth cluster subjects were labelled “art lovers”. Their typical preferences present an opposition to the previous group. Their favourite activities are reading books (1.89), going to the cinema (2.20), going to the theatre (2.26), listening to jazz and rock music (2.31), and listening to classical music (2.55). Other favourite activities, in addition to artistic ones, are walking (1.97), talking to a friend (2.02), watch-ing TV (2.20), and going to a café (2.36). Activities this group is least inclined to in its spare time include: going to a fair (3.64), going to a sport event (3.50), and listening to folk music (3.38). Respondents from this group are relatively young – their average age is 35. Most belong to the 18-30 age group (42.1%) and the next group by age (37.2%). They are comparatively rare in the oldest group (2.1%). Over 55% of them have a college or university diploma, while only two have just elementary education. Most of them are experts, managers, and owners, while a number of them belong to middle class professions. They live mostly in smaller towns of south Macedonia and in Skopje. In this cluster, there was a total of 145 respondents, with a tiny majority of women (59.3%).
Typical of the final two clusters are opposite attitudes, not only to cultural and artistic activities, but also to all activities we offered in this question – perhaps we can say these groups cherish opposing attitudes to life. Those from the sixth cluster, whom we labelled “life lovers” have a non-discriminatively positive attitude to almost all activities we listed, while respondents from the seventh cluster have any equally non-discriminative negative position on all the activities. We therefore labelled the latter “life haters”91.
90 Average marks over 4 show that a number of respondents opted for the position “I don’t like this at all”. 91 One should not exclude the possibility that both groups actually wanted to “get rid” of the sur-veyors as soon as possible, so that they provided the same response (or circled the same number) for each activity.
62
Cultural Needs, Habits aNd taste of CitizeNs of serbia aNd MaCedoNia
The sixth cluster gathers 128 respondents – an almost equal number of men and women. The average age is 39, while only seven belong to the oldest, 65+ group. Most have secondary education (56.3%), and they are followed by persons with higher education (34.1%). The distribution between workers, middle class civil serv-ants, experts and managers is even. These people mostly live in the cities of south and east Macedonia. There seems to be no leisure activity that this group does not like (the closest to this is listening to classical music – 2.97 and listening to jazz and rock music – 2.98; the most favourite [along with going for a walk and talking to friends] are watching TV – 1.63, going to family celebrations – 1.78, practising sports with friends – 1.88, going to a café – 1.90, reading papers – 1.92, going to the cinema – 1.94, going to the theatre – 1.99, and reading books – 2.15).
In the seventh cluster, a small group gathering only 32 respondents, there is al-most no acceptable free time activity. They have the least negative view of listening to folk music (3.62), going to family celebrations (3.66), talking to friends (3.79), going to a restaurant (3.84), and watching TV (3.90). In this group there are a bit more men than women, and it mostly gathers supported individuals, farmers and workers. The average age is 51, and most respondents from the cluster live in the outskirts of Skopje and in Macedonian villages.
Viewing the clusters in Macedonia and Serbia we observe that in the multitude of preferential differences (that allowed us to group respondents into clusters) one trait remains constant and enables us to further classify these clusters – this is their attitude to cultural activities in the narrower sense. In both Macedonia and Serbia artistic activities in the narrower sense are globally among the least favourite activities for some clusters, remaining among the most favourite spare time actions for the other clusters92.
Socio-demographic distribution of respondents belonging to these groups of clusters (for convenience, let us call them “art fans” and “non-art fans”) shows recognizable patterns. In both Macedonia and Serbia in the “art fans” cluster group there are a bit more women than men and also more respondents from the young-est groups (18-30 and 31-45), while respondents from the older groups, especially the oldest (over 65) mostly comprise “non-art fans”. In terms of their territorial distribution, the data are contradictory: in Serbia, art fans prevail in Belgrade and towns with the population smaller than 100,000 and in the region comprised of Belgrade and nearby towns, while in Macedonia this applies to towns with more than 100,000 inhabitants and the region of southern Macedonia.
92 In Macedonia (global) forms of artistic activities are among the least favourite for 1) “café/disco fans”,2) “sport fans”, 3) TV fans, 4) “art haters” and 5) “life haters”, and the most favourite for 6) “art lovers” and 7) “life lovers”. In Serbia, traditional art activities are the least favourite for 1) “art haters”, 2) TV fans, 3) “folk music lovers” and 4) sport fans, and most favourite for 5) “art lovers/ anti-folk lovers” and 6) “art/life lovers”.
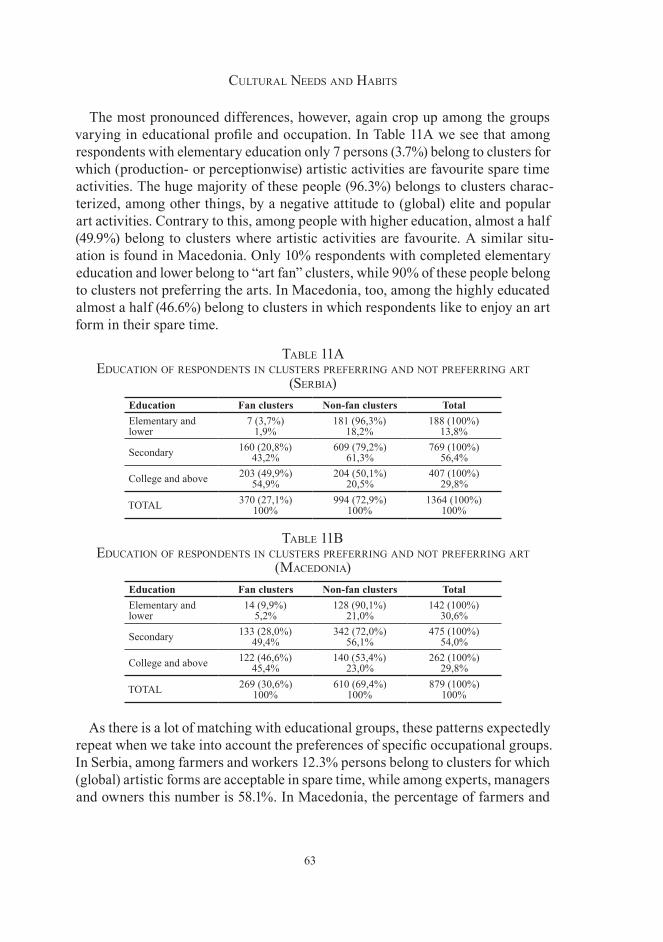
63
Cultural Needs aNd Habits
The most pronounced differences, however, again crop up among the groups varying in educational profile and occupation. In Table 11A we see that among respondents with elementary education only 7 persons (3.7%) belong to clusters for which (production- or perceptionwise) artistic activities are favourite spare time activities. The huge majority of these people (96.3%) belongs to clusters charac-terized, among other things, by a negative attitude to (global) elite and popular art activities. Contrary to this, among people with higher education, almost a half (49.9%) belong to clusters where artistic activities are favourite. A similar situ-ation is found in Macedonia. Only 10% respondents with completed elementary education and lower belong to “art fan” clusters, while 90% of these people belong to clusters not preferring the arts. In Macedonia, too, among the highly educated almost a half (46.6%) belong to clusters in which respondents like to enjoy an art form in their spare time.
table 11a eduCatioN of respoNdeNts iN Clusters preferriNg aNd Not preferriNg art
(serbia)Education Fan clusters Non-fan clusters TotalElementary and lower
7 (3,7%)1,9%
181 (96,3%)18,2%
188 (100%)13,8%
Secondary 160 (20,8%)43,2%
609 (79,2%)61,3%
769 (100%)56,4%
College and above 203 (49,9%)54,9%
204 (50,1%)20,5%
407 (100%)29,8%
TOTAL 370 (27,1%)100%
994 (72,9%)100%
1364 (100%)100%
table 11b eduCatioN of respoNdeNts iN Clusters preferriNg aNd Not preferriNg art
(MaCedoNia)Education Fan clusters Non-fan clusters TotalElementary and lower
14 (9,9%)5,2%
128 (90,1%)21,0%
142 (100%)30,6%
Secondary 133 (28,0%)49,4%
342 (72,0%)56,1%
475 (100%)54,0%
College and above 122 (46,6%)45,4%
140 (53,4%)23,0%
262 (100%)29,8%
TOTAL 269 (30,6%)100%
610 (69,4%)100%
879 (100%)100%
As there is a lot of matching with educational groups, these patterns expectedly repeat when we take into account the preferences of specific occupational groups. In Serbia, among farmers and workers 12.3% persons belong to clusters for which (global) artistic forms are acceptable in spare time, while among experts, managers and owners this number is 58.1%. In Macedonia, the percentage of farmers and
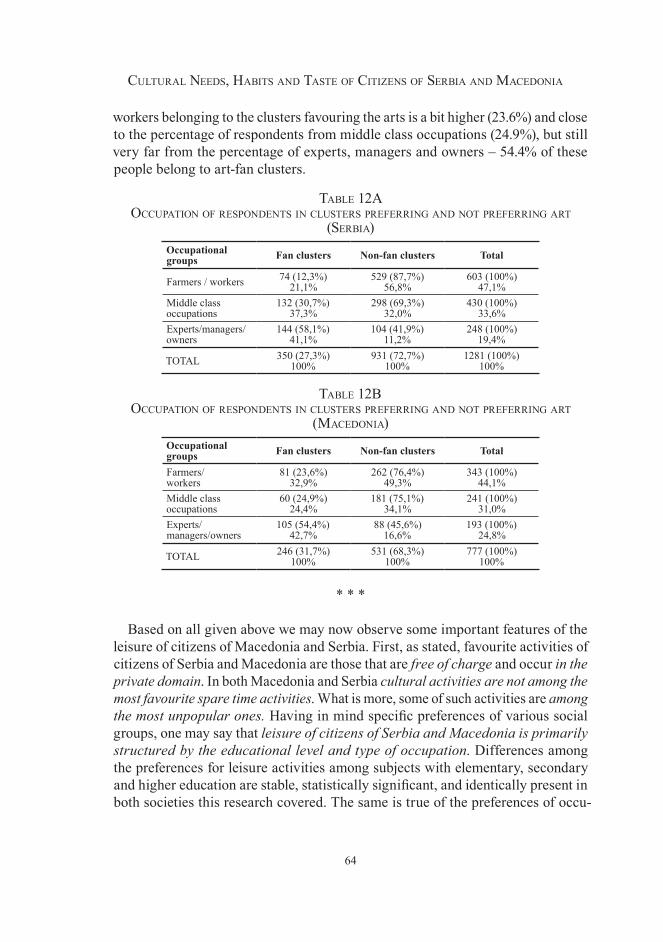
64
Cultural Needs, Habits aNd taste of CitizeNs of serbia aNd MaCedoNia
workers belonging to the clusters favouring the arts is a bit higher (23.6%) and close to the percentage of respondents from middle class occupations (24.9%), but still very far from the percentage of experts, managers and owners – 54.4% of these people belong to art-fan clusters.
table 12a oCCupatioN of respoNdeNts iN Clusters preferriNg aNd Not preferriNg art
(serbia)Occupational groups Fan clusters Non-fan clusters Total
Farmers / workers 74 (12,3%)21,1%
529 (87,7%)56,8%
603 (100%)47,1%
Middle class occupations
132 (30,7%)37,3%
298 (69,3%)32,0%
430 (100%)33,6%
Experts/managers/owners
144 (58,1%)41,1%
104 (41,9%)11,2%
248 (100%)19,4%
TOTAL 350 (27,3%)100%
931 (72,7%)100%
1281 (100%)100%
table 12b oCCupatioN of respoNdeNts iN Clusters preferriNg aNd Not preferriNg art
(MaCedoNia)Occupational groups Fan clusters Non-fan clusters Total
Farmers/workers
81 (23,6%)32,9%
262 (76,4%)49,3%
343 (100%)44,1%
Middle class occupations
60 (24,9%)24,4%
181 (75,1%)34,1%
241 (100%)31,0%
Experts/managers/owners
105 (54,4%)42,7%
88 (45,6%)16,6%
193 (100%)24,8%
TOTAL 246 (31,7%)100%
531 (68,3%)100%
777 (100%)100%
* * *
Based on all given above we may now observe some important features of the leisure of citizens of Macedonia and Serbia. First, as stated, favourite activities of citizens of Serbia and Macedonia are those that are free of charge and occur in the private domain. In both Macedonia and Serbia cultural activities are not among the most favourite spare time activities. What is more, some of such activities are among the most unpopular ones. Having in mind specific preferences of various social groups, one may say that leisure of citizens of Serbia and Macedonia is primarily structured by the educational level and type of occupation. Differences among the preferences for leisure activities among subjects with elementary, secondary and higher education are stable, statistically significant, and identically present in both societies this research covered. The same is true of the preferences of occu-
65
Cultural Needs aNd Habits
pational groups: farmers and workers, compared with middle class civil servants and further compared with experts, managers, and owners. These differences are most clearly delineated with regard to cultural activities in the narrower sense. The demarcation line among the preferences of groups of respondents with higher education and experts and managers/owners on the one hand and preferences of groups of respondents with elementary education working as farmers or workers in routine jobs on the other is not, as in similar studies conducted in other socie-ties, that between elite and popular culture activities. Rather, it is between those cultural activities belonging to the global milieu (such as going to the theatre, but also going to the cinema, listening to classical music, and also listening to jazz and rock music) on the one hand and cultural activities belonging to the local milieu (such as listening to folk music) on the other.
Other identifiable characteristics pertain to gender preferences for a certain number of activities not classifiable as cultural participation in the narrower sense – such as practising sports, attending sport events, going to a restaurant, fishing and hunting (as preferred by men), and handicraft, gardening and interior decoration (as preferred by women). Among cultural activities in the narrower sense, there is a certain (statistically not too strong) relation between preferences more inclining to elite cultural activities (such as reading books and listening to classical music) and the female gender, and preferences more inclining to popular cultural forms (such as jazz and rock and roll) and the male gender.
Among age groups, specific in terms of preferences is the youngest respondent group, aged 18 to 30. Although the range of their preferences is broader than in other age groups, and although they show more inclination than other age groups for cultural activities in the narrower sense, the key difference between the spare time of respondents aged 18 to 30 as opposed to other age groups is that they have significantly more preference for activities occurring in the public sphere (such as going to cafes, discotheques/clubs, cinemas).
As for territorial groups (groups based on the place and region of residence) we may say that in terms of interests and cultural interests of citizens there are no territorial differences. The only noticeable difference occurring is the one between the preferences of urban population (regardless of the size of town) and rural population. Still, this relation is not very strong statistically.
Now we may take a look at the situation regarding cultural habits of citizens of Macedonia and Serbia.
66
Cultural Needs, Habits aNd taste of CitizeNs of serbia aNd MaCedoNia
Cultural Habits – The Actual Aspect of Cultural Participation
Our study of cultural habits, that is actual cultural participation activities, was operationalized via 33 questions classified into four groups. Through them, we
wished to gain insight into: 1) cultural production activities, i.e. whether respondents practice art – as professionals or amateurs – and whether their ancestors (parents and grandparents) practised the arts and, if yes, which ones; 2) media habits of respondents (whether and how often they watch TV or listen to the radio, read dailies and periodicals/magazines, and what are their favourite TV/radio programs, favourite dailies and magazines); 3) forms of private cultural consumption (reading books and listening to music); 4) forms of public cultural consumption (visits to the theatre, cinema, galleries/museums, concerts, historical monuments, etc.).
After gaining principal trends for types of cultural habits listed for the entire sample (population) in Macedonia and Serbia, we studied their socio-demographic distribution, i.e. whether there are differences in cultural habits among groups by gender, age, education, occupation, and territory. In the end of this chapter, based on the data from the research ”Europeans’ Participation in Cultural Activities“ of April 2002 and ”New Europeans and Culture“ of April 2003, carried out on a similar sample with questions similar to our own, we compare cultural habits of citizens of Macedonia and Serbia with the habits of citizens of EU countries (old and new member states).
Cultural Production Activities
By studying cultural needs of citizens of Serbia and Macedonia we realized that pursuing an artistic activity is among the least popular leisure time activities. For Serbian respondents this is indeed the most unpopular activity (with the average
“grade” 3.58) while in Macedonia it takes the last but one position, just after lis-tening to classical music (the average “grade” is 3.56). Not only were there many respondents assessing their attitude to pursuing an art with the statement number 4 (“I do not like this”), but there was a significant number of those expressing their position with the mark 5 (“I do not like this at all”). Even if we could understand those people with no affinity to art, who do not like practising the arts, it remains rather difficult to understand what is there to “not like at all” with regard to art, so much praised as a “free and creative expression of humanity”. Whether this is a negative attitude to an activity whose rules and merits one does not understand, repulsion to pretentious activities reserved for “higher” social strata, or scornful
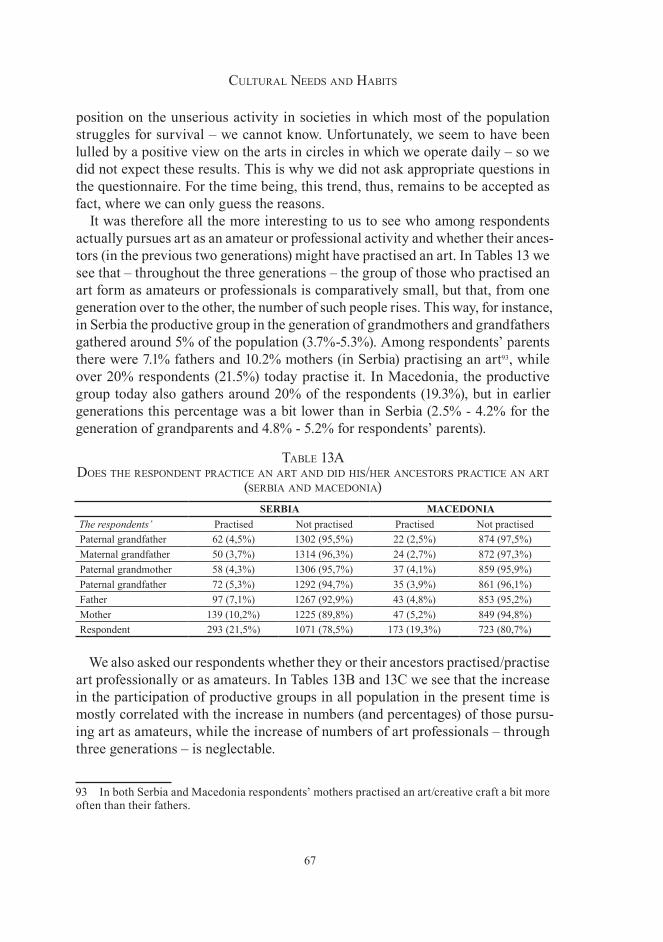
67
Cultural Needs aNd Habits
position on the unserious activity in societies in which most of the population struggles for survival – we cannot know. Unfortunately, we seem to have been lulled by a positive view on the arts in circles in which we operate daily – so we did not expect these results. This is why we did not ask appropriate questions in the questionnaire. For the time being, this trend, thus, remains to be accepted as fact, where we can only guess the reasons.
It was therefore all the more interesting to us to see who among respondents actually pursues art as an amateur or professional activity and whether their ances-tors (in the previous two generations) might have practised an art. In Tables 13 we see that – throughout the three generations – the group of those who practised an art form as amateurs or professionals is comparatively small, but that, from one generation over to the other, the number of such people rises. This way, for instance, in Serbia the productive group in the generation of grandmothers and grandfathers gathered around 5% of the population (3.7%-5.3%). Among respondents’ parents there were 7.1% fathers and 10.2% mothers (in Serbia) practising an art93, while over 20% respondents (21.5%) today practise it. In Macedonia, the productive group today also gathers around 20% of the respondents (19.3%), but in earlier generations this percentage was a bit lower than in Serbia (2.5% - 4.2% for the generation of grandparents and 4.8% - 5.2% for respondents’ parents).
table 1�a does tHe respoNdeNt praCtiCe aN art aNd did His/Her aNCestors praCtiCe aN art
(serbia aNd MaCedoNia)SERBIA MACEDONIA
The respondents’ Practised Not practised Practised Not practisedPaternal grandfather 62 (4,5%) 1302 (95,5%) 22 (2,5%) 874 (97,5%)Maternal grandfather 50 (3,7%) 1314 (96,3%) 24 (2,7%) 872 (97,3%)Paternal grandmother 58 (4,3%) 1306 (95,7%) 37 (4,1%) 859 (95,9%)Paternal grandfather 72 (5,3%) 1292 (94,7%) 35 (3,9%) 861 (96,1%)Father 97 (7,1%) 1267 (92,9%) 43 (4,8%) 853 (95,2%)Mother 139 (10,2%) 1225 (89,8%) 47 (5,2%) 849 (94,8%)Respondent 293 (21,5%) 1071 (78,5%) 173 (19,3%) 723 (80,7%)
We also asked our respondents whether they or their ancestors practised/practise art professionally or as amateurs. In Tables 13B and 13C we see that the increase in the participation of productive groups in all population in the present time is mostly correlated with the increase in numbers (and percentages) of those pursu-ing art as amateurs, while the increase of numbers of art professionals – through three generations – is neglectable.
93 In both Serbia and Macedonia respondents’ mothers practised an art/creative craft a bit more often than their fathers.
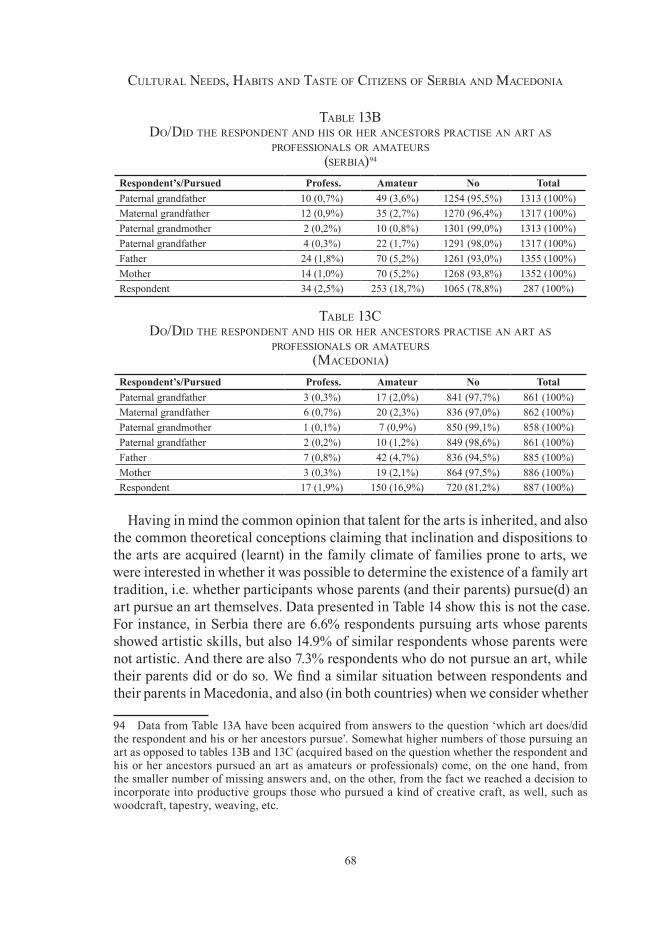
68
Cultural Needs, Habits aNd taste of CitizeNs of serbia aNd MaCedoNia
table 1�b do/did tHe respoNdeNt aNd His or Her aNCestors praCtise aN art as
professioNals or aMateurs (serbia)94
Respondent’s/Pursued Profess. Amateur No TotalPaternal grandfather 10 (0,7%) 49 (3,6%) 1254 (95,5%) 1313 (100%)Maternal grandfather 12 (0,9%) 35 (2,7%) 1270 (96,4%) 1317 (100%)Paternal grandmother 2 (0,2%) 10 (0,8%) 1301 (99,0%) 1313 (100%)Paternal grandfather 4 (0,3%) 22 (1,7%) 1291 (98,0%) 1317 (100%)Father 24 (1,8%) 70 (5,2%) 1261 (93,0%) 1355 (100%)Mother 14 (1,0%) 70 (5,2%) 1268 (93,8%) 1352 (100%)Respondent 34 (2,5%) 253 (18,7%) 1065 (78,8%) 287 (100%)
table 1�C do/did tHe respoNdeNt aNd His or Her aNCestors praCtise aN art as
professioNals or aMateurs (MaCedoNia)
Respondent’s/Pursued Profess. Amateur No TotalPaternal grandfather 3 (0,3%) 17 (2,0%) 841 (97,7%) 861 (100%)Maternal grandfather 6 (0,7%) 20 (2,3%) 836 (97,0%) 862 (100%)Paternal grandmother 1 (0,1%) 7 (0,9%) 850 (99,1%) 858 (100%)Paternal grandfather 2 (0,2%) 10 (1,2%) 849 (98,6%) 861 (100%)Father 7 (0,8%) 42 (4,7%) 836 (94,5%) 885 (100%)Mother 3 (0,3%) 19 (2,1%) 864 (97,5%) 886 (100%)Respondent 17 (1,9%) 150 (16,9%) 720 (81,2%) 887 (100%)
Having in mind the common opinion that talent for the arts is inherited, and also the common theoretical conceptions claiming that inclination and dispositions to the arts are acquired (learnt) in the family climate of families prone to arts, we were interested in whether it was possible to determine the existence of a family art tradition, i.e. whether participants whose parents (and their parents) pursue(d) an art pursue an art themselves. Data presented in Table 14 show this is not the case. For instance, in Serbia there are 6.6% respondents pursuing arts whose parents showed artistic skills, but also 14.9% of similar respondents whose parents were not artistic. And there are also 7.3% respondents who do not pursue an art, while their parents did or do so. We find a similar situation between respondents and their parents in Macedonia, and also (in both countries) when we consider whether
94 Data from Table 13A have been acquired from answers to the question ‘which art does/did the respondent and his or her ancestors pursue’. Somewhat higher numbers of those pursuing an art as opposed to tables 13B and 13C (acquired based on the question whether the respondent and his or her ancestors pursued an art as amateurs or professionals) come, on the one hand, from the smaller number of missing answers and, on the other, from the fact we reached a decision to incorporate into productive groups those who pursued a kind of creative craft, as well, such as woodcraft, tapestry, weaving, etc.
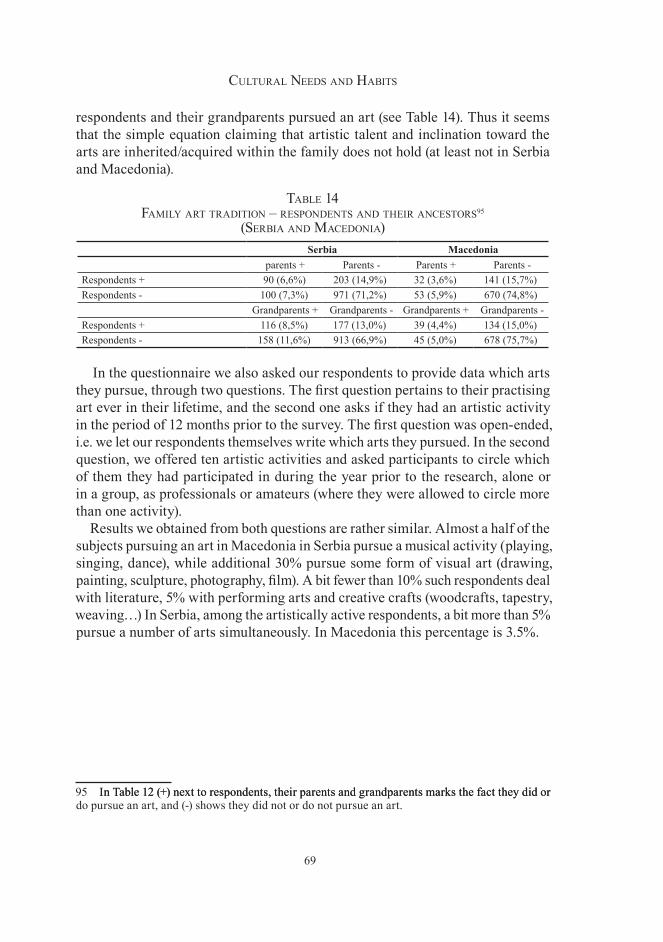
69
Cultural Needs aNd Habits
respondents and their grandparents pursued an art (see Table 14). Thus it seems that the simple equation claiming that artistic talent and inclination toward the arts are inherited/acquired within the family does not hold (at least not in Serbia and Macedonia).
table 14 faMily art traditioN – respoNdeNts aNd tHeir aNCestors95
(serbia aNd MaCedoNia)Serbia Macedonia
parents + Parents - Parents + Parents -Respondents + 90 (6,6%) 203 (14,9%) 32 (3,6%) 141 (15,7%)Respondents - 100 (7,3%) 971 (71,2%) 53 (5,9%) 670 (74,8%)
Grandparents + Grandparents - Grandparents + Grandparents -Respondents + 116 (8,5%) 177 (13,0%) 39 (4,4%) 134 (15,0%)Respondents - 158 (11,6%) 913 (66,9%) 45 (5,0%) 678 (75,7%)
In the questionnaire we also asked our respondents to provide data which arts they pursue, through two questions. The first question pertains to their practising art ever in their lifetime, and the second one asks if they had an artistic activity in the period of 12 months prior to the survey. The first question was open-ended, i.e. we let our respondents themselves write which arts they pursued. In the second question, we offered ten artistic activities and asked participants to circle which of them they had participated in during the year prior to the research, alone or in a group, as professionals or amateurs (where they were allowed to circle more than one activity).
Results we obtained from both questions are rather similar. Almost a half of the subjects pursuing an art in Macedonia in Serbia pursue a musical activity (playing, singing, dance), while additional 30% pursue some form of visual art (drawing, painting, sculpture, photography, film). A bit fewer than 10% such respondents deal with literature, 5% with performing arts and creative crafts (woodcrafts, tapestry, weaving…) In Serbia, among the artistically active respondents, a bit more than 5% pursue a number of arts simultaneously. In Macedonia this percentage is 3.5%.
95 In Table 12 (+) next to respondents, their parents and grandparents marks the fact they did orIn Table 12 (+) next to respondents, their parents and grandparents marks the fact they did or do pursue an art, and (-) shows they did not or do not pursue an art.
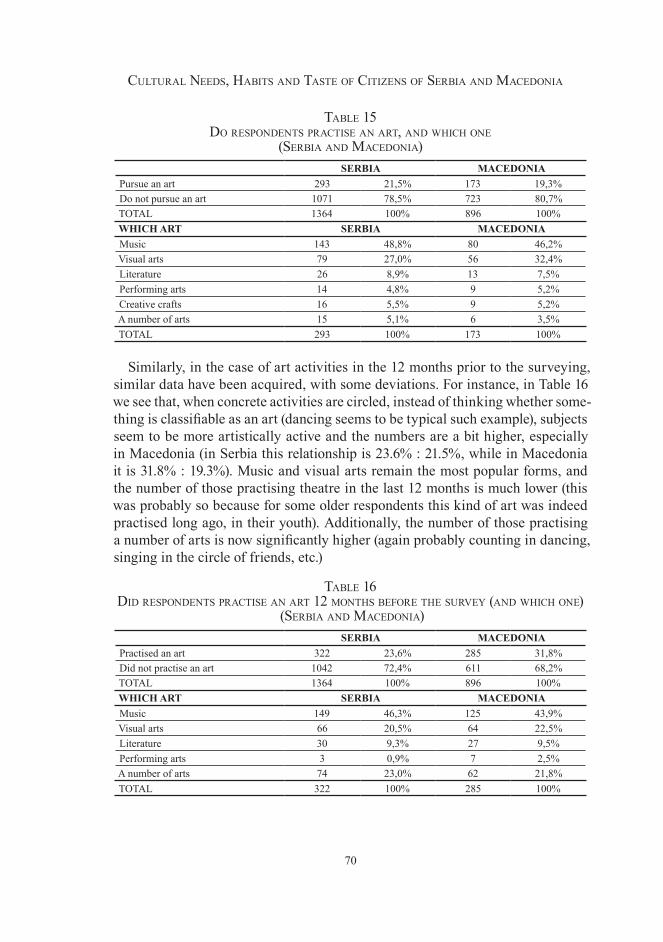
70
Cultural Needs, Habits aNd taste of CitizeNs of serbia aNd MaCedoNia
table 15 do respoNdeNts praCtise aN art, aNd wHiCH oNe
(serbia aNd MaCedoNia)SERBIA MACEDONIA
Pursue an art 293 21,5% 173 19,3%Do not pursue an art 1071 78,5% 723 80,7%TOTAL 1364 100% 896 100%WHICH ART SERBIA MACEDONIAMusic 143 48,8% 80 46,2%Visual arts 79 27,0% 56 32,4%Literature 26 8,9% 13 7,5%Performing arts 14 4,8% 9 5,2%Creative crafts 16 5,5% 9 5,2%A number of arts 15 5,1% 6 3,5%TOTAL 293 100% 173 100%
Similarly, in the case of art activities in the 12 months prior to the surveying, similar data have been acquired, with some deviations. For instance, in Table 16 we see that, when concrete activities are circled, instead of thinking whether some-thing is classifiable as an art (dancing seems to be typical such example), subjects seem to be more artistically active and the numbers are a bit higher, especially in Macedonia (in Serbia this relationship is 23.6% : 21.5%, while in Macedonia it is 31.8% : 19.3%). Music and visual arts remain the most popular forms, and the number of those practising theatre in the last 12 months is much lower (this was probably so because for some older respondents this kind of art was indeed practised long ago, in their youth). Additionally, the number of those practising a number of arts is now significantly higher (again probably counting in dancing, singing in the circle of friends, etc.)
table 16 did respoNdeNts praCtise aN art 12 MoNtHs before tHe survey (aNd wHiCH oNe)
(serbia aNd MaCedoNia)SERBIA MACEDONIA
Practised an art 322 23,6% 285 31,8%Did not practise an art 1042 72,4% 611 68,2%TOTAL 1364 100% 896 100%WHICH ART SERBIA MACEDONIAMusic 149 46,3% 125 43,9%Visual arts 66 20,5% 64 22,5%Literature 30 9,3% 27 9,5%Performing arts 3 0,9% 7 2,5%A number of arts 74 23,0% 62 21,8%TOTAL 322 100% 285 100%
71
Cultural Needs aNd Habits
As mentioned before, the productive group (in the sample and population) included those who practise(d) an art as professional or amateurs, but also those who pursue(d) a creative craft (woodcraft, tapestry, weaving, etc.) When viewing the distribution of the productive group so defined by social groups, it turned out that social and demographic factors do not strongly influence the inclination of a person to practise an art – which is true both of the respondents’ generation and of the previous two generations of their ancestors. Statistically speaking, relations between practising an art and any of the factors observed (gender, age, education, occupation, job position, place of residence, region of residence) are not worthy of attention.
Minor differences are seen in the fact that, first, in Serbia women are more commonly active in the arts and creative crafts, while in Macedonia this is true only of creative crafts. As expected, in both cases, the most common pursuers of art are among the youngest (18-30), while the oldest (over 65) prefer creative crafts – especially women in this group. When broken down, the scheme of the educational groups shows that affinity to art rises with the rise in the education level (in Serbia from secondary ‘gymnasium’ above, in Macedonia from college above). Also, in terms of occupational groups, experts, managers and owners practise an art more often than other groups (in both Serbia and Macedonia). In the generation of respondents’ fathers and mothers in Serbia we witness an even clearer distinction between the highly educated and experts, managers and owners and other educational and occupational groups. With grandparents, this borderline is a bit lower – delineating those with completed secondary education (and above) and middle class professions on the one hand and farmers and managers on the other. In Macedonia, in the parent generation, there are almost no differences in education between those pursuing an art. The same goes for occupational groups. In the previous (grandparent) generation, the male population from the productive group was mostly highly educated, while the female population from this group had at least secondary education. As for territorial distribution, in both Serbia and Macedonia one notices the urban/rural distinction, where pursuing an art is commoner in the cities, and creative crafts are more prevalent in the countryside.
In an attempt to summarize what has been presented so far, we may say that the productive group is relatively small, but that in the three generations studied the number and percentage of those pursuing an art has increased – especially in terms of amateur artists – so that today in Serbia and Macedonia the productive group takes 20% of the population. Among those practising an art almost a half are active in a musical field (playing, singing, dance), while second in the list by popularity is the realm of visual arts (drawing, painting, sculpture, photography, film). It turned out, too, that being in a productive group is not much dependent on social factors, including family tradition in practising art.
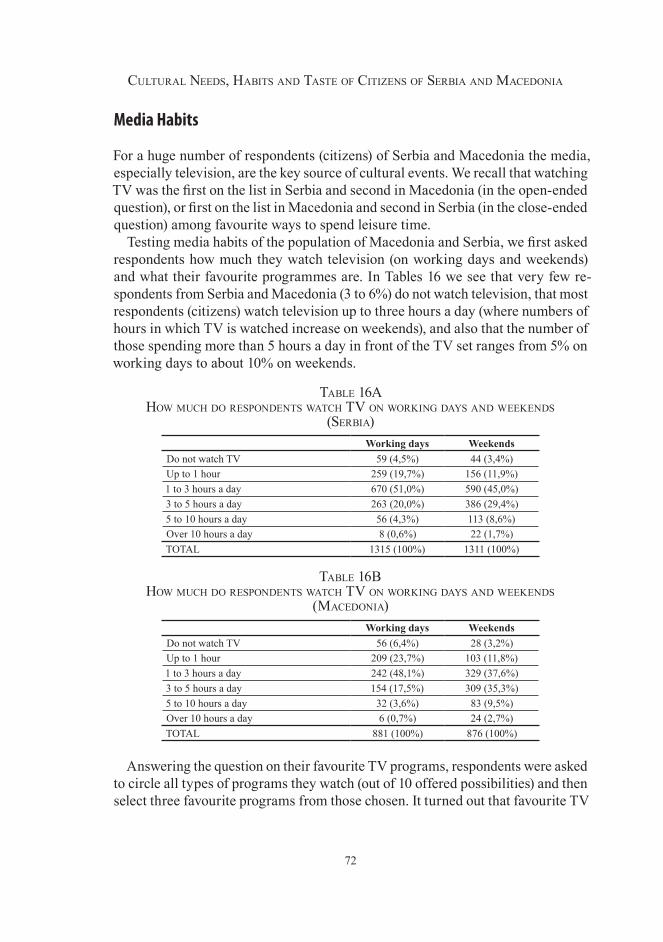
72
Cultural Needs, Habits aNd taste of CitizeNs of serbia aNd MaCedoNia
Media Habits
For a huge number of respondents (citizens) of Serbia and Macedonia the media, especially television, are the key source of cultural events. We recall that watching TV was the first on the list in Serbia and second in Macedonia (in the open-ended question), or first on the list in Macedonia and second in Serbia (in the close-ended question) among favourite ways to spend leisure time.
Testing media habits of the population of Macedonia and Serbia, we first asked respondents how much they watch television (on working days and weekends) and what their favourite programmes are. In Tables 16 we see that very few re-spondents from Serbia and Macedonia (3 to 6%) do not watch television, that most respondents (citizens) watch television up to three hours a day (where numbers of hours in which TV is watched increase on weekends), and also that the number of those spending more than 5 hours a day in front of the TV set ranges from 5% on working days to about 10% on weekends.
table 16a How MuCH do respoNdeNts watCH tv oN workiNg days aNd weekeNds
(serbia)Working days Weekends
Do not watch TV 59 (4,5%) 44 (3,4%)Up to 1 hour 259 (19,7%) 156 (11,9%)1 to 3 hours a day 670 (51,0%) 590 (45,0%)3 to 5 hours a day 263 (20,0%) 386 (29,4%)5 to 10 hours a day 56 (4,3%) 113 (8,6%)Over 10 hours a day 8 (0,6%) 22 (1,7%)TOTAL 1315 (100%) 1311 (100%)
table 16b How MuCH do respoNdeNts watCH tv oN workiNg days aNd weekeNds
(MaCedoNia)Working days Weekends
Do not watch TV 56 (6,4%) 28 (3,2%)Up to 1 hour 209 (23,7%) 103 (11,8%)1 to 3 hours a day 242 (48,1%) 329 (37,6%)3 to 5 hours a day 154 (17,5%) 309 (35,3%)5 to 10 hours a day 32 (3,6%) 83 (9,5%)Over 10 hours a day 6 (0,7%) 24 (2,7%)TOTAL 881 (100%) 876 (100%)
Answering the question on their favourite TV programs, respondents were asked to circle all types of programs they watch (out of 10 offered possibilities) and then select three favourite programs from those chosen. It turned out that favourite TV
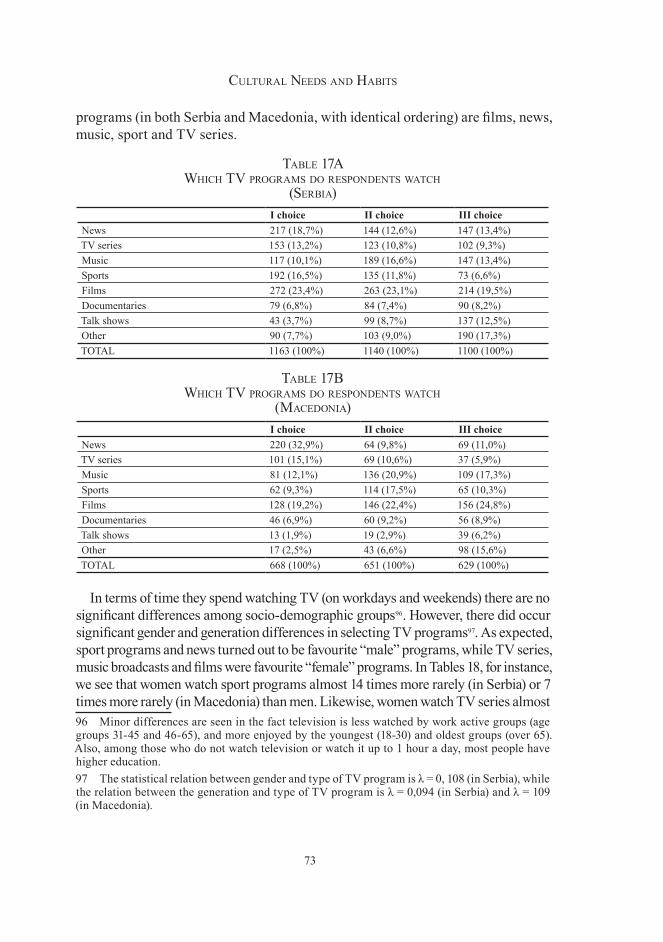
73
Cultural Needs aNd Habits
programs (in both Serbia and Macedonia, with identical ordering) are films, news, music, sport and TV series.
table 17a wHiCH tv prograMs do respoNdeNts watCH
(serbia)I choice II choice III choice
News 217 (18,7%) 144 (12,6%) 147 (13,4%)TV series 153 (13,2%) 123 (10,8%) 102 (9,3%)Music 117 (10,1%) 189 (16,6%) 147 (13,4%)Sports 192 (16,5%) 135 (11,8%) 73 (6,6%)Films 272 (23,4%) 263 (23,1%) 214 (19,5%)Documentaries 79 (6,8%) 84 (7,4%) 90 (8,2%)Talk shows 43 (3,7%) 99 (8,7%) 137 (12,5%)Other 90 (7,7%) 103 (9,0%) 190 (17,3%)TOTAL 1163 (100%) 1140 (100%) 1100 (100%)
table 17b wHiCH tv prograMs do respoNdeNts watCH
(MaCedoNia)I choice II choice III choice
News 220 (32,9%) 64 (9,8%) 69 (11,0%)TV series 101 (15,1%) 69 (10,6%) 37 (5,9%)Music 81 (12,1%) 136 (20,9%) 109 (17,3%)Sports 62 (9,3%) 114 (17,5%) 65 (10,3%)Films 128 (19,2%) 146 (22,4%) 156 (24,8%)Documentaries 46 (6,9%) 60 (9,2%) 56 (8,9%)Talk shows 13 (1,9%) 19 (2,9%) 39 (6,2%)Other 17 (2,5%) 43 (6,6%) 98 (15,6%)TOTAL 668 (100%) 651 (100%) 629 (100%)
In terms of time they spend watching TV (on workdays and weekends) there are no significant differences among socio-demographic groups96. However, there did occur significant gender and generation differences in selecting TV programs97. As expected, sport programs and news turned out to be favourite “male” programs, while TV series, music broadcasts and films were favourite “female” programs. In Tables 18, for instance, we see that women watch sport programs almost 14 times more rarely (in Serbia) or 7 times more rarely (in Macedonia) than men. Likewise, women watch TV series almost 96 Minor differences are seen in the fact television is less watched by work active groups (age groups 31-45 and 46-65), and more enjoyed by the youngest (18-30) and oldest groups (over 65). Also, among those who do not watch television or watch it up to 1 hour a day, most people have higher education.97 The statistical relation between gender and type of TV program is λ = 0, 108 (in Serbia), while the relation between the generation and type of TV program is λ = 0,094 (in Serbia) and λ = 109 (in Macedonia).
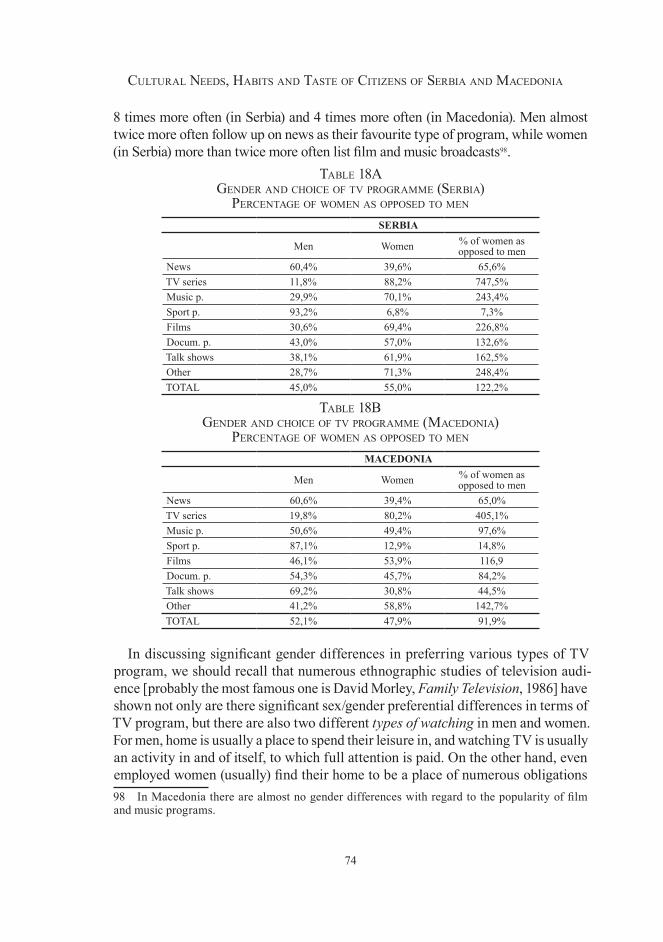
74
Cultural Needs, Habits aNd taste of CitizeNs of serbia aNd MaCedoNia
8 times more often (in Serbia) and 4 times more often (in Macedonia). Men almost twice more often follow up on news as their favourite type of program, while women (in Serbia) more than twice more often list film and music broadcasts98.
table 18a geNder aNd CHoiCe of tv prograMMe (serbia)
perCeNtage of woMeN as opposed to MeN
SERBIA
Men Women % of women as opposed to men
News 60,4% 39,6% 65,6%TV series 11,8% 88,2% 747,5%Music p. 29,9% 70,1% 243,4%Sport p. 93,2% 6,8% 7,3%Films 30,6% 69,4% 226,8%Docum. p. 43,0% 57,0% 132,6%Talk shows 38,1% 61,9% 162,5%Other 28,7% 71,3% 248,4%TOTAL 45,0% 55,0% 122,2%
table 18b geNder aNd CHoiCe of tv prograMMe (MaCedoNia)
perCeNtage of woMeN as opposed to MeN
MACEDONIA
Men Women % of women as opposed to men
News 60,6% 39,4% 65,0%TV series 19,8% 80,2% 405,1%Music p. 50,6% 49,4% 97,6%Sport p. 87,1% 12,9% 14,8%Films 46,1% 53,9% 116,9Docum. p. 54,3% 45,7% 84,2%Talk shows 69,2% 30,8% 44,5%Other 41,2% 58,8% 142,7%TOTAL 52,1% 47,9% 91,9%
In discussing significant gender differences in preferring various types of TV program, we should recall that numerous ethnographic studies of television audi-ence [probably the most famous one is David Morley, Family Television, 1986] have shown not only are there significant sex/gender preferential differences in terms of TV program, but there are also two different types of watching in men and women. For men, home is usually a place to spend their leisure in, and watching TV is usually an activity in and of itself, to which full attention is paid. On the other hand, even employed women (usually) find their home to be a place of numerous obligations 98 In Macedonia there are almost no gender differences with regard to the popularity of film and music programs.
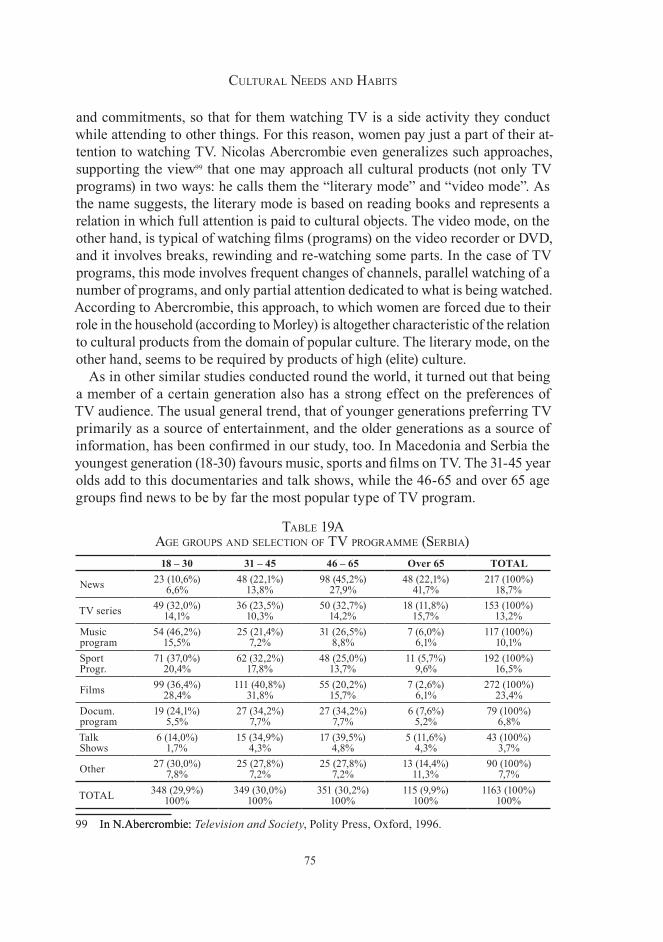
75
Cultural Needs aNd Habits
and commitments, so that for them watching TV is a side activity they conduct while attending to other things. For this reason, women pay just a part of their at-tention to watching TV. Nicolas Abercrombie even generalizes such approaches, supporting the view99 that one may approach all cultural products (not only TV programs) in two ways: he calls them the “literary mode” and “video mode”. As the name suggests, the literary mode is based on reading books and represents a relation in which full attention is paid to cultural objects. The video mode, on the other hand, is typical of watching films (programs) on the video recorder or DVD, and it involves breaks, rewinding and re-watching some parts. In the case of TV programs, this mode involves frequent changes of channels, parallel watching of a number of programs, and only partial attention dedicated to what is being watched. According to Abercrombie, this approach, to which women are forced due to their role in the household (according to Morley) is altogether characteristic of the relation to cultural products from the domain of popular culture. The literary mode, on the other hand, seems to be required by products of high (elite) culture.
As in other similar studies conducted round the world, it turned out that being a member of a certain generation also has a strong effect on the preferences of TV audience. The usual general trend, that of younger generations preferring TV primarily as a source of entertainment, and the older generations as a source of information, has been confirmed in our study, too. In Macedonia and Serbia the youngest generation (18-30) favours music, sports and films on TV. The 31-45 year olds add to this documentaries and talk shows, while the 46-65 and over 65 age groups find news to be by far the most popular type of TV program.
table 19a age groups aNd seleCtioN of tv prograMMe (serbia)
18 – 30 31 – 45 46 – 65 Over 65 TOTAL
News 23 (10,6%)6,6%
48 (22,1%)13,8%
98 (45,2%)27,9%
48 (22,1%)41,7%
217 (100%)18,7%
TV series 49 (32,0%)14,1%
36 (23,5%)10,3%
50 (32,7%)14,2%
18 (11,8%)15,7%
153 (100%)13,2%
Music program
54 (46,2%)15,5%
25 (21,4%)7,2%
31 (26,5%)8,8%
7 (6,0%)6,1%
117 (100%)10,1%
Sport Progr.
71 (37,0%)20,4%
62 (32,2%)17,8%
48 (25,0%)13,7%
11 (5,7%)9,6%
192 (100%)16,5%
Films 99 (36,4%)28,4%
111 (40,8%)31,8%
55 (20,2%)15,7%
7 (2,6%)6,1%
272 (100%)23,4%
Docum.program
19 (24,1%)5,5%
27 (34,2%)7,7%
27 (34,2%)7,7%
6 (7,6%)5,2%
79 (100%)6,8%
Talk Shows
6 (14,0%)1,7%
15 (34,9%)4,3%
17 (39,5%)4,8%
5 (11,6%)4,3%
43 (100%)3,7%
Other 27 (30,0%)7,8%
25 (27,8%)7,2%
25 (27,8%)7,2%
13 (14,4%)11,3%
90 (100%)7,7%
TOTAL 348 (29,9%)100%
349 (30,0%)100%
351 (30,2%)100%
115 (9,9%)100%
1163 (100%)100%
99 In N.Abercrombie:In N.Abercrombie: Television and Society, Polity Press, Oxford, 1996.
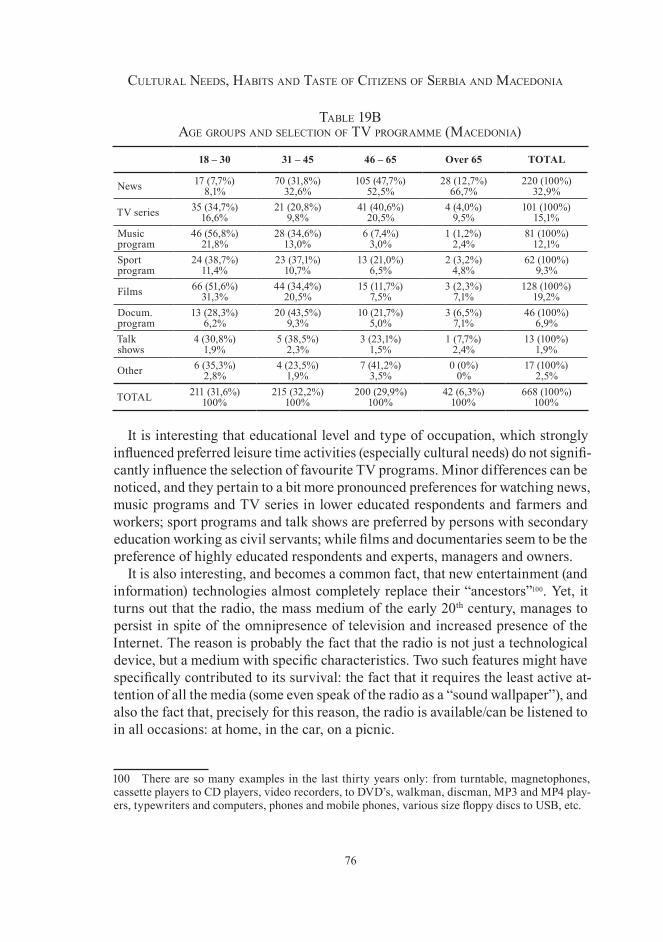
76
Cultural Needs, Habits aNd taste of CitizeNs of serbia aNd MaCedoNia
table 19b age groups aNd seleCtioN of tv prograMMe (MaCedoNia)
18 – 30 31 – 45 46 – 65 Over 65 TOTAL
News 17 (7,7%)8,1%
70 (31,8%)32,6%
105 (47,7%)52,5%
28 (12,7%)66,7%
220 (100%)32,9%
TV series 35 (34,7%)16,6%
21 (20,8%)9,8%
41 (40,6%)20,5%
4 (4,0%)9,5%
101 (100%)15,1%
Music program
46 (56,8%)21,8%
28 (34,6%)13,0%
6 (7,4%)3,0%
1 (1,2%)2,4%
81 (100%)12,1%
Sport program
24 (38,7%)11,4%
23 (37,1%)10,7%
13 (21,0%)6,5%
2 (3,2%)4,8%
62 (100%)9,3%
Films 66 (51,6%)31,3%
44 (34,4%)20,5%
15 (11,7%)7,5%
3 (2,3%)7,1%
128 (100%)19,2%
Docum.program
13 (28,3%)6,2%
20 (43,5%)9,3%
10 (21,7%)5,0%
3 (6,5%)7,1%
46 (100%)6,9%
Talk shows
4 (30,8%)1,9%
5 (38,5%)2,3%
3 (23,1%)1,5%
1 (7,7%)2,4%
13 (100%)1,9%
Other 6 (35,3%)2,8%
4 (23,5%)1,9%
7 (41,2%)3,5%
0 (0%)0%
17 (100%)2,5%
TOTAL 211 (31,6%)100%
215 (32,2%)100%
200 (29,9%)100%
42 (6,3%)100%
668 (100%)100%
It is interesting that educational level and type of occupation, which strongly influenced preferred leisure time activities (especially cultural needs) do not signifi-cantly influence the selection of favourite TV programs. Minor differences can be noticed, and they pertain to a bit more pronounced preferences for watching news, music programs and TV series in lower educated respondents and farmers and workers; sport programs and talk shows are preferred by persons with secondary education working as civil servants; while films and documentaries seem to be the preference of highly educated respondents and experts, managers and owners.
It is also interesting, and becomes a common fact, that new entertainment (and information) technologies almost completely replace their “ancestors”100. Yet, it turns out that the radio, the mass medium of the early 20th century, manages to persist in spite of the omnipresence of television and increased presence of the Internet. The reason is probably the fact that the radio is not just a technological device, but a medium with specific characteristics. Two such features might have specifically contributed to its survival: the fact that it requires the least active at-tention of all the media (some even speak of the radio as a “sound wallpaper”), and also the fact that, precisely for this reason, the radio is available/can be listened to in all occasions: at home, in the car, on a picnic.
100 There are so many examples in the last thirty years only: from turntable, magnetophones, cassette players to CD players, video recorders, to DVD’s, walkman, discman, MP3 and MP4 play-ers, typewriters and computers, phones and mobile phones, various size floppy discs to USB, etc.
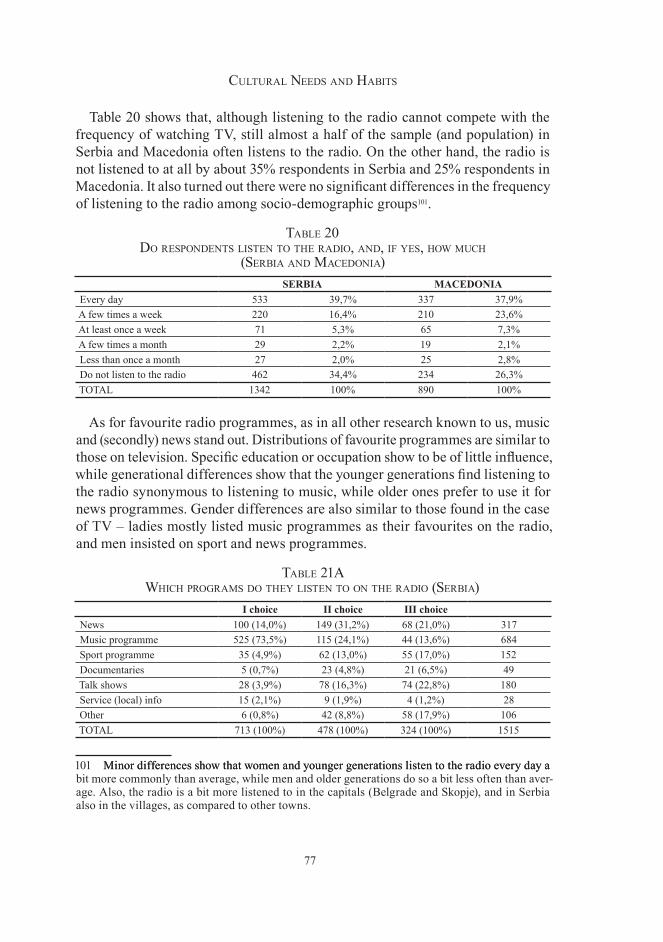
77
Cultural Needs aNd Habits
Table 20 shows that, although listening to the radio cannot compete with the frequency of watching TV, still almost a half of the sample (and population) in Serbia and Macedonia often listens to the radio. On the other hand, the radio is not listened to at all by about 35% respondents in Serbia and 25% respondents in Macedonia. It also turned out there were no significant differences in the frequency of listening to the radio among socio-demographic groups101.
table 20 do respoNdeNts listeN to tHe radio, aNd, if yes, How MuCH
(serbia aNd MaCedoNia)SERBIA MACEDONIA
Every day 533 39,7% 337 37,9%A few times a week 220 16,4% 210 23,6%At least once a week 71 5,3% 65 7,3%A few times a month 29 2,2% 19 2,1%Less than once a month 27 2,0% 25 2,8%Do not listen to the radio 462 34,4% 234 26,3%TOTAL 1342 100% 890 100%
As for favourite radio programmes, as in all other research known to us, music and (secondly) news stand out. Distributions of favourite programmes are similar to those on television. Specific education or occupation show to be of little influence, while generational differences show that the younger generations find listening to the radio synonymous to listening to music, while older ones prefer to use it for news programmes. Gender differences are also similar to those found in the case of TV – ladies mostly listed music programmes as their favourites on the radio, and men insisted on sport and news programmes.
table 21a wHiCH prograMs do tHey listeN to oN tHe radio (serbia)
I choice II choice III choiceNews 100 (14,0%) 149 (31,2%) 68 (21,0%) 317Music programme 525 (73,5%) 115 (24,1%) 44 (13,6%) 684Sport programme 35 (4,9%) 62 (13,0%) 55 (17,0%) 152Documentaries 5 (0,7%) 23 (4,8%) 21 (6,5%) 49Talk shows 28 (3,9%) 78 (16,3%) 74 (22,8%) 180Service (local) info 15 (2,1%) 9 (1,9%) 4 (1,2%) 28Other 6 (0,8%) 42 (8,8%) 58 (17,9%) 106TOTAL 713 (100%) 478 (100%) 324 (100%) 1515
101 Minor differences show that women and younger generations listen to the radio every day aMinor differences show that women and younger generations listen to the radio every day a bit more commonly than average, while men and older generations do so a bit less often than aver-age. Also, the radio is a bit more listened to in the capitals (Belgrade and Skopje), and in Serbia also in the villages, as compared to other towns.
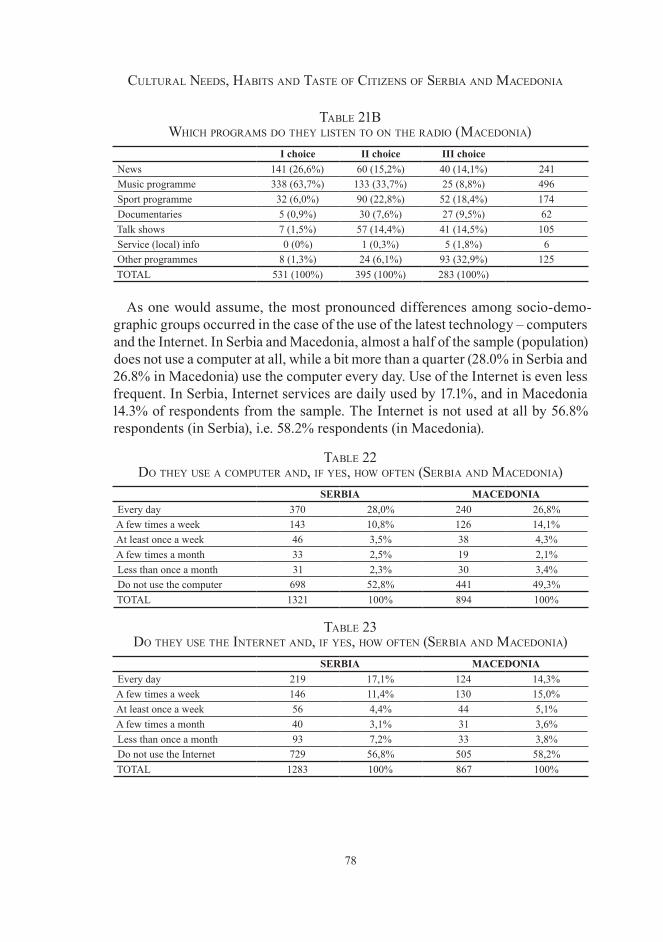
78
Cultural Needs, Habits aNd taste of CitizeNs of serbia aNd MaCedoNia
table 21b wHiCH prograMs do tHey listeN to oN tHe radio (MaCedoNia)
I choice II choice III choiceNews 141 (26,6%) 60 (15,2%) 40 (14,1%) 241Music programme 338 (63,7%) 133 (33,7%) 25 (8,8%) 496Sport programme 32 (6,0%) 90 (22,8%) 52 (18,4%) 174Documentaries 5 (0,9%) 30 (7,6%) 27 (9,5%) 62Talk shows 7 (1,5%) 57 (14,4%) 41 (14,5%) 105Service (local) info 0 (0%) 1 (0,3%) 5 (1,8%) 6Other programmes 8 (1,3%) 24 (6,1%) 93 (32,9%) 125TOTAL 531 (100%) 395 (100%) 283 (100%)
As one would assume, the most pronounced differences among socio-demo-graphic groups occurred in the case of the use of the latest technology – computers and the Internet. In Serbia and Macedonia, almost a half of the sample (population) does not use a computer at all, while a bit more than a quarter (28.0% in Serbia and 26.8% in Macedonia) use the computer every day. Use of the Internet is even less frequent. In Serbia, Internet services are daily used by 17.1%, and in Macedonia 14.3% of respondents from the sample. The Internet is not used at all by 56.8% respondents (in Serbia), i.e. 58.2% respondents (in Macedonia).
table 22 do tHey use a CoMputer aNd, if yes, How ofteN (serbia aNd MaCedoNia)
SERBIA MACEDONIAEvery day 370 28,0% 240 26,8%A few times a week 143 10,8% 126 14,1%At least once a week 46 3,5% 38 4,3%A few times a month 33 2,5% 19 2,1%Less than once a month 31 2,3% 30 3,4%Do not use the computer 698 52,8% 441 49,3%TOTAL 1321 100% 894 100%
table 2� do tHey use tHe iNterNet aNd, if yes, How ofteN (serbia aNd MaCedoNia)
SERBIA MACEDONIAEvery day 219 17,1% 124 14,3%A few times a week 146 11,4% 130 15,0%At least once a week 56 4,4% 44 5,1%A few times a month 40 3,1% 31 3,6%Less than once a month 93 7,2% 33 3,8%Do not use the Internet 729 56,8% 505 58,2%TOTAL 1283 100% 867 100%
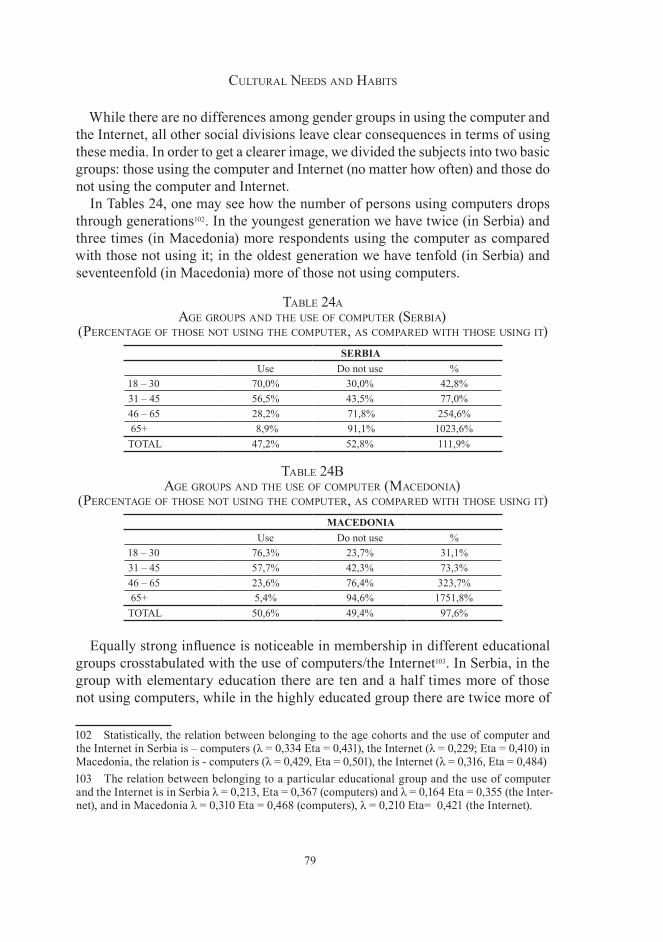
79
Cultural Needs aNd Habits
While there are no differences among gender groups in using the computer and the Internet, all other social divisions leave clear consequences in terms of using these media. In order to get a clearer image, we divided the subjects into two basic groups: those using the computer and Internet (no matter how often) and those do not using the computer and Internet.
In Tables 24, one may see how the number of persons using computers drops through generations102. In the youngest generation we have twice (in Serbia) and three times (in Macedonia) more respondents using the computer as compared with those not using it; in the oldest generation we have tenfold (in Serbia) and seventeenfold (in Macedonia) more of those not using computers.
table 24a age groups aNd tHe use of CoMputer (serbia)
(perCeNtage of tHose Not usiNg tHe CoMputer, as CoMpared witH tHose usiNg it)SERBIA
Use Do not use % 18 – 30 70,0% 30,0% 42,8%31 – 45 56,5% 43,5% 77,0%46 – 65 28,2% 71,8% 254,6% 65+ 8,9% 91,1% 1023,6%TOTAL 47,2% 52,8% 111,9%
table 24b age groups aNd tHe use of CoMputer (MaCedoNia)
(perCeNtage of tHose Not usiNg tHe CoMputer, as CoMpared witH tHose usiNg it)MACEDONIA
Use Do not use % 18 – 30 76,3% 23,7% 31,1%31 – 45 57,7% 42,3% 73,3%46 – 65 23,6% 76,4% 323,7% 65+ 5,4% 94,6% 1751,8%TOTAL 50,6% 49,4% 97,6%
Equally strong influence is noticeable in membership in different educational groups crosstabulated with the use of computers/the Internet103. In Serbia, in the group with elementary education there are ten and a half times more of those not using computers, while in the highly educated group there are twice more of
102 Statistically, the relation between belonging to the age cohorts and the use of computer and the Internet in Serbia is – computers (λ = 0,334 Eta = 0,431), the Internet (λ = 0,229; Eta = 0,410) in Macedonia, the relation is - computers (λ = 0,429, Eta = 0,501), the Internet (λ = 0,316, Eta = 0,484)103 The relation between belonging to a particular educational group and the use of computer and the Internet is in Serbia λ = 0,213, Eta = 0,367 (computers) and λ = 0,164 Eta = 0,355 (the Inter-net), and in Macedonia λ = 0,310 Eta = 0,468 (computers), λ = 0,210 Eta= 0,421 (the Internet).
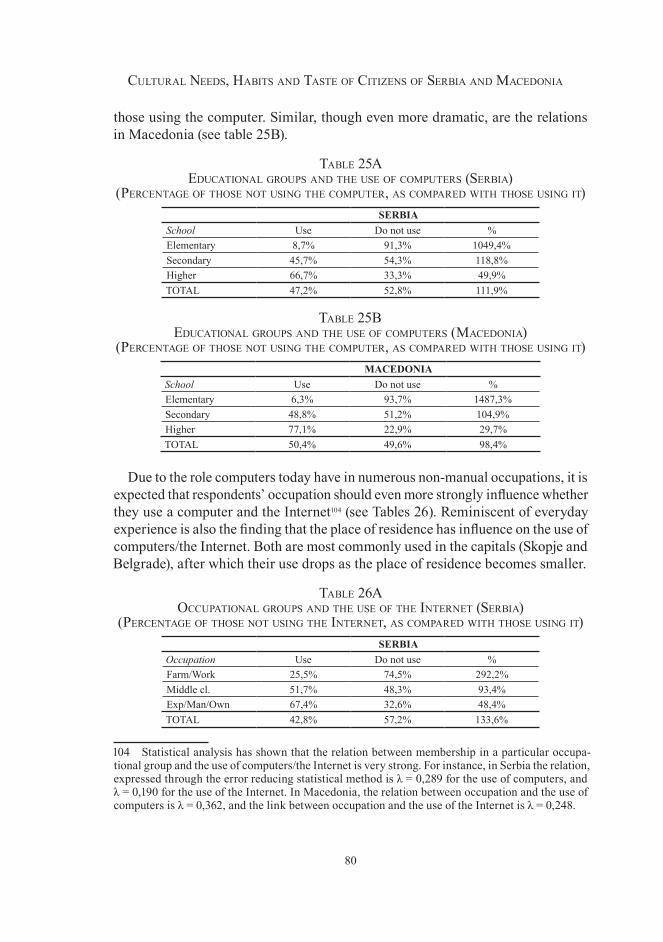
80
Cultural Needs, Habits aNd taste of CitizeNs of serbia aNd MaCedoNia
those using the computer. Similar, though even more dramatic, are the relations in Macedonia (see table 25B).
table 25a eduCatioNal groups aNd tHe use of CoMputers (serbia)
(perCeNtage of tHose Not usiNg tHe CoMputer, as CoMpared witH tHose usiNg it)SERBIA
School Use Do not use % Elementary 8,7% 91,3% 1049,4%Secondary 45,7% 54,3% 118,8%Higher 66,7% 33,3% 49,9%TOTAL 47,2% 52,8% 111,9%
table 25b eduCatioNal groups aNd tHe use of CoMputers (MaCedoNia)
(perCeNtage of tHose Not usiNg tHe CoMputer, as CoMpared witH tHose usiNg it)MACEDONIA
School Use Do not use % Elementary 6,3% 93,7% 1487,3% Secondary 48,8% 51,2% 104,9%Higher 77,1% 22,9% 29,7%TOTAL 50,4% 49,6% 98,4%
Due to the role computers today have in numerous non-manual occupations, it is expected that respondents’ occupation should even more strongly influence whether they use a computer and the Internet104 (see Tables 26). Reminiscent of everyday experience is also the finding that the place of residence has influence on the use of computers/the Internet. Both are most commonly used in the capitals (Skopje and Belgrade), after which their use drops as the place of residence becomes smaller.
table 26a oCCupatioNal groups aNd tHe use of tHe iNterNet (serbia)
(perCeNtage of tHose Not usiNg tHe iNterNet, as CoMpared witH tHose usiNg it)SERBIA
Occupation Use Do not use % Farm/Work 25,5% 74,5% 292,2%Middle cl. 51,7% 48,3% 93,4%Exp/Man/Own 67,4% 32,6% 48,4%TOTAL 42,8% 57,2% 133,6%
104 Statistical analysis has shown that the relation between membership in a particular occupa-tional group and the use of computers/the Internet is very strong. For instance, in Serbia the relation, expressed through the error reducing statistical method is λ = 0,289 for the use of computers, and λ = 0,190 for the use of the Internet. In Macedonia, the relation between occupation and the use of computers is λ = 0,362, and the link between occupation and the use of the Internet is λ = 0,248.
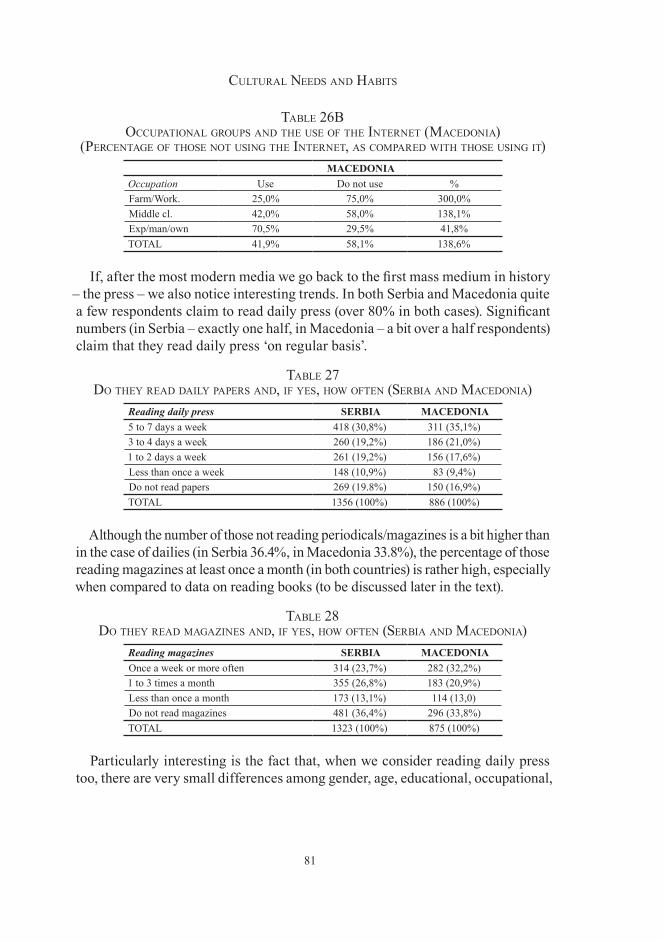
81
Cultural Needs aNd Habits
table 26b oCCupatioNal groups aNd tHe use of tHe iNterNet (MaCedoNia)
(perCeNtage of tHose Not usiNg tHe iNterNet, as CoMpared witH tHose usiNg it)MACEDONIA
Occupation Use Do not use % Farm/Work. 25,0% 75,0% 300,0%Middle cl. 42,0% 58,0% 138,1%Exp/man/own 70,5% 29,5% 41,8%TOTAL 41,9% 58,1% 138,6%
If, after the most modern media we go back to the first mass medium in history – the press – we also notice interesting trends. In both Serbia and Macedonia quite a few respondents claim to read daily press (over 80% in both cases). Significant numbers (in Serbia – exactly one half, in Macedonia – a bit over a half respondents) claim that they read daily press ‘on regular basis’.
table 27 do tHey read daily papers aNd, if yes, How ofteN (serbia aNd MaCedoNia)
Reading daily press SERBIA MACEDONIA5 to 7 days a week 418 (30,8%) 311 (35,1%)3 to 4 days a week 260 (19,2%) 186 (21,0%)1 to 2 days a week 261 (19,2%) 156 (17,6%)Less than once a week 148 (10,9%) 83 (9,4%)Do not read papers 269 (19.8%) 150 (16,9%)TOTAL 1356 (100%) 886 (100%)
Although the number of those not reading periodicals/magazines is a bit higher than in the case of dailies (in Serbia 36.4%, in Macedonia 33.8%), the percentage of those reading magazines at least once a month (in both countries) is rather high, especially when compared to data on reading books (to be discussed later in the text).
table 28 do tHey read MagaziNes aNd, if yes, How ofteN (serbia aNd MaCedoNia)
Reading magazines SERBIA MACEDONIAOnce a week or more often 314 (23,7%) 282 (32,2%)1 to 3 times a month 355 (26,8%) 183 (20,9%)Less than once a month 173 (13,1%) 114 (13,0)Do not read magazines 481 (36,4%) 296 (33,8%)TOTAL 1323 (100%) 875 (100%)
Particularly interesting is the fact that, when we consider reading daily press too, there are very small differences among gender, age, educational, occupational,
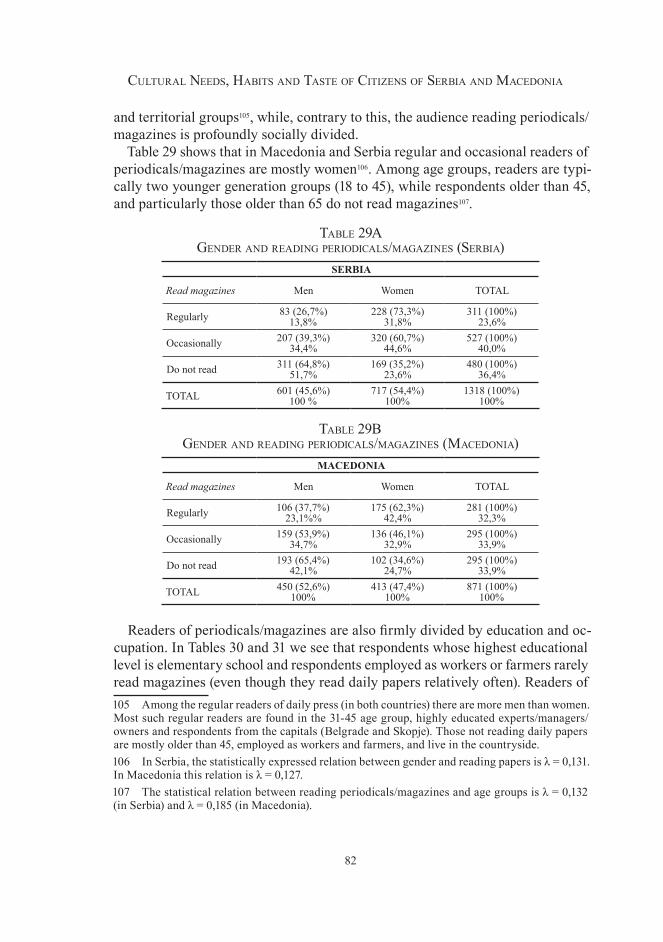
82
Cultural Needs, Habits aNd taste of CitizeNs of serbia aNd MaCedoNia
and territorial groups105, while, contrary to this, the audience reading periodicals/magazines is profoundly socially divided.
Table 29 shows that in Macedonia and Serbia regular and occasional readers of periodicals/magazines are mostly women106. Among age groups, readers are typi-cally two younger generation groups (18 to 45), while respondents older than 45, and particularly those older than 65 do not read magazines107.
table 29a geNder aNd readiNg periodiCals/MagaziNes (serbia)
SERBIA
Read magazines Men Women TOTAL
Regularly 83 (26,7%)13,8%
228 (73,3%)31,8%
311 (100%)23,6%
Occasionally 207 (39,3%)34,4%
320 (60,7%)44,6%
527 (100%)40,0%
Do not read 311 (64,8%)51,7%
169 (35,2%)23,6%
480 (100%)36,4%
TOTAL 601 (45,6%)100 %
717 (54,4%)100%
1318 (100%)100%
table 29b geNder aNd readiNg periodiCals/MagaziNes (MaCedoNia)
MACEDONIA
Read magazines Men Women TOTAL
Regularly 106 (37,7%)23,1%%
175 (62,3%)42,4%
281 (100%)32,3%
Occasionally 159 (53,9%)34,7%
136 (46,1%)32,9%
295 (100%)33,9%
Do not read 193 (65,4%)42,1%
102 (34,6%)24,7%
295 (100%)33,9%
TOTAL 450 (52,6%)100%
413 (47,4%)100%
871 (100%)100%
Readers of periodicals/magazines are also firmly divided by education and oc-cupation. In Tables 30 and 31 we see that respondents whose highest educational level is elementary school and respondents employed as workers or farmers rarely read magazines (even though they read daily papers relatively often). Readers of 105 Among the regular readers of daily press (in both countries) there are more men than women. Most such regular readers are found in the 31-45 age group, highly educated experts/managers/owners and respondents from the capitals (Belgrade and Skopje). Those not reading daily papers are mostly older than 45, employed as workers and farmers, and live in the countryside. 106 In Serbia, the statistically expressed relation between gender and reading papers is λ = 0,131. In Macedonia this relation is λ = 0,127. 107 The statistical relation between reading periodicals/magazines and age groups is λ = 0,132 (in Serbia) and λ = 0,185 (in Macedonia).
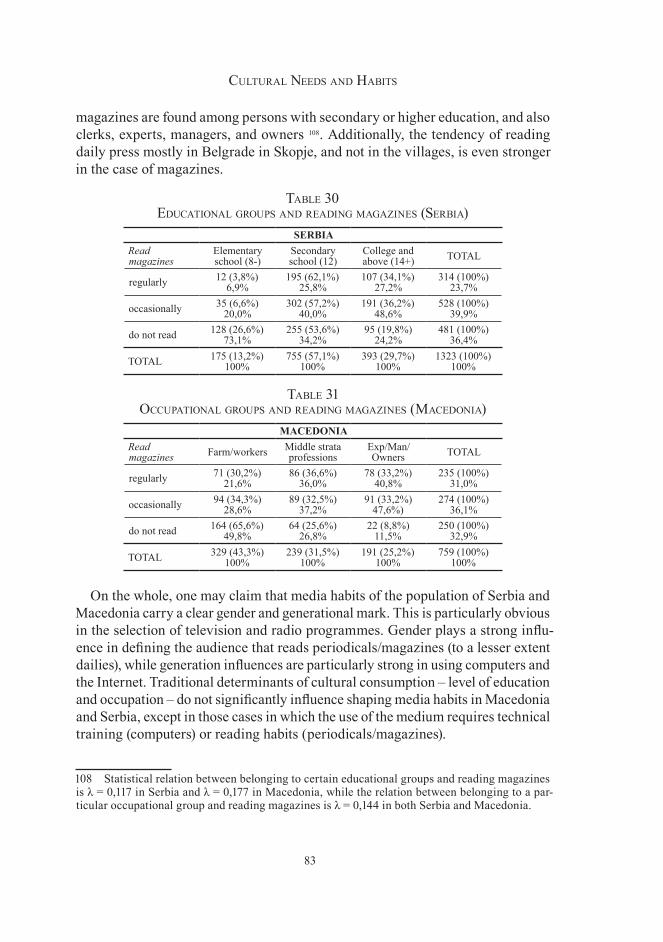
83
Cultural Needs aNd Habits
magazines are found among persons with secondary or higher education, and also clerks, experts, managers, and owners 108. Additionally, the tendency of reading daily press mostly in Belgrade in Skopje, and not in the villages, is even stronger in the case of magazines.
table �0 eduCatioNal groups aNd readiNg MagaziNes (serbia)
SERBIARead magazines
Elementary school (8-)
Secondary school (12)
College and above (14+) TOTAL
regularly 12 (3,8%)6,9%
195 (62,1%)25,8%
107 (34,1%)27,2%
314 (100%)23,7%
occasionally 35 (6,6%)20,0%
302 (57,2%)40,0%
191 (36,2%)48,6%
528 (100%)39,9%
do not read 128 (26,6%)73,1%
255 (53,6%)34,2%
95 (19,8%)24,2%
481 (100%)36,4%
TOTAL 175 (13,2%)100%
755 (57,1%)100%
393 (29,7%)100%
1323 (100%)100%
table �1 oCCupatioNal groups aNd readiNg MagaziNes (MaCedoNia)
MACEDONIARead magazines Farm/workers Middle strata
professionsExp/Man/Owners TOTAL
regularly 71 (30,2%)21,6%
86 (36,6%)36,0%
78 (33,2%)40,8%
235 (100%)31,0%
occasionally 94 (34,3%)28,6%
89 (32,5%)37,2%
91 (33,2%)47,6%)
274 (100%)36,1%
do not read 164 (65,6%)49,8%
64 (25,6%)26,8%
22 (8,8%)11,5%
250 (100%)32,9%
TOTAL 329 (43,3%)100%
239 (31,5%)100%
191 (25,2%)100%
759 (100%)100%
On the whole, one may claim that media habits of the population of Serbia and Macedonia carry a clear gender and generational mark. This is particularly obvious in the selection of television and radio programmes. Gender plays a strong influ-ence in defining the audience that reads periodicals/magazines (to a lesser extent dailies), while generation influences are particularly strong in using computers and the Internet. Traditional determinants of cultural consumption – level of education and occupation – do not significantly influence shaping media habits in Macedonia and Serbia, except in those cases in which the use of the medium requires technical training (computers) or reading habits (periodicals/magazines).
108 Statistical relation between belonging to certain educational groups and reading magazines is λ = 0,117 in Serbia and λ = 0,177 in Macedonia, while the relation between belonging to a par-ticular occupational group and reading magazines is λ = 0,144 in both Serbia and Macedonia.
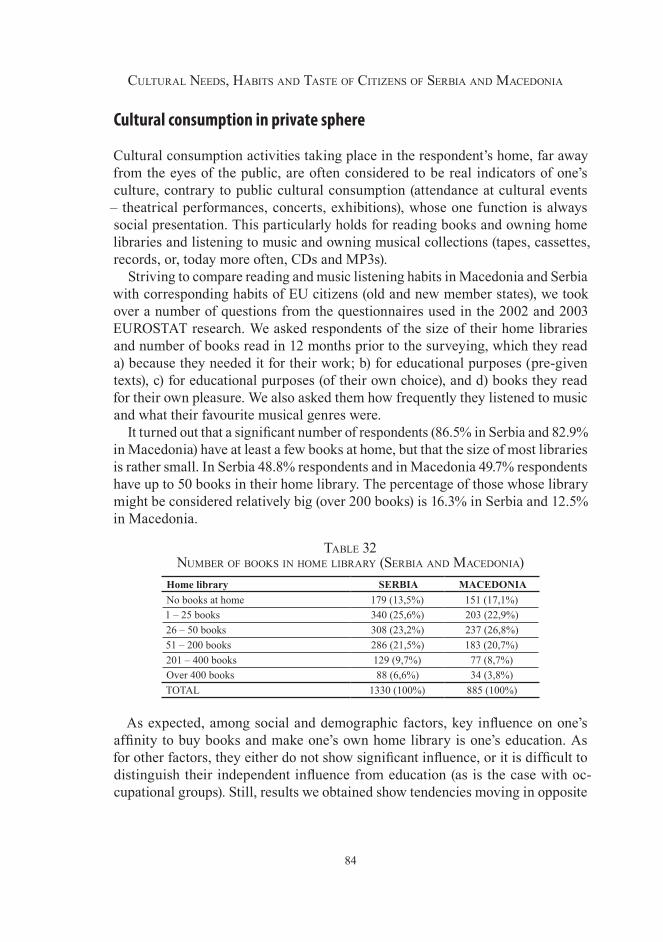
84
Cultural Needs, Habits aNd taste of CitizeNs of serbia aNd MaCedoNia
Cultural consumption in private sphere
Cultural consumption activities taking place in the respondent’s home, far away from the eyes of the public, are often considered to be real indicators of one’s culture, contrary to public cultural consumption (attendance at cultural events – theatrical performances, concerts, exhibitions), whose one function is always social presentation. This particularly holds for reading books and owning home libraries and listening to music and owning musical collections (tapes, cassettes, records, or, today more often, CDs and MP3s).
Striving to compare reading and music listening habits in Macedonia and Serbia with corresponding habits of EU citizens (old and new member states), we took over a number of questions from the questionnaires used in the 2002 and 2003 EUROSTAT research. We asked respondents of the size of their home libraries and number of books read in 12 months prior to the surveying, which they read a) because they needed it for their work; b) for educational purposes (pre-given texts), c) for educational purposes (of their own choice), and d) books they read for their own pleasure. We also asked them how frequently they listened to music and what their favourite musical genres were.
It turned out that a significant number of respondents (86.5% in Serbia and 82.9% in Macedonia) have at least a few books at home, but that the size of most libraries is rather small. In Serbia 48.8% respondents and in Macedonia 49.7% respondents have up to 50 books in their home library. The percentage of those whose library might be considered relatively big (over 200 books) is 16.3% in Serbia and 12.5% in Macedonia.
table �2 NuMber of books iN HoMe library (serbia aNd MaCedoNia)
Home library SERBIA MACEDONIANo books at home 179 (13,5%) 151 (17,1%)1 – 25 books 340 (25,6%) 203 (22,9%)26 – 50 books 308 (23,2%) 237 (26,8%)51 – 200 books 286 (21,5%) 183 (20,7%)201 – 400 books 129 (9,7%) 77 (8,7%)Over 400 books 88 (6,6%) 34 (3,8%)TOTAL 1330 (100%) 885 (100%)
As expected, among social and demographic factors, key influence on one’s affinity to buy books and make one’s own home library is one’s education. As for other factors, they either do not show significant influence, or it is difficult to distinguish their independent influence from education (as is the case with oc-cupational groups). Still, results we obtained show tendencies moving in opposite
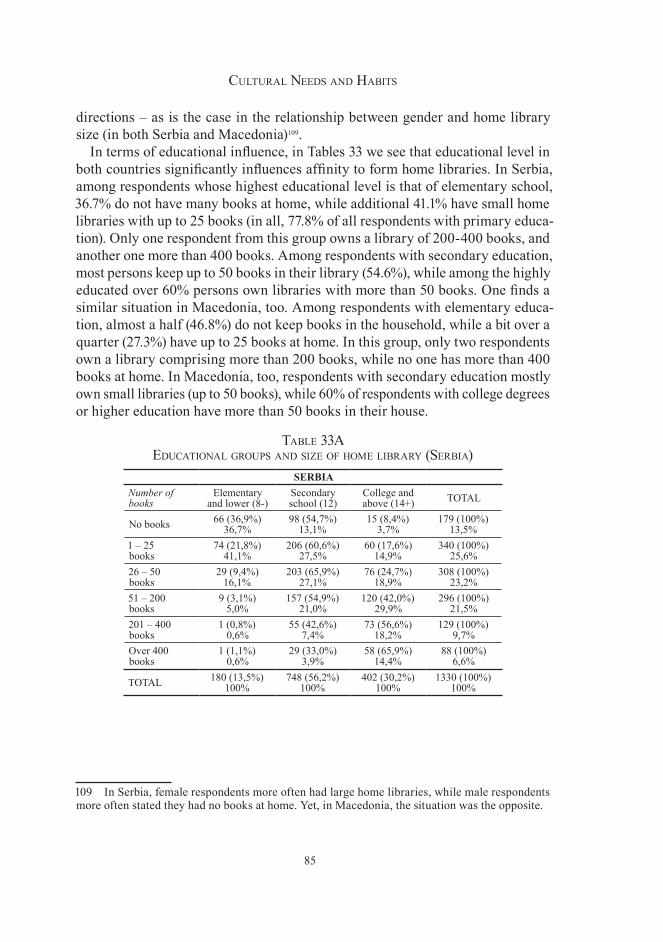
85
Cultural Needs aNd Habits
directions – as is the case in the relationship between gender and home library size (in both Serbia and Macedonia)109.
In terms of educational influence, in Tables 33 we see that educational level in both countries significantly influences affinity to form home libraries. In Serbia, among respondents whose highest educational level is that of elementary school, 36.7% do not have many books at home, while additional 41.1% have small home libraries with up to 25 books (in all, 77.8% of all respondents with primary educa-tion). Only one respondent from this group owns a library of 200-400 books, and another one more than 400 books. Among respondents with secondary education, most persons keep up to 50 books in their library (54.6%), while among the highly educated over 60% persons own libraries with more than 50 books. One finds a similar situation in Macedonia, too. Among respondents with elementary educa-tion, almost a half (46.8%) do not keep books in the household, while a bit over a quarter (27.3%) have up to 25 books at home. In this group, only two respondents own a library comprising more than 200 books, while no one has more than 400 books at home. In Macedonia, too, respondents with secondary education mostly own small libraries (up to 50 books), while 60% of respondents with college degrees or higher education have more than 50 books in their house.
table ��a eduCatioNal groups aNd size of HoMe library (serbia)
SERBIANumber of books
Elementary and lower (8-)
Secondary school (12)
College and above (14+) TOTAL
No books 66 (36,9%)36,7%
98 (54,7%)13,1%
15 (8,4%)3,7%
179 (100%)13,5%
1 – 25 books
74 (21,8%)41,1%
206 (60,6%)27,5%
60 (17,6%)14,9%
340 (100%)25,6%
26 – 50 books
29 (9,4%)16,1%
203 (65,9%)27,1%
76 (24,7%)18,9%
308 (100%)23,2%
51 – 200 books
9 (3,1%)5,0%
157 (54,9%)21,0%
120 (42,0%)29,9%
296 (100%)21,5%
201 – 400 books
1 (0,8%)0,6%
55 (42,6%)7,4%
73 (56,6%)18,2%
129 (100%)9,7%
Over 400 books
1 (1,1%)0,6%
29 (33,0%)3,9%
58 (65,9%)14,4%
88 (100%)6,6%
TOTAL 180 (13,5%)100%
748 (56,2%)100%
402 (30,2%)100%
1330 (100%)100%
109 In Serbia, female respondents more often had large home libraries, while male respondents more often stated they had no books at home. Yet, in Macedonia, the situation was the opposite.
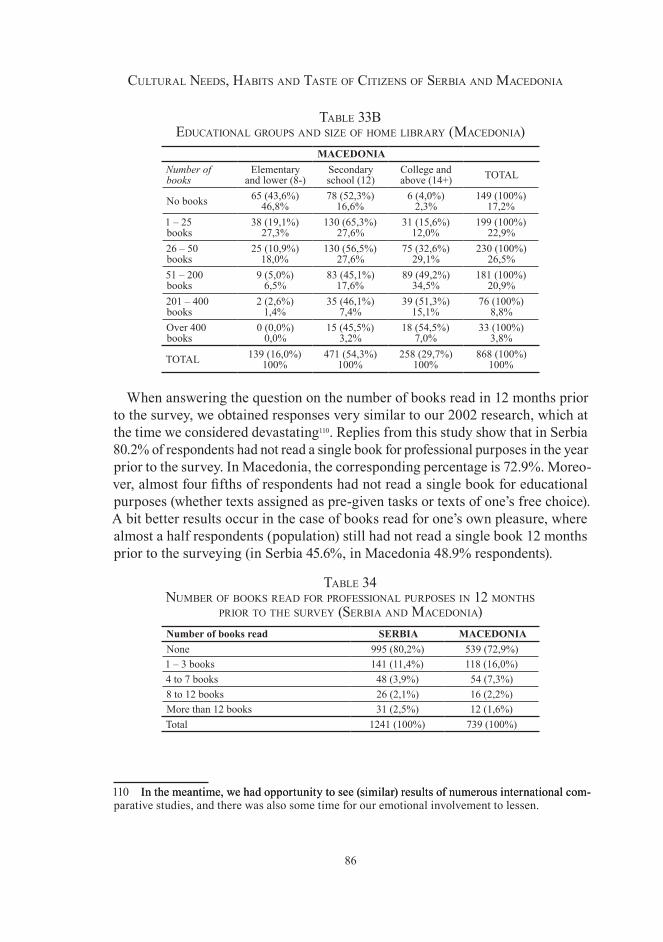
86
Cultural Needs, Habits aNd taste of CitizeNs of serbia aNd MaCedoNia
table ��b eduCatioNal groups aNd size of HoMe library (MaCedoNia)
MACEDONIANumber of books
Elementary and lower (8-)
Secondary school (12)
College and above (14+) TOTAL
No books 65 (43,6%)46,8%
78 (52,3%)16,6%
6 (4,0%)2,3%
149 (100%)17,2%
1 – 25 books
38 (19,1%)27,3%
130 (65,3%)27,6%
31 (15,6%)12,0%
199 (100%)22,9%
26 – 50 books
25 (10,9%)18,0%
130 (56,5%)27,6%
75 (32,6%)29,1%
230 (100%)26,5%
51 – 200 books
9 (5,0%)6,5%
83 (45,1%)17,6%
89 (49,2%)34,5%
181 (100%)20,9%
201 – 400 books
2 (2,6%)1,4%
35 (46,1%)7,4%
39 (51,3%)15,1%
76 (100%)8,8%
Over 400 books
0 (0,0%)0,0%
15 (45,5%)3,2%
18 (54,5%)7,0%
33 (100%)3,8%
TOTAL 139 (16,0%)100%
471 (54,3%)100%
258 (29,7%)100%
868 (100%)100%
When answering the question on the number of books read in 12 months prior to the survey, we obtained responses very similar to our 2002 research, which at the time we considered devastating110. Replies from this study show that in Serbia 80.2% of respondents had not read a single book for professional purposes in the year prior to the survey. In Macedonia, the corresponding percentage is 72.9%. Moreo-ver, almost four fifths of respondents had not read a single book for educational purposes (whether texts assigned as pre-given tasks or texts of one’s free choice). A bit better results occur in the case of books read for one’s own pleasure, where almost a half respondents (population) still had not read a single book 12 months prior to the surveying (in Serbia 45.6%, in Macedonia 48.9% respondents).
table �4 NuMber of books read for professioNal purposes iN 12 MoNtHs
prior to tHe survey (serbia aNd MaCedoNia)Number of books read SERBIA MACEDONIANone 995 (80,2%) 539 (72,9%)1 – 3 books 141 (11,4%) 118 (16,0%)4 to 7 books 48 (3,9%) 54 (7,3%)8 to 12 books 26 (2,1%) 16 (2,2%)More than 12 books 31 (2,5%) 12 (1,6%)Total 1241 (100%) 739 (100%)
110 In the meantime, we had opportunity to see (similar) results of numerous international com-In the meantime, we had opportunity to see (similar) results of numerous international com-parative studies, and there was also some time for our emotional involvement to lessen.
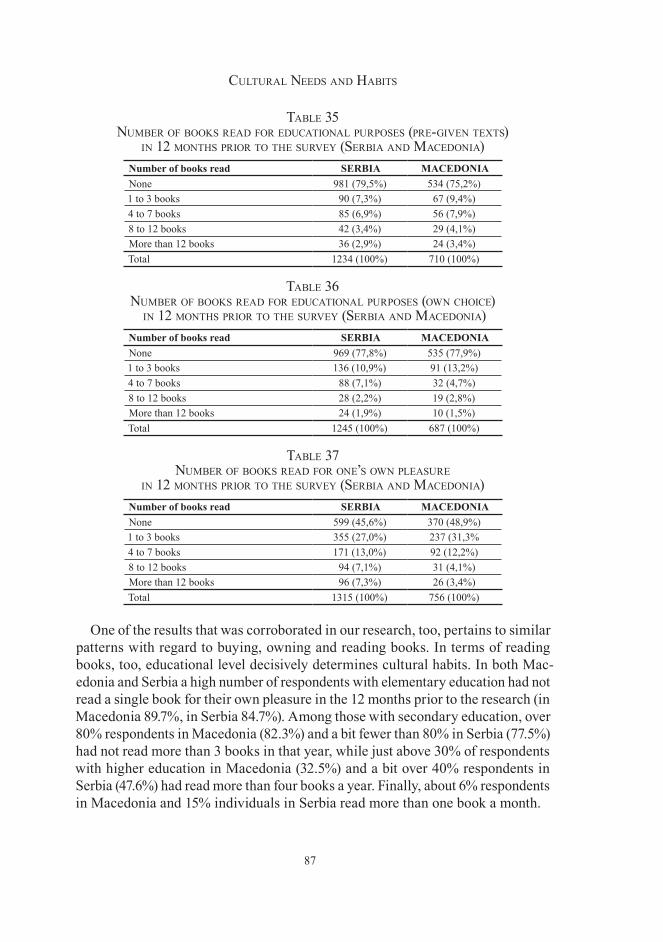
87
Cultural Needs aNd Habits
table �5 NuMber of books read for eduCatioNal purposes (pre-giveN texts)
iN 12 MoNtHs prior to tHe survey (serbia aNd MaCedoNia)Number of books read SERBIA MACEDONIANone 981 (79,5%) 534 (75,2%)1 to 3 books 90 (7,3%) 67 (9,4%)4 to 7 books 85 (6,9%) 56 (7,9%)8 to 12 books 42 (3,4%) 29 (4,1%)More than 12 books 36 (2,9%) 24 (3,4%)Total 1234 (100%) 710 (100%)
table �6 NuMber of books read for eduCatioNal purposes (owN CHoiCe)
iN 12 MoNtHs prior to tHe survey (serbia aNd MaCedoNia)Number of books read SERBIA MACEDONIANone 969 (77,8%) 535 (77,9%)1 to 3 books 136 (10,9%) 91 (13,2%)4 to 7 books 88 (7,1%) 32 (4,7%)8 to 12 books 28 (2,2%) 19 (2,8%)More than 12 books 24 (1,9%) 10 (1,5%)Total 1245 (100%) 687 (100%)
table �7 NuMber of books read for oNe’s owN pleasure
iN 12 MoNtHs prior to tHe survey (serbia aNd MaCedoNia) Number of books read SERBIA MACEDONIANone 599 (45,6%) 370 (48,9%)1 to 3 books 355 (27,0%) 237 (31,3%4 to 7 books 171 (13,0%) 92 (12,2%)8 to 12 books 94 (7,1%) 31 (4,1%)More than 12 books 96 (7,3%) 26 (3,4%)Total 1315 (100%) 756 (100%)
One of the results that was corroborated in our research, too, pertains to similar patterns with regard to buying, owning and reading books. In terms of reading books, too, educational level decisively determines cultural habits. In both Mac-edonia and Serbia a high number of respondents with elementary education had not read a single book for their own pleasure in the 12 months prior to the research (in Macedonia 89.7%, in Serbia 84.7%). Among those with secondary education, over 80% respondents in Macedonia (82.3%) and a bit fewer than 80% in Serbia (77.5%) had not read more than 3 books in that year, while just above 30% of respondents with higher education in Macedonia (32.5%) and a bit over 40% respondents in Serbia (47.6%) had read more than four books a year. Finally, about 6% respondents in Macedonia and 15% individuals in Serbia read more than one book a month.
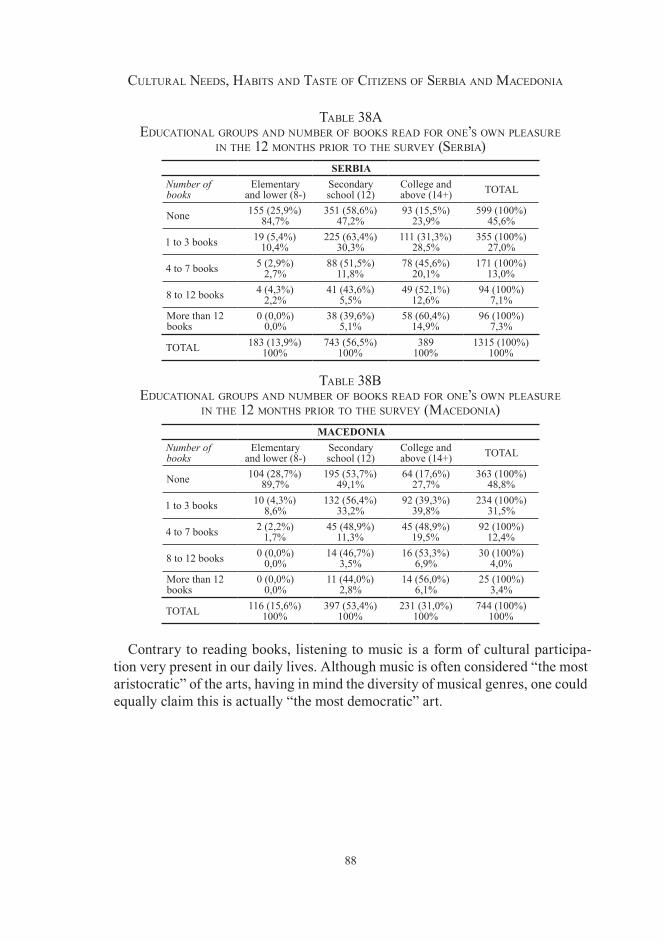
88
Cultural Needs, Habits aNd taste of CitizeNs of serbia aNd MaCedoNia
table �8a eduCatioNal groups aNd NuMber of books read for oNe’s owN pleasure
iN tHe 12 MoNtHs prior to tHe survey (serbia)SERBIA
Number of books
Elementary and lower (8-)
Secondary school (12)
College and above (14+) TOTAL
None 155 (25,9%)84,7%
351 (58,6%)47,2%
93 (15,5%)23,9%
599 (100%)45,6%
1 to 3 books 19 (5,4%)10,4%
225 (63,4%)30,3%
111 (31,3%)28,5%
355 (100%)27,0%
4 to 7 books 5 (2,9%)2,7%
88 (51,5%)11,8%
78 (45,6%)20,1%
171 (100%)13,0%
8 to 12 books 4 (4,3%)2,2%
41 (43,6%)5,5%
49 (52,1%)12,6%
94 (100%)7,1%
More than 12 books
0 (0,0%)0,0%
38 (39,6%)5,1%
58 (60,4%)14,9%
96 (100%)7,3%
TOTAL 183 (13,9%)100%
743 (56,5%)100%
389100%
1315 (100%)100%
table �8b eduCatioNal groups aNd NuMber of books read for oNe’s owN pleasure
iN tHe 12 MoNtHs prior to tHe survey (MaCedoNia)MACEDONIA
Number of books
Elementary and lower (8-)
Secondary school (12)
College and above (14+) TOTAL
None 104 (28,7%)89,7%
195 (53,7%)49,1%
64 (17,6%)27,7%
363 (100%)48,8%
1 to 3 books 10 (4,3%)8,6%
132 (56,4%)33,2%
92 (39,3%)39,8%
234 (100%)31,5%
4 to 7 books 2 (2,2%)1,7%
45 (48,9%)11,3%
45 (48,9%)19,5%
92 (100%)12,4%
8 to 12 books 0 (0,0%)0,0%
14 (46,7%)3,5%
16 (53,3%)6,9%
30 (100%)4,0%
More than 12 books
0 (0,0%)0,0%
11 (44,0%)2,8%
14 (56,0%)6,1%
25 (100%)3,4%
TOTAL 116 (15,6%)100%
397 (53,4%)100%
231 (31,0%)100%
744 (100%)100%
Contrary to reading books, listening to music is a form of cultural participa-tion very present in our daily lives. Although music is often considered “the most aristocratic” of the arts, having in mind the diversity of musical genres, one could equally claim this is actually “the most democratic” art.
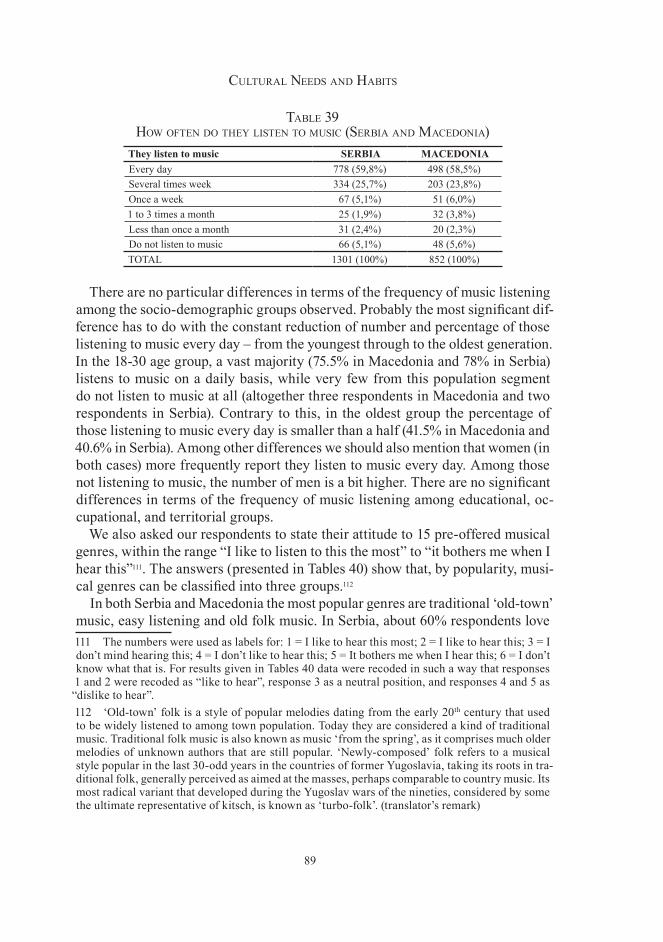
89
Cultural Needs aNd Habits
table �9 How ofteN do tHey listeN to MusiC (serbia aNd MaCedoNia)
They listen to music SERBIA MACEDONIAEvery day 778 (59,8%) 498 (58,5%)Several times week 334 (25,7%) 203 (23,8%)Once a week 67 (5,1%) 51 (6,0%)1 to 3 times a month 25 (1,9%) 32 (3,8%)Less than once a month 31 (2,4%) 20 (2,3%)Do not listen to music 66 (5,1%) 48 (5,6%)TOTAL 1301 (100%) 852 (100%)
There are no particular differences in terms of the frequency of music listening among the socio-demographic groups observed. Probably the most significant dif-ference has to do with the constant reduction of number and percentage of those listening to music every day – from the youngest through to the oldest generation. In the 18-30 age group, a vast majority (75.5% in Macedonia and 78% in Serbia) listens to music on a daily basis, while very few from this population segment do not listen to music at all (altogether three respondents in Macedonia and two respondents in Serbia). Contrary to this, in the oldest group the percentage of those listening to music every day is smaller than a half (41.5% in Macedonia and 40.6% in Serbia). Among other differences we should also mention that women (in both cases) more frequently report they listen to music every day. Among those not listening to music, the number of men is a bit higher. There are no significant differences in terms of the frequency of music listening among educational, oc-cupational, and territorial groups.
We also asked our respondents to state their attitude to 15 pre-offered musical genres, within the range “I like to listen to this the most” to “it bothers me when I hear this”111. The answers (presented in Tables 40) show that, by popularity, musi-cal genres can be classified into three groups.112
In both Serbia and Macedonia the most popular genres are traditional ‘old-town’ music, easy listening and old folk music. In Serbia, about 60% respondents love 111 The numbers were used as labels for: 1 = I like to hear this most; 2 = I like to hear this; 3 = I don’t mind hearing this; 4 = I don’t like to hear this; 5 = It bothers me when I hear this; 6 = I don’t know what that is. For results given in Tables 40 data were recoded in such a way that responses 1 and 2 were recoded as “like to hear”, response 3 as a neutral position, and responses 4 and 5 as “dislike to hear”. 112 ‘Old-town’ folk is a style of popular melodies dating from the early 20th century that used to be widely listened to among town population. Today they are considered a kind of traditional music. Traditional folk music is also known as music ‘from the spring’, as it comprises much older melodies of unknown authors that are still popular. ‘Newly-composed’ folk refers to a musical style popular in the last 30-odd years in the countries of former Yugoslavia, taking its roots in tra-ditional folk, generally perceived as aimed at the masses, perhaps comparable to country music. Its most radical variant that developed during the Yugoslav wars of the nineties, considered by some the ultimate representative of kitsch, is known as ‘turbo-folk’. (translator’s remark)
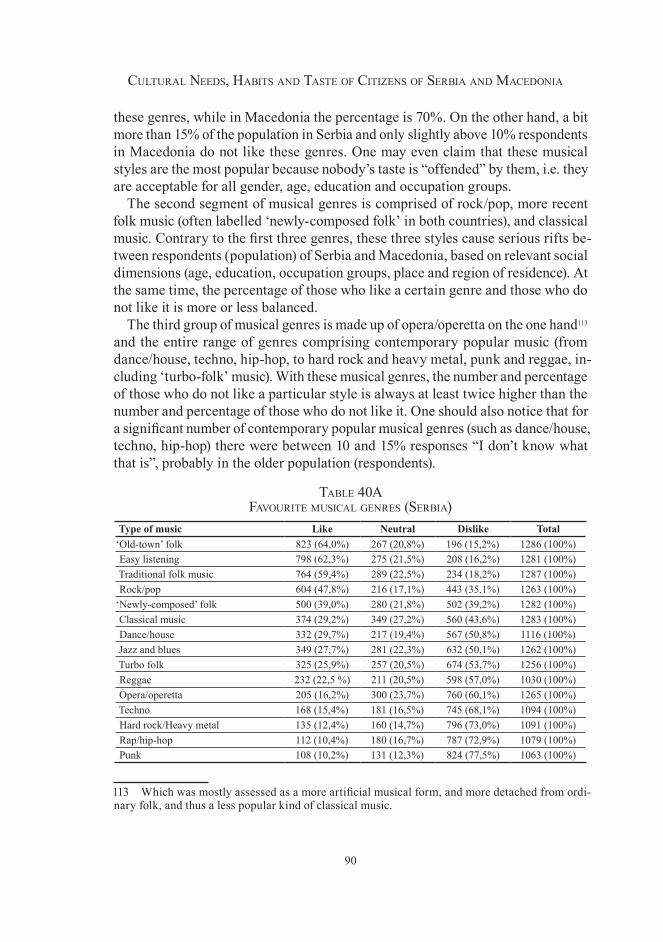
90
Cultural Needs, Habits aNd taste of CitizeNs of serbia aNd MaCedoNia
these genres, while in Macedonia the percentage is 70%. On the other hand, a bit more than 15% of the population in Serbia and only slightly above 10% respondents in Macedonia do not like these genres. One may even claim that these musical styles are the most popular because nobody’s taste is “offended” by them, i.e. they are acceptable for all gender, age, education and occupation groups.
The second segment of musical genres is comprised of rock/pop, more recent folk music (often labelled ‘newly-composed folk’ in both countries), and classical music. Contrary to the first three genres, these three styles cause serious rifts be-tween respondents (population) of Serbia and Macedonia, based on relevant social dimensions (age, education, occupation groups, place and region of residence). At the same time, the percentage of those who like a certain genre and those who do not like it is more or less balanced.
The third group of musical genres is made up of opera/operetta on the one hand113 and the entire range of genres comprising contemporary popular music (from dance/house, techno, hip-hop, to hard rock and heavy metal, punk and reggae, in-cluding ‘turbo-folk’ music). With these musical genres, the number and percentage of those who do not like a particular style is always at least twice higher than the number and percentage of those who do not like it. One should also notice that for a significant number of contemporary popular musical genres (such as dance/house, techno, hip-hop) there were between 10 and 15% responses “I don’t know what that is”, probably in the older population (respondents).
table 40a favourite MusiCal geNres (serbia)
Type of music Like Neutral Dislike Total‘Old-town’ folk 823 (64,0%) 267 (20,8%) 196 (15,2%) 1286 (100%)Easy listening 798 (62,3%) 275 (21,5%) 208 (16,2%) 1281 (100%)Traditional folk music 764 (59,4%) 289 (22,5%) 234 (18,2%) 1287 (100%)Rock/pop 604 (47,8%) 216 (17,1%) 443 (35,1%) 1263 (100%)
‘Newly-composed’ folk 500 (39,0%) 280 (21,8%) 502 (39,2%) 1282 (100%)Classical music 374 (29,2%) 349 (27,2%) 560 (43,6%) 1283 (100%)Dance/house 332 (29,7%) 217 (19,4%) 567 (50,8%) 1116 (100%)Jazz and blues 349 (27,7%) 281 (22,3%) 632 (50,1%) 1262 (100%)Turbo folk 325 (25,9%) 257 (20,5%) 674 (53,7%) 1256 (100%)Reggae 232 (22,5 %) 211 (20,5%) 598 (57,0%) 1030 (100%)Opera/operetta 205 (16,2%) 300 (23,7%) 760 (60,1%) 1265 (100%)Techno 168 (15,4%) 181 (16,5%) 745 (68,1%) 1094 (100%)Hard rock/Heavy metal 135 (12,4%) 160 (14,7%) 796 (73,0%) 1091 (100%)Rap/hip-hop 112 (10,4%) 180 (16,7%) 787 (72,9%) 1079 (100%)Punk 108 (10,2%) 131 (12,3%) 824 (77,5%) 1063 (100%)
113 Which was mostly assessed as a more artificial musical form, and more detached from ordi-nary folk, and thus a less popular kind of classical music.
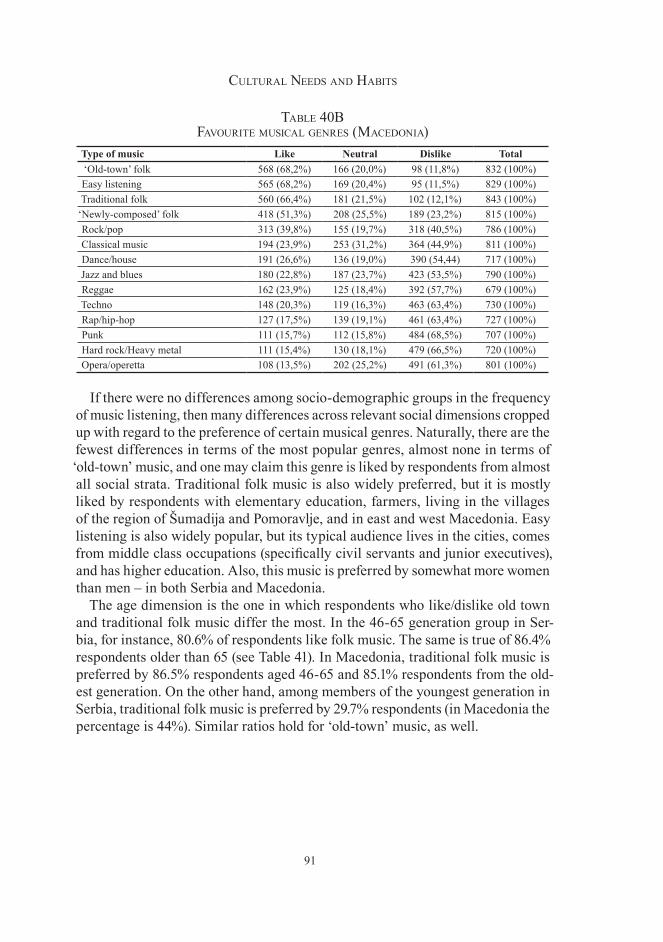
91
Cultural Needs aNd Habits
table 40b favourite MusiCal geNres (MaCedoNia)
Type of music Like Neutral Dislike Total ‘Old-town’ folk 568 (68,2%) 166 (20,0%) 98 (11,8%) 832 (100%)Easy listening 565 (68,2%) 169 (20,4%) 95 (11,5%) 829 (100%)Traditional folk 560 (66,4%) 181 (21,5%) 102 (12,1%) 843 (100%)
‘Newly-composed’ folk 418 (51,3%) 208 (25,5%) 189 (23,2%) 815 (100%)Rock/pop 313 (39,8%) 155 (19,7%) 318 (40,5%) 786 (100%)Classical music 194 (23,9%) 253 (31,2%) 364 (44,9%) 811 (100%)Dance/house 191 (26,6%) 136 (19,0%) 390 (54,44) 717 (100%)Jazz and blues 180 (22,8%) 187 (23,7%) 423 (53,5%) 790 (100%)Reggae 162 (23,9%) 125 (18,4%) 392 (57,7%) 679 (100%)Techno 148 (20,3%) 119 (16,3%) 463 (63,4%) 730 (100%)Rap/hip-hop 127 (17,5%) 139 (19,1%) 461 (63,4%) 727 (100%)Punk 111 (15,7%) 112 (15,8%) 484 (68,5%) 707 (100%)Hard rock/Heavy metal 111 (15,4%) 130 (18,1%) 479 (66,5%) 720 (100%)Opera/operetta 108 (13,5%) 202 (25,2%) 491 (61,3%) 801 (100%)
If there were no differences among socio-demographic groups in the frequency of music listening, then many differences across relevant social dimensions cropped up with regard to the preference of certain musical genres. Naturally, there are the fewest differences in terms of the most popular genres, almost none in terms of ‘old-town’ music, and one may claim this genre is liked by respondents from almost all social strata. Traditional folk music is also widely preferred, but it is mostly liked by respondents with elementary education, farmers, living in the villages of the region of Šumadija and Pomoravlje, and in east and west Macedonia. Easy listening is also widely popular, but its typical audience lives in the cities, comes from middle class occupations (specifically civil servants and junior executives), and has higher education. Also, this music is preferred by somewhat more women than men – in both Serbia and Macedonia.
The age dimension is the one in which respondents who like/dislike old town and traditional folk music differ the most. In the 46-65 generation group in Ser-bia, for instance, 80.6% of respondents like folk music. The same is true of 86.4% respondents older than 65 (see Table 41). In Macedonia, traditional folk music is preferred by 86.5% respondents aged 46-65 and 85.1% respondents from the old-est generation. On the other hand, among members of the youngest generation in Serbia, traditional folk music is preferred by 29.7% respondents (in Macedonia the percentage is 44%). Similar ratios hold for ‘old-town’ music, as well.
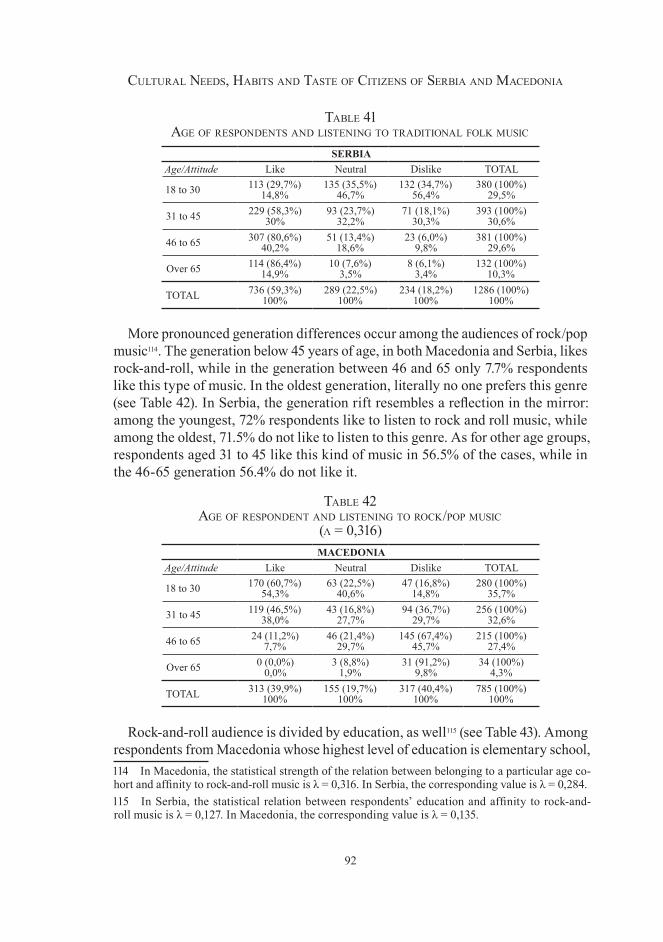
92
Cultural Needs, Habits aNd taste of CitizeNs of serbia aNd MaCedoNia
table 41 age of respoNdeNts aNd listeNiNg to traditioNal folk MusiC
SERBIAAge/Attitude Like Neutral Dislike TOTAL
18 to 30 113 (29,7%)14,8%
135 (35,5%)46,7%
132 (34,7%)56,4%
380 (100%)29,5%
31 to 45 229 (58,3%)30%
93 (23,7%)32,2%
71 (18,1%)30,3%
393 (100%)30,6%
46 to 65 307 (80,6%)40,2%
51 (13,4%)18,6%
23 (6,0%)9,8%
381 (100%)29,6%
Over 65 114 (86,4%)14,9%
10 (7,6%)3,5%
8 (6,1%)3,4%
132 (100%)10,3%
TOTAL 736 (59,3%)100%
289 (22,5%)100%
234 (18,2%)100%
1286 (100%)100%
More pronounced generation differences occur among the audiences of rock/pop music114. The generation below 45 years of age, in both Macedonia and Serbia, likes rock-and-roll, while in the generation between 46 and 65 only 7.7% respondents like this type of music. In the oldest generation, literally no one prefers this genre (see Table 42). In Serbia, the generation rift resembles a reflection in the mirror: among the youngest, 72% respondents like to listen to rock and roll music, while among the oldest, 71.5% do not like to listen to this genre. As for other age groups, respondents aged 31 to 45 like this kind of music in 56.5% of the cases, while in the 46-65 generation 56.4% do not like it.
table 42 age of respoNdeNt aNd listeNiNg to roCk/pop MusiC
(λ = 0,316)MACEDONIA
Age/Attitude Like Neutral Dislike TOTAL
18 to 30 170 (60,7%)54,3%
63 (22,5%)40,6%
47 (16,8%)14,8%
280 (100%)35,7%
31 to 45 119 (46,5%)38,0%
43 (16,8%)27,7%
94 (36,7%)29,7%
256 (100%)32,6%
46 to 65 24 (11,2%)7,7%
46 (21,4%)29,7%
145 (67,4%)45,7%
215 (100%)27,4%
Over 65 0 (0,0%)0,0%
3 (8,8%)1,9%
31 (91,2%)9,8%
34 (100%)4,3%
TOTAL 313 (39,9%)100%
155 (19,7%)100%
317 (40,4%)100%
785 (100%)100%
Rock-and-roll audience is divided by education, as well115 (see Table 43). Among respondents from Macedonia whose highest level of education is elementary school, 114 In Macedonia, the statistical strength of the relation between belonging to a particular age co-hort and affinity to rock-and-roll music is λ = 0,316. In Serbia, the corresponding value is λ = 0,284.115 In Serbia, the statistical relation between respondents’ education and affinity to rock-and-roll music is λ = 0,127. In Macedonia, the corresponding value is λ = 0,135.
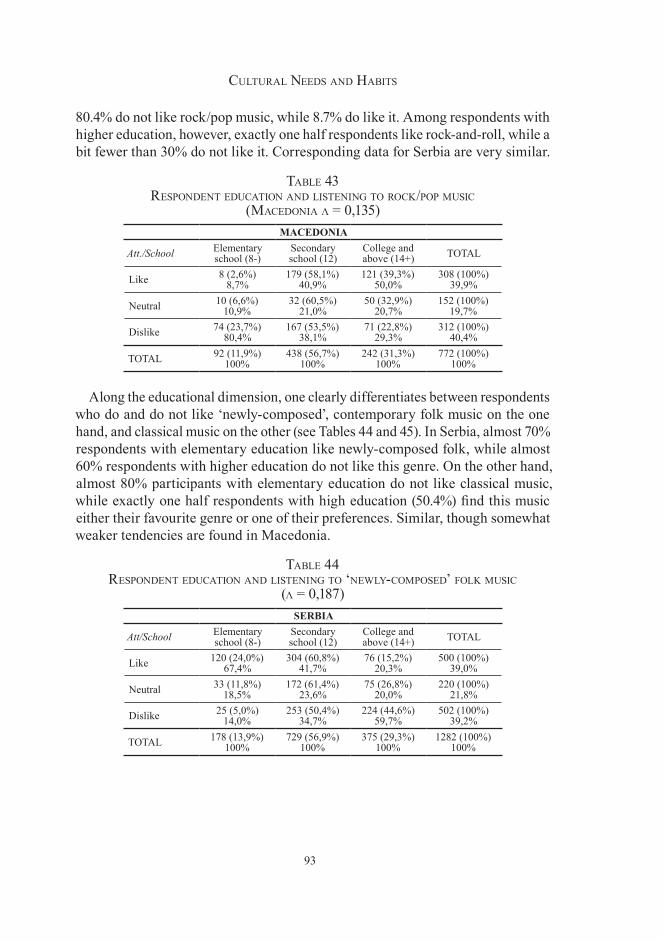
93
Cultural Needs aNd Habits
80.4% do not like rock/pop music, while 8.7% do like it. Among respondents with higher education, however, exactly one half respondents like rock-and-roll, while a bit fewer than 30% do not like it. Corresponding data for Serbia are very similar.
table 4� respoNdeNt eduCatioN aNd listeNiNg to roCk/pop MusiC
(Macedonia λ = 0,135)MACEDONIA
Att./School Elementary school (8-)
Secondary school (12)
College and above (14+) TOTAL
Like 8 (2,6%)8,7%
179 (58,1%)40,9%
121 (39,3%)50,0%
308 (100%)39,9%
Neutral 10 (6,6%)10,9%
32 (60,5%)21,0%
50 (32,9%)20,7%
152 (100%)19,7%
Dislike 74 (23,7%)80,4%
167 (53,5%)38,1%
71 (22,8%)29,3%
312 (100%)40,4%
TOTAL 92 (11,9%)100%
438 (56,7%)100%
242 (31,3%)100%
772 (100%)100%
Along the educational dimension, one clearly differentiates between respondents who do and do not like ‘newly-composed’, contemporary folk music on the one hand, and classical music on the other (see Tables 44 and 45). In Serbia, almost 70% respondents with elementary education like newly-composed folk, while almost 60% respondents with higher education do not like this genre. On the other hand, almost 80% participants with elementary education do not like classical music, while exactly one half respondents with high education (50.4%) find this music either their favourite genre or one of their preferences. Similar, though somewhat weaker tendencies are found in Macedonia.
table 44 respoNdeNt eduCatioN aNd listeNiNg to ‘Newly-CoMposed’ folk MusiC
(λ = 0,187)SERBIA
Att/School Elementary school (8-)
Secondary school (12)
College and above (14+) TOTAL
Like 120 (24,0%)67,4%
304 (60,8%)41,7%
76 (15,2%)20,3%
500 (100%)39,0%
Neutral 33 (11,8%)18,5%
172 (61,4%)23,6%
75 (26,8%)20,0%
220 (100%)21,8%
Dislike 25 (5,0%)14,0%
253 (50,4%)34,7%
224 (44,6%)59,7%
502 (100%)39,2%
TOTAL 178 (13,9%)100%
729 (56,9%)100%
375 (29,3%)100%
1282 (100%)100%
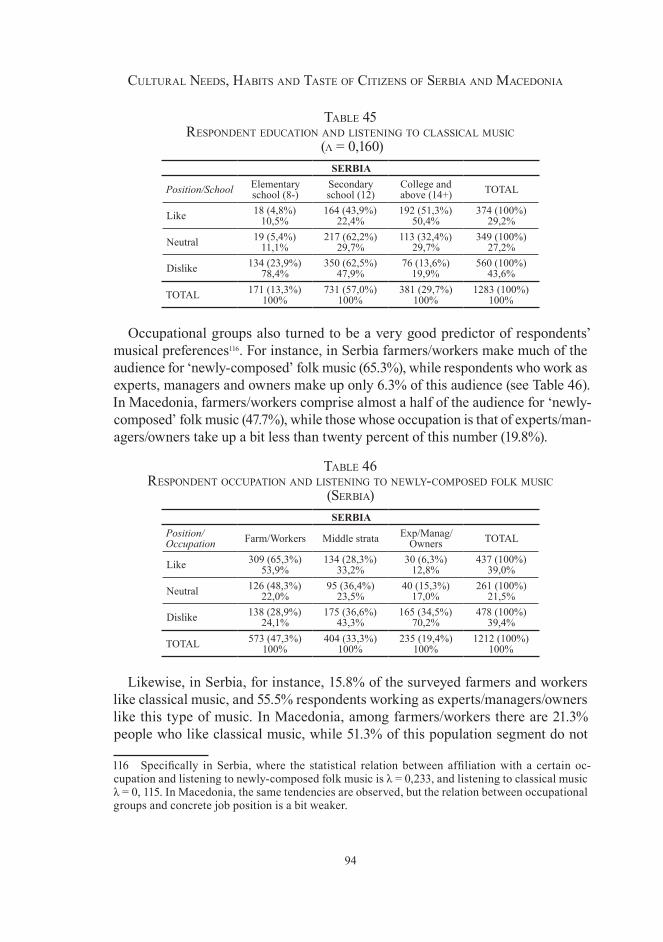
94
Cultural Needs, Habits aNd taste of CitizeNs of serbia aNd MaCedoNia
table 45 respoNdeNt eduCatioN aNd listeNiNg to ClassiCal MusiC
(λ = 0,160)SERBIA
Position/School Elementary school (8-)
Secondary school (12)
College and above (14+) TOTAL
Like 18 (4,8%)10,5%
164 (43,9%)22,4%
192 (51,3%)50,4%
374 (100%)29,2%
Neutral 19 (5,4%)11,1%
217 (62,2%)29,7%
113 (32,4%)29,7%
349 (100%)27,2%
Dislike 134 (23,9%)78,4%
350 (62,5%)47,9%
76 (13,6%)19,9%
560 (100%)43,6%
TOTAL 171 (13,3%)100%
731 (57,0%)100%
381 (29,7%)100%
1283 (100%)100%
Occupational groups also turned to be a very good predictor of respondents’ musical preferences116. For instance, in Serbia farmers/workers make much of the audience for ‘newly-composed’ folk music (65.3%), while respondents who work as experts, managers and owners make up only 6.3% of this audience (see Table 46). In Macedonia, farmers/workers comprise almost a half of the audience for ‘newly-composed’ folk music (47.7%), while those whose occupation is that of experts/man-agers/owners take up a bit less than twenty percent of this number (19.8%).
table 46 respoNdeNt oCCupatioN aNd listeNiNg to Newly-CoMposed folk MusiC
(serbia)SERBIA
Position/Occupation Farm/Workers Middle strata Exp/Manag/
Owners TOTAL
Like 309 (65,3%)53,9%
134 (28,3%)33,2%
30 (6,3%)12,8%
437 (100%)39,0%
Neutral 126 (48,3%)22,0%
95 (36,4%)23,5%
40 (15,3%)17,0%
261 (100%)21,5%
Dislike 138 (28,9%)24,1%
175 (36,6%)43,3%
165 (34,5%)70,2%
478 (100%)39,4%
TOTAL 573 (47,3%)100%
404 (33,3%)100%
235 (19,4%)100%
1212 (100%)100%
Likewise, in Serbia, for instance, 15.8% of the surveyed farmers and workers like classical music, and 55.5% respondents working as experts/managers/owners like this type of music. In Macedonia, among farmers/workers there are 21.3% people who like classical music, while 51.3% of this population segment do not
116 Specifically in Serbia, where the statistical relation between affiliation with a certain oc-cupation and listening to newly-composed folk music is λ = 0,233, and listening to classical music λ = 0, 115. In Macedonia, the same tendencies are observed, but the relation between occupational groups and concrete job position is a bit weaker.
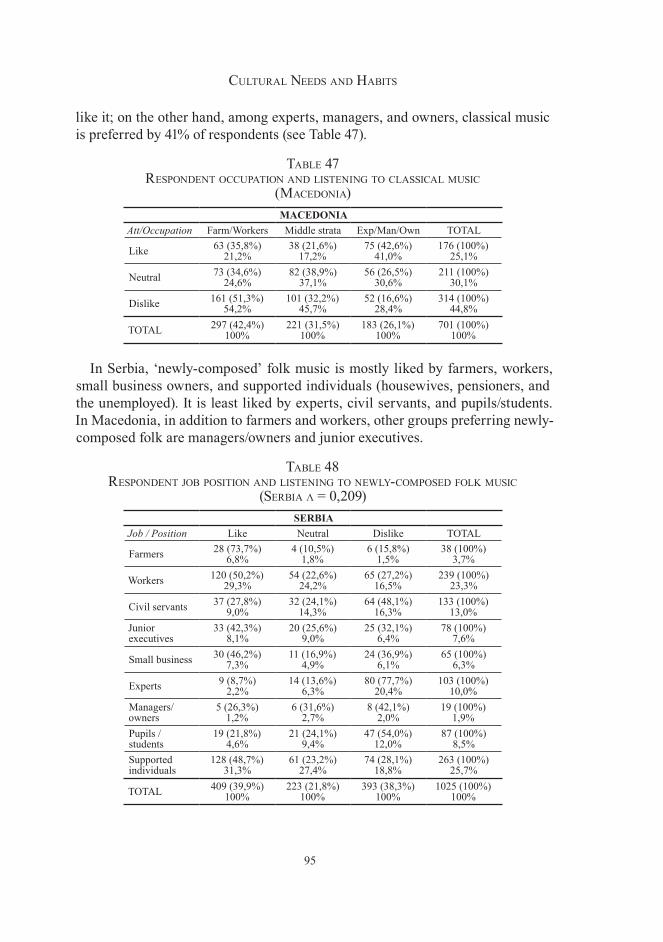
95
Cultural Needs aNd Habits
like it; on the other hand, among experts, managers, and owners, classical music is preferred by 41% of respondents (see Table 47).
table 47 respoNdeNt oCCupatioN aNd listeNiNg to ClassiCal MusiC
(MaCedoNia)MACEDONIA
Att/Occupation Farm/Workers Middle strata Exp/Man/Own TOTAL
Like 63 (35,8%)21,2%
38 (21,6%)17,2%
75 (42,6%)41,0%
176 (100%)25,1%
Neutral 73 (34,6%)24,6%
82 (38,9%)37,1%
56 (26,5%)30,6%
211 (100%)30,1%
Dislike 161 (51,3%)54,2%
101 (32,2%)45,7%
52 (16,6%)28,4%
314 (100%)44,8%
TOTAL 297 (42,4%)100%
221 (31,5%)100%
183 (26,1%)100%
701 (100%)100%
In Serbia, ‘newly-composed’ folk music is mostly liked by farmers, workers, small business owners, and supported individuals (housewives, pensioners, and the unemployed). It is least liked by experts, civil servants, and pupils/students. In Macedonia, in addition to farmers and workers, other groups preferring newly-composed folk are managers/owners and junior executives.
table 48 respoNdeNt job positioN aNd listeNiNg to Newly-CoMposed folk MusiC
(Serbia λ = 0,209)SERBIA
Job / Position Like Neutral Dislike TOTAL
Farmers 28 (73,7%)6,8%
4 (10,5%)1,8%
6 (15,8%)1,5%
38 (100%)3,7%
Workers 120 (50,2%)29,3%
54 (22,6%)24,2%
65 (27,2%)16,5%
239 (100%)23,3%
Civil servants 37 (27,8%)9,0%
32 (24,1%)14,3%
64 (48,1%)16,3%
133 (100%)13,0%
Junior executives
33 (42,3%)8,1%
20 (25,6%)9,0%
25 (32,1%)6,4%
78 (100%)7,6%
Small business 30 (46,2%)7,3%
11 (16,9%)4,9%
24 (36,9%)6,1%
65 (100%)6,3%
Experts 9 (8,7%)2,2%
14 (13,6%)6,3%
80 (77,7%)20,4%
103 (100%)10,0%
Managers/ owners
5 (26,3%)1,2%
6 (31,6%)2,7%
8 (42,1%)2,0%
19 (100%)1,9%
Pupils / students
19 (21,8%)4,6%
21 (24,1%)9,4%
47 (54,0%)12,0%
87 (100%)8,5%
Supported individuals
128 (48,7%)31,3%
61 (23,2%)27,4%
74 (28,1%)18,8%
263 (100%)25,7%
TOTAL 409 (39,9%)100%
223 (21,8%)100%
393 (38,3%)100%
1025 (100%)100%
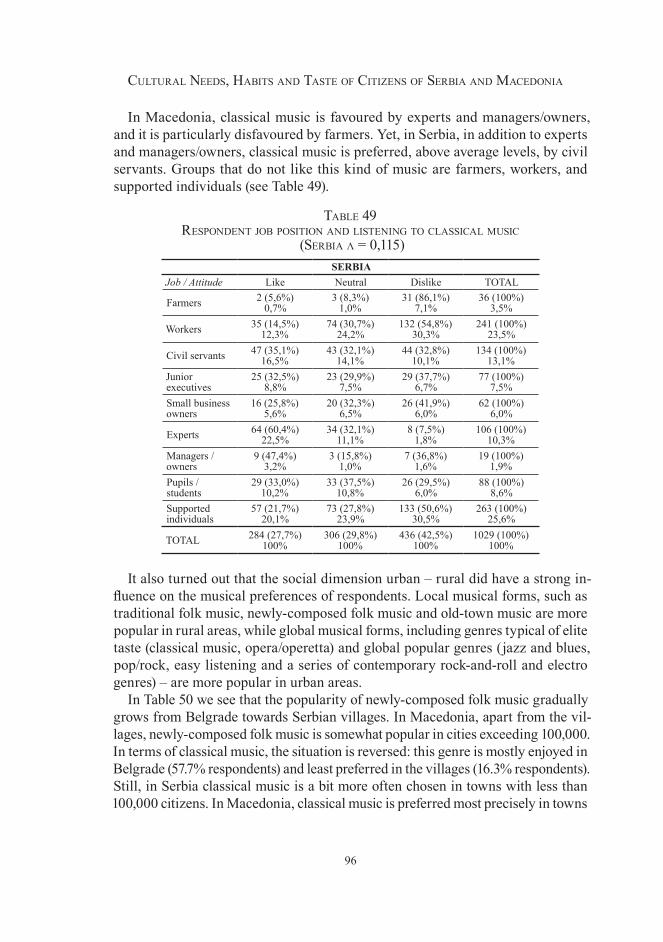
96
Cultural Needs, Habits aNd taste of CitizeNs of serbia aNd MaCedoNia
In Macedonia, classical music is favoured by experts and managers/owners, and it is particularly disfavoured by farmers. Yet, in Serbia, in addition to experts and managers/owners, classical music is preferred, above average levels, by civil servants. Groups that do not like this kind of music are farmers, workers, and supported individuals (see Table 49).
table 49 respoNdeNt job positioN aNd listeNiNg to ClassiCal MusiC
(Serbia λ = 0,115)SERBIA
Job / Attitude Like Neutral Dislike TOTAL
Farmers 2 (5,6%)0,7%
3 (8,3%)1,0%
31 (86,1%)7,1%
36 (100%)3,5%
Workers 35 (14,5%)12,3%
74 (30,7%)24,2%
132 (54,8%)30,3%
241 (100%)23,5%
Civil servants 47 (35,1%)16,5%
43 (32,1%)14,1%
44 (32,8%)10,1%
134 (100%)13,1%
Junior executives
25 (32,5%)8,8%
23 (29,9%)7,5%
29 (37,7%)6,7%
77 (100%)7,5%
Small business owners
16 (25,8%)5,6%
20 (32,3%)6,5%
26 (41,9%)6,0%
62 (100%)6,0%
Experts 64 (60,4%)22,5%
34 (32,1%)11,1%
8 (7,5%)1,8%
106 (100%)10,3%
Managers / owners
9 (47,4%)3,2%
3 (15,8%)1,0%
7 (36,8%)1,6%
19 (100%)1,9%
Pupils / students
29 (33,0%)10,2%
33 (37,5%)10,8%
26 (29,5%)6,0%
88 (100%)8,6%
Supported individuals
57 (21,7%)20,1%
73 (27,8%)23,9%
133 (50,6%)30,5%
263 (100%)25,6%
TOTAL 284 (27,7%)100%
306 (29,8%)100%
436 (42,5%)100%
1029 (100%)100%
It also turned out that the social dimension urban – rural did have a strong in-fluence on the musical preferences of respondents. Local musical forms, such as traditional folk music, newly-composed folk music and old-town music are more popular in rural areas, while global musical forms, including genres typical of elite taste (classical music, opera/operetta) and global popular genres (jazz and blues, pop/rock, easy listening and a series of contemporary rock-and-roll and electro genres) – are more popular in urban areas.
In Table 50 we see that the popularity of newly-composed folk music gradually grows from Belgrade towards Serbian villages. In Macedonia, apart from the vil-lages, newly-composed folk music is somewhat popular in cities exceeding 100,000. In terms of classical music, the situation is reversed: this genre is mostly enjoyed in Belgrade (57.7% respondents) and least preferred in the villages (16.3% respondents). Still, in Serbia classical music is a bit more often chosen in towns with less than 100,000 citizens. In Macedonia, classical music is preferred most precisely in towns
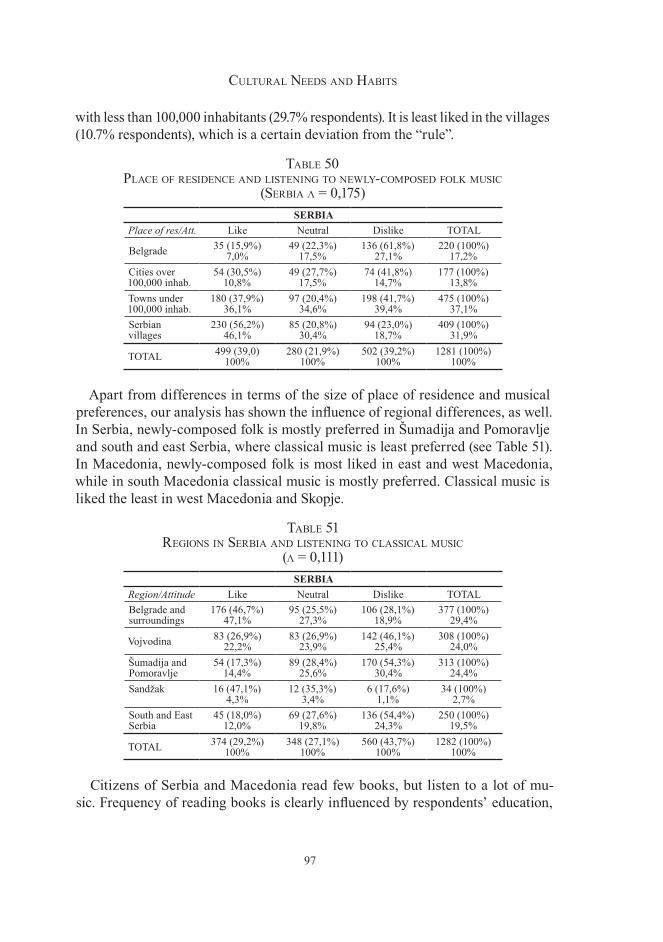
97
Cultural Needs aNd Habits
with less than 100,000 inhabitants (29.7% respondents). It is least liked in the villages (10.7% respondents), which is a certain deviation from the “rule”.
table 50 plaCe of resideNCe aNd listeNiNg to Newly-CoMposed folk MusiC
(Serbia λ = 0,175)SERBIA
Place of res/Att. Like Neutral Dislike TOTAL
Belgrade 35 (15,9%)7,0%
49 (22,3%)17,5%
136 (61,8%)27,1%
220 (100%)17,2%
Cities over 100,000 inhab.
54 (30,5%)10,8%
49 (27,7%)17,5%
74 (41,8%)14,7%
177 (100%)13,8%
Towns under 100,000 inhab.
180 (37,9%)36,1%
97 (20,4%)34,6%
198 (41,7%)39,4%
475 (100%)37,1%
Serbian villages
230 (56,2%)46,1%
85 (20,8%)30,4%
94 (23,0%)18,7%
409 (100%)31,9%
TOTAL 499 (39,0)100%
280 (21,9%)100%
502 (39,2%)100%
1281 (100%)100%
Apart from differences in terms of the size of place of residence and musical preferences, our analysis has shown the influence of regional differences, as well. In Serbia, newly-composed folk is mostly preferred in Šumadija and Pomoravlje and south and east Serbia, where classical music is least preferred (see Table 51). In Macedonia, newly-composed folk is most liked in east and west Macedonia, while in south Macedonia classical music is mostly preferred. Classical music is liked the least in west Macedonia and Skopje.
table 51 regioNs iN serbia aNd listeNiNg to ClassiCal MusiC
(λ = 0,111)SERBIA
Region/Attitude Like Neutral Dislike TOTALBelgrade and surroundings
176 (46,7%)47,1%
95 (25,5%)27,3%
106 (28,1%)18,9%
377 (100%)29,4%
Vojvodina 83 (26,9%)22,2%
83 (26,9%)23,9%
142 (46,1%)25,4%
308 (100%)24,0%
Šumadija and Pomoravlje
54 (17,3%)14,4%
89 (28,4%)25,6%
170 (54,3%)30,4%
313 (100%)24,4%
Sandžak 16 (47,1%)4,3%
12 (35,3%)3,4%
6 (17,6%)1,1%
34 (100%)2,7%
South and East Serbia
45 (18,0%)12,0%
69 (27,6%)19,8%
136 (54,4%)24,3%
250 (100%)19,5%
TOTAL 374 (29,2%)100%
348 (27,1%)100%
560 (43,7%)100%
1282 (100%)100%
Citizens of Serbia and Macedonia read few books, but listen to a lot of mu-sic. Frequency of reading books is clearly influenced by respondents’ education,
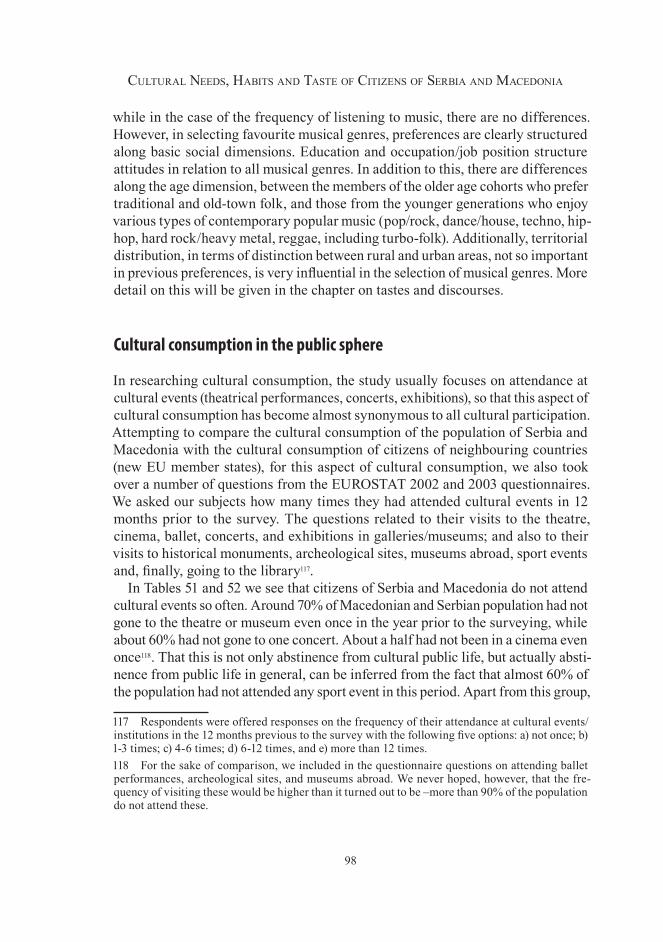
98
Cultural Needs, Habits aNd taste of CitizeNs of serbia aNd MaCedoNia
while in the case of the frequency of listening to music, there are no differences. However, in selecting favourite musical genres, preferences are clearly structured along basic social dimensions. Education and occupation/job position structure attitudes in relation to all musical genres. In addition to this, there are differences along the age dimension, between the members of the older age cohorts who prefer traditional and old-town folk, and those from the younger generations who enjoy various types of contemporary popular music (pop/rock, dance/house, techno, hip-hop, hard rock/heavy metal, reggae, including turbo-folk). Additionally, territorial distribution, in terms of distinction between rural and urban areas, not so important in previous preferences, is very influential in the selection of musical genres. More detail on this will be given in the chapter on tastes and discourses.
Cultural consumption in the public sphere
In researching cultural consumption, the study usually focuses on attendance at cultural events (theatrical performances, concerts, exhibitions), so that this aspect of cultural consumption has become almost synonymous to all cultural participation. Attempting to compare the cultural consumption of the population of Serbia and Macedonia with the cultural consumption of citizens of neighbouring countries (new EU member states), for this aspect of cultural consumption, we also took over a number of questions from the EUROSTAT 2002 and 2003 questionnaires. We asked our subjects how many times they had attended cultural events in 12 months prior to the survey. The questions related to their visits to the theatre, cinema, ballet, concerts, and exhibitions in galleries/museums; and also to their visits to historical monuments, archeological sites, museums abroad, sport events and, finally, going to the library117.
In Tables 51 and 52 we see that citizens of Serbia and Macedonia do not attend cultural events so often. Around 70% of Macedonian and Serbian population had not gone to the theatre or museum even once in the year prior to the surveying, while about 60% had not gone to one concert. About a half had not been in a cinema even once118. That this is not only abstinence from cultural public life, but actually absti-nence from public life in general, can be inferred from the fact that almost 60% of the population had not attended any sport event in this period. Apart from this group,
117 Respondents were offered responses on the frequency of their attendance at cultural events/institutions in the 12 months previous to the survey with the following five options: a) not once; b) 1-3 times; c) 4-6 times; d) 6-12 times, and e) more than 12 times. 118 For the sake of comparison, we included in the questionnaire questions on attending ballet performances, archeological sites, and museums abroad. We never hoped, however, that the fre-quency of visiting these would be higher than it turned out to be –more than 90% of the population do not attend these.
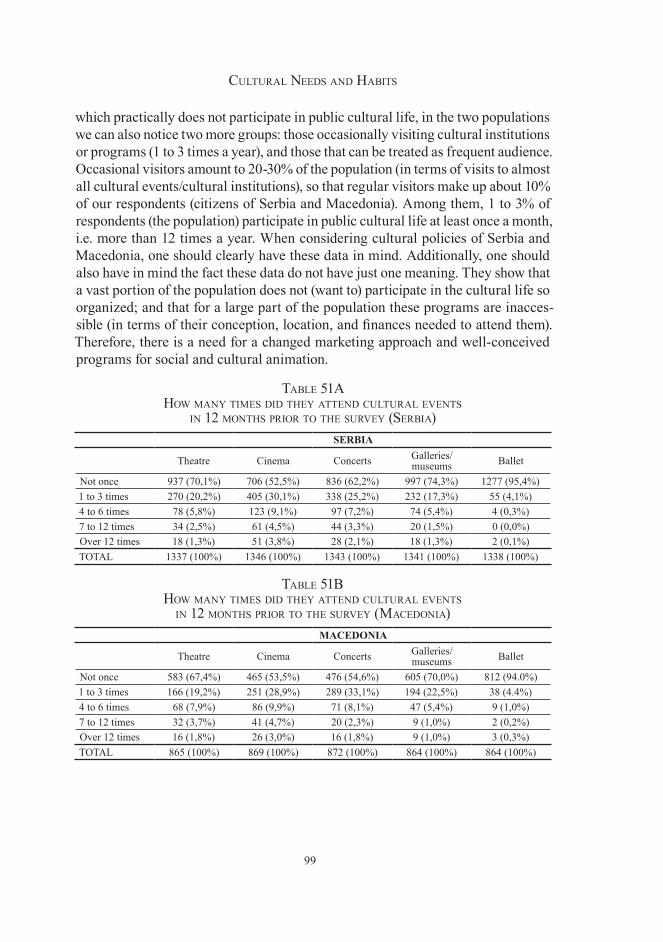
99
Cultural Needs aNd Habits
which practically does not participate in public cultural life, in the two populations we can also notice two more groups: those occasionally visiting cultural institutions or programs (1 to 3 times a year), and those that can be treated as frequent audience. Occasional visitors amount to 20-30% of the population (in terms of visits to almost all cultural events/cultural institutions), so that regular visitors make up about 10% of our respondents (citizens of Serbia and Macedonia). Among them, 1 to 3% of respondents (the population) participate in public cultural life at least once a month, i.e. more than 12 times a year. When considering cultural policies of Serbia and Macedonia, one should clearly have these data in mind. Additionally, one should also have in mind the fact these data do not have just one meaning. They show that a vast portion of the population does not (want to) participate in the cultural life so organized; and that for a large part of the population these programs are inacces-sible (in terms of their conception, location, and finances needed to attend them). Therefore, there is a need for a changed marketing approach and well-conceived programs for social and cultural animation.
table 51a How MaNy tiMes did tHey atteNd Cultural eveNts
iN 12 MoNtHs prior to tHe survey (serbia)SERBIA
Theatre Cinema Concerts Galleries/museums Ballet
Not once 937 (70,1%) 706 (52,5%) 836 (62,2%) 997 (74,3%) 1277 (95,4%)1 to 3 times 270 (20,2%) 405 (30,1%) 338 (25,2%) 232 (17,3%) 55 (4,1%)4 to 6 times 78 (5,8%) 123 (9,1%) 97 (7,2%) 74 (5,4%) 4 (0,3%)7 to 12 times 34 (2,5%) 61 (4,5%) 44 (3,3%) 20 (1,5%) 0 (0,0%)Over 12 times 18 (1,3%) 51 (3,8%) 28 (2,1%) 18 (1,3%) 2 (0,1%)TOTAL 1337 (100%) 1346 (100%) 1343 (100%) 1341 (100%) 1338 (100%)
table 51b How MaNy tiMes did tHey atteNd Cultural eveNts
iN 12 MoNtHs prior to tHe survey (MaCedoNia)MACEDONIA
Theatre Cinema Concerts Galleries/museums Ballet
Not once 583 (67,4%) 465 (53,5%) 476 (54,6%) 605 (70,0%) 812 (94.0%)1 to 3 times 166 (19,2%) 251 (28,9%) 289 (33,1%) 194 (22,5%) 38 (4.4%)4 to 6 times 68 (7,9%) 86 (9,9%) 71 (8,1%) 47 (5,4%) 9 (1,0%)7 to 12 times 32 (3,7%) 41 (4,7%) 20 (2,3%) 9 (1,0%) 2 (0,2%)Over 12 times 16 (1,8%) 26 (3,0%) 16 (1,8%) 9 (1,0%) 3 (0,3%)TOTAL 865 (100%) 869 (100%) 872 (100%) 864 (100%) 864 (100%)
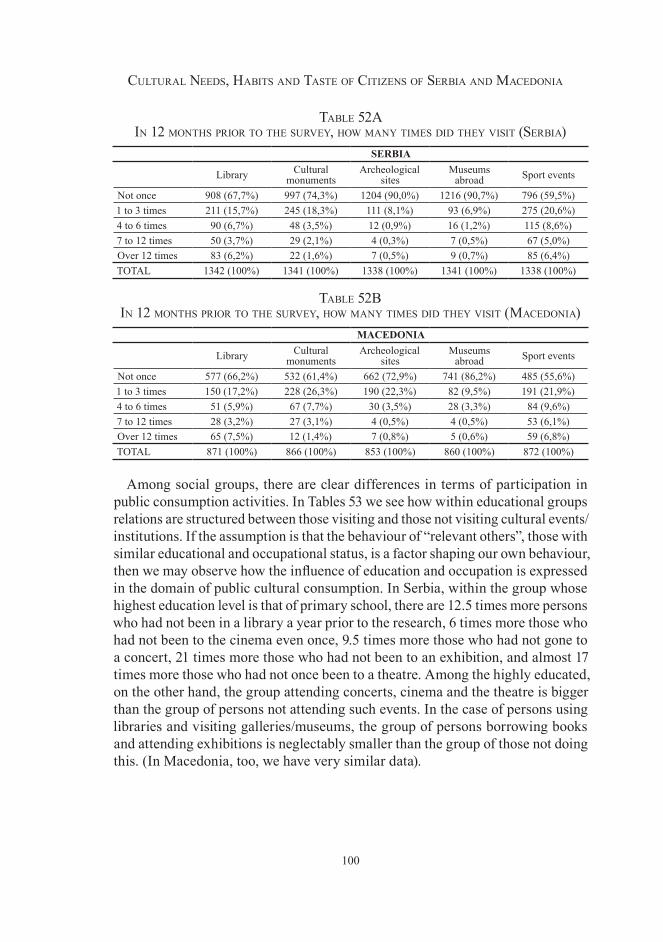
100
Cultural Needs, Habits aNd taste of CitizeNs of serbia aNd MaCedoNia
table 52a iN 12 MoNtHs prior to tHe survey, How MaNy tiMes did tHey visit (serbia)
SERBIA
Library Cultural monuments
Archeological sites
Museums abroad Sport events
Not once 908 (67,7%) 997 (74,3%) 1204 (90,0%) 1216 (90,7%) 796 (59,5%)1 to 3 times 211 (15,7%) 245 (18,3%) 111 (8,1%) 93 (6,9%) 275 (20,6%)4 to 6 times 90 (6,7%) 48 (3,5%) 12 (0,9%) 16 (1,2%) 115 (8,6%)7 to 12 times 50 (3,7%) 29 (2,1%) 4 (0,3%) 7 (0,5%) 67 (5,0%)Over 12 times 83 (6,2%) 22 (1,6%) 7 (0,5%) 9 (0,7%) 85 (6,4%)TOTAL 1342 (100%) 1341 (100%) 1338 (100%) 1341 (100%) 1338 (100%)
table 52b iN 12 MoNtHs prior to tHe survey, How MaNy tiMes did tHey visit (MaCedoNia)
MACEDONIA
Library Cultural monuments
Archeological sites
Museums abroad Sport events
Not once 577 (66,2%) 532 (61,4%) 662 (72,9%) 741 (86,2%) 485 (55,6%)1 to 3 times 150 (17,2%) 228 (26,3%) 190 (22,3%) 82 (9,5%) 191 (21,9%)4 to 6 times 51 (5,9%) 67 (7,7%) 30 (3,5%) 28 (3,3%) 84 (9,6%)7 to 12 times 28 (3,2%) 27 (3,1%) 4 (0,5%) 4 (0,5%) 53 (6,1%)Over 12 times 65 (7,5%) 12 (1,4%) 7 (0,8%) 5 (0,6%) 59 (6,8%)TOTAL 871 (100%) 866 (100%) 853 (100%) 860 (100%) 872 (100%)
Among social groups, there are clear differences in terms of participation in public consumption activities. In Tables 53 we see how within educational groups relations are structured between those visiting and those not visiting cultural events/institutions. If the assumption is that the behaviour of “relevant others”, those with similar educational and occupational status, is a factor shaping our own behaviour, then we may observe how the influence of education and occupation is expressed in the domain of public cultural consumption. In Serbia, within the group whose highest education level is that of primary school, there are 12.5 times more persons who had not been in a library a year prior to the research, 6 times more those who had not been to the cinema even once, 9.5 times more those who had not gone to a concert, 21 times more those who had not been to an exhibition, and almost 17 times more those who had not once been to a theatre. Among the highly educated, on the other hand, the group attending concerts, cinema and the theatre is bigger than the group of persons not attending such events. In the case of persons using libraries and visiting galleries/museums, the group of persons borrowing books and attending exhibitions is neglectably smaller than the group of those not doing this. (In Macedonia, too, we have very similar data).
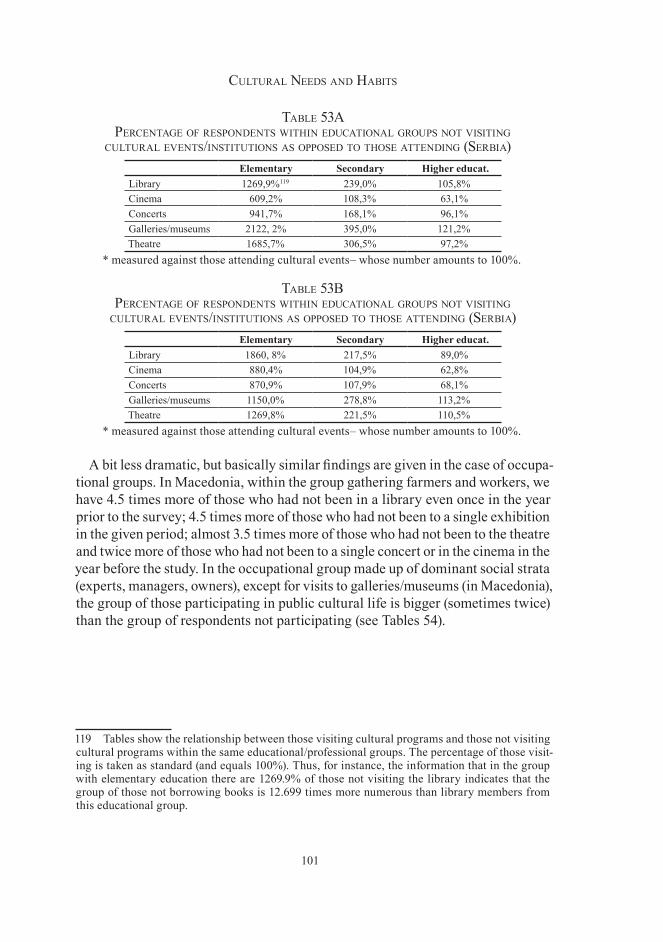
101
Cultural Needs aNd Habits
table 5�a perCeNtage of respoNdeNts witHiN eduCatioNal groups Not visitiNg
Cultural eveNts/iNstitutioNs as opposed to tHose atteNdiNg (serbia)Elementary Secondary Higher educat.
Library 1269,9%119 239,0% 105,8%Cinema 609,2% 108,3% 63,1%Concerts 941,7% 168,1% 96,1%Galleries/museums 2122, 2% 395,0% 121,2%Theatre 1685,7% 306,5% 97,2%
* measured against those attending cultural events– whose number amounts to 100%.
table 5�b perCeNtage of respoNdeNts witHiN eduCatioNal groups Not visitiNg
Cultural eveNts/iNstitutioNs as opposed to tHose atteNdiNg (serbia)Elementary Secondary Higher educat.
Library 1860, 8% 217,5% 89,0%Cinema 880,4% 104,9% 62,8%Concerts 870,9% 107,9% 68,1%Galleries/museums 1150,0% 278,8% 113,2%Theatre 1269,8% 221,5% 110,5%
* measured against those attending cultural events– whose number amounts to 100%.
A bit less dramatic, but basically similar findings are given in the case of occupa-tional groups. In Macedonia, within the group gathering farmers and workers, we have 4.5 times more of those who had not been in a library even once in the year prior to the survey; 4.5 times more of those who had not been to a single exhibition in the given period; almost 3.5 times more of those who had not been to the theatre and twice more of those who had not been to a single concert or in the cinema in the year before the study. In the occupational group made up of dominant social strata (experts, managers, owners), except for visits to galleries/museums (in Macedonia), the group of those participating in public cultural life is bigger (sometimes twice) than the group of respondents not participating (see Tables 54).
119 Tables show the relationship between those visiting cultural programs and those not visiting cultural programs within the same educational/professional groups. The percentage of those visit-ing is taken as standard (and equals 100%). Thus, for instance, the information that in the group with elementary education there are 1269.9% of those not visiting the library indicates that the group of those not borrowing books is 12.699 times more numerous than library members from this educational group.
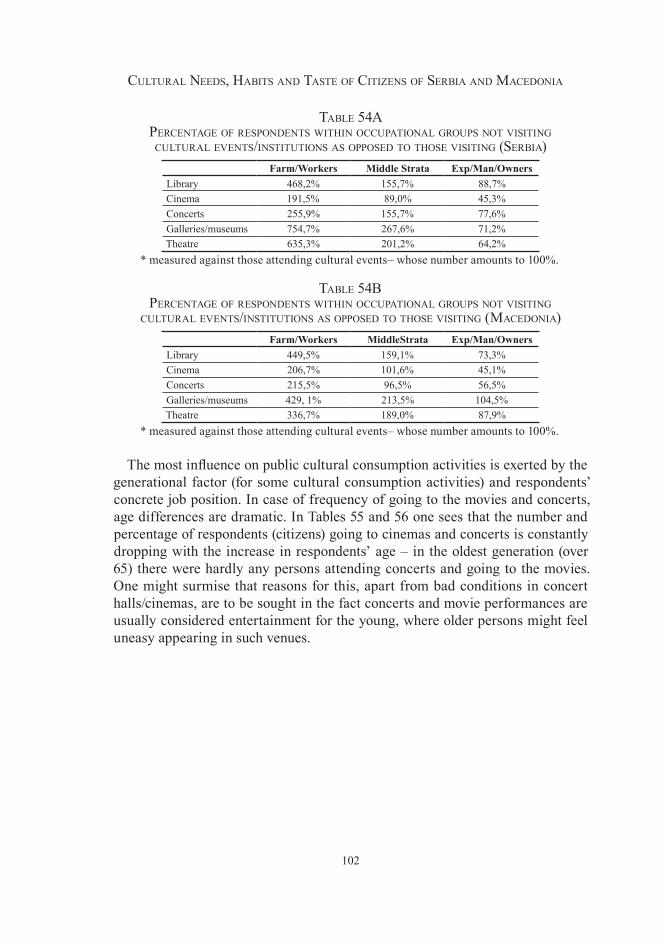
102
Cultural Needs, Habits aNd taste of CitizeNs of serbia aNd MaCedoNia
table 54a perCeNtage of respoNdeNts witHiN oCCupatioNal groups Not visitiNg
Cultural eveNts/iNstitutioNs as opposed to tHose visitiNg (serbia)Farm/Workers Middle Strata Exp/Man/Owners
Library 468,2% 155,7% 88,7%Cinema 191,5% 89,0% 45,3%Concerts 255,9% 155,7% 77,6%Galleries/museums 754,7% 267,6% 71,2%Theatre 635,3% 201,2% 64,2%
* measured against those attending cultural events– whose number amounts to 100%.
table 54b perCeNtage of respoNdeNts witHiN oCCupatioNal groups Not visitiNg
Cultural eveNts/iNstitutioNs as opposed to tHose visitiNg (MaCedoNia)Farm/Workers MiddleStrata Exp/Man/Owners
Library 449,5% 159,1% 73,3%Cinema 206,7% 101,6% 45,1%Concerts 215,5% 96,5% 56,5%Galleries/museums 429, 1% 213,5% 104,5%Theatre 336,7% 189,0% 87,9%
* measured against those attending cultural events– whose number amounts to 100%.
The most influence on public cultural consumption activities is exerted by the generational factor (for some cultural consumption activities) and respondents’ concrete job position. In case of frequency of going to the movies and concerts, age differences are dramatic. In Tables 55 and 56 one sees that the number and percentage of respondents (citizens) going to cinemas and concerts is constantly dropping with the increase in respondents’ age – in the oldest generation (over 65) there were hardly any persons attending concerts and going to the movies. One might surmise that reasons for this, apart from bad conditions in concert halls/cinemas, are to be sought in the fact concerts and movie performances are usually considered entertainment for the young, where older persons might feel uneasy appearing in such venues.
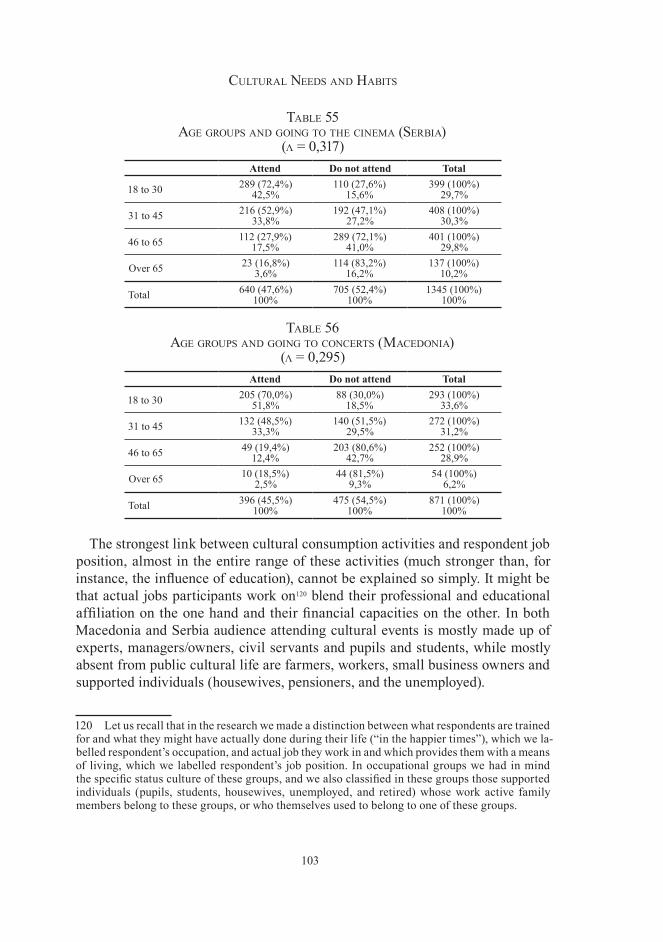
103
Cultural Needs aNd Habits
table 55 age groups aNd goiNg to tHe CiNeMa (serbia)
(λ = 0,317)Attend Do not attend Total
18 to 30 289 (72,4%)42,5%
110 (27,6%)15,6%
399 (100%)29,7%
31 to 45 216 (52,9%)33,8%
192 (47,1%)27,2%
408 (100%)30,3%
46 to 65 112 (27,9%)17,5%
289 (72,1%)41,0%
401 (100%)29,8%
Over 65 23 (16,8%)3,6%
114 (83,2%)16,2%
137 (100%)10,2%
Total 640 (47,6%)100%
705 (52,4%)100%
1345 (100%)100%
table 56 age groups aNd goiNg to CoNCerts (MaCedoNia)
(λ = 0,295)Attend Do not attend Total
18 to 30 205 (70,0%)51,8%
88 (30,0%)18,5%
293 (100%)33,6%
31 to 45 132 (48,5%)33,3%
140 (51,5%)29,5%
272 (100%)31,2%
46 to 65 49 (19,4%)12,4%
203 (80,6%)42,7%
252 (100%)28,9%
Over 65 10 (18,5%)2,5%
44 (81,5%)9,3%
54 (100%)6,2%
Total 396 (45,5%)100%
475 (54,5%)100%
871 (100%)100%
The strongest link between cultural consumption activities and respondent job position, almost in the entire range of these activities (much stronger than, for instance, the influence of education), cannot be explained so simply. It might be that actual jobs participants work on120 blend their professional and educational affiliation on the one hand and their financial capacities on the other. In both Macedonia and Serbia audience attending cultural events is mostly made up of experts, managers/owners, civil servants and pupils and students, while mostly absent from public cultural life are farmers, workers, small business owners and supported individuals (housewives, pensioners, and the unemployed).
120 Let us recall that in the research we made a distinction between what respondents are trained for and what they might have actually done during their life (“in the happier times”), which we la-belled respondent’s occupation, and actual job they work in and which provides them with a means of living, which we labelled respondent’s job position. In occupational groups we had in mind the specific status culture of these groups, and we also classified in these groups those supported individuals (pupils, students, housewives, unemployed, and retired) whose work active family members belong to these groups, or who themselves used to belong to one of these groups.
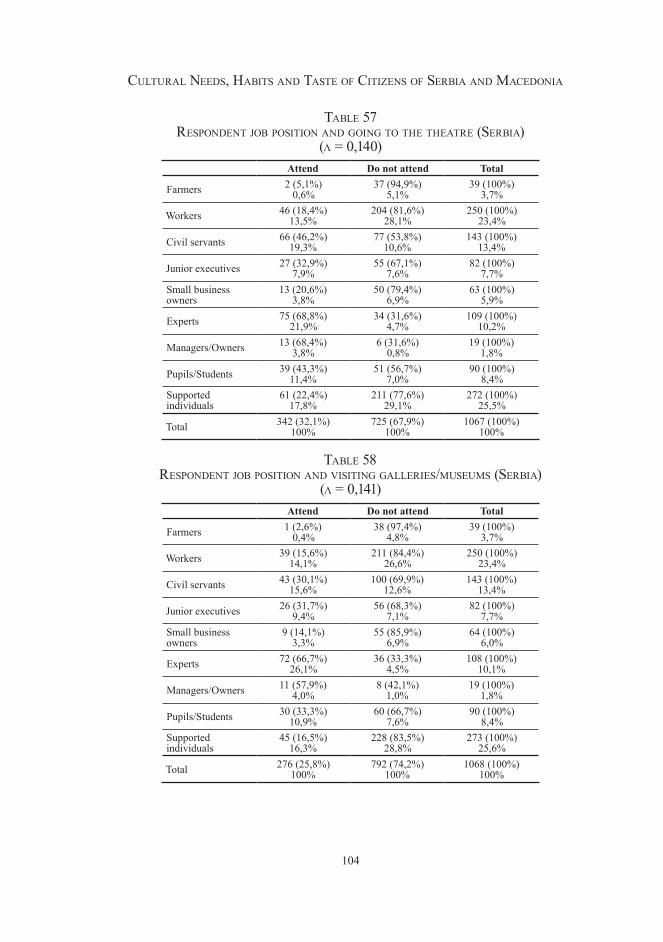
104
Cultural Needs, Habits aNd taste of CitizeNs of serbia aNd MaCedoNia
table 57 respoNdeNt job positioN aNd goiNg to tHe tHeatre (serbia)
(λ = 0,140)Attend Do not attend Total
Farmers 2 (5,1%)0,6%
37 (94,9%)5,1%
39 (100%)3,7%
Workers 46 (18,4%)13,5%
204 (81,6%)28,1%
250 (100%)23,4%
Civil servants 66 (46,2%)19,3%
77 (53,8%)10,6%
143 (100%)13,4%
Junior executives 27 (32,9%)7,9%
55 (67,1%)7,6%
82 (100%)7,7%
Small business owners
13 (20,6%)3,8%
50 (79,4%)6,9%
63 (100%)5,9%
Experts 75 (68,8%)21,9%
34 (31,6%)4,7%
109 (100%)10,2%
Managers/Owners 13 (68,4%)3,8%
6 (31,6%)0,8%
19 (100%)1,8%
Pupils/Students 39 (43,3%)11,4%
51 (56,7%)7,0%
90 (100%)8,4%
Supported individuals
61 (22,4%)17,8%
211 (77,6%)29,1%
272 (100%) 25,5%
Total 342 (32,1%)100%
725 (67,9%)100%
1067 (100%)100%
table 58 respoNdeNt job positioN aNd visitiNg galleries/MuseuMs (serbia)
(λ = 0,141)Attend Do not attend Total
Farmers 1 (2,6%)0,4%
38 (97,4%)4,8%
39 (100%)3,7%
Workers 39 (15,6%)14,1%
211 (84,4%)26,6%
250 (100%)23,4%
Civil servants 43 (30,1%)15,6%
100 (69,9%)12,6%
143 (100%)13,4%
Junior executives 26 (31,7%)9,4%
56 (68,3%)7,1%
82 (100%)7,7%
Small business owners
9 (14,1%)3,3%
55 (85,9%)6,9%
64 (100%)6,0%
Experts 72 (66,7%)26,1%
36 (33,3%)4,5%
108 (100%)10,1%
Managers/Owners 11 (57,9%)4,0%
8 (42,1%)1,0%
19 (100%)1,8%
Pupils/Students 30 (33,3%)10,9%
60 (66,7%)7,6%
90 (100%)8,4%
Supported individuals
45 (16,5%)16,3%
228 (83,5%)28,8%
273 (100%)25,6%
Total 276 (25,8%)100%
792 (74,2%)100%
1068 (100%)100%
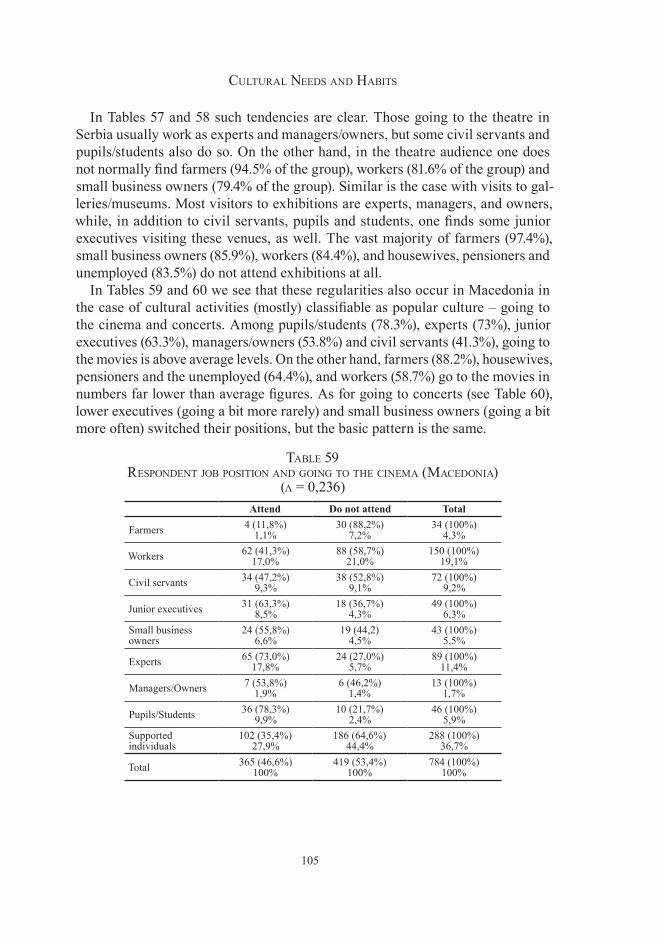
105
Cultural Needs aNd Habits
In Tables 57 and 58 such tendencies are clear. Those going to the theatre in Serbia usually work as experts and managers/owners, but some civil servants and pupils/students also do so. On the other hand, in the theatre audience one does not normally find farmers (94.5% of the group), workers (81.6% of the group) and small business owners (79.4% of the group). Similar is the case with visits to gal-leries/museums. Most visitors to exhibitions are experts, managers, and owners, while, in addition to civil servants, pupils and students, one finds some junior executives visiting these venues, as well. The vast majority of farmers (97.4%), small business owners (85.9%), workers (84.4%), and housewives, pensioners and unemployed (83.5%) do not attend exhibitions at all.
In Tables 59 and 60 we see that these regularities also occur in Macedonia in the case of cultural activities (mostly) classifiable as popular culture – going to the cinema and concerts. Among pupils/students (78.3%), experts (73%), junior executives (63.3%), managers/owners (53.8%) and civil servants (41.3%), going to the movies is above average levels. On the other hand, farmers (88.2%), housewives, pensioners and the unemployed (64.4%), and workers (58.7%) go to the movies in numbers far lower than average figures. As for going to concerts (see Table 60), lower executives (going a bit more rarely) and small business owners (going a bit more often) switched their positions, but the basic pattern is the same.
table 59 respoNdeNt job positioN aNd goiNg to tHe CiNeMa (MaCedoNia)
(λ = 0,236)Attend Do not attend Total
Farmers 4 (11,8%)1,1%
30 (88,2%)7,2%
34 (100%)4,3%
Workers 62 (41,3%)17,0%
88 (58,7%)21,0%
150 (100%)19,1%
Civil servants 34 (47,2%)9,3%
38 (52,8%)9,1%
72 (100%)9,2%
Junior executives 31 (63,3%)8,5%
18 (36,7%)4,3%
49 (100%)6,3%
Small business owners
24 (55,8%)6,6%
19 (44,2)4,5%
43 (100%)5,5%
Experts 65 (73,0%)17,8%
24 (27,0%)5,7%
89 (100%)11,4%
Managers/Owners 7 (53,8%)1,9%
6 (46,2%)1,4%
13 (100%)1,7%
Pupils/Students 36 (78,3%)9,9%
10 (21,7%)2,4%
46 (100%)5,9%
Supported individuals
102 (35,4%)27,9%
186 (64,6%)44,4%
288 (100%)36,7%
Total 365 (46,6%)100%
419 (53,4%)100%
784 (100%)100%
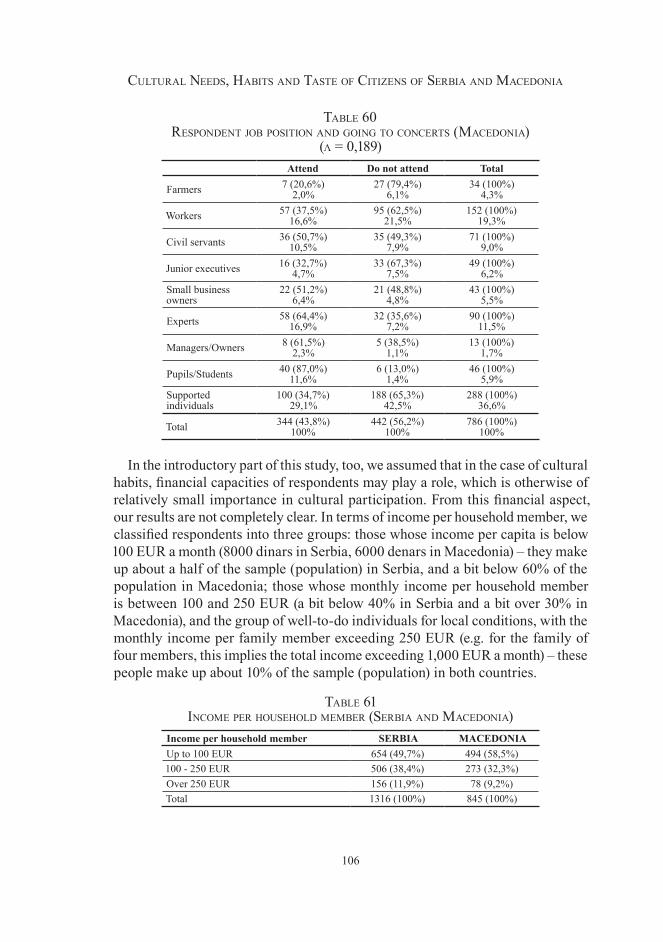
106
Cultural Needs, Habits aNd taste of CitizeNs of serbia aNd MaCedoNia
table 60 respoNdeNt job positioN aNd goiNg to CoNCerts (MaCedoNia)
(λ = 0,189)Attend Do not attend Total
Farmers 7 (20,6%)2,0%
27 (79,4%)6,1%
34 (100%)4,3%
Workers 57 (37,5%)16,6%
95 (62,5%)21,5%
152 (100%)19,3%
Civil servants 36 (50,7%)10,5%
35 (49,3%)7,9%
71 (100%)9,0%
Junior executives 16 (32,7%)4,7%
33 (67,3%)7,5%
49 (100%)6,2%
Small business owners
22 (51,2%)6,4%
21 (48,8%)4,8%
43 (100%)5,5%
Experts 58 (64,4%)16,9%
32 (35,6%)7,2%
90 (100%)11,5%
Managers/Owners 8 (61,5%)2,3%
5 (38,5%)1,1%
13 (100%)1,7%
Pupils/Students 40 (87,0%)11,6%
6 (13,0%)1,4%
46 (100%)5,9%
Supported individuals
100 (34,7%)29,1%
188 (65,3%)42,5%
288 (100%)36,6%
Total 344 (43,8%)100%
442 (56,2%)100%
786 (100%)100%
In the introductory part of this study, too, we assumed that in the case of cultural habits, financial capacities of respondents may play a role, which is otherwise of relatively small importance in cultural participation. From this financial aspect, our results are not completely clear. In terms of income per household member, we classified respondents into three groups: those whose income per capita is below 100 EUR a month (8000 dinars in Serbia, 6000 denars in Macedonia) – they make up about a half of the sample (population) in Serbia, and a bit below 60% of the population in Macedonia; those whose monthly income per household member is between 100 and 250 EUR (a bit below 40% in Serbia and a bit over 30% in Macedonia), and the group of well-to-do individuals for local conditions, with the monthly income per family member exceeding 250 EUR (e.g. for the family of four members, this implies the total income exceeding 1,000 EUR a month) – these people make up about 10% of the sample (population) in both countries.
table 61 iNCoMe per HouseHold MeMber (serbia aNd MaCedoNia)
Income per household member SERBIA MACEDONIAUp to 100 EUR 654 (49,7%) 494 (58,5%)100 - 250 EUR 506 (38,4%) 273 (32,3%)Over 250 EUR 156 (11,9%) 78 (9,2%)Total 1316 (100%) 845 (100%)
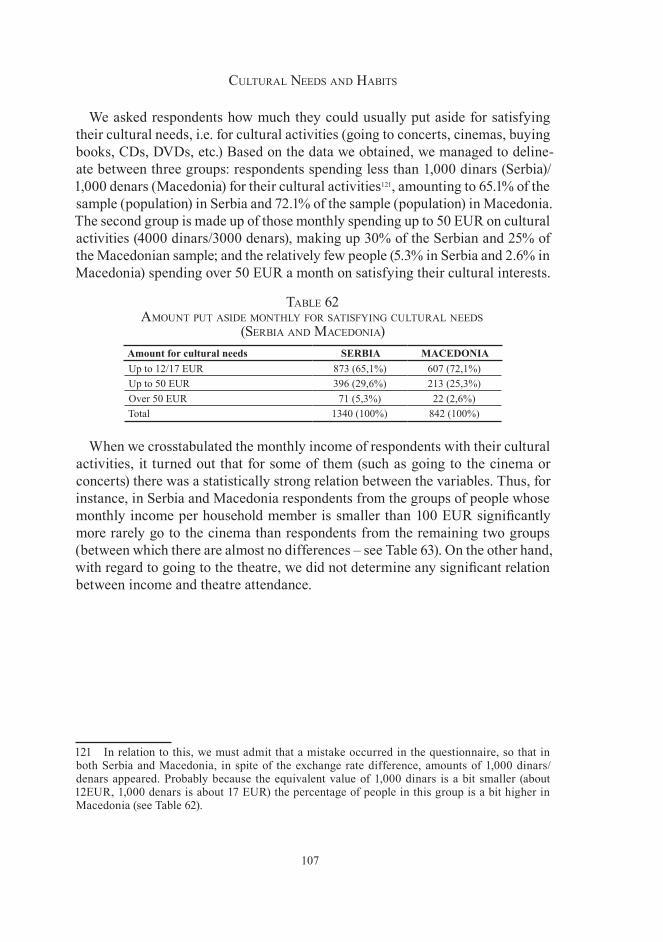
107
Cultural Needs aNd Habits
We asked respondents how much they could usually put aside for satisfying their cultural needs, i.e. for cultural activities (going to concerts, cinemas, buying books, CDs, DVDs, etc.) Based on the data we obtained, we managed to deline-ate between three groups: respondents spending less than 1,000 dinars (Serbia)/ 1,000 denars (Macedonia) for their cultural activities121, amounting to 65.1% of the sample (population) in Serbia and 72.1% of the sample (population) in Macedonia. The second group is made up of those monthly spending up to 50 EUR on cultural activities (4000 dinars/3000 denars), making up 30% of the Serbian and 25% of the Macedonian sample; and the relatively few people (5.3% in Serbia and 2.6% in Macedonia) spending over 50 EUR a month on satisfying their cultural interests.
table 62 aMouNt put aside MoNtHly for satisfyiNg Cultural Needs
(serbia aNd MaCedoNia)Amount for cultural needs SERBIA MACEDONIAUp to 12/17 EUR 873 (65,1%) 607 (72,1%)Up to 50 EUR 396 (29,6%) 213 (25,3%)Over 50 EUR 71 (5,3%) 22 (2,6%)Total 1340 (100%) 842 (100%)
When we crosstabulated the monthly income of respondents with their cultural activities, it turned out that for some of them (such as going to the cinema or concerts) there was a statistically strong relation between the variables. Thus, for instance, in Serbia and Macedonia respondents from the groups of people whose monthly income per household member is smaller than 100 EUR significantly more rarely go to the cinema than respondents from the remaining two groups (between which there are almost no differences – see Table 63). On the other hand, with regard to going to the theatre, we did not determine any significant relation between income and theatre attendance.
121 In relation to this, we must admit that a mistake occurred in the questionnaire, so that in both Serbia and Macedonia, in spite of the exchange rate difference, amounts of 1,000 dinars/denars appeared. Probably because the equivalent value of 1,000 dinars is a bit smaller (about 12EUR, 1,000 denars is about 17 EUR) the percentage of people in this group is a bit higher in Macedonia (see Table 62).
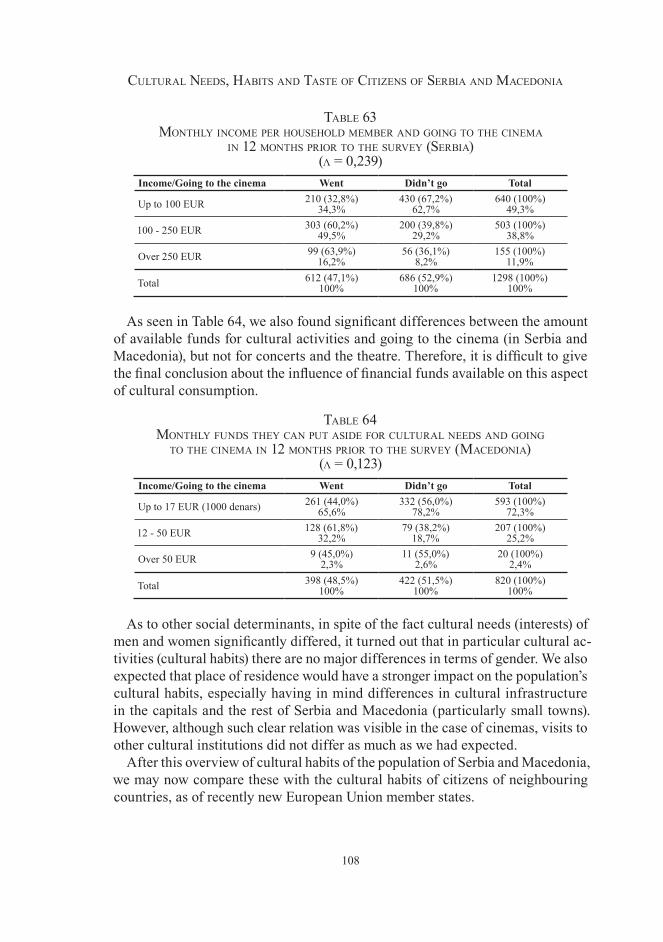
108
Cultural Needs, Habits aNd taste of CitizeNs of serbia aNd MaCedoNia
table 6� MoNtHly iNCoMe per HouseHold MeMber aNd goiNg to tHe CiNeMa
iN 12 MoNtHs prior to tHe survey (serbia) (λ = 0,239)
Income/Going to the cinema Went Didn’t go Total
Up to 100 EUR 210 (32,8%)34,3%
430 (67,2%)62,7%
640 (100%)49,3%
100 - 250 EUR 303 (60,2%)49,5%
200 (39,8%)29,2%
503 (100%)38,8%
Over 250 EUR 99 (63,9%)16,2%
56 (36,1%)8,2%
155 (100%)11,9%
Total 612 (47,1%)100%
686 (52,9%)100%
1298 (100%)100%
As seen in Table 64, we also found significant differences between the amount of available funds for cultural activities and going to the cinema (in Serbia and Macedonia), but not for concerts and the theatre. Therefore, it is difficult to give the final conclusion about the influence of financial funds available on this aspect of cultural consumption.
table 64 MoNtHly fuNds tHey CaN put aside for Cultural Needs aNd goiNg
to tHe CiNeMa iN 12 MoNtHs prior to tHe survey (MaCedoNia) (λ = 0,123)
Income/Going to the cinema Went Didn’t go Total
Up to 17 EUR (1000 denars) 261 (44,0%)65,6%
332 (56,0%)78,2%
593 (100%)72,3%
12 - 50 EUR 128 (61,8%)32,2%
79 (38,2%)18,7%
207 (100%)25,2%
Over 50 EUR 9 (45,0%)2,3%
11 (55,0%)2,6%
20 (100%)2,4%
Total 398 (48,5%)100%
422 (51,5%)100%
820 (100%)100%
As to other social determinants, in spite of the fact cultural needs (interests) of men and women significantly differed, it turned out that in particular cultural ac-tivities (cultural habits) there are no major differences in terms of gender. We also expected that place of residence would have a stronger impact on the population’s cultural habits, especially having in mind differences in cultural infrastructure in the capitals and the rest of Serbia and Macedonia (particularly small towns). However, although such clear relation was visible in the case of cinemas, visits to other cultural institutions did not differ as much as we had expected.
After this overview of cultural habits of the population of Serbia and Macedonia, we may now compare these with the cultural habits of citizens of neighbouring countries, as of recently new European Union member states.
109
Cultural Needs aNd Habits
Comparison of Cultural Habits of Citizens of Serbia and Macedonia with Cultural Habits of Citizens of Neighbouring Countries (EU Member States)
The studies “Europeans’ Participation in Cultural Activities” and “New Europeans and Culture” were carried out upon the request of the European Commission in 2002 and 2003. The first research comprised fifteen countries which were at the time EU members, and the second one thirteen countries which were then candidates for accession (Lithuania, Estonia, Latvia, Poland, the Czech Republic, Slovakia, Hun-gary, Slovenia, Cyprus, Malta, Bulgaria, Romania, and Turkey122). In both studies, stratified multistage random samples were used, gathering about 1,000 respond-ents123. The only relevant sampling difference is reflected in the fact in these studies respondents were aged 15 and above, while in our research respondents were older than 18. Therefore, a meaningful comparison between results seems possible.
The studies “Europeans’ Participation in Cultural Activities” and “New Eu-ropeans and Culture” researched cultural activities of citizens of countries that were at that time members of EU and countries that would become future member states (attendance at cultural events, reading books, listening to music, watching television, listening to the radio, reading daily press and magazines, listening to music, using the computer, and artistic activities). Wishing to compare the cultural habits of citizens of Macedonia and Serbia in this context, we incorporated in our research a number of questions from these Eurobarometer surveys.
When we compared results on attendance to cultural events of the population of Serbia and Macedonia with the average of EU candidate countries, it turned out that in almost all activities (apart from attendance at ballet performances and visits to historical monuments in Serbia), citizens of Serbia and Macedonia are above average levels124 (see Graphs 1 and 2).
One gets the same impression upon comparing the percentage of respondents who had not attended cultural events in the year prior to the survey. Only in the case of ballet and visits to museums abroad was the percentage of visitors from Serbia and Macedonia lower than that of countries who were then EU candidates. One should add to this that in terms of visits to historical monuments Serbia is exactly on the average level for these, then, future EU member states. In all other cases, the percentage of those who did not visit cultural events/cultural institutions in Macedonia and Serbia is by far below the average of candidate countries (see Graphs 3 and 4). 122 The first ten countries acceded to the EU in 2005, while Bulgaria and Romania joined in 2007. Turkey is still a candidate country. 123 With the exception of Germany – 2,047 respondents (because the study was conducted separately for east and west Germany) and Cyprus – 500 respondents. 124 The ‘average’ here pertains to the scale with values 1 through 5 (where 1 means “never”, and 5 means “more than 12 times”). The central position is expressed by the value 3, meaning “4 to 6 times”. This solution was used by Eurostat teams, and we just included the data acquired from the research in Macedonia and Serbia into the graph (table).
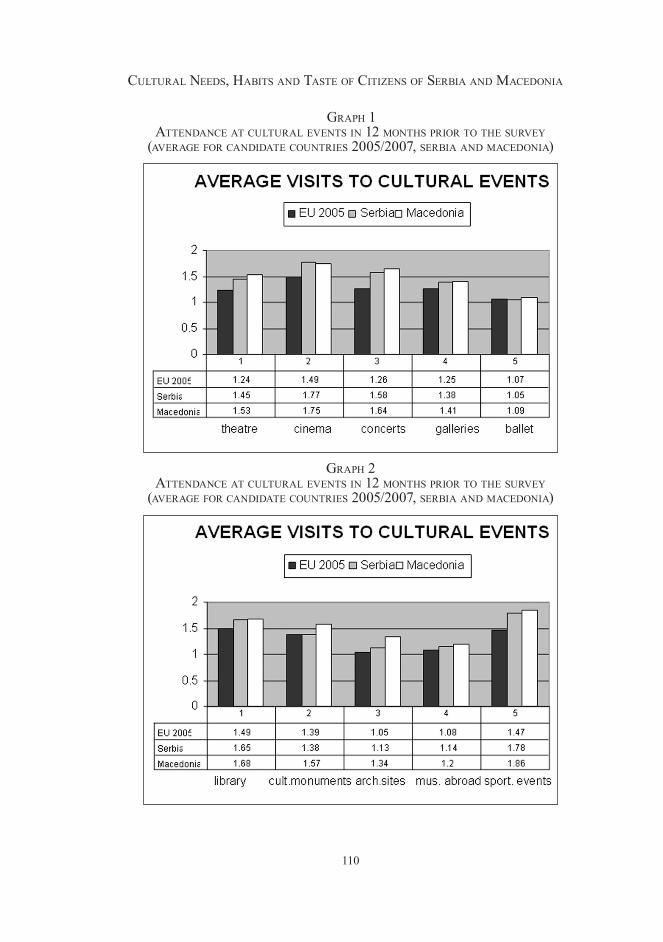
110
Cultural Needs, Habits aNd taste of CitizeNs of serbia aNd MaCedoNia
grapH 1 atteNdaNCe at Cultural eveNts iN 12 MoNtHs prior to tHe survey
(average for CaNdidate CouNtries 2005/2007, serbia aNd MaCedoNia)
grapH 2 atteNdaNCe at Cultural eveNts iN 12 MoNtHs prior to tHe survey
(average for CaNdidate CouNtries 2005/2007, serbia aNd MaCedoNia)
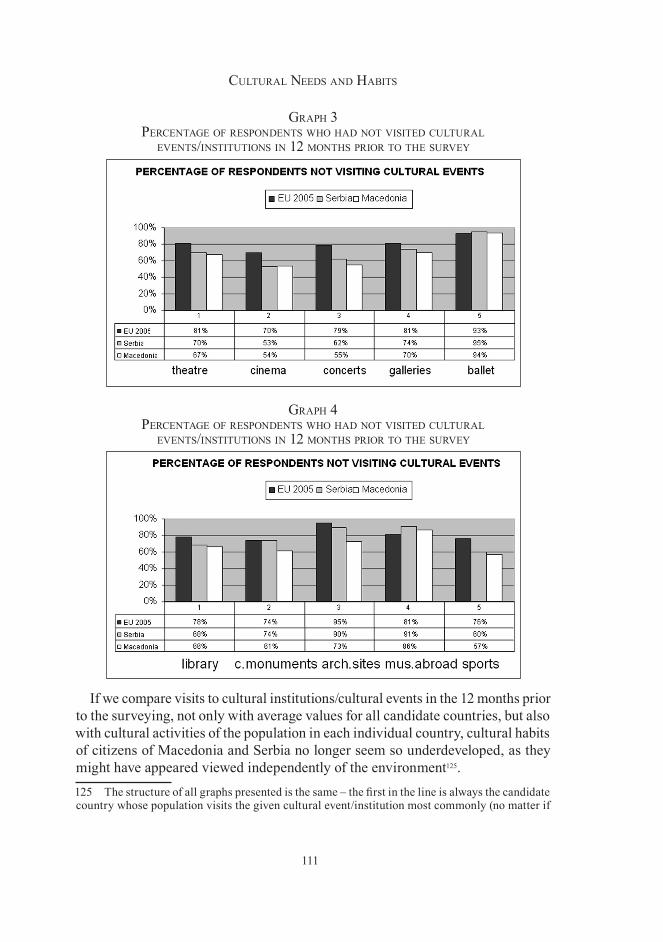
111
Cultural Needs aNd Habits
grapH � perCeNtage of respoNdeNts wHo Had Not visited Cultural
eveNts/iNstitutioNs iN 12 MoNtHs prior to tHe survey
grapH 4 perCeNtage of respoNdeNts wHo Had Not visited Cultural
eveNts/iNstitutioNs iN 12 MoNtHs prior to tHe survey
If we compare visits to cultural institutions/cultural events in the 12 months prior to the surveying, not only with average values for all candidate countries, but also with cultural activities of the population in each individual country, cultural habits of citizens of Macedonia and Serbia no longer seem so underdeveloped, as they might have appeared viewed independently of the environment125.125 The structure of all graphs presented is the same – the first in the line is always the candidate country whose population visits the given cultural event/institution most commonly (no matter if
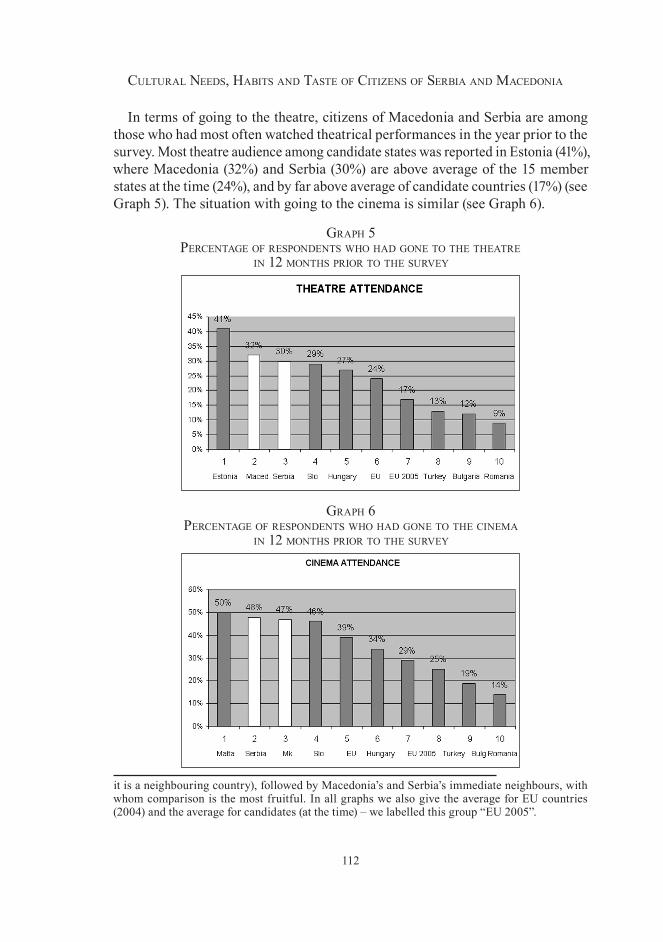
112
Cultural Needs, Habits aNd taste of CitizeNs of serbia aNd MaCedoNia
In terms of going to the theatre, citizens of Macedonia and Serbia are among those who had most often watched theatrical performances in the year prior to the survey. Most theatre audience among candidate states was reported in Estonia (41%), where Macedonia (32%) and Serbia (30%) are above average of the 15 member states at the time (24%), and by far above average of candidate countries (17%) (see Graph 5). The situation with going to the cinema is similar (see Graph 6).
grapH 5 perCeNtage of respoNdeNts wHo Had goNe to tHe tHeatre
iN 12 MoNtHs prior to tHe survey
grapH 6 perCeNtage of respoNdeNts wHo Had goNe to tHe CiNeMa
iN 12 MoNtHs prior to tHe survey
it is a neighbouring country), followed by Macedonia’s and Serbia’s immediate neighbours, with whom comparison is the most fruitful. In all graphs we also give the average for EU countries (2004) and the average for candidates (at the time) – we labelled this group “EU 2005”.
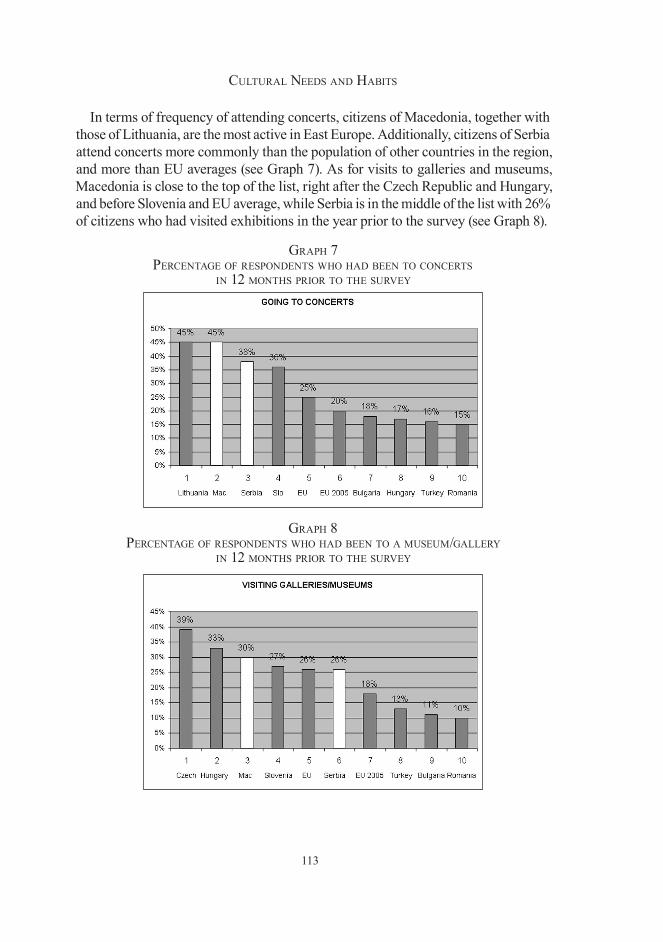
113
Cultural Needs aNd Habits
In terms of frequency of attending concerts, citizens of Macedonia, together with those of Lithuania, are the most active in East Europe. Additionally, citizens of Serbia attend concerts more commonly than the population of other countries in the region, and more than EU averages (see Graph 7). As for visits to galleries and museums, Macedonia is close to the top of the list, right after the Czech Republic and Hungary, and before Slovenia and EU average, while Serbia is in the middle of the list with 26% of citizens who had visited exhibitions in the year prior to the survey (see Graph 8).
grapH 7 perCeNtage of respoNdeNts wHo Had beeN to CoNCerts
iN 12 MoNtHs prior to tHe survey
grapH 8 perCeNtage of respoNdeNts wHo Had beeN to a MuseuM/gallery
iN 12 MoNtHs prior to tHe survey
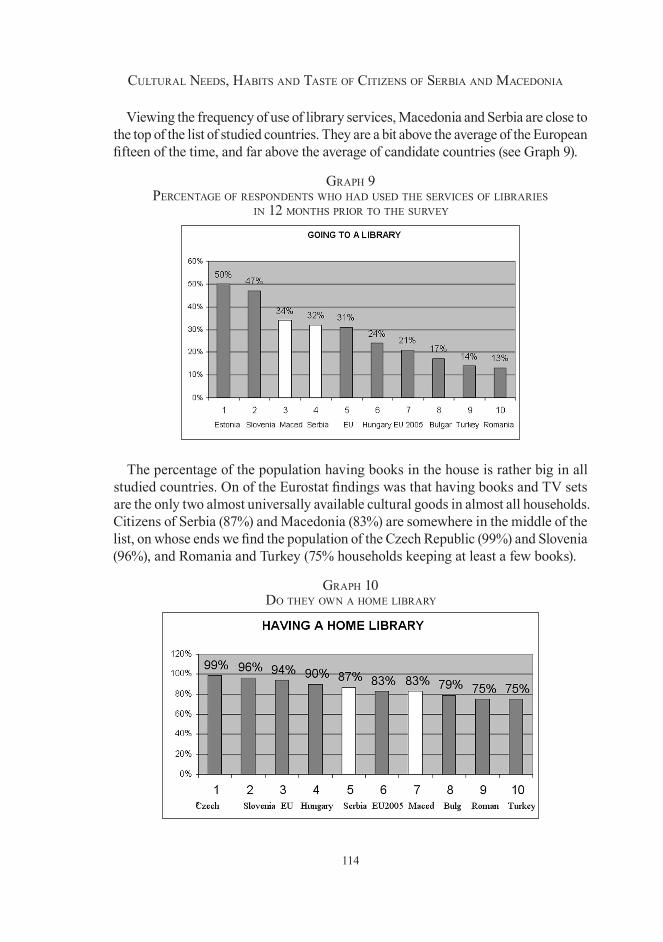
114
Cultural Needs, Habits aNd taste of CitizeNs of serbia aNd MaCedoNia
Viewing the frequency of use of library services, Macedonia and Serbia are close to the top of the list of studied countries. They are a bit above the average of the European fifteen of the time, and far above the average of candidate countries (see Graph 9).
grapH 9 perCeNtage of respoNdeNts wHo Had used tHe serviCes of libraries
iN 12 MoNtHs prior to tHe survey
The percentage of the population having books in the house is rather big in all studied countries. On of the Eurostat findings was that having books and TV sets are the only two almost universally available cultural goods in almost all households. Citizens of Serbia (87%) and Macedonia (83%) are somewhere in the middle of the list, on whose ends we find the population of the Czech Republic (99%) and Slovenia (96%), and Romania and Turkey (75% households keeping at least a few books).
grapH 10 do tHey owN a HoMe library
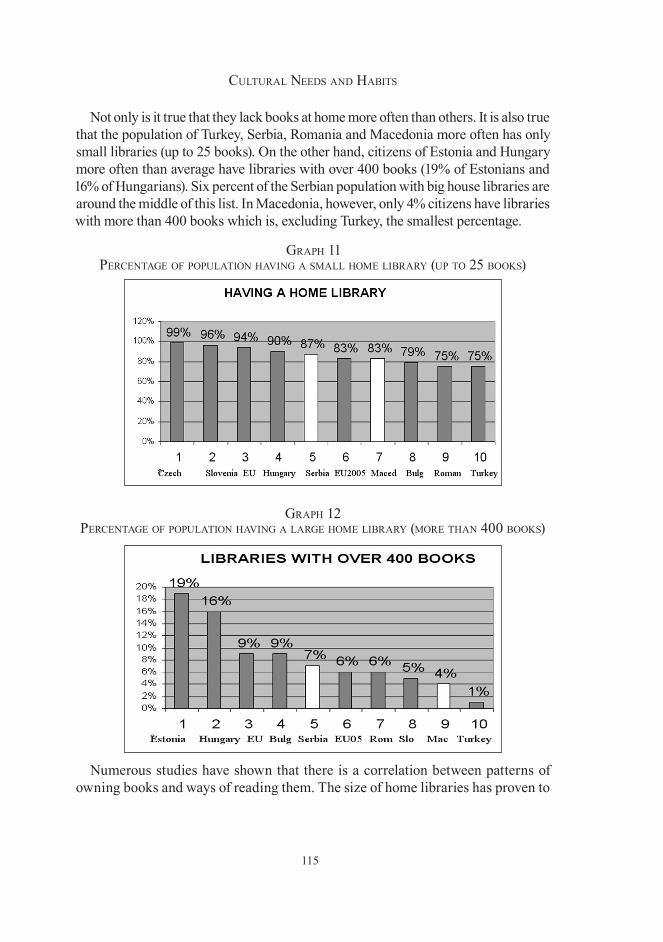
115
Cultural Needs aNd Habits
Not only is it true that they lack books at home more often than others. It is also true that the population of Turkey, Serbia, Romania and Macedonia more often has only small libraries (up to 25 books). On the other hand, citizens of Estonia and Hungary more often than average have libraries with over 400 books (19% of Estonians and 16% of Hungarians). Six percent of the Serbian population with big house libraries are around the middle of this list. In Macedonia, however, only 4% citizens have libraries with more than 400 books which is, excluding Turkey, the smallest percentage.
grapH 11 perCeNtage of populatioN HaviNg a sMall HoMe library (up to 25 books)
grapH 12 perCeNtage of populatioN HaviNg a large HoMe library (More tHaN 400 books)
Numerous studies have shown that there is a correlation between patterns of owning books and ways of reading them. The size of home libraries has proven to
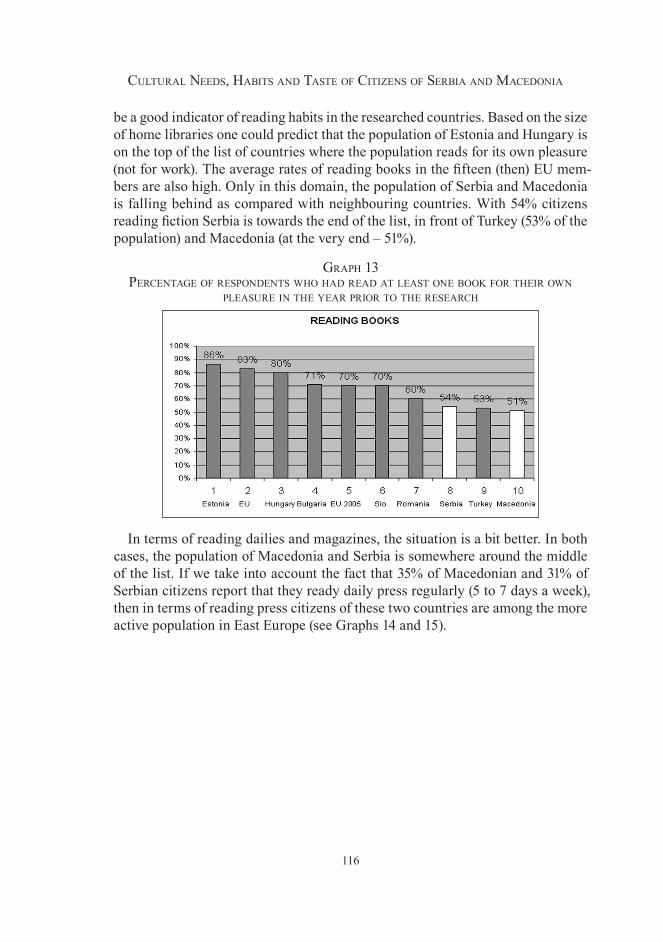
116
Cultural Needs, Habits aNd taste of CitizeNs of serbia aNd MaCedoNia
be a good indicator of reading habits in the researched countries. Based on the size of home libraries one could predict that the population of Estonia and Hungary is on the top of the list of countries where the population reads for its own pleasure (not for work). The average rates of reading books in the fifteen (then) EU mem-bers are also high. Only in this domain, the population of Serbia and Macedonia is falling behind as compared with neighbouring countries. With 54% citizens reading fiction Serbia is towards the end of the list, in front of Turkey (53% of the population) and Macedonia (at the very end – 51%).
grapH 1� perCeNtage of respoNdeNts wHo Had read at least oNe book for tHeir owN
pleasure iN tHe year prior to tHe researCH
In terms of reading dailies and magazines, the situation is a bit better. In both cases, the population of Macedonia and Serbia is somewhere around the middle of the list. If we take into account the fact that 35% of Macedonian and 31% of Serbian citizens report that they ready daily press regularly (5 to 7 days a week), then in terms of reading press citizens of these two countries are among the more active population in East Europe (see Graphs 14 and 15).
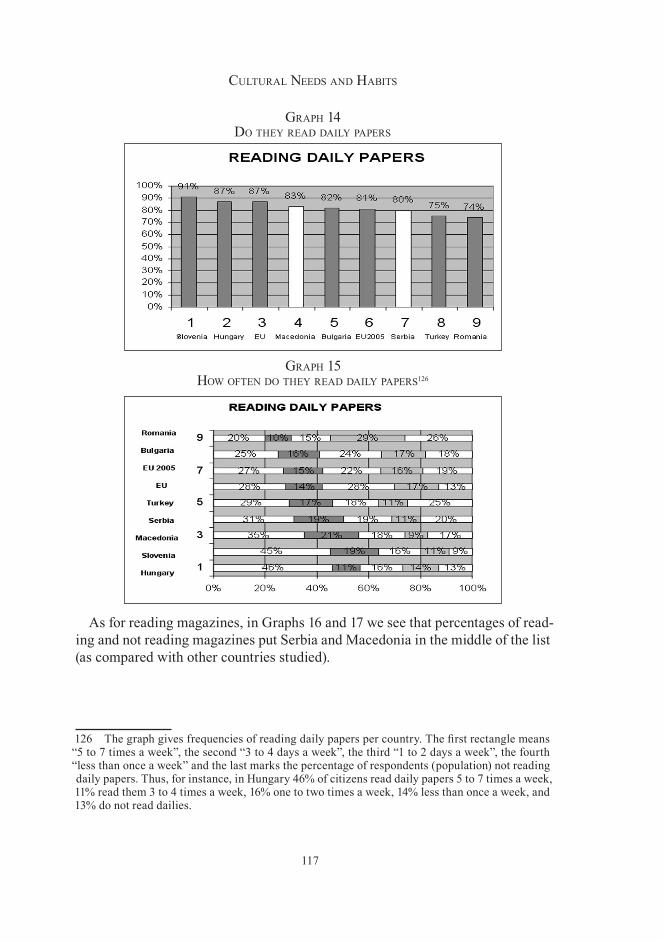
117
Cultural Needs aNd Habits
grapH 14 do tHey read daily papers
grapH 15 How ofteN do tHey read daily papers126
As for reading magazines, in Graphs 16 and 17 we see that percentages of read-ing and not reading magazines put Serbia and Macedonia in the middle of the list (as compared with other countries studied).
126 The graph gives frequencies of reading daily papers per country. The first rectangle means “5 to 7 times a week”, the second “3 to 4 days a week”, the third “1 to 2 days a week”, the fourth “less than once a week” and the last marks the percentage of respondents (population) not reading daily papers. Thus, for instance, in Hungary 46% of citizens read daily papers 5 to 7 times a week, 11% read them 3 to 4 times a week, 16% one to two times a week, 14% less than once a week, and 13% do not read dailies.
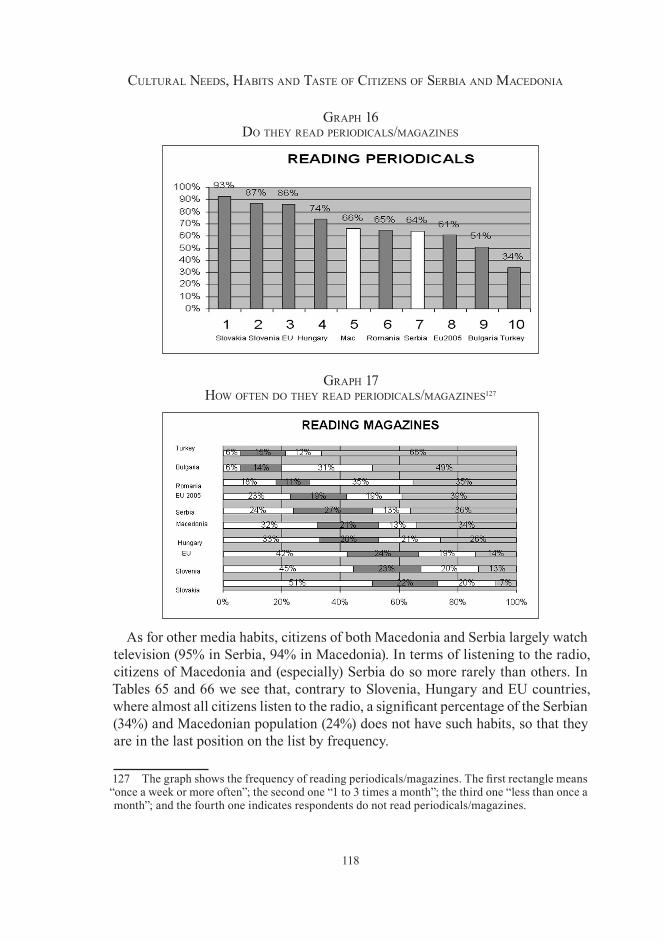
118
Cultural Needs, Habits aNd taste of CitizeNs of serbia aNd MaCedoNia
grapH 16 do tHey read periodiCals/MagaziNes
grapH 17 How ofteN do tHey read periodiCals/MagaziNes127
As for other media habits, citizens of both Macedonia and Serbia largely watch television (95% in Serbia, 94% in Macedonia). In terms of listening to the radio, citizens of Macedonia and (especially) Serbia do so more rarely than others. In Tables 65 and 66 we see that, contrary to Slovenia, Hungary and EU countries, where almost all citizens listen to the radio, a significant percentage of the Serbian (34%) and Macedonian population (24%) does not have such habits, so that they are in the last position on the list by frequency.
127 The graph shows the frequency of reading periodicals/magazines. The first rectangle means “once a week or more often”; the second one “1 to 3 times a month”; the third one “less than once a month”; and the fourth one indicates respondents do not read periodicals/magazines.
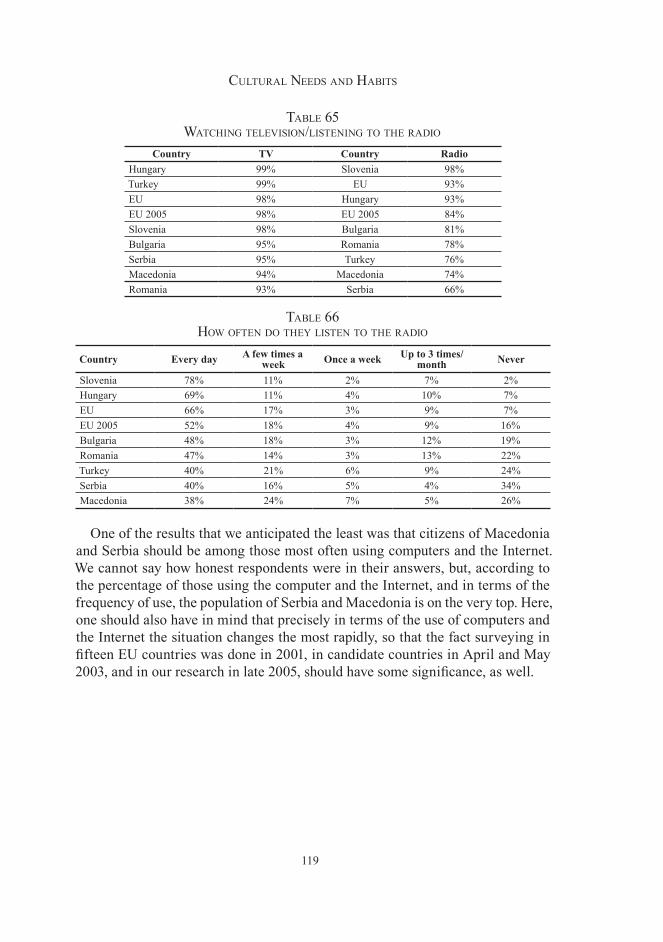
119
Cultural Needs aNd Habits
table 65 watCHiNg televisioN/listeNiNg to tHe radio
Country TV Country RadioHungary 99% Slovenia 98%Turkey 99% EU 93%EU 98% Hungary 93%EU 2005 98% EU 2005 84%Slovenia 98% Bulgaria 81%Bulgaria 95% Romania 78%Serbia 95% Turkey 76%Macedonia 94% Macedonia 74%Romania 93% Serbia 66%
table 66 How ofteN do tHey listeN to tHe radio
Country Every day A few times a week Once a week Up to 3 times/
month Never
Slovenia 78% 11% 2% 7% 2%Hungary 69% 11% 4% 10% 7%EU 66% 17% 3% 9% 7%EU 2005 52% 18% 4% 9% 16%Bulgaria 48% 18% 3% 12% 19%Romania 47% 14% 3% 13% 22%Turkey 40% 21% 6% 9% 24%Serbia 40% 16% 5% 4% 34%Macedonia 38% 24% 7% 5% 26%
One of the results that we anticipated the least was that citizens of Macedonia and Serbia should be among those most often using computers and the Internet. We cannot say how honest respondents were in their answers, but, according to the percentage of those using the computer and the Internet, and in terms of the frequency of use, the population of Serbia and Macedonia is on the very top. Here, one should also have in mind that precisely in terms of the use of computers and the Internet the situation changes the most rapidly, so that the fact surveying in fifteen EU countries was done in 2001, in candidate countries in April and May 2003, and in our research in late 2005, should have some significance, as well.
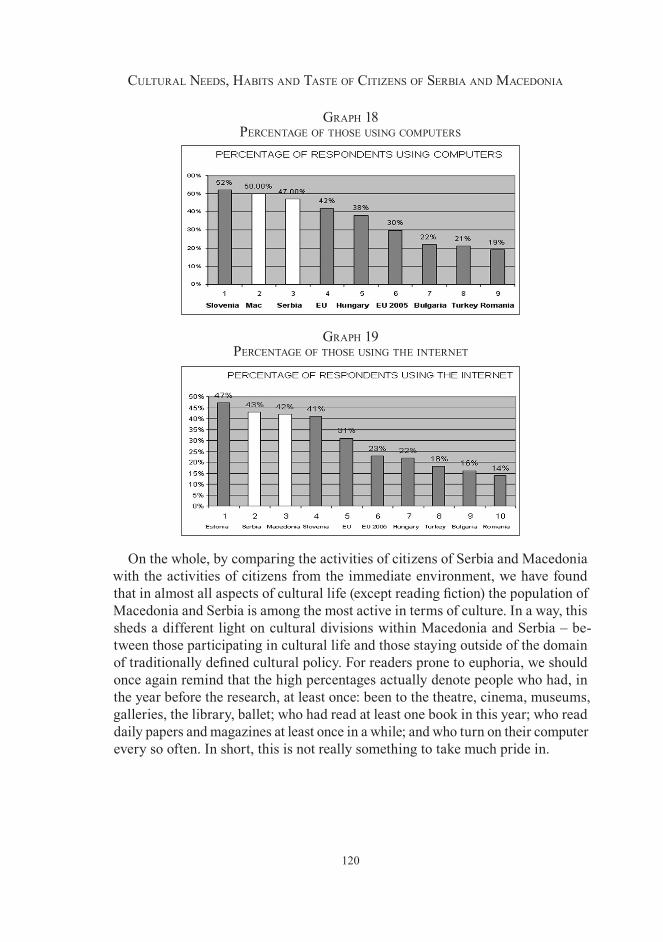
120
Cultural Needs, Habits aNd taste of CitizeNs of serbia aNd MaCedoNia
grapH 18 perCeNtage of tHose usiNg CoMputers
grapH 19 perCeNtage of tHose usiNg tHe iNterNet
On the whole, by comparing the activities of citizens of Serbia and Macedonia with the activities of citizens from the immediate environment, we have found that in almost all aspects of cultural life (except reading fiction) the population of Macedonia and Serbia is among the most active in terms of culture. In a way, this sheds a different light on cultural divisions within Macedonia and Serbia – be-tween those participating in cultural life and those staying outside of the domain of traditionally defined cultural policy. For readers prone to euphoria, we should once again remind that the high percentages actually denote people who had, in the year before the research, at least once: been to the theatre, cinema, museums, galleries, the library, ballet; who had read at least one book in this year; who read daily papers and magazines at least once in a while; and who turn on their computer every so often. In short, this is not really something to take much pride in.
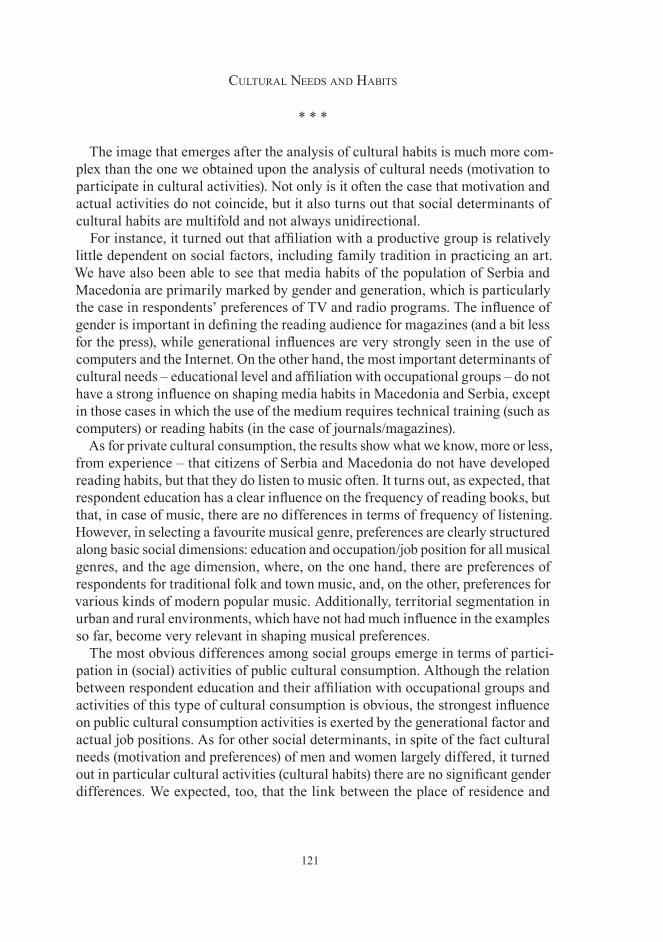
121
Cultural Needs aNd Habits
* * *
The image that emerges after the analysis of cultural habits is much more com-plex than the one we obtained upon the analysis of cultural needs (motivation to participate in cultural activities). Not only is it often the case that motivation and actual activities do not coincide, but it also turns out that social determinants of cultural habits are multifold and not always unidirectional.
For instance, it turned out that affiliation with a productive group is relatively little dependent on social factors, including family tradition in practicing an art. We have also been able to see that media habits of the population of Serbia and Macedonia are primarily marked by gender and generation, which is particularly the case in respondents’ preferences of TV and radio programs. The influence of gender is important in defining the reading audience for magazines (and a bit less for the press), while generational influences are very strongly seen in the use of computers and the Internet. On the other hand, the most important determinants of cultural needs – educational level and affiliation with occupational groups – do not have a strong influence on shaping media habits in Macedonia and Serbia, except in those cases in which the use of the medium requires technical training (such as computers) or reading habits (in the case of journals/magazines).
As for private cultural consumption, the results show what we know, more or less, from experience – that citizens of Serbia and Macedonia do not have developed reading habits, but that they do listen to music often. It turns out, as expected, that respondent education has a clear influence on the frequency of reading books, but that, in case of music, there are no differences in terms of frequency of listening. However, in selecting a favourite musical genre, preferences are clearly structured along basic social dimensions: education and occupation/job position for all musical genres, and the age dimension, where, on the one hand, there are preferences of respondents for traditional folk and town music, and, on the other, preferences for various kinds of modern popular music. Additionally, territorial segmentation in urban and rural environments, which have not had much influence in the examples so far, become very relevant in shaping musical preferences.
The most obvious differences among social groups emerge in terms of partici-pation in (social) activities of public cultural consumption. Although the relation between respondent education and their affiliation with occupational groups and activities of this type of cultural consumption is obvious, the strongest influence on public cultural consumption activities is exerted by the generational factor and actual job positions. As for other social determinants, in spite of the fact cultural needs (motivation and preferences) of men and women largely differed, it turned out in particular cultural activities (cultural habits) there are no significant gender differences. We expected, too, that the link between the place of residence and
122
Cultural Needs, Habits aNd taste of CitizeNs of serbia aNd MaCedoNia
cultural habits would be somewhat stronger, especially having in mind the totally different cultural infrastructure in the capitals and the rest of Serbia and Macedonia. However, although the clear connection was visible in the case of cinemas, visits to other cultural institutions did not differ in numbers as much as we had expected.
On the whole, one can say that citizens of Serbia and Macedonia do not attend cultural events so often and do not have well developed cultural habits. From the data we obtained, we can claim that about 70% respondents from Macedonia and Serbia had not been to a theatre or museum even once in the year prior to the research, that about 60% of them had not attended one concert, and about a half of them had not gone to the cinema. Apart from this group, which practically does not participate in public cultural life, among respondents (citizens of Serbia and Macedonia) one could discern two more groups: the one attending cultural programs occasionally (20-30% respondents) and the one we could consider regular audience (about 10% respondents). Among them, 1% and 3% respondents (population) participate in public cultural life at least once a month, i.e. more than 12 times a year. One should add to this that in the year prior to the research, 80.2% respondents in Serbia and 72.9% in Macedonia had not read a single book for professional purposes, and al-most a half respondents (population) had not read one book for their own pleasure (in Serbia, 45.6% respondents, in Macedonia, 48.9% respondents).
However, when we compared the results of our study of cultural activities of Serbian and Macedonian population with the average values for EU candidate countries and cultural activities of populations in individual countries, it turned out that in the case of almost all activities (except reading books, visits to ballet performances and historic monuments of culture), citizens of Serbia and Macedo-nia are above average values. This only shows that structural similarities among countries of the region are reflected in the similar structure of the audience and cultural styles – so that in all of them, a huge portion of the population is left out-side the traditionally defined domain of cultural policy.
123
The Audience and Cultural Offer
The idea of a separate analysis of motivation for cultural participation (what we defined in this research as cultural needs) and actual cultural participation
activities (that we labelled cultural habits) had for its purpose a reconstruction of four types of audience, based on the relationship between subjects’ “cultural needs” and “cultural habits”. This construct was to allow us a more complex analysis of the audience as compared with studies that, on the one hand, involve in the audience all persons having actually attended cultural events in the given time period128 (although they have no inclination to art), and exclude from the audience all those who love the arts and feel the need to communicate with works of art, but who were, in the given period (for some reason) prevented from participating in cultural activities. We believe that this last group, that of potential audience, is actually the most interesting for analysis and particularly interesting for all cultural policy stakeholders, especially for devising a marketing strategy or a strategy of socio-cultural animation.
The idea is based on the conception of Keith Diggle who, to remind the reader, differentiates between four audience types: 1) Attenders who have a positive attitude to the arts and transform this attitude to actual cultural participation; 2) Intenders, who have a positive attitude to the arts and like to attend cultural events, but fail to do so for some reason; 3) The Indifferent who do not have a clear attitude to art, nor a wish to attend cultural and art performances; and 4) The Hostile who have a negative position to the arts and no intention of visiting events in culture and art. Our classification of the audience is somewhat different and starts from the division into two respondent groups with regard to their cultural needs (those who do and do not like a particular type of art, i.e. do or do not have motivation to participate in a certain type of cultural activities) and two respondent groups with regard to their cultural habits (those who had attended cultural events in the given field in the previous year, and those who had not done so). Logically, four combinations are possible among these groups. The first group is made up of those we labelled “active audience”. These subjects like a certain type of art, have motivation to participate in certain cultural activities129 and they have participated in those cultural activities in the given period. The second group that we labelled
“potential (or passive) audience” is made up of respondents who like a particular kind of art, have motivation to take part in cultural activities, but have not partici-pated in them in the observed period. The third group is made up of respondents who do not have affinities to certain types of cultural activities130, but who in fact, 128 Usually a month or a year prior to the survey.129 That is, those from our research who stated they liked to do this in their leisure time.130 That is, stated they do not like to do this in their spare time.
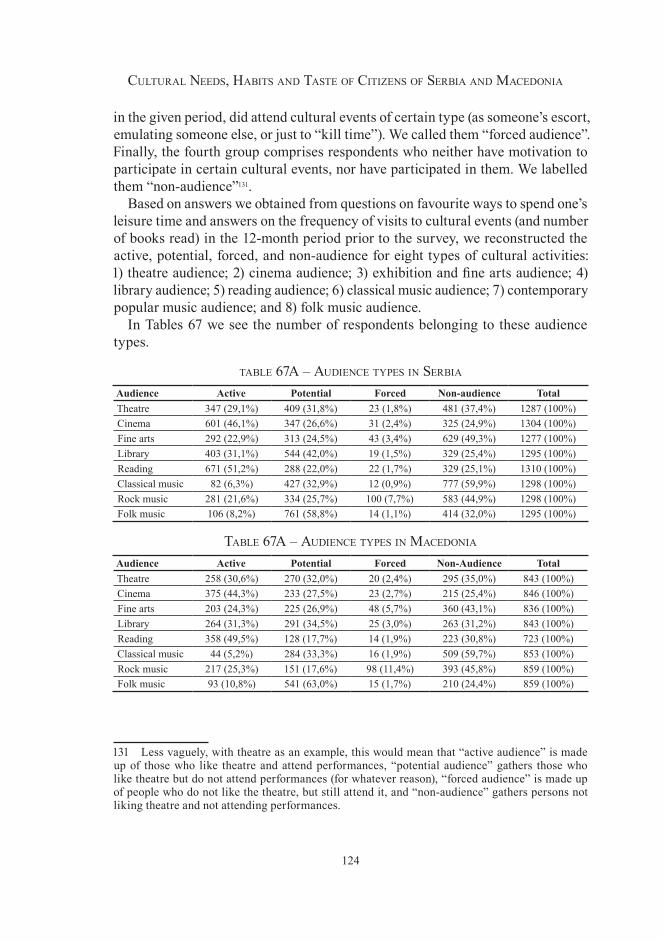
124
Cultural Needs, Habits aNd taste of CitizeNs of serbia aNd MaCedoNia
in the given period, did attend cultural events of certain type (as someone’s escort, emulating someone else, or just to “kill time”). We called them “forced audience”. Finally, the fourth group comprises respondents who neither have motivation to participate in certain cultural events, nor have participated in them. We labelled them “non-audience”131.
Based on answers we obtained from questions on favourite ways to spend one’s leisure time and answers on the frequency of visits to cultural events (and number of books read) in the 12-month period prior to the survey, we reconstructed the active, potential, forced, and non-audience for eight types of cultural activities: 1) theatre audience; 2) cinema audience; 3) exhibition and fine arts audience; 4) library audience; 5) reading audience; 6) classical music audience; 7) contemporary popular music audience; and 8) folk music audience.
In Tables 67 we see the number of respondents belonging to these audience types.
table 67a – audieNCe types iN serbia
Audience Active Potential Forced Non-audience TotalTheatre 347 (29,1%) 409 (31,8%) 23 (1,8%) 481 (37,4%) 1287 (100%)Cinema 601 (46,1%) 347 (26,6%) 31 (2,4%) 325 (24,9%) 1304 (100%)Fine arts 292 (22,9%) 313 (24,5%) 43 (3,4%) 629 (49,3%) 1277 (100%)Library 403 (31,1%) 544 (42,0%) 19 (1,5%) 329 (25,4%) 1295 (100%)Reading 671 (51,2%) 288 (22,0%) 22 (1,7%) 329 (25,1%) 1310 (100%)Classical music 82 (6,3%) 427 (32,9%) 12 (0,9%) 777 (59,9%) 1298 (100%)Rock music 281 (21,6%) 334 (25,7%) 100 (7,7%) 583 (44,9%) 1298 (100%)Folk music 106 (8,2%) 761 (58,8%) 14 (1,1%) 414 (32,0%) 1295 (100%)
table 67a – audieNCe types iN MaCedoNia
Audience Active Potential Forced Non-Audience TotalTheatre 258 (30,6%) 270 (32,0%) 20 (2,4%) 295 (35,0%) 843 (100%)Cinema 375 (44,3%) 233 (27,5%) 23 (2,7%) 215 (25,4%) 846 (100%)Fine arts 203 (24,3%) 225 (26,9%) 48 (5,7%) 360 (43,1%) 836 (100%)Library 264 (31,3%) 291 (34,5%) 25 (3,0%) 263 (31,2%) 843 (100%)Reading 358 (49,5%) 128 (17,7%) 14 (1,9%) 223 (30,8%) 723 (100%)Classical music 44 (5,2%) 284 (33,3%) 16 (1,9%) 509 (59,7%) 853 (100%)Rock music 217 (25,3%) 151 (17,6%) 98 (11,4%) 393 (45,8%) 859 (100%)Folk music 93 (10,8%) 541 (63,0%) 15 (1,7%) 210 (24,4%) 859 (100%)
131 Less vaguely, with theatre as an example, this would mean that “active audience” is made up of those who like theatre and attend performances, “potential audience” gathers those who like theatre but do not attend performances (for whatever reason), “forced audience” is made up of people who do not like the theatre, but still attend it, and “non-audience” gathers persons not liking theatre and not attending performances.
125
tHe audieNCe aNd Cultural offer
It turned out that, for all types of cultural activities132, forced audience made up such a small group (1-3% of the sample in both Macedonia and Serbia) that, on the one hand, analysis based on it would make no sense, and, on the other, its omis-sion would not significantly influence the analyses of other audience types. So we decided not to involve this audience into the analysis of individual audiences (i.e. to recode those data as missing).
We dedicate most of this chapter to the analysis of the remaining audience types – active audience, potential audience, and non-audience – based on socio-demographic dimensions presented so far: gender, age, education, occupation133 and territory134. Apart from a description of the characteristics of each audience type, we have tried to find general regularities in relations between affiliation with relevant social-demographic groups and various audience types.
After a detailed presentation of the social profile of active audience, potential audience and non-audience for eight types of cultural activities, here we also present the results of the research of the influence of early participation experience in cultural events to the cultural practice of our respondents (i.e. their being classi-fied in a particular audience type). Wishing to test assumptions on the influence of early formation of cultural habits to their future maturation, we asked respondents whether their parents had taken them to puppet shows, theatre, exhibitions, cinemas, concerts when they were very young. In an attempt to see what importance they themselves give to early experience with the art, we also asked them whether they took their own children to cultural events.
Based on the assumption that cultural participation is rarely limited to only one branch of art or only one type of cultural events, but that it also represents a specific attitude to one’s own leisure time (and way of life), we did cluster analysis so as to reconstruct three “general audience types”, so that we could analyze them in order to digest the results we obtained in studying individual audiences. Apart from describing social characteristics of these audience types, we also tested (in both individual audience types and the “general” audience) what are the reasons for which people in the audience do not attend performances/concerts/exhibitions, i.e.
132 Numbers of respondents belonging to this audience are a bit more pronounced only in rock-and-roll audience (11.4% in Macedonia and 7.7% in Serbia). We have no data to let us explain why this is so – we can only guess that a number of young people attend rock music concerts (even though they do not like them) searching for friends and partners. 133 In terms of participation of respondents from the first three occupation types for which they were trained or which they used to work in (farmers and workers, middle-class professions and experts, managers and owners) and nine groups constructed based on actual activities respond-ents carry out: farmers, workers, civil servants, lower executives, small business owners, experts, managers/owners, pupils and students, and supported individuals (housewives, pensioners, and unemployed individuals). 134 Based on the size of place of residence (the capital, cities with population exceeding 100,000, smaller towns and villages) and based on districts (five districts in Serbia and four in Macedonia).
126
Cultural Needs, Habits aNd taste of CitizeNs of serbia aNd MaCedoNia
on what conditions they would be willing to attend these more often. We offered respondents to state their opinion on eight possible reasons for giving up going to cultural events, i.e. on the importance of eight conditions whose satisfaction would boost them to participate more often. Since we assumed that money would be an important reason, we analyzed the differences in income per capita and funds respondents put aside for satisfying cultural activities every month among different audience type members, so as to observe how much these influence cultural participation.
The second, smaller segment of this chapter is dedicated to the analysis of cultural offer in Serbia and Macedonia, in particular territorial differences in cultural offer, having in mind the size of the respondents’ place of residence and their regional makeup. By comparing the territorial makeup of the audience and territorial differences in cultural offer, we tried to avoid another single-handedness of most cultural participation research. Indeed, many studies forget that motivation and capability for cultural participation must be followed by the opportunity for cultural participation, and that participation does not occur in conditions equal for all, but rather, that differences in cultural participation (usually interpreted as differences in motivation and capabilities) are often only differences in available cultural offer, in disguise. This way we complete our research of the audience, its cultural needs and habits.
THEATRE AUDIENCE
Analysis of theatre audience in Serbia
ACTIVE THEATRE AUDIENCE. In Serbia, active theatre audience gathers 29.6% of the sample (population).135 These are mostly women (61.6%:38.4%), and mostly respondents from two younger age groups – the average age of active theatre goers is 39. In the 18-30 and 31-45 age groups in the active theatre audience we find one third respondents, in the 45-65 generation one quarter, and in the over-65 generation 17.2% persons. In this audience, there are hardly any respondents 135 Naturally, percentages in the sample and population are not identical. Let us recall that the sample of this size enables population parametres to be assessed with 95% certainty with error margin from 2.5% (with maximum variance 50%) to 1.5% (with 10% variance) in Serbia, i.e. with error margin from 3.1% (with maximum variance 50%) to 1.8% (with 10% variance) in Macedonia. We should add to this a deviation resulting from the refusal of some respondents to answer survey questions (in our study, around 20%), and also from the lack of answers to a number of questions we have analyzed here. Regardless of this, our sample not only allows generalization, but is also such that differences between its parametres and population parametres are not so big. Therefore, with this warning in mind, one may talk of the characteristics of the entire population, based on our data.
127
tHe audieNCe aNd Cultural offer
whose highest education is primary school (7 in all, or 4.1% of the group). From among respondents with secondary education, one quarter (24.1%) belong to the active audience, while in the highly educated more than a half (51.7%) are active audience in the theatre. Similar is the case with occupational groups, where 11.7% farmers and workers participate as active audience, and this is also the case with a bit over a third middle-class occupation holders and 60% of experts, managers, and owners. Above average participation in theatre life is also found in persons working as experts (69.6%), managers and owners (68.4%) and civil servants (48.5%), and also pupils and students (41.7%). As for the place of residence, among Belgrade respondents, 47.5% persons belong to the active theatre audience. In big and small towns this is the case with one third respondents, while among villagers the percentage is only 12.6%. Among Serbian districts, active theatrical audience is above averagely present in Belgrade and around (37.2%), Vojvodina (33.1%) and Sandzak (38.2%), and below average in Sumadija and Pomoravlje (26.6%) and south and east Serbia (17.2%).
POTENTIAL THEATRE AUDIENCE. Likewise, potential theatre audience in Serbia gathers approximately one third of the sample (population). It is largely made up of women (again in similar percents 59.9%:40.1%), but this audience is a bit older – their average age is 42. In all age groups potential audience gathers around 30% respondents, which represents a noticeable increase in the 45-65 age group participation as compared with the active theatre audience from the same generation. In terms of education, the highest growth with regard to participation in the active audience is found in respondents with secondary education. Among theatre audience there are 35% respondents with secondary and high education respectively, while only 13.5% respondents whose highest educational level is el-ementary school (4.1% of active audience) like to visit theatrical plays – although do not do this for some reason. Similarly, in the potential theatre audience we find numbers pointing to a significant, above-average participation of middle-class professions (39.6%), and below-average numbers of experts, managers and owners (28.2%) and farmers and workers (29.1%). One should notice that this percentage of farmers and workers is quite enlarged as compared with the part of this group found in the active theatre audience. As for respondents’ occupation, while the percentage of farmers in potential theatre audience has remained the same as in the active theatre audience (5.3%), the percentage of workers who would wish to take part in the life of the theatre increased significantly (from 16.2% to 30.2%). Above average numbers in potential theatre audience we find junior executives (41%), small business owners (38.7%), pupils and students (36.9%), and supported individuals (32.6%). Above averagely in potential theatre audience we also find respondents from Belgrade and towns with population under 100,000. Among Serbian regions, as in the case of active theatre audience, above average in potential
128
Cultural Needs, Habits aNd taste of CitizeNs of serbia aNd MaCedoNia
theatre audience we find respondents from Belgrade and around (39.1%), Vojvodina (34.1%), and Sandzak (41.2%). Below average are respondents from Sumadija and Pomoravlje (28.8%) and south and east Serbia (23.6%).
THEATRE NON-AUDIENCE. In Serbia, non-audience for theatre comprises a group which is a bit bigger than the previous two (38.1%). Almost a half of it includes men (46.7%), which means that men make up the majority of non-audience (55.9% : 44.1%). The average age of non-audience respondents is 45, where most belong to the 45-65 generations (45.8% of the group) and over 65 (52.3% of the group). How much formal education influences cultural needs and habits is clearly seen in the fact that non-audience for theatre gathers 82.4% respondents whose highest education level is elementary school, 40.9% of persons with secondary school degrees, and only 12.5% respondents with high education. We find similar ratios in terms of occupational groups. In theatre non-audience there are almost 60% farmers and workers, 26% respondents from middle class professions, and only 11.5% experts, managers and owners. Considering the actual job positions of our respondents, in theatre non-audience we find the most farmers (almost 90 percent of this group – 89.5%), workers (53.6%), supported individuals (45.2%) and small business owners (41.9%). Above average level, theatre non-audience in Serbia is made up of respondents (citizens) of cities with more than 100,000 inhabitants (42.3% of the group), and villagers (58.8%). As for regional organization, almost 60% respondents from south and east Serbia belong to the group of non-audience, as is the case with 44.7% of the population from Šumadija and Pomoravlje.
Analysis of theatre audience in Macedonia
ACTIVE THEATRE AUDIENCE. In Macedonia, active theatre audience corre-sponds to 31.3% of the sample. Contrary to Serbia, there are no significant gender differences here. The average age of respondents from this group is 37. Among age groups, like in Serbia, one notices clear differences between the participation of the two younger generations (35.5% and 36.6%) and the two older generations: the 46-65 age group participates in the percentage 24.4%, and the oldest generation only 14.9%. Theatre audience in Macedonia is clearly divided along educational and occupational dimensions. Among respondents with elementary education there are only eight persons in this group (6% of the group, and 3.2% of active audience), while almost 30% respondents with secondary education, and 46.9% respondents with high education represent regular theatre visitors. Among occupational groups, most common are experts, managers and owners (52.2%), followed (a bit above average values) by respondents from middle class professions (33.2%), and, finally, farmers and workers (21.5%). When we analyzed actual job positions taken by
129
tHe audieNCe aNd Cultural offer
respondents, it turned out that, like in Serbia (but with a bit changed ranking), above average participation in active theatre audience is found among managers and owners (63.6%), experts (52.4%), pupils and students (47.7%) and civil serv-ants (39.4%). In Macedonia, active theatre audience is most commonly found in cities exceeding 100,000 (49.5%), then in Skopje (32.1%), smaller towns (30.9%), and, much more rarely, in the villages (18.3%). When we analyzed the regional makeup of the population, it turned out that most theatre audience is found in east Macedonia (49.2%), then south Macedonia (34%), Skopje and nearby towns (30.3%), and, finally, west Macedonia (19.2%).
POTENTIAL THEATRE AUDIENCE. Potential theatre audience in Macedonia is a bit bigger group than active audience (32.8% - identical percentage to that in Serbia). The average age of these respondents is 40, with no significant generation rifts here, where the oldest generation is still the least common in this audience group (19.1%). On the other hand, gender differences emerged – women participate in potential audience a bit more often than men (36.7% : 29.2%). Like in Serbia, there are no differences between respondents with secondary and high education (33.9%), and levels of respondents with elementary education have risen significantly as compared with active theatre audience (28.6%). Another similarity is found in the fact that respondents from middle-class professions are the most common in potential audience (35.5%). This is also seen in the above average numbers of small business owners (37.5%), civil servants (36.4%) and junior executives (35.4%), and a very high percentage of workers in potential audience (37.2%). Although respondents from the villages are less commonly found in potential audience, there are almost no differences in terms of place of residence, while in terms of regional makeup one clearly distinguishes between respondents from Skopje and South Macedonia (participating in potential audience with 36.1% and 35.6%) and those from west and east Macedonia (24% and 20.6%).
THEATRE NON-AUDIENCE. In Macedonia, theatre non-audience makes up the final third of the sample (population – 35.8%). In it, there are a bit more men (38.2%) than women (33.2%). The average age of respondents from theatre non-audience is 43 and, while differences among generations up to the age 65 are small (they all centre around 35%), respondents older than 65 make up as much as 66% of non-audience. Likewise, strong educational and occupational divisions in active audience (followed by lack of division in potential audience) resulted in equally strong divisions in non-audience. So, in non-audience one finds 65.4% respondents with elementary education and almost a half farmers and workers (48.7%); 36.3% respondents with secondary education and 31.4% respondents from middle-class professions: and 19.2% respondents with high education and 15.7% persons working as experts, managers, and owners. When viewing their actual way of earning their living, in theatre non-audience we find mostly farmers and supported individuals.
130
Cultural Needs, Habits aNd taste of CitizeNs of serbia aNd MaCedoNia
Above averagely, in non-audience we find villagers (54.2%) and people from small towns (35.8%). In terms of regions, participation in non-audience which is above average levels is found only among respondents from west Macedonia.
CINEMA AUDIENCE
Analysis of cinema audience in Serbia
ACTIVE CINEMA AUDIENCE. In Serbia, active cinema audience is significantly bigger than active theatre audience. In this group we find almost a half respondents (population) – 47.2%. In active cinema audience, we find an almost equal percentage of male and female respondents, where the average age is 35 (four years younger than in active theatre audience). That youth is an important characteristic of active cinema audience is seen in the participation of almost three quarters (74%) of the youngest age group and over a half (51.8%) respondents from the 31-45 age group. On the other hand, only 26.8% from the 46-65 generation and only 16.7% persons older than 65 go to cinemas. Although educational and occupational differences are obvious in cinema audience, too, participation of respondents with elemen-tary education is a bit higher (12.4%) than in the case of active theatre audience. Particularly more significant is the participation of workers and farmers (33.3% of the group). In active cinema audience, pupils and students make up the largest percentage (79.5% of the group), followed by experts (70.5%), managers and own-ers (66.7%), civil servants (59.3%) and junior executives (56.6%), while the lowest percentage is found among farmers (only 8.1% of the group). Percentages above average levels are found in respondents from Belgrade and cities exceeding the population of 100,000, while respondents from small towns exactly match average levels. Below average levels for active cinema life we find only villagers. As for territorial makeup, only respondents from south and east Serbia are well below average levels (29.8% of the group).
POTENTIAL CINEMA AUDIENCE. Among potential cinema audience in Ser-bia (accounting for a bit more than a quarter of the sample) we find more women than men, and it gathers respondents from 31-45 (30.9%) and 46-65 (32.1%) age groups above average levels. The average age of members of this passive cinema audience is 44 (on average, two years older than potential theatre audience). As in the case of theatre audience, in potential cinema audience, above average levels, we find respondents working as small business owners (38.7%), managers/owners (33.3%), workers (29.9%), and civil servants (28.9%). Potential cinema audience in Serbia, in levels above average values, is also found in towns below 100,000 inhabitants (32.5% of the group) and those living in Šumadija and Pomoravlje (30.7%).
131
tHe audieNCe aNd Cultural offer
CINEMA NON-AUDIENCE. In Serbia, cinema non-audience amounts to 25.5% of the sample (population). The average age of these respondents is 53 (on average, 18 years older than respondents from active cinema audience and 9 years more than potential cinema audience). This fact that cinema-audience is strongly con-ditioned by generation is best seen in the participation of only 6.7% respondents aged 18-30; 17.3% respondents aged 31-45; 41.1% of the 46-65 generation, and as much as 59.1% of respondents older than 65. Among members of cinema non-audience in Serbia we find a bit more men than women, but this difference is not too big. Major differences occur in terms of educational levels. In non-audience, we find 74% of respondents whose highest educational level is elementary school, 22.2% respondents whose education ended in secondary school and only 10.3% respondents with high education. In terms of occupational groups, differences are a bit smaller: in non-audience we find 41% farmers and workers; 15% middle-class profession respondents and 9.7% respondents who are experts, managers, and owners. Again, farmers are most typically found among non-audience (even 75.7% in terms of cinemas here). Above average levels, we find supported individuals in this group (housewives, pensioners, and unemployed persons – 29.8% in all) and workers (29.5%). In cinema non-audience, above average levels we notice re-spondents (citizens) from Serbian towns exceeding 100,000 in population (26.9%) and especially people from the villages (39.3%). In terms of Serbian districts, as was the case in theatre non-audience, respondents from south and east Serbia are singled out (45.3%).
Analysis of cinema audience in Macedonia
ACTIVE CINEMA AUDIENCE. In Macedonia, active cinema audience comprises 45.6% of the sample (population). With its average age of 33, this audience is even younger than that in Serbia. In previous analyses one could also notice that going to the cinema is an activity typical of the younger generations. This is confirmed here, as well, where 65.4% respondents younger than 30 like films and attend cinemas, which is also the case with over a half (51%) people from the 31-45 generation. Already in the 46-65 generation only one quarter people represent active audience, while in persons older than 65 only 6% attend movie theatres. In terms of education, rifts in the cinema audience are a bit more prominent in Macedonia than in Serbia. They clearly divide the audience into those with elementary education on the one hand, and all the rest on the other. Only 9.7% respondents with elementary educa-tion are found among active cinema audience. On the other hand, there are almost a half respondents with secondary education (47.8%) and over 60% respondents with high education in this group. Although less prominent, in Macedonian active
132
Cultural Needs, Habits aNd taste of CitizeNs of serbia aNd MaCedoNia
cinema audience there are also divisions by occupational groups. Cinema visitors gather almost 70% respondents who work as experts, managers and owners, al-most a half of persons from middle-class professions, and a bit over 30% farmers and workers. Quite a broad range of respondents (based on job positions) attend cinema performances above average levels. Below average percentages we find only farmers, workers, and supported individuals. Among active cinema audience we notice clear differences in terms of respondents’ place of residence, which are probably related to the availability of cinemas in places of different size. In Skopje, we register almost 60% respondents as active cinema goers. The percentage then decreases as the size of the town dwindles – 49.6% in cities exceeding 100,000; 42.1% in smaller towns, and 26.4% in the villages. Regionally, there are almost no differences between Skopje and south and east Macedonia (around 50% in all three). In west Macedonia, however, active cinema audience amounts to only 17.1% of the segment.
POTENTIAL CINEMA AUDIENCE. In Macedonia, this audience corresponds to 28.3% of the population. In contrast to active cinema audience, where there were no significant gender differences, in potential cinema audience (just like in potential theatre audience) we notice more women. Respondents from this group are significantly older than respondents from the active audience – their average age is 41 – and among them there are no significant generation differences. Also, educational and occupational divisions are less prominent. Respondents with secondary education are a bit more common in potential audience than respond-ents with high education (around 31%), which is also reflected in the significant participation of farmers and workers and persons from middle-class professions in this group (30%). When viewing their actual job positions, above average levels in potential cinema audience we find, apart from farmers (56.3%) and workers (33.8%), also civil servants (39.7%). Excluding respondents from Skopje, who largely comprise active audience (so there are almost none of them in potential audience), respondents from all other settlement types are present in potential audience above average levels. This is even more pronounced in terms of regional makeup of respondents, where in terms of participation in this audience there are almost no differences among respondents from different regions.
CINEMA NON-AUDIENCE. Amounting to 26.1%, non-audience is the small-est cinema audience in Macedonia. Respondents from this group –whose average age is 51 – are on average ten years older than respondents from potential audi-ence, and almost 20 years older than respondents belonging to active audience. In this audience we observe almost three quarter respondents older than 65. On the other end, there are only 9% respondents younger than 30. Strong educational and occupational differences in active audience are ranked as in a mirror. In cinema non-audience, there are almost 60% respondents with elementary education, 21.2%
133
tHe audieNCe aNd Cultural offer
respondents with secondary education, and 15.6% respondents with high education. In terms of occupational groups, differences are less prominent, but still clearly distinguishable – for instance, there are 38.3% of workers and farmers in non-audience, and also 11.8% experts, managers, and owners. As for the respondents’ place of residence, above average levels in non-audience we find respondents from the villages. Regional differences single out west Macedonia, where there are the most respondents belonging to cinema non-audience (52.4%). In other regions, this group ranges between 27% and 30%.
FINE ARTS EXHIBITION AUDIENCE
Analysis of fine arts exhibition audience in Serbia
ACTIVE AUDIENCE OF FINE ARTS EXHIBITIONS. Fine arts exhibition active audience in Serbia is smaller and older than active theatre and cinema audience. It corresponds to a bit less than one quarter of the sample (population) (23.7%). In this active audience as well, there are more women (27.5%) than men (19%), with the mutual ratio of 63% : 37%. The average age of respondents from this group is 42. Contrary to active theatre and cinema audience, the active audience of fine arts exhibitions is more evenly distributed over age groups, where most individuals belonging to this audience are found in the 31-45 generation. As in the case of other arts taken to be elite ones, active audience for fine arts exhibi-tions is strongly conditioned by education and occupation. Thus, for instance, we find here only 2.4% respondents from the group with elementary education (they altogether comprise only 1.4% of active audience), 17.6% respondents with secondary school degrees, and 45.2% respondents with higher education. Among occupational groups we also notice clear differences. There are only 8.6% farm-ers and workers who comprise active audience for the exhibitions of fine arts. In terms of middle-class professions, there are 25.6% active exhibition visitors, and among experts, managers, and owners, the percentage is 57%. Viewed by actual job positions of our respondents we clearly differentiate between experts (65.7%), managers and owners (56.3%), pupils and students (33%), junior executives (29.3%), and civil servants (27.6%) on the one hand, and farmers (2.6%), workers (9.8%), small business owners (12.7%), and supported individuals (14.6%), on the other. Respondents from Belgrade (44.8% of the group) are the most significant portion of this audience, while above average levels we also find respondents from towns with less than 100,000 inhabitants (25%). Simultaneously, only 10.2% village dwellers actively participate in the cultural life in this sphere. Among Serbian regions, we notice a clear difference between Belgrade and around and Vojvodina on the one
134
Cultural Needs, Habits aNd taste of CitizeNs of serbia aNd MaCedoNia
hand (high active audience participation), and Šumadija and Pomoravlje and south and east Serbia on the other (low participation in active audience).
POTENTIAL AUDIENCE OF FINE ARTS EXHIBITIONS. The potential audience of fine arts exhibitions in Serbia amounts to 25.4% of the sample. In it there are, once again, a bit more women, and it is also interesting that, contrary to all other cases, the potential audience of exhibitions, with the average age of 40, is a bit younger than the active audience for fine arts. As in the case of its active counterpart, this potential audience is evenly distributed across age groups, and this difference is probably the result of a more substantial number of respondents from the youngest group (28.6%). In potential audience there are no marked differences by education and occupation. In terms of percentages, the groups of respondents with secondary and high education give equal numbers of respondents, but, due to the highest participation of respondents with secondary school in the sample, they make up the largest portion of this audience. Similar is the case with occupa-tional groups. In potential audience, there are most respondents from middle-class professions (32%), followed by experts, managers and owners (23.5%). However, in this group, we find a relatively high percentage of workers and farmers (20.7%). Viewed by respondents’ job position, in potential fine arts audience we find the most civil servants (36.2%), small business owners (33.3%) and lower executives (28%). It is also interesting that respondents from towns with over 100,000 citizens not only participate in the active audience for works of fine arts with low numbers, but also occupy the last position in the passive audience, as well (13.6%). This is a low percentage, not only as compared with participants from Belgrade and around and small towns, but also in comparison with persons from the countryside (25.2%). Also, while participants from other regions almost equally participate in potential fine arts audience (25-30%), respondents from south and east Serbia are significantly falling behind (only 13.8% of the group).
NON-AUDIENCE OF FINE ARTS EXHIBITIONS. Over a half of the total Serbian sample (51%) is fine arts non-audience. This is significantly higher than the percentage of theatre and cinema non-audience. The average age in this group is 44, where the two oldest generations are a bit more common. In non-audience, as in the previous cases, there are more men than women. Again, belonging to non-audience clearly reflects the influence of education on cultural practices. Almost nine tenths of respondents with elementary education (87.6%) belong to fine arts non-audience. Among respondents with secondary education, in non-audience there are a bit over a half respondents (55.6%). Finally, there is a quarter of the highly educated belonging to this group (25.2%). As divisions by occupation are followed by the division by education, we have similar ratios, as well. And, since non-audience is mainly an inversed image of active audience, once again we find a clear division in non-audience based on respondents’ job positions. Most non-audi-
135
tHe audieNCe aNd Cultural offer
ence is found among farmers (92.1%) and workers (65.8%), supported individuals (60.5%) and small business owners (54%). On the other hand, small participation in this group is found among experts (11.1%), and managers and owners (18.8%). As expected, respondents from cities over 100,000 and those from the villages, who participated in small numbers in active and passive audience, now make up the majority of non-audience. Respondents from major towns participate with 65.4%, while participation of villagers in non-audience equals 69.2%. Most fine arts non-audience is found among respondents from south and east Serbia (72.4%), but the percentage of respondents from non-audience is rather high in Šumadija and Pomoravlje (56.4%), and Vojvodina (51.6%), too.
Analysis of fine arts exhibition audience in Macedonia
ACTIVE AUDIENCE OF FINE ARTS EXHIBITIONS. The active audience of fine arts exhibitions in Macedonia corresponds to 25.8% of the sample. Contrary to Ser-bia, in this audience there are no sexual/gender differences. However, a particularly conspicuous difference lies in the fact that in Macedonia, in this audience too, one notices a general regularity that audience activity decreases with age, where the active audience is younger than others (which is not the case in Serbia in terms of fine arts at least). The average age of respondents from this audience is 37. Unlike Serbia, where there were no significant generation differences, in Macedonia, in the active audience, one can make a distinction between the generations of those who are younger and older than 45. Respondents from younger generations participate in it with 29.3% and 32%, while, on the other hand, respondents from generations over 45 participate with 16.9% and 17.2%. Similarity with the Serbian situation is seen in the strong division in the active audience along educational and occupational dimensions. Among respondents from Macedonia belonging to this group there are only four persons with elementary education. Ratios are similar in terms of occupational groups. The most participation is found with experts, managers and owners (44%). Then follow respondents from middle-class professions (28.6%), while farmers and workers have a mere 14.8% participation. Above average levels, in terms of participation in active exhibition audience, viewed by their actual job positions, there are managers and owners (50%), experts (47.4%), civil servants (32.8%). and small business owners (30.8%). In terms of percentages, the most active audience is located in small towns in Macedonia (32.3%), and the least are, expectedly, located in the villages (12%). It is also interesting that respondents from the region comprising Skopje and nearby towns, along with respondents from west Macedonia, together take little part in the active audience (19.2% and 12.6%). On
136
Cultural Needs, Habits aNd taste of CitizeNs of serbia aNd MaCedoNia
the other hand, the most active audience of this type is found in east Macedonia (50.8%) and south Macedonia (32.2%).
POTENTIAL AUDIENCE OF FINE ARTS EXHIBITIONS. Potential fine arts exhibition audience in Macedonia gathers 28.6% of the sample. The principal characteristic of this type of audience in Serbia is lack of major differences by all socio-demographic dimensions. The situation is similar in Macedonia. If in the potential audience there are once again a bit more women than men, these differ-ences are not big. The average age of respondents belonging to this audience is, like in Serbia, 40 and generation differences among respondents are neglectable here, too. In terms of low participation, the only group to stand out is that of the oldest generation (15.7% respondents). In terms of education, we notice that be-tween respondents with secondary education and those with higher education there are no differences (participation level 31%), while respondents with elementary education are less common (19.7%). How differences are becoming bigger even in this potential audience is perhaps best seen by occupation and job position, where participation of respondents from all three groups ranges in the interval 27% - 31% (which is rather unusual in other cases). Also, in terms of job position, the most frequent are workers (34.5%), managers and owners (33.3%), and junior executives (31.1%). Among prospective audience, in terms of percentages, respondents from major cities stand out (39%), while regionally respondents from south Macedonia (30.9%) and Skopje and nearby towns (30.6%) also excel.
NON-AUDIENCE OF FINE ARTS EXHIBITIONS. In Macedonia, this type of audience amounts to 45.7% of the sample (population). Like in Serbia, it is one of the biggest non-audiences. The average age of these respondents is 43, like in Serbia, and this audience is mostly made up of respondents from the two older generations (50.6% and 66.7%). There are no gender differences in the makeup of this audience, but, as in other cases of clear division in the active audience based on educational and occupational criteria, rifts are present here in non-audience, as well. In it, there participate over three quarters of respondents with elemen-tary education (77.2%), 47% respondents with secondary education, and 26.3% respondents with higher education. Accordingly, most prevalent are workers and farmers (57.9%), followed by middle-class professions (42.7%), and, finally, experts, managers and owners (24.4% participation). Apart from farmers, participation in non-audience above average values is also found in supported individuals (house-wives, retired and unemployed individuals – 53.7%), but also pupils and students (50%), who usually, above average levels, belong to the active audience for other arts. The most participation in non-audience is found among respondents living in the villages and in Skopje, while a high percentage of non-audience in Skopje makes this region (50.2%) fall behind only west Macedonia in terms of non-audi-ence for these arts (62.1%).
137
tHe audieNCe aNd Cultural offer
LIBRARY AUDIENCE
Analysis of library audience in Serbia
ACTIVE LIBRARY AUDIENCE. In Serbia, active library audience amounts to just over 30% of the sample (population). In it there participate many more women than men (62.2% : 37.8%). This active audience, whose average age is 37, is among the youngest studied here (along with cinema and rock’n’roll audience). We may see here that as respondents’ age increases, in each next age group the percentage of those participating in active audience decreases by 10 percent. Thus, among respondents aged 18-30 44.6% participate in active library audience; in the 31-45 generation there are 34.8%; among those between 46 and 65 years of age there are 22.9%, and from the generation over 65, 10.8% persons belong to active library audience. Both educational and occupational divisions equally strongly cut through the active library audience. Therefore, for instance, in it there are only 10 respond-ents who completed only elementary education (which is 5.8% of this group, and 2.5% of active audience); 28.6% respondents with secondary education and 48.8% respondents with higher education. Although the number and percentage of work-ers and farmers participating in active library audience is a bit higher, divisions by occupational groups are equally prominent. In the active audience, there are 16.4% workers and farmers, 39.5% people from the group of middle-class professions, and 52.2% respondents coming from the group of experts, managers, and owners. Considering also the job positions of respondents, we see that in the active library audience, there is by far the highest percentage of pupils and students (73.8%) and experts (62.6%)136, while in active library audience there is, for instance, just one farmer. There are no significant differences in terms of place of residence of respondents from active library audience. In all towns, regardless of their size, in the active audience there participate around 35% respondents, and even in the vil-lages, the percentage of those actively using library services is accordingly high (22.1%). In terms of regional makeup, there are no major differences, although the hierarchy is preserved – in this case, the highest participation is found in Vojvodina respondents, while the lowest participation is observed in south and east Serbia.
POTENTIAL LIBRARY AUDIENCE. In Serbia, this audience amounts to about 40% of the sample (population). In potential audience there are more women than men (the ratio is 57.7% : 42.3%). Unlike active library audience, in this group there are no major generation differences – the average age in the group is 43 – and even the youngest age group is the least represented. This ‘generation balance’ is followed by a lack of clear divisions in terms of education and occupation. In per-
136 One should not forget they are directly required to use libraries, due to their professional activities.
138
Cultural Needs, Habits aNd taste of CitizeNs of serbia aNd MaCedoNia
centages, all occupational groups range between 40% and 45%, while in terms of educational groups, respondents with secondary education and those with higher education participate in potential library audience with 45% each, while even from the group whose highest educational level is elementary school, 24% respondents belong to potential library audience. By job position as well, only farmers (27.3%) and pupils and students (21.3%)137 have lower percentages of participation in library audience. There is a balance in terms of territorial organization, as well. Even in the villages there is a significant number of people who like to read and would like to use library services (37.4% countryside residents), and among Serbian regions lower percentages of potential library audience are found only in Šumadija and Pomoravlje. Participation of other regions is roughly the same.
LIBRARY NON-AUDIENCE. As in terms of cinema audience, library non-audience comprises about a quarter of the sample (population). The average age of respondents from this group is 48, and in terms of generations we have a mirror image of active library audience. The least participation is found in the youngest generation, and then participation grows with increased age of respondents. In other observed dimensions, due to clear educational and occupational divisions in the active audience and balanced participation of all groups in potential audi-ence, it was logical to expect inversely proportional participation of these groups in non-audience as compared with active library audience. Hence, in library non-audience we find 70.2% respondents with elementary education, 25.6% respondents with secondary education, and only 6.3% respondents with higher education. Due to significant participation of farmers and workers in potential library audience, they participate in non-audience with not so big a percentage – 45.5%. Among middle-class professions, 13.2% respondents are non-audience, as is the case with 3.8% experts, managers, and owners. Having in mind respondents’ current job positions, the highest percentage of library non-audience is found with farmers (73.7%), workers (40.1%), and small business owners (26.6%). In terms of place of residence and regions in Serbia, only Belgrade (and its surrounding area) stand out in terms of small non-audience, while in other locations and regions this per-centage is mostly even.
Analysis of library audience in Macedonia
ACTIVE LIBRARY AUDIENCE. Library audience in Macedonia is divided into almost equal thirds of the sample (population). In active audience, there are 32.2% respondents, whose average age is 34 and, as in Serbia, they are one of the youngest audiences. In addition, like other young audiences, it is clearly divided by genera-
137 Because their almost entire group belongs to active library audience.
139
tHe audieNCe aNd Cultural offer
tion. Two younger generations participate in active audience with 46.6% and 33.2%. On the other hand, respondents from the 46-65 group participate with 18.8% and those older than 65 with 13.7%. Unlike Serbia, in Macedonian active audience there are no significant gender differences. What is the case with active audience in Serbia, and repeats in Macedonia, is strong educational and occupational rifts. In active audience, there are over 50% respondents with higher education, more than 30% respondents with secondary school degrees, and only seven people (5.3%) with elementary education. Similarly, in active library audience there are 55.9% respondents from the group of experts, managers and owners, 36.1% respond-ents from middle-class occupations, and 17% farmers and workers. As in Serbia, viewed by job position, by far leading on the list are pupils and students (77.3%), followed by experts (56.3%), junior executives (42.2%), and civil servants (40.3%). In Macedonia, respondents belonging to active audience above averagely live in cities with population exceeding 100,000. In terms of regional makeup, however, there are almost no differences in terms of active audience participation.
POTENTIAL LIBRARY AUDIENCE. In Macedonia, this audience gathers 35.6% of the sample. Contrary to active audience, in potential Macedonian audience one notices significant gender differences. In it, we witness stronger participation of women (40.6%) than men (31.3%). The average age of this audience is 40, and participation level of age groups is close (around 36%), except for the oldest genera-tion – 23.5%. Educational differences are still not as strong as in the case of active audience, and they obviously differentiate between respondents with secondary and higher education (39% participation) and those with elementary education (21.1%). In potential audience, however, differences in terms of occupational groups disap-pear. Likewise, by job position, all groups participate at roughly the same level (apart from pupils and students, who almost totally belong to active audience). The highest participation in potential audience is found in respondents from Skopje and small Macedonian towns, while there are no significant differences in terms of the regional makeup of the population.
LIBRARY NON-AUDIENCE. Library non-audience makes up the final third of the sample (population) in Macedonia. The average age of these respondents is 47, and strong generation rifts occur here as well. While the oldest generation participates in non-audience with 62.7%, the youngest does so with 17.7%. In this audience, we find a significantly larger percentage of men (37.6%) than women (26%), and educational and occupational divisions are noticeable in this group, too. In non-audience there are 73.3% respondents with elementary education, 32% respondents with secondary education, and only 9.6% respondents with higher education. Likewise, respondents from the group of farmers and workers participate with 51.6%, those from middle-class professions 26.5%, and experts, managers, and owners with 6.2%. Among groups formed based on working on
140
Cultural Needs, Habits aNd taste of CitizeNs of serbia aNd MaCedoNia
actual jobs, standing out in terms of participation in library non-audience we note farmers (64.7%), workers (45%), supported individuals (39.4%), and small business owners (35%). While in terms of participation of respondents from Skopje and cities with more than 100,000 inhabitants there are no major differences (where participation of both in non-audience is below average levels), respondents from smaller towns and villages participate in non-audience above average degree (small town population 35.6%, villagers 48.1%). As for regional composition, respondents from west Macedonia participate in library non-audience significantly more than all others (41.1%).
READING AUDIENCE
Analysis of reading audience in Serbia
ACTIVE READING AUDIENCE. Reading audience is an exception compared with all other audience types, for it pertains to private, in-door cultural consump-tion, and therefore does not much depend on the presence of cultural institutions on the one hand, and readiness of a person to participate in public life and their financial resources on the other. Accordingly, no wonder active reading audience in Serbia is the biggest of all audiences here analyzed and it gathers over a half of the sample (and population – 52.1%). The rule from previous audiences also holds here: that women are a majority in the active audience of “elite” arts, and that active audience is younger138 and more educated than potential audience, and potential audience in turn younger and more educated than non-audience. The ratio of men and women in active reading audience is 63% : 37%, and the average age of active reading audience in Serbia is 40. The 18-30 generation participates in this active audience with 62.8%, and the percentage drops in the oldest generation, which participates with 34.6%. As expected, active reading audience is strongly divided by education and occupation. In this audience, there are 72.2% respondents with higher education, 51% respondents with secondary education, and only 13.1% respondents whose highest educational level is elementary school. Three quarters of people from the group of experts, managers and owners and 60% respondents from middle-class professions participate in active reading audience, while among farmers and workers participation percentage is 34.7%. Expectedly, by far the biggest percentage of readers is found among experts (82.6%), followed by civil servants (67.2%), pupils and students (63.5%), managers and owners (57.9%). On the other end of the line, farmers are isolated (5.6%), while participation of workers (40.8%) is quite close to all other groups (formed based on their actual job position). 138 With the exception of fine arts exhibition audience.
141
tHe audieNCe aNd Cultural offer
Almost three quarters of Belgrade respondents belong to active reading audience (72%), followed by respondents from smaller towns (58.1%), cities exceeding 100,000 people (46.3%), and countryside population (35.9%). In terms of regions in Serbia, respondents from Belgrade and around again participate most in active reading audience (65.3%). On the other end we find respondents from Šumadija and Pomoravlje – 39.1% participation.
POTENTIAL READING AUDIENCE. In Serbia, potential reading audience amounts to a bit over 20% of the sample (population). In it, there are no significant participation differences of men and women. There is also an age balance – the average being 43 years. It is logical that there are similarities between reading and library audiences (by and large, this is the same audience), so no wonder charac-teristics of potential library audience are repeated here. In terms of education and occupation, there is a balance in the percental participation of respondents with different educational levels, or different occupational affiliations. Viewed by job position, only junior executives (35%) partly stand out, while all other groups (in-cluding farmers) range around 20%. Likewise, in terms of territorial composition of respondents (place and region of residence), there are almost no differences.
READING NON-AUDIENCE. In Serbia, reading non-audience corresponds to a quarter of the sample (population) and their average age is 48. Again, as in library audience, the ratio of the generations within active audience and non-audi-ence is inversely proportional. In non-audience there is the smallest percentage of respondents from the 18-30 generation (16.1%), while it grows toward the oldest generation, where it amounts to 41.5% of over-sixty-fivers. As in most cases, men comprise most non-audience (60.4% : 39.6%). Strong educational differences, in particular dividing the least educated group from all others, are obvious in reading non-audience as well. Thus, for instance, in Serbian non-audience there participate 68.2% respondents with elementary education, 25.6% respondents with secondary education, and only 5.8% respondents with higher education. Similarly, 44.9% farmers and workers belong to reading non-audience, while, on the other hand, in it we find 13% respondents working in middle-class professions, and 4.1% experts, managers and owners. In terms of job positions, by participation in non-audience, one clearly singles out farmers (72.2% of the group) and workers (40.3% of the group), while the participation of others in reading non-audience is even (and lower). As for place of residence, respondents from major and smaller Serbian towns amount to close percentages of reading non-audience, and the principal rift emerges between respondents from Belgrade (8%) and respondents from the coun-tryside (39.4%). Among Serbian regions, high percentage of reading non-audience is found in Šumadija and Pomoravlje and south and east Serbia (36%).
142
Cultural Needs, Habits aNd taste of CitizeNs of serbia aNd MaCedoNia
Analysis of reading audience in Macedonia
ACTIVE READING AUDIENCE. In Macedonia, too, active reading audience comprises over a half of the sample (population – 50.5%). Here, too, like in other activities classifiable as “elite” arts, women (56.3%) participate more than men (45%). The average respondent age in this group is 37, and, as in the case of library audience, one can make a clear distinction between respondents younger than 45 and those older than this age. Respondents from the generation under 30 partici-pate in active audience with 60.8%, those from the 46-65 generation participate with 35.7%, and those from the oldest generation with 30.4%. As we have a similar situation in Serbia, one may assume that, since reading does not require leaving one’s house and participation in public events (which is the case with other cultural consumption activities that we study here), generation influences reflect not only decreased readiness to take part in public events, but also the fact that ageing im-plies reduced interest in cultural participation in general. Active reading audience in Macedonia is clearly divided along the lines of education and occupation. In it, there are 71.5% highly educated, 50.5% respondents with secondary education, and only nine respondents with elementary education (amounting to 8.3% of this group and only 2.5% of active audience). These clear-cut educational divisions are largely translated into occupational differences. Thus, more than three quarters of experts, managers, and owners participate in active reading audience, as do more than a half respondents from middle-class professions and a bit above 30% respondents from among farmers and workers. When observing groups we constructed based on actual jobs respondents work on, above average levels in active audience we find experts (76.3%), managers and owners (66.7%), pupils and students (63.3%), civil servants (62.7%) and small business owners (61.8%). In terms of place of residence, one notices three respondent groups. First, those living in Skopje, who participate in active audience with 74.2%. Second, people from cities exceeding the population of 100,000 and those from smaller towns, where participation in active audience amounts to 42.9% and 48.4% respectively. Finally, there is countryside population, whose participation in active audience is 25.2%. Up to a point, these divisions recur in terms of regional composition of respondents from the group. Respondents from Skopje region participate in this audience above average levels (61.3%). Respondents from south and east Macedonia show exactly the average participation rate (49.3% and 50%), while participation of west Macedonian re-spondents is below average value.
POTENTIAL READING AUDIENCE. In Macedonia, potential reading audi-ence comprises a relatively small group – only 18.1% of the sample. One should relate this to the fact we have already mentioned, that participation in these ac-tivities does not depend on the availability of cultural infrastructure, nor so much
143
tHe audieNCe aNd Cultural offer
on financial resources (as books can be borrowed), so we could say that the gap between the interest (need) and the activity (habit) is smaller. The average age of respondents from this group is 39, and generation differences are a bit unusual. In here, above average participation is found in the 18-30 generation (21.6%) and the generation between 46 and 65 years of age (21%), while less participation is found in the 31-46 age group and the group of oldest respondents – 13.8% and 8.7%. Strong gender, educational and occupational differences in potential reading audience in Macedonia disappear (as is the case in Serbia). All educational groups participate in potential audience on the same level (17%), while among occupational groups a bit more prevalent are respondents from middle-class professions. Above average values, in potential audience we find junior managers (33.3%), managers/own-ers (25%), civil servants (23.7%), and workers (20%). As for place of residence, respondents from cities with more than 100,000 inhabitants (38.6%) and villages (27%) participate in potential audience above average levels, while participation of respondents from smaller towns (16%) and Skopje (7.9%) is below average. The most prevalent in this audience are respondents from west Macedonia (24.5%), while respondents from other regions participate a bit less (17%).
READING NON-AUDIENCE. In Macedonia, reading non-audience gathers 31.5% respondents. This audience is clearly divided along the lines of gender, gen-eration, education, and occupation. Most reading non-audience is male (male/female internal ratio is 60.8% : 39.2%). The average age of these respondents is 47, and generation differences within it are typical of non-audience. The oldest generation participates with 60.9%, and the youngest with only 17.6%. Respondents with the lowest education level participate in this audience above averagely (74.3%), while participation of respondents with higher education is small (11.3%). Among oc-cupational groups, we notice farmers (60%), workers (41.4%), and supported indi-viduals (38.4%). These educational divisions and divisions based on job positions repeat in occupational non-audience. In reading non-audience there are only nine respondents from the group of experts, managers, and owners (5.7% of this group and 4.6% of non-audience), while, on the other hand, in this group there are more than a half farmers and workers (51.5%). Non-audience in Macedonia is above averagely present in towns with less than 100,000 inhabitants (35.6%) and in the countryside (47.7%), while among regions, respondents from west Macedonia are singled out in terms of increased participation in non-audience.
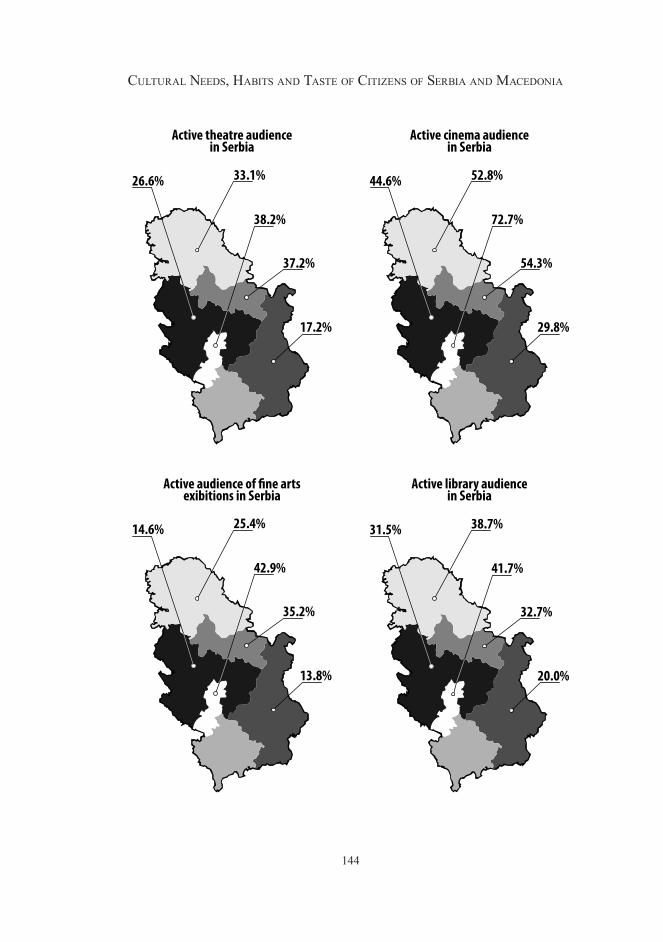
144
Cultural Needs, Habits aNd taste of CitizeNs of serbia aNd MaCedoNia
54.3%
72.7%
29.8%
44.6% 52.8%
37.2%
38.2%
17.2%
26.6% 33.1%
35.2%
42.9%
13.8%
14.6% 25.4%
32.7%
41.7%
20.0%
31.5% 38.7%
Active cinema audiencein Serbia
Active theatre audiencein Serbia
Active library audiencein Serbia
Active audience of �ne artsexibitions in Serbia
145
tHe audieNCe aNd Cultural offer
CLASSICAL MUSIC CONCERT AUDIENCE
Analysis of classical music concert audience in Serbia
ACTIVE CLASSICAL MUSIC CONCERT AUDIENCE. Active audience for clas-sical music concerts in Serbia comprises only 6% of the sample. Among genera-tions, there are almost no differences in terms of participation in this audience, and, with average respondent age of 41, this is an older active audience. In this case, too, there are more women admirers of classical music and visitors to such concerts (the internal ratio of women and men in active audience is 71.6% : 28.4%). As expected, this audience has clear educational properties, so that there are no respondents with elementary education belonging to active classical music concert audience. From among those with secondary school diplomas, 3.2% belong to this audience, and from among highly educated, 15.6% actively attend classical music concerts (which, on the other hand, amounts to almost three quarters –72% – of total classical music active audience). Likewise, active audience of classical music concerts includes 1.6% workers and farmers, 5% respondents from middle-class professions, and 20.2% experts, managers, and owners. Above average in terms of participation in active audience we also find experts (26.9%), pupils and students (11.5%), managers and owners (11.1%), and civil servants (6.8%). It turned out that the link between place of residence and different types of classical music audience is statistically significant and strong, so that there are clear differences between active audience in Belgrade (17.4% of such respondents participate in active classical music concert audience), cities with more than 100,000 inhabitants (8%), small towns (5.3%), and villages (1%). These differences occur with regard to Serbian regions, as well, where in Belgrade 12% respondents participate in active audience, in Vojvodina this amounts to 6%, in south and east Serbia 4%, and in Sumadija and Pomoravlje 2.1%.
POTENTIAL CLASSICAL MUSIC CONCERT AUDIENCE. Potential classical music concert audience in Serbia amounts to one third of the sample (population – 33.2%). This audience is a bit older than its active counterpart – the average age of these respondents is 42. Age groups are evenly distributed here as well. There are differences in the participation of women and men, but they are less prominent than in the active audience. Although educational differences are smaller, too, still in potential audience there participate 49.1% respondents with high education, 30.7% respondents with secondary education, and 10.1% respondents for whom elementary school is the highest educational level. Moreover, in this audience there are a bit over a half experts, managers and owners (50.1%), over 40% respondents from middle-class professions, and 19.5% farmers and workers. Viewing the current job positions of respondents, we conclude that in addition to experts (50%), civil servants (48.1%), managers and owners (44.4%), and pupils and students (44.1%), who make the basis
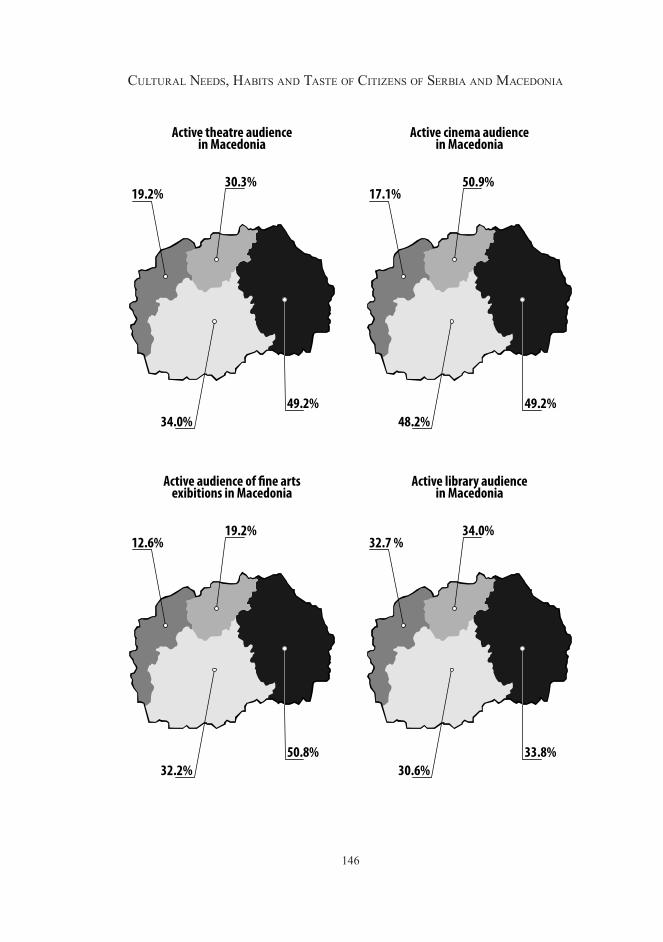
146
Cultural Needs, Habits aNd taste of CitizeNs of serbia aNd MaCedoNia
Active cinema audiencein Macedonia
Active theatre audiencein Macedonia
Active library audiencein Macedonia
Active audience of �ne artsexibitions in Macedonia
48.2%49.2%
17.1%50.9%
34.0%49.2%
19.2%30.3%
32.2%50.8%
12.6%19.2%
30.6%33.8%
32.7 %34.0%
147
tHe audieNCe aNd Cultural offer
of active audience, there are, with values above the average, also junior managers (37.2%). The difference that distinguished between respondents from Belgrade and other locations in Serbia is present here, too, but in potential audience there is a bit higher percentage of respondents from the countryside (23.3%). Also, there are almost no differences in terms of participation in potential classical music concert audience among other Serbian regions (around 25%). Only Belgrade area stands out, with the almost 50% potential audience participation (48.6%).
CLASSICAL MUSIC CONCERT NON-AUDIENCE. Making up more than 60% of the sample (population), classical music non-audience is the largest non-audience of all in Serbia. The general characteristic of classical music concert audience is that within it there are no major generation differences, which is an exception when compared with other types of audience (similar, though not identical relations are found only in the audience for fine arts exhibitions and folk music). Hence the average age of classical music non-audience: 43 (active audience 41, passive audience 42). In it, there are two third of male respondents (66.8%), and over a half of female respondents (55.1%) in Serbia. Educational differences are clearly visible in non-audience, too: 90% respondents with elementary education belong to non-audience for classical music, while almost two thirds of respond-ents with secondary education (66.2%) and a bit over one third respondents with higher education (35.3%) are found within this group. Since differences among occupational groups largely coincide with education levels, among respondents from different occupational groups one makes clear distinctions. Thus, for instance, non-audience for classical music includes 29% experts, managers and owners, over a half respondents from middle-class professions (53.2%), and more than three quarters of farmers and workers (78.9%). As in most other non-audiences, the biggest participation is found in farmers (97.4%), workers (75.2%), small business owners (68.8%) and supported individuals (66.3%). Relatively small percentage of respondents from Belgrade belonging to non-audience (27.1%) is followed by an almost equal participation in non-audience of respondents from other towns (62%), and even higher number of villagers (75.7%). Territorial differences are similar for Serbian regions. Respondents from Belgrade stand out in terms of relatively low participation in classical music non-audience (39.3%), while participation of respondents from other parts of Serbia ranges around 70%.
Analysis of classical music concert audience in Macedonia
ACTIVE CLASSICAL MUSIC CONCERT AUDIENCE. Active audience for classical music concerts in Macedonia – amounting to only 5.3% of the sample – is the small-est active audience of all observed groups. The average age of respondents from this

148
Cultural Needs, Habits aNd taste of CitizeNs of serbia aNd MaCedoNia
23.6%
28.6%
18.7%
23.1% 27.3%
12.0%
8.3%
4.0%
2.1% 6.0%
2.7%
14.2%
6.0%
15.6% 8.1%
65.3%
67.6%
43.5%
39.1% 54.8%
Active audience of contemporary popularmusic concerts in Serbia
Active classical music concerts audience in Serbia
Active reading audiencein Serbia
Active folk music concerts audience in Serbia
149
tHe audieNCe aNd Cultural offer
audience is 37, which is the typical average age for respondents of all active audiences in Macedonia. In this small group there are almost no generation differences – very narrowly, the 31-45 generation stands out. In spite of small numbers, in the active audience one notices clear gender differences (internal ratio of women and men is 61.4% : 38.6%) and specific educational differences. As it may be, among respondents with elementary education there are no active visitors to classical music concerts. Re-spondents with secondary education (48.8%) and those with high education (51.2%) participate in this group with almost equal numbers. As some respondents with sec-ondary education actually do workers’ jobs, the share in the active audience of experts, managers and owners is almost equal to the share of highly educated respondents (51.3%). On the other hand, respondents from the group of farmers and workers and from the group of middle class professions have taken the remaining part, amount-ing to 23.1% and 25.6% of active audience. Still, when looking at the job positions of respondents, we conclude that managers/owners (27.3%), small business owners (11.9%) and civil servants (6.0%) participate in this active audience with a bit higher numbers. Differences occur in terms of territorial composition of respondents from active audience. They are mainly concentrated around Skopje and major Macedonian towns, while only two respondents from the countryside belong to this active audience. Having in mind Macedonian regions, as we constructed them, we conclude that only in Skopje and nearby locations there is a bit more active audience.
POTENTIAL CLASSICAL MUSIC CONCERT AUDIENCE. Like in Serbia, potential classical music concert audience gathers one third of the sample (popu-lation – 33.9%). Similarities do not end here. Specific to classical music audience in both societies is that differences in average age among active, potential, and non-audiences are tiny, while educational differences between active and potential audience are almost none. It is also interesting that respondents from this non-audi-ence are more educated than other non-audiences. The average age of respondents from active audience is 37, of those from potential audience 38, and of those from non-audience 42. Moreover, the average duration of education of respondents from active audience is 13 years, as is the case with respondents from potential audience, while the average duration of education of members of this non-audience is 11 years (as opposed to the usual nine years). This only shows that many respondents with high education are not fans of classical music, and therefore (naturally) do not at-tend such concerts. Gender differences, noticeable in active audience, disappear here, while generation differences again divide those younger and older than 45. Respondents from the younger generations participate in potential audience on the level of 39.9% and 35.7% respectively, while respondents from the 46-65 age group participate with 27%, and those from the oldest group with 26.4%. The three-degree scale usually occurring in the audience in terms of education levels is found in the potential classical music audience, too. Highly educated respondents participate in

150
Cultural Needs, Habits aNd taste of CitizeNs of serbia aNd MaCedoNia
Active audience of contemporary popularmusic concerts in Macedonia
Active classical music concerts audience in Macedonia
Active reading audiencein Macedonia
Active folk music concerts audience in Macedonia
33.7%25.0%
22.0%27.0%
5.1%3.0%
3.5%6.6%
13.5%9.0%
15.5%8.1%
49.3%50.0%
29.6%61.3%
151
tHe audieNCe aNd Cultural offer
this audience with 47.5%, respondents with secondary school degrees with 32.8%, and those with elementary education with only 13.8% (to remind the reader, not one person from this group participated in the active classical music audience). We have a similar ranking in terms of occupational groups, where on the one hand there is participation of experts, managers, and owners on the level 51.9%, and on the other that of farmers and workers – 24.2%. Except managers/owners, small business owners, and civil servants, who made the basis of active audience, above averagely in potential audience we also find experts and pupils and students. In potential audience respondents from Skopje and larger Macedonian towns partici-pate above average levels. In terms of regional composition, most participation is found in south Macedonia (37.9%), and Skopje and nearby towns (36.4%).
CLASSICAL MUSIC NON-AUDIENCE. Percentage of respondents classified as classical music non-audience is identical in Macedonia and Serbia and in both cases represents the biggest non-audience that we have analyzed (61.8%). As in other elite arts, men prevail in classical music non-audience (63.9%), while women follow (57.4%). As for generation differences, two older generations who participated in active audience on a lower level, make up the larger portion of classical music non-audience (69.8% and 67.9%). Likewise, educational differences are also clear, where in this audience there are also quite a few respondents with higher education (43.4%). Respondents with elementary education participate with 86.2%, and those with secondary school degrees with 62.6%. Again typically of “elite” arts, there is increased non-audience participation of farmers (84.8%), workers (68.5%), and supported individuals (63.3%). Occupational groups are ranked as expected: on one end there are farmers and workers (with non-audience participation of 73%), and on the other there are experts, managers, and owners (37% participation). Since respondents from Skopje and major Macedonian cities made up the core of both active and potential audience, it is quite logical that in non-audience the highest share comprises respondents from the countryside (82.7%) and those from towns of fewer than 100,000 inhabitants (61.6%). For the same reason, respondents from west Macedonia (75.2% participation) and east Macedonia (68.2%) comprise the majority of classical music non-audience.
AUDIENCE OF CONTEMPORARY POPULAR MUSIC CONCERTS
Analysis of the audience of contemporary popular music concerts in Serbia
ACTIVE AUDIENCE OF CONTEMPORARY POPULAR MUSIC CONCERTS. Although in further text instead of the phrase “contemporary popular music” we will use the phrase “rock music”, we note that our analysis comprised attendance to

152
Cultural Needs, Habits aNd taste of CitizeNs of serbia aNd MaCedoNia
27.0%
15.2%
24.9%
30.7% 26.9%
39.1%
38.2%
17.2%
26.6% 34.1%
31.5%
31.4%
13.8%
29.0% 23.0%
51.3%
50.0%
44.1%
32.1% 47.0%
Potential cinema audiencein Serbia
Potential theatre audiencein Serbia
Potential library audiencein Serbia
Potential audience of �ne artsexibitions in Serbia
153
tHe audieNCe aNd Cultural offer
concerts of various types of global popular music (from hard rock to heavy metal to techno and reggae music, from hip-hop and old rock’n’roll to dance music). Active rock music audience gathers a bit less than one quarter of the sample (population – 23.2%). This audience shows strong generation differences, but almost no gen-der differences. The average age of respondents in this active audience is 33 and unlike, for instance, classical music audience, it represents the youngest active audience out of all observed audiences in Serbia. From one generation group to another (as constructed in our research) one notices significant changes in terms of number and percentage of participants in active rock audience. In the youngest generation, 45% respondents belong to this active audience; in the 31-45 age group 26.6%; in the group of people between 46 and 65 years of age there are hardly 8.8% persons participating in active rock audience; and in the over-65 generation there are just five such people (3.8%). Although one notices differences in levels of education among members of active audience, particularly dividing respondents with elementary education from all the rest, analysis has shown that there are no major differences in terms of education of respondents within rock audience139. A bit more significant differences are noticeable in terms of their parents’ education, where the regular pattern is again found – active audience is more educated than potential audience, and potential audience yet more educated than non-audience (in this case, their parents). Also, differences in terms of occupational groups140, although present, are a bit milder than in the case of other Serbian active audiences. Farmers, workers, civil servants and supported individuals participate in active rock audience with small percentages, while among pupils and students (expectedly) there were the most individuals who actively participate in r’n’r activities (63%). Then follow, with a significantly smaller percentage, but still participating above average levels, experts (43.4%), managers and owners (42.1%), junior executives (31%), and small business owners (30.5%). Territorial composition of respondents in active audience clearly shows why rock music is considered an urban phenomenon. Percentage of participation of respondents from cities (regardless of their size) shows no significant differences (ranging between 25% and 30%), but percent-age of respondents from the countryside making up active rock audience is only 13.3%. Regional differences are not conspicuous, either: the biggest percentage of respondents in active rock audience is found in Vojvodina (27.3%), and the lowest in south and east Serbia (18.7%).
POTENTIAL AUDIENCE OF CONTEMPORARY POPULAR MUSIC CON-CERTS. Potential rock music audience in Serbia gathers the second quarter of the sample (population – 27.9%). There are no gender differences, and prominent 139 In part, this is a consequence of the fact that a number of younger respondents comprising the majority of this audience have not yet completed their education.140 Active audience gathers 39.8% experts, managers, and owners, 24.7% respondents from middle-class professions, and 14.9% farmers and workers.
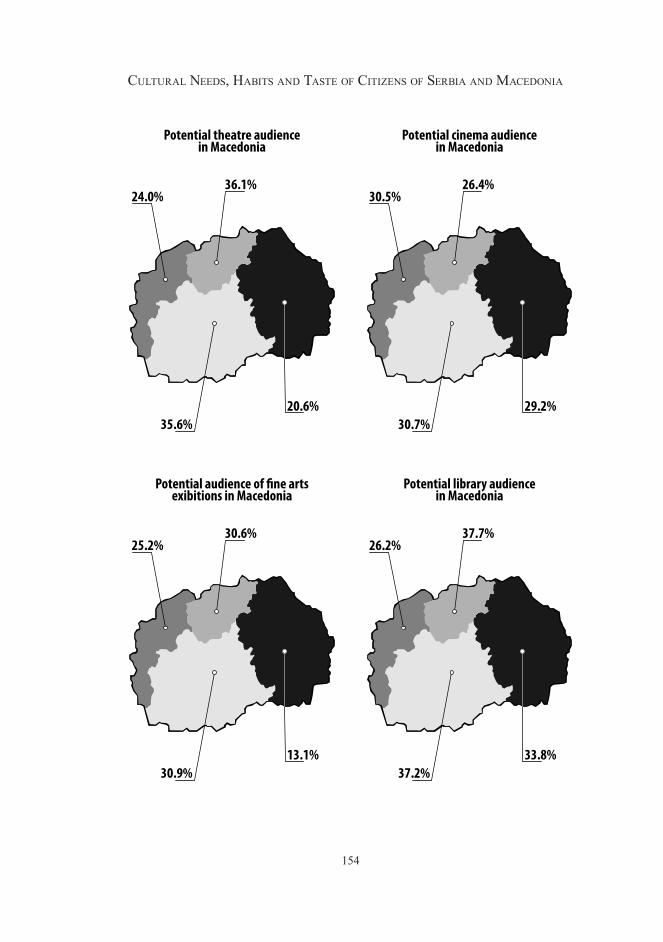
154
Cultural Needs, Habits aNd taste of CitizeNs of serbia aNd MaCedoNia
Potential cinema audiencein Macedonia
Potential theatre audiencein Macedonia
Potential library audiencein Macedonia
Potential audience of �ne artsexibitions in Macedonia
30.7%29.2%
30.5%26.4%
35.6%20.6%
24.0%36.1%
30.9%13.1%
25.2%30.6%
37.2%33.8%
26.2%37.7%
155
tHe audieNCe aNd Cultural offer
generation differences, typical of active rock audience, disappear here. The only remaining difference is that distinguishing between the oldest generation and the rest – the oldest do not only abstain from visiting rock concerts, but they do not like this music at all in large numbers. Contrary to this, educational divisions seen in active audience are clear here, too. On the one hand, there are respondents with elementary education who participate in both active and potential audience with very small numbers (4% and 9.1% respectively), and, on the other, there are almost no differences between respondents with secondary education and those with high education. Similarly, there is almost no difference between respondents from middle-class professions and experts, managers, and owners141, while, in terms of reduced participation in potential audience, farmers and workers stand out (18.8%). Viewed by actual job positions of respondents, we find above average participation of civil servants (38.5%), experts (36.4%), and small business owners (35.6%). Here we may add to this workers, who participate in potential rock audience with 30.5%. An interesting remark related to territorial composition of respondents is that in active audience differences among cities were insignificant, while they were all clearly opposed to the countryside population. In potential audience, there are no particular differences in small towns, major cities and villages in Serbia (ranging from 23% to 27%), but Belgrade and its surroundings comprise more significant participation here (41.1%). It is logical that the same pattern repeats in the regional makeup of potential rock audience.
NON-AUDIENCE OF CONTEMPORARY POPULAR MUSIC CONCERTS. This non-audience takes up almost a half of the sample and population in Serbia (48.7%). In it, too, there are no gender differences, but strong generation differences occur once again. In this non-audience, there are 77.9% respondents older than 65, two thirds of respondents from the 46-65 age group, 40% participants between 31 and 45 years of age, and one quarter (24.7%) of respondents from the youngest age group (18-30). As is the case with educationally and occupationally strongly divided audiences, in this non-audience the rifts are strong. Among respondents with elementary education, participation in non-audience amounts to 86.9%, among respondents with secondary education it amounts to 49.2%, and among the highly educated 28.5%. Occupational divisions follow the same line. In non-audience, there is one quarter experts, managers, and owners, 40% persons from middle-class professions, and two thirds farmers and workers. Viewed by actual job positions, farmers (81.6%), workers (56.6%), and supported individuals (51.9%) make up the most of this non-audience. As for territorial organization, respondents from the countryside, Sumadija and Pomoravlje regions and south and east Serbia show above average levels of non-audience participation.
141 Participation in potential rock audience for middle-class professions is 36.2%, and for ex-perts, managers, and owners – 35.8%.

156
Cultural Needs, Habits aNd taste of CitizeNs of serbia aNd MaCedoNia
38.2%
28.6%
24.3%
20.8% 25.8%
48.6%
44.4%
21.4%
27.4% 29.1%
56.5%
40.0%
69.8%
60.1% 55.7%
20.2%
24.3%
19.8%
24.8% 24.4%
Potential audience of contemporary popularmusic concerts in Serbia
Potential classical music concerts audience in Serbia
Potential reading audiencein Serbia
Potential folk music concerts audience in Serbia
157
tHe audieNCe aNd Cultural offer
Analysis of the audience of contemporary popular music concerts in Macedonia
ACTIVE AUDIENCE OF CONTEMPORARY POPULAR MUSIC CONCERTS. Active rock audience in Macedonia is a bit bigger than in Serbia and represents 28.5% of the sample (population). With the average age of 31, it is the youngest audience group of all the we have analyzed. Strong generation differences within this audience point to a more general regularity. It turned out, actually, that in the cases of audience for the so-called “popular” arts (such as modern popular music or film), generation differences are very strong and determine who belongs to audience. On the other hand, there were almost no gender differences. Here, too, educational and occupational differences are specific: they clearly differenti-ate between the groups of the lowest status – the least educated and farmers and workers – and the remaining groups, which is not the case with other audience. In accordance with this, in active rock audience there participate 54.9% respond-ents from the under 30 generation, 30.2% respondents from the 31-45 age group, only 7.1% of those belonging to the 46-65 generation, and just two respondents older than 65 (which is 4% of this generation and 0.9% of active audience). The regularity we were talking about may also be seen in the fact that in active rock audience there participates just one respondent with elementary education, one hundred twenty participants with secondary school degrees (30.8% of the group) and eighty nine respondents from the higher education group (39.9% of the group). Among occupational groups there is, on the other hand, something more similar to the three-storey pyramid common with other audiences: experts, managers, and owners participate in active rock audience with 48.5%, respondents from middle-class professions with 31.6%, and farmers and workers with 15.6%. It is possible that this comes from the fact that, in constructing occupational groups, we recoded the largest group in this audience – pupils and students (78.6%) – based on their parents’ occupations. Apart from them, above average levels, in active audience we also find experts (52.6%), small business owners (38.5%), managers/owners (33.3%) and civil servants (30.5%). As in Serbia, in Macedonia, too, respondents from the cities (irrespective of their size) show similar participation percentages, which clearly distinguish between them and the countryside population. As for regional organization, the highest percentage of participation in active audience is found in the population of south Macedonia.
POTENTIAL AUDIENCE OF CONTEMPORARY POPULAR MUSIC CON-CERTS. Potential rock audience comprises 19.8% of the sample (population). In this audience there are no gender differences, and generation differences are seen in the fact respondents from the oldest generation (mere 4% participation) stand out as compared with all other groups. The average age of respondents from this
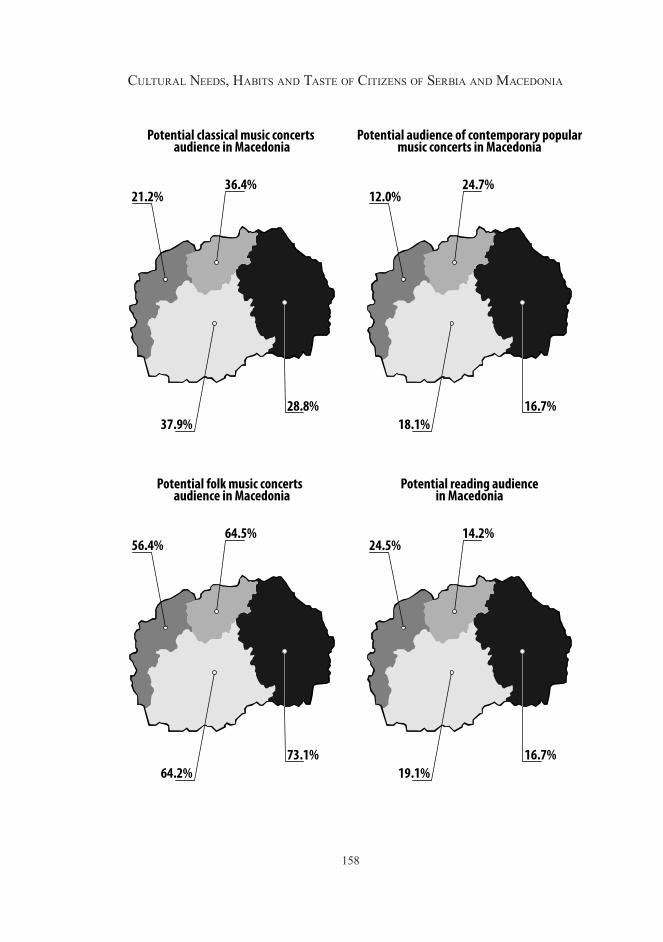
158
Cultural Needs, Habits aNd taste of CitizeNs of serbia aNd MaCedoNia
Potential audience of contemporary popularmusic concerts in Macedonia
Potential classical music concerts audience in Macedonia
Potential reading audiencein Macedonia
Potential folk music concerts audience in Macedonia
18.1%16.7%
12.0%24.7%
37.9%28.8%
21.2%36.4%
64.2%73.1%
56.4%64.5%
19.1%16.7%
24.5%14.2%
159
tHe audieNCe aNd Cultural offer
group is 39. Although noticeable, educational and occupational differences are by far smaller than in the active rock audience. Again, the group of respondents with elementary education and farmers and workers participate on clearly different levels as compared with the remaining two groups. In potential rock audience, above average levels there participate civil servants (28.8%), junior managers (26.5%) and small business owners (25.6%). As for territorial composition, above average levels we find in potential audience only respondents from Skopje (29.4%), which leads to the same regular pattern in terms of regional makeup of our respondents (this time, with the participation of respondents from Skopje on the 24.7% level).
NON-AUDIENCE OF CONTEMPORARY POPULAR MUSIC CONCERTS. Non-audience for rock music is quite substantial in Macedonia, too – it comprises over a half of the sample (population – 51.6%). With the average age of 48 years, it is, on average, quite older than its active and potential counterparts. One can see this in terms of generation differences within this audience, which, contrary to gender divisions, are again very significant. The oldest generation participates in non-audience with 92%, while, on the other hand, the participation of the youngest generation equals 24.1%. Also, educational divisions in non-audience are quite conspicuous and point to the same direction we have seen in the active audience: respondents with the lowest education (participation level 88.1%) are clearly separated from the remaining two groups (whose participation is 48.5% and 35.9%). Differences based on occupational groups provide a mirror image as compared with active audience: farmers and workers participate in non-audience in the highest percentage (68.8%), the numbers gradually decrease toward mid-dle-class professions (49%) and experts, managers, and owners (30.1%). Among non-audience, out of the groups we constructed based on their current job posi-tions, the highest participation is found among farmers (78.8%), workers (62.9%), supported individuals (60.5%), and junior managers (53.1%). Respondents from towns of fewer than 100,000 inhabitants and those from the villages, who made up just a tiny percentage of active and potential audience, comprise the cornerstone of rock music non-audience (three quarters of countryside respondents and over a half of respondents from smaller towns). A similar situation occurs in terms of regional organization of our respondents. Those from west and east Macedonia, who did not much participate in active and potential audiences, take part in non-audience above average values: those from west Macedonia 66%, and those from east Macedonia 58.3%.
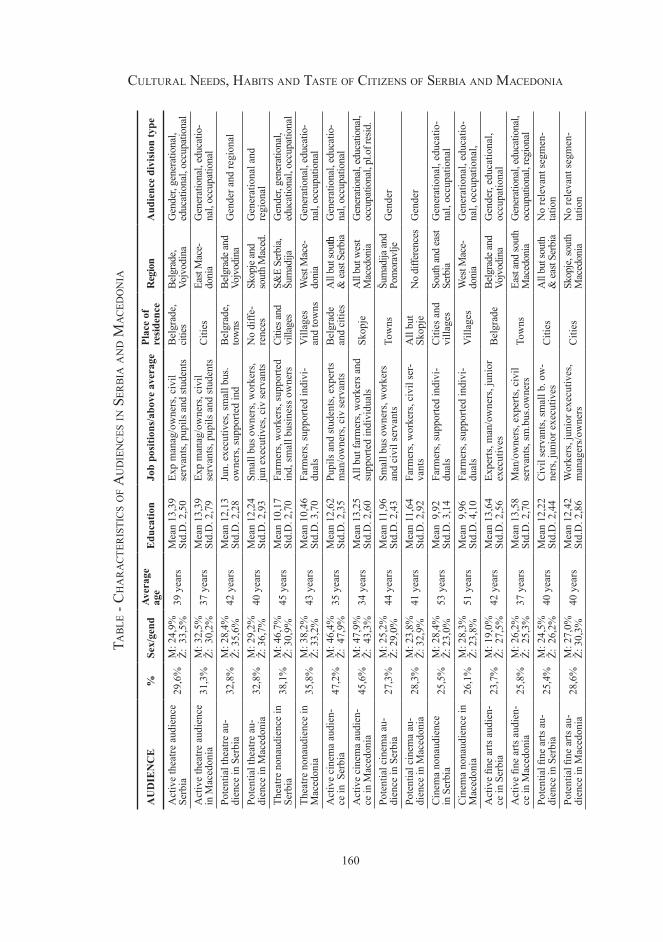
160
Cultural Needs, Habits aNd taste of CitizeNs of serbia aNd MaCedoNia
AU
DIE
NC
E%
Sex/
gend
Aver
age
age
Edu
catio
nJo
b po
sitio
ns/a
bove
ave
rage
Plac
e of
re
side
nce
Reg
ion
Aud
ienc
e di
visi
on ty
pe
Act
ive
thea
tre a
udie
nce
Serb
ia29
,6%
M: 2
4,9%
Ž: 3
3,5%
39 y
ears
Mea
n 13
,39
Std.
D. 2
,50
Ex
p m
anag
/ow
ners
, civ
il se
rvan
ts, p
upils
and
stud
ents
Bel
grad
e,ci
ties
Belg
rade
,Vo
jvod
ina
Gen
der,
gene
ratio
nal,
educ
atio
nal,
occu
patio
nal
Act
ive
thea
tre a
udie
nce
in M
aced
onia
31,3
%M
: 32,
5%Ž:
30,
2%37
yea
rsM
ean
13,3
9St
d.D
. 2,7
9
Exp
man
ag/o
wne
rs, c
ivil
serv
ants
, pup
ils a
nd st
uden
tsC
ities
East
Mac
e-do
nia
Gen
erat
iona
l, ed
ucat
io-
nal,
occu
patio
nal
Pote
ntia
l the
atre
au-
dien
ce in
Ser
bia
32,8
%M
: 28,
4%Ž:
35,
6%42
yea
rsM
ean
12,1
3St
d.D
. 2,2
8
Jun.
exe
cutiv
es, s
mal
l bus
. ow
ners
, sup
porte
d in
dB
elgr
ade,
to
wns
Belg
rade
and
Vojv
odin
aG
ende
r and
regi
onal
Pote
ntia
l the
atre
au-
dien
ce in
Mac
edon
ia32
,8%
M: 2
9,2%
Ž: 3
6,7%
40 y
ears
Mea
n 12
,24
Std.
D. 2
,93
Sm
all b
us o
wne
rs, w
orke
rs,
jun
exec
utiv
es, c
iv se
rvan
tsN
o di
ffe-
renc
esSk
opje
and
sout
h M
aced
.G
ener
atio
nal a
nd
regi
onal
Thea
tre n
onau
dien
ce in
Se
rbia
38,1
%M
: 46,
7%Ž:
30,
9%45
yea
rsM
ean
10,1
7St
d.D
. 2,7
0
Farm
ers,
wor
kers
, sup
porte
d in
d, sm
all b
usin
ess o
wne
rsCi
ties a
nd
villa
ges
S&E
Serb
ia,
Šum
adija
Gen
der,
gene
ratio
nal,
educ
atio
nal,
occu
patio
nal
Thea
tre n
onau
dien
ce in
M
aced
onia
35,8
%M
: 38,
2%Ž:
33,
2%43
yea
rsM
ean
10,4
6St
d.D
. 3,7
0
Farm
ers,
supp
orte
d in
divi
-du
als
Vill
ages
an
d to
wns
Wes
t Mac
e-do
nia
Gen
erat
iona
l, ed
ucat
io-
nal,
occu
patio
nal
Act
ive
cine
ma
audi
en-
ce in
Ser
bia
47,2
%M
: 46,
4%Ž:
47,
9%35
yea
rsM
ean
12,6
2St
d.D
. 2,3
5
Pupi
ls a
nd st
uden
ts, e
xper
ts
man
/ow
ners
, civ
serv
ants
Bel
grad
e an
d ci
ties
All
but s
outhth
&
east
Serb
iaG
ener
atio
nal,
educ
atio
-na
l, oc
cupa
tiona
lA
ctiv
e ci
nem
a au
dien
-ce
in M
aced
onia
45,6
%M
: 47,
9%Ž:
43,
3%34
yea
rsM
ean
13,2
5St
d.D
. 2,6
0 A
ll bu
t far
mer
s, w
orke
rs a
nd
supp
orte
d in
divi
dual
sSk
opje
All
but w
est
Mac
edon
iaG
ener
atio
nal,
educ
atio
nal,
occu
patio
nal,
pl.o
f res
id.
Pote
ntia
l cin
ema
au-
dien
ce in
Ser
bia
27,3
%M
: 25,
2%Ž:
29,
0%44
yea
rsM
ean
11,9
6St
d.D
. 2,4
3
Smal
l bus
ow
ners
, wor
kers
an
d ci
vil s
erva
nts
Tow
nsŠu
mad
ija an
d Po
mor
avlje
Gen
der
Pote
ntia
l cin
ema
au-
dien
ce in
Mac
edon
ia28
,3%
M: 2
3,8%
Ž: 3
2,9%
41 y
ears
Mea
n 11
,64
Std.
D. 2
,92
Fa
rmer
s, w
orke
rs, c
ivil
ser-
vant
sA
ll bu
t Sk
opje
No
diffe
renc
esG
ende
r
Cin
ema
nona
udie
nce
in S
erbi
a25
,5%
M: 2
8,4%
Ž: 2
3,0%
53 y
ears
Mea
n 9
,92
Std.
D. 3
,14
Fa
rmer
s, su
ppor
ted
indi
vi-
dual
sC
ities
and
vi
llage
sSo
uth
and
east
Serb
iaG
ener
atio
nal,
educ
atio
-na
l, oc
cupa
tiona
lC
inem
a no
naud
ienc
e in
M
aced
onia
26,1
%M
: 28,
3%Ž:
23,
8%51
yea
rsM
ean
9,9
6St
d.D
. 4,1
0
Farm
ers,
supp
orte
d in
divi
-du
als
Vill
ages
Wes
t Mac
e-do
nia
Gen
erat
iona
l, ed
ucat
io-
nal,
occu
patio
nal,
Act
ive
fine
arts
aud
ien-
ce in
Ser
bia
23,7
%M
: 19,
0%Ž:
27,
5%42
yea
rsM
ean
13,6
4St
d.D
. 2,5
6 Ex
perts
, man
/ow
ners
, jun
ior
exec
utiv
esB
elgr
ade
Belg
rade
and
Vojv
odin
aG
ende
r, ed
ucat
iona
l, oc
cupa
tiona
lA
ctiv
e fin
e ar
ts a
udie
n-ce
in M
aced
onia
25,8
%M
: 26,
2%Ž:
25,
3%37
yea
rsM
ean
13,5
8St
d.D
. 2,7
0
Man
/ow
ners
, exp
erts
, civ
il se
rvan
ts, s
m.b
us.o
wne
rsTo
wns
East
and
sout
h M
aced
onia
Gen
erat
iona
l, ed
ucat
iona
l, oc
cupa
tiona
l, re
gion
alPo
tent
ial fi
ne a
rts a
u-di
ence
in S
erbi
a25
,4%
M: 2
4,5%
Ž: 2
6,2%
40 y
ears
Mea
n 12
,22
Std.
D. 2
,44
C
ivil
serv
ants
, sm
all b
. ow
-ne
rs, j
unio
r exe
cutiv
esC
ities
All
but s
outh
&
east
Serb
iaN
o re
leva
nt se
gmen
-ta
tion
Pote
ntia
l fine
arts
au-
dien
ce in
Mac
edon
ia28
,6%
M: 2
7,0%
Ž: 3
0,3%
40 y
ears
Mea
n 12
,42
Std.
D. 2
,86
W
orke
rs, j
unio
r exe
cutiv
es,
man
ager
s/ow
ners
Citi
esSk
opje
, sou
th
Mac
edon
iaN
o re
leva
nt se
gmen
-ta
tion
tabl
e - C
Ha
ra
Cte
ris
tiC
s of a
ud
ieN
Ces
iN s
erbi
a a
Nd
Ma
Ced
oN
ia
161
tHe audieNCe aNd Cultural offer
FOLK MUSIC CONCERT AUDIENCE
Analysis of folk music concert audience in Serbia
ACTIVE FOLK MUSIC AUDIENCE. According to replies from our survey, active folk music audience in Serbia gathers only 8.3% of the sample (population). This of course does not correspond to our everyday experience from Serbia. It is possible that respondents, assuming that listening to folk music would be treated as a sign of plainness in “academic” circles (and the survey probably looked as such), have concealed that they visit folk music concerts. Another possibility, which seems to us more plausible (as in the section on cultural needs respondents did not hide they liked to listen to folk music in their leisure time) is that respondents have taken the meaning of the word “concert” too literally142, so that they excluded all cases in which they listened to folk music live, but which did not take place in concert halls or domes. Contributing to this is the fact that potential folk music audience gathers almost 60% of respondents, which is the biggest potential audience of all in Serbia. It is most likely that many of them actually belong to active audi-ence, which would have been better identifiable with a more proper formulation of questions, or with additional explanations from our surveyors. Be it as it may, we analyzed the data that we gathered, and this warning should just be kept in mind. Among respondents from this active audience there are no gender differ-ences, and generation differences are small, too (apart from the case of over-65ers who are a bit less common). The average age of respondents from this audience is 39. In terms of both average age and education, the audience for folk music is an exception. On average, age and education in this audience are the same for the population in the active audience and in non-audience143, while the oldest and the least educated respondent groups belong to potential audience. In terms of level of participation in active audience there are no differences between respondents with secondary school and high education (9% from both groups), while those with elementary education are less prominent in active audience (3.9%). Moreover, in terms of affiliation with occupational groups there are almost no differences (all participate in active audience with 8%). When viewed by actual job positions at present, we find that in this audience junior managers (15.6%), small business owners (14.1%), managers and owners (10.5%), pupils and students (10.2%), and workers (9.5%) make up the largest portion of participants. Although one could expect that most folk music active audience lives in the countryside, probably due
142 In the question how many folk music concerts they had attended in the 12 months prior to the survey.143 The average length of education for these two groups is 12 years each, while the average age of non-audience respondents is 40.

162
Cultural Needs, Habits aNd taste of CitizeNs of serbia aNd MaCedoNia
AU
DIE
NC
E%
Sex/
gend
Aver
age
age
Edu
catio
nJo
b po
sitio
ns/a
bove
ave
rage
Plac
e of
re
side
nce
Reg
ion
Aud
ienc
e di
visi
on ty
pe
Fine
arts
non
audi
ence
in
Ser
bia
51,0
%M
: 56,
6%Ž:
46,
3%44
yea
rsM
ean
10,6
2St
d.D
. 2,5
8
Farm
ers,
wor
kers
, sup
porte
d in
divi
dual
s, sm
.b.o
wne
rsC
ities
and
vi
llage
sA
ll bu
t Bel
-gr
ade
Educ
atio
nal a
nd o
ccu-
patio
nal
Fine
arts
non
audi
ence
in
Mac
edon
ia45
,7%
M: 4
6,8%
Ž: 4
4,5%
43 y
ears
Mea
n 1
1,92
Std.
D. 3
,39
Farm
ers,
supp
orte
d in
d, p
upi-
ls a
nd st
uden
tsSk
opje
and
vi
llage
sSk
opje
and
w.M
aced
onia
Gen
erat
iona
l, ed
ucat
io-
nal a
nd o
ccup
atio
nal
Act
ive
libra
ry a
udie
nce
in S
erbi
a31
,6%
M: 2
6,6%
Ž: 3
6,3%
37 y
ears
Mea
n 13
,05
Std.
D. 2
,48
Ex
perts
. pup
ils a
nd st
uden
tsN
o di
ffer-
ence
sN
o di
ffer-
ence
sG
ener
atio
nal,
educ
a-tio
nal,
occu
patio
nal
Act
ive
libra
ry a
udie
nce
in M
aced
onia
32,3
%M
: 31,
1%Ž:
33,
4%34
yea
rsM
ean
13,7
0St
d.D
. 2,5
7
Pupi
ls an
d stu
dent
s, ex
perts
, ju
nior
exe
cutiv
es, c
iv se
rvan
tsC
ities
No
diffe
r-en
ces
Gen
erat
iona
l, ed
uca-
tiona
l, oc
cupa
tiona
lPo
tent
ial l
ibra
ry a
udi-
ence
in S
erbi
a42
,6%
M: 3
9,5%
Ž: 4
5,3%
43 y
ears
Mea
n 12
,07
Std.
D. 2
,46
A
ll bu
t far
mer
s and
pup
ils
and
stud
ents
No
diffe
r-en
ces
All
but
Sum
adija
No
rele
vant
segm
enta
-tio
nPo
tent
ial l
ibra
ry a
udi-
ence
in M
aced
onia
35,6
%M
: 31,
3%Ž:
40,
6%40
yea
rsM
ean
12,4
1St
d.D
. 2,8
0
All
but p
upils
and
stud
ents
Skop
je,
tow
nsN
o di
ffer-
ence
sG
ende
r, ed
ucat
iona
l, pl
ace
of re
side
nce
Libr
ary
nona
udie
nce
in
Serb
ia25
,8%
M: 3
4,3%
Ž: 1
8,4%
48 y
ears
Mea
n 9
,68
Std.
D.
2,75
Fa
rmer
s, w
orke
rs, s
mal
l bus
i-ne
ss o
wne
rsA
ll bu
t B
elgr
ade
All
but B
el-
grad
eG
ener
atio
nal,
educ
atio
n-al
and
occ
upat
iona
lLi
brar
y no
naud
ienc
e in
M
aced
onia
32,2
%M
: 37,
6%Ž:
26,
0%47
yea
rsM
ean
9,6
5St
d.D
. 3,4
9
Farm
ers,
wor
kers
, sup
porte
d in
divi
dual
s, sm
.b.o
wne
rsTo
wns
and
vi
llage
sw
est M
ace-
doni
aG
ende
r, ge
nera
tiona
l, ed
ucat
iona
l&oc
cupa
tiona
lA
ctiv
e re
adin
g au
di-
ence
in S
erbi
a52
,1%
M: 4
2,3%
Ž: 6
0,3%
40 y
ears
Mea
n 12
,75
Std.
D. 2
,46
Ex
perts
, civ
il se
rvan
ts, p
upils
an
d st
uden
ts, m
an/o
wne
rsB
elgr
ade,
to
wns
Bel
grad
eG
ende
r, ge
nera
tiona
l, ed
ucat
iona
l&oc
cupa
tiona
lA
ctiv
e re
adin
g au
di-
ence
in M
aced
onia
50,5
%M
: 45,
0%Ž:
56,
3%37
yea
rsM
ean
13,3
8St
d.D
. 2,6
6Ex
perts
, man
/ow
ners
, civ
se
rvan
ts, p
upils
and
stud
ents
Skop
jeSk
opje
& e
ast
Mac
edon
iaG
ende
r, ge
nera
tiona
l, ed
ucat
iona
l&oc
cupa
tiona
lPo
tent
ial r
eadi
ng a
udi-
ence
in S
erbi
a22
,4%
M: 2
4,0%
Ž: 2
1,2%
43 y
ears
Mea
n 11
,77
Std.
D. 2
,54
Ju
nior
exe
cutiv
esN
o di
ffer-
ence
sN
o di
ffer-
ence
sN
o se
gmen
tatio
n
Pote
ntia
l rea
ding
aud
i-en
ce in
Mac
edon
ia18
,1%
M: 1
7,3%
Ž: 1
8,7%
39 y
ears
Mea
n 1
2,17
Std.
D.
2,86
Ju
nior
exe
cutiv
es, m
anag
ers/
owne
rs, c
iv se
rvan
tsC
ities
, vil-
lage
sW
est M
ace-
doni
aPl
ace
of re
side
nce
Rea
ding
non
audi
ence
in
Ser
bia
25,5
%M
: 33,
7%Ž:
18,
5%48
yea
rsM
ean
9,6
8St
d.D
. 2,7
5
Farm
ers a
nd w
orke
rsV
illag
esŠu
mad
ija a
nd
S&E
Serb
iaG
ende
r, ge
nera
tiona
l, ed
ucat
iona
l&oc
cupa
tiona
lR
eadi
ng n
onau
dien
ce
in M
aced
onia
31,5
%M
: 37,
7%Ž:
25,
0%47
yea
rsM
ean
9,8
1St
d.D
. 3,6
6
Farm
ers,
wor
kers
, sup
porte
d in
divi
dual
sV
illag
es,
tow
nsW
est a
nd e
ast
Mac
edon
iaG
ende
r, ge
nera
tiona
l, ed
ucat
iona
l&oc
cupa
tiona
lA
ctiv
e cl
assi
cal m
usic
au
dien
ce in
Ser
bia
6,0%
M: 3
,9%
Ž: 8
,4%
41
yea
rsM
ean
14,5
7St
d.D
. 2,4
0
Expe
rts, p
upils
and
stud
ents
, m
an/o
wne
rs, c
iv se
rvan
tsB
elgr
ade
Bel
grad
eG
ende
r, ed
ucat
iona
l, oc
-cu
patio
nal,
pl.o
f res
.A
ctiv
e cl
assi
cal m
usic
au
dien
ce in
Mac
edon
ia5,
3%M
: 3,9
%Ž:
6,7
%37
yea
rsM
ean
13,8
2St
d.D
. 2,7
2
Man
/ow
ners
, sm
b o
wne
rs,
civi
l ser
vant
sSk
opje
, ci
ties
Skop
jeG
ende
r, ed
ucat
iona
l, oc
-cu
patio
nal,
pl.o
f res
.
tabl
e - C
Ha
ra
Cte
ris
tiC
s of a
ud
ieN
Ces
iN s
erbi
a a
Nd
Ma
Ced
oN
ia (C
oN
tiN
ued
)
163
tHe audieNCe aNd Cultural offer
to misunderstandings we have mentioned, the data show that active folk music audience in Serbia is mostly located in towns with over 100,000 inhabitants and smaller towns, and least frequent in Belgrade and the villages. On the other hand, in terms of regional composition, this audience is the most common in Šumadija and Pomoravlje (as expected, up to a point at least).
POTENTIAL FOLK MUSIC AUDIENCE. We have already mentioned that potential folk music audience in Serbia gathers 60% of the sample (population). Among them there are no gender differences, but one notices clear generation differences. The average age of respondents from potential audience is 44 and a clear distinction can be made between the participation of respondents from the two younger generations (54% each) and the two older generations (66.5% for re-spondents aged 46-65, and 69.7% for respondents over 65). In terms of educational criteria, divisions are also clear-cut. While among respondents with elementary education 77.7% take part in potential audience, among persons with secondary school degrees there are 60.8% potential folk music concert goers. Finally, among the highly educated, the percentage of participation in this audience is 47.8%. This, so to speak, reversed order (as opposed to other situations with active and potential audiences) is noticeable in occupational groups, too, where farmers and workers participate in the potential audience with almost 70%, while respondents from middle-class professions do so with 54.5%, and experts, managers, and owners with 44.4%. When observed by actual job positions of respondents, above aver-age levels of participation in potential folk music audience is found with farmers (86.8%), managers/owners (68.4%), supported individuals (65.6%), and workers (63.6%). Our assumption is that this “reversed order” also suggests that most potential audience is actually active audience. In terms of place of residence, the most members of this audience live in the countryside and cities of over 100,000 inhabitants, while among regions such as south and east Serbia and Šumadija and Pomoravlje, these people are most frequently found.
FOLK MUSIC NON-AUDIENCE. Of the three audience types, probably the most accurate are the data on the scope and characteristics of non-audience. It comprises around 30% of the sample (population). The average age of these re-spondents is 40, and here too one notices a clear division between the below-45 and over-45 generations. Respondents from younger generations participate in non-audience on the 36% level, while in the older generations the number figures around one quarter of the total number of people. The most participation in folk music non-audience is found among respondents with high education (43.3%), fol-lowed by those with secondary school degrees (30.1%), and finally individuals with an elementary school diploma (18.4%). Parallel with this, respondents from the group of experts, managers, and owners participate in non-audience with 47.4%, those from middle class professions with 37.6%, and those from among farmers
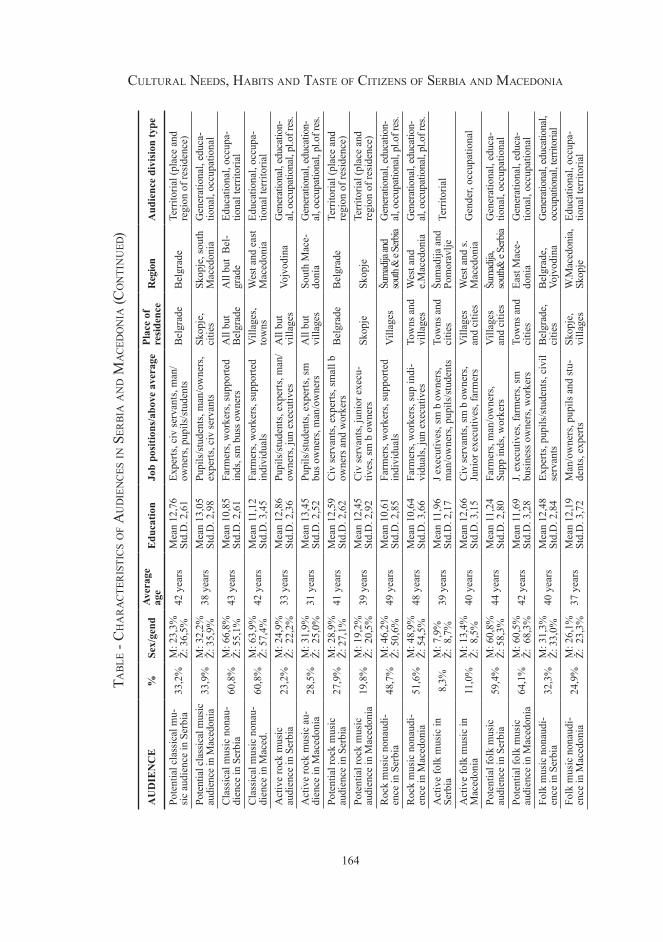
164
Cultural Needs, Habits aNd taste of CitizeNs of serbia aNd MaCedoNia
AU
DIE
NC
E%
Sex/
gend
Aver
age
age
Edu
catio
nJo
b po
sitio
ns/a
bove
ave
rage
Plac
e of
re
side
nce
Reg
ion
Aud
ienc
e di
visi
on ty
pe
Pote
ntia
l cla
ssic
al m
u-si
c au
dien
ce in
Ser
bia
33,2
%M
: 23,
3%Ž:
36,
5%
42 y
ears
Mea
n 12
,76
Std.
D. 2
,61
Ex
perts
, civ
serv
ants
, man
/ow
ners
, pup
ils/s
tude
nts
Bel
grad
eB
elgr
ade
Terr
itoria
l (pl
ace
and
regi
on o
f res
iden
ce)
Pote
ntia
l cla
ssic
al m
usic
au
dien
ce in
Mac
edon
ia33
,9%
M: 3
2,2%
Ž: 3
5,9%
38 y
ears
Mea
n 13
,05
Std.
D. 2
,98
Pu
pils
/stu
dent
s, m
an/o
wne
rs,
expe
rts, c
iv se
rvan
tsSk
opje
, ci
ties
Skop
je, s
outh
M
aced
onia
Gen
erat
iona
l, ed
uca-
tiona
l, oc
cupa
tiona
lC
lass
ical
mus
ic n
onau
-di
ence
in S
erbi
a60
,8%
M: 6
6,8%
Ž: 5
5,1%
43 y
ears
Mea
n 10
,85
Std.
D. 2
,61
Fa
rmer
s, w
orke
rs, s
uppo
rted
inds
, sm
bus
s ow
ners
All
but
Bel
grad
eA
ll bu
t B
el-
grad
eEd
ucat
iona
l, oc
cupa
-tio
nal t
errit
oria
lC
lass
ical
mus
ic n
onau
-di
ence
in M
aced
.60
,8%
M: 6
3,9%
Ž: 5
7,4%
42 y
ears
Mea
n 11
,12
Std.
D. 3
,45
Fa
rmer
s, w
orke
rs, s
uppo
rted
indi
vidu
als
Vill
ages
, to
wns
Wes
t and
eas
t M
aced
onia
Educ
atio
nal,
occu
pa-
tiona
l ter
ritor
ial
Act
ive
rock
mus
ic
audi
ence
in S
erbi
a23
,2%
M: 2
4,9%
Ž: 2
2,2%
33 y
ears
Mea
n 12
,86
Std.
D. 2
,36
Pu
pils
/stu
dent
s, ex
perts
, man
/ow
ners
, jun
exe
cutiv
esA
ll bu
t vi
llage
sVo
jvod
ina
Gen
erat
iona
l, ed
ucat
ion-
al, o
ccup
atio
nal,
pl.o
f res
.A
ctiv
e ro
ck m
usic
au-
dien
ce in
Mac
edon
ia28
,5%
M: 3
1,9%
Ž: 2
5,0%
31 y
ears
Mea
n 13
,45
Std.
D. 2
,52
Pu
pils
/stu
dent
s, ex
perts
, sm
bu
s ow
ners
, man
/ow
ners
All
but
villa
ges
Sout
h M
ace-
doni
aG
ener
atio
nal,
educ
atio
n-al
, occ
upat
iona
l, pl
.of r
es.
Pote
ntia
l roc
k m
usic
au
dien
ce in
Ser
bia
27,9
%M
: 28,
9%Ž:
27,
1%41
yea
rsM
ean
12,5
9St
d.D
. 2,6
2
Civ
serv
ants
, exp
erts
, sm
all b
ow
ners
and
wor
kers
Bel
grad
eB
elgr
ade
Terr
itoria
l (pl
ace
and
regi
on o
f res
iden
ce)
Pote
ntia
l roc
k m
usic
au
dien
ce in
Mac
edon
ia19
,8%
M: 1
9,2%
Ž: 2
0,5%
39 y
ears
Mea
n 12
,45
Std.
D. 2
,92
C
iv se
rvan
ts, j
unio
r exe
cu-
tives
, sm
b o
wne
rsSk
opje
Skop
jeTe
rrito
rial (
plac
e an
d re
gion
of r
esid
ence
)R
ock
mus
ic n
onau
di-
ence
in S
erbi
a48
,7%
M: 4
6,2%
Ž: 5
0,6%
49 y
ears
Mea
n 10
,61
Std.
D. 2
,85
Fa
rmer
s, w
orke
rs, s
uppo
rted
indi
vidu
als
Vill
ages
Šum
adija
and
south
& e
Serb
iaG
ener
atio
nal,
educ
atio
n-al
, occ
upat
iona
l, pl
.of r
es.
Roc
k m
usic
non
audi
-en
ce in
Mac
edon
ia51
,6%
M: 4
8,9%
Ž: 5
4,5%
48 y
ears
Mea
n 10
,64
Std.
D. 3
,66
Fa
rmer
s, w
orke
rs, s
up in
di-
vidu
als,
jun
exec
utiv
esTo
wns
and
vi
llage
sW
est a
nd
e.M
aced
onia
Gen
erat
iona
l, ed
ucat
ion-
al, o
ccup
atio
nal,
pl.o
f res
.A
ctiv
e fo
lk m
usic
in
Serb
ia8,
3%M
: 7,9
%Ž:
8,7
%39
yea
rsM
ean
11,9
6St
d.D
. 2,1
7
J exe
cutiv
es, s
m b
ow
ners
, m
an/o
wne
rs, p
upils
/stu
dent
sTo
wns
and
ci
ties
Šum
adija
and
Po
mor
avlje
Terr
itoria
l
Act
ive
folk
mus
ic in
M
aced
onia
11,0
%M
: 13,
4%Ž:
8,5
%40
yea
rsM
ean
12,6
6St
d.D
. 3,1
5
Civ
serv
ants
, sm
b o
wne
rs,
Juni
or e
xecu
tives
, far
mer
sV
illag
es
and
citie
sW
est a
nd s.
M
aced
onia
Gen
der,
occu
patio
nal
Pote
ntia
l fol
k m
usic
au
dien
ce in
Ser
bia
59,4
%M
: 60,
8%Ž:
58,
3%44
yea
rs
Mea
n 11
,24
Std.
D. 2
,80
Fa
rmer
s, m
an/o
wne
rs,
Supp
inds
, wor
kers
Vill
ages
an
d ci
ties
Šum
adija
, so
uth&
e Se
rbia
Gen
erat
iona
l, ed
uca-
tiona
l, oc
cupa
tiona
lPo
tent
ial f
olk
mus
ic
audi
ence
in M
aced
onia
64,1
%M
: 60,
5%Ž:
68,
3%42
yea
rsM
ean
11,6
9St
d.D
. 3,2
8
J. ex
ecut
ives
, far
mer
s, sm
bu
sine
ss o
wne
rs, w
orke
rsTo
wns
and
ci
ties
East
Mac
e-do
nia
Gen
erat
iona
l, ed
uca-
tiona
l, oc
cupa
tiona
lFo
lk m
usic
non
audi
-en
ce in
Ser
bia
32,3
%M
: 31,
3%Ž:
33,
0%40
yea
rsM
ean
12,4
8St
d.D
. 2,8
4
Expe
rts, p
upils
/stu
dent
s, ci
vil
serv
ants
Bel
grad
e,
citie
sB
elgr
ade,
Vo
jvod
ina
Gen
erat
iona
l, ed
ucat
iona
l, oc
cupa
tiona
l, te
rrito
rial
Folk
mus
ic n
onau
di-
ence
in M
aced
onia
24
,9%
M: 2
6,1%
Ž: 2
3,3%
37 y
ears
Mea
n 12
,19
Std.
D. 3
,72
M
an/o
wne
rs, p
upils
and
stu-
dent
s, ex
perts
Skop
je,
villa
ges
W.M
aced
onia
, Sk
opje
Ed
ucat
iona
l, oc
cupa
-tio
nal t
errit
oria
l
tabl
e - C
Ha
ra
Cte
ris
tiC
s of a
ud
ieN
Ces
iN s
erbi
a a
Nd
Ma
Ced
oN
ia (C
oN
tiN
ued
)
165
tHe audieNCe aNd Cultural offer
and workers with 22.3%. Within groups we constructed based on their actual job positions, most non-audience comprises experts (53.5%), pupils and students (45.5%), and civil servants (43.6%). In terms of territorial organization, a kind of response to their prevalence in potential audience (and not, as in previous cases, active audience) most non-audience is found in Belgrade and towns with less than 100,000 inhabitants, and also in Belgrade and Vojvodina. Likewise, the least folk music non-audience is found among villagers and residents of south and east Serbia and Šumadija and Pomoravlje.
Analysis of folk music concert audience in Macedonia
ACTIVE FOLK MUSIC AUDIENCE. Everything stated on folk music audience in Serbia applies in Macedonia, as well. Although in both countries folk music is omnipresent, and although halls in which such concerts are held are packed with crowds, and live performances also occur in discos, cafes, clubs, and street tents, according to our data, active audience for this kind of music in Macedonia gath-ers very few respondents (only 11% of the sample). As mentioned above, our daily experience suggests that these data are not true, and that respondents have either attempted to conceal their visits to folk music concerts or that they have consid-ered as ‘concerts’ only those solo performances of major stars which indeed occur seldom (and mostly in Belgrade and Skopje). As was the case in Serbia, in terms of age and education, folk music audience in Macedonia is an exception. Its non-audience is younger (37) than its active audience (40), while, with the average age of 42 – the oldest are those respondents belonging to potential audience. Simultane-ously, as in Serbia, there are almost no educational differences among respondents from the active, potential and non-audiences for folk music. Although the number of respondents in active audience is very low, one still notices significant gender differences – men participate in this audience more than women (the mutual ratio being 63.4% : 36.6%). Within active audience, there are no significant differences in terms of participation of different generations. Still, the participation of the old-est generation is the lowest (5.7%). Accordingly, although educational differences among the respondents are not significant, one may notice that respondents with elementary education participate on a lower level, as compared with the other two educational groups. As for occupational groups, participation in the active audience above average levels is found within middle-class profession participants (16.9%). When viewed by their actual job positions, we find that civil servants (15.9%), small business owners (14.6%), lower executives (14.3%), and farmers (11.8%) participate above average levels. In terms of percentages, the most active folk music audience in Macedonia is found in the villages (16%) and in towns with more than 100,000
166
Cultural Needs, Habits aNd taste of CitizeNs of serbia aNd MaCedoNia
inhabitants (12.3%). As for regional composition, most participation in active audi-ence is found in west Macedonia (15.5%) and south Macedonia (13.5%).
POTENTIAL FOLK MUSIC AUDIENCE. As in Serbia, characteristics that we expected to find in folk music active audience pop up in potential audience. Potential folk music audience is even bigger than the one in Serbia, and amounts to 64.1% of the sample (population). The average age of these respondents is 42. In this audience, there are no major generation differences, and in terms of percentage, the most prevalent is the 46-65 generation (74.5%). There are no particular gender divisions, either, while educational and occupational differences here too contradict all other active and potential audiences that we have studied here. In potential folk music audience, we find the most respondents with elementary education (71.5%), followed by those with secondary education (65.4%), while participation of re-spondents with higher education is 56.9%. Likewise, among occupational groups, above average levels of participation in this audience are found only among farmers and workers (70%). On the other hand, when observing the actual job positions of respondents, below average levels we find only those groups that are always above average levels in other active and potential audiences – experts, managers/owners, and pupils/students. In Macedonia, the most potential audience respondents come from towns with over 100,000 inhabitants (70.2%), and from smaller towns (66.9%), while, regionally, participants from east Macedonia stand out (73.1%).
FOLK MUSIC NON-AUDIENCE. Folk music non-audience makes up about a quarter of the population in Macedonia (24.9% of the sample). As mentioned before, with the average respondent age of 37, this is the youngest of folk music audiences, and generational divisions within it are peculiar: the most participation in non-audience is found in the youngest (34.7%) and the oldest generations (30.2%). In this audience, there are no significant gender differences, and most participation in it is found among the most educated (29.7%) and experts, managers and owners (35.7%). Viewed by their actual job positions, those who did not participate in potential audience stand out here – experts, managers/owners, and pupils and students. Similarly, respond-ents from Skopje and the countryside, whose participation in potential audience was below average levels, make up the most of non-audience. This high participation of respondents from Skopje in non-audience translates into significant participation of respondents from the region of Skopje and around (27.5%), while west Macedonian respondents make up an even larger group of non-audience (28.2%).
The audience and cultural habits – the influence of early socialization
In this research, we also studied how much early contacts with art, especially in the circle of the family, influence one’s later affiliation with certain types of audience.
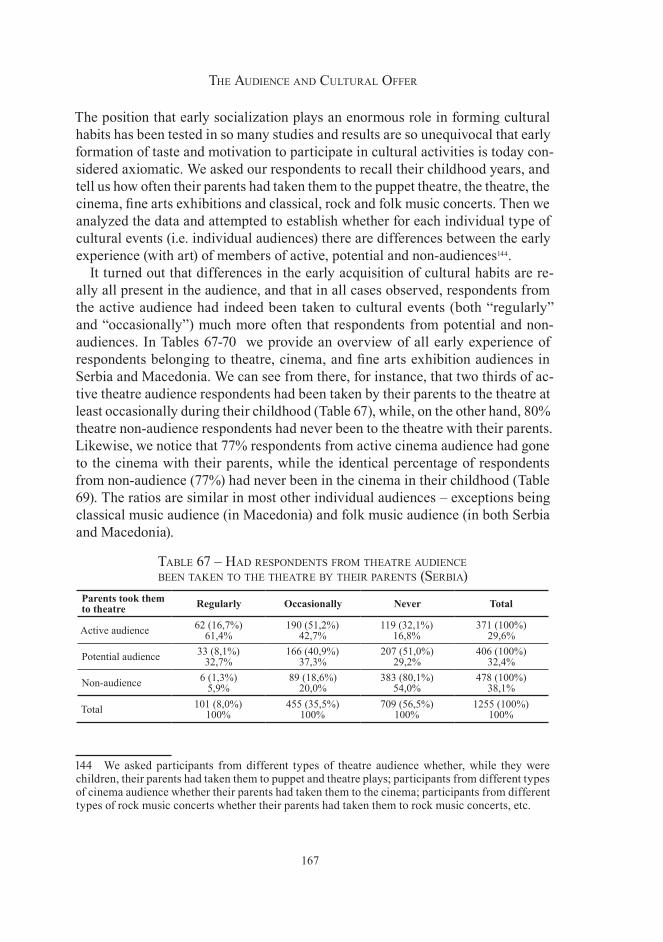
167
tHe audieNCe aNd Cultural offer
The position that early socialization plays an enormous role in forming cultural habits has been tested in so many studies and results are so unequivocal that early formation of taste and motivation to participate in cultural activities is today con-sidered axiomatic. We asked our respondents to recall their childhood years, and tell us how often their parents had taken them to the puppet theatre, the theatre, the cinema, fine arts exhibitions and classical, rock and folk music concerts. Then we analyzed the data and attempted to establish whether for each individual type of cultural events (i.e. individual audiences) there are differences between the early experience (with art) of members of active, potential and non-audiences144.
It turned out that differences in the early acquisition of cultural habits are re-ally all present in the audience, and that in all cases observed, respondents from the active audience had indeed been taken to cultural events (both “regularly” and “occasionally”) much more often that respondents from potential and non-audiences. In Tables 67-70 we provide an overview of all early experience of respondents belonging to theatre, cinema, and fine arts exhibition audiences in Serbia and Macedonia. We can see from there, for instance, that two thirds of ac-tive theatre audience respondents had been taken by their parents to the theatre at least occasionally during their childhood (Table 67), while, on the other hand, 80% theatre non-audience respondents had never been to the theatre with their parents. Likewise, we notice that 77% respondents from active cinema audience had gone to the cinema with their parents, while the identical percentage of respondents from non-audience (77%) had never been in the cinema in their childhood (Table 69). The ratios are similar in most other individual audiences – exceptions being classical music audience (in Macedonia) and folk music audience (in both Serbia and Macedonia).
table 67 – Had respoNdeNts froM tHeatre audieNCe beeN takeN to tHe tHeatre by tHeir pareNts (serbia)
Parents took them to theatre Regularly Occasionally Never Total
Active audience 62 (16,7%)61,4%
190 (51,2%)42,7%
119 (32,1%)16,8%
371 (100%)29,6%
Potential audience 33 (8,1%)32,7%
166 (40,9%)37,3%
207 (51,0%)29,2%
406 (100%)32,4%
Non-audience 6 (1,3%)5,9%
89 (18,6%)20,0%
383 (80,1%)54,0%
478 (100%)38,1%
Total 101 (8,0%)100%
455 (35,5%)100%
709 (56,5%)100%
1255 (100%)100%
144 We asked participants from different types of theatre audience whether, while they were children, their parents had taken them to puppet and theatre plays; participants from different types of cinema audience whether their parents had taken them to the cinema; participants from different types of rock music concerts whether their parents had taken them to rock music concerts, etc.
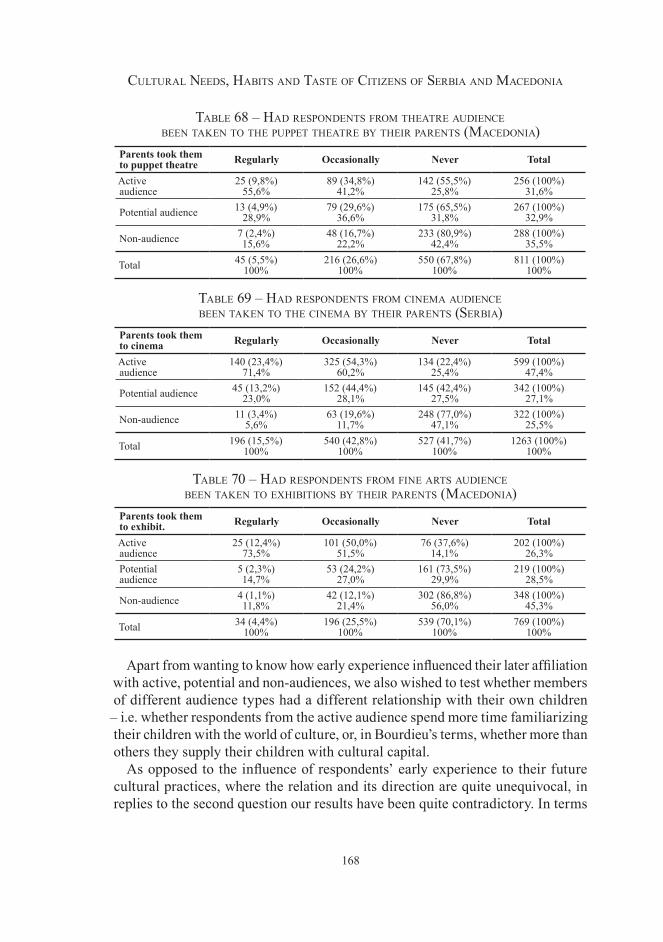
168
Cultural Needs, Habits aNd taste of CitizeNs of serbia aNd MaCedoNia
table 68 – Had respoNdeNts froM tHeatre audieNCe beeN takeN to tHe puppet tHeatre by tHeir pareNts (MaCedoNia)
Parents took them to puppet theatre Regularly Occasionally Never Total
Activeaudience
25 (9,8%)55,6%
89 (34,8%)41,2%
142 (55,5%)25,8%
256 (100%)31,6%
Potential audience 13 (4,9%)28,9%
79 (29,6%)36,6%
175 (65,5%)31,8%
267 (100%)32,9%
Non-audience 7 (2,4%)15,6%
48 (16,7%)22,2%
233 (80,9%)42,4%
288 (100%)35,5%
Total 45 (5,5%)100%
216 (26,6%)100%
550 (67,8%)100%
811 (100%)100%
table 69 – Had respoNdeNts froM CiNeMa audieNCe beeN takeN to tHe CiNeMa by tHeir pareNts (serbia)
Parents took them to cinema Regularly Occasionally Never Total
Activeaudience
140 (23,4%)71,4%
325 (54,3%)60,2%
134 (22,4%)25,4%
599 (100%)47,4%
Potential audience 45 (13,2%)23,0%
152 (44,4%)28,1%
145 (42,4%)27,5%
342 (100%)27,1%
Non-audience 11 (3,4%)5,6%
63 (19,6%)11,7%
248 (77,0%)47,1%
322 (100%)25,5%
Total 196 (15,5%)100%
540 (42,8%)100%
527 (41,7%)100%
1263 (100%)100%
table 70 – Had respoNdeNts froM fiNe arts audieNCe beeN takeN to exHibitioNs by tHeir pareNts (MaCedoNia)
Parents took them to exhibit. Regularly Occasionally Never Total
Activeaudience
25 (12,4%)73,5%
101 (50,0%)51,5%
76 (37,6%)14,1%
202 (100%)26,3%
Potentialaudience
5 (2,3%)14,7%
53 (24,2%)27,0%
161 (73,5%)29,9%
219 (100%)28,5%
Non-audience 4 (1,1%)11,8%
42 (12,1%)21,4%
302 (86,8%)56,0%
348 (100%)45,3%
Total 34 (4,4%)100%
196 (25,5%)100%
539 (70,1%)100%
769 (100%)100%
Apart from wanting to know how early experience influenced their later affiliation with active, potential and non-audiences, we also wished to test whether members of different audience types had a different relationship with their own children – i.e. whether respondents from the active audience spend more time familiarizing their children with the world of culture, or, in Bourdieu’s terms, whether more than others they supply their children with cultural capital.
As opposed to the influence of respondents’ early experience to their future cultural practices, where the relation and its direction are quite unequivocal, in replies to the second question our results have been quite contradictory. In terms
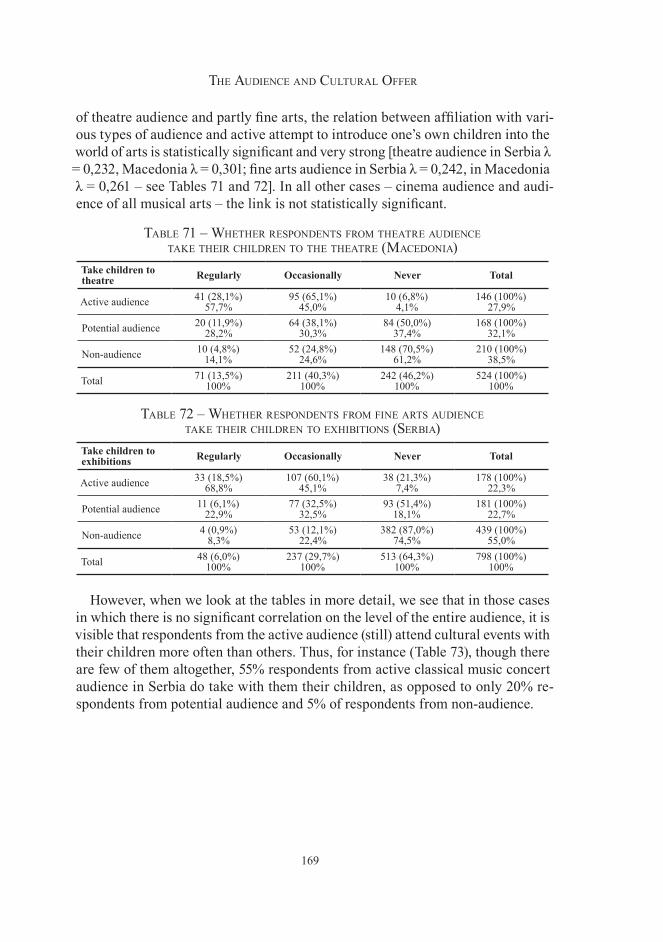
169
tHe audieNCe aNd Cultural offer
of theatre audience and partly fine arts, the relation between affiliation with vari-ous types of audience and active attempt to introduce one’s own children into the world of arts is statistically significant and very strong [theatre audience in Serbia λ = 0,232, Macedonia λ = 0,301; fine arts audience in Serbia λ = 0,242, in Macedonia λ = 0,261 – see Tables 71 and 72]. In all other cases – cinema audience and audi-ence of all musical arts – the link is not statistically significant.
table 71 – wHetHer respoNdeNts froM tHeatre audieNCe take tHeir CHildreN to tHe tHeatre (MaCedoNia)
Take children to theatre Regularly Occasionally Never Total
Active audience 41 (28,1%)57,7%
95 (65,1%)45,0%
10 (6,8%)4,1%
146 (100%)27,9%
Potential audience 20 (11,9%)28,2%
64 (38,1%)30,3%
84 (50,0%)37,4%
168 (100%)32,1%
Non-audience 10 (4,8%)14,1%
52 (24,8%)24,6%
148 (70,5%)61,2%
210 (100%)38,5%
Total 71 (13,5%)100%
211 (40,3%)100%
242 (46,2%)100%
524 (100%)100%
table 72 – wHetHer respoNdeNts froM fiNe arts audieNCe take tHeir CHildreN to exHibitioNs (serbia)
Take children to exhibitions Regularly Occasionally Never Total
Active audience 33 (18,5%)68,8%
107 (60,1%)45,1%
38 (21,3%)7,4%
178 (100%)22,3%
Potential audience 11 (6,1%)22,9%
77 (32,5%)32,5%
93 (51,4%)18,1%
181 (100%)22,7%
Non-audience 4 (0,9%)8,3%
53 (12,1%)22,4%
382 (87,0%)74,5%
439 (100%)55,0%
Total 48 (6,0%)100%
237 (29,7%)100%
513 (64,3%)100%
798 (100%)100%
However, when we look at the tables in more detail, we see that in those cases in which there is no significant correlation on the level of the entire audience, it is visible that respondents from the active audience (still) attend cultural events with their children more often than others. Thus, for instance (Table 73), though there are few of them altogether, 55% respondents from active classical music concert audience in Serbia do take with them their children, as opposed to only 20% re-spondents from potential audience and 5% of respondents from non-audience.
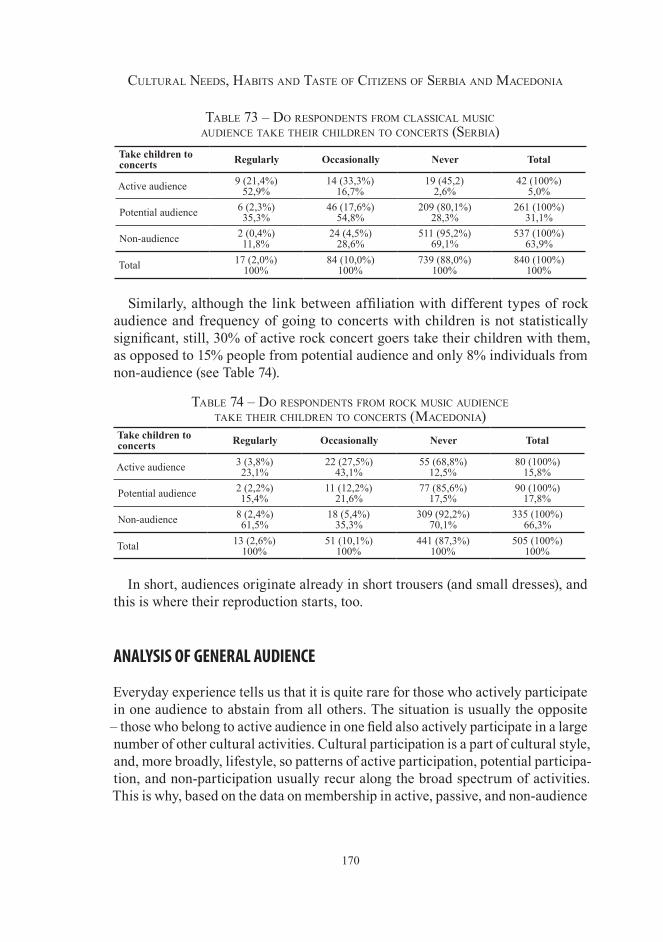
170
Cultural Needs, Habits aNd taste of CitizeNs of serbia aNd MaCedoNia
table 7� – do respoNdeNts froM ClassiCal MusiC audieNCe take tHeir CHildreN to CoNCerts (serbia)
Take children to concerts Regularly Occasionally Never Total
Active audience 9 (21,4%)52,9%
14 (33,3%)16,7%
19 (45,2)2,6%
42 (100%)5,0%
Potential audience 6 (2,3%)35,3%
46 (17,6%)54,8%
209 (80,1%)28,3%
261 (100%)31,1%
Non-audience 2 (0,4%)11,8%
24 (4,5%)28,6%
511 (95,2%)69,1%
537 (100%)63,9%
Total 17 (2,0%)100%
84 (10,0%)100%
739 (88,0%)100%
840 (100%)100%
Similarly, although the link between affiliation with different types of rock audience and frequency of going to concerts with children is not statistically significant, still, 30% of active rock concert goers take their children with them, as opposed to 15% people from potential audience and only 8% individuals from non-audience (see Table 74).
table 74 – do respoNdeNts froM roCk MusiC audieNCe take tHeir CHildreN to CoNCerts (MaCedoNia)
Take children to concerts Regularly Occasionally Never Total
Active audience 3 (3,8%)23,1%
22 (27,5%)43,1%
55 (68,8%)12,5%
80 (100%)15,8%
Potential audience 2 (2,2%)15,4%
11 (12,2%)21,6%
77 (85,6%)17,5%
90 (100%)17,8%
Non-audience 8 (2,4%)61,5%
18 (5,4%)35,3%
309 (92,2%)70,1%
335 (100%)66,3%
Total 13 (2,6%)100%
51 (10,1%)100%
441 (87,3%)100%
505 (100%)100%
In short, audiences originate already in short trousers (and small dresses), and this is where their reproduction starts, too.
ANALYSIS OF GENERAL AUDIENCE
Everyday experience tells us that it is quite rare for those who actively participate in one audience to abstain from all others. The situation is usually the opposite – those who belong to active audience in one field also actively participate in a large number of other cultural activities. Cultural participation is a part of cultural style, and, more broadly, lifestyle, so patterns of active participation, potential participa-tion, and non-participation usually recur along the broad spectrum of activities. This is why, based on the data on membership in active, passive, and non-audience
171
tHe audieNCe aNd Cultural offer
in individual cultural activities, we attempted to use cluster analysis so as to con-struct something that could represent general audience types. They would gather respondents who are motivated to actively participate in a wide range of cultural activities (active audience), who have an affinity to the arts and motivation to visit cultural events but usually do not do so (potential audience), and those respond-ents who neither have motivation nor actually participate in cultural activities (non-audience). It is worth mentioning that audiences of individual arts (cultural activities) were our constructs, but that data on general audiences are so much a result of our processing (with no attempt of distortion, though), that they should indeed be taken with extreme caution. In this case, our point was not to precisely describe the characteristics of this “general” audience in Macedonia and Serbia, but rather to point out some frequent characteristics so that general regularities – some of which have been noted in the analysis of individual audiences already – should become even clearer.
Analysis of general audience in Serbia
ACTIVE AUDIENCE. Active audience gathers 32.6% of the Serbian sample. It includes a bit more women than men, but the difference is not big. From the statisti-cal values observed, we conclude that, in general, the relation between gender and affiliation with audience types – although statistically significant – is not too strong. The average age of the population from this group is 39. Generation divisions in it follow the line we witnessed in the analysis of many individual audiences: on the one hand we find respondents from the generations below 45 (with participation of 41% and 36.9% respectively), and on the other there are respondents older than this age (25.1%) and those older than 65 (18.4%). The link between respondents’ age and their participation in difference audience types is statistically significant and pretty strong (λ = 0,121, Eta = 0,342). It turned out, however, that the strong-est influence on structuring audience in Serbia comes from educational and oc-cupational divisions. The correlation between the level of education and audience type is statistically significant and strong (λ = 0,208, Eta = 0,502, accounting for around 25% variance). We find a similar situation when observing the interrela-tion of membership in occupational groups on the one hand and membership in audience types on the other (statistically, also significant and strong - λ = 0,218). Viewing only active audience, we notice that there are 56.8% persons with higher education participating in it, and also 26.9% individuals with secondary school degrees and only seven persons with elementary school diplomas (which is 3.7% of the group and only 1.6% of active audience). Likewise, in the active audience in Serbia we find almost seventy percent of respondents from among experts, managers,
172
Cultural Needs, Habits aNd taste of CitizeNs of serbia aNd MaCedoNia
and owners (69.4%), 37.2% respondents from middle-class professions and 14.3% farmers and workers. When viewed by job position they actually take, we see that in the active audience (as in numerous individual audiences we observed) there is above-average participation of experts (75.9%), managers and owners (63.2%), pupils and students (55.6%), and civil servants (45.1%). Analyses have shown that territorial differences in Serbia, although present, do not have stronger influence on belonging to certain audience types, and that among them, more influence is exerted by the size of the place of residence than the region of residence (the link between regional composition of respondents and affiliation with certain audience types in Serbia is not statistically significant). In Serbia, in the active population, there is above-average participation of respondents from Belgrade (57.9%) and towns with less than 100,000 population (36.5%). Viewed by regional composition, we see that the most active audience is located in Belgrade (45%) and Vojvodina (34.7%)145, while below average levels this is the case in Šumadija and Pomoravlje (24.9%) and south and east Serbia (20.5%).
POTENTIAL AUDIENCE. Potential audience gathers around 40% of the Serbian sample. The average age of respondents from this group is 41, and within it there are almost no generation differences – all generations participate around average levels. Additionally, in this group there are no gender differences. Viewed by educational and occupational groups, we notice that in potential audience the most present are respondents with secondary education and those from middle-class professions. This can be seen in the above-average participation in this audience of small business owners (49.2%), junior executives (44.6%) and civil servants (41.7%). In terms of territorial organization, above-average participation in potential audi-ence is typical of respondents from the countryside (41.5%), towns with fewer than 100,000 inhabitants (41.3%), and also Sandzak (51.3%) and Vojvodina (42.5%).
NON-AUDIENCE. Non-audience gathers 27.4% of the Serbian sample. The general rule we noticed in observing individual audiences – that in potential au-dience there are no major differences in terms of observed dimensions, and that non-audience provides an inverse image of active audience – is also borne out here. In non-audience there are a bit more men than women, although, once again, these differences are not major. The average age of respondents from non-audience is 48 years, where, although generation differences in non-audience more clearly deline-ate between generations (as we constructed them) than in active audience, the basic line of division remains: between people under 45 (below average participation in non-audience) and people from the two older generations (above average partici-pation in non-audience). Rifts along educational and occupational dimensions are even better seen in non-audience. Here one clearly notices what we drew attention to while analyzing individual audiences – that the gap dividing respondents with
145 Also in Sandzak – 41%, with the remark we have already presented.
173
tHe audieNCe aNd Cultural offer
elementary education and those with secondary school degrees (especially in the case of “popular” arts such as film or modern pop music) is higher than the one delineating between respondents with secondary school degrees and those with higher education146. Among respondents with elementary education, 72.3% people are in non-audience. On the other hand, non-audience gathers 27.8% people with secondary school degrees, and only 5.9% of the highly educated population. Simi-larly, 48.4% farmers and workers are in non-audience (amounting to 80.7% of this audience), and 14.7% respondents from middle-class professions and 2.8% persons working as experts, managers or owners belong to this audience. As was the case with individual audiences, in non-audience there is an above-average participation of farmers (82.5%), workers (42.7%), and supported individuals (32.6%). As for the territorial organization, above average participation in non-audience is found among villagers (43.3%) and persons from towns with over 100,000 inhabitants (29.5%). Among Serbian regions, above average participation in non-audience is found among respondents from south and east Serbia (40.9%), and Šumadija and Pomoravlje (36.1%).
Analysis of general audience in Macedonia
ACTIVE AUDIENCE. Active audience comprises 27% of the Macedonian sample. Contrary to Serbia, in Macedonian active audience there are no differences in the participation of men and women. Moreover, if on the level of the entire audience in Serbia, the link between gender and affiliation with certain types of audience was statistically significant (though not strong), in Macedonia there is even no statistical significance. In Macedonia, too, in general audience, just like in most individual audiences, one of the regularities we have noticed holds: that in terms of age and education, among respondents belonging to different types of audiences, the numbers are going downwards: respondents from the active audience are younger and more educated than those in potential audience, and they are in turn younger and more educated than respondents from non-audience147. The average age of respondents from the general audiences in Macedonia is 34 (which is five years younger than the active audience in Serbia). Just like in Serbia, generation differences within the active audience divide the sample (population) into two younger and two older generations, which leads one to conclude that in observed societies in one’s mid forties (in our constructed generations, the borderline is 45 146 By analogy, the same could be said of the differences between respondents classified as farmers and workers, middle-class professionals, and experts, managers and owners.147 As for education, this also applies to their parents – parents of respondents from active au-dience are better educated than parents of respondents from potential audience, and these are, in turn, better educated than parents of respondents from non-audience.
174
Cultural Needs, Habits aNd taste of CitizeNs of serbia aNd MaCedoNia
years of age), for a large portion of the population, there starts abstinence from ac-tive cultural life. In the youngest generation in Macedonian active audience, there participate 39.7% respondents, and in the 31-45 generation – 30.5% respondents. On the other hand, from the 46-65 generation, in the active audience we find 12.5% respondents, and in the oldest group – 10.7% respondents.148 Educational differ-ences in Macedonian audience are strong (Eta = 0.463), and this can be seen in divisions within active audience. Out of respondents with elementary education, only one respondent takes part in active audience. Among those with secondary school diplomas, there are 125 persons belonging to active audience (26.3% of this group and 53% of active audience, just below the average rate of participation for respondents from the sample). Finally, among the group of respondents with higher education, 110 respondents participate in active audience (comprising 42% of this group and 46.6% of active audience, which is by far above the average level of participation of this group in the sample). As usual, similar differences in terms of participation in active audience are found among occupational groups as well.149 From among experts, managers, and owners, almost a half respondents participate in active audience (48.2%), while respondents from middle class professions par-ticipate almost two times less frequently (28.6%), and farmers and workers almost three times less so (16.3%). Viewed by respondents’ actual job positions, we find that among them participation in active audience above average levels is typical only of farmers, workers, lower executives and supported individuals, while all the rest are above average. This is expressed in the values of statistics we have observed, showing that the link between job positions and audience types is not significant. The same is true of the relation between territorial composition of our respondents and their participation in active, potential, and non audiences. In Serbia, the link between regional makeup and audience type was not statistically significant, while the influence of the size of place of residence was small (but the link was statistically significant). In Macedonia, there is not even this significance, but it does not mean that there are no differences in the territorial composition of the audiences. In the active audience, the difference is clear between, on the one hand, respondents from all cities (with average participation in active audience of 31%), and, on the other, people from the countryside (whose participation in active audience is only 9.l%). In terms of regional composition, although regional differences are small, south and east Macedonia lead in terms of respondents’ participation in active audience.
POTENTIAL AUDIENCE. In Macedonia, 41% of the sample participates in potential audience. As we have noticed in a series of individual audiences, in po-148 As in Serbia, the link between the generation and type of audience is statistically significant and, although weaker than the link between education, type of occupation or job position (on the one hand) and affiliation with certain audience types (on the other), it is still strong enough (ETA = 0.342). 149 This link is also statistically significant and rather strong (λ = 0.140)
175
tHe audieNCe aNd Cultural offer
tential audience there are a bit more women (44%) than men (38.4%). The average age of these respondents is 40, and generation differences make a distinction only between the respondents from the oldest generation (26.8% participation) and those from other age groups (whose participation in potential audience ranges between 40% and 42%). A similar situation is found in terms of educational and occupational dimensions. The differences between the participation of respondents with secondary school degrees (42.7%) and those with high education (46.2%) are almost lost in potential audience. On the other end, there are respondents with elementary school diplomas (25.4% participation). Likewise, there are no differ-ences in potential audience between the participation of middle-class profession respondents (43.2%) and experts, managers, and owners (44.6%), but the difference emerges in terms of participation of farmers and workers (33.2%). This tendency of increased presence of middle class professions and secondary school diploma holders can be seen in the above-average participation of respondents from the groups of junior executives (62%) and civil servants (50%) in potential audience. In terms of respondents’ place of residence, one can notice a significant increase of participation of villagers in potential audience (as compared to their appearance in active audience) – even though it still remains below average levels. Above aver-age levels in participation in potential audience we find respondents from Skopje (48.5%) and cities with over 100,000 respondents (48%). Regionally, respondents from west Macedonia and those who live in Skopje and around participate in po-tential audience with almost identical figures (48.9% and 48.1%).
NON-AUDIENCE. Non-audience comprises 32% of the Macedonian sample. The average age of these respondents is 47, and generation differences provide a mirror image of the active audience – above average participation is found in persons older than 45, and below average participation in two younger generations. In response to a bit more pronounced participation of female respondents in po-tential audience, in non-audience in Macedonia we find a bit more men, but, as in potential audience, these differences are not pronounced. As in active audience, big differences are seen in the participation of different educational and occupational groups. Thus, in non-audience we find almost three quarter respondents with el-ementary education (73.9%), a bit above 30% respondents with secondary school diplomas, and 11.8% respondents with high education. Accordingly, more than a half farmers and workers (50.4%) are in non-audience, which is almost twice more than middle-class professionals (28.2%), and almost seven times more than experts, managers, and owners (7.3%). Viewed by actual job positions of respondents, in Macedonia, too, in non-audience we find above average participation of farmers (67.6%), workers (43%), and supported individuals (39.5%). Respondents with cities of fewer than 100,000 residents participate highly in active audiences, and they do so in non-audience (34.6%), which clearly indicates that the place of residence
176
Cultural Needs, Habits aNd taste of CitizeNs of serbia aNd MaCedoNia
in itself does not have any significant structuring power, but that this power is a consequence of other factors. Apart from them, in non-audience we find above average participation of countryside population (51.7%). Regionally, respondents from west Macedonia (40%) and east Macedonia (35.7%) participate in non-audience above average levels. What we noticed of respondents from smaller towns, in this case applies to respondents from east Macedonia, too. The fact that in this region other divisions (primarily educational and occupational) are so pronounced leads to the consequence that in the same region there is above average participation in both active audience and non-audience.
Reasons for non-participation – conditions for participation
Knowing the reasons why a segment of the audience does not participate in the programs we organize is the first prerequisite for making successful marketing campaigns, in which we would try to convince these people to “change their opinion”. Real marketing research in this respect has in mind a concrete “product” (performance, concert, book…) and very concrete conditions influencing attend-ance/purchase (ticket prices, participation/absence of “stars” known to the local audience, good/bad condition of the venue in which the performance is played, (un)availability of the venue where the performance is given (downtown, or pe-ripheral areas, etc.) What we tried to establish is which of the reasons that are most commonly stated as distracting people from participation in cultural events have the most importance (according to respondents from Serbia and Macedonia). Second, we inquired whether there are differences in the reasons as stated by ac-tive, passive, and non-audiences.
We asked our respondents on what conditions they would attend cultural events more often (than they do now) – and offered them seven possible conditions, al-lowing for the possibility that they themselves add one more that has not been mentioned. The seven conditions we stated, whose fulfillment would raise the level of cultural participation, are: 1) that they have more money; 2) more time; 3) circle of friends to go to cultural events with; 4) that the offer of cultural events is richer, i.e. that there are more such events; 5) that cultural events are of better quality; 6) that venues in which the events are played are in a better condition; and 7) that venues in which cultural events take place are closer to their homes. For each of the conditions we asked participants to state whether this is a) the most important condition, b) a condition of influence, or c) not a condition of influence.
We conducted our analyses among representatives of individual audiences. How-ever, as there is no room to present all these data here, we present the results for the three types of general audience (pointing to the same direction as the results
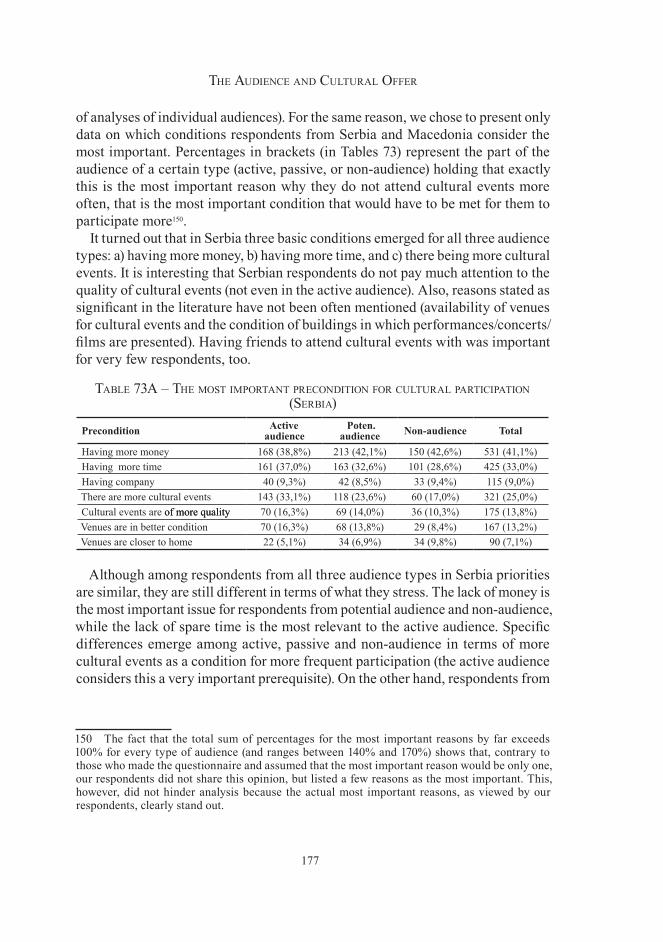
177
tHe audieNCe aNd Cultural offer
of analyses of individual audiences). For the same reason, we chose to present only data on which conditions respondents from Serbia and Macedonia consider the most important. Percentages in brackets (in Tables 73) represent the part of the audience of a certain type (active, passive, or non-audience) holding that exactly this is the most important reason why they do not attend cultural events more often, that is the most important condition that would have to be met for them to participate more150.
It turned out that in Serbia three basic conditions emerged for all three audience types: a) having more money, b) having more time, and c) there being more cultural events. It is interesting that Serbian respondents do not pay much attention to the quality of cultural events (not even in the active audience). Also, reasons stated as significant in the literature have not been often mentioned (availability of venues for cultural events and the condition of buildings in which performances/concerts/films are presented). Having friends to attend cultural events with was important for very few respondents, too.
table 7�a – tHe Most iMportaNt preCoNditioN for Cultural partiCipatioN (serbia)
Precondition Active audience
Poten. audience Non-audience Total
Having more money 168 (38,8%) 213 (42,1%) 150 (42,6%) 531 (41,1%)Having more time 161 (37,0%) 163 (32,6%) 101 (28,6%) 425 (33,0%)Having company 40 (9,3%) 42 (8,5%) 33 (9,4%) 115 (9,0%)There are more cultural events 143 (33,1%) 118 (23,6%) 60 (17,0%) 321 (25,0%)Cultural events are of more qualityof more quality 70 (16,3%) 69 (14,0%) 36 (10,3%) 175 (13,8%)Venues are in better condition 70 (16,3%) 68 (13,8%) 29 (8,4%) 167 (13,2%)Venues are closer to home 22 (5,1%) 34 (6,9%) 34 (9,8%) 90 (7,1%)
Although among respondents from all three audience types in Serbia priorities are similar, they are still different in terms of what they stress. The lack of money is the most important issue for respondents from potential audience and non-audience, while the lack of spare time is the most relevant to the active audience. Specific differences emerge among active, passive and non-audience in terms of more cultural events as a condition for more frequent participation (the active audience considers this a very important prerequisite). On the other hand, respondents from
150 The fact that the total sum of percentages for the most important reasons by far exceeds 100% for every type of audience (and ranges between 140% and 170%) shows that, contrary to those who made the questionnaire and assumed that the most important reason would be only one, our respondents did not share this opinion, but listed a few reasons as the most important. This, however, did not hinder analysis because the actual most important reasons, as viewed by our respondents, clearly stand out.
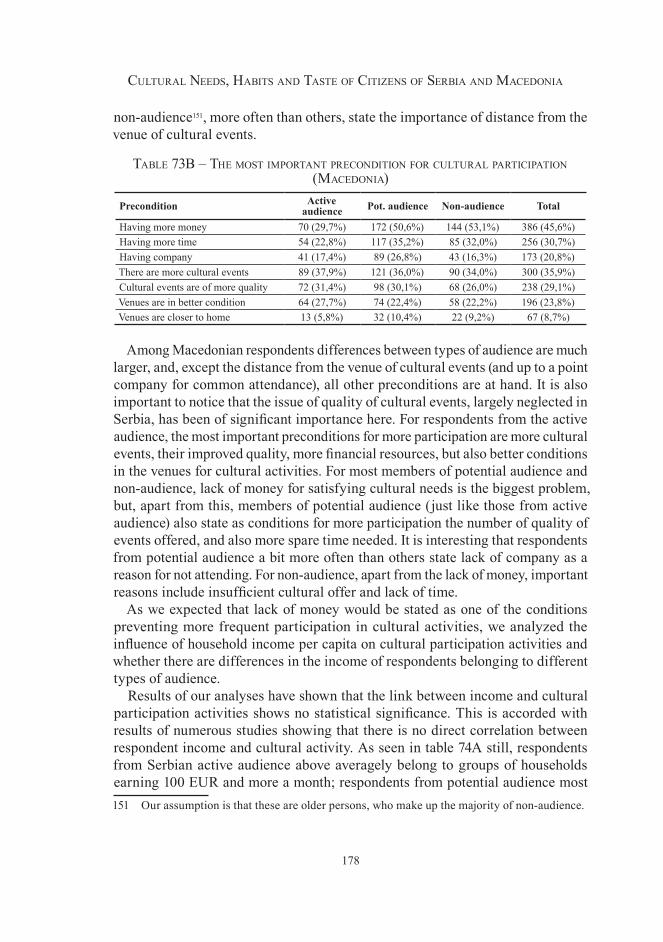
178
Cultural Needs, Habits aNd taste of CitizeNs of serbia aNd MaCedoNia
non-audience151, more often than others, state the importance of distance from the venue of cultural events.
table 7�b – tHe Most iMportaNt preCoNditioN for Cultural partiCipatioN (MaCedoNia)
Precondition Active audience Pot. audience Non-audience Total
Having more money 70 (29,7%) 172 (50,6%) 144 (53,1%) 386 (45,6%)Having more time 54 (22,8%) 117 (35,2%) 85 (32,0%) 256 (30,7%)Having company 41 (17,4%) 89 (26,8%) 43 (16,3%) 173 (20,8%)There are more cultural events 89 (37,9%) 121 (36,0%) 90 (34,0%) 300 (35,9%)Cultural events are of more quality 72 (31,4%) 98 (30,1%) 68 (26,0%) 238 (29,1%)Venues are in better condition 64 (27,7%) 74 (22,4%) 58 (22,2%) 196 (23,8%)Venues are closer to home 13 (5,8%) 32 (10,4%) 22 (9,2%) 67 (8,7%)
Among Macedonian respondents differences between types of audience are much larger, and, except the distance from the venue of cultural events (and up to a point company for common attendance), all other preconditions are at hand. It is also important to notice that the issue of quality of cultural events, largely neglected in Serbia, has been of significant importance here. For respondents from the active audience, the most important preconditions for more participation are more cultural events, their improved quality, more financial resources, but also better conditions in the venues for cultural activities. For most members of potential audience and non-audience, lack of money for satisfying cultural needs is the biggest problem, but, apart from this, members of potential audience (just like those from active audience) also state as conditions for more participation the number of quality of events offered, and also more spare time needed. It is interesting that respondents from potential audience a bit more often than others state lack of company as a reason for not attending. For non-audience, apart from the lack of money, important reasons include insufficient cultural offer and lack of time.
As we expected that lack of money would be stated as one of the conditions preventing more frequent participation in cultural activities, we analyzed the influence of household income per capita on cultural participation activities and whether there are differences in the income of respondents belonging to different types of audience.
Results of our analyses have shown that the link between income and cultural participation activities shows no statistical significance. This is accorded with results of numerous studies showing that there is no direct correlation between respondent income and cultural activity. As seen in table 74A still, respondents from Serbian active audience above averagely belong to groups of households earning 100 EUR and more a month; respondents from potential audience most 151 Our assumption is that these are older persons, who make up the majority of non-audience.
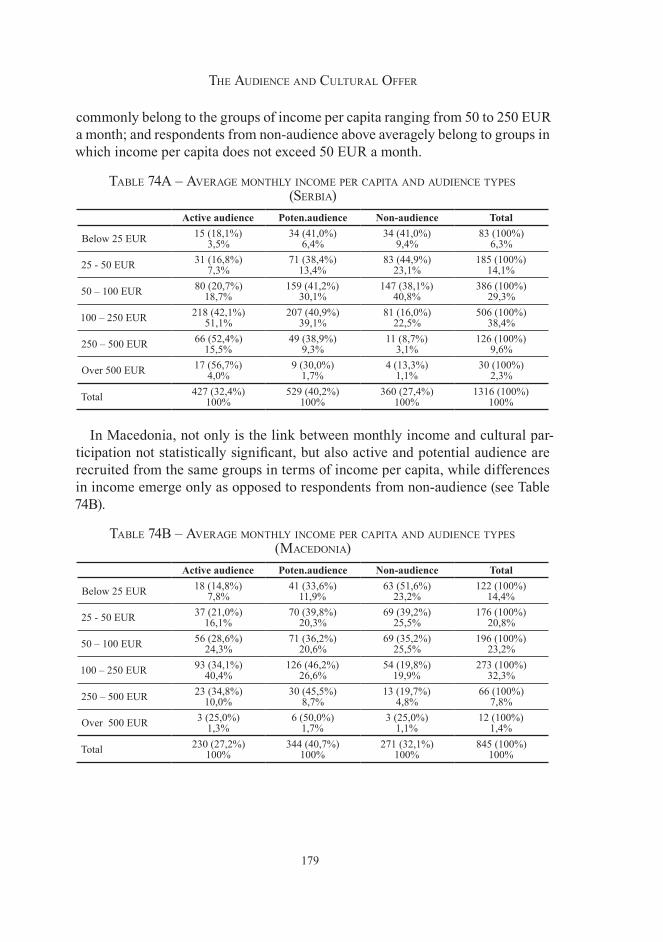
179
tHe audieNCe aNd Cultural offer
commonly belong to the groups of income per capita ranging from 50 to 250 EUR a month; and respondents from non-audience above averagely belong to groups in which income per capita does not exceed 50 EUR a month.
table 74a – average MoNtHly iNCoMe per Capita aNd audieNCe types (serbia)
Active audience Poten.audience Non-audience Total
Below 25 EUR 15 (18,1%)3,5%
34 (41,0%)6,4%
34 (41,0%)9,4%
83 (100%)6,3%
25 - 50 EUR 31 (16,8%)7,3%
71 (38,4%)13,4%
83 (44,9%)23,1%
185 (100%)14,1%
50 – 100 EUR 80 (20,7%)18,7%
159 (41,2%)30,1%
147 (38,1%)40,8%
386 (100%)29,3%
100 – 250 EUR 218 (42,1%)51,1%
207 (40,9%)39,1%
81 (16,0%)22,5%
506 (100%)38,4%
250 – 500 EUR 66 (52,4%)15,5%
49 (38,9%)9,3%
11 (8,7%)3,1%
126 (100%)9,6%
Over 500 EUR 17 (56,7%)4,0%
9 (30,0%)1,7%
4 (13,3%)1,1%
30 (100%)2,3%
Total 427 (32,4%)100%
529 (40,2%)100%
360 (27,4%)100%
1316 (100%)100%
In Macedonia, not only is the link between monthly income and cultural par-ticipation not statistically significant, but also active and potential audience are recruited from the same groups in terms of income per capita, while differences in income emerge only as opposed to respondents from non-audience (see Table 74B).
table 74b – average MoNtHly iNCoMe per Capita aNd audieNCe types (MaCedoNia)
Active audience Poten.audience Non-audience Total
Below 25 EUR 18 (14,8%)7,8%
41 (33,6%)11,9%
63 (51,6%)23,2%
122 (100%)14,4%
25 - 50 EUR 37 (21,0%)16,1%
70 (39,8%)20,3%
69 (39,2%)25,5%
176 (100%)20,8%
50 – 100 EUR 56 (28,6%)24,3%
71 (36,2%)20,6%
69 (35,2%)25,5%
196 (100%)23,2%
100 – 250 EUR 93 (34,1%)40,4%
126 (46,2%)26,6%
54 (19,8%)19,9%
273 (100%)32,3%
250 – 500 EUR 23 (34,8%)10,0%
30 (45,5%)8,7%
13 (19,7%)4,8%
66 (100%)7,8%
Over 500 EUR 3 (25,0%)1,3%
6 (50,0%)1,7%
3 (25,0%)1,1%
12 (100%)1,4%
Total 230 (27,2%)100%
344 (40,7%)100%
271 (32,1%)100%
845 (100%)100%
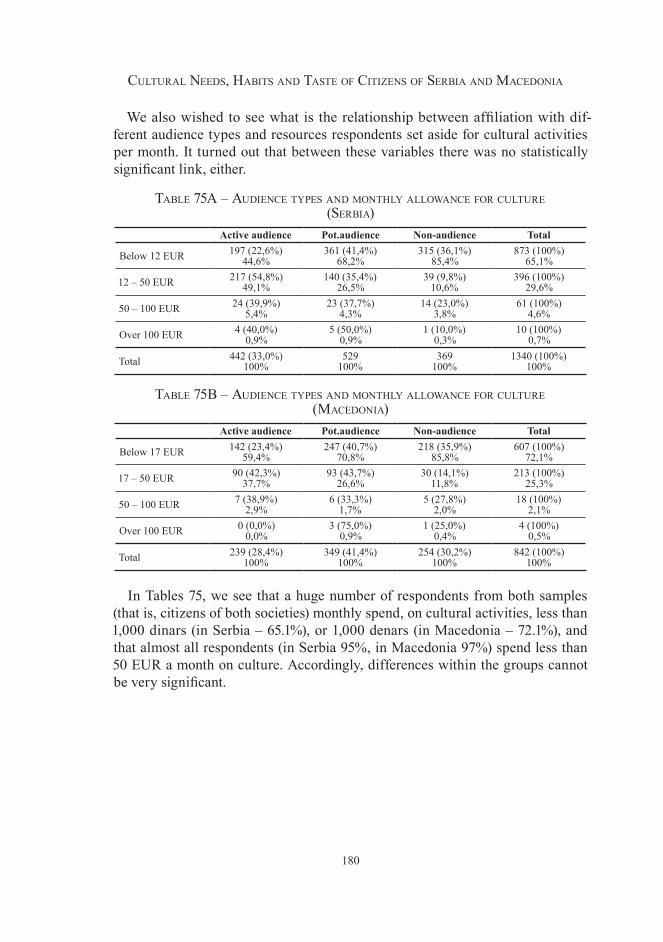
180
Cultural Needs, Habits aNd taste of CitizeNs of serbia aNd MaCedoNia
We also wished to see what is the relationship between affiliation with dif-ferent audience types and resources respondents set aside for cultural activities per month. It turned out that between these variables there was no statistically significant link, either.
table 75a – audieNCe types aNd MoNtHly allowaNCe for Culture (serbia)
Active audience Pot.audience Non-audience Total
Below 12 EUR 197 (22,6%)44,6%
361 (41,4%)68,2%
315 (36,1%)85,4%
873 (100%)65,1%
12 – 50 EUR 217 (54,8%)49,1%
140 (35,4%)26,5%
39 (9,8%)10,6%
396 (100%)29,6%
50 – 100 EUR 24 (39,9%)5,4%
23 (37,7%)4,3%
14 (23,0%)3,8%
61 (100%)4,6%
Over 100 EUR 4 (40,0%)0,9%
5 (50,0%)0,9%
1 (10,0%)0,3%
10 (100%)0,7%
Total 442 (33,0%)100%
529100%
369100%
1340 (100%)100%
table 75b – audieNCe types aNd MoNtHly allowaNCe for Culture (MaCedoNia)
Active audience Pot.audience Non-audience Total
Below 17 EUR 142 (23,4%)59,4%
247 (40,7%)70,8%
218 (35,9%)85,8%
607 (100%)72,1%
17 – 50 EUR 90 (42,3%)37,7%
93 (43,7%)26,6%
30 (14,1%)11,8%
213 (100%)25,3%
50 – 100 EUR 7 (38,9%)2,9%
6 (33,3%)1,7%
5 (27,8%)2,0%
18 (100%)2,1%
Over 100 EUR 0 (0,0%)0,0%
3 (75,0%)0,9%
1 (25,0%)0,4%
4 (100%)0,5%
Total 239 (28,4%)100%
349 (41,4%)100%
254 (30,2%)100%
842 (100%)100%
In Tables 75, we see that a huge number of respondents from both samples (that is, citizens of both societies) monthly spend, on cultural activities, less than 1,000 dinars (in Serbia – 65.1%), or 1,000 denars (in Macedonia – 72.1%), and that almost all respondents (in Serbia 95%, in Macedonia 97%) spend less than 50 EUR a month on culture. Accordingly, differences within the groups cannot be very significant.
181
tHe audieNCe aNd Cultural offer
* * *
Based on all facts stated, we are now in a position to point to some basic regu-larities we have noticed observing the audience in Macedonia and Serbia. First of all, based on the characteristics of the audiences we have analyzed and types of divisions specific to them, we could say that the distinction between “elite” and
“popular” arts is not ungrounded. First, active audience of “popular” arts (film, rock, and folk music152) is significantly bigger than the audiences of “elite” arts. Second, active audience for popular arts is, on average, younger than the active audience of elite arts, which comes from the decisive influence that the generation factor has in the divisions within the audience of “popular” arts. In terms of “elite” arts, this role is taken over by educational and occupational differences. However, these differences are not only milder than in the popular arts, but they also follow a different pattern. In “elite” arts one notices a three-level pyramid which, by the level of participation in different types of audience, clearly distinguishes between respondents with elementary, secondary, and higher education153. In “popular” arts, this borderline is lower and differentiates between respondents with elementary education and farmers and workers (below averagely participating in active and potential audience, and by far above average levels in non-audience)154 and, on the other hand, respondents with secondary and high education (i.e. respondents belonging to middle-class professions and experts, managers, and owners), for whom there are almost no differences in participation in various types of “popular arts” audiences. Fourth, the difference between “elite” and “popular” arts can be seen in the size of “non-audience”. Thus, for instance, two largest non-audiences in Serbia and Macedonia are the non-audience for classical music concerts and that for fine arts exhibitions. In them, there is the highest lack of participation among groups with lower education and groups of farmers and workers – where 80% to 90% of them belong to non-audience155. Finally, in popular arts, there are almost no gender differences in the audience – so, having this in mind, we could perhaps label them “unisex” arts.
As for gender differences in “elite” arts, in almost all audiences analyzed here, women participate in active and potential audience in higher percentages, while 152 Let us be allowed to claim this, contrary to data we presented, at least due to the size of potential audiences of folk music in both Macedonia and Serbia.153 That is respondents by occupational groups, who largely follow up on educational differenc-es: farmers and workers, middle-class profession workers, and experts, managers, and owners. 154 And the other way round in the case of folk music – according to out data at least in potential audience and non-audience.155 The non-audience of modern popular music is rather big too (in both Serbia and Macedonia), but in this case the factor determining who belongs to the audience is that of generation – out of almost one half of the sample (population) making up non-audience, more than three quarters of respondents belong to the under-45 age groups.
182
Cultural Needs, Habits aNd taste of CitizeNs of serbia aNd MaCedoNia
men make up the larger portion of non-audience (although these differences are not major)156. The dominant pattern of generational divisions, in the cultural activities that we have analyzed, is the one which on the one hand distinguishes between respondents under 45 (above average participation in active audience, below av-erage in non-audience) and respondents from the two generation groups over 45 (below average participation in active audience, above average in non-audience). As we find a similar situation in terms of reading audience, which does not entail leaving the house and participating in public events (as other forms of cultural consumption observed here do), we assume that generation influences do not im-ply only the lack of readiness to participate in public cultural events, but also that ageing reduces interest in cultural participation in general (which corresponds to our everyday experience).
Perhaps the most important regularity that we noticed while analyzing individual audiences is that the activity of the audience is proportionate to the educational level and that it lessens with age i.e. that members of active audience are younger and better educated than those in potential audience, and they are in turn younger and better educated than non-audience.157 Here, not only are respondents from almost all active audiences more educated than respondents from potential audi-ence and non-audience, but differences in the education of their parents are even more prominent, which once again supports the thesis of the huge importance of informal education (acquired in one’s family home in the early socialization phase) to cultural participation. On the whole, one may notice that educational and occupational differences are very noticeable in active and non-audiences, while much less prominent in potential audience. Indeed, the best way to observe them is to track different participation of educational and occupational groups in non-audience – among those who are excluded from cultural life.
Having in mind all stated so far and the fact that, viewed by actual job posi-tions taken by respondents158, in active audience we most commonly find experts, managers and owners, pupils and students and (sometimes) civil servants; in po-tential audience, apart from civil servants, also junior managers, small business owners and (sometimes) workers, and in non-audience mostly farmers, workers and supported individuals, one may claim that the statement that differentiation into audience types follows class differences is not ungrounded, either159.
156 These regularities have been noticed in a number of other cultural consumption studies and are usually treated as the “puzzle of female highbrow participation”.157 Exceptions to this rule are the fine arts audience in Serbia and classical music audiences in Serbia and Macedonia (in terms of age) and folk music concert audience (in terms of age and education).158 Which (apart from pupils and students) correspond to classes in Weber’s sense.159 Where civil servants and workers take up intermediate positions in a number of cases – civil servants between active and potential audience, and workers between potential and non-audience.
183
tHe audieNCe aNd Cultural offer
A mechanism securing that such a link is established is that of different early expe-rience with art typical of members of different classes, which in our research turned out to strongly influence the subsequent development of cultural needs and habits in almost all audience types analyzed160. In the case of theatre audience and audience for fine arts we saw this tendency active in the opposite direction, that is, that there are differences among members of different audience types in terms of significance they ascribe to the early acquisition of cultural habits in their own children.
In order not to rely solely on the influence of “objective factors” influencing the cultural participation of our respondents without their will, we also asked re-spondents for reasons which hinder/conditions that would improve their cultural participation. In Serbia, respondents from all audience types took it that lack of money, lack of spare time, and insufficient number of cultural events were decisive reasons lowering the level of their cultural participation. The image is a bit more complex in Macedonia, where differences among audience types are much stronger and where significant prerequisites for more participation are also quality cultural programs and better condition of venues for performances. However, we managed to determine that at least one of these factors – funds available – is not of actual influence. In spite of the subjective belief of citizens of Serbia and Macedonia that insufficient money for cultural activities is an important reason for their absence from cultural life, analysis of our research data has confirmed that there is no direct link between income and cultural participation. In our research the links between these variables are neither strong nor statistically significant (i.e. we cannot claim that differences from our sample actually exist in the population).
Finally, let us conclude this chapter with the statement we will begin the next one with: we expected that territorial differences would have more influence on affili-ation with different types of audience. This has not been supported by our results. Additionally, not only did it turn out there are no territorial differences in cultural participation in cultural activities belonging to private cultural consumption, but there are no differences either in the cultural events representing public cultural consumption – which suggests that presence/absence of cultural infrastructure does not play so significant a role, as one might have expected. Although statistical tests have shown that the link between territorial composition and various audience types is not strong (in some cases not even statistically significant), this does not mean that analysis of individual audiences has not provided insight into differences. Quite obvious are the urban/rural differences in cultural participation in both societies, i.e. the fact that countryside population has a much more modest level of participation than the population from other types of settlements. Also, lower participation in
160 We recall that exceptions are classical music audience (in Macedonia) and folk music audi-ence (in both countries).
184
Cultural Needs, Habits aNd taste of CitizeNs of serbia aNd MaCedoNia
almost all cultural activities was noticeable in Šumadija and Pomoravlje and south and east Serbia (in Serbia), and west Macedonia (in Macedonia).
CULTURAL OFFER
In a series of pseudo-scientific formulae following the research of cultural participa-tion, one postulates that cultural consumption is a product of cultural motivation and cultural abilities, filtered through cultural offer [(motivation x abilities) : cultural offer] = cultural consumption. Since studies of cultural consumption usually take the form of surveys or ethnographic research, i.e. aim at the characteristics of the audience (its motivation, preferences, and abilities), cultural offer is usually left out of such analyses. An ideal method for its incorporation would be to compare territorial organization of various types of audience or various levels of cultural participation with reliable maps providing the composition of cultural institu-tions/organizations and data on the frequency of cultural programs in the given period. In absence of such maps, we asked our respondents to name themselves all institutions available in their place of residence and tell us how many times in the previous 12 months there had been (in their location): a) folk music concerts; b) easy listening concerts; c) rock music concerts; d) jazz music concerts; e) clas-sical music concerts; e) theatre plays; f) evenings of poetry; g) fine arts exhibitions. Finally, for all these types of cultural events, we asked them if they were satisfied with cultural offer in their place of residence161.
It turned out three types of place of residence were discernible in terms of cul-tural institution availability. On the territory of Macedonia and Serbia the most frequently available are libraries and houses of culture (for which 85% respondents in Serbia and 90% respondents in Macedonia state they are available locally). Then follows the group of institutions including the cinema, gallery, theatre and museum (referred to as available in the place of residence by 60% to 75% respondents in both Serbia and Macedonia). Finally, we find institutions of classical music (symphony orchestra, ballet and opera) available to about 15% of respondents in Serbia and 25% to 30% participants from Macedonia.
161 Options available to them to assess the offer of cultural events in their place of residence were: a) I am very satisfied; b) I am mostly satisfied; c) I am neither satisfied nor dissatisfied; d) I am mostly dissatisfied; e) I am not satisfied at all; and f) for my taste, there are too many of them.
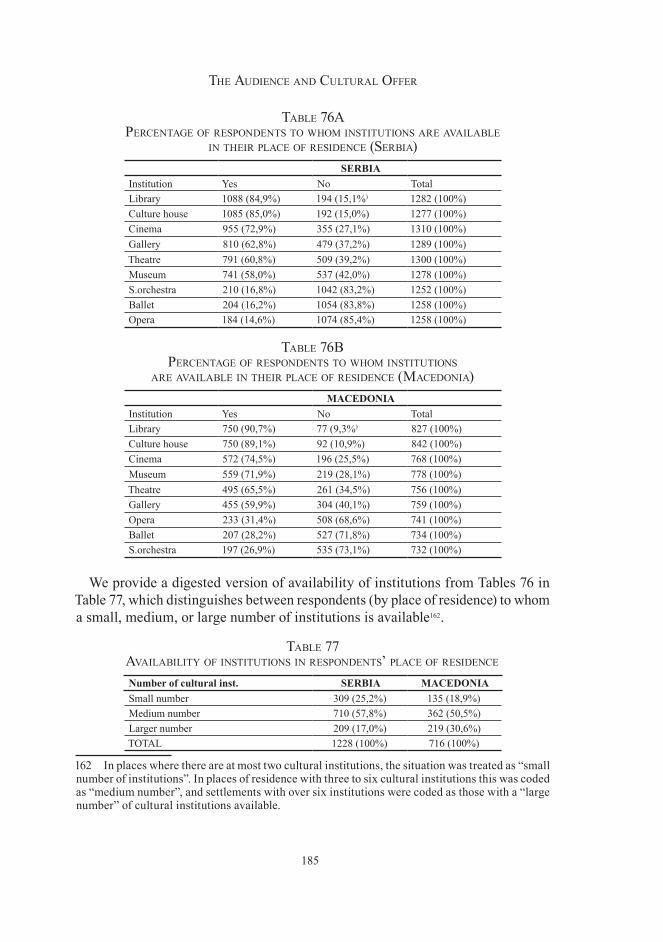
185
tHe audieNCe aNd Cultural offer
table 76a perCeNtage of respoNdeNts to wHoM iNstitutioNs are available
iN tHeir plaCe of resideNCe (serbia)SERBIA
Institution Yes No TotalLibrary 1088 (84,9%) 194 (15,1%) 1282 (100%)Culture house 1085 (85,0%) 192 (15,0%) 1277 (100%)Cinema 955 (72,9%) 355 (27,1%) 1310 (100%)Gallery 810 (62,8%) 479 (37,2%) 1289 (100%)Theatre 791 (60,8%) 509 (39,2%) 1300 (100%)Museum 741 (58,0%) 537 (42,0%) 1278 (100%)S.orchestra 210 (16,8%) 1042 (83,2%) 1252 (100%)Ballet 204 (16,2%) 1054 (83,8%) 1258 (100%)Opera 184 (14,6%) 1074 (85,4%) 1258 (100%)
table 76b perCeNtage of respoNdeNts to wHoM iNstitutioNs
are available iN tHeir plaCe of resideNCe (MaCedoNia)MACEDONIA
Institution Yes No TotalLibrary 750 (90,7%) 77 (9,3%) 827 (100%)Culture house 750 (89,1%) 92 (10,9%) 842 (100%)Cinema 572 (74,5%) 196 (25,5%) 768 (100%)Museum 559 (71,9%) 219 (28,1%) 778 (100%)Theatre 495 (65,5%) 261 (34,5%) 756 (100%)Gallery 455 (59,9%) 304 (40,1%) 759 (100%)Opera 233 (31,4%) 508 (68,6%) 741 (100%)Ballet 207 (28,2%) 527 (71,8%) 734 (100%)S.orchestra 197 (26,9%) 535 (73,1%) 732 (100%)
We provide a digested version of availability of institutions from Tables 76 in Table 77, which distinguishes between respondents (by place of residence) to whom a small, medium, or large number of institutions is available162.
table 77 availability of iNstitutioNs iN respoNdeNts’ plaCe of resideNCe
Number of cultural inst. SERBIA MACEDONIASmall number 309 (25,2%) 135 (18,9%)Medium number 710 (57,8%) 362 (50,5%)Larger number 209 (17,0%) 219 (30,6%)TOTAL 1228 (100%) 716 (100%)
162 In places where there are at most two cultural institutions, the situation was treated as “small number of institutions”. In places of residence with three to six cultural institutions this was coded as “medium number”, and settlements with over six institutions were coded as those with a “large number” of cultural institutions available.
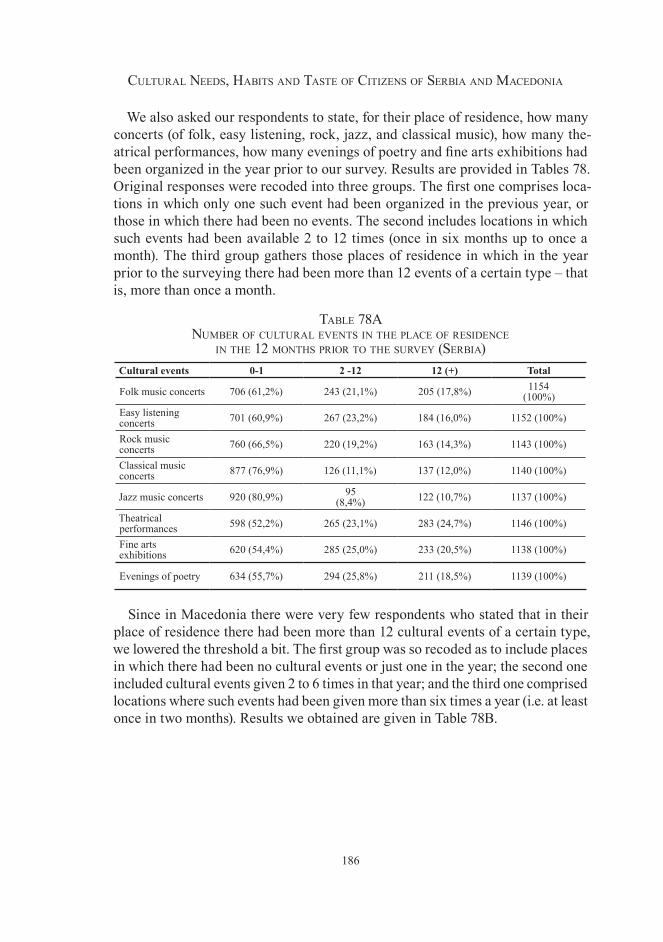
186
Cultural Needs, Habits aNd taste of CitizeNs of serbia aNd MaCedoNia
We also asked our respondents to state, for their place of residence, how many concerts (of folk, easy listening, rock, jazz, and classical music), how many the-atrical performances, how many evenings of poetry and fine arts exhibitions had been organized in the year prior to our survey. Results are provided in Tables 78. Original responses were recoded into three groups. The first one comprises loca-tions in which only one such event had been organized in the previous year, or those in which there had been no events. The second includes locations in which such events had been available 2 to 12 times (once in six months up to once a month). The third group gathers those places of residence in which in the year prior to the surveying there had been more than 12 events of a certain type – that is, more than once a month.
table 78a NuMber of Cultural eveNts iN tHe plaCe of resideNCe
iN tHe 12 MoNtHs prior to tHe survey (serbia)Cultural events 0-1 2 -12 12 (+) Total
Folk music concerts 706 (61,2%) 243 (21,1%) 205 (17,8%) 1154 (100%)
Easy listening concerts 701 (60,9%) 267 (23,2%) 184 (16,0%) 1152 (100%)
Rock music concerts 760 (66,5%) 220 (19,2%) 163 (14,3%) 1143 (100%)
Classical music concerts 877 (76,9%) 126 (11,1%) 137 (12,0%) 1140 (100%)
Jazz music concerts 920 (80,9%) 95 (8,4%) 122 (10,7%) 1137 (100%)
Theatrical performances 598 (52,2%) 265 (23,1%) 283 (24,7%) 1146 (100%)
Fine arts exhibitions 620 (54,4%) 285 (25,0%) 233 (20,5%) 1138 (100%)
Evenings of poetry 634 (55,7%) 294 (25,8%) 211 (18,5%) 1139 (100%)
Since in Macedonia there were very few respondents who stated that in their place of residence there had been more than 12 cultural events of a certain type, we lowered the threshold a bit. The first group was so recoded as to include places in which there had been no cultural events or just one in the year; the second one included cultural events given 2 to 6 times in that year; and the third one comprised locations where such events had been given more than six times a year (i.e. at least once in two months). Results we obtained are given in Table 78B.
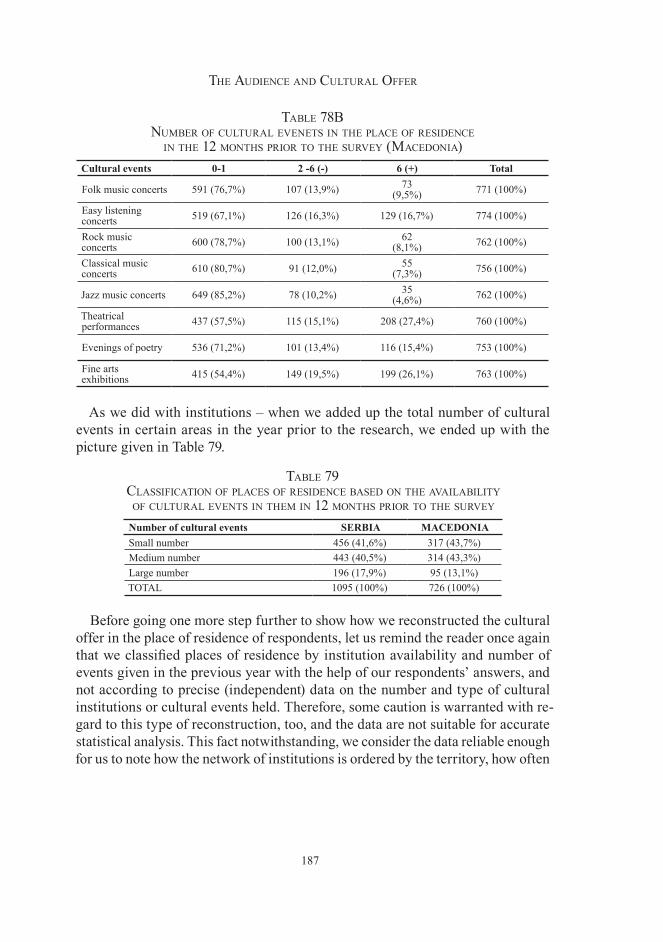
187
tHe audieNCe aNd Cultural offer
table 78b NuMber of Cultural eveNets iN tHe plaCe of resideNCe
iN tHe 12 MoNtHs prior to tHe survey (MaCedoNia)Cultural events 0-1 2 -6 (-) 6 (+) Total
Folk music concerts 591 (76,7%) 107 (13,9%) 73 (9,5%) 771 (100%)
Easy listening concerts 519 (67,1%) 126 (16,3%) 129 (16,7%) 774 (100%)
Rock music concerts 600 (78,7%) 100 (13,1%) 62
(8,1%) 762 (100%)
Classical music concerts 610 (80,7%) 91 (12,0%) 55
(7,3%) 756 (100%)
Jazz music concerts 649 (85,2%) 78 (10,2%) 35 (4,6%) 762 (100%)
Theatrical performances 437 (57,5%) 115 (15,1%) 208 (27,4%) 760 (100%)
Evenings of poetry 536 (71,2%) 101 (13,4%) 116 (15,4%) 753 (100%)
Fine arts exhibitions 415 (54,4%) 149 (19,5%) 199 (26,1%) 763 (100%)
As we did with institutions – when we added up the total number of cultural events in certain areas in the year prior to the research, we ended up with the picture given in Table 79.
table 79 ClassifiCatioN of plaCes of resideNCe based oN tHe availability
of Cultural eveNts iN tHeM iN 12 MoNtHs prior to tHe survey
Number of cultural events SERBIA MACEDONIASmall number 456 (41,6%) 317 (43,7%)Medium number 443 (40,5%) 314 (43,3%)Large number 196 (17,9%) 95 (13,1%)TOTAL 1095 (100%) 726 (100%)
Before going one more step further to show how we reconstructed the cultural offer in the place of residence of respondents, let us remind the reader once again that we classified places of residence by institution availability and number of events given in the previous year with the help of our respondents’ answers, and not according to precise (independent) data on the number and type of cultural institutions or cultural events held. Therefore, some caution is warranted with re-gard to this type of reconstruction, too, and the data are not suitable for accurate statistical analysis. This fact notwithstanding, we consider the data reliable enough for us to note how the network of institutions is ordered by the territory, how often
188
Cultural Needs, Habits aNd taste of CitizeNs of serbia aNd MaCedoNia
respondents from certain types of settlements have the chance to participate in cultural events, and, what the cultural offer in them is like163.
Among other issues also to test the accuracy of our respondents’ replies, in the reconstruction of cultural offer we crosstabulated the data on the number of cultural institutions and the data on the number of cultural events given. We wanted to observe and correct any extremes (e.g. it is not likely that in environments with a small number of institutions a large number of cultural events will be organized, and the other way round). Thus, we decided to observe the territorial composition of cultural offer with regard to this, more balanced picture. The data we acquired are given in Table 80.
table 80 Cultural offer iN serbia aNd MaCedoNia
Cultural offer SERBIA MACEDONIAPoor cultural offer 422 (41,4%) 207 (34,7%)Average cultural offer 438 (42,9%) 301 (50,5%)Good cultural offer 160 (15,7%) 88 (14,8%)TOTAL 1020 (100%) 596 (100%)
Moreover, in order to present the territorial makeup of respondents as accurately as possible, we crosstabulated the data on the size of place of residence (the capital, cities over 100,000, towns, and villages) with data on regions in Macedonia (north, south, east, west) and Serbia (Belgrade, Vojvodina, Šumadija and Pomoravlje, Sandžak, and south and east Serbia). We thus identified twelve types of territorial units in Serbia and ten types of such units in Macedonia.
When observing the availability of cultural institutions with regard to these, more balanced territorial maps of Macedonia and Serbia, it turned out that small numbers of cultural institutions are typical only of the villages (in all regions), that the average number of cultural institutions is typical of small towns in all regions, but also of some large cities in south and east Serbia and Šumadija and Pomoravlje. Large numbers of cultural institutions are reported by respondents from Belgrade, Novi Sad, and Niš. In Macedonia, the situation is somewhat dif-ferent. A small number of cultural institutions is largely reported by respondents from all villages, but also those from cities in west Macedonia (Tetovo) and towns in east Macedonia. Apart from respondents from smaller towns in all regions, an average number of institutions is mentioned by participants from cities of north Macedonia (Kumanovo). Many cultural institutions are listed by participants from Skopje and major cities in south Macedonia (Bitola and Ohrid).
Moreover, in terms of cultural events available one year prior to the survey, we notice that few cultural events are typically reported by respondents from the coun-163 We actually assumed that most respondents knew which cultural institutions were available in their place of residence, and also assumed they would be able to assess whether cultural events occur in their place of residence once a month, once in six months, or once a year.
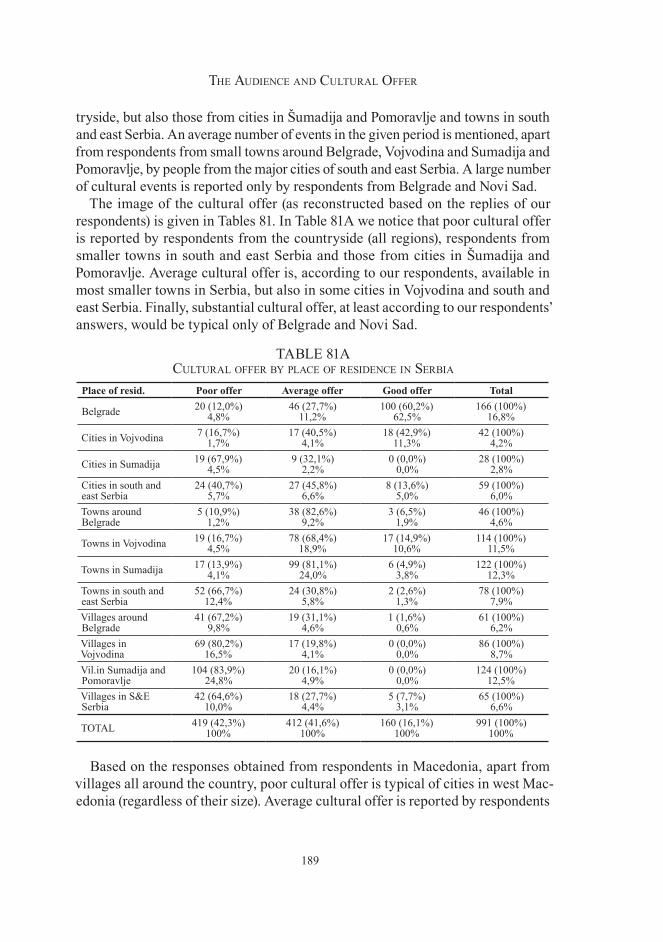
189
tHe audieNCe aNd Cultural offer
tryside, but also those from cities in Šumadija and Pomoravlje and towns in south and east Serbia. An average number of events in the given period is mentioned, apart from respondents from small towns around Belgrade, Vojvodina and Sumadija and Pomoravlje, by people from the major cities of south and east Serbia. A large number of cultural events is reported only by respondents from Belgrade and Novi Sad.
The image of the cultural offer (as reconstructed based on the replies of our respondents) is given in Tables 81. In Table 81A we notice that poor cultural offer is reported by respondents from the countryside (all regions), respondents from smaller towns in south and east Serbia and those from cities in Šumadija and Pomoravlje. Average cultural offer is, according to our respondents, available in most smaller towns in Serbia, but also in some cities in Vojvodina and south and east Serbia. Finally, substantial cultural offer, at least according to our respondents’ answers, would be typical only of Belgrade and Novi Sad.
table 81a Cultural offer by plaCe of resideNCe iN serbia
Place of resid. Poor offer Average offer Good offer Total
Belgrade 20 (12,0%)4,8%
46 (27,7%)11,2%
100 (60,2%)62,5%
166 (100%)16,8%
Cities in Vojvodina 7 (16,7%)1,7%
17 (40,5%)4,1%
18 (42,9%)11,3%
42 (100%) 4,2%
Cities in Sumadija 19 (67,9%)4,5%
9 (32,1%)2,2%
0 (0,0%)0,0%
28 (100%)2,8%
Cities in south and east Serbia
24 (40,7%)5,7%
27 (45,8%)6,6%
8 (13,6%)5,0%
59 (100%)6,0%
Towns around Belgrade
5 (10,9%)1,2%
38 (82,6%)9,2%
3 (6,5%)1,9%
46 (100%)4,6%
Towns in Vojvodina 19 (16,7%)4,5%
78 (68,4%)18,9%
17 (14,9%)10,6%
114 (100%)11,5%
Towns in Sumadija 17 (13,9%)4,1%
99 (81,1%)24,0%
6 (4,9%)3,8%
122 (100%)12,3%
Towns in south and east Serbia
52 (66,7%)12,4%
24 (30,8%)5,8%
2 (2,6%)1,3%
78 (100%)7,9%
Villages around Belgrade
41 (67,2%)9,8%
19 (31,1%)4,6%
1 (1,6%)0,6%
61 (100%)6,2%
Villages in Vojvodina
69 (80,2%)16,5%
17 (19,8%)4,1%
0 (0,0%)0,0%
86 (100%)8,7%
Vil.in Sumadija and Pomoravlje
104 (83,9%)24,8%
20 (16,1%)4,9%
0 (0,0%)0,0%
124 (100%)12,5%
Villages in S&E Serbia
42 (64,6%)10,0%
18 (27,7%)4,4%
5 (7,7%)3,1%
65 (100%)6,6%
TOTAL 419 (42,3%)100%
412 (41,6%)100%
160 (16,1%)100%
991 (100%)100%
Based on the responses obtained from respondents in Macedonia, apart from villages all around the country, poor cultural offer is typical of cities in west Mac-edonia (regardless of their size). Average cultural offer is reported by respondents
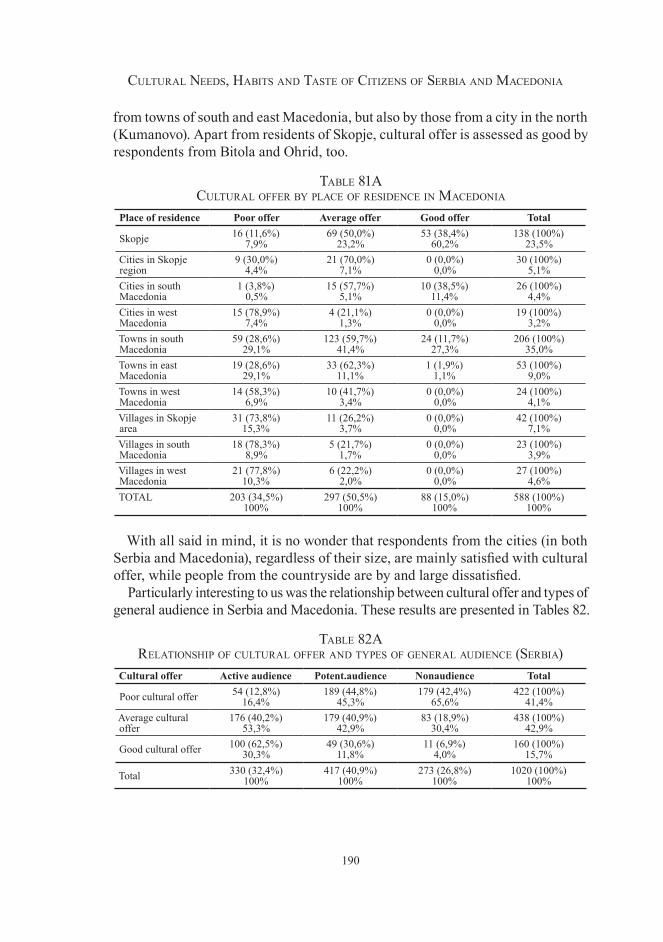
190
Cultural Needs, Habits aNd taste of CitizeNs of serbia aNd MaCedoNia
from towns of south and east Macedonia, but also by those from a city in the north (Kumanovo). Apart from residents of Skopje, cultural offer is assessed as good by respondents from Bitola and Ohrid, too.
table 81a Cultural offer by plaCe of resideNCe iN MaCedoNia
Place of residence Poor offer Average offer Good offer Total
Skopje 16 (11,6%)7,9%
69 (50,0%)23,2%
53 (38,4%)60,2%
138 (100%)23,5%
Cities in Skopje region
9 (30,0%)4,4%
21 (70,0%)7,1%
0 (0,0%)0,0%
30 (100%)5,1%
Cities in south Macedonia
1 (3,8%)0,5%
15 (57,7%)5,1%
10 (38,5%)11,4%
26 (100%)4,4%
Cities in west Macedonia
15 (78,9%)7,4%
4 (21,1%)1,3%
0 (0,0%)0,0%
19 (100%)3,2%
Towns in south Macedonia
59 (28,6%)29,1%
123 (59,7%)41,4%
24 (11,7%)27,3%
206 (100%)35,0%
Towns in east Macedonia
19 (28,6%)29,1%
33 (62,3%)11,1%
1 (1,9%)1,1%
53 (100%)9,0%
Towns in west Macedonia
14 (58,3%)6,9%
10 (41,7%)3,4%
0 (0,0%)0,0%
24 (100%)4,1%
Villages in Skopje area
31 (73,8%)15,3%
11 (26,2%)3,7%
0 (0,0%)0,0%
42 (100%)7,1%
Villages in south Macedonia
18 (78,3%)8,9%
5 (21,7%)1,7%
0 (0,0%)0,0%
23 (100%)3,9%
Villages in west Macedonia
21 (77,8%)10,3%
6 (22,2%)2,0%
0 (0,0%)0,0%
27 (100%)4,6%
TOTAL 203 (34,5%)100%
297 (50,5%)100%
88 (15,0%)100%
588 (100%)100%
With all said in mind, it is no wonder that respondents from the cities (in both Serbia and Macedonia), regardless of their size, are mainly satisfied with cultural offer, while people from the countryside are by and large dissatisfied.
Particularly interesting to us was the relationship between cultural offer and types of general audience in Serbia and Macedonia. These results are presented in Tables 82.
table 82a relatioNsHip of Cultural offer aNd types of geNeral audieNCe (serbia)
Cultural offer Active audience Potent.audience Nonaudience Total
Poor cultural offer 54 (12,8%)16,4%
189 (44,8%)45,3%
179 (42,4%)65,6%
422 (100%)41,4%
Average cultural offer
176 (40,2%)53,3%
179 (40,9%)42,9%
83 (18,9%)30,4%
438 (100%)42,9%
Good cultural offer 100 (62,5%)30,3%
49 (30,6%)11,8%
11 (6,9%)4,0%
160 (100%)15,7%
Total 330 (32,4%)100%
417 (40,9%)100%
273 (26,8%)100%
1020 (100%)100%
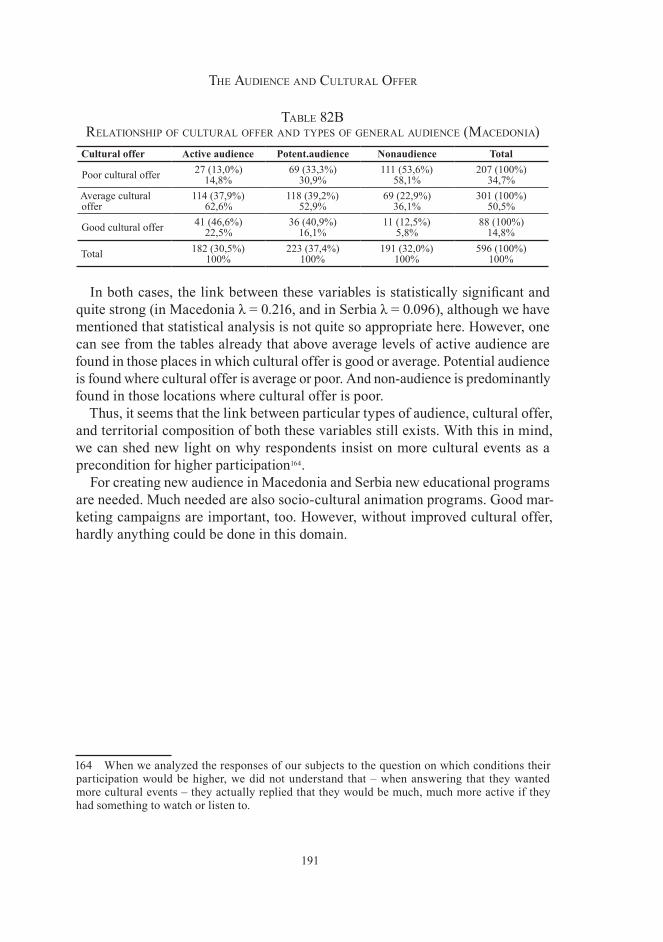
191
tHe audieNCe aNd Cultural offer
table 82b relatioNsHip of Cultural offer aNd types of geNeral audieNCe (MaCedoNia)
Cultural offer Active audience Potent.audience Nonaudience Total
Poor cultural offer 27 (13,0%)14,8%
69 (33,3%)30,9%
111 (53,6%)58,1%
207 (100%)34,7%
Average cultural offer
114 (37,9%)62,6%
118 (39,2%)52,9%
69 (22,9%)36,1%
301 (100%)50,5%
Good cultural offer 41 (46,6%)22,5%
36 (40,9%)16,1%
11 (12,5%)5,8%
88 (100%)14,8%
Total 182 (30,5%)100%
223 (37,4%)100%
191 (32,0%)100%
596 (100%)100%
In both cases, the link between these variables is statistically significant and quite strong (in Macedonia λ = 0.216, and in Serbia λ = 0.096), although we have mentioned that statistical analysis is not quite so appropriate here. However, one can see from the tables already that above average levels of active audience are found in those places in which cultural offer is good or average. Potential audience is found where cultural offer is average or poor. And non-audience is predominantly found in those locations where cultural offer is poor.
Thus, it seems that the link between particular types of audience, cultural offer, and territorial composition of both these variables still exists. With this in mind, we can shed new light on why respondents insist on more cultural events as a precondition for higher participation164.
For creating new audience in Macedonia and Serbia new educational programs are needed. Much needed are also socio-cultural animation programs. Good mar-keting campaigns are important, too. However, without improved cultural offer, hardly anything could be done in this domain.
164 When we analyzed the responses of our subjects to the question on which conditions their participation would be higher, we did not understand that – when answering that they wanted more cultural events – they actually replied that they would be much, much more active if they had something to watch or listen to.
192
Tastes and Discourses
Cultural consumption does not only assume two forms – those we labelled cultural consumption in the private domain (e.g. reading books, listening to
music, or watching DVDs) and cultural consumption in the public sphere (e.g. at-tending concerts, going to cinemas, theatres). It also has two aspects. So far, we have mainly covered the first (quantitative) aspect of cultural consumption – how often respondents, i.e. the population of Serbia and Macedonia, visit cultural events, watch certain TV programmes, read books, papers and journals, listen to music. The second (qualitative) aspect of cultural consumption – what it is that respondents choose and prefer among cultural products – usually called taste, is the topic of this chapter.
Colloquially, taste is defined as the ability to assess the beautiful165, and in this type of research it is most commonly operationalized in two ways: a) through verbally expressed assessment of concrete works of art or verbally expressed prefer-ence for certain art genres; or b) through behaviour – cultural activities – visits to a certain type of cultural events (e.g. rock or classical music concerts), watching films of certain genres, reading books of certain authors, etc. We find the first type of taste operationalization in Bourdieu (1979), Peterson (1992) and Bethany Bryson (1996). The other operationalization, however, that uses behaviour as an expression of preferences – is more common in contemporary studies [(A.Vander Stichele and R.Laermans: 2006), (Tak Wing Chan and John H. Goldthorpe: 2006), (Jordi Lopes-Sintas and Tally Katz-Gerro: 2005), (Tally Katz-Gerro: 2002), (van Eijck: 2001), (van Eijck: 1999), (van Rees at al: 1999)]. We should only add here that in studying taste, apart from questions on preferences, one often finds questions on the knowledge respondents have on a particular art, genres, artists. These are mostly used as control questions in reconstructing taste types, but we will see that there are also cases in which the issues of preferences and knowledge intertwine, leaving some room for misunderstandings.
Before turning to the presentation of the typology of taste we have used and results we have got in our research, let us point to only a few relevant moments in the sociological understanding of taste in the second half of the 20th century, because solutions we have used can only be understood against these theoretical foundations.
165 In the most famous philosophical tradition which studies taste, that of Kant, which is rel-evant for us here among other things because Bourdieu bases his own (sociological) conception on contrasting Kant’s view, taste is defined as: “Taste is the ability to judge an object, or a way of presenting it, by means of a liking or disliking devoid of all interest.” (I.Kant, Critique of Judg-ment, BIGZ, Belgrade, 1991 pp. 102.)
193
tastes aNd disCourses
20th Century Sociological Conceptions on Taste
Differentiation between the levels of culture, recipients of culture and taste is not a modern invention. The classification of culture, its recipients and their tastes into the culture of the elite and people’s (folk) culture originated in the very origins of civilization with the detachment of cultural elites. However, the study of character-istics of various layers of culture and their audiences is something that came into the focus of scientific explorations with the advent of mass society, and especially with the expansion of the mass media in the second half of the 20th century. In this period the criticism of mass culture, which also had its proponents throughout 19th century, reached its peak. Authors such as Dwight Macdonald and Harold Rosenborg clearly divide art into elite art (avantgarde) and massive, commercial art (kitsch), followed by the domination of the principle of the (smallest) common denominator in production and homogenization of taste in reception. Although the first conception of three levels of culture recipients as a grounds to classify culture can be found in early 20th century (1915) in the book “America’s Coming of Age” by Van Wyck Brooks166, it also came into accepted use following the book by Russell Lynes ”The Taste Makers” (1954). The same goes for the terms Highbrow, Middlebrow and Lowbrow, which Lynes used for these layers of culture and taste. We find similar segmentations in the papers of Clement Greenberg167, who devised a three-part classification of works of art and their corresponding tastes. On this view, only avantgarde art represents the culture which bears artistic values. On the one hand, it is opposed by academism (traditional art) and on the other, there is kitsch (a synonym for mass culture)168; akin to this is the work of Edward Shils169, who also discusses three levels of culture (refined, average, and brutal culture).
In spite of the subtlety and complexity of Bourdieu’s conception, his view of three taste zones: 1) legitimate taste, i.e. preference for artworks of elite culture; 2) average taste, preference for lesser important works of legitimate arts and best works of popular arts, and 3) popular taste, whose representatives are prone to works of legitimate arts that have lost their prestige in the popularization process and works of popular art which have no artistic merit, basically remains a variant of this three-layer typology.166 Van Wyck Brooks, America’s Coming of Age, Amerion Ltd, 1992 (1915). 167 Clement Greenberg, Avant-Gard and Kitch, Partisan Review, 1947168 In our local (Serbian and Macedonian) literature, we find a similar taste typology, however without emotional undertone, with Sreten Petrović, who discusses avantgarde, traditionalist and conformist tastes as types of modern taste (see S. Petrović, Estetika i Sociologija, Uvod u soci-ologiju umetnosti (Aesthetics and Sociology, An Introduction into the Sociology of Art), Privredni pregled, Belgrade, 1984; and S. Petrović (ed.), Recepcija umetnosti, Istraživanje tipova ukusa beogradskih studenata (Art Reception: a Research of Types of Taste of Belgrade Students), Faculty of Philology Belgrade, Belgrade, 1996) 169 Edward Shils: Mass society and its culture. u: Norman Jacobs (ed): Culture for the Millions? Princeton, 1961.
194
Cultural Needs, Habits aNd taste of CitizeNs of serbia aNd MaCedoNia
The position of Herbert Gans, laid out in the study “Popular Culture and Elite Culture” (1974) was devised as a challenge to the conception of a homogenous mass art (and taste), where this art is seen as nothing but a purely commercial endeavour (whose side product is that the audience is made more stupid and its taste spoiled)170. Quite the contrary, Gans claimed that the dichotomous view of an elite and a massive taste was far too simple, and he suggested a typology with five taste cultures and five taste audiences, that he called high culture, upper-middle culture, lower-middle culture, low culture, and quasi-folklore low taste culture. On the other hand, in his view, all taste cultures are based on certain values and aesthetic standards and all of them (and not just the high taste culture) use these (different) standards in their choices. One can thus say that – if viewed having in mind the needs of corresponding groups in the audience – taste cultures are not better or worse than one another, but are simply different171.
The next important moment in the sociological taste typologies was the afore-mentioned conception of Richard Peterson and his collaborators on omnivores and univores. In his papers of the early nineties, Peterson defined a conception claiming that the range of leisure time used for cultural activities and diversity of cultural choices today emerge as the main difference between status groups. Cultural elite of our time no longer claims its excellence by high taste and exclusive (“snobbish”) activities, but by acquaintedness with and consumption of all other art forms (mass art included) and a more prominent participation in the most diverse leisure time activi-ties. If this heterogeneity of elite taste is best reflected by the term “omnivores”, then its contrast should be found in the groups whose members have a low social status, a very narrow range of cultural activities and a relatively homogeneous (one-way) taste. In their 1992 paper, Peterson and Simkus labelled these people “univores”.
Contrary to Bourdieu and Gans, whose conceptions (just like the elite and mass culture theory) presuppose a congruence between social and cultural stratifications, i.e. correlation between affiliation with certain social statuses/classes and types of taste, Peterson postulates that the relationship between status structure and taste structure can be represented as the relationship of two pyramids (one that looks like the usual pyramid, and one that is turned upside down). The normal pyramid (its
170 In local literature (Serbian and Macedonian), a view challenging the traditional conception of homogenuous mass culture and homogenuous mass taste could be found in the conception of Milena Dragicević-Šešić, given in the text: An Attempt to Define Dominant and Productive Mod-els of Cultural Life in Yugoslavia, in: Subcultures I, IIS SSO Serbia, Belgrade, 1985.171 In spite of the fact Gans had for his explicit purpose to defy the conception of the dichoto-mous division into elite and (homogenuous) mass culture, his theory is today often criticized as a branch of elitistic conceptions (albeit not a dogmatic one). According to his critics, this is seen in the fact Gans claimed higher cultures were better, or at least more comprehensive and informative, than the lower ones (if viewed independently of their corresponding taste types, which, accord-ing to Gans, should not be done in practical cultural policy). In addition to this (again, in critics’ words) Gans linked his taste cultures too crudely with the classes in the American society.
195
tastes aNd disCourses
top up) is a metaphor that, according to Peterson, best embodies cultural stratifica-tion. On its top there is elite culture, with more and more alternative forms on the same level as we go down the taste pyramid. On the other hand the ‘upside-down’ pyramid (representing concrete groups and individuals) is a metaphor of status structure in which the highest status (in this aspect) is vouched by those who, de-pending on the situation, can communicate with cultural products from various levels of culture (whom he calls omnivores), while the lowest status is reserved for those who are able to communicate only with certain types of art products or art genres (whom he labels univores).
Although it does not entail a, so to speak, direct, one-to-one relationship between elite social groups (classes or groups in terms of social status) and elite tastes, this conception still assumes that, between affiliation with different levels of social stratification and acquisition and practice of certain taste types, there is a clear link. In his more recent work, Peterson defends the position on there being two types of omnivores (higher and lower omnivores) and two types of univores (higher and lower univores). That way, this conception comes closer to the results of empirical research in the last ten years, but also loses its edge, as it practically melts into those conceptions which claim that in the post-modern, globalized world the link between social and cultural stratification is lost, where tastes, or cultural styles and lifestyles are a matter of free choice and, as such, much more important social markers than traditional indicators of social position (such as class, race, nation, religious community, etc.)
Let us only add here the study of three present-day Australian authors – Tony Bennett, Michael Emmison and John Frow, “Accounting for Taste – Australian Everyday Cultures” 172. In this study, documented in great detail, and based on the results of the research “Australian Everyday Cultures” by the three authors, among other aspects of everyday culture173, social distribution of types of musical tastes in Australia is analyzed. Through factorial analysis of favourite and least favourite musical genres of respondents, the authors singled out six factors. Apart from those respondents whose preferences are assignable to the three-degree classification of Highbrow, Middlebrow, and Lowbrow tastes, by determining omnivorous respond-ents as those who have a liability to genres belonging to various cultural levels, the authors have noticed that there is not just one, but three types of omnivores. They labelled these “highbrow omnivores”, “lowbrow omnivores” and “ideally-typical
172 Tony Bennett, Michael Emmmison, John Frow, Accounting for Tastes – Australian Every-day Cultures“, Cambridge University Press, 1999. The title is a pun based on the proverb “There is no accounting for tastes”. 173 The book discusses ways of spending leisure time, culture at the participants’ job position, ways they do interior design in their homes, their media culture, care of their own body, phe-nomena related to reading, musical tastes, and internationalization/Americanization of everyday culture in Australia.
196
Cultural Needs, Habits aNd taste of CitizeNs of serbia aNd MaCedoNia
omnivores”. Highbrow or elite omnivores prefer elite musical genres (classical music and opera), but also sometimes like some works of “lower” cultures. Contrary to this, “lowbrow omnivores” prefer musical genres from the popular domain (folk, bluegrass, rock and blues) and still some works of highbrow culture. Finally, “ide-ally-typical omnivores” mix up the works from all musical genres with no limita-tions, i.e. without any dominant preferences for any of the three levels of culture. Research results have shown that “highbrow omnivores” are as rare as representa-tives of “pure” elite taste. In Australia, they made up only 1% of more than 2,700 respondents from the sample. On the other hand, respondents from the group defined as “lowbrow omnivores” comprised one quarter of the sample (25.5%), and those labelled “ideally-typical omnivores” participated with 8.3%.
Possibly the most important insight of these Australian researchers pertains to the role that knowledge of art, art genres and artists plays in the reconstruction of taste types. They noticed that Bourdieu was unaware of this problem in his work, and that Peterson, in his omnivore conception, actually merged these two aspects into one, opening up a serious problem for the interpretation of results. In the text
“Understanding Audience Segmentation: from Elite and Mass to Omnivores and Univores”174 Peterson states that the “the elaborated musical taste code of the omni-vore member of the elite can acclaim classical music and yet, in the proper context, show passing knowledge of a wide range of musical forms” (p. 255, emphasis added). According to Bennett et al, this only shows that, after Peterson, omnivores also know other (art) forms, but the question remains (and Peterson fails to discuss it), whether they actually like them. Based on their own research, showing that not only “lowbrow omnivores” but also “ideally-typical omnivores” cannot be found among elite social layers, and that, based on preferences, “univores” can be found both at the bottom (as expected by Peterson) and at the top of social stratification scale (which is not forseen in his conception), these authors conclude that the is-sue of omnivore taste (in Peterson’s sense) can relate to the knowledge of the wide variety of musical (art) forms, rather than the affinity to these forms.
Discourses and Schemas
In the text “What is good music”175, which, slightly adapted, appeared as the second chapter of the book “Performing Rites”176, Simon Frith shows that disputes over 174 The already quoted text: Richard A. Peterson “Understanding audience segmentation: From elite and mass to omnivore and univore”. Poetics 21, p. 243-258, 1992.175 As already quoted: “What is Good Music”, Canadian University Music Review, Vol. 10, 1990, p.92–102.176 Simon Frith, Performing Rites: Evaluating Popular Music, Oxford University Press, Ox-ford, 1998.
197
tastes aNd disCourses
taste are actually not disputes over concrete musical (art) works, but disputes over what should be valued in music (art)177. Therefore, discussion should be aimed at the discourses that provide meanings to value terms. Frith based his conception on the thesis of Howard Becker, claiming that, in order to understand art objects and people’s responses to them, we have to understand institutional and discursive proc-esses (the art world) in which they are constructed as works of art, and in relation with which a certain type of aesthetic reactions is considered socially appropriate; and also on the view of Pierre Bourdieu that affiliation with particular worlds of art is primarily a reflection of the amount (and type) of cultural capital people posses, so that reactions of the audience can be understood only through understanding social organization of taste in a society. Having these two complementary ap-proaches in mind, Frith states that contemporary music (and, more broadly, art) is today viewed through three overlapping and contradictory frameworks, that he calls art discourse, folklore discourse, and pop discourse178.
Art discourse is built in the framework of the world of classical or art music and nineteenth century high culture. The key institution of art discourse is the academy, and the key relationship in this artistic world is that of the teacher and the pupil179, based on the assumption that musicians need to go through the phase of “apprentice-ship” and advance through a series of pre-defined phases, so as to finally become qualified to play. At the same time, the role of the academy is to institutionalize proper ways of approaching music, since in this discourse it goes without saying that for cultural consumption, too, education is needed. The assumption is that only those who develop appropriate interpretive abilities can experience the deep meaning of great music. The world of classical music is strictly hierarchical: in it, one can clearly set boundaries between the composer and the performer, and the performers and their audience. The central event of this world of art – the concert
– is represented as a transcendent experience, which is suggested and encouraged through a series of conventions: the obligation to listen with respect, in silence; the seclusion of rooms for satisfying bodily needs (toilets, bars, wardrobes) from the room in which the musical event is taking place; by using the stage and lights to clearly divide the artist from the audience180.
177 Frith’s conception and examples relate to musical discourses and musical worlds of art, but, by analogy, they can be extended to other artworlds, as well.178 In his view, as is the case with all other discursive practices, musical discourses have to be viewed as effects of specific historical situations, and they should be related to changes in the cul-tural domain stemming from the advancement of industrial capitalism as of 19th century.179 In the world of classical music, students, as a rule, list as their references those people they once studied at. On the other hand, in the world of jazz, one gets reputation through whom one used to play with.180 Frith points out how much, for instance, the conventions of jazz performances differ from classical concerts: from having drinks, scatting, to applauding during the play, all the way to ask-ing musicians to play certain tunes.
198
Cultural Needs, Habits aNd taste of CitizeNs of serbia aNd MaCedoNia
The source of folklore discourse is folklore musical world. In it, there is no dis-tinction between art and life and enjoying music is directly related to enjoying its social functions. As in the world of classical art, the ideals of folklore arts turn to tradition, but, contrary to the classical world, the accent is not on the accumulation of knowledge, but on the “purity” and genuine (traditional) way of doing things. The values of the folklore world are the natural, spontaneous, and direct. However, Frith insists that these can be put to practice only due to a “careful construction of informality”, which poses requirements to both the performers and the audience and directs their behaviour a certain way. It is the destruction of glamour that is consciously aimed at in the folklore world. On the part of the performer, folklore conventions require that they avoid behaviour typical of pop singers, i.e. showy movement on the stage and their own stylized presentation. Conventions require a minimisation of differences between the performers and the audience and their unification into a romanticized community participating in the joint musical crea-tion. A way to view folklore discourse is to interpret it as a criticism of the (com-mercialized) everyday life, so that folklore music rituals in the key institutions of this world – the club and festivals – can be viewed from that point of view, too. For this reason, folk festivals are organized not in the form of one grandiose stage, but rather with a series of small stages with direct contact between the performer and the audience. In them, it is also almost obligatory that stars be friendly with the audience (sometimes have a drink or two together). This integration of life and art accounts for another evaluative criterion of the folklore world – music is judged by its direct contribution to socialness.
The source of popular discourse is the world of commercial music. Its values have been created by the music industry and are organized around this industry’s goals. In this world, a musical value and commercial value are equalized, so that success in the charts is treated both as a measure and as a symbol of good pop music. The world of popular music also has its key institutions and rituals fol-lowing them – promo concerts and discotheques – which, in Frith’s words, offer a specific kind of routine transcendence. They produce and sell “entertainment” which, on the one hand, represents an escape from daily obligations (which makes it attractive) and, on the other, is integrated in the rhythms of daily life (job and game, production and consumption).
As we mentioned in the introduction, similarly to Simon Frith, the German sociologist Gerhard Schulze, in his work Die Erlebnisgesselschaft identified three schemes representing a basis for shaping cultural preferences that he labels “the high culture scheme”, “the trivial scheme” and “the excitement scheme”. Like Frith’s art discourse, the high culture scheme entails a difference between art and life – art relates to the sublime, spiritual, and absolute. According to this scheme, art is not only to enjoy, but to learn, and a typical form of audience behaviour is
199
tastes aNd disCourses
that of restraint, where all concentration is put on what the performers are doing. In the trivial scheme (folklore discourse) life and art are less separated. The most important thing in it are authenticity and social function of art. The audience is allowed to participate in the performance by clapping and shouting, which con-tributes to a more relaxed atmosphere. In this art, traditional, folklore values are expressed, and the audience does not ask from it intellectual and spiritual elevation, but security – through conformism. Frith’s popular discourse is akin to Schulze’s excitement scheme, which is historically the youngest and characterized by the commerciality and fun, whose primary role is that of escapism. Enjoying this art is a bodily activity – dance, laugh, unconventional behaviour – especially in the case of music.
Schulze also identifies members of the audience crossing traditional borders of art patterns, i.e. those belonging to more than one scheme. In his words, these are young, well-educated, socially-ascending, mobile individuals belonging to the new middle class, whose lifestyle can be labelled “postmodern”. Their cultural consumption patterns include leisure time cultural choices and activities which are traditionally taken to be unmatchable – visits to luna parks and museums, listening to classical and pop music. According to Schulze, members of these groups combine classical, pop music and jazz, but do not include in their choices that music which belongs to the trivial scheme, or folk discourse.
Taste Typology in Serbia and Macedonia
Although historically conditions for the foundation of discourses and schemes Simon Frith and Gerhard Schulze are talking about are different from the situa-tion in Serbia and Macedonia (as compared with the USA or western European countries), so that much is specific for the two countries we are discussing, we have started with the assumption that the activity of these three discourses, in the sense of providing coordinates as to what should be valued in art181, is recognizable in our area, too. Therefore, following the positions of Simon Frith and Gerhard Schulze, we have assumed that tastes in Serbia and Macedonia are formed in the framework of elite, popular, and folklore discourses (and among them).
181 Somewhat joking, Frith defines discourses as “taste forming machines”.Somewhat joking, Frith defines discourses as “taste forming machines”.
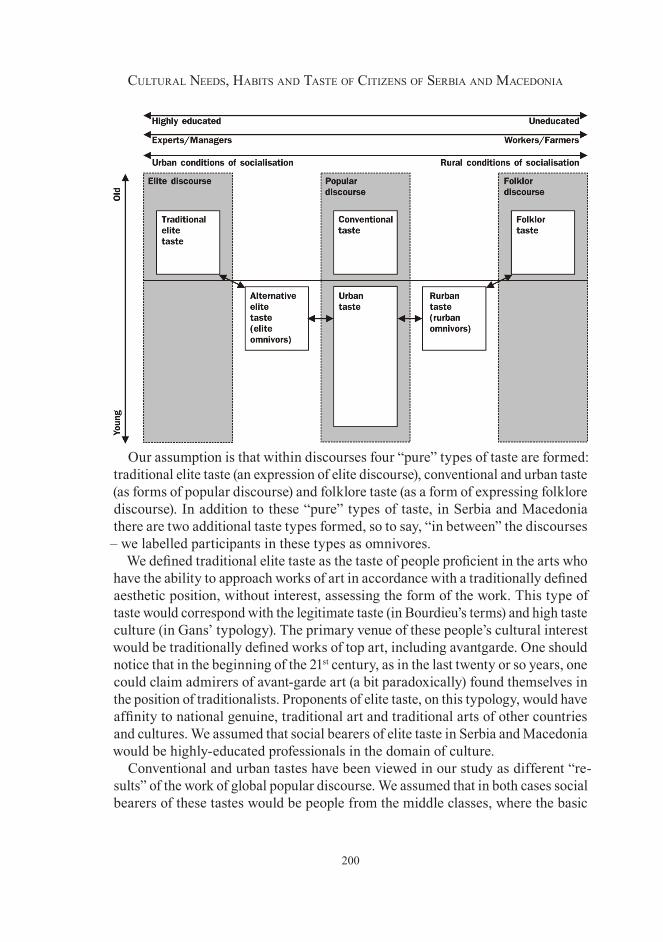
200
Cultural Needs, Habits aNd taste of CitizeNs of serbia aNd MaCedoNia
Our assumption is that within discourses four “pure” types of taste are formed: traditional elite taste (an expression of elite discourse), conventional and urban taste (as forms of popular discourse) and folklore taste (as a form of expressing folklore discourse). In addition to these “pure” types of taste, in Serbia and Macedonia there are two additional taste types formed, so to say, “in between” the discourses – we labelled participants in these types as omnivores.
We defined traditional elite taste as the taste of people proficient in the arts who have the ability to approach works of art in accordance with a traditionally defined aesthetic position, without interest, assessing the form of the work. This type of taste would correspond with the legitimate taste (in Bourdieu’s terms) and high taste culture (in Gans’ typology). The primary venue of these people’s cultural interest would be traditionally defined works of top art, including avantgarde. One should notice that in the beginning of the 21st century, as in the last twenty or so years, one could claim admirers of avant-garde art (a bit paradoxically) found themselves in the position of traditionalists. Proponents of elite taste, on this typology, would have affinity to national genuine, traditional art and traditional arts of other countries and cultures. We assumed that social bearers of elite taste in Serbia and Macedonia would be highly-educated professionals in the domain of culture.
Conventional and urban tastes have been viewed in our study as different “re-sults” of the work of global popular discourse. We assumed that in both cases social bearers of these tastes would be people from the middle classes, where the basic
201
tastes aNd disCourses
distinction between them would be that of generation – representatives of urban taste would be younger than representatives of conventional taste, which would, to a great extent, produce other significant differences (conformist/nonconform-ist view of reality, readiness to form subcultural groups based on common key interests, frequency of cultural participation, etc.).
Conventional taste, that we also labelled “decent” or “safe” taste is the taste for “what is liked”, that which is considered unquestionably valuable in a culture. Conventional taste is related to the work of generally accepted artists – globally or locally. This is the taste of bestsellers or critics’ awards, that of blockbusters, Nobel prizes, Grammies and Oscars. Contrary to elite taste, bearers of conventional taste prefer the art which is primarily oriented to the contents, and not to formal experiments and innovations. As opposed to proponents of urban taste, works of art these people communicate with are primarily classifiable as traditional art forms, rather than mass culture. Finally, as opposed to bearers of folklore taste, art forms these people address are international (novels, films, theatre plays, easy listening romances), and not a part of the local folklore. This taste type in our typology corresponds to the higher-middle taste culture of Gans’ typology. We assumed that social representatives of conventional taste in Serbia and Macedonia would be representatives of widely defined middle classes, where differences between higher and lower strata would be based on the frequency of cultural participation, rather than differences in taste.182.
Global (urban) taste is primarily the taste of young city generations belonging to what had until recently been rock and roll culture. ‘Global’ implies that behav-iour, dress, value system, and taste of members of this audience are similar in all urban areas of the world (or those areas that wish to be urban in that way). Out of all audiences described here, members of this audience are the closest to what used to be labelled “the youth subculture”183, in terms of both their clearly defined cultural style (clothing, music, rituals and argo), and the use of style for defying the social establishment (and also members of other taste publics). Accordingly, while subcultures in Great Britain184 are those of the working class, the parent culture of urban subcultures in all former Yugoslav republics (including Serbia
182 Where there is a difference in taste between members of lower and higher middle classes (who together make up conventional taste), it would be presented as the preference of popular cultural forms by representatives of lower middle classes (e.g. popular music, disco hits, film and literary hits), and the preference of traditional cultural forms by higher middle classes. Thus, lower middle classes would prefer bestsellers and blockbusters, and higher middle classes would like those works that are awarded critics’ prizes.183 It is a common view today that the concept of subculture has lost its analytical value – on this, see David Muggleton and Rupert Weinzierl (eds.) The Post-Subcultures Reader, Berg, Ox-ford, New York, 2003 – yet, this is not our topic of interest here. 184 Their place of “origin” and especially the venue of their most intensive study (in the work of theoreticians from the Centre for Contemporary Cultural Studies - CCCS).
202
Cultural Needs, Habits aNd taste of CitizeNs of serbia aNd MaCedoNia
and Macedonia) is the culture of the middle classes. While, according to Hebdige, subcultures in Great Britain were a response to the experience of living in a ra-cially mixed society, urban subcultures in these areas are specific in that they have represented not only a fashionable mimicking of global trends, but also a response to the accelerated urbanization. For members of urban subcultures, denim trou-sers, radio Luxemburg, turntables, and long hair, or, later on, leather jackets with big buttons, torn T-shirts and closely-cropped hairstyle were distinctive features clearly pointing to separation from the insufficiently urbanized environment and resolution to belong to the global cultural model. Cultural preferences of members of urban taste range within the broad domain of (global) popular culture – from old rock’n’roll and blues, jazz, to punk, hardcore, hip-hop, techno, urban films, on-the-road literature, and comic books.
We defined folklore taste as a taste formed within traditional folk culture. We assumed that its proponents would be people who still live in the countryside or those who are now the first generation of city dwellers, but whose taste was formed in the villages. Having in mind the all-presence of the media in the countryside today, and the influence the media have on the younger generations, we assumed that representatives of folklore taste in Serbia and Macedonia would be people from the older generations, lowly educated, farmers or workers. Their preferences would relate to genuine, traditional folk art (especially music) and rituals it is embedded in, but also to the first generation of the ‘newly-composed’ folk music, which still had the traces of original folk tunes, and also local family TV series and a certain type of popular local film comedies.
Already in our 2002 research we noticed that there were two additional groups of respondents whose preferences and value judgements were somewhere “in between discourses”, who apply certain discourses outside the art worlds which they had originated from. One group was made up of respondents whose preferences were based on combining preferences for the works of elite art and works of popular culture (rock’n’roll and jazz), that we labelled representatives of alternative elite taste or elite omnivores. The second, very substantial, group was made up of individuals who parallelly expressed preferences typical of folklore taste (primarily newly-composed folk music) and works of global popular culture (pop music, but also soap operas, TV novellas, simplified novels, etc.)185. This group, that transcended the borders of folklore and popular discourse, applying the framework of folklore discourse on the creations of global popular culture and the other way round, we labelled as representatives of rurban186 taste, or rurban omnivores.
Let us recall that Peterson’s definition of omnivore taste was based on the scope of cultural knowledge and preferences, that is, that as omnivores he defined those
185 In their preference works of elite culture did not occur, or they occurred very rarely.186 Neither rural, nor urban – but (r)urban.
203
tastes aNd disCourses
people who knew and preferred a number of musical (art) genres – where the issue of contents of their choices was not studied at all. We saw that in their own studies Van Eijck and Schulze, when defining respondents with omnivore taste, introduced the issue of content of their preferences187, retaining Peterson’s standpoint that affiliation with omnivore taste was a new way to express high social status, and even locating new middle classes as carriers of omnivore taste. What Tony Bennett and members of his team working on the study of everyday culture in Australia introduced as a novelty was the insight that, when observing contents of prefer-ences of respondents with omnivore taste, it becomes clear that, with regard to the way genres from different discourses are combined, there isn’t just a single group of omnivores. Moreover, omnivores of whom Peterson, Van Eijck and Schulze discussed (elite omnivores) were actually a very small audience group. Contrary to this, data on the two other omnivore groups these authors noticed – “lowbrow omnivores” and “ideally-typical omnivores” showed that, on the one hand, these groups were quite substantial in numbers, and, on the other, they certainly did not belong to elite social circles.
All these findings have been very useful to our research. In our 2002 research we simply noted empirically that there were two omnivore groups in Serbian au-dience. Insights we have come to in the meantime have helped us make a unified conceptual schema (taste typology) that we have used in this study.
In our typology, representatives of elite taste or elite omnivores correspond to what Peterson takes to be omnivores. The key difference between proponents of traditional and this alternative elite taste is seen in the range and homogeneity/ heterogeneity of cultural choices on the one hand, and their attitude to the work of mass media and (indirectly) to popular or mass culture on the other188. The most important trait of elite omnivores would be that they quite equally relate to the products of traditional and popular art, combining them at will, which natu-rally makes them closer to the media-aware, retrofitting postmodern work. Social representatives of this second elite taste type would be representatives of highly educated cultural professionals.
The last, but perhaps also the most interesting group to be studied is made up of representatives of rurban taste, or rurban omnivores. To a large extent, they are a phenomenon specific for the transition period in the Balkans189. Culturally, they are characterized by appreciating a strange concoction of elements from various cultural discourses – best embodied in the trademark of this taste – turbo folk.
187 Not asking only how many genres they combine, but also which genres they combine.188 Another difference between them would be that of generation. Actually, as in the case of conventional and urban tastes, we assumed that respondents from alternative elite taste (elite om-nivores) would be younger than representatives of traditional elite taste.189 To our knowledge, except in former Yugoslav republics, this taste culture is prevalent in Bulgaria, too.
204
Cultural Needs, Habits aNd taste of CitizeNs of serbia aNd MaCedoNia
This hybrid blend of rhythm machines, electric guitars and folk melodies, of cel-lular phones and family patron saint celebrations, of violence and religiousness, of sexual liberties and traditionality, makes one regard this (sub)culture as a kind of paradoxical, folklore postmodern. We assumed that social carriers of this “neither urban nor rural” taste would be representatives of the second and third genera-tions of descendants of those people who had come to the cities in the accelerated urbanization process. That is, our assumption was that rurban taste is the taste of
“the suburbs” – taken both literally and metaphorically. We also surmised these would mostly be younger people, with elementary or vocational secondary school degrees, working in labour or lower-civil-servant professions, who ensured their survival by “making their way” (ranging from crime, over selling items in flea markets, to pursuing small private businesses). Apart from turbo folk, as indicators of rurban taste we used south American TV novellas, gossipy magazines, foreign action films, and local “war” or “street” films.
Tastes of Citizens of Serbia and Macedonia
We operationalized our study of taste by means of 20 questions. In the first series of questions, we asked our respondents to state their favourite song, favourite male/female singer, band, composer, writer, film actor or actress, film directors, painters, sculptors, architects, and comic book creators. In the second series of questions we asked them to select one TV series (out of 16 offered) and one national and one international film (from among 12 offered for each) that they believed to be the best. We also gave them two tables with 15 musical genres and asked them to state their position on each of the genres (in the first table), and the position of their partner190, ranging from “I like to listen to this the most” to “It bothers me when I hear this”. Outside the realm of arts – we also asked them of their favourite TV stations, daily papers and magazines. Wanting to know, on the one hand, how much they knew of the work of some national artists/performers, and, on the other, what attitude they had to these people, we offered our respondents the names of 12 artists (of whom there would be two, we assumed, to embody the six taste types we had identified) and asked them to state, with regard to those people’s work a) whether they like it; b) don’t like it; c) don’t know of their work; or d) don’t know who they are. Finally, in order to gain some insight into their knowledge of art, art genres and artists, we posed some questions to our respondents in a pseudo-quiz of 24 questions (four questions per six taste types). The quiz was constructed in such a way that respondents “belonging” to one of the postulated taste types would easily respond to 4 questions (from the domain of their taste), while answers to
190 As much as their knowledge of their taste allows them to.
205
tastes aNd disCourses
other questions much more depended on how much the respondents were informed of other artistic/cultural spheres. Thus, on the one hand, we obtained information on the scope of their “passing” knowledge (in Peterson’s terms), and, on the other, the procedure was helpful in deciding on their eventual type of taste.
Based on all these data, we first reconstructed groups of respondents belonging to types of taste as postulated here191. Then, as a kind of control, we used cluster analysis to reconstruct musical tastes of respondents in Macedonia and Serbia192. Finally, we classified respondent tastes into those belonging to the local and glo-bal milieus and for all these variables observed their distribution along important social dimensions.
When we reconstructed six taste publics in Serbia and Macedonia, based on replies of our respondents, it turned out there were similarities in the distribution of taste in the two societies (see Table 83). First, in both cases, the most numerous and the most prevalent in terms of percentage is the group we labelled rurban om-nivores. In Macedonia, respondents from this group make up almost a half of the sample (49%), and in Serbia they correspond to over a third of the sample (36.7%). Second by numbers and percentages is the group of respondents with conventional taste (28.9% in Serbia and 26.2% in Macedonia). The respondent group with pure folklore taste is a bit more numerous in Serbia (23%) than in Macedonia (13.6%), while respondents with the urban taste in both countries amount to about 10% of the sample. Finally, as in other survey-based studies, it turned out respondents with elite (both traditional and alternative) taste were relatively few193.
Perhaps it would be good to point out already that, viewed by taste type belong-ing to local cultural milieu (folklore and rurban taste) and to the global cultural milieu (urban, conventional, and elite taste), similarities become even more obvious. In fact, respondents whose tastes are related to the local cultural milieu in both Serbia and Macedonia make up around 60% of the sample (62.6% in Macedonia and 59.6% in Serbia). In both Macedonia and Serbia, among global popular tastes we find a bit more than a third of the sample (population) – 38.3% in Serbia and 36.3% in Macedonia, and one should add to this another 2% (in Serbia) and 1.1% (in Macedonia) from elite tastes (from the global cultural milieu).
191 Based on responses to all twenty questions we obtained here, through two waves of inde-pendent data coding.192 Based on their attitude to 15 musical genres offered.193 For this reason, in further analyses we merged respondents from these two groups and treat-ed them as respondents with elite taste.
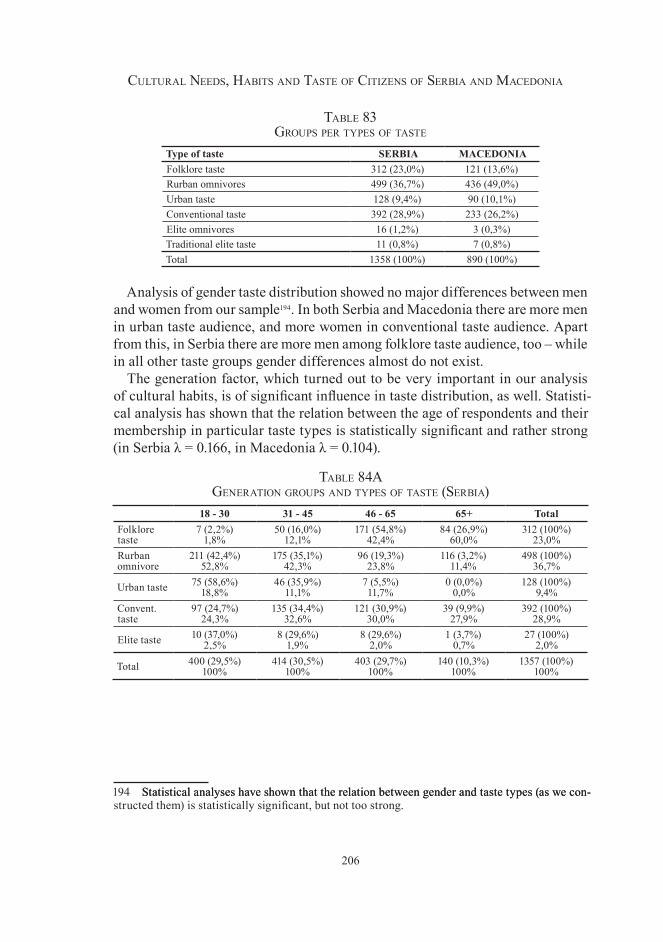
206
Cultural Needs, Habits aNd taste of CitizeNs of serbia aNd MaCedoNia
table 8� groups per types of taste
Type of taste SERBIA MACEDONIAFolklore taste 312 (23,0%) 121 (13,6%)Rurban omnivores 499 (36,7%) 436 (49,0%)Urban taste 128 (9,4%) 90 (10,1%)Conventional taste 392 (28,9%) 233 (26,2%)Elite omnivores 16 (1,2%) 3 (0,3%)Traditional elite taste 11 (0,8%) 7 (0,8%)Total 1358 (100%) 890 (100%)
Analysis of gender taste distribution showed no major differences between men and women from our sample194. In both Serbia and Macedonia there are more men in urban taste audience, and more women in conventional taste audience. Apart from this, in Serbia there are more men among folklore taste audience, too – while in all other taste groups gender differences almost do not exist.
The generation factor, which turned out to be very important in our analysis of cultural habits, is of significant influence in taste distribution, as well. Statisti-cal analysis has shown that the relation between the age of respondents and their membership in particular taste types is statistically significant and rather strong (in Serbia λ = 0.166, in Macedonia λ = 0.104).
table 84a geNeratioN groups aNd types of taste (serbia)
18 - 30 31 - 45 46 - 65 65+ TotalFolklore taste
7 (2,2%)1,8%
50 (16,0%)12,1%
171 (54,8%)42,4%
84 (26,9%)60,0%
312 (100%)23,0%
Rurban omnivore
211 (42,4%)52,8%
175 (35,1%)42,3%
96 (19,3%)23,8%
116 (3,2%)11,4%
498 (100%)36,7%
Urban taste 75 (58,6%)18,8%
46 (35,9%)11,1%
7 (5,5%)11,7%
0 (0,0%)0,0%
128 (100%)9,4%
Convent. taste
97 (24,7%)24,3%
135 (34,4%)32,6%
121 (30,9%)30,0%
39 (9,9%)27,9%
392 (100%)28,9%
Elite taste 10 (37,0%)2,5%
8 (29,6%)1,9%
8 (29,6%)2,0%
1 (3,7%)0,7%
27 (100%)2,0%
Total 400 (29,5%)100%
414 (30,5%)100%
403 (29,7%)100%
140 (10,3%)100%
1357 (100%)100%
194 Statistical analyses have shown that the relation between gender and taste types (as we con-Statistical analyses have shown that the relation between gender and taste types (as we con-structed them) is statistically significant, but not too strong.
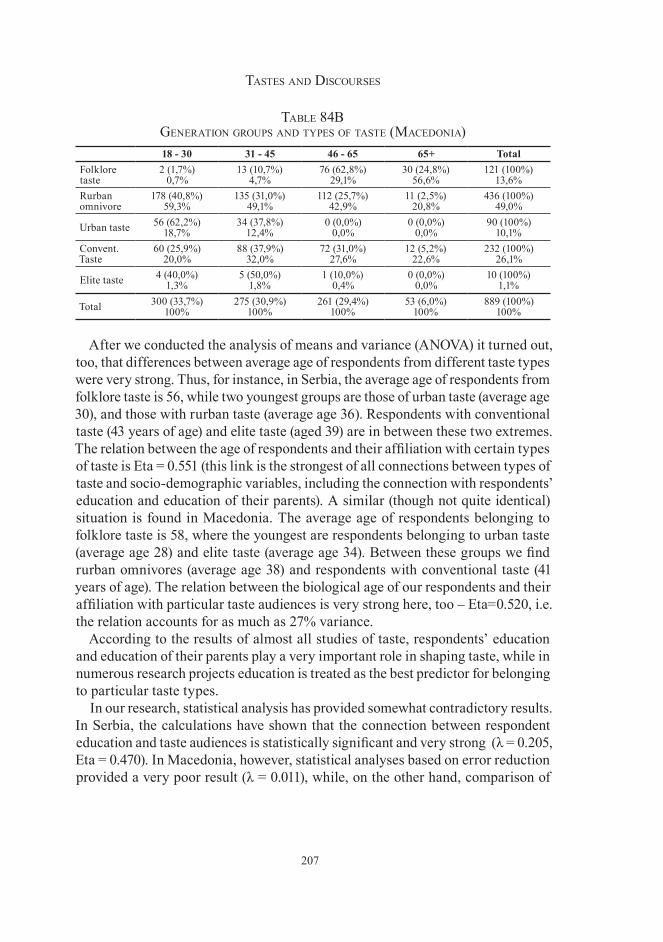
207
tastes aNd disCourses
table 84b geNeratioN groups aNd types of taste (MaCedoNia)18 - 30 31 - 45 46 - 65 65+ Total
Folklore taste
2 (1,7%)0,7%
13 (10,7%)4,7%
76 (62,8%)29,1%
30 (24,8%)56,6%
121 (100%)13,6%
Rurban omnivore
178 (40,8%)59,3%
135 (31,0%)49,1%
112 (25,7%)42,9%
11 (2,5%)20,8%
436 (100%)49,0%
Urban taste 56 (62,2%)18,7%
34 (37,8%)12,4%
0 (0,0%)0,0%
0 (0,0%)0,0%
90 (100%)10,1%
Convent. Taste
60 (25,9%)20,0%
88 (37,9%)32,0%
72 (31,0%)27,6%
12 (5,2%)22,6%
232 (100%)26,1%
Elite taste 4 (40,0%)1,3%
5 (50,0%)1,8%
1 (10,0%)0,4%
0 (0,0%)0,0%
10 (100%)1,1%
Total 300 (33,7%)100%
275 (30,9%)100%
261 (29,4%)100%
53 (6,0%)100%
889 (100%)100%
After we conducted the analysis of means and variance (ANOVA) it turned out, too, that differences between average age of respondents from different taste types were very strong. Thus, for instance, in Serbia, the average age of respondents from folklore taste is 56, while two youngest groups are those of urban taste (average age 30), and those with rurban taste (average age 36). Respondents with conventional taste (43 years of age) and elite taste (aged 39) are in between these two extremes. The relation between the age of respondents and their affiliation with certain types of taste is Eta = 0.551 (this link is the strongest of all connections between types of taste and socio-demographic variables, including the connection with respondents’ education and education of their parents). A similar (though not quite identical) situation is found in Macedonia. The average age of respondents belonging to folklore taste is 58, where the youngest are respondents belonging to urban taste (average age 28) and elite taste (average age 34). Between these groups we find rurban omnivores (average age 38) and respondents with conventional taste (41 years of age). The relation between the biological age of our respondents and their affiliation with particular taste audiences is very strong here, too – Eta=0.520, i.e. the relation accounts for as much as 27% variance.
According to the results of almost all studies of taste, respondents’ education and education of their parents play a very important role in shaping taste, while in numerous research projects education is treated as the best predictor for belonging to particular taste types.
In our research, statistical analysis has provided somewhat contradictory results. In Serbia, the calculations have shown that the connection between respondent education and taste audiences is statistically significant and very strong (λ = 0.205, Eta = 0.470). In Macedonia, however, statistical analyses based on error reduction provided a very poor result (λ = 0.011), while, on the other hand, comparison of
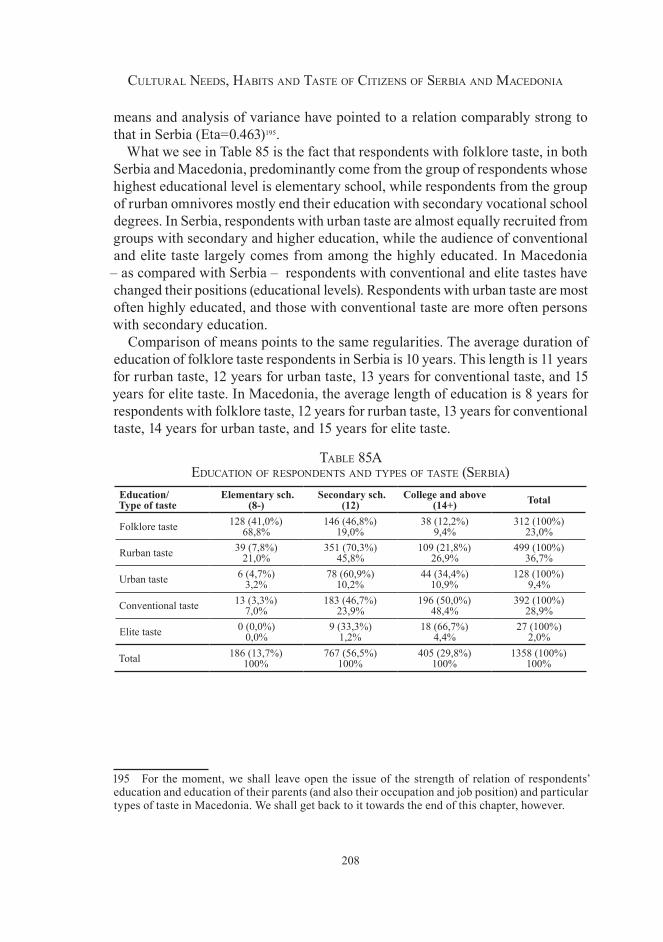
208
Cultural Needs, Habits aNd taste of CitizeNs of serbia aNd MaCedoNia
means and analysis of variance have pointed to a relation comparably strong to that in Serbia (Eta=0.463)195.
What we see in Table 85 is the fact that respondents with folklore taste, in both Serbia and Macedonia, predominantly come from the group of respondents whose highest educational level is elementary school, while respondents from the group of rurban omnivores mostly end their education with secondary vocational school degrees. In Serbia, respondents with urban taste are almost equally recruited from groups with secondary and higher education, while the audience of conventional and elite taste largely comes from among the highly educated. In Macedonia
– as compared with Serbia – respondents with conventional and elite tastes have changed their positions (educational levels). Respondents with urban taste are most often highly educated, and those with conventional taste are more often persons with secondary education.
Comparison of means points to the same regularities. The average duration of education of folklore taste respondents in Serbia is 10 years. This length is 11 years for rurban taste, 12 years for urban taste, 13 years for conventional taste, and 15 years for elite taste. In Macedonia, the average length of education is 8 years for respondents with folklore taste, 12 years for rurban taste, 13 years for conventional taste, 14 years for urban taste, and 15 years for elite taste.
table 85a eduCatioN of respoNdeNts aNd types of taste (serbia)
Education/ Type of taste
Elementary sch.(8-)
Secondary sch.(12)
College and above (14+) Total
Folklore taste 128 (41,0%)68,8%
146 (46,8%)19,0%
38 (12,2%)9,4%
312 (100%)23,0%
Rurban taste 39 (7,8%)21,0%
351 (70,3%)45,8%
109 (21,8%)26,9%
499 (100%)36,7%
Urban taste 6 (4,7%)3,2%
78 (60,9%)10,2%
44 (34,4%)10,9%
128 (100%)9,4%
Conventional taste 13 (3,3%)7,0%
183 (46,7%)23,9%
196 (50,0%)48,4%
392 (100%)28,9%
Elite taste 0 (0,0%)0,0%
9 (33,3%)1,2%
18 (66,7%)4,4%
27 (100%)2,0%
Total 186 (13,7%)100%
767 (56,5%)100%
405 (29,8%)100%
1358 (100%)100%
195 For the moment, we shall leave open the issue of the strength of relation of respondents’ education and education of their parents (and also their occupation and job position) and particular types of taste in Macedonia. We shall get back to it towards the end of this chapter, however.
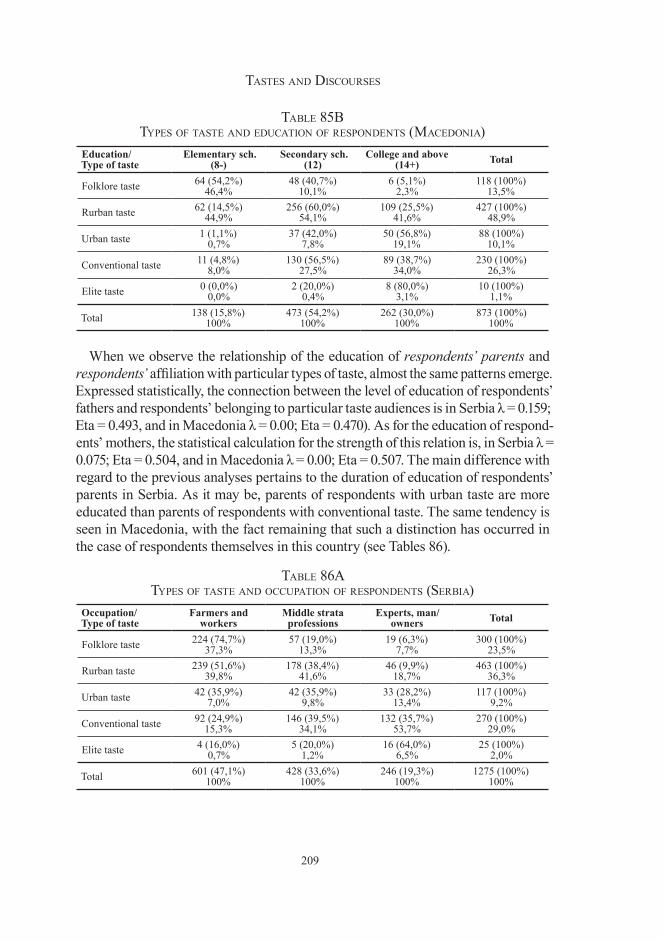
209
tastes aNd disCourses
table 85b types of taste aNd eduCatioN of respoNdeNts (MaCedoNia)
Education/ Type of taste
Elementary sch.(8-)
Secondary sch.(12)
College and above (14+) Total
Folklore taste 64 (54,2%)46,4%
48 (40,7%)10,1%
6 (5,1%)2,3%
118 (100%)13,5%
Rurban taste 62 (14,5%)44,9%
256 (60,0%)54,1%
109 (25,5%)41,6%
427 (100%)48,9%
Urban taste 1 (1,1%)0,7%
37 (42,0%)7,8%
50 (56,8%)19,1%
88 (100%)10,1%
Conventional taste 11 (4,8%)8,0%
130 (56,5%)27,5%
89 (38,7%)34,0%
230 (100%)26,3%
Elite taste 0 (0,0%)0,0%
2 (20,0%)0,4%
8 (80,0%)3,1%
10 (100%)1,1%
Total 138 (15,8%)100%
473 (54,2%)100%
262 (30,0%)100%
873 (100%)100%
When we observe the relationship of the education of respondents’ parents and respondents’ affiliation with particular types of taste, almost the same patterns emerge. Expressed statistically, the connection between the level of education of respondents’ fathers and respondents’ belonging to particular taste audiences is in Serbia λ = 0.159; Eta = 0.493, and in Macedonia λ = 0.00; Eta = 0.470). As for the education of respond-ents’ mothers, the statistical calculation for the strength of this relation is, in Serbia λ = 0.075; Eta = 0.504, and in Macedonia λ = 0.00; Eta = 0.507. The main difference with regard to the previous analyses pertains to the duration of education of respondents’ parents in Serbia. As it may be, parents of respondents with urban taste are more educated than parents of respondents with conventional taste. The same tendency is seen in Macedonia, with the fact remaining that such a distinction has occurred in the case of respondents themselves in this country (see Tables 86).
table 86a types of taste aNd oCCupatioN of respoNdeNts (serbia)
Occupation/ Type of taste
Farmers and workers
Middle strata professions
Experts, man/owners Total
Folklore taste 224 (74,7%)37,3%
57 (19,0%)13,3%
19 (6,3%)7,7%
300 (100%)23,5%
Rurban taste 239 (51,6%)39,8%
178 (38,4%)41,6%
46 (9,9%)18,7%
463 (100%)36,3%
Urban taste 42 (35,9%)7,0%
42 (35,9%)9,8%
33 (28,2%)13,4%
117 (100%)9,2%
Conventional taste 92 (24,9%)15,3%
146 (39,5%)34,1%
132 (35,7%)53,7%
270 (100%)29,0%
Elite taste 4 (16,0%)0,7%
5 (20,0%)1,2%
16 (64,0%)6,5%
25 (100%)2,0%
Total 601 (47,1%)100%
428 (33,6%)100%
246 (19,3%)100%
1275 (100%)100%
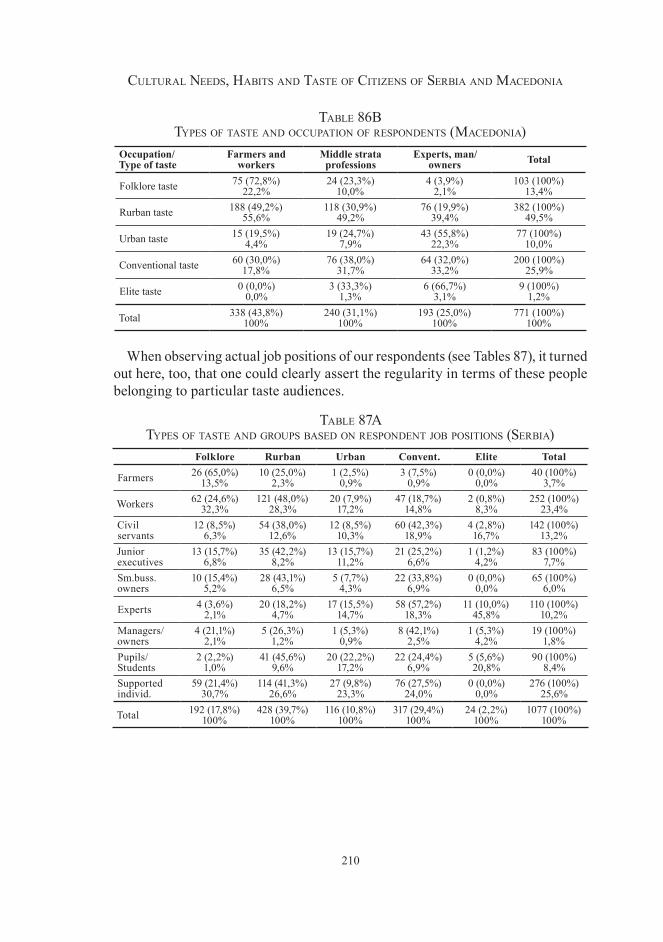
210
Cultural Needs, Habits aNd taste of CitizeNs of serbia aNd MaCedoNia
table 86b types of taste aNd oCCupatioN of respoNdeNts (MaCedoNia)
Occupation/ Type of taste
Farmers and workers
Middle strata professions
Experts, man/owners Total
Folklore taste 75 (72,8%)22,2%
24 (23,3%)10,0%
4 (3,9%)2,1%
103 (100%)13,4%
Rurban taste 188 (49,2%)55,6%
118 (30,9%)49,2%
76 (19,9%)39,4%
382 (100%)49,5%
Urban taste 15 (19,5%)4,4%
19 (24,7%)7,9%
43 (55,8%)22,3%
77 (100%)10,0%
Conventional taste 60 (30,0%)17,8%
76 (38,0%)31,7%
64 (32,0%)33,2%
200 (100%)25,9%
Elite taste 0 (0,0%)0,0%
3 (33,3%)1,3%
6 (66,7%)3,1%
9 (100%)1,2%
Total 338 (43,8%)100%
240 (31,1%)100%
193 (25,0%)100%
771 (100%)100%
When observing actual job positions of our respondents (see Tables 87), it turned out here, too, that one could clearly assert the regularity in terms of these people belonging to particular taste audiences.
table 87a types of taste aNd groups based oN respoNdeNt job positioNs (serbia)
Folklore Rurban Urban Convent. Elite Total
Farmers 26 (65,0%)13,5%
10 (25,0%)2,3%
1 (2,5%)0,9%
3 (7,5%)0,9%
0 (0,0%)0,0%
40 (100%)3,7%
Workers 62 (24,6%)32,3%
121 (48,0%)28,3%
20 (7,9%)17,2%
47 (18,7%)14,8%
2 (0,8%)8,3%
252 (100%)23,4%
Civil servants
12 (8,5%)6,3%
54 (38,0%)12,6%
12 (8,5%)10,3%
60 (42,3%)18,9%
4 (2,8%)16,7%
142 (100%)13,2%
Junior executives
13 (15,7%)6,8%
35 (42,2%)8,2%
13 (15,7%)11,2%
21 (25,2%)6,6%
1 (1,2%)4,2%
83 (100%)7,7%
Sm.buss.owners
10 (15,4%)5,2%
28 (43,1%)6,5%
5 (7,7%)4,3%
22 (33,8%)6,9%
0 (0,0%)0,0%
65 (100%)6,0%
Experts 4 (3,6%)2,1%
20 (18,2%)4,7%
17 (15,5%)14,7%
58 (57,2%)18,3%
11 (10,0%)45,8%
110 (100%)10,2%
Managers/owners
4 (21,1%)2,1%
5 (26,3%)1,2%
1 (5,3%)0,9%
8 (42,1%)2,5%
1 (5,3%)4,2%
19 (100%)1,8%
Pupils/Students
2 (2,2%)1,0%
41 (45,6%)9,6%
20 (22,2%)17,2%
22 (24,4%)6,9%
5 (5,6%)20,8%
90 (100%)8,4%
Supported individ.
59 (21,4%)30,7%
114 (41,3%)26,6%
27 (9,8%)23,3%
76 (27,5%)24,0%
0 (0,0%)0,0%
276 (100%)25,6%
Total 192 (17,8%)100%
428 (39,7%)100%
116 (10,8%)100%
317 (29,4%)100%
24 (2,2%)100%
1077 (100%)100%
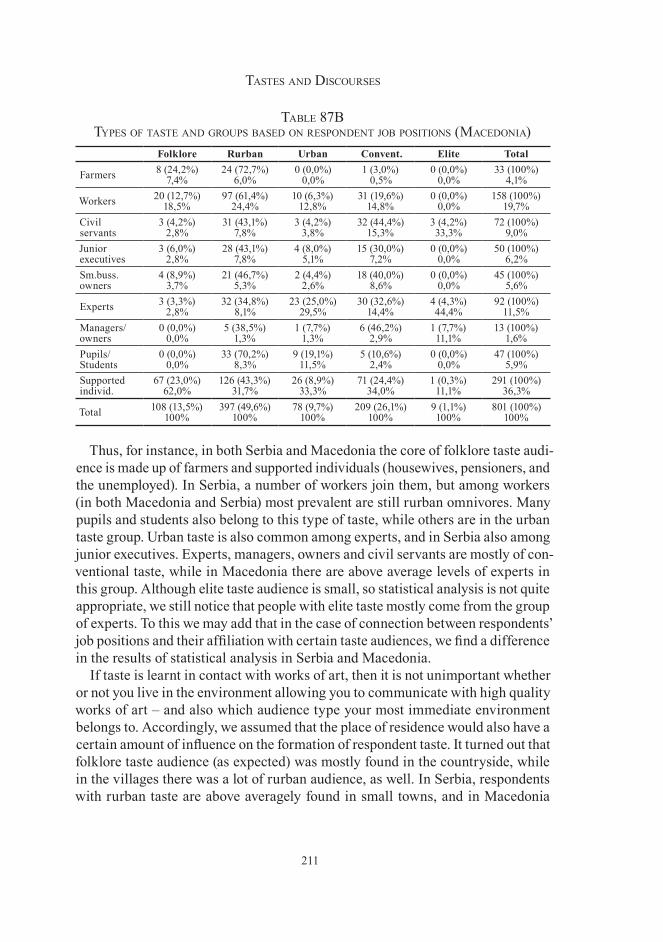
211
tastes aNd disCourses
table 87b types of taste aNd groups based oN respoNdeNt job positioNs (MaCedoNia)
Folklore Rurban Urban Convent. Elite Total
Farmers 8 (24,2%)7,4%
24 (72,7%)6,0%
0 (0,0%)0,0%
1 (3,0%)0,5%
0 (0,0%)0,0%
33 (100%)4,1%
Workers 20 (12,7%)18,5%
97 (61,4%)24,4%
10 (6,3%)12,8%
31 (19,6%)14,8%
0 (0,0%)0,0%
158 (100%)19,7%
Civil servants
3 (4,2%)2,8%
31 (43,1%)7,8%
3 (4,2%)3,8%
32 (44,4%)15,3%
3 (4,2%)33,3%
72 (100%)9,0%
Junior executives
3 (6,0%)2,8%
28 (43,1%)7,8%
4 (8,0%)5,1%
15 (30,0%)7,2%
0 (0,0%)0,0%
50 (100%)6,2%
Sm.buss.owners
4 (8,9%)3,7%
21 (46,7%)5,3%
2 (4,4%)2,6%
18 (40,0%)8,6%
0 (0,0%)0,0%
45 (100%)5,6%
Experts 3 (3,3%)2,8%
32 (34,8%)8,1%
23 (25,0%)29,5%
30 (32,6%)14,4%
4 (4,3%)44,4%
92 (100%)11,5%
Managers/owners
0 (0,0%)0,0%
5 (38,5%)1,3%
1 (7,7%)1,3%
6 (46,2%)2,9%
1 (7,7%)11,1%
13 (100%)1,6%
Pupils/Students
0 (0,0%)0,0%
33 (70,2%)8,3%
9 (19,1%)11,5%
5 (10,6%)2,4%
0 (0,0%)0,0%
47 (100%)5,9%
Supported individ.
67 (23,0%)62,0%
126 (43,3%)31,7%
26 (8,9%)33,3%
71 (24,4%)34,0%
1 (0,3%)11,1%
291 (100%)36,3%
Total 108 (13,5%)100%
397 (49,6%)100%
78 (9,7%)100%
209 (26,1%)100%
9 (1,1%)100%
801 (100%)100%
Thus, for instance, in both Serbia and Macedonia the core of folklore taste audi-ence is made up of farmers and supported individuals (housewives, pensioners, and the unemployed). In Serbia, a number of workers join them, but among workers (in both Macedonia and Serbia) most prevalent are still rurban omnivores. Many pupils and students also belong to this type of taste, while others are in the urban taste group. Urban taste is also common among experts, and in Serbia also among junior executives. Experts, managers, owners and civil servants are mostly of con-ventional taste, while in Macedonia there are above average levels of experts in this group. Although elite taste audience is small, so statistical analysis is not quite appropriate, we still notice that people with elite taste mostly come from the group of experts. To this we may add that in the case of connection between respondents’ job positions and their affiliation with certain taste audiences, we find a difference in the results of statistical analysis in Serbia and Macedonia.
If taste is learnt in contact with works of art, then it is not unimportant whether or not you live in the environment allowing you to communicate with high quality works of art – and also which audience type your most immediate environment belongs to. Accordingly, we assumed that the place of residence would also have a certain amount of influence on the formation of respondent taste. It turned out that folklore taste audience (as expected) was mostly found in the countryside, while in the villages there was a lot of rurban audience, as well. In Serbia, respondents with rurban taste are above averagely found in small towns, and in Macedonia
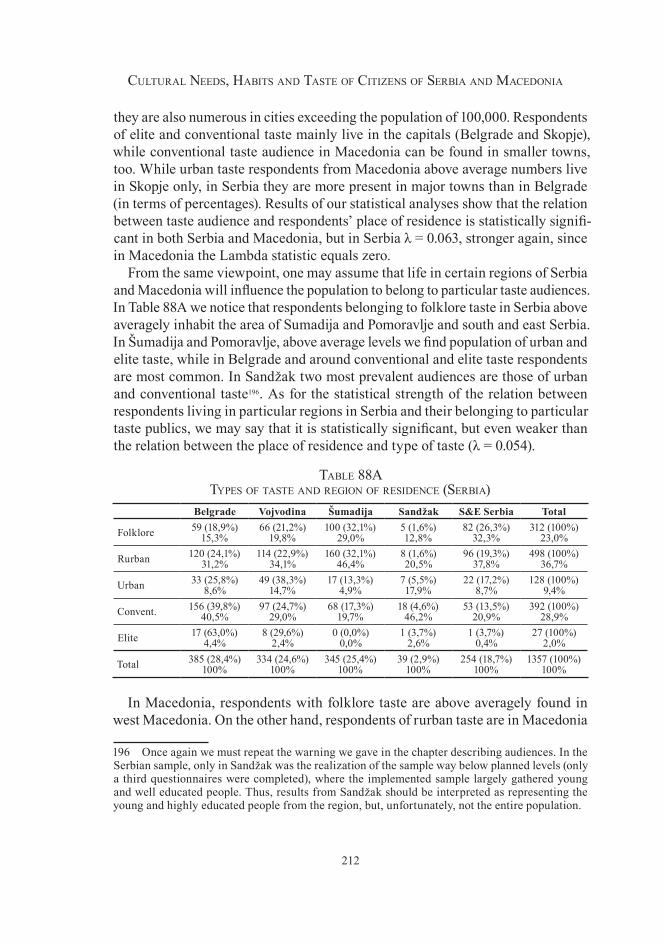
212
Cultural Needs, Habits aNd taste of CitizeNs of serbia aNd MaCedoNia
they are also numerous in cities exceeding the population of 100,000. Respondents of elite and conventional taste mainly live in the capitals (Belgrade and Skopje), while conventional taste audience in Macedonia can be found in smaller towns, too. While urban taste respondents from Macedonia above average numbers live in Skopje only, in Serbia they are more present in major towns than in Belgrade (in terms of percentages). Results of our statistical analyses show that the relation between taste audience and respondents’ place of residence is statistically signifi-cant in both Serbia and Macedonia, but in Serbia λ = 0.063, stronger again, since in Macedonia the Lambda statistic equals zero.
From the same viewpoint, one may assume that life in certain regions of Serbia and Macedonia will influence the population to belong to particular taste audiences. In Table 88A we notice that respondents belonging to folklore taste in Serbia above averagely inhabit the area of Sumadija and Pomoravlje and south and east Serbia. In Šumadija and Pomoravlje, above average levels we find population of urban and elite taste, while in Belgrade and around conventional and elite taste respondents are most common. In Sandžak two most prevalent audiences are those of urban and conventional taste196. As for the statistical strength of the relation between respondents living in particular regions in Serbia and their belonging to particular taste publics, we may say that it is statistically significant, but even weaker than the relation between the place of residence and type of taste (λ = 0.054).
table 88a types of taste aNd regioN of resideNCe (serbia)
Belgrade Vojvodina Šumadija Sandžak S&E Serbia Total
Folklore 59 (18,9%)15,3%
66 (21,2%)19,8%
100 (32,1%)29,0%
5 (1,6%)12,8%
82 (26,3%)32,3%
312 (100%)23,0%
Rurban 120 (24,1%)31,2%
114 (22,9%)34,1%
160 (32,1%)46,4%
8 (1,6%)20,5%
96 (19,3%)37,8%
498 (100%)36,7%
Urban 33 (25,8%)8,6%
49 (38,3%)14,7%
17 (13,3%)4,9%
7 (5,5%)17,9%
22 (17,2%)8,7%
128 (100%)9,4%
Convent. 156 (39,8%)40,5%
97 (24,7%)29,0%
68 (17,3%)19,7%
18 (4,6%)46,2%
53 (13,5%)20,9%
392 (100%)28,9%
Elite 17 (63,0%)4,4%
8 (29,6%)2,4%
0 (0,0%)0,0%
1 (3,7%)2,6%
1 (3,7%)0,4%
27 (100%)2,0%
Total 385 (28,4%)100%
334 (24,6%)100%
345 (25,4%)100%
39 (2,9%)100%
254 (18,7%)100%
1357 (100%)100%
In Macedonia, respondents with folklore taste are above averagely found in west Macedonia. On the other hand, respondents of rurban taste are in Macedonia
196 Once again we must repeat the warning we gave in the chapter describing audiences. In the Serbian sample, only in Sandžak was the realization of the sample way below planned levels (only a third questionnaires were completed), where the implemented sample largely gathered young and well educated people. Thus, results from Sandžak should be interpreted as representing the young and highly educated people from the region, but, unfortunately, not the entire population.
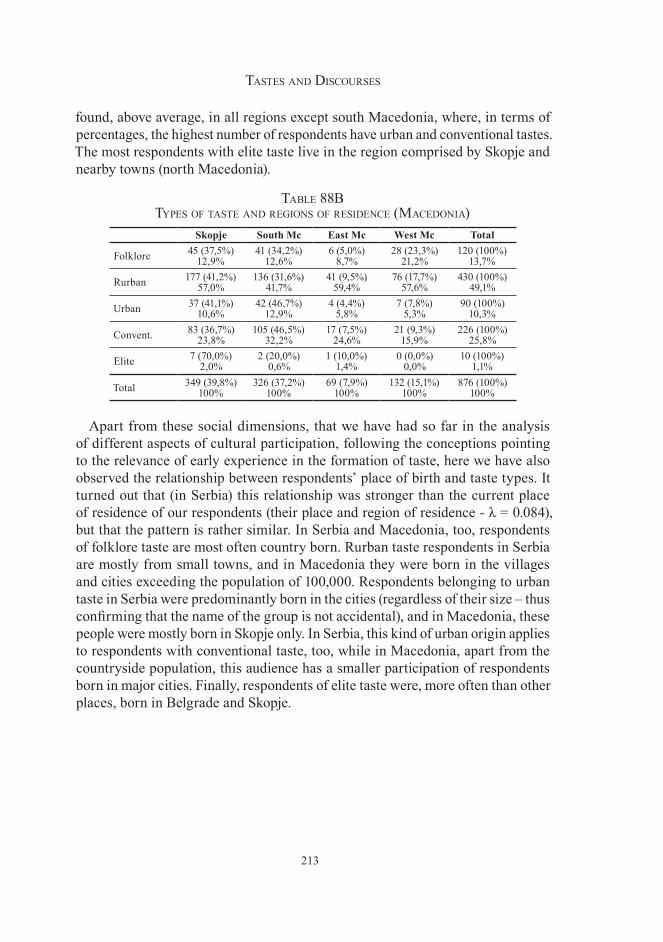
213
tastes aNd disCourses
found, above average, in all regions except south Macedonia, where, in terms of percentages, the highest number of respondents have urban and conventional tastes. The most respondents with elite taste live in the region comprised by Skopje and nearby towns (north Macedonia).
table 88b types of taste aNd regioNs of resideNCe (MaCedoNia)
Skopje South Mc East Mc West Mc Total
Folklore 45 (37,5%)12,9%
41 (34,2%)12,6%
6 (5,0%)8,7%
28 (23,3%)21,2%
120 (100%)13,7%
Rurban 177 (41,2%)57,0%
136 (31,6%)41,7%
41 (9,5%)59,4%
76 (17,7%)57,6%
430 (100%)49,1%
Urban 37 (41,1%)10,6%
42 (46,7%)12,9%
4 (4,4%)5,8%
7 (7,8%)5,3%
90 (100%)10,3%
Convent. 83 (36,7%)23,8%
105 (46,5%)32,2%
17 (7,5%)24,6%
21 (9,3%)15,9%
226 (100%)25,8%
Elite 7 (70,0%)2,0%
2 (20,0%)0,6%
1 (10,0%)1,4%
0 (0,0%)0,0%
10 (100%)1,1%
Total 349 (39,8%)100%
326 (37,2%)100%
69 (7,9%)100%
132 (15,1%)100%
876 (100%)100%
Apart from these social dimensions, that we have had so far in the analysis of different aspects of cultural participation, following the conceptions pointing to the relevance of early experience in the formation of taste, here we have also observed the relationship between respondents’ place of birth and taste types. It turned out that (in Serbia) this relationship was stronger than the current place of residence of our respondents (their place and region of residence - λ = 0.084), but that the pattern is rather similar. In Serbia and Macedonia, too, respondents of folklore taste are most often country born. Rurban taste respondents in Serbia are mostly from small towns, and in Macedonia they were born in the villages and cities exceeding the population of 100,000. Respondents belonging to urban taste in Serbia were predominantly born in the cities (regardless of their size – thus confirming that the name of the group is not accidental), and in Macedonia, these people were mostly born in Skopje only. In Serbia, this kind of urban origin applies to respondents with conventional taste, too, while in Macedonia, apart from the countryside population, this audience has a smaller participation of respondents born in major cities. Finally, respondents of elite taste were, more often than other places, born in Belgrade and Skopje.
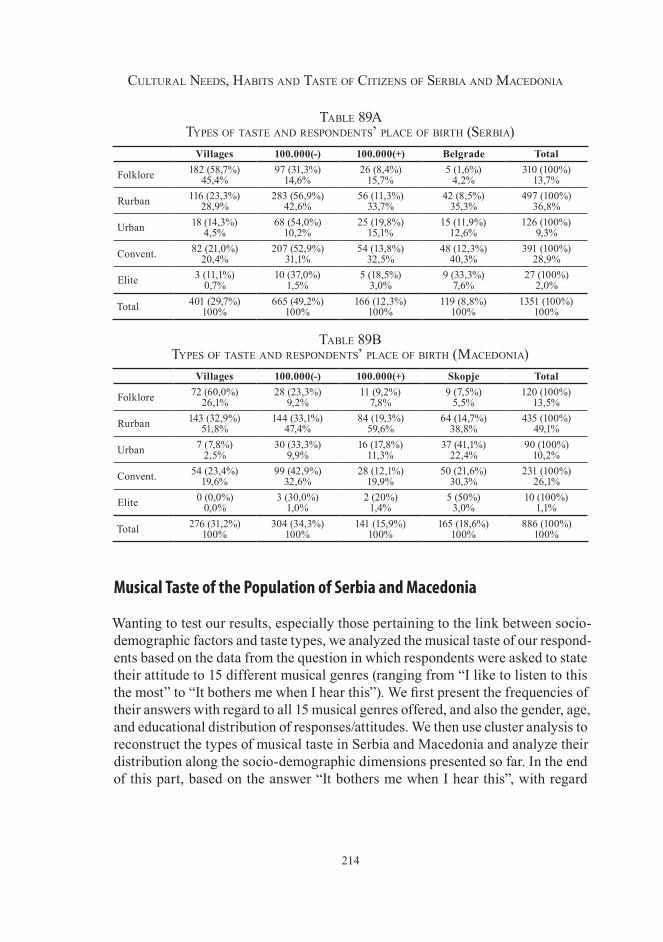
214
Cultural Needs, Habits aNd taste of CitizeNs of serbia aNd MaCedoNia
table 89a types of taste aNd respoNdeNts’ plaCe of birtH (serbia)
Villages 100.000(-) 100.000(+) Belgrade Total
Folklore 182 (58,7%)45,4%
97 (31,3%)14,6%
26 (8,4%)15,7%
5 (1,6%)4,2%
310 (100%)13,7%
Rurban 116 (23,3%)28,9%
283 (56,9%)42,6%
56 (11,3%)33,7%
42 (8,5%)35,3%
497 (100%)36,8%
Urban 18 (14,3%)4,5%
68 (54,0%)10,2%
25 (19,8%)15,1%
15 (11,9%)12,6%
126 (100%)9,3%
Convent. 82 (21,0%)20,4%
207 (52,9%)31,1%
54 (13,8%)32,5%
48 (12,3%)40,3%
391 (100%)28,9%
Elite 3 (11,1%)0,7%
10 (37,0%)1,5%
5 (18,5%)3,0%
9 (33,3%)7,6%
27 (100%)2,0%
Total 401 (29,7%)100%
665 (49,2%)100%
166 (12,3%)100%
119 (8,8%)100%
1351 (100%)100%
table 89b types of taste aNd respoNdeNts’ plaCe of birtH (MaCedoNia)
Villages 100.000(-) 100.000(+) Skopje Total
Folklore 72 (60,0%)26,1%
28 (23,3%)9,2%
11 (9,2%)7,8%
9 (7,5%)5,5%
120 (100%)13,5%
Rurban 143 (32,9%)51,8%
144 (33,1%)47,4%
84 (19,3%)59,6%
64 (14,7%)38,8%
435 (100%)49,1%
Urban 7 (7,8%)2,5%
30 (33,3%)9,9%
16 (17,8%)11,3%
37 (41,1%)22,4%
90 (100%)10,2%
Convent. 54 (23,4%)19,6%
99 (42,9%)32,6%
28 (12,1%)19,9%
50 (21,6%)30,3%
231 (100%)26,1%
Elite 0 (0,0%)0,0%
3 (30,0%)1,0%
2 (20%)1,4%
5 (50%)3,0%
10 (100%)1,1%
Total 276 (31,2%)100%
304 (34,3%)100%
141 (15,9%)100%
165 (18,6%)100%
886 (100%)100%
Musical Taste of the Population of Serbia and Macedonia
Wanting to test our results, especially those pertaining to the link between socio-demographic factors and taste types, we analyzed the musical taste of our respond-ents based on the data from the question in which respondents were asked to state their attitude to 15 different musical genres (ranging from “I like to listen to this the most” to “It bothers me when I hear this”). We first present the frequencies of their answers with regard to all 15 musical genres offered, and also the gender, age, and educational distribution of responses/attitudes. We then use cluster analysis to reconstruct the types of musical taste in Serbia and Macedonia and analyze their distribution along the socio-demographic dimensions presented so far. In the end of this part, based on the answer “It bothers me when I hear this”, with regard
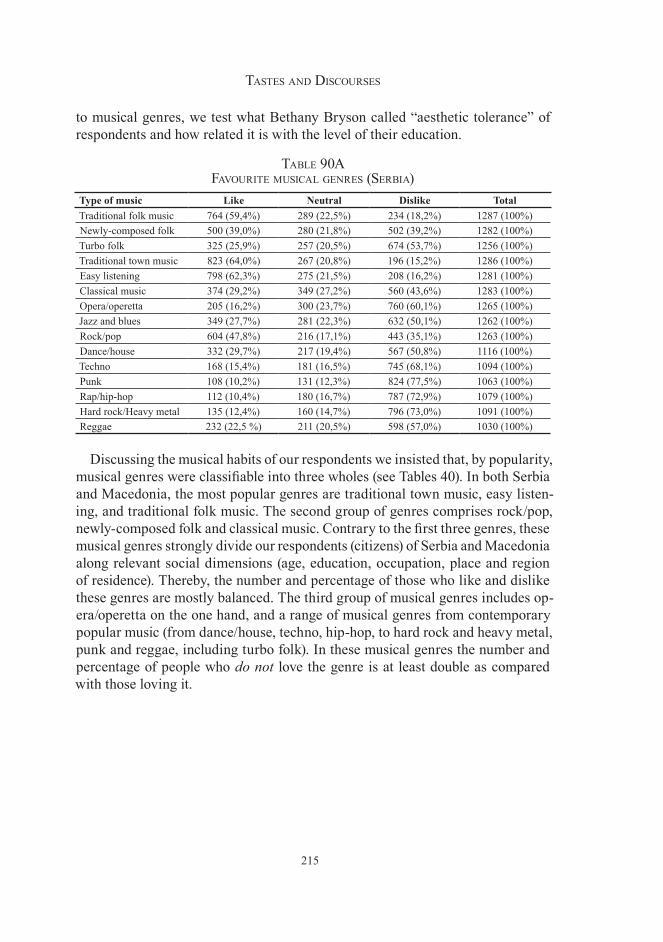
215
tastes aNd disCourses
to musical genres, we test what Bethany Bryson called “aesthetic tolerance” of respondents and how related it is with the level of their education.
table 90a favourite MusiCal geNres (serbia)
Type of music Like Neutral Dislike TotalTraditional folk music 764 (59,4%) 289 (22,5%) 234 (18,2%) 1287 (100%)Newly-composed folk 500 (39,0%) 280 (21,8%) 502 (39,2%) 1282 (100%)Turbo folk 325 (25,9%) 257 (20,5%) 674 (53,7%) 1256 (100%)Traditional town music 823 (64,0%) 267 (20,8%) 196 (15,2%) 1286 (100%)Easy listening 798 (62,3%) 275 (21,5%) 208 (16,2%) 1281 (100%)Classical music 374 (29,2%) 349 (27,2%) 560 (43,6%) 1283 (100%)Opera/operetta 205 (16,2%) 300 (23,7%) 760 (60,1%) 1265 (100%)Jazz and blues 349 (27,7%) 281 (22,3%) 632 (50,1%) 1262 (100%)Rock/pop 604 (47,8%) 216 (17,1%) 443 (35,1%) 1263 (100%)Dance/house 332 (29,7%) 217 (19,4%) 567 (50,8%) 1116 (100%)Techno 168 (15,4%) 181 (16,5%) 745 (68,1%) 1094 (100%)Punk 108 (10,2%) 131 (12,3%) 824 (77,5%) 1063 (100%)Rap/hip-hop 112 (10,4%) 180 (16,7%) 787 (72,9%) 1079 (100%)Hard rock/Heavy metal 135 (12,4%) 160 (14,7%) 796 (73,0%) 1091 (100%)Reggae 232 (22,5 %) 211 (20,5%) 598 (57,0%) 1030 (100%)
Discussing the musical habits of our respondents we insisted that, by popularity, musical genres were classifiable into three wholes (see Tables 40). In both Serbia and Macedonia, the most popular genres are traditional town music, easy listen-ing, and traditional folk music. The second group of genres comprises rock/pop, newly-composed folk and classical music. Contrary to the first three genres, these musical genres strongly divide our respondents (citizens) of Serbia and Macedonia along relevant social dimensions (age, education, occupation, place and region of residence). Thereby, the number and percentage of those who like and dislike these genres are mostly balanced. The third group of musical genres includes op-era/operetta on the one hand, and a range of musical genres from contemporary popular music (from dance/house, techno, hip-hop, to hard rock and heavy metal, punk and reggae, including turbo folk). In these musical genres the number and percentage of people who do not love the genre is at least double as compared with those loving it.
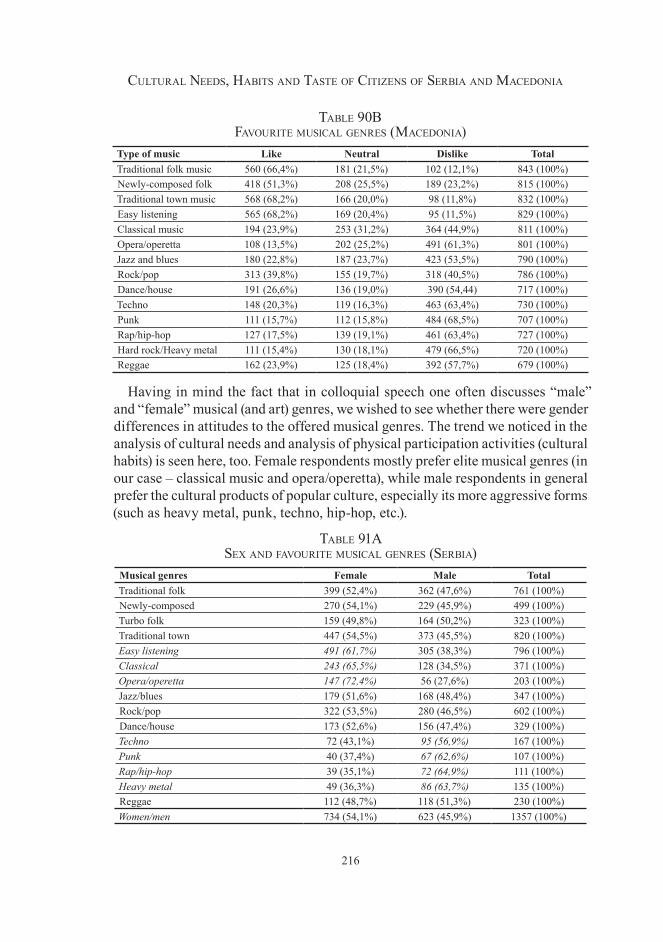
216
Cultural Needs, Habits aNd taste of CitizeNs of serbia aNd MaCedoNia
table 90b favourite MusiCal geNres (MaCedoNia)
Type of music Like Neutral Dislike TotalTraditional folk music 560 (66,4%) 181 (21,5%) 102 (12,1%) 843 (100%)Newly-composed folk 418 (51,3%) 208 (25,5%) 189 (23,2%) 815 (100%)Traditional town music 568 (68,2%) 166 (20,0%) 98 (11,8%) 832 (100%)Easy listening 565 (68,2%) 169 (20,4%) 95 (11,5%) 829 (100%)Classical music 194 (23,9%) 253 (31,2%) 364 (44,9%) 811 (100%)Opera/operetta 108 (13,5%) 202 (25,2%) 491 (61,3%) 801 (100%)Jazz and blues 180 (22,8%) 187 (23,7%) 423 (53,5%) 790 (100%)Rock/pop 313 (39,8%) 155 (19,7%) 318 (40,5%) 786 (100%)Dance/house 191 (26,6%) 136 (19,0%) 390 (54,44) 717 (100%)Techno 148 (20,3%) 119 (16,3%) 463 (63,4%) 730 (100%)Punk 111 (15,7%) 112 (15,8%) 484 (68,5%) 707 (100%)Rap/hip-hop 127 (17,5%) 139 (19,1%) 461 (63,4%) 727 (100%)Hard rock/Heavy metal 111 (15,4%) 130 (18,1%) 479 (66,5%) 720 (100%)Reggae 162 (23,9%) 125 (18,4%) 392 (57,7%) 679 (100%)
Having in mind the fact that in colloquial speech one often discusses “male” and “female” musical (and art) genres, we wished to see whether there were gender differences in attitudes to the offered musical genres. The trend we noticed in the analysis of cultural needs and analysis of physical participation activities (cultural habits) is seen here, too. Female respondents mostly prefer elite musical genres (in our case – classical music and opera/operetta), while male respondents in general prefer the cultural products of popular culture, especially its more aggressive forms (such as heavy metal, punk, techno, hip-hop, etc.).
table 91a sex aNd favourite MusiCal geNres (serbia)
Musical genres Female Male TotalTraditional folk 399 (52,4%) 362 (47,6%) 761 (100%)Newly-composed 270 (54,1%) 229 (45,9%) 499 (100%)Turbo folk 159 (49,8%) 164 (50,2%) 323 (100%)Traditional town 447 (54,5%) 373 (45,5%) 820 (100%)Easy listening 491 (61,7%) 305 (38,3%) 796 (100%)Classical 243 (65,5%) 128 (34,5%) 371 (100%)Opera/operetta 147 (72,4%) 56 (27,6%) 203 (100%)Jazz/blues 179 (51,6%) 168 (48,4%) 347 (100%)Rock/pop 322 (53,5%) 280 (46,5%) 602 (100%)Dance/house 173 (52,6%) 156 (47,4%) 329 (100%)Techno 72 (43,1%) 95 (56,9%) 167 (100%)Punk 40 (37,4%) 67 (62,6%) 107 (100%)Rap/hip-hop 39 (35,1%) 72 (64,9%) 111 (100%)Heavy metal 49 (36,3%) 86 (63,7%) 135 (100%)Reggae 112 (48,7%) 118 (51,3%) 230 (100%)Women/men 734 (54,1%) 623 (45,9%) 1357 (100%)
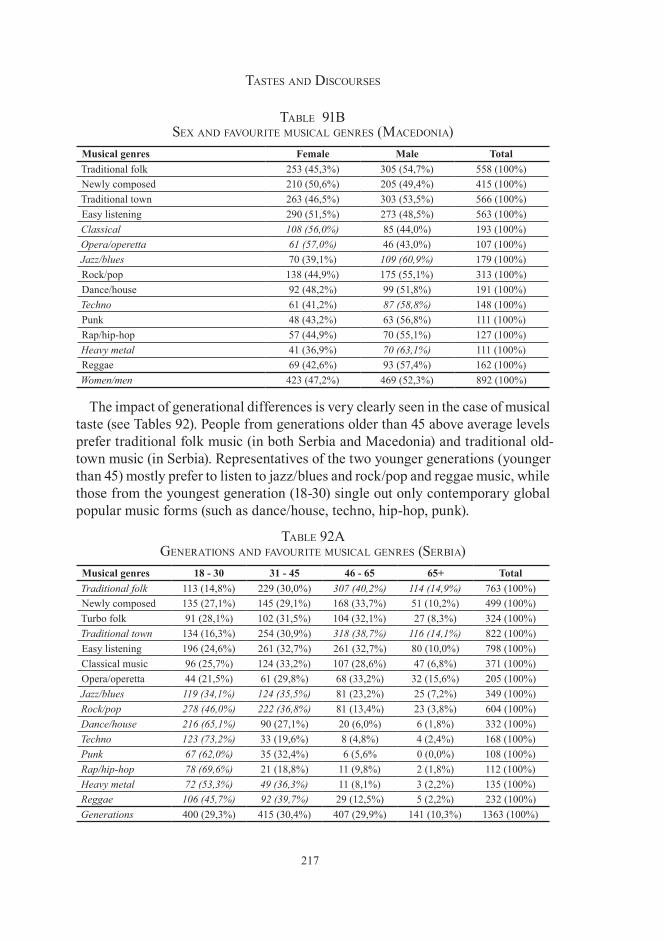
217
tastes aNd disCourses
table 91b sex aNd favourite MusiCal geNres (MaCedoNia)
Musical genres Female Male TotalTraditional folk 253 (45,3%) 305 (54,7%) 558 (100%)Newly composed 210 (50,6%) 205 (49,4%) 415 (100%)Traditional town 263 (46,5%) 303 (53,5%) 566 (100%)Easy listening 290 (51,5%) 273 (48,5%) 563 (100%)Classical 108 (56,0%) 85 (44,0%) 193 (100%)Opera/operetta 61 (57,0%) 46 (43,0%) 107 (100%)Jazz/blues 70 (39,1%) 109 (60,9%) 179 (100%)Rock/pop 138 (44,9%) 175 (55,1%) 313 (100%)Dance/house 92 (48,2%) 99 (51,8%) 191 (100%)Techno 61 (41,2%) 87 (58,8%) 148 (100%)Punk 48 (43,2%) 63 (56,8%) 111 (100%)Rap/hip-hop 57 (44,9%) 70 (55,1%) 127 (100%)Heavy metal 41 (36,9%) 70 (63,1%) 111 (100%)Reggae 69 (42,6%) 93 (57,4%) 162 (100%)Women/men 423 (47,2%) 469 (52,3%) 892 (100%)
The impact of generational differences is very clearly seen in the case of musical taste (see Tables 92). People from generations older than 45 above average levels prefer traditional folk music (in both Serbia and Macedonia) and traditional old-town music (in Serbia). Representatives of the two younger generations (younger than 45) mostly prefer to listen to jazz/blues and rock/pop and reggae music, while those from the youngest generation (18-30) single out only contemporary global popular music forms (such as dance/house, techno, hip-hop, punk).
table 92a geNeratioNs aNd favourite MusiCal geNres (serbia)
Musical genres 18 - 30 31 - 45 46 - 65 65+ TotalTraditional folk 113 (14,8%) 229 (30,0%) 307 (40,2%) 114 (14,9%) 763 (100%)Newly composed 135 (27,1%) 145 (29,1%) 168 (33,7%) 51 (10,2%) 499 (100%)Turbo folk 91 (28,1%) 102 (31,5%) 104 (32,1%) 27 (8,3%) 324 (100%)Traditional town 134 (16,3%) 254 (30,9%) 318 (38,7%) 116 (14,1%) 822 (100%)Easy listening 196 (24,6%) 261 (32,7%) 261 (32,7%) 80 (10,0%) 798 (100%)Classical music 96 (25,7%) 124 (33,2%) 107 (28,6%) 47 (6,8%) 371 (100%)Opera/operetta 44 (21,5%) 61 (29,8%) 68 (33,2%) 32 (15,6%) 205 (100%)Jazz/blues 119 (34,1%) 124 (35,5%) 81 (23,2%) 25 (7,2%) 349 (100%)Rock/pop 278 (46,0%) 222 (36,8%) 81 (13,4%) 23 (3,8%) 604 (100%)Dance/house 216 (65,1%) 90 (27,1%) 20 (6,0%) 6 (1,8%) 332 (100%)Techno 123 (73,2%) 33 (19,6%) 8 (4,8%) 4 (2,4%) 168 (100%)Punk 67 (62,0%) 35 (32,4%) 6 (5,6% 0 (0,0%) 108 (100%)Rap/hip-hop 78 (69,6%) 21 (18,8%) 11 (9,8%) 2 (1,8%) 112 (100%)Heavy metal 72 (53,3%) 49 (36,3%) 11 (8,1%) 3 (2,2%) 135 (100%)Reggae 106 (45,7%) 92 (39,7%) 29 (12,5%) 5 (2,2%) 232 (100%)Generations 400 (29,3%) 415 (30,4%) 407 (29,9%) 141 (10,3%) 1363 (100%)
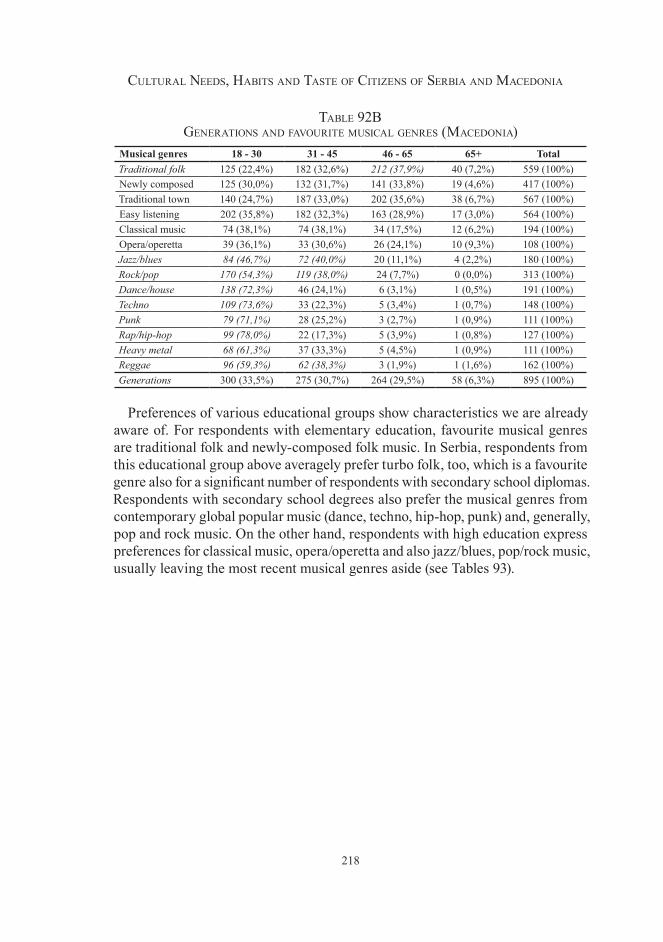
218
Cultural Needs, Habits aNd taste of CitizeNs of serbia aNd MaCedoNia
table 92b geNeratioNs aNd favourite MusiCal geNres (MaCedoNia)
Musical genres 18 - 30 31 - 45 46 - 65 65+ TotalTraditional folk 125 (22,4%) 182 (32,6%) 212 (37,9%) 40 (7,2%) 559 (100%)Newly composed 125 (30,0%) 132 (31,7%) 141 (33,8%) 19 (4,6%) 417 (100%)Traditional town 140 (24,7%) 187 (33,0%) 202 (35,6%) 38 (6,7%) 567 (100%)Easy listening 202 (35,8%) 182 (32,3%) 163 (28,9%) 17 (3,0%) 564 (100%)Classical music 74 (38,1%) 74 (38,1%) 34 (17,5%) 12 (6,2%) 194 (100%)Opera/operetta 39 (36,1%) 33 (30,6%) 26 (24,1%) 10 (9,3%) 108 (100%)Jazz/blues 84 (46,7%) 72 (40,0%) 20 (11,1%) 4 (2,2%) 180 (100%)Rock/pop 170 (54,3%) 119 (38,0%) 24 (7,7%) 0 (0,0%) 313 (100%)Dance/house 138 (72,3%) 46 (24,1%) 6 (3,1%) 1 (0,5%) 191 (100%)Techno 109 (73,6%) 33 (22,3%) 5 (3,4%) 1 (0,7%) 148 (100%)Punk 79 (71,1%) 28 (25,2%) 3 (2,7%) 1 (0,9%) 111 (100%)Rap/hip-hop 99 (78,0%) 22 (17,3%) 5 (3,9%) 1 (0,8%) 127 (100%)Heavy metal 68 (61,3%) 37 (33,3%) 5 (4,5%) 1 (0,9%) 111 (100%)Reggae 96 (59,3%) 62 (38,3%) 3 (1,9%) 1 (1,6%) 162 (100%)Generations 300 (33,5%) 275 (30,7%) 264 (29,5%) 58 (6,3%) 895 (100%)
Preferences of various educational groups show characteristics we are already aware of. For respondents with elementary education, favourite musical genres are traditional folk and newly-composed folk music. In Serbia, respondents from this educational group above averagely prefer turbo folk, too, which is a favourite genre also for a significant number of respondents with secondary school diplomas. Respondents with secondary school degrees also prefer the musical genres from contemporary global popular music (dance, techno, hip-hop, punk) and, generally, pop and rock music. On the other hand, respondents with high education express preferences for classical music, opera/operetta and also jazz/blues, pop/rock music, usually leaving the most recent musical genres aside (see Tables 93).
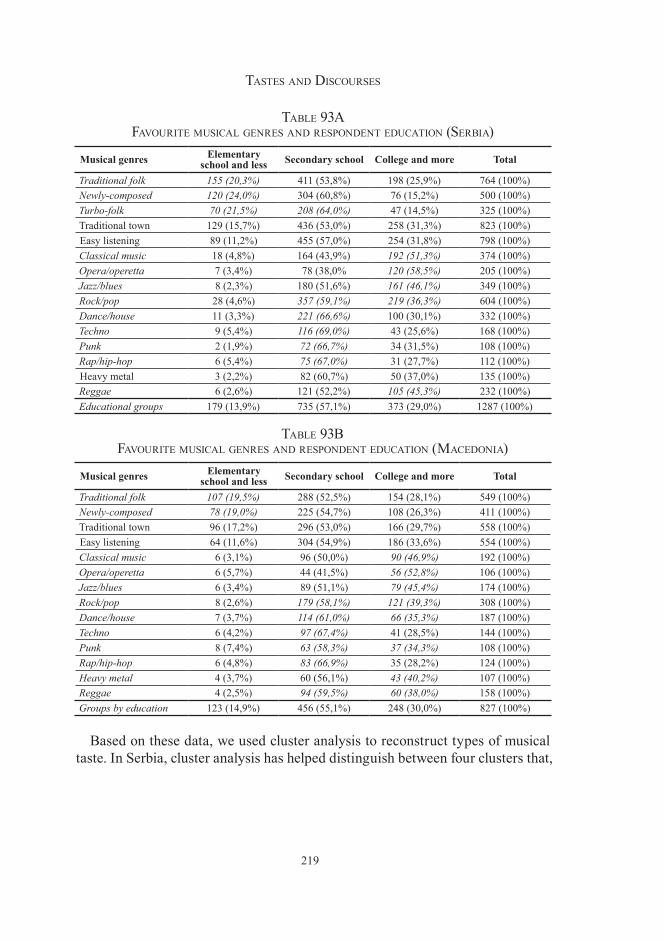
219
tastes aNd disCourses
table 9�a favourite MusiCal geNres aNd respoNdeNt eduCatioN (serbia)
Musical genres Elementary school and less Secondary school College and more Total
Traditional folk 155 (20,3%) 411 (53,8%) 198 (25,9%) 764 (100%)Newly-composed 120 (24,0%) 304 (60,8%) 76 (15,2%) 500 (100%)Turbo-folk 70 (21,5%) 208 (64,0%) 47 (14,5%) 325 (100%)Traditional town 129 (15,7%) 436 (53,0%) 258 (31,3%) 823 (100%)Easy listening 89 (11,2%) 455 (57,0%) 254 (31,8%) 798 (100%)Classical music 18 (4,8%) 164 (43,9%) 192 (51,3%) 374 (100%)Opera/operetta 7 (3,4%) 78 (38,0% 120 (58,5%) 205 (100%)Jazz/blues 8 (2,3%) 180 (51,6%) 161 (46,1%) 349 (100%)Rock/pop 28 (4,6%) 357 (59,1%) 219 (36,3%) 604 (100%)Dance/house 11 (3,3%) 221 (66,6%) 100 (30,1%) 332 (100%)Techno 9 (5,4%) 116 (69,0%) 43 (25,6%) 168 (100%)Punk 2 (1,9%) 72 (66,7%) 34 (31,5%) 108 (100%)Rap/hip-hop 6 (5,4%) 75 (67,0%) 31 (27,7%) 112 (100%)Heavy metal 3 (2,2%) 82 (60,7%) 50 (37,0%) 135 (100%)Reggae 6 (2,6%) 121 (52,2%) 105 (45,3%) 232 (100%)Educational groups 179 (13,9%) 735 (57,1%) 373 (29,0%) 1287 (100%)
table 9�b favourite MusiCal geNres aNd respoNdeNt eduCatioN (MaCedoNia)
Musical genres Elementary school and less Secondary school College and more Total
Traditional folk 107 (19,5%) 288 (52,5%) 154 (28,1%) 549 (100%)Newly-composed 78 (19,0%) 225 (54,7%) 108 (26,3%) 411 (100%)Traditional town 96 (17,2%) 296 (53,0%) 166 (29,7%) 558 (100%)Easy listening 64 (11,6%) 304 (54,9%) 186 (33,6%) 554 (100%)Classical music 6 (3,1%) 96 (50,0%) 90 (46,9%) 192 (100%)Opera/operetta 6 (5,7%) 44 (41,5%) 56 (52,8%) 106 (100%)Jazz/blues 6 (3,4%) 89 (51,1%) 79 (45,4%) 174 (100%)Rock/pop 8 (2,6%) 179 (58,1%) 121 (39,3%) 308 (100%)Dance/house 7 (3,7%) 114 (61,0%) 66 (35,3%) 187 (100%)Techno 6 (4,2%) 97 (67,4%) 41 (28,5%) 144 (100%)Punk 8 (7,4%) 63 (58,3%) 37 (34,3%) 108 (100%)Rap/hip-hop 6 (4,8%) 83 (66,9%) 35 (28,2%) 124 (100%)Heavy metal 4 (3,7%) 60 (56,1%) 43 (40,2%) 107 (100%)Reggae 4 (2,5%) 94 (59,5%) 60 (38,0%) 158 (100%)Groups by education 123 (14,9%) 456 (55,1%) 248 (30,0%) 827 (100%)
Based on these data, we used cluster analysis to reconstruct types of musical taste. In Serbia, cluster analysis has helped distinguish between four clusters that,
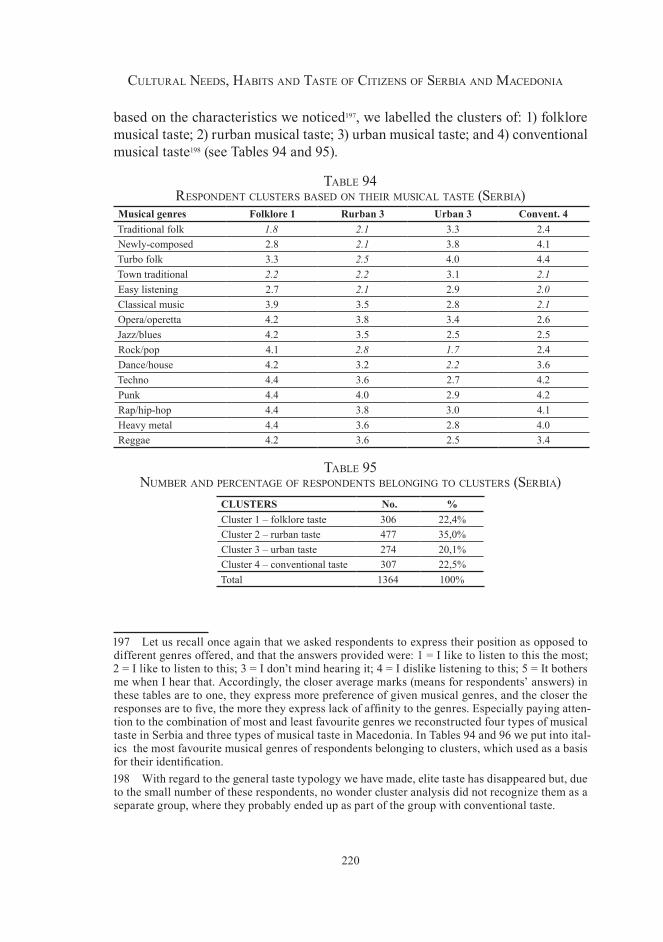
220
Cultural Needs, Habits aNd taste of CitizeNs of serbia aNd MaCedoNia
based on the characteristics we noticed197, we labelled the clusters of: 1) folklore musical taste; 2) rurban musical taste; 3) urban musical taste; and 4) conventional musical taste198 (see Tables 94 and 95).
table 94 respoNdeNt Clusters based oN tHeir MusiCal taste (serbia)
Musical genres Folklore 1 Rurban 3 Urban 3 Convent. 4Traditional folk 1.8 2.1 3.3 2.4Newly-composed 2.8 2.1 3.8 4.1Turbo folk 3.3 2.5 4.0 4.4Town traditional 2.2 2.2 3.1 2.1Easy listening 2.7 2.1 2.9 2.0Classical music 3.9 3.5 2.8 2.1Opera/operetta 4.2 3.8 3.4 2.6Jazz/blues 4.2 3.5 2.5 2.5Rock/pop 4.1 2.8 1.7 2.4Dance/house 4.2 3.2 2.2 3.6Techno 4.4 3.6 2.7 4.2Punk 4.4 4.0 2.9 4.2Rap/hip-hop 4.4 3.8 3.0 4.1Heavy metal 4.4 3.6 2.8 4.0Reggae 4.2 3.6 2.5 3.4
table 95 NuMber aNd perCeNtage of respoNdeNts beloNgiNg to Clusters (serbia)
CLUSTERS No. %Cluster 1 – folklore taste 306 22,4%Cluster 2 – rurban taste 477 35,0%Cluster 3 – urban taste 274 20,1%Cluster 4 – conventional taste 307 22,5%Total 1364 100%
197 Let us recall once again that we asked respondents to express their position as opposed to different genres offered, and that the answers provided were: 1 = I like to listen to this the most; 2 = I like to listen to this; 3 = I don’t mind hearing it; 4 = I dislike listening to this; 5 = It bothers me when I hear that. Accordingly, the closer average marks (means for respondents’ answers) in these tables are to one, they express more preference of given musical genres, and the closer the responses are to five, the more they express lack of affinity to the genres. Especially paying atten-tion to the combination of most and least favourite genres we reconstructed four types of musical taste in Serbia and three types of musical taste in Macedonia. In Tables 94 and 96 we put into ital-ics the most favourite musical genres of respondents belonging to clusters, which used as a basis for their identification. 198 With regard to the general taste typology we have made, elite taste has disappeared but, due to the small number of these respondents, no wonder cluster analysis did not recognize them as a separate group, where they probably ended up as part of the group with conventional taste.
221
tastes aNd disCourses
Contrary to Serbia, where two typologies (global taste typology and musical taste typology) mostly match, cluster analysis of Macedonian musical preferences distinguished between three clusters that we called 1) folklore musical taste; 2) urban musical taste; and 3) local conventional musical taste. While the first and the second cluster were relatively “clean” and the principle of their organization relatively easy for decoding, in the case of the third cluster we were not quite sure as to what to do. The most favourite musical genres in this respondent group were easy listening and town traditional music, so we thought we should define them as the conventional taste group. Contributing to this was also the “assess-ment” of classical music (3 – meaning “I do not mind hearing it”), as opposed to, say, responses from the folklore taste cluster, where classical music was assessed as “I don’t like to hear this” – 3.9. On the other hand (bolded in the table), these respondents have an equal relationship to newly-composed folk music and rock/pop music (2.7) – which we treated as one of the main characteristics of rurban omnivores. Finally, when we crosstabulated general types of taste with musical taste clusters in Macedonia, respondents from this group of musical tastes ended up in almost equal numbers in the groups for rurban taste and conventional taste (in the general typology)199. For this reason, in the end, we added another cluster to our list – seemingly the most paradoxical – but also suggestive of an important property of taste in Macedonia. We named the cluster “rurb-conventional” or “local conventional” musical taste”200 – not only mechanically blending the names of two types of discourse from general typology, but also sensing that mixing the genres (those belonging to local and global cultural milieus) is something that represents a dominant view of things in Macedonia – indeed a convention.
199 We should mention that we also checked whether another type of organization into clusters would better distribute musical tastes in Macedonia. Not only did the three-degree classification show a “reducing” of distance with regard to the cluster centre more than other segmentations, but also other segmentations were even more confusing, from the standpoint of distribution between global and local milieus. 200 According to our taste typology, we assumed that respondents with conventional taste would belong to the global cultural milieu, because works of art they turn to mostly belong to interna-tional cultural forms, so that the modifier “local” points to the specific nature of this taste group.
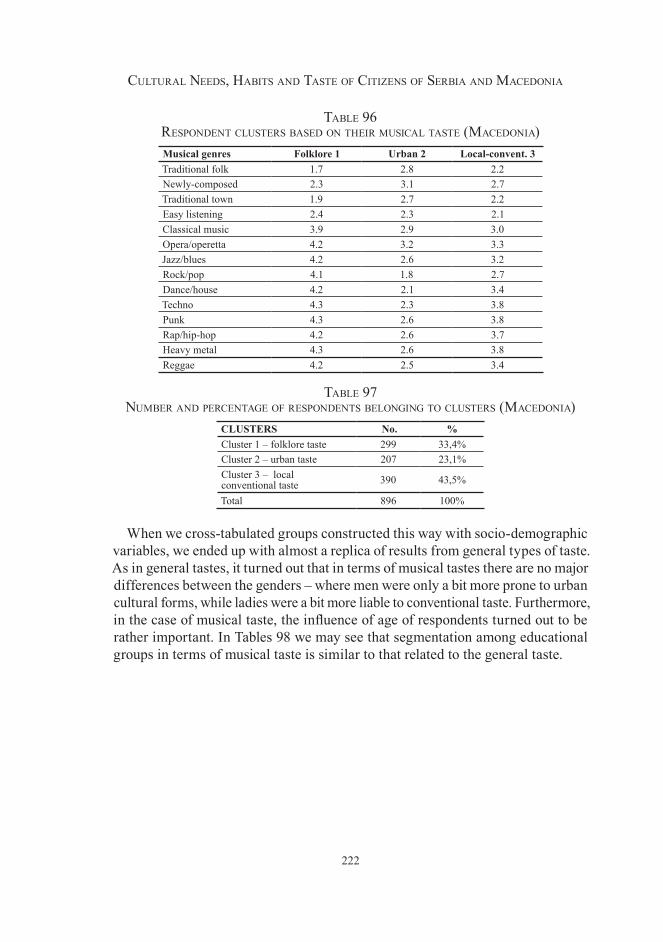
222
Cultural Needs, Habits aNd taste of CitizeNs of serbia aNd MaCedoNia
table 96 respoNdeNt Clusters based oN tHeir MusiCal taste (MaCedoNia)Musical genres Folklore 1 Urban 2 Local-convent. 3Traditional folk 1.7 2.8 2.2Newly-composed 2.3 3.1 2.7Traditional town 1.9 2.7 2.2Easy listening 2.4 2.3 2.1Classical music 3.9 2.9 3.0Opera/operetta 4.2 3.2 3.3Jazz/blues 4.2 2.6 3.2Rock/pop 4.1 1.8 2.7Dance/house 4.2 2.1 3.4Techno 4.3 2.3 3.8Punk 4.3 2.6 3.8Rap/hip-hop 4.2 2.6 3.7Heavy metal 4.3 2.6 3.8Reggae 4.2 2.5 3.4
table 97 NuMber aNd perCeNtage of respoNdeNts beloNgiNg to Clusters (MaCedoNia)
CLUSTERS No. %Cluster 1 – folklore taste 299 33,4%Cluster 2 – urban taste 207 23,1%Cluster 3 – local conventional taste 390 43,5%
Total 896 100%
When we cross-tabulated groups constructed this way with socio-demographic variables, we ended up with almost a replica of results from general types of taste. As in general tastes, it turned out that in terms of musical tastes there are no major differences between the genders – where men were only a bit more prone to urban cultural forms, while ladies were a bit more liable to conventional taste. Furthermore, in the case of musical taste, the influence of age of respondents turned out to be rather important. In Tables 98 we may see that segmentation among educational groups in terms of musical taste is similar to that related to the general taste.
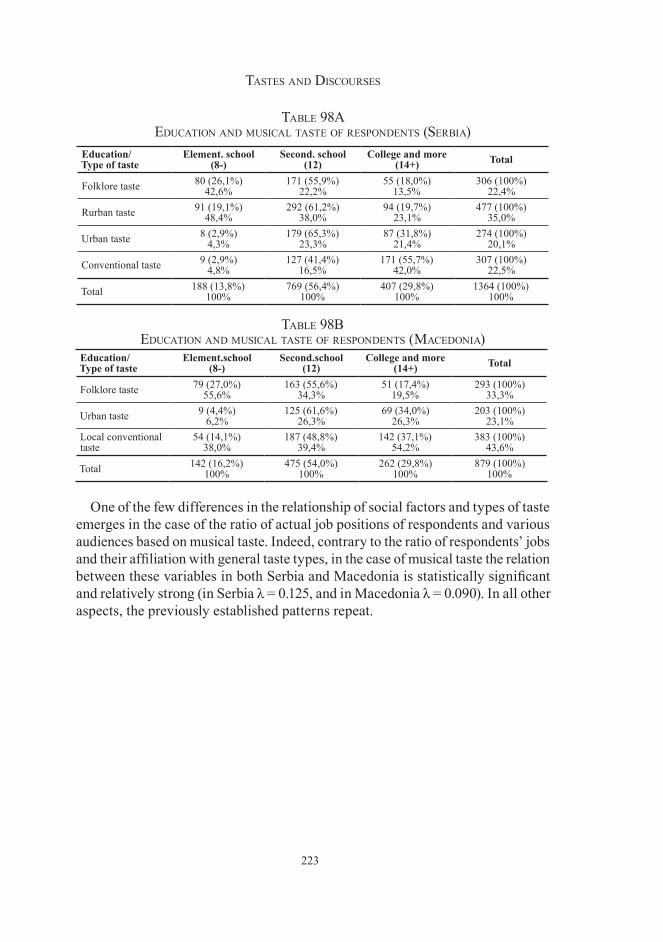
223
tastes aNd disCourses
table 98a eduCatioN aNd MusiCal taste of respoNdeNts (serbia)
Education/Type of taste
Element. school(8-)
Second. school(12)
College and more (14+) Total
Folklore taste 80 (26,1%)42,6%
171 (55,9%)22,2%
55 (18,0%)13,5%
306 (100%)22,4%
Rurban taste 91 (19,1%)48,4%
292 (61,2%)38,0%
94 (19,7%)23,1%
477 (100%)35,0%
Urban taste 8 (2,9%)4,3%
179 (65,3%)23,3%
87 (31,8%)21,4%
274 (100%)20,1%
Conventional taste 9 (2,9%)4,8%
127 (41,4%)16,5%
171 (55,7%)42,0%
307 (100%)22,5%
Total 188 (13,8%)100%
769 (56,4%)100%
407 (29,8%)100%
1364 (100%)100%
table 98b eduCatioN aNd MusiCal taste of respoNdeNts (MaCedoNia)
Education/Type of taste
Element.school(8-)
Second.school(12)
College and more (14+) Total
Folklore taste 79 (27,0%)55,6%
163 (55,6%)34,3%
51 (17,4%)19,5%
293 (100%)33,3%
Urban taste 9 (4,4%)6,2%
125 (61,6%)26,3%
69 (34,0%)26,3%
203 (100%)23,1%
Local conventional taste
54 (14,1%)38,0%
187 (48,8%)39,4%
142 (37,1%)54,2%
383 (100%)43,6%
Total 142 (16,2%)100%
475 (54,0%)100%
262 (29,8%)100%
879 (100%)100%
One of the few differences in the relationship of social factors and types of taste emerges in the case of the ratio of actual job positions of respondents and various audiences based on musical taste. Indeed, contrary to the ratio of respondents’ jobs and their affiliation with general taste types, in the case of musical taste the relation between these variables in both Serbia and Macedonia is statistically significant and relatively strong (in Serbia λ = 0.125, and in Macedonia λ = 0.090). In all other aspects, the previously established patterns repeat.
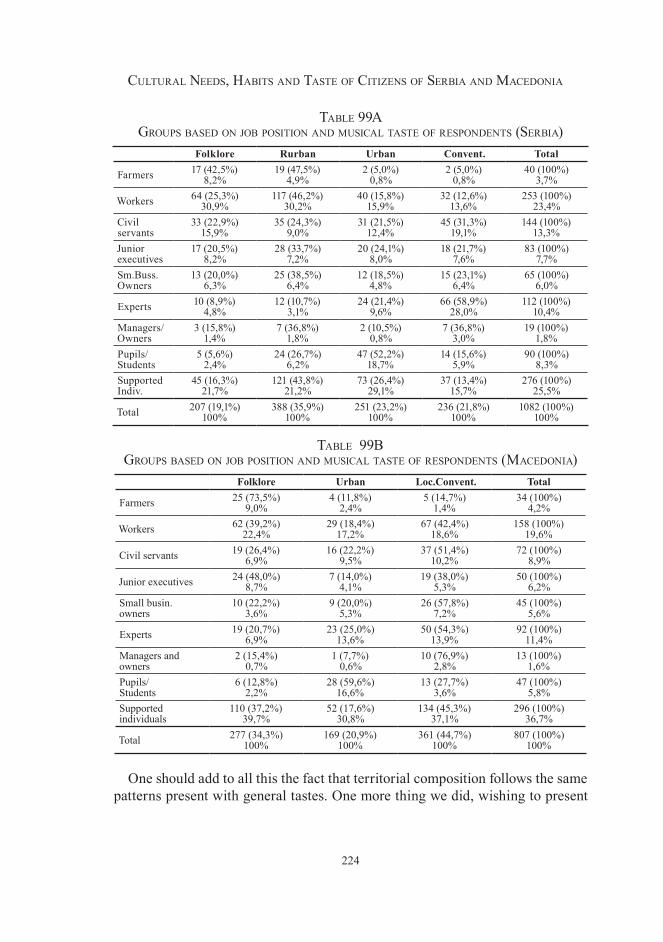
224
Cultural Needs, Habits aNd taste of CitizeNs of serbia aNd MaCedoNia
table 99a groups based oN job positioN aNd MusiCal taste of respoNdeNts (serbia)
Folklore Rurban Urban Convent. Total
Farmers 17 (42,5%)8,2%
19 (47,5%)4,9%
2 (5,0%)0,8%
2 (5,0%)0,8%
40 (100%)3,7%
Workers 64 (25,3%)30,9%
117 (46,2%)30,2%
40 (15,8%)15,9%
32 (12,6%)13,6%
253 (100%)23,4%
Civil servants
33 (22,9%)15,9%
35 (24,3%)9,0%
31 (21,5%)12,4%
45 (31,3%)19,1%
144 (100%)13,3%
Junior executives
17 (20,5%)8,2%
28 (33,7%)7,2%
20 (24,1%)8,0%
18 (21,7%)7,6%
83 (100%)7,7%
Sm.Buss. Owners
13 (20,0%)6,3%
25 (38,5%)6,4%
12 (18,5%)4,8%
15 (23,1%)6,4%
65 (100%)6,0%
Experts 10 (8,9%)4,8%
12 (10,7%)3,1%
24 (21,4%)9,6%
66 (58,9%)28,0%
112 (100%)10,4%
Managers/Owners
3 (15,8%)1,4%
7 (36,8%)1,8%
2 (10,5%)0,8%
7 (36,8%)3,0%
19 (100%)1,8%
Pupils/ Students
5 (5,6%)2,4%
24 (26,7%)6,2%
47 (52,2%)18,7%
14 (15,6%)5,9%
90 (100%)8,3%
Supported Indiv.
45 (16,3%)21,7%
121 (43,8%)21,2%
73 (26,4%)29,1%
37 (13,4%)15,7%
276 (100%)25,5%
Total 207 (19,1%)100%
388 (35,9%)100%
251 (23,2%)100%
236 (21,8%)100%
1082 (100%)100%
table 99b groups based oN job positioN aNd MusiCal taste of respoNdeNts (MaCedoNia)
Folklore Urban Loc.Convent. Total
Farmers 25 (73,5%)9,0%
4 (11,8%)2,4%
5 (14,7%)1,4%
34 (100%)4,2%
Workers 62 (39,2%)22,4%
29 (18,4%)17,2%
67 (42,4%)18,6%
158 (100%)19,6%
Civil servants 19 (26,4%)6,9%
16 (22,2%)9,5%
37 (51,4%)10,2%
72 (100%)8,9%
Junior executives 24 (48,0%)8,7%
7 (14,0%)4,1%
19 (38,0%)5,3%
50 (100%)6,2%
Small busin. owners
10 (22,2%)3,6%
9 (20,0%)5,3%
26 (57,8%)7,2%
45 (100%)5,6%
Experts 19 (20,7%)6,9%
23 (25,0%)13,6%
50 (54,3%)13,9%
92 (100%)11,4%
Managers and owners
2 (15,4%)0,7%
1 (7,7%)0,6%
10 (76,9%)2,8%
13 (100%)1,6%
Pupils/Students
6 (12,8%)2,2%
28 (59,6%)16,6%
13 (27,7%)3,6%
47 (100%)5,8%
Supported individuals
110 (37,2%)39,7%
52 (17,6%)30,8%
134 (45,3%)37,1%
296 (100%)36,7%
Total 277 (34,3%)100%
169 (20,9%)100%
361 (44,7%)100%
807 (100%)100%
One should add to all this the fact that territorial composition follows the same patterns present with general tastes. One more thing we did, wishing to present
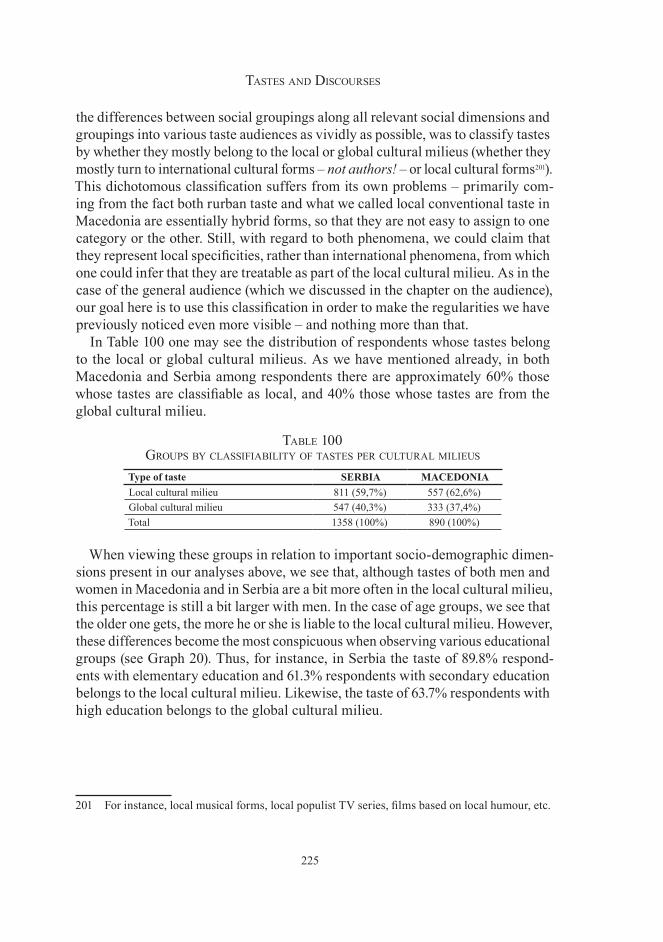
225
tastes aNd disCourses
the differences between social groupings along all relevant social dimensions and groupings into various taste audiences as vividly as possible, was to classify tastes by whether they mostly belong to the local or global cultural milieus (whether they mostly turn to international cultural forms – not authors! – or local cultural forms201). This dichotomous classification suffers from its own problems – primarily com-ing from the fact both rurban taste and what we called local conventional taste in Macedonia are essentially hybrid forms, so that they are not easy to assign to one category or the other. Still, with regard to both phenomena, we could claim that they represent local specificities, rather than international phenomena, from which one could infer that they are treatable as part of the local cultural milieu. As in the case of the general audience (which we discussed in the chapter on the audience), our goal here is to use this classification in order to make the regularities we have previously noticed even more visible – and nothing more than that.
In Table 100 one may see the distribution of respondents whose tastes belong to the local or global cultural milieus. As we have mentioned already, in both Macedonia and Serbia among respondents there are approximately 60% those whose tastes are classifiable as local, and 40% those whose tastes are from the global cultural milieu.
table 100 groups by Classifiability of tastes per Cultural Milieus
Type of taste SERBIA MACEDONIALocal cultural milieu 811 (59,7%) 557 (62,6%)Global cultural milieu 547 (40,3%) 333 (37,4%)Total 1358 (100%) 890 (100%)
When viewing these groups in relation to important socio-demographic dimen-sions present in our analyses above, we see that, although tastes of both men and women in Macedonia and in Serbia are a bit more often in the local cultural milieu, this percentage is still a bit larger with men. In the case of age groups, we see that the older one gets, the more he or she is liable to the local cultural milieu. However, these differences become the most conspicuous when observing various educational groups (see Graph 20). Thus, for instance, in Serbia the taste of 89.8% respond-ents with elementary education and 61.3% respondents with secondary education belongs to the local cultural milieu. Likewise, the taste of 63.7% respondents with high education belongs to the global cultural milieu.
201 For instance, local musical forms, local populist TV series, films based on local humour, etc.
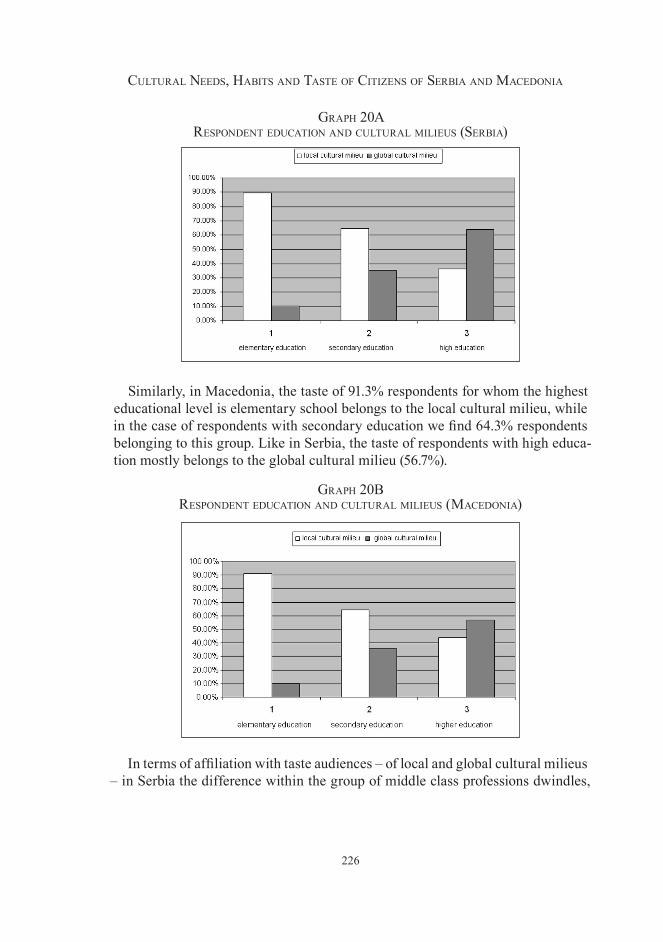
226
Cultural Needs, Habits aNd taste of CitizeNs of serbia aNd MaCedoNia
grapH 20a respoNdeNt eduCatioN aNd Cultural Milieus (serbia)
Similarly, in Macedonia, the taste of 91.3% respondents for whom the highest educational level is elementary school belongs to the local cultural milieu, while in the case of respondents with secondary education we find 64.3% respondents belonging to this group. Like in Serbia, the taste of respondents with high educa-tion mostly belongs to the global cultural milieu (56.7%).
grapH 20b respoNdeNt eduCatioN aNd Cultural Milieus (MaCedoNia)
In terms of affiliation with taste audiences – of local and global cultural milieus – in Serbia the difference within the group of middle class professions dwindles,
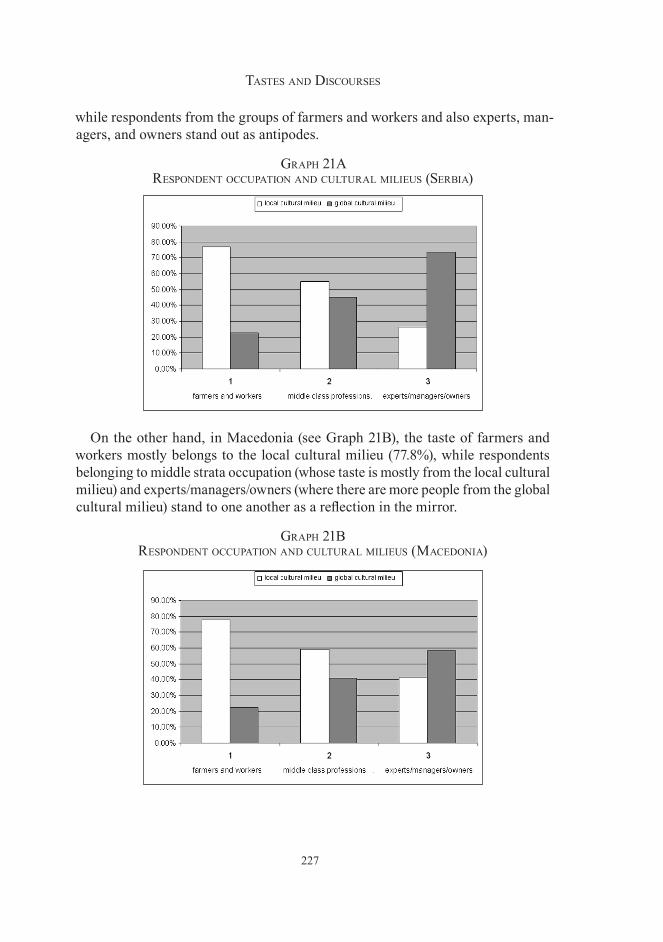
227
tastes aNd disCourses
while respondents from the groups of farmers and workers and also experts, man-agers, and owners stand out as antipodes.
grapH 21a respoNdeNt oCCupatioN aNd Cultural Milieus (serbia)
On the other hand, in Macedonia (see Graph 21B), the taste of farmers and workers mostly belongs to the local cultural milieu (77.8%), while respondents belonging to middle strata occupation (whose taste is mostly from the local cultural milieu) and experts/managers/owners (where there are more people from the global cultural milieu) stand to one another as a reflection in the mirror.
grapH 21b respoNdeNt oCCupatioN aNd Cultural Milieus (MaCedoNia)
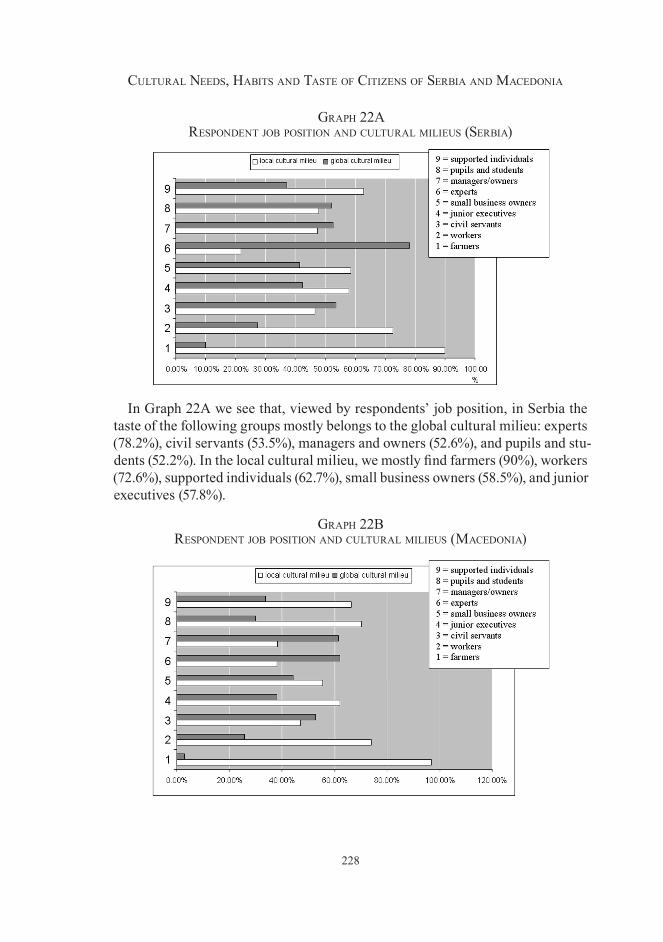
228
Cultural Needs, Habits aNd taste of CitizeNs of serbia aNd MaCedoNia
grapH 22a respoNdeNt job positioN aNd Cultural Milieus (serbia)
In Graph 22A we see that, viewed by respondents’ job position, in Serbia the taste of the following groups mostly belongs to the global cultural milieu: experts (78.2%), civil servants (53.5%), managers and owners (52.6%), and pupils and stu-dents (52.2%). In the local cultural milieu, we mostly find farmers (90%), workers (72.6%), supported individuals (62.7%), small business owners (58.5%), and junior executives (57.8%).
grapH 22b respoNdeNt job positioN aNd Cultural Milieus (MaCedoNia)
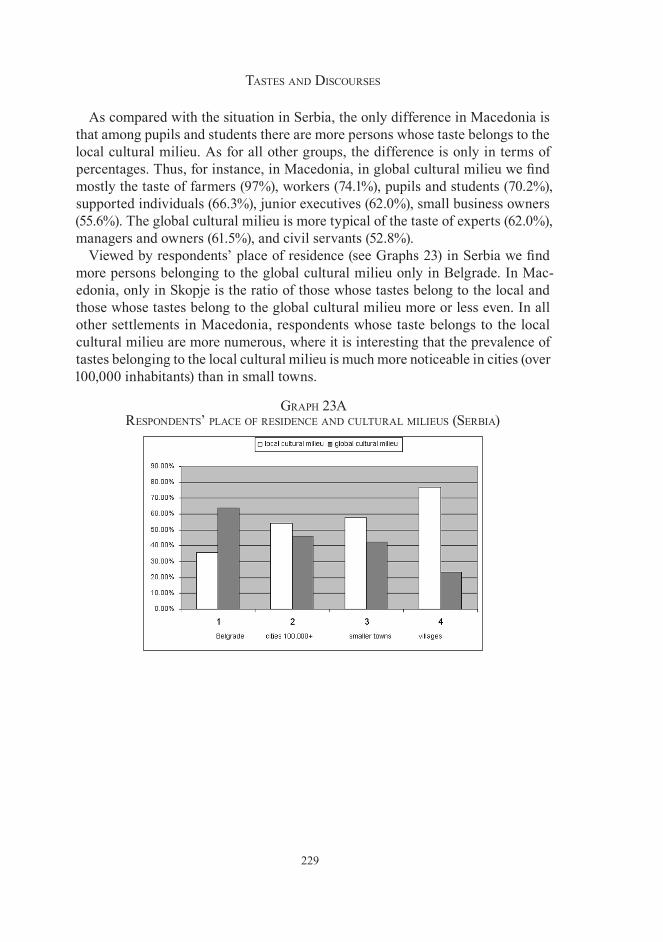
229
tastes aNd disCourses
As compared with the situation in Serbia, the only difference in Macedonia is that among pupils and students there are more persons whose taste belongs to the local cultural milieu. As for all other groups, the difference is only in terms of percentages. Thus, for instance, in Macedonia, in global cultural milieu we find mostly the taste of farmers (97%), workers (74.1%), pupils and students (70.2%), supported individuals (66.3%), junior executives (62.0%), small business owners (55.6%). The global cultural milieu is more typical of the taste of experts (62.0%), managers and owners (61.5%), and civil servants (52.8%).
Viewed by respondents’ place of residence (see Graphs 23) in Serbia we find more persons belonging to the global cultural milieu only in Belgrade. In Mac-edonia, only in Skopje is the ratio of those whose tastes belong to the local and those whose tastes belong to the global cultural milieu more or less even. In all other settlements in Macedonia, respondents whose taste belongs to the local cultural milieu are more numerous, where it is interesting that the prevalence of tastes belonging to the local cultural milieu is much more noticeable in cities (over 100,000 inhabitants) than in small towns.
grapH 2�a respoNdeNts’ plaCe of resideNCe aNd Cultural Milieus (serbia)
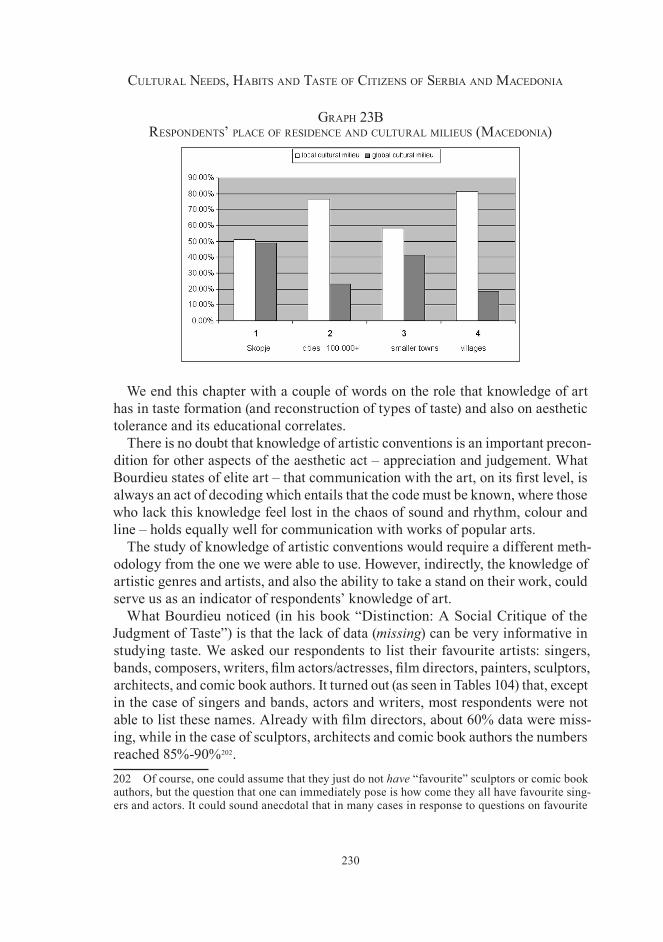
230
Cultural Needs, Habits aNd taste of CitizeNs of serbia aNd MaCedoNia
grapH 2�b respoNdeNts’ plaCe of resideNCe aNd Cultural Milieus (MaCedoNia)
We end this chapter with a couple of words on the role that knowledge of art has in taste formation (and reconstruction of types of taste) and also on aesthetic tolerance and its educational correlates.
There is no doubt that knowledge of artistic conventions is an important precon-dition for other aspects of the aesthetic act – appreciation and judgement. What Bourdieu states of elite art – that communication with the art, on its first level, is always an act of decoding which entails that the code must be known, where those who lack this knowledge feel lost in the chaos of sound and rhythm, colour and line – holds equally well for communication with works of popular arts.
The study of knowledge of artistic conventions would require a different meth-odology from the one we were able to use. However, indirectly, the knowledge of artistic genres and artists, and also the ability to take a stand on their work, could serve us as an indicator of respondents’ knowledge of art.
What Bourdieu noticed (in his book “Distinction: A Social Critique of the Judgment of Taste”) is that the lack of data (missing) can be very informative in studying taste. We asked our respondents to list their favourite artists: singers, bands, composers, writers, film actors/actresses, film directors, painters, sculptors, architects, and comic book authors. It turned out (as seen in Tables 104) that, except in the case of singers and bands, actors and writers, most respondents were not able to list these names. Already with film directors, about 60% data were miss-ing, while in the case of sculptors, architects and comic book authors the numbers reached 85%-90%202.202 Of course, one could assume that they just do not have “favourite” sculptors or comic book authors, but the question that one can immediately pose is how come they all have favourite sing-ers and actors. It could sound anecdotal that in many cases in response to questions on favourite
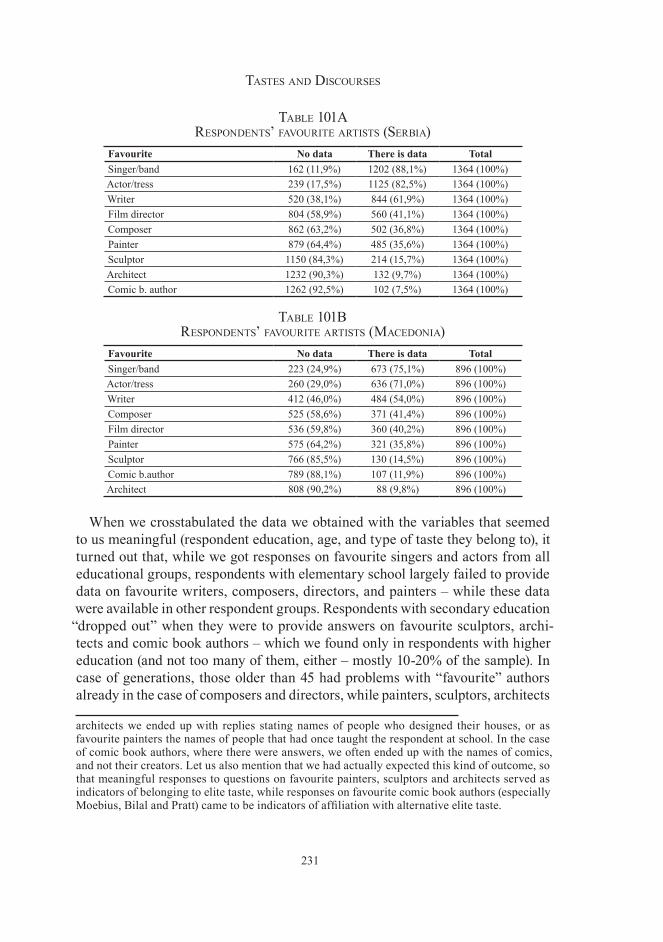
231
tastes aNd disCourses
table 101a respoNdeNts’ favourite artists (serbia)
Favourite No data There is data TotalSinger/band 162 (11,9%) 1202 (88,1%) 1364 (100%)Actor/tress 239 (17,5%) 1125 (82,5%) 1364 (100%)Writer 520 (38,1%) 844 (61,9%) 1364 (100%)Film director 804 (58,9%) 560 (41,1%) 1364 (100%)Composer 862 (63,2%) 502 (36,8%) 1364 (100%)Painter 879 (64,4%) 485 (35,6%) 1364 (100%)Sculptor 1150 (84,3%) 214 (15,7%) 1364 (100%)Architect 1232 (90,3%) 132 (9,7%) 1364 (100%)Comic b. author 1262 (92,5%) 102 (7,5%) 1364 (100%)
table 101b respoNdeNts’ favourite artists (MaCedoNia)
Favourite No data There is data TotalSinger/band 223 (24,9%) 673 (75,1%) 896 (100%)Actor/tress 260 (29,0%) 636 (71,0%) 896 (100%)Writer 412 (46,0%) 484 (54,0%) 896 (100%)Composer 525 (58,6%) 371 (41,4%) 896 (100%)Film director 536 (59,8%) 360 (40,2%) 896 (100%)Painter 575 (64,2%) 321 (35,8%) 896 (100%)Sculptor 766 (85,5%) 130 (14,5%) 896 (100%)Comic b.author 789 (88,1%) 107 (11,9%) 896 (100%)Architect 808 (90,2%) 88 (9,8%) 896 (100%)
When we crosstabulated the data we obtained with the variables that seemed to us meaningful (respondent education, age, and type of taste they belong to), it turned out that, while we got responses on favourite singers and actors from all educational groups, respondents with elementary school largely failed to provide data on favourite writers, composers, directors, and painters – while these data were available in other respondent groups. Respondents with secondary education “dropped out” when they were to provide answers on favourite sculptors, archi-tects and comic book authors – which we found only in respondents with higher education (and not too many of them, either – mostly 10-20% of the sample). In case of generations, those older than 45 had problems with “favourite” authors already in the case of composers and directors, while painters, sculptors, architects
architects we ended up with replies stating names of people who designed their houses, or as favourite painters the names of people that had once taught the respondent at school. In the case of comic book authors, where there were answers, we often ended up with the names of comics, and not their creators. Let us also mention that we had actually expected this kind of outcome, so that meaningful responses to questions on favourite painters, sculptors and architects served as indicators of belonging to elite taste, while responses on favourite comic book authors (especially Moebius, Bilal and Pratt) came to be indicators of affiliation with alternative elite taste.
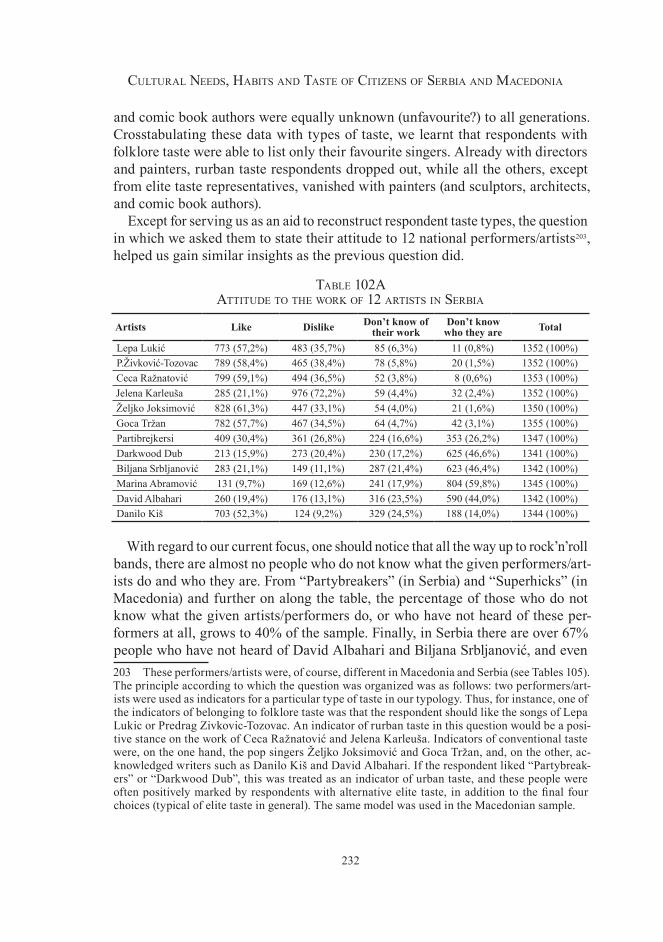
232
Cultural Needs, Habits aNd taste of CitizeNs of serbia aNd MaCedoNia
and comic book authors were equally unknown (unfavourite?) to all generations. Crosstabulating these data with types of taste, we learnt that respondents with folklore taste were able to list only their favourite singers. Already with directors and painters, rurban taste respondents dropped out, while all the others, except from elite taste representatives, vanished with painters (and sculptors, architects, and comic book authors).
Except for serving us as an aid to reconstruct respondent taste types, the question in which we asked them to state their attitude to 12 national performers/artists203, helped us gain similar insights as the previous question did.
table 102a attitude to tHe work of 12 artists iN serbia
Artists Like Dislike Don’t know of their work
Don’t know who they are Total
Lepa Lukić 773 (57,2%) 483 (35,7%) 85 (6,3%) 11 (0,8%) 1352 (100%)P.Živković-Tozovac 789 (58,4%) 465 (38,4%) 78 (5,8%) 20 (1,5%) 1352 (100%)Ceca Ražnatović 799 (59,1%) 494 (36,5%) 52 (3,8%) 8 (0,6%) 1353 (100%)Jelena Karleuša 285 (21,1%) 976 (72,2%) 59 (4,4%) 32 (2,4%) 1352 (100%)Željko Joksimović 828 (61,3%) 447 (33,1%) 54 (4,0%) 21 (1,6%) 1350 (100%)Goca Tržan 782 (57,7%) 467 (34,5%) 64 (4,7%) 42 (3,1%) 1355 (100%)Partibrejkersi 409 (30,4%) 361 (26,8%) 224 (16,6%) 353 (26,2%) 1347 (100%)Darkwood Dub 213 (15,9%) 273 (20,4%) 230 (17,2%) 625 (46,6%) 1341 (100%)Biljana Srbljanović 283 (21,1%) 149 (11,1%) 287 (21,4%) 623 (46,4%) 1342 (100%)Marina Abramović 131 (9,7%) 169 (12,6%) 241 (17,9%) 804 (59,8%) 1345 (100%)David Albahari 260 (19,4%) 176 (13,1%) 316 (23,5%) 590 (44,0%) 1342 (100%)Danilo Kiš 703 (52,3%) 124 (9,2%) 329 (24,5%) 188 (14,0%) 1344 (100%)
With regard to our current focus, one should notice that all the way up to rock’n’roll bands, there are almost no people who do not know what the given performers/art-ists do and who they are. From “Partybreakers” (in Serbia) and “Superhicks” (in Macedonia) and further on along the table, the percentage of those who do not know what the given artists/performers do, or who have not heard of these per-formers at all, grows to 40% of the sample. Finally, in Serbia there are over 67% people who have not heard of David Albahari and Biljana Srbljanović, and even 203 These performers/artists were, of course, different in Macedonia and Serbia (see Tables 105). The principle according to which the question was organized was as follows: two performers/art-ists were used as indicators for a particular type of taste in our typology. Thus, for instance, one of the indicators of belonging to folklore taste was that the respondent should like the songs of Lepa Lukic or Predrag Zivkovic-Tozovac. An indicator of rurban taste in this question would be a posi-tive stance on the work of Ceca Ražnatović and Jelena Karleuša. Indicators of conventional taste were, on the one hand, the pop singers Željko Joksimović and Goca Tržan, and, on the other, ac-knowledged writers such as Danilo Kiš and David Albahari. If the respondent liked “Partybreak-ers” or “Darkwood Dub”, this was treated as an indicator of urban taste, and these people were often positively marked by respondents with alternative elite taste, in addition to the final four choices (typical of elite taste in general). The same model was used in the Macedonian sample.
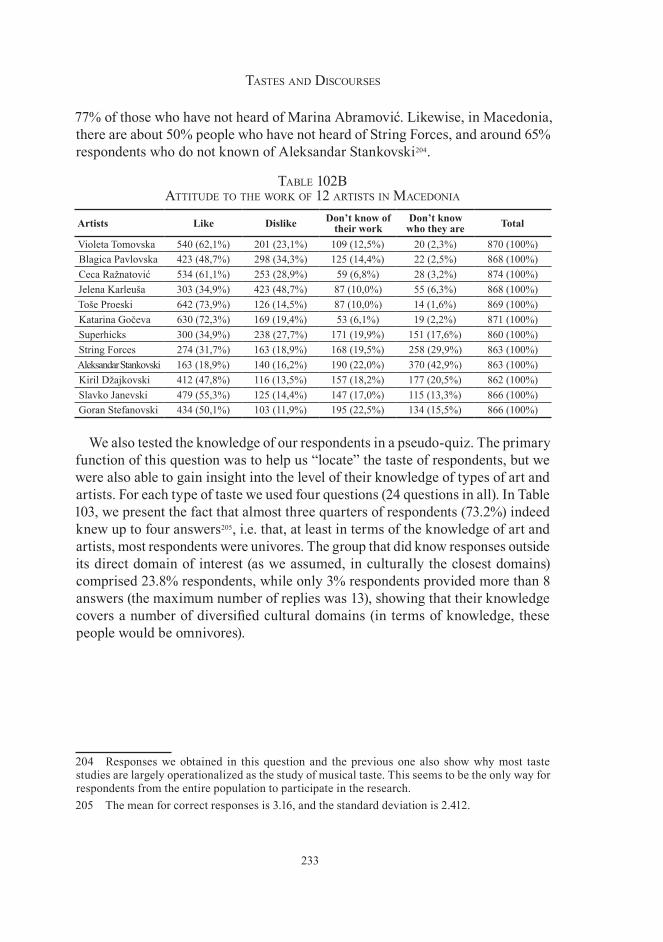
233
tastes aNd disCourses
77% of those who have not heard of Marina Abramović. Likewise, in Macedonia, there are about 50% people who have not heard of String Forces, and around 65% respondents who do not known of Aleksandar Stankovski204.
table 102b attitude to tHe work of 12 artists iN MaCedoNia
Artists Like Dislike Don’t know of their work
Don’t know who they are Total
Violeta Tomovska 540 (62,1%) 201 (23,1%) 109 (12,5%) 20 (2,3%) 870 (100%)Blagica Pavlovska 423 (48,7%) 298 (34,3%) 125 (14,4%) 22 (2,5%) 868 (100%)Ceca Ražnatović 534 (61,1%) 253 (28,9%) 59 (6,8%) 28 (3,2%) 874 (100%)Jelena Karleuša 303 (34,9%) 423 (48,7%) 87 (10,0%) 55 (6,3%) 868 (100%)Toše Proeski 642 (73,9%) 126 (14,5%) 87 (10,0%) 14 (1,6%) 869 (100%)Katarina Gočeva 630 (72,3%) 169 (19,4%) 53 (6,1%) 19 (2,2%) 871 (100%)Superhicks 300 (34,9%) 238 (27,7%) 171 (19,9%) 151 (17,6%) 860 (100%)String Forces 274 (31,7%) 163 (18,9%) 168 (19,5%) 258 (29,9%) 863 (100%)Aleksandar Stankovski 163 (18,9%) 140 (16,2%) 190 (22,0%) 370 (42,9%) 863 (100%)Kiril Džajkovski 412 (47,8%) 116 (13,5%) 157 (18,2%) 177 (20,5%) 862 (100%)Slavko Janevski 479 (55,3%) 125 (14,4%) 147 (17,0%) 115 (13,3%) 866 (100%)Goran Stefanovski 434 (50,1%) 103 (11,9%) 195 (22,5%) 134 (15,5%) 866 (100%)
We also tested the knowledge of our respondents in a pseudo-quiz. The primary function of this question was to help us “locate” the taste of respondents, but we were also able to gain insight into the level of their knowledge of types of art and artists. For each type of taste we used four questions (24 questions in all). In Table 103, we present the fact that almost three quarters of respondents (73.2%) indeed knew up to four answers205, i.e. that, at least in terms of the knowledge of art and artists, most respondents were univores. The group that did know responses outside its direct domain of interest (as we assumed, in culturally the closest domains) comprised 23.8% respondents, while only 3% respondents provided more than 8 answers (the maximum number of replies was 13), showing that their knowledge covers a number of diversified cultural domains (in terms of knowledge, these people would be omnivores).
204 Responses we obtained in this question and the previous one also show why most taste studies are largely operationalized as the study of musical taste. This seems to be the only way for respondents from the entire population to participate in the research.205 The mean for correct responses is 3.16, and the standard deviation is 2.412.
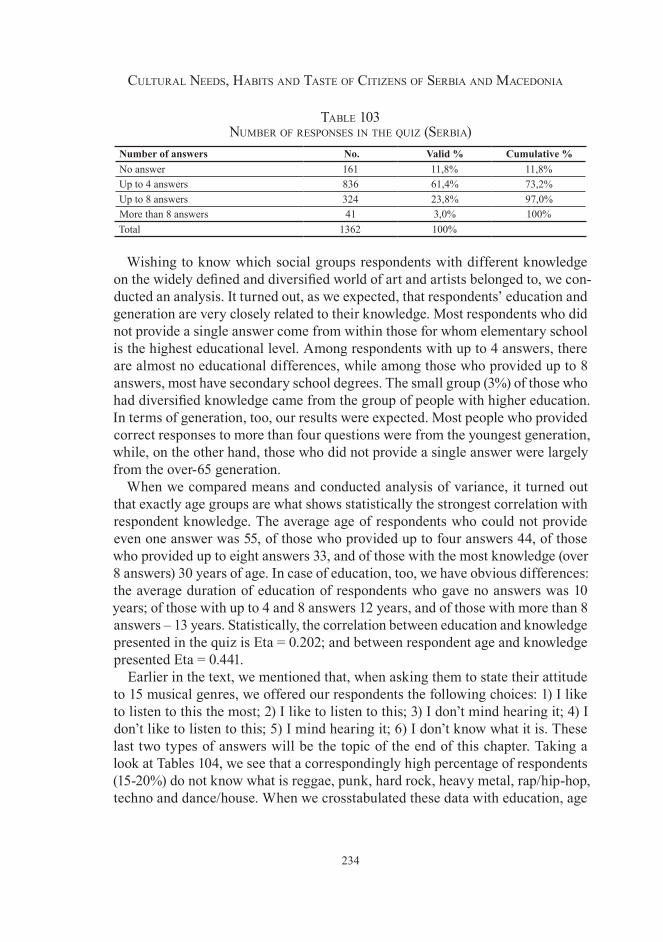
234
Cultural Needs, Habits aNd taste of CitizeNs of serbia aNd MaCedoNia
table 10� NuMber of respoNses iN tHe quiz (serbia)
Number of answers No. Valid % Cumulative %No answer 161 11,8% 11,8%Up to 4 answers 836 61,4% 73,2%Up to 8 answers 324 23,8% 97,0%More than 8 answers 41 3,0% 100%Total 1362 100%
Wishing to know which social groups respondents with different knowledge on the widely defined and diversified world of art and artists belonged to, we con-ducted an analysis. It turned out, as we expected, that respondents’ education and generation are very closely related to their knowledge. Most respondents who did not provide a single answer come from within those for whom elementary school is the highest educational level. Among respondents with up to 4 answers, there are almost no educational differences, while among those who provided up to 8 answers, most have secondary school degrees. The small group (3%) of those who had diversified knowledge came from the group of people with higher education. In terms of generation, too, our results were expected. Most people who provided correct responses to more than four questions were from the youngest generation, while, on the other hand, those who did not provide a single answer were largely from the over-65 generation.
When we compared means and conducted analysis of variance, it turned out that exactly age groups are what shows statistically the strongest correlation with respondent knowledge. The average age of respondents who could not provide even one answer was 55, of those who provided up to four answers 44, of those who provided up to eight answers 33, and of those with the most knowledge (over 8 answers) 30 years of age. In case of education, too, we have obvious differences: the average duration of education of respondents who gave no answers was 10 years; of those with up to 4 and 8 answers 12 years, and of those with more than 8 answers – 13 years. Statistically, the correlation between education and knowledge presented in the quiz is Eta = 0.202; and between respondent age and knowledge presented Eta = 0.441.
Earlier in the text, we mentioned that, when asking them to state their attitude to 15 musical genres, we offered our respondents the following choices: 1) I like to listen to this the most; 2) I like to listen to this; 3) I don’t mind hearing it; 4) I don’t like to listen to this; 5) I mind hearing it; 6) I don’t know what it is. These last two types of answers will be the topic of the end of this chapter. Taking a look at Tables 104, we see that a correspondingly high percentage of respondents (15-20%) do not know what is reggae, punk, hard rock, heavy metal, rap/hip-hop, techno and dance/house. When we crosstabulated these data with education, age
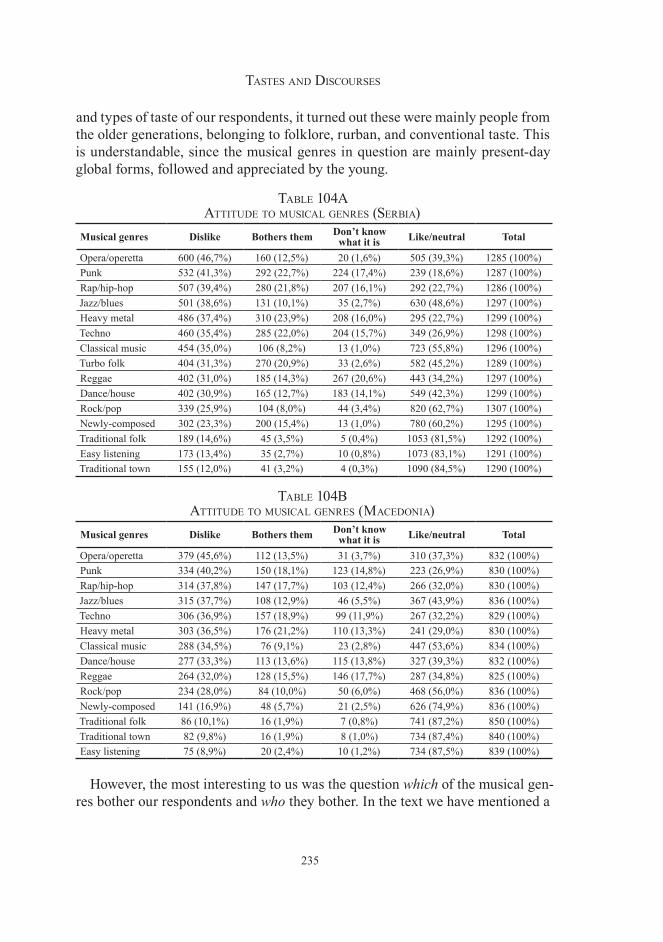
235
tastes aNd disCourses
and types of taste of our respondents, it turned out these were mainly people from the older generations, belonging to folklore, rurban, and conventional taste. This is understandable, since the musical genres in question are mainly present-day global forms, followed and appreciated by the young.
table 104a attitude to MusiCal geNres (serbia)
Musical genres Dislike Bothers them Don’t know what it is Like/neutral Total
Opera/operetta 600 (46,7%) 160 (12,5%) 20 (1,6%) 505 (39,3%) 1285 (100%)Punk 532 (41,3%) 292 (22,7%) 224 (17,4%) 239 (18,6%) 1287 (100%)Rap/hip-hop 507 (39,4%) 280 (21,8%) 207 (16,1%) 292 (22,7%) 1286 (100%)Jazz/blues 501 (38,6%) 131 (10,1%) 35 (2,7%) 630 (48,6%) 1297 (100%)Heavy metal 486 (37,4%) 310 (23,9%) 208 (16,0%) 295 (22,7%) 1299 (100%)Techno 460 (35,4%) 285 (22,0%) 204 (15,7%) 349 (26,9%) 1298 (100%)Classical music 454 (35,0%) 106 (8,2%) 13 (1,0%) 723 (55,8%) 1296 (100%)Turbo folk 404 (31,3%) 270 (20,9%) 33 (2,6%) 582 (45,2%) 1289 (100%)Reggae 402 (31,0%) 185 (14,3%) 267 (20,6%) 443 (34,2%) 1297 (100%)Dance/house 402 (30,9%) 165 (12,7%) 183 (14,1%) 549 (42,3%) 1299 (100%)Rock/pop 339 (25,9%) 104 (8,0%) 44 (3,4%) 820 (62,7%) 1307 (100%)Newly-composed 302 (23,3%) 200 (15,4%) 13 (1,0%) 780 (60,2%) 1295 (100%)Traditional folk 189 (14,6%) 45 (3,5%) 5 (0,4%) 1053 (81,5%) 1292 (100%)Easy listening 173 (13,4%) 35 (2,7%) 10 (0,8%) 1073 (83,1%) 1291 (100%)Traditional town 155 (12,0%) 41 (3,2%) 4 (0,3%) 1090 (84,5%) 1290 (100%)
table 104b attitude to MusiCal geNres (MaCedoNia)
Musical genres Dislike Bothers them Don’t know what it is Like/neutral Total
Opera/operetta 379 (45,6%) 112 (13,5%) 31 (3,7%) 310 (37,3%) 832 (100%)Punk 334 (40,2%) 150 (18,1%) 123 (14,8%) 223 (26,9%) 830 (100%)Rap/hip-hop 314 (37,8%) 147 (17,7%) 103 (12,4%) 266 (32,0%) 830 (100%)Jazz/blues 315 (37,7%) 108 (12,9%) 46 (5,5%) 367 (43,9%) 836 (100%)Techno 306 (36,9%) 157 (18,9%) 99 (11,9%) 267 (32,2%) 829 (100%)Heavy metal 303 (36,5%) 176 (21,2%) 110 (13,3%) 241 (29,0%) 830 (100%)Classical music 288 (34,5%) 76 (9,1%) 23 (2,8%) 447 (53,6%) 834 (100%)Dance/house 277 (33,3%) 113 (13,6%) 115 (13,8%) 327 (39,3%) 832 (100%)Reggae 264 (32,0%) 128 (15,5%) 146 (17,7%) 287 (34,8%) 825 (100%)Rock/pop 234 (28,0%) 84 (10,0%) 50 (6,0%) 468 (56,0%) 836 (100%)Newly-composed 141 (16,9%) 48 (5,7%) 21 (2,5%) 626 (74,9%) 836 (100%)Traditional folk 86 (10,1%) 16 (1,9%) 7 (0,8%) 741 (87,2%) 850 (100%)Traditional town 82 (9,8%) 16 (1,9%) 8 (1,0%) 734 (87,4%) 840 (100%)Easy listening 75 (8,9%) 20 (2,4%) 10 (1,2%) 734 (87,5%) 839 (100%)
However, the most interesting to us was the question which of the musical gen-res bother our respondents and who they bother. In the text we have mentioned a
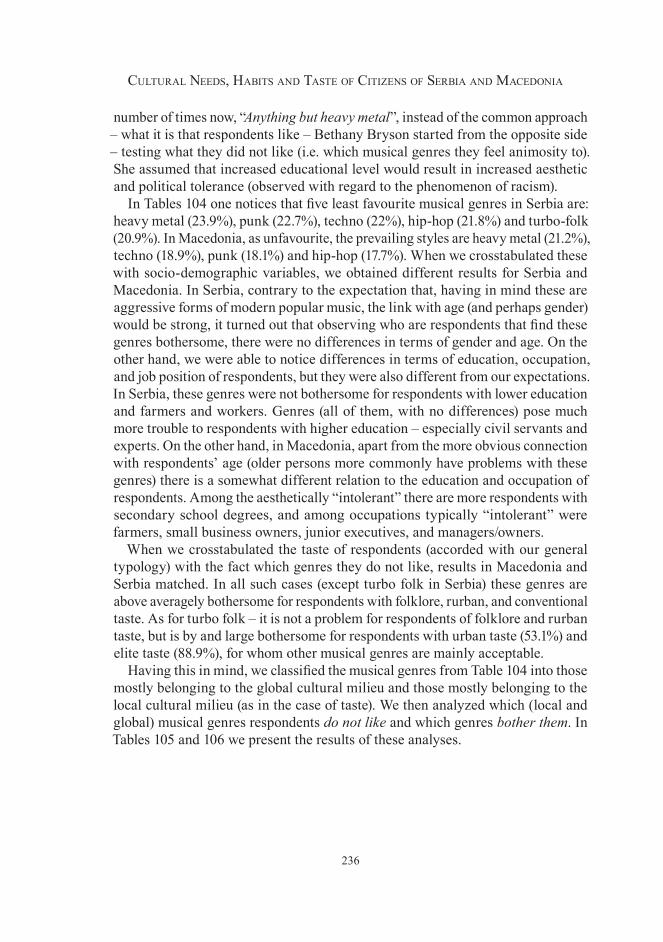
236
Cultural Needs, Habits aNd taste of CitizeNs of serbia aNd MaCedoNia
number of times now, “Anything but heavy metal”, instead of the common approach – what it is that respondents like – Bethany Bryson started from the opposite side – testing what they did not like (i.e. which musical genres they feel animosity to). She assumed that increased educational level would result in increased aesthetic and political tolerance (observed with regard to the phenomenon of racism).
In Tables 104 one notices that five least favourite musical genres in Serbia are: heavy metal (23.9%), punk (22.7%), techno (22%), hip-hop (21.8%) and turbo-folk (20.9%). In Macedonia, as unfavourite, the prevailing styles are heavy metal (21.2%), techno (18.9%), punk (18.1%) and hip-hop (17.7%). When we crosstabulated these with socio-demographic variables, we obtained different results for Serbia and Macedonia. In Serbia, contrary to the expectation that, having in mind these are aggressive forms of modern popular music, the link with age (and perhaps gender) would be strong, it turned out that observing who are respondents that find these genres bothersome, there were no differences in terms of gender and age. On the other hand, we were able to notice differences in terms of education, occupation, and job position of respondents, but they were also different from our expectations. In Serbia, these genres were not bothersome for respondents with lower education and farmers and workers. Genres (all of them, with no differences) pose much more trouble to respondents with higher education – especially civil servants and experts. On the other hand, in Macedonia, apart from the more obvious connection with respondents’ age (older persons more commonly have problems with these genres) there is a somewhat different relation to the education and occupation of respondents. Among the aesthetically “intolerant” there are more respondents with secondary school degrees, and among occupations typically “intolerant” were farmers, small business owners, junior executives, and managers/owners.
When we crosstabulated the taste of respondents (accorded with our general typology) with the fact which genres they do not like, results in Macedonia and Serbia matched. In all such cases (except turbo folk in Serbia) these genres are above averagely bothersome for respondents with folklore, rurban, and conventional taste. As for turbo folk – it is not a problem for respondents of folklore and rurban taste, but is by and large bothersome for respondents with urban taste (53.1%) and elite taste (88.9%), for whom other musical genres are mainly acceptable.
Having this in mind, we classified the musical genres from Table 104 into those mostly belonging to the global cultural milieu and those mostly belonging to the local cultural milieu (as in the case of taste). We then analyzed which (local and global) musical genres respondents do not like and which genres bother them. In Tables 105 and 106 we present the results of these analyses.
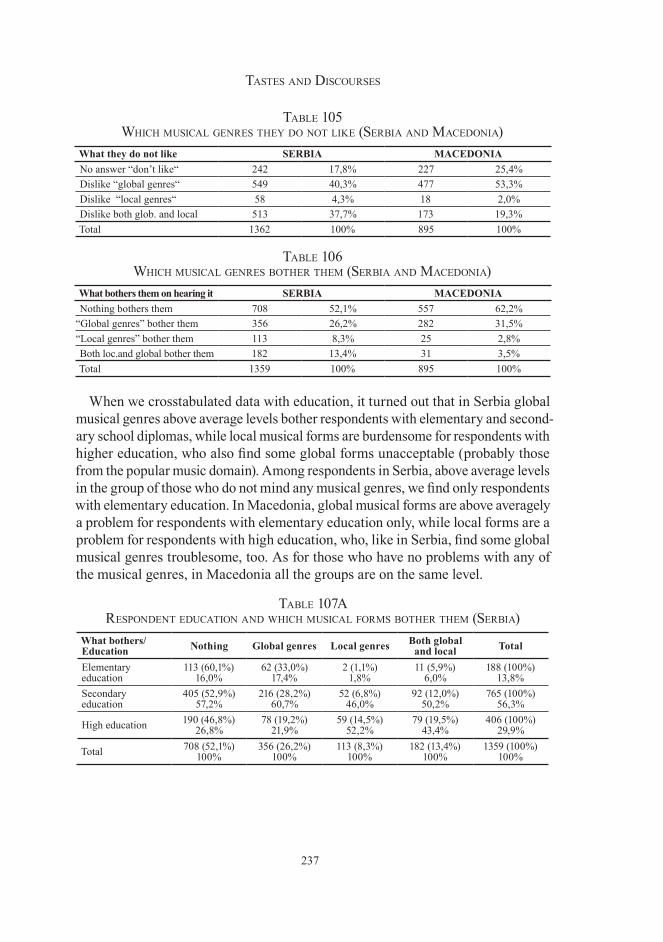
237
tastes aNd disCourses
table 105 wHiCH MusiCal geNres tHey do Not like (serbia aNd MaCedoNia)
What they do not like SERBIA MACEDONIANo answer “don’t like“ 242 17,8% 227 25,4%Dislike “global genres“ 549 40,3% 477 53,3%Dislike “local genres“ 58 4,3% 18 2,0%Dislike both glob. and local 513 37,7% 173 19,3%Total 1362 100% 895 100%
table 106 wHiCH MusiCal geNres botHer tHeM (serbia aNd MaCedoNia)
What bothers them on hearing it SERBIA MACEDONIANothing bothers them 708 52,1% 557 62,2%
“Global genres” bother them 356 26,2% 282 31,5%“Local genres” bother them 113 8,3% 25 2,8%Both loc.and global bother them 182 13,4% 31 3,5%Total 1359 100% 895 100%
When we crosstabulated data with education, it turned out that in Serbia global musical genres above average levels bother respondents with elementary and second-ary school diplomas, while local musical forms are burdensome for respondents with higher education, who also find some global forms unacceptable (probably those from the popular music domain). Among respondents in Serbia, above average levels in the group of those who do not mind any musical genres, we find only respondents with elementary education. In Macedonia, global musical forms are above averagely a problem for respondents with elementary education only, while local forms are a problem for respondents with high education, who, like in Serbia, find some global musical genres troublesome, too. As for those who have no problems with any of the musical genres, in Macedonia all the groups are on the same level.
table 107a respoNdeNt eduCatioN aNd wHiCH MusiCal forMs botHer tHeM (serbia)
What bothers/ Education Nothing Global genres Local genres Both global
and local Total
Elementary education
113 (60,1%)16,0%
62 (33,0%)17,4%
2 (1,1%)1,8%
11 (5,9%)6,0%
188 (100%)13,8%
Secondary education
405 (52,9%)57,2%
216 (28,2%)60,7%
52 (6,8%)46,0%
92 (12,0%)50,2%
765 (100%)56,3%
High education 190 (46,8%)26,8%
78 (19,2%)21,9%
59 (14,5%)52,2%
79 (19,5%)43,4%
406 (100%)29,9%
Total 708 (52,1%)100%
356 (26,2%)100%
113 (8,3%)100%
182 (13,4%)100%
1359 (100%)100%
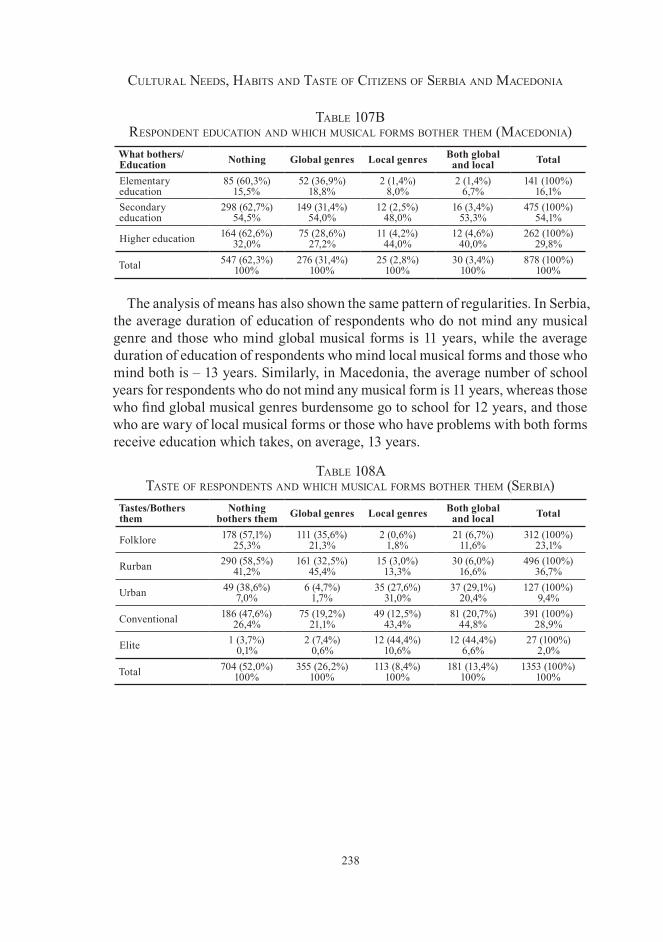
238
Cultural Needs, Habits aNd taste of CitizeNs of serbia aNd MaCedoNia
table 107b respoNdeNt eduCatioN aNd wHiCH MusiCal forMs botHer tHeM (MaCedoNia)
What bothers/Education Nothing Global genres Local genres Both global
and local Total
Elementary education
85 (60,3%)15,5%
52 (36,9%)18,8%
2 (1,4%)8,0%
2 (1,4%)6,7%
141 (100%)16,1%
Secondary education
298 (62,7%)54,5%
149 (31,4%)54,0%
12 (2,5%)48,0%
16 (3,4%)53,3%
475 (100%)54,1%
Higher education 164 (62,6%)32,0%
75 (28,6%)27,2%
11 (4,2%)44,0%
12 (4,6%)40,0%
262 (100%)29,8%
Total 547 (62,3%)100%
276 (31,4%)100%
25 (2,8%)100%
30 (3,4%)100%
878 (100%)100%
The analysis of means has also shown the same pattern of regularities. In Serbia, the average duration of education of respondents who do not mind any musical genre and those who mind global musical forms is 11 years, while the average duration of education of respondents who mind local musical forms and those who mind both is – 13 years. Similarly, in Macedonia, the average number of school years for respondents who do not mind any musical form is 11 years, whereas those who find global musical genres burdensome go to school for 12 years, and those who are wary of local musical forms or those who have problems with both forms receive education which takes, on average, 13 years.
table 108a taste of respoNdeNts aNd wHiCH MusiCal forMs botHer tHeM (serbia)
Tastes/Bothers them
Nothing bothers them Global genres Local genres Both global
and local Total
Folklore 178 (57,1%)25,3%
111 (35,6%)21,3%
2 (0,6%)1,8%
21 (6,7%)11,6%
312 (100%)23,1%
Rurban 290 (58,5%)41,2%
161 (32,5%)45,4%
15 (3,0%)13,3%
30 (6,0%)16,6%
496 (100%)36,7%
Urban 49 (38,6%)7,0%
6 (4,7%)1,7%
35 (27,6%)31,0%
37 (29,1%)20,4%
127 (100%)9,4%
Conventional 186 (47,6%)26,4%
75 (19,2%)21,1%
49 (12,5%)43,4%
81 (20,7%)44,8%
391 (100%)28,9%
Elite 1 (3,7%)0,1%
2 (7,4%)0,6%
12 (44,4%)10,6%
12 (44,4%)6,6%
27 (100%)2,0%
Total 704 (52,0%)100%
355 (26,2%)100%
113 (8,4%)100%
181 (13,4%)100%
1353 (100%)100%
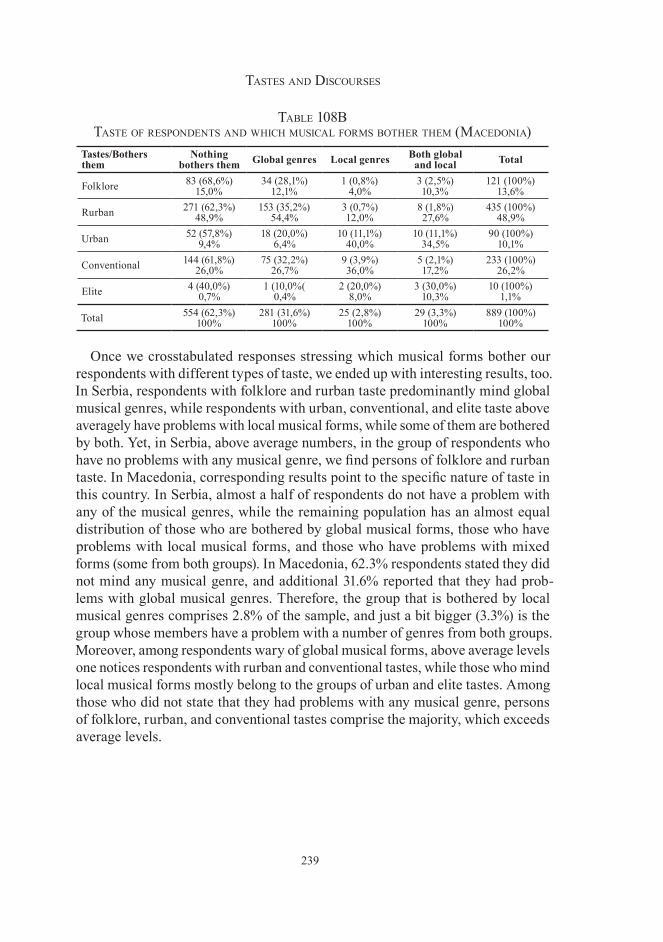
239
tastes aNd disCourses
table 108b taste of respoNdeNts aNd wHiCH MusiCal forMs botHer tHeM (MaCedoNia)
Tastes/Bothers them
Nothing bothers them Global genres Local genres Both global
and local Total
Folklore 83 (68,6%)15,0%
34 (28,1%)12,1%
1 (0,8%)4,0%
3 (2,5%)10,3%
121 (100%)13,6%
Rurban 271 (62,3%)48,9%
153 (35,2%)54,4%
3 (0,7%)12,0%
8 (1,8%)27,6%
435 (100%)48,9%
Urban 52 (57,8%)9,4%
18 (20,0%)6,4%
10 (11,1%)40,0%
10 (11,1%)34,5%
90 (100%)10,1%
Conventional 144 (61,8%)26,0%
75 (32,2%)26,7%
9 (3,9%)36,0%
5 (2,1%)17,2%
233 (100%)26,2%
Elite 4 (40,0%)0,7%
1 (10,0%(0,4%
2 (20,0%)8,0%
3 (30,0%)10,3%
10 (100%)1,1%
Total 554 (62,3%)100%
281 (31,6%)100%
25 (2,8%)100%
29 (3,3%)100%
889 (100%)100%
Once we crosstabulated responses stressing which musical forms bother our respondents with different types of taste, we ended up with interesting results, too. In Serbia, respondents with folklore and rurban taste predominantly mind global musical genres, while respondents with urban, conventional, and elite taste above averagely have problems with local musical forms, while some of them are bothered by both. Yet, in Serbia, above average numbers, in the group of respondents who have no problems with any musical genre, we find persons of folklore and rurban taste. In Macedonia, corresponding results point to the specific nature of taste in this country. In Serbia, almost a half of respondents do not have a problem with any of the musical genres, while the remaining population has an almost equal distribution of those who are bothered by global musical forms, those who have problems with local musical forms, and those who have problems with mixed forms (some from both groups). In Macedonia, 62.3% respondents stated they did not mind any musical genre, and additional 31.6% reported that they had prob-lems with global musical genres. Therefore, the group that is bothered by local musical genres comprises 2.8% of the sample, and just a bit bigger (3.3%) is the group whose members have a problem with a number of genres from both groups. Moreover, among respondents wary of global musical forms, above average levels one notices respondents with rurban and conventional tastes, while those who mind local musical forms mostly belong to the groups of urban and elite tastes. Among those who did not state that they had problems with any musical genre, persons of folklore, rurban, and conventional tastes comprise the majority, which exceeds average levels.
240
Cultural Needs, Habits aNd taste of CitizeNs of serbia aNd MaCedoNia
Hence, based on our results, contrary to the thesis of Bettany Bryson, we might claim that aesthetic tolerance does not increase with increased education. Rather, in accordance with Bourdieu’s claims – it decreases206.
* * *
The typology of taste that we developed in our 2002 research, appended in our 2005 study, was made in order to understand the segmentation of taste in Serbia. Its aim was not to become a general typology, applicable anywhere in the world. Pilot research showed that it could be used in Macedonia, too, with a sound degree of reliability. However, contrary to results relating to cultural needs and cultural habits (by definition more related to the quantitative aspects of cultural practices), where patterns were almost identical, the data from the study of taste suggest we have not quite made it in our attempt to unlock the secret of taste in Macedonia. Not that results failed to bear out our expectations (which happened in many cases in Serbia), but unfulfilled expectations in Macedonia were unsystematic. This may have been a consequence of erroneous operationalization, bad coding, or, most probably, that the very typology of taste that we used failed to cover some property relevant to the Macedonian society and culture. What we can only hint at is that aesthetic cleavages which are prominent in Serbian society does not have the same relevance in Macedonia. Particularly based on the responses on musical taste that we were given, it seems to us, first, that conventional taste in Macedonia is much more based on local art forms than it is in Serbia, and second, that, in Macedonia, ‘omnivoreness’, the mixture of local and global art forms and appreciation of all of them with no particular problems, is typical not only of a part of the population, but seems to be an important convention in the whole society. As it may be, for better and more precise results, the research of taste in Macedonia will obviously have to wait for a (better) researcher – probably from Macedonia.
Results of the study of taste in Serbia once again testify to a strong relation between education and occupation on the one hand and acquisition of specific types of taste on the other. Even though statistical analyses based on error reduction methods did not show any relevant relation between these social factors and types of taste in Macedonia, patterns of relations between the variables were markedly similar to those in Serbia (when viewed in the tables). Extremely influential in both Macedonia and Serbia was the generation of respondents which, as in the case of habits, emerged as one of the
206 Results of our research of the audiences of EXIT and Guca Festival in 2006 (Predrag Cvetičanin and Miloš Jovanović “Last EXIT to Guča”), presented at the 4th Conference of the Research Network for Sociology of the Arts of the ESA held in Lineburg/Hamburg in late March 2007, it turned out, too, that visitors to EXIT were aesthetically less tolerant than people attending Guca. However, politically, measured against the phenomenon of nationalism, visitors of the EXIT festival were more tolerant.
241
tastes aNd disCourses
key factors. Similarities in Macedonia and Serbia also include the general distribution of types of taste, where in both countries rurban omnivores prevail; groups of urban taste make up about 10% of the sample (population), and two elite groups together comprise 2% of the sample in Serbia, and 1.1% of the sample in Macedonia.
Contrary to Peterson’s position, it turned out that the phenomenon of ‘omnivore-ness’ (at least in Serbia and Macedonia) is not typical of elite social positions – quite the opposite is true, actually: omnivores mostly come from lower social strata. And contrary to the conception of Tony Bennett and his associates, it turned out that most omnivores by preference are univores in terms of knowledge. Our tests have shown that many respondents know things about popular music and film, but in many other domains (especially the visual arts and architecture) a significant portion of respond-ents (in both Serbia and Macedonia) failed to name at least their favourite artists.
Finally, in our research of aesthetic tolerance, results from Serbia and Macedonia seemed to contradict results of studies from other parts of the world (particularly the USA). In it we could see that most aesthetic tolerance is shown by respondents with the lowest education, i.e. that political and aesthetic tolerance do not correlate with education in the same way.
242
Cultural Styles and Social FactorsOut of three dominant ways of understanding culture in social science (aesthetic, anthropological, and symbolic), in this study, as we assume is obvious, we used the term cultural (cultural needs, cultural habits, cultural activities) in the aesthetic sense, to label activities related to art and art forms. This is not so due to the fact we believe this is the only relevant way to discuss culture or because cultural needs can be reduced to needs for art, but (primarily) so because of our intended readers of this book, whom we would like it to be useful to. Recall once again, the book is a part of the project of the same name, whose purpose is to help cultural policy stakeholders in Macedonia and Serbia (cultural institutions, non-governmental organizations active in culture, informal art groups, but also national ministries of culture and municipal departments of culture) to develop innovative cultural policy, individual and joint projects, and various cooperation projects in the field. Thus, art had been positioned as our focus even before the beginning of the research.
The last phenomenon that we analyze in this study – “cultural style” – pertains to the position that art phenomena, activities and creations take in the daily life of Serbian and Macedonian population. Using other words, we could say that for us, cultural style is the position and role culture (in the aesthetic sense) has/plays in the way of life of Serbian and Macedonian citizens (culture in the anthropological sense). In order to avoid any possible misunderstanding in further text, here it is important to make it clear that by culture in the aesthetic sense (art) we here mean activities and works of art usually belonging to the domain of practically defined cultural policy (as conducted by the ministries of culture, municipal departments of culture, and cultural institutions), where we mostly concentrated on cultural activities in the public domain (concerts, staged plays, exhibitions, visits to cultural institutions – with the exception of reading books).
We included in cultural style of our respondents almost all elements that we have analyzed in the study: first, a) whether (in terms of cultural needs) respondents belong to the clusters of those who reported cultural activities were a favourite way of spending their leisure time207; then, b) whether in terms of cultural habits (having in mind visits to cultural events in the 12 months prior to the survey) these people had developed, partly developed, or undeveloped cultural habits208;
207 We coded respondent clusters stating art activities were not a favourite way of spending free times 1, and those preferring art activities in their leisure time 2. Thus, in tables in which results of cluster analyses are presented, the closer the value is to 1, the less affinity do respondents have to arts. Likewise, the closer to 2, the more favourite is art in their leisure time.208 For each cultural activity (going to the library, the cinema, concerts, theatres, exhibitions) we used the same type of coding. Those who had not visited these cultural events even once in the 12 months prior to the research were coded 1, those who had visited such events occasionally (1 to 3 times in a year) were coded 2, and those who had visited more than 3 times were coded 3. In the
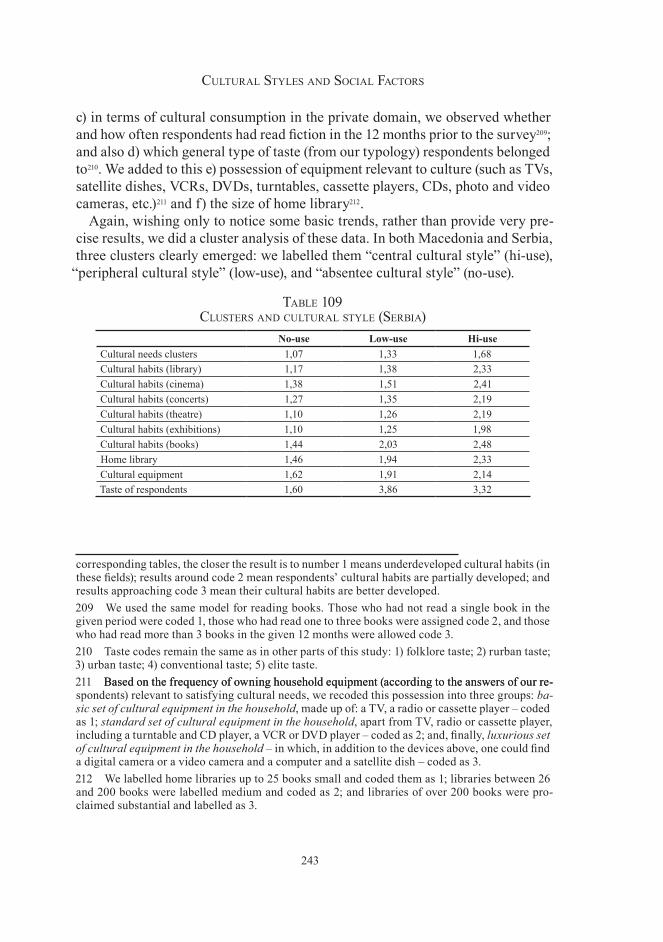
243
Cultural styles aNd soCial faCtors
c) in terms of cultural consumption in the private domain, we observed whether and how often respondents had read fiction in the 12 months prior to the survey209; and also d) which general type of taste (from our typology) respondents belonged to210. We added to this e) possession of equipment relevant to culture (such as TVs, satellite dishes, VCRs, DVDs, turntables, cassette players, CDs, photo and video cameras, etc.)211 and f) the size of home library212.
Again, wishing only to notice some basic trends, rather than provide very pre-cise results, we did a cluster analysis of these data. In both Macedonia and Serbia, three clusters clearly emerged: we labelled them “central cultural style” (hi-use),
“peripheral cultural style” (low-use), and “absentee cultural style” (no-use).
table 109 Clusters aNd Cultural style (serbia)
No-use Low-use Hi-useCultural needs clusters 1,07 1,33 1,68Cultural habits (library) 1,17 1,38 2,33Cultural habits (cinema) 1,38 1,51 2,41Cultural habits (concerts) 1,27 1,35 2,19Cultural habits (theatre) 1,10 1,26 2,19Cultural habits (exhibitions) 1,10 1,25 1,98Cultural habits (books) 1,44 2,03 2,48Home library 1,46 1,94 2,33Cultural equipment 1,62 1,91 2,14Taste of respondents 1,60 3,86 3,32
corresponding tables, the closer the result is to number 1 means underdeveloped cultural habits (in these fields); results around code 2 mean respondents’ cultural habits are partially developed; and results approaching code 3 mean their cultural habits are better developed.209 We used the same model for reading books. Those who had not read a single book in the given period were coded 1, those who had read one to three books were assigned code 2, and those who had read more than 3 books in the given 12 months were allowed code 3.210 Taste codes remain the same as in other parts of this study: 1) folklore taste; 2) rurban taste; 3) urban taste; 4) conventional taste; 5) elite taste.211 Based on the frequency of owning household equipment (according to the answers of our re-Based on the frequency of owning household equipment (according to the answers of our re-spondents) relevant to satisfying cultural needs, we recoded this possession into three groups: ba-sic set of cultural equipment in the household, made up of: a TV, a radio or cassette player – coded as 1; standard set of cultural equipment in the household, apart from TV, radio or cassette player, including a turntable and CD player, a VCR or DVD player – coded as 2; and, finally, luxurious set of cultural equipment in the household – in which, in addition to the devices above, one could find a digital camera or a video camera and a computer and a satellite dish – coded as 3. 212 We labelled home libraries up to 25 books small and coded them as 1; libraries between 26 and 200 books were labelled medium and coded as 2; and libraries of over 200 books were pro-claimed substantial and labelled as 3.
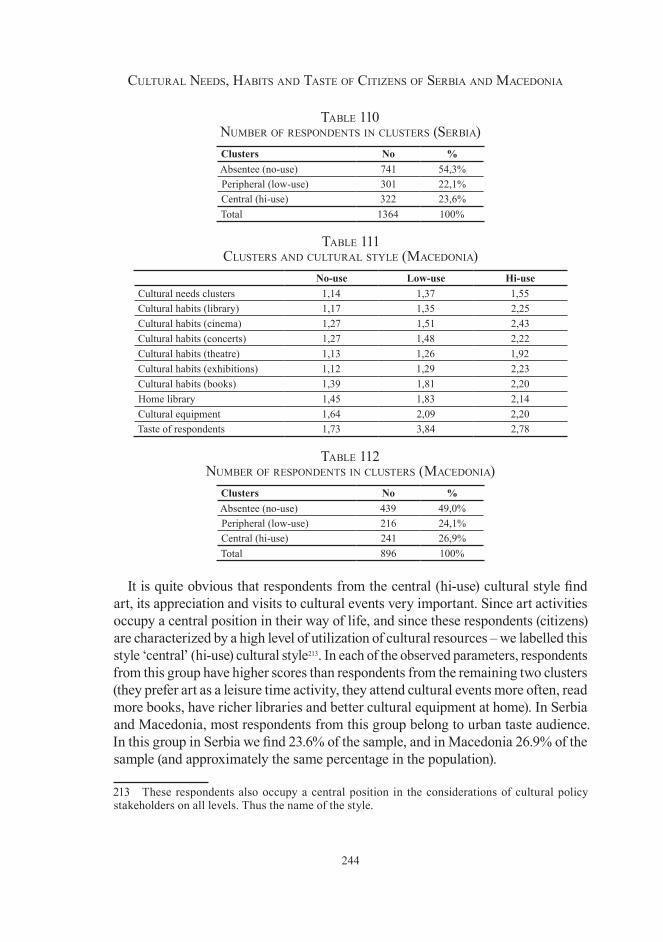
244
Cultural Needs, Habits aNd taste of CitizeNs of serbia aNd MaCedoNia
table 110 NuMber of respoNdeNts iN Clusters (serbia)Clusters No %Absentee (no-use) 741 54,3%Peripheral (low-use) 301 22,1%Central (hi-use) 322 23,6%Total 1364 100%
table 111 Clusters aNd Cultural style (MaCedoNia)
No-use Low-use Hi-useCultural needs clusters 1,14 1,37 1,55Cultural habits (library) 1,17 1,35 2,25Cultural habits (cinema) 1,27 1,51 2,43Cultural habits (concerts) 1,27 1,48 2,22Cultural habits (theatre) 1,13 1,26 1,92Cultural habits (exhibitions) 1,12 1,29 2,23Cultural habits (books) 1,39 1,81 2,20Home library 1,45 1,83 2,14Cultural equipment 1,64 2,09 2,20Taste of respondents 1,73 3,84 2,78
table 112 NuMber of respoNdeNts iN Clusters (MaCedoNia)
Clusters No %Absentee (no-use) 439 49,0%Peripheral (low-use) 216 24,1%Central (hi-use) 241 26,9%Total 896 100%
It is quite obvious that respondents from the central (hi-use) cultural style find art, its appreciation and visits to cultural events very important. Since art activities occupy a central position in their way of life, and since these respondents (citizens) are characterized by a high level of utilization of cultural resources – we labelled this style ‘central’ (hi-use) cultural style213. In each of the observed parameters, respondents from this group have higher scores than respondents from the remaining two clusters (they prefer art as a leisure time activity, they attend cultural events more often, read more books, have richer libraries and better cultural equipment at home). In Serbia and Macedonia, most respondents from this group belong to urban taste audience. In this group in Serbia we find 23.6% of the sample, and in Macedonia 26.9% of the sample (and approximately the same percentage in the population).
213 These respondents also occupy a central position in the considerations of cultural policy stakeholders on all levels. Thus the name of the style.
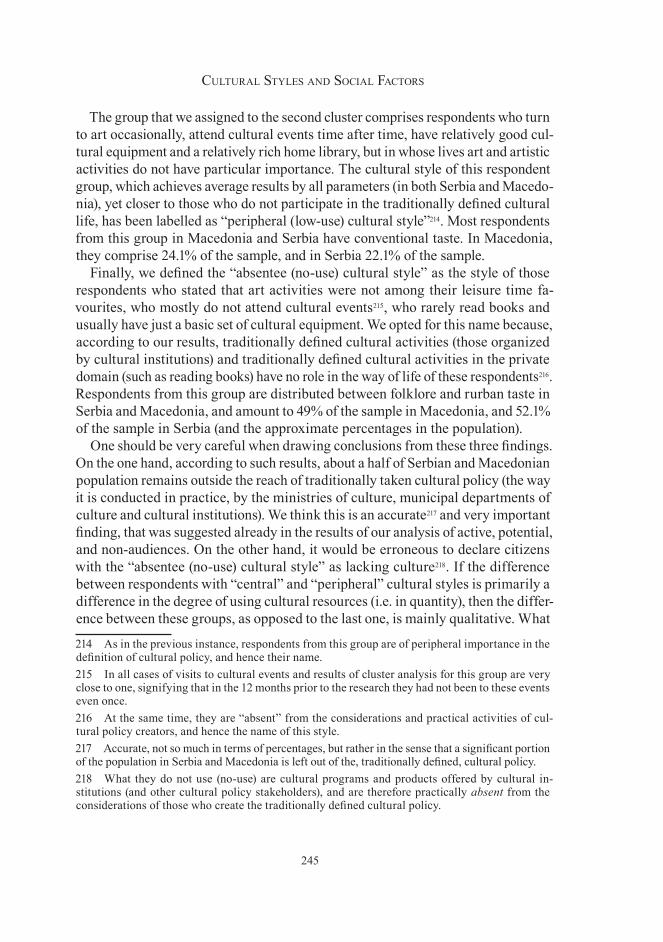
245
Cultural styles aNd soCial faCtors
The group that we assigned to the second cluster comprises respondents who turn to art occasionally, attend cultural events time after time, have relatively good cul-tural equipment and a relatively rich home library, but in whose lives art and artistic activities do not have particular importance. The cultural style of this respondent group, which achieves average results by all parameters (in both Serbia and Macedo-nia), yet closer to those who do not participate in the traditionally defined cultural life, has been labelled as “peripheral (low-use) cultural style”214. Most respondents from this group in Macedonia and Serbia have conventional taste. In Macedonia, they comprise 24.1% of the sample, and in Serbia 22.1% of the sample.
Finally, we defined the “absentee (no-use) cultural style” as the style of those respondents who stated that art activities were not among their leisure time fa-vourites, who mostly do not attend cultural events215, who rarely read books and usually have just a basic set of cultural equipment. We opted for this name because, according to our results, traditionally defined cultural activities (those organized by cultural institutions) and traditionally defined cultural activities in the private domain (such as reading books) have no role in the way of life of these respondents216. Respondents from this group are distributed between folklore and rurban taste in Serbia and Macedonia, and amount to 49% of the sample in Macedonia, and 52.1% of the sample in Serbia (and the approximate percentages in the population).
One should be very careful when drawing conclusions from these three findings. On the one hand, according to such results, about a half of Serbian and Macedonian population remains outside the reach of traditionally taken cultural policy (the way it is conducted in practice, by the ministries of culture, municipal departments of culture and cultural institutions). We think this is an accurate217 and very important finding, that was suggested already in the results of our analysis of active, potential, and non-audiences. On the other hand, it would be erroneous to declare citizens with the “absentee (no-use) cultural style” as lacking culture218. If the difference between respondents with “central” and “peripheral” cultural styles is primarily a difference in the degree of using cultural resources (i.e. in quantity), then the differ-ence between these groups, as opposed to the last one, is mainly qualitative. What
214 As in the previous instance, respondents from this group are of peripheral importance in the definition of cultural policy, and hence their name.215 In all cases of visits to cultural events and results of cluster analysis for this group are very close to one, signifying that in the 12 months prior to the research they had not been to these events even once.216 At the same time, they are “absent” from the considerations and practical activities of cul-tural policy creators, and hence the name of this style.217 Accurate, not so much in terms of percentages, but rather in the sense that a significant portion of the population in Serbia and Macedonia is left out of the, traditionally defined, cultural policy.218 What they do not use (no-use) are cultural programs and products offered by cultural in-stitutions (and other cultural policy stakeholders), and are therefore practically absent from the considerations of those who create the traditionally defined cultural policy.
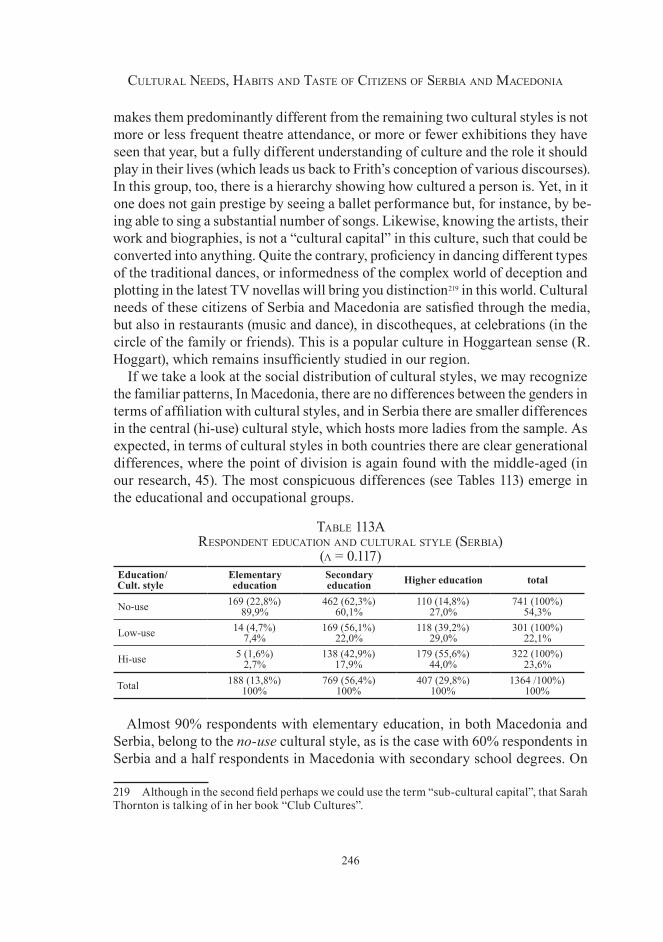
246
Cultural Needs, Habits aNd taste of CitizeNs of serbia aNd MaCedoNia
makes them predominantly different from the remaining two cultural styles is not more or less frequent theatre attendance, or more or fewer exhibitions they have seen that year, but a fully different understanding of culture and the role it should play in their lives (which leads us back to Frith’s conception of various discourses). In this group, too, there is a hierarchy showing how cultured a person is. Yet, in it one does not gain prestige by seeing a ballet performance but, for instance, by be-ing able to sing a substantial number of songs. Likewise, knowing the artists, their work and biographies, is not a “cultural capital” in this culture, such that could be converted into anything. Quite the contrary, proficiency in dancing different types of the traditional dances, or informedness of the complex world of deception and plotting in the latest TV novellas will bring you distinction219 in this world. Cultural needs of these citizens of Serbia and Macedonia are satisfied through the media, but also in restaurants (music and dance), in discotheques, at celebrations (in the circle of the family or friends). This is a popular culture in Hoggartean sense (R. Hoggart), which remains insufficiently studied in our region.
If we take a look at the social distribution of cultural styles, we may recognize the familiar patterns, In Macedonia, there are no differences between the genders in terms of affiliation with cultural styles, and in Serbia there are smaller differences in the central (hi-use) cultural style, which hosts more ladies from the sample. As expected, in terms of cultural styles in both countries there are clear generational differences, where the point of division is again found with the middle-aged (in our research, 45). The most conspicuous differences (see Tables 113) emerge in the educational and occupational groups.
table 11�a respoNdeNt eduCatioN aNd Cultural style (serbia)
(λ = 0.117)Education/ Cult. style
Elementary education
Secondary education Higher education total
No-use 169 (22,8%)89,9%
462 (62,3%)60,1%
110 (14,8%)27,0%
741 (100%)54,3%
Low-use 14 (4,7%)7,4%
169 (56,1%)22,0%
118 (39,2%)29,0%
301 (100%)22,1%
Hi-use 5 (1,6%)2,7%
138 (42,9%)17,9%
179 (55,6%)44,0%
322 (100%)23,6%
Total 188 (13,8%)100%
769 (56,4%)100%
407 (29,8%)100%
1364 /100%)100%
Almost 90% respondents with elementary education, in both Macedonia and Serbia, belong to the no-use cultural style, as is the case with 60% respondents in Serbia and a half respondents in Macedonia with secondary school degrees. On
219 Although in the second field perhaps we could use the term “sub-cultural capital”, that Sarah Thornton is talking of in her book “Club Cultures”.
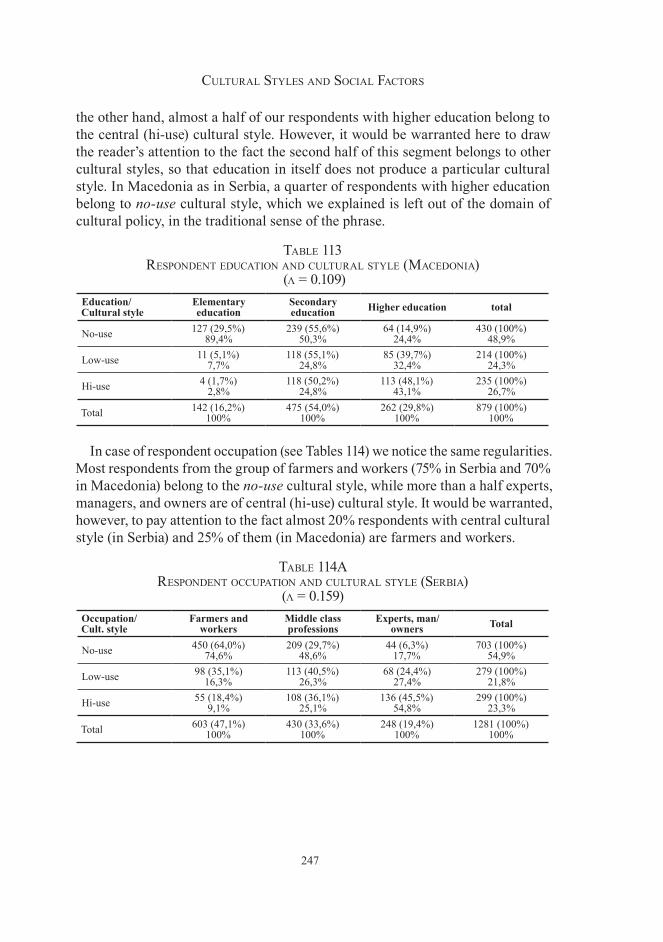
247
Cultural styles aNd soCial faCtors
the other hand, almost a half of our respondents with higher education belong to the central (hi-use) cultural style. However, it would be warranted here to draw the reader’s attention to the fact the second half of this segment belongs to other cultural styles, so that education in itself does not produce a particular cultural style. In Macedonia as in Serbia, a quarter of respondents with higher education belong to no-use cultural style, which we explained is left out of the domain of cultural policy, in the traditional sense of the phrase.
table 11� respoNdeNt eduCatioN aNd Cultural style (MaCedoNia)
(λ = 0.109)Education/ Cultural style
Elementary education
Secondary education Higher education total
No-use 127 (29,5%)89,4%
239 (55,6%)50,3%
64 (14,9%)24,4%
430 (100%)48,9%
Low-use 11 (5,1%)7,7%
118 (55,1%)24,8%
85 (39,7%)32,4%
214 (100%)24,3%
Hi-use 4 (1,7%)2,8%
118 (50,2%)24,8%
113 (48,1%)43,1%
235 (100%)26,7%
Total 142 (16,2%)100%
475 (54,0%)100%
262 (29,8%)100%
879 (100%)100%
In case of respondent occupation (see Tables 114) we notice the same regularities. Most respondents from the group of farmers and workers (75% in Serbia and 70% in Macedonia) belong to the no-use cultural style, while more than a half experts, managers, and owners are of central (hi-use) cultural style. It would be warranted, however, to pay attention to the fact almost 20% respondents with central cultural style (in Serbia) and 25% of them (in Macedonia) are farmers and workers.
table 114a respoNdeNt oCCupatioN aNd Cultural style (serbia)
(λ = 0.159)Occupation/ Cult. style
Farmers and workers
Middle class professions
Experts, man/owners Total
No-use 450 (64,0%)74,6%
209 (29,7%)48,6%
44 (6,3%)17,7%
703 (100%)54,9%
Low-use 98 (35,1%)16,3%
113 (40,5%)26,3%
68 (24,4%)27,4%
279 (100%)21,8%
Hi-use 55 (18,4%)9,1%
108 (36,1%)25,1%
136 (45,5%)54,8%
299 (100%)23,3%
Total 603 (47,1%)100%
430 (33,6%)100%
248 (19,4%)100%
1281 (100%)100%
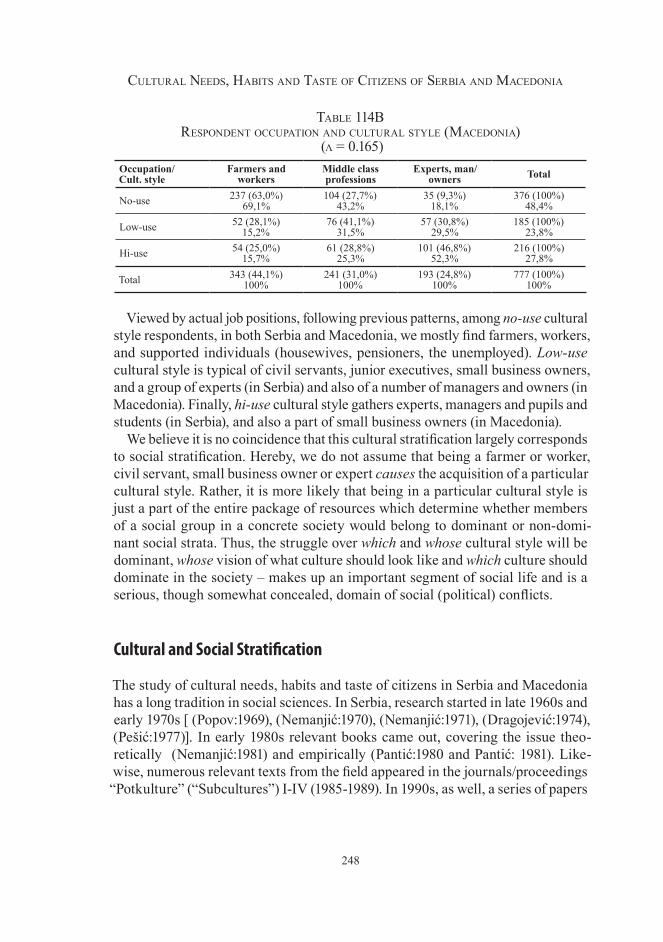
248
Cultural Needs, Habits aNd taste of CitizeNs of serbia aNd MaCedoNia
table 114b respoNdeNt oCCupatioN aNd Cultural style (MaCedoNia)
(λ = 0.165)Occupation/ Cult. style
Farmers and workers
Middle class professions
Experts, man/owners Total
No-use 237 (63,0%)69,1%
104 (27,7%)43,2%
35 (9,3%)18,1%
376 (100%)48,4%
Low-use 52 (28,1%)15,2%
76 (41,1%)31,5%
57 (30,8%)29,5%
185 (100%)23,8%
Hi-use 54 (25,0%)15,7%
61 (28,8%)25,3%
101 (46,8%)52,3%
216 (100%)27,8%
Total 343 (44,1%)100%
241 (31,0%)100%
193 (24,8%)100%
777 (100%)100%
Viewed by actual job positions, following previous patterns, among no-use cultural style respondents, in both Serbia and Macedonia, we mostly find farmers, workers, and supported individuals (housewives, pensioners, the unemployed). Low-use cultural style is typical of civil servants, junior executives, small business owners, and a group of experts (in Serbia) and also of a number of managers and owners (in Macedonia). Finally, hi-use cultural style gathers experts, managers and pupils and students (in Serbia), and also a part of small business owners (in Macedonia).
We believe it is no coincidence that this cultural stratification largely corresponds to social stratification. Hereby, we do not assume that being a farmer or worker, civil servant, small business owner or expert causes the acquisition of a particular cultural style. Rather, it is more likely that being in a particular cultural style is just a part of the entire package of resources which determine whether members of a social group in a concrete society would belong to dominant or non-domi-nant social strata. Thus, the struggle over which and whose cultural style will be dominant, whose vision of what culture should look like and which culture should dominate in the society – makes up an important segment of social life and is a serious, though somewhat concealed, domain of social (political) conflicts.
Cultural and Social Stratification
The study of cultural needs, habits and taste of citizens in Serbia and Macedonia has a long tradition in social sciences. In Serbia, research started in late 1960s and early 1970s [ (Popov:1969), (Nemanjić:1970), (Nemanjić:1971), (Dragojević:1974), (Pešić:1977)]. In early 1980s relevant books came out, covering the issue theo-retically (Nemanjić:1981) and empirically (Pantić:1980 and Pantić: 1981). Like-wise, numerous relevant texts from the field appeared in the journals/proceedings “Potkulture” (“Subcultures”) I-IV (1985-1989). In 1990s, as well, a series of papers
249
Cultural styles aNd soCial faCtors
studied the cultural practice of the population of Serbia, from different view-points [(Božović:1991), (Nemanjić:1991), (Prica:1991), (Dragićević-Šešić:1993), (Dragićević-Šešić:1994), (Žunić:1994), (Dragićević-Šešić and Stojković:1996), (Petrović:1996), (Marić:1998), (Dragićević-Šešić:1998). In the new millennium, the interest for the study of these phenomena has not decreased [(Kronja: 2001), (Jovanović et al: 2002), (Žolt Lazar et al: 2002), (Kronja:2004), (Žolt Lazar et al: 2004)]. In Macedonia, at least from the literature available to us, it seems in the late 1990s and early 2000s, there was a series of empirical studies, among other issues covering this domain [(Taseva et al: 1998), (Džeparovski et al :2003), (Petkovska et al: 2003), (Pečijareski et al.: 2003), (Petkovska, et al: 2004)].
The only novelty in our research is probably the fact it was conducted as a comparative study on nationally-proportional samples, so that results allow us to actually reach conclusions on the population and differences that occur in Mac-edonia and Serbia. Even more so, this opens up a possibility for the sociological study of the influence of social factors on the formation of cultural practices of citizens and the role of cultural practices in social life. One could say that our study ends where the most interesting bit of a sociologist’s work should start. Having in mind the aim of the book and its potential readers, we have tried to put such purely sociological discussions aside.
Here, at the end of the book, as we promised in the introduction, we only sketch two important sociological topics that we will cover more deeply elsewhere. One of them is the question of influence of social factors on the formation of cultural practices taken in the narrower sense – from cultural needs, i.e. motivation for taking part in art activities, to actual participation (cultural habits in the narrower sense), to shaping one’s preferences (taste) in the domain of art – but also in the broader sense, in which cultural practices are seen as symbolic practices that find their expression in lifestyles. The second question pertains to the function which cultural practices (in aesthetic and symbolic sense) have in social life, from two aspects: a) with regard to the symbolic struggle of members of social layers over the acquisition of social status (position in the socially accepted hierarchy of social superiority/inferiority); b) in the political domain taken broadly, questioning the role culture has in the achievement and preservation of hegemony (in Gramsci’s sense).
As for the relation between social stratification and cultural stratification, as we attempted to present in the study, in social theory three viewpoints have emerged, defined by Chan and Goldthorpe220 as the a) homology thesis; b) individualization thesis, and c) omnivore and univore thesis.
The homology thesis is advocated by Pierre Bourdieu and Herbert Gans. Put most simply, the thesis assumes a correspondence of social and cultural stratifi-
220 In the text we have already quoted “Social Stratification and Cultural Consumption: Music in England“, European Sociological Review, 2006
250
Cultural Needs, Habits aNd taste of CitizeNs of serbia aNd MaCedoNia
cation – where those occupying high social positions consume works of high or elite culture, while those with low social positions prefer a form of popular (com-mercial or folk) culture, while in between there is a variety of intermediate social and cultural layers. As we stressed in the introduction to this study, for Bourdieu’s conception, the position of Max Webber – differentiating between classes (one’s market situation) and status (one’s position in the generally accepted hierarchy of social superiority and inferiority expressed through life style) – is unacceptable. In his view, there is a homology between class and status structures, where status is to be understood as a symbolic aspect of class structure, not reducible to the economic dimension only. The instance that mediates between class and status structure is what Bourdieu calls the class “habitus”, which secures “semantic” unity of practices in all domains of consumption, including cultural consumption. Rivalry and conflicts of various lifestyles within status structure are not independent of class conflicts, but represent a form of symbolic struggle of the classes.
The individualization thesis contradicts this view. It either generally denies the influence of social structure on the formation of cultural practices, or assumes that there was such influence in the past, but that today, in developed post-industrial societies it is lost. Instead of reflecting positions in social stratification and being part of stratification struggles, cultural consumption and lifestyles in modern societies are becoming a part of the “self-realization” project. After Chan and Goldthorpe, we may find two variants of this thesis. In its weaker form, among others advocated by A. Giddens (1991) and U. Beck (1992), influencing the formation of lifestyles today we also find other structural foundations of lifestyle (age, gender, ethnicity, sexual preferences), and not only classes. After the stronger variant of the thesis, typical of post-modern views – habitus has been replaced by freedom (A. Warde). In these approaches, lifestyles in post-modern conditions are no longer structur-ally conditioned and do not even have internal unity. They become “life-projects constructing identity”, formed independently of social location, through arbitrary combinations and recombinations of elements by one’s own free will.
We already introduced the omnivore and univore thesis by Peterson and Simkus (1992).221 According to this thesis, the homology conception is now outdated, but not because cultural practices are losing their social foundation, but because there are new types of connections. Cultural consumption of elite social strata no longer differs from the consumption of lowest layers by the fact elite layers consume elite art. Rather, the difference lies in the fact intensity of their cultural consumption is larger and scope of their cultural consumption is broader (including works from all cultural levels). This conception can thus be viewed as a “middle way” between the homology and individualization theses. Chan and Goldthorpe stress that it 221 Richard A. Peterson and Albert Simkus “How musical tastes mark occupational status groups”, u: Michele Lamont and Marcel Fournier (eds.), Cultivating differences: Symbolic boundaries and the making of inequality, p. 152-186. Chicago, IL: The University of Chicago Press, 1992.
251
Cultural styles aNd soCial faCtors
can also be interpreted in two ways. In the first interpretation, omnivores would be essentially tolerant individuals, highly educated and socially mobile, and thus open to other cultural styles and ready to experiment with them. In this variant, the omnivore thesis comes very close to the individualization conception. However, in the second interpretation, omnivoreness is a new expression of elite social status which exhibits cultural and social superiority, as opposed to the limited amount of cultural consumption and unidirectional taste of cultural omnivores. This way, the conception comes closer to the homology thesis222.
Following the homology conception, we put forward two hypotheses223 that we labelled “primary socialization hypothesis” and “cultural adaptation hypothesis”, wishing to test how two groups of factors emerging from the homology concep-tions influence the formation of cultural practices in the narrower sense (cultural needs, cultural habits, taste, and cultural styles as used in this study). The primary socialization hypothesis assumes that in the formation of cultural practices decisive influence is exerted by those social factors that work in early childhood (parents’ education, parents’ occupation/job position, and the place of birth of the respond-ent). According to this hypothesis, individuals’ cultural practices are formed in the primary socialization phase, and then they mainly remain within the scope of what has been acquired in the parental home. The “cultural adaptation” hypothesis, contrary to this, assumes that cultural needs, habits, tastes, and cultural styles of respondents are not so much dependent on early experience. Rather, they change and adapt (to the educational, professional, and territorial) environment individu-als face throughout their lives.
To test these hypotheses we used regression analysis, where in separate analyses dependent variables were a) respondents’ affiliation with various types of audience224 (active, potential, and non-audience), b) respondents’ affiliation with various types of taste (folklore, rurban, urban, conventional, and elite taste); and c) respondents’ affiliation with various cultural styles (hi-use, low-use, no-use). Independent vari-ables, which helped us operationalize the primary socialization hypothesis, were: 1) education of respondent’s father; 2) education of respondent’s mother; 3) occupation of respondent’s father; 4) occupation of respondent’s mother225; 5) job position of
222 We have already mentioned that we think the original omnivore conception assumed that omnivoreness is a way of expressing elite social status, but that changes in more recent Peterson’s conception have practically turned this into a variant of the individualization thesis. 223 See introduction to this study, pages 28 and 29. 224 Which subsume the dimensions of cultural needs and cultural habits.225 In the introductory part of this study we mentioned that part of the problem for sociologi-cal analysis in Serbia and Macedonia lies in the fact that occupational status of respondents and their parents (what they were trained for and what they might have done once) and their actual job position (the market situation) have become separated. We tried to solve this problem by asking respondents both of their occupation (and that of their parents) and of their actual job position (and that of their parents). We hope that in the text already it was clear that occupational groups
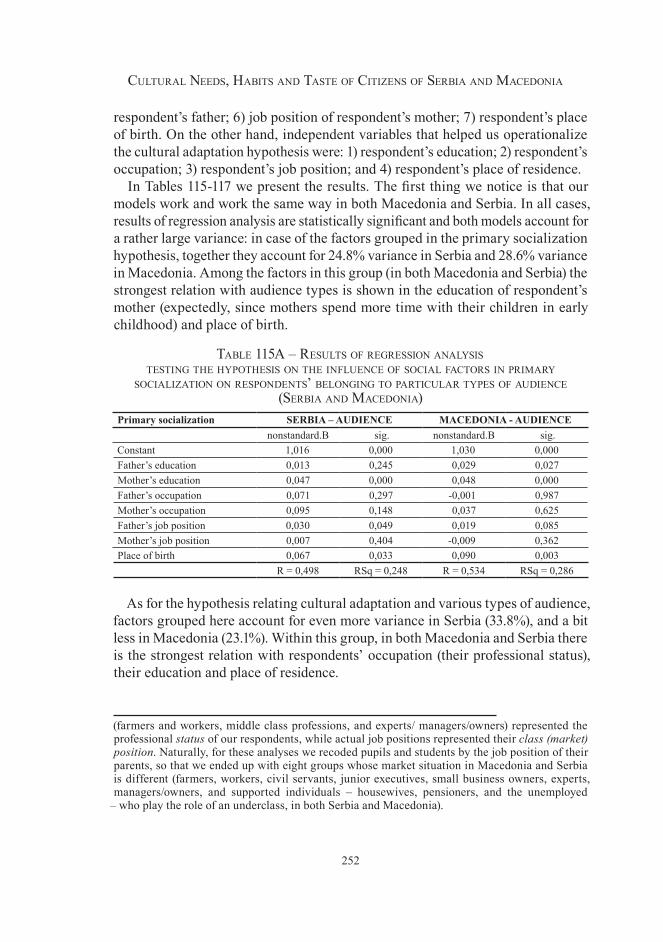
252
Cultural Needs, Habits aNd taste of CitizeNs of serbia aNd MaCedoNia
respondent’s father; 6) job position of respondent’s mother; 7) respondent’s place of birth. On the other hand, independent variables that helped us operationalize the cultural adaptation hypothesis were: 1) respondent’s education; 2) respondent’s occupation; 3) respondent’s job position; and 4) respondent’s place of residence.
In Tables 115-117 we present the results. The first thing we notice is that our models work and work the same way in both Macedonia and Serbia. In all cases, results of regression analysis are statistically significant and both models account for a rather large variance: in case of the factors grouped in the primary socialization hypothesis, together they account for 24.8% variance in Serbia and 28.6% variance in Macedonia. Among the factors in this group (in both Macedonia and Serbia) the strongest relation with audience types is shown in the education of respondent’s mother (expectedly, since mothers spend more time with their children in early childhood) and place of birth.
table 115a – results of regressioN aNalysis testiNg tHe HypotHesis oN tHe iNflueNCe of soCial faCtors iN priMary
soCializatioN oN respoNdeNts’ beloNgiNg to partiCular types of audieNCe (serbia aNd MaCedoNia)
Primary socialization SERBIA – AUDIENCE MACEDONIA - AUDIENCEnonstandard.B sig. nonstandard.B sig.
Constant 1,016 0,000 1,030 0,000Father’s education 0,013 0,245 0,029 0,027Mother’s education 0,047 0,000 0,048 0,000Father’s occupation 0,071 0,297 -0,001 0,987Mother’s occupation 0,095 0,148 0,037 0,625Father’s job position 0,030 0,049 0,019 0,085Mother’s job position 0,007 0,404 -0,009 0,362Place of birth 0,067 0,033 0,090 0,003
R = 0,498 RSq = 0,248 R = 0,534 RSq = 0,286
As for the hypothesis relating cultural adaptation and various types of audience, factors grouped here account for even more variance in Serbia (33.8%), and a bit less in Macedonia (23.1%). Within this group, in both Macedonia and Serbia there is the strongest relation with respondents’ occupation (their professional status), their education and place of residence.
(farmers and workers, middle class professions, and experts/ managers/owners) represented the professional status of our respondents, while actual job positions represented their class (market) position. Naturally, for these analyses we recoded pupils and students by the job position of their parents, so that we ended up with eight groups whose market situation in Macedonia and Serbia is different (farmers, workers, civil servants, junior executives, small business owners, experts, managers/owners, and supported individuals – housewives, pensioners, and the unemployed
– who play the role of an underclass, in both Serbia and Macedonia).
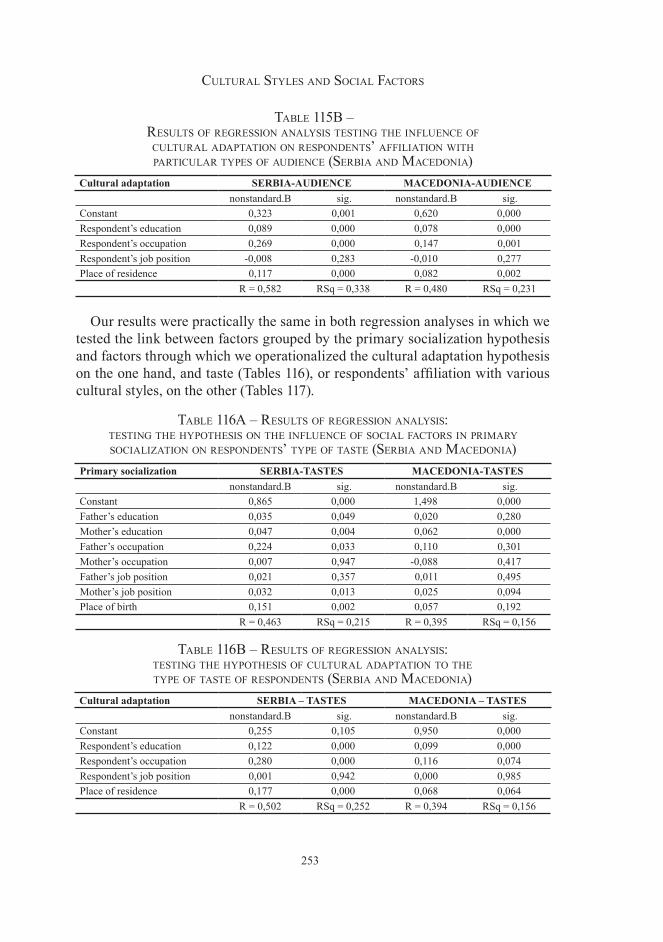
253
Cultural styles aNd soCial faCtors
table 115b – results of regressioN aNalysis testiNg tHe iNflueNCe of
Cultural adaptatioN oN respoNdeNts’ affiliatioN witH partiCular types of audieNCe (serbia aNd MaCedoNia)
Cultural adaptation SERBIA-AUDIENCE MACEDONIA-AUDIENCEnonstandard.B sig. nonstandard.B sig.
Constant 0,323 0,001 0,620 0,000Respondent’s education 0,089 0,000 0,078 0,000Respondent’s occupation 0,269 0,000 0,147 0,001Respondent’s job position -0,008 0,283 -0,010 0,277Place of residence 0,117 0,000 0,082 0,002
R = 0,582 RSq = 0,338 R = 0,480 RSq = 0,231
Our results were practically the same in both regression analyses in which we tested the link between factors grouped by the primary socialization hypothesis and factors through which we operationalized the cultural adaptation hypothesis on the one hand, and taste (Tables 116), or respondents’ affiliation with various cultural styles, on the other (Tables 117).
table 116a – results of regressioN aNalysis: testiNg tHe HypotHesis oN tHe iNflueNCe of soCial faCtors iN priMary soCializatioN oN respoNdeNts’ type of taste (serbia aNd MaCedoNia)
Primary socialization SERBIA-TASTES MACEDONIA-TASTESnonstandard.B sig. nonstandard.B sig.
Constant 0,865 0,000 1,498 0,000Father’s education 0,035 0,049 0,020 0,280Mother’s education 0,047 0,004 0,062 0,000Father’s occupation 0,224 0,033 0,110 0,301Mother’s occupation 0,007 0,947 -0,088 0,417Father’s job position 0,021 0,357 0,011 0,495Mother’s job position 0,032 0,013 0,025 0,094Place of birth 0,151 0,002 0,057 0,192
R = 0,463 RSq = 0,215 R = 0,395 RSq = 0,156
table 116b – results of regressioN aNalysis: testiNg tHe HypotHesis of Cultural adaptatioN to tHe type of taste of respoNdeNts (serbia aNd MaCedoNia)
Cultural adaptation SERBIA – TASTES MACEDONIA – TASTESnonstandard.B sig. nonstandard.B sig.
Constant 0,255 0,105 0,950 0,000Respondent’s education 0,122 0,000 0,099 0,000Respondent’s occupation 0,280 0,000 0,116 0,074Respondent’s job position 0,001 0,942 0,000 0,985Place of residence 0,177 0,000 0,068 0,064
R = 0,502 RSq = 0,252 R = 0,394 RSq = 0,156
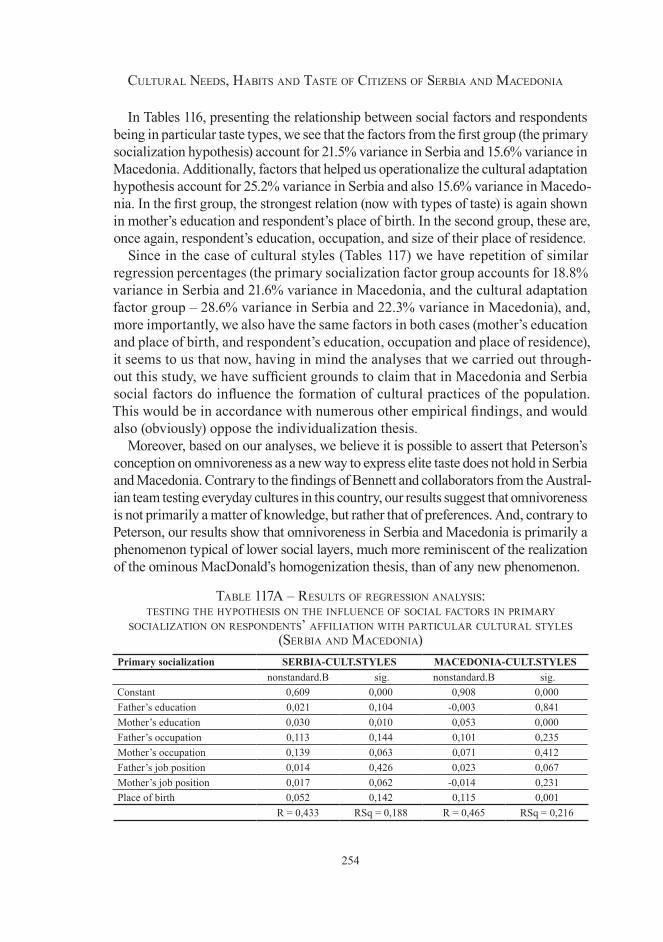
254
Cultural Needs, Habits aNd taste of CitizeNs of serbia aNd MaCedoNia
In Tables 116, presenting the relationship between social factors and respondents being in particular taste types, we see that the factors from the first group (the primary socialization hypothesis) account for 21.5% variance in Serbia and 15.6% variance in Macedonia. Additionally, factors that helped us operationalize the cultural adaptation hypothesis account for 25.2% variance in Serbia and also 15.6% variance in Macedo-nia. In the first group, the strongest relation (now with types of taste) is again shown in mother’s education and respondent’s place of birth. In the second group, these are, once again, respondent’s education, occupation, and size of their place of residence.
Since in the case of cultural styles (Tables 117) we have repetition of similar regression percentages (the primary socialization factor group accounts for 18.8% variance in Serbia and 21.6% variance in Macedonia, and the cultural adaptation factor group – 28.6% variance in Serbia and 22.3% variance in Macedonia), and, more importantly, we also have the same factors in both cases (mother’s education and place of birth, and respondent’s education, occupation and place of residence), it seems to us that now, having in mind the analyses that we carried out through-out this study, we have sufficient grounds to claim that in Macedonia and Serbia social factors do influence the formation of cultural practices of the population. This would be in accordance with numerous other empirical findings, and would also (obviously) oppose the individualization thesis.
Moreover, based on our analyses, we believe it is possible to assert that Peterson’s conception on omnivoreness as a new way to express elite taste does not hold in Serbia and Macedonia. Contrary to the findings of Bennett and collaborators from the Austral-ian team testing everyday cultures in this country, our results suggest that omnivoreness is not primarily a matter of knowledge, but rather that of preferences. And, contrary to Peterson, our results show that omnivoreness in Serbia and Macedonia is primarily a phenomenon typical of lower social layers, much more reminiscent of the realization of the ominous MacDonald’s homogenization thesis, than of any new phenomenon.
table 117a – results of regressioN aNalysis: testiNg tHe HypotHesis oN tHe iNflueNCe of soCial faCtors iN priMary
soCializatioN oN respoNdeNts’ affiliatioN witH partiCular Cultural styles (serbia aNd MaCedoNia)
Primary socialization SERBIA-CULT.STYLES MACEDONIA-CULT.STYLESnonstandard.B sig. nonstandard.B sig.
Constant 0,609 0,000 0,908 0,000Father’s education 0,021 0,104 -0,003 0,841Mother’s education 0,030 0,010 0,053 0,000Father’s occupation 0,113 0,144 0,101 0,235Mother’s occupation 0,139 0,063 0,071 0,412Father’s job position 0,014 0,426 0,023 0,067Mother’s job position 0,017 0,062 -0,014 0,231Place of birth 0,052 0,142 0,115 0,001
R = 0,433 RSq = 0,188 R = 0,465 RSq = 0,216
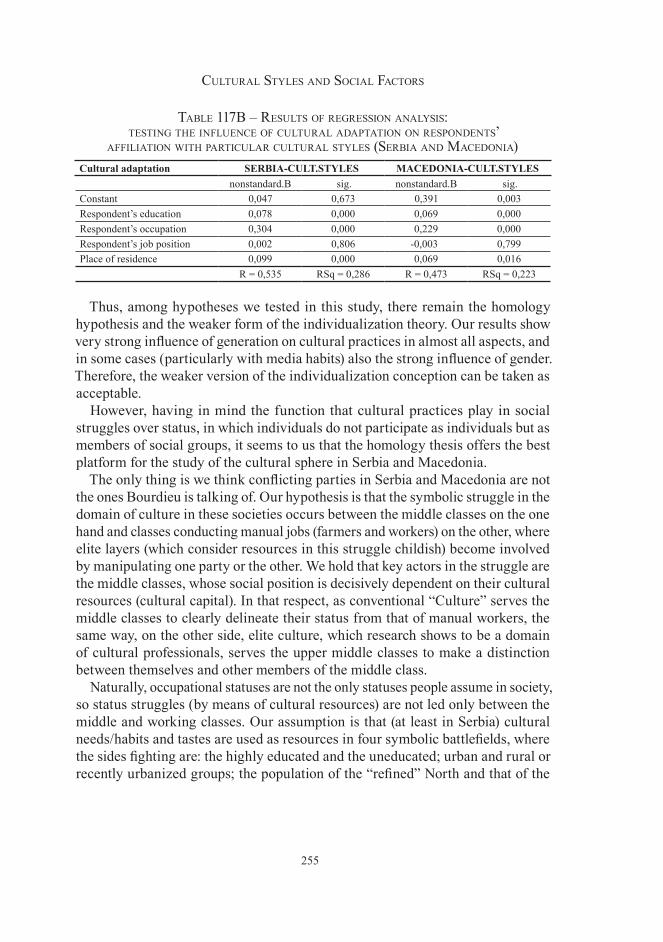
255
Cultural styles aNd soCial faCtors
table 117b – results of regressioN aNalysis: testiNg tHe iNflueNCe of Cultural adaptatioN oN respoNdeNts’
affiliatioN witH partiCular Cultural styles (serbia aNd MaCedoNia)Cultural adaptation SERBIA-CULT.STYLES MACEDONIA-CULT.STYLES
nonstandard.B sig. nonstandard.B sig.Constant 0,047 0,673 0,391 0,003Respondent’s education 0,078 0,000 0,069 0,000Respondent’s occupation 0,304 0,000 0,229 0,000Respondent’s job position 0,002 0,806 -0,003 0,799Place of residence 0,099 0,000 0,069 0,016
R = 0,535 RSq = 0,286 R = 0,473 RSq = 0,223
Thus, among hypotheses we tested in this study, there remain the homology hypothesis and the weaker form of the individualization theory. Our results show very strong influence of generation on cultural practices in almost all aspects, and in some cases (particularly with media habits) also the strong influence of gender. Therefore, the weaker version of the individualization conception can be taken as acceptable.
However, having in mind the function that cultural practices play in social struggles over status, in which individuals do not participate as individuals but as members of social groups, it seems to us that the homology thesis offers the best platform for the study of the cultural sphere in Serbia and Macedonia.
The only thing is we think conflicting parties in Serbia and Macedonia are not the ones Bourdieu is talking of. Our hypothesis is that the symbolic struggle in the domain of culture in these societies occurs between the middle classes on the one hand and classes conducting manual jobs (farmers and workers) on the other, where elite layers (which consider resources in this struggle childish) become involved by manipulating one party or the other. We hold that key actors in the struggle are the middle classes, whose social position is decisively dependent on their cultural resources (cultural capital). In that respect, as conventional “Culture” serves the middle classes to clearly delineate their status from that of manual workers, the same way, on the other side, elite culture, which research shows to be a domain of cultural professionals, serves the upper middle classes to make a distinction between themselves and other members of the middle class.
Naturally, occupational statuses are not the only statuses people assume in society, so status struggles (by means of cultural resources) are not led only between the middle and working classes. Our assumption is that (at least in Serbia) cultural needs/habits and tastes are used as resources in four symbolic battlefields, where the sides fighting are: the highly educated and the uneducated; urban and rural or recently urbanized groups; the population of the “refined” North and that of the
256
Cultural Needs, Habits aNd taste of CitizeNs of serbia aNd MaCedoNia
“unrefined” South of the country; and also “cosmopolitans” and “patriots”. And that all these struggles have clear political implications.
These sketches conclude our circumscription of the cultural map of Serbia and Macedonia. We tried to carefully describe what we perceived in the cultural life of these countries and, wherever possible, make the underlying forces visible. It seems to us that implications of our findings could be relevant to the practical cultural policy in Macedonia and Serbia, but we also think that it is not on the researcher to impose a particular type of implications or reach decisions. Or, put differently, it is not on the map maker to decide which way to go. We only hope that this map will help those setting off stay on the right course. We have no il-lusions that many people will read this book. It is our illusion, though, that those who do read it will find it useful.
257
Cultural styles aNd soCial faCtors
* * *
In a research of this magnitude, one clearly depends on the help of numerous people. I would like to thank all – both those who were part of this project, and
especially those who helped with no particular reason, except for good will. I would first thank partners in the project, particularly Anita Ivkoviќ and Nikola Pisarev from the Centre for Contemporary Arts from Skopje. The gratitude also goes to the translators: Mihailo Antović, Ćani Memeti and Goran Ivkoviќ. The project secretary, Miloš Jovanović, did a tremendous amount of work, both with the field research and later with data analysis – his contribution to this study is indeed substantial. Thanks also to Ivan Stojić for the layout of the text in impos-sible conditions, to Dušan Mitić – Car for the photographs, and to Aleksandar Leković for help during the project. The gratitude is also to be expressed to all the surveyors in Macedonia and Serbia, and to the Agency «Argument», in particular Snežana Hristovski, for her help with the organization of the surveying in Belgrade. Finally, I would like to thank the people of the European Cultural Foundation who were patient enough to wait for this project to end even after all deadlines had been broken. All four issues of this book (in Serbian, Macedonian, Albanian, and English) are downloadable from the web page www.ogi.org.yu. Please, address all correspondence to [email protected].
258
Bibliography:Abercrombie, Nicholas: Television and Society, Polity Press, Oxford, 1996.Alexander, Victoria D. Sociology of the Arts. Exploring Fine and Popular Forms,
Blackwell Publishing, Malden, Oxford, Carlton, 2004Barker, Chris, Cultural Studies. Theory and Practice, Sage Publications, London,
Thousand Oaks, New Delhi, 2000Baudrillard, Jean, The System of Objects, Verso, London, New York, 2002 Baudrillard, Jean, The Consumer Society, Myths and Structures, Sage Publica-
tions, London, Thousand Oaks, New Delhi, 2004 Bayley, Stephen, Taste. The Secret Meaning of Things, Pantheon Books, New
York, 1991Beck, Ulrich, Risk Society: Towards a New Modernity. Sage, London: 1992Becker, Howard, S. Art Worlds, University of California Press, Berkley, Los An-
geles, London, 1982Bogdanović, Marija: Kvantitativni pristup u sociologiji, Službeni list, Beograd, 1981.
Bogdanović, Marija: Metodološke studije, Institut za političke studije, Beograd, 1993.
Benet, Andy and Kaith Kahn-Harris (eds), After Subculture. Critical Studies in Contemporary Youth Culture, Palgrave Macmillan, Basingstoke, New York, 2004
Bennett, Tony, Michael Emmison, John Frow, Accounting for Tastes, Australian Everyday Cultures, Cambridge University Press, 1999.
Bourdieu, Pierre, Distinction. A Social Critique of the Judgement of Taste, Har-vard University Press, Cambridge USA, 1984
Bourdieu, Pierre, Reproduction: in Education, Society and Culture, Sage Publi-cations, London, Thousand Oaks, New Delhi, 1990
Bourdieu, Pierre, The Love of Art. European Art Museums and their Public, Pol-ity Press, Cambridge, 1991
Bourdieu, Pierre, The Field of Cultural Production. Essays on Art and Literature, Polity Press, Cambridge, 1993
Bourdieu, Pierre, The Rules of Art. Genesis and Structure of the Literary Field, Polity Press, Cambridge, 1996.
Burdije, Pjer, Nacrt za jednu teoriju prakse, Zavod za udžbenike i nastavna sred-stva, Beograd, 1999
Božović, Ratko, R. Kultura potreba, Naučna knjiga, Beograd, 1991
259
bibliograpHy
Breadley, Harriet, Fractured Identities. Changing Patterns of Inequality, Polity Press, Cambridge, 2005
Burrows, Roger and Catherine March, Consumption and Class: Divisions and Change, Palgrave Macmillan, 1991
Calhoun Craig, Edward LiPuma and Moishe Postone (eds), Bourdieu: Critical Perspectives, University of Chicago Press, 1993.
Chaney, David, The Cultural Turn: Scene-Setting Essays on Contemporary Cul-tural History, Routledge, New York, 1994
Čejni, Dejvid, Životni stilovi, Clio, Beograd, 2003Crane, Diana (ed), The Sociology of Culture. Emerging Theoretical Perspectives,
Blackwell, Oxford UK and Cambridge USA, 1994Crompton, Rosemary, Class and Stratification. An Introduction to Current De-
bates (second edition), Polity Press, Cambridge, 2004Cvetičanin, Predrag, Kulturne potrebe, navike i ukus građana Srbije, OGI/Pro
Helvetia, 2002. godine (elektronsko izdanje)DeCerto, Michael, The Practice of Everyday Life, University of California Press,
Berkley, Los Angeles, London, 1988 Devlin, Fiona at al. Rethinking Class. Culture, Identities and Lifestyle, Palgrave
Macmillan, New York, 2005Dickie, George, Evaluating Art, Temple University Press, Philadelphia, 1988Digl, Kit, Marketing umetnosti, Clio, Beograd, 1998. Dorfles, Gillo, Oscilacije ukusa i moderne umjetnosti, Mladost, Zagreb, 1963Douglas, Mary and Baron Isherwood, The World of Goods: Towards an Anthro-
pology of Consumption, Routledge, New York, 1996Dragićević-Šešić, Milena, Horizonti čitanja, Pont, Beograd, 1993Dragićević-Šešić, Milena, Neofolk kultura. Publika i njene zvezde, Izdavačka
knjižarnica Zorana Stojanovića, Novi Sad, 1994. Dragićević-Šešić, Milena i Branimir Stojković, Kultura: Menadžment, animacija,
marketing (drugo dopunjeno izdanje), Clio, Beograd, 1996During, Simon, The Cultural Studies Reader (second edition), Routledge, London
and New York, 2000Džeparovski, Ivan (ur) Mladite, sakralnoto i umetnosta, projekat Kulturna dekon-
taminacija (CD-rom) Fondacija Institut otvoreno opštestvo Makedonija, Sko-pje 2003
Europeans’ Participation in Cultural Activities, Eurobarometar, 2002. Featherstone, Mike, Consumer Culture and Postmodernism, Sage Publications,
260
Cultural Needs, Habits aNd taste of CitizeNs of serbia aNd MaCedoNia
London, Thousand Oaks, New Delhi, 2004Feri, Lik, Homo Aestheticus. Otkriće ukusa u demokratskom dobu, Izdavačka
knjižarnica Zorana Stojanovića, Sremski Karlovci, Novi Sad, 1994Fisk, Džon, Popularna kultura, Clio, Beograd, 2001Fowler, Bridget, Pierre Bourdieu and Cultural Theory. Critical Investigations,
Sage Publications, London, Thousand Oaks, New Delhi, 1997Frit, Sajmon, Sociologija roka, IIC i CIDID, Beograd, 1987.Frith, Simon, Performing Rites: Evaluating Popular Music. Oxford University
Press, Oxford, 1998Frow, John, Cultural Studies and Cultural Value, Clarendon Press, Oxford, 1995Gans, Herbert, J. Popular Culture and High Culture. An Analysis and Evaluation
of Taste (revised and updated edition), Basic Books, New York, 1999Gelder, Ken and Sarah Thorton (eds), The Subcultures Reader, Routledge, Lon-
don and New York, 1997Giddens, Anthony. Modernity and Self-identity: Self and Society in the Late
Modern Age, Polity Press, Cambridge, 1991Gordi, Erik, Kultura vlasti u Srbiji. Nacionalizam i razaranje alternativa, Samiz-
dat, Free B92, Beograd, 2001Griswold, Wendy, Cultures and Societies in a Changing World (second edition),
Pine Forge Press and Sage Publication, London, Thousand Oaks, New Delhi, 2004
Gronow, Jukka, The Sociology of Taste, Routledge, London and New York, 1997Grossberg, Lawrence, Cary Nelson and Paula Treichler (eds), Cultural Studies,
Routledge, London and New York, 1992Hebdiž, Dik, Potkultura: značenje stila, Pečat, Beograd, 1980Inglis, David and John Hughson, Confronting Culture. Sociological Vistas, Polity
Press, Cambridge, 1996Jacobs, Mark D. and Nancy Weiss Hanrahan, The Blackwell Companion to the
Sociology of Culture, Blackwell Publishing, Malden, Oxford, Carlton, 2005Jovanović, Đokica at al. Parodija tragičnog, Filozofski fakultet u Kosovskoj
Mitrovici, Institut za filozofiju i društvenu teoriju i Istraživačko-analitički cen-tar, Kosovska Mitrovica, Beograd, 2002.
Kahle, Lynn, R. „Social Values and Social Change“, Praeger, New York, 1983Kant, Imanuel, Kritika moći suđenja, BIGZ, Beograd, 1991.Kellner, Douglas, Popular Culture and the Construction of Postmodern Iden-
tities, u: Modernity and Identity, (eds) Scott Lasch and Jonathan Friedman,
261
bibliograpHy
Blackwell Publishing Malden, Oxford, Carlton, 1992Kellner, Douglas, Baudrillard: A Critical Reader, Blackwell Oxford UK and
Cambridge USA, 1994Klein, Naomi, No Logo, Picador, New York, 2002Kloskovska, Antonjina, Masovna kultura: kritika i odbrana, Matica Srpska, Novi
Sad, 1990Kloskovska, Antonjina, Sociologija kulture, Čigoja, Beograd, 2001Koludurović-Tomić, Inga i Anči Luburić; Sociologija životnog stila, Naklada Je-
senski i Turk, Zagreb, 2002. godineIvana Kronja, Smrtonosni sjaj: masovna psihologija i estetika turbo-folka, Teh-
nokratia, Beograd, 2001Lamont, Michèle, Money, Morals and Manners. The Culture of the French and
the American Upper-Middle Class, University of Chicago Press, Chicago and London, 1992
Lamont, Michèle and Marcel Fournier (eds), Cultivating Differences, Symbolic Boundaries and the Making of Inequality, University of Chicago Press, Chi-cago and London, 1992
Lawrence W. Levine, Highbrow/Lowbrow: the Emergence of Cultural Hierarchy in America, Harvard University Press, Cambridge, MA, 1988
Lazar, Žolt. K. at al. (ur.),(ur.), Omladinske potkulture i publika Exit-a. Novi Sad: EXITNovi Sad: EXIT udruženje, 2002
Long, Elizabeth, From Sociology to Cultural Studies. New Perspectives, Black-well Publishing, Malden, Oxford 1997
Lury, Celia, Consumer Culture, Polity Press, Cambridge, 2001Maffesoli, Michael, The Time of the Tribes, The Decline of Individualism in Mass
Society, Sage Publications, London, Thousand Oaks, New Delhi, 1996Marić, Ratka. Stilovi – Sociologija omladinskih potkultura, Geopoetika, Beograd:
1998:McGuigan Jim, Cultural Populism, Routledge, New York, 1992. McGuigan, Jim (ed), Cultural Methodologies, Sage Publications, London, Thou-
sand Oaks, New Delhi, 1997McCarthy, K. F. and K. Jinnett. A New Framework for Building Participation in
the Arts. RAND, Santa Monica, 2001.Milner Andrew and Jeff Browitt, Contemporary Cultural Theory. An Introduc-
tion, (third edition), Routledge, London and New York, 2002Mitchel, Arnold, The Nine American Lifestyles, The Warner Books, New York,
262
Cultural Needs, Habits aNd taste of CitizeNs of serbia aNd MaCedoNia
1983Morley, David. Family Television: Cultural Power and Domestic Leisure, Lon-
don, Comedia, 1986Muggleton, David and Rupert Weinzierl (eds) The Post-Subcultures Reader, Berg,
New York, 2003Nemanjić, Miloš, Kulturne potrebe, Vuk Karadžić, Beograd, 1981. Nemanjić, Miloš, Filmska i pozorišna publika Beograda. Socio-kulturni uslovi
formiranja u periodu 1961 – 1984, IDEA, Zavod za proučavanje kulturnog razvitka, Beograd, 1991
New Europeans and Culture: Public Opinion in the Candidate Countries, Euro-barometar, 2003
Pakulski, Jan and Malcolm Waters, The Death of Class, Sage Publications, Lon-don, Thousand Oaks, New Delhi, 1996
Pantić, Dragomir, Interesovanja mladih. Priroda interesovanja, IISSO Srbije, Beograd, 1980
Pantić, Dragomir, Interesovanja mladih. Rezultati istraživanja, IISSO Srbije, Be-ograd, 1981
Pečijareski, Ljupčo, Dijagnosticiranje na etno-kulturološkiot ambient vo R. Makedonija, projekat Kulturna dekontaminacija (CD-rom) Fondacija Institut otvoreno opštestvo Makedonija, Skopje 2003
Petkovska, Antoanela (ur): Vrednosni sistemi i zivotni orientacii na mladite vo R. Makedonija vo postkonfliktniot period, projekat Kulturna dekontaminacija (CD-rom) Fondacija Institut otvoreno opštestvo Makedonija, Skopje 2003
Petkovska. A, M.Taševa, Z.Velkovski, V.Dimitrijevska, K.Minovski, O.Šurbanovska, Osnovna studija za mladinski trendovi, Agencija za mladi i sport, Skopje 2004
Petrović, Sreten, Estetika i sociologija, Uvod u sociologiju umetnosti (treće dop-unjeno izdanje), Privredni pregled, Beograd, 1984
Petrović, Sreten (ed.), Recepcija umetnosti, Istraživanje tipova ukusa beograd-skih studenata, Filološki fakultet u Beogradu, Beograd, 1996
Pešić, Vesna: Društvena slojevitost i stil života, u Popović, Mihailo at al. Društveni slojevi i društvena svest, Centar za sociološka istraživanja Instituta društvenih nauka, Beograd, 1977.
Potkulture I IIS SSO Srbije, Beograd, 1985,Potkulture II IIS SSO Srbije, Beograd, 1986Potkulture III IIS SSO Srbije, Beograd, 1987,
263
bibliograpHy
Potkulture IV IIS SSO Srbije, Beograd, 1989Prica, Ines. Omladinska potkultura u Beogradu, simbolička praksa, Etnografski
institut SANU, Beograd: 1991Reisman, David at all, The Lonely Crowd: A Study of the Changing American
Character, Yale University Press, New Haven, 1961Saunders, Peter, Social Theory and the Urban Question, Hutchinson, 1986. Shils, Edward, Mass society and its culture. u: Norman Jacobs (ed): Culture for
the Millions? Princeton, 1961.Slater, Don, Consumer Culture and Modernity, Polity Press, Cambridge, 2004Veblen, Torsten, Teorija dokoličarske klase, Kultura, Beograd, 1966Storey, John, Cultural Studies and the Study of Popular Culture. Theories and
Methods, Edinburgh University Press, 1998Storey, John, Cultural Consumption and Everyday Life, Arnold, London, Sidney,
Auckland, 1999Strinati, Dominic, An Introduction to Theories of Popular Culture (second edi-
tion), Routledge, London and New York, 2004Taseva, Marija, Mileva Gurovska, Antoanela Petkovska, Konstantin Minoski Et-
nickite grupi vo Makedonija - sovremeni sostojbi, Filozofski fakultet – Skopje, 1998
Thornton, Sarah, Club Culture. Music, Media and Subcultural Capital, Polity Press, Cambridge, 2004.
Schulze, Gerhard, Die Erlebnisgesellschaft: Kustsociologie der Gegenwart, Kam-pus, Frankfurt, 1995.
Spasić, Ivana, Sociologije svakodnevnog života, Zavod za udžbenike i nastavna sredstva, Beograd, 2004
Swartz, David, Culture and Power. The Sociology of Pierre Bourdieu, The Uni-versity of Chicago Press, Chicago and London, 1997
Throsby, C. David, and Glenn Winter. The Economics of the Performing Arts, New York: St. Martin’s Press, 1979.
Van Wyck Brooks, America’s Coming of Age, Amerion Ltd, 1992. Warde, Alan, Consumers, Identity and Belonging: Reflections on Some Thesis of
Zygmund Bauman, u: The Authority of the Consumer, (eds) Russell Keat, Nigel Whiteley, and Nicolas Abercromtie, Routledge, 1994.
Williams, Raymond, The Sociology of Culture, The University of Chicago Press, Chicago, 1981
Zerubavel, Eviatar, The Fine Line: Making Distinctions in Everyday Life, Univer-
264
Cultural Needs, Habits aNd taste of CitizeNs of serbia aNd MaCedoNia
sity of Chicago Press, Chicago, 1993 Zolberg, Vera, L. Constructing a Sociology of the Arts, Cambridge University
Press, Cambridge, New York, Port Chester, Meblourne, Sidney, 1991. Žunić, Dragan, Svakidašnji ukus, Kritika moći sviđanja, Prosveta, Niš, 1994Žunić, Dragan, Sociologija umetnosti, Filozofski fakultet, Niš, 1995
Texts from journals:
Barbalet, J.M, Limitations of Class Theory and the Disappearance of Status, The Problem of the New Middle Class, Sociology 20 (1986), 557-575
Bihagen, Erik and Tally Katz-Gerro, Culture consumption in Sweden: The stabil-ity of gender differences, Poetics 27 (2000) 327-349
Bihagen, Erik, How do Classes Make Use of Their Incomes?: A Test of Two Hy-potheses Concerning Class and Consumption on a Swedish Data-set from 1992, Social Indicators Research vol. 47, (1999),119–151,
Bryson, Bethany, “Anything but Heavy Metal”: Simbolic Exclusion and Musical Dislikes, American Sociological Review, vol. 61 (1996), p. 884 - 899
Bryson, Bethany, What about the univores? Musical dislikes and group-based identity construction among Americans with low levels of education, Poetics 25 (1997) 141-156
Castells, Manuel, The Net and the Self, Critique in Anthropology 16 (1996), 9-38Chan, Tak Wing and John H.Goldthorpe, Social Stratification and Culture Con-
sumption: Music in England, European Sociological Review (2006), 1-19De Graaf, Nan Dirk, Distinction by Consumption in Czechoslovakia, Hungary
and the Netehrlands, European Sociological Review, vol. 7, no. 3, (1991), p. 267 - 290
De Graaf, Nan Dirk, Paul M. De Graar, Gerbert Kraaykamp, Parental Cultural Capital and Educational Attainment in the Neatherlands: A Refinement of the Cultural Capital Perspective, Sociology of Education, vol. 73, no.2, (2000), p. 92 - 111
DiMaggio, Paul and Francie Ostrower, Participation in the Arts by Black and White Americans, Social Forces, vol. 68, no. 3 (1990), p.753 - 778
DiMaggio, Paul and Michael Useem, Social Class and Arts Consumption: The Origins and Consequences of Class Differences in Exposure to the Arts in America, Theory and Society, vol. 5, no. 2, (1978), 141 - 161
Dragićević-Šešić, Milena, Pokušaj definisanja dominantnih i produktivnih mod-
265
bibliograpHy
ela kulturnog života u Jugoslaviji, u: Potkulture 1, IIS SSO Srbije, Beograd, 1985
Dragićević-Šešić, Milena: Publika, Kultura, broj 97 (1998), str. 69-88. Dragojević, Dragomir, Kulturne potrebe i nivo interesovanja učenika srednjih
škola, Kultura, br. 26, Beograd 1974. Ericson, Bonnie H. Culture, Class and Connections, The American Journal of
Sociology, vol. 102, no.1, (1996), 217 - 251Frith, Simon, What is Good Music, Canadian University Music Review, Vol. 10,
(1990), p. 92 – 102Gartman, David, Culture as Class Symbolization or Mass Reification? A Critique
of Bourdeiu’s Distinction, American Journal of Sociology, vol. 97, no. 2 (1991), p.421- 447
Gartman, David, Bourdieu’s Theory of Cultural Change, Explication, Applica-tion, Critique, Sociological Theory, vol. 20, no.2, (2002), p. 255 – 277
Greenberg, Clement, Avant-Gard and Kitch, Partisan Review, 1947Hechter, Michael, From Class to Culture, The American Journal of Sociology,
Vol. 110, No. 2 (2004), 400 – 446Holt, Douglas, B. Poststructuralist Lifestyle Analysis: Conceptualizing the Social
Patterning of Consumption in Postmodernity, Journal of Consumer Research, vol 23 (1997), p. 326 – 350
Holt, Douglas, B. Distinction in America? Recovering Bourdieu’s Theory of Tastes for its Critics, Poetics (25), 93-120, 1997
Michael Hughes and Richard A. Peterson, Isolating cultural choice patters in the U.S. population, American Behavioral Scientists, 26, 1983, p. 459 - 487
Kane, Danielle, Distinction worldwide?: Bourdieu’s theory of taste in interna-tional context, Poetics 31 (2003) 403–421
Katz, Gerro, Tally and Yossi Shavit, The Stratification of Leisure and Taste: Classes and Lifestyles in Isreal, European Sociological Review, vol. 14, no.4 (1998), 369 - 386
Katz, Gerro, Tally, Highbrow Cultural Consumption and Class Distinction in Italy, Israel, West Germany, Sweeden and the United States, Social Forces, vol. 81, no. 1, (2002), 207 – 229
Kern, Roger M., Boundaries in use: The deployment of personal resources by the upper middle class, Poetics vol, 25 (1997) 177-193
Kronja, Ivana, Politics, Nationalism, Music, and Popular Culture in 1990s Serbia, Slovo, Maney Publishing, Vol 16, Spring 2004, No 1. str. 5-15
Lamont Michèle and Annette Lareau, Cultural Capital: Allusions, Gaps and Glis-
266
Cultural Needs, Habits aNd taste of CitizeNs of serbia aNd MaCedoNia
sandos in Recent Theoretical Development, Sociological Theory, vol. 6, no. 2 (1988), p. 153 - 168
Lamont Michèle, John Schmalzbauer, Maureen Waller, Daniel Weber, Cultural and moral boundaries in the United States: Structural position, geographic location, and lifestyle explanations, Poetics 24 (1996) 31-56
Lamont, Michèle and Virág Molnár, The Study of Boundaries in the Social Sci-ences, Annual. Revew of Sociology. Vol 28, (2002), p. 167–95
Lahire, Bernard, From the habitus to an individual heritage of dispositions. To-wards a sociology at the level of the individual, Poetics 31 (2003) 329–355
Lazar, Žolt K, Aleksandra Višnjevac i Anđelija Vučurević, Aktuelno stanje omla-dinskih potkultura i publika EXIT-a, Teme, vol. 28, br. 4, (2004), str. 361-380
Lizardo, Omar, The puzzle of women’s ‘‘highbrow’’ culture consumption: In-tegrating gender and work into Bourdieu’s class theory of taste, Poetics 34 (2006) 1–23
Maffesoli, Michael, The Social Ambiance, Current Sociology 41 (1993), 7-15Mukerji, Chandra and Michael Schudson, Popular Culture, Annual Review of
Sociology, vol. 12, (1986), p 47 -66Nardone, J. M. Is the Movie Industry Countercyclical? Cycles 33, 3, April 1982Nemanjić, Miloš: Funkcije umetnosti i estetička potreba, Kulura, broj 11 (1970),
str. 61-80. Nemanjić, Miloš: Kulturne potrebe i kulturne vrednosti, Kultura, broj 15, (1971),
str. 152-162. Peterson, Richard A.and Paul Di Maggio, From Region to Class, the Changing
Locus of Country Music: A Test of the Massification Hypothesis, Social Forces, vol. 53, no. 3. (1975), pp. 497-506.
Peterson, Richard A. Understanding audience segmentation: From elite and mass to omnivore and univore. Poetics 21, (1992) p. 243-258,.
Peterson, Richard, A. and Roger M. Kern, Changing Highbrow Taste: From Snob to Omnivore, American Sociological Review, vol. 61, no. 5 (1996), p. 900 - 907
Peterson, Richard A., The rise and fall of highbrow snobbery as a status marker, Poetics 25 (1997) 75-92
Popov, Nebojša: Društvena uslovljenost kulturnih potreba, Kultura, broj 4, (1969) str. 78 - 95.
Reckwitz, Andreas, Toward a Theory of Social Practices: A Development in Cul-turalist Theorizing, European Journal of Social Theory vol 5, no 2 (2002), p. 243–263
267
bibliograpHy
Sintas, J. L. and Alvarez, E. G, Omnivores Show up Again: The Segmentation of Cultural Consumers in Spanish Social Space. European Sociological Review, 18, (2002). 353–368.
Sintas, J.L and Tally Katz-Gerro, From Exclusive to Inclusive elitists and further: Twenty years of omnivorousness and cultural diversity in arts participation in the USA, Poetics, 32 (2005), 299-319.
Sobel, Michael, Lifestyle Differentiation and Stratification in Contemporary U.S.Society, Research in Social Stratification and Mobility 2 (1983), 115-144
Swidler, Ann, Culture in Action: Symbols and Strategies, American Sociological Review, vol. 51, (1986), p. 273-286
Stigler, George J., and Gary S. Becker. De Gustibus Non Est Disputandum, Amer-ican Economic Review, 67, No. 2, 1977, 76–90.
Stichele, Vander Alexander and Rudi Laermans, Cultural Participation in Flan-ders: Testing the Cultural Ominvore Thesis with population data, Poetics, 34 (2006), 45-64
Throsby, David, The Production and Consumption of the Arts: A View of Cultural Economics, Journal of Economic Literature, vol. 32, no. 1 (1994), p. 1 - 29
Trienekens, Sandra, Colourful distinction: the role of ethnicity and ethnic orien-tation in cultural consumption, Poetics 30 (2002) 281–298
Upright, Craig Barton, Social capital and cultural participation: spousal influ-ences on attendance at arts events, Poetics 32 (2004) 129–143
Van Eijck, Koen, The impact of family background and educational attainment on cultural consumption: A sibling analysis, Poetics 25 (1997) 195-224
Van Eijck, Koen, Socialization, Education and Lifestyle: How Social Mobility Increases the Cultural Heterogeneity of Status Groups, Poetics 26 (1999), 309-328
Van Eijck, Koen, Richard A. Peterson and the culture of consumption, Poetics 28 (2000) 207-224
Van Eijck, Koen, Social Differentiation in Musical Taste Patterns, Social Forces, vol. 79, no. 3, (2001), p. 1163 – 1185
van Rees, K., Vermunt, J. and Verboord, M, Cultural Classifications under Dis-cussion: Latent Class Analysis of Highbrow and Lowbrow Reading. Poetics, 26 (1999), 349–365
Verdaasdonk, Hugo, Valuation as rational decision-making: a critique of Bourdieu’s analysis of cultural value, Poetics 31 (2003) 357–374
Vogel, Harold. Entertainment Industry Economics: A Guide for Financial Analy-sis, Cambridge, U.K.: Cambridge University Press, 2000.
268
Cultural Needs, Habits aNd taste of CitizeNs of serbia aNd MaCedoNia
Warde, Alan and Gindo Tampubolon, Social capital, networks and leisure con-sumption, The Sociological Review, (2002). p. 155 – 180
Warde, Alan, Consumption and Theories of Practice, Journal of Consumer Cul-ture, vol 5, no. 2 (2005): 131–153
Jennifer Wiggins „Motivation, Ability and Opportunity to Participate: A Recon-ceptualization of the RAND model of Audience Development“
Wilson, John, Sociology of Leisure, Annual Review of Sociology, vol. 6 (1980), p. 21 - 40
Woodward Ian, Michael Emmison, From aesthetic principles to collective senti-ments: The logics of everyday judgements of taste, Poetics 29 (2001) 295–316
Zablocki, Benjamin, D, and Rosabeth Moss Kanter, The Differentiation of Life-Styles, Annual Review of Sociology, 2 (1976), 269-298
Zavisca, Jane, The Status of Cultural Omnivorism: A Case Study of Reading in Russia, Social Forces, vol. 84, No. 2 (2005), p. 1233 -1257
269
SadržajCultural Needs, Habits and Taste of Citizens of Serbia and Macedonia 5
Cultural needs and habits 33
Cultural Needs - A Potential Aspect of Cultural Participation 40
Cultural Habits – The Actual Aspect of Cultural Participation 66
The Audience and Cultural Offer 123
Tastes and Discourses 192
Cultural Styles and Social Factors 242
Bibliography 258