Embed Size (px)
Citation preview
This is an Accepted Author version of the paper, published 2017 in Accident Analysis & Prevention. The definitive version is online at http://www.sciencedirect.com/science/article/pii/S0001457517303366
1
Predictors of the frequency and subjective experience of cycling
near misses: findings from the first two years of the UK Near Miss
Project Rachel Aldred and Anna Goodman
1. Background Successfully promoting cycling would bring considerable benefits for population health, greenhouse gas
emissions, urban air pollution and congestion (Cabinet Office 2009, Maizlish et al 2013, Woodcock et al
2013, Woodcock 2014). Cycling participation remains low, however, in the UK and many other high-
income countries relative to its potential (Lovelace et al 2016; TfL 2010). Although multiple factors may
act as barriers to cycling, the most common reason that people give for not cycling is perceived risk
(Lawson et al 2013, Horton 2007, Thornton et al 2010). These concerns may partly reflect media over-
reporting of road traffic crashes involving cyclists relative to users of other modes (MacMillan 2016), but
may also reflect the impact of seeing or experiencing a cycling road injury or ‘near miss’.
The latter has traditionally received little research or policy attention, but this has begun to change.
Sanders (2015) showed that because of the high frequency of near misses, they have stronger impact on
cycling experiences, and potentially withdrawal from cycling, than do injury incidents. New mapping
tools such as Collideoscope or bikemaps.org, alongside existing reporting systems run directly by police
or transport authorities, have allowed people to report such incidents in real time. There is a growing
recognition that non-injury incidents may form a missing link between the relatively low ‘objectively
measured’ injury rate (even in low-cycling contexts) and the high levels of ‘fear of cycling’ (Aldred 2016).
In the UK, near misses have started to become incorporated within policing and planning policy. For
example, in October 2016 West Midlands Police began a work stream focusing on close passes, using an
undercover officer to catch and educate drivers who give cyclists little room. This is justified on grounds
both of safety and perceived safety. The scheme aims to educate drivers about safe passing distances
and create a belief that any cyclist might be an undercover police officer. At the time of writing, 15 other
UK police services are planning to introduce such a scheme; while others are introducing or stepping up
recording of near miss or dangerous driving incidents (e.g. RoadSafe London1).
Within this growing field methods vary, and different methods lend themselves to different types of
analysis. One methodological consideration is the duration of time during which participant cyclists are
asked to record near misses. Real-time reporting systems recruit cyclists to report near misses for
weeks or months at a time which, given the high rate of minor incidents, is likely to be onerous even for
self-selecting, committed respondents2. Such systems may therefore only capture a minority of near-
misses, perhaps the most serious incidents. This may still be useful in recording incidents of greatest
1 http://content.met.police.uk/Site/roadsafelondon 2 There is also an issue of self-selection which affects much of this research; in very low-cycling contexts this problem cannot easily be avoided, although it can perhaps be minimised.
This is an Accepted Author version of the paper, published 2017 in Accident Analysis & Prevention. The definitive version is online at http://www.sciencedirect.com/science/article/pii/S0001457517303366
2
concern for policy, but for assessing rates of all types of incident it may be necessary to conduct studies
that use a much shorter time period such as a single day.
Definitions of ‘near misses’ also vary, with some highly subjective and others more objective. As with
any research there is a trade-off between capturing individual experience and creating a generalizable
measure of that experience. An ‘objective’ definition of near misses is attractive as in theory it can be
independently verified. Much ‘near miss’ research has hence focused on close passes as these can, with
on-bike equipment, be measured (e.g. Walker et al 2014, Walker 2007). Another definition is based on
an approach often taken for studying near misses between motorised vehicles, and relates to the taking
of evasive action. For example, Matsui et al (2015) state:
‘A near-miss incident is a situation that a car accident involving a cyclist is avoided by the
attention and braking of a driver.’
Similarly, Girotto et al (2016) defined a ‘near-miss accident as the performance of an evasive manoeuver
by the driver [our emphasis] to avoid a vehicle accident’.
By contrast, in many Near Miss Project incidents, cyclists said that they had prevented incidents by
modifying their own behaviour. More broadly, definitions that rely on evasive action being taken (by any
party: driver, pedestrian or cyclist) will not capture incidents such as close passes where neither party in
fact swerved, but the experience might still have been unpleasant and intimidating.
However, a subjective definition of near misses raises the question as to whether these experiences can
be generalised and reliably counted. Subjectively reported rates may differ sharply depending on how
and in what order questions are asked, and how long a recall period the question covered. Sanders
(2015) left the time period entirely open, Girotto et al (2016) used a twelve-month period, while Fyhri et
al (2016) asked about a specific trip. Different survey methods might imply that a near-miss is a collision
only just avoided, or that a near-miss covers a wide range of incident categories. Again, survey design
should take account of this depending upon what the research seeks to capture.
One way of assessing the reliability of subjective reporting is to compare rates obtained through
objective and subjective measurements, although this may only be possible for some types of near miss,
and will depend on the definitions used. For example, Joshi et al (2001) wanted to capture all incidents
that caused fear or annoyance to respondents and it is hard to see how this could be directly verified by
independent observation. By contrast, verifying rates of close passes is feasible, and this was done in
Aldred (2016) which found rates of subjective and objective reporting roughly comparable in the UK
context for that specific ‘near-miss’ incident type.
St-Aubin et al (2015) used automation to identify and analyse near-miss events at a roundabout,
identifying evasive action taken and how soon this happened before a collision would have occurred
(‘time-to-event’). While a highly promising approach this currently would not capture many categories
of cyclist-defined incident. Rapid development of such techniques will make it easier to objectively
measure some types of non-injury incident, but we should remember that subjectively defined incidents
This is an Accepted Author version of the paper, published 2017 in Accident Analysis & Prevention. The definitive version is online at http://www.sciencedirect.com/science/article/pii/S0001457517303366
3
may be important, and measurable, even if they will not easily map to something that can be (at
present) objectively measured.
However, clearly it is important to ensure that where experiences are being subjectively measured,
these do have some consistency and validity. Using 2014 and 2015 data from the UK Near Miss Project,
this paper therefore aims to examine the consistency of incident rates for cycling near misses across
these two years. It further examines the consistency of the individual-level predictors of experiencing a
near miss, including what influences the scariness of an incident. This builds upon our previous work
that only analysed data from the first, 2014, period of data collection (Aldred 2016, Aldred and
Crosweller 2015).
In addition, in 2015 the Near Miss Project asked for the first time about cycling experience. This
additional question was included because in 2014 we had found that incident rates declined weakly with
age (Aldred 2016, Aldred and Crosweller 2015), a finding that might be explained by age acting as a
proxy for cycling experience. Our second aim here is therefore to examine whether the incident rate is
associated with how much cycling experience participant has, with a particular focus on new cyclists.
Finally, the 2015 Near Miss Project also asked participants for the first time whether they would self-
define a non-injury incident as a ‘near miss’. We used this to address our third aim, which was to
examine what individual and incident characteristics predict perceptions of whether an incident is
deliberate, whether it is a near miss, and whether it is very scary.
2. Methods
2.1 Participants
In 2014 and then again in 2015, the Near Miss project recruited a convenience sample of people who
cycle. Channels for recruitment included organisational mailing lists, cycling organisations, leafleting (in
the first year), traditional and social media dissemination, and re-contacting previous survey
participants. Participants were informed that the study focused on cycling near misses and that it should
take around 15-20 minutes to complete. Ethical approval for the study was granted by Westminster
University.
The recruitment method could introduce bias, if people more prone to near misses sign up. However,
given only 2% of trips are by cycle, using more traditional methods to recruit a national sample of
cyclists would be difficult and expensive. The study sought to ensure different types of cyclist were
represented by using a range of recruitment channels and messages.
Out of an initial sample of 2,668 completed diaries, we removed 66 reporting many incidents (>10) as (i)
detailed information was only asked about the first 10 incidents experienced and (ii) people reporting
more than 10 incidents could be seen as potential outliers, with unusually high rates of/awareness of
non-injury incidents. We further excluded 16 diaries because the same individual had completed two
diaries in the same year; in this case we only used the first diary that they completed in that year. This
left a final sample of 2586 diaries, 1525 completed in 2014 and 1061 in 2015. 398 participants
completed diaries in both 2014 and 2015.
This is an Accepted Author version of the paper, published 2017 in Accident Analysis & Prevention. The definitive version is online at http://www.sciencedirect.com/science/article/pii/S0001457517303366
4
In addition to describing their incidents, participants provided us with some information on individual
characteristics. This included their gender, their age, and (in 2015 only) responses to the question
“Please tell us how long you have been cycling for, in years”. Participants also told us their home
postcode, which we used to assign the prevalence of commuter cycling in the participant’s local
authority, using data from the 2011 Census. We have previously shown that this measure of commuter
cycling in the Census is highly correlated, at the population level, with the total amount of cycling in an
area (Goodman 2013).
2.2 Data collection on near misses
Participants were asked to nominate in advance one day over a two-week period on which they would
record cycle trips and any near miss incidents. On the nominated day, each participant completed an
online one-day diary that asked participants to report all cycle trip stages, without exact location details:
for example ‘Home to Work’ or ‘Work to Meeting’. Participants were asked for timings of each trip stage
and whether any non-injury incidents occurred. If any incidents did occur, participants were asked to
locate the incident on a Google map. To allow calculation of a daily incident rate, participants were also
asked to estimate the total distance they had cycled across the day and their confidence in this
estimate. Many were reporting a repeated journey (typically, commute) while others used apps such as
Strava, so confidence was generally high.
The definition of ‘incident’ was left open, with participants directed to record all events they found
‘frightening’ and/or ‘annoying’. They were asked to separately rate how scary or annoying incidents
were; where on each scale 0 represented ‘not at all scary’ or ‘not at all annoying’ and 3 ‘very scary’ or
‘very annoying’. In the 2015 questionnaire, participants were also asked if they thought an incident was
deliberate, and if they would consider it a ‘near miss’. Answers to these questions could be ‘yes’, ‘no’
and ‘unsure’3. We asked these two questions because we thought it interesting and important to
explore the extent to which a just-avoided collision, and/or overt aggression by another road user, might
affect the level of fear generated by an incident.
Participants described each incident separately in a free text field. In 2014 the open descriptions of
incidents were coded to create seven incident types accounting for 97.3% of all reported incidents
(Aldred and Crosweller 2015). An iterative and inductive approach was employed, with two coders
classifying incidents using NVivo qualitative software, combining incident types that then seemed to
share important similarities (e.g. near left-hooks and near right-hooks).
In 2015, we again asked for an open description of the incident, but afterwards additionally asked the
respondent to place the incident in one of eight categories, if appropriate (one of our original seven
incident types, covering near misses caused by an obstruction, was split in two depending on whether a
pedestrian or something else was blocking the cyclist’s way). Once the data had been collected, we went
3 These questions were not included in the 2014 questionnaire, although we had provisionally coded incidents we thought might have been deliberate based on a description that included overt hostility (e.g. beeping or verbal abuse).
This is an Accepted Author version of the paper, published 2017 in Accident Analysis & Prevention. The definitive version is online at http://www.sciencedirect.com/science/article/pii/S0001457517303366
5
through every incident recoding where necessary (the main change being that some incidents
categorised as ‘other’ by a respondent did fit into a category, on reading the incident description).
2.3 Data analysis
In addressing our first and second aims, we used Poisson regression with individuals as the unit of
analysis. Our outcome was the number of incidents that a person experienced on their diary day. We fit
these regression models in 3 stages. First, we fit unadjusted models; second we fit models adjusting for
other participant and incident characteristics (gender, age, day of week and local cycling prevalence);
and finally we additionally adjusted for total distance travelled across the day. We included this third
stage of additionally adjusted for total distance travelled in order to examine how far any differences in
the daily incident rate could be explained by differences in the amount of cycling done. In those
analyses that pooled together 2014 and 2015 data, we used multilevel analysis (diaries nested within
individuals) to account for the fact that 398 participants completed diaries in both years.
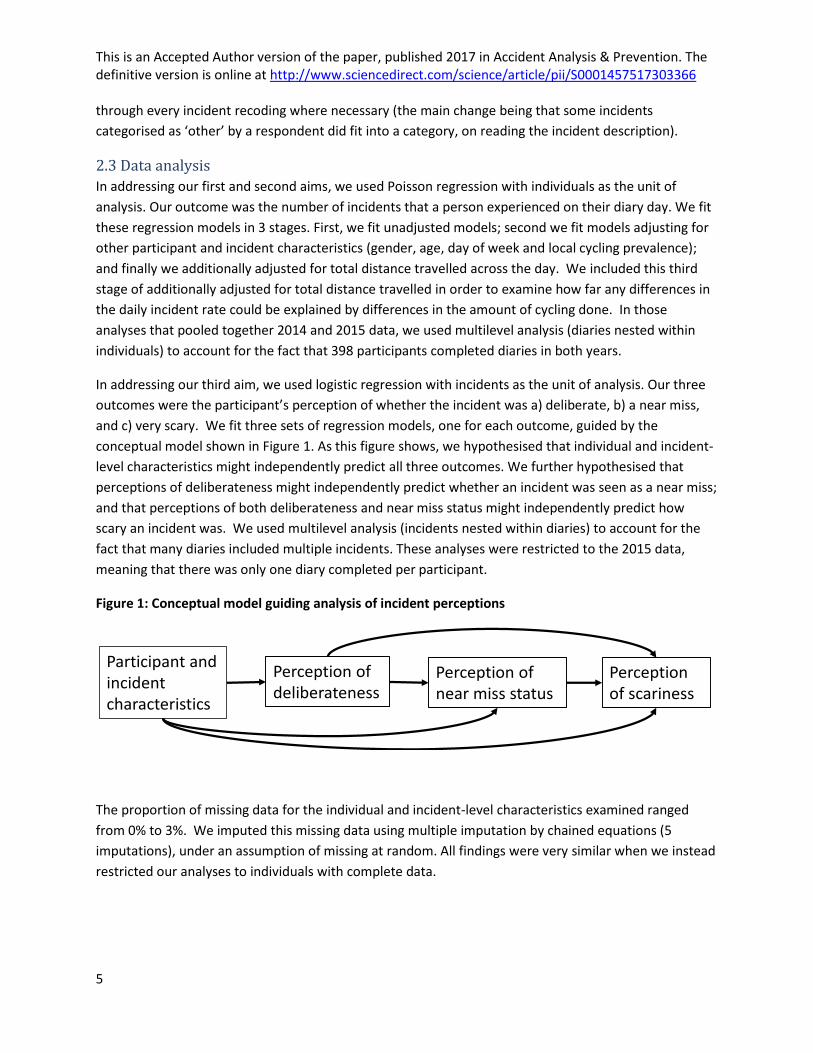
In addressing our third aim, we used logistic regression with incidents as the unit of analysis. Our three
outcomes were the participant’s perception of whether the incident was a) deliberate, b) a near miss,
and c) very scary. We fit three sets of regression models, one for each outcome, guided by the
conceptual model shown in Figure 1. As this figure shows, we hypothesised that individual and incident-
level characteristics might independently predict all three outcomes. We further hypothesised that
perceptions of deliberateness might independently predict whether an incident was seen as a near miss;
and that perceptions of both deliberateness and near miss status might independently predict how
scary an incident was. We used multilevel analysis (incidents nested within diaries) to account for the
fact that many diaries included multiple incidents. These analyses were restricted to the 2015 data,
meaning that there was only one diary completed per participant.
Figure 1: Conceptual model guiding analysis of incident perceptions
The proportion of missing data for the individual and incident-level characteristics examined ranged
from 0% to 3%. We imputed this missing data using multiple imputation by chained equations (5
imputations), under an assumption of missing at random. All findings were very similar when we instead
restricted our analyses to individuals with complete data.
Participant and incident characteristics
Perception of deliberateness
Perception of near miss status
Perception of scariness
This is an Accepted Author version of the paper, published 2017 in Accident Analysis & Prevention. The definitive version is online at http://www.sciencedirect.com/science/article/pii/S0001457517303366
6
3. Results
3.1 Comparison of incident rate and incident patterning between 2014 and 2015
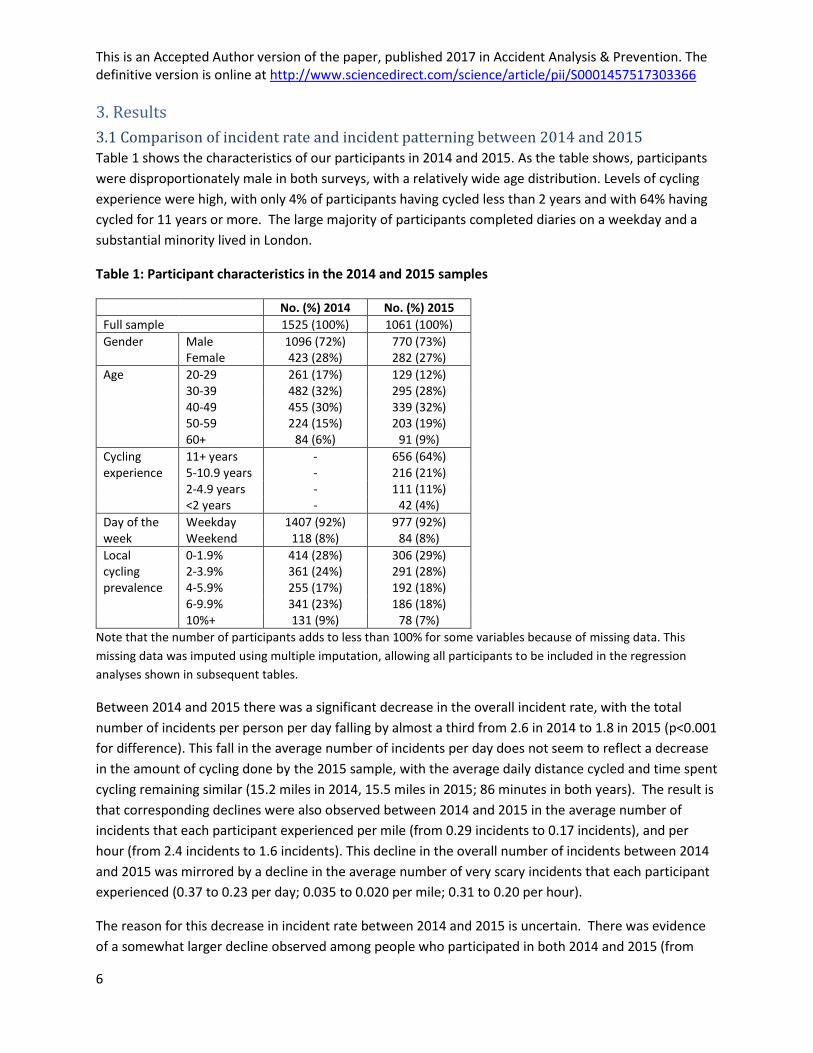
Table 1 shows the characteristics of our participants in 2014 and 2015. As the table shows, participants
were disproportionately male in both surveys, with a relatively wide age distribution. Levels of cycling
experience were high, with only 4% of participants having cycled less than 2 years and with 64% having
cycled for 11 years or more. The large majority of participants completed diaries on a weekday and a
substantial minority lived in London.
Table 1: Participant characteristics in the 2014 and 2015 samples
No. (%) 2014 No. (%) 2015
Full sample 1525 (100%) 1061 (100%)
Gender Male 1096 (72%) 770 (73%) Female 423 (28%) 282 (27%)
Age 20-29 261 (17%) 129 (12%) 30-39 482 (32%) 295 (28%) 40-49 455 (30%) 339 (32%) 50-59 224 (15%) 203 (19%) 60+ 84 (6%) 91 (9%)
Cycling 11+ years - 656 (64%) experience 5-10.9 years - 216 (21%) 2-4.9 years - 111 (11%) <2 years - 42 (4%)
Day of the Weekday 1407 (92%) 977 (92%) week Weekend 118 (8%) 84 (8%)
Local 0-1.9% 414 (28%) 306 (29%) cycling 2-3.9% 361 (24%) 291 (28%) prevalence 4-5.9% 255 (17%) 192 (18%) 6-9.9% 341 (23%) 186 (18%) 10%+ 131 (9%) 78 (7%)
Note that the number of participants adds to less than 100% for some variables because of missing data. This
missing data was imputed using multiple imputation, allowing all participants to be included in the regression
analyses shown in subsequent tables.
Between 2014 and 2015 there was a significant decrease in the overall incident rate, with the total
number of incidents per person per day falling by almost a third from 2.6 in 2014 to 1.8 in 2015 (p<0.001
for difference). This fall in the average number of incidents per day does not seem to reflect a decrease
in the amount of cycling done by the 2015 sample, with the average daily distance cycled and time spent
cycling remaining similar (15.2 miles in 2014, 15.5 miles in 2015; 86 minutes in both years). The result is
that corresponding declines were also observed between 2014 and 2015 in the average number of
incidents that each participant experienced per mile (from 0.29 incidents to 0.17 incidents), and per
hour (from 2.4 incidents to 1.6 incidents). This decline in the overall number of incidents between 2014
and 2015 was mirrored by a decline in the average number of very scary incidents that each participant
experienced (0.37 to 0.23 per day; 0.035 to 0.020 per mile; 0.31 to 0.20 per hour).
The reason for this decrease in incident rate between 2014 and 2015 is uncertain. There was evidence
of a somewhat larger decline observed among people who participated in both 2014 and 2015 (from
This is an Accepted Author version of the paper, published 2017 in Accident Analysis & Prevention. The definitive version is online at http://www.sciencedirect.com/science/article/pii/S0001457517303366
7
0.31 incidents/mile to 0.15 incidents/mile, a 52% decline) than among people who participated in only
one year (from 0.29 incidents per mile to 0.18 incidents per mile, a 37% decline; p<0.001 for
interaction). In addition, in terms of changes in the rate of specific categories of incident, the largest
decreases were observed for the least scary categories of incidents (e.g. having to swerve to avoid an
obstruction; see Appendix Figure A1). Taken together, this suggests that the decline may reflect changes
in how people responded to the survey: people in the second survey may have had, on average, a higher
threshold for reporting “borderline” incidents, particularly if they had participated in the survey
previously. It is possible that there may be some element of “real” decline, however, as police-recorded
cycling injuries in Britain fell by 11% between 2014 and 2015 (5% for fatalities and serious injuries, 13%
for slight injuries).
The decline in the incident rate between 2014 and 2015 was observed to a very similar degree
irrespective of gender, age, day of the week or the local prevalence of cycling (all p≥0.3 for interaction,
see Appendix Table A1). In other words, although the absolute number of incidents was lower in 2015
than 2014, the patterning of those incidents with respect to the participant’s characteristics was very
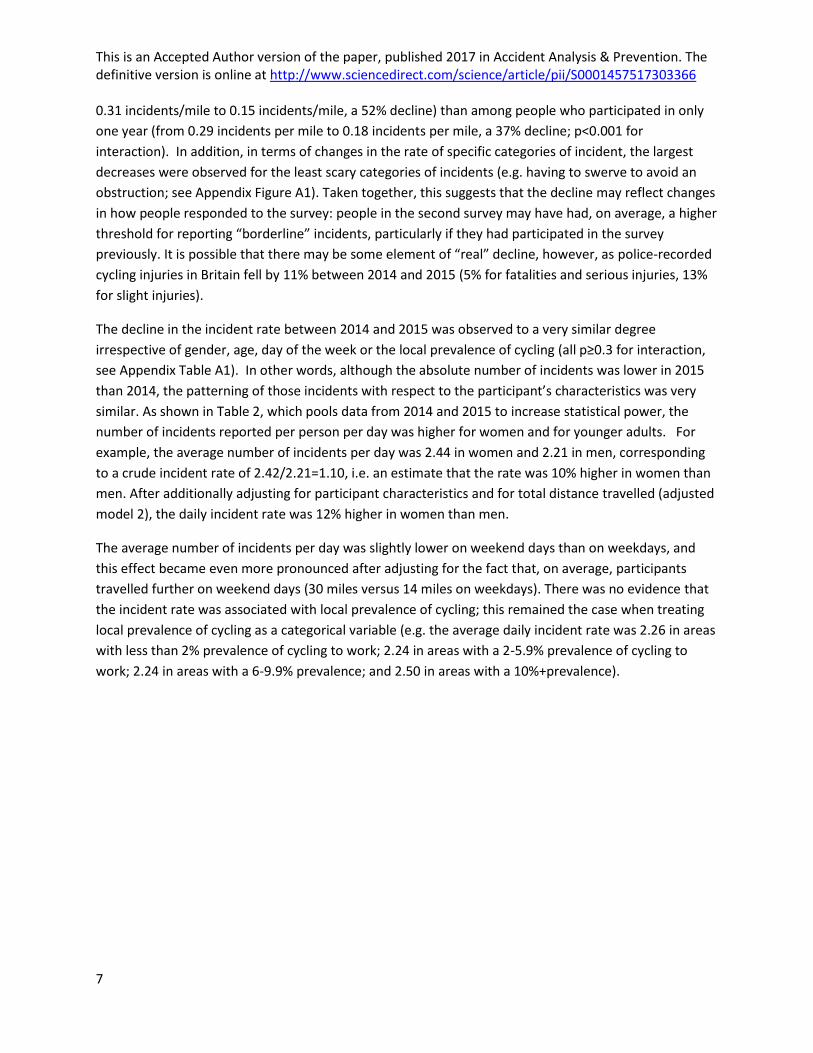
similar. As shown in Table 2, which pools data from 2014 and 2015 to increase statistical power, the
number of incidents reported per person per day was higher for women and for younger adults. For
example, the average number of incidents per day was 2.44 in women and 2.21 in men, corresponding
to a crude incident rate of 2.42/2.21=1.10, i.e. an estimate that the rate was 10% higher in women than
men. After additionally adjusting for participant characteristics and for total distance travelled (adjusted
model 2), the daily incident rate was 12% higher in women than men.
The average number of incidents per day was slightly lower on weekend days than on weekdays, and
this effect became even more pronounced after adjusting for the fact that, on average, participants
travelled further on weekend days (30 miles versus 14 miles on weekdays). There was no evidence that
the incident rate was associated with local prevalence of cycling; this remained the case when treating
local prevalence of cycling as a categorical variable (e.g. the average daily incident rate was 2.26 in areas
with less than 2% prevalence of cycling to work; 2.24 in areas with a 2-5.9% prevalence of cycling to
work; 2.24 in areas with a 6-9.9% prevalence; and 2.50 in areas with a 10%+prevalence).
This is an Accepted Author version of the paper, published 2017 in Accident Analysis & Prevention. The definitive version is online at http://www.sciencedirect.com/science/article/pii/S0001457517303366
8
Table 2: Individual-level predictors of incident rate, 2014 and 2015 samples combined
No. Incidents per day
Crude (unadjusted) rate
ratio (95% CI)
Adjusted rate ratio, model 1
(95% CI)
Adjusted rate ratio, model 2 (95% CI)
Gender Male 2.21 1* 1 1* Female 2.42 1.10 (1.01, 1.19) 1.07 (0.98, 1.16) 1.12 (1.03, 1.21)
Age 20-29 2.47 1*** 1* 1** 30-39 2.38 0.97 (0.87, 1.08) 1.00 (0.90, 1.12) 0.99 (0.88, 1.10) 40-49 2.29 0.93 (0.83, 1.04) 0.99 (0.88, 1.11) 0.97 (0.86, 1.08) 50-59 2.00 0.80 (0.71, 0.91) 0.88 (0.77, 1.00) 0.85 (0.75, 0.97) 60+ 1.85 0.73 (0.61, 0.87) 0.82 (0.69, 0.98) 0.78 (0.65, 0.93)
Day of the Weekday 2.28 1† 1 1** week Weekend 2.08 0.89 (0.78, 1.01) 0.92 (0.81, 1.05) 0.81 (0.71, 0.94)
Local cycling prevalence
Change per 10 percentage-point increase
- 1.07 (1.00, 1.16)† 1.02 (0.95, 1.10) 1.06 (0.99, 1.15)
†p<0.10, *p<0.05, ** p<0.01, ***p<0.001. CI = confidence interval. Rate ratios calculated using Poisson regression.
Adjusted model one adjusts for all variables shown in the column, plus year of data collection. Adjusted model 2
additionally adjusts for total daily cycling distance, entered as a linear plus quadratic term. Results in adjusted
model 2 were almost identical when adjusting for total cycling duration, as opposed to total cycling distance. After
adjusting for total daily cycling distance (i.e. in adjusted model 2), mean cycling speed was not significantly
associated with the daily number of incidents and adjusting for speed had little impact on the other regression
coefficients presented.
This is an Accepted Author version of the paper, published 2017 in Accident Analysis & Prevention. The definitive version is online at http://www.sciencedirect.com/science/article/pii/S0001457517303366
9
3.2 Impact of cycling experience on incident rate
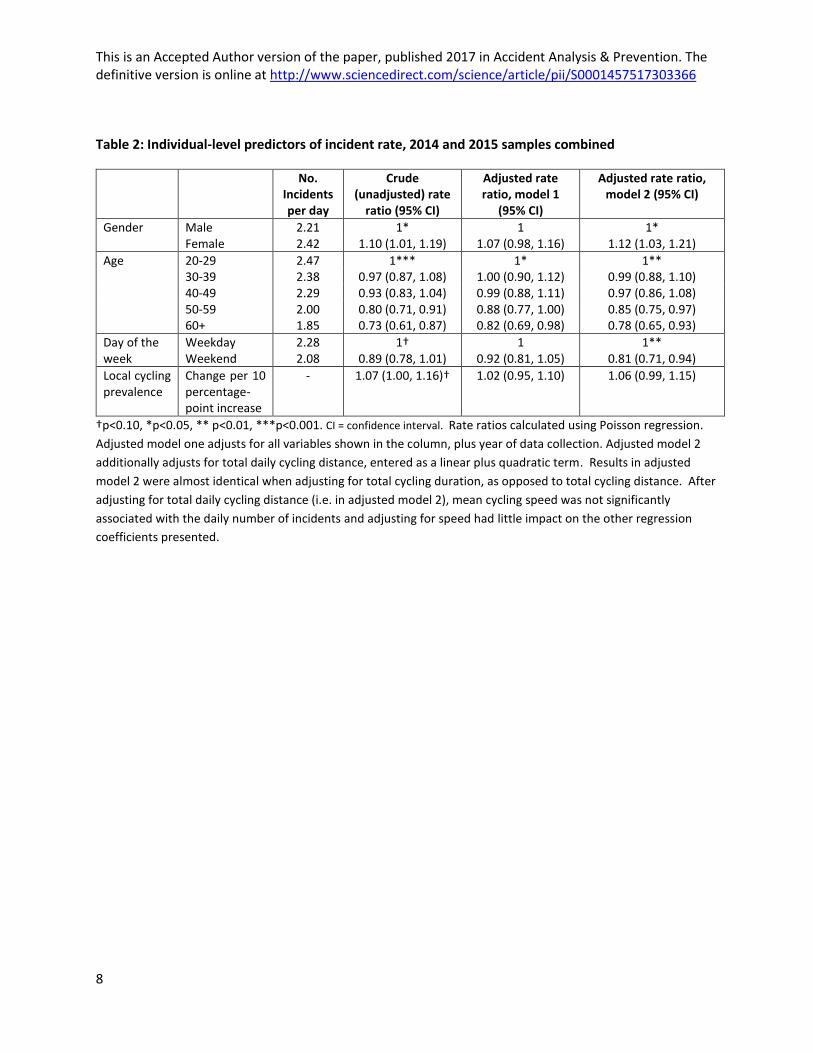
As already shown in Table 1, levels of cycling experience were high among the 1061 participants in the
2015 survey: the average reported duration of cycling experience was 23 years (median 22 years). Table
3 shows the association between cycling experience and the daily incident rate, both in relation to all
incidents and very scary incidents. As the table shows, there was evidence that the daily incident rate
was higher among newer cyclists, who had been cycling for less than 2 years, than among cyclists with
longer cycling experience. After adjusting for the participants’ characteristics and cycling distance
(adjusted model 2), newer cyclists with less than 2 years of cycling experience reported almost 40%
more incidents per day than cyclists with more than 2 years of experience (p= 0.005). The difference
was even larger with respect to very scary incidents, with new cyclists reporting twice the daily incidents
of cyclists with more than 2 years of experience (p= 0.003).
By contrast, there was little or no evidence of any association between cycling experience and incident
rate among cyclists with 2 or more years of cycling experience. Given this, and given our a priori
decision to focus on the experiences of new cyclists, we entered cycling experience as a binary variable
in all subsequent analyses.
Table 3: Cycling experience and incident rate, 2015 sample (N=1061)
All incidents Very scary incidents
No. Incidents per day
Unadjusted rate ratio (95% CI)
Adjusted rate ratio, model 1 (95% CI)
Adjusted rate ratio, model 2 (95% CI)
No. Incidents per day
Unadjusted rate ratio (95% CI)
Adjusted rate ratio, model 1 (95% CI)
Adjusted rate ratio, model 2 (95% CI)
Cycling 11+ years 1.73 1* 1* 1* 0.22 1* 1* 1* experience, 5-10.9
years 1.71 0.99 (0.88,
1.11) 0.93 (0.82,
1.06) 0.91 (0.80,
1.03) 0.18 0.81 (0.57,
1.15) 0.78 (0.53,
1.16) 0.76 (0.52,
1.12) categorised 2-4.9
years 1.81 1.04 (0.90,
1.21) 0.98 (0.84,
1.15) 0.95 (0.81,
1.11) 0.27 1.21 (0.80,
1.82) 1.18 (0.76,
1.85) 1.12 (0.72,
1.74) <2 years 2.44 1.41 (1.13,
1.75) 1.33 (1.05,
1.67) 1.33 (1.05,
1.67) 0.45 2.02 (1.25,
3.25) 1.99 (1.18,
3.34) 1.97 (1.17,
3.33)
Cycling ≥ 2 years 1.74 1** 1** 1** 0.22 1** 1** 1** experience, binary
<2 years 2.44 1.40 (1.13, 1.74)
1.36 (1.09, 1.70)
1.38 (1.11, 1.72)
0.45 2.05 (1.29, 3.27)
2.06 (1.26, 3.36)
2.09 (1.28, 3.41)
*p<0.05, ** p<0.01, ***p<0.001, from tests for heterogeneity. CI = confidence interval. Rate ratios calculated using
Poisson regression. Adjusted model one adjusts for all participant and incident characteristics shown in Table 2,
plus year of data collection. Adjusted model 2 additionally adjusts for total daily cycling distance, entered as a
linear plus quadratic term. Results in adjusted model 2 were almost identical when adjusting for total cycling
duration, as opposed to total cycling distance, or when additionally adjusting for cycling speed.
This is an Accepted Author version of the paper, published 2017 in Accident Analysis & Prevention. The definitive version is online at http://www.sciencedirect.com/science/article/pii/S0001457517303366
10
3.3 Individual and incident-level predictors of incident perceptions
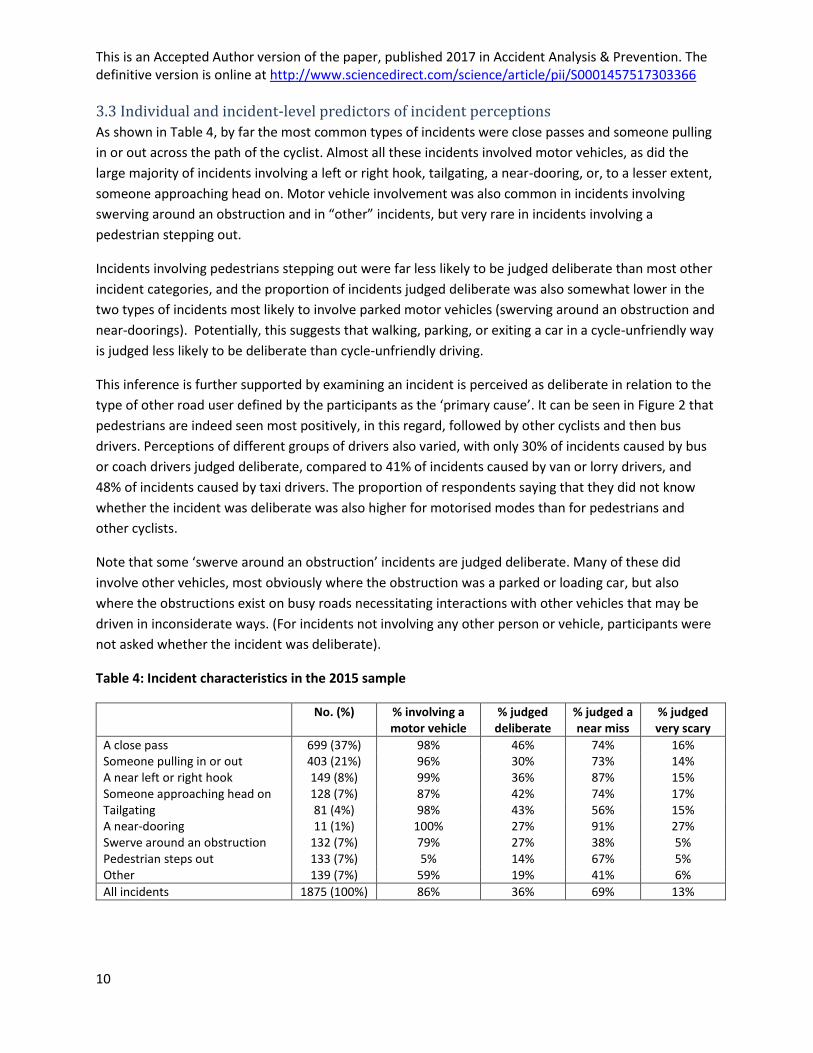
As shown in Table 4, by far the most common types of incidents were close passes and someone pulling
in or out across the path of the cyclist. Almost all these incidents involved motor vehicles, as did the
large majority of incidents involving a left or right hook, tailgating, a near-dooring, or, to a lesser extent,
someone approaching head on. Motor vehicle involvement was also common in incidents involving
swerving around an obstruction and in “other” incidents, but very rare in incidents involving a
pedestrian stepping out.
Incidents involving pedestrians stepping out were far less likely to be judged deliberate than most other
incident categories, and the proportion of incidents judged deliberate was also somewhat lower in the
two types of incidents most likely to involve parked motor vehicles (swerving around an obstruction and
near-doorings). Potentially, this suggests that walking, parking, or exiting a car in a cycle-unfriendly way
is judged less likely to be deliberate than cycle-unfriendly driving.
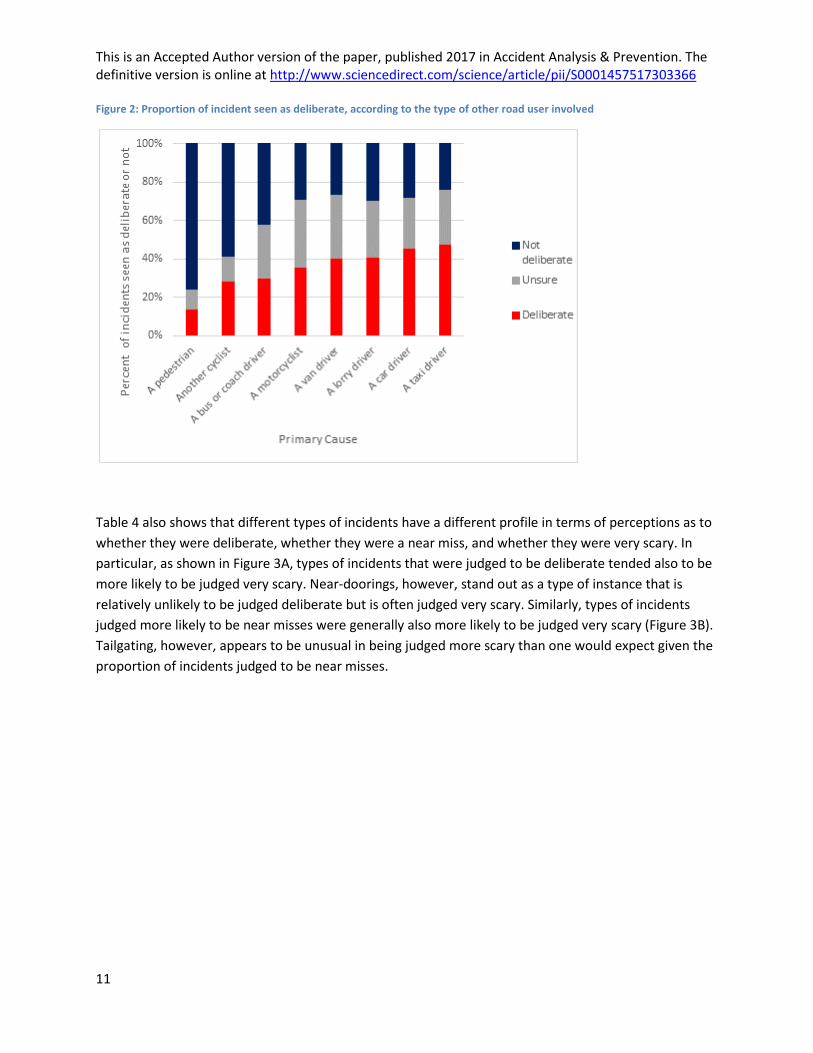
This inference is further supported by examining an incident is perceived as deliberate in relation to the
type of other road user defined by the participants as the ‘primary cause’. It can be seen in Figure 2 that
pedestrians are indeed seen most positively, in this regard, followed by other cyclists and then bus
drivers. Perceptions of different groups of drivers also varied, with only 30% of incidents caused by bus
or coach drivers judged deliberate, compared to 41% of incidents caused by van or lorry drivers, and
48% of incidents caused by taxi drivers. The proportion of respondents saying that they did not know
whether the incident was deliberate was also higher for motorised modes than for pedestrians and
other cyclists.
Note that some ‘swerve around an obstruction’ incidents are judged deliberate. Many of these did
involve other vehicles, most obviously where the obstruction was a parked or loading car, but also
where the obstructions exist on busy roads necessitating interactions with other vehicles that may be
driven in inconsiderate ways. (For incidents not involving any other person or vehicle, participants were
not asked whether the incident was deliberate).
Table 4: Incident characteristics in the 2015 sample
No. (%) % involving a motor vehicle
% judged deliberate
% judged a near miss
% judged very scary
A close pass 699 (37%) 98% 46% 74% 16% Someone pulling in or out 403 (21%) 96% 30% 73% 14% A near left or right hook 149 (8%) 99% 36% 87% 15% Someone approaching head on 128 (7%) 87% 42% 74% 17% Tailgating 81 (4%) 98% 43% 56% 15% A near-dooring 11 (1%) 100% 27% 91% 27% Swerve around an obstruction 132 (7%) 79% 27% 38% 5% Pedestrian steps out 133 (7%) 5% 14% 67% 5% Other 139 (7%) 59% 19% 41% 6%
All incidents 1875 (100%) 86% 36% 69% 13%
This is an Accepted Author version of the paper, published 2017 in Accident Analysis & Prevention. The definitive version is online at http://www.sciencedirect.com/science/article/pii/S0001457517303366
11
Figure 2: Proportion of incident seen as deliberate, according to the type of other road user involved
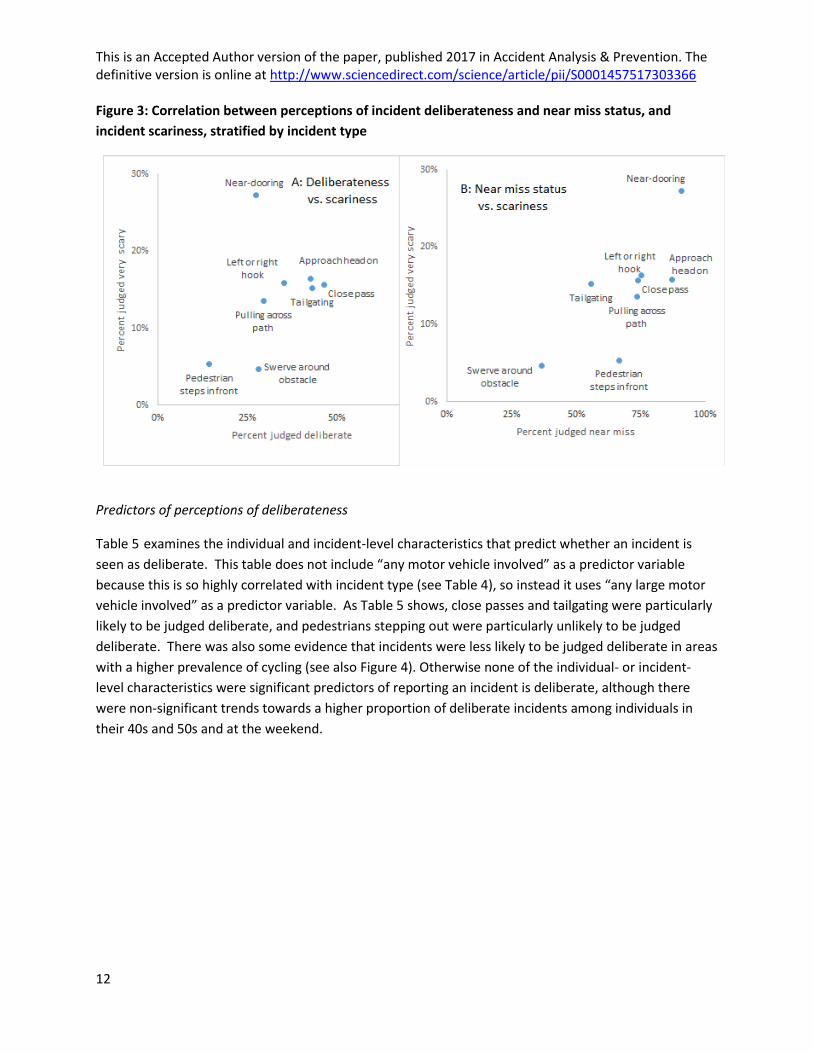
Table 4 also shows that different types of incidents have a different profile in terms of perceptions as to
whether they were deliberate, whether they were a near miss, and whether they were very scary. In
particular, as shown in Figure 3A, types of incidents that were judged to be deliberate tended also to be
more likely to be judged very scary. Near-doorings, however, stand out as a type of instance that is
relatively unlikely to be judged deliberate but is often judged very scary. Similarly, types of incidents
judged more likely to be near misses were generally also more likely to be judged very scary (Figure 3B).
Tailgating, however, appears to be unusual in being judged more scary than one would expect given the
proportion of incidents judged to be near misses.
This is an Accepted Author version of the paper, published 2017 in Accident Analysis & Prevention. The definitive version is online at http://www.sciencedirect.com/science/article/pii/S0001457517303366
12
Figure 3: Correlation between perceptions of incident deliberateness and near miss status, and
incident scariness, stratified by incident type
Predictors of perceptions of deliberateness
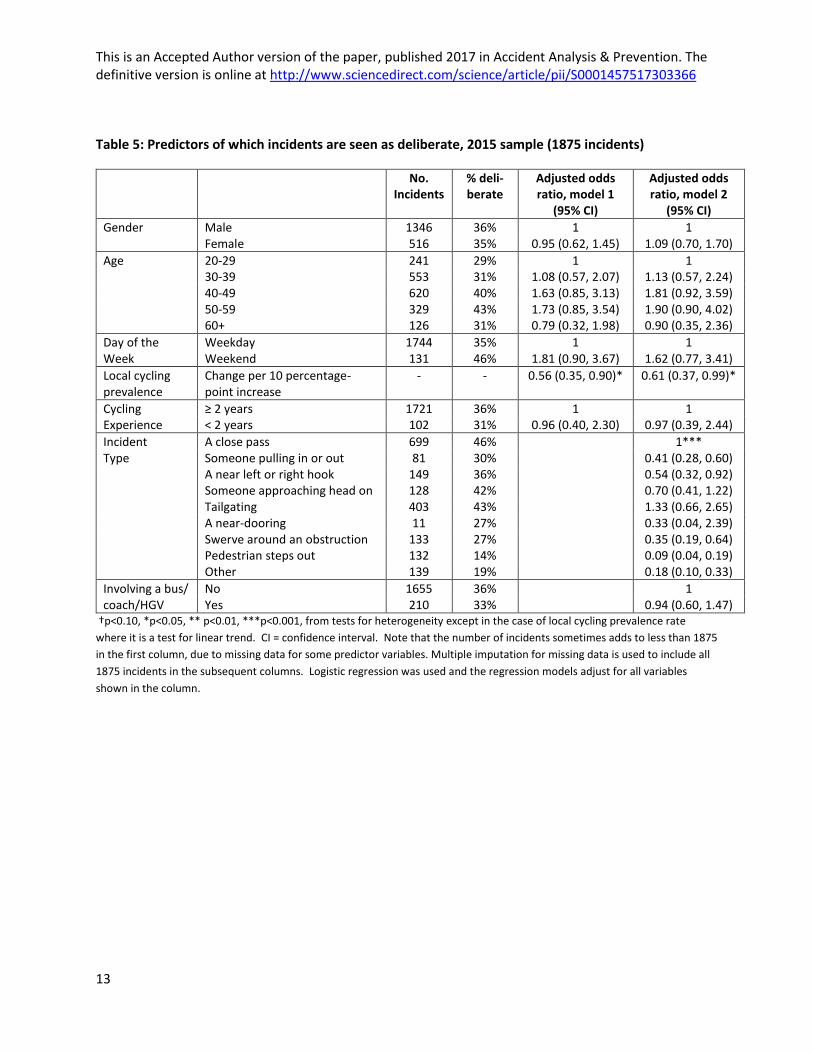
Table 5 examines the individual and incident-level characteristics that predict whether an incident is
seen as deliberate. This table does not include “any motor vehicle involved” as a predictor variable
because this is so highly correlated with incident type (see Table 4), so instead it uses “any large motor
vehicle involved” as a predictor variable. As Table 5 shows, close passes and tailgating were particularly
likely to be judged deliberate, and pedestrians stepping out were particularly unlikely to be judged
deliberate. There was also some evidence that incidents were less likely to be judged deliberate in areas
with a higher prevalence of cycling (see also Figure 4). Otherwise none of the individual- or incident-
level characteristics were significant predictors of reporting an incident is deliberate, although there
were non-significant trends towards a higher proportion of deliberate incidents among individuals in
their 40s and 50s and at the weekend.
This is an Accepted Author version of the paper, published 2017 in Accident Analysis & Prevention. The definitive version is online at http://www.sciencedirect.com/science/article/pii/S0001457517303366
13
Table 5: Predictors of which incidents are seen as deliberate, 2015 sample (1875 incidents)
No. Incidents
% deli-berate
Adjusted odds ratio, model 1
(95% CI)
Adjusted odds ratio, model 2
(95% CI)
Gender Male 1346 36% 1 1 Female 516 35% 0.95 (0.62, 1.45) 1.09 (0.70, 1.70)
Age 20-29 241 29% 1 1 30-39 553 31% 1.08 (0.57, 2.07) 1.13 (0.57, 2.24) 40-49 620 40% 1.63 (0.85, 3.13) 1.81 (0.92, 3.59) 50-59 329 43% 1.73 (0.85, 3.54) 1.90 (0.90, 4.02) 60+ 126 31% 0.79 (0.32, 1.98) 0.90 (0.35, 2.36)
Day of the Weekday 1744 35% 1 1 Week Weekend 131 46% 1.81 (0.90, 3.67) 1.62 (0.77, 3.41)
Local cycling prevalence
Change per 10 percentage-point increase
- - 0.56 (0.35, 0.90)* 0.61 (0.37, 0.99)*
Cycling ≥ 2 years 1721 36% 1 1 Experience < 2 years 102 31% 0.96 (0.40, 2.30) 0.97 (0.39, 2.44) Incident A close pass 699 46% 1*** Type Someone pulling in or out 81 30% 0.41 (0.28, 0.60) A near left or right hook 149 36% 0.54 (0.32, 0.92) Someone approaching head on 128 42% 0.70 (0.41, 1.22) Tailgating 403 43% 1.33 (0.66, 2.65) A near-dooring 11 27% 0.33 (0.04, 2.39) Swerve around an obstruction 133 27% 0.35 (0.19, 0.64) Pedestrian steps out 132 14% 0.09 (0.04, 0.19) Other 139 19% 0.18 (0.10, 0.33)
Involving a bus/ No 1655 36% 1 coach/HGV Yes 210 33% 0.94 (0.60, 1.47)
†p<0.10, *p<0.05, ** p<0.01, ***p<0.001, from tests for heterogeneity except in the case of local cycling prevalence rate
where it is a test for linear trend. CI = confidence interval. Note that the number of incidents sometimes adds to less than 1875
in the first column, due to missing data for some predictor variables. Multiple imputation for missing data is used to include all
1875 incidents in the subsequent columns. Logistic regression was used and the regression models adjust for all variables
shown in the column.
This is an Accepted Author version of the paper, published 2017 in Accident Analysis & Prevention. The definitive version is online at http://www.sciencedirect.com/science/article/pii/S0001457517303366
14
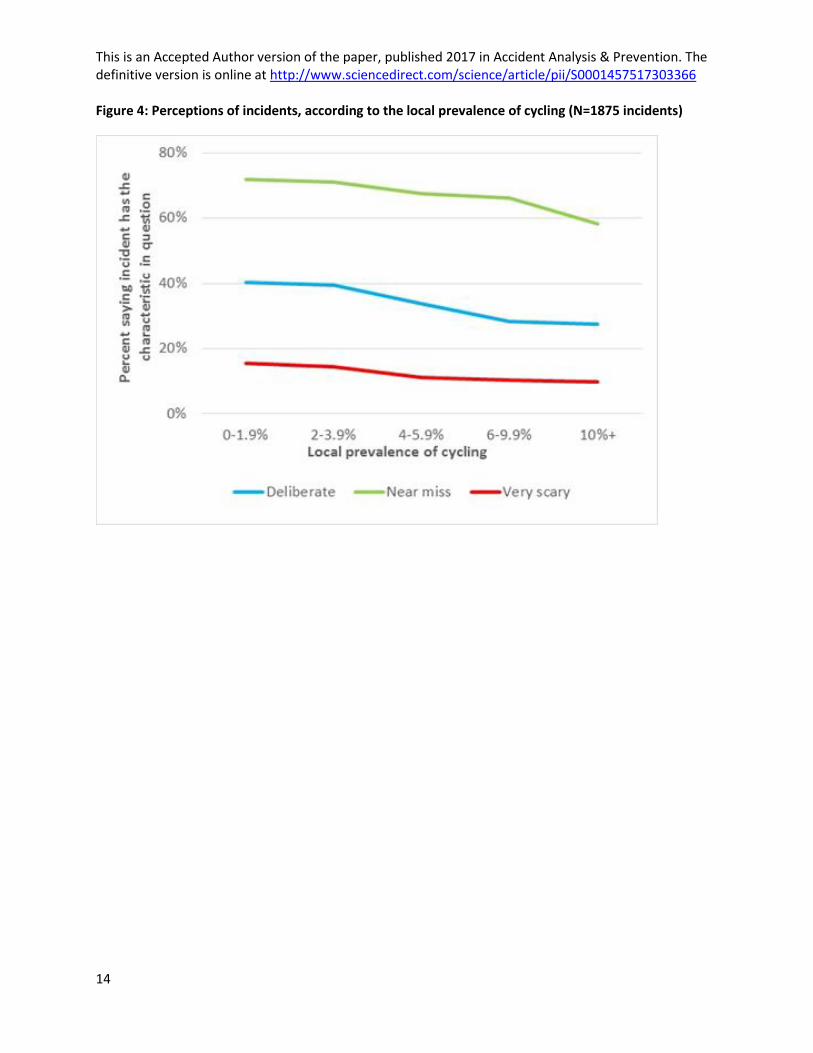
Figure 4: Perceptions of incidents, according to the local prevalence of cycling (N=1875 incidents)
This is an Accepted Author version of the paper, published 2017 in Accident Analysis & Prevention. The definitive version is online at http://www.sciencedirect.com/science/article/pii/S0001457517303366
15
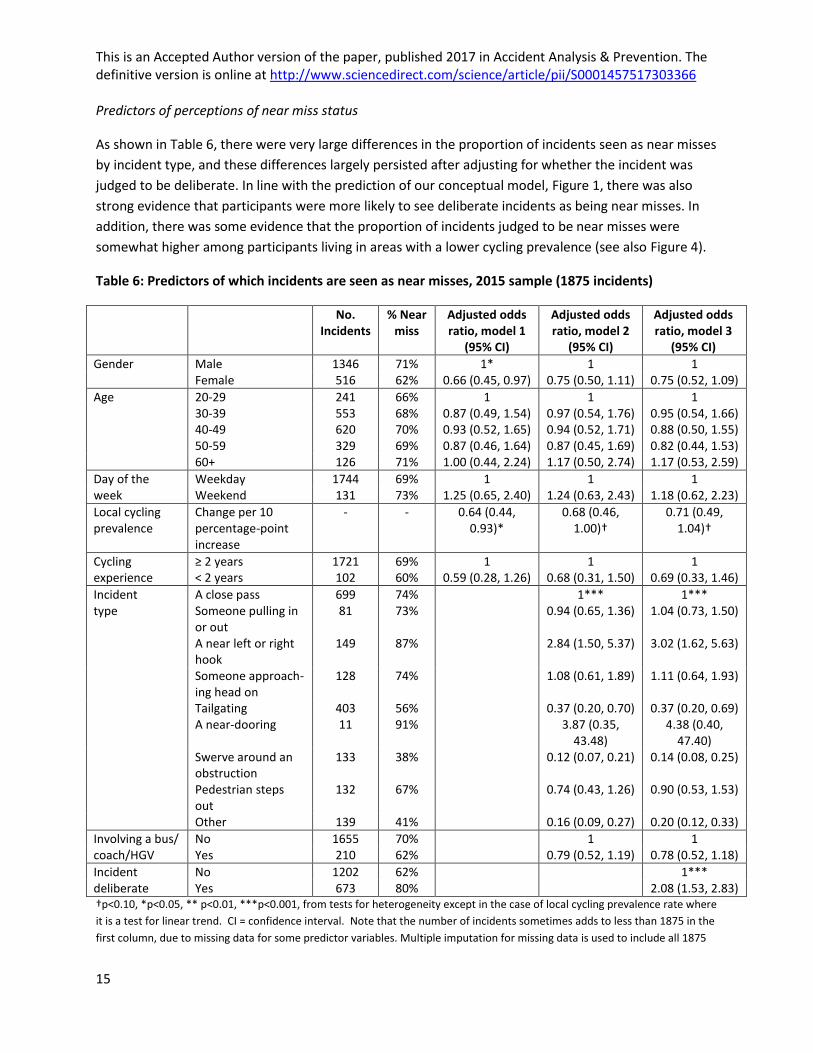
Predictors of perceptions of near miss status
As shown in Table 6, there were very large differences in the proportion of incidents seen as near misses
by incident type, and these differences largely persisted after adjusting for whether the incident was
judged to be deliberate. In line with the prediction of our conceptual model, Figure 1, there was also
strong evidence that participants were more likely to see deliberate incidents as being near misses. In
addition, there was some evidence that the proportion of incidents judged to be near misses were
somewhat higher among participants living in areas with a lower cycling prevalence (see also Figure 4).
Table 6: Predictors of which incidents are seen as near misses, 2015 sample (1875 incidents)
No. Incidents
% Near miss
Adjusted odds ratio, model 1
(95% CI)
Adjusted odds ratio, model 2
(95% CI)
Adjusted odds ratio, model 3
(95% CI)
Gender Male 1346 71% 1* 1 1 Female 516 62% 0.66 (0.45, 0.97) 0.75 (0.50, 1.11) 0.75 (0.52, 1.09)
Age 20-29 241 66% 1 1 1 30-39 553 68% 0.87 (0.49, 1.54) 0.97 (0.54, 1.76) 0.95 (0.54, 1.66) 40-49 620 70% 0.93 (0.52, 1.65) 0.94 (0.52, 1.71) 0.88 (0.50, 1.55) 50-59 329 69% 0.87 (0.46, 1.64) 0.87 (0.45, 1.69) 0.82 (0.44, 1.53) 60+ 126 71% 1.00 (0.44, 2.24) 1.17 (0.50, 2.74) 1.17 (0.53, 2.59)
Day of the Weekday 1744 69% 1 1 1 week Weekend 131 73% 1.25 (0.65, 2.40) 1.24 (0.63, 2.43) 1.18 (0.62, 2.23)
Local cycling prevalence
Change per 10 percentage-point increase
- - 0.64 (0.44, 0.93)*
0.68 (0.46, 1.00)†
0.71 (0.49, 1.04)†
Cycling ≥ 2 years 1721 69% 1 1 1 experience < 2 years 102 60% 0.59 (0.28, 1.26) 0.68 (0.31, 1.50) 0.69 (0.33, 1.46)
Incident A close pass 699 74% 1*** 1*** type Someone pulling in
or out 81 73% 0.94 (0.65, 1.36) 1.04 (0.73, 1.50)
A near left or right hook
149 87% 2.84 (1.50, 5.37) 3.02 (1.62, 5.63)
Someone approach-ing head on
128 74% 1.08 (0.61, 1.89) 1.11 (0.64, 1.93)
Tailgating 403 56% 0.37 (0.20, 0.70) 0.37 (0.20, 0.69) A near-dooring 11 91% 3.87 (0.35,
43.48) 4.38 (0.40,
47.40) Swerve around an
obstruction 133 38% 0.12 (0.07, 0.21) 0.14 (0.08, 0.25)
Pedestrian steps out
132 67% 0.74 (0.43, 1.26) 0.90 (0.53, 1.53)
Other 139 41% 0.16 (0.09, 0.27) 0.20 (0.12, 0.33)
Involving a bus/ No 1655 70% 1 1 coach/HGV Yes 210 62% 0.79 (0.52, 1.19) 0.78 (0.52, 1.18)
Incident No 1202 62% 1*** deliberate Yes 673 80% 2.08 (1.53, 2.83) †p<0.10, *p<0.05, ** p<0.01, ***p<0.001, from tests for heterogeneity except in the case of local cycling prevalence rate where
it is a test for linear trend. CI = confidence interval. Note that the number of incidents sometimes adds to less than 1875 in the
first column, due to missing data for some predictor variables. Multiple imputation for missing data is used to include all 1875
This is an Accepted Author version of the paper, published 2017 in Accident Analysis & Prevention. The definitive version is online at http://www.sciencedirect.com/science/article/pii/S0001457517303366
16
incidents in the subsequent columns. Logistic regression was used and the regression models adjust for all variables shown in
the column.
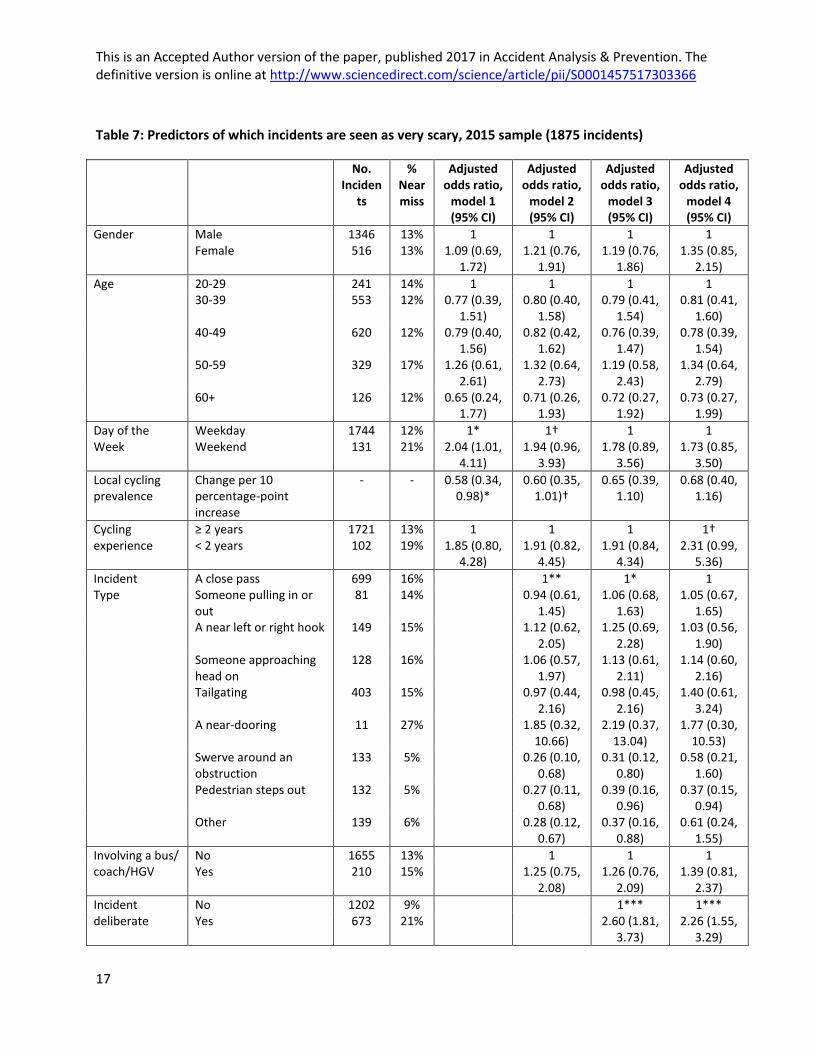
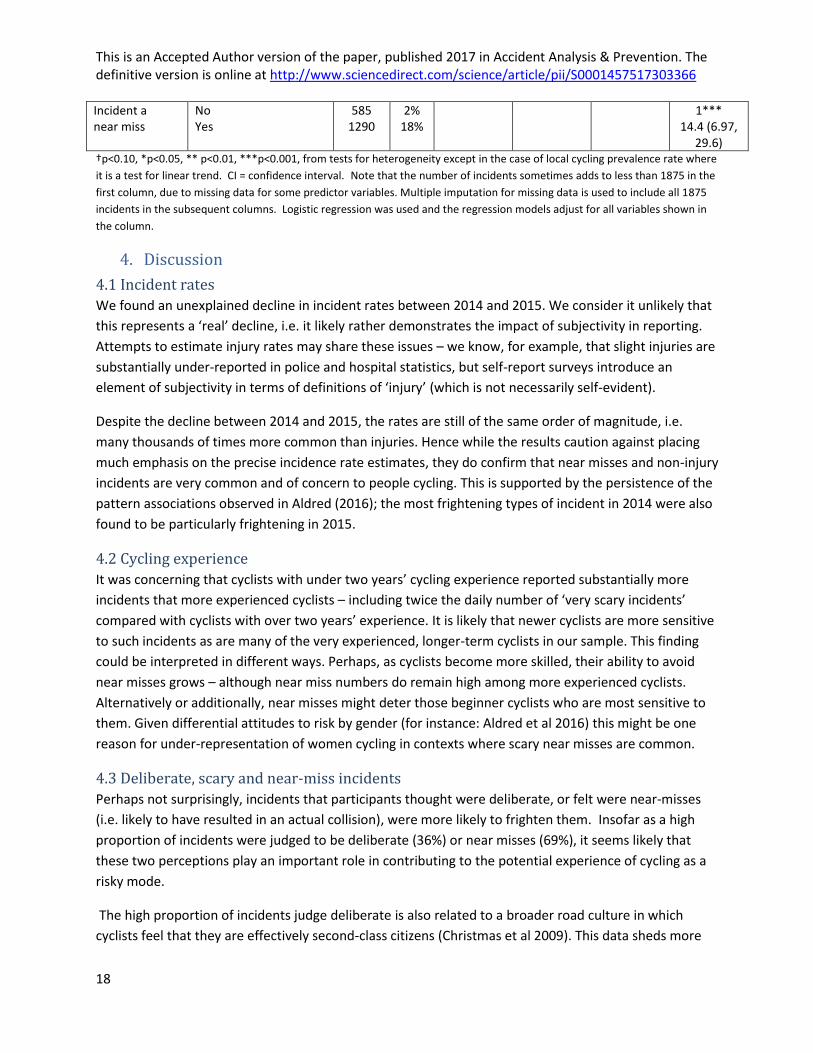
Predictors of perceptions of incident scariness
As shown in Table 7, near miss incidents were much more likely to be experienced as very scary (18%
very scary versus 2% of incidents that were not near misses). There was a strong effect of incident
deliberateness (odds ratio 2.60 in adjusted model 3), only partially attenuated after adjusting for near
miss status (odds ratio 2.26 in adjusted model 4). This suggests that the effect of perceptions of
deliberateness upon perceptions of scariness is partly mediated through perceptions of near miss status
(i.e. deliberate incidents are judged somewhat more likely to be near misses, and that makes them more
scary), but is largely direct (i.e. deliberate incidents are judged scary even if they did not result in a near
miss). However, there was no independent effect of incident type upon perceptions of scariness after
adjusting for perceptions of deliberateness and near miss status, suggesting that these two perception
variables account for much of the reported differences in scariness between different incident types.
As for the other individual-level predictors of scariness, there was some evidence that people are more
likely to report that an incident was very scary on the weekend or in areas with a lower prevalence of
cycling (see also Figure 4). There was a non-significant trend for newer cyclists to report incidents as
being very scary (19% versus 13%) - a trend that explains why, as reported in Table 3, the daily rate ratio
for scary incidents was even stronger new cyclists than the daily rate ratio for all incidents. Interestingly,
this trend was not attenuated after adjusting for perceptions as to whether the incident was deliberate
or near miss, suggesting that these two variables do not explain why newer cyclists appear to be
particularly likely to report a given incident as scary.
This is an Accepted Author version of the paper, published 2017 in Accident Analysis & Prevention. The definitive version is online at http://www.sciencedirect.com/science/article/pii/S0001457517303366
17
Table 7: Predictors of which incidents are seen as very scary, 2015 sample (1875 incidents)
No. Inciden
ts
% Near miss
Adjusted odds ratio,
model 1 (95% CI)
Adjusted odds ratio,
model 2 (95% CI)
Adjusted odds ratio,
model 3 (95% CI)
Adjusted odds ratio,
model 4 (95% CI)
Gender Male 1346 13% 1 1 1 1 Female 516 13% 1.09 (0.69,
1.72) 1.21 (0.76,
1.91) 1.19 (0.76,
1.86) 1.35 (0.85,
2.15)
Age 20-29 241 14% 1 1 1 1 30-39 553 12% 0.77 (0.39,
1.51) 0.80 (0.40,
1.58) 0.79 (0.41,
1.54) 0.81 (0.41,
1.60) 40-49 620 12% 0.79 (0.40,
1.56) 0.82 (0.42,
1.62) 0.76 (0.39,
1.47) 0.78 (0.39,
1.54) 50-59 329 17% 1.26 (0.61,
2.61) 1.32 (0.64,
2.73) 1.19 (0.58,
2.43) 1.34 (0.64,
2.79) 60+ 126 12% 0.65 (0.24,
1.77) 0.71 (0.26,
1.93) 0.72 (0.27,
1.92) 0.73 (0.27,
1.99)
Day of the Weekday 1744 12% 1* 1† 1 1 Week Weekend 131 21% 2.04 (1.01,
4.11) 1.94 (0.96,
3.93) 1.78 (0.89,
3.56) 1.73 (0.85,
3.50)
Local cycling prevalence
Change per 10 percentage-point increase
- - 0.58 (0.34, 0.98)*
0.60 (0.35, 1.01)†
0.65 (0.39, 1.10)
0.68 (0.40, 1.16)
Cycling ≥ 2 years 1721 13% 1 1 1 1† experience < 2 years 102 19% 1.85 (0.80,
4.28) 1.91 (0.82,
4.45) 1.91 (0.84,
4.34) 2.31 (0.99,
5.36)
Incident A close pass 699 16% 1** 1* 1 Type Someone pulling in or
out 81 14% 0.94 (0.61,
1.45) 1.06 (0.68,
1.63) 1.05 (0.67,
1.65) A near left or right hook 149 15% 1.12 (0.62,
2.05) 1.25 (0.69,
2.28) 1.03 (0.56,
1.90) Someone approaching
head on 128 16% 1.06 (0.57,
1.97) 1.13 (0.61,
2.11) 1.14 (0.60,
2.16) Tailgating 403 15% 0.97 (0.44,
2.16) 0.98 (0.45,
2.16) 1.40 (0.61,
3.24) A near-dooring 11 27% 1.85 (0.32,
10.66) 2.19 (0.37,
13.04) 1.77 (0.30,
10.53) Swerve around an
obstruction 133 5% 0.26 (0.10,
0.68) 0.31 (0.12,
0.80) 0.58 (0.21,
1.60) Pedestrian steps out 132 5% 0.27 (0.11,
0.68) 0.39 (0.16,
0.96) 0.37 (0.15,
0.94) Other 139 6% 0.28 (0.12,
0.67) 0.37 (0.16,
0.88) 0.61 (0.24,
1.55)
Involving a bus/ No 1655 13% 1 1 1 coach/HGV Yes 210 15% 1.25 (0.75,
2.08) 1.26 (0.76,
2.09) 1.39 (0.81,
2.37)
Incident No 1202 9% 1*** 1*** deliberate Yes 673 21% 2.60 (1.81,
3.73) 2.26 (1.55,
3.29)
This is an Accepted Author version of the paper, published 2017 in Accident Analysis & Prevention. The definitive version is online at http://www.sciencedirect.com/science/article/pii/S0001457517303366
18
Incident a No 585 2% 1*** near miss Yes 1290 18% 14.4 (6.97,
29.6) †p<0.10, *p<0.05, ** p<0.01, ***p<0.001, from tests for heterogeneity except in the case of local cycling prevalence rate where
it is a test for linear trend. CI = confidence interval. Note that the number of incidents sometimes adds to less than 1875 in the
first column, due to missing data for some predictor variables. Multiple imputation for missing data is used to include all 1875
incidents in the subsequent columns. Logistic regression was used and the regression models adjust for all variables shown in
the column.
4. Discussion
4.1 Incident rates
We found an unexplained decline in incident rates between 2014 and 2015. We consider it unlikely that
this represents a ‘real’ decline, i.e. it likely rather demonstrates the impact of subjectivity in reporting.
Attempts to estimate injury rates may share these issues – we know, for example, that slight injuries are
substantially under-reported in police and hospital statistics, but self-report surveys introduce an
element of subjectivity in terms of definitions of ‘injury’ (which is not necessarily self-evident).
Despite the decline between 2014 and 2015, the rates are still of the same order of magnitude, i.e.
many thousands of times more common than injuries. Hence while the results caution against placing
much emphasis on the precise incidence rate estimates, they do confirm that near misses and non-injury
incidents are very common and of concern to people cycling. This is supported by the persistence of the
pattern associations observed in Aldred (2016); the most frightening types of incident in 2014 were also
found to be particularly frightening in 2015.
4.2 Cycling experience
It was concerning that cyclists with under two years’ cycling experience reported substantially more
incidents that more experienced cyclists – including twice the daily number of ‘very scary incidents’
compared with cyclists with over two years’ experience. It is likely that newer cyclists are more sensitive
to such incidents as are many of the very experienced, longer-term cyclists in our sample. This finding
could be interpreted in different ways. Perhaps, as cyclists become more skilled, their ability to avoid
near misses grows – although near miss numbers do remain high among more experienced cyclists.
Alternatively or additionally, near misses might deter those beginner cyclists who are most sensitive to
them. Given differential attitudes to risk by gender (for instance: Aldred et al 2016) this might be one
reason for under-representation of women cycling in contexts where scary near misses are common.
4.3 Deliberate, scary and near-miss incidents
Perhaps not surprisingly, incidents that participants thought were deliberate, or felt were near-misses
(i.e. likely to have resulted in an actual collision), were more likely to frighten them. Insofar as a high
proportion of incidents were judged to be deliberate (36%) or near misses (69%), it seems likely that
these two perceptions play an important role in contributing to the potential experience of cycling as a
risky mode.
The high proportion of incidents judge deliberate is also related to a broader road culture in which
cyclists feel that they are effectively second-class citizens (Christmas et al 2009). This data sheds more
This is an Accepted Author version of the paper, published 2017 in Accident Analysis & Prevention. The definitive version is online at http://www.sciencedirect.com/science/article/pii/S0001457517303366
19
light on this perception. If cyclists experience on a daily basis incidents in which they feel other road
users are actively disregarding their safety, this may form the basis for that wider sense of
marginalisation, rather than it solely being due to, for example, negative media coverage. In support of
this interpretation, participants living in high-cycling areas (in which cyclists might be expected to feel
less marginalised) did judge a smaller proportion of incidents to be deliberate.
In general, the problem road users – judged to be deliberately putting cyclists at risk – were motorists. In
pedestrian-stepping-out incidents, only 14% were judged deliberate. By contrast, for incidents caused by
motorists (except bus and coach drivers or motorcyclists), 40% or more were judged deliberate. This
proportion is substantially higher than the value of 4.8% assessed in the first, 2014 survey, in which
deliberateness was assigned by the researchers to those incidents in which the free text description
includes the description of hostile behaviour, such as beeping or verbal abuse (Aldred and Crosweller
2015). Perceived deliberateness runs deeper than this, and might include for instance a close pass being
judged deliberate because of the cyclist’s assumption that the driver knew that s/he was passing close,
rather than because of the pass being accompanied by overt aggression. It is also interesting to note
that participants were much more likely to say that they did not know whether an incident was
deliberate or not when it concerned a motorist, reflecting the difficulty of reading a person’s intention
when they are physically separated from you by being in a motor vehicle.
While there were close associations between perceptions of near misses, and perceived scariness, the
results suggest caution against always restricting study of incidents to only self-defined ‘near misses’. In
particular, tailgating incidents were judged more frightening than might be expected, given the
proportion of that category incidents that were judged ‘near misses’. Tailgating without a collision is also
unlikely to rank as a near miss in terms of definitions that rely on evasive action being taken, yet (a) may
result in a collision, in a minority of cases and (b) may be paradigmatic of an attitude to driving where
cyclists are seen as obstructions on the road. Even where aggressive driving is not associated with a
near-collision, this may still create intimidation and deter people from continuing to cycle. This may
particularly affect newer and more sensitive cyclists, and the majority who do not feel themselves to be
‘strong and fearless’ (Dill and McNeil 2014).
4.4 Near Miss Rates and Cycling Prevalence
Finally, near miss rates in relation to cycling prevalence is worth some comment. In earlier work, we
found that near miss rates were not lower at peak times when there are more cyclists on the road, nor
did they seem lower in places with higher rates of cycling. This paper examines the latter issue in more
detail, exploring the perceptions of incidents as deliberate, near misses, or very scary. While again we
did not find a lower rate of reporting incidents in local authority areas with a higher cycling prevalence,
we did find some evidence that those incidents reported were less likely to be perceived as deliberate,
near misses, or very scary (independent of the types of incident).
This finding was interesting, because these effects are independent of the impact of different incident
types. Perhaps there is no behavioural improvement among other road users, but cyclists feel less
disregarded or less under threat in a context where cycling feels more ‘normal’. Or perhaps incidents in
higher-cycling areas differ in a way that we have not captured here; being somehow experienced as less
This is an Accepted Author version of the paper, published 2017 in Accident Analysis & Prevention. The definitive version is online at http://www.sciencedirect.com/science/article/pii/S0001457517303366
20
severe although categorised under the same headings. Further research could helpfully explore the
extent to which perceptions of cyclists and cycling incidents might differ depending on the broader local
prevalence of cycling.
4.5 Cycling infrastructure and road environment: a potential direction for future research
One limitation of the current research it does not include any characteristics related to the road
environment, including cycling infrastructure. Examining the effect of the road environment on the
experience of near misses would pose some challenges, as it is not enough to know the road
environment characteristics of the places where incidents took place (the numerator). Instead one also
needs to know how much cycling occurs in different types of road environments (the denominator). One
promising possibility would be to adapt an approach successfully used in relation to cycling injuries
(Teschke et al 2012) and collect information on participant’s cycling routes as well as the location of
their near misses. This would allow each near miss location to be matched to a randomly-selected
control location elsewhere on their route, in other words each cyclist would act as their own control.
We hope that future research may include such approaches, and thereby contribute to evidence
regarding subjective experience of cycling risk in different types of road environment.
5. Conclusion This paper has compared two years of the UK Near Miss Project, including new analysis focused on
perceptions of incidents, and the impact of cycling experience. Incident rates per person per day have
remained at the same order of magnitude, albeit declining by around a third for unknown reasons (we
think probably due to changes in reporting). Thus we would caution against placing too much weight on
the precise magnitude of incidents rates or on year-on-year changes in subjectively reported near
misses and other non-injury collisions. However, near misses clearly are very commonly experienced by
UK cyclists, and appear stable in terms of the types of incidents experienced and the patterning of these
incidents across different groups of cyclists.
The paper has also explored how subjective feelings about non-injury incidents (whether they are near
misses, and whether they are deliberate) shape incident perceptions. Where incidents are perceived to
be deliberate, and/or near misses, they are more likely to be perceived as very scary. New cyclists stand
out as being more likely to see incidents as being near misses, deliberate or scary, also reporting
significantly higher non-injury incident rates than more experienced cyclists. It is important that these
voices be heard in policy and planning. This research was skewed towards very experienced cyclists who
may have grown able to cope with such incidents, but newer cyclists seem to have more negative
experiences and to be more intimidated by them.
More research is needed to understand the experiences of newer cyclists, and the extent to which near
misses might contribute to discouraging new cyclists from continuing. It would be useful for future
studies to collect data on cycling exposure at route-level, in order to include infrastructural correlates of
near miss risk in future analysis. In these ways, we can continue to develop our understanding of the
subjective experience of cycling risk, seeking to create cycling conditions that both are safer and feel
safer.
This is an Accepted Author version of the paper, published 2017 in Accident Analysis & Prevention. The definitive version is online at http://www.sciencedirect.com/science/article/pii/S0001457517303366
21
6. Bibliography Aldred, R., Elliott, B., Woodcock, J. and Goodman, M. (2016), Cycling provision separated from motor
traffic: A systematic review exploring whether stated preferences vary by gender and age, Transport
Reviews, 37(1):29-55.
Cabinet Office, An Analysis of Urban Transport. (2009), London: The Strategy Unit, Cabinet Office.
Christmas, S., Helman, S., Butress, S., Newman, C. and Hutchins, R. (2009) Safety, cycling and sharing the
road: qualitative research with cyclists and other road users, Great Britain. Department for Transport,
London.
Dill, J., & McNeil, N. (2014). Four types of cyclists? Examination of typology for better understanding of
bicycling behavior and potential. Transportation Research Record: Journal of the Transportation
Research Board 2387, 129–138. doi:10.3141/2387-15
Fyhri, A., Sundfør, H.B, Bjørnskau, T. and Laureshyn, A. (2016) Safety in numbers for cyclists—
conclusions from a multidisciplinary study of seasonal change in interplay and conflicts, Accident
Analysis & Prevention, in press, corrected proof, http://dx.doi.org/10.1016/j.aap.2016.04.039
Girotto, A., Maffei de Andrade, S., Durán González, A. and Eumann Mesas, A. (2016) Professional
experience and traffic accidents/near-miss accidents among truck drivers, Accident Analysis &
Prevention 95, Part A, 299-304
Goodman A. (2013) Walking, cycling and driving to work in the English and Welsh 2011 census: trends,
socio-economic patterning and relevance to travel behaviour in general. Plos One 8:e71790.
Horton, D., (2007) Fear of cycling, in Cycling and Society, D. Horton, P. Rosen, and P. Cox, Editors,
Ashgate: Aldershot.
Lawson, A.R., Pakrashi, V., Ghosh, B. and Szeto, W.Y. (2013) Perception of safety of cyclists in Dublin City.
Accid Anal Prev, 2013. 50: p. 499-511.
Lovelace, R., Goodman, A., Aldred, R., Berkoff, N., Abbas, A. and Woodcock, J. (2016) The Propensity to
Cycle Tool: An open source online system for sustainable transport planning, Journal of Transport and
Land Use 10 (1), 505 – 528
Macmillan, A., Roberts, A., Woodcock, J., Aldred, R. and Goodman, A. (2016) Trends in local newspaper
reporting of London cyclist fatalities 1992-2012: the role of the media in shaping the systems dynamics
of cycling, Accident Analysis and Prevention, 86, 137-145
Maizlish, N., et al. (2013), Health co-benefits and transportation-related reductions in greenhouse gas
emissions in the San Francisco Bay area. Am J Public Health. 103(4): p. 703-9.Aldred 2016
Rojas-Rueda, D., et al. (2011) The health risks and benefits of cycling in urban environments compared
with car use: health impact assessment study. BMJ, 343: p. 4521.
This is an Accepted Author version of the paper, published 2017 in Accident Analysis & Prevention. The definitive version is online at http://www.sciencedirect.com/science/article/pii/S0001457517303366
22
Sanders, R.L. (2015) Perceived traffic risk for cyclists: The impact of near miss and collision experiences,
Accident Analysis & Prevention, 75, 26–34
St Aubin, P., Saunier, N. and Miranda-Moreno, L. (2015) Large-scale automated proactive road safety
analysis using video data, Transportation Research Part C: Emerging Technologies, 58, 363–379
Teschke, K., Harris, M.A., Reynolds, C.C., Winters, M., Babul, S., Chipman, M., et al. (2012) Route
infrastructure and the risk of injuries to bicyclists: a case-crossover study. American Journal of Public
Health, 102, 2336-43.
Thornton, A., et al. (2010) Climate change and transport choices: segmentation study – interim report by
TNS-BMRB. London: Department for Transport.
Transport for London, Analysis of cycling potential. 2010, London: Transport for London.
Walker, I. (2007) Drivers overtaking bicyclists: Objective data on the effects of riding position, helmet
use, vehicle type and apparent gender, Accident Analysis & Prevention 39(2), 417–425
Walker, I., Garrard, I. and Jowitt, F. (2014) The influence of a bicycle commuter's appearance on drivers’
overtaking proximities: An on-road test of bicyclist stereotypes, high-visibility clothing and safety aids in
the United Kingdom, Accident Analysis and Prevention, 64, pp. 69-77
Woodcock, J., et al. (2014) Health effects of the London bicycle sharing system: health impact modelling
study. BMJ. 348: p. g425.
Woodcock, J., M. Givoni, and A. Morgan (2013) Health Impact Modelling of Active Travel Visions for
England and Wales using an Integrated Transport and Health Impact Modelling tool (ITHIM) PLoS One.
8(1): p. e51462.
This is an Accepted Author version of the paper, published 2017 in Accident Analysis & Prevention. The definitive version is online at http://www.sciencedirect.com/science/article/pii/S0001457517303366
23
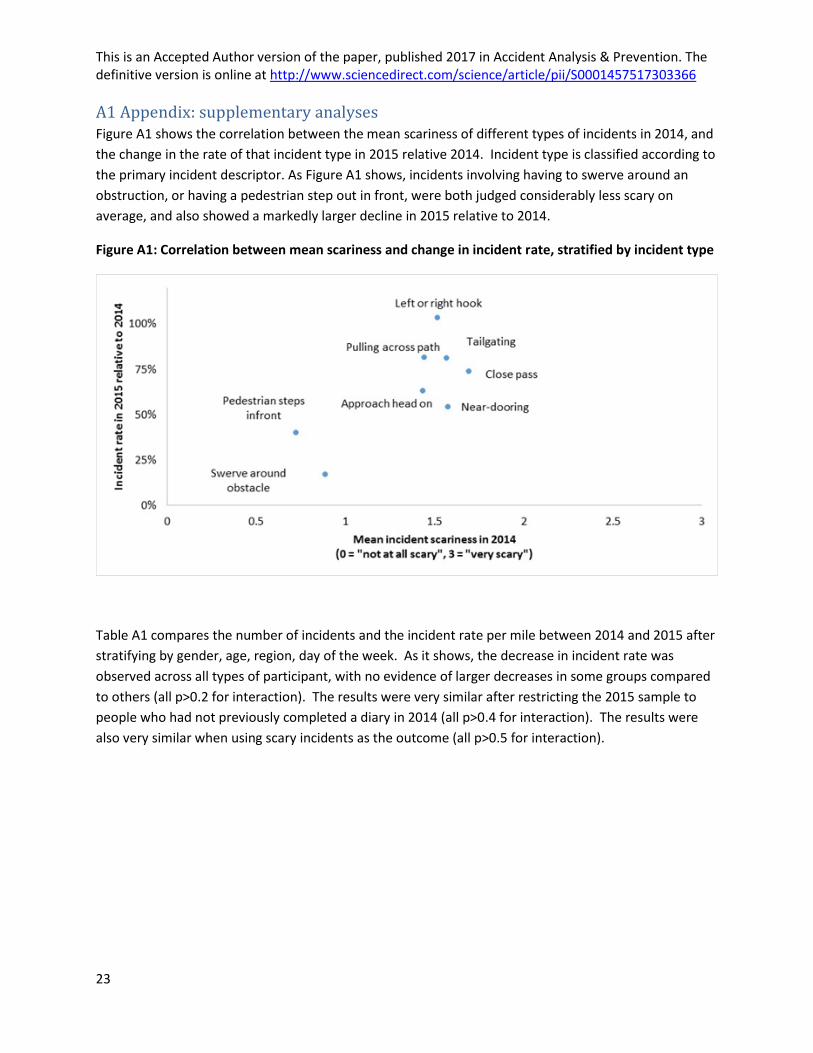
A1 Appendix: supplementary analyses Figure A1 shows the correlation between the mean scariness of different types of incidents in 2014, and
the change in the rate of that incident type in 2015 relative 2014. Incident type is classified according to
the primary incident descriptor. As Figure A1 shows, incidents involving having to swerve around an
obstruction, or having a pedestrian step out in front, were both judged considerably less scary on
average, and also showed a markedly larger decline in 2015 relative to 2014.
Figure A1: Correlation between mean scariness and change in incident rate, stratified by incident type
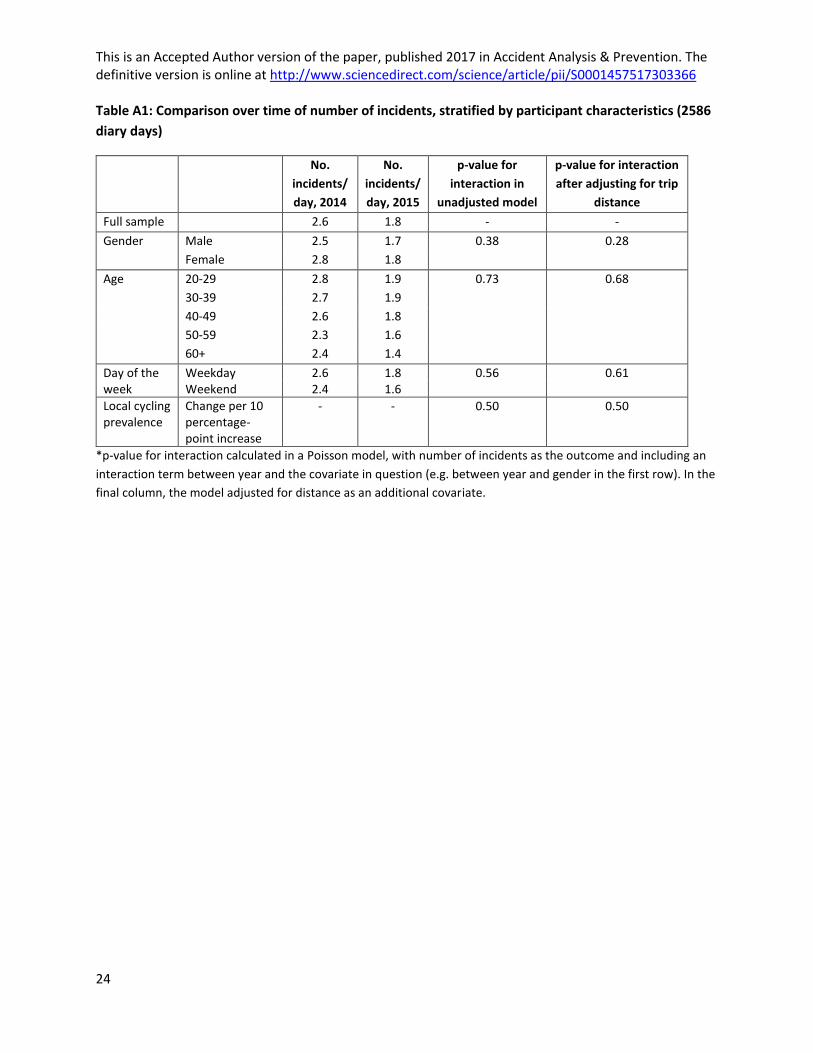
Table A1 compares the number of incidents and the incident rate per mile between 2014 and 2015 after
stratifying by gender, age, region, day of the week. As it shows, the decrease in incident rate was
observed across all types of participant, with no evidence of larger decreases in some groups compared
to others (all p>0.2 for interaction). The results were very similar after restricting the 2015 sample to
people who had not previously completed a diary in 2014 (all p>0.4 for interaction). The results were
also very similar when using scary incidents as the outcome (all p>0.5 for interaction).
This is an Accepted Author version of the paper, published 2017 in Accident Analysis & Prevention. The definitive version is online at http://www.sciencedirect.com/science/article/pii/S0001457517303366
24
Table A1: Comparison over time of number of incidents, stratified by participant characteristics (2586
diary days)
No.
incidents/
day, 2014
No.
incidents/
day, 2015
p-value for
interaction in
unadjusted model
p-value for interaction
after adjusting for trip
distance
Full sample 2.6 1.8 - -
Gender Male 2.5 1.7 0.38 0.28
Female 2.8 1.8
Age 20-29 2.8 1.9 0.73 0.68
30-39 2.7 1.9
40-49 2.6 1.8
50-59 2.3 1.6
60+ 2.4 1.4
Day of the Weekday 2.6 1.8 0.56 0.61 week Weekend 2.4 1.6
Local cycling prevalence
Change per 10 percentage-point increase
- - 0.50 0.50
*p-value for interaction calculated in a Poisson model, with number of incidents as the outcome and including an
interaction term between year and the covariate in question (e.g. between year and gender in the first row). In the
final column, the model adjusted for distance as an additional covariate.

This is an Accepted Author version of the paper, published 2017 in Accident Analysis & Prevention. The definitive version is online at http://www.sciencedirect.com/science/article/pii/S0001457517303366
25
Acknowledgements This project was jointly funded by the Creative Exchange (http://thecreativeexchange.org/) and Blaze
(http://blaze.cc). The funders had no involvement in study design; in the collection, analysis and
interpretation of data; in the writing of the report; or in the decision to submit the article for
publication. The Creative Exchange is one of four Knowledge Exchange Hubs funded by the Arts and
Humanities Research Council to bring together creative sector businesses and academics.