Embed Size (px)
Citation preview
University of LynchburgDigital Showcase @ University of Lynchburg
Undergraduate Theses and Capstone Projects
Spring 5-2018
Predictors of sleep quality: Depression, anxiety, andsleep self-efficacyRayanna JohnsonUniversity of Lynchburg
Follow this and additional works at: https://digitalshowcase.lynchburg.edu/utcp
Part of the Other Psychology Commons
This Thesis is brought to you for free and open access by Digital Showcase @ University of Lynchburg. It has been accepted for inclusion inUndergraduate Theses and Capstone Projects by an authorized administrator of Digital Showcase @ University of Lynchburg. For more information,please contact [email protected].
Recommended CitationJohnson, Rayanna, "Predictors of sleep quality: Depression, anxiety, and sleep self-efficacy" (2018). Undergraduate Theses and CapstoneProjects. 110.https://digitalshowcase.lynchburg.edu/utcp/110
Running Head: PREDICTORS OF SLEEP QUALITY 1
Predictors of sleep quality: Depression, anxiety, and sleep self-efficacy
Rayanna Johnson
Senior Honors Project
Submitted in partial fulfillment of the graduation requirements of the Westover Honors Program
Westover Honors Program
May, 2018
Ei Hlaing, PhD
Laura Kicklighter, PhD
Virginia Cylke, PhD
PREDICTORS OF SLEEP QUALITY 2
Abstract
The objective of the current study was to examine the relationship between depression, anxiety,
sleep self-efficacy and sleep quality in college students by using both objective measures and
self-report data. Participants included undergraduate students from a small liberal arts college
who wore an ActiGraph wGT3X-BT wristband for a period of seven nights. At the end of the
seven nights, participants also completed the Beck Anxiety Inventory, Center for Epidemiologic
Studies Depression Scale, the Sleep Self-Efficacy Scale, and Pittsburgh Sleep Quality Index.
Results indicated that higher sleep self-efficacy scores were associated with lower anxiety and
depression scores. Higher self-reported sleep quality, based on the Pittsburgh Sleep Quality
Index, was also associated with higher sleep self-efficacy scores as well as lower depression and
anxiety scores. Results were potentially limited due to the small sample size (n = 20) of the
study, as well as participant bias and various environmental factors that will be discussed.
PREDICTORS OF SLEEP QUALITY 3
Predictors of sleep quality: Depression, anxiety, and sleep self-efficacy
Introduction
Poor sleep and sleep disorders pose a significant problem in the United States. In 2014
the National Sleep Foundation reported that almost half of Americans are impacted by poor sleep
at least once a week, and the impact of sleep deprivation on cognition and daily functioning has
been studied extensively across countless populations (Pilcher, & Huffcutt, 1996). For many
college students, sleep deprivation just seems par for the course. Up to 60% of college students
report sleeping poorly (Lund, Reider, Whiting, & Prichard, 2010), which can have a negative
impact on students’ academic endeavors (Chiang, Arendt, Zheng, & Hanisch, 2014). Academic
pursuits are further hindered by the issue of mental health in college students. In 2003, roughly
50% of college students qualified for at least one disorder according to the DSM-IV (Blanco et
al., 2008). The purpose of the current study was to focus on anxiety, depression, and sleep self-
efficacy in order to better understand the impact of these variables on sleep quality in college
students.
Lund et al. (2010) demonstrated the prevalence of poor sleep in college students aged
between 17 and 24 years. The study consisted of 1,175 participants who completed the
Pittsburgh Sleep Quality Index (PSQI; Buysse, Reynolds, Monk, Berman, & Kupfer, 1989),
Ostberg Morningness-Eveningness Scale (Home, & Ostberg, 1976), Subjective Units of Distress
Scale (Wolpe, 1970), Epworth Sleepiness Scale (Johns, 1992), Profile of Mood States (Curran,
Andrykowski, & Studts, 1995), and academic performance questions. Physical and psychological
health problems were more common in students with poorer sleep quality, who accounted for
over 60% of the participants. Poor sleepers also scored worse negative moods, including higher
scores for fatigue, tension, confusion, anger, and depression. Lund et al. (2010) also indicated
PREDICTORS OF SLEEP QUALITY 4
that poor sleep was best explained by perceived stress, versus other variables (ex: regularity of
sleep schedule). This is consistent with findings by Buboltz, Jenkins, Soper, Woller, Johnson,
and Faes (2009). Buboltz et al. (2009) collected data from 742 undergraduate students at public
universities who completed the Sleep Quality Index (Urponen, Partinen, Vuori, & Hasan, 1991).
Occasional sleep problems were reported by 65.9% of participants, and over half reported
morning tiredness.
Cognitive functioning is known to be markedly different in poor sleepers (Harvey, 2000;
Suh et al., 2012), which is particularly relevant for college students. Harvey (2000) hypothesized
that pre-sleep worries and concerns would be more prevalent in insomniacs versus their good-
sleeping counterparts. Participants included 30 people who met the diagnostic criteria for
insomnia as stated in the DSM-IV, and an additional 30 to serve as controls. The primary sleep
complaint for the experimental group were delays in sleep-onset; participants with other primary
sleep concerns were excluded. The Sleep Disturbance Questionnaire (Espie, Brookes, &
Lindsay, 1989), Beck Anxiety Inventory (Beck, Epstein, Brown, & Steer, 1988), Beck
Depression Inventory (Beck, Ward, Mendelson, Mock, & Erbaugh, 1961), Penn State Worry
Questionnaire (Meyer, Miller, Metzger, & Borkovec, 1990), and the Why Worry? And
Intolerance of Uncertainty (Freeston, Rheaume, Letarte, Dugas, & Ladouceur, 1994)
questionnaires were administered. Researchers found that compared to good sleepers, insomniacs
had a higher propensity for worrying. Insomniacs experienced worrying thoughts for longer and
found the thoughts to be more preoccupying than did the good sleepers. Of the insomniac group,
77% indicated cognitive interference as a primary factor in poorer sleep quality on the Sleep
Disturbance Questionnaire (Espie et al., 1989), supporting the notion that cognitive processes
have some impact on sleep.
PREDICTORS OF SLEEP QUALITY 5
Suh et al. (2012) expanded on the relationship between cognition and sleep disturbance
by exploring cognitive predictors of multiple symptoms of insomnia: difficulty with sleep
initiation, maintenance, and early morning awakenings. The study’s sample consisted of 146
clinical patients with insomnia seeking cognitive-behavior therapy at the Stanford Sleep
Disorders Clinic. Potential predictors of insomnia symptoms were depression symptoms, self-
reported sleep, academic performance, physical health, psychoactive drug use, and circadian
preferences. The study involved two groups: a multiple symptom group and a single symptom
group. Variable measures included the Insomnia Severity Index (Bastien, Vallières, & Morin,
2001), Glasgow Content of Thoughts Inventory (Harvey, & Epsie, 2004), Dysfunctional Beliefs
and Attitudes about Sleep (Morin, Vallières, & Ivers, 2007), Sleep Self-Efficacy Scale (Lacks,
1987), Beck Depression Inventory (Beck et al., 1961), and Morning-Eveningness Composite
Scale (Smith, Reilly, & Midkiff, 1989). Severity of pain while trying to sleep was also recorded,
in addition to daily sleep diaries. The Sleep Self-Efficacy Scale served as a significant predictor
of multiple insomnia symptoms (Lacks, 1987). Of the patients that scored low on the Sleep Self-
Efficacy Scale (Lacks, 1987), 73.4% were a part of the combined multiple symptom subgroup.
These participants also had longer sleep onset latency and showed worse depression symptoms
as indicated on the Beck Depression Inventory (Beck et al., 1961).
Self-efficacy plays a significant role in an individual’s ability to successfully tackle a
problem and is considerably relevant to sleep - a daily task that can present significant difficulty
to a large population of people. Bandura’s theory of self-efficacy (1977) suggests that an
individual’s expectations and perceptions of a task significantly influence the quality of a
person’s effort at a task, and therefore impacts their ability to perform that task. Bandura’s
(1977) study utilized behavioral tasks of varying difficulty to demonstrate the impact of self-
PREDICTORS OF SLEEP QUALITY 6
efficacy, where tasks were ordered according to the amount of effort required to complete them.
Higher self-efficacy was correlated with greater perseverance at tasks, and therefore greater
success at those tasks.
The potential implications of self-efficacy on mental health was depicted in Bandura,
Pastorelli, Barbaranelli, and Caprara’s (1999) research on self-efficacy and childhood
depression. Perceived self-efficacy was self-reported for academic achievement, extracurricular
activities, and social behaviors. Students (mean age of 11.5 years) also completed the Children’s
Depression Inventory (Kovacs, 1985) and Child Behavior Checklist (Achenbach, & Edelbock,
1978). Academic achievement was collected from the children’s teachers, and classmates
additionally rated each other for prosocial behaviors. Results indicated that children were more
negatively impacted by their beliefs about their academic performance, versus their actual
academic performance. Perceptions on their social inefficiency was also linked to depression.
Children were re-evaluated for depression one and two years after the initial study, and a
relationship was established between the children’s perceptions of social inefficiency and long-
term depressive symptomology.
While Bandura et al. (1999) studied self-efficacy in general, Rutledge, Guardia, and
Bluestein (2013) specifically depicted the relationship between sleep self-efficacy and overall
sleep quality. Rutledge et al. (2013) included 236 participants from primary care facilities; all
participants had clinically significant insomnia as measured by the Insomnia Severity Index
(Bastien et al., 2001). Participants completed the Self-Efficacy for Sleep Scale (Lacks, 1987),
Insomnia Treatment Acceptability Scale (Morin, 1993), the SF-8 (Ware, & Sherbourne, 1992),
the Dysfunctional Beliefs about Sleep Scale (Morin et al., 2007), and The Center for
Epidemiological Studies Depression Scale (Radloff, 1977). Results indicated that insomnia
PREDICTORS OF SLEEP QUALITY 7
severity, dysfunctional beliefs, and depressive symptoms all negatively correlated with sleep
self-efficacy. These outcomes support Bandura’s theory (1977) and suggest that patients must
believe that they can be effective in treating their insomnia in order for the treatment to work.
Furthermore, Rutledge et al. (2013) provided support for the link between low sleep self-efficacy
and depression-depression sufferers are more likely to have lower self-efficacy, inhibiting
improvement of sleep quality.
Similarly, Nyer et al. (2013) depicted the relationship between depressive symptomology,
intense anxiety and sleep disturbance. The study’s sample consisted of 287 students that
indicated significant depression symptoms as determined by a score of 13 or greater on the Beck
Depression Inventory (Beck et al., 1961), with 220 of them also indicating disturbed sleep.
Participants then completed the Anxiety Symptom Questionnaire (Clark, & Watson, 1991),
Quality of Life Enjoyment and Satisfaction Questionnaire (Endicott, Nee, Harrison, &
Blumenthal, 1993), Beck Hopelessness Scale (Beck, Weissman, Lester, & Trexler, 1974),
Massachusetts General Hospital Cognitive and Physical Functioning Questionnaire (Fava,
Iosifescu, Pedrelli, & Baer, 2009), and Beck Anxiety Inventory (Beck et al., 1988). Results
showed that the group with both depressive symptoms and sleep disturbance experienced a
higher level of impairment (both physical and cognitive) as well as increased anxiety.
Bluestein, Rutledge, and Healey (2010) also indicated a correlation between insomnia
severity and depression, as well as with dysfunctional beliefs and sleep self-efficacy. The study
consisted of 236 adult participants with insomnia according to the Insomnia Severity Index
(Bastien et al., 2001), recruited from three clinical facilities. Participants completed the Center
for Epidemiologic Studies Depression Scale (Radloff, 1977), SF-8 (Ware et al., 1992), Self-
Efficacy for Sleep Scale (Lacks, 1987), and Dysfunctional Beliefs about Sleep Scale (Morin et
PREDICTORS OF SLEEP QUALITY 8
al., 2007). Health, depression, dysfunctional beliefs, and self-efficacy correlated significantly
with insomnia severity-low self-efficacy and higher depressive scores best predicted insomnia
severity.
Depression and sleep disturbance have a well-researched association, but there has been a
failure to narrow down a directional causal relationship. Complaints about sleep impairment
have been reported by over 90% of patients experiencing depression (Mendelson, Gillin, &
Wyatt, 2012), and insomnia is a common symptom of depression. On the other hand, severe
insomnia causes patients to be much more likely to develop depression (Riemann, Berger, &
Voderholzer, 2001). Riemann et al. (2001) reviewed EEG recordings from several different
subtypes of depression and sleep disturbances across various research studies and failed to find
causal explanations for the relationship between depression and sleep deprivation-however, the
culmination of data further supports the bi-directional relationship between depression and sleep
disturbance.
Studies about sleep, anxiety, and depressive symptomatology consistently make use of
self-report data. Although many studies utilize EEG to collect information (e.g. Riemann et al.,
2001), the bulk of research on the topic relies on self-report questionnaires. Self-report data can
be easily impacted by factors outside of the researchers’ control, such as the honesty of
participants, subjective understandings about a question, or the reliability of a participant’s
memory. Furthermore, mere expectations about an event or situation can alter a participant’s
self-report data. For example, O’Donnell, Silva, Munch, Ronda, Wang, and Duffy (2009)
compared the objective and subjective sleep measures of older adults. Data from 24 older adult
subjects (ages ranged from 55-74 years old) was collected over the course of 32-days of inpatient
participation. During this time participants had no access to time-telling devices, and there were
PREDICTORS OF SLEEP QUALITY 9
no windows in the patients’ rooms. Sleep was monitored using an EEG every night during the
participation period, including three days to determine baseline sleeping habits. After every
sleeping period, the participant was given a post-sleep questionnaire that asked participants to
self-report sleep quality in addition to the EEG’s readings. The questionnaire included inquiries
regarding latency, duration, awakenings, and time awake before the scheduled waking time.
O’Donnell et al. (2009) indicated that the association between subjective and objective sleep
measures are modest. O’Donnell et al. (2009) found that participants rated their baseline sleep as
“good”, despite the fact that their objective measures indicated low sleep quality. This is
consistent with research by Buysse, Reynolds, Monk, Hoch, Yeager, and Kupfer (1991) who
theorized the perception of sleep by older adults may be altered by gradual sleep quality changes
associated with aging. Similarly, self-report data collected from college students may be
impacted by general expectations about being in college-poor sleep is considered commonplace
and may therefore be misinterpreted as “good” sleep. The current study will seek to explore this
potential problem by utilizing both objective and subjective sleep quality measures.
The aforementioned studies have demonstrated the effects of anxiety, depression, and
sleep self-efficacy (an individual’s confidence that they can sleep well) on overall sleep quality.
However, most of these studies are similar in that they utilized questionnaires to measure these
variables. The present study sought to rectify this gap in the research between objective and
subjective data by not only utilizing a questionnaire, but by also using a sleep monitor that
objectively measured each participant’s quality of sleep. The device used in this study-the
Actigraph wGT3X-BT-has been shown to be similar in accuracy to the polysomnography (PSG;
a well-established measure of sleep) for measuring the sleep quality of non-clinical patients
(Sadeh, Hauri, Kripke, & Lavie, 1995). Utilizing both a questionnaire and objective sleeping
PREDICTORS OF SLEEP QUALITY 10
measure may indicate which method is more closely related to sleep self-efficacy.
The current study also sought to expand on previous research by using a sample of non-
clinical college students versus a sample of patients in primary care, or with clinically diagnosed
insomnia; this potentially increased generalizability. It was hypothesized that the results of this
study would be consistent with previous studies: as anxiety and depressive symptomatology
increase and sleep self-efficacy will decrease, both the subjective and objective measures of
overall sleep quality will also decrease. It was also hypothesized that sleep self-efficacy will be
negatively correlated with depression and anxiety symptoms, and that sleep self-efficacy,
anxiety, and depression scores will significantly predict sleep quality.
Method
Participants
Participants were all undergraduate students over the age of 18 from a liberal arts college.
Students were asked to participate through emails sent to undergraduate students through
professors, as well as the researchers. The study consisted of 20 participants (85% female). The
mean age was 20.05 years (SD = 1.73), and 70% were freshmen. Caucasians accounted for 75%
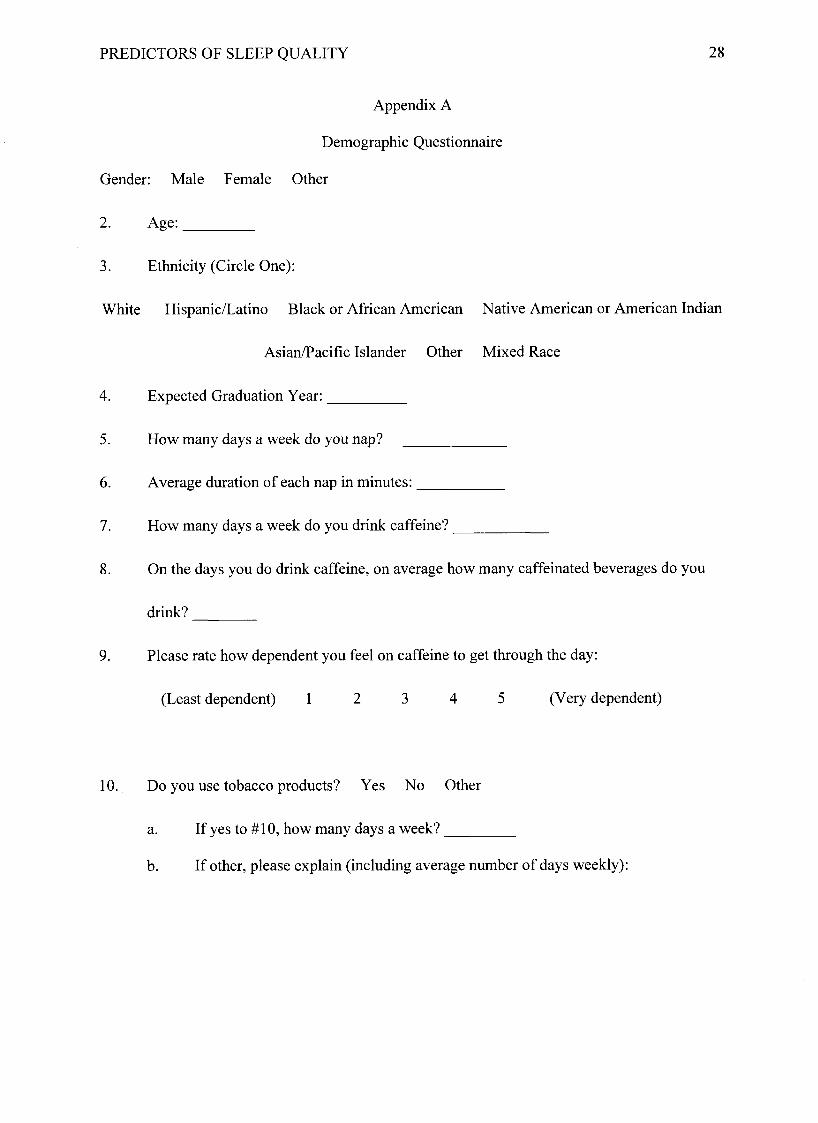
of the sample. Demographic information collected also included gender, age, expected college
graduation year (to indicate their class), and ethnicity. Participants were also asked to indicate
napping habits as well as caffeine, tobacco and alcohol use, and use of over-the-counter sleep
aids (see Appendix A). Participants diagnosed with a sleeping disorder were excluded on the
basis of separating out the clinical population.
Materials
Sleep quality. Sleep quality was measured with both objective and subjective measures.
Participants were asked to wear the ActiGraph wGT3X-BT for a period of seven consecutive
PREDICTORS OF SLEEP QUALITY 11
nights (ActiGraph, n.d.). The ActiGraph is a medical grade wristband that provides an objective
measure for total sleep time, sleep latency and efficiency, as well as wake after sleep onset. Self-
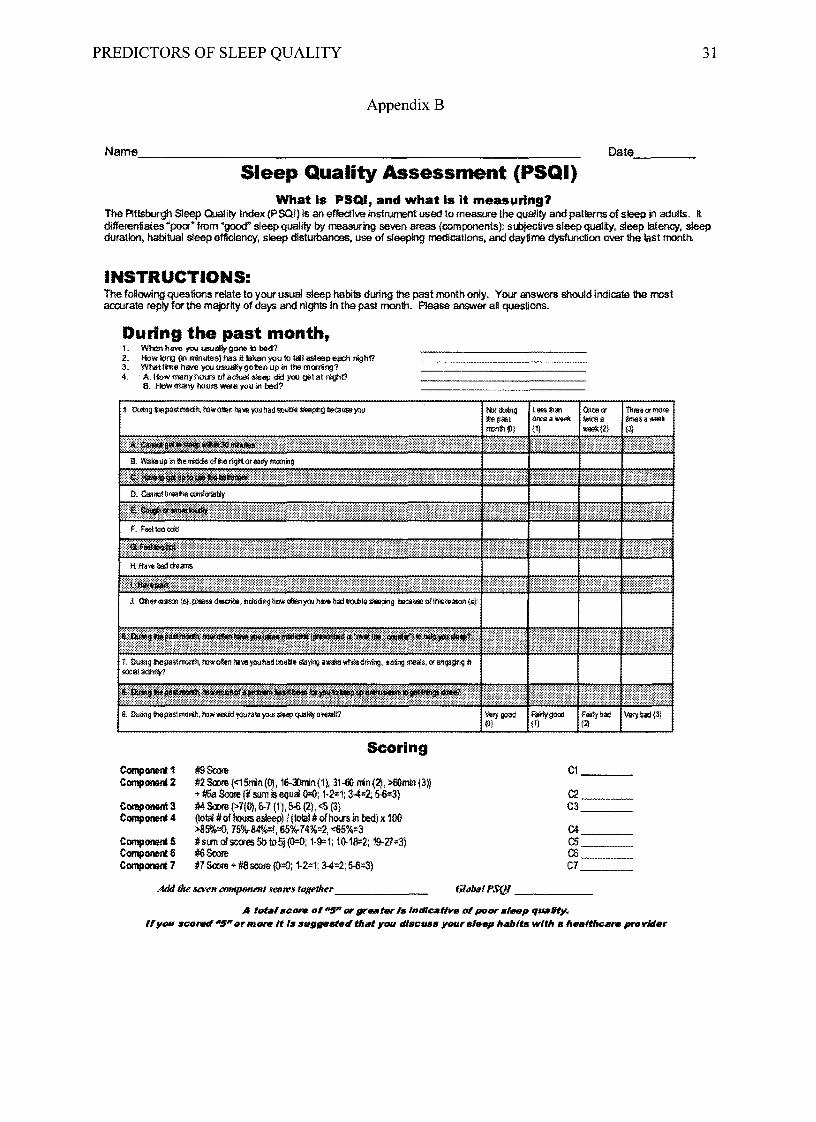
reported sleep was recorded using the Pittsburgh Sleep Quality Index (PSQI; Buysse et al., 1989;
see Appendix B). The PSQI (Buysse et al., 1989) is a 9-question survey that measures 7 areas of
sleep including sleep quality, latency, duration, efficiency, disturbances, daytime dysfunction,
and use of sleeping medication. Answers were recorded using both a Likert scale (0-3) as well as
filling in blanks. Scoring was determined by combining the component scores. Poorer sleep was
indicated by a score of 5 or greater. The PSQI (Buysse et al., 1989) has a Cronbach’s alpha of
0.83, indicating good reliability.
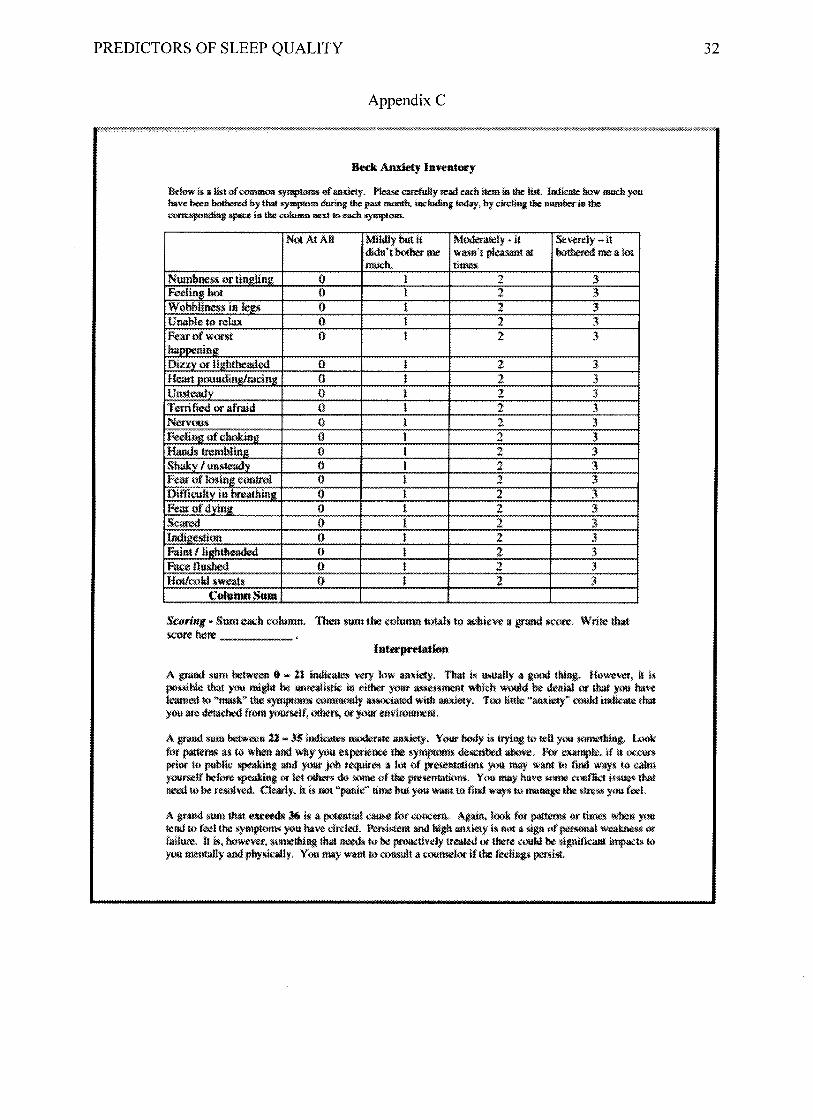
Anxiety. The Beck Anxiety Inventory (BAI; Beck et al., 1988; see Appendix C) is a 21-
question inventory with a Cronbach’s alpha of .92 that indicates how severe a symptom of
anxiety has been for a participant during the past month. Each question can have a score of 0 to
3, with 0 indicating that the participant has not been bothered at all by the symptom, and 3
indicating that the participant has been severely bothered by the symptom. Total scores can range
from 0 to 63, with 21 and lower indicating very low anxiety, and scores exceeding 36 indicating
potentially severe anxiety.
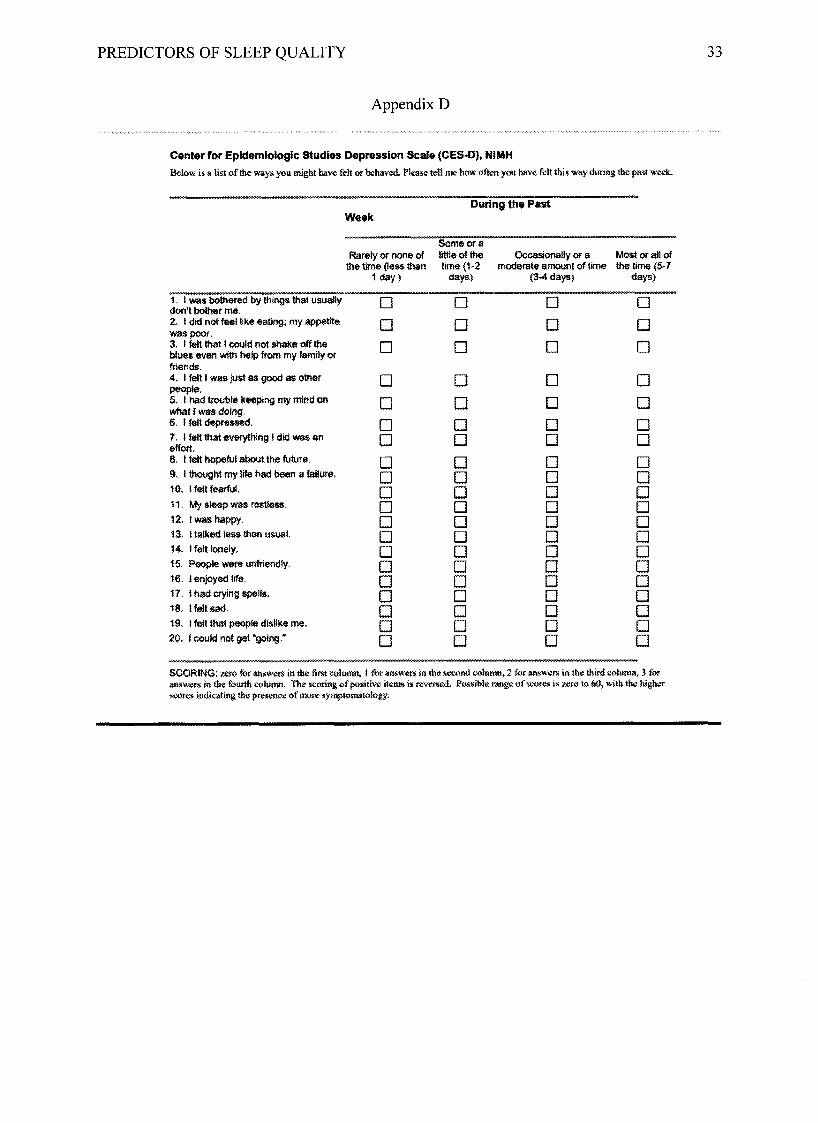
Depression. Self-reported depressive symptomatology was measured with the Center for
Epidemiologic Studies Depression Scale (CES-D; Radloff, 1977; see Appendix D), a 20-item
questionnaire that asks participants how often during the past week they have experienced
depression symptoms. The CES-D (Radloff, 1977) scores on a Likert Scale from 0-3, with 0
indicating no symptomatology and 3 indicating severe symptomatology. Total scores can range
from 0 to 60 - more symptomology is indicated by higher score. The CES-D (Radloff, 1977) has
good reliability, with a Cronbach’s alpha of .84 to .90 over four samples.
PREDICTORS OF SLEEP QUALITY 12
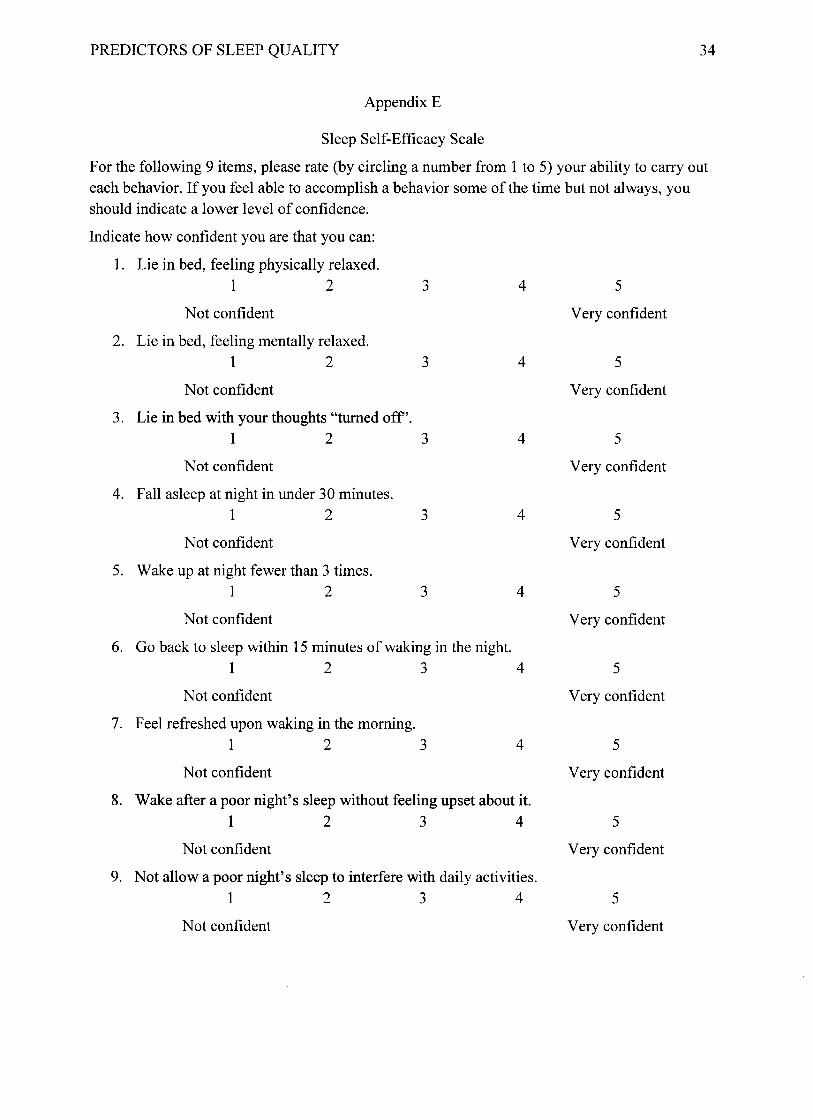
Self-Efficacy. Self-efficacy for sleep was measured using the Sleep Self-Efficacy Scale
(SES; Lacks, 1987; see Appendix E). The scale consists of 9-items that measure the participants
sleep self-efficacy by asking participants to indicate how confident they feel about
accomplishing sleep-related behaviors. Higher scores indicate higher self-efficacy and can range
from 9 to 45. The SES (Lacks, 1987) has a Cronbach’s alpha of .71.
Procedure
The study took place over the course of seven days with two in-person sessions at the
beginning and end of the week-long time period. During the first session, participants completed
an informed consent form and demographic questionnaire. Participants also received an
ActiGraph wGT3X-BT wristband with instructions to wear the wristband for the next seven
consecutive nights. The second session took place after the seven nights of wearing the
ActiGraph was completed. Participants returned the ActiGraph and completed four
questionnaires: the CES-D (Radloff, 1977), BAI (Beck et al., 1988), SES (Lacks, 1987), and
PSQI (Buysse et al., 1989). The order of questionnaires was counterbalanced by reversing the
order for half of the participants. Each session took approximately 10 minutes to complete.
Design
Correlations were run to determine the relationship between sleep self-efficacy scores,
and anxiety and depression, as well as any associations between anxiety, depression, sleep self-
efficacy, and both objective and subjective sleep scores. An independent sample t test was
conducted to examine the difference between Freshmen and non-Freshmen on their objective
sleep time. A multiple regression was also performed to potentially determine depression,
anxiety, and sleep self-efficacy as predictors for objective and subjective sleep quality.
Results
PREDICTORS OF SLEEP QUALITY 13
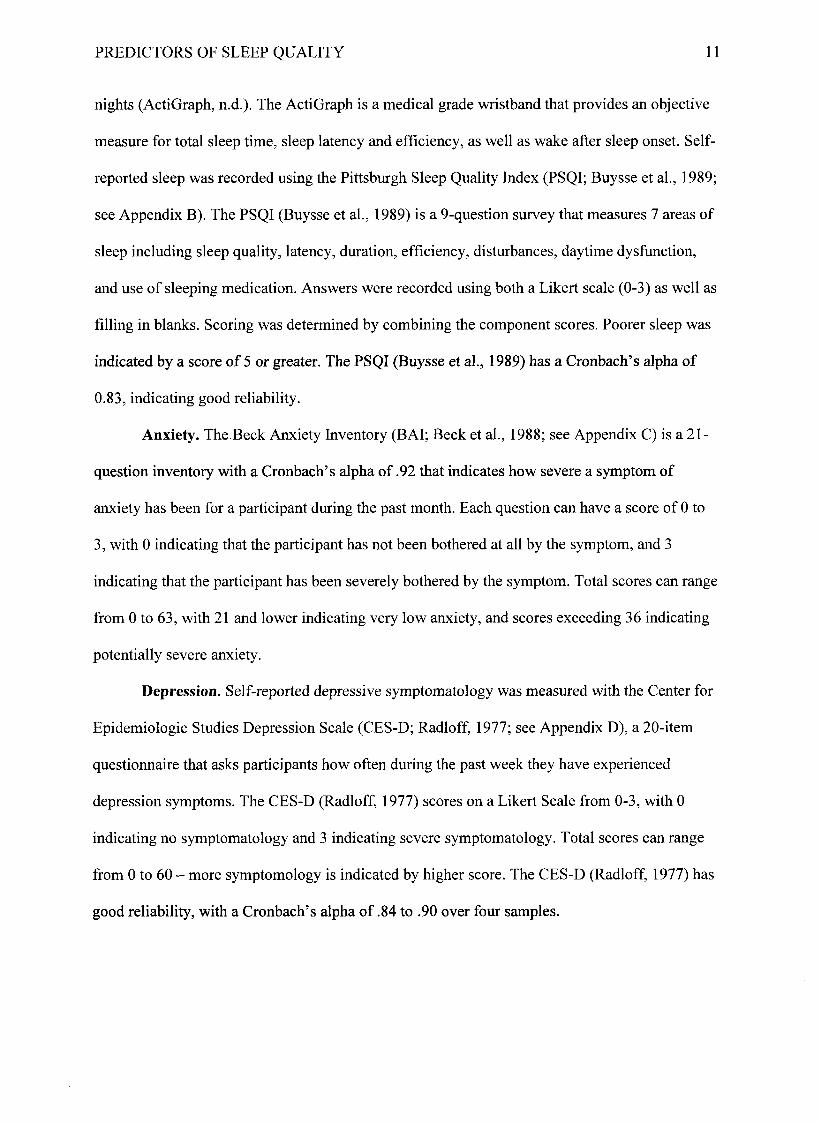
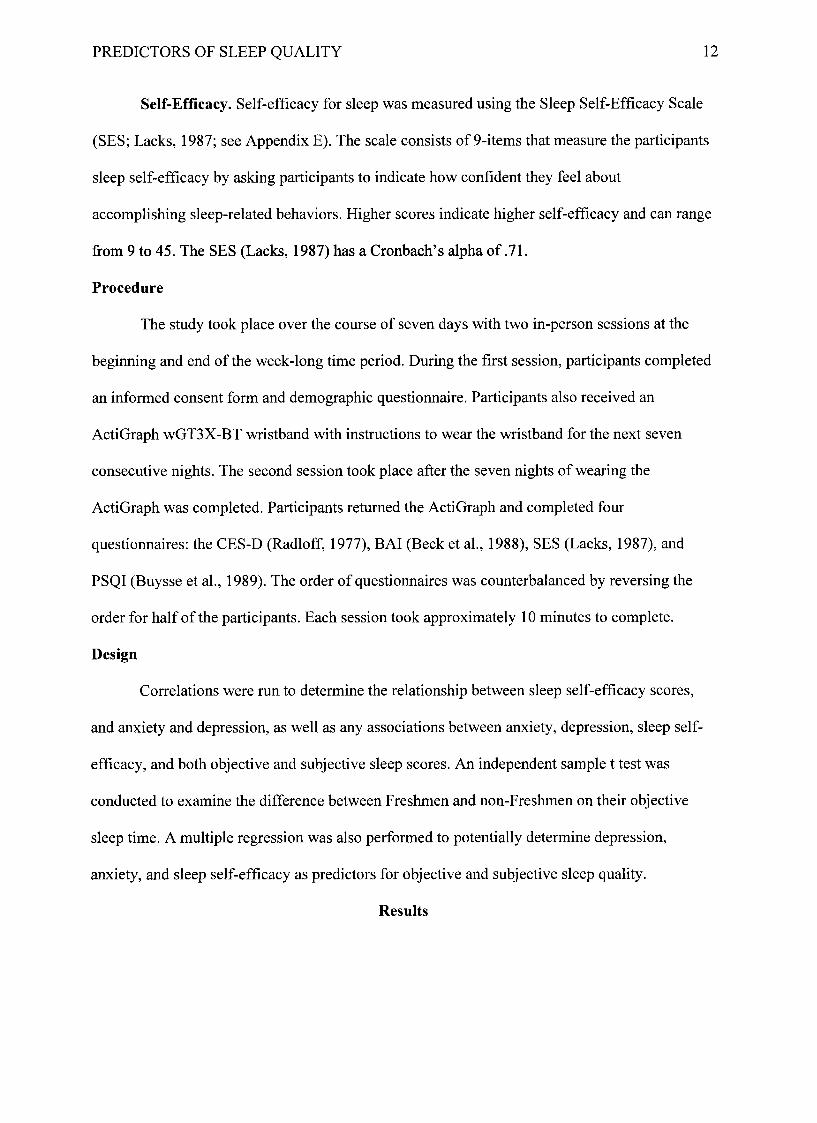
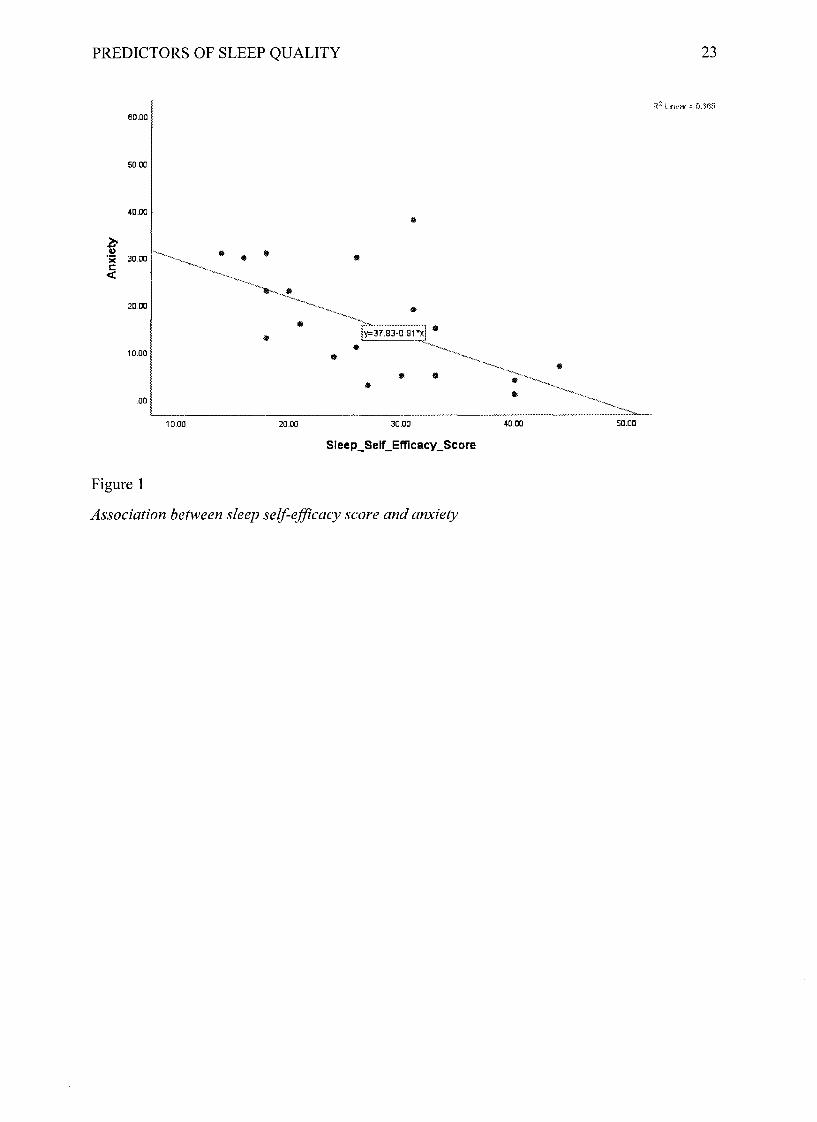
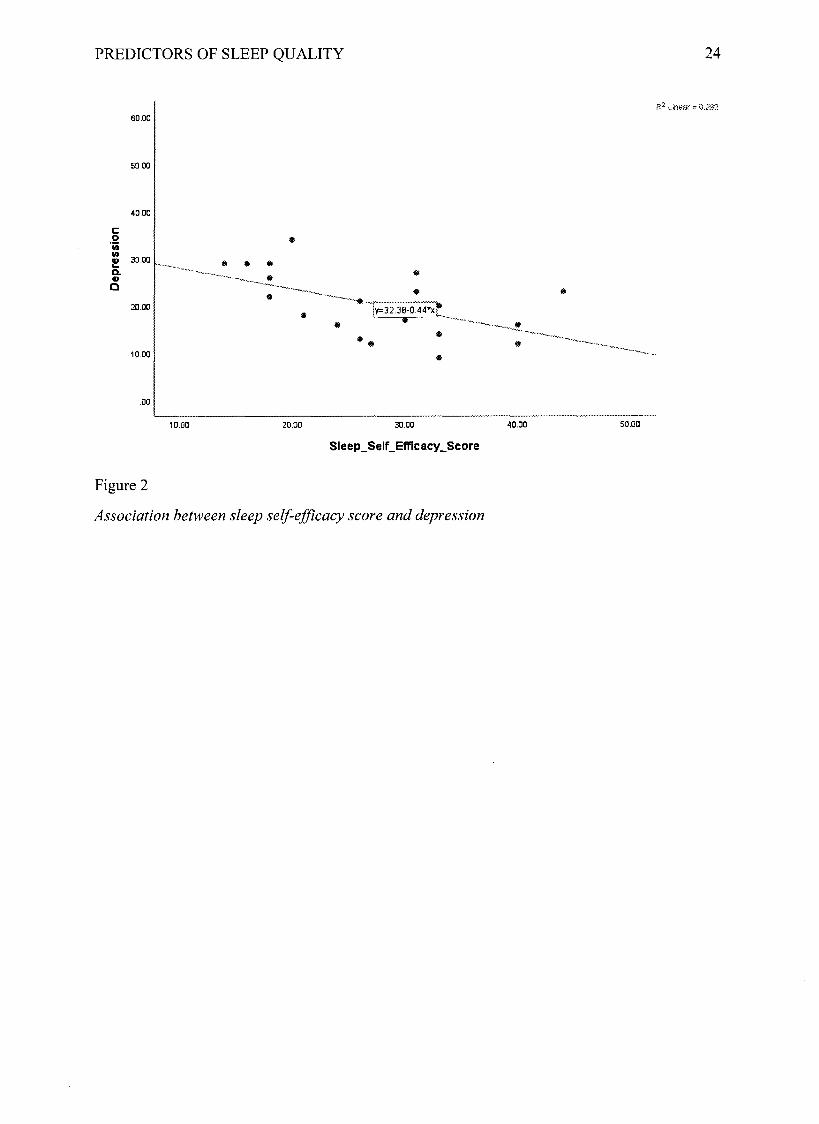
Using correlations, sleep self-efficacy scores were negatively correlated with both
anxiety scores (r(18) = -0.60, p = 0.002; see Figure 1) and depression scores (r(18) = -0.54, p =
0.007; see Figure 2). Objective sleep scores obtained through the ActiGraph wGT3X-BT did not
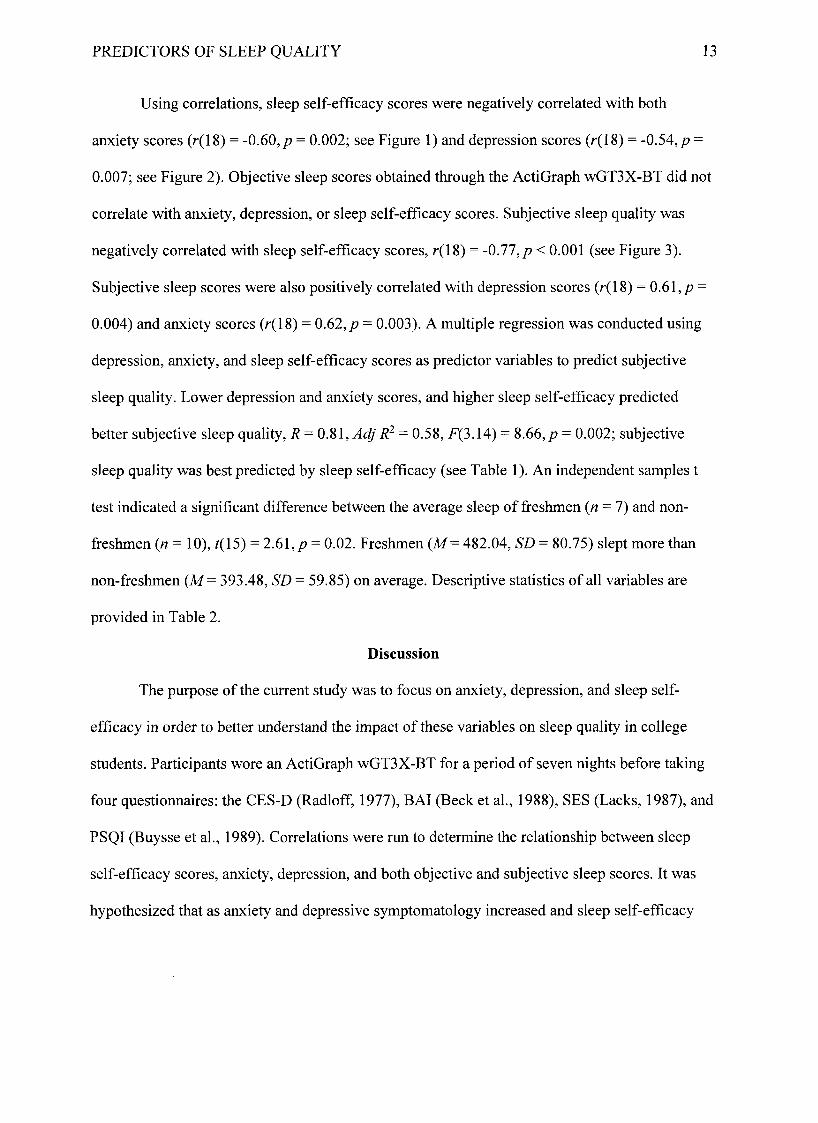
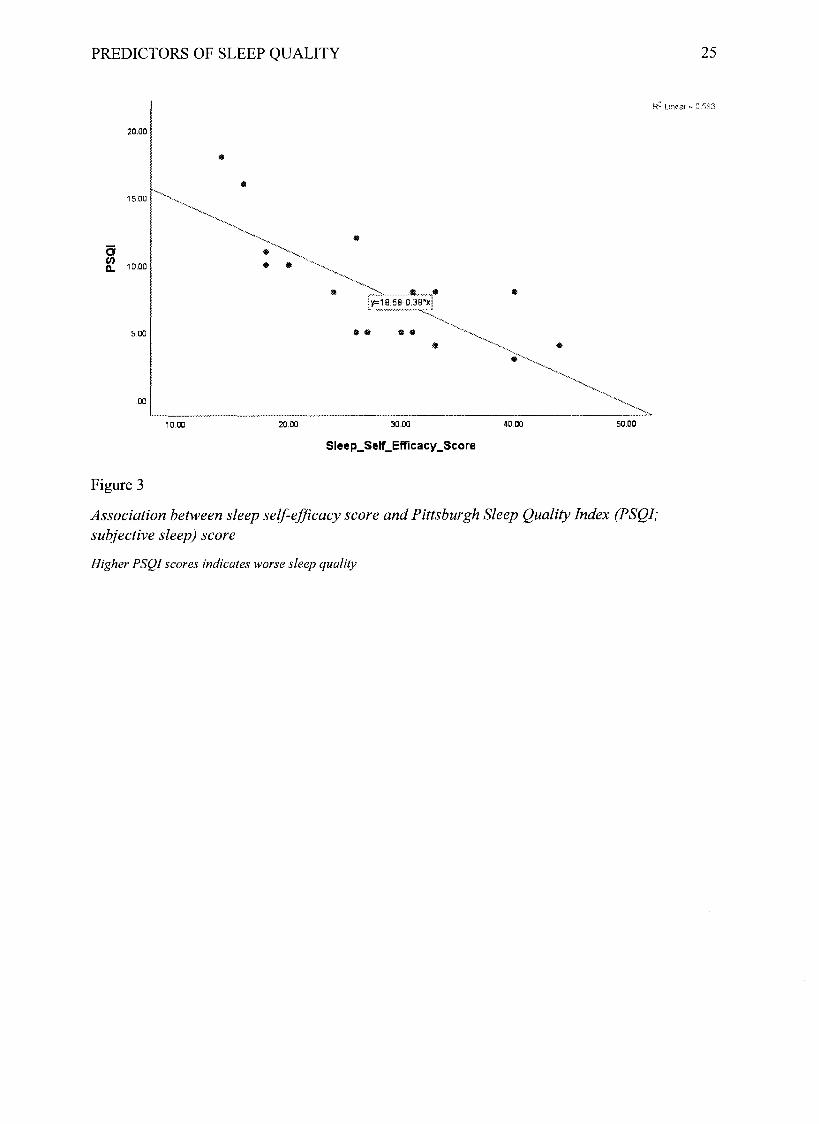
correlate with anxiety, depression, or sleep self-efficacy scores. Subjective sleep quality was
negatively correlated with sleep self-efficacy scores, r(18) = -0.77, p < 0.001 (see Figure 3).
Subjective sleep scores were also positively correlated with depression scores (r( l8) = 0.61, p =
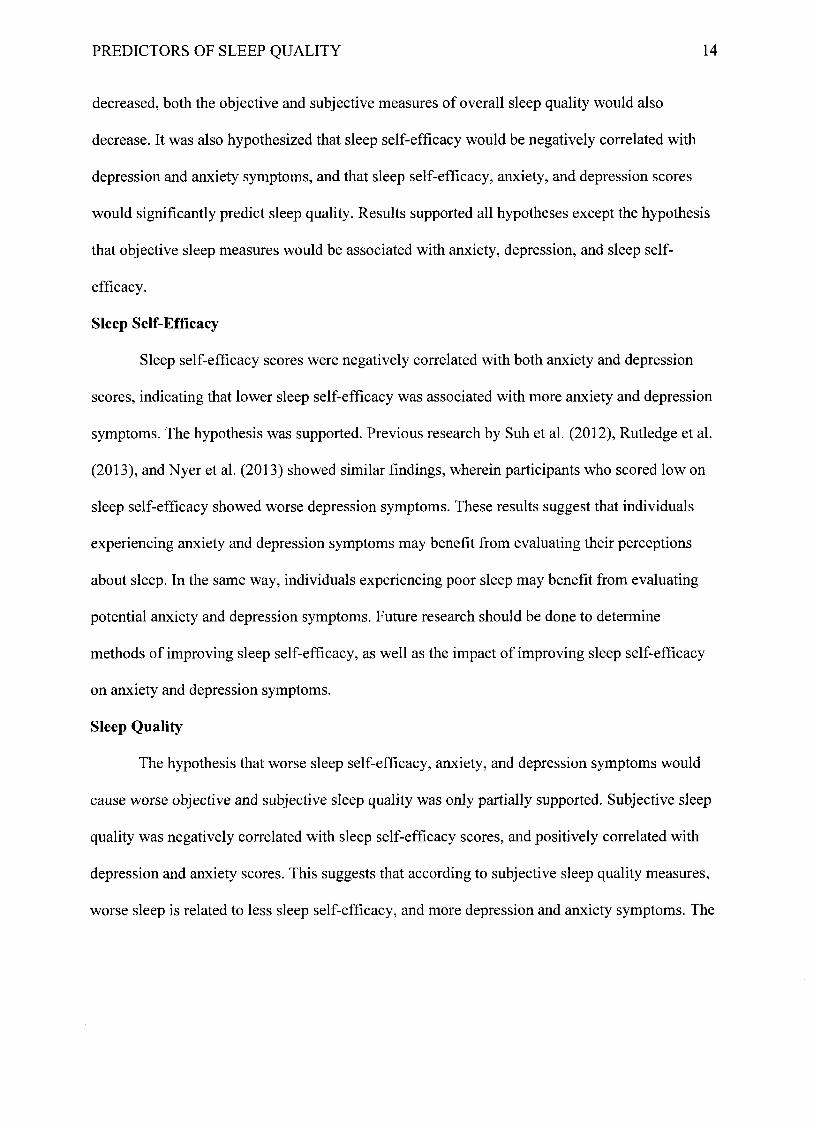
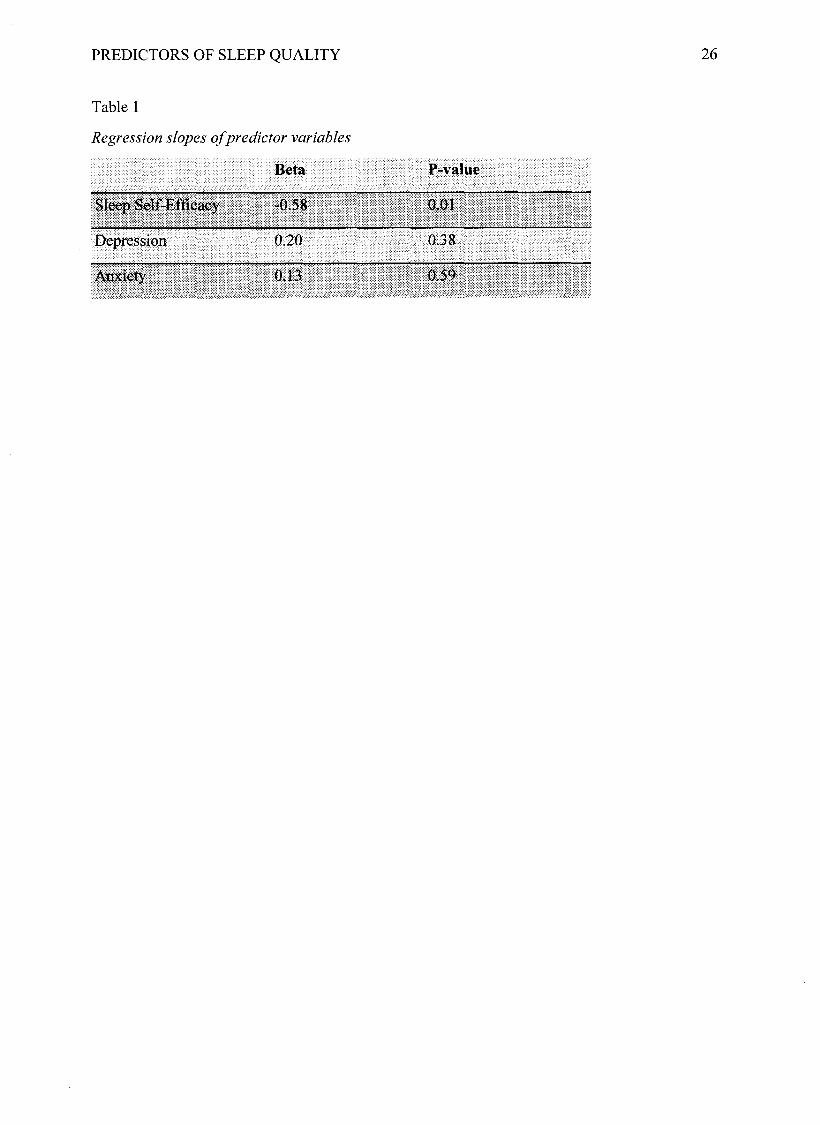
0.004) and anxiety scores (r(18) = 0.62, p = 0.003). A multiple regression was conducted using
depression, anxiety, and sleep self-efficacy scores as predictor variables to predict subjective
sleep quality. Lower depression and anxiety scores, and higher sleep self-efficacy predicted
better subjective sleep quality, R = 0.81, Adj R2 = 0.58, F(3.14) = 8.66, p = 0.002; subjective
sleep quality was best predicted by sleep self-efficacy (see Table 1). An independent samples t
test indicated a significant difference between the average sleep of freshmen (n = 7) and non-
freshmen (n = 10), t(15) = 2.61 , p = 0.02. Freshmen (M = 482.04, SD = 80.75) slept more than
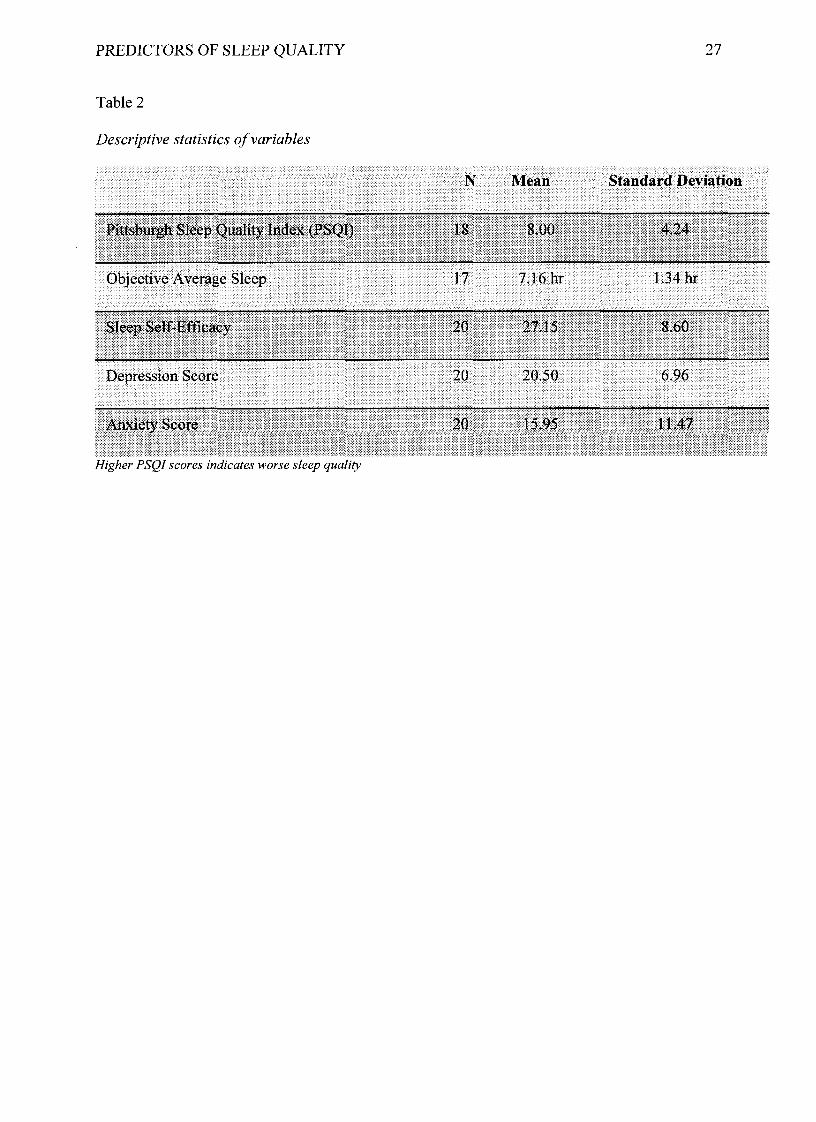
non-freshmen (M = 393.48, SD = 59.85) on average. Descriptive statistics of all variables are
provided in Table 2.
Discussion
The purpose of the current study was to focus on anxiety, depression, and sleep self-
efficacy in order to better understand the impact of these variables on sleep quality in college
students. Participants wore an ActiGraph wGT3X-BT for a period of seven nights before taking
four questionnaires: the CES-D (Radloff, 1977), BAI (Beck et al., 1988), SES (Lacks, 1987), and
PSQI (Buysse et al., 1989). Correlations were run to determine the relationship between sleep
self-efficacy scores, anxiety, depression, and both objective and subjective sleep scores. It was
hypothesized that as anxiety and depressive symptomatology increased and sleep self-efficacy
PREDICTORS OF SLEEP QUALITY 14
decreased, both the objective and subjective measures of overall sleep quality would also
decrease. It was also hypothesized that sleep self-efficacy would be negatively correlated with
depression and anxiety symptoms, and that sleep self-efficacy, anxiety, and depression scores
would significantly predict sleep quality. Results supported all hypotheses except the hypothesis
that objective sleep measures would be associated with anxiety, depression, and sleep self-
efficacy.
Sleep Self-Efficacy
Sleep self-efficacy scores were negatively correlated with both anxiety and depression
scores, indicating that lower sleep self-efficacy was associated with more anxiety and depression
symptoms. The hypothesis was supported. Previous research by Suh et al. (2012), Rutledge et al.
(2013), and Nyer et al. (2013) showed similar findings, wherein participants who scored low on
sleep self-efficacy showed worse depression symptoms. These results suggest that individuals
experiencing anxiety and depression symptoms may benefit from evaluating their perceptions
about sleep. In the same way, individuals experiencing poor sleep may benefit from evaluating
potential anxiety and depression symptoms. Future research should be done to determine
methods of improving sleep self-efficacy, as well as the impact of improving sleep self-efficacy
on anxiety and depression symptoms.
Sleep Quality
The hypothesis that worse sleep self-efficacy, anxiety, and depression symptoms would
cause worse objective and subjective sleep quality was only partially supported. Subjective sleep
quality was negatively correlated with sleep self-efficacy scores, and positively correlated with
depression and anxiety scores. This suggests that according to subjective sleep quality measures,
worse sleep is related to less sleep self-efficacy, and more depression and anxiety symptoms. The
PREDICTORS OF SLEEP QUALITY 15
hypothesis that depression, anxiety, and sleep self-efficacy would predict sleep quality was also
supported for subjective sleep. These results were not found using objective sleep measures.
These findings are consistent with previous research: Suh et al. (2012) and Nyer et al.
(2013) utilized subjective measures of sleep quality and found similar results when correlated
with sleep self-efficacy, anxiety, and depression. Additionally, O’Donnell et al. (2009) found a
similar discrepancy between objective and subjective measures in older adults, who were likely
to report “good” sleep despite EEG readings that indicated that their sleep was poor. Buysse et
al. (1991) theorized that the perception of older adults may be altered by gradual sleep quality
changes associated with aging that alter their expectations about what good sleep is. The results
of the current study indicate that a similar phenomenon may be occurring in college students.
Because college students may expect to get less sleep, they may be more willing to describe poor
sleep as good sleep, so long as it is less poor than what they are used to.
These results also suggest that an individual’s perception of sleep is more relevant to
anxiety and depression symptoms, versus how much sleep an individual is actually getting.
Depression and anxiety were measured using self-report data, which measures an individual’s
perception of anxiety and depression. If an individual does not feel as though they have gotten
enough sleep, they may exhibit irritability, depression, and anxiety symptoms regardless of
whether they actually received an adequate amount of sleep. These results reiterate the need to
examine treatments for poor sleep, which should include methods of improving an individual’s
perceptions of sleep, and not just the overall time a person is sleeping. Research conducted in the
future should look at the possibility of other objective measures that may correlate more closely
with subjective sleep quality (ex: circadian rhythm indicators; Buysse et al., 1991; Campbell,
Gillin, Kripke, Erikson, & Clopton, 1989).
PREDICTORS OF SLEEP QUALITY 16
Limitations
The current study has several limitations. One is the small sample size of only twenty
participants, which may not be enough to glean accurate findings about the rest of the
population. Typical self-report limitations (such as dishonesty, level of understanding, memory,
and bias) are also applicable to the current study, which may have accounted for the disparity
between objective and subjective results. Because participants were not restricted to a sleep lab
while wearing the ActiGraph wGT3X-BT, it is not possible to know the exact conditions under
which the wristband was worn-such as being forgotten on some nights or being stored in
extremely variable conditions that may have influenced the ActiGraph wGT3X-BT’s readings.
Additionally, the current study could have been improved with the use of electronic self-scoring
versions of the questionnaires, which would have eliminated any potential errors from manual
scoring.
Conclusion
This study demonstrated the importance of an individual’s perceptions of sleep. Although
objective sleep data may be useful in other contexts, subjective data is more relevant when it
comes to anxiety and depression symptoms-symptoms that comprise two common mental health
problems in both teens and adults (“World Health”, 2017). While the health centers of colleges
and universities may provide a plethora of information regarding anxiety and depression, more
emphasis should be placed on the importance of sleep when dealing with these symptoms, as
well as how our perceptions of sleep can impact other cognitive functioning.
PREDICTORS OF SLEEP QUALITY 17
References
Achenbach, T., & Edelbrock, C. S. (1978). The classification of child psychopathology: A
review and analysis of empirical efforts. Psychological Bulletin, 85, 1275-1301.
ActiGraph wGT3X-BT. (n.d.). Retrieved November 01, 2017, from
http://actigraphcorp.com/products-showcase/activity-monitors/actigraph-wgt3x-bt
Bandura, A. (1977). Self-efficacy: Toward a unifying theory o f behavioral change. New York,
NY, US: Psychology Press.
Bandura, A., Pastorelli, C., Barbaranelli, C., & Caprara, G. V. (1999). Self-efficacy pathways to
childhood depression. Journal o f Personality and Social Psychology, 76(2), 258-269.
doi: 10.1037//0022-3514.76.2.258
Bastien, C., Vallières, A., & Morin, C. M. (2001). Validation of the Insomnia Severity Index as
an outcome measure for insomnia research. Sleep Medicine, 2(4), 297-307.
doi: 10.1016/s1389-9457(00)00065-4
Beck, A. T., Epstein, N., Brown, G., & Steer, R. A. (1988). An inventory for measuring clinical
anxiety: Psychometric properties. Journal o f Consulting and Clinical Psychology, 56(6),
896-897. doi: 10.1037//0022-006x.56.6.893
Beck, A. T., Ward, C. H., Mendelson, M., Mock, J., & Erbaugh, J. (1961). An inventory
measuring depression. Archives o f General Psychiatry, 4, 561-571.
Beck, A. T., Weissman, A., Lester, D., & Trexler, L. (1974). The measurement of pessimism: the
hopelessness scale. J Consult Clin Psychol, 6(42), 861-865.
Blanco, C., Okuda, M., Wright, C., Hasin, D. S., Grant, B. F., Liu, S., & Olfson, M. (2008).
Mental health of college students and their non-college-attending peers: Results from the
National Epidemiologic Study on Alcohol and Related Conditions. Arch Gen Psychiatry,
PREDICTORS OF SLEEP QUALITY 18
65(12), 1429-1437. doi:10.1001/archpsyc.65.12.1429
Bluestein, D., Rutledge, C. M., & Healey, A. C. (2010). Psychosocial correlates of insomnia
severity in primary care. The Journal o f the American Board o f Family Medicine, 23(2),
204-211. doi: 10.3122/jabfm.2010.02.090179
Buboltz, W., Jenkins, S. M., Soper, B., Woller, K., Johnson, P., & Faes, T. (2009). Sleep Habits
and Patterns of College Students: An Expanded Study. Journal o f College Counseling,
12(2), 113-124. doi: 10.1002/j.2161-1882-2009.tbh00109.x
Buysse, D. J., Reynolds, C. F., Monk, T. H., Berman, S. R., & Kupfer, D. J. (1989). The
Pittsburgh sleep quality index: A new instrument for psychiatric practice and research.
Psychiatry Research, 28(2), 193-213. doi:10.1016/0165-1781(89)90047-4
Buysse, D. J., Reynolds, C. F., Monk, T. H., Hoch, C. C., Yeager, A. L., & Kupfer, D. J. (1991).
Quantification of Subjective Sleep Quality in Healthy Elderly Men and Women Using the
Pittsburgh Sleep Quality Index (PSQI). Sleep, 331-338. doi:10.1093/sleep/14.4.331
Campbell, S. S., Gillin, C., Kripke, D., Erikson, P., & Clopton, P. (1989). Gender Differences in
the Circadian Temperature Rhythms of Healthy Elderly Subjects: Relationships to Sleep
Quality. Sleep, 12(6), 529-536. doi:10.1093/sleep/12.6.529
Clark, L. A., & Watson, D. (1991). Tripartite model of anxiety and depression: Psychometric
evidence and taxonomic implications. Journal o f Abnormal Psychology, 100, 316-336.
Chiang, Y., Arendt, S. W., Zheng, T., & Hanisch, K. A. (2014). The Effects of Sleep on
Academic Performance and Job Performance. College Student Journal,48(1), 72-87.
doi: 10.1037/e578212006-001
Curran, S. L., Andrykowski, M. A., & Studts, J. L. (1995). Short Form of the Profile of Mood
States (POMS-SF): Psychometric information. Psychological Assessment, 7(1), 80-83.
PREDICTORS OF SLEEP QUALITY 19
doi:10.1037/1040-3590.7.1.80
Endicott, J., Nee, J., Harrison, W., & Blumenthal, R. (1993). Quality of Life Enjoyment and
Satisfaction Questionnaire. PsycTESTS Dataset. doi:10.1037/t49981-000
Espie, C. A., Brookes, D. N., & Lindsay, W. R. (1989). An evaluation of tailored psychological
treatment of insomnia. Journal o f Behaviour Therapy and Experimental Psychiatry, 20,
143-153.
Fava, M., Iosifescu, D. V., Pedrelli, P., & Baer, L. (2009). Reliability and Validity of the
Massachusetts General Hospital Cognitive and Physical Functioning Questionnaire.
Psychotherapy and Psychosomatics, 78(2), 91-97. doi:10.1159/000201934
Freeston, M. H., Rheaume, J., Letarte, H., Dugas, M. J., & Ladouceur, R. (1994). Why do people
worry? Personality and Individual Differences, 17, 791-802
Content of Thoughts Inventory (GCTI): A new measure for the assessment of pre-sleep
doi:10.1348/0144665042388900
Home, J. A., & Ostberg, O. (1976). A self-assessment questionnaire to determine morningness-
eveningness in human circadian rhythms. International Journal o f Chronobiology, 4(2),
97-110.
Johns, M. W. (1992). Reliability and Factor Analysis of the Epworth Sleepiness Scale. Sleep,
15(4), 376-381. doi:10.1093/sleep/l5.4.376
Harvey, A. G. (2000). Pre-sleep cognitive activity: A comparison of sleep-onset insomniacs and
doi:10.1348/014466500163284
Harvey, K. J., & Espie, C. A. (2004). Development and preliminary validation of the Glasgow
good sleepers. British Journal o f Clinical Psychology,39(3), 275-286.
cognitive activity. British Journal o f Clinical Psychology, 43(4), 409-420.
PREDICTORS OF SLEEP QUALITY 20
Kovacs, M. (1985). The Children’s Depression Inventory (CDI). Psychopharmacology Bulletin,
21, 995-1124.
Lacks, P. (1987). Behavioral treatment for persistent insomnia. New York: Pergamon Press.
Lack of Sleep is Affecting Americans, Finds the National Sleep Foundation. (2014, December).
Retrieved October 23, 2017, from https://sleepfoundation.org/media-center/press-
release/lack-sleep-affecting-americans-finds-the-national-sleep-foundation
Lund, H. G., Reider, B.D., Whiting, A. B., & Prichard, J. R. (2010). Sleep patterns and predictors
of disturbed sleep in a large population of college students. Journal o f Adolescent Health,
46(2), 124-132. doi:10.1016/j.jadohealth.2009.06.016
Mendelson, W. B., Gillin, J. C., & Wyatt, R. J. (2012). Human Sleep and Its Disorders. Springer
Verlag.
Meyer, T. J., Miller, M. L., Metzger, R. L., & Borkovec, T. D. (1990). Development and
validation of the Penn State Worry Questionnaire. Behavior Research and Therapy, 28,
487-495
Morin, C. M. (1993). Insomnia: Psychological Assessment and Management. Guilford Press,
New York, NY.
Morin, C. M., Vallières, A., & Ivers, H. (2007). Dysfunctional Beliefs and Attitudes about Sleep
(DBAS): Validation of a Brief Version (DBAS-16). Sleep, 30(11), 1547-1554.
doi:10.1093/sleep/30.11.1547
Nyer, M., Farabaugh, A., Fehling, K., Soskin, D., Holt, D., Papakosta, G. I., ... Mischoulon, D.
(2013). Relationship Between Sleep Disturbance and Depression, Anxiety, and
Functioning In College Students. Depression and Anxiety, 30(9), 873-880.
doi:10.1002/da.22064
PREDICTORS OF SLEEP QUALITY 21
O’Donnell, D., Silva, E. J., Munch, M., Ronda, J. M., Wang, W., & Duffy, J. F. (2009).
Comparison of subjective and objective assessments of sleep in healthy older subjects
without sleep complaints. Journal o f Sleep Research, 18(2), 254-263. doi:10.1111/j.1365-
2869.2008.00719.x
Pilcher, J. J., & Huffcutt, A. I. (1996). Effects of Sleep Deprivation on Performance: A
Meta-Analysis. Sleep, 19(4), 318-326. doi:10.1093/sleep/19.4.318
Radloff, L. S. (1977). The CES-D Scale: A Self-Report Depression Scale for Research in the
General Population. Applied Psychological Measurement, 1(3), 385-401.
doi:10.1177/014662167700100306
Riemann, D., Berger, M., & Voderholzer, U. (2001). Sleep and depression - results from
psychobiological studies: an overview. Biological Psychology, 57(1-3), 67-103.
doi:10.1016/s0301-0511(01 )00090-4
Rutledge, C. M., Guardia, A. C. L., & Bluestein, D. (2013). Predictors of self-efficacy for sleep
in primary care. Journal o f Clinical Nursing, 22(9), 1254-1261. doi:10.1111/jocn.12005
Sadeh, A., Hauri, P. J., Kripke, D. F., & Lavie, P. (1995). The Role of Actigraphy in the
Evaluation of Sleep Disorders. Sleep,18(4), 288-302. doi:10.1093/sleep/18.4.288
Smith, C. S., Reilly, C., & Midkiff, K. (1989). Evaluation of three circadian rhythm
questionnaires with suggestions for an improved measure of morningness. Journal o f
Applied Psychology, 74(5), 728-738. doi:10.1037/0021-9010.74.5.728
Suh, S., Ong, J. C., Steidtmann, D., Nowakowski, S., Dowdle, C., Willett, E .,. . . Manber, R.
(2012). Cognitions and Insomnia Subgroups. Cognitive Therapy and Research, 36(2),
120-128. doi:10.1007/s10608-011-9415-6
PREDICTORS OF SLEEP QUALITY 22
Taylor, D. J., & Bramoweth, A. D. (2010). Patterns and Consequences of Inadequate Sleep in
College Students: Substance Use and Motor Vehicle Accidents. Journal o f Adolescent
Health, 46(6), 610-612. doi:10.1016/j.jadohealth.2009.12.010
Urponen, H., Partinen, M., Vuori, I., & Hasan, J. (1991). Sleep Quality and Health: Description
of the Sleep Quality Index. Sleep and Health Risk, 555-558. doi:10.1007/978-3-642-
76034-l_63
Ware, J. E., & Sherbourne, C. D. (1992). MOS 36-item Short-Form Health Survey. PsycTESTS
Dataset. doi:10.1033/t06708-000
Wolpe, J. (1970). The practice o f behavior therapy. New York: Pergamon Press.
World Health Organization. (2017). World Health Organization. Retrieved March 17, 2018,
from
http://www.who.int/mental_health/management/depression/prevalence_global_health_est
imates/en/
PREDICTORS OF SLEEP QUALITY 23
Figure 1
Association between sleep self-efficacy score and anxiety
SIeep_Self_Efficacy_Score
10.00 20.00 30.00 40.00 50.00
60.00
50.00
40.00
30.00
20.00
10.00
.00
y=3 7.83-0.81*x
R 2 L i n e a r = 0 . 3 6 5A
nxie
ty
PREDICTORS OF SLEEP QUALITY 24
Figure 2
Association between sleep self-efficacy score and depression
60.00
50.00
40.00
30.00
20.00
10.00
.00
10.00 20.00 30.00 40.00 50.00
Sleep_Self_Efficacy__Score
y=32.38-0.44*x
R 2 L i n e a r = 0 . 2 9 2D
epre
ssio
n
PREDICTORS OF SLEEP QUALITY 25
Figure 3
Association between sleep self-efficacy score and Pittsburgh Sleep Quality Index (PSQI; subjective sleep) score
Higher PSQI scores indicates worse sleep quality
R2 Linear = 0.583
20.00
15.00
10.00
5.00
.00
10.00 20.00 30.00 40.00 50.00
SIeep_SeIf_ Effic acy_Score
PSQ
I
y=18.58-0.38*x
PREDICTORS OF SLEEP QUALITY 26
Table 1
Regression slopes o f predictor variables
Sleep Self-Efficacy
Depression
Anxiety
Beta P-value
-0.58
0.20
0.13
0.01
0.38
0.50
PREDICTORS OF SLEEP QUALITY 27
Table 2
Descriptive statistics o f variables
Higher PSQI scores indicates worse sleep quality
Pittsburgh Sleep Quality Index (PSQI)
Objective Average Sleep
Sleep Self-Efficacy
Depression Score 20
20
17
18 8.00 4.24
7.16 hr
27.15
1.34 hr
8.60
20.50 6.96
20 15.95 11.47Anxiety Score
N Mean Standard Deviation
PREDICTORS OF SLEEP QUALITY 28
Appendix A
Demographic Questionnaire
Gender: Male Female Other
2.
3.
Age:_________
Ethnicity (Circle One):
White Hispanic/Latino Black or African American Native American or American Indian
Asian/Pacific Islander Other Mixed Race
4.
5.
6.
7.
8.
How many days a week do you drink caffeine?____________
Average duration of each nap in minutes:___________
How many days a week do you nap? _____________
Expected Graduation Year:__________
On the days you do drink caffeine, on average how many caffeinated beverages do you
drink?________
9. Please rate how dependent you feel on caffeine to get through the day:
(Least dependent) 1 2 3 4 5 (Very dependent)
10. Do you use tobacco products? Yes No Other
a. If yes to #10, how many days a week?_________
b. If other, please explain (including average number of days weekly):
PREDICTORS OF SLEEP QUALITY 29
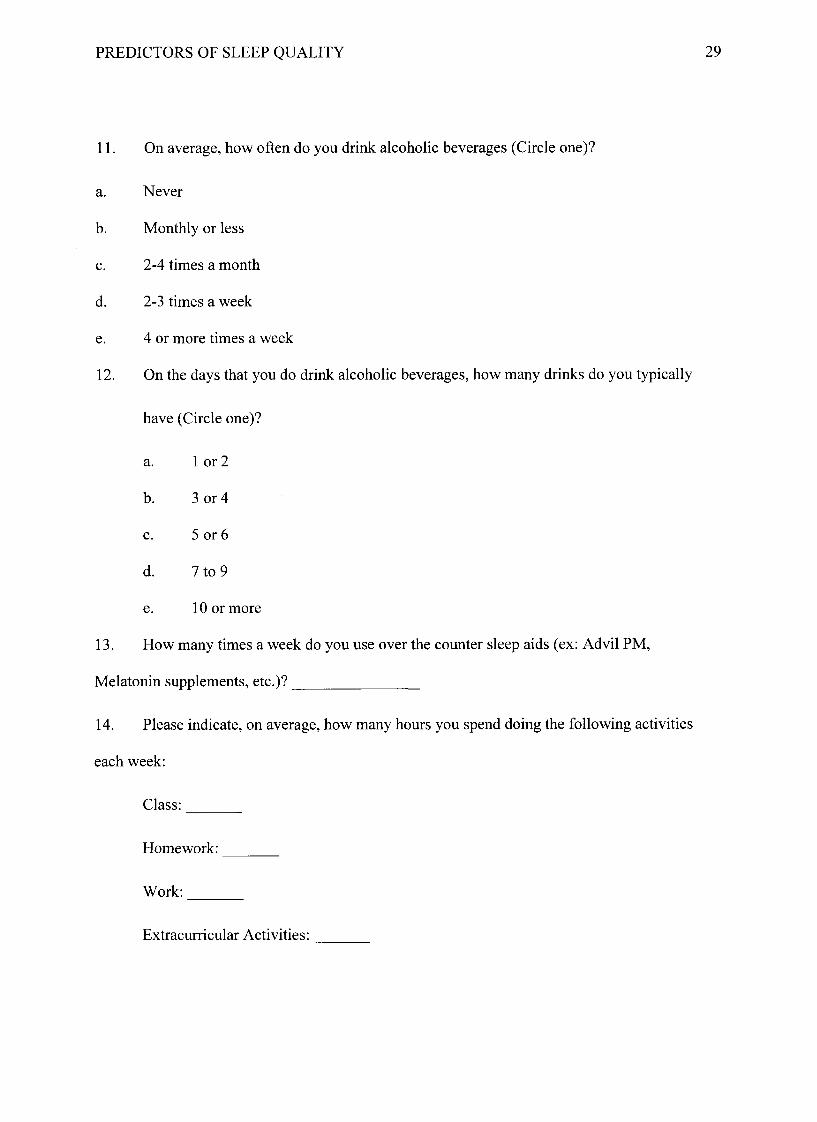
11. On average, how often do you drink alcoholic beverages (Circle one)?
a. Never
b. Monthly or less
c. 2-4 times a month
d. 2-3 times a week
e. 4 or more times a week
12. On the days that you do drink alcoholic beverages, how many drinks do you typically
have (Circle one)?
a. 1 or 2
b. 3 or 4
c. 5 or 6
d. 7 to 9
e. 10 or more
13. How many times a week do you use over the counter sleep aids (ex: Advil PM,
Melatonin supplements, etc.)?________________
14. Please indicate, on average, how many hours you spend doing the following activities
each week:
Class:_______
Homework:_______
Work:_______
Extracurricular Activities:_______
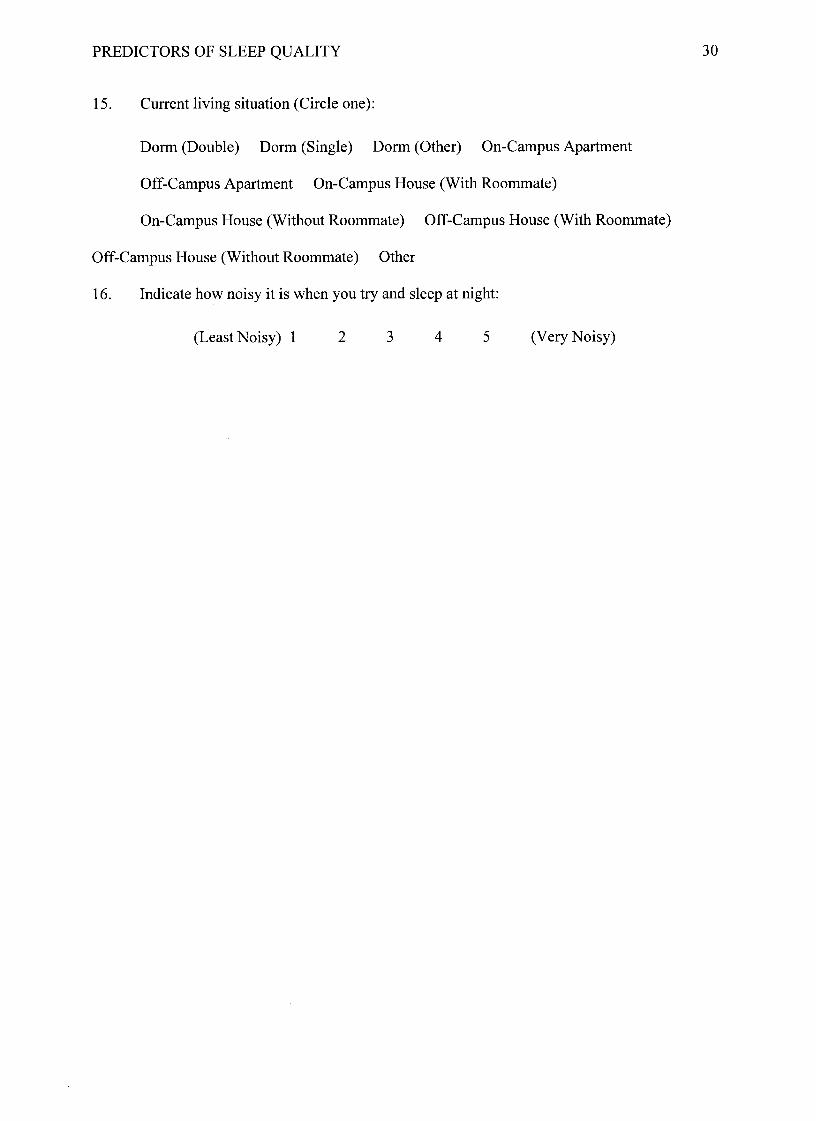
PREDICTORS OF SLEEP QUALITY 30
(Least Noisy) 1 2 3 4 5 (Very Noisy)
16. Indicate how noisy it is when you try and sleep at night:
Off-Campus House (Without Roommate) Other
On-Campus House (Without Roommate) Off-Campus House (With Roommate)
Off-Campus Apartment On-Campus House (With Roommate)
Dorm (Double) Dorm (Single) Dorm (Other) On-Campus Apartment
15. Current living situation (Circle one):
PREDICTORS OF SLEEP QUALITY 31
Appendix B
Name Dale
Sleep Quality Assessment (PSQI)W hat Is PSQI, and w h a t is it m easuring?
The Pittsburgh Sleep Quality Index (PSQI) is an effective instrument used to measure the qualify and patterns of steep in adults, it differentiates “poor" from “good"sleep quality by measuring seven areas (components): subjective sleep quality, sleep latency, sleep duration, habitual sleep efficiency, steep disturbances, use of sleeping medications, and daytime dysfunction over the last month.
INSTRUCTIONS:The following questions relate to your usual sleep habits during the past month only. Your answers should indicate tie most accurate reply for the majority of days and nights in the past month. Please answer all questions.
Scoring
During the past month,1. When have you usually gone to bed?2. How long (in minutes) has it taken you to fall asleep each night?3. What time have you usually gotten up in the morning'?4. A. How many hours of actual sleep did you get in a night?
B. How many hours were you in bed?
Component* Component 2
Component 3 Con$>onent4
Component 5Component 6 Component 7
C1
C2C3
C4CSC6C7
Add the seven component scores together Global PSQI
A to ta l score o f "5" or gre a te r is Indicative o f p o o r sleep quality.I f yo u scored "5 " o r m ore It is suggested that yo u disc uss y o u r sleep habits w ith a healthcare provider
#9 Score#2 Score (<15min (0), 16-30min (1), 31-60 min (2), >60min (3))+ #5a Score (if sum is equal 0=0; 1-2=1; 3-4=2; 5-6=3)#4 Scoe (>7(0), 6-7 (1), 5-6 (2), <5 (3)(total # of hours of sleep) / (total # of hours in bed) x 100>85%=0, 75%-84%=!, 65%-74%=2, <65%=3# sum of scores 5b to 5j (0=0; 1-9=1; 10-18=2; 19-27=3)#6 Score#7 Score + #8 score (0=0; 1-2=1; 3-4=2; 5-6=3)
PREDICTORS OF SLEEP QUALITY 32
Appendix C
Beck Anxiety Inventory
Below is a list of common symptoms of anxiety. {lease carefully read each item in the list. Indicate how much you have been bothered by that symptom during the past month, including today, by circling the number in the corresponding space in the column next to each symptom.
Not At All Mildly but it didn't bother me much.
Moderately - it wasn't pleasant at times
Severely - it bothered me a lot
Numbness or tinglingFeeling hotWobbliness in kgsUnable to relaxFear of worst happeningDizzy or lightheadedHeart pounding/racingUnsteadyTerrified or afraidNervousFeeling of chokingHands tremblingShaky / unsteadyFear of losing controlDifficulty in breathingFear of dyingScaredIndigestionFaint / lightheadedFace flushedHot/cold sweats
Column Sum0
00
0
111110
222
2:2
21000
333333321
000
1111 2
222 3
333
000
11110
222:2210
33333
33333
222221
11110
0000
Scoring - Sum each column. Then sum the column totals to achieve a grand score. Write that score here _ _ _ _ _ _ .
Interpretation
A grand sum between 0 - 21 indicates very low anxiety. That is usually a good thing. However, it is possible that you might be unrealistic in either your assessment which would be denial or that: you have learned to "mask" the symptoms commonly associated with anxiety. Too little "anxiety" could indicate that you are detached from yourself, others, or your environment.
A grand sum between 22 - 35 indicates moderate anxiety. Your body is trying to tell you something. Look for patterns as to what and why you experience the symptoms described above. For example, if it occurs prior to public speaking and your job respires a lot of presentations yon may want to find ways to calm yourself before speaking or let others do some of the presentations. You may have some conflict issues that need to be resolved. Clearly, it is not "panic" time but you want to find ways to manage the stress you feel.
A grand sum that exceeds 36 is a potential cause for concern. Again, look for patterns or times when you tend to feel the symptoms you have circled. Persistent and high anxiety is not: a sign of personal weakness or failure. It is, however, something that needs to be p roactively treated or there could be: significant impacts to you mentally a nd physically. You may want to consult a counselor if the feelings persist.
PREDICTORS OF SLEEP QUALITY 33
Appendix D
Center for Epidemiologic Studies Depression Scale (CES-D), NIMHBelow is a list of the ways you might have felt or behaved. Please tell me how often you have felt this way during the past week.
WeekDuring the Pest
Rarely or none of the time (less than
1 d ay )
Some or a little of the time (1-2
days)
Occasionally or a moderate amount of time
(3-4 days)
Most or all of the time (5-7
days)
1. I was bothered by things that usually don't bother me,2. i did not feel like eating; my appetite was poor.3. I felt that I could not shake off the blues even with help from my family or friends.4. I felt I was just as good as other people.5. I had trouble keeping my mind on what I was doing.6. I felt depressed.7. I felt that everything I did w as an effort.8. I felt hopeful about the future.9. I thought my life had been a failure.10. I felt fearful.11. My s le e p was restless.12. I was happy.13. I talked less than usual.14. I felt lonely.15. People were unfriendly.16. I enjoyed life.17. I had crying spells.18. I felt sad.19. I felt that people dislike me.20. I could not get "going."
SCORING: zero fo r answ ers in the first column. 1 fo r answ ers in th e second column, 2 fo r answ ers in the th ird colum n, 3 for an sw ers in the fourth colum n. The scoring o f positive item s is reversed . Possib le range o f scores is zero to 6 0 , w ith the h igher scores ind ica ting the p resence o f m ore symptomatology.
PREDICTORS OF SLEEP QUALITY 34
Appendix E
Sleep Self-Efficacy Scale
For the following 9 items, please rate (by circling a number from 1 to 5) your ability to carry out each behavior. If you feel able to accomplish a behavior some of the time but not always, you should indicate a lower level of confidence.
Indicate how confident you are that you can:
1. Lie in bed, feeling physically relaxed.1 2 3 4 5
Not confident Very confident
2. Lie in bed, feeling mentally relaxed.1 2 3 4 5
Not confident Very confident
3. Lie in bed with your thoughts “turned off’.1 2 3 4 5
Not confident Very confident
4. Fall asleep at night in under 30 minutes.1 2 3 4 5
Not confident Very confident
5. Wake up at night fewer than 3 times.1 2 3 4 5
Not confident Very confident
6. Go back to sleep within 15 minutes of waking in the night.1 2 3 4 5
Not confident Very confident
7. Feel refreshed upon waking in the morning.1 2 3 4 5
Not confident Very confident
8. Wake after a poor night’s sleep without feeling upset about it.1 2 3 4 5
Not confident Very confident
9. Not allow a poor night’s sleep to interfere with daily activities.1 2 3 4 5
Not confident Very confident