Embed Size (px)
Citation preview
Predictors of mobile Internet usage in 10 African countriesEnrico Calandro, UCT/Research ICT AfricaRong Wang, USC Annenberg School of CommunicationITS Bangkok, 18-21 Nov 2012
Friday, 24 May 13
Mobile phones and Internet contributing to positive development outcomesPart of the research which seeks to explore the role of ICTs in contemporary social and political engagement (food protest in Mozambique 2007/2008, ethnic mobilisation in Kenya in 2009, Arab spring) The study concludes with policy implications on mobile Internet usage in African countries related to democracy, empowerment and capability development.
Research outline
Friday, 24 May 13
Research questions:
What are the social aspects and demographic factors influencing mobile Internet usage in selected African countries?
To what extent does belonging to specific civic affiliations such as religious, recreational or political groups impact on mobile Internet usage?
Friday, 24 May 13
Nationally representative ICT access and usage household and individual data10 African countries in end 2011 and beginning of 20124 Stage sampling based on census sample frame
Research methodology
Friday, 24 May 13

Assessing mobile Internet usageAssessing mobile Internet access and usage
Friday, 24 May 13

South Africa
Namibia
Botswana
Ghana
Nigeria
Tanzania
Rwanda
Uganda
Cameroon
Ethiopia 7%
15%
15%
19%
19%
23%
29%
30%
31%
51%
15+ Owners of a mobile with mobile that is capable of browsing the Internet
15+ Owning a mobile
South Africa
Botswana
Nigeria
Ghana
Namibia
Uganda
Cameroon
Tanzania
Rwanda
Ethiopia 18%
24%
36%
45%
47%
56%
60%
66%
80%
84%
Friday, 24 May 13

Network exposureIn smaller markets most users are innovators
South Africa
Botswana
Nigeria
Ghana
Namibia
Uganda
Cameroon
Tanzania
Rwanda
Ethiopia 18%
24%
36%
45%
47%
56%
60%
66%
80%
84% Botswana
South Africa
Namibia
Ghana
Nigeria
Cameroon
Uganda
Tanzania
Rwanda
Ethiopia 8%
14%
28%
30%
35%
39%
48%
52%
57%
63%
Mobile ownership in the close group of friends
(5 friends)
Ethiopia
Cameroon
Rwanda
Tanzania
Nigeria
Ghana
Uganda
Botswana
Namibia
South Africa 9%
10%
11%
14%
16%
25%
27%
35%
38%
59%
Mobile ownership in the close group of friends
(0 friends)Share mobile owners
Friday, 24 May 13
South AfricaNamibia
BotswanaNigeria
RwandaGhana
CameroonUganda
TanzaniaEthiopia 5%
5%8%8%
13%15%16%
23%24%
28%
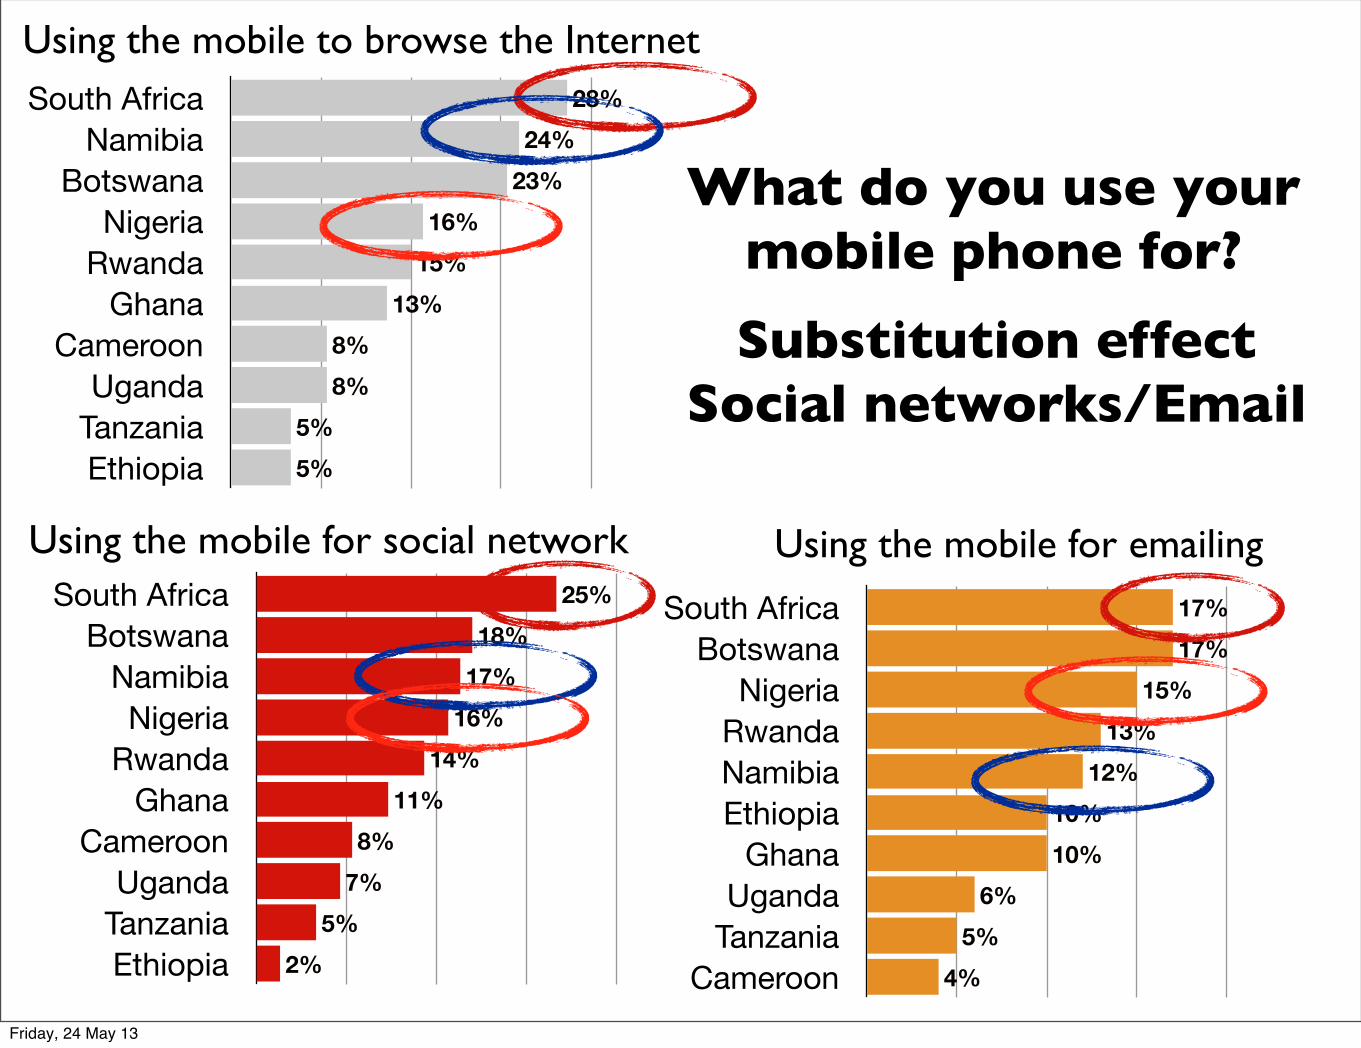
Using the mobile to browse the Internet
What do you use yourmobile phone for?
South AfricaBotswana
NigeriaRwandaNamibiaEthiopia
GhanaUganda
TanzaniaCameroon 4%
5%6%
10%10%
12%13%
15%17%17%
Using the mobile for emailingUsing the mobile for social networkSouth Africa
BotswanaNamibiaNigeria
RwandaGhana
CameroonUganda
TanzaniaEthiopia 2%
5%7%8%
11%14%
16%17%18%
25%
Substitution effectSocial networks/Email
Friday, 24 May 13
NigeriaUganda
CameroonTanzania
BotswanaEthiopia
GhanaRwandaNamibia
South Africa 36%36%38%
44%47%48%50%50%54%
62%
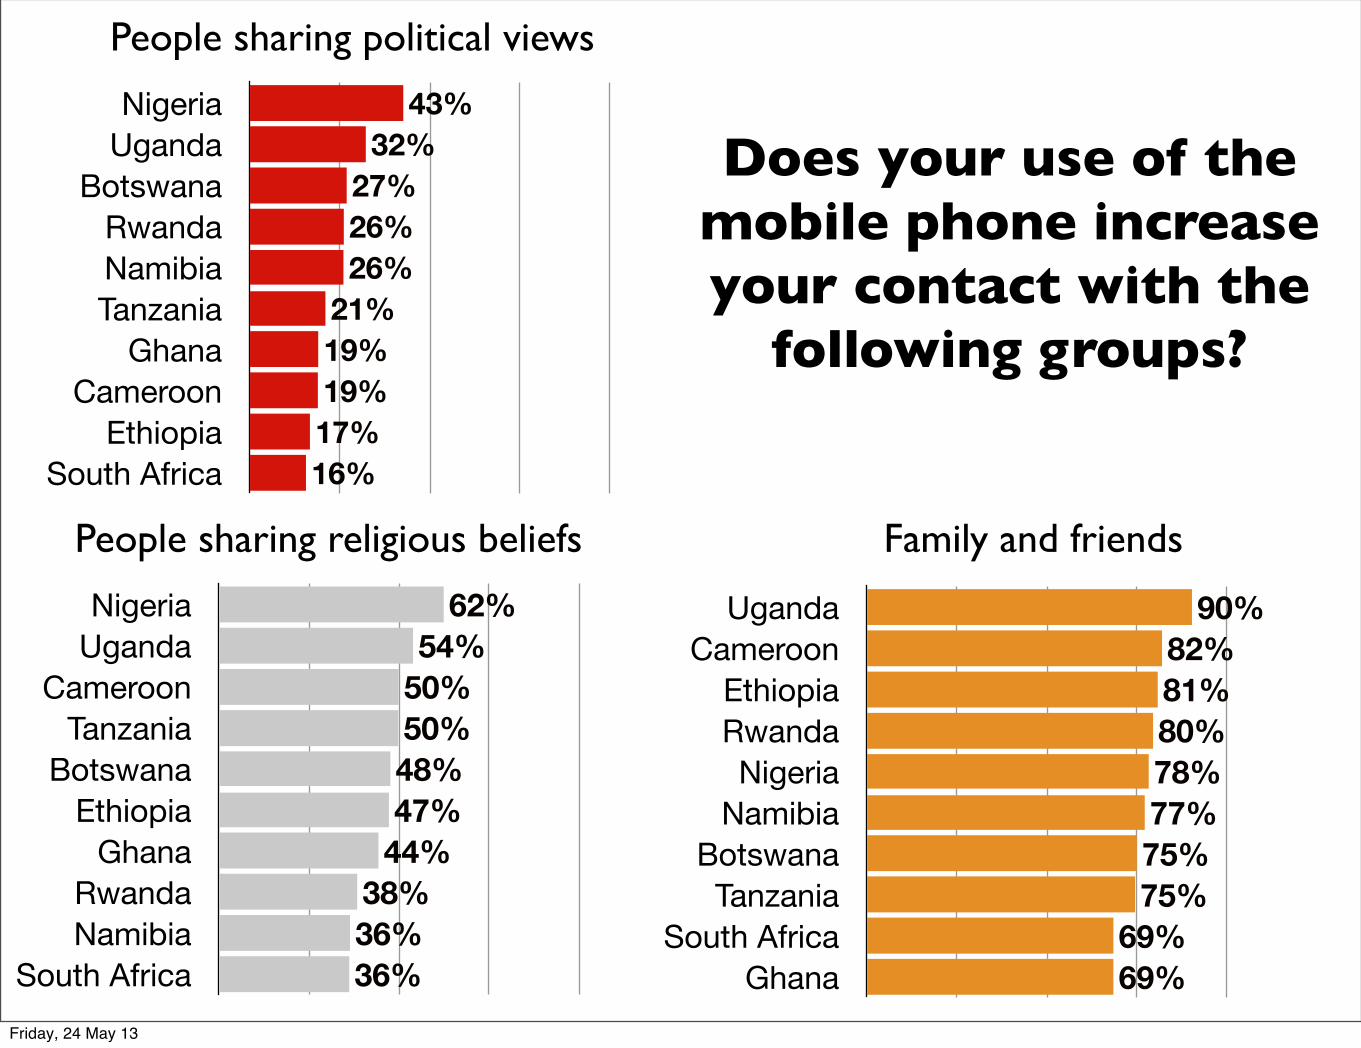
People sharing religious beliefs
Does your use of the mobile phone increase your contact with the
following groups?
UgandaCameroon
EthiopiaRwandaNigeria
NamibiaBotswana
TanzaniaSouth Africa
Ghana 69%69%
75%75%77%78%80%81%82%
90%
Family and friends
People sharing political views
NigeriaUganda
BotswanaRwandaNamibiaTanzania
GhanaCameroon
EthiopiaSouth Africa 16%
17%19%19%21%
26%26%27%
32%43%
Friday, 24 May 13
Ethiopia
South Africa
Botswana
Cameroon
Rwanda
Ghana
Tanzania
Uganda
Nigeria
Namibia 46%
49%
58%
63%
75%
77%
78%
79%
84%
89%
36%
28%
22%
22%
9%
12%
8%
11%
9%
7%
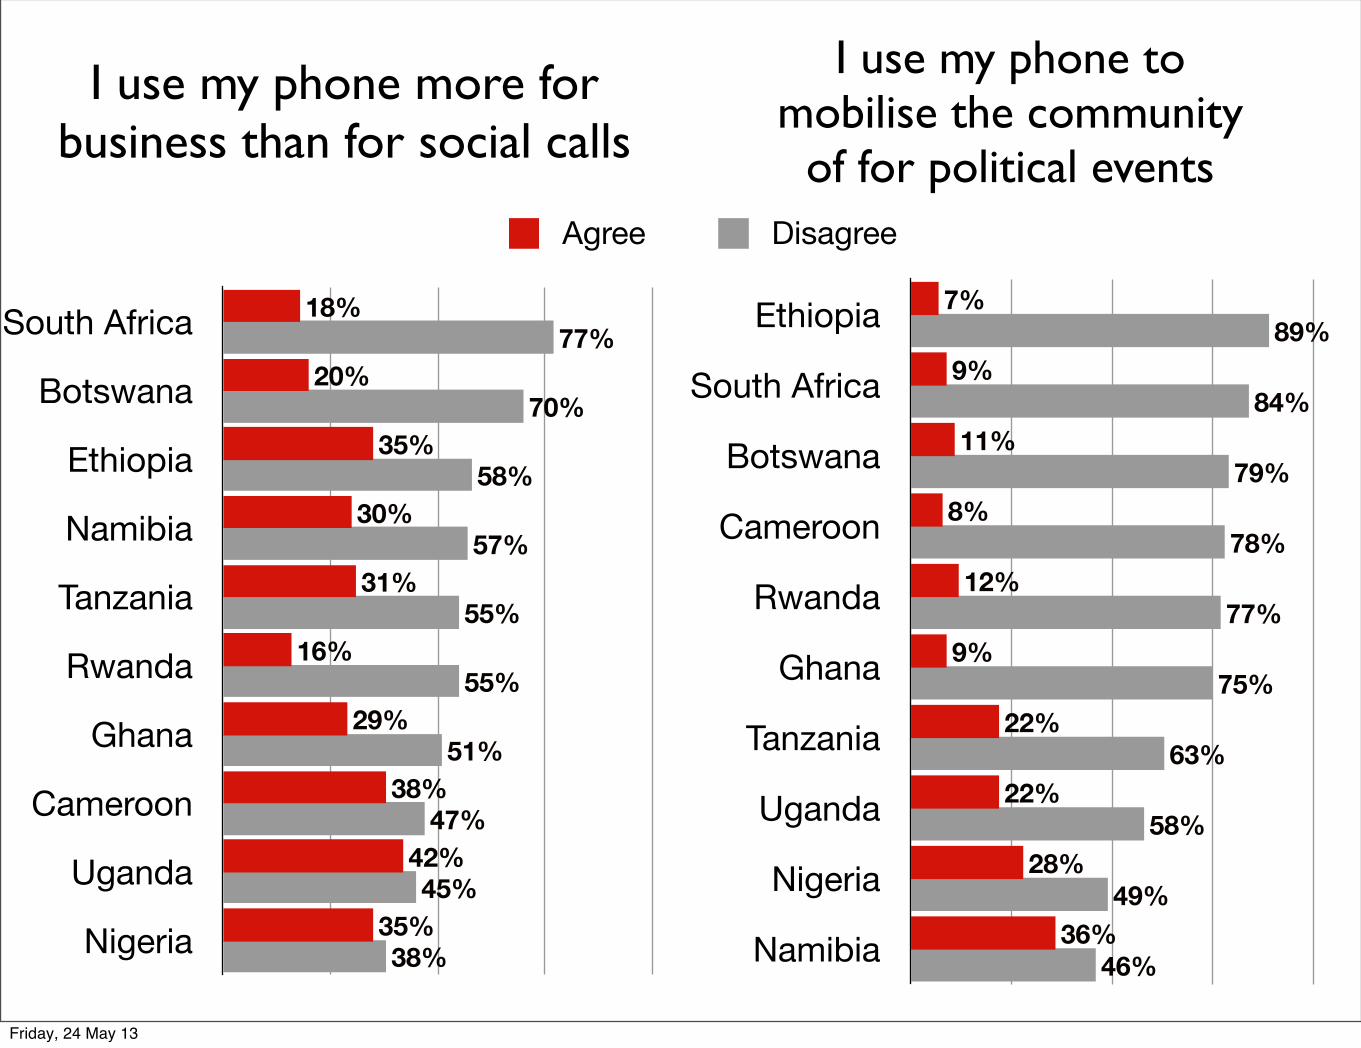
I use my phone to mobilise the community
of for political events
I use my phone more for business than for social calls
South Africa
Botswana
Ethiopia
Namibia
Tanzania
Rwanda
Ghana
Cameroon
Uganda
Nigeria 38%
45%
47%
51%
55%
55%
57%
58%
70%
77%
35%
42%
38%
29%
16%
31%
30%
35%
20%
18%
Agree Disagree
Friday, 24 May 13
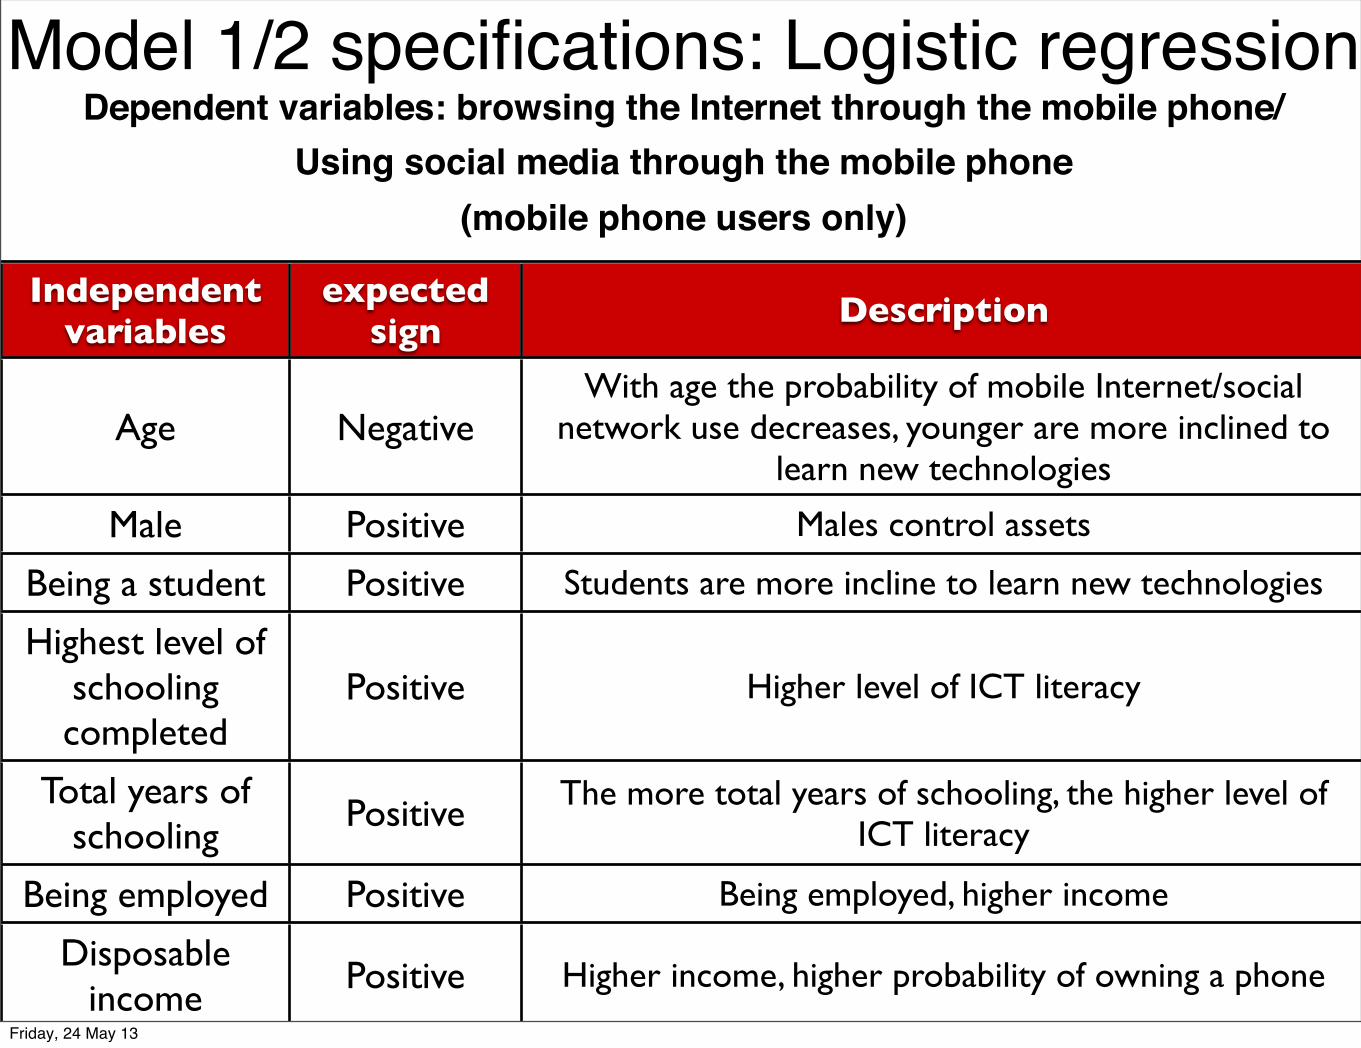
Model 1/2 specifications: Logistic regressionDependent variables: browsing the Internet through the mobile phone/
Using social media through the mobile phone(mobile phone users only)
Independent variables
expected sign
Description
Age NegativeWith age the probability of mobile Internet/social
network use decreases, younger are more inclined to learn new technologies
Male Positive Males control assets
Being a student Positive Students are more incline to learn new technologies
Highest level of schooling completed
Positive Higher level of ICT literacy
Total years of schooling
Positive The more total years of schooling, the higher level of ICT literacy
Being employed Positive Being employed, higher income
Disposable income
Positive Higher income, higher probability of owning a phoneFriday, 24 May 13

Independent variables
expected sign
Description
Religious group Positive Religious groups presence on social media
Trade union Positive Social mobilisation through social media
Cultural or political group Positive Social mobilisation through social media
Farmer association/cooperative
Negative Low level of ICT penetration between farmers
Saving club Positive Mobile Internet/Social media may be used by saving groups
Recreational group Positive Mobile Internet may help people beloning to
recreational groups to keep in touch
Model 1/2 specifications: Logistic regressionDependent variables: browsing the Internet through the mobile phone/
Using social media through the mobile phone(mobile phone users only)
Friday, 24 May 13
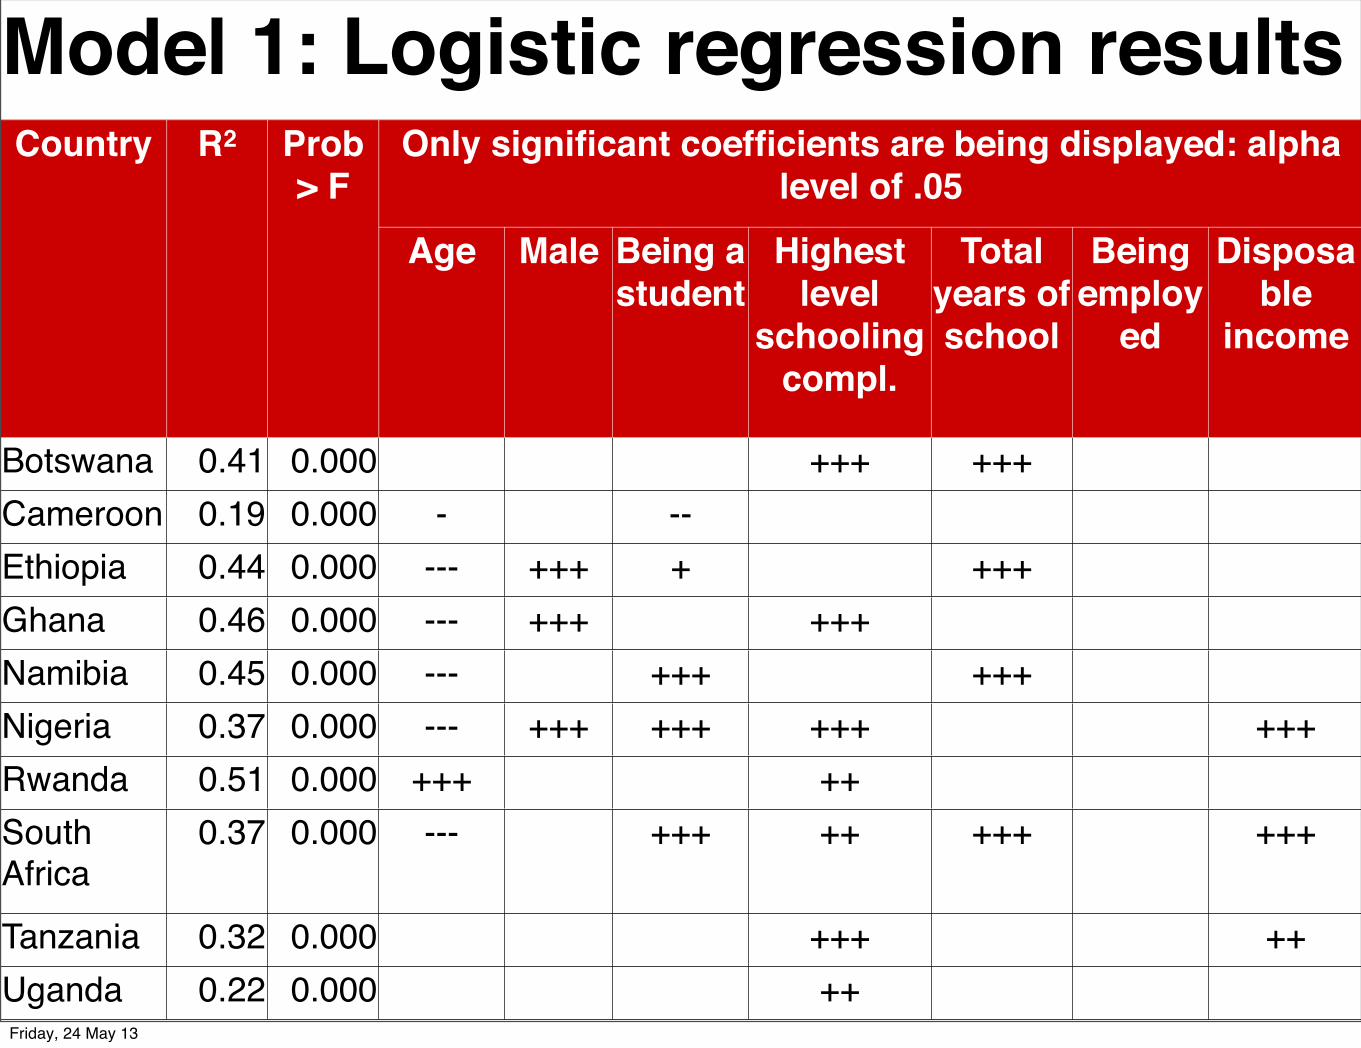
Model 1: Logistic regression resultsModel 1: Logistic regression resultsModel 1: Logistic regression resultsModel 1: Logistic regression resultsModel 1: Logistic regression resultsModel 1: Logistic regression resultsModel 1: Logistic regression resultsModel 1: Logistic regression resultsModel 1: Logistic regression resultsModel 1: Logistic regression resultsCountry R2 Prob
> FOnly significant coefficients are being displayed: alpha
level of .05Only significant coefficients are being displayed: alpha
level of .05Only significant coefficients are being displayed: alpha
level of .05Only significant coefficients are being displayed: alpha
level of .05Only significant coefficients are being displayed: alpha
level of .05Only significant coefficients are being displayed: alpha
level of .05Only significant coefficients are being displayed: alpha
level of .05Country R2 Prob
> FAge Male Being a
studentHighest
level schooling
compl.
Total years of school
Being employ
ed
Disposable
income
Botswana 0.41 0.000 +++ +++Cameroon 0.19 0.000 - --Ethiopia 0.44 0.000 --- +++ + +++Ghana 0.46 0.000 --- +++ +++Namibia 0.45 0.000 --- +++ +++Nigeria 0.37 0.000 --- +++ +++ +++ +++Rwanda 0.51 0.000 +++ ++South Africa
0.37 0.000 --- +++ ++ +++ +++
Tanzania 0.32 0.000 +++ ++Uganda 0.22 0.000 ++Friday, 24 May 13
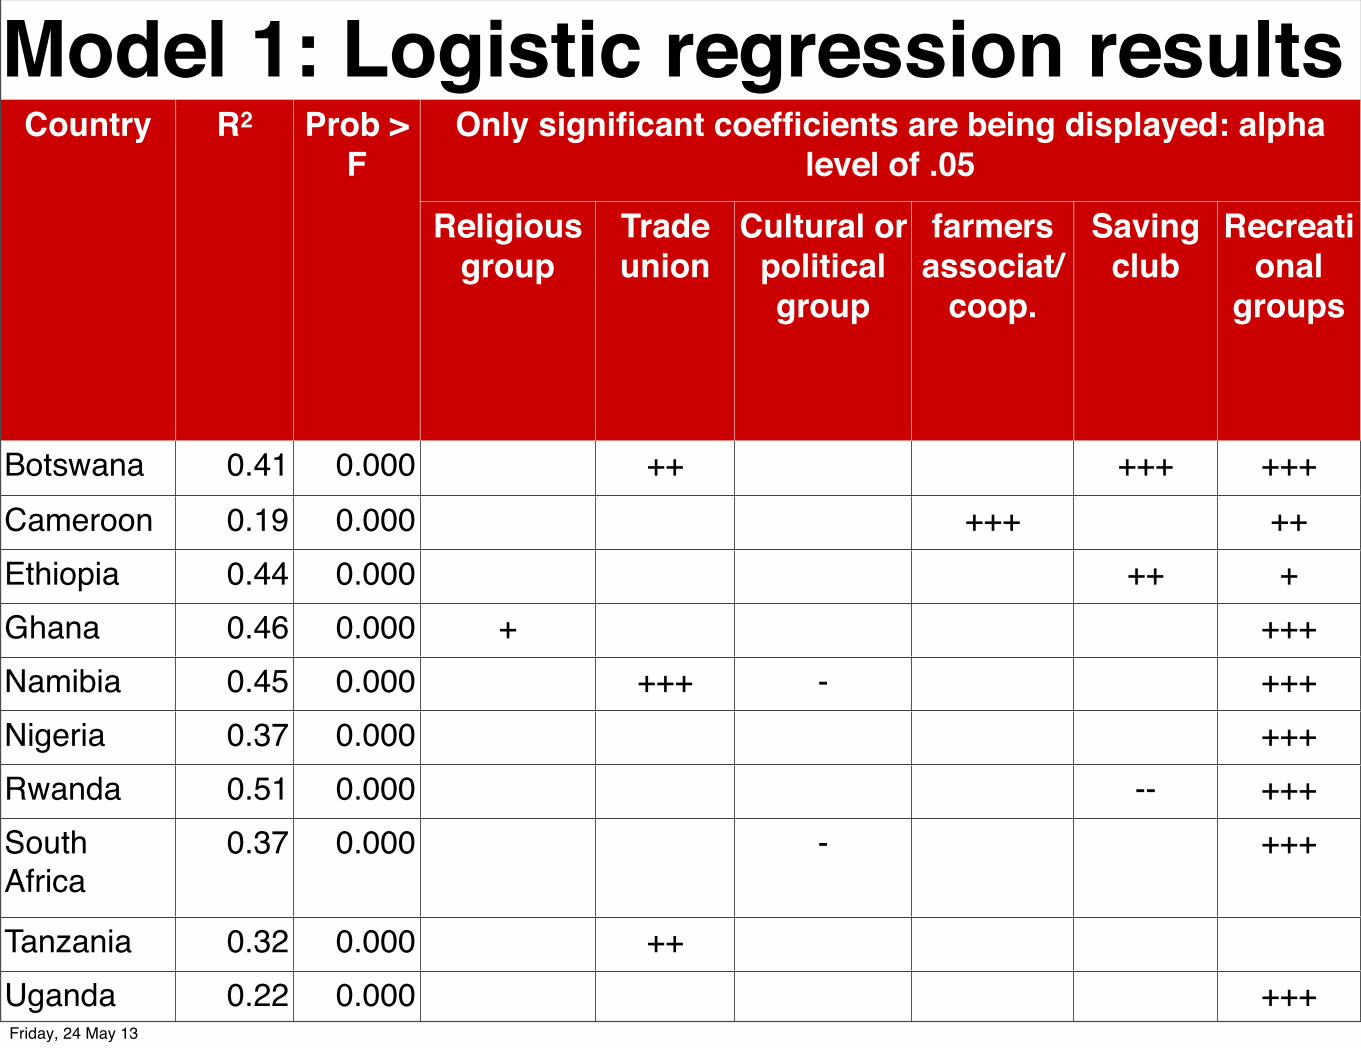
Model 1: Logistic regression resultsModel 1: Logistic regression resultsModel 1: Logistic regression resultsModel 1: Logistic regression resultsModel 1: Logistic regression resultsModel 1: Logistic regression resultsModel 1: Logistic regression resultsModel 1: Logistic regression resultsModel 1: Logistic regression resultsCountry R2 Prob >
FOnly significant coefficients are being displayed: alpha
level of .05Only significant coefficients are being displayed: alpha
level of .05Only significant coefficients are being displayed: alpha
level of .05Only significant coefficients are being displayed: alpha
level of .05Only significant coefficients are being displayed: alpha
level of .05Only significant coefficients are being displayed: alpha
level of .05Country R2 Prob >
F
Religious group
Trade union
Cultural or political group
farmers associat/
coop.
Saving club
Recreational
groups
Botswana 0.41 0.000 ++ +++ +++Cameroon 0.19 0.000 +++ ++Ethiopia 0.44 0.000 ++ +Ghana 0.46 0.000 + +++Namibia 0.45 0.000 +++ - +++Nigeria 0.37 0.000 +++Rwanda 0.51 0.000 -- +++South Africa
0.37 0.000 - +++
Tanzania 0.32 0.000 ++Uganda 0.22 0.000 +++Friday, 24 May 13

Model 2: Logistic regression resultsModel 2: Logistic regression resultsModel 2: Logistic regression resultsModel 2: Logistic regression resultsModel 2: Logistic regression resultsModel 2: Logistic regression resultsModel 2: Logistic regression resultsModel 2: Logistic regression resultsModel 2: Logistic regression resultsModel 2: Logistic regression resultsCountry R2 Prob
> FOnly significant coefficients are being displayed: alpha
level of .05Only significant coefficients are being displayed: alpha
level of .05Only significant coefficients are being displayed: alpha
level of .05Only significant coefficients are being displayed: alpha
level of .05Only significant coefficients are being displayed: alpha
level of .05Only significant coefficients are being displayed: alpha
level of .05Only significant coefficients are being displayed: alpha
level of .05Country R2 Prob
> FAge Gender
(M = 1,F = 0)
Being a student
Highest level
schooling compl.
Total years of school
Being emplo
yed
Disposable
income
Botswana 0.43 0.000 -- +++ +++ ++Cameroon 0.26 0.000 -- +
Ethiopia 0.43 0.000 --- + +++Ghana 0.45 0.000 --- +++ +++Namibia 0.45 0.000 --- +++ +++Nigeria 0.35 0.000 -- +++ ++ +++Rwanda 0.60 0.000 ++ +++ +++South Africa
0.38 0.000 --- +++ +++ +++
Tanzania 0.46 0.000 +++Uganda 0.45 0.000 --- ++ +++Friday, 24 May 13

Model 2: Logistic regression resultsModel 2: Logistic regression resultsModel 2: Logistic regression resultsModel 2: Logistic regression resultsModel 2: Logistic regression resultsModel 2: Logistic regression resultsModel 2: Logistic regression resultsModel 2: Logistic regression resultsModel 2: Logistic regression resultsCountry R2 Prob >
FOnly significant coefficients are being displayed: * =
significant at 0.1 level or above, ** = significant at 0.05 level, *** = significant at 0.01 level
Only significant coefficients are being displayed: * = significant at 0.1 level or above, ** = significant at 0.05
level, *** = significant at 0.01 level
Only significant coefficients are being displayed: * = significant at 0.1 level or above, ** = significant at 0.05
level, *** = significant at 0.01 level
Only significant coefficients are being displayed: * = significant at 0.1 level or above, ** = significant at 0.05
level, *** = significant at 0.01 level
Only significant coefficients are being displayed: * = significant at 0.1 level or above, ** = significant at 0.05
level, *** = significant at 0.01 level
Only significant coefficients are being displayed: * = significant at 0.1 level or above, ** = significant at 0.05
level, *** = significant at 0.01 level
Country R2 Prob > F
Religious group
Trade union
Cultural or
political group
farmers associat/
coop
Saving club
Recreational
groups
Botswana 0.43 0.000 +++ +++Cameroon 0.26 0.000 -- ++ +++
Ethiopia 0.43 0.000 -- +Ghana 0.45 0.000 - +++Namibia 0.45 0.000 +++Nigeria 0.35 0.000 +++ +++Rwanda 0.60 0.000 +++ -- -- +++South Africa
0.38 0.000 -- ++
Tanzania 0.45 0.000 ++Uganda 0.45 0.000 +++Friday, 24 May 13

Conclusions (1/2)The mobile is closing the voice and the data gap in AfricaSocial media through mobile phone reduces the cost of communicationUsers get connected to social media through the mobile phone to keep in touch with family and friends or for entertainmentMobile phone usage increases contacts with family & friends, but
no significant evidence to increase contacts with political groupsno significant evidence of using the phone for mobilising the community or for political events
Friday, 24 May 13
Conclusions (2/2)Very little evidence was found of using mobile media through the phone for social mobilisation or to keep in touch with political organisationsTo be a student and highest level of education achieved were found to be the most significant predictors, together with being male and with a higher disposable income in four countries (Nigeria, Rwanda, SA, Tanzania)Be associated to a recreational network was the only significant positive predictor regarding social affiliations
Friday, 24 May 13
RecommendationsReform strategies to increase competition will lower prices and lead to better and faster access:
Spectrum re-farming to issue LTE spectrumIssue more and converged licences (Ethiopia)Require reselling of fixed-broadband (ADSL), for it to become cheaper and to compete with mobile broadband
Censorship of the Internet in countries where the Internet take up is slow or constrained by high prices of broadband and data may impact on the development of the mobile Internet sector
Friday, 24 May 13

Thank youwww.researchICTafrica.netUniversity of Cape Town,
Graduate School of Business
USC Annenberg School of Communication
Friday, 24 May 13