Embed Size (px)
Citation preview
PREDICTORS AND INDICATORS OF MAXIMAL SPRINT
PERFORMANCE
by
FRANCESCA PICCHI-WILSON
A THESIS
Presented to the Department of Human Physiology
and the Robert D. Clark Honors College in partial fulfillment of the requirements for the degree of
Bachelor of Science
June 2017

ii
An Abstract of the Thesis of
Francesca Picchi-Wilson for the degree of Bachelor of Science in the Department of Human Physiology to be taken June 2017
Title: Predictors and Indicators of Maximal Sprint Performance
Approved: _______________________________________
Mike Hahn
Many different anthropometric, physiological, and biomechanical factors
contribute to human sprinting performance, but only a few can be reasonably measured
on the field. To understand which of these measureable factors best explain sprinting
velocity, we examined the relationship between sprinting kinematics, measures of joint
power, strength, and anthropometrics and running time. Kinematic data was collected
using 2D motion capture during a 60m run at a maximal sprint, 90% of max, 75% of
max, and 60% of max. These data were used to calculate tibia angle with respect to
horizontal and foot angle with respect to vertical during both the heel strike and toe off
phases of gait. A step-wise linear regression was run to determine the predictive
capability of sprinting kinematics (at a submaximal pace) for maximal sprint time.
Another regression was run to determine the predictive capability of measures of
strength and power on maximal sprint time. Results indicated that broad jump, left hip
flexion, and foot angle at toe off when running at 75% of max were predictive of
maximal sprint time. This information can provide coaches, trainers, and athletes with
information about how to obtain the most predictive data for improvement of sprinting
performance.

iii
Acknowledgements
I would like to give a special thanks to Mike Hahn for allowing me the
opportunity to work in the Bowerman Sports Science Clinic for the last two years. Not
only for the opportunity but also the massive amounts of patience and advice in helping
me design this project. I would also like to thank Jake Hinkel-Lipsker for his
willingness to teach, his extensive knowledge of SPSS, and his sense of humor that
made this project not only possible but enjoyable.
I am also extremely grateful to all other members of the BSSC that have shared
both their time, space, and knowledge with me over the last few years.

iv
Table of Contents
Introduction 1 Background and Literature Review 4
Subjects 6 Experimental Setup 6 Protocol 7 Data Analysis 9 Statistical Analysis 10
Results 12 Discussion 18 Limitations 21 Conclusion 22 Appendix 23
Variables Measured 23 IRB Approval 24 Research Plan 25 Consent Form 31 Data Sheet 35 Confirmation Email 37
Bibliography 38
v
List of Figures
Figure 1: Using Dartfish to analyze tibial angle with respect to ground (horizontal). 10 Figure 2: Using Dartfish to analyze foot angle with respect to vertical. 10 Figure 3: Correlation between maximal sprint time (s) and broad jump (cm). 15 Figure 4: Correlation between left hip flexion torque (N*m) and maximal sprint time (s). 16 Figure 5: Correlation between foot angle at toe off during 75% run (deg) and maximal sprint time (s). 17
vi
List of Tables
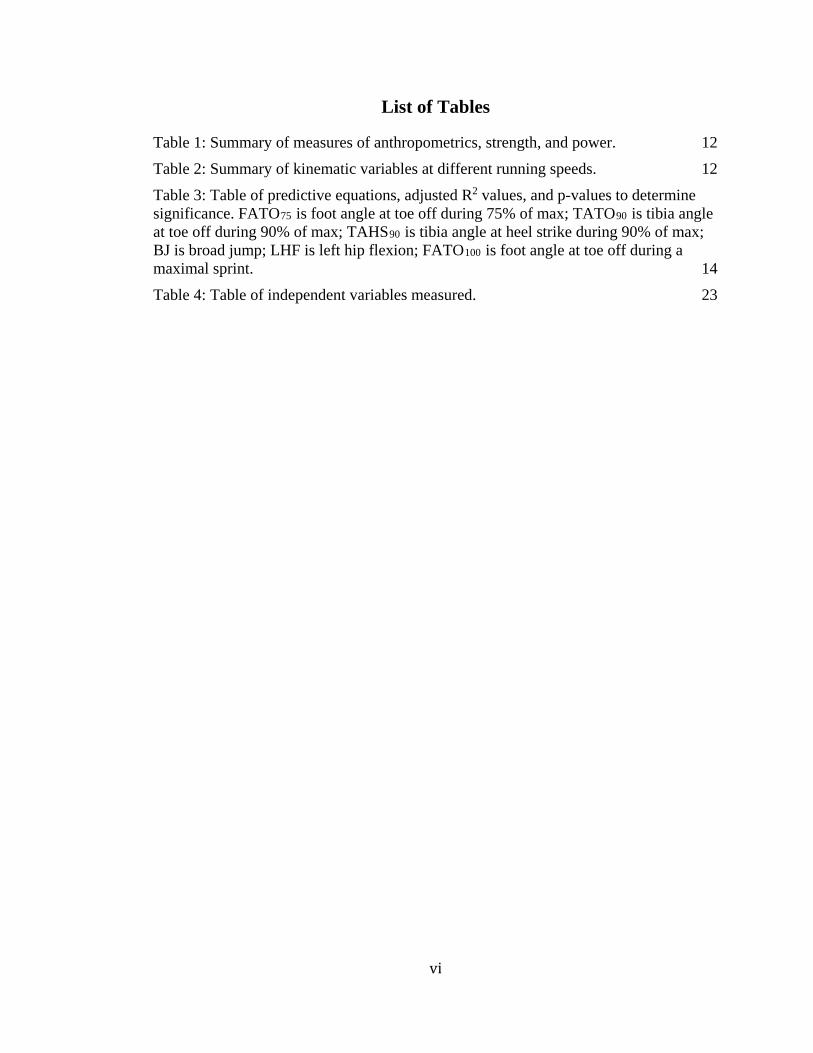
Table 1: Summary of measures of anthropometrics, strength, and power. 12 Table 2: Summary of kinematic variables at different running speeds. 12 Table 3: Table of predictive equations, adjusted R2 values, and p-values to determine significance. FATO75 is foot angle at toe off during 75% of max; TATO90 is tibia angle at toe off during 90% of max; TAHS90 is tibia angle at heel strike during 90% of max; BJ is broad jump; LHF is left hip flexion; FATO100 is foot angle at toe off during a maximal sprint. 14 Table 4: Table of independent variables measured. 23
Introduction
The improvement of an athlete’s technique necessitates a biomechanical
understanding of every aspect of sprint running. This information can then help
coaches, trainers, and other professionals design training programs to improve an
athlete’s biomechanical sprinting technique. Sprinting is considered a cyclic skill, where
the coordination and timing of body movements occur in repeated cycles (McGinnis,
2013). It is also a continuous, gross movement, meaning that the beginning and the end
of sprint gait cycle are arbitrary and that multiple limbs are involved. Most literature
and educational resources define one sprint gait cycle as the time between when the heel
on one foot strikes the ground and the subsequent heel strike on the same foot
(Novacheck, 1998).
Multiple spatiotemporal factors seem to be related to faster sprinting. For
example, a faster sprinter has a faster average horizontal velocity during each step of
their sprint, compared to slower runners (McGinnis, 2013). Also, the average velocity
of a sprinter can be determined by average stride length, or the horizontal displacement
of a person’s limb from one step to the next, and average step frequency. Horizontal
displacement during the support phase (when the foot is in contact with the ground) can
be explained by the touchdown distance (how far behind the foot the sprinter’s center of
gravity is at touchdown) and takeoff distance (how far ahead the center of gravity is
ahead of the foot at takeoff). During flight phase, or when both feet are not in contact
with the ground, horizontal displacement is affected by the horizontal velocity of the
sprinter at takeoff and the amount of time spent in the air (McGinnis, 2013). Horizontal
velocity at takeoff is affected in turn by braking force generated during the preceding
2
stance phase, horizontal displacement, and propulsive force (McGinnis, 2013).
Rapid movement of the body is required during sprinting. In terms of the
velocity-time curve, there are four phases of a sprint: the start, the acceleration phase,
the velocity maintenance phase, and the deceleration phase (Mero et al., 1992). Most
existing research on sprinting technique focuses primarily on the velocity maintenance
phase. The velocity maintenance phase may be most important to total sprint
performance as this is the period of time when most sprinters are attempting to maintain
their maximal velocity (Mero et al., 1992). In theory, during the velocity maintenance
phase, the sprinter has found her or his cadence, and strides are similar kinetically,
making this phase an indicator of maximal sprint performance.
It is important to identify specific temporal phases within the gait cycle that are
critical to performance and can be individually used to analyze running form. Souza
(2016) analyzed the following key phases: 1) end of swing phase, or the point in time
right before initial contact of the foot with the running surface, 2) initial contact, when
the foot first strikes the ground, 3) loading response, when the runner’s body weight is
transferred to the lead leg, 4) toe off, where the contact leg is now behind the body and
propels the body forward. The angles created by the tibia and foot during initial contact
(heel strike), as well as the angles created by the tibia and foot at toe off are valuable
indicators of stride mechanics (Souza, 2016).
In total, increasing an individual’s step frequency and stride length leads to an
increase in running velocity, as previous research has demonstrated a strong correlation
between these variables (McGinnis, 2013). However, it often takes 40-60m for a
sprinter to reach her or his maximum velocity, making overground sprinting challenging

3
to measure in a research laboratory. On the other hand, biomechanical measurement of
sprinting performance outside of a research laboratory can also be challenging due to a
lack of access to high-end research equipment. It is therefore necessary to find which
biomechanical measurements can be used as out-of-laboratory surrogates. This would
allow athletes, coaches, and other sport professionals to accurately measure sprint
performance when access to a research laboratory is not possible.

4
Background and Literature Review
The measurement of an individual’s sprinting ability is of importance in the
fields of motor development, sport performance, and athletic recruitment. From a motor
development standpoint, researchers have observed biomechanical changes in young
sprinters as they progress through adolescence and into adulthood. For example,
sprinting speed is maximized in adolescents around the time when they reach post peak
height velocity (PHV), the period of time when their fastest growth spurt is occurring.
(Meyers et al., 2015; Philippaerts et al., 2006).
Previous studies performed in laboratory settings have examined the alterations
in sprint mechanics during both submaximal and maximal sprints, and revealed that at
higher speeds there is a larger increase in stride rate rather than stride length, suggesting
that the optimal strategy to increase sprinting velocity seems to be increasing stepping
frequency (Meyers et al., 2015; Rumpf and Cronin, 2015). Furthermore, there seems to
be a relationship between various proxy measures of force and power production and
sprinting performance. For example, a strong correlation exists between maximal
vertical jump, horizontal jump, and jump squat performance and 100m sprint time
(Bissas and Havenetidis, 2008).
Taken together, these previous studies demonstrate that while there are various
predictors of sprint performance within the laboratory setting, there is a need for
coaches, trainers, and scouts to be able to make measurements with simple tools. In a
real-world setting, coaches, trainers and athletes do not have access to high-end
laboratory equipment, making these measurements difficult to obtain. Therefore, it is
necessary to determine which measurements which can be measured in the field, can
5
help to predict sprinting performance. Such a determination would allow these
measurements to be used to assess athlete potential or identify possible areas to train
athletes for increases in sprint performance.
The first purpose of this current study was to determine the ability of
anthropometrics, lower-limb kinematics, and measures of power and strength to predict
sprint performance. Second, this study sought to determine whether the predictive
power of these variables change at different submaximal sprinting levels. It was
hypothesized that (1) step-wise regression models of anthropometric, power, strength,
and kinematic measures from submaximal speeds would explain the majority of the
variance (R2 > 0.7) in time for a 60 meter maximal sprint time and (2) one measured
variable would significantly predict maximal sprint time.
6
Methods
Subjects
Eleven subjects (6 male, 5 females, age 22.45 ± 2.63, weight 70.37 ± 11.85 kg,
height 174.13 ± 9.25 cm) were recruited from the University of Oregon community, and
were active with a self-report of moderate to high running experience. Subjects were
included if they were between the ages of 18 and 50 and capable of sprinting for short
distances repeatedly for up to 30 minutes. Exclusion criteria included: 1) any self-
reported conditions that could impair sprinting ability, including and lower limb injuries
within the last 6 months, or any chronic pain that would prevent them from comfortably
completing the study; 2) any cardiovascular or neurological ailments that would put
individuals at an increased risk while completing the study. Subjects were briefed on the
purpose of this study as well as the experimental procedure and signed a consent form
prior to participating. The Institutional Review Board at the University of Oregon
approved this study.
Experimental Setup
Subjects were asked to attend two days of testing for this study. On the first day,
anthropometric, strength, and power measurements were collected. On the second day,
sprint performance measures of strength were measured using a Biodex dynamometer
(Biodex Medical Systems, New York, NY). This system isolates a muscle group of
interest and measures maximal isometric torque produced. Maximum vertical jump
height, representing a measure of vertical power production, was measured by using a
Vertec Jump Training System (Sports Imports, Hilliard, OH). Participants were
instructed to jump off two feet and touch a series of slats spaced 1/2 inch apart,
7
vertically. Vertical jump height was measured as the distance between the highest slat
touched and the lowest slat, which was set to the individual’s highest standing reach.
The broad jump was used as a measure of horizontal power production and was
assessed by asking the participant to jump the farthest horizontal distance possible off
two feet, and measuring the distance between take-off and landing.
Heart rate was measured during the second session using a heart rate monitor
(Polar USA, Lake Success, NY) fitted around the chest to ensure that each participant
reached a target heart rate and was able to continue with the protocol safely. Heart rate
was monitored during the warmup and noted after the warm up was completed. Goal
heart rate for warmup was approximately 50 to 60% of max heart rate (220 bpm minus
age). After each sprint, heart rate was allowed to return to around the post warmup heart
rate before completing the next time trial.
A high-speed digital camera (GC-PX100BU, JVCENWOOD Corporation,
Wayne, NJ) positioned at approximately 50m from the starting point and in the sagittal
plane of the runner was used to record a video of one maximal velocity stride, as
previous research has demonstrated that it takes approximately 40m to accelerate to
maximum velocity.
Protocol
During the first session of the experiment, participants’ height, weight, age, and
leg lengths were recorded. Subjects were then asked to perform measures of strength
using the Biodex dynamometer: maximal isometric hip flexion and extension for each
leg at 45 degrees, and isometric ankle plantar flexion at 15 degrees. Subjects were
placed in a standing position, with the limb to be tested elevated off the ground at 45
8
degrees of hip flexion. While testing plantar flexion, the subject was seated in the
Biodex chair, with the hip at approximately 75 degrees and the knee at approximately
30 degrees. Subjects were instructed to maximally contract against the pad for five
seconds, with a rest period of five seconds between each trial for a total of three trials
per motion. Hip flexion and extension torque were measured first, followed by plantar
flexion torque.
Additionally, two measures of power production were collected. First, to
measure vertical power production, each participant was asked to perform three vertical
jumps using the Vertec system described above with as much rest as needed between
each jump. Second, participants were asked to perform three standing broad jumps as
described above in order to measure horizontal power production.
For the second session of the experiment, subjects were first asked to go through
a ten-minute warmup protocol of their own choosing or were given the following: a
warmup 100m jog followed by dynamic stretching (high knee walk, high knees running,
high heels running, lateral lunges, lateral leg swings, and skipping) and two more 100m
runs at a pace just above a jog. After warming up, subjects were asked to perform the
maximal sprints with a rest period between each trial lasting the amount of time it took
for their heart rate to return to approximately similar to the post warmup heart rate.
Next, subjects were asked to perform three randomized sets of submaximal sprints
(60%, 75%, or 90%) after being given a time goal to complete a 60m sprint. The target
percent of max was calculated based off the average maximal speed using the following
equations:
1. 𝐴𝐴𝐴𝐴𝐴𝐴𝐴𝐴𝐴𝐴𝐴𝐴𝐴𝐴 𝑚𝑚𝐴𝐴𝑚𝑚𝑚𝑚𝑚𝑚𝐴𝐴𝑚𝑚 𝑠𝑠𝑠𝑠𝐴𝐴𝐴𝐴𝑠𝑠100 �𝑚𝑚𝑠𝑠� = 60 𝑚𝑚
𝑎𝑎𝑎𝑎𝑎𝑎𝑎𝑎𝑎𝑎𝑎𝑎𝑎𝑎 𝑡𝑡𝑡𝑡𝑚𝑚𝑎𝑎 (𝑠𝑠)
9
2. 𝑇𝑇𝐴𝐴𝐴𝐴𝐴𝐴𝐴𝐴𝑇𝑇 𝐴𝐴𝐴𝐴𝐴𝐴𝐴𝐴𝐴𝐴𝐴𝐴𝐴𝐴 𝑠𝑠𝑠𝑠𝐴𝐴𝐴𝐴𝑠𝑠 �𝑚𝑚𝑠𝑠� = 𝐴𝐴𝐴𝐴𝐴𝐴𝐴𝐴𝐴𝐴𝐴𝐴𝐴𝐴 𝑚𝑚𝐴𝐴𝑚𝑚𝑚𝑚𝑚𝑚𝐴𝐴𝑚𝑚 𝑠𝑠𝑠𝑠𝐴𝐴𝐴𝐴𝑠𝑠100 ∗
𝑠𝑠𝐴𝐴𝐴𝐴𝑝𝑝𝐴𝐴𝑝𝑝𝑇𝑇 𝑚𝑚𝐴𝐴𝑚𝑚
3. 𝑇𝑇𝐴𝐴𝐴𝐴𝐴𝐴𝐴𝐴𝑇𝑇 𝑇𝑇𝑚𝑚𝑚𝑚𝐴𝐴 (𝑠𝑠) = 60 𝑚𝑚𝑡𝑡𝑎𝑎𝑎𝑎𝑎𝑎𝑎𝑎𝑡𝑡 𝑎𝑎𝑎𝑎𝑎𝑎𝑎𝑎𝑎𝑎𝑎𝑎𝑎𝑎 𝑠𝑠𝑠𝑠𝑎𝑎𝑎𝑎𝑠𝑠 (𝑚𝑚𝑠𝑠 )
where time was the time to sprint 60 m (in seconds) and percent max was either
0.60 (60%), 0.75 (75%), or 0.90 (90%) depending on the trial. The trial for each
percentage of max with the time closest to the target time was used for analysis.
Data Analysis
High-speed video was recorded at 240 Hz and exported to Dartfish (Dartfish,
Fribourg, Switzerland), a two-dimensional motion analysis software package. Within
this software, the angle of the tibia with respect to the ground (horizontal) and angle of
the foot with respect to vertical were calculated for each trial. Data for submaximal
speeds were collected only from the trial closest to the target time calculated above.
Maximal sprint kinematic data were collected from the trial with time that was closest
to the average maximal sprint time.
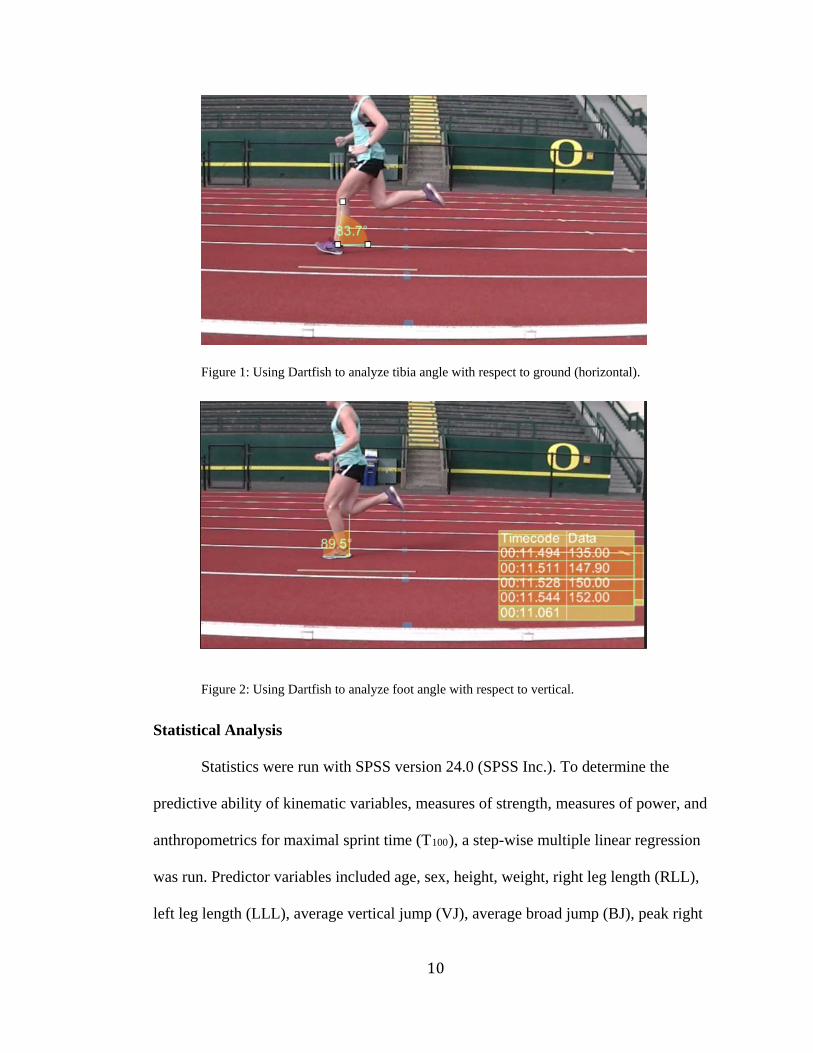
The lateral malleolus and lateral condyle of the femur were used to calculate the
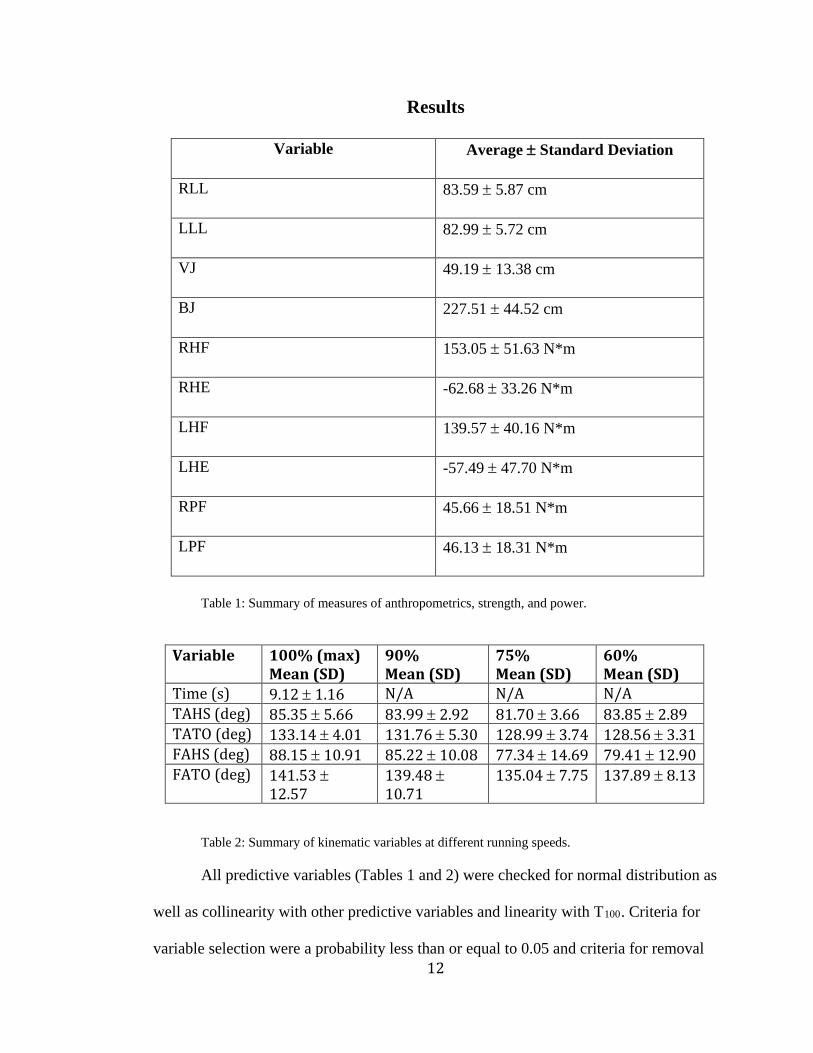
angle of the tibia with respect to horizontal (Figure 1). The heel of the shoe and the toe
of the shoe were used to measure the angle of the foot with respect to vertical (Figure
2).
10
Figure 1: Using Dartfish to analyze tibia angle with respect to ground (horizontal).
Figure 2: Using Dartfish to analyze foot angle with respect to vertical.
Statistical Analysis
Statistics were run with SPSS version 24.0 (SPSS Inc.). To determine the
predictive ability of kinematic variables, measures of strength, measures of power, and
anthropometrics for maximal sprint time (T100), a step-wise multiple linear regression
was run. Predictor variables included age, sex, height, weight, right leg length (RLL),
left leg length (LLL), average vertical jump (VJ), average broad jump (BJ), peak right

11
hip flexion torque (RHF), peak left hip flexion torque (LHF), peak right hip extension
(RHE), left hip extension (LHE), right plantar flexion (RPF), left plantar flexion (LPF),
tibial angle at heel strike (TAHS), tibial angle at toe off (TATO), foot angle at heel
strike (FAHS), and foot angle at toe off (FATO). Kinematic data (TAHS, TATO,
FAHS, FATO) was included in the data set for each percent of maximal sprint
(TAHS100, TAHS90, TAHS75, TAHS60, TATO100, TATO90, TATO75, TATO60,
FAHS100, FAHS90, FAHS75, FAHS60, FATO100, FATO90, FATO75, FATO60) while all
other variables were the same for each of the speed trials.
There were a total of six significant predictive equations for six different
models. Equation 1 used all kinematic variables from submaximal trials to predict max
sprint time (T100). Equation 2 used all anthropometric, strength, and power measures to
predict max sprint time (T100). Equation 3 used all measures of strength, power,
anthropometrics, as well as kinematic measures from the max sprint trial to predict max
sprint time (T100). Equation 4 used all measures of strength, power, and
anthropometrics, as well as kinematic measures from 90% trials to predict max sprint
time (T100). Equation 5 used all measures of strength, power, and anthropometrics as
well as kinematic measures from 75% trials to predict max sprint time (T100). Equation
6 used all measures of strength, power, anthropometrics, and kinematic measures from
60% trials to predict max sprint time (T100).
12
Results
Variable Average ± Standard Deviation
RLL 83.59 ± 5.87 cm
LLL 82.99 ± 5.72 cm
VJ 49.19 ± 13.38 cm
BJ 227.51 ± 44.52 cm
RHF 153.05 ± 51.63 N*m
RHE -62.68 ± 33.26 N*m
LHF 139.57 ± 40.16 N*m
LHE -57.49 ± 47.70 N*m
RPF 45.66 ± 18.51 N*m
LPF 46.13 ± 18.31 N*m
Table 1: Summary of measures of anthropometrics, strength, and power.
Variable 100% (max)
Mean (SD) 90% Mean (SD)
75% Mean (SD)
60% Mean (SD)
Time (s) 9.12 ± 1.16 N/A N/A N/A TAHS (deg) 85.35 ± 5.66 83.99 ± 2.92 81.70 ± 3.66 83.85 ± 2.89 TATO (deg) 133.14 ± 4.01 131.76 ± 5.30 128.99 ± 3.74 128.56 ± 3.31 FAHS (deg) 88.15 ± 10.91 85.22 ± 10.08 77.34 ± 14.69 79.41 ± 12.90 FATO (deg) 141.53 ±
12.57 139.48 ± 10.71
135.04 ± 7.75 137.89 ± 8.13
Table 2: Summary of kinematic variables at different running speeds.
All predictive variables (Tables 1 and 2) were checked for normal distribution as
well as collinearity with other predictive variables and linearity with T100. Criteria for
variable selection were a probability less than or equal to 0.05 and criteria for removal
13
were a probability greater or equal than 0.1. Variables with collinearity greater than 0.7
were removed as were variables which were not linear with T100 with a correlation less
than 0.3. The final, most significant predictors as shown in Table 3 were FATO75
TATO90, TATO90, TAHS90, BJ, and LHF.
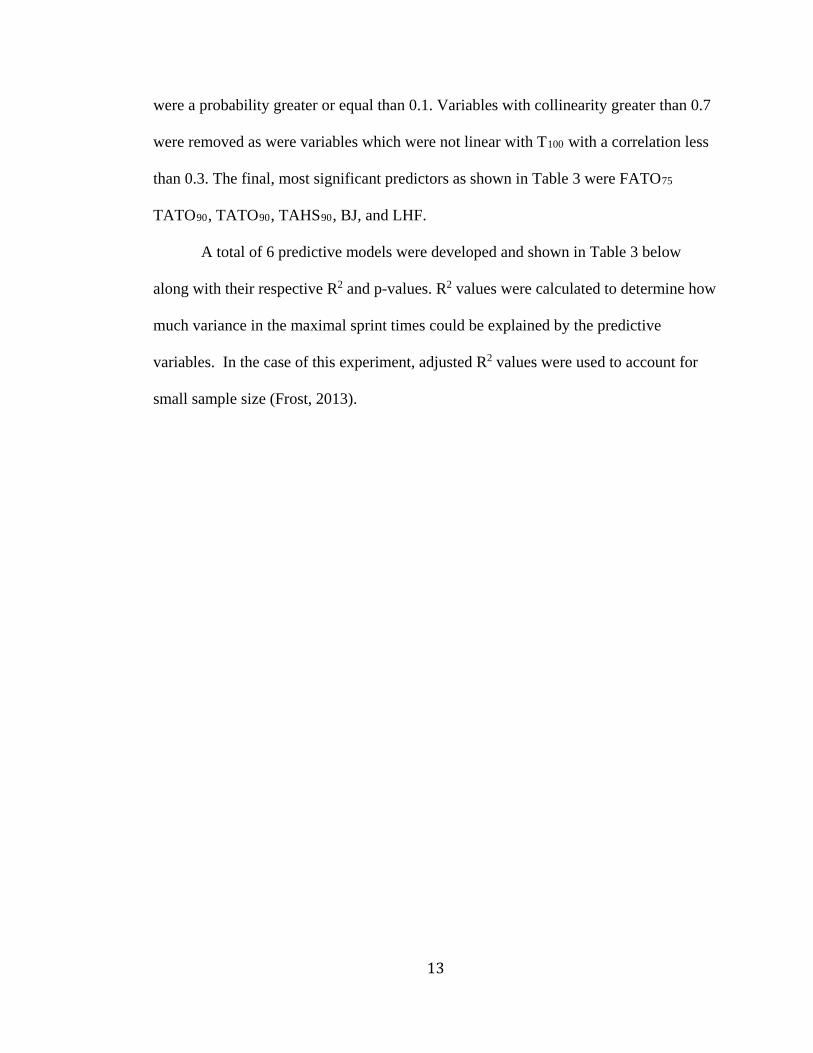
A total of 6 predictive models were developed and shown in Table 3 below
along with their respective R2 and p-values. R2 values were calculated to determine how
much variance in the maximal sprint times could be explained by the predictive
variables. In the case of this experiment, adjusted R2 values were used to account for
small sample size (Frost, 2013).
14
Table 3: Table of predictive equations, adjusted R2 values, and p-values to determine
significance. FATO75 is foot angle at toe off during 75% of max; TATO90 is tibia angle
at toe off during 90% of max; TAHS90 is tibia angle at heel strike during 90% of max;
BJ is broad jump; LHF is left hip flexion; FATO100 is foot angle at toe off during a
maximal sprint.
EQ Predictive Model Adjusted R2 Significance
Eq 1
𝑇𝑇100
= 50.187 − 0.058𝐹𝐹𝐴𝐴𝑇𝑇𝐹𝐹75 − 0.118𝑇𝑇𝐴𝐴𝑇𝑇𝐹𝐹90
− 0.210𝑇𝑇𝐴𝐴𝑇𝑇𝑇𝑇90
0.860
0.001
Eq 2 𝑇𝑇100 = 14.859 − 0.020𝐵𝐵𝐵𝐵 − 0.008𝐿𝐿𝑇𝑇𝐹𝐹 0.904 < 0.001
Eq 3
𝑇𝑇100
= 17.587 − 0.018𝐵𝐵𝐵𝐵 − 0.008𝐿𝐿𝑇𝑇𝐹𝐹
− 0.023𝐹𝐹𝐴𝐴𝑇𝑇𝐹𝐹100
0.966
< 0.001
Eq 4 𝑇𝑇100 = 14.859 − 0.02𝐵𝐵𝐵𝐵 − 0.008𝐿𝐿𝑇𝑇𝐹𝐹 0.904 < 0.001
Eq 5
𝑇𝑇100
= 19.936 − 0.16𝐵𝐵𝐵𝐵 − 0.008𝐿𝐿𝑇𝑇𝐹𝐹
− 0.045𝐹𝐹𝐴𝐴𝑇𝑇𝐹𝐹75
0.974
< 0.001
Eq 6 𝑇𝑇100 = 14.859 − 0.020𝐵𝐵𝐵𝐵 − 0.008𝐿𝐿𝑇𝑇𝐹𝐹 0.904 < 0.001
15
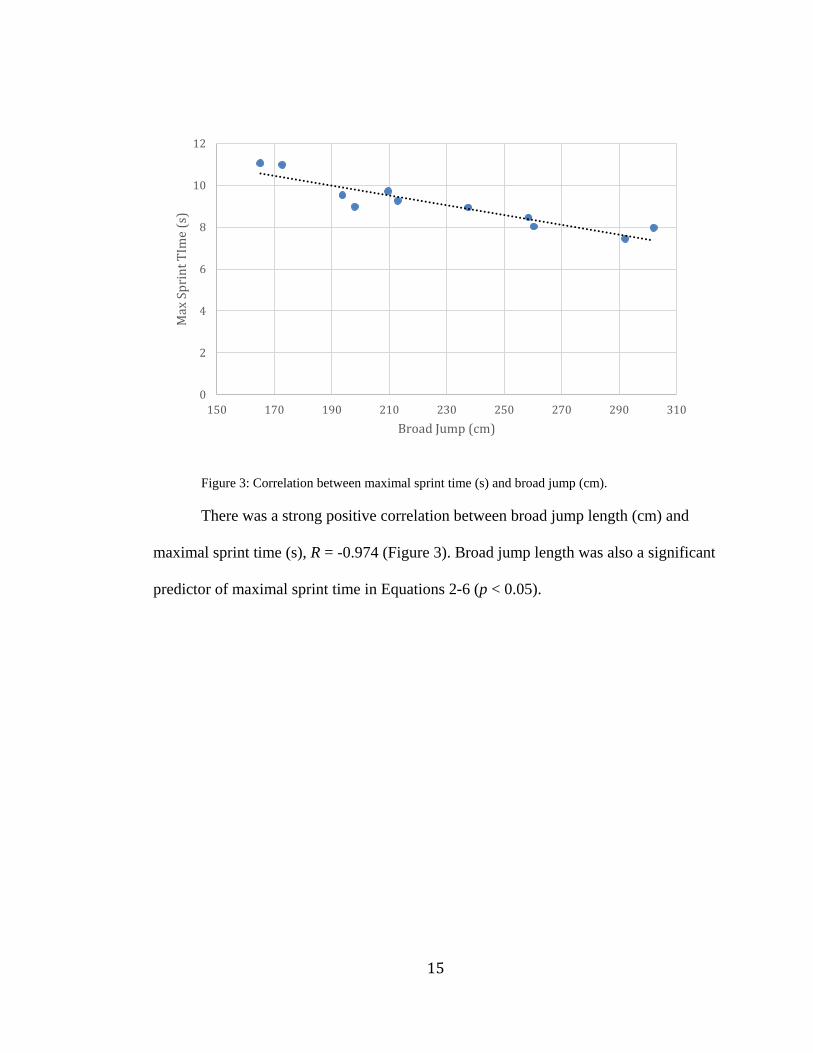
Figure 3: Correlation between maximal sprint time (s) and broad jump (cm).
There was a strong positive correlation between broad jump length (cm) and
maximal sprint time (s), R = -0.974 (Figure 3). Broad jump length was also a significant
predictor of maximal sprint time in Equations 2-6 (p < 0.05).
0
2
4
6
8
10
12
150 170 190 210 230 250 270 290 310
Max
Spr
int T
Ime
(s)
Broad Jump (cm)
• • ································• . ..................... .. . . . .. •·····················•·······

16
Figure 4: Correlation between left hip flexion torque (N*m) and maximal sprint time
(s).
There was a medium inverse correlation between torque produced by the left hip
(N*m) and maximal sprint time (s), R = -0.625 (Figure 4). Left hip torque was also a
significant predictor of maximal sprint time in Equations 2-6 (p < 0.05).
0
2
4
6
8
10
12
80 100 120 140 160 180 200
Max
Spr
int T
ime
(s)
Left Hip Flexion Torque (N*m)
• • • • • •••••••••.•••••••• ' ••••••••• ·11· ••••••••• ········' ········' •••• ••••• ···11 ........ · ••••••• .. ... .
• • •
17
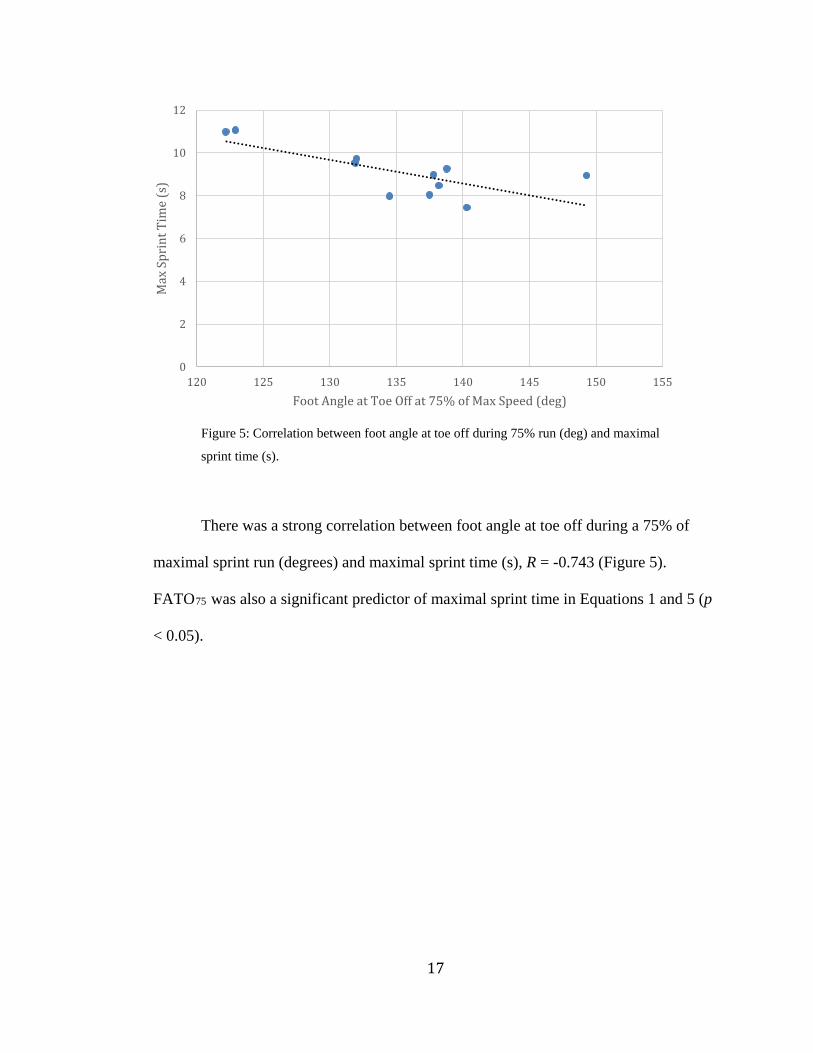
Figure 5: Correlation between foot angle at toe off during 75% run (deg) and maximal
sprint time (s).
There was a strong correlation between foot angle at toe off during a 75% of
maximal sprint run (degrees) and maximal sprint time (s), R = -0.743 (Figure 5).
FATO75 was also a significant predictor of maximal sprint time in Equations 1 and 5 (p
< 0.05).
0
2
4
6
8
10
12
120 125 130 135 140 145 150 155
Max
Spr
int T
ime
(s)
Foot Angle at Toe Off at 75% of Max Speed (deg)
•• • ................................. . . ................. . .................................. ..
• • •

18
Discussion
The purpose of this study was to determine the predictive ability of
anthropometrics, sprinting kinematics, and measures of power and strength of maximal
sprint performance. It was hypothesized that at least one kinematic variable would
significantly predict maximum sprint time, and that these variables along with
anthropometric, power, and strength measures would explain the majority of the
variance (R2 > 0.7) in time for a 60 m maximal sprint time. The current study found that
broad jump (BJ), left hip flexion torque (LHF), and foot angle at toe-off during a 75%
of maximal sprint (FATO75) were predictive of maximal sprint time (Table 1).
The first model (Table 1) attempted to explain maximal time based off of
kinematic measures (TAHS, TATO, FAHS, FATO) during submaximal trials. FATO75,
TATO90, TAHS90 were included in the model following the stepwise selection
procedure time: 𝑇𝑇100 = 50.187 − 0.058𝐹𝐹𝐴𝐴𝑇𝑇𝐹𝐹75 − 0.118𝑇𝑇𝐴𝐴𝑇𝑇𝐹𝐹90 − 0.210𝑇𝑇𝐴𝐴𝑇𝑇𝑇𝑇90. In equation 1,
TAHS90 had the largest standardized coefficient, indicating that it has the largest weight
in explaining the variance in maximal sprint time. This implies that coaching on running
form should be focused on the angle at which the heel strikes the group when running at
a speed of 90% of maximal effort.
Additionally, all coefficients were negative, implying that a larger angle would
decrease maximal sprint time (i.e. subject would be running faster). In the case of
FATO90, to increase speed, a person would need to run more on their toes than on the
midfoot or heel. The toe off portion of the gait cycle provides the propulsion required to
move the body forward as the foot pushes against the ground (McGinnis, 2013).
Therefore, it can be inferred that increasing angle of the foot relative to vertical during
19
the toe-off phase of gait, a greater propulsive force is created, propelling the body
forward.
In the second model, the relationship between anthropometrics and measures of
strength and power (Biodex output, broad jump, and vertical jump) and maximal sprint
time were examined. Equation 2 found that broad jump (BJ) and left hip flexion (LHF)
were predictive of maximal sprint time: 𝑇𝑇100 = 14.859 − 0.020𝐵𝐵𝐵𝐵 − 0.008𝐿𝐿𝑇𝑇𝐹𝐹. Like
equation 1, the coefficients were negative, implying that they have an inverse
relationship. Right hip flexion (RHF) (153.04 ± 51.63 N*m) was not included in the
model because it was collinear with LHF (139.57 ± 40.16 N*m), R = 0.85.
This collinearity suggests that either RHF or LHF may be measured and put into
the model. Additionally, RHF was measured first using the Biodex so a learning effect
may be involved as subjects were familiar with the machine and understood what to do
when performing flexion/extension on the left leg. This implies that while the side (R/L)
may not be important, it is important to include hip flexion strength as this muscle
group is responsible for pulling the leg upward during and after toe-off phase of gait.
Previous research has demonstrated the relationship between hip flexor strength and
sprinting. Deane et al. (2005) tested the effects of hip flexor training on sprint, shuttle
run, and vertical jump performance and found that training increased strength by 12.2%
and reduced sprint time by 3.8%. This suggests that by strengthening hip flexors, sprint
time can be reduced, producing faster sprinters.
Equation 2 also found that BJ was highly indicative of sprint time, meaning
longer jumps correlated with faster sprint time (R = -0.974, p = 0.000). In the context of
this experiment, BJ was used as an indicator of power, as the ability to broad jump

20
requires an individual to generate a lot of force in a very short period of time, similar to
sprinting. Brechue et al. (2010) found BJ to be significantly correlated with 40-yard
dash time and 40-yard dash velocity. The broad jump requires an explosive movement,
similar to that required during a maximal sprint. Berthoin et al. (2001) found that this
ability can be improved through jump training, resistance training, or other types of
explosive training. This along with results from the current study suggest that explosive
training can decrease sprint time and therefore should be focused on when coaching
sprinters.
Models 3-6 within the current study examined the relationship between all
variables measured and the kinematics of a single submaximal percent. Equations 4 and
6 found that there was no effect of kinematic variables on maximal sprint time during
90% (Equation 4) and 60% (Equation 6) runs. Equation 5 found that in addition to BJ
and LHF, FATO75 was predictive of maximal sprint time, (R = -0.743, p = 0.004):
𝑇𝑇100 = 19.936 − 0.16𝐵𝐵𝐵𝐵 − 0.008𝐿𝐿𝑇𝑇𝐹𝐹 − 0.045𝐹𝐹𝐴𝐴𝑇𝑇𝐹𝐹75. The model implies that increasing
FATO (running more on toes) during a 75% of maximal run would influence maximal
sprint time. Additionally, this implies that coaching an individual to run on his/her toes
during a 75% run would influence sprint time. Perhaps 75% of max is a speed at which
form can still be modified compared to either 60, 90, or 100% sprints. This finding may
indicate to coaches that they should focus on running form during a 75% run, in
addition to BJ and hip flexion, which may have an effect on overall sprint time.
21
Limitations
The participants in this study were recruited from the university campus
community, and were active with moderate to high experience running. Having such a
uniform sample may mean that the results of this study may not be applicable to high
level and professional athletes. More data needs to be collected from these individuals
to determine the predictability of measured variables on sprint time. The current study
only tested 11 subjects, which may have affected the statistical analysis preformed. This
limitation was corrected by using adjusted R2 values, but additional research needs to be
done with more subjects to confirm the results.
Additionally, data were analyzed using 2D analysis, which while being more
cost efficient and simpler to use, is not as accurate as 3D motion capture. As a result,
kinematic data may not have as accurate results as studies that use a different method of
motion capture. Further studies should determine the viability of using 2D motion
capture to predict sprint time compared to 3D motion capture.

22
Conclusion
From these findings, it appears that broad jump distance and hip flexor strength
are predictive of maximal sprint time, implying that coaching that emphasizes these
measures could affect 60 m sprint time. This suggests that coaches, trainers, and athletes
should incorporate exercises that improve broad jump and hip flexor strength to
improve sprint performance.
23
Appendix
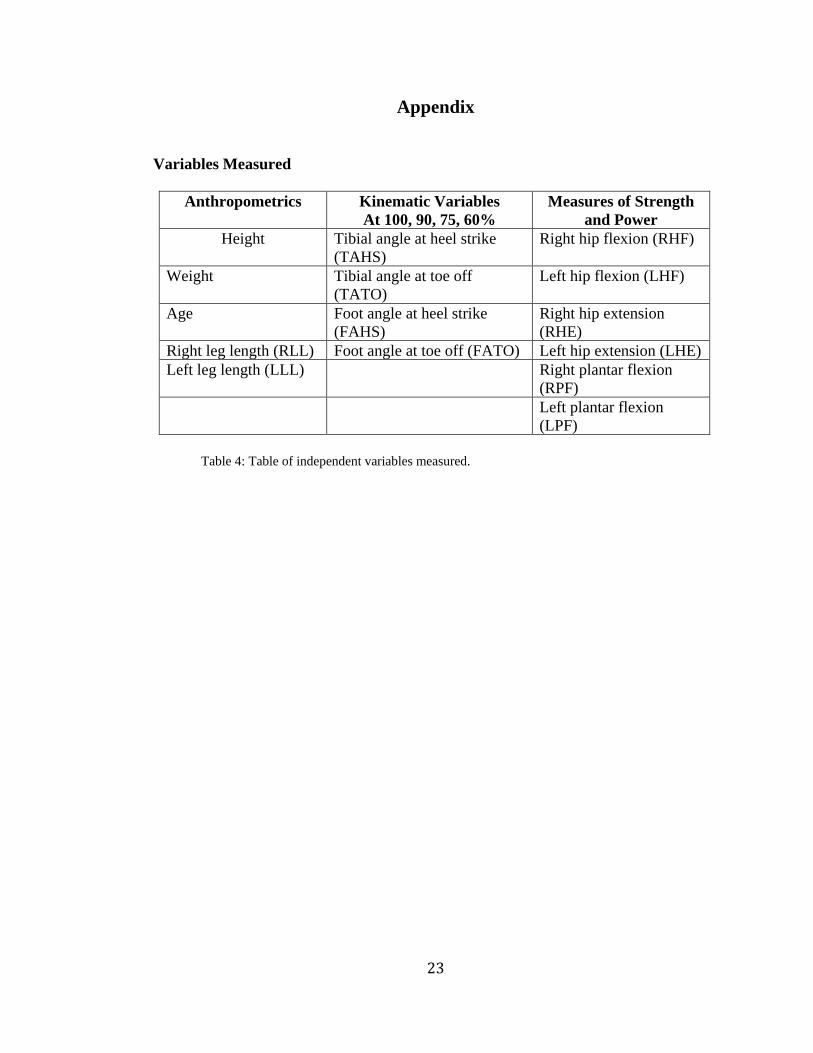
Variables Measured
Anthropometrics Kinematic Variables At 100, 90, 75, 60%
Measures of Strength and Power
Height Tibial angle at heel strike (TAHS)
Right hip flexion (RHF)
Weight Tibial angle at toe off (TATO)
Left hip flexion (LHF)
Age Foot angle at heel strike (FAHS)
Right hip extension (RHE)
Right leg length (RLL) Foot angle at toe off (FATO) Left hip extension (LHE) Left leg length (LLL) Right plantar flexion
(RPF) Left plantar flexion
(LPF) Table 4: Table of independent variables measured.
24
IRB Approval
o I UNIVERSITY OF OREGON
e training, you must submit a Protocol Amendment Application Form to add their names to the protocol, along with a copy of their CITI certificates.
COMMITTEE FOR THE PROTECTION OF HUMAN SUBJECTS• RESEARCH COMPLIANCE SERVICES
677 E. 12· Avo., Suite 500, 5237 University of Oregon, Eugene OR 97401-5237
T 541-346-2510 F 541-346-5138 http://rcs.uoregon.edu
An equal-opportunity, affirmative-action institution committed to cultural diversity and compliance with the Americans with Disabilities Act
25
Research Plan
Study Title: Predictors of Maximal Sprint Performance Protocol Number: N/A Principal Investigator: Francesca Picchi-Wilson
A. Introduction and Background Measurement of an individual’s sprinting ability is of importance in the field of motor development, sport performance, and athletic recruitment. Previously, researchers have observed biomechanical changes in young sprinters as they progress through adolescence and into adulthood. For example, maximal sprint speed develops as stride frequency and contact time begin to stabilize, around and post peak height velocity (PHV), the period of time when an adolescent fastest growth spurt, which is used to classify adolescents in terms of size, body composition, and performance relative to growth spurt (Meyers et al., 2015; Philippaerts et al., 2006). Increasing an individual’s step frequency and stride length leads to an increase in running velocity, as previous research has demonstrated a strong correlation between these variables. This top sprinting velocity can be achieved within 40-60m making it not feasible variable to measure in the lab, indicating that more research needs to be done in this area. The mechanics of running, primarily reducing the braking force, also change with increasing speed in order to propel the body forward faster. Previously, studies have examined the alterations in sprint mechanics during both submaximal and maximal sprints, and revealed that at higher speeds there is a larger increase in stride rate rather than stride length, suggesting that the strategy to increase sprinting velocity seems to be increasing stepping frequency (Meyers et al., 2015; Rumpf and Cronin, 2015). This increase in stride rate can be explained by changes in lower limb mechanics. Furthermore, there seems to be a relationship between various measures of force and power production and running performance. For example, a strong correlation exists between maximal vertical jump, horizontal jump, and jump squat performance and 100m sprint time (Bissas and Havenetidis, 2008). Taken together, these previous studies demonstrate that while there are various predictors of sprint performance within the laboratory setting, there is a need for coaches, trainers, and scouts to be able to make measurements with simple tools in a real-world setting, as often as they do not have access to high-end laboratory equipment. Therefore, it is necessary to determine which predictor variables best explain sprinting velocity when being measured in a real-world setting.
B. Specific Aims/Study Objectives The purpose of this study is to model the predictive ability of anthropometrics, sprinting kinematics, and measures of power and strength on sprint performance and whether the predictive power of these variables change at different levels of maximal sprinting.
26
Using a generalized linear model (GLM) with anthropometrics, kinematics, and power and strength measures, we hypothesize that (1) the GLM will explain the majority of the variance (R2 > 0.7) in sprinting velocity during a 60 m run and (2) a significant interaction will exist between one predictor variable, percentage of sprint max, and the measured kinematic variables.
C. Methods, Materials and Analysis The research will take place at the Bowerman Sports Science Clinic and Hayward Field at the University of Oregon, where we will collect anthropometric, spatial-temporal, kinematic, and strength and power measurements from each participant. All study procedures will be completed within two total hours, involving at most two sessions of one hour each. One day will consist of obtaining measures within the laboratory and one day will consist of sprinting trials on the track. The sessions will occur on two different days. During the lab day, participants’ height, weight, age, sex, and leg length will be recorded. Then subjects will be asked to perform measures of strength and power using a BioDex dynamometer. This system involves isolating a muscle group of interest and instructing an individual to contract maximally against a padded surface. The dynamometer can then measure the torque at the center of rotation of the system, which is aligned with the center of rotation of the joint/muscle group. Thus, measures of torque about a certain joint can be inferred. These measures include maximal isometric hip flexion and extension at 45 degrees each as well as isometric ankle plantar flexion at 15 degrees. Subjects will be instructed to maximally contract against the pad for five seconds, and a rest period of five seconds will occur between each trial. Hip flexion and extension torque will be measured first, followed by plantar flexion torque. Each measurement will be measured three times. This device will only be used for its approved marketed purposes during this study. Measures of power include vertical jump height and broad jump length. Broad jump and vertical jump will be measured three times with approximately 30 seconds of rest between each trial. We will assess the broad jump by asking the participant to jump the farthest horizontal distance possible off of two feet, and measuring the distance between take-off and landing. The vertical jump is measured using a Vertec Jump Training System, where participants are instructed to jump off of two feet and touch a series of slats spaced 1 inch apart. The distance between the highest slat touched and the lowest slat, which is set to the individual’s highest standing reach, is taken as their vertical jump height. The field day will consist of a total of twelve total sprints of 60 m: three maximal sprints followed by three sets of sprints randomized at 60, 75 and 90 percent of max. Initially, participants will be fitted with a heart rate monitor around their chest and asked to go through a ten-minute warmup protocol consisting of a warmup 100m jog followed by dynamic stretching (high knee walk, high knees running, high heels running, lateral lunges, lateral leg swings, and skipping) and two more 100 m runs at a pace just above a jog. Heart rate will be monitored during the warmup and noted after
27
the warm up is completed, goal heart rate for warmup is approximately 50 to 60% of max heart rate (220 minus age). After warming up, subjects will be asked to perform the maximal sprints with a rest period between each trial lasting the amount of time it takes for their heart rate to return to approximately similar to the post warmup heart rate. Subjects will then be asked to perform the randomized sets of submaximal sprints by giving them a time goal to complete a 60m sprint. The target percent of max will be calculated based off the average maximal speed. The trial for each percentage of max with the time closest to the goal time will be used for analysis. A high-speed camera positioned at approximately 40m from the starting point and in the sagittal (side) plane of the runner will record a video of one maximal velocity stride, as previous research has demonstrated that it takes approximately 40m to accelerate to maximum velocity. Video will be recorded at 240 Hz and exported to Dartfish, a two-dimensional motion analysis software package. Within this software, the angle of the tibia with respect to the ground, angle of the foot with respect to vertical, and distance from the participant’s whole-body center of mass (COM) with respect to the lateral malleolus of the ankle joint of the foot in contact with the ground will be used as kinematic measures. After both days of collection, all subjects will be assigned a number corresponding to the order in which they were recruited for the study. Their name will be collected only for contact purposes and not reported. Any individual data will only refer to their subject number, and all data will be presented in aggregated formats. No individual with be represented or reported in an identifiable manner. A GLM will be used to determine the relationship between the predictors, anthropometrics, kinematics, isometric strength, and power assessments and the outcome, maximal sprint performance. In total, the ability of 14 variables to predict 1 outcome variable will be assessed in this analysis. First, testing of assumptions of linearity, independence, normality, and equality of variance will occur, with appropriate transformations made to individual variables to meet any necessary assumptions. Next, a stepwise selection of variables, including any hypothesized interactions, will be made to determine order of predictors in the model. The overall model fit will be assessed to determine the predictive ability, and individual variable significance will be determined by α < 0.05.
D. Research Population & Recruitment Methods An a priori analysis for multiple regressions, using an effect size of 2.5, α = 0.05, and 14 predictors reveals that this model requires a sample size of 26 to have a power of 0.95. The total pool of subjects will ideally have equal numbers of males and females. As a result, we plan to recruit 13 females and 13 males to participate in this research. Participants will not be compensated for their participation in the study. Population access will occur first either in person or by the posted flyer to which participants will respond either by email or over the phone. This will be followed by the confirmation email as a follow up to confirm the interest in participating in the study, followed by screening procedures to ensure that each subject meets the inclusion and exclusion requirements described below.
28
First, for recruitment, the nature of the research study will be described and the additional eligibility criteria will be defined to participate. Participants for this study will be recruited via: • Posted flyers at the University of Oregon. Subjects are asked to contact the PI via
email or phone. • Contact via PI or research staff in person or over email. Next, during this initial contact by email, subjects will be screened to determine if they meet the study criteria (as follows):
• Inclusion criteria: between the ages of 18 and 50, and are capable of sprinting for short distances repeatedly for up to 30 minutes. The proposed research does not include involvement of special classes of subjects, such as pregnant women, prisoners, institutionalized individuals, or others who may be considered vulnerable populations.
• Exclusion criteria: self-reported conditions that could impair sprinting ability, including any lower limb injuries within the last 6 months or suffer from any chronic pain that would prevent them from comfortably completing the study, or any cardiovascular or neurological aliments that would put them at an increased risk while completing the study.
Finally, after eligibility requirements are ascertained for both types of recruitment, the PI or research staff will go through the consent process (see Section E).
E. Informed Consent Process At the beginning of the first lab visit, the PI or trained research staff will perform the informed consent process in person prior to enrollment in the study. PI will verbally describe the informed consent document and participants will be asked to read it in addition. They will also be given a copy to take with them. The initial consent form will apply for both days of participation and the researcher will obtain verbal ongoing consent prior to participation on the second day. All documents pertaining to the study will be stored in a locked file cabinet. A password protected spreadsheet will be created and used to document the dates and times of participation as well as the date and time of signed consent, but will not connect a subject’s assigned number with their name. The person obtaining consent will have specific experiences from previous CITI training sessions and one-on-one training with the supervising faculty. The prospective participant’s understanding of the procedures will be assessed by encouraging the participant to ask questions at any point during the consent process, and asking at the end of the consent process if they understand what will be happening.
F. Provisions for Participant Privacy and Data Confidentiality
Participant and data confidentiality will be provided by storing electronic data on secure university servers and paper documents in the PI’s office or senior staff member’s locked cabinet in the Bowerman Sports Science Clinic. Records will be kept for 1 year following completion of the study. Contact information (such as phone or email) will be collected and stored in a locked file cabinet. All data will be de-identified and the
29
participants’ identities will be coded. The codes to identify participants will NOT be stored with the de-identified data. Video will be filmed so that only the trunk and lower limbs are in the field of view. As such, no faces will be recorded, participants will only be referred to by their de-identified subject number. Only results from this study will be used for future research, no individual record will be retained after the 1-year time window.
G. Potential Research Risks or Discomforts to Participants Injury and Discomfort Participants may be at a slight risk of injury (e.g., trip or fall) while they perform the sprinting protocol or discomfort (e.g., muscle soreness) after either the lab day or the field day. Additionally, during maximal sprinting, subjects may be at risk for pulled or strained muscles. No more potential risk exists than that of any given day of exercise in a gym or recreation center. If the subject experiences harm because of the project, they will be instructed to contact the State of Oregon to cover medical costs according to the Oregon Tort Claims Act. They will also be given the contact information for the University of Oregon representatives responsible for oversight of this. They will be notified this during the informed consent process and given contact information at the same time. Stress Potential sources of emotional and physical stress for participants include the possibly uncomfortable nature of sprinting maximally and visiting the laboratory for data collection. The subjects may feel some emotional stress while wearing tight fitting garments while running on the track. Visitors or other observers during data collection are only permitted with participant concurrence during the lab day, which can be revoked at any time during the experiment, and minimized during the field day.
Invasion of privacy Given the impersonal nature of the data collected (sprint mechanics), the risk of invasion of privacy is minimal. Any contact information pertaining to the subject will be stored in a locked file cabinet and subjects will be de-identified there for loss of privacy and/or breach of confidentiality will be minimized.
Side effects None.
Alternatives to participation Subjects may choose not to participate at any time for any reason. There are no other alternative treatments or procedures.
Therapeutic risks
This study has no therapeutic risks.
30
H. Potential Benefits of the Research Individual participants in the proposed research are not expected to receive a direct benefit from their participation. The potential benefit of the proposed research is to the biomechanics and motor learning/control scientific communities in general. The results of this study will directly benefit societal knowledge of sprint mechanics, and will help to direct future protocols for sports recruitment and performance training. The risks to subjects are low; no life sustaining or life supporting interventions are used as a part of the proposed research protocol. The potential benefit and low risk yield a favorable risk/benefit ratio.
I. Investigator Experience Francesca Picchi-Wilson has three years of study as a Human Physiology student at the University of Oregon, and has one year’s experience in this lab using biomechanics and sport science equipment. She also has field experience as an athletic trainer for multiple sports in high school. Jacob Hinkel-Lipsker, M.S., has 6 years of experience, 3 of which are at the University of Oregon, as a researcher in biomechanics, motor control, and sport performance. He has worked with multiple athlete populations, including sprinters, in maximization of performance and limitation of injury. Dr. Michael Hahn, the faculty advisor for this study, is an Associate Professor in the Department of Human Physiology at the University of Oregon and Director of the Bowerman Sports Science Clinic. He has over 20 years of experience performing researching the fields of gait rehabilitation, motor control, and sport biomechanics. In doing this he has experience with the proposed participant population and is familiar with the methods and materials used in this study.
J. References Bissas, A. I., and K. Havenetidis. "The use of various strength-power tests as predictors of sprint running performance." Journal of Sports Medicine and Physical Fitness 48.1 (2008): 49. Meyers, Robert W., et al. "Maximal sprint speed in boys of increasing maturity." Pediatric exercise science 27.1 (2015). Philippaerts, Renaat M., et al. "The relationship between peak height velocity and physical performance in youth soccer players." Journal of sports sciences 24.3 (2006): 221-230. Rumpf, Michael C., et al. "Kinematics and Kinetics of Maximum Running Speed in Youth Across Maturity." Pediatric exercise science 27.2 (2015).
31
Consent Form
University of Oregon, Department of Human Physiology
Informed Consent for Participation as a Subject in a study titled:
“Predictors and Indicators of Maximal Sprint Performance”
Investigator: Francesca Picchi-Wilson
Type of consent: Adult Consent Form
Introduction
• You are being asked to participate in this research study because we would like to know how measures of various power, strength, and body characteristics can predict max sprint speed as well as percent of max sprint speed.
• You are selected as a possible participant because you responded to a posted flyer or advertisement, specific to this study, and do not have any cardiovascular, neurological, or musculoskeletal disorders or injuries that can affect your ability to sprint maximally.
• We ask that you read this form and ask any questions that you may have before agreeing to be in the study.
*Please note that the procedures in this study are research related and do not provide clinical treatment or care.
Purpose of Study:
• The purpose of this study is to assess whether maximal sprint capacity can be predicted from anthropometric, power, and strength tests.
Description of the Study Procedures:
If you agree to be in this study, you will be asked to visit the lab at the Bowerman Sports Science Clinic. The study will consist of two sessions, with each session lasting about 1 hour. The times of these lab visits are flexible depending on your schedule but will occur ideally within 48 hours of each other. In the first session we will gather basic information about your body (height, weight, age, sex) as well as various measures of strength, power, and range of motion. These data will be collected using a BioDex dynamometer and we will only use this device for its approved marketed purpose. This device will measure isometric force and torque generation at the hip and ankle joints by having you contract maximally against a padded surface for 5 seconds at a time. In measurement of hip torque you will be standing and driving your thigh upwards against the pad, and ankle torque
32
will be measured with you in a seated position while pushing your toes away from your body and against the surface (much like pressing the gas pedal down while driving a car). Measures of power will include three broad jumps (jumping as far forward as possible) and three vertical jumps (jumping as high as possible). During the second session you will be asked to follow a prescribed warm up routine, after which you will be asked to perform three maximal sprints for a distance of 60 m each, followed by nine sprints at a designated percent of maximal sprint speed (approximately 60,75, and 90% 3 times each). Breaks will be provided between each sprint for the amount of time that it takes for your heart rate to return the level recorded after the warmup. The sprint session will be filmed and analyzed later. You will be asked to wear tight-fitting spandex shirts and shorts during these visits. The reason for this is that we will be analyzing video data from your sessions, and we must be able to clearly identify body landmarks. You will also be fitted with a heart rate monitor around your chest, worn beneath your shirt.
Risks/Discomforts of Being in the Study: • You will most likely feel tired after the end of the study. After training, you
may experience some mild muscle soreness. • The experimental procedures that take place in our laboratory may be an
inconvenience to you because we will ask you to travel to and from our location to participate in these experiments.
• There is a risk that you may feel emotional and/or physical stress during this study. Sprinting maximally may cause you to have difficulty breathing. Notify study staff immediately if you feel as though you cannot breathe or have extremely difficulty breathing after exercising.
• There is a risk of pulled or strained muscles during sprinting. Notify the study staff if you experience any muscular pain during this task.
• This study may include risks that are unknown at this time. • Name and contact information will be collected however this will be kept
confidential and you will be de-identified using a subject number in order to minimize this risk.
• If you experience harm because of the project, you can ask the State of Oregon to pay you. A law called the Oregon Tort Claims Act limits the amount of money you can receive from the State of Oregon if you are harmed. If you have been harmed, you can contact the General Counsel of the University of Oregon. Here are the e-mail address, physical address, and phone number; General Counsel, Office of the President, University of Oregon, Eugene, OR 97403, [email protected]. In addition, you can contact Dr. Michael Hahn, the faculty advisor for this study at [email protected].
33
Benefits of Being in the Study: • The purpose of the study is to examine how running style changes as speed
changes as well as predictors of sprint ability. This will enhance future knowledge of sprint mechanics, and will contribute to the ability of sports scouting in adolescents.
• There will be no direct benefit to you by participating in the study. Payments:
• You will not receive any payment for being involved in this study. Costs:
• There is no cost to you to participate in this research study. Confidentiality:
• The records of this study will be kept private. In any sort of report we may publish, we will not include any information that will make it possible to identify a participant. Research records will be kept in a locked file.
• All electronic information will be coded and secured using a password protected file. If we use any video recordings during a scientific presentation or publication, we will obscure your identity. Only members of the research team will have access to these videos. You may view the recordings and delete any that you wish.
• Access to the records will be limited to the researchers however, please note that the Institutional Review Board and internal University of Oregon auditors may review the research records.
Voluntary Participation/Withdrawal:
• Your participation is voluntary. If you choose not to participate, it will not affect your current or future relations with the University.
• You are free to withdraw at any time, for whatever reason. • There is no penalty or loss of benefits for not taking part or for stopping
your participation. • You will be provided with any significant new findings that develop during
the course of the research that may make you decide that you want to stop participating.
Dismissal from the Study:
• The investigator may withdraw you from the study at any time for the following reasons: (1) withdrawal is in your best interests (e.g. side effects or distress have resulted), or (2) you have failed to comply with the study requirements.
Contacts and Questions:
• The researchers conducting this study are Francesca Picchi-Wilson, Jacob Hinkel-Lipsker, MS and Michael Hahn, PhD, the faculty advisor. For questions or more information concerning this research you may contact them at 541-346-4114.

34
• If you believe you may have suffered a research related injury, contact Michael Hahn, PhD at 541-346-3554 who will give you further instructions.
• If you have any questions about your rights as a research subject, you may contact: Research Compliance Services, University of Oregon at (541) 346-2510 or [email protected]
Copy of Consent Form:
• You will be given a copy of this form to keep for your records and future reference.
Statement of Consent:
• I have read (or have had read to me) the contents of this consent form and have been encouraged to ask questions. I have received answers to my questions. I give my consent to participate in this study. I have received (or will receive) a copy of this form.
Signatures/Dates _____________________________________________________________ Study Participant (Print Name) _____________________________________________________________ Participant or Legal Representative Signature Date
35
Data Sheet
Height: __________ cm Weight: __________ lbs R leg length: __________ cm L leg length: __________ cm
Vertical jump (in)
Trial 1 Trial 2 Trial 3
Broad jump (cm)
Trial 1 Trial 2 Trial 3

36
GOAL: 90%: _________ s __________ m/s 75%: _________ s __________ m/s
trial # % max
time (s) rate (m/s)
Post HR (bpm)
Pre HR (bpm)
Recovery time (min)
warm up
N/A
1 100
2 100
3 100
37
Confirmation Email
Hello (insert name), We are contacting you because you have recently expressed interest in participating in our study, entitled “Predictors of Maximal Sprint Performance”. You are selected as a possible participant because you do not have any cardiovascular, neurological, or musculoskeletal disorders that can affect your ability to sprint for short distances for more than 30 minutes. If you are affected by any such disorder, please note the type and date diagnosed in a reply to this email. We have confirmed you to attend two data collection sessions, on 2 separate days: (insert dates and times). These sessions will last approximately 1 hour each, and will consist of doing tests for power and strength on the first day and 12 sprints on the second day. Please confirm that you can attend these sessions an email reply. Finally, if you are able to attend these sessions, we ask that you wear exercise wear, and comfortable running shoes. Thanks again, and we look forward to working with you! Regards, Cesca Picchi-Wilson and Jake Hinkle-Lipsker
38
Bibliography
Berthoin, Serge, Gregory, D., Mary, P., and Gerbeaux, M. “Predicting Sprint Kinematic Parameters from Anaerobic Field Tests in Physical Education Students” Journal of Strength and Conditioning Research 15.1 (2001): 75-80.
Bissas, A. I., and K. Havenetidis. "The use of various strength-power tests as predictors of sprint running performance." Journal of Sports Medicine and Physical Fitness 48.1 (2008): 49.
Brechue, William F., Mayhew, Jerry L., and Piper, Fontaine C. “Characteristics of Sprint Performance in College Football Players” Journal of Strength and Conditioning Research 24.5 (2010): 1169-1178.
Deane, R. S., Chow, J. W., Tillman, M. D., & Fournier, K. A. "Effects of hip flexor training on sprint, shuttle run, and vertical jump performance." Journal of Strength and Conditioning Research. 19.3 (2005): 615-621.
Frost, Jim. "Multiple Regression Analysis: Use Adjusted R-Squared and Predicted R-Squared to Include the Correct Number of Variables." Minitab. Minitab Inc., 13 June 2013. Web. 30 Apr. 2017.
McGinnis, Peter Merton. "Qualitative Biomechanics Analysis to Improve Technique." Biomechanics of Sport and Exercise. 3rd ed. Champaign, IL: Human Kinetics, (2013): 311-37. Print.
McGinnis, Peter Merton. "Qualitative Biomechanical Analysis to Understand Injury Development." Biomechanics of Sport and Exercise. 3rd ed. Champaign, IL: Human Kinetics, (2013): 361-82. Print.
Mero, A., P. V. Komi, and R. J. Gregor. "Biomechanics of sprint running." Sports medicine 13.6 (1992): 376-392.
Meyers, Robert W., et al. "Maximal sprint speed in boys of increasing maturity." Pediatric exercise science 27.1 (2015).
Novacheck, Tom F. “The Biomechanics of Running.” Gait and Posture 7 (1998): 77–95.
Philippaerts, Renaat M., et al. "The relationship between peak height velocity and physical performance in youth soccer players." Journal of sports sciences 24.3 (2006): 221-230.
Rumpf, Michael C., et al. "Kinematics and Kinetics of Maximum Running Speed in Youth Across Maturity." Pediatric exercise science 27.2 (2015).

39
Souza, Richard B. 2016. “An Evidence-Based Videotaped Running Biomechanics Analysis.” Physical medicine and rehabilitation clinics of North America 27(1): 217–36. http://www.ncbi.nlm.nih.gov/pubmed/26616185 (April 19, 2017).


![Sprint Interval Training - Strength and conditioning …1].pdf · rather, that sprint interval training ... When one is exercising above 100% VO2 max, it is termed “supra‐maximal”](https://img.pdfslide.us/doc/110x75/5b8413f47f8b9ad34a8b7d01/sprint-interval-training-strength-and-conditioning-1pdf-rather-that-sprint.jpg)