Embed Size (px)
Citation preview
Acta of Bioengineering and Biomechanics Vol. 4, No. 2, 2002
Predictive torque equations for joints of the extremities
TADEUSZ BOBER
Academy of Physical Education, Biomechanics Laboratory, ul. Paderewskiego 35, 51-612 Wrocław, Poland, tel. 347 3248, e-mail: [email protected]
KORNELIA KULIG
Department of Biokinesiology and Physical Therapy, University of Southern California, Los Angeles, CA
JUDITH M. BURNFIELD
Department of Biokinesiology and Physical Therapy, University of Southern California, Los Angeles, CA
BOGDAN PIETRASZEWSKI
Academy of Physical Education, Biomechanics Laboratory, ul. Paderewskiego, 35, 51-612, Wrocław, Poland
The purpose of this study was to develop regression equations predicting torque output throughout the range of motion for the human elbow, shoulder, knee, and hip. Twenty-two healthy males participated. Torque values throughout the sagittal plane range of motion (i.e., flexion and extension) of the right elbow, shoulder, knee and hip were recorded (isokinetic dynamometer, 1 rad/sec) and expressed as a percentage of the peak torque produced for each motion. For each joint tested, regression equations based on ensemble-averaged, normalized torque data were calculated to predict the relative torque throughout the investigated range of motion when torque in one angular position was known. Shoulder flexion was best described by a second-order polynomial, while shoulder extension, elbow and knee flexion and extension, and hip flexion were described best by third-order polynomials. Hip extension was best described by a fourth-order polynomial. The regression multiple R2 values ranged between 0.998 and 1.000. These regression equations can be used to predict the expected torque anywhere in the sagittal plane range of motion based on knowledge of a torque recorded at another joint angle for the elbow, shoulder, knee, or hip joint. These equations can be
T. BOBER et al. 50
used in the clinical setting when a direct examination of strength capability is not possible due to limitations in equipment or due to the presence of pain within the arc of motion.
Key words: human, strength, extremities
1. Introduction
Strength measurement is a routine procedure employed in clinical, athletic and research environments. Assessment of human strength provides objective insight into the function of the human neuromusculoskeletal system and enables prediction of functional status (BUCHNER et al. [2], SALEM et al. [16]). Furthermore, it assists in prognosing and monitoring the progress of persons in rehabilitation programs. Thorough understanding of human strength capabilities provides a foundation for modelling human movement and the interaction between the person and the environment.
The ability to estimate a joint’s torque producing capacity throughout a range of motion may be useful when a direct examination of strength capability is not possible. For example, the extent of physical effort required by a strength test may be beyond a person’s ability, or the desired joint position may not be accessible to testing due to pain or restriction. Additionally, the necessary testing equipment may not be available.
A common method of estimating strength production is through the use of statistically derived predictive equations (GRAVEL et al. [7], GRAVES et al. [8], KUMAR et al. [13], [14]). CLARKE [4] and SCHANNE [17] calculated comprehensive equations to predict strength of a joint within the extremities if the position of that joint and its proximal counterpart were known. However, when applied, the predicted linear relationships between torque and joint angle in many of their equations often did not reproduce the experimentally derived ascending–descending curves.
While it is well known that torque varies throughout a joint’s arc of motion (CLARKE [4]), a review of published literature indicates that equations currently available to predict torque throughout a joint’s full range of motion do not fully reproduce the experimental data. Therefore, the primary purpose of this study was to develop a set of torque-angle equations that could be used to predict flexion and extension torque production throughout the range of motion of the human shoulder, elbow, hip, and knee. A secondary goal of this study was to provide a basis for interpreting the predictive accuracy of the equations developed from data in the current study.
Predictive torque equations 51
2. Methods
Twenty-two healthy male volunteers (age, 18–37 years; body height, 179.1 + 6.6 cm; and body mass, 78.8 + 14.6 kg) consented to participate in this study. Subjects were informed that they might withdraw from this study at any time without prejudice. Regardless of arm or leg dominance, the right shoulder, elbow, hip and knee of all subjects were tested.
The Merac comprehensive strength dynamometer (UNIVERSAL GYM Equipment, Inc., Cedar Rapids, Iowa) was used for acquisition of the torque values produced by the muscle groups tested. Previous research indicates that the Merac comprehensive strength dynamometer is a reliable tool for torque assessment (BOBER and HAY [1]).
To avoid alterations in strength associated with subjects performing repeated maximum isometric muscle contractions at each of the 9 to 12 test positions for the eight muscle groups, torque (Nm) data were collected during concentric, isokinetic motion at 1 rad/s. This approach is supported by previous research that has documented a statistically significant correlation between static and isokinetic (60°/sec) torque production capability (BOBER and HAY [1]).
The manufacturer’s recommendations were followed in setting up the subjects for each testing position, except for placement of the dynamometer resistance pad, which was always placed on the side of the “direction of testing” (i.e., for knee extension the resistance pad was placed over the distal anterior shank). For each test, the resistance pad was secured to the tested limb segment using a velcro strap.
To describe the angular relationship between adjacent body segments, the following convention was used. At the elbow and knee, full extension was described as 0°. At the hip, a neutral position of thigh flexion/extension in relation to the pelvis and trunk was described as 0°, while at the shoulder, 0° described a parallel position of the arm relative to the trunk.
Elbow flexion and extension torque values were measured with subjects seated. Their right arm was supported and flexed to 60°. The right arm was stabilized against the support and a strap placed over the arm allowed for a change in arm circumference during muscle contraction. The forearm was fully supinated. The trunk was supported by a back support and stabilized with straps applied in a diagonal pattern over the right and left shoulders and hips.
Shoulder flexion and extension torque values were measured with subjects seated in an accessory chair positioned beside the Merac dynamometer. During testing, the elbow was extended but unconstrained. The trunk was stabilized in the chair with straps applied in a diagonal pattern over the right and left shoulders and hips. The stabilization system allowed the arm to move freely in the sagittal plane from 60° of extension to approximately 150° of flexion. During both elbow and shoulder testing the left hand grasped the handle for support and stability, the legs were unconstrained, and the left foot was supported by a footrest.
T. BOBER et al. 52
Knee flexion and extension torque values were measured with subjects seated. The right thigh was stabilized with a wide, non-elastic strap. The design of the seat allowed full knee extension, but knee flexion was limited by the edge of seat to approximately 110°. The trunk was stabilized to the back support of the chair using straps applied in a diagonal pattern over the right and left shoulders and hips. The hip position was 90°. The left and right hands grasped the handles for support and stability. The left foot was supported by a footrest.
Hip flexion and extension torque values were measured in the supine position. The knee of the tested leg was flexed to 80° and stabilized in this position with a light plastic cuff to avoid changes in the moment of inertia of the moving leg. During thigh extension, the lower leg and foot moved freely below the edge of the table to assure full thigh mobility. The supine positioned trunk was stabilized to the table with straps applied in a diagonal pattern over the right and left shoulders and hips. The pelvis had additional stabilization to restrict lumbar motion. To increase stability, the left leg was flexed at the knee and the foot was supported on the footrest and the hands grasped the handles.
All testing occurred during a single two-hour session. Flexion and extension efforts were tested separately at each joint. Prior to formally testing each motion, subjects were familiarized with the testing procedure by performing a warm-up consisting of two isokinetic efforts.
Following each warm-up, the Merac system was calibrated with respect to gravity according to the manufacturer’s protocol for the specified motion to be tested. The subject was then instructed to perform three isokinetic repetitions (60°/sec), exerting maximum effort throughout the full range of motion. A ten-second rest was provided between each repetition. After recording three trials of the specified isokinetic test, the subject participated in a warm-up for the next isokinetic test. The Merac system was again calibrated, and the formal trials for the next isokinetic test were recorded. This procedure continued until each of the eight muscle groups was tested.
For each joint, testing was performed first in the direction of flexion and second in extension. In the elbow joint, the testing was initiated from full extension and was carried to maximum flexion. In the shoulder joint, the motion was initiated from maximum extension (≈ 60°) and was flexed to above the horizontal plane (≈ 150°). In the knee joint, the initial position was full extension with motion into flexion restricted by the edge of the bench at 110°. In the hip joint, motion was initiated at a neutral position (0°) and maximum flexion was approximately 110°. The arcs for testing extension were the reverse of those described for testing flexion.
The trial that produced the highest peak torque was used for analysis. For each subject, the measured torque values throughout the joint motion were plotted to create measured torque versus joint angle curves. From these curves, torque values at selected angular positions were chosen for further analysis. In particular, the

Predictive torque equations 53
torque values were extracted at 15° intervals from 15° to 120° of elbow motion, from −45° to 120° of shoulder motion, and for every 10° from 10° to 90° for the knee and hip and joints. This process provided eight data points for the elbow torque curve, twelve data points for the shoulder torque curve, and nine data points for the knee and hip torque curves for each subject. To minimize the influence of body segment acceleration and deceleration on joint torque values, the data recorded at the extreme joint positions, such as −60º and 140º at the shoulder and 0° and 100° at the knee and hip, were excluded from calculation. Similarly, data recorded at 0° and 140° at the elbow were excluded. For subsequent comparison with predicted torque versus joint angle curves, ensemble-averaged measured torque versus joint angle curves were created for each of the eight muscle groups tested.
Next, normalized measured torque versus joint angle curves were created by expressing each subject’s measured torque value within the curve as a percentage of the peak measured torque value for the given curve. An ensemble-averaged normalized torque versus joint angle curve was created for each muscle group tested. In order to assure that the peak of the normalized ensemble-averaged curve was 100%, each point on the final curve was multiplied by a constant.
The Statistica software (Statistica for Windows, version 5.1, Statsoft, Inc. U.S.A.) was used to calculate the mean, standard deviation and standard error of the mean of the measured torque values at the selected angular positions. These data were then plotted for each joint angle.
Next, to enable prediction of torque values at each angle studied, best-fit polynomials derived from the ensemble-averaged normalized torque curves of each of the eight muscle groups tested were calculated. Finally, the coefficients of variation (CV) of the mean ensemble-averaged normalized torque values and the predicted torque values for the eight muscle groups were calculated.
3. Results
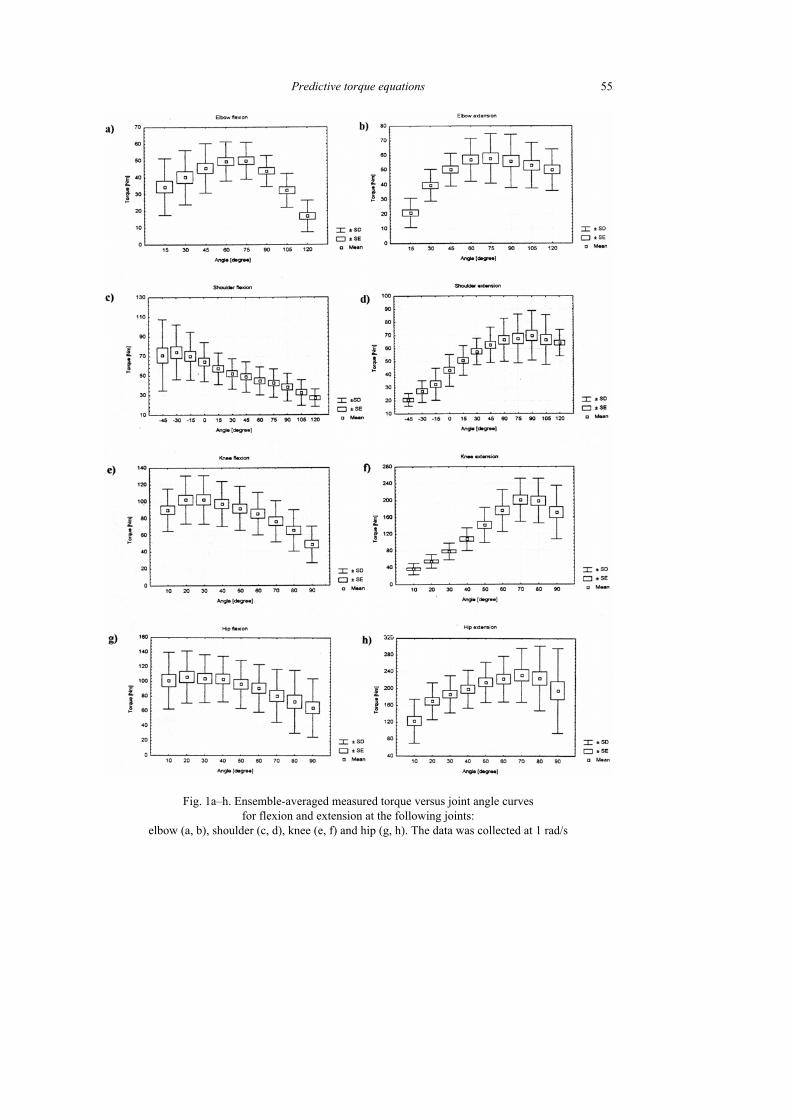
For each muscle group tested, an ensemble-averaged ascending–descending measured torque versus joint angle curve was identified (figure 1a–h). The peak ensemble-averaged torque for both elbow flexion (figure 1a) and elbow extension (figure 1b) occurred at 75°. The peak ensemble-averaged shoulder flexion torque occurred at –30° (figure 1c) with the ascending segment of the shoulder flexion curve created by only one testing position (– 45°). The peak ensemble-averaged torque for shoulder extension occurred at 90° (figure 1d). At the knee, the peak ensemble-averaged flexion torque occurred at 30° (figure 1e), and the peak ensemble-averaged extension torque occurred at 70° (figure 1f). The peak ensemble-averaged hip flexion torque occurred at 20° with only minor variations in torque recorded within the 10° to
T. BOBER et al. 54
40° positions (figure 1g). The ensemble-averaged hip extension torque peaked at 70° (figure 1h).
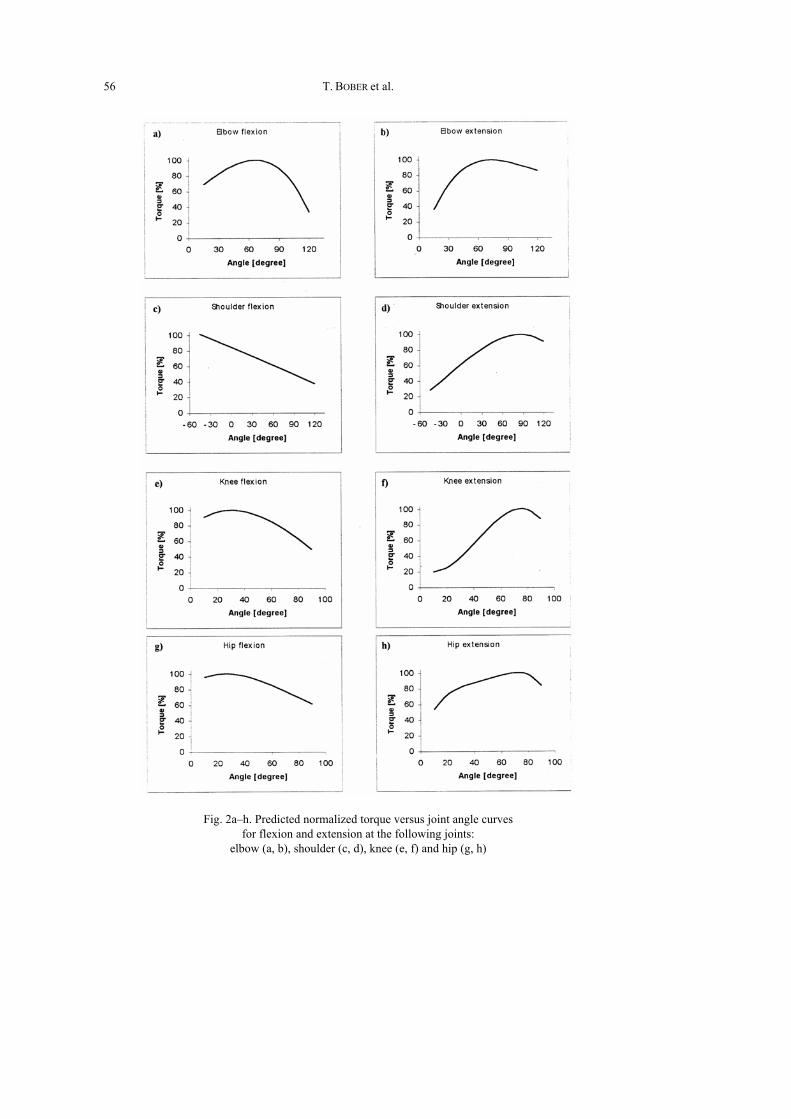
The regression equations relating the ensemble-averaged normalized torque (%) to the joint angle (°) are presented in table 1. Polynomials of the second to the fourth orders described the experimental (mean) data. The confidence level was set at p < 0.0001, and R2 ranged between 0.998 and 1. With the exception of shoulder flexion, the equations predicted ascending–descending torque versus joint angle curves (figures 2a–h). The predicted shoulder flexion versus joint angle curve was linear and descending.
Predictive torque equations 55
Fig. 1a–h. Ensemble-averaged measured torque versus joint angle curves for flexion and extension at the following joints:
elbow (a, b), shoulder (c, d), knee (e, f) and hip (g, h). The data was collected at 1 rad/s
T. BOBER et al. 56
Fig. 2a–h. Predicted normalized torque versus joint angle curves for flexion and extension at the following joints:
elbow (a, b), shoulder (c, d), knee (e, f) and hip (g, h)
Predictive torque equations 57
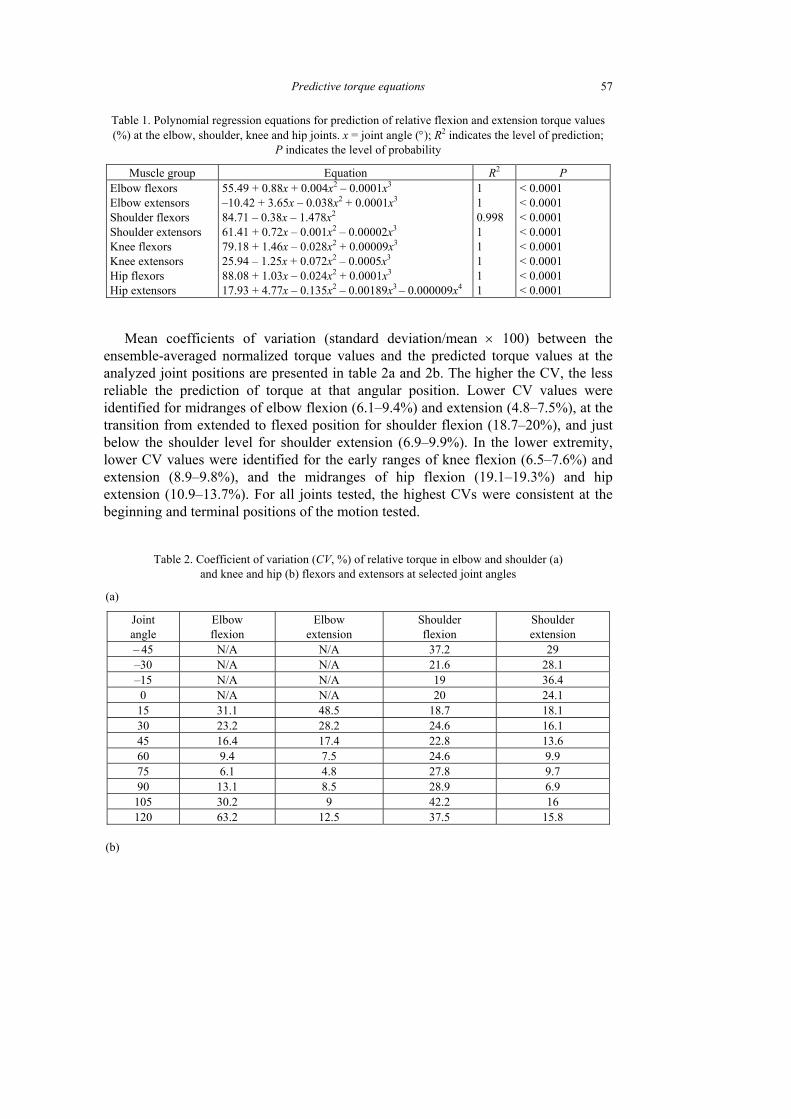
Table 1. Polynomial regression equations for prediction of relative flexion and extension torque values (%) at the elbow, shoulder, knee and hip joints. x = joint angle (°); R2 indicates the level of prediction;
P indicates the level of probability
Muscle group Equation R2 P Elbow flexors Elbow extensors Shoulder flexors Shoulder extensors Knee flexors Knee extensors Hip flexors Hip extensors
55.49 + 0.88x + 0.004x2 – 0.0001x3
–10.42 + 3.65x – 0.038x2 + 0.0001x3
84.71 – 0.38x – 1.478x2
61.41 + 0.72x – 0.001x2 – 0.00002x3
79.18 + 1.46x – 0.028x2 + 0.00009x3
25.94 – 1.25x + 0.072x2 – 0.0005x3
88.08 + 1.03x – 0.024x2 + 0.0001x3
17.93 + 4.77x – 0.135x2 – 0.00189x3 – 0.000009x4
1 1 0.998 1 1 1 1 1
< 0.0001 < 0.0001 < 0.0001 < 0.0001 < 0.0001 < 0.0001 < 0.0001 < 0.0001
Mean coefficients of variation (standard deviation/mean × 100) between the ensemble-averaged normalized torque values and the predicted torque values at the analyzed joint positions are presented in table 2a and 2b. The higher the CV, the less reliable the prediction of torque at that angular position. Lower CV values were identified for midranges of elbow flexion (6.1–9.4%) and extension (4.8–7.5%), at the transition from extended to flexed position for shoulder flexion (18.7–20%), and just below the shoulder level for shoulder extension (6.9–9.9%). In the lower extremity, lower CV values were identified for the early ranges of knee flexion (6.5–7.6%) and extension (8.9–9.8%), and the midranges of hip flexion (19.1–19.3%) and hip extension (10.9–13.7%). For all joints tested, the highest CVs were consistent at the beginning and terminal positions of the motion tested.
Table 2. Coefficient of variation (CV, %) of relative torque in elbow and shoulder (a) and knee and hip (b) flexors and extensors at selected joint angles
(a)
Joint angle
Elbow flexion
Elbow extension
Shoulder flexion
Shoulder extension
– 45 N/A N/A 37.2 29 –30 N/A N/A 21.6 28.1 –15 N/A N/A 19 36.4 0 N/A N/A 20 24.1 15 31.1 48.5 18.7 18.1 30 23.2 28.2 24.6 16.1 45 16.4 17.4 22.8 13.6 60 9.4 7.5 24.6 9.9 75 6.1 4.8 27.8 9.7 90 13.1 8.5 28.9 6.9
105 30.2 9 42.2 16 120 63.2 12.5 37.5 15.8
(b)
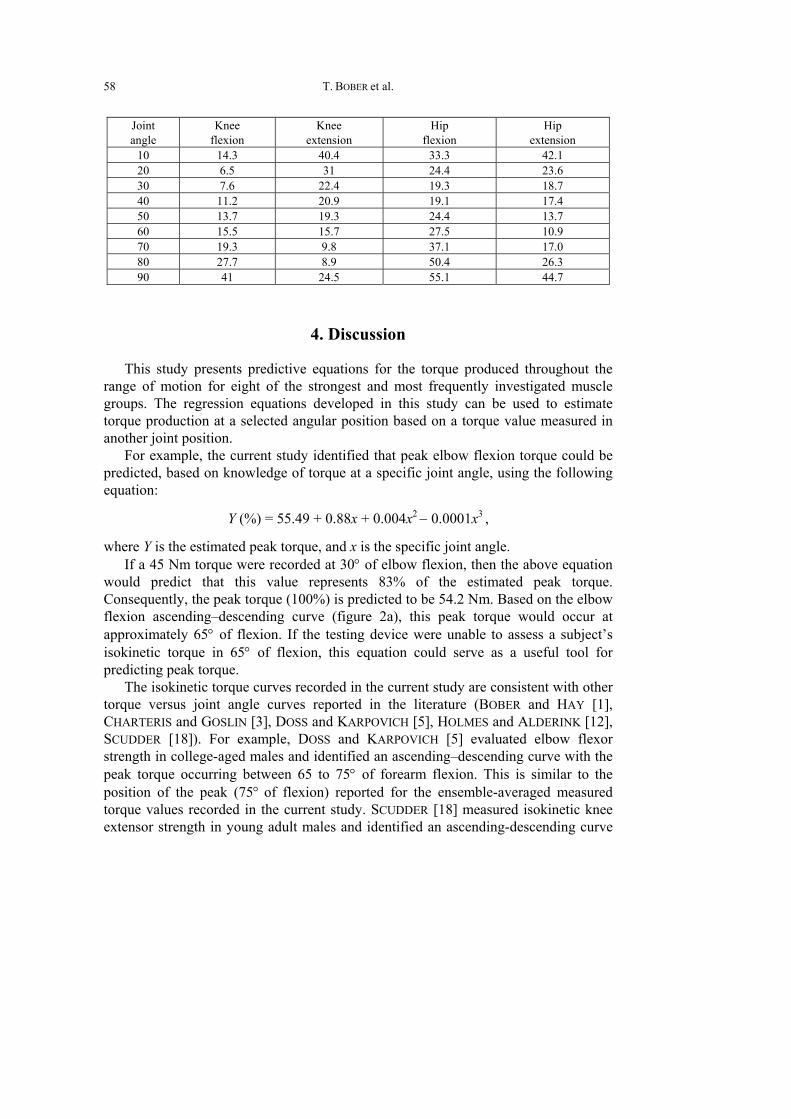
T. BOBER et al. 58
Joint angle
Knee flexion
Knee extension
Hip flexion
Hip extension
10 14.3 40.4 33.3 42.1 20 6.5 31 24.4 23.6 30 7.6 22.4 19.3 18.7 40 11.2 20.9 19.1 17.4 50 13.7 19.3 24.4 13.7 60 15.5 15.7 27.5 10.9 70 19.3 9.8 37.1 17.0 80 27.7 8.9 50.4 26.3 90 41 24.5 55.1 44.7
4. Discussion
This study presents predictive equations for the torque produced throughout the range of motion for eight of the strongest and most frequently investigated muscle groups. The regression equations developed in this study can be used to estimate torque production at a selected angular position based on a torque value measured in another joint position.
For example, the current study identified that peak elbow flexion torque could be predicted, based on knowledge of torque at a specific joint angle, using the following equation:
Y (%) = 55.49 + 0.88x + 0.004x2 − 0.0001x3 ,
where Y is the estimated peak torque, and x is the specific joint angle. If a 45 Nm torque were recorded at 30° of elbow flexion, then the above equation
would predict that this value represents 83% of the estimated peak torque. Consequently, the peak torque (100%) is predicted to be 54.2 Nm. Based on the elbow flexion ascending–descending curve (figure 2a), this peak torque would occur at approximately 65° of flexion. If the testing device were unable to assess a subject’s isokinetic torque in 65° of flexion, this equation could serve as a useful tool for predicting peak torque.
The isokinetic torque curves recorded in the current study are consistent with other torque versus joint angle curves reported in the literature (BOBER and HAY [1], CHARTERIS and GOSLIN [3], DOSS and KARPOVICH [5], HOLMES and ALDERINK [12], SCUDDER [18]). For example, DOSS and KARPOVICH [5] evaluated elbow flexor strength in college-aged males and identified an ascending–descending curve with the peak torque occurring between 65 to 75° of forearm flexion. This is similar to the position of the peak (75° of flexion) reported for the ensemble-averaged measured torque values recorded in the current study. SCUDDER [18] measured isokinetic knee extensor strength in young adult males and identified an ascending-descending curve
Predictive torque equations 59
with the peak torque occurring at 60° of extension, similar to the location of the peak (70°) reported in the current study.
The predictive equations developed in the current study are unique and do not have many counterparts in the literature. The shape of the predicted torque curves in the current study at times differed from that previously reported (CLARKE [4], SCHANNE [17]). The equations in the current study described an asymmetrical ascending–descending curve for seven of the eight joint motions assessed, similar in shape to the measured isokinetic and isometric torque curves. The only exception to this pattern was with the linear relationship predicted for shoulder flexion in the current study. In contrast, when using similar joint angles to those used for testing in this study, the equations developed by SCHANNE [17] and CLARKE [4] predicted a linear relationship for elbow extension, shoulder flexion, shoulder extension and knee flexion. These linear predictions differ from measured torque versus joint angle curves previously presented in the literature, (BOBER and HAY [1], CHARTERIS and GOSLIN [3], DOSS and KARPOVICH [5], GALLAGHER et al. [6], HOLMES and ALDERINK [12], SCUDDER [18]). The second area of difference was the angle at which the peak predicted torque occurred.
Several factors may influence the interpretation of the predictive equations developed in the current study. The factors include the method for obtaining experimental torque values in the clinic, the influence of limb dominance on torque production, the subject population studied, and the shape of the curves.
Strength measurements were obtained isokinetically at a low velocity to avoid fatigue during repeated maximal effort isometric tests. It is well known that torque values obtained during concentric isokinetic testing are lower than isometric torque values. Although differences in peak values have been documented, the neuromechanical properties of muscle contraction suggest a relationship between static and dynamic strength, especially during slow velocity contractions (HILL [11], LIEBER [15]). BOBER and HAY [1] reported a statistically significant correlation between static and isokinetic (60°/sec) torque production (the correlation coefficient ranging from 0.90 for elbow flexion to 0.71 for hip flexion and 0.59 for hip extension). This strong relationship allowed prediction of static torque from dynamic torque value in younger subjects (BOBER and HAY [1]).
Coefficient of variation reflects the variability in subjects as well as in joint positions. The variability observed throughout the range of motion (i.e., higher CV at the end ranges of joint motion than at the mid-range of joint motion) reflects the accuracy of testing position, reliability of dynamic testing and instructions to the subject. The higher coefficient of variation values recorded at the end ranges in the current study indicates that predictions of torque production at the end range positions are less accurate than predictions about torque in the mid-ranges.
In the clinical setting, implementation of these predictive equations will be most accurate if torque testing is performed in the same position as described in this study. HERZOG et al. [10] documented that the knee position during hip testing altered torque values. CHARTERIS and GOSLIN [3] also found that the hip flexion angle during knee
T. BOBER et al. 60
extension and flexion testing could have a significant effect on knee torque. The finding of HERZOG et al. [10] and CHARTERIS and GOSLIN [3] reinforce the importance of using similar testing protocols for assessing strength in order to predict torque at other joint angles.
The accuracy of the torque values predicted based on these equations will be affected by the reliability of the device used for assessing strength (HEINRICHS et al. [9]). The Merac comprehensive strength dynamometer used in the current study was previously found to reliably assess torque (BOBER and HAY [1]). Use of other less reliable devices, however, might contribute to errors in predicting torque.
Experimental data for the current study were obtained for the right extremity only, raising the issue of the influence of limb dominance on torque values. HOLMES and ALDERINK [12] compared torque production of the left and right knee extensors and flexors and found no difference between the two extremities. WYATT and EDWARDS [19] found no difference between right and left knee extensor torque production in female subjects but identified a difference in male subjects for the same muscle group. GALLAGHER et al. [6] found no difference in arm dominance in elbow extensors but identified a difference in elbow flexors. None of these studies, however, identified a difference between limbs in the angular position where peak torque was identified in the current study. Therefore, since the current study reports relative torque values in reference to the peak torque, limb dominance should not prevent the use of the predictive equations identified in the current study for either extremity.
The relatively homogeneous nature of the current study group suggests that the most appropriate population to target for using these predictive equations would be young, healthy males. GALLAGHER et al. [6] found that older adults reached their peak elbow flexion and extension torque earlier than younger adults. Therefore, the use of these predictive equations for older adults has to be implemented with caution.
In summary, the regression equations developed in the current study can be used to predict torque anywhere in the sagittal plane range of motion based on knowledge of a torque recorded at another joint angle for the elbow, shoulder, knee, or hip joint. These equations can be used in the clinical setting when a direct examination of strength capability is not possible due to limitations in equipment or to the presence of pain within the arc of motion. Predictions of torque produced in the midrange of the arc of motion will be most accurate.
References
[1] BOBER T., HAY J.G., Topografia siły głównych mięśni kończyn człowieka, Wychowanie Fizyczne i Sport, 1990, 3, 3–22.
[2] BUCHNER D.M., LARSON E.B., WAGNER E.H., KOEPSELL T.D., De LATEUR B.J., Evidence for a non-linear relatonship between leg strength and gait speed, Age Ageing, 1996, 25(5), 386–391.
[3] CHARTERIS J., GOSLIN B.R., In vivo approximations of the classic in vitro length–tension relationship: An isokinetic evaluation, Journal of Orthopaedic and Sports Physical Therapy, 1986, 7(5), 222–231.
Predictive torque equations 61
[4] CLARKE H.H., Muscular strength and endurance in man, Englewood Cliffs, NJ, 1966, Prentice Hall, pp. 1–51.
[5] DOSS W.S., KARPOVICH P.V., A comparison of concentric, eccentric and isometric strength of elbow flexors, J. Appl. Physiol., 1965, 20(2), 351–353.
[6] GALLAGHER M.A., CUOMO F., POLONSKY L., BERLINER K., ZUCKERMAN J.D., Effects of age, testing speed and arm dominance on isokinetic strength of the elbow, J. Shoulder Elbow Sugr., 1997, 6(4), 340–346.
[7] GRAVEL D., GAGNON M., PLAMONDON A., DESJARDINS P., Development and application of predictive equations of maximal static moments generated by the trunk musculature, Clin. Biomech., 1997, 12(5), 314–324.
[8] GRAVES J.E., POLLOCK M.L., JONES A.E., COLVIN A.B., LEGGETT S.H., Specificity of limited range of motion variable resistance training, Med. Sci. Sports Exerc., 1989, 21(1), 84–89.
[9] HEINRICHS K.I., PERRIN D.H., WELTMAN A., GIECK J.H., BALL D.W., Effect of protocol and assessment device on isokinetic peak torque on the quadriceps muscle group, Isokinetic and Exercise Science, 1995, 5, 7–13.
[10] HERZOG W., HASLER E.M., ABRAHAMSE S.K., A comparison of knee extensor strength curves obtained theoretically and experimentally, Medicine and Science in Sports and Exercise, 1991, 23, 108–114.
[11] HILL A.V., First and Last Experiments in Muscle Mechanics, London, Cambridge University Press, 1970.
[12] HOLMES J.R., ALDERINK G.J., Isokinetic strength characteristics of the quadratics femoris and hamstring muscles in high school students, Phys. Ther., 1984, 64(6), 914–918.
[13] KUMAR S., DUFRESNE R.M., VAN SCHOOR T., Human trunk strength profile in flexion and extension, Spine, 1995, 20(2), 160–168.
[14] KUMAR S., DUFRESNE R.M., VAN SCHOOR T., Human trunk strength profile in lateral flexion and axial rotation, Spine, 1995, 20(2), 169–177.
[15] LIEBER R.L., Skeletal Muscle Structure and Function: Implications for Rehabilitation and Sports Medicine, Baltimore, Williams and Wilkins, 1992.
[16] SALEM G.J., WANG M.Y., YOUNG J.T., MARION M., GREENDALE G.A., Knee strength and lower- and higher-intensity functional performance in older adults, Med. Sci. Sports Exerc., 2000, 32(10), 1679–1684.
[17] SCHANNE F.J.J., A Three-Dimensional Hand Force Capability Model for a Seated Person, Volumes I and II, 1972.
[18] SCUDDER G.N., Torque curves produced at the knee during isometric and isokinetic exercise, Arch. Phys. Med. Rehabil., 1980, 61(2), 68–73.
[19] WYATT M.P., EDWARDS A.M., Comparison of quadriceps and hamstring torque values during isokinetic exercise, Journal of Orthopaedic and Sports Physical Therapy, 1981, 3, 48–55.


![T Geared Torque Motors - · PDF fileMa mot [Nm] = Starting torque (rated torque) of the torque motor MT.. = Torque motor series up to size 100 ... Only for gear unit mounting Type](https://img.pdfslide.us/doc/110x75/5a78956e7f8b9ab8768d2d41/t-geared-torque-motors-mot-nm-starting-torque-rated-torque-of-the-torque.jpg)


![Torque Converter Voith Torque Converter[1]](https://img.pdfslide.us/doc/110x75/55cf992e550346d0339c0bc5/torque-converter-voith-torque-converter1.jpg)