Embed Size (px)
Citation preview

HAL Id: hal-01273157https://hal-centralesupelec.archives-ouvertes.fr/hal-01273157
Submitted on 13 Apr 2017
HAL is a multi-disciplinary open accessarchive for the deposit and dissemination of sci-entific research documents, whether they are pub-lished or not. The documents may come fromteaching and research institutions in France orabroad, or from public or private research centers.
L’archive ouverte pluridisciplinaire HAL, estdestinée au dépôt et à la diffusion de documentsscientifiques de niveau recherche, publiés ou non,émanant des établissements d’enseignement et derecherche français ou étrangers, des laboratoirespublics ou privés.
Predictive model for tensile strength of pharmaceuticaltablets based on local hardness measurements
Audrey Juban, Cécile Nouguier-Lehon, Stéphanie Briancon, Thierry Hoc,François Puel
To cite this version:Audrey Juban, Cécile Nouguier-Lehon, Stéphanie Briancon, Thierry Hoc, François Puel. Pre-dictive model for tensile strength of pharmaceutical tablets based on local hardness measure-ments. International Journal of Pharmaceutics, Elsevier, 2015, 490 (1-2), pp. 438-445.�10.1016/j.ijpharm.2015.05.078�. �hal-01273157�

1
To cite this article: A. JUBAN, C. NOUGUIER-LEHON, S. BRIANCON, T. HOC, F. PUEL, 2015 Predictive model for tensile strength of pharmaceutical tablets based on local hardness measurements International Journal of Pharmaceutics 490, 438-445 http://dx.doi.org/10.1016/j.ijpharm.2015.05.078
Predictive model for tensile strength of pharmaceutical tablets based on local hardness measurements
Audrey JUBANa, Cécile NOUGUIER-LEHONb, Stéphanie BRIANCONa, Thierry HOCb, François PUELa,c.
a Université de Lyon, F-69622 Lyon, France. Université Lyon 1, Villeurbanne, CNRS, UMR5007, Laboratoire d’Automatique et de Génie des Procédés (LAGEP), CPE-Lyon, 43 bd du 11 Novembre 1918, 69622 Villeurbanne Cedex, France
b Université de Lyon, LTDS UMR CNRS 5513, Ecole Centrale de Lyon, 36 avenue Guy de Collongue, 69134 ECULLY cedex, France
c Université Paris Saclay, CentraleSupélec Paris, Laboratoire de Génie des Procédés et Matériaux
(LGPM), EA 4038, Grande Voie des Vignes, 92290 Châtenay-Malabry, France
Corresponding author : Prof. F. Puel, +33 (0)1 411 311 09, [email protected]
Abstract
In the pharmaceutical field, tablets are the most common dosage forms for oral administration. During
the manufacture of tablets, measures are taken to assure that they possess a suitable mechanical
strength to avoid crumbling or breaking when handling while ensuring disintegration after
administration. Accordingly, the tensile strength is an essential parameter to consider. In the present
study, microscopic hardness and macroscopic tensile strength of binary tablets made from
microcrystalline cellulose and caffeine in various proportions were measured. A relationship between
these two mechanical properties was found for binary mixture. The proposed model was based on two
physical measurements easily reachable: hardness and tablet density. Constants were determined
from the two extreme compositions of this given system. This model was validated with experimental
results, and a comparison was made with the one developed by Wu et al. (2005). Both models are
relevant for this studied system. Nonetheless, with this model, the tablet tensile strength can be
connected with a tablet characteristic at microscopic scale in which porosity is not needed.

2
Keywords
Tablet tensile strength
Powder mixture
Predictive model
Direct compression
Nanoindentation
Diametral compression test
Chemical compounds studied in this article
Caffeine (PubChem CID: 2519); Microcrystalline cellulose (PubChem CID: 14055602)

3
1. Introduction
In the pharmaceutical field, tablets are the most common dosage form for oral administration and
these forms occupy two thirds of the global drug market (Wu and Seville, 2009). Tablets are composed
of numerous particulate materials that are bound together under pressure in order to be delivered as
a unit. The nature of these compounds (physical and chemical) as well as the processing conditions are
crucial for the properties of the blend and, consequently, the tablet ones (Tejedor et al., 2015). For
example, it is well known that the macroscopic dissolution of tablets depends on the physicochemical
properties of the micrometric powders such as contact angle, surface area and particle size (Tran et
al., 2015; Leonardi and Salomon, 2013). In the same way, recent studies have been conducted on
mechanical properties (Tejedor et al., 2015; Al-khattawi et al., 2014; Sun, 2011; Narayan and Hancock,
2003). However, the relationship between mechanical properties at different scale is not yet fully
understood. Concerning the processing conditions for the tablets manufacturing, the use of direct
compression has rapidly increased in the past few years due to its economic interest and its process
which avoids the steps of the wet granulation and drying processes.
During tablet manufacturing, measures are taken to ensure that tablets possess a suitable mechanical
strength to avoid crumbling or breaking when handling. According to the European Pharmacopoeia
(European Pharmacopeia, 2014) two mandatory tests are proposed to determine mechanical strength
of tablets: friability of uncoated tablets and resistance to crushing of tablets based on diametral
compression test (sections 2.9.7 and 2.9.8, respectively). The latter one, using a tablet tester,
determines the force, usually expressed in Newton (N), needed to disrupt tablets by crushing. The
literature has suggested other tests for the practical determination of the mechanical strength of
tablets like the three-point bending test, biaxial compression test, etc... (see Podczeck (2012) for a
complete review). Nevertheless the diametral compression test is the easiest to implement.
A more thorough study of tablets requires the knowledge of other characteristics. Density, and
porosity, were generally used to study the compression behaviour of the powder mixture
corresponding to powder compactability and powder compressibility (ability to reduce their volume
under pressure). In the literature, several studies dealt with the understanding of the compressibility
according to the properties of the pure components. These studies were based on global models
commonly used in the pharmaceutical field such as Heckel model (Heckel, 1961, Ilkka and Paronen,
1993, Van Veen et al., 2000) or Kawakita model (Kawakita and Lüdde, 1970, Frenning et al., 2009,
Mazel et al., 2011, Busignies et al., 2012). However, Denny (2002) made a comparison between these
two equations and finally concluded that Kawakita equation is a specific case of the modified Heckel
equation. In addition, there is no proven relationship between the powder compressibility and the
physical and mechanical properties of tablets.

4
Many authors h ave been interested in the study of tablet tensile strength of binary mixtures, using the
relative proportion of the two pure components (Chan et al., 1983; Kuentz and Leuenberger, 2000;
Ramirez et al., 2004; Michrafy et al., 2007). In all these studies, several unknown parameters were
needed. These parameters are not easily accessible such as characteristic parameters describing
intrinsic interaction between particles (Chan et al., 1983) or critical relative density for models using
percolation theory (Kuentz and Leuenberger, 2000; Ramirez et al., 2004; Michrafy et al., 2007).
In the same way, a simple model predicting the tensile strength of binary mixtures was developed by
Wu et al. (2005). These authors have adapted the Ryshkewitch–Duckworth equation (Duckworth,
1953) in which tensile strength of tablets made from a single compound depended on their porosity,
irrespective of the tablet dimensions. Using this approach two mixtures were studied: microcrystalline
cellulose (MCC) / hydroxypropylmethyl cellulose (HPMC) and MCC / Starch, each for three
compositions (90, 50 and 10 wt% of MCC and 80, 50 and 20 wt% of MCC, respectively). Tablets were
produced using an Instron universal testing machine and 800 mg powder samples were compressed
into a 13 mm die to a specified compression force ranging from 3 kN to 18 kN (corresponding to a
compression load ranging from 22 MPa to 135 MPa). A good estimation of the tablet tensile strength
was obtained for the two studied systems with an overestimation of the tensile strength for high
relative densities (≥ 0.85).
The purpose of the present study was to develop a simplified model in order to predict the tensile
strength of binary tablets from a local mechanical measurement performed at the surface of the tablet
(i.e hardness) and the tablet density. The performance of the present model was compared to the one
developed by Wu et al. (2005). The binary mixture contained anhydrous caffeine as the active
pharmaceutical ingredient (API) and microcrystalline cellulose (Avicel® PH-102, FMC Biopolymer) as
diluent. This model will be applied to predict the tablet tensile strength of a given system, for all
compositions and within in a wide range of compression loads.
5
2. Materials and methods
2.1. Materials
Two anhydrous caffeine crystalline forms exhibiting an enantiotropic relationship are known and called
Form I, stable from about 145 °C to its melting point 236 °C (Pinto and Diogo, 2006) and Form II, stable
from room temperature to 145 °C. The material used in this study was caffeine Form I (CFI). It was
obtained using the same method than Hubert et al. (2013) (based on the one suggested by Derollez et
al. (2005) and Griesser et al. (1999)) as follows. Commercial anhydrous caffeine Form II (purchased
from Cooper) was heated to 170 °C in an oven for 24 hours in order to anneal the Form II. Freshly Form
I was quickly cooled in liquid nitrogen until room temperature. On each batch a Differential Scanning
Calorimetry (DSC) analysis was performed at a heating rate of 10 °C/min from 20 °C to 270 °C and no
trace of the transition III was found. Microcrystalline cellulose (MCC), Avicel® PH-102, was obtained
from FMC Biopolymer. For each pure component the true particle density (ρ) was determined using a
helium pycnometer (Hubert, 2012).
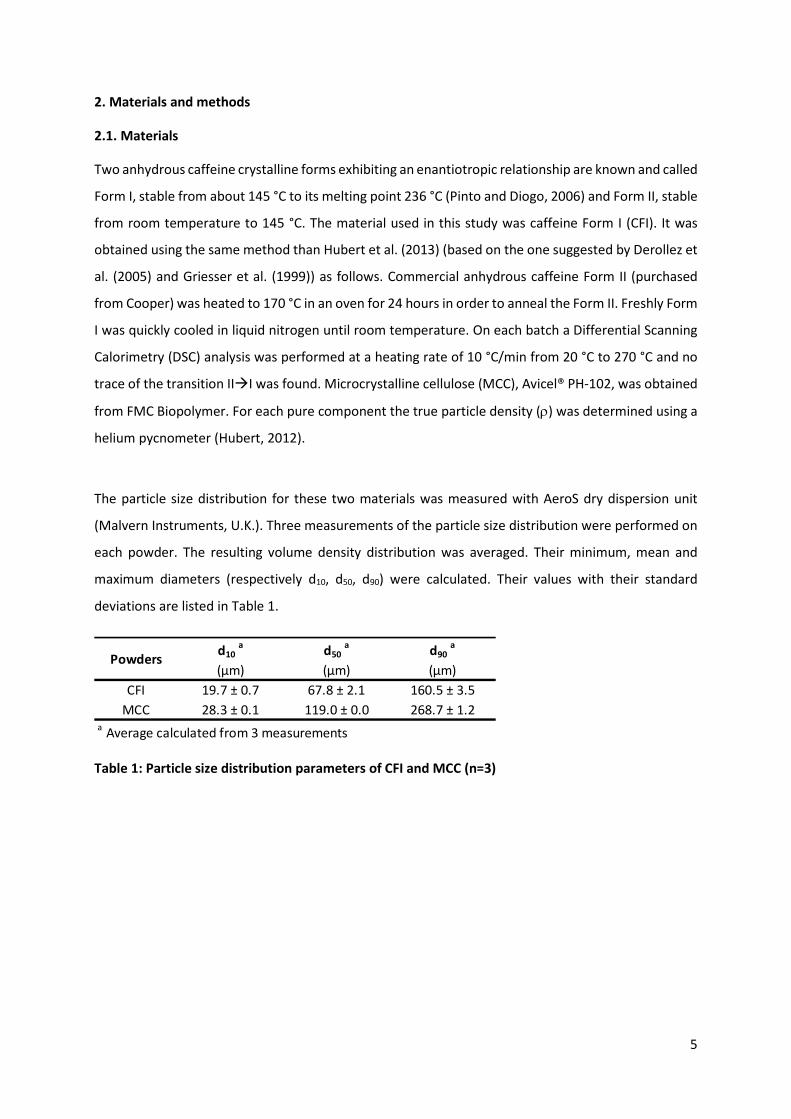
The particle size distribution for these two materials was measured with AeroS dry dispersion unit
(Malvern Instruments, U.K.). Three measurements of the particle size distribution were performed on
each powder. The resulting volume density distribution was averaged. Their minimum, mean and
maximum diameters (respectively d10, d50, d90) were calculated. Their values with their standard
deviations are listed in Table 1.
Table 1: Particle size distribution parameters of CFI and MCC (n=3)
Powders d10 a
(µm)d50 a
(µm)d90 a
(µm)CFI 19.7 ± 0.7 67.8 ± 2.1 160.5 ± 3.5
MCC 28.3 ± 0.1 119.0 ± 0.0 268.7 ± 1.2a Average calculated from 3 measurements

6
2.2. Tablets preparation
Cylindrical tablets were prepared with a binary mixture of anhydrous caffeine Form I (one day after its
manufacture) and MCC as a diluent. These two materials were mixed in various proportions with
caffeine content of 0, 10, 20, 30, 40, 50, 60, 78, 90 and 100 wt%. The blending was performed with a
tridimensional mixer (Turbula® T2F) at a rotational rate of 49 rpm for 10 minutes. The homogeneity of
the blend was assessed by measuring the caffeine content after mixing by DSC. The measurements
were realized in triplicate for each composition (three sampling performed in three positions in the
mixing vial). The relative difference between the measure and the theoretical caffeine content was
less than 5%. All tablets were made at constant mass (about 300 mg) by using a compaction simulator
Styl’One Classic (Medelpharm, Beynost, France) and its data acquisition software (Analis, 2.03 versions,
Medelpharm). This tableting press was a single station press where compression was made by the
lower punch. The compression forces were measured with an accuracy of 0.5% of full scale, and the
displacements of the punches were monitored using Linear Variable Differential Transformers (LVDTs)
with an accuracy of 50 µm for the lower punch. Standard Euro D tools with flat faces and 11.28 mm of
diameter were fitted on the simulator. The device deformation (including punch deformation) was
taken into consideration and measured before each experiment to correct the values of the
displacement. In the present study, tablets were produced with one main compression under three
different compression forces (5 kN, 10 kN, 20 kN) corresponding to a pressure of 50 MPa, 100 MPa and
200 MPa, respectively. In the following of this study, these three pressures will be called compression
loads.

7
2.3. Tablet characterization
Twenty tablets per composition at each compression load were made. The tablet weight, thickness
and diameter were measured using respectively a scale (AX 105 DeltaRange® ± 0.0001 g, Mettler-
Toledo, Greifensee, Switzerland) and a Mitutoyo micrometer (Absolute Digimatic ID-S Série 543-790B
± 0.003 mm, Codima Roboflux, Décines, France) just after compression according to the European
Pharmacopeia methods section 2.09.05 (European Pharmacopeia, 2014).
The tablet density d was calculated using Eq. (1); where w is the weight and V the volume of tablet.
𝑑𝑑 = 𝑤𝑤𝑉𝑉
(1)
The tablet porosity was calculated as follows (Eq. (2)):
𝜀𝜀 = 1 − � 𝑑𝑑𝜌𝜌𝑏𝑏𝑏𝑏𝑏𝑏𝑏𝑏𝑏𝑏
� (2)
where ρblend is the particle density of the blend (i.e. mixture with no porosity), calculated using Eq. (3):
1𝜌𝜌𝑏𝑏𝑏𝑏𝑏𝑏𝑏𝑏𝑏𝑏
= 𝑋𝑋𝐶𝐶𝐶𝐶𝐶𝐶𝜌𝜌𝐶𝐶𝐶𝐶𝐶𝐶
+ 1− 𝑋𝑋𝐶𝐶𝐶𝐶𝐶𝐶𝜌𝜌𝑀𝑀𝐶𝐶𝐶𝐶
(3)
where ρCFI and ρMCC are the particle density of anhydrous caffeine Form I and microcrystalline cellulose
particles, respectively, and XCFI is the mass fraction of anhydrous caffeine Form I in the mixture.
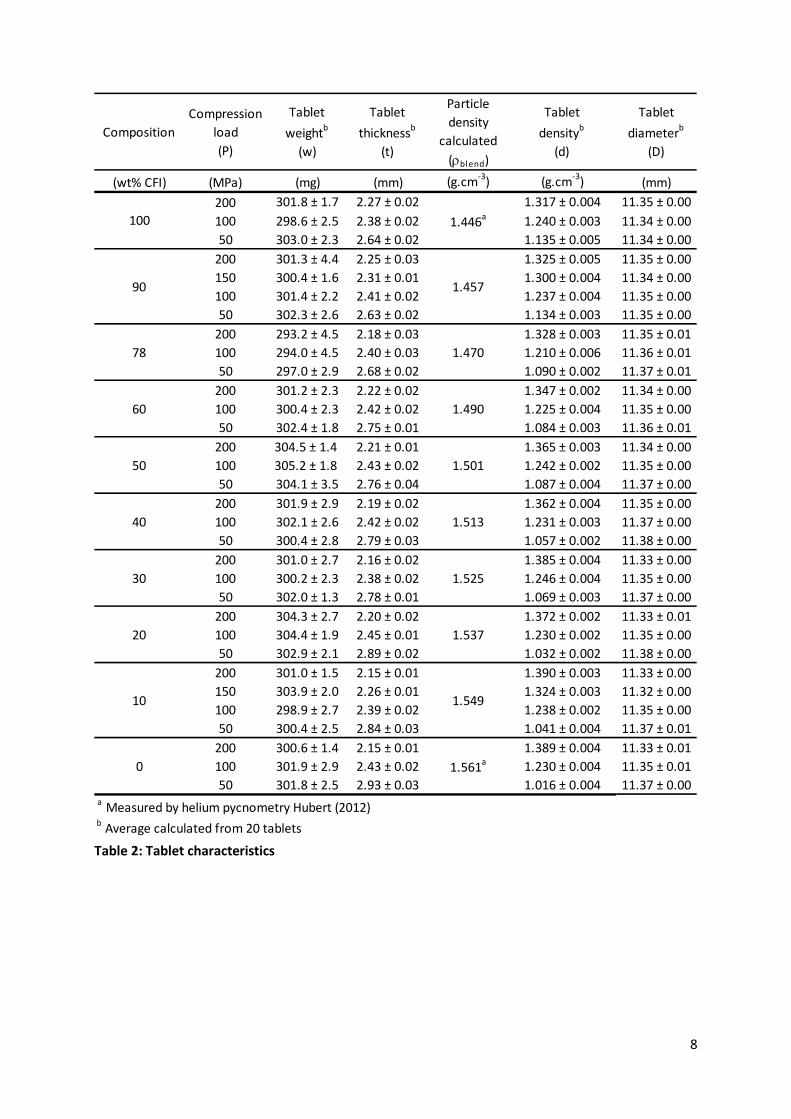
Table 2 shows the tablet characteristics.
8
Table 2: Tablet characteristics
CompositionCompression
load (P)
Tablet weightb
(w)
Tablet thicknessb
(t)
Particle density
calculated (ρblend)
Tablet densityb
(d)
Tablet diameterb
(D)
(wt% CFI) (MPa) (mg) (mm) (g.cm-3) (g.cm-3) (mm)200 301.8 ± 1.7 2.27 ± 0.02 1.317 ± 0.004 11.35 ± 0.00100 298.6 ± 2.5 2.38 ± 0.02 1.240 ± 0.003 11.34 ± 0.0050 303.0 ± 2.3 2.64 ± 0.02 1.135 ± 0.005 11.34 ± 0.00
200 301.3 ± 4.4 2.25 ± 0.03 1.325 ± 0.005 11.35 ± 0.00150 300.4 ± 1.6 2.31 ± 0.01 1.300 ± 0.004 11.34 ± 0.00100 301.4 ± 2.2 2.41 ± 0.02 1.237 ± 0.004 11.35 ± 0.0050 302.3 ± 2.6 2.63 ± 0.02 1.134 ± 0.003 11.35 ± 0.00
200 293.2 ± 4.5 2.18 ± 0.03 1.328 ± 0.003 11.35 ± 0.01100 294.0 ± 4.5 2.40 ± 0.03 1.210 ± 0.006 11.36 ± 0.0150 297.0 ± 2.9 2.68 ± 0.02 1.090 ± 0.002 11.37 ± 0.01
200 301.2 ± 2.3 2.22 ± 0.02 1.347 ± 0.002 11.34 ± 0.00100 300.4 ± 2.3 2.42 ± 0.02 1.225 ± 0.004 11.35 ± 0.0050 302.4 ± 1.8 2.75 ± 0.01 1.084 ± 0.003 11.36 ± 0.01
200 304.5 ± 1.4 2.21 ± 0.01 1.365 ± 0.003 11.34 ± 0.00100 305.2 ± 1.8 2.43 ± 0.02 1.242 ± 0.002 11.35 ± 0.0050 304.1 ± 3.5 2.76 ± 0.04 1.087 ± 0.004 11.37 ± 0.00
200 301.9 ± 2.9 2.19 ± 0.02 1.362 ± 0.004 11.35 ± 0.00100 302.1 ± 2.6 2.42 ± 0.02 1.231 ± 0.003 11.37 ± 0.0050 300.4 ± 2.8 2.79 ± 0.03 1.057 ± 0.002 11.38 ± 0.00
200 301.0 ± 2.7 2.16 ± 0.02 1.385 ± 0.004 11.33 ± 0.00100 300.2 ± 2.3 2.38 ± 0.02 1.246 ± 0.004 11.35 ± 0.0050 302.0 ± 1.3 2.78 ± 0.01 1.069 ± 0.003 11.37 ± 0.00
200 304.3 ± 2.7 2.20 ± 0.02 1.372 ± 0.002 11.33 ± 0.01100 304.4 ± 1.9 2.45 ± 0.01 1.230 ± 0.002 11.35 ± 0.0050 302.9 ± 2.1 2.89 ± 0.02 1.032 ± 0.002 11.38 ± 0.00
200 301.0 ± 1.5 2.15 ± 0.01 1.390 ± 0.003 11.33 ± 0.00150 303.9 ± 2.0 2.26 ± 0.01 1.324 ± 0.003 11.32 ± 0.00100 298.9 ± 2.7 2.39 ± 0.02 1.238 ± 0.002 11.35 ± 0.0050 300.4 ± 2.5 2.84 ± 0.03 1.041 ± 0.004 11.37 ± 0.01
200 300.6 ± 1.4 2.15 ± 0.01 1.389 ± 0.004 11.33 ± 0.01100 301.9 ± 2.9 2.43 ± 0.02 1.230 ± 0.004 11.35 ± 0.0150 301.8 ± 2.5 2.93 ± 0.03 1.016 ± 0.004 11.37 ± 0.00
a Measured by helium pycnometry Hubert (2012)b Average calculated from 20 tablets
100 1.446a
90 1.457
78 1.470
60 1.490
50 1.501
40 1.513
0 1.561a
30 1.525
20 1.537
10 1.549

9
2.4. Nanoindentation
Nanoindentation tests were performed on tablets two days after their fabrication at ambient
temperature using a commercial nanoindenter (Agilent Nanoindenter G200, ScienTec, Les Ulis,
France). The Berkovich diamond tip had a pyramidal shape. Fused silica was used for calibration of the
contact surface area. Indentation tests were performed on the surface of the tablets. Ninety indents
(divided in ten areas) have been performed on the diametral line of the tablets (Figure 1) with a
minimum spacing of 400 µm of the borders and a minimum spacing of 200 µm between each
indentation print.
A constant strain rate of 0.05 s-1 and a maximum depth of 1.1 µm were imposed. The Continuous
Stiffness Measurement (CSM) method allows a determination of the Young’s modulus and the
hardness as functions of the displacement into the surface. In the present study, Oliver and Pharr’s
method was used (Oliver and Pharr, 1992) with the assumptions that apply to linear elastic isotropic
materials. The elastic properties of the diamond indenter were νi = 0.07 and Ei = 1131 GPa. The
hardness for each point was measured on the plateau between 3 and 9 µm. One measurement
corresponded to 240 seconds. Indentations resulting in poor curves were not included in the analysis.
Fig.1: Microscopic observation showing the indent prints made by nanoindentation with a Berkovich tip (tablet 100wt% excipient (MCC), compression load = 200 MPa)

10
2.5. Diametral compression test
Diametral compression tests were performed on tablets one day after their fabrication at the ambient
temperature using a tensile test device (ElectroPulsTM E10000, Instron®, Élancourt, France) and its data
acquisition software (WaveMatrixTM, Instron®). A sensor of 1kN was used. Diametral compression tests
were performed at a constant displacement rate of 0.01 mm.min-1 (to ensure a quasi-static test) with
an acquisition rate of 10 Hz. For each compression load (50 MPa, 100 MPa and 200 MPa), a minimum
of three tablets per composition were tested. The maximal diametral crushing force (F in Newtons)
was measured for each tablet and the tensile strength (σT in MPa) was calculated with Eq. (4)(Fell and
Newton, 1970), where D and t were the diameter and the thickness of the tablet, respectively :
𝜎𝜎𝑇𝑇 = 2.𝐹𝐹𝜋𝜋.𝐷𝐷.𝑡𝑡
(4)
2.6. Statistical analysis
Statistical analyses were conducted using the R (The R foundation) with a threshold of 5%
corresponding to the alpha risk. As all data were not normally distributed and variances were not
equal, consequently, data could not be normalized, a non-parametric Kruskal-Wallis test was
performed. In order to determine significant differences between mechanical properties of tablets and
their compositions and compression pressures, a multiple comparison post hoc test (kruskalmc) was
conducted.

11
3. Results
3.1. Tablet density
Table 2 reports the tablet density for different caffeine contents at the three compression loads. A
minimum of twenty tablets per composition, and per compression load were used to calculate the
mean tablet density (using Eq. 1) and the standard deviations. As expected the tablet density increased
with the compression load (1.094 ± 0.039 g.cm-3, 1.251 ± 0.008 g.cm-3 and 1.375 ± 0.027 g.cm-3 for 50
MPa, 100 MPa and 200 MPa respectively).
12
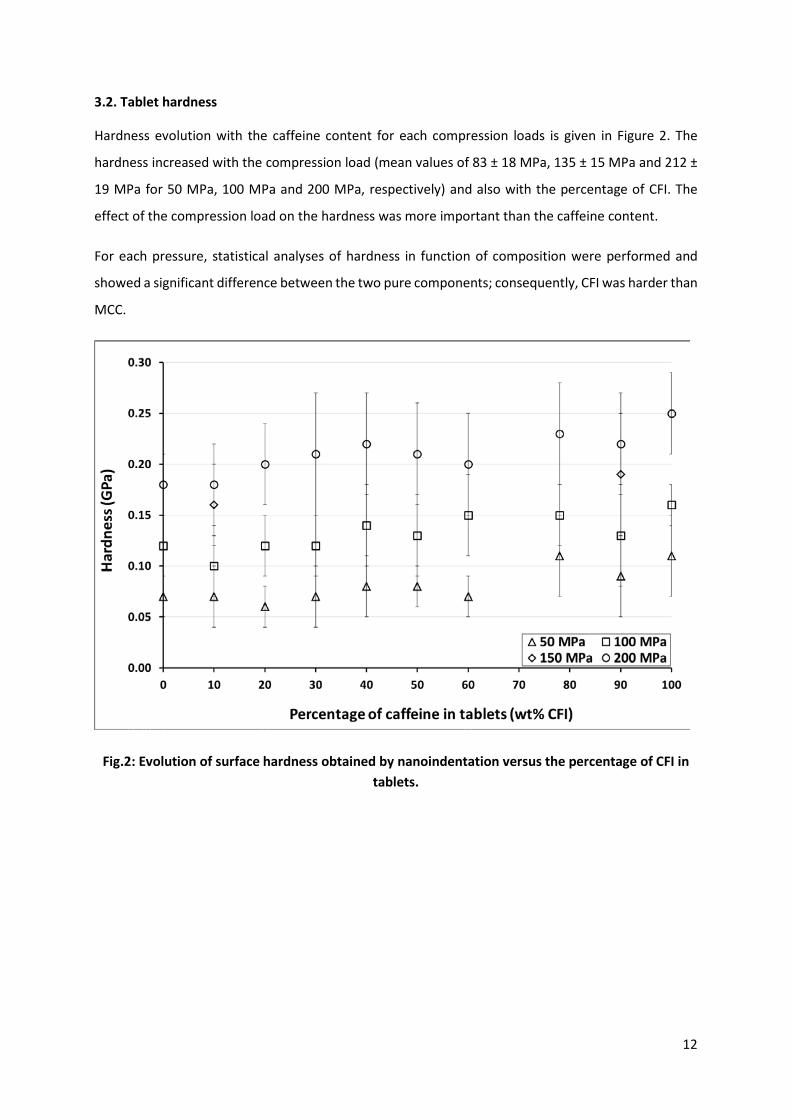
3.2. Tablet hardness
Hardness evolution with the caffeine content for each compression loads is given in Figure 2. The
hardness increased with the compression load (mean values of 83 ± 18 MPa, 135 ± 15 MPa and 212 ±
19 MPa for 50 MPa, 100 MPa and 200 MPa, respectively) and also with the percentage of CFI. The
effect of the compression load on the hardness was more important than the caffeine content.
For each pressure, statistical analyses of hardness in function of composition were performed and
showed a significant difference between the two pure components; consequently, CFI was harder than
MCC.
Fig.2: Evolution of surface hardness obtained by nanoindentation versus the percentage of CFI in tablets.
13
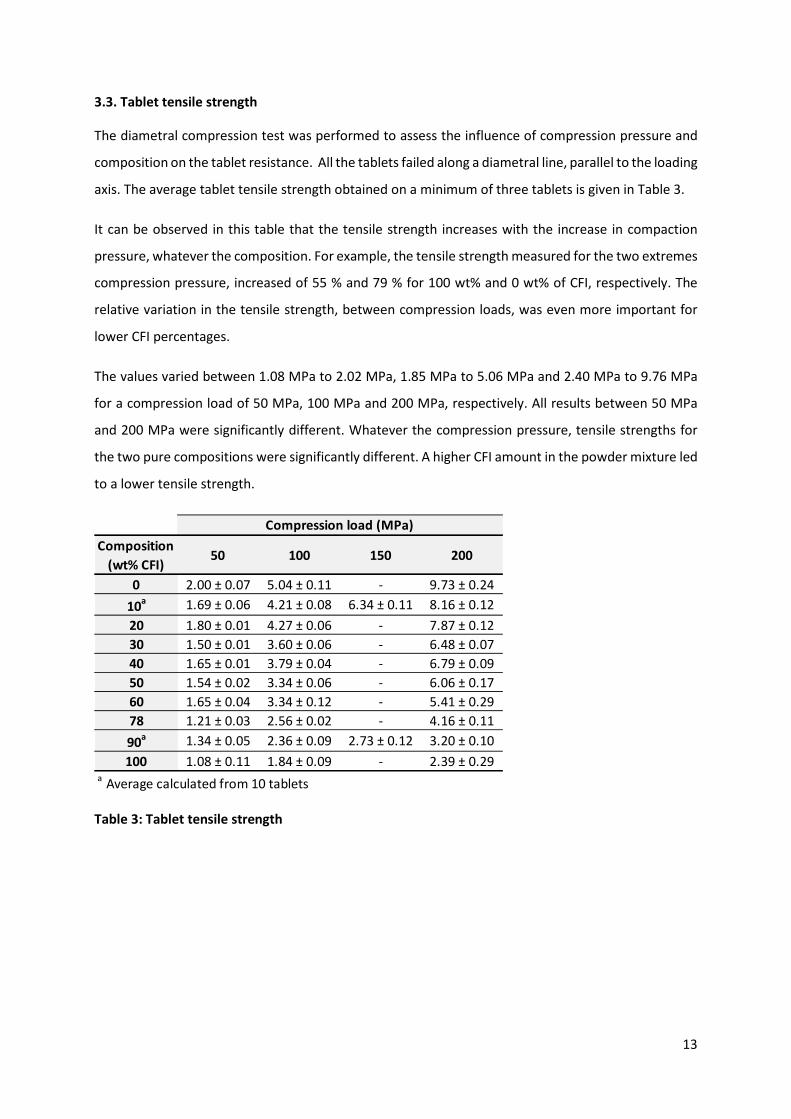
3.3. Tablet tensile strength
The diametral compression test was performed to assess the influence of compression pressure and
composition on the tablet resistance. All the tablets failed along a diametral line, parallel to the loading
axis. The average tablet tensile strength obtained on a minimum of three tablets is given in Table 3.
It can be observed in this table that the tensile strength increases with the increase in compaction
pressure, whatever the composition. For example, the tensile strength measured for the two extremes
compression pressure, increased of 55 % and 79 % for 100 wt% and 0 wt% of CFI, respectively. The
relative variation in the tensile strength, between compression loads, was even more important for
lower CFI percentages.
The values varied between 1.08 MPa to 2.02 MPa, 1.85 MPa to 5.06 MPa and 2.40 MPa to 9.76 MPa
for a compression load of 50 MPa, 100 MPa and 200 MPa, respectively. All results between 50 MPa
and 200 MPa were significantly different. Whatever the compression pressure, tensile strengths for
the two pure compositions were significantly different. A higher CFI amount in the powder mixture led
to a lower tensile strength.
Table 3: Tablet tensile strength
Composition(wt% CFI)
50 100 150 200
0 2.00 ± 0.07 5.04 ± 0.11 - 9.73 ± 0.2410a 1.69 ± 0.06 4.21 ± 0.08 6.34 ± 0.11 8.16 ± 0.1220 1.80 ± 0.01 4.27 ± 0.06 - 7.87 ± 0.1230 1.50 ± 0.01 3.60 ± 0.06 - 6.48 ± 0.0740 1.65 ± 0.01 3.79 ± 0.04 - 6.79 ± 0.0950 1.54 ± 0.02 3.34 ± 0.06 - 6.06 ± 0.1760 1.65 ± 0.04 3.34 ± 0.12 - 5.41 ± 0.2978 1.21 ± 0.03 2.56 ± 0.02 - 4.16 ± 0.1190a 1.34 ± 0.05 2.36 ± 0.09 2.73 ± 0.12 3.20 ± 0.10100 1.08 ± 0.11 1.84 ± 0.09 - 2.39 ± 0.29
a Average calculated from 10 tablets
Compression load (MPa)

14
3.4. Creation of a forecasting model of the tablet tensile strength
The objective was to determine a link between the macroscopic tensile strength and the microscopic
hardness in order to be able to predict a global characteristic of the tablets from the results obtained
by a local measurement (nanoindentation test). The tablet density, which is an essential tablet
characteristic, will be taken into account in the following of this study.
In the pharmaceutical field, the basis of direct compression is to add a key component (generally a
diluent) in the formulation which has the necessary degree of fluidity and compressibility. Other
ingredients could be included, such as lubricant, binder, glidant and/or disintegrating agent
(Armstrong, 2002). Hence, at minimum two ingredients (API and diluent) are required in the
formulation. To be consistent with the reality, binary mixtures (the two extreme compositions: 10 and
90 wt% of CFI) were chosen in order to develop a simple model for predicting a mechanical property
of tablets produced from powder mixtures. Figure 3 displays the tablet hardness multiplied by the
density (Hxd) according to the tensile strength of the tablets made at four compression loads. For each
mixture, a linear regression through the origin was plotted (slopes of the equations and correlation
coefficients are given in Table 4). The linear regression coefficient (R²) was always greater than 0.93.
Fig.3: Evolution of tablet hardness multiplied by the tablet density (H x d) versus the tensile strength of the tablets.
15
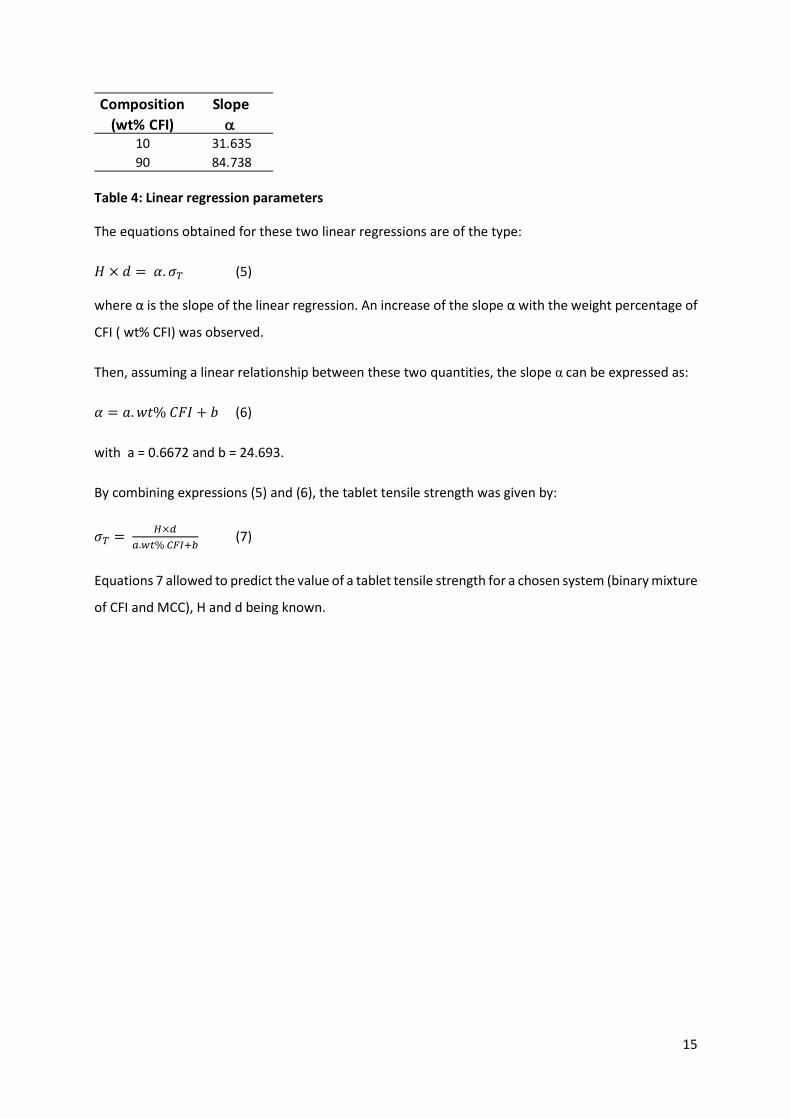
Table 4: Linear regression parameters
The equations obtained for these two linear regressions are of the type:
𝐻𝐻 × 𝑑𝑑 = 𝛼𝛼.𝜎𝜎𝑇𝑇 (5)
where α is the slope of the linear regression. An increase of the slope α with the weight percentage of
CFI ( wt% CFI) was observed.
Then, assuming a linear relationship between these two quantities, the slope α can be expressed as:
𝛼𝛼 = 𝑎𝑎.𝑤𝑤𝑤𝑤% 𝐶𝐶𝐶𝐶𝐶𝐶 + 𝑏𝑏 (6)
with a = 0.6672 and b = 24.693.
By combining expressions (5) and (6), the tablet tensile strength was given by:
𝜎𝜎𝑇𝑇 = 𝐻𝐻×𝑑𝑑𝑎𝑎.𝑤𝑤𝑡𝑡% 𝐶𝐶𝐹𝐹𝐶𝐶+𝑏𝑏
(7)
Equations 7 allowed to predict the value of a tablet tensile strength for a chosen system (binary mixture
of CFI and MCC), H and d being known.
Composition (wt% CFI)
Slopeα
10 31.63590 84.738
16
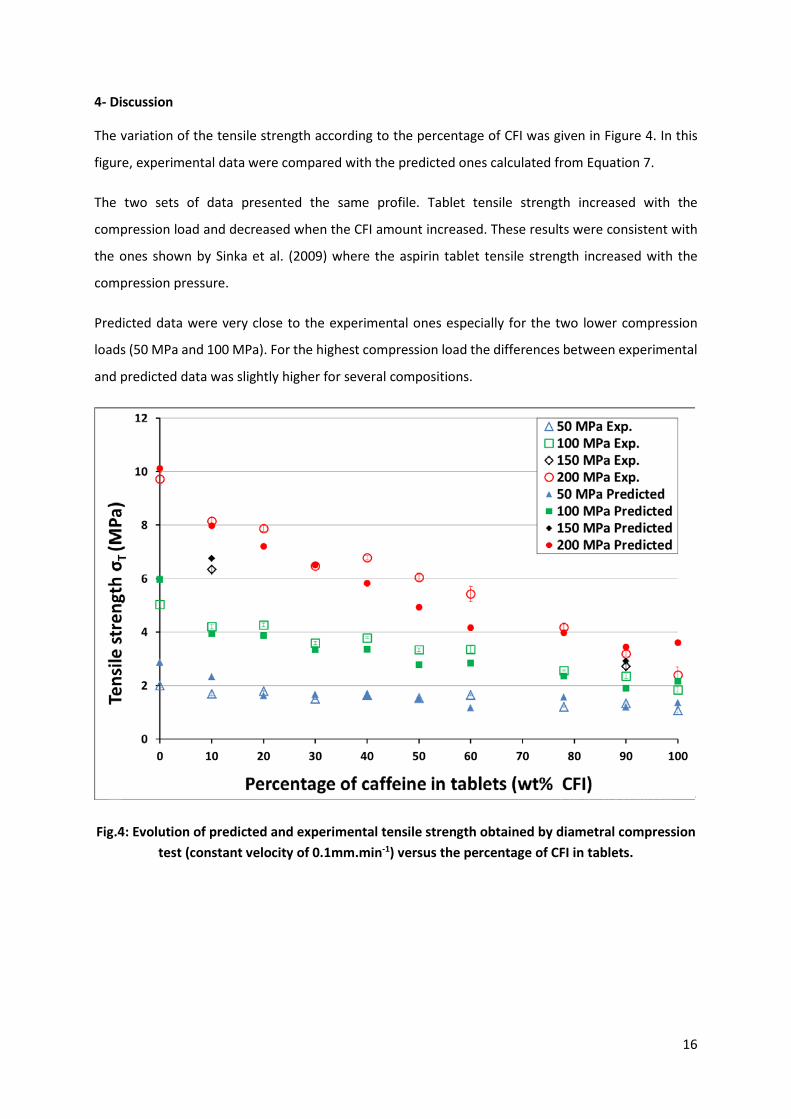
4- Discussion
The variation of the tensile strength according to the percentage of CFI was given in Figure 4. In this
figure, experimental data were compared with the predicted ones calculated from Equation 7.
The two sets of data presented the same profile. Tablet tensile strength increased with the
compression load and decreased when the CFI amount increased. These results were consistent with
the ones shown by Sinka et al. (2009) where the aspirin tablet tensile strength increased with the
compression pressure.
Predicted data were very close to the experimental ones especially for the two lower compression
loads (50 MPa and 100 MPa). For the highest compression load the differences between experimental
and predicted data was slightly higher for several compositions.
Fig.4: Evolution of predicted and experimental tensile strength obtained by diametral compression test (constant velocity of 0.1mm.min-1) versus the percentage of CFI in tablets.

17
In the literature, a simplified model predicting the tensile strength was developed by Wu et al. (2005).
The authors adapted the Ryshkewitch–Duckworth equation for binary mixtures. Ryshkewitch (1953)
found that the logarithm of the tensile strength of single compounds was inversely proportional to the
porosity by plotting the tensile strength as a function of the porosity. In a discussion of Ryskewitch’s
results, Duckworth (1953) developed the following equation (Eq. 8) to correlate the tensile strength
with the porosity for tablets made from a single component:
𝜎𝜎𝑡𝑡 = 𝜎𝜎𝑡𝑡0. 𝑒𝑒−𝑘𝑘𝑘𝑘 (8)
where ε is the tablet porosity, σt0 is the tensile strength at zero porosity and k is a constant representing
the bonding capacity. This latter parameter was fixed at 7 to reproduce all experimental data obtained
by these authors on several materials. Wu et al. (2005) adapted this model for binary tablets and
proposed the following equation (Eq.9):
𝜎𝜎𝑡𝑡𝑡𝑡 = 𝜎𝜎𝑡𝑡0. 𝑒𝑒−𝑘𝑘𝑚𝑚𝑘𝑘 (9)
where σm0 and km are the tensile strength at zero porosity and a constant representing the bonding
capacity of the mixture, respectively. These two parameters were calculated by using the mixing rule
and data obtained for pure components. In this model, a mixing rule was also used to calculate the
true density of binary mixtures and therefore to calculate the tablet porosity ε.
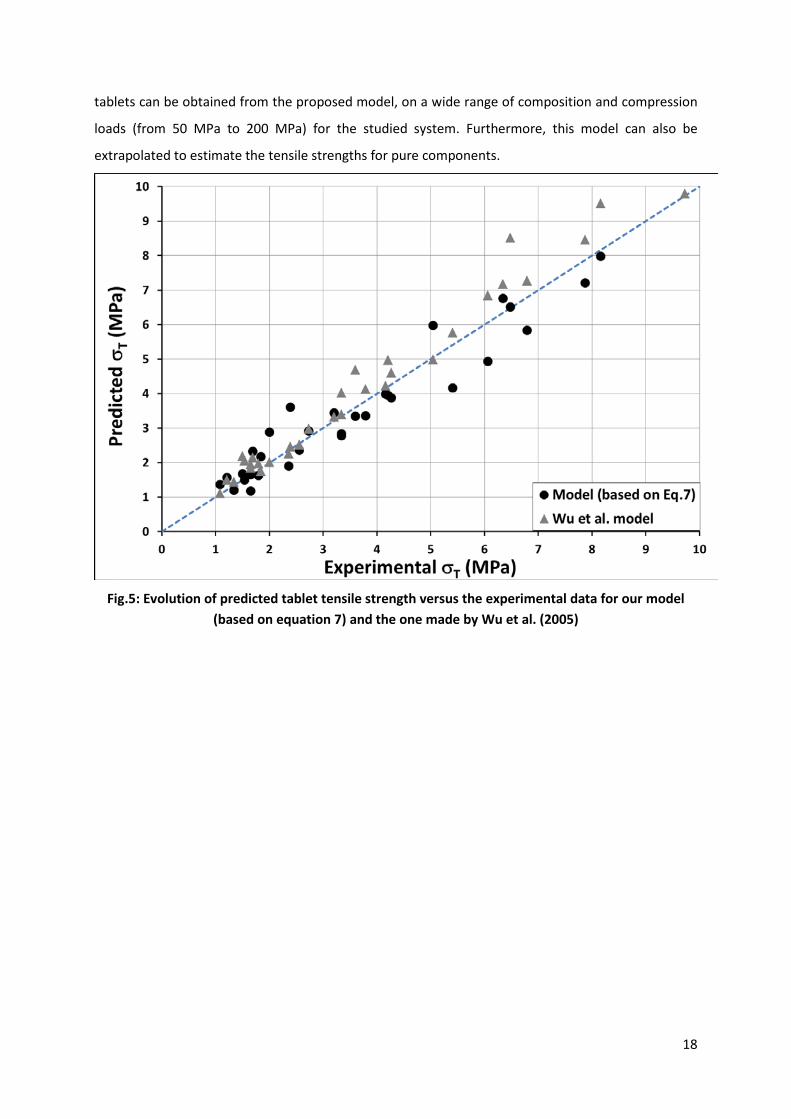
Figure 5 compares our model with the one proposed by Wu et al. (2005) for the prediction of tablet
tensile strength. Predicted data obtained with our model (based on Eq.7) and the ones calculated from
Wu et al.'s model (2005) were plotted according to the experimental values of tensile strength
measured in the present study. For both models, all points lie very close to the first bisector. The main
difference between these models was observed for higher experimental values of tensile strength.
Indeed, predicted values of tensile strength were underestimated with the newly developed model
and overestimated with the one made by Wu et al.'s (2005). Thus, both models are relevant for the
studied binary system (MCC/CFI). The mean relative deviation between predicted and experimental
tensile strength is 12% for the developed model and 14.5% for the one proposed by Wu et al. (2005).
In the present study, the proposed model has been derived from two physical measurements that are
easily accessible (hardness and tablet density), while the Wu et al. model was mainly based on mixing
rules for several parameters. It is worth to note that porosity (or tablet relative density) is not needed
in our model. This parameter, measured on pure component powder, requires the use of a mixing rule
to be approximated in the case of powder mixtures, and is often required in literature models.
Moreover, the multiscale approach proposed in the present study showed that macroscopic tensile
strength can be predicted using a local mechanical property (hardness obtained by nanoindentation
technique) and tablet density. Most significantly, a good estimation of tensile strengths of binary
18
tablets can be obtained from the proposed model, on a wide range of composition and compression
loads (from 50 MPa to 200 MPa) for the studied system. Furthermore, this model can also be
extrapolated to estimate the tensile strengths for pure components.
Fig.5: Evolution of predicted tablet tensile strength versus the experimental data for our model
(based on equation 7) and the one made by Wu et al. (2005)

19
Conclusion
In this work, hardness and tensile strength of binary tablets made from MCC and CFI in various
proportions were measured. A relationship between these two mechanical properties has been
established through an equation including tablet density and a simplified model was proposed.
The validity of this model was demonstrated with experimental data both for a wide range of
compositions (from 10 wt% to 90 wt% of CFI) and a compression load from 50 MPa to 200 MPa. Unlike
existing models to predict tablet tensile strength (models based on Ryshkewitch–Duckworth equation
or on the percolation theory), porosity is not needed. A comparison between our equation and the
one reported by Wu et al. (2005) for the prediction of tablet tensile strength showed that both are
applicable for the present studied system.
In this study, the tablet tensile strength can be connected with a tablet characteristic other than
porosity. Indeed, tablet tensile strength (global characteristic) can be predicted from a local
measurement on the tablets (tablet hardness).
Acknowledgements
The support of the Ministère de l’Enseignement Supérieur et de la Recherche is gratefully
acknowledged. We would like to thank Medelpharm especially T. Ménard, G. Tardy and B. Villa as well
as the engineers and technicians G. Conod-Nardi, B. Ponsard, O. Pollet and J.P. Valour for their
technical support. We also wish to thank the IVTV platform (ANR-10-EQPX-06-01).
References
Al-Khattawi, A., Alyami, H., Townsend, B., Ma, X., Mohammed, A.R., 2014. Evidence-based nanoscopic and molecular framework for excipient functionality in compressed orally disintegrating tablets. PLoS One, vol.9, p. e101369
Armstrong, N.A., 2002. Tablet manufacture. In: Swarbrick J, ed. Encyclopedia of pharmaceutical technology, vol. 3. 3rd ed. New York: Informa Healthcare Inc., 2723.
Busignies, V., Mazel, V., Diarra, H., Tchoreloff, P., 2012. Prediction of the compressibility of complex mixtures of pharmaceutical powders. Int. J. Pharm., 436, 862–868.
Chan, S.Y., Pilpel, N., Cheng, D.C.-H., 1983. The tensile strengths of single powders and binary mixtures. Powder Technol. 34, 173–189.
20
Denny, P.J., 2002. Compaction equations: A comparison of the Heckel and Kawakita equations. Powder Technol. 127, 162–172.
Derollez, P., Correia, N.T., Danede, F., Capet, F., Affouard, F., Lefebvre, J., Descamps, M., 2005. Ab initio structure determination of the high-temperature phase of anhydrous caffeine by X-ray powder diffraction. Acta Crystallogr. B61, 329–334.
Duckworth, W., 1953. Discussion of Ryshkewitch paper. J. Am. Ceram. Soc. 36, 68.
European Pharmacopoeia, 2014. Eighth edn.
Fell, J.T., Newton, J.M., 1970. Determination of tablet strength by the diametrical compression test. J. Pharm. Sci. 59, 688–691.
Frenning, G., Nordstrom, J., Alderborn, G., 2009. Effective Kawakita parameters for binary mixtures. Powder Technol. 189, 270–275.
Griesser, U.J., Szelagiewicz, M., Hofmeir, U., Pitt, C., Cianferani, S., 1999. Vapor pressure and heat of sublimation of crystal polymorphs. J. Therm. Anal. Calorim. 57, 45–60.
Heckel, R.W., 1961. Density–pressure relationship in powder compaction. Trans. Metall. Soc. AIME 221, 671–675.
Hubert, S. Transitions de phases solides induites par un procédé de compression directe : application à la caféine et à la carbamazépine, PhD Thesis, University of Lyon 1, France, 2012.
Hubert, S., Briancon, S., Hédoux, A., Guinet, Y., Paccou, L., Fessi, H., Puel, F., 2011. Process induced transformations during tablet manufacturing: phase transition analysis of caffeine using DSC and low frequency micro-Raman spectroscopy. Int. J. Pharm., 420, 76–83.
Ilkka, J., Paronen, P., 1993. Prediction of the compression behaviour of powder mixtures by the Heckel equation. Int. J. Pharm. 94, 181–187.
Kawakita, K., Lüdde, K., 1970/71. Some considerations on powder compression equations. Powder Technol. 4, 61–68.
Kuentz, M., Leuenberger, H., 2000. A new theoretical approach to tablet strength of a binary mixture consisting of a well and a poorly compactable substance. Eur. J. Pharm. Biopharm. 49, 151–159.
Leonardi, D., Salomon, C.J., 2013. Comparison of different mathematical models for the tensile strength–relative density profiles of binary tablets. J. Pharm. Sci. 102, 1016–1023.

21
Mazel, V., Busignies, V., Duca, S., Leclerc, B., Tchoreloff, P., 2011. Original predictive approach to the compressibility of pharmaceutical powder mixtures based on the Kawakita equation. Int. J. Pharm. 410, 92–98.
Michrafy, A., Michrafy, M., Kadiri, M.S., Dodds, J.A., 2007. Predictions of tensile strength of binary tablets using linear and power law mixing rules. Int. J. Pharm. 333, 118–126.
Narayan, P., Hancock, B.C., 2003. The relationship between the particle properties, mechanical behavior, and surface roughness of some pharmaceutical excipient compacts. Mater. Sci. Eng. A, 355, 24–36.
Oliver, W.C., Pharr, G.M. An improved technique for determining hardness and elastic modulus using load and displacement sensing indentation experiments. Journal of Materials Research Volume 7, Issue 06, 1992, pp 1564-1583
Pinto, S.S., Diogo, P., 2006. Thermochemical study of two anhydrous polymorphs of caffeine. J. Chem. Thermodyn. 38, 1515–1522.
Podczeck, F., 2012. Methods for the practical determination of the mechanical strength of tablets—from empiricism to science. Int. J. Pharm., 436, 214–232.
Ramirez, N., Melgoza, L.M., Kuentz, M., Sandoval, H., Caraballo, I., 2004. Comparison of different mathematical models for the tensile strength–relative density profiles of binary tablets. Eur. J. Pharm. Sci. 22, 19–23.
Ryshkewitch, E., 1953. Compression strength of porous sintered alumina and zirconia. J. Am. Ceram. Soc. 36, 65–68.
Sinka, I.C., Motazedian, F., Cocks, A.C.F., Pitt, K.G., 2009. The effect of processing parameters on pharmaceutical tablet properties. Powder Technol. 189, 276–284.
Sun, C.C., 2011. Decoding powder tabletability: roles of particle adhesion and plasticity. J. Adhes. Sci. Technol. 25, 483–499. Tejedor, M.B., Nordgren, N., Schuleit, M., Rutland, M.W., 2015. Tablet mechanics depend on nano and micro scale adhesion, lubrication and structure. Int. J. Pharm., 486, 315–323. Tran,T.H., Park, C., Kang, T., Park, Y.J., Oh, E., Lee, B.J., 2015. Micromeritic properties and instrumental analysis of physical mixtures and solid dispersions with adsorbent containing losartan: Comparison of dissolution-differentiating factors. Powder Technol. 272, 269-275. Van Veen, B., Maarschalk, K.V.D.V, Bolhuis, G.K., Zuurman, K., Frijlink, H.W., 2000. Tensile strength of tablets containing two materials with a different compaction behavior. Int. J. Pharm., 203, 71–79.

22
Wu, C.Y., Best, S.M., Bentham, A.C., Hancock, B.C., Bonfirld, W., 2005. A simple predictive model for the tensile strength of binary tablets. Eur. J. Pharm. Sci., 25, 331–336.
Wu, C.Y., Seville, J.P.K, 2009. A comparative study of compaction properties of binary and bilayer tablets. Powder Technol. 189, 285-294.