Embed Size (px)
Citation preview

Predictive Analytics atUniversity of Utah Health Care
Samir E. Abdelrahman, Ph.D.
Research Scientist
Department of Biomedical Informatics
University of Utah

Academic Career 2
●B.Sc.: operations research (mathematical and statistical modeling for solving industrial optimization problems)
●M.Sc. and PhD: computer science o Faculty of Computers and Information - Cairo Universityo Major: artificial intelligenceo Minor: programming languages and compilers
●Assistant professor at Cairo University●Cairo University research fellowship:
o Minnesota University – Computer Science Department
●Associate professor at Cairo University
●USA biomedical informatics research fellowshipsVanderbilt University, University of Illinois, and University of Utah
© Samir E. AbdelRahman – All rights reserved

Research Interests3
● Predictive analyticso S.E. AbdelRahman, M. Zhang, B.E. Bray, K. Kawamoto. A Three-step
Approach for the Derivation and Validation of High-Performing PredictiveModels Using an Operational Dataset: Congestive Heart Failure ReadmissionCase Study. BMCMedical Informatics And Decision Making. 14:41, May 2014
● Data mining and multi-agent Systemso S.E. AbdelRahman, R. Bahgat, G. M. Farag. Order Statistics Bayesian-Mining
Agent Modeling for Automated Negotiation. Informatica. 35:123-137, 2011
● Natural language processing applicationso H. Xu, S.E. AbdelRahman, Y. Lu, J. C. Denny, S. Doan. Applying Semantic-
Based Probabilistic Context-Free Grammar to Medical Language Processing –
A Preliminary Study on Parsing Medication Sentences. Journal of Biomedical
Informatics. 44(6):1068-1075, 2011
● Ontologieso S. Salim, S.E. AbdelRahman. A Multiple-Domain Ontology Builder. Coling.
pp. 967-975, 2010© Samir E. AbdelRahman – All rights reserved

Outline4
●Background
o What is predictive analytics?o Health care predictive analytics stageso Examples of health care applicationso Definitions
Predictive model performance measures P-value risk factor analysis
●Predictive analytics at University of Utah Health Care (UUHC)
o Predictive analytics pipelineo Clinical projects
© Samir E. AbdelRahman – All rights reserved

What is Predictive Analytics?5
● Predictive analytics is the practice of extractinginformation from existing data sets to learn patternsand predict future outcomes and risks
Data
PredictiveAnalytics
Knowledgeand
Decisions
© Samir E. AbdelRahman – All rights reserved
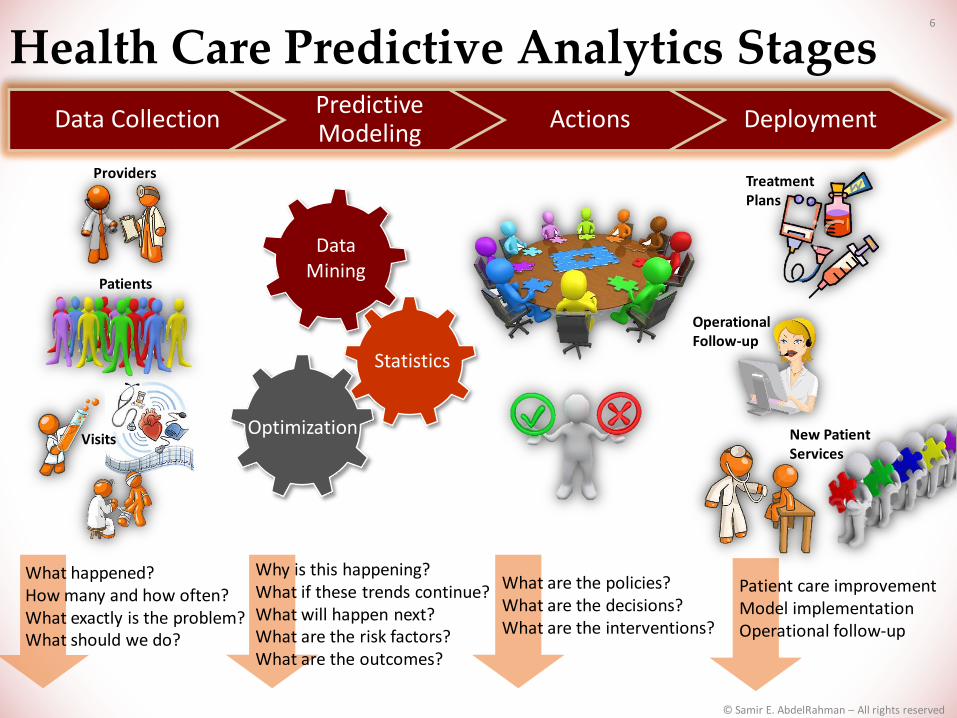
Health Care Predictive Analytics Stages6
Providers
Patients
Visits
Data CollectionPredictive Modeling
Actions Deployment
What happened?How many and how often?What exactly is the problem?What should we do?
DataMining
Optimization
Statistics
Why is this happening?What if these trends continue?What will happen next?What are the risk factors?What are the outcomes?
What are the policies?What are the decisions?What are the interventions?
Treatment Plans
Operational Follow-up
New Patient Services
Patient care improvementModel implementationOperational follow-up
© Samir E. AbdelRahman – All rights reserved

Example Health Care Applications7
Outcome of Interest Potential Intervention
Hospital readmission Intensively manage high-risk patients post-discharge
Appointment no-shows and last-minute cancellations
Contact intensively prior to appointment
Gastro-intestinal (GI) bleeding following Left Ventricular Assist Device (LVAD) implantation
Modify management and follow-up of high-risk patients post-op
Patient satisfaction Understand and address risk factors to improve patient experience
Sepsis mortality Rapid initiation of sepsis protocol
Resource utilization Allocate additional care management resources
© Samir E. AbdelRahman – All rights reserved

Predictive Model Performance Measures(Readmission Example)
8
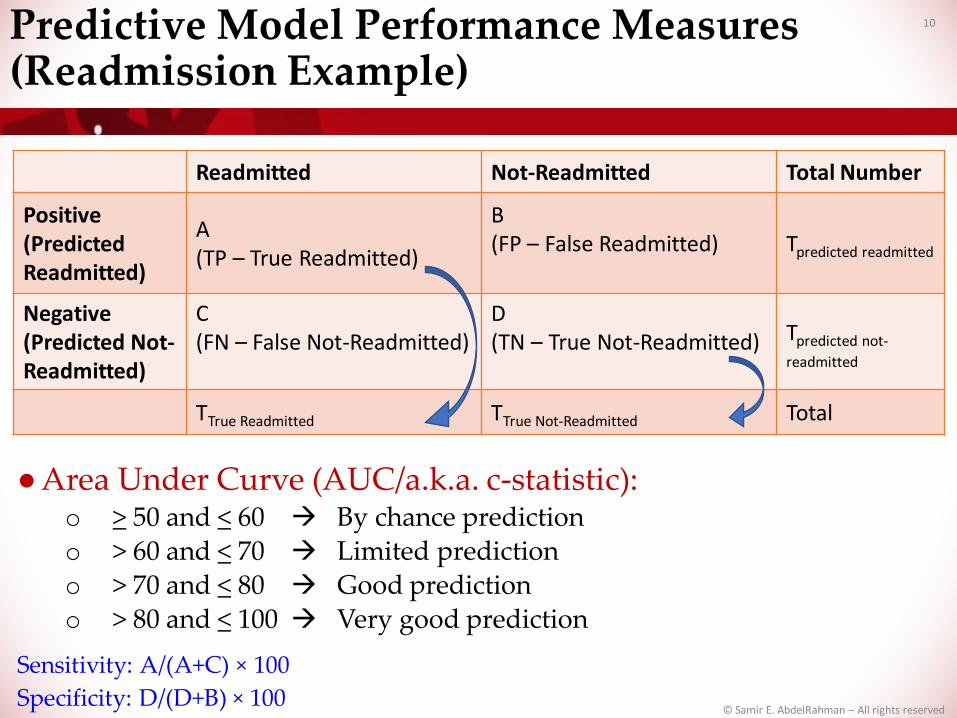
Readmitted Not-Readmitted Total Number
Positive(PredictedReadmitted)
A(TP – True Readmitted)
B(FP – False Readmitted) Tpredicted readmitted
Negative(Predicted Not-Readmitted)
C(FN – False Not-Readmitted)
D(TN – True Not-Readmitted) Tpredicted not-
readmitted
TTrue Readmitted TTrue Not-Readmitted Total
● Positive predictive value (PPV): probability that patient wasreadmitted when the model predicted patient would bereadmitted A/(A+B) × 100
● Negative predictive value (NPV): probability that patient wasnot readmitted when the model predicted patient would not bereadmitted D/(D+C) × 100
© Samir E. AbdelRahman – All rights reserved

Predictive Model Performance Measures(Readmission Example)
9
Readmitted Not-Readmitted Total Number
Positive(PredictedReadmitted)
A(TP – True Readmitted)
B(FP – False Readmitted) Tpredicted readmitted
Negative(Predicted Not-Readmitted)
C(FN – False Not-Readmitted)
D(TN – True Not-Readmitted) Tpredicted not-
readmitted
TTrue Readmitted TTrue Not-Readmitted Total
● Positive predictive value (PPV): probability that patient wasreadmitted when the model predicted patient would bereadmitted A/(A+B) × 100
● Negative predictive value (NPV): probability that patient wasnot readmitted when the model predicted patient would not bereadmitted D/(D+C) × 100
Maximize PPV and NPV …
© Samir E. AbdelRahman – All rights reserved
Predictive Model Performance Measures(Readmission Example)
10
● Area Under Curve (AUC/a.k.a. c-statistic):o > 50 and < 60 By chance prediction o > 60 and < 70 Limited predictiono > 70 and < 80 Good predictiono > 80 and < 100 Very good prediction
Sensitivity: A/(A+C) × 100
Readmitted Not-Readmitted Total Number
Positive(PredictedReadmitted)
A(TP – True Readmitted)
B(FP – False Readmitted) Tpredicted readmitted
Negative(Predicted Not-Readmitted)
C(FN – False Not-Readmitted)
D(TN – True Not-Readmitted) Tpredicted not-
readmitted
TTrue Readmitted TTrue Not-Readmitted Total
Specificity: D/(D+B) × 100© Samir E. AbdelRahman – All rights reserved

P-value for Risk Factor Analysis 11
●Is risk factor X associated with outcome of interest Y?o If there is a difference among the distributions of the X
values between the two populations of Y, e.g. readmittedand not-readmitted, then X is considered as a risk factor
● Readmission example:
o Is Age a risk factor?o H0 : 𝜇𝐴𝑔𝑒(𝑟𝑒𝑎𝑑𝑚𝑖𝑡𝑡𝑒𝑑) = 𝜇𝐴𝑔𝑒(𝑛𝑜𝑡 𝑟𝑒𝑎𝑑𝑚𝑖𝑡𝑡𝑒𝑑)
o H1 : 𝜇𝐴𝑔𝑒(𝑟𝑒𝑎𝑑𝑚𝑖𝑡𝑡𝑒𝑑) ≠ 𝜇𝐴𝑔𝑒(𝑛𝑜𝑡 𝑟𝑒𝑎𝑑𝑚𝑖𝑡𝑡𝑒𝑑)
o For example: if p-value < threshold (e.g. 0.005), then reject H0
Age has a significant impact on readmission riskelse we fail to reject H0
© Samir E. AbdelRahman – All rights reserved

12
Predictive Analytics at University of Utah
Health Care (UUHC)
© Samir E. AbdelRahman – All rights reserved

Health Care Predictive Analytics Stages13
Providers
Patients
Visits
Data CollectionPredictive Modeling
Actions Deployment
What happened?How many and how often?What exactly is the problem?What should we do?
DataMining
Optimization
Statistics
Why is this happening?What if these trends continue?What will happen next?What are the risk factors?What are the outcomes?
What are the policies?What are the decisions?What are the interventions?
Treatment Plans
Operational Follow-up
New Patient Services
Patient care improvementModel implementationOperational follow-up
© Samir E. AbdelRahman – All rights reserved

Problem Analysis Data AnalysisSystematic
Model Development
Risk Factor Analysis
Operational Application
Predictive Analytics Pipeline 14
Data CollectionPredictive Modeling
Actions Deployment
© Samir E. AbdelRahman – All rights reserved
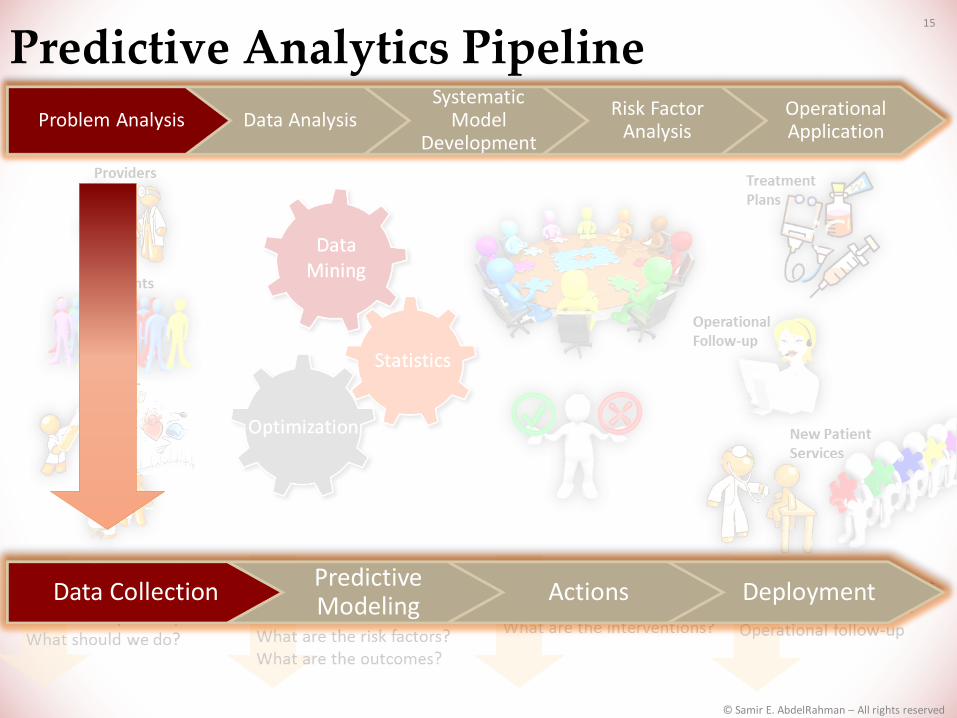
Predictive Analytics Pipeline 15
Data CollectionPredictive Modeling
Actions Deployment
Problem Analysis Data AnalysisSystematic
Model Development
Risk Factor Analysis
Operational Application
© Samir E. AbdelRahman – All rights reserved

Data CollectionPredictive Modeling
Actions Deployment
Predictive Analytics Pipeline 16
Problem Analysis Data AnalysisSystematic
Model Development
Risk Factor Analysis
Operational Application
© Samir E. AbdelRahman – All rights reserved

Data CollectionPredictive Modeling
Actions Deployment
Predictive Analytics Pipeline 17
Problem Analysis Data AnalysisSystematic
Model Development
Risk Factor Analysis
Operational Application
© Samir E. AbdelRahman – All rights reserved

Pipeline: Problem Analysis18
●Collaborate with experts and partners
●Determine the aim and the objectives
●Identify the explanatory and response (yes/no) variables– in some cases, the response variable is numeric (regression)o Expert and literature
●Collect an operational dataseto Data retrieval (e.g., from data warehouse)
Problem Analysis Data AnalysisSystematic
Model Development
Risk Factor Analysis
Operational Application
© Samir E. AbdelRahman – All rights reserved
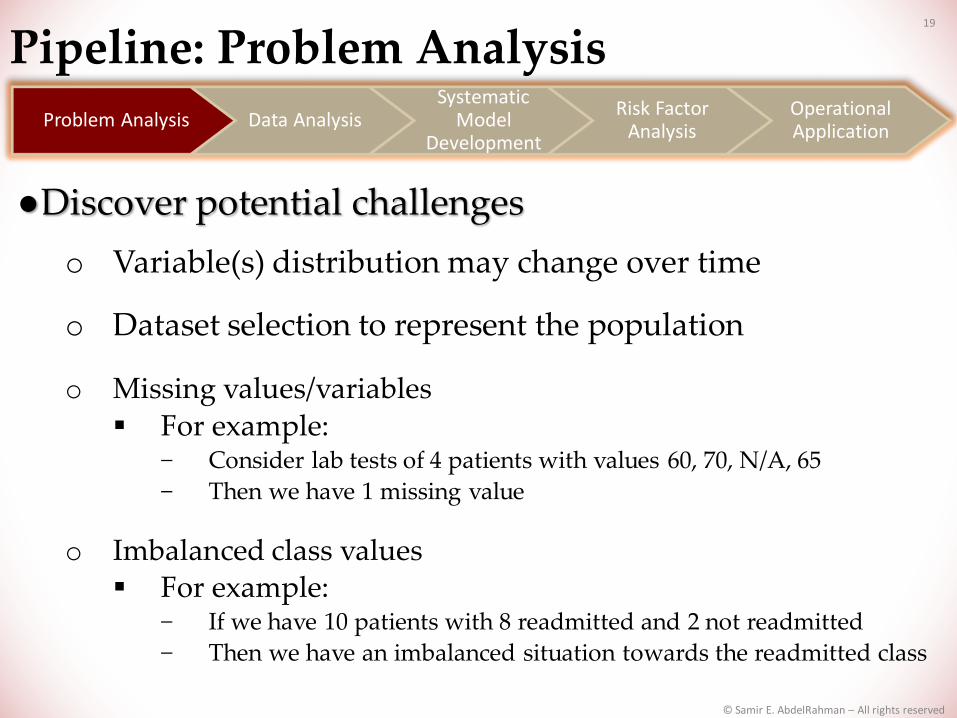
Pipeline: Problem Analysis19
●Discover potential challenges
o Variable(s) distribution may change over time
o Dataset selection to represent the population
o Missing values/variables
For example:− Consider lab tests of 4 patients with values 60, 70, N/A, 65
− Then we have 1 missing value
o Imbalanced class values For example:
− If we have 10 patients with 8 readmitted and 2 not readmitted
− Then we have an imbalanced situation towards the readmitted class
Problem Analysis Data AnalysisSystematic
Model Development
Risk Factor Analysis
Operational Application
© Samir E. AbdelRahman – All rights reserved

Pipeline: Data Analysis20
●Analyze the explanatory variables using descriptive statistical methods
●Divide the data into partitions of derivation and validation datasetso All variable exclusion and risk analysis should use only
derivation datasets
●Exclude (rule out) irrelevant variables o Correlation analysis among explanatory variables
Identify independent/dependent variables o Statistical variable exclusion methodso Statistical tests or p-value analysis between explanatory
variables and response variable
Problem Analysis Data AnalysisSystematic
Model Development
Risk Factor Analysis
Operational Application
© Samir E. AbdelRahman – All rights reserved

Pipeline: Systematic Model Development21
●Investigate all possible supervised learning techniques with variable selection methods to maximize positive/negative predictive valueo Feature selection/rankers methods and/or p-value statistical
test analysis
Problem Analysis Data AnalysisSystematic
Model Development
Risk Factor Analysis
Operational Application
© Samir E. AbdelRahman – All rights reserved

Pipeline: Systematic Model Development22
● To maximize positive/negative predictive value, we may also handle the data using some methods such as:
o Discretization methods Methods for transferring a numeric variable into discrete
counterparts For example: presenting age as intervals of 0-10, 11-20, ...
o Imputation methods Methods for filling missing variable values For example: given 4 patient lab tests: 60, N/A, 70, 65, then the
values may become 60, 65, 70, 65
o Imbalance methods Methods for balancing samples for each data class For example: under-sampling methods to deal with the highly
represented cases and others to over-sample the low ones
Problem Analysis Data AnalysisSystematic
Model Development
Risk Factor Analysis
Operational Application
© Samir E. AbdelRahman – All rights reserved

Pipeline: Risk Factor Analysis23
●We use statistical test and p-value analysismaximizing positive/negative predictive values toassess the significance of:o Risk factors ( e.g. age)o Risk factors values (e.g. age > 65 has high readmission
ratio)
Problem Analysis Data AnalysisSystematic
Model Development
Risk Factor Analysis
Operational Application
© Samir E. AbdelRahman – All rights reserved

Pipeline: Operational Application24
●Implement the computational coreo Model implementationo Backend implementation
●Meet with stakeholders to design interventions leveraging prediction model outcomes
● Design and implement the user interface applicationo Web interfaceo Client/server interface
Problem Analysis Data AnalysisSystematic
Model Development
Risk Factor Analysis
Operational Application
© Samir E. AbdelRahman – All rights reserved

Predictive Analytics at UUHC25
●Congestive heart failure readmission*
●No-shows and last-minute cancellation appointments
●Non-surgical bleeding for patients receiving continuous flow Left Ventricular Assist Devices (LVAD)
●Ongoing projects
* Samir E. AbdelRahman, Mingyuan Zhang, Bruce E Bray, Kensaku Kawamoto, A Three-step Approach for TheDerivation and Validation of High-performing Predictive Models Using an Operational Dataset: CongestiveHeart Failure Readmission Case Study. BMC Medical Informatics And Decision Making 2014, 14:41, May 2014.
© Samir E. AbdelRahman – All rights reserved
Predictive Analytics at UUHC26
●Congestive heart failure readmission*
* Samir E. AbdelRahman, Mingyuan Zhang, Bruce E Bray, Kensaku Kawamoto, A Three-step Approach for TheDerivation and Validation of High-performing Predictive Models Using an Operational Dataset: CongestiveHeart Failure Readmission Case Study. BMC Medical Informatics And Decision Making 2014, 14:41, May 2014.
The goals are (1) to propose and modifymethods to contribute to the clinicalpredictive analytics approaches, and (2)to predict potential risk factors in ourUUHC settings using these methods
© Samir E. AbdelRahman – All rights reserved
Congestive Heart Failure Readmission27
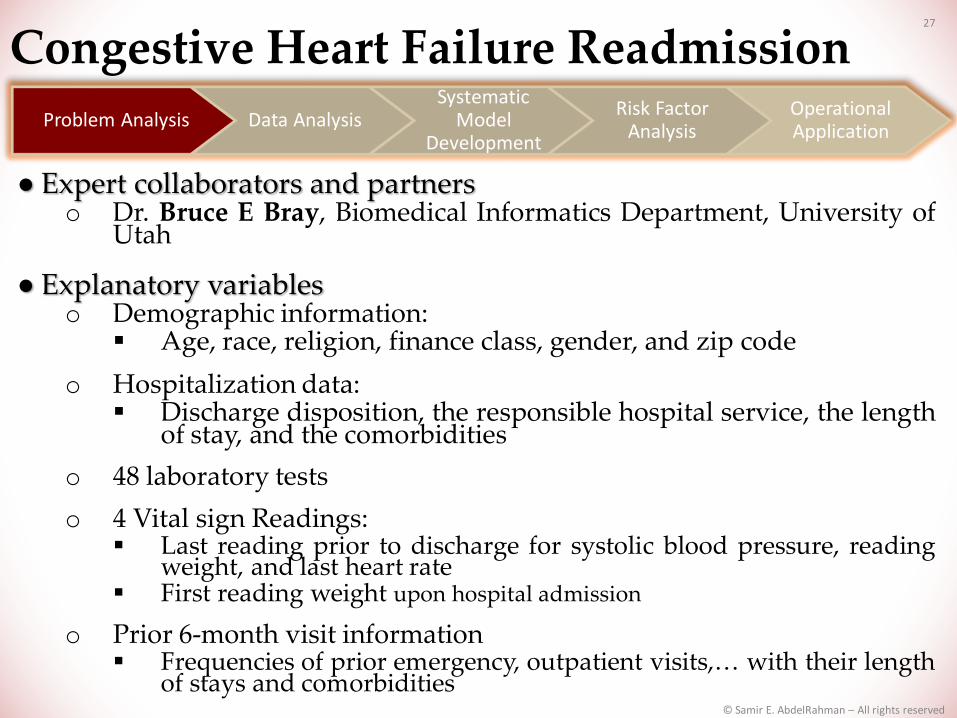
● Expert collaborators and partnerso Dr. Bruce E Bray, Biomedical Informatics Department, University of
Utah
● Explanatory variableso Demographic information:
Age, race, religion, finance class, gender, and zip code
o Hospitalization data: Discharge disposition, the responsible hospital service, the length
of stay, and the comorbidities
o 48 laboratory tests
o 4 Vital sign Readings: Last reading prior to discharge for systolic blood pressure, reading
weight, and last heart rate First reading weight upon hospital admission
o Prior 6-month visit information Frequencies of prior emergency, outpatient visits,… with their length
of stays and comorbidities
Problem Analysis Data AnalysisSystematic
Model Development
Risk Factor Analysis
Operational Application
© Samir E. AbdelRahman – All rights reserved

Congestive Heart Failure Readmission28
●Response variableo Readmission (repeat inpatient hospitalization) for any
cause within 30 days of the index CHF hospitalization
●Dataseto 2,787 CHF hospitalizations (January 2003 - June 2013)
having the derivation and the first validation datasets
o The second validation dataset of patient records July - October 2013
Problem Analysis Data AnalysisSystematic
Model Development
Risk Factor Analysis
Operational Application
© Samir E. AbdelRahman – All rights reserved

Congestive Heart Failure Readmission29
●Challenges
o Vital Sign Data: They were regularly saved in the EDW only starting from 2008,
when a new electronic health record system was implemented atUUHC
o A new scheduling and billing system caused changesto some categorical variable values: The designation of the cardiothoracic surgery service changed
from the “CTI” service to the “CTS” service, we merged suchvalues into a single CTI-CTS value
o The annual readmission rates for 2003-2012 throughthe first 9 months of 2013: 17.06%, 14.50%, 15.38%, 24.11%, 11.81%, 10.57%, 16.78%, 23.20%,
19.94%, 15.50%, 8.50%, and, 12.8%
Problem Analysis Data AnalysisSystematic
Model Development
Risk Factor Analysis
Operational Application
© Samir E. AbdelRahman – All rights reserved
Congestive Heart Failure Readmission30
Problem Analysis Data AnalysisSystematic
Model Development
Risk Factor Analysis
Operational Application
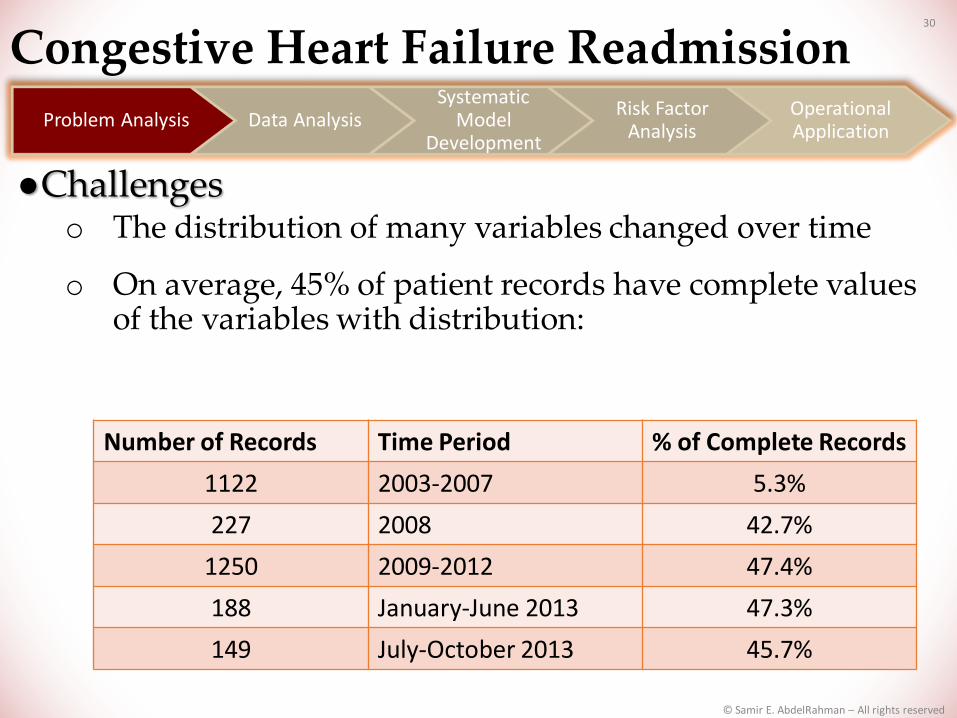
Number of Records Time Period % of Complete Records
1122 2003-2007 5.3%
227 2008 42.7%
1250 2009-2012 47.4%
188 January-June 2013 47.3%
149 July-October 2013 45.7%
●Challengeso The distribution of many variables changed over time
o On average, 45% of patient records have complete values of the variables with distribution:
© Samir E. AbdelRahman – All rights reserved
Congestive Heart Failure Readmission31
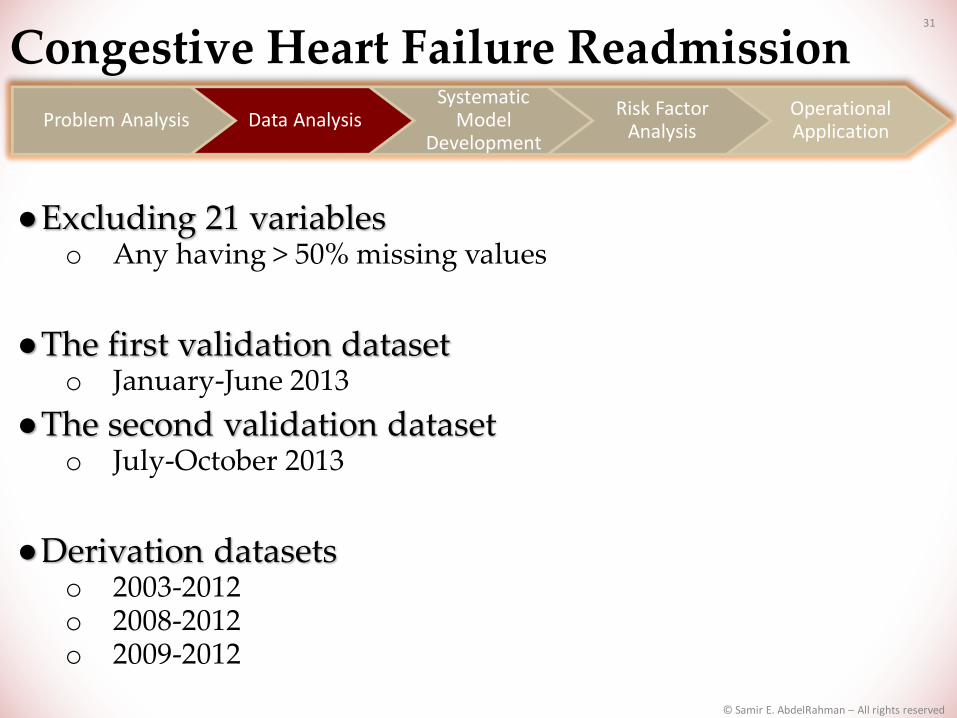
●Excluding 21 variables o Any having > 50% missing values
●The first validation dataseto January-June 2013
●The second validation dataset o July-October 2013
●Derivation datasetso 2003-2012 o 2008-2012 o 2009-2012
Problem Analysis Data AnalysisSystematic
Model Development
Risk Factor Analysis
Operational Application
© Samir E. AbdelRahman – All rights reserved

Congestive Heart Failure Readmission32
● The selected derivation dataset:o Complete records of 2008-2012 (729 records with 18.1% readmission
rate)
● The first validation dataset:o The whole records (complete and missing) of January-June 2013 (188
records with 8.5% readmission rate)
● The second validation dataset:o The whole records (complete and missing) of July-October 2013 (149
records with 12.8% readmission rate)
● Selected methodso Voting classifier between voting feature interval (VFI) and logistic
regressiono Class-attribute contingency coefficient discretization methodo The wrapper subset feature selection methodo Three ranking strategies based on information gain, gain ratio, and
symmetrical uncertainty
Problem Analysis Data AnalysisSystematic
Model Development
Risk Factor Analysis
Operational Application
© Samir E. AbdelRahman – All rights reserved
Congestive Heart Failure Readmission33
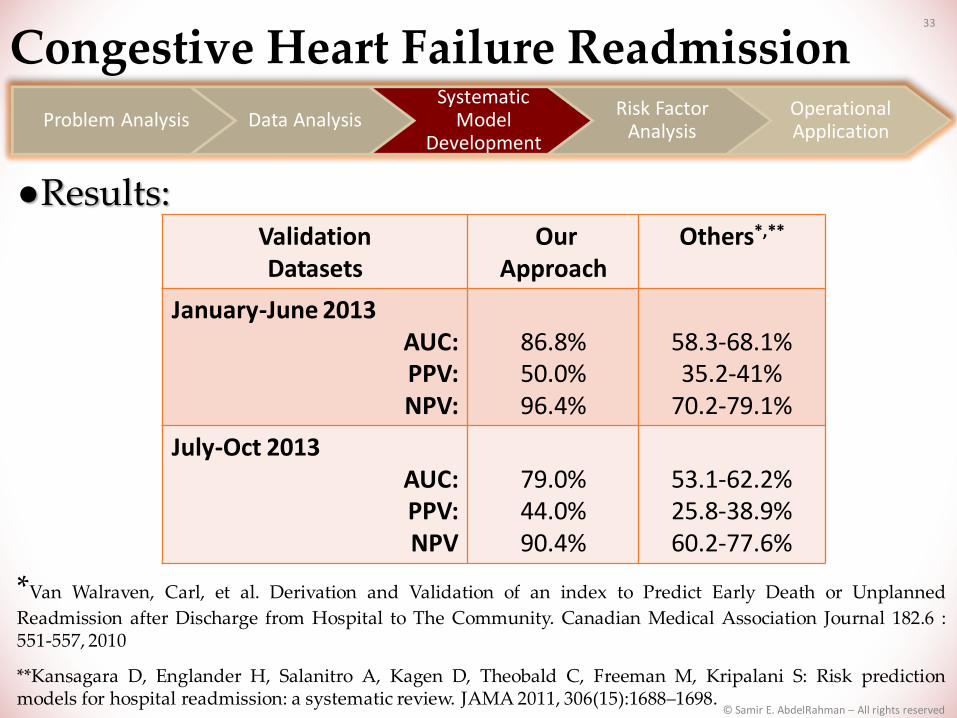
●Results:
*Van Walraven, Carl, et al. Derivation and Validation of an index to Predict Early Death or Unplanned
Readmission after Discharge from Hospital to The Community. Canadian Medical Association Journal 182.6 :551-557, 2010
**Kansagara D, Englander H, Salanitro A, Kagen D, Theobald C, Freeman M, Kripalani S: Risk predictionmodels for hospital readmission: a systematic review. JAMA 2011, 306(15):1688–1698.
Validation Datasets
Our Approach
Others*,**
January-June 2013 AUC:PPV:NPV:
86.8%50.0%96.4%
58.3-68.1%35.2-41%
70.2-79.1%
July-Oct 2013 AUC:PPV:NPV
79.0%44.0%90.4%
53.1-62.2%25.8-38.9%60.2-77.6%
Problem Analysis Data AnalysisSystematic
Model Development
Risk Factor Analysis
Operational Application
© Samir E. AbdelRahman – All rights reserved

Congestive Heart Failure Readmission34
● Developing risk analysisalgorithm coupled withrankers, feature selectionmethods, and p-values onexplanatory variables andselected risk factorso Strong (High)o Regular (Normal)o Weak (Low)
Problem Analysis Data AnalysisSystematic
Model Development
Risk Factor Analysis
Operational Application
© Samir E. AbdelRahman – All rights reserved
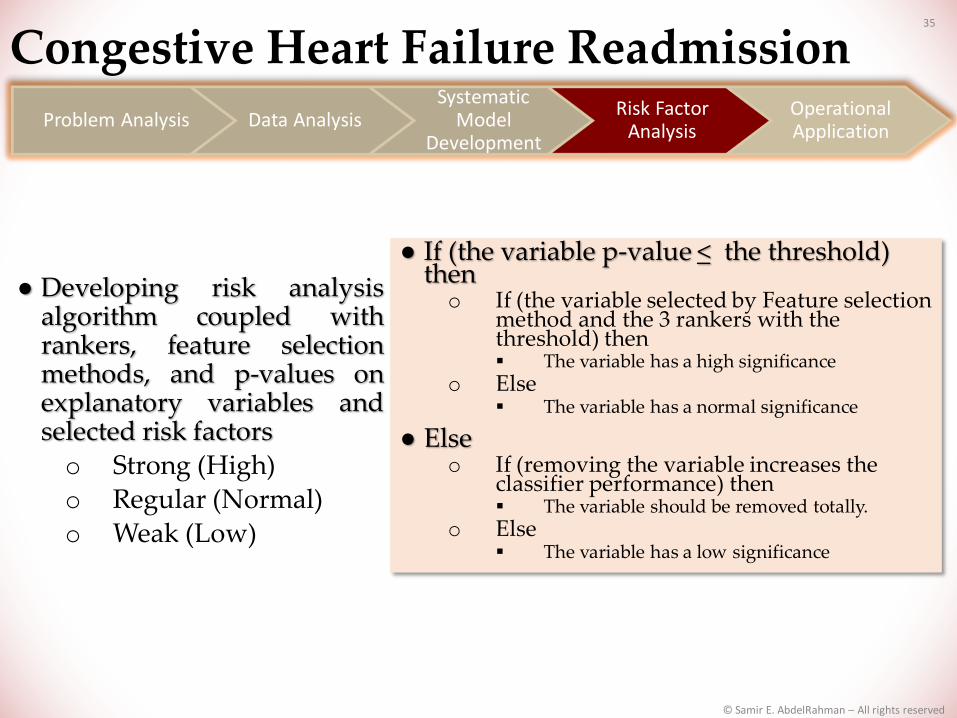
Congestive Heart Failure Readmission35
● Developing risk analysisalgorithm coupled withrankers, feature selectionmethods, and p-values onexplanatory variables andselected risk factorso Strong (High)o Regular (Normal)o Weak (Low)
Problem Analysis Data AnalysisSystematic
Model Development
Risk Factor Analysis
Operational Application
● If (the variable p-value < the threshold) theno If (the variable selected by Feature selection
method and the 3 rankers with the threshold) then The variable has a high significance
o Else The variable has a normal significance
● Elseo If (removing the variable increases the
classifier performance) then The variable should be removed totally.
o Else The variable has a low significance
© Samir E. AbdelRahman – All rights reserved

Congestive Heart Failure Readmission36
●42 Selected risk variables
Problem Analysis Data AnalysisSystematic
Model Development
Risk Factor Analysis
Operational Application
Significance Level Variables
High discharge disposition, discretized age, anemia-related labs,hospital services, the Carlson Index frequency, injury andpoisoning CCS category, and the prior 6-month variables ofCarlson Index frequency and ED encounters
Low race, religion, and insurance/finance class
Normal The remaining variables
© Samir E. AbdelRahman – All rights reserved
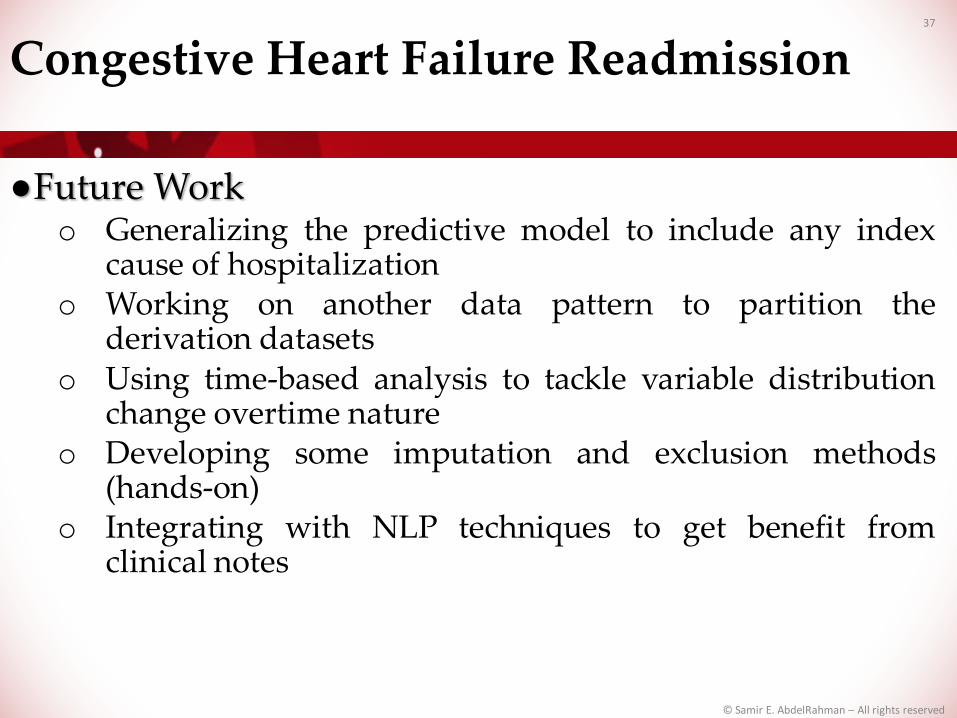
37
●Future Worko Generalizing the predictive model to include any index
cause of hospitalizationo Working on another data pattern to partition the
derivation datasetso Using time-based analysis to tackle variable distribution
change overtime natureo Developing some imputation and exclusion methods
(hands-on)o Integrating with NLP techniques to get benefit from
clinical notes
Congestive Heart Failure Readmission
© Samir E. AbdelRahman – All rights reserved
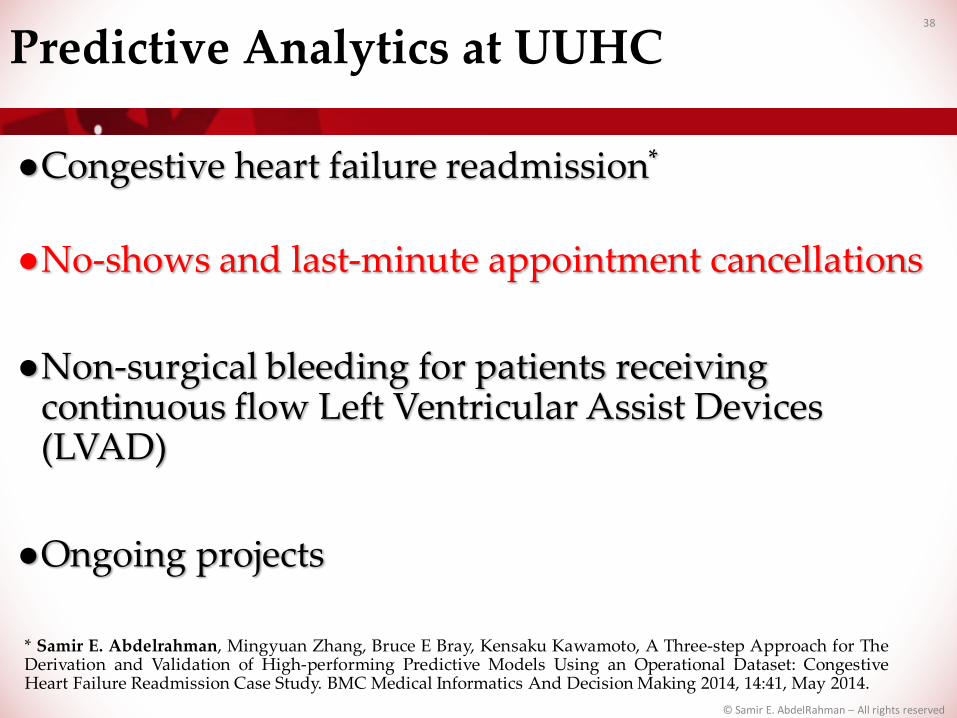
Predictive Analytics at UUHC38
●Congestive heart failure readmission*
●No-shows and last-minute appointment cancellations
●Non-surgical bleeding for patients receiving continuous flow Left Ventricular Assist Devices (LVAD)
●Ongoing projects
* Samir E. Abdelrahman, Mingyuan Zhang, Bruce E Bray, Kensaku Kawamoto, A Three-step Approach for TheDerivation and Validation of High-performing Predictive Models Using an Operational Dataset: CongestiveHeart Failure Readmission Case Study. BMC Medical Informatics And Decision Making 2014, 14:41, May 2014.
© Samir E. AbdelRahman – All rights reserved

No-shows and Last-minute Cancellation Appointments
39
● Expert collaborators and partnerso Ryan M Vanderwerff, UU Orthopaedic Center, Outpatient
Services Directoro Matthew Ball Huish, Physical Medicine & Rehabilitation,
Administrative Directoro Steve Johnson, Value Engineering, UUHC
● Explanatory variableso Demographic informationo Visit datao Prior 1-year complete and no-shows/cancelled visit information
● Response variableo Appointment no-shows or cancel within 1 business day
Problem Analysis Data AnalysisSystematic
Model Development
Risk Factor Analysis
Operational Application
© Samir E. AbdelRahman – All rights reserved

40
●Dataseto 44,406 appointments (November 2010 - September 2014)
●Challengeso Many records have missing values for patient information
valueso Imbalanced dataset: 6% no-shows, 30% cancellations
(including rescheduled), and 67% completed appointments
o Many cancellations cases were similar to no-show cases
No-shows and Last-minute Cancellation Appointments
Problem Analysis Data AnalysisSystematic
Model Development
Risk Factor Analysis
Operational Application
© Samir E. AbdelRahman – All rights reserved
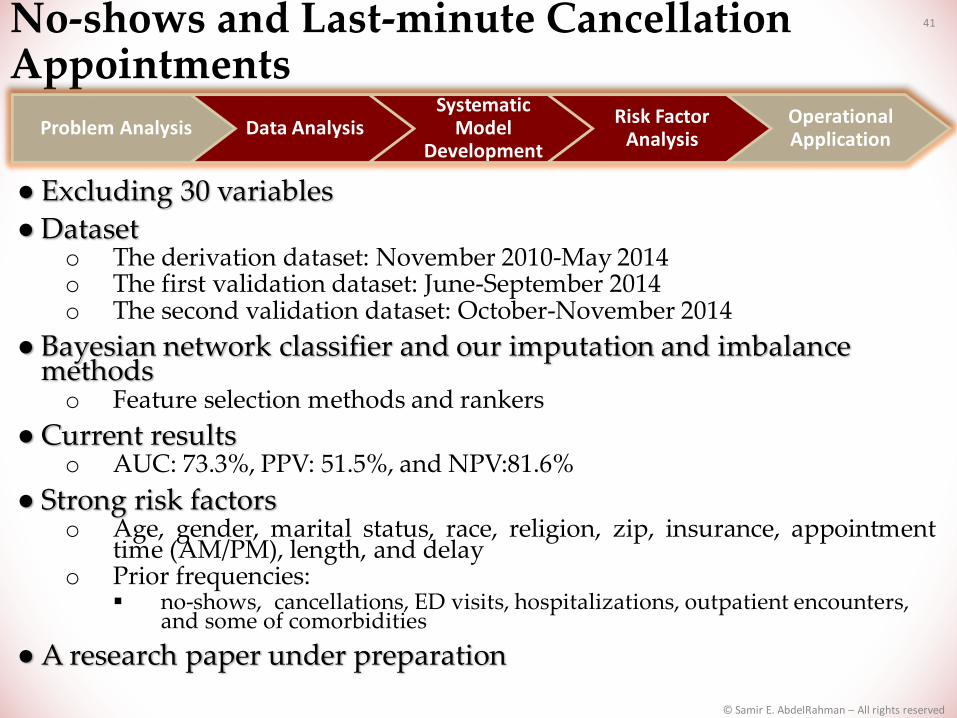
41
● Excluding 30 variables
● Dataseto The derivation dataset: November 2010-May 2014o The first validation dataset: June-September 2014o The second validation dataset: October-November 2014
● Bayesian network classifier and our imputation and imbalance methodso Feature selection methods and rankers
● Current resultso AUC: 73.3%, PPV: 51.5%, and NPV:81.6%
● Strong risk factorso Age, gender, marital status, race, religion, zip, insurance, appointment
time (AM/PM), length, and delayo Prior frequencies:
no-shows, cancellations, ED visits, hospitalizations, outpatient encounters, and some of comorbidities
● A research paper under preparation
No-shows and Last-minute Cancellation Appointments
Problem Analysis Data AnalysisSystematic
Model Development
Risk Factor Analysis
Operational Application
© Samir E. AbdelRahman – All rights reserved

42
●Computational coreo Model developmento Randomizing test set 50%/50% for control/treatment
groups
●Intervention:o MA to call the patient prior to the visit
●Web-based Applicationo ITS team:
Vicki Wells, Steve Wood, and John DeGrey
No-shows and Last-minute Cancellation Appointments
Problem Analysis Data AnalysisSystematic
Model Development
Risk Factor Analysis
Operational Application
© Samir E. AbdelRahman – All rights reserved

Predictive Analytics at UUHC43
●Congestive heart failure readmission*
●No-shows and last-minute appointment cancellations
●Non-surgical bleeding for patients receiving continuous flow Left Ventricular Assist Devices (LVAD)
●Ongoing projects
* Samir E. AbdelRahman, Mingyuan Zhang, Bruce E Bray, Kensaku Kawamoto, A Three-step Approach for TheDerivation and Validation of High-performing Predictive Models Using an Operational Dataset: CongestiveHeart Failure Readmission Case Study. BMC Medical Informatics And Decision Making 2014, 14:41, May 2014.
© Samir E. AbdelRahman – All rights reserved

Non-surgical Bleeding For Patients Receiving Continuous Flow LVAD
44
● Main collaborators o Dr. Jose Nativi-Nicolau , Division of Cardiovascular Medicine,
University of Utaho Omar E. Wever-Pinzon, MD, Division of Cardiovascular Medicine,
University of Utah
● Dataseto 236 records ( January 2003 – October 2013)
● Variableso Explanatory: demographic information and 65 lab tests and vital signso Response: bleeding outcome (32.3% yes vs. 67.7% no)
● Challengeo Many variables and small dataseto Index or scoring function
● Excluding 40 variables
Problem Analysis Data AnalysisSystematic
Model Development
Risk Factor Analysis
Operational Application
© Samir E. AbdelRahman – All rights reserved
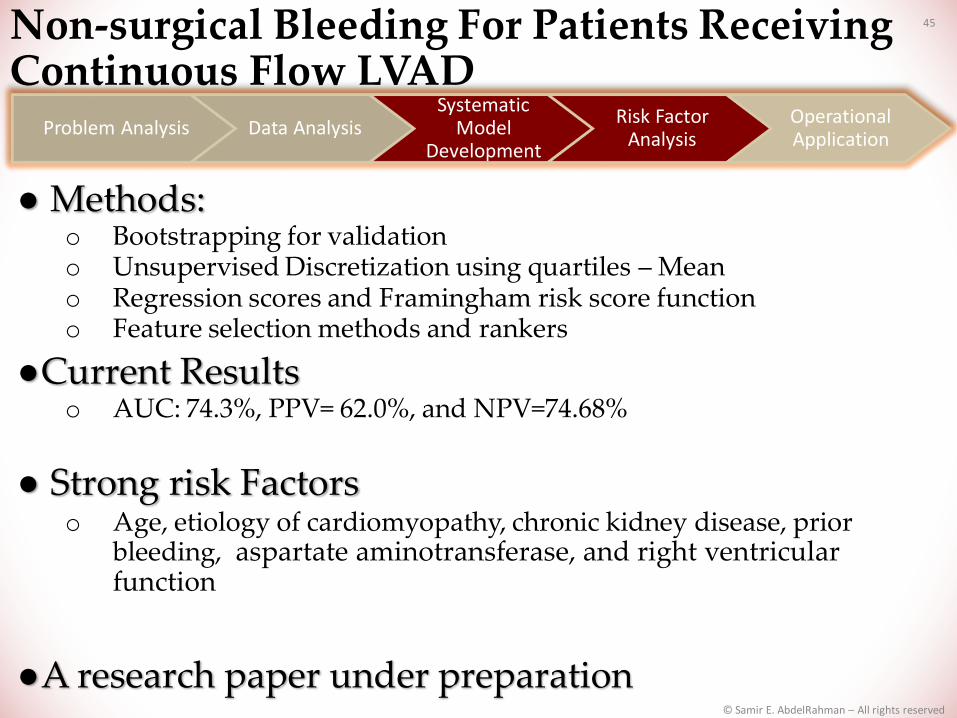
Non-surgical Bleeding For Patients Receiving Continuous Flow LVAD
45
● Methods:o Bootstrapping for validation o Unsupervised Discretization using quartiles – Mean o Regression scores and Framingham risk score functiono Feature selection methods and rankers
●Current Resultso AUC: 74.3%, PPV= 62.0%, and NPV=74.68%
● Strong risk Factors o Age, etiology of cardiomyopathy, chronic kidney disease, prior
bleeding, aspartate aminotransferase, and right ventricular function
●A research paper under preparation
Problem Analysis Data AnalysisSystematic
Model Development
Risk Factor Analysis
Operational Application
© Samir E. AbdelRahman – All rights reserved
Predictive Analytics at UUHC46
●Congestive heart failure readmission*
●No-shows and last-minute appointment cancellations
●Non-surgical bleeding for patients receiving continuous flow Left Ventricular Assist Devices (LVAD)
●Ongoing projects
* Samir E. AbdelRahman, Mingyuan Zhang, Bruce E Bray, Kensaku Kawamoto, A Three-step Approach for TheDerivation and Validation of High-performing Predictive Models Using an Operational Dataset: CongestiveHeart Failure Readmission Case Study. BMC Medical Informatics And Decision Making 2014, 14:41, May 2014.
© Samir E. AbdelRahman – All rights reserved

Ongoing Projects47
● Patient satisfaction assessment and improvemento Collaborators:
Dr. P. Ward, Division of Facial Plastic & Reconstructive Surgery Practice, University of Utah
Steve Johnson, Value Engineering, University of Utah Health Care o Most of work done and a research paper under preparation
● Prediction of 30-day readmission for patients receiving continuous flow Left Ventricular Assist Devices (LVAD)o Main Collaborators:
Dr. Craig H. Selzman, Cardiothoracic Surgery Division, University of Utah
Dr. Jose Nativi-Nicolau , Division of Cardiovascular Medicine, University of Utah
Aaron Healy, MD, Residents/General Surgery, University of Utah
● Sepsiso Collaborators:
Devin Horton, MD, General Internal Medicine John Arego, Clinical Doc Data Manager
● Financial predictions (UUMG leadership)
● Automation of predictive analytics pipeline
© Samir E. AbdelRahman – All rights reserved

Take Home Message 48
●Predictive analytics has high-valuecases for health care
●UUHC is home to many greatcollaborators for driving clinicalimprovements leveraging predictiveanalytics
© Samir E. AbdelRahman – All rights reserved
Acknowledgements 49
●Our Collaboratorso Dr. Bruce E Brayo Ryan M Vanderwerffo Matthew Ball Huisho Steve Johnsono Vicki Wellso Steve Woodo John DeGreyo Dr. Jose Nativi-Nicolauo Omar E. Wever-Pinzono Dr. P. Wardo Dr. Craig H. Selzmano Aaron Healyo Devin Hortono John Arego
© Samir E. AbdelRahman – All rights reserved

Acknowledgements 50
●Cairo University Professorso Reem Bahgat and Aly Fahmy
●USA University Professorso William Schuler, Hua Xu, Kensaku Kawamoto, and Wendy
Chapman
●Biomedical Informatics Department Administration Staffo Alisha M. Edison-Hair and Tahanie Branz
●University of Utah Data Warehousing Teamo Cheri Hunter, Ming Tu, Vikrant Deshmukh, Paul Sanders,
and Mingyuan Zhang
●University of Utah ITS Teamo Jim Turnbull and Travis Gregory
●KMM/Ken and Blulab/Wendyo Catherine J. Staes from KMM teamo Lee Christensen from Blulab team
© Samir E. AbdelRahman – All rights reserved

Thank You