Embed Size (px)
Citation preview
NASA Technical Memorandum 102818
Prediction Techniques forJet-Induced Effects inHover on STOVL AircraftDouglas A. Wardwell, Ames Research Center, Moffett Field, CaliforniaRichard E. Kuhn, V/STOL Consultant, San Diego, California
August 1991
N/LRANational Aeronautics andSpace Administration
Ames Research CenterMoffett Field, California 94035-1000
https://ntrs.nasa.gov/search.jsp?R=19910022756 2018-05-08T14:52:48+00:00Z
PREDICTION TECHNIQUES FOR JET-INDUCED EFFECTS IN HOVER ON STOVLAIRCRAFT
Douglas A. WardwellNASA Ames Research Center
Richard E. Kuhn
V/STOL Consultant
SUMMARY
Prediction techniques for jet-induced lift effects during hover are available, relatively easy to use,
and produce adequate results for preliminary design work. Although deficiencies of the current
method were found, it is still currently the best way to estimate jet-induced lift effects short of using
computational fluid dynamics. Its use is summarized in this report. There is still much work that
needs to be done to understand and predict jet-induced lift (suckdown), some of which is in progress.
The "new" method also summarized in this report, represents the first step toward the use of
surface pressure data in an empirical method, as opposed to just balance data in the current method,
for calculating jet-induced effects. Although the new method is currently limited to flat plate config-
urations having two circular jets of equal thrust, it has the potential of more accurately predicting jet-
induced effects including a means for estimating the pitching moment in hover. As this method was
developed from a very limited amount of data, broader applications of this method require the inclu-
sion of new data on additional configurations. However, within this small data base, the new method
does a better job in predicting jet-induced effects in hover than the current method. Studies are cur-
rently underway to expand the jet-induced suckdown data base in general and it is hoped to increase
both the understanding and the prediction accuracy of jet-induced effects in and out of ground effectin hover.
SYMBOLS
Cp
d
fl
total jet area
pressure coefficient
individual jet diameter
equivalent jet diameter
fountain increase factor at greater heights utilizing lift improvement devices (LIDs)
fz
h
k
NPR
S
T
X
AL
AM
fountain increase factor at lesser heights utilizing LIDs
nozzle height above the ground
a factor
nozzle pressure ratio
planform area
thrust
distance from the moment reference point
jet-induced lift loss
jet-induced pitching moment
Subscripts:
base the value on the model lower surface to which the pressure distribution will asymptote as
distance from the jet(s) is increased
f fountain
L lift improvement devices (LIDs)
m moment
max maximum
s entrainment, multi-jet.
sj entrainment, single jet
s,f entrainment, front jet
s,r entrainment, rear jet
oo out-of-ground effect
INTRODUCTION
As interest in STOVL aircraft has increased over the last decade, jet-induced lift loss has become
a critical design issue. Work has shown that there is a need for new and more systematic testing of
jet-induced lift loss (suckdown). The current jet-induced lift loss (or suckdown) prediction method of
reference 1 was empirically derived from tests of numerous planform and nozzle configurations
dating back to the 1950s and is intended only for preliminary design calculations. This method is
primarily based upon round jets of equal thrust with varying planform geometry, nozzle spacing,
nozzle pressure ratio (NPR), and planform to nozzle area. Most configurations tested had nozzle
pressure ratios ranging from 1.15 to 2.08 (with most of the data between 1.5 and 2.08), and planform
to jet area ratios from 4.25 to 165 with a mean around 80. Much of the jet-induced data measure-
ments are balance data with a very limited amount of pressure data.
Most of the recent STOVL designs employ higher nozzle pressure ratios and planform to jet area
ratios. Current tests have shown that some of the terms for the current method (ref. 1) are overpre-
dicted, but cancel when added giving a good overall prediction. A "new" method which uses pres-
sure data and balance data for predictions is being developed. The current prediction method for jet-
induced effects in hover is summarized, the proposed "new" prediction scheme is summarized, and
results from this "new" method are compared to those using the current method.
CURRENT PREDICTION METHOD
The current method was assembled by Kuhn (ref. 1). Most of the available data used in reference
1 were from tests which provided only balance data. Although balance data gives only the total lift
loss or gain for the configuration, pieces making up the total lift loss could be estimated by using
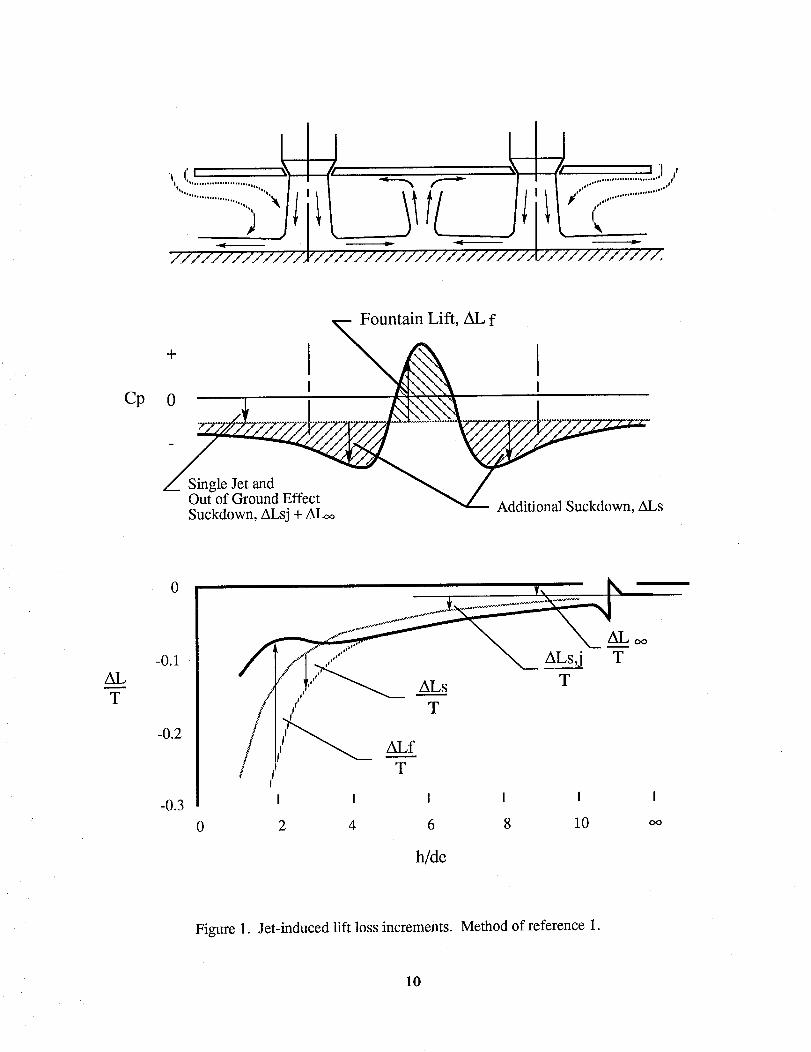
data from many planform and nozzle configurations. The flow field for the current prediction
method was assumed to look like the one shown in figures la and lb. The method thus assumes that
the lift loss is made up of the following four terms (fig. lc):
+AL
where
= base lift loss out of ground effect
= lift loss induced by a equivalent single jet
= additional lift loss induced by multiple jets
--_--) = lift incrementfrom thefountainflowf
As the total lift loss force was the only term obtained from each model, the individual terms that
make up the total lift loss had to somehow be estimated. The out-of-ground effect (OGE) base lift
loss term (AL/T)** is the loss the configuration sees when far above the ground, or out-of-ground
effect, and is based on work from references 2 and 3. This term can be directly measured.
The equivalent single-jet lift loss term (AI./T)sj is based on Wyatt's work (ref. 4). Although this
term can not be directly measured, the jets can be made into an "equivalent" single-jet. The suck-
down can then be estimated from the method developed from tests of single jets in various plan-
forms. It has since been found that the method will substantially overpredict the single-jet suckdown
for jet pressure ratios greater than 2.0. Therefore, for jet pressure ratios above 2.0, the value of 2.0
should be used in estimating the single-jet suckdown.
This leaves the multijet (AL/T)s and fountain (AL/T)f terms to be determined. In reference 1 it
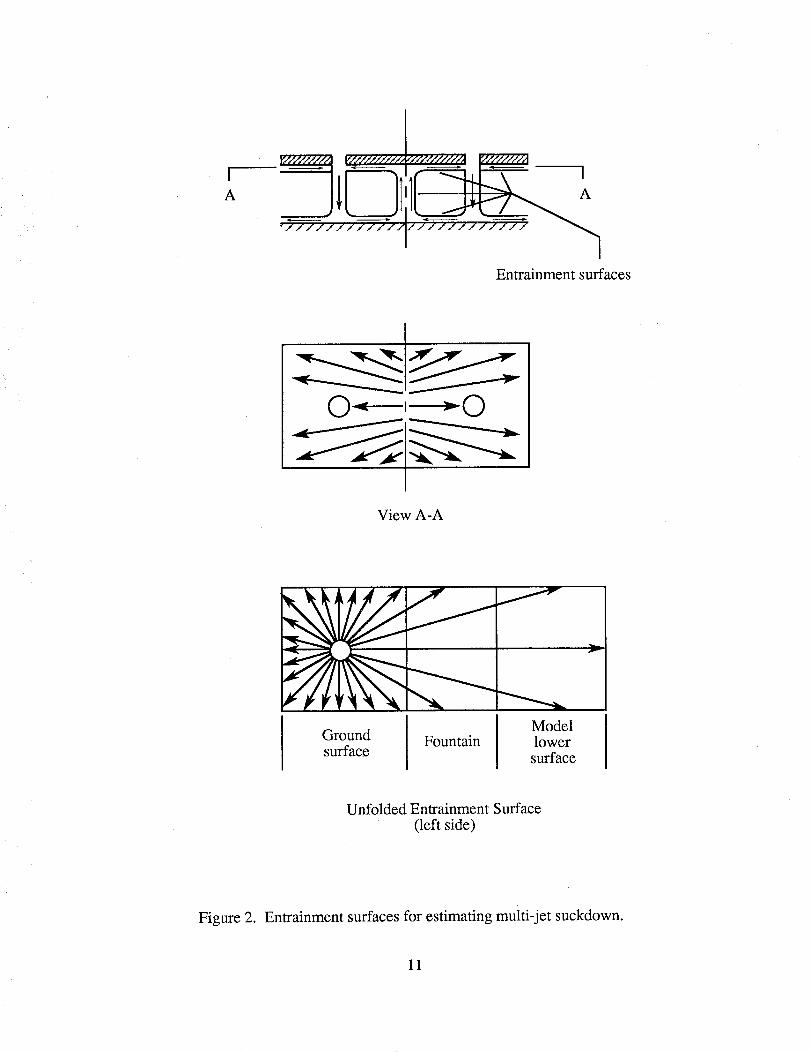
was assumed that the total jet entrainment term could be estimated and from which the multijetsuckdown and fountain lift terms could be calculated. To calculate the total multijet lift loss, refer-
ence 1 assumed that there is additional suckdown from the entrainment regions generated by the
interactions of the jet flows; the flow on the ground, the flow in the fountain, and the flow on the
lower surface of the model (fig. 2). The entrainment surfaces were then unfolded onto a flat surface
for which the lift loss could be estimated by using the method for single-jet configurations (bottom
of fig. 2). This estimate was then subtracted, along with the out-of-ground effect base lift loss term
(AL/T)_, from the total lift loss to obtain the fountain increment for correlation with K.T. Yen's
theory (ref. 5) in which some terms had to be experimentally determined.
The fountain increment, based for this method on Yen's theory (using the experimentally derived
constants and exponents), along with (AL/T)oo and (AL/T)sj, could then be subtracted from the total
lift loss to obtain the multijet lift loss increment (AL/T)s. This multijet increment is the lift loss
incurred in addition to the equivalent single-jet lift loss for the given planform. This technique gave
values that appeared reasonable and were used for the estimation method of reference 1. It is now
known that this estimation procedure tends to overpredict both the multijet suckdown and fountain
lift terms. However the method is still valid and useful for configurations that are in, or close to,
those in the data base, as the overpredictions of the two terms tend to cancel and give the correct
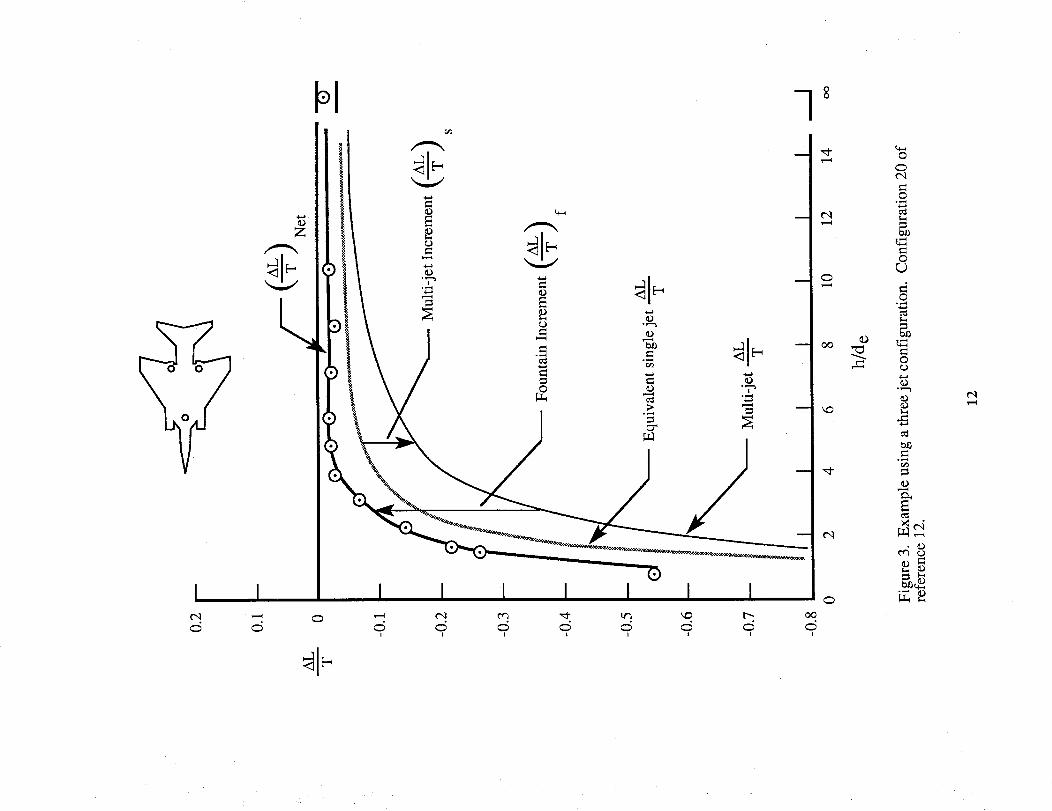
overall lift loss. Figure 3 shows a prediction for a three-jet flat plate model that was in excellent
agreement with test data.
Lift Improvement Devices (LIDs) are important for many configurations as they can capture the
fountain flow and significantly increase the positive fountain increment at low heights, thus decreas-
ing the total lift loss. The current method for calculating the increase in fountain strength due to LIDs
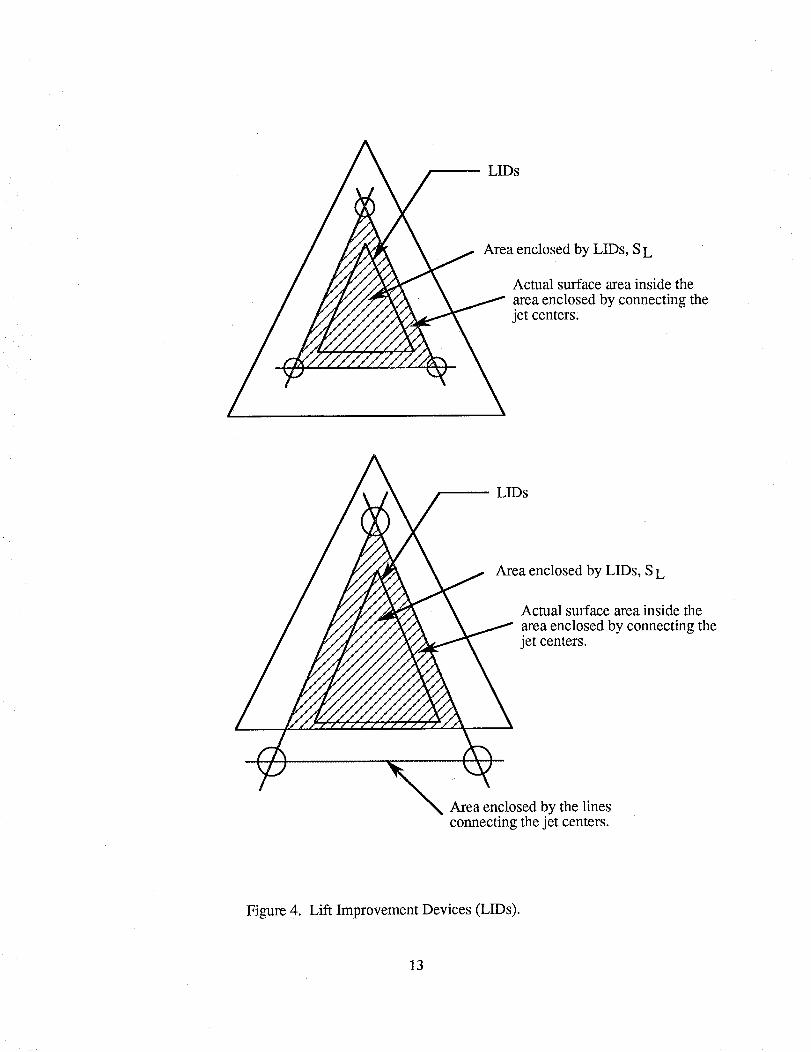
assumes the LIDs do not extend beyond the lines connecting the nozzle centers (figs. 4a,b). LIDs
can be of any shape inside this area with at most one open segment. The method will also account for
jets located outside of the planform as shown at the bottom of figure 4b.
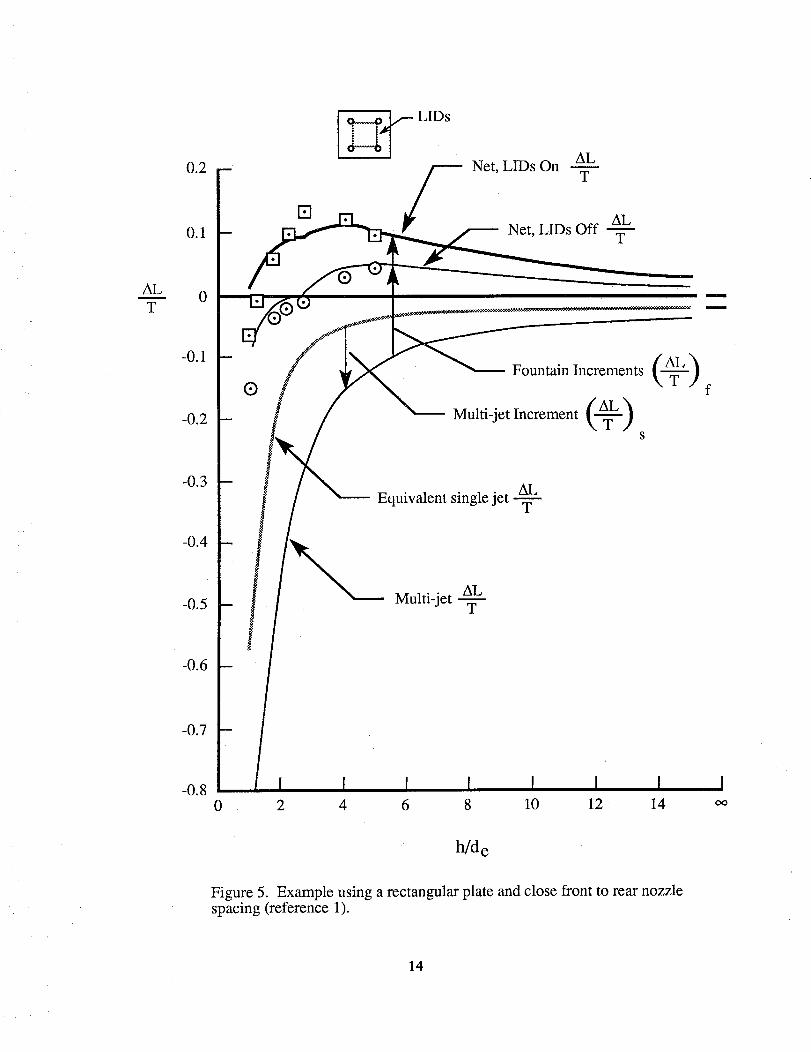
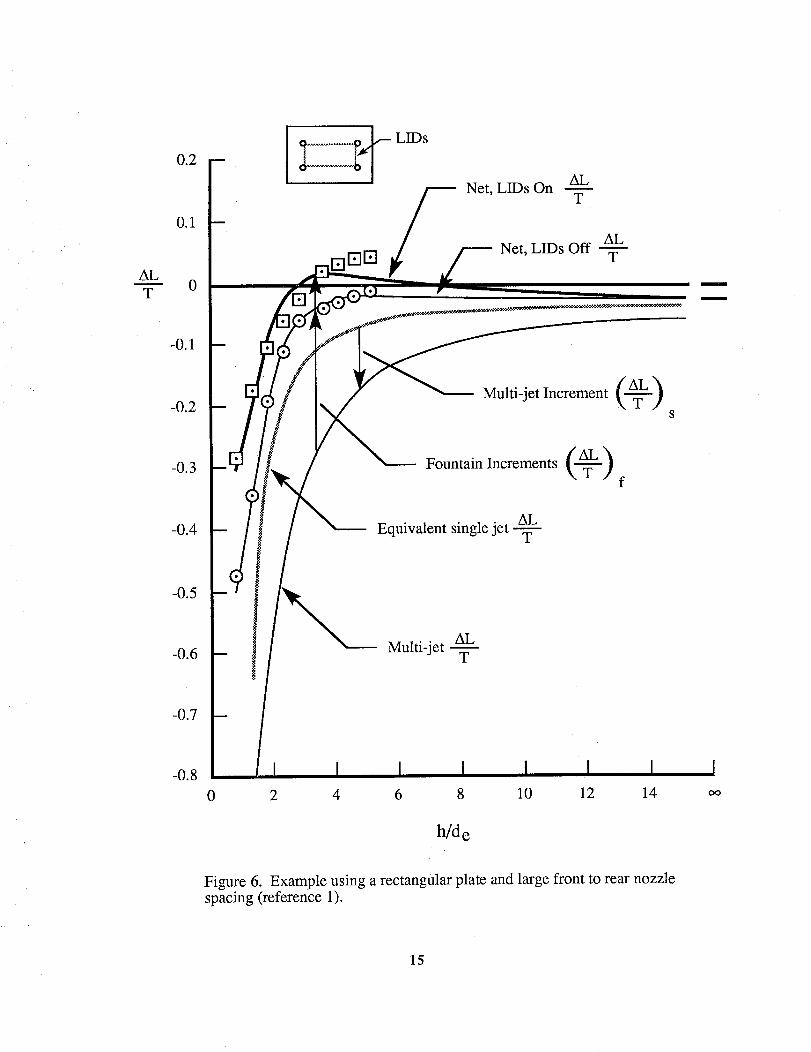
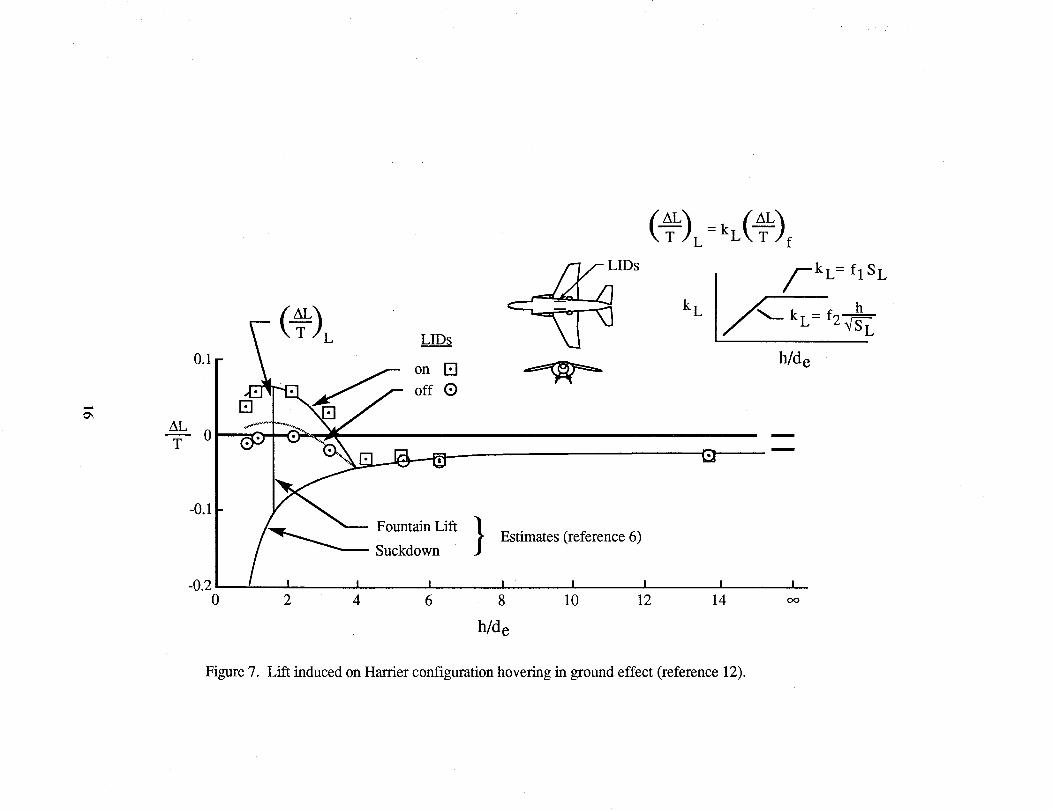
Examples using the current prediction method are shown in figures 5 to 7. Figures 5 and 6 show
predictions compared to test data of two rectangular plates with different front to rear jet spacings.
4
Thesetwo figuresalsoshowtheeffectsof LIDs on thetotal suckdown.Figure7ashowsthepredic-tion for anAV-8B Harrierwith andwithoutLIDs. TheLID incrementfactortrendis shownin figure7bandis from reference1.TheLIDs for theHarrieraretwo longitudinal,nearlyvertical,strakesformedfrom thegunpods.In hover,theplumesfrom thetwo front andtworearjetscanbeassumedto closethefront andrearLID sectionto makearectangulararea.Thepredictionsfor theAV-8Bwereverygood.Although thecurrentlift losspredictionmethodwill notpredictjet-inducedliftincrementsexactly,it doesgivea goodindicationof thelift lossesexpectedandtheheightsat whichsuckdownmaybecometroublesome.Themethodis relativelyeasyto useandisprimarily intendedfor conceptualor preliminarydesignwork.
PROPOSED NEW PREDICTION METHOD
Although the current method gave approximately the correct total suckdown, more recent tests
(refs. 6, 7, and 8), have showed that both the fountain and multijet increments are over-estimated. It
was thought that a more accurate method could be derived from tests that provided pressure data in
addition to balance data. The tests described in references 7 and 9 (conducted at NASA Ames and
Lockheed's Rye Canyon facility) provided most of the data to date, with some additional pressure
data from references 6, 8, and 10. With this data in hand, R.E. Kuhn proposed a new prediction
scheme (ref. 1 1). This new scheme will be referred to as the "new method." This new method is cur-
rently limited to flat plate configurations with two circular vertical jets of equal thrust.
Previous to the tests of references 6 and 7, it was assumed that the pressures induced on the outer
regions of the planform (furthest from the jets and fountain) would asymptote to those induced by an
equivalent single jet (fig. lb). Further, it was assumed that the fountain lift could be obtained by
integrating those pressures above the average level that would be induced by an equivalent single-jet
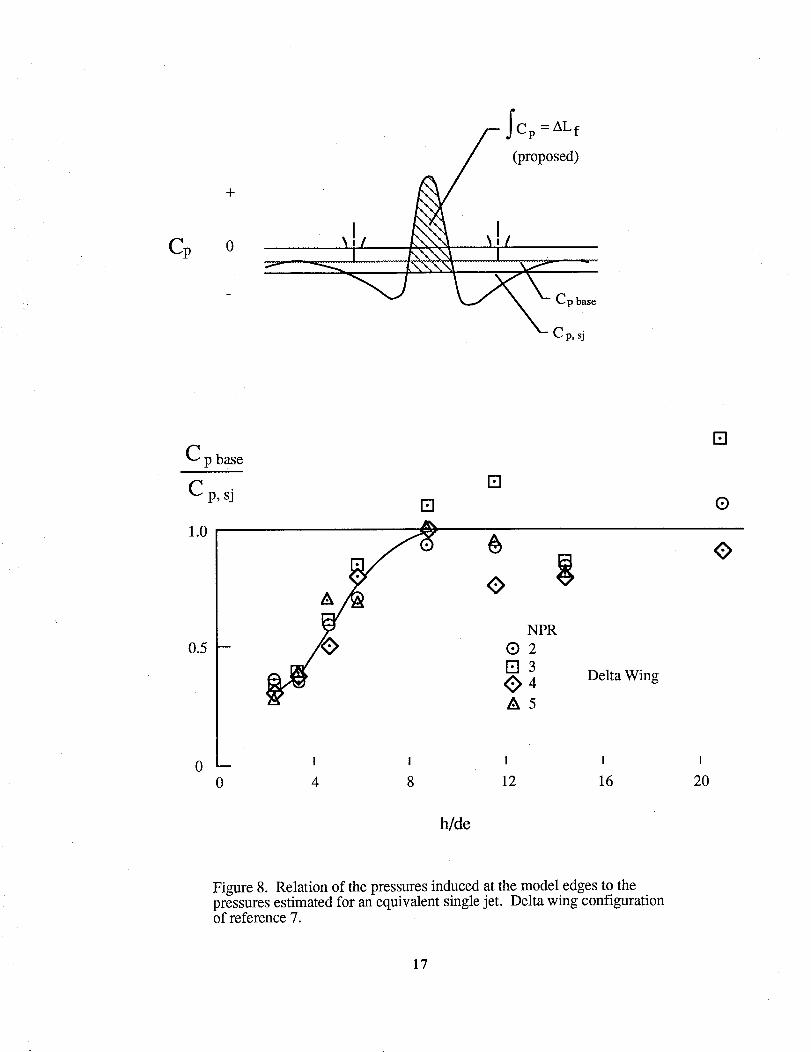
as depicted at the top of figure 8. However, after examining the pressure profiles from reference 7, it
was found that at the lower heights, the base Cp does not asymptote to that induced by an equivalent
single-jet (bottom of fig. 8) as previously thought. At the lower heights, the base Cp was consider-
ably less. Attempts by R.E. Kuhn to develop a simple way to relate the pressure at the edges of the
planforms and away from the jets to the equivalent single-jet pressure were unsuccessful and it was
decided to leave the suckdown increment due to an equivalent single-jet out of the method.
Thus the new method is currently made up of the base lift loss out-of-ground effect, the lift loss
induced forward of the fountain region, the lift loss induced aft of the fountain region, and the foun-tain lift itself.
-_-)00 = base lift loss out of ground effect
---_) = lift loss induced forward of the fountains,f
-f) = lift loss induced aft of the fountains,r
---_)f = lift increment from the fountain flow
Thus,
(_-) = (--_--).0 + (---_)s,f + (-_--)s,r + (-_--}f
The pitching moment is assumed to be the sum of the lift loss terms multiplied by their respec-tive moment arms.
AL Xo. AL Xf
(T_) (--T--)oo(-_--) + {ALl (Xs'fl + tALl {Xs'r/ + (--T)I_)_--T--Js,_--_J _ T Is._ de ]
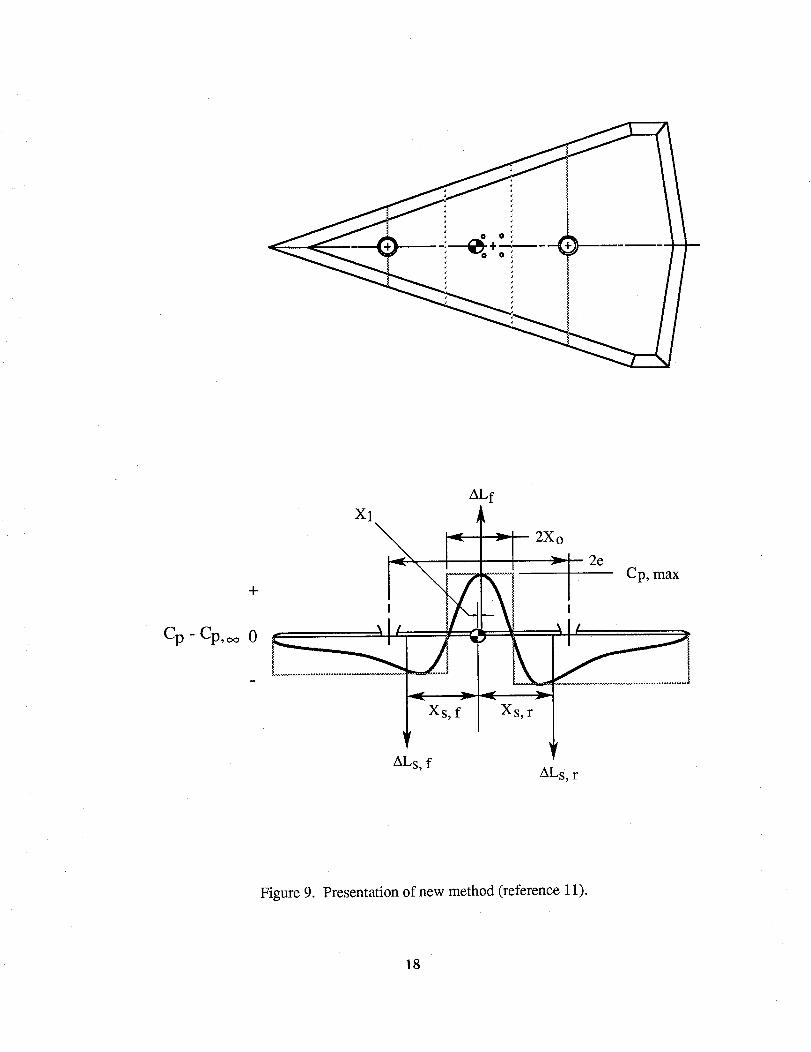
Figure 9 shows the key terms of the previous two equations. The terms (AL/T)oo and (AL/T)f are
described below. More details of these terms can be found in reference 11. The OGE lift loss is
assumed to act at the center of area for the configuration, thus Xoo is the distance from the center of
the planform area to the moment reference point.
The OGE lift loss is similar to the current method (ref. 1), except that some of the exponents and
multiplying factors have been modified. The lift loss term for this new method is defined as follows:
(-T-)oo S Spd 1.58AL = K__A_. (______) (NPR)_0.5
where
Koo = -0.00010
for tests in open air or very large rooms.
The nozzle pressure ratio and K,,o terms have been modified fromthe method of reference 1. Itshould be noted that it was found from the tests described in reference 7 that the room size did have a
significant effect on the OGE lift loss term. The smaller rooms indicated a larger Koo was needed to
match measurements--this is probably due to the observable recirculation within the room.
The front or rear suckdown increments ((AL]T)s,f and (AL/T)s,r) are negative in value and are
determined from the planform area forward and aft of the fountain region and the minimum pres-
sures associated with these regions on the undersurface of the planform. This minimum pressure data
can be empirically fit for the different heights and planforms tested (see ref. 11).
6
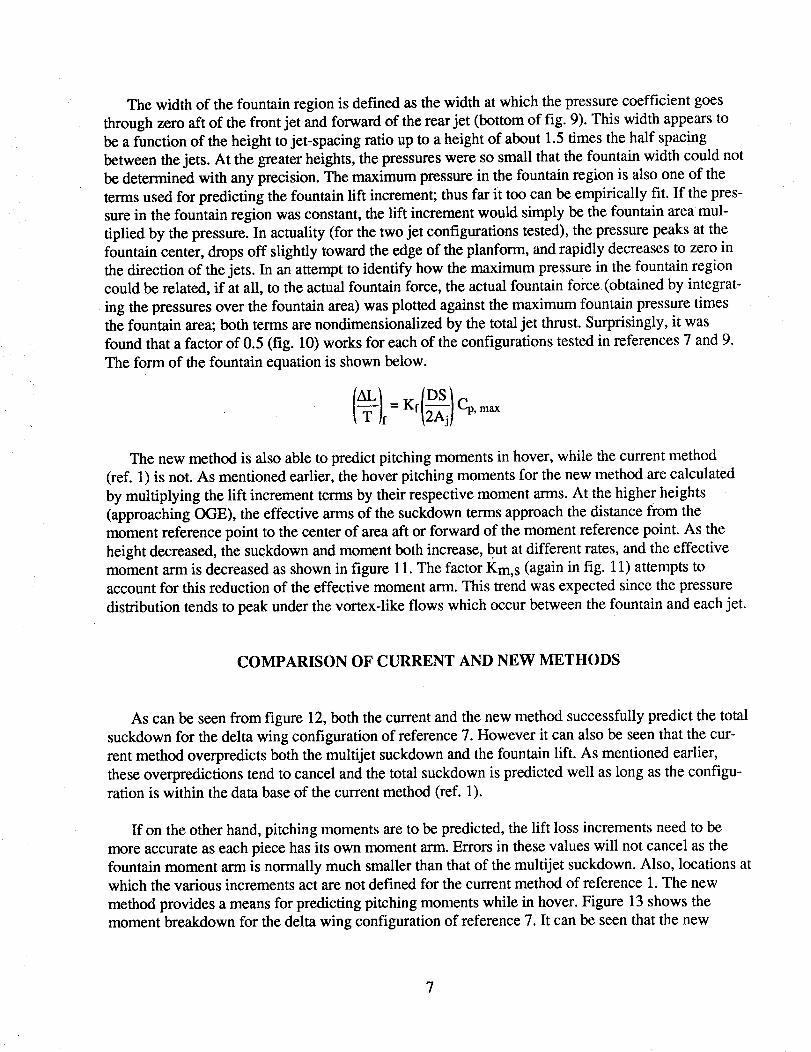
Thewidth of thefountainregionis defined as the width at which the pressure coefficient goes
through zero aft of the front jet and forward of the rear jet (bottom of fig. 9). This width appears to
be a function of the height to jet-spacing ratio up to a height of about 1.5 times the half spacing
between the jets. At the greater heights, the pressures were so small that the fountain width could not
be determined with any precision. The maximum pressure in the fountain region is also one of the
terms used for predicting the fountain lift increment; thus far it too can be empirically fit. If the pres-
sure in the fountain region was constant, the lift increment would simply be the fountain area mul-
tiplied by the pressure. In actuality (for the two jet configurations tested), the pressure peaks at the
fountain center, drops off slightly toward the edge of the planform, and rapidly decreases to zero in
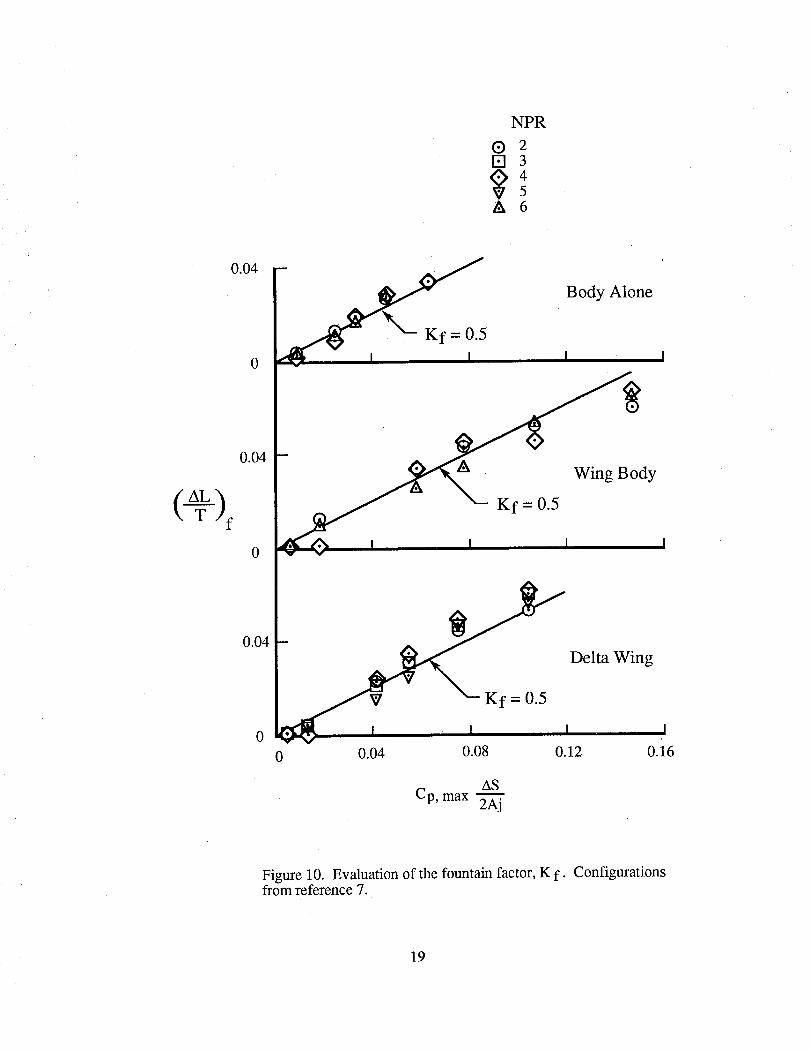
the direction of the jets. In an attempt to identify how the maximum pressure in the fountain region
could be related, if at all, to the actual fountain force, the actual fountain force (obtained by integrat-
ing the pressures over the fountain area) was plotted against the maximum fountain pressure times
the fountain area; both terms are nondimensionalized by the total jet thrust. Surprisingly, it was
found that a factor of 0.5 (fig. 10) works for each of the configurations tested in references 7 and 9.
The form of the fountain equation is shown below.
AL = Kf Cp, max
f
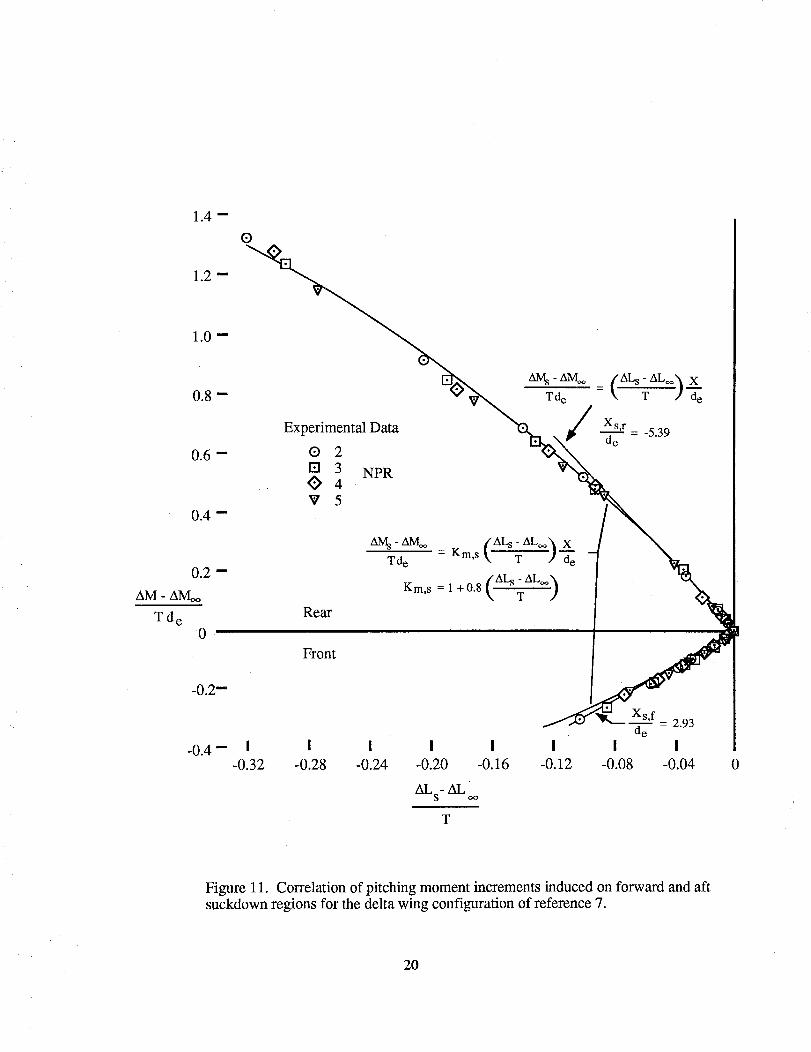
The new method is also able to predict pitching moments in hover, while the current method
(ref. 1) is not. As mentioned earlier, the hover pitching moments for the new method are calculated
by multiplying the lift increment terms by their respective moment arms. At the higher heights
(approaching OGE), the effective arms of the suckdown terms approach the distance from the
moment reference point to the center of area aft or forward of the moment reference point. As the
height decreased, the suckdown and moment both increase, but at different rates, and the effective
moment arm is decreased as shown in figure 11. The factor Km, s (again in fig. 11) attempts to
account for this reduction of the effective moment arm. This trend was expected since the pressure
distribution tends to peak under the vortex-like flows which occur between the fountain and each jet.
COMPARISON OF CURRENT AND NEW METHODS
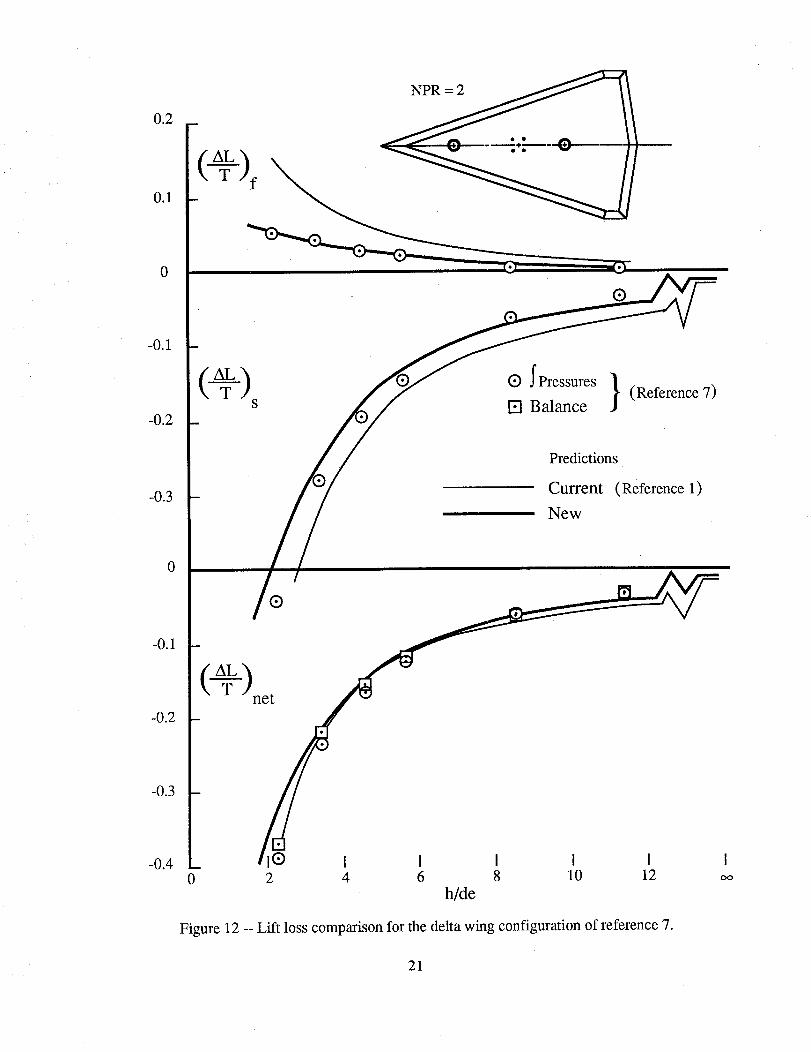
As can be seen from figure 12, both the current and the new method successfully predict the total
suckdown for the delta wing configuration of reference 7. However it can also be seen that the cur-
rent method overpredicts both the multijet suckdown and the fountain lift. As mentioned earlier,
these overpredictions tend to cancel and the total suckdown is predicted well as long as the configu-
ration is within the data base of the current method (ref. 1).
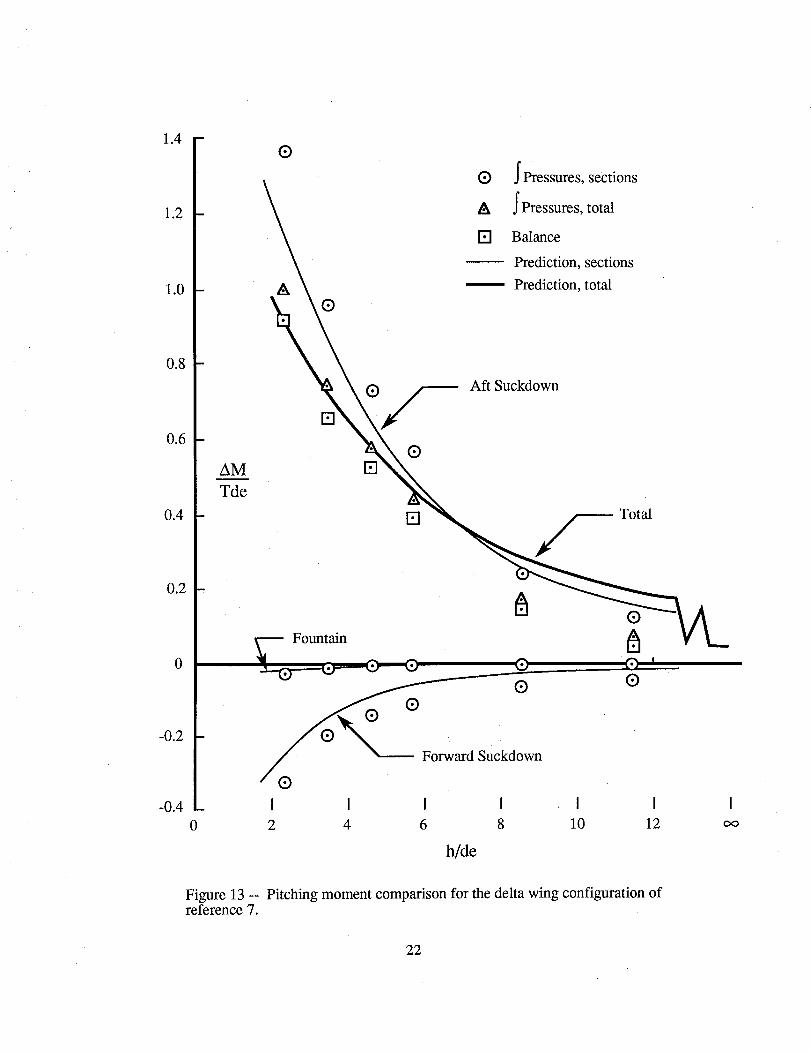
If on the other hand, pitching moments are to be predicted, the lift loss increments need to be
more accurate as each piece has its own moment arm. Errors in these values will not cancel as the
fountain moment arm is normally much smaller than that of the multijet suckdown. Also, locations at
which the various increments act are not defined for the current method of reference 1. The new
method provides a means for predicting pitching moments while in hover. Figure 13 shows the
moment breakdown for the delta wing configuration of reference 7. It can be seen that the new

methodpredictsthepitchingmomentsatthe lowerheightsfairly well, butoverpredictswhenapproachingthehigherheights.
8
REFERENCES
.
6
Q
.
.
.
*
.
.
10.
11.
12.
13.
Kuhn, R. E.: An Engineering Method for Estimating the Induced Lift on WSTOL Aircraft
Hovering In and Out of Ground Effect. Naval Air Development Center, NADC-80246-60.
Gentry, G. L.; and Margason, R. J.: Jet-Induced Lift Losses on VTOL Configurations HoveringIn and Out of Ground Effect. NASA TN D-3166, Feb. 1966.
Shumpert, P. K.; and Tibbetts, J. G.: Model Tests of Jet-Induced Lift Effects on a VTOL
Aircraft in Hover. NASA CR-1297, March 1969.
Wyatt, L. A.: Static Test of Ground Effect on Planforms Fitted With a Centrally-Located Round
Lifting Jet. Ministry of Aviation, CP-749, June 1962.
Yen, K. T.: On the Vertical Method for Estimating Jet Induced Lift Losses of V/STOL Aircraft
Hovering In and Out-Of-Ground Effect. Proceeding of the Workshop on V/STOL Aerody-
namics, Naval Air Development Center, NADC-79273-60, Nov. 1979.
Bellavia, D. C.; Wardwell, D. A.; Corsiglia, V. R.; and Kuhn, R. E.: Forces and Pressures
Induced on Circular Plates by a Single Lifting Jet in Ground Effect. NASA TM- 102816,March 1991.
Bellavia, D. C.; Wardwell, D. A.; Corsiglia, V. R.; and Kuhn, R. E.: Suckdown, Fountain Lift,
and Pressures Induced on Two Tandem Jet VTOL Configurations. NASA TM-102817,
March 1991.
Dudley, M. R.; Eshleman, J. E.; and Schell, C. J.: Full Scale Ground Effects of Twin Impinging
Jets Beneath a Subsonic Tactical V/STOL Aircraft. AIAA-86-2704, Oct. 1986.
Corsiglia, V. R.; Wardwell, D. A.; and Kuhn, R. E.: Small-Scale Experiments in STOVL
Ground Effects. SAE Paper 901060, Apr. 1990.
Hall, G. R.; and Rogers, K. H.: Recirculation Effects Produced by a Pair of Heated Jets
Impinging on a Ground Plane. NASA CR-1307, 1969.
Kuhn, R. E.; Bellavia, D. C.; Corsiglia, V. R.; and Wardwell, D. A.: On the Estimation of Jet
Induced Fountain Lift and Additional Suckdown in Hover for Two Jet Configurations.
NASA TM-102268, Aug. 1991.
Albang, L. F.: Analysis of Spread Multi-Jet VTOL Aircraft in Hover. Old Dominion University,
Report No. 74-T8, Dec. 1974.
Johnson, D. B.; Lacey, T. R.; and Voda, J. J.: Powered Wind Tunnel Testing of the AV-8B: A
Straightforward Approach Pays Off. AIAA-79-0333, Jan. 1979.
9
/////////////, _/////////////////////_
u'J r,°°°°,,oo°°..........,,°°oo,J _f
_p, °, ooo,°,,'"
4_
////////////.
Cp
_- Fountain Lift, AL f
0
_itional Suckdown, ALs_UCK(IOWn, z3LSJ + _t_oo
AlL
T
-0.1
-0.2
-0.3
/
/0 2
/ T
T
I I I I I
4 6 8 10 oo
h/de
Figure 1. Jet-induced lift loss increments. Method of reference 1.
10
rA
If////f///.41 V/////'////_
"///////////J
F//////////A
AF/////////'_/_
Entrainment surfaces
O_ I _O
View A-A
ModelGround Fountain lowersurface surface
Unfolded Entrainment Surface
(left side)
Figure 2. Entrainment surfaces for estimating multi-jet suckdown.
11
©
i I i I
0
I
0
0°_._
°_
c_
°_
LIDs
Area enclosed by LIDs, S L
Actual surface area inside the
area enclosed by connecting thejet centers:
LIDs
Area enclosed by LIDs, S L
Actual surface area inside the
area enclosed by connecting thejet centers.
Area enclosed by the linesconnecting the jet centers.
Figure 4. Lift Improvement Devices (LIDs).
13
ALn
T
0.2
0.1
[ _/,-- LIDsAL
-- Net, LIDs On T
m
I Fountain Increments (-@-)O
Multi-jet Increment (_)S
Equivalent single jet ALT
Multi-jet ALT
2 4 6 8 10 12 14
h/de
Figure 5. Example using a rectangular plate and close front to rear nozzlespacing (reference 1).
14
ALT
°2I0.1 •
_ LIDs
/6LNet, LIDs OnT
ALNet, LIDs Off T
Multi-j et Increment (-_-)S
Fountain Increments (@-) f
Equivalent single jet AL
2 4 6 8 10 12 14
h/de
Figure 6. Example using a rectangular plate and large front to rear nozzle
spacing (reference 1).
15
0.1
ALm 0
T
-0.1
(-_)_ _s_/- on H
• •
Suckdown
I I I
2 4 6
IDs
} Estimates (reference 6)
AL ¸
kL= fl SL
k_j._ _:f_h/de
m
[] m
I I I I I
8 10 12 14 oo
h/de
Figure 7. Lift induced on Harrier configuration hovering in ground effect (reference 12).
Cp
+
0
F ICp =ALf
_// (proposed)
C p base
Cp, sj
1.o
0.5 -
o -o
[]
[]
4 Delta Wing
_5
I I I I I
4 8 12 16 20
[]
@
h/de
Figure 8. Relation of the pressures induced at the model edges to thepressures estimated for an equivalent single jet. Delta wing configurationof reference 7.
17
+
Cp - Cp, oo 0
x1
I
ALf
_ -- 2Xo•,,,..._ I
_Xs, f [-" Xs, r _
Cp, max
ALs, f
I
ALs, r
Figure 9. Presentation of new method (reference 11).
18
NPR
Q 2[] 3
5& 6
0.04
Kf = 0.5
Body Alone
-_ I I I I0
0.04
dy
AL
f
0
0.04
0
- ___,_x_ Delta Wing
2g'* \
0 0.04 0.08 0.12 0.16
AS
Cp, max "_
Figure 10. Evaluation of the fountain factor, K f. Configurationsfrom reference 7.
19
Td e0
-0.2--
Experimental Data
® 2
[] 3 NPR4
V 5
Rear
Xs,r= -5.39
de
Front
-0.4 -- I I I I I-0.32 -0.28 -0.24 -0.20 -0.16
ALs- AL _,
Sde
I I I-0.12 -0.08 -0.04 0
T
Figure 11. Correlation of pitching moment increments induced on forward and aftsuckdown regions for the delta wing configuration of reference 7.
20
NPR = 2
0.2
T f0.1
0
-0.1
-0.2
-0.3
(9 IPressures } (Reference 7)(_)s 121 Balance
0
Predictions
Current (Reference 1)
New
®
-0.1
-0.2
-0.3
-0.4 I® I I I I I I
0 2 4 6 8 10 12 _oh/de
Figure 12 -- Lift loss comparison for the delta wing configuration of reference 7.
21
1.4
1.2
1.0
0.8
0.6
0.4
0.2
0
-0.2
-0.4
AMTde
@
&
rQ J Pressures, sections
/_ ;Pressures, total
[] Balance
Prediction, sections
-- Prediction, total
[]
rr
Aft Suckdown
[] Total
h/de
I I I10 12 oo
Figure 13 -- Pitching moment comparison for the delta wing configuration ofreference 7.
22

_ _ i._._Qi_ ,L,_ ¸
Report Documentation PageNai_¢_ AemnaJi_ e_d
Space _Irn_ t,t'ali_
1. Report No. 2. Govemment Accession No. 3. Recipienrs Catalog No.
NASA TM-102818
4. "title and Subtitle
Prediction Techniques for Jet-Induced Effects in Hover on STOVLAircraft
7. Author(s)
Douglas A. Wardwell and Richard E. Kuhn*
9. Performing Organization Name and Address
Ames Research Center
Moffett Field, CA 94035-1000
12. Sponsoring Agency Name and Address
National Aeronautics and Space Administration
Washington, DC 20546-0001
5. Report Date
August 1991
6. Performing Organization Code
8. Performing Organization Report No.
A-90146
10. Work Unit No.
505-68-71
11. Contract or Grant No.
13. Type of Report and Period Covered
Technical Memorandum
14. Sponsoring Agency Coda
15. Supplementary Notes
Point of Contact: Douglas A. Wardwell, Ames Research Center, MS 237-3,
Moffett Field, CA 94035-1000, (415) 604-6566 or Frs 464-6566
*V/STOL Consultant, 16527 Sambroso PI., San Diego, CA 92128
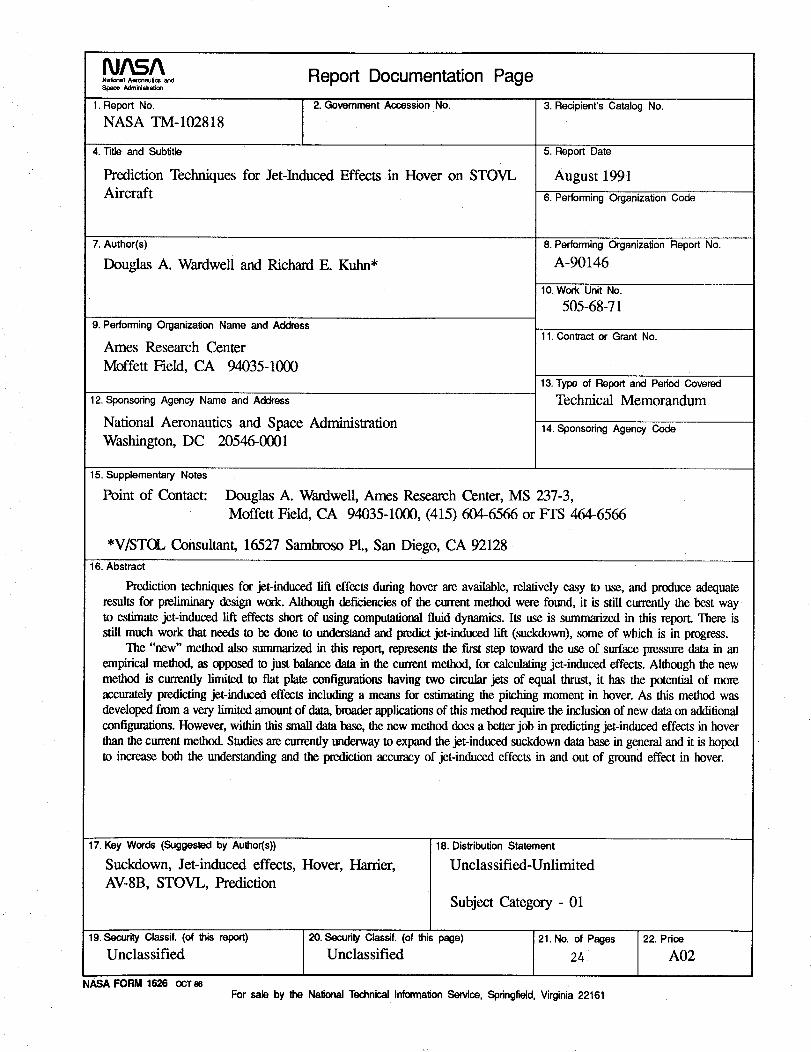
16. Abstract
Prediction techniques for jet-induced rift effects during hover are available, relatively easy to use, and produce adequate
results for preliminary design work. Although deficiencies of the current method were found, it is still currently the best wayto estimate jet-induced lift effects shortof using computational fluid dynamics. Its use is summarized in this report. There isstill much work that needs to be done to understand and predict jet-induced lift (suckdown), some of which is in progress.
The "new" method also summarized in lifts report, represents the first step toward the use of surface pressure data in anempirical method, as opposed to just balance data in the current method, for calculating jet-induced effects. Although the newmethod is currently limited to flat plate configurationshaving two circular jets of equal thrust, it has the potential of moreaccurately predicting jet-induced effects including a means for estimating the pitching moment in hover. As this method wasdeveloped from a very limited amount of data, broader applications of this method require the inclusion of new data on additionalconfigurations. However, within this small data base, the new method does a better job in predicting jet-induced effects in hover
than the current method. Studies are currently underway to expand the jet-induced suckdown data base in general and it is hopedto increase both the understanding and the prediction accuracy of jet-induced effects in and out of ground effect in hover.
17. Key Words (Suggested by Author(s))
Suckdown, Jet-induced effects, Hover, Harrier,
AV-8B, STOVL, Prediction
18. Distribution Statement
Unclassified-Unlimited
Subject Category - 01
19. Security Classif. (of this report)
Unclassified
NASA FORM 1626 OCT86
20. Secudty Classif. (of this page) 21. No. of Pages
Unclassified 24
For sale by the National Technical Information Service, Springfield, Virginia 22161
22. Price
A02