Embed Size (px)
Citation preview
Brizuela, Armel & Montero-Rojas, Eiliana (2013). Prediction of the difficulty level in a standardized reading compre-hension test: contributions from cognitive psychology and psychometrics. RELIEVE, 19 (2), art. 1. DOI: 10.7203/relieve.19.2.3149
RELIEVE- Revista ELectrónica de Investigación y EValuación Educativa [ www.uv.es/RELIEVE ] pag. 1
e-Journal of Educational Research, Assessment and
Evaluation
Revista ELectrónica de Investigación y EValuación
Educativa
PREDICTION OF THE DIFFICULTY LEVEL IN A STAN-DARDIZED READING COMPREHENSION TEST: CON-TRIBUTIONS FROM COGNITIVE PSYCHOLOGY AND
PSYCHOMETRICS [Predicción del nivel de dificultad en una prueba estandarizada de
comprensión de lectura: aportes desde la psicometría y la psicología cognitiva]
by/por
Article record
About authors
HTML format
Brizuela, Armel ([email protected]) Montero-Rojas, Eiliana ([email protected])
Ficha del artículo
Sobre los autores
Formato HTML
Abstract This research seeks to identify possible predictors of the difficulty level of reading comprehension items used in a standardized psychometric test for university admission. Several potential predictors of difficulty were proposed, namely, propositional density, negations, grammatical structure, vocabulary difficulty, presence of enhancement elements (words highlighted typographically), item ab-straction level and degree of similarity between correct option and relevant text to resolve the item. By Linear Lo-gistic Test Model (Fisher, 1973) it was found that the number of propositions, the syntactic structure, and fun-damentally, the presence of difficult words contributed to the prediction of the item difficulty level.
Resumen Esta investigación busca identificar posibles variables predictoras del nivel de dificultad de los ítems de com-prensión de lectura utilizados en una prueba psicométrica estandarizada para la admisión a una institución universi-taria. Se propusieron varios posibles predictores del nivel de dificultad, a saber: densidad proposicional, negaciones, estructura sintáctica, dificultad del vocabulario, presencia elementos de realce (palabras resaltadas tipográficamen-te), abstracción del ítem y grado de similitud entre opción correcta y texto relevante para resolver el ítem. Mediante el Modelo Logístico Lineal de Rasgo Latente se encontró que la cantidad de proposiciones, la estructura sintáctica y, fundamentalmente, la presencia de léxico difícil de com-prender contribuyeron a la predicción del nivel de dificul-tad.
Keywords Cognitive psychology, language processing, reading com-prehension, Item Response Theory, Linear Logistic Test Model, Task Analysis, Item difficulty level..
Descriptores Psicología cognitiva, Procesamiento del lenguaje, Com-prensión de lectura, Teoría de Respuesta al Ítem, Modelo Logístico Lineal de Rasgo Latente, Análisis de tareas, Ni-vel de dificultad de los ítems.
This study is about the verbal items on the University of Costa Rica Academic Aptitude Test (PAA, its initials in Spanish), for which a set of attributes were proposed that might in-crease or decrease their difficulty levels.
The Linear Logistic Test Model (LLTM) was used to statistically relate the proposed attributes for each item and the examinees’ answers, entering this data into two matrices and decomposing each item’s difficulty index
Brizuela, Armel & Montero-Rojas, Eiliana (2013). Prediction of the difficulty level in a standardized reading compre-hension test: contributions from cognitive psychology and psychometrics. RELIEVE, 19 (2), art. 1. DOI: 10.7203/relieve.19.2.3149
RELIEVE- Revista ELectrónica de Investigación y EValuación Educativa [ www.uv.es/RELIEVE ] pag. 2
(parameter b) into the components involved in each one’s solution.
This research is linked to the latest ap-proaches to validity (Gorin, 2007; Embretson, 1996; Embretson & Gorin, 2001; Messick, 1995; Cronbach & Meehl, 1955; Borsboom, Mellenbergh & Heerden, 2004), according to which the validity of the inferences made from test result interpretations are valid when: a) the construct exists as such, and b) variations of the constructs cause variations in the scores obtained on the test. Thus the primary objec-tive was to identify some PAA verbal item characteristics that make it possible to predict item difficulty level based on several variables that have been thoroughly researched in the field of cognitive psychology.
Interest in isolating the item strategies and attributes involved in solving reading compre-hension tests is relatively recent, if we com-pare it with the long history of this type of testing (Hunt, 2011). This line of research has been built on the investigation (mainly through semi-structured interviews and verbal self-reports) into the strategies used by subjects to solve reading comprehension items (Farr, Pritchard & Smitten, 1990; DeMauro, Merritty & Adams, 1994; Powers & Wilson, 1995; Rupp, Ferne & Choi, 2006). In addition, the attempt to predict item difficulty level has generated a large number of studies where the basic interest has been to identify cognitive and linguistic predictors (Drum, Calfee & Cook, 1981; Stahl & Jacobson, 1986; Davey, 1988; Kirsch & Mosenthal, 1990; Freedle & Kostin, 1991; Freedle & Kostin, 1992; Dane-man & Hannon, 2001; Sheehan & Ginther, 2001; Gorin & Embretson, 2006; Ozuru, Rowe, O’Reilly & McNamara, 2008; Leroy, Helmreich & Cowie, 2010). These last studies have primarily used a quantitative approach, making use of traditional statistical techniques such as multiple regression and ANOVA; however, various studies can also be found where the LLTM is used to estimate the pre-dictive power of certain characteristics of logi-cal reasoning and reading comprehension
items (Embretson & Wetzel, 1987; Sheehan & Mislevy, 1990; Gorin, 2005; Sonnleitner, 2008; Attoresi, Picón, Abal, Aguerri & Galib-ert, 2009; Gilbert, Picón, Lozzia, Aguerri & Attorresi, 2010; Poinstingl, 2009).
This being the case, the aforementioned studies have been of vital importance in identi-fying several variables that might be of interest for predicting the difficulty level of PAA ver-bal items. The different studies that have used the LLTM for this purpose, along with those that used classical quantitative data analysis techniques, have served to justify the sources of difficulty that will be explained below. Moreover, the studies focusing on the strate-gies for solving these types of items are rele-vant for taking into account how hugely im-portant the response options and questions are when predicting the difficulty level of a par-ticular verbal task.
Based on a review of the literature, it was possible to identify a set of difficulty sources considered significant for this study. These difficulty sources will be explained in detail further below, along with the way they were coded. The following section presents this study’s theoretical model with the incorpora-tion of the predictors found in the literature.
It should be emphasized that the pertinence of the item attributes was considered in light of the researcher's experience and that of experts in the field of linguistics and cognitive psy-chology. It would certainly be possible to in-clude many other factors that might influence the level of item difficulty, but it was neces-sary to filter them out on the basis of accumu-lated experience with the particular features of the PAA. In this respect the items used on this test do not have all the characteristics of other verbal reasoning and reading comprehension tests.
Taking into consideration the purpose of this study, theoretical contributions from different disciplines have had to be integrated into a single conceptual framework. Below, there-fore, is a description of the interest of psycho-
Brizuela, Armel & Montero-Rojas, Eiliana (2013). Prediction of the difficulty level in a standardized reading compre-hension test: contributions from cognitive psychology and psychometrics. RELIEVE, 19 (2), art. 1. DOI: 10.7203/relieve.19.2.3149
RELIEVE- Revista ELectrónica de Investigación y EValuación Educativa [ www.uv.es/RELIEVE ] pag. 3
metrics in the contributions of cognitive psy-chology, the characteristics of the LLTM, the Embretson & Wetzel model (1987) for ex-plaining in cognitive terms how a reading comprehension item is resolved, and, finally, the sources of difficulty in said process.
Psychometrics and Cognitive Psychology There is currently much interest in latent trait
psychometric models because they permit calibration of test items based on their attrib-utes. With classical test theory it was only pos-sible to calculate overall test measurements, while these variable-measurement or latent-trait approaches allow for measurement that meets the validity requirement described at the beginning of this paper.
In addition, there has been a strong interest in modern psychometrics in using the findings of cognitive psychology to theoretically ex-plain the cognitive factors underlying the scores obtained on different types of psycho-metric tests (Cortada de Kohan, 2003). This possibility is highly useful for constructing items with pre-established parameters, as well as for explaining the characteristics or compo-nents of items on psychometric tests such as the PAA.
To this respect, the basic fact is that the scores obtained on any paper-and-pencil in-strument depend, to a certain extent, on the specific characteristics of each item. The re-sults obtained on verbal items can therefore be expected to be related to aspects inherent to item structure, that is, to the characteristics of natural language.
On the other hand, the score obtained on a psychometric test is associated with a con-struct traditionally called “ability”, which is conceptualized as a dependent variable based on statistical calculations made with the test scores. In other words, the ability is obtained as a summary indicator that involves a combi-nation of cognitive processes, strategies, com-ponents and knowledge that can be mathe-matically modeled using a measurement the-
ory, which in this particular study is the Rasch model and the LLTM (Embretson, 1989).
It should not be forgotten that although cog-nitive psychology and psychometrics may concur, the essential interest in the aforemen-tioned study is to seek evidence of validity and improve the predictive power of a psychomet-ric instrument in order to establish more pre-cise differences between the ability levels of the subjects. If we can identify those item at-tributes that explain their difficulty, we would be able to get greater precision when measur-ing constructs, and this would make it possible to carry out valid and reliable measurements and establish equally pertinent differences among the subjects taking a test. These types of psychometric models, then, have also been called explanatory item response models (De Boeck & Wilson, 2004) because they make it possible to explain in cognitive terms the variations shown by statistics calculated on the basis of examinees’ responses.
Linear Logistic Test Model (LLTM) This study uses one of the logistic latent-trait
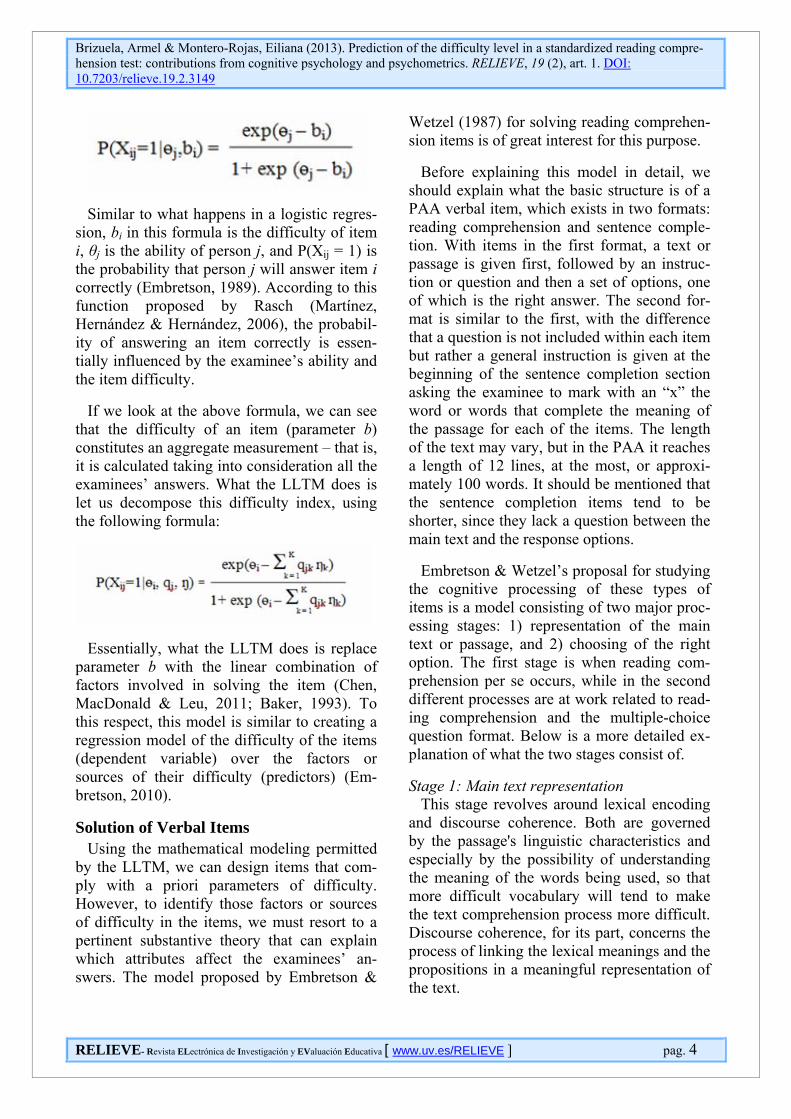
models with linear constraints most commonly used for modeling the components involved in solving an item: the Linear Logistic Test Model (LLTM). Proposed by Fischer (1973), it is considered one of the many models derived from the one proposed by Rasch (Bond & Fox (2001) give a detailed presentation of this model). According to this measurement model, answering an item is a probabilistic rather than a deterministic phenomenon, so answering it correctly does not relate linearly to the overall test score. If the probability of getting an item correct is calculated for each ability level of the examinees, obtained from the total test score, it distributes normally, so the resulting curve takes the shape of a cumulative normal distribution. In addition, if we take into ac-count that a logistic curve is very similar in shape but mathematically simpler, we can see why the following equation proposed by Rasch has been extremely useful in the field of psy-chometrics:
Brizuela, Armel & Montero-Rojas, Eiliana (2013). Prediction of the difficulty level in a standardized reading compre-hension test: contributions from cognitive psychology and psychometrics. RELIEVE, 19 (2), art. 1. DOI: 10.7203/relieve.19.2.3149
RELIEVE- Revista ELectrónica de Investigación y EValuación Educativa [ www.uv.es/RELIEVE ] pag. 4
Similar to what happens in a logistic regres-sion, bi in this formula is the difficulty of item i, θj is the ability of person j, and P(Xij = 1) is the probability that person j will answer item i correctly (Embretson, 1989). According to this function proposed by Rasch (Martínez, Hernández & Hernández, 2006), the probabil-ity of answering an item correctly is essen-tially influenced by the examinee’s ability and the item difficulty.
If we look at the above formula, we can see that the difficulty of an item (parameter b) constitutes an aggregate measurement – that is, it is calculated taking into consideration all the examinees’ answers. What the LLTM does is let us decompose this difficulty index, using the following formula:
Essentially, what the LLTM does is replace parameter b with the linear combination of factors involved in solving the item (Chen, MacDonald & Leu, 2011; Baker, 1993). To this respect, this model is similar to creating a regression model of the difficulty of the items (dependent variable) over the factors or sources of their difficulty (predictors) (Em-bretson, 2010).
Solution of Verbal Items Using the mathematical modeling permitted
by the LLTM, we can design items that com-ply with a priori parameters of difficulty. However, to identify those factors or sources of difficulty in the items, we must resort to a pertinent substantive theory that can explain which attributes affect the examinees’ an-swers. The model proposed by Embretson &
Wetzel (1987) for solving reading comprehen-sion items is of great interest for this purpose.
Before explaining this model in detail, we should explain what the basic structure is of a PAA verbal item, which exists in two formats: reading comprehension and sentence comple-tion. With items in the first format, a text or passage is given first, followed by an instruc-tion or question and then a set of options, one of which is the right answer. The second for-mat is similar to the first, with the difference that a question is not included within each item but rather a general instruction is given at the beginning of the sentence completion section asking the examinee to mark with an “x” the word or words that complete the meaning of the passage for each of the items. The length of the text may vary, but in the PAA it reaches a length of 12 lines, at the most, or approxi-mately 100 words. It should be mentioned that the sentence completion items tend to be shorter, since they lack a question between the main text and the response options.
Embretson & Wetzel’s proposal for studying the cognitive processing of these types of items is a model consisting of two major proc-essing stages: 1) representation of the main text or passage, and 2) choosing of the right option. The first stage is when reading com-prehension per se occurs, while in the second different processes are at work related to read-ing comprehension and the multiple-choice question format. Below is a more detailed ex-planation of what the two stages consist of.
Stage 1: Main text representation This stage revolves around lexical encoding
and discourse coherence. Both are governed by the passage's linguistic characteristics and especially by the possibility of understanding the meaning of the words being used, so that more difficult vocabulary will tend to make the text comprehension process more difficult. Discourse coherence, for its part, concerns the process of linking the lexical meanings and the propositions in a meaningful representation of the text.
Brizuela, Armel & Montero-Rojas, Eiliana (2013). Prediction of the difficulty level in a standardized reading compre-hension test: contributions from cognitive psychology and psychometrics. RELIEVE, 19 (2), art. 1. DOI: 10.7203/relieve.19.2.3149
RELIEVE- Revista ELectrónica de Investigación y EValuación Educativa [ www.uv.es/RELIEVE ] pag. 5
Before going on, we should clarify what this study understands as a proposition. The con-cept refers to a state, event or action repre-sented in the text that can be evaluated in terms of its truth value with respect to the real world or an imaginary construction (Graesser, Millis & Zwaan, 1997). Said states, events or actions presented in the text are integrated, together with the lexical meaning of the words, into a coherent whole, so that, in the words of Kintsch (1998), “comprehension entails form-ing, on the basis of perceptual and conceptual features, coherent units with Gestalt-type char-acteristics.” (p. 93)
The representation stage constitutes a cycli-cal or iterative process in which the text’s propositions (in this case, the processing units) are integrated into a coherent whole, together with the reader’s prior knowledge. Thus the model proposed by Kintsch & van Dijk (1978) is called the Construction-Integration Model, insofar as reading comprehension is the proc-ess of constructing a mental representation based on the integration of multiple proposi-tions, such that the difficulty in this stage is given by the text’s propositional density and by all those factors that make the construction-integration process difficult, such as the use of negations or grammatically complex sentences (subordinated clauses or passive voice). In effect, the ratio between the number of propo-sitions and total text size is a major factor when creating a coherent mental representa-tion, since the ability to process such units is limited. In addition, if they are not integrated properly, the information will not be sufficient for using it later to solve an item (Gorin & Embretson, 2006).
Stage 2: Choosing the correct option Embretson & Wetzel (1987) call this second
stage the decision process, since this is when people make a decision as to which response options are incorrect and which is correct. First of all, the sub-processes that occur in the ear-lier stage (lexical encoding and coherence) also occur here in the same way with the ques-tions and response options (in the case of the
sentence completion format, these processes only occur in the response options). In other words, examinees first need to understand what is being asked of them, along with the alternatives being presented, before they can proceed with the remaining sub-processes. However, it is not enough to understand the meaning of the questions and options, because a choice must also be made of the correct al-ternative depending on the question or item instruction.
The next step is text mapping, which is the process of relating the propositions of the questions and options to the representation previously constructed and integrated on the basis of the passage propositions. The diffi-culty level in the text mapping is influenced by the amount of information needed from the passage to answer the question or perform the requested task. This implies that not all the information in the passage is essential for solv-ing the item, but rather that there are relevant text segments or key information for finding the correct response among the options.
Finally, the last step in this second stage is to evaluate the truth status of the response op-tions, which in turn is carried out through two activities: falsification and confirmation. This dual process is related to the amount of infor-mation given in the passage that can be used to falsify or confirm the response options. Item difficulty decreases insofar as incorrect op-tions can be falsified by the text (because they are contradicted explicitly) or the correct op-tion can be confirmed by the passage (because it is stated explicitly).
Embretson & Wetzel (1987) also proposed other variables that could affect the level of item difficulty. One is the vocabulary level used in the response options. A distractor that uses difficult-to-understand terms tends not to be considered a plausible candidate for the correct option, and those answering a multiple-choice question frequently do not choose the correct response when difficult vocabulary is used in it. That is to say, difficult vocabulary
Brizuela, Armel & Montero-Rojas, Eiliana (2013). Prediction of the difficulty level in a standardized reading compre-hension test: contributions from cognitive psychology and psychometrics. RELIEVE, 19 (2), art. 1. DOI: 10.7203/relieve.19.2.3149
RELIEVE- Revista ELectrónica de Investigación y EValuación Educativa [ www.uv.es/RELIEVE ] pag. 6
acts as a factor for increasing item difficulty (when it is present in the correct option and absent in the distractors) or decreasing item difficulty (when it is absent in the correct op-tion and present in the distractors). Another source of difficulty involved in the response selection stage is the similarity between the options and the relevant text for answering the item. The lowest level of difficulty is when the correct option is the same as the relevant text for answering the item, since no inference or reordering is necessary in order to answer. On the other hand, the highest level of difficulty would be where a generalization or application must be made, which occurs when the correct option is a general statement that explains the particular cases in the passage, or when said option is a particular case of some general statement or rule in the passage, respectively. There is an intermediate level between the two poles of difficulty where the correct option is a paraphrasing of the portion of relevant text for answering the item, or in other words, the cor-rect option expresses the same information as the relevant text for answering the item but in other words (using synonyms, grammatical reordering, equivalent phrases, etc.).
Sources of Difficulty of the PAA Verbal Items All the theoretical grounds for this study
having been given, what remains is to propose a list of the characteristics or attributes that could explain the difficulty level of the PAA verbal items. The proposed characteristics or attributes are as follows: predicate and modi-fier propositional density, number of connec-tors, negations, passive voice with “se” (in Spanish), subordinate clauses, lexical diffi-culty, vocabulary use frequency, and the pres-ence of enhancement elements (words in bold type).
It should be noted that we used many of the sources of difficulty proposed by Embretson & Wetzel (1987) and Gorin & Embretson (2006), who conducted exhaustive literature searches to incorporate in their analyses all those vari-ables that affect reading comprehension.
Hypotheses This section gives the hypotheses derived
from the Embretson & Wetzel (1987) model, the research background, and our experience with the particular characteristics of the PAA.
H1: The higher the predicate and modifier propositional density, the higher the difficulty when solving the item.
It is expected that a larger number of propo-sitions means a higher processing load for the examinee; this is to be expected since the ex-aminee has to maintain active a larger amount of information insofar as the item has more propositions. This hypothesis corresponds to the sources of difficulty regarding predicate and modifier propositional density in the pas-sage, in the instructions and in the response options.
H2: The higher the connective propositional density, the lower the difficulty level.
Linking particles (words such as “but”, “be-sides”, “consequently”, “however”, etc.) facili-tate coherent integration of the text, giving the examinees clues for identifying logical and conceptual relationships between the different propositions in the main text.
H3: The presence of negations makes solving of the items more difficult.
Using the particle “no” to refer to a specific proposition forces the reader to keep in mind two versions of the same situation: one that refers to the situation itself, and one that re-lates to the absence or falsity of what was said. Each negated proposition thus provides more information than an affirmative proposition. For example, to understand the proposition “Tomorrow I’m not going to class” it is neces-sary to identify the event of “going to class” and also process the non-occurrence of the same action. With respect to the aforemen-tioned sources of difficulty, this hypothesis applies to the passage, the questions (if there are any) and the response options.
Brizuela, Armel & Montero-Rojas, Eiliana (2013). Prediction of the difficulty level in a standardized reading compre-hension test: contributions from cognitive psychology and psychometrics. RELIEVE, 19 (2), art. 1. DOI: 10.7203/relieve.19.2.3149
RELIEVE- Revista ELectrónica de Investigación y EValuación Educativa [ www.uv.es/RELIEVE ] pag. 7
H4: The presence of passive voice and sub-ordinate clauses increases the difficulty when solving the item.
In the consulted studies, these types of con-structions have been considered important factors for increasing the level of difficulty when comprehending the text. It is to be ex-pected that every passive voice sentence has to be transformed to active voice in order to be incorporated into the propositional network being constructed from the text. This trans-formation (as with negations) is therefore ex-pected to represent a higher processing load for the reader. Subordination also entails a greater amount of processing in terms of work-ing memory, since it requires the reader to maintain active the subject of the sentence while processing the rest of the sentence com-ponents, which tend to be relatively removed from the subject precisely because of the typi-cal structure of a subordinate clause.
H5: Difficult vocabulary will increase item difficulty when it is in the correct option and insofar as these types of words are in the main text.
We found in our consultation of the literature that anyone answering an item needs to know the meaning of the words contained in it. When this lexical knowledge does not exist, comprehension is weakened insofar as the per-son cannot use all the information needed for solving the item. In particular, when one or several poorly known terms (that is, difficult vocabulary) are in the correct response, it tends to be considered implausible, so distrac-tors with more accessible vocabulary become better candidates (from the examinee’s point of view) for being the correct option.
H6: The presence of enhancement elements (words in bold) facilitate an item’s solution.
The explanation is that this typographical re-source visually helps the examinee determine what exactly he or she should be looking for in the response options.
Method Sample
The item sample consists of 100 verbal items applied in 2011 that are used regularly in the University of Costa Rica entrance exam. It should be noted that only those items that were in the item bank that year, which had met all the psychometric requirements for a regularly applied item, were used for the analysis. Ex-perimental items – that is, those used for the first time that year – were therefore not taken into account in the analysis, inasmuch as it was uncertain at that time whether they were representative of the population of verbal items on the PAA. In addition, 37,937 high school students took the PAA that year. Procedure
Three experts and one codifier judged the items in the sample: the codifier was responsi-ble for coding the 100 items according to at-tributes requiring counts only, while the ex-perts handled predictors in which a more global valuation had to be made. Once this task was completed, the respective inter-rater agreement indices (Cohen kappa and intra-class correlation) were calculated. Two data matrices were then constructed, one with the students’ responses on the items (in terms of 1 = right and 0 = wrong) and the other with the values assigned to those same items by the three raters and the codifier. These matrices were entered into the R software to verify the existing correlation between the difficulty in-dex estimated by this model and the one esti-mated using the Rasch model. Finally, the sta-tistically significant difficulty sources were used in a multiple regression model in order to gauge their importance to predict the Rasch model b parameter.
We should clarify that the raters were chosen on the basis of their respective areas of exper-tise, namely, linguistics (two experts) and cog-nitive psychology (one expert). Also taken into account was the restricted access to the items, which are the confidential material of the Per-manent Academic Aptitude Test Program at the University of Costa Rica. Professionals
Brizuela, Armel & Montero-Rojas, Eiliana (2013). Prediction of the difficulty level in a standardized reading compre-hension test: contributions from cognitive psychology and psychometrics. RELIEVE, 19 (2), art. 1. DOI: 10.7203/relieve.19.2.3149
RELIEVE- Revista ELectrónica de Investigación y EValuación Educativa [ www.uv.es/RELIEVE ] pag. 8
therefore had to be chosen who could guaran-tee discretional use of the information they were going to handle, and they signed a confi-dentiality agreement with the Program wherein they agreed not to disclose said information.
More difficulty predictors were originally proposed, but during coding it was possible to show that some were either irrelevant or ab-sent in the item sample, and the decision was made to exclude them from the analysis. In addition, two corpuses prepared by researchers in the Hispanic-Costa Rican Lexicography Studies program of the University of Costa Rica’s Institute for Linguistic Research were used to measure vocabulary use frequency (Sánchez, n.d.; Ríos, 2011).
Two software programs were used for the analysis: R, for running the LLTM and the regression model; and Winsteps, for running the Rasch model. A code manual was also prepared, along with a log sheet for the raters to analyze the items based on the sources of difficulty described earlier. Analytic Strategy
Due to this study’s fundamentally psycho-metric nature, the analysis strategy is an intrin-sic component of the supporting theory. For this reason, a detailed explanation of the LLTM was given in the theoretical framework, so only mention will be made in this section of the steps for carrying out the analysis.
Before going into the steps for implementing the LLTM, we should point out that we worked only with those items meeting the as-sumptions of the Rasch model (unidimension-ality and model fit). We thus first ran an ex-ploratory factor analysis and used the Rasch model in the Winsteps program to evaluate the fit of the items and the examinees.
Below, then, are the stages of the LLTM:
1. The Rasch model was run in R to esti-mate the item difficulty indices. The analy-
sis was made by exam form, so four sepa-rate analyses were made according to the way the Academic Aptitude Test is adminis-tered. 2. The codes assigned by the raters were en-tered as a matrix into the eRm (the package implemented in R for running the Rasch model and the LLTM). 3. The LLTM was used to estimate the dif-ficulty indices based on the predictors en-tered in step two. 4. Model fit was evaluated using the corre-lation coefficient between the Rasch model and LLTM estimates. 5. A multiple regression model was used to identify the direction and importance of the specific effect for each predictor.
Results The results of the analyses are given in this
section, which is divided into seven sub-sections according to the information in each, namely: 1) descriptive statistics, 2) inter-rater reliability coefficients, 3) factorial structure of each form, 4) fit of the items to the Rasch model, 5) LLTM goodness-of-fit indices, 6) LLTM eta parameters, and 7) standardized beta coefficients of the regression model. Descriptive Statistics
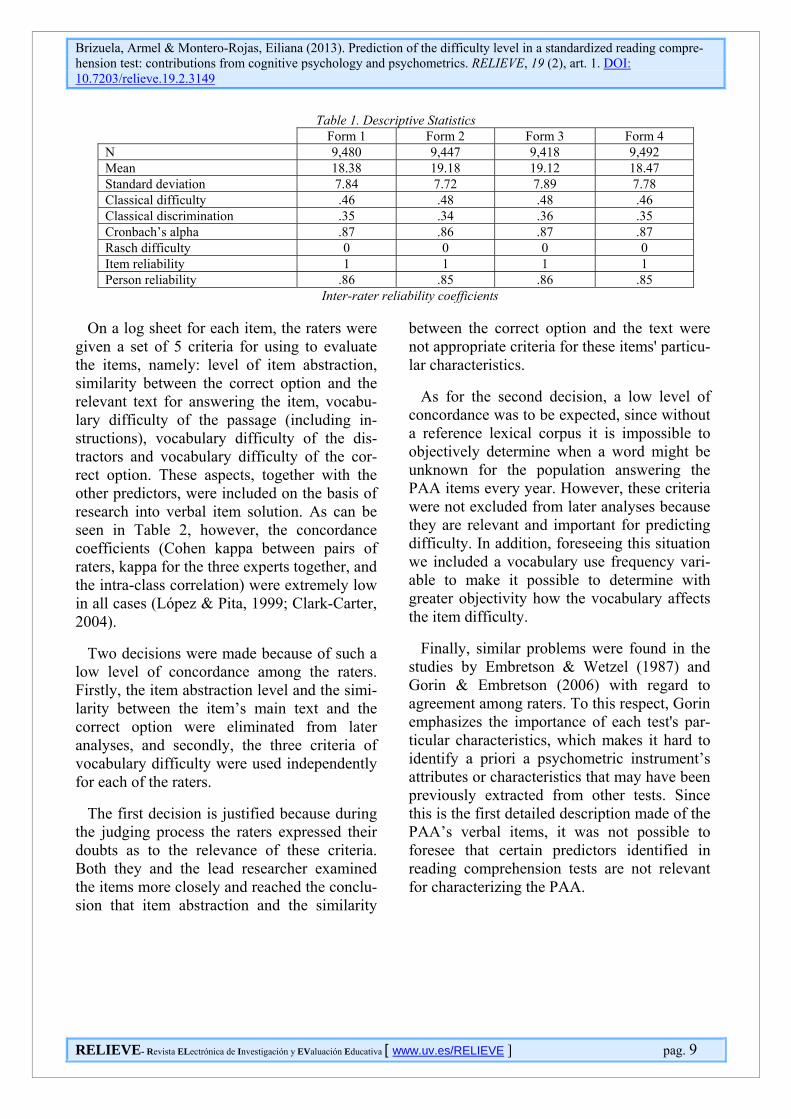
Table 1 gives some descriptive data on the four PAA forms. It first gives the number of people answering each, which is an enor-mously large number compared to the samples that usually appear in psychometric research. The forms are what are called parallel tests, with small, decimal-point differences between each. Reliability for all the forms is high and homogenous. Finally, with regard to the Rasch-estimated difficulty, it should be pointed out that the verbal items were on aver-age of medium difficulty, taking into account that the difficulty index tends to be from -3 to +3.
Brizuela, Armel & Montero-Rojas, Eiliana (2013). Prediction of the difficulty level in a standardized reading compre-hension test: contributions from cognitive psychology and psychometrics. RELIEVE, 19 (2), art. 1. DOI: 10.7203/relieve.19.2.3149
RELIEVE- Revista ELectrónica de Investigación y EValuación Educativa [ www.uv.es/RELIEVE ] pag. 9
Table 1. Descriptive Statistics Form 1 Form 2 Form 3 Form 4 N 9,480 9,447 9,418 9,492 Mean 18.38 19.18 19.12 18.47 Standard deviation 7.84 7.72 7.89 7.78 Classical difficulty .46 .48 .48 .46 Classical discrimination .35 .34 .36 .35 Cronbach’s alpha .87 .86 .87 .87 Rasch difficulty 0 0 0 0 Item reliability 1 1 1 1 Person reliability .86 .85 .86 .85
Inter-rater reliability coefficients
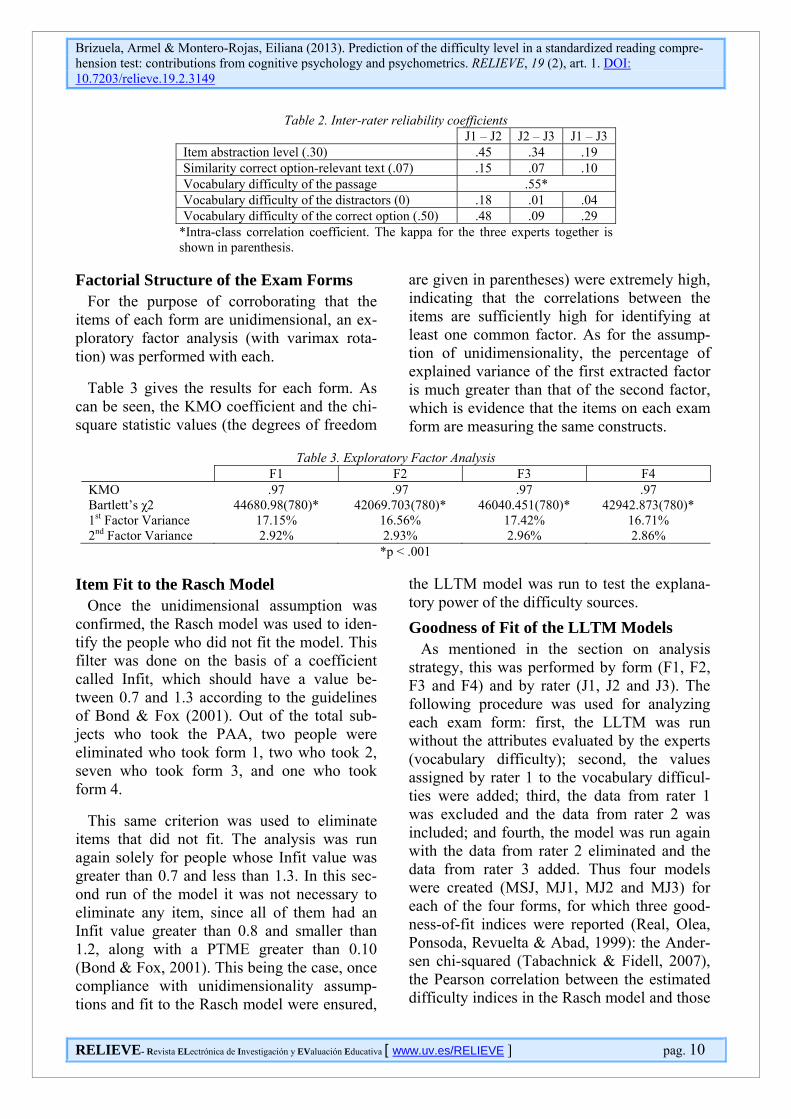
On a log sheet for each item, the raters were given a set of 5 criteria for using to evaluate the items, namely: level of item abstraction, similarity between the correct option and the relevant text for answering the item, vocabu-lary difficulty of the passage (including in-structions), vocabulary difficulty of the dis-tractors and vocabulary difficulty of the cor-rect option. These aspects, together with the other predictors, were included on the basis of research into verbal item solution. As can be seen in Table 2, however, the concordance coefficients (Cohen kappa between pairs of raters, kappa for the three experts together, and the intra-class correlation) were extremely low in all cases (López & Pita, 1999; Clark-Carter, 2004).
Two decisions were made because of such a low level of concordance among the raters. Firstly, the item abstraction level and the simi-larity between the item’s main text and the correct option were eliminated from later analyses, and secondly, the three criteria of vocabulary difficulty were used independently for each of the raters.
The first decision is justified because during the judging process the raters expressed their doubts as to the relevance of these criteria. Both they and the lead researcher examined the items more closely and reached the conclu-sion that item abstraction and the similarity
between the correct option and the text were not appropriate criteria for these items' particu-lar characteristics.
As for the second decision, a low level of concordance was to be expected, since without a reference lexical corpus it is impossible to objectively determine when a word might be unknown for the population answering the PAA items every year. However, these criteria were not excluded from later analyses because they are relevant and important for predicting difficulty. In addition, foreseeing this situation we included a vocabulary use frequency vari-able to make it possible to determine with greater objectivity how the vocabulary affects the item difficulty.
Finally, similar problems were found in the studies by Embretson & Wetzel (1987) and Gorin & Embretson (2006) with regard to agreement among raters. To this respect, Gorin emphasizes the importance of each test's par-ticular characteristics, which makes it hard to identify a priori a psychometric instrument’s attributes or characteristics that may have been previously extracted from other tests. Since this is the first detailed description made of the PAA’s verbal items, it was not possible to foresee that certain predictors identified in reading comprehension tests are not relevant for characterizing the PAA.
Brizuela, Armel & Montero-Rojas, Eiliana (2013). Prediction of the difficulty level in a standardized reading compre-hension test: contributions from cognitive psychology and psychometrics. RELIEVE, 19 (2), art. 1. DOI: 10.7203/relieve.19.2.3149
RELIEVE- Revista ELectrónica de Investigación y EValuación Educativa [ www.uv.es/RELIEVE ] pag. 10
Table 2. Inter-rater reliability coefficients J1 – J2 J2 – J3 J1 – J3 Item abstraction level (.30) .45 .34 .19 Similarity correct option-relevant text (.07) .15 .07 .10 Vocabulary difficulty of the passage .55* Vocabulary difficulty of the distractors (0) .18 .01 .04 Vocabulary difficulty of the correct option (.50) .48 .09 .29
*Intra-class correlation coefficient. The kappa for the three experts together is shown in parenthesis.
Factorial Structure of the Exam Forms
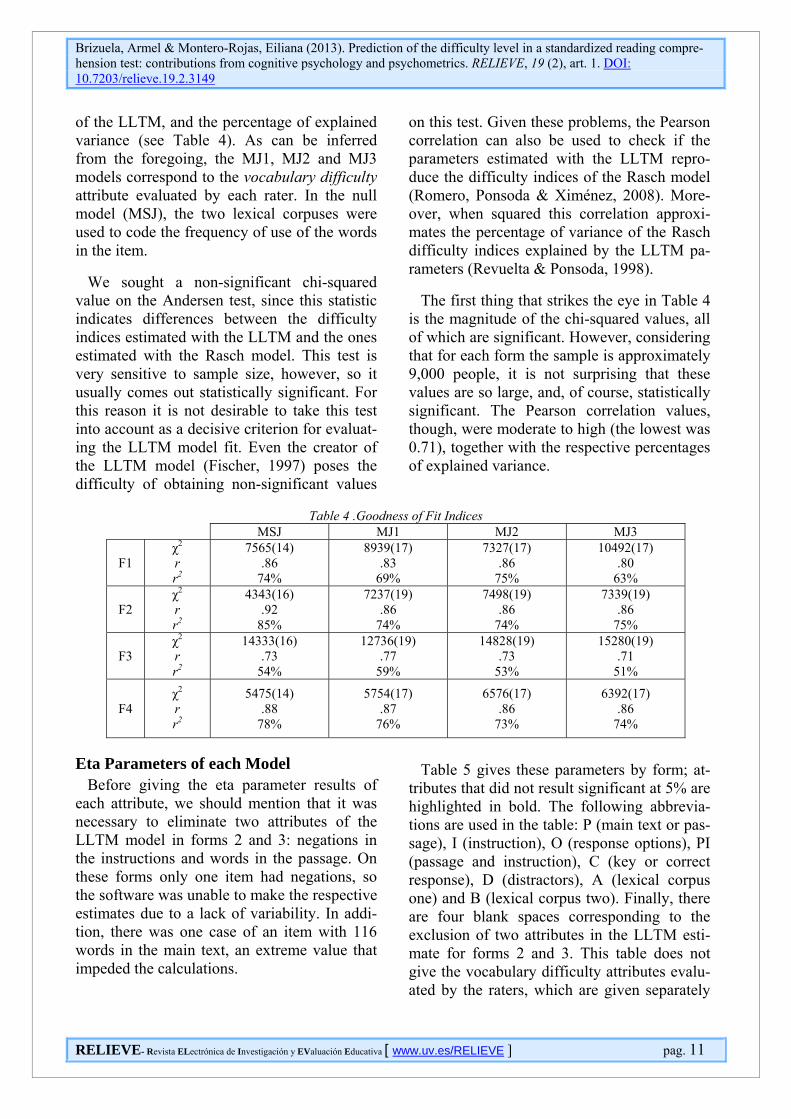
For the purpose of corroborating that the items of each form are unidimensional, an ex-ploratory factor analysis (with varimax rota-tion) was performed with each.
Table 3 gives the results for each form. As can be seen, the KMO coefficient and the chi-square statistic values (the degrees of freedom
are given in parentheses) were extremely high, indicating that the correlations between the items are sufficiently high for identifying at least one common factor. As for the assump-tion of unidimensionality, the percentage of explained variance of the first extracted factor is much greater than that of the second factor, which is evidence that the items on each exam form are measuring the same constructs.
Table 3. Exploratory Factor Analysis
F1 F2 F3 F4 KMO .97 .97 .97 .97 Bartlett’s χ2 44680.98(780)* 42069.703(780)* 46040.451(780)* 42942.873(780)* 1st Factor Variance 17.15% 16.56% 17.42% 16.71% 2nd Factor Variance 2.92% 2.93% 2.96% 2.86%
*p < .001 Item Fit to the Rasch Model
Once the unidimensional assumption was confirmed, the Rasch model was used to iden-tify the people who did not fit the model. This filter was done on the basis of a coefficient called Infit, which should have a value be-tween 0.7 and 1.3 according to the guidelines of Bond & Fox (2001). Out of the total sub-jects who took the PAA, two people were eliminated who took form 1, two who took 2, seven who took form 3, and one who took form 4.
This same criterion was used to eliminate items that did not fit. The analysis was run again solely for people whose Infit value was greater than 0.7 and less than 1.3. In this sec-ond run of the model it was not necessary to eliminate any item, since all of them had an Infit value greater than 0.8 and smaller than 1.2, along with a PTME greater than 0.10 (Bond & Fox, 2001). This being the case, once compliance with unidimensionality assump-tions and fit to the Rasch model were ensured,
the LLTM model was run to test the explana-tory power of the difficulty sources. Goodness of Fit of the LLTM Models
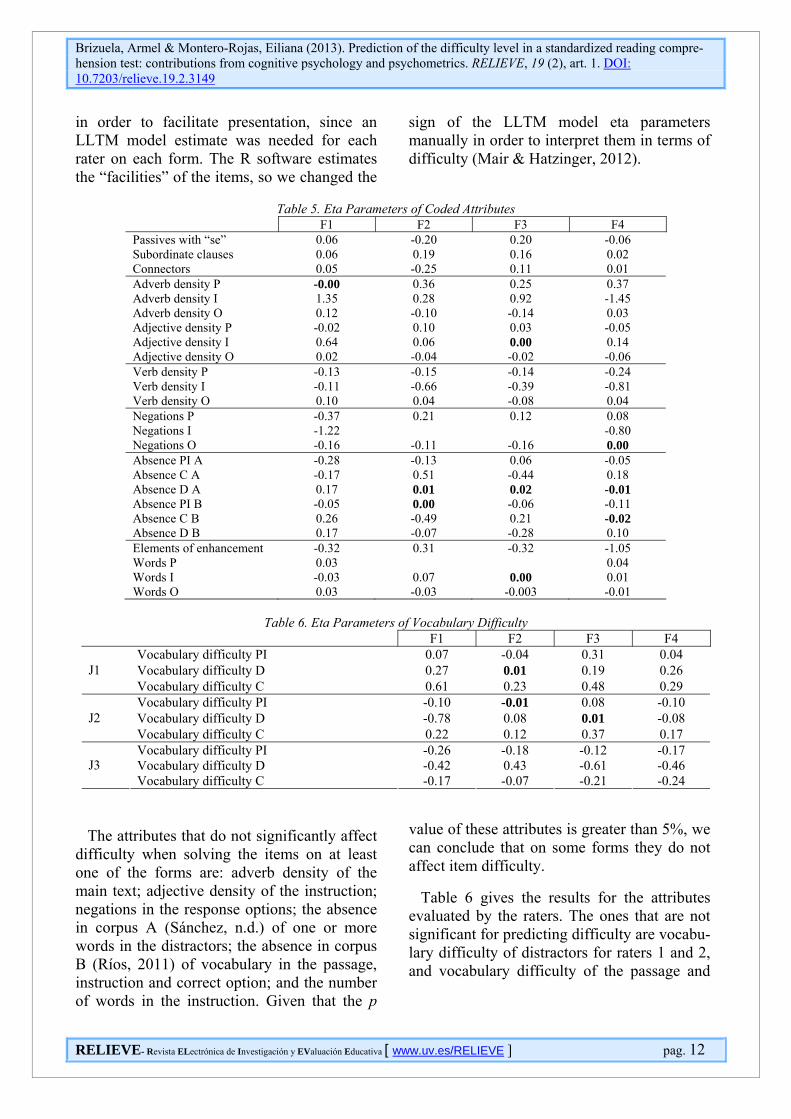
As mentioned in the section on analysis strategy, this was performed by form (F1, F2, F3 and F4) and by rater (J1, J2 and J3). The following procedure was used for analyzing each exam form: first, the LLTM was run without the attributes evaluated by the experts (vocabulary difficulty); second, the values assigned by rater 1 to the vocabulary difficul-ties were added; third, the data from rater 1 was excluded and the data from rater 2 was included; and fourth, the model was run again with the data from rater 2 eliminated and the data from rater 3 added. Thus four models were created (MSJ, MJ1, MJ2 and MJ3) for each of the four forms, for which three good-ness-of-fit indices were reported (Real, Olea, Ponsoda, Revuelta & Abad, 1999): the Ander-sen chi-squared (Tabachnick & Fidell, 2007), the Pearson correlation between the estimated difficulty indices in the Rasch model and those
Brizuela, Armel & Montero-Rojas, Eiliana (2013). Prediction of the difficulty level in a standardized reading compre-hension test: contributions from cognitive psychology and psychometrics. RELIEVE, 19 (2), art. 1. DOI: 10.7203/relieve.19.2.3149
RELIEVE- Revista ELectrónica de Investigación y EValuación Educativa [ www.uv.es/RELIEVE ] pag. 11
of the LLTM, and the percentage of explained variance (see Table 4). As can be inferred from the foregoing, the MJ1, MJ2 and MJ3 models correspond to the vocabulary difficulty attribute evaluated by each rater. In the null model (MSJ), the two lexical corpuses were used to code the frequency of use of the words in the item.
We sought a non-significant chi-squared value on the Andersen test, since this statistic indicates differences between the difficulty indices estimated with the LLTM and the ones estimated with the Rasch model. This test is very sensitive to sample size, however, so it usually comes out statistically significant. For this reason it is not desirable to take this test into account as a decisive criterion for evaluat-ing the LLTM model fit. Even the creator of the LLTM model (Fischer, 1997) poses the difficulty of obtaining non-significant values
on this test. Given these problems, the Pearson correlation can also be used to check if the parameters estimated with the LLTM repro-duce the difficulty indices of the Rasch model (Romero, Ponsoda & Ximénez, 2008). More-over, when squared this correlation approxi-mates the percentage of variance of the Rasch difficulty indices explained by the LLTM pa-rameters (Revuelta & Ponsoda, 1998).
The first thing that strikes the eye in Table 4 is the magnitude of the chi-squared values, all of which are significant. However, considering that for each form the sample is approximately 9,000 people, it is not surprising that these values are so large, and, of course, statistically significant. The Pearson correlation values, though, were moderate to high (the lowest was 0.71), together with the respective percentages of explained variance.
Table 4 .Goodness of Fit Indices
MSJ MJ1 MJ2 MJ3
F1 χ2 r r2
7565(14) .86
74%
8939(17) .83
69%
7327(17) .86
75%
10492(17) .80
63%
F2 χ2 r r2
4343(16) .92
85%
7237(19) .86
74%
7498(19) .86
74%
7339(19) .86
75%
F3 χ2 r r2
14333(16) .73
54%
12736(19) .77
59%
14828(19) .73
53%
15280(19) .71
51%
F4 χ2 r r2
5475(14) .88
78%
5754(17) .87
76%
6576(17) .86
73%
6392(17) .86
74%
Eta Parameters of each Model
Before giving the eta parameter results of each attribute, we should mention that it was necessary to eliminate two attributes of the LLTM model in forms 2 and 3: negations in the instructions and words in the passage. On these forms only one item had negations, so the software was unable to make the respective estimates due to a lack of variability. In addi-tion, there was one case of an item with 116 words in the main text, an extreme value that impeded the calculations.
Table 5 gives these parameters by form; at-tributes that did not result significant at 5% are highlighted in bold. The following abbrevia-tions are used in the table: P (main text or pas-sage), I (instruction), O (response options), PI (passage and instruction), C (key or correct response), D (distractors), A (lexical corpus one) and B (lexical corpus two). Finally, there are four blank spaces corresponding to the exclusion of two attributes in the LLTM esti-mate for forms 2 and 3. This table does not give the vocabulary difficulty attributes evalu-ated by the raters, which are given separately
Brizuela, Armel & Montero-Rojas, Eiliana (2013). Prediction of the difficulty level in a standardized reading compre-hension test: contributions from cognitive psychology and psychometrics. RELIEVE, 19 (2), art. 1. DOI: 10.7203/relieve.19.2.3149
RELIEVE- Revista ELectrónica de Investigación y EValuación Educativa [ www.uv.es/RELIEVE ] pag. 12
in order to facilitate presentation, since an LLTM model estimate was needed for each rater on each form. The R software estimates the “facilities” of the items, so we changed the
sign of the LLTM model eta parameters manually in order to interpret them in terms of difficulty (Mair & Hatzinger, 2012).
Table 5. Eta Parameters of Coded Attributes
F1 F2 F3 F4 Passives with “se” 0.06 -0.20 0.20 -0.06 Subordinate clauses 0.06 0.19 0.16 0.02 Connectors 0.05 -0.25 0.11 0.01 Adverb density P -0.00 0.36 0.25 0.37 Adverb density I 1.35 0.28 0.92 -1.45 Adverb density O 0.12 -0.10 -0.14 0.03 Adjective density P -0.02 0.10 0.03 -0.05 Adjective density I 0.64 0.06 0.00 0.14 Adjective density O 0.02 -0.04 -0.02 -0.06 Verb density P -0.13 -0.15 -0.14 -0.24 Verb density I -0.11 -0.66 -0.39 -0.81 Verb density O 0.10 0.04 -0.08 0.04 Negations P -0.37 0.21 0.12 0.08 Negations I -1.22 -0.80 Negations O -0.16 -0.11 -0.16 0.00 Absence PI A -0.28 -0.13 0.06 -0.05 Absence C A -0.17 0.51 -0.44 0.18 Absence D A 0.17 0.01 0.02 -0.01 Absence PI B -0.05 0.00 -0.06 -0.11 Absence C B 0.26 -0.49 0.21 -0.02 Absence D B 0.17 -0.07 -0.28 0.10 Elements of enhancement -0.32 0.31 -0.32 -1.05 Words P 0.03 0.04 Words I -0.03 0.07 0.00 0.01 Words O 0.03 -0.03 -0.003 -0.01
Table 6. Eta Parameters of Vocabulary Difficulty
F1 F2 F3 F4 Vocabulary difficulty PI 0.07 -0.04 0.31 0.04 Vocabulary difficulty D 0.27 0.01 0.19 0.26 J1 Vocabulary difficulty C 0.61 0.23 0.48 0.29 Vocabulary difficulty PI -0.10 -0.01 0.08 -0.10 Vocabulary difficulty D -0.78 0.08 0.01 -0.08 J2 Vocabulary difficulty C 0.22 0.12 0.37 0.17 Vocabulary difficulty PI -0.26 -0.18 -0.12 -0.17 Vocabulary difficulty D -0.42 0.43 -0.61 -0.46 J3 Vocabulary difficulty C -0.17 -0.07 -0.21 -0.24
The attributes that do not significantly affect difficulty when solving the items on at least one of the forms are: adverb density of the main text; adjective density of the instruction; negations in the response options; the absence in corpus A (Sánchez, n.d.) of one or more words in the distractors; the absence in corpus B (Ríos, 2011) of vocabulary in the passage, instruction and correct option; and the number of words in the instruction. Given that the p
value of these attributes is greater than 5%, we can conclude that on some forms they do not affect item difficulty.
Table 6 gives the results for the attributes evaluated by the raters. The ones that are not significant for predicting difficulty are vocabu-lary difficulty of distractors for raters 1 and 2, and vocabulary difficulty of the passage and
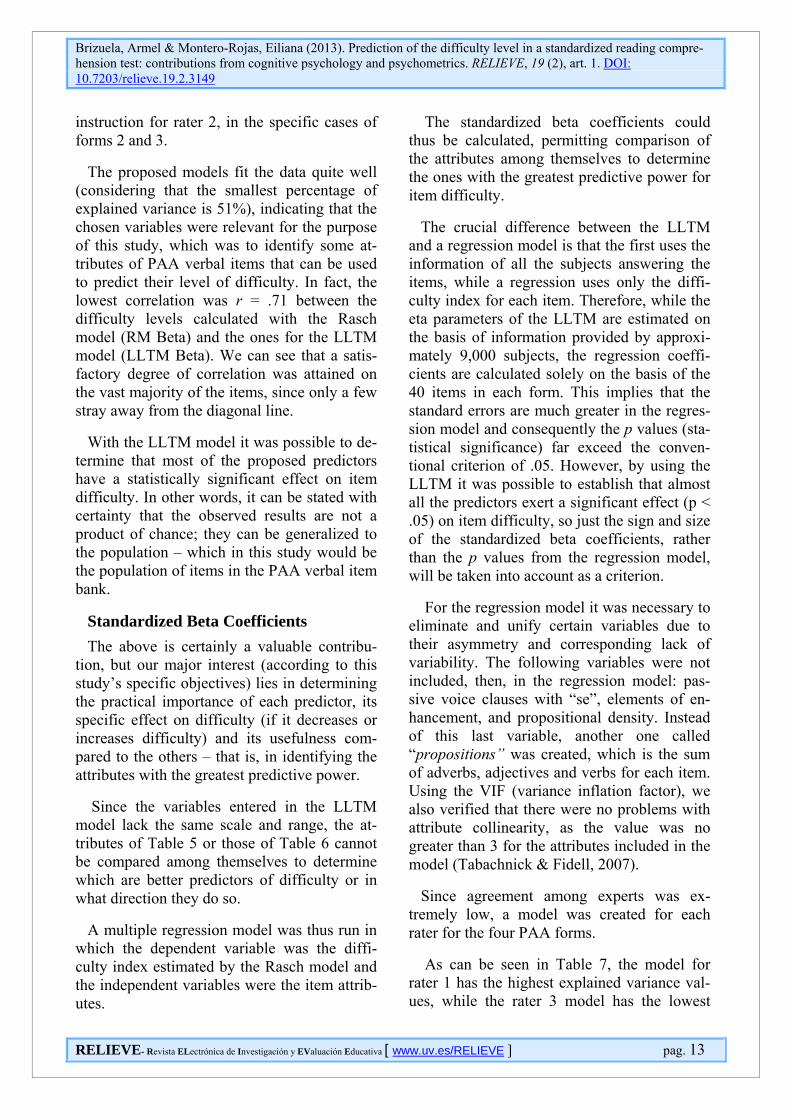
Brizuela, Armel & Montero-Rojas, Eiliana (2013). Prediction of the difficulty level in a standardized reading compre-hension test: contributions from cognitive psychology and psychometrics. RELIEVE, 19 (2), art. 1. DOI: 10.7203/relieve.19.2.3149
RELIEVE- Revista ELectrónica de Investigación y EValuación Educativa [ www.uv.es/RELIEVE ] pag. 13
instruction for rater 2, in the specific cases of forms 2 and 3.
The proposed models fit the data quite well (considering that the smallest percentage of explained variance is 51%), indicating that the chosen variables were relevant for the purpose of this study, which was to identify some at-tributes of PAA verbal items that can be used to predict their level of difficulty. In fact, the lowest correlation was r = .71 between the difficulty levels calculated with the Rasch model (RM Beta) and the ones for the LLTM model (LLTM Beta). We can see that a satis-factory degree of correlation was attained on the vast majority of the items, since only a few stray away from the diagonal line.
With the LLTM model it was possible to de-termine that most of the proposed predictors have a statistically significant effect on item difficulty. In other words, it can be stated with certainty that the observed results are not a product of chance; they can be generalized to the population – which in this study would be the population of items in the PAA verbal item bank.
Standardized Beta Coefficients The above is certainly a valuable contribu-
tion, but our major interest (according to this study’s specific objectives) lies in determining the practical importance of each predictor, its specific effect on difficulty (if it decreases or increases difficulty) and its usefulness com-pared to the others – that is, in identifying the attributes with the greatest predictive power.
Since the variables entered in the LLTM model lack the same scale and range, the at-tributes of Table 5 or those of Table 6 cannot be compared among themselves to determine which are better predictors of difficulty or in what direction they do so.
A multiple regression model was thus run in which the dependent variable was the diffi-culty index estimated by the Rasch model and the independent variables were the item attrib-utes.
The standardized beta coefficients could thus be calculated, permitting comparison of the attributes among themselves to determine the ones with the greatest predictive power for item difficulty.
The crucial difference between the LLTM and a regression model is that the first uses the information of all the subjects answering the items, while a regression uses only the diffi-culty index for each item. Therefore, while the eta parameters of the LLTM are estimated on the basis of information provided by approxi-mately 9,000 subjects, the regression coeffi-cients are calculated solely on the basis of the 40 items in each form. This implies that the standard errors are much greater in the regres-sion model and consequently the p values (sta-tistical significance) far exceed the conven-tional criterion of .05. However, by using the LLTM it was possible to establish that almost all the predictors exert a significant effect (p < .05) on item difficulty, so just the sign and size of the standardized beta coefficients, rather than the p values from the regression model, will be taken into account as a criterion.
For the regression model it was necessary to eliminate and unify certain variables due to their asymmetry and corresponding lack of variability. The following variables were not included, then, in the regression model: pas-sive voice clauses with “se”, elements of en-hancement, and propositional density. Instead of this last variable, another one called “propositions” was created, which is the sum of adverbs, adjectives and verbs for each item. Using the VIF (variance inflation factor), we also verified that there were no problems with attribute collinearity, as the value was no greater than 3 for the attributes included in the model (Tabachnick & Fidell, 2007).
Since agreement among experts was ex-tremely low, a model was created for each rater for the four PAA forms.
As can be seen in Table 7, the model for rater 1 has the highest explained variance val-ues, while the rater 3 model has the lowest
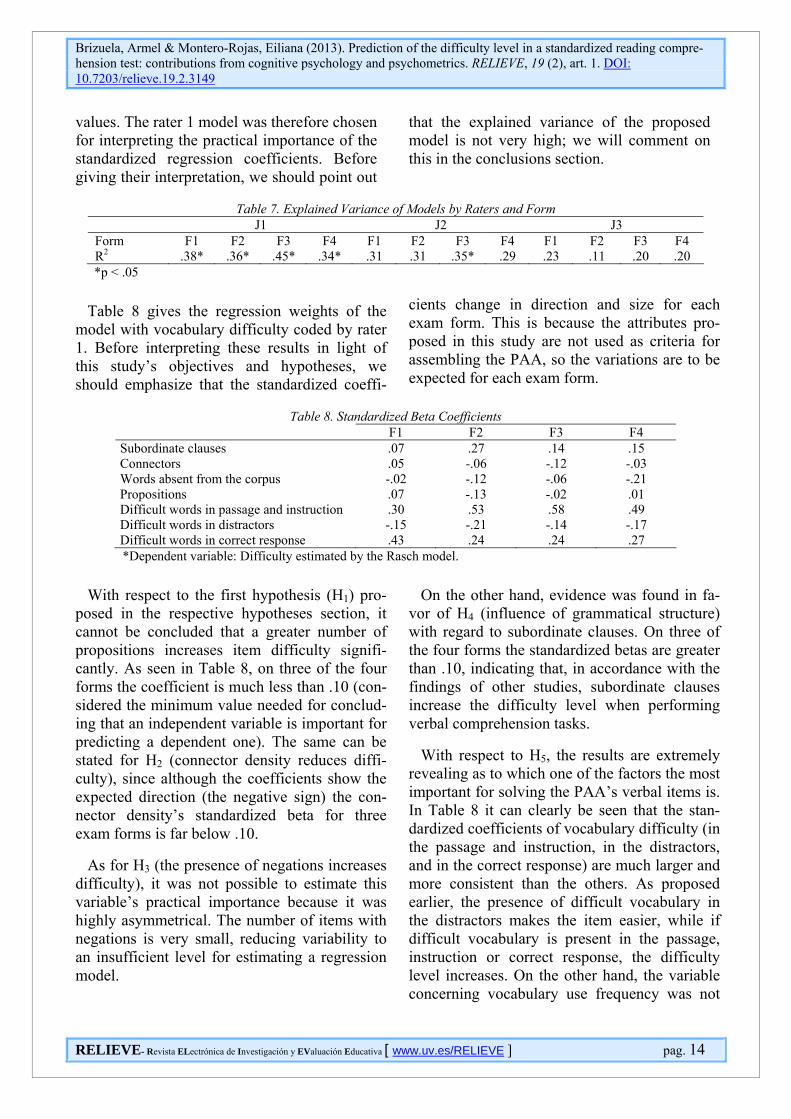
Brizuela, Armel & Montero-Rojas, Eiliana (2013). Prediction of the difficulty level in a standardized reading compre-hension test: contributions from cognitive psychology and psychometrics. RELIEVE, 19 (2), art. 1. DOI: 10.7203/relieve.19.2.3149
RELIEVE- Revista ELectrónica de Investigación y EValuación Educativa [ www.uv.es/RELIEVE ] pag. 14
values. The rater 1 model was therefore chosen for interpreting the practical importance of the standardized regression coefficients. Before giving their interpretation, we should point out
that the explained variance of the proposed model is not very high; we will comment on this in the conclusions section.
Table 7. Explained Variance of Models by Raters and Form
J1 J2 J3 Form F1 F2 F3 F4 F1 F2 F3 F4 F1 F2 F3 F4 R2 .38* .36* .45* .34* .31 .31 .35* .29 .23 .11 .20 .20 *p < .05
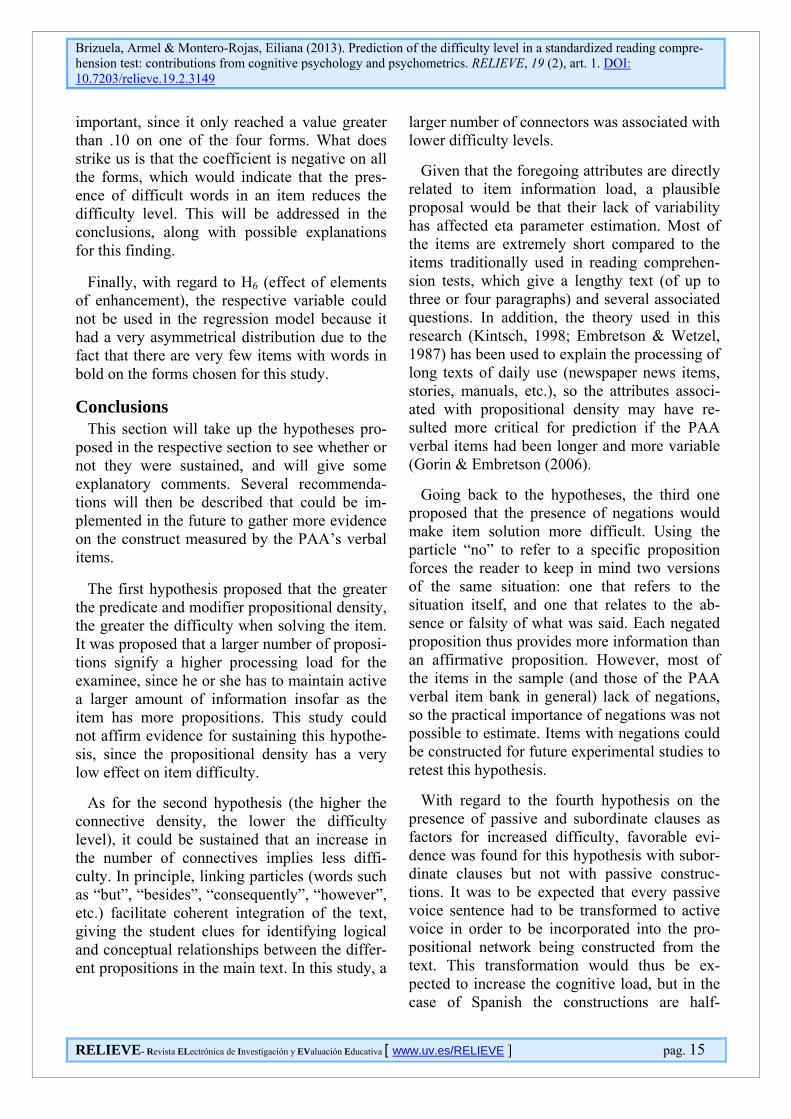
Table 8 gives the regression weights of the model with vocabulary difficulty coded by rater 1. Before interpreting these results in light of this study’s objectives and hypotheses, we should emphasize that the standardized coeffi-
cients change in direction and size for each exam form. This is because the attributes pro-posed in this study are not used as criteria for assembling the PAA, so the variations are to be expected for each exam form.
Table 8. Standardized Beta Coefficients
F1 F2 F3 F4 Subordinate clauses .07 .27 .14 .15 Connectors .05 -.06 -.12 -.03 Words absent from the corpus -.02 -.12 -.06 -.21 Propositions .07 -.13 -.02 .01 Difficult words in passage and instruction .30 .53 .58 .49 Difficult words in distractors -.15 -.21 -.14 -.17 Difficult words in correct response .43 .24 .24 .27 *Dependent variable: Difficulty estimated by the Rasch model.
With respect to the first hypothesis (H1) pro-posed in the respective hypotheses section, it cannot be concluded that a greater number of propositions increases item difficulty signifi-cantly. As seen in Table 8, on three of the four forms the coefficient is much less than .10 (con-sidered the minimum value needed for conclud-ing that an independent variable is important for predicting a dependent one). The same can be stated for H2 (connector density reduces diffi-culty), since although the coefficients show the expected direction (the negative sign) the con-nector density’s standardized beta for three exam forms is far below .10.
As for H3 (the presence of negations increases difficulty), it was not possible to estimate this variable’s practical importance because it was highly asymmetrical. The number of items with negations is very small, reducing variability to an insufficient level for estimating a regression model.
On the other hand, evidence was found in fa-vor of H4 (influence of grammatical structure) with regard to subordinate clauses. On three of the four forms the standardized betas are greater than .10, indicating that, in accordance with the findings of other studies, subordinate clauses increase the difficulty level when performing verbal comprehension tasks.
With respect to H5, the results are extremely revealing as to which one of the factors the most important for solving the PAA’s verbal items is. In Table 8 it can clearly be seen that the stan-dardized coefficients of vocabulary difficulty (in the passage and instruction, in the distractors, and in the correct response) are much larger and more consistent than the others. As proposed earlier, the presence of difficult vocabulary in the distractors makes the item easier, while if difficult vocabulary is present in the passage, instruction or correct response, the difficulty level increases. On the other hand, the variable concerning vocabulary use frequency was not
Brizuela, Armel & Montero-Rojas, Eiliana (2013). Prediction of the difficulty level in a standardized reading compre-hension test: contributions from cognitive psychology and psychometrics. RELIEVE, 19 (2), art. 1. DOI: 10.7203/relieve.19.2.3149
RELIEVE- Revista ELectrónica de Investigación y EValuación Educativa [ www.uv.es/RELIEVE ] pag. 15
important, since it only reached a value greater than .10 on one of the four forms. What does strike us is that the coefficient is negative on all the forms, which would indicate that the pres-ence of difficult words in an item reduces the difficulty level. This will be addressed in the conclusions, along with possible explanations for this finding.
Finally, with regard to H6 (effect of elements of enhancement), the respective variable could not be used in the regression model because it had a very asymmetrical distribution due to the fact that there are very few items with words in bold on the forms chosen for this study.
Conclusions This section will take up the hypotheses pro-
posed in the respective section to see whether or not they were sustained, and will give some explanatory comments. Several recommenda-tions will then be described that could be im-plemented in the future to gather more evidence on the construct measured by the PAA’s verbal items.
The first hypothesis proposed that the greater the predicate and modifier propositional density, the greater the difficulty when solving the item. It was proposed that a larger number of proposi-tions signify a higher processing load for the examinee, since he or she has to maintain active a larger amount of information insofar as the item has more propositions. This study could not affirm evidence for sustaining this hypothe-sis, since the propositional density has a very low effect on item difficulty.
As for the second hypothesis (the higher the connective density, the lower the difficulty level), it could be sustained that an increase in the number of connectives implies less diffi-culty. In principle, linking particles (words such as “but”, “besides”, “consequently”, “however”, etc.) facilitate coherent integration of the text, giving the student clues for identifying logical and conceptual relationships between the differ-ent propositions in the main text. In this study, a
larger number of connectors was associated with lower difficulty levels.
Given that the foregoing attributes are directly related to item information load, a plausible proposal would be that their lack of variability has affected eta parameter estimation. Most of the items are extremely short compared to the items traditionally used in reading comprehen-sion tests, which give a lengthy text (of up to three or four paragraphs) and several associated questions. In addition, the theory used in this research (Kintsch, 1998; Embretson & Wetzel, 1987) has been used to explain the processing of long texts of daily use (newspaper news items, stories, manuals, etc.), so the attributes associ-ated with propositional density may have re-sulted more critical for prediction if the PAA verbal items had been longer and more variable (Gorin & Embretson (2006).
Going back to the hypotheses, the third one proposed that the presence of negations would make item solution more difficult. Using the particle “no” to refer to a specific proposition forces the reader to keep in mind two versions of the same situation: one that refers to the situation itself, and one that relates to the ab-sence or falsity of what was said. Each negated proposition thus provides more information than an affirmative proposition. However, most of the items in the sample (and those of the PAA verbal item bank in general) lack of negations, so the practical importance of negations was not possible to estimate. Items with negations could be constructed for future experimental studies to retest this hypothesis.
With regard to the fourth hypothesis on the presence of passive and subordinate clauses as factors for increased difficulty, favorable evi-dence was found for this hypothesis with subor-dinate clauses but not with passive construc-tions. It was to be expected that every passive voice sentence had to be transformed to active voice in order to be incorporated into the pro-positional network being constructed from the text. This transformation would thus be ex-pected to increase the cognitive load, but in the case of Spanish the constructions are half-
Brizuela, Armel & Montero-Rojas, Eiliana (2013). Prediction of the difficulty level in a standardized reading compre-hension test: contributions from cognitive psychology and psychometrics. RELIEVE, 19 (2), art. 1. DOI: 10.7203/relieve.19.2.3149
RELIEVE- Revista ELectrónica de Investigación y EValuación Educativa [ www.uv.es/RELIEVE ] pag. 16
passive; that is, the verb is active and the agent is marked with the particle “se”, so the situation is different. Subordination, though, entails a greater amount of processing in terms of work-ing memory, since it requires the reader to maintain active the subject of the sentence while processing the rest of the sentence components, which tend to be relatively removed from the subject precisely because of the typical structure of a subordinate clause. However, the effect of this structure was not possible to estimate since it is rarely found in the items. As in the case of negations, items should be constructed with this structure to test its possible effect on difficulty.
One of the hypotheses that posed the most problems for operationalization was the one proposing that difficult vocabulary would in-crease item difficulty whenever it was present in the correct option and the main text. We found in our consultation of the literature that anyone answering an item needs to know the meaning of the words contained in it. When this lexical knowledge does not exist, comprehension is weakened insofar as the person cannot use all the information needed for solving the item. In particular, when one or several poorly known terms (that is, difficult-to-understand vocabu-lary) are in the correct response, this response tends to be considered implausible, so distrac-tors with more accessible vocabulary become better candidates (from the examinee’s point of view) for being the correct option. Two strate-gies were used in this study to address this as-pect: two lexical corpuses were used as refer-ence, and experts were asked for their opinions.
With use of the lexical corpuses (Sánchez, n.d.), it was found that when one or more terms are present in the item and absent in the cor-puses, the difficulty level was lower. This was not to be expected from our consultation of the literature. We should take into account, though, that these variables had standardized coeffi-cients in the regression model of less than .10 on two of the four forms, so we should not draw conclusions based on these results. Now, as mentioned earlier, the vocabulary difficulty
evaluated by raters 1 was extremely important and consistent throughout the four forms.
Given the size and direction of the standard-ized coefficients, we must emphasize that vo-cabulary mastery plays a crucial role in solving these items. This result concurs with the con-sulted studies, which propose that verbal tasks are extremely influenced by the vocabulary knowledge of the subjects who are solving them. In addition, one of the essential character-istics of vocabulary is that its comprehension depends on the inferences made by the subjects, who need to activate a great deal of knowledge about the world in order to process it (Escudero, 2010).
Before concluding, we should point out some limitations of this study that could be antici-pated in future studies for testing other types of reading comprehension variables, and give some recommendations we can derive from it.
Firstly, this study did not include variables as-sociated with inferences and solution strategies that might affect item difficulty (Green & Smith, 1987). This is important because in some studies (Tatsuoka 1982 as cited in Green & Smith, 1987; Gilhooly, 2004) item difficulty is seen as a function of item-solving strategies. Thus the predictive power of models based on the way students solve the PAA’s verbal items would be greater. To this respect, as Gorin & Embretson (2006, p. 49) have put it, “the current study suggests at least an initial list of variables as potential sources of difficulty for constructing reading comprehension items, but the amount of explained variance suggests that researchers should think beyond the usual ‘suspects’.” A design could be implemented in future studies to see what solution strategies the students use when they find an unknown word or connective in the main text or response options.
Reading comprehension clearly involves a very important inferential aspect (Iza & Ezquerro, 2000) that should be incorporated into future studies in order to better understand the elements leading to variation in the difficulty indices of the PAA's verbal items. The social
Brizuela, Armel & Montero-Rojas, Eiliana (2013). Prediction of the difficulty level in a standardized reading compre-hension test: contributions from cognitive psychology and psychometrics. RELIEVE, 19 (2), art. 1. DOI: 10.7203/relieve.19.2.3149
RELIEVE- Revista ELectrónica de Investigación y EValuación Educativa [ www.uv.es/RELIEVE ] pag. 17
and demographic aspects of those answering the items will also have to be taken into account, since differences might be found between men and women as well as between those coming from public high schools and those from private ones.
One final limitation that should be corrected in future studies concerns the operationalization of such variables as degree of abstraction, similar-ity between the relevant text for answering an item and the correct response, etc. For example, instead of degree of abstraction the imaginabil-ity of the text could be used. This is a crucial aspect when working with expert raters, since inadequate operationalization keeps there from being a minimum of concordance between the raters. It will likewise be necessary to work with inter-rater agreement, so that experts work inde-pendently and, when finished, reach a consen-sus.
With respect to recommendations that can be derived from this study, the following measures could be taken to reduce in the short term the importance of the vocabulary component in solving PAA verbal items:
• Review of the items by the target population and experts. One mechanism for detecting dif-ficult-to-understand words is to show the items to a small group of high school students and experts. From the feedback, it would be possible to identify items whose difficulty was merely a matter of vocabulary mastery.
• Preparation of a blacklist of words derived from the reviews made by the raters and stu-dents. The blacklisted words would not be used to construct new items.
• Incorporation of a PAA glossary. Another way to keep the vocabulary component from inter-fering in measurement of the construct is to include a list of vocabulary words with their respective definitions, so that all students have the same knowledge of words that are particu-larly difficult to understand.
• Given the level of accuracy attained by rater 1, he could be put in charge of reviewing the
verbal items in search of vocabulary that may be inaccessible for the student population.
• Increase the length of the main text in the items. Most of the items analyzed in this study were no more than three or four lines long, considerably reducing the possibility the stu-dent has of getting the information needed for solving the item. If the texts were longer, the item constructors could include more data, and the importance of knowing a key word would thereby be reduced.
References Attoresi, H.F., Picón, J., Abal, F., Aguerri, M. & Galibert, M.S. (2009). Aplicación del mo-delo LLTM de Fisher al análisis de las fuen-tes de dificultad de ítemes de razonamiento deductivo. Interdisciplinaria, 26(1), 77-93.
Baker, F. (1993). Sensitivity of the Linear Lo-gistic Test Model to Misspecification of the Weight Matrix. Applied Psychological Mea-surement, 17(3), 201-210. doi: 10.1177/014662169301700301
Belinchón, M., Igoa, J. & Rivière, A. (1998). Psicología del lenguaje: Investigación y teo-ría. España: Editorial Trotta.
Bond, T. & Fox, C. (2001). Applying the Rasch Model: Fundamental Measurement in the Human Sciences. Estados Unidos: Law-rence Erlbaum Associates, Inc.
Borsboom, D., Mellenbergh, G.J. & Heerden, J. (2004). The Concept of Validity. Psycholo-gical Review, 111(4), 1061–1071. doi: 10.1037/0033-295X.111.4.1061
Chen, Y., MacDonald, G. & Leu, Y. (2011). Validating Cognitive Sources of Mathematics Item Difficulty: Application of the LLTM to Fraction Conceptual Items. The International Journal of Educational and Psychological Assessment, 7(2), 74-93. Retrieved from https://sites.google.com/site/tijepa2012/home
Clark-Carter, D. (2004). Quantitative Psycho-logical Research. Estados Unidos: Psycholo-gy Press.
Cortada de Kohan, N. (2003). Posibilidad de integración de las teorías cognitivas y la psi-
Brizuela, Armel & Montero-Rojas, Eiliana (2013). Prediction of the difficulty level in a standardized reading compre-hension test: contributions from cognitive psychology and psychometrics. RELIEVE, 19 (2), art. 1. DOI: 10.7203/relieve.19.2.3149
RELIEVE- Revista ELectrónica de Investigación y EValuación Educativa [ www.uv.es/RELIEVE ] pag. 18
cometría moderna. Revista Argentina de Neu-ropsicología, 1, 8-23.
Cronbach, L.J. & Meehl, P.E. (1955). Con-struct Validity in Psychological Test. Psycho-logical Bulletin, 52(2), 281-302.
Daneman, M. & Hannon, B. (2001). Using Working Memory Theory to Investigate the Construct Validity of Multiple-Choice Read-ing Comprehension Tests Such as the SAT. Journal of Experimental Psychology: Gen-eral, 130(2), 208-233.
Davey, B. (1988). Factors Affecting the Diffi-culty of Reading Comprehension Items for Successful and Unsuccessful Readers. The Journal of Experimental Education, 56(2), 67-76.
De Boeck, P. & Wilson, M. (2004). Explana-tory Item Response Models: A Generalized Linear and Nonlinear Approach. NY: Springer.
DeMauro, G., Merritt, A. & Adams, R. (1994). Delimiting the Verbal Domain (Research Re-port RR-94-34). Princeton, NJ: Educational Testing Service.
Drum, P.A., Calfee, R.C. & Cook, L.K. (1981). The Effects of Surface Structure Variables on Performance in Reading Com-prehension. Reading Research Quarterly, 16(4), 486-514.
Embretson, S. & Daniel, R. (2008). Under-standing and quantifying cognitive complex-ity level in mathematical problem solving items. Psychology Science Quarterly, 50(3), 328-344.
Embretson, S. E. & Wetzel, D. (1987). Com-ponent Latent Trait Models for Paragraph Comprehension Tests. Applied Psychological Measurement, 11(2), 175-193. doi: 10.1177/014662168701100207
Embretson, S. E. (1996). The New Rules of Measurement. Psychological Assessment, 8(4), 341-349.
Embretson, S. E. (2010). Cognitive Design Systems: A Structural Modeling Approach Applied to Developing a Spatial Ability Test. En S. Embretson (Ed.), Measuring Psycho-
logical Constructs: Advances in Model-Based Approaches (pp. 247-271). Washington, DC: American Psychological Association.
Embretson, S.E. & Gorin, J. (2001). Improving Construct Validity with Cognitive Psychol-ogy Principles. Journal of Educational Meas-urement, 38(4), 343-368. doi: 10.1111/j.1745-3984.2001.tb01131.x
Embretson, S.E. (1989). Latent Trait Models as an Information-Processing Approach to Testing. International Journal of Educational Research, 13(2), 189-203. doi:10.1016/0883-0355(89)90006-2
Escudero, I. (2010). Las inferencias en la comprensión lectora: una ventana hacia los procesos cognitivos en segundas lenguas. Re-vista Nebrija de Lingüística Aplicada, 7(4), 1-32. Retrieved from http://www.nebrija.com/revista-linguistica/
Farr, R., Pritchard, R. & Smitten, B. (1990). A Description of What Happens When an Ex-aminee Takes a Multiple-Choice Reading Comprehension Test. Journal of Educational Measurement, 27(3), 209-226. doi: 10.1111/j.1745-3984.1990.tb00744.x
Fischer, G. (1997). Unidimensional Linear Logistic Rasch Model. En W. Van Der Linden y R. Hambleton, Handbook of Modern Item Response Theory. New York: Springer-Verlag.
Fisher, G. H. (1973). The Linear Logistic Test Model as an Instrument in Educational Re-search. Acta Psychologica, 37, 359-374. doi: 10.1016/0001-6918(73)90003-6
Freedle, R. & Kostin, I. (1991). The Prediction of SAT Reading Comprehension Item Diffi-culty for Expository Prose Passages (Re-search Report RR-91-29). Princeton, NJ: Educational Testing Service.
Freedle, R. & Kostin, I. (1992). The Prediction of GRE Reading Comprehension Item Diffi-culty for Expository Prose Passages for each of Three Item Types: Main Ideas, Inferences and Explicit Statements (GRE Board Report No. 87-1OP). Princeton, NJ: Educational Testing Service.
Brizuela, Armel & Montero-Rojas, Eiliana (2013). Prediction of the difficulty level in a standardized reading compre-hension test: contributions from cognitive psychology and psychometrics. RELIEVE, 19 (2), art. 1. DOI: 10.7203/relieve.19.2.3149
RELIEVE- Revista ELectrónica de Investigación y EValuación Educativa [ www.uv.es/RELIEVE ] pag. 19
Gilbert, M.S., Picón, J.C., Lozzia, G.S., Aguerri, M.E. & Attorresi, H.F. (2010). Componentes de dificultad de ítems para la evaluación de operaciones lógicas / Una apli-cación del modelo LLTM. SUMMA Psi-cológica UST, 7(1), 3-14.
Gilhooly, K. (2004). Working Memory and Reasoning. En J. Leighton y R. Sternberg (Eds.), The Nature of Reasoning (pp. 49-77). Estados Unidos: Cambridge University Press.
Gorin, J. S. (2007). Reconsidering Issues in Validity Theory. Educational Researcher, 36(8), 456-462. doi: 10.3102/0013189X07311607
Gorin, J.S. & Embretson, S.E. (2006). Item Difficulty Modeling of Paragraph Compre-hension Items. Applied Psychological Meas-urement, 30(5), 394-411. doi: 10.1177/0146621606288554
Gorin, J.S. (2005). Manipulating Processing Difficulty of Reading Comprehension Ques-tions: The Feasibility of Verbal Item Genera-tion. Journal of Educational Measurement, 42(4), 351-373. doi: 10.1111/j.1745-3984.2005.00020.x
Graesser, A. C., Millis, K. & Zwaan, R.A. (1997). Discourse Comprehension. Annual Review of Psychology, 48, 163-189. doi: 10.1146/annurev.psych.48.1.163
Green, K. & Smith, R. (1987). A Comparison of Two Methods of Decomposing Item Diffi-culties. Journal of Educational and Behav-ioral Statistics, 12(4), 369-381. doi: 10.3102/10769986012004369
Kintsch, W. & van Dijk, T. (1978). Toward a Model of Text Comprehension and Produc-tion. Psychological Review, 85(5), 363-394. doi: 10.1037/0033-295X.85.5.363
Hunt, E. (2011). Human Intelligence. Estados Unidos: Cambridge University Press
Iza, M. & Ezquerro, J. (2000). Elaborative Inferences. Anales de Psicología, 16(2), 227-249.
Kintsch, W. (1998). Comprehension: A Para-digm for Cognition. NY: Cambridge Univer-sity Press.
Kirsch, I. & Mosenthal. (1990). Exploring Document Literacy Underlying the Perform-ance of Young Adults. Reading Research Quarterly, 25(1), 5-30.
Leroy, G., Helmreich, S. y Cowie, J.R. (2010). The influence of text characteristics on per-ceived and actual difficulty of health informa-tion. International Journal of Medical Infor-matics. doi:10.1016/j.ijmedinf.2010.02.002
López, I. & Pita, S. (1999). Medidas de con-cordancia: el índice de Kappa. Recuperado de http://www.fisterra.com/mbe/investiga/kappa/kappa2.pdf
Mair, P. & Hatzinger, R. (2012). Extended Rasch Modeling: The R Package eRm [Vi-gnette]. Retrieved from http://cran.r-project.org/web/packages/eRm/eRm.pdf
Martínez, M., Hernández, M. & Hernández, M. (2006). Psicometría. Madrid: Alianza Edi-torial.
Messick, S. (1995). Validity of Psychological Assessment. American Psychologist, 50(9), 741-749. doi: 10.1037/0003-066X.50.9.741
Ozuru, Y., Rowe, M., O’Reilly, T. & McNa-mara, D. (2008). Where’s the difficulty in standardized reading tests: The passage or the question? Behavior Research Methods, 40(4), 1001-1015. doi: 10.3758/BRM.40.4.1001
Poinstingl, H. (2009). The Linear Logistic Test Model (LLTM) as the methodological foun-dation of item generating rules for a new ver-bal reasoning test. Psychology Science Quar-terly, 51(2), 123-134.
Powers, D.E. & Wilson, S. (1995). Answering the New SAT Reading Comprehension Ques-tions without the Passages. Journal of Educa-tional Measurement, 32(2), 105-129. doi: 10.1111/j.1745-3984.1995.tb00458.x
Real, E., Olea, J., Ponsoda, V., Revuelta, J. & Abad, F. (1999). Análisis de la dificultad de un test de matemáticas mediante un modelo componencial. Psicológica, 20, 121-134.
Revuelta, J. & Ponsoda, V. (1998). Un test adaptativo informatizado de análisis lógico
Brizuela, Armel & Montero-Rojas, Eiliana (2013). Prediction of the difficulty level in a standardized reading compre-hension test: contributions from cognitive psychology and psychometrics. RELIEVE, 19 (2), art. 1. DOI: 10.7203/relieve.19.2.3149
RELIEVE- Revista ELectrónica de Investigación y EValuación Educativa [ www.uv.es/RELIEVE ] pag. 20
basado en la generación automática de ítems. Psicothema, 10(3), 709-716.
Ríos, G. (2011). Características del lenguaje de los jóvenes costarricenses desde la dispo-nibilidad léxica. España: Ediciones Universi-dad de Salamanca.
Romero, S., Ponsoda, V. & Ximénez, C. (2008). Análisis de un test de aritmética me-diante el modelo logístico lineal de rasgo la-tente. Revista Latinoamericana de Psicología, 40(1), 85-95.
Rupp, A., Ferne, T. & Choi, H. (2006). How Assessing Reading Comprehension with Mul-tiple-Choice Questions Shapes the Construct: A Cognitive Processing Perspective. Langua-ge Testing, 23(4), 441-474. doi: 10.1191/0265532206lt337oa
Sánchez, V. (s.f.). Corpus de frecuencia de uso de vocabulario en estudiantes de secundaria [datos no procesados]. Universidad de Costa Rica: Estudios de Lexicografía Hispano-Costarricense.
Sheehan, K. & Mislevy, R. (1990). Integrating Cognitive and Psychometric Models to
Measure Document Literacy. Journal of Edu-cational Measurement, 27(3), 255-272. doi: 10.1111/j.1745-3984.1990.tb00747.x
Sheehan, K. M., & Ginther, A. (2001). What do Passage-Based Multiple-Choice Verbal Reasoning Items Really Measure? An Analy-sis of the Cognitive Skills Underlying Per-formance on the Current TOEFL Reading Section. Paper presented at the 2000 Annual Meeting of the National Council of Meas-urement in Education, New Orleans, LA.
Sonnleitner, P. (2008). Using the LLTM to Evaluate an Item-Generating System for Reading Comprehension. Psychology Science Quarterly, 50(3), 345-362.
Stahl, S.A. & Jacobson, M.J. (1986). Vocabu-lary Difficulty, Prior Knowledge, and Text Comprehension. Journal of Reading Behav-ior, 28(4), 309-323. doi: 10.1080/10862968609547578
Tabachnick, B. & Fidell, L. (2007). Using Multivariate Statistics. New Yotk: Pearson Education.
ABOUT THE AUTHORS / SOBRE LOS AUTORES
Brizuela, Armel ([email protected]). Philologist and specialist in quantitative research methods in the field of psychology. Researcher in the Permanent Academic Aptitude Test Program and in the Admission Specific Tests Program (Institute for Psychological Research at the University of Costa Rica). Buscar otros artículos de este au-
tor en Google Académico / Find other articles by this author in Scholar Google
Montero-Rojas, Eiliana ([email protected]). Doctorate in Educational Measurement and Evaluation from Florida State University, Florida, U.S.A., and Bachelor’s Degree in Statistics from the University of Costa Rica (UCR). Tenured UCR professor since 1993, teacher and researcher at the School of Statistics of the Institute for Psychological Research and various postgraduate programs. Author and co-author of more than 30 scientific publications, she works in the areas of mixed (multilevel) and structural equation models, impact assessment, measurement models – especially IRT and Rasch – and validation of instruments and indicators. She has consult-ing experience with the following organizations: ETS (Educational Testing Service) in the United States, the Ja-cobs Foundation (Switzerland), INCAE Business School, UNAIDS, the Universidad de Chile, the Andalusian School of Social Economy (EAES), the Costa Rican State of Education Program, the Costa Rican Ministry of Education, and the Nicaraguan Ministry of Education. She was awarded the distinction of “Educational Ambassa-dor 2010-2011” by the U.S. American Statistical Association. Buscar otros artículos de esta autora en Google
Académico / Find other articles by this author in Scholar Google
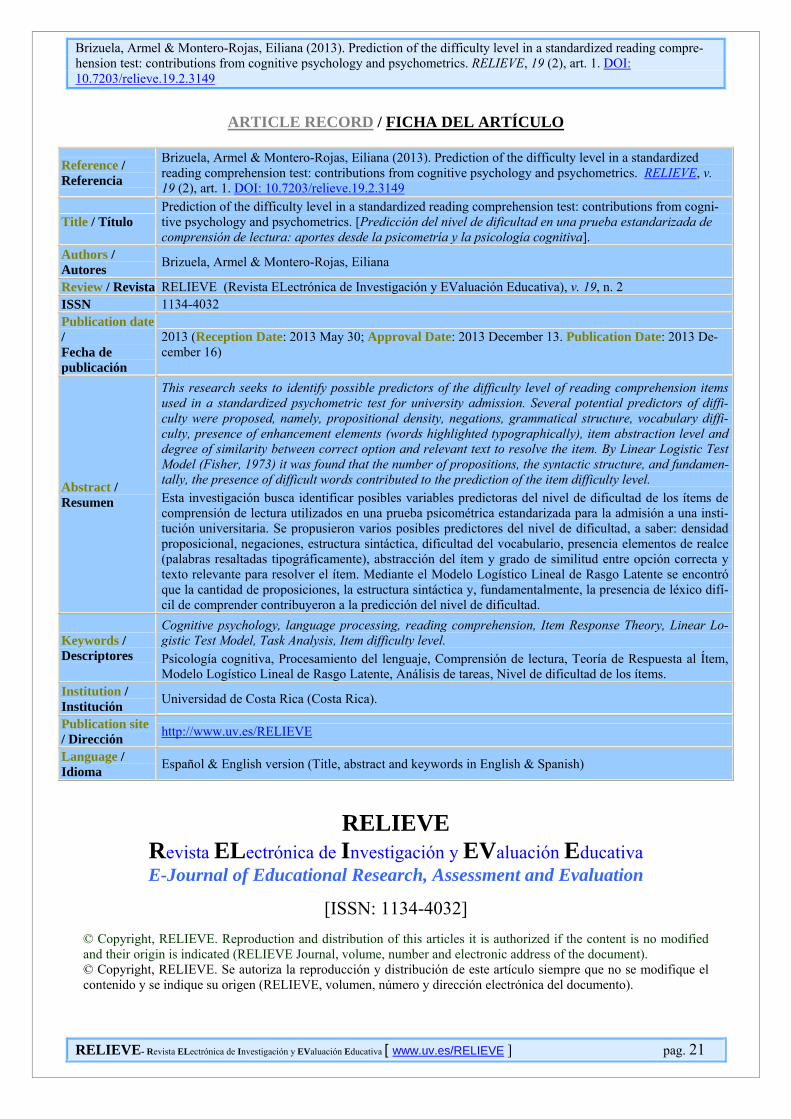
Brizuela, Armel & Montero-Rojas, Eiliana (2013). Prediction of the difficulty level in a standardized reading compre-hension test: contributions from cognitive psychology and psychometrics. RELIEVE, 19 (2), art. 1. DOI: 10.7203/relieve.19.2.3149
RELIEVE- Revista ELectrónica de Investigación y EValuación Educativa [ www.uv.es/RELIEVE ] pag. 21
ARTICLE RECORD / FICHA DEL ARTÍCULO
Reference / Referencia
Brizuela, Armel & Montero-Rojas, Eiliana (2013). Prediction of the difficulty level in a standardized reading comprehension test: contributions from cognitive psychology and psychometrics. RELIEVE, v. 19 (2), art. 1. DOI: 10.7203/relieve.19.2.3149
Title / Título Prediction of the difficulty level in a standardized reading comprehension test: contributions from cogni-tive psychology and psychometrics. [Predicción del nivel de dificultad en una prueba estandarizada de comprensión de lectura: aportes desde la psicometría y la psicología cognitiva].
Authors / Autores Brizuela, Armel & Montero-Rojas, Eiliana Review / Revista RELIEVE (Revista ELectrónica de Investigación y EValuación Educativa), v. 19, n. 2 ISSN 1134-4032 Publication date / Fecha de publicación
2013 (Reception Date: 2013 May 30; Approval Date: 2013 December 13. Publication Date: 2013 De-cember 16)
Abstract / Resumen
This research seeks to identify possible predictors of the difficulty level of reading comprehension items used in a standardized psychometric test for university admission. Several potential predictors of diffi-culty were proposed, namely, propositional density, negations, grammatical structure, vocabulary diffi-culty, presence of enhancement elements (words highlighted typographically), item abstraction level and degree of similarity between correct option and relevant text to resolve the item. By Linear Logistic Test Model (Fisher, 1973) it was found that the number of propositions, the syntactic structure, and fundamen-tally, the presence of difficult words contributed to the prediction of the item difficulty level. Esta investigación busca identificar posibles variables predictoras del nivel de dificultad de los ítems de comprensión de lectura utilizados en una prueba psicométrica estandarizada para la admisión a una insti-tución universitaria. Se propusieron varios posibles predictores del nivel de dificultad, a saber: densidad proposicional, negaciones, estructura sintáctica, dificultad del vocabulario, presencia elementos de realce (palabras resaltadas tipográficamente), abstracción del ítem y grado de similitud entre opción correcta y texto relevante para resolver el ítem. Mediante el Modelo Logístico Lineal de Rasgo Latente se encontró que la cantidad de proposiciones, la estructura sintáctica y, fundamentalmente, la presencia de léxico difí-cil de comprender contribuyeron a la predicción del nivel de dificultad.
Keywords / Descriptores
Cognitive psychology, language processing, reading comprehension, Item Response Theory, Linear Lo-gistic Test Model, Task Analysis, Item difficulty level. Psicología cognitiva, Procesamiento del lenguaje, Comprensión de lectura, Teoría de Respuesta al Ítem, Modelo Logístico Lineal de Rasgo Latente, Análisis de tareas, Nivel de dificultad de los ítems.
Institution / Institución Universidad de Costa Rica (Costa Rica). Publication site / Dirección http://www.uv.es/RELIEVE Language / Idioma Español & English version (Title, abstract and keywords in English & Spanish)
RELIEVE
Revista ELectrónica de Investigación y EValuación Educativa E-Journal of Educational Research, Assessment and Evaluation
[ISSN: 1134-4032]
© Copyright, RELIEVE. Reproduction and distribution of this articles it is authorized if the content is no modified and their origin is indicated (RELIEVE Journal, volume, number and electronic address of the document). © Copyright, RELIEVE. Se autoriza la reproducción y distribución de este artículo siempre que no se modifique el contenido y se indique su origen (RELIEVE, volumen, número y dirección electrónica del documento).