Embed Size (px)
Citation preview
Prediction of Partition Coefficients of Plastic Additives between PackagingMaterials and Food Simulants
Guillaume Gillet,†,‡,§ Olivier Vitrac,*,‡ and Stephane Desobry§
Laboratoire National de metrologie et d’Essais, Centre Energie, Materiaux et Emballage, 29 aVenue RogerHennequin, 78197 Trappes CEDEX, France, Institut National de la Recherche Agronomique, Joint ResearchUnit 1145 “Food Process Engineering” between INRA, Agroparistech and CNAM, 1 aVenue des Olympiades,91300 Massy, France, and Nancy UniVersite, LSGA-ENSAIA-INPL, 2 aVenue de la foret de Haye,BP 172, 54505 VandoeuVre les Nancy, France
Partition coefficients, Ki,F/P, between liquids or food simulants, F, and amorphous regions of polymers, P, areimportant quantities to predict the sorption or desorption kinetics in various areas and in particular to predictthe contamination of food by substances originating from food contact materials. This work extends an atomisticFlory-Huggins approach previously developed by us (Ind. Eng. Chem. Res 2009, 48, 5285-5301) to predictKi,F/P values for large solutes such as antioxidants, light stabilizers, and surface agents. Two extensions wereparticularly considered. The first extension aims at determining by isobaric molecular dynamics (MD) simulationthe contribution of translational entropy in liquids with increasing polarity (isopropanol, ethanol, methanol,ethyl acetate, water) for large and flexible solutes representative of plastics additives. It was found to behigher than the partial molar volume of such solutes, independent of the considered alcohol and satisfactoryestimated by the volume accessible to a hydrogen probe. The validity of the coarse-graining approximationfor large flexible solutes (octadecane and octacosane) was tested by computing the radial distribution functionfrom MD simulations. A simple correction was proposed to account for the partial overlapping at the coarse-grained level between F molecules and large flexible segments of solutes. The second major improvementextends the whole methodology to water and water-ethanol mixtures. Intrinsic limitations of the Flory-Hugginsapproximation to handle hydrogen bond cooperativity were overcame by reweighting contact energies inwater and by introducing tabulated nonideal properties of water-ethanol mixtures. All predictions agreedwell with previously published partitioning data as well as those generated by this study. From experimentalvalues and theoretical considerations, the possibility to predict the contamination of food emulsions withwater-ethanol mixtures is finally discussed.
1. Introduction
In Europe, all materials intended to be in contact with foodmust comply with the recently introduced framework regulation2004/1935/EC1 specific for food contact materials, whichenforces a safety assessment and risk management decision forall starting substances and possible degradation products comingfrom the material. For plastic materials, article 14 of the directive2002/72/EC2 allows the use of mathematical modeling ofdesorption to demonstrate the compliance of these materialsaccording to the specific migration limits (SML). Due totoxicological concern, among the 937 substances (including 340monomers and 597 additives) positively listed in EU directiveson plastics in contact with food,3 502 substances (including 230monomers and 272 additives) are subjected to migration limits.As a result, the development of migration modeling is expectedto contribute significantly to an increase of the safety of foodproducts, while reducing significantly the cost of this safety. Inother related areas, the recently introduced EU regulation onthe safety of chemicals, so-called REACH directives,4 encour-ages the development of similar predictive approaches to assessthe migration of chemicals into the environment or through thefood chain. The principles of robust desorption modeling inpresence of uncertainty on composition, contact condition and
physicochemical properties has been detailed for monolayer andmultilayer materials.5 In particular, probabilistic modeling6 hasbeen applied to evaluate the contamination of 12 retailed foodproducts by a ubiquitous antioxidant7 and to assess the exposureof French consumers to styrene originating from yogurt pots.8
It is argued that a similar methodology could be used by allinvolved stakeholders (packaging industry, food industry,regulation authorities, food safety agencies...) and updatedaccording to the information available and the followed objec-tive: compliance testing, tier assessment, sanitary survey.... Itsdissemination and application to a wide range of substances,contact conditions (temperature, interactions with food) andmaterials (monolayer and multilayer materials, active materials)is currently limited by either the span of confidence intervalsor safety margins mainly due to a large uncertainty on thepartitioning of plastic additives with food or food simulants.Indeed, several predictive estimators of diffusion coefficientsof additives including uncertainty estimates have been proposedfor common polymers such as polyolefins9-13 but only roughapproximations have been proposed to predict their chemicalaffinity for common food simulants. The current “practicalguide” for the application of European directives14 advises thatthe concentrations at equilibrium are equal between the contactmaterial and a fatty product whereas they are 103 times lowerwhen the same material is in contact with an aqueous food. Norecommendation is proposed to estimate partition coefficientsbetween layered materials. The complications in measuringpartitioning of plastic additives such as hindered phenolicantioxidants or hindered amine light stabilizers arise for their
* Corresponding author. E-mail: [email protected].† Laboratoire National de metrologie et d’Essais, Centre Energie,
Materiaux et Emballage.‡ Institut National de la Recherche Agronomique, Joint Research Unit
1145 “Food Process Engineering”.§ Nancy Universite, LSGA-ENSAIA-INPL.
Ind. Eng. Chem. Res. XXXX, xxx, 000 A
10.1021/ie9010595 XXXX American Chemical SocietyPAGE EST: 17.4
1
2
3
4
5
6
7
8
9
10
11
12
13
14
15
16
17
18
19
20
21
22
23
24
25
26
27
28
29
30
31
32
33
34
35
36
37
38
39
40
41
42
43
44
45
46
47
48
49
50
51
52
53
54
55
56
57
58
59
60
61
62
63
64
65
66
67
68
69
70
71
72
73
74
75
76
77
78
79
ohio2/yie-yie/yie-yie/yie99907/yie6548d07z xppws 23:ver.3 6/12/10 5:47 Msc: ie-2009-010595 TEID: men00 BATID: 00000
low affinity for polar media (food simulant or polymer) and totheir possible reactivity during migration or extraction.15
Alternative methods based on the prediction of activity coef-ficients are scarce and rarely applied to molecules as large aspolymeric plastic additives. Group contribution methods andother semiempirical methods have been recently reviewed.16 Themost extensive study was performed by Baner and Piringer17
and concerned volatiles and solutes with intermediate molecularweights. By mixing both the regular solution theory and aFlory-Huggins approach, a correlation model was proposed forpartition coefficients between polyethylene materials and alco-hols. Because the introduced correction factor was dependenton the size and the shape of the solute, the approach cannothowever be extended reliably to plastic additives. Alternativesbased on brute force calculations of excess chemical potentialsin each phase by molecular simulations could be an alternative.For small solutes in liquid phases, several efficient techniquesare available (see the review in18) involving either GibbsEnsemble Monte Carlo19 or thermodynamics integration.20 Inpolymers, insertion21 or deletion22 techniques applied to bulkyor stiff solutes fail to accommodate the shape of the polymercavity to the solute shape due to a very slow relaxation ofpolymer segments at ambient temperature. An efficient freeenergy perturbation method of chemical potentials in polymersfor bulky plastic additives has been devised only recently.23,24
As the method involves an explicit representation of entangledpolymer segments and long-term molecular dynamics simula-tion, it remains highly computationally expensive and has beenrestricted to liquids and molten polymers at high temperature.
To overcome previous limitations and with a goal of tailoredcalculations for a wide range of solutes, we recently devisedan off-lattice generalized Flory-Huggins approach at atomisticscale25 to predict without any mathematical adjustment thepartition coefficient of solutes, noted Ki,F/P, between theamorphous phase of a polyolefin, noted P, and a liquid simulant,noted F. As in the original Flory-Huggins approach, theinteractions with P are accounted only with the neighbors incontact so that an explicit representation of the entangledpolymer is not required. A similar approach has been appliedto assess the activity coefficient in F. The total cost of themethod was low since the distributions of interactions werecalculated by using a full Monte Carlo sampling on moleculepairs and conformers and finally averaged over the number ofneighbors. Since a full detailed forcefield at atomistic scale wasapplied, the method is expected to be applicable to any molecule(of solute i, of P or of F) even if they generate strong attractiveinteractions such as hydrogen bonding. The method wassatisfactory applied to all molecules analyzed by Baner andPiringer,17 to series of flexible molecules (n-alkanes andn-alcohols) and to two prototypes of phenolic antioxidants, witha prediction error of a same magnitude order as the overallexperimental error at least for solutes with molecular masseslower than 300 g ·mol-1. Additionally, the simulations demon-strated that even if low polar molecules including plasticadditives have by design a good solubility in P, they have alsoa significant chemical affinity for polar simulants such as smallalcohols (methanol, ethanol). This effect, which was neglectedin previous studies, was related to the higher number of possiblerearrangements of F molecules when a solute much larger thanF was introduced in the mixture. Within the Flory-Hugginsapproximation, this contribution is expressed as a change intranslational entropy and it involves the number of F moleculesreordered or exchanged when a single solute is inserted in theliquid. This number was denoted ri,F
-1. and implies that matter
can spread out randomly without any enthalpic constraint. Foralmost incompressible mixtures, we argued that a rough estimateof ri,F
-1 would lie between the hardcore volume and the molarvolume of i. For bulky additives with a melting point muchhigher than the common migration temperature (i.e., 40 °C),both bounds seem particularly unrealistic as they correspondrespectively to a state where all the van-der-Waals surface ofthe solute is in contact with F and to an ordered state of i.Besides, our description applied to interacting liquids neglectnonideal behaviors due to the perturbation of the network ofhydrogen bonds around i. The current work proposes to derivea more rigorous formulation for ri,F
-1 for flexible and bulky solutes(beyond 250 g ·mol-1) in polar liquids while keeping ourmolecular tailoring approach of excess chemical potentials andpartition coefficients. The extensions were tested against newexperimental partition coefficients of large hindered phenolicantioxidants and against isobaric molecular dynamics simula-tions in different liquids with increasing polarity and decreasingmolecular size: isopropanol, ethanol, methanol and water. Sincehydrolysis avoided direct measurements of Ki,F/P in water,different mixtures of ethanol in water were used instead. It isemphasized that the mixture 50:50 v/v of water and ethanol isalso the new food simulant recommended by EU authorities toassess the migration of plastic additives into dairy products,26
after a significant amount of a photoinitiator (2-isopropylthiox-anthone) for printing inks has been found in baby milk27 andof other packaged drinks.28 In presence of long-range Coulombicinteractions, the initially proposed pair summation of intermo-lecular interactions was however expected to minimize signifi-cantly the contribution of hydrogen bonding: i) because onlymolecules in close contact could interact together and ii) becausea single molecule could participate at maximum in two long-lived hydrogen bonds through a head and tail arrangementpattern. A number of hydrogen-bonded neighbors rangedbetween 1 and 2 is acceptable for ethanol29 but is unrealisticfor water, where a single molecule is involved in up to 6hydrogen bonds.30 Our initial approach was extended to waterby summing water-water pair interactions as there wereinvolved in a 5 sites rigid model of water (i.e., tetrahedral modelof water). A similar idea is used in the 5 sites transferableintermolecular potential function31 and it was shown that thisgeometrical description was be able to predict various propertiesof liquid water.32
The paper is organized as follows. Section 2 recapitulatesthe theoretical principles of calculation of Ki,F/P from a MonteCarlo (MC) sampling of pair contact interactions at atomisticscale. Section 3 details the experimental and isobaric moleculardynamics (MD) simulation conditions that were used to generatereference data and predictions. The computational cost associ-ated to direct calculations by MD simulations of partial molarvolumes of additives in F was significantly reduced by compar-ing their values with the volume enclosed to the surfaceaccessible to an hydrogen atom Section 4 summarizes thepredictions of Ki,F/P in all tested conditions for large plasticadditives. The improvements induced by new ri,F
-1 estimates wereanalyzed against Ki,F/P values previously collected for homolo-gous series of solutes17,33 and according F-solute radial distribu-tion functions calculated for large flexible molecules. Inparticular, previous allegations of low partitioning of plasticsadditives in water and in water-ethanol mixtures were discussedaccording to a sensitivity analysis to nonidealities and accordingto experimental values generated by this study in water-ethanolmixtures and those extrapolated by Gandek34 in pure water.Finally, some suggestions are given on how current predictions
B Ind. Eng. Chem. Res., Vol. xxx, No. xx, XXXX
80
81
82
83
84
85
86
87
88
89
90
91
92
93
94
95
96
97
98
99
100
101
102
103
104
105
106
107
108
109
110
111
112
113
114
115
116
117
118
119
120
121
122
123
124
125
126
127
128
129
130
131
132
133
134
135
136
137
138
139
140
141
142
143
144
145
146
147
148
149
150
151
152
153
154
155
156
157
158
159
160
161
162
163
164
165
166
167
168
169
170
171
172
173
174
175
176
177
178
179
180
181
182
183
184
185
186
187
188
189
190
191
192
193
194
195
196
197
198
199
200
201
202
203
204
205
206
207
ohio2/yie-yie/yie-yie/yie99907/yie6548d07z xppws 23:ver.3 6/12/10 5:47 Msc: ie-2009-010595 TEID: men00 BATID: 00000
could be used to assess consumer exposure to ubiquitoushindered phenolic antioxidants and could be used to select anappropriate simulant of aqueous food products in the perspectiveof compliance testing of food packaging materials and plasticspipes used in water distribution systems.
2. Theory
2.1. Definition of Partition Coefficients. Since the diffusionof a solute i, such as a plastic additive, requires the cooperativemotions of the polymer,35 the substance i is assumed to diffuseonly in the amorphous phase of the polymer. The partitioncoefficient between F and the amorphous phase of the polymer,P, denoted Ki,F/P, is assessed as:25
where Ci,F|eq andCi,P|eqa are the concentrations at equilibrium in
F and P respectively. {Ci,k|eq}k)F,P are the correspondingconcentrations as experimentally assessed. The concentrationin P is in particular associated with an extraction yield ai lowerthan 1. In addition, since large additives have a melting pointmuch higher than the extrusion temperature of polyolefins, eq1 takes also into account that a significant fraction bi of theinitial additives content, Ci,P|t)0, could be crystallized and doesnot participate to the apparent equilibrium due to kineticlimitations. c is the crystallinity of the polymer (volume fractionof crystalline phase), which may vary according to the consid-ered sample.
2.2. Partition Coefficient Estimates in Alcohols. Accordingto Flory-Huggins theory,36-39 the activity coefficients relativeto volume fractions in solute, denoted {γi,k
V }k)F,P, can becalculated on a rigid lattice, whose mesh size is commensurableto the volume of the solute Vi. In this work, we used a similarapproach without any lattice by sampling explicitly at atomisticscale the molecular pair interactions. Comparatively to previousapproaches involving solubility coefficients, the superiority ofthis description comes from the sampling of the dispersion ofinteraction energies due to the different conformers and toaccessibility constraints. This contribution on enthalpic terms,identified in many books as nonpositional entropy contribution,can therefore be explicitly calculated. In our initial formulation,25
the excess translational entropy in F was expressed within thecell theory of liquids: a bulky solute occupies ri,F
-1 > 1cells ofF, where the volume of a single cell was chosen equal to thevolume of a single molecule of F in a pure liquid of F. Byneglecting the sampling biases (see the full expression in eq 16of rref 25), Ki,F/P was approximated as: where {�i,k}k)F,P is the
Flory-Huggins parameter, kB is the Boltzmann constant, T isthe absolute temperature. The enthalpies associated to all binarymixtures P+i, F+i, P+P and F+F were calculated as theproduct of the average number of neighbors, {zA+B}A,B)i,F,P,times the average enthalpy associated to a single pair{εA+B}A,B)i,F,P at the temperature T. The temperature was chosencomparable to the one used in reference data, commonly 313
K as prescribed in EU regulation.2 ⟨⟩ and ⟨⟩Tare the averageoperator and the temperature ensemble average operator re-spectively. The latter was obtained by weighting the sampleddistribution of energies pA+B(ε) with the Boltzmann factor,defined as exp(-ε/kB ·T):
The sampling of pA+B(ε) was based on a large conformersset of A (seed molecule) and B (contact molecule) representativeof their condensed state (up to 104 configurations) and basedon all possible contacts of their van der Waals envelopes withspherical symmetric probability (up to 1011 configurations). Aspreviously discussed,25 contacting was performed either byexpansion or contraction to avoid an oversampling of cavitiesin large or flexible molecules. An infinite long polymer wassimulated by replacing with an oligomer-like, where head andtail atoms were noncontact in order to mimic the hindranceassociated to the connectivity of these atoms. Within the Flory’s“pair local energy approximation”, the optimal oligomer lengthrepresents the backbone bonds range of nonbond interactionswithin the polymer chain.40 In practice, �i,P depends weakly onthe number of monomers41 and the optimal number of mono-mers was set to minimize the overestimation of noncontact “headand tail effects” while preserving the overall convergence ofthe sampling. As a rule of thumb, it was demonstrated that theoverall bias was minimal when the test oligomer was com-mensurable to the solute.25
The entropic term ri,F-1 was defined as the ratio Vi/VF
M, whereVF
M is the molar volume of pure F. The choice of Vi was highlycritical as it affects significantly the quality of prediction viaeq 2. By assuming that the mixtures i+F are compressible, Vi
was estimated as the infinite dilution partial molar volume of iin F under isobaric and isothermal conditions, denoted Vi,F
P . AsVi,F
P values were not tabulated for plastics additives moleculesin the literature, they were calculated from MD simulations.However, the assumption of a homogeneous compressibilityclose to i appeared questionable for large and highly flexiblesolutes, because the same cell (i.e., a volume commensurableto solute) can be simultaneously occupied by atoms of i and byF molecules due the persistence of a local order close to i. Thisdeviation to mixing ideality is depicted in Figure 1 for a highlyflexible solute dispersed in liquid methanol. The sketch repre-sents two methanol molecules “enclosed” within the octacosanecontour. Since the excess entropic contribution, ri,F
-1 dependsonly on the rearrangement of the center of mass of moleculesF and i regardless of the true shape of molecules,41 a generalformulation of ri,F
-1 was derived by correcting the number of“displaced” F molecules, expressed as the ratio Vi,F
P /VFM by the
fractional number of F molecules overlapping i, denotednF neighboring i
overlap :
For n-alkanes, nF neighboring ioverlap was derived from the ensemble-
averaged pair radial distribution of F molecules around the solutei during isobaric MD simulations. Such results were used tovalidate a much less computationally expensive approxima-tion, where Vi,F
P was replaced by the conformational ensembleaverage of the solute volume enclosed within the surfaceaccessible to a hydrogen atom, denoted Vi
H. Indeed, it was
Ki,F/P )Ci,F|eq
Ci,P|eqa
) (1 - c) ·Ci,F|eq
1ai
· Ci,P|eq - bi · Ci,P|t)0
(1)
⟨εA+B⟩T )∫-∞
+∞pA+B(ε) · e-ε/kB · T · ε · dε
∫-∞
+∞pA+B(ε) · e-ε/kB · T · dε
(3)
ri,F-1 )
Vi,FP
VFM
- nFneighboringioverlap (4)
Ind. Eng. Chem. Res., Vol. xxx, No. xx, XXXX C
208
209
210
211
212
213
214
215
216
217
218
219
220
221
222
223
224
225
226
227
228
229
230
231
232
233
234
235
236
237
238
239
240
241
242
243
244
245
246
247
248
249
250
251
252
253
254
255
256
257
258
259
260
261
262
263
264
265
266
267
268
269
270
271
272
273
274
275
276
277
278
279
280
281
282
283
284
285
286
287
288
289
290
291
292
293
294
295
296
297
298
299
300
301
302
303
304
305
306
307
308
309
310
311
312
F1
ohio2/yie-yie/yie-yie/yie99907/yie6548d07z xppws 23:ver.3 6/12/10 5:47 Msc: ie-2009-010595 TEID: men00 BATID: 00000
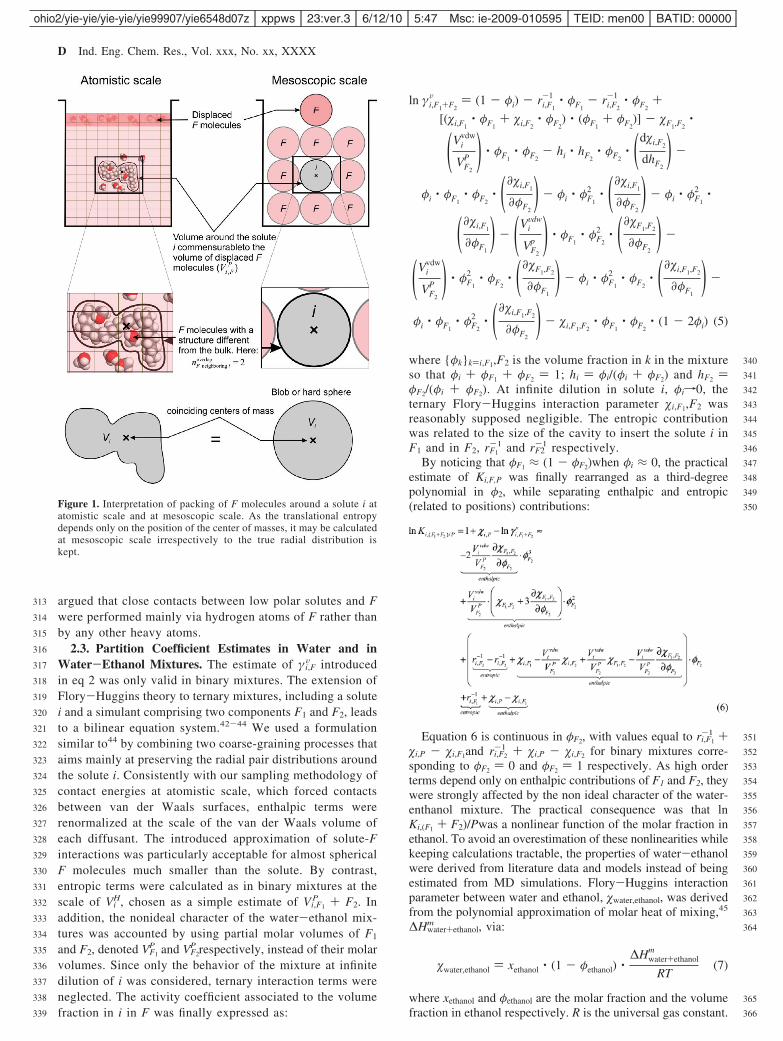
argued that close contacts between low polar solutes and Fwere performed mainly via hydrogen atoms of F rather thanby any other heavy atoms.
2.3. Partition Coefficient Estimates in Water and inWater-Ethanol Mixtures. The estimate of γi,F
V introducedin eq 2 was only valid in binary mixtures. The extension ofFlory-Huggins theory to ternary mixtures, including a solutei and a simulant comprising two components F1 and F2, leadsto a bilinear equation system.42-44 We used a formulationsimilar to44 by combining two coarse-graining processes thataims mainly at preserving the radial pair distributions aroundthe solute i. Consistently with our sampling methodology ofcontact energies at atomistic scale, which forced contactsbetween van der Waals surfaces, enthalpic terms wererenormalized at the scale of the van der Waals volume ofeach diffusant. The introduced approximation of solute-Finteractions was particularly acceptable for almost sphericalF molecules much smaller than the solute. By contrast,entropic terms were calculated as in binary mixtures at thescale of Vi
H, chosen as a simple estimate of Vi,F1 + F2P . In
addition, the nonideal character of the water-ethanol mix-tures was accounted by using partial molar volumes of F1
and F2, denoted VF1P and VF2
P respectively, instead of their molarvolumes. Since only the behavior of the mixture at infinitedilution of i was considered, ternary interaction terms wereneglected. The activity coefficient associated to the volumefraction in i in F was finally expressed as:
where {φk}k)i,F1,F2 is the volume fraction in k in the mixtureso that φi + φF1 + φF2 ) 1; hi ) φi/(φi + φF2) and hF2 )φF2/(φi + φF2). At infinite dilution in solute i, φif0, theternary Flory-Huggins interaction parameter �i,F1,F2 wasreasonably supposed negligible. The entropic contributionwas related to the size of the cavity to insert the solute i inF1 and in F2, rF1
-1 and rF2-1 respectively.
By noticing that φF1 ≈ (1 - φF2)when φi ≈ 0, the practicalestimate of Ki,F,P was finally rearranged as a third-degreepolynomial in φ2, while separating enthalpic and entropic(related to positions) contributions:
Equation 6 is continuous in φF2, with values equal to ri,F1-1 +
�i,P - �i,F1and ri,F2-1 + �i,P - �i,F2 for binary mixtures corre-
sponding to φF2 ) 0 and φF2 ) 1 respectively. As high orderterms depend only on enthalpic contributions of F1 and F2, theywere strongly affected by the non ideal character of the water-enthanol mixture. The practical consequence was that lnKi,(F1 + F2)/Pwas a nonlinear function of the molar fraction inethanol. To avoid an overestimation of these nonlinearities whilekeeping calculations tractable, the properties of water-ethanolwere derived from literature data and models instead of beingestimated from MD simulations. Flory-Huggins interactionparameter between water and ethanol, �water,ethanol, was derivedfrom the polynomial approximation of molar heat of mixing,45
∆Hwater+ethanolm , via:
where xethanol and φethanol are the molar fraction and the volumefraction in ethanol respectively. R is the universal gas constant.
Figure 1. Interpretation of packing of F molecules around a solute i atatomistic scale and at mesoscopic scale. As the translational entropydepends only on the position of the center of masses, it may be calculatedat mesoscopic scale irrespectively to the true radial distribution iskept.
ln γi,F1+F2
V ) (1 - φi) - ri,F1
-1 · φF1- ri,F2
-1 · φF2+
[(�i,F1· φF1
+ �i,F2· φF2
) · (φF1+ φF2
)] - �F1,F2·
(Vivdw
VF2
P ) · φF1· φF2
- hi · hF2· φF2
· (d�i,F2
dhF2) -
φi · φF1· φF2
· (∂�i,F1
∂φF2) - φi · φF1
2 · (∂�i,F1
∂φF2) - φi · φF1
2 ·
(∂�i,F1
∂φF1) - (Vi
Vdw
VF2
p ) · φF1· φF2
2 · (∂�F1,F2
∂φF2) -
(Vivdw
VF2
P ) · φF1
2 · φF2· (∂�F1,F2
∂φF1) - φi · φF1
2 · φF2· (∂�i,F1,F2
∂φF1) -
φi · φF1· φF2
2 · (∂�i,F1,F2
∂φF2) - �i,F1,F2
· φF1· φF2
· (1 - 2φi) (5)
�water,ethanol ) xethanol · (1 - φethanol) ·∆Hwater+ethanol
m
RT(7)
D Ind. Eng. Chem. Res., Vol. xxx, No. xx, XXXX
313
314
315
316
317
318
319
320
321
322
323
324
325
326
327
328
329
330
331
332
333
334
335
336
337
338
339
340
341
342
343
344
345
346
347
348
349
350
351
352
353
354
355
356
357
358
359
360
361
362
363
364
365
366
ohio2/yie-yie/yie-yie/yie99907/yie6548d07z xppws 23:ver.3 6/12/10 5:47 Msc: ie-2009-010595 TEID: men00 BATID: 00000
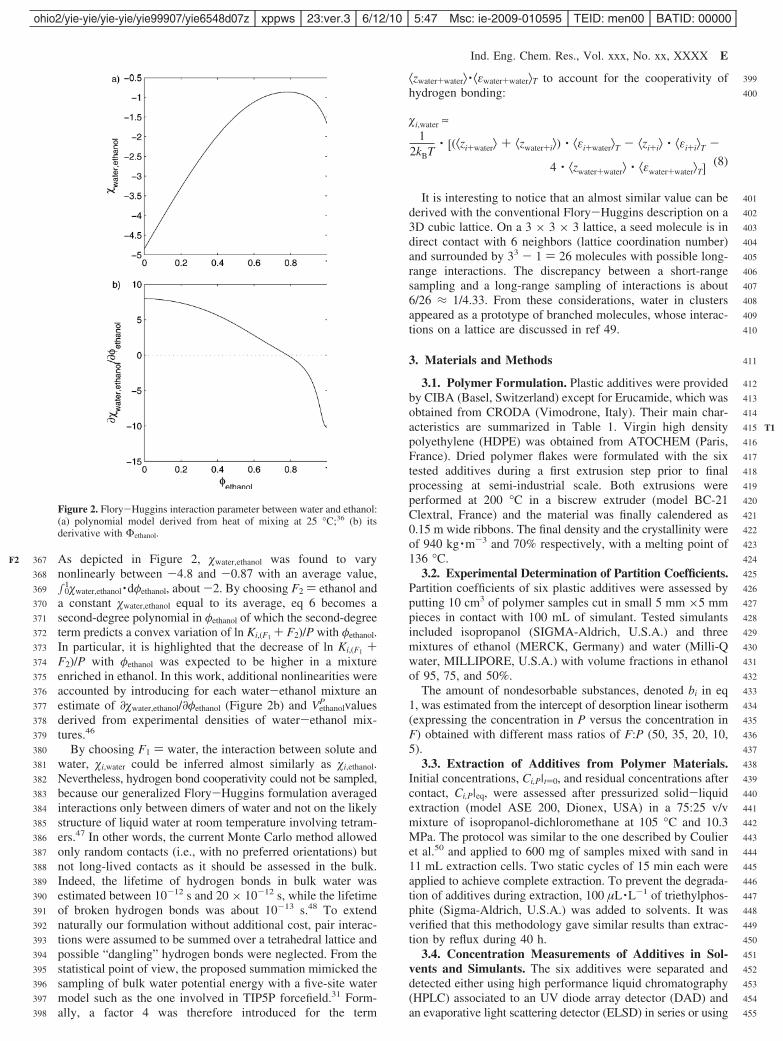
As depicted in Figure 2, �water,ethanol was found to varynonlinearly between -4.8 and -0.87 with an average value,∫0
1�water,ethanol ·dφethanol, about -2. By choosing F2 ) ethanol anda constant �water,ethanol equal to its average, eq 6 becomes asecond-degree polynomial in φethanol of which the second-degreeterm predicts a convex variation of ln Ki,(F1 + F2)/P with φethanol.In particular, it is highlighted that the decrease of ln Ki,(F1 +F2)/P with φethanol was expected to be higher in a mixtureenriched in ethanol. In this work, additional nonlinearities wereaccounted by introducing for each water-ethanol mixture anestimate of ∂�water,ethanol/∂φethanol (Figure 2b) and Vethanol
P valuesderived from experimental densities of water-ethanol mix-tures.46
By choosing F1 ) water, the interaction between solute andwater, �i,water could be inferred almost similarly as �i,ethanol.Nevertheless, hydrogen bond cooperativity could not be sampled,because our generalized Flory-Huggins formulation averagedinteractions only between dimers of water and not on the likelystructure of liquid water at room temperature involving tetram-ers.47 In other words, the current Monte Carlo method allowedonly random contacts (i.e., with no preferred orientations) butnot long-lived contacts as it should be assessed in the bulk.Indeed, the lifetime of hydrogen bonds in bulk water wasestimated between 10-12 s and 20 × 10-12 s, while the lifetimeof broken hydrogen bonds was about 10-13 s.48 To extendnaturally our formulation without additional cost, pair interac-tions were assumed to be summed over a tetrahedral lattice andpossible “dangling” hydrogen bonds were neglected. From thestatistical point of view, the proposed summation mimicked thesampling of bulk water potential energy with a five-site watermodel such as the one involved in TIP5P forcefield.31 Form-ally, a factor 4 was therefore introduced for the term
⟨zwater+water⟩ · ⟨εwater+water⟩T to account for the cooperativity ofhydrogen bonding:
It is interesting to notice that an almost similar value can bederived with the conventional Flory-Huggins description on a3D cubic lattice. On a 3 × 3 × 3 lattice, a seed molecule is indirect contact with 6 neighbors (lattice coordination number)and surrounded by 33 - 1 ) 26 molecules with possible long-range interactions. The discrepancy between a short-rangesampling and a long-range sampling of interactions is about6/26 ≈ 1/4.33. From these considerations, water in clustersappeared as a prototype of branched molecules, whose interac-tions on a lattice are discussed in ref 49.
3. Materials and Methods
3.1. Polymer Formulation. Plastic additives were providedby CIBA (Basel, Switzerland) except for Erucamide, which wasobtained from CRODA (Vimodrone, Italy). Their main char-acteristics are summarized in Table 1. Virgin high densitypolyethylene (HDPE) was obtained from ATOCHEM (Paris,France). Dried polymer flakes were formulated with the sixtested additives during a first extrusion step prior to finalprocessing at semi-industrial scale. Both extrusions wereperformed at 200 °C in a biscrew extruder (model BC-21Clextral, France) and the material was finally calendered as0.15 m wide ribbons. The final density and the crystallinity wereof 940 kg ·m-3 and 70% respectively, with a melting point of136 °C.
3.2. Experimental Determination of Partition Coefficients.Partition coefficients of six plastic additives were assessed byputting 10 cm3 of polymer samples cut in small 5 mm ×5 mmpieces in contact with 100 mL of simulant. Tested simulantsincluded isopropanol (SIGMA-Aldrich, U.S.A.) and threemixtures of ethanol (MERCK, Germany) and water (Milli-Qwater, MILLIPORE, U.S.A.) with volume fractions in ethanolof 95, 75, and 50%.
The amount of nondesorbable substances, denoted bi in eq1, was estimated from the intercept of desorption linear isotherm(expressing the concentration in P versus the concentration inF) obtained with different mass ratios of F:P (50, 35, 20, 10,5).
3.3. Extraction of Additives from Polymer Materials.Initial concentrations, Ci,P|t)0, and residual concentrations aftercontact, Ci,P|eq, were assessed after pressurized solid-liquidextraction (model ASE 200, Dionex, USA) in a 75:25 v/vmixture of isopropanol-dichloromethane at 105 °C and 10.3MPa. The protocol was similar to the one described by Coulieret al.50 and applied to 600 mg of samples mixed with sand in11 mL extraction cells. Two static cycles of 15 min each wereapplied to achieve complete extraction. To prevent the degrada-tion of additives during extraction, 100 µL ·L-1 of triethylphos-phite (Sigma-Aldrich, U.S.A.) was added to solvents. It wasverified that this methodology gave similar results than extrac-tion by reflux during 40 h.
3.4. Concentration Measurements of Additives in Sol-vents and Simulants. The six additives were separated anddetected either using high performance liquid chromatography(HPLC) associated to an UV diode array detector (DAD) andan evaporative light scattering detector (ELSD) in series or using
Figure 2. Flory-Huggins interaction parameter between water and ethanol:(a) polynomial model derived from heat of mixing at 25 °C;36 (b) itsderivative with Φethanol.
�i,water ≈1
2kBT· [(⟨zi+water⟩ + ⟨zwater+i⟩) · ⟨εi+water⟩T - ⟨zi+i⟩ · ⟨εi+i⟩T -
4 · ⟨zwater+water⟩ · ⟨εwater+water⟩T] (8)
Ind. Eng. Chem. Res., Vol. xxx, No. xx, XXXX E
367
368
369
370
371
372
373
374
375
376
377
378
379
380
381
382
383
384
385
386
387
388
389
390
391
392
393
394
395
396
397
398
399
400
401
402
403
404
405
406
407
408
409
410
411
412
413
414
415
416
417
418
419
420
421
422
423
424
425
426
427
428
429
430
431
432
433
434
435
436
437
438
439
440
441
442
443
444
445
446
447
448
449
450
451
452
453
454
455
F2
T1
ohio2/yie-yie/yie-yie/yie99907/yie6548d07z xppws 23:ver.3 6/12/10 5:47 Msc: ie-2009-010595 TEID: men00 BATID: 00000
gas chromatography (GC) associated to a flame ionizationdetector (FID). ESLD was only applied to Irganox PS802. GCwas not applied to Irganox 3114 due to its insufficient volatility.The HPLC protocol was similar to the one described by Garrido-Lopez et al.51 The HPLC system consisted in a Waters 717 plusautosampler, a Waters 600 controller equipped with a thermo-statted column compartment and an in-line degasser AF (Waters,U.S.A.). Separation was achieved on a Xterra C8 column (150mm ×3.0 mm; 5 µm particles; Waters, U.S.A.) operated at 60°C. The linear solvent gradient is described in Table 2. Theflow rate was of 0.8 mL/min and the injection volume was of30 µL. UV detection was performed between 200 and 300 nmwith a PDA model 2996 (Waters, USA). Light scattering wasassessed with a DDL 31 detector (Eurosep, France) using anebulization temperature of 110 °C and an air gas flow of 1.5L/min. The GC system comprised an AutoSystem XL (Perkin-Elmer, U.S.A.) used in on-column mode. The injector temper-ature was kept at 45 °C during 2 min followed by a linearincrease up to 320 °C with a heating rate of 100 °C/min.Separation was carried out on a BPX5 capillary column (30 m× 0,25 mm × 0,25 µm; SGE Europe, France). After injectionof 1 µL, the temperature was kept at 50 °C during 1 min,increased up to 330 at 15 °C/min and was at 330 °C for 5 min.Detector was permanently held to 340 °C. Because similarresults were obtained with GC and HPLC methods, they arenot distinguished in the remainder of this work.
3.5. Monte Carlo Sampling and MD Simulation Proce-dures. The main originality of our approach was to apply thesame methodology and the same theoretical framework tosample the interactions between a solute and much largerpolymer chains and to sample the interactions between a soluteand much smaller F molecules. The tailoring and coverage ofthe whole methodology were reinforced by the use of an abinitio class II (i.e., including anharmonic and cross-couplingterms) forcefield (COMPASS forcefield, Accelrys, USA), whichis optimized for condensed phases and which incorporates allthe parameters required for the study of polymers,52 plasticsadditives and food simulant including in some extent water viaa 3-site model.53 As only pair interactions between watermolecules were explicitly considered, the geometric approxima-
tion of hydrogen bonding via a three-site model was argued tobe appropriate.
As previously described,25 Monte Carlo sampling of pairinteraction energies was performed by combining a proprietarypre- and postprocessing code, so-called Molecular Studio,developed for Matlab (Matworks)/Scilab and the classical MDsimulation software Discover (Accelrys, U.S.A.). A large setof conformers (103 - 104) of each species was generated fromlong-term MD simulation at 313 K. Conformers of additives inpolymer and conformers of polymer segments were generatedin vacuum by neglecting intermolecular interactions. By contrast,conformers in F were extracted from isobaric MD simulationsin periodic systems including 103 F molecules. Pair contactenergies, {εA+B}A,B)i,F,P, relied on 107 samples for F moleculesand up to 1011 samples for large plastics additives. Potentialenergies were calculated without applying any cutoff. Thenumber of neighbors, {zA+B}A,B)i,F,P, was based on up to 104
trials of packing of contact molecules around a seed molecule.The contact surface was set to the van der Waals surface ofeach atom.
Initial packing configurations in F including one to foursolutes and 103 molecules were constructed at 313 K with theAmorphous Cell module (Accelrys, U.S.A.), using a compres-sion box technique, as described by Rigby.53 The target densityat this stage was setup to be 5-8% lower than that of thecorresponding ideal mixture. Each cell was subsequentlysubmitted to a long-term MD in the canonical NPT ensemblewith an integration time step of 10-15 ns. Temperature andpressure were kept constant by coupling the simulated cell withan infinite external heat bath (Andersen thermostat) and withan isotropic pressure bath (Berensen barostat). MD simulationswere equilibrated during 1 ns and repeated on 5 initial packingconfigurations. Van-der-Waals interactions were calculated atatomistic scale using a distance cutoff of 15.5 Å and ananalytical spline tail correction of 5 Å (buffer width ) 2 Å).Coulombic interactions were calculated via a 3D Ewald sum-mation technique with a lattice update width of 5 Å. Theconvergence of typical MD runs were tested by checking thatsimulated systems had a constant energy in the microcanonical(NVE) ensemble, that is without temperature and pressure bathscoupling.
Partial molar volumes, Vi,FP , at T ) 313 K and a pressure p )
105 Pa, were inferred from the volumes of equilibrated cellsF+i, VF+i, containing ni ) 1-4 solute molecules dispersedamong a constant number of F molecules, denoted nF. Vi,F
P ,defined in eq 9, was calculated as the slope of the regressionline of the mixture volume with the number of solutes i.
Possible biases introduced by MD simulations were detectedby comparing the intercept of the regression line with thetheoretical volume of pure F. In addition, it was verified that
Table 1. Main Characteristics of Experimentally Studied Plastics Additives
additive CAS number technological function Vivdw (Å3) Vi
M (Å3) melting range (°C) bi (%)
Irganox 1076 2082-79-3 antioxidant 647 ( 12 949 50-55e 0.002Irganox PS802 00693-36-7 antioxidant 850 ( 30 1235 64-67 0Irgafos 168 31570-04-4 co-stabilizer 747 ( 3 1043 183-186 0.03Chimassorb 81 01843-05-6 UV-stabilizer 344 ( 2 508 48-49 0.007Tinuvin 326 03896-11-5 UV-stabilizer 285 ( 3 416 138-141 0.008Erucamide 00112-84-5 surface agent 424 ( 6 642 79 0
ViM was calculated at 313 K with densities (averaged or extrapolated at the good temperature) from the Chemical Abstracts database; melting ranges
were obtained from technical datasheets of products; bi’s were estimated with results of Figure 2.
Table 2. Linear Solvent Gradient of Our HPLC Method
time (min) solvent Aa (%) solvent Bb (%) solvent Cc (%)
0 40 60 02 40 60 030 0 100 032 0 0 10037 0 0 10042 40 60 053 40 60 0
a Solvent A: aqueous 10 mM NH4Ac (VWR, France) solutionadjusted to pH 9.5 with 25% aqueous NH4OH (ACROS organics, Geel,Belgium) to which 500 µL/L n-hexylamine (SIGMA-ALDRICH, USA)was added. b Solvent B: acetonitrile (HPLC grade, CARLO ERBA,France) to which 500 µL/L n-hexylamine was added. c Solvent C:isopropanol to which 500 µL/L n-hexylamine was added.
Vi,FP ) (∂VF+i
∂ni)
T,p,nF
(9)
F Ind. Eng. Chem. Res., Vol. xxx, No. xx, XXXX
456
457
458
459
460
461
462
463
464
465
466
467
468
469
470
471
472
473
474
475
476
477
478
479
480
481
482
483
484
485
486
487
488
489
490
491
492
493
494
495
496
497
498
499
500
501
502
503
504
505
506
507
508
509
510
511
512
513
514
515
516
517
518
519
520
521
522
523
524
525
526
527
528
529
530
531
532
533
534
535
536
537
538
539
540
541
542
543
544
545
T2
ohio2/yie-yie/yie-yie/yie99907/yie6548d07z xppws 23:ver.3 6/12/10 5:47 Msc: ie-2009-010595 TEID: men00 BATID: 00000
doubling nF or changing the initial density did not affect thedensity at equilibrium.
A cost-efficient estimate of Vi,FP was tested by calculating the
volume enclosed within the Connolly surface accessible to ahydrogen atom and denoted Vi
H. This surface was sampled forseveral conformers by rolling around the solute a spherical probewith a radius comparable to a hydrogen atom. The enclosedvolume was finally calculated by Delaunay tessellation.
4. Results and Discussion
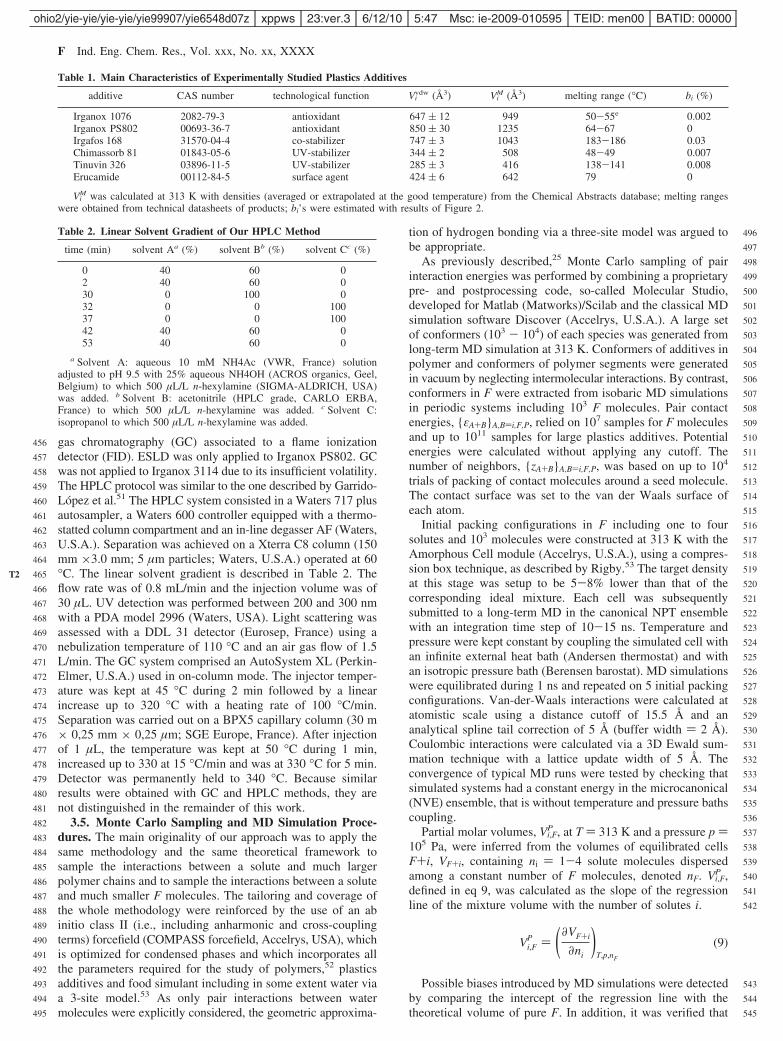
4.1. Typical Desorption Isotherms of Plastic Additivesin Ethanol. Typical desorption isotherms of plastic additivesincluding light stabilizers, an antioxidant and a lubricant (seeTable 1) are plotted in Figure 3 for F)ethanol 95%. Severalequilibriums were carried out by varying the volume of F incontact. Contact times were longer than 3 months to ensure athermodynamical equilibrium even for large additives and tomimic the long-term storage of food products. It is importantto notice that all additives belonged to a same formulation ofhigh density polyethylene and were consequently obtained insimilar conditions. All isotherms appeared linear with anintercept close to 0. According to eq 1, the slope wasproportional to the partition coefficient when bi was negligible.Estimates of bi were given by the intercept with Ci,F|eq andrepresented between 0 and 0.2% of the initial content in additive.These values were roughly correlated to the melting point ofthe considered additive (Table 1) and were used to deriveaccurate confidence intervals on partition coefficients includingbiases as defined in eq 1.
Significant deviation to linearity occurred only for Erucamide.Its chemical affinity for F increased when the concentration inP at equilibrium increased. This effect was related to the poorcompatibility of its unsaturated long chain carboxylic acid amidewith polyethylene. The induced phase separation in polyethyleneat high concentration is technologically used to modify thesurface tension of polyolefins. The substance is commonlyreferenced as lubricant, antifogging or slip agent and is highlysoluble in alcohols. In this case, only the first linear part of theisotherm was considered to determine partitioning. On theopposite, Irgafos 168, which is used as peroxide decomposer,
had the lowest chemical affinity for ethanol. The significantdiscrepancy between concentration measurements of Irgafos 168in particular in F was attributed to the high reactivity of itstrivalent phosphorus.
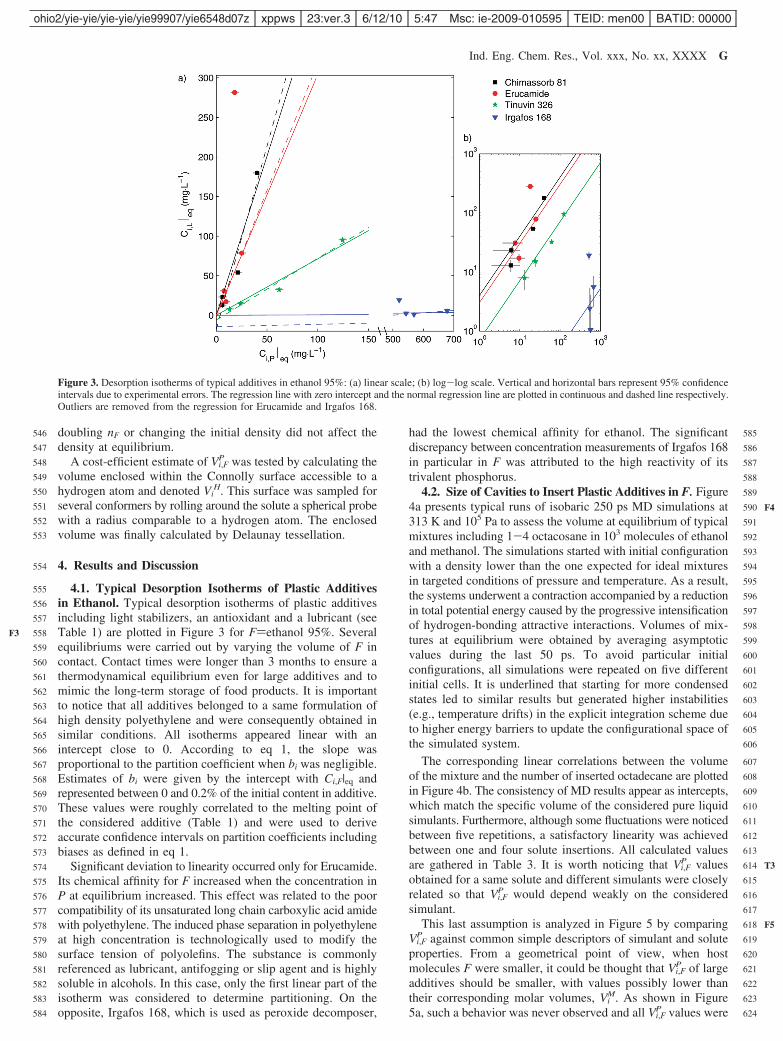
4.2. Size of Cavities to Insert Plastic Additives in F. Figure4a presents typical runs of isobaric 250 ps MD simulations at313 K and 105 Pa to assess the volume at equilibrium of typicalmixtures including 1-4 octacosane in 103 molecules of ethanoland methanol. The simulations started with initial configurationwith a density lower than the one expected for ideal mixturesin targeted conditions of pressure and temperature. As a result,the systems underwent a contraction accompanied by a reductionin total potential energy caused by the progressive intensificationof hydrogen-bonding attractive interactions. Volumes of mix-tures at equilibrium were obtained by averaging asymptoticvalues during the last 50 ps. To avoid particular initialconfigurations, all simulations were repeated on five differentinitial cells. It is underlined that starting for more condensedstates led to similar results but generated higher instabilities(e.g., temperature drifts) in the explicit integration scheme dueto higher energy barriers to update the configurational space ofthe simulated system.
The corresponding linear correlations between the volumeof the mixture and the number of inserted octadecane are plottedin Figure 4b. The consistency of MD results appear as intercepts,which match the specific volume of the considered pure liquidsimulants. Furthermore, although some fluctuations were noticedbetween five repetitions, a satisfactory linearity was achievedbetween one and four solute insertions. All calculated valuesare gathered in Table 3. It is worth noticing that Vi,F
P valuesobtained for a same solute and different simulants were closelyrelated so that Vi,F
P would depend weakly on the consideredsimulant.
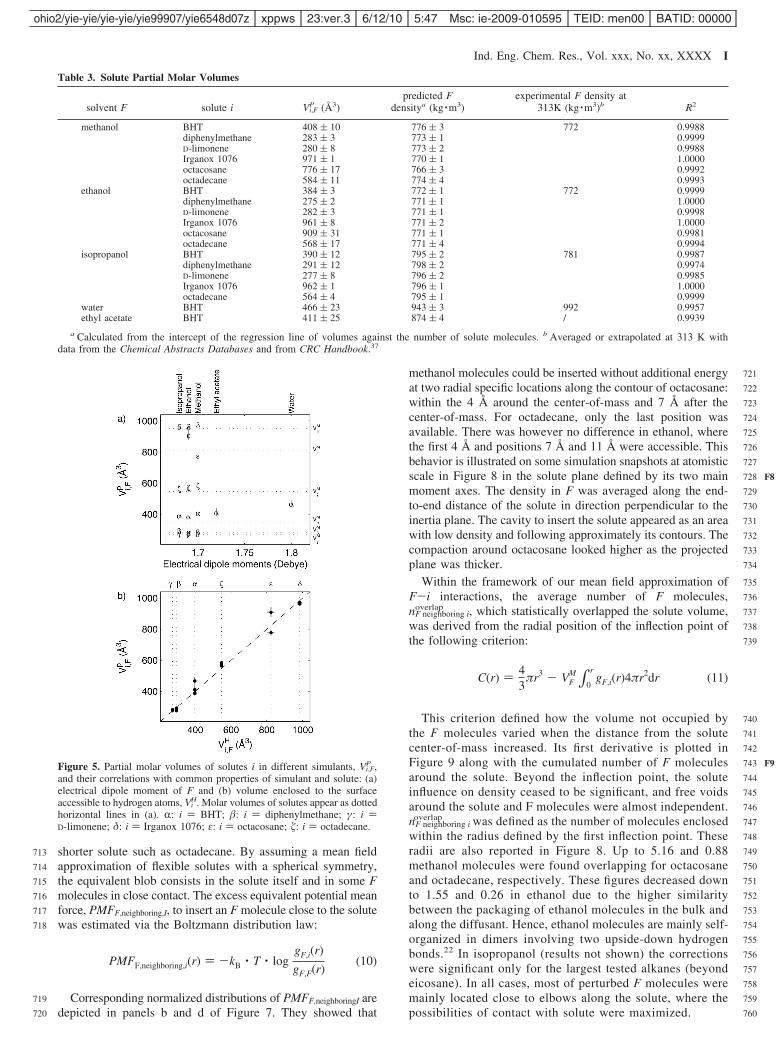
This last assumption is analyzed in Figure 5 by comparingVi,F
P against common simple descriptors of simulant and soluteproperties. From a geometrical point of view, when hostmolecules F were smaller, it could be thought that Vi,F
P of largeadditives should be smaller, with values possibly lower thantheir corresponding molar volumes, Vi
M. As shown in Figure5a, such a behavior was never observed and all Vi,F
P values were
Figure 3. Desorption isotherms of typical additives in ethanol 95%: (a) linear scale; (b) log-log scale. Vertical and horizontal bars represent 95% confidenceintervals due to experimental errors. The regression line with zero intercept and the normal regression line are plotted in continuous and dashed line respectively.Outliers are removed from the regression for Erucamide and Irgafos 168.
Ind. Eng. Chem. Res., Vol. xxx, No. xx, XXXX G
546
547
548
549
550
551
552
553
554
555
556
557
558
559
560
561
562
563
564
565
566
567
568
569
570
571
572
573
574
575
576
577
578
579
580
581
582
583
584
585
586
587
588
589
590
591
592
593
594
595
596
597
598
599
600
601
602
603
604
605
606
607
608
609
610
611
612
613
614
615
616
617
618
619
620
621
622
623
624
F3
F4
T3
F5
ohio2/yie-yie/yie-yie/yie99907/yie6548d07z xppws 23:ver.3 6/12/10 5:47 Msc: ie-2009-010595 TEID: men00 BATID: 00000
significantly greater than ViM ones and were either independent
of F or decreased when the size of F increased. This last effectwas well identified with solutes including a BHT pattern (e.g.,BHT itself or Irganox 1076) and was approximately correlatedto the electrical dipole moment of F with an increase of Vi,F
P by40% when isopropanol was replaced by water. These resultsshowed that the volume of simulant molecules displaced by theinsertion of a solute, ri,F
-1, was controlled by the volume of theinserted solute and by a nonideal effect related to the perturba-tion of the network of attractive interactions in F (see Figure 1as a possible interpretation). In other words, the large externalsurface of the solute hindered locally the creation of attractiveelectrostatic forces, which were responsible for a highermolecular compaction and cohesion in pure F.
Because all investigated solutes comprised only a fewhydrogen bond donors, they were statistically in contact withthe most abundant atoms in F, that is hydrogen atoms. It wastherefore argued that Vi,F
P should be correlated with the volumeenclosed within the solute external surface accessible tohydrogen atoms, Vi
H. A good agreement was observed for bothsmall solutes and large additives (Figure 5b). In more polarsimulants such as water, results obtained on BHT (Figure 5a)suggested that the perturbation region around large additivesshould be thicker than a single hydrogen atom and Vi
H values
should underestimate ri,F-1 and consequently Ki,F/P. Due to the
high computational cost of Vi,FP calculations by MD simulations,
ensemble-averaged ViH values were privileged to assess parti-
tioning via eq 22 or eq 6. This choice confirmed our firstallegations,25 for which the large entropic contribution involvedin the partitioning of plastic additives should be controlled bytheir large hardcore volume plus an interstitial volume thatwould be proportional to the surface exposed to F. In alcohols,using Vi
H led to an interstitial estimate that was on average 9%larger than the one derived using Vi
M as previously proposedas an upper bound of rF
-1.25
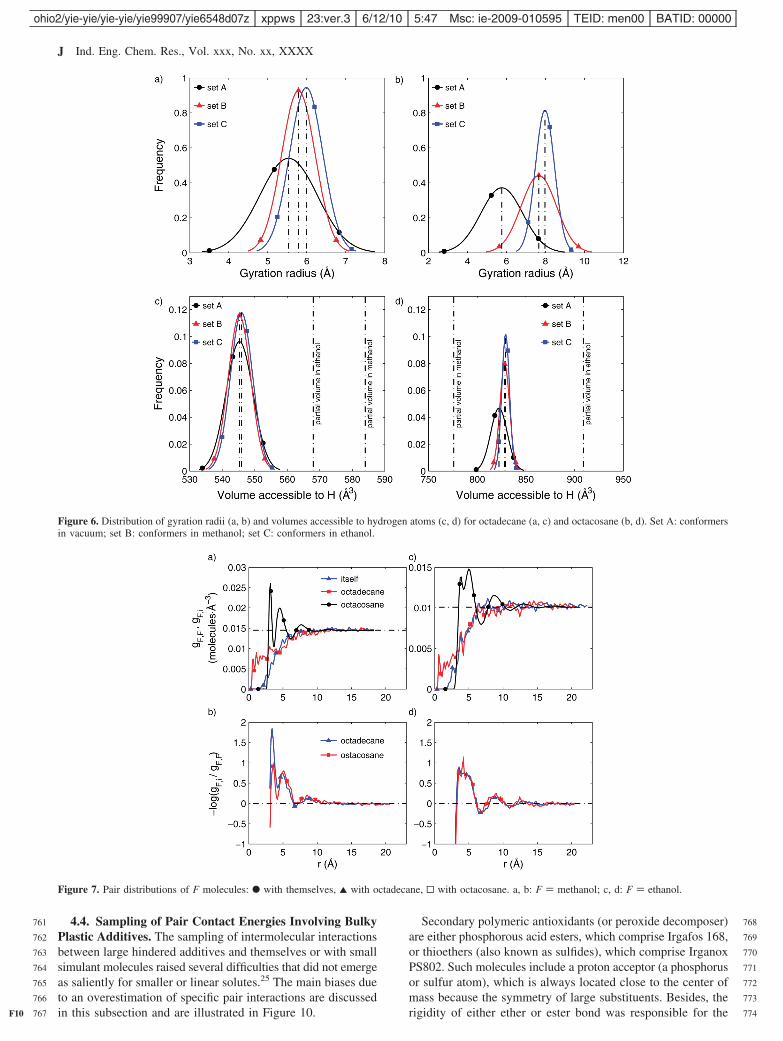
For flexible solutes, the interstitial volume was thought tovary according to the configuration of solutes and according toconsidered interactions (e.g., without intermolecular interactions,in poor solvent). This possible effect was systematically testedfor octadecane and octacosane. The corresponding gyration radii,Vi
H and Vi,FP values are plotted in Figure 6. Without intermo-
lecular interactions, large n-alkanes adopted mainly randomlycoiled configurations, whereas more stretched configurationswere privileged in ethanol and methanol. Surprisingly, althoughsignificant discrepancies appeared between sets of conformers,the ensemble-averaged Vi
H values were almost independent ofthe way conformers were sampled. In particular, such method-ological results confirmed the principle of an inexpensivetailored sampling of volumes “in vacuum” (without intermo-lecular interactions). In details, the volume enclosed within theaccessible surface to a hydrogen atom underestimated slightlythe true volume of cavity because of additional excludedvolumes due to the size of F molecules. There was, however,an exception for octacosane in methanol for which the cavitywas smaller than Vi
H. This effect was related to a close packingbetween methanol molecules and large aliphatic chains closeto their correlation length.
4.3. Solute-Simulant Radial Distribution Functions. Sev-eral plastics additives, among them plasticizers, surface agents, andantioxidants, include an aliphatic chain, which tends to “accom-modate” the packing of small F molecules more efficiently thanbulky rigid group (e.g., a BHT pattern). This effect was analyzedspecifically as it counterbalanced the effect of solute in size in thetranslational entropic contribution. It was shown to be particularlysignificant for n-alkanes larger than tetradecane, where our initialformulation overestimated strongly experimental Ki,F/P values.25
Such deviations were inherent to our mean field aproximation,which assumed that two species could not occupy the same spacebelow the length scale of a statistical segment. Since this lengthscale was chosen related to the solute volume to keep a similarchemical potential expression in P and in F, details smaller thanthe solute gyration radius were not captured.
Fluctuations in F density around flexible solutes in methanoland ethanol are analyzed in Figure 7 by plotting the radialdistributions of F-F and i-F pairs averaged over several cellsand more than 100 independent time snapshots. Densitycorrelations of small liquid alcohols, denoted gF,F(r), persistedover distances up to 6 molecular diameters (between 10 and 15Å), that is on length scales close to the gyration radius of mostof plastic additives. The first peak was related to a contact viaa hydrogen bond (e.g., methanol or ethanol) or even a doublehydrogen bond (e.g., ethanol), whereas following contactsinvolved hydrogen to another hydrogen or hydrogen to a carboninteraction. Around flexible solutes, the density in F molecules,gF,i(r), was by contrast always lower than in the bulk andincreased regularly outward. For a molecule larger than itspersistence length, such as octacosane, the solute center-of-masswas accessible to F molecules, but it was inacessible for a
Figure 4. Typical NPT MD runs at T ) 313 K and p ) 105 Pa in F )methanol (empty symbols) and F ) ethanol (filled symbols) when O ni )1; ∆: ni ) 2; 0: ni ) 3; ]: ni ) 4 molecules of octacosane are added to1000 F molecules: Total energy (a) and volume (b) are cumulative averages.Typical partial molar volumes are calculated as reference slopes (c).
H Ind. Eng. Chem. Res., Vol. xxx, No. xx, XXXX
625
626
627
628
629
630
631
632
633
634
635
636
637
638
639
640
641
642
643
644
645
646
647
648
649
650
651
652
653
654
655
656
657
658
659
660
661
662
663
664
665
666
667
668
669
670
671
672
673
674
675
676
677
678
679
680
681
682
683
684
685
686
687
688
689
690
691
692
693
694
695
696
697
698
699
700
701
702
703
704
705
706
707
708
709
710
711
712
F6
F7
ohio2/yie-yie/yie-yie/yie99907/yie6548d07z xppws 23:ver.3 6/12/10 5:47 Msc: ie-2009-010595 TEID: men00 BATID: 00000
shorter solute such as octadecane. By assuming a mean fieldapproximation of flexible solutes with a spherical symmetry,the equivalent blob consists in the solute itself and in some Fmolecules in close contact. The excess equivalent potential meanforce, PMFF,neighboring,I, to insert an F molecule close to the solutewas estimated via the Boltzmann distribution law:
Corresponding normalized distributions of PMFF,neighboringI aredepicted in panels b and d of Figure 7. They showed that
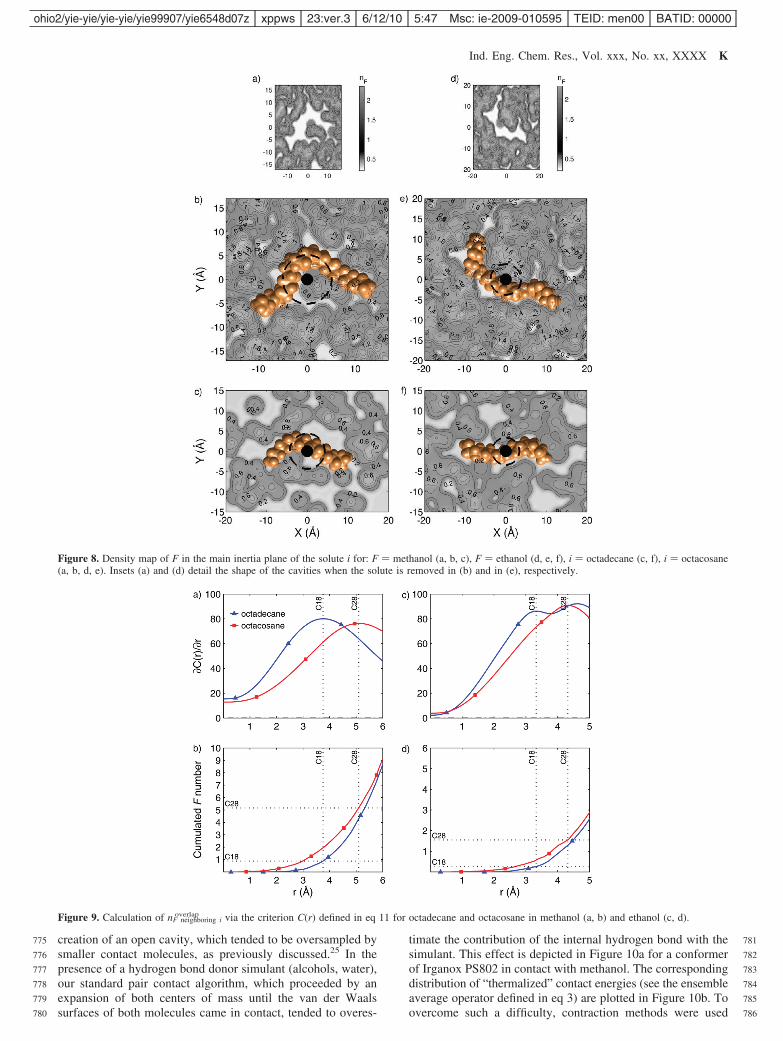
methanol molecules could be inserted without additional energyat two radial specific locations along the contour of octacosane:within the 4 Å around the center-of-mass and 7 Å after thecenter-of-mass. For octadecane, only the last position wasavailable. There was however no difference in ethanol, wherethe first 4 Å and positions 7 Å and 11 Å were accessible. Thisbehavior is illustrated on some simulation snapshots at atomisticscale in Figure 8 in the solute plane defined by its two mainmoment axes. The density in F was averaged along the end-to-end distance of the solute in direction perpendicular to theinertia plane. The cavity to insert the solute appeared as an areawith low density and following approximately its contours. Thecompaction around octacosane looked higher as the projectedplane was thicker.
Within the framework of our mean field approximation ofF-i interactions, the average number of F molecules,nF neighboring i
overlap , which statistically overlapped the solute volume,was derived from the radial position of the inflection point ofthe following criterion:
This criterion defined how the volume not occupied bythe F molecules varied when the distance from the solutecenter-of-mass increased. Its first derivative is plotted inFigure 9 along with the cumulated number of F moleculesaround the solute. Beyond the inflection point, the soluteinfluence on density ceased to be significant, and free voidsaround the solute and F molecules were almost independent.nF neighboring i
overlap was defined as the number of molecules enclosedwithin the radius defined by the first inflection point. Theseradii are also reported in Figure 8. Up to 5.16 and 0.88methanol molecules were found overlapping for octacosaneand octadecane, respectively. These figures decreased downto 1.55 and 0.26 in ethanol due to the higher similaritybetween the packaging of ethanol molecules in the bulk andalong the diffusant. Hence, ethanol molecules are mainly self-organized in dimers involving two upside-down hydrogenbonds.22 In isopropanol (results not shown) the correctionswere significant only for the largest tested alkanes (beyondeicosane). In all cases, most of perturbed F molecules weremainly located close to elbows along the solute, where thepossibilities of contact with solute were maximized.
Table 3. Solute Partial Molar Volumes
solvent F solute i Vi,FP (Å3)
predicted Fdensitya (kg ·m3)
experimental F density at313K (kg ·m3)b R2
methanol BHT 408 ( 10 776 ( 3 772 0.9988diphenylmethane 283 ( 3 773 ( 1 0.9999D-limonene 280 ( 8 773 ( 2 0.9988Irganox 1076 971 ( 1 770 ( 1 1.0000octacosane 776 ( 17 766 ( 3 0.9992octadecane 584 ( 11 774 ( 4 0.9993
ethanol BHT 384 ( 3 772 ( 1 772 0.9999diphenylmethane 275 ( 2 771 ( 1 1.0000D-limonene 282 ( 3 771 ( 1 0.9998Irganox 1076 961 ( 8 771 ( 2 1.0000octacosane 909 ( 31 771 ( 1 0.9981octadecane 568 ( 17 771 ( 4 0.9994
isopropanol BHT 390 ( 12 795 ( 2 781 0.9987diphenylmethane 291 ( 12 798 ( 2 0.9974D-limonene 277 ( 8 796 ( 2 0.9985Irganox 1076 962 ( 1 796 ( 1 1.0000octadecane 564 ( 4 795 ( 1 0.9999
water BHT 466 ( 23 943 ( 3 992 0.9957ethyl acetate BHT 411 ( 25 874 ( 4 / 0.9939
a Calculated from the intercept of the regression line of volumes against the number of solute molecules. b Averaged or extrapolated at 313 K withdata from the Chemical Abstracts Databases and from CRC Handbook.37
Figure 5. Partial molar volumes of solutes i in different simulants, Vi,FP ,
and their correlations with common properties of simulant and solute: (a)electrical dipole moment of F and (b) volume enclosed to the surfaceaccessible to hydrogen atoms, Vi
H. Molar volumes of solutes appear as dottedhorizontal lines in (a). R: i ) BHT; �: i ) diphenylmethane; γ: i )D-limonene; δ: i ) Irganox 1076; ε: i ) octacosane; �: i ) octadecane.
PMFF,neighboring,i(r) ) -kB · T · loggF,i(r)
gF,F(r)(10)
C(r) ) 43
πr3 - VFM∫0
rgF,i(r)4πr2dr (11)
Ind. Eng. Chem. Res., Vol. xxx, No. xx, XXXX I
713
714
715
716
717
718
719
720
721
722
723
724
725
726
727
728
729
730
731
732
733
734
735
736
737
738
739
740
741
742
743
744
745
746
747
748
749
750
751
752
753
754
755
756
757
758
759
760
F8
F9
ohio2/yie-yie/yie-yie/yie99907/yie6548d07z xppws 23:ver.3 6/12/10 5:47 Msc: ie-2009-010595 TEID: men00 BATID: 00000
4.4. Sampling of Pair Contact Energies Involving BulkyPlastic Additives. The sampling of intermolecular interactionsbetween large hindered additives and themselves or with smallsimulant molecules raised several difficulties that did not emergeas saliently for smaller or linear solutes.25 The main biases dueto an overestimation of specific pair interactions are discussedin this subsection and are illustrated in Figure 10.
Secondary polymeric antioxidants (or peroxide decomposer)are either phosphorous acid esters, which comprise Irgafos 168,or thioethers (also known as sulfides), which comprise IrganoxPS802. Such molecules include a proton acceptor (a phosphorusor sulfur atom), which is always located close to the center ofmass because the symmetry of large substituents. Besides, therigidity of either ether or ester bond was responsible for the
Figure 6. Distribution of gyration radii (a, b) and volumes accessible to hydrogen atoms (c, d) for octadecane (a, c) and octacosane (b, d). Set A: conformersin vacuum; set B: conformers in methanol; set C: conformers in ethanol.
Figure 7. Pair distributions of F molecules: b with themselves, 2 with octadecane, 0 with octacosane. a, b: F ) methanol; c, d: F ) ethanol.
J Ind. Eng. Chem. Res., Vol. xxx, No. xx, XXXX
761
762
763
764
765
766
767
768
769
770
771
772
773
774F10
ohio2/yie-yie/yie-yie/yie99907/yie6548d07z xppws 23:ver.3 6/12/10 5:47 Msc: ie-2009-010595 TEID: men00 BATID: 00000
creation of an open cavity, which tended to be oversampled bysmaller contact molecules, as previously discussed.25 In thepresence of a hydrogen bond donor simulant (alcohols, water),our standard pair contact algorithm, which proceeded by anexpansion of both centers of mass until the van der Waalssurfaces of both molecules came in contact, tended to overes-
timate the contribution of the internal hydrogen bond with thesimulant. This effect is depicted in Figure 10a for a conformerof Irganox PS802 in contact with methanol. The correspondingdistribution of “thermalized” contact energies (see the ensembleaverage operator defined in eq 3) are plotted in Figure 10b. Toovercome such a difficulty, contraction methods were used
Figure 8. Density map of F in the main inertia plane of the solute i for: F ) methanol (a, b, c), F ) ethanol (d, e, f), i ) octadecane (c, f), i ) octacosane(a, b, d, e). Insets (a) and (d) detail the shape of the cavities when the solute is removed in (b) and in (e), respectively.
Figure 9. Calculation of nF neighboring ioverlap via the criterion C(r) defined in eq 11 for octadecane and octacosane in methanol (a, b) and ethanol (c, d).
Ind. Eng. Chem. Res., Vol. xxx, No. xx, XXXX K
775
776
777
778
779
780
781
782
783
784
785
786
ohio2/yie-yie/yie-yie/yie99907/yie6548d07z xppws 23:ver.3 6/12/10 5:47 Msc: ie-2009-010595 TEID: men00 BATID: 00000

instead of expansion ones and were combined with differentdirections of translation that were not collinear with centers-of-mass of contact and seed molecules.
In addition, replacing the sampling of many-molecules systemby the sampling between a pair of molecules was shown tocreate artifacts when the molecular reference state of the systemat the considered temperature was ordered. Such biases wereparticularly significant when the interactions between two largehindered phosphorous acid esters were sampled. Typicalconfigurations of Irganox 3114 with very low potential energiesare depicted in Figure 10c. Such configurations maximized theπ-π interaction between their inner heterocyclic aromatic ringsso that the left part distributions of pair contact energies at 313K appeared highly noisy as plotted in Figure 10d. Suchconfigurations were very unlikely as Irganox 3114 is crystallineat 313 K with a melting point ranging between 219 and 226°C. The likely structure at 313 K of such hindered moleculeswould involve a stacking of convex regions by putting in contactits convex surface (bulging outward) with a concave one(bulging inward). Though they were associated to much lowercontact energies, the few configurations, where two convexsurfaces (e.g., Figure 10c) were in contact via their centralaromatic rings (π stacking), were therefore discarded byintroducing a posteriori a stacking weight, wA+B(ε) in eq 3, asfollows:
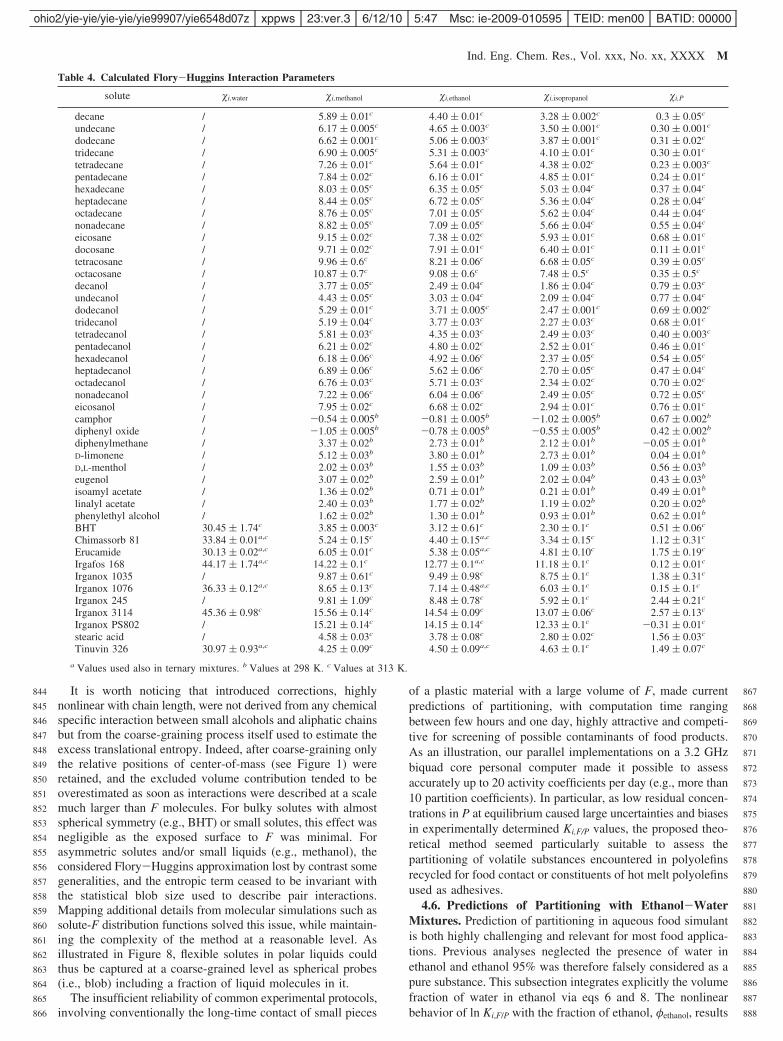
Such additional refinements led to Flory interaction param-eters in P, which were ranged between 0 and 3 (Table 4).
Neglecting previous effects would yield much higher values,which would be unrealistic for plastics additives, which haveby design a good solubility in P.
4.5. Predictions of Partitioning with Alcohols. Partitioncoefficients between alcohols and amorphous regions of poly-ethylene were calculated by means of eq 2. ri,F
-1 was calculatedfrom eq 4 using Vi
H values and the molar volume of F. Thecorrective term nF neighboring i
overlap was included for all moleculesincluding an alkyl chain (e.g., n-alkanes, n-alcohols, Erucamide,Irganox 1076, Irganox PS802) on the basis of an extrapolationof the behavior observed from MD simulations octacosane andoctadecane in the appropriate simulant. In practice, the correctionwas almost insignificant for segments including less than 16carbons. Contact energies in F were derived conformers sampledfrom MD simulations at 313 K in F. They were finally“thermalized” by means of eq 3 at the corresponding experi-mental temperature, either 313 or 298 K. Corresponding �i,F
and �i,P values are gathered in Table 4.
Predictions were compared to reference data used in ourprevious work25 and to additional data generated by this study.The comparisons are plotted crudely in Figure 11 withoutapplying any fitting procedure. The predictions were particularlysatisfactory for plastic additives. For large n-alkanes, thepredictions are poorly satisfactory in absence of correction butwere highly confident when the overlapping effect was consid-ered. Introduced new refinements improve drastically previouspredictions of large molecules either flexible or not and madethe predictions more robust for new solutes (e.g., surface agents,polymeric hindered antioxidants) and new food simulants(isopropanol).
Figure 10. Biases associated to the sampling of contact energies involving bulky molecules: (a,b) Irganox PS802 and methanol, (c,d) Irganox 3114 anditself. The snapshots depicted in (a) and (c) have a minimal interaction energy. Sampled distributions of contact energies plotted in (b) and (d) are weightedwith the corresponding Boltzmann factor at 313 K. Extraction and contraction methods are described in previous work.25
⟨εA+B⟩T )∫-∞
+∞pA+B(ε) · e-ε/kB · T · wA+B(ε) · ε · dε
∫-∞
+∞pA+B(ε) · e-ε/kB · T · wA+B(ε) · dε
(12)
L Ind. Eng. Chem. Res., Vol. xxx, No. xx, XXXX
787
788
789
790
791
792
793
794
795
796
797
798
799
800
801
802
803
804
805
806
807
808
809
810
811
812
813
814
815
816
817
818
819
820
821
822
823
824
825
826
827
828
829
830
831
832
833
834
835
836
837
838
839
840
841
842
843T4
F11
ohio2/yie-yie/yie-yie/yie99907/yie6548d07z xppws 23:ver.3 6/12/10 5:47 Msc: ie-2009-010595 TEID: men00 BATID: 00000
It is worth noticing that introduced corrections, highlynonlinear with chain length, were not derived from any chemicalspecific interaction between small alcohols and aliphatic chainsbut from the coarse-graining process itself used to estimate theexcess translational entropy. Indeed, after coarse-graining onlythe relative positions of center-of-mass (see Figure 1) wereretained, and the excluded volume contribution tended to beoverestimated as soon as interactions were described at a scalemuch larger than F molecules. For bulky solutes with almostspherical symmetry (e.g., BHT) or small solutes, this effect wasnegligible as the exposed surface to F was minimal. Forasymmetric solutes and/or small liquids (e.g., methanol), theconsidered Flory-Huggins approximation lost by contrast somegeneralities, and the entropic term ceased to be invariant withthe statistical blob size used to describe pair interactions.Mapping additional details from molecular simulations such assolute-F distribution functions solved this issue, while maintain-ing the complexity of the method at a reasonable level. Asillustrated in Figure 8, flexible solutes in polar liquids couldthus be captured at a coarse-grained level as spherical probes(i.e., blob) including a fraction of liquid molecules in it.
The insufficient reliability of common experimental protocols,involving conventionally the long-time contact of small pieces
of a plastic material with a large volume of F, made currentpredictions of partitioning, with computation time rangingbetween few hours and one day, highly attractive and competi-tive for screening of possible contaminants of food products.As an illustration, our parallel implementations on a 3.2 GHzbiquad core personal computer made it possible to assessaccurately up to 20 activity coefficients per day (e.g., more than10 partition coefficients). In particular, as low residual concen-trations in P at equilibrium caused large uncertainties and biasesin experimentally determined Ki,F/P values, the proposed theo-retical method seemed particularly suitable to assess thepartitioning of volatile substances encountered in polyolefinsrecycled for food contact or constituents of hot melt polyolefinsused as adhesives.
4.6. Predictions of Partitioning with Ethanol-WaterMixtures. Prediction of partitioning in aqueous food simulantis both highly challenging and relevant for most food applica-tions. Previous analyses neglected the presence of water inethanol and ethanol 95% was therefore falsely considered as apure substance. This subsection integrates explicitly the volumefraction of water in ethanol via eqs 6 and 8. The nonlinearbehavior of ln Ki,F/P with the fraction of ethanol, φethanol, results
Table 4. Calculated Flory-Huggins Interaction Parameters
solute �i,water �i,methanol �i,ethanol �i,isopropanol �i,P
decane / 5.89 ( 0.01c 4.40 ( 0.01c 3.28 ( 0.002c 0.3 ( 0.05c
undecane / 6.17 ( 0.005c 4.65 ( 0.003c 3.50 ( 0.001c 0.30 ( 0.001c
dodecane / 6.62 ( 0.001c 5.06 ( 0.003c 3.87 ( 0.001c 0.31 ( 0.02c
tridecane / 6.90 ( 0.005c 5.31 ( 0.003c 4.10 ( 0.01c 0.30 ( 0.01c
tetradecane / 7.26 ( 0.01c 5.64 ( 0.01c 4.38 ( 0.02c 0.23 ( 0.003c
pentadecane / 7.84 ( 0.02c 6.16 ( 0.01c 4.85 ( 0.01c 0.24 ( 0.01c
hexadecane / 8.03 ( 0.05c 6.35 ( 0.05c 5.03 ( 0.04c 0.37 ( 0.04c
heptadecane / 8.44 ( 0.05c 6.72 ( 0.05c 5.36 ( 0.04c 0.28 ( 0.04c
octadecane / 8.76 ( 0.05c 7.01 ( 0.05c 5.62 ( 0.04c 0.44 ( 0.04c
nonadecane / 8.82 ( 0.05c 7.09 ( 0.05c 5.66 ( 0.04c 0.55 ( 0.04c
eicosane / 9.15 ( 0.02c 7.38 ( 0.02c 5.93 ( 0.01c 0.68 ( 0.01c
docosane / 9.71 ( 0.02c 7.91 ( 0.01c 6.40 ( 0.01c 0.11 ( 0.01c
tetracosane / 9.96 ( 0.6c 8.21 ( 0.06c 6.68 ( 0.05c 0.39 ( 0.05c
octacosane / 10.87 ( 0.7c 9.08 ( 0.6c 7.48 ( 0.5c 0.35 ( 0.5c
decanol / 3.77 ( 0.05c 2.49 ( 0.04c 1.86 ( 0.04c 0.79 ( 0.03c
undecanol / 4.43 ( 0.05c 3.03 ( 0.04c 2.09 ( 0.04c 0.77 ( 0.04c
dodecanol / 5.29 ( 0.01c 3.71 ( 0.005c 2.47 ( 0.001c 0.69 ( 0.002c
tridecanol / 5.19 ( 0.04c 3.77 ( 0.03c 2.27 ( 0.03c 0.68 ( 0.01c
tetradecanol / 5.81 ( 0.03c 4.35 ( 0.03c 2.49 ( 0.03c 0.40 ( 0.003c
pentadecanol / 6.21 ( 0.02c 4.80 ( 0.02c 2.52 ( 0.01c 0.46 ( 0.01c
hexadecanol / 6.18 ( 0.06c 4.92 ( 0.06c 2.37 ( 0.05c 0.54 ( 0.05c
heptadecanol / 6.89 ( 0.06c 5.62 ( 0.06c 2.70 ( 0.05c 0.47 ( 0.04c
octadecanol / 6.76 ( 0.03c 5.71 ( 0.03c 2.34 ( 0.02c 0.70 ( 0.02c
nonadecanol / 7.22 ( 0.06c 6.04 ( 0.06c 2.49 ( 0.05c 0.72 ( 0.05c
eicosanol / 7.95 ( 0.02c 6.68 ( 0.02c 2.94 ( 0.01c 0.76 ( 0.01c
camphor / -0.54 ( 0.005b -0.81 ( 0.005b -1.02 ( 0.005b 0.67 ( 0.002b
diphenyl oxide / -1.05 ( 0.005b -0.78 ( 0.005b -0.55 ( 0.005b 0.42 ( 0.002b
diphenylmethane / 3.37 ( 0.02b 2.73 ( 0.01b 2.12 ( 0.01b -0.05 ( 0.01b
D-limonene / 5.12 ( 0.03b 3.80 ( 0.01b 2.73 ( 0.01b 0.04 ( 0.01b
D,L-menthol / 2.02 ( 0.03b 1.55 ( 0.03b 1.09 ( 0.03b 0.56 ( 0.03b
eugenol / 3.07 ( 0.02b 2.59 ( 0.01b 2.02 ( 0.04b 0.43 ( 0.03b
isoamyl acetate / 1.36 ( 0.02b 0.71 ( 0.01b 0.21 ( 0.01b 0.49 ( 0.01b
linalyl acetate / 2.40 ( 0.03b 1.77 ( 0.02b 1.19 ( 0.02b 0.20 ( 0.02b
phenylethyl alcohol / 1.62 ( 0.02b 1.30 ( 0.01b 0.93 ( 0.01b 0.62 ( 0.01b
BHT 30.45 ( 1.74c 3.85 ( 0.003c 3.12 ( 0.61c 2.30 ( 0.1c 0.51 ( 0.06c
Chimassorb 81 33.84 ( 0.01a,c 5.24 ( 0.15c 4.40 ( 0.15a,c 3.34 ( 0.15c 1.12 ( 0.31c
Erucamide 30.13 ( 0.02a,c 6.05 ( 0.01c 5.38 ( 0.05a,c 4.81 ( 0.10c 1.75 ( 0.19c
Irgafos 168 44.17 ( 1.74a,c 14.22 ( 0.1c 12.77 ( 0.1a,c 11.18 ( 0.1c 0.12 ( 0.01c
Irganox 1035 / 9.87 ( 0.61c 9.49 ( 0.98c 8.75 ( 0.1c 1.38 ( 0.31c
Irganox 1076 36.33 ( 0.12a,c 8.65 ( 0.13c 7.14 ( 0.48a,c 6.03 ( 0.1c 0.15 ( 0.1c
Irganox 245 / 9.81 ( 1.09c 8.48 ( 0.78c 5.92 ( 0.1c 2.44 ( 0.21c
Irganox 3114 45.36 ( 0.98c 15.56 ( 0.14c 14.54 ( 0.09c 13.07 ( 0.06c 2.57 ( 0.13c
Irganox PS802 / 15.21 ( 0.14c 14.15 ( 0.14c 12.33 ( 0.1c -0.31 ( 0.01c
stearic acid / 4.58 ( 0.03c 3.78 ( 0.08c 2.80 ( 0.02c 1.56 ( 0.03c
Tinuvin 326 30.97 ( 0.93a,c 4.25 ( 0.09c 4.50 ( 0.09a,c 4.63 ( 0.1c 1.49 ( 0.07c
a Values used also in ternary mixtures. b Values at 298 K. c Values at 313 K.
Ind. Eng. Chem. Res., Vol. xxx, No. xx, XXXX M
844
845
846
847
848
849
850
851
852
853
854
855
856
857
858
859
860
861
862
863
864
865
866
867
868
869
870
871
872
873
874
875
876
877
878
879
880
881
882
883
884
885
886
887
888
ohio2/yie-yie/yie-yie/yie99907/yie6548d07z xppws 23:ver.3 6/12/10 5:47 Msc: ie-2009-010595 TEID: men00 BATID: 00000
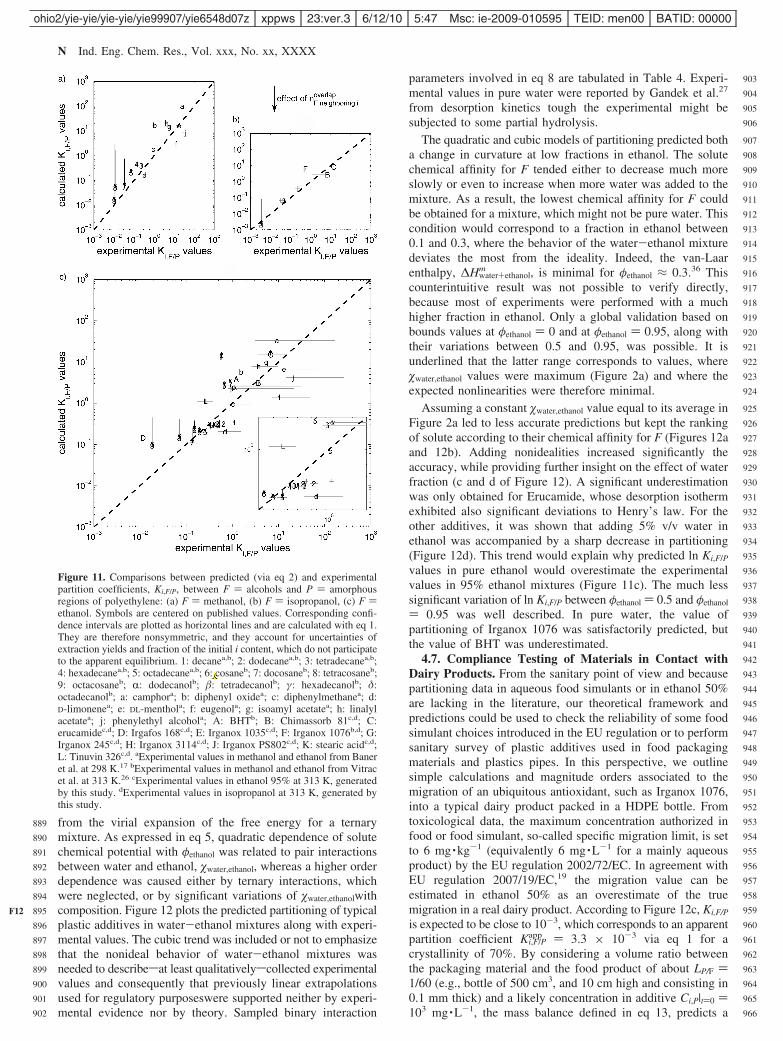
from the virial expansion of the free energy for a ternarymixture. As expressed in eq 5, quadratic dependence of solutechemical potential with φethanol was related to pair interactionsbetween water and ethanol, �water,ethanol, whereas a higher orderdependence was caused either by ternary interactions, whichwere neglected, or by significant variations of �water,ethanolwithcomposition. Figure 12 plots the predicted partitioning of typicalplastic additives in water-ethanol mixtures along with experi-mental values. The cubic trend was included or not to emphasizethat the nonideal behavior of water-ethanol mixtures wasneeded to describesat least qualitativelyscollected experimentalvalues and consequently that previously linear extrapolationsused for regulatory purposeswere supported neither by experi-mental evidence nor by theory. Sampled binary interaction
parameters involved in eq 8 are tabulated in Table 4. Experi-mental values in pure water were reported by Gandek et al.27
from desorption kinetics tough the experimental might besubjected to some partial hydrolysis.
The quadratic and cubic models of partitioning predicted botha change in curvature at low fractions in ethanol. The solutechemical affinity for F tended either to decrease much moreslowly or even to increase when more water was added to themixture. As a result, the lowest chemical affinity for F couldbe obtained for a mixture, which might not be pure water. Thiscondition would correspond to a fraction in ethanol between0.1 and 0.3, where the behavior of the water-ethanol mixturedeviates the most from the ideality. Indeed, the van-Laarenthalpy, ∆Hwater+ethanol
m , is minimal for φethanol ≈ 0.3.36 Thiscounterintuitive result was not possible to verify directly,because most of experiments were performed with a muchhigher fraction in ethanol. Only a global validation based onbounds values at φethanol ) 0 and at φethanol ) 0.95, along withtheir variations between 0.5 and 0.95, was possible. It isunderlined that the latter range corresponds to values, where�water,ethanol values were maximum (Figure 2a) and where theexpected nonlinearities were therefore minimal.
Assuming a constant �water,ethanol value equal to its average inFigure 2a led to less accurate predictions but kept the rankingof solute according to their chemical affinity for F (Figures 12aand 12b). Adding nonidealities increased significantly theaccuracy, while providing further insight on the effect of waterfraction (c and d of Figure 12). A significant underestimationwas only obtained for Erucamide, whose desorption isothermexhibited also significant deviations to Henry’s law. For theother additives, it was shown that adding 5% v/v water inethanol was accompanied by a sharp decrease in partitioning(Figure 12d). This trend would explain why predicted ln Ki,F/P
values in pure ethanol would overestimate the experimentalvalues in 95% ethanol mixtures (Figure 11c). The much lesssignificant variation of ln Ki,F/P between φethanol ) 0.5 and φethanol
) 0.95 was well described. In pure water, the value ofpartitioning of Irganox 1076 was satisfactorily predicted, butthe value of BHT was underestimated.
4.7. Compliance Testing of Materials in Contact withDairy Products. From the sanitary point of view and becausepartitioning data in aqueous food simulants or in ethanol 50%are lacking in the literature, our theoretical framework andpredictions could be used to check the reliability of some foodsimulant choices introduced in the EU regulation or to performsanitary survey of plastic additives used in food packagingmaterials and plastics pipes. In this perspective, we outlinesimple calculations and magnitude orders associated to themigration of an ubiquitous antioxidant, such as Irganox 1076,into a typical dairy product packed in a HDPE bottle. Fromtoxicological data, the maximum concentration authorized infood or food simulant, so-called specific migration limit, is setto 6 mg ·kg-1 (equivalently 6 mg ·L-1 for a mainly aqueousproduct) by the EU regulation 2002/72/EC. In agreement withEU regulation 2007/19/EC,19 the migration value can beestimated in ethanol 50% as an overestimate of the truemigration in a real dairy product. According to Figure 12c, Ki,F/P
is expected to be close to 10-3, which corresponds to an apparentpartition coefficient Ki,F/P
app ) 3.3 × 10⁻³ via eq 1 for acrystallinity of 70%. By considering a volume ratio betweenthe packaging material and the food product of about LP/F )1/60 (e.g., bottle of 500 cm3, and 10 cm high and consisting in0.1 mm thick) and a likely concentration in additive Ci,P|t)0 )103 mg ·L-1, the mass balance defined in eq 13, predicts a
Figure 11. Comparisons between predicted (via eq 2) and experimentalpartition coefficients, Ki,F/P, between F ) alcohols and P ) amorphousregions of polyethylene: (a) F ) methanol, (b) F ) isopropanol, (c) F )ethanol. Symbols are centered on published values. Corresponding confi-dence intervals are plotted as horizontal lines and are calculated with eq 1.They are therefore nonsymmetric, and they account for uncertainties ofextraction yields and fraction of the initial i content, which do not participateto the apparent equilibrium. 1: decanea,b; 2: dodecanea,b; 3: tetradecanea,b;4: hexadecanea,b; 5: octadecanea,b; 6: cosaneb; 7: docosaneb; 8: tetracosaneb;9: octacosaneb; R: dodecanolb; �: tetradecanolb; γ: hexadecanolb; δ:octadecanolb; a: camphora; b: diphenyl oxidea; c: diphenylmethanea; d:D-limonenea; e: DL-menthola; f: eugenola; g: isoamyl acetatea; h: linalylacetatea; j: phenylethyl alcohola; A: BHTb; B: Chimassorb 81c,d; C:erucamidec,d; D: Irgafos 168c,d; E: Irganox 1035c,d; F: Irganox 1076b,d; G:Irganox 245c,d; H: Irganox 3114c,d; J: Irganox PS802c,d; K: stearic acidc,d;L: Tinuvin 326c,d. aExperimental values in methanol and ethanol from Baneret al. at 298 K.17 bExperimental values in methanol and ethanol from Vitracet al. at 313 K.26 cExperimental values in ethanol 95% at 313 K, generatedby this study. dExperimental values in isopropanol at 313 K, generated bythis study.
N Ind. Eng. Chem. Res., Vol. xxx, No. xx, XXXX
889
890
891
892
893
894
895
896
897
898
899
900
901
902
903
904
905
906
907
908
909
910
911
912
913
914
915
916
917
918
919
920
921
922
923
924
925
926
927
928
929
930
931
932
933
934
935
936
937
938
939
940
941
942
943
944
945
946
947
948
949
950
951
952
953
954
955
956
957
958
959
960
961
962
963
964
965
966
F12
ohio2/yie-yie/yie-yie/yie99907/yie6548d07z xppws 23:ver.3 6/12/10 5:47 Msc: ie-2009-010595 TEID: men00 BATID: 00000
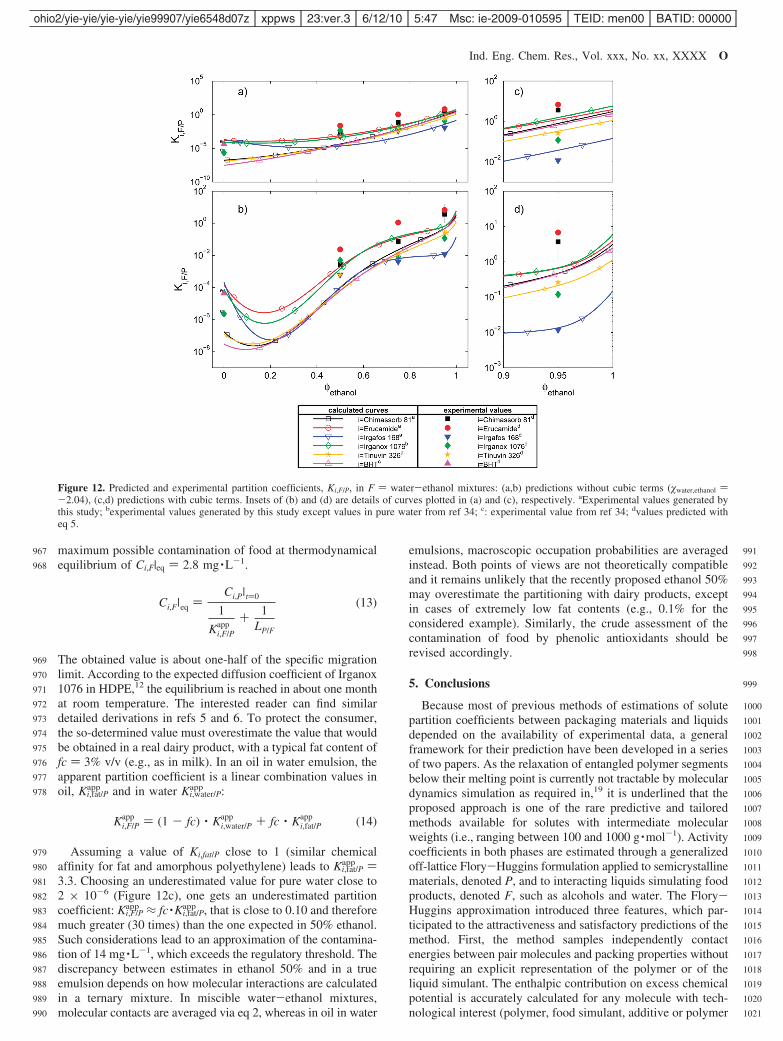
maximum possible contamination of food at thermodynamicalequilibrium of Ci,F|eq ) 2.8 mg ·L-1.
The obtained value is about one-half of the specific migrationlimit. According to the expected diffusion coefficient of Irganox1076 in HDPE,12 the equilibrium is reached in about one monthat room temperature. The interested reader can find similardetailed derivations in refs 5 and 6. To protect the consumer,the so-determined value must overestimate the value that wouldbe obtained in a real dairy product, with a typical fat content offc ) 3% v/v (e.g., as in milk). In an oil in water emulsion, theapparent partition coefficient is a linear combination values inoil, Ki,fat/P
app and in water Ki,water/Papp :
Assuming a value of Ki,fat/P close to 1 (similar chemicalaffinity for fat and amorphous polyethylene) leads to Ki,fat/P
app )3.3. Choosing an underestimated value for pure water close to2 × 10-6 (Figure 12c), one gets an underestimated partitioncoefficient: Ki,F/P
app ≈ fc ·Ki,fat/Papp , that is close to 0.10 and therefore
much greater (30 times) than the one expected in 50% ethanol.Such considerations lead to an approximation of the contamina-tion of 14 mg ·L-1, which exceeds the regulatory threshold. Thediscrepancy between estimates in ethanol 50% and in a trueemulsion depends on how molecular interactions are calculatedin a ternary mixture. In miscible water-ethanol mixtures,molecular contacts are averaged via eq 2, whereas in oil in water
emulsions, macroscopic occupation probabilities are averagedinstead. Both points of views are not theoretically compatibleand it remains unlikely that the recently proposed ethanol 50%may overestimate the partitioning with dairy products, exceptin cases of extremely low fat contents (e.g., 0.1% for theconsidered example). Similarly, the crude assessment of thecontamination of food by phenolic antioxidants should berevised accordingly.
5. Conclusions
Because most of previous methods of estimations of solutepartition coefficients between packaging materials and liquidsdepended on the availability of experimental data, a generalframework for their prediction have been developed in a seriesof two papers. As the relaxation of entangled polymer segmentsbelow their melting point is currently not tractable by moleculardynamics simulation as required in,19 it is underlined that theproposed approach is one of the rare predictive and tailoredmethods available for solutes with intermediate molecularweights (i.e., ranging between 100 and 1000 g ·mol-1). Activitycoefficients in both phases are estimated through a generalizedoff-lattice Flory-Huggins formulation applied to semicrystallinematerials, denoted P, and to interacting liquids simulating foodproducts, denoted F, such as alcohols and water. The Flory-Huggins approximation introduced three features, which par-ticipated to the attractiveness and satisfactory predictions of themethod. First, the method samples independently contactenergies between pair molecules and packing properties withoutrequiring an explicit representation of the polymer or of theliquid simulant. The enthalpic contribution on excess chemicalpotential is accurately calculated for any molecule with tech-nological interest (polymer, food simulant, additive or polymer
Figure 12. Predicted and experimental partition coefficients, Ki,F/P, in F ) water-ethanol mixtures: (a,b) predictions without cubic terms (�water,ethanol )-2.04), (c,d) predictions with cubic terms. Insets of (b) and (d) are details of curves plotted in (a) and (c), respectively. aExperimental values generated bythis study; bexperimental values generated by this study except values in pure water from ref 34; c: experimental value from ref 34; dvalues predicted witheq 5.
Ci,F|eq )Ci,P|t)0
1
Ki,F/Papp
+ 1LP/F
(13)
Ki,F/Papp ) (1 - fc) · Ki,water/P
app + fc · Ki,fat/Papp (14)
Ind. Eng. Chem. Res., Vol. xxx, No. xx, XXXX O
967
968
969
970
971
972
973
974
975
976
977
978
979
980
981
982
983
984
985
986
987
988
989
990
991
992
993
994
995
996
997
998
999
1000
1001
1002
1003
1004
1005
1006
1007
1008
1009
1010
1011
1012
1013
1014
1015
1016
1017
1018
1019
1020
1021
ohio2/yie-yie/yie-yie/yie99907/yie6548d07z xppws 23:ver.3 6/12/10 5:47 Msc: ie-2009-010595 TEID: men00 BATID: 00000
residue) with an atomistic ab initio forcefield. Combined witha Monte Carlo sampling of both conformation and configura-tional spaces at atomistic scale, the nonpositional entropiccontribution is naturally incorporated within the formulation.The enthalpic contribution is derived without additional costfor any close temperature (ca. ( 20 °C) by reweighting thesampled distribution with the corresponding Boltzmann factor.Second, the excess translational entropy, which was falselyneglected in previous studies applied to smaller solutes, isderived independently from geometrical considerations. Finally,the same mutlti-scale theory, combining atomistic scale calcula-tions and coarse-grained approximations, can be applied indif-ferently to binary and ternary mixtures at solute infinite dilution.In well-characterized liquid mixtures (e.g., water-ethanolmixtures), excess solute chemical potential contributions internary mixtures can be straightforward extrapolated from theones obtained in binary mixtures without repeating the samplingprocedure.
The application to bulky and flexible solutes showed howeverthat refinements or extensions were required to apply theproposed off-lattice Flory-Huggins approach to migrants orig-inating from food contact materials such as oligomers or plasticadditives. The main difficulties arose from the sampling ofinteractions between molecules highly different in size and inshape. The configuration space was in addition significantlyaugmented by the presence of flexible molecules. Because thebiases associated to the independent sampling of pair contactenergies were analyzed in the first paper, this work focused ontwo specific extensions to increase mainly the accuracy and therobustness of predictions of partitioning with polar simulants.To validate introduced sophistications and assumptions, long-term isobaric molecular dynamics in F was used to provideconformers ensemble for flexible solutes, reference radialdistributions and partial molar volumes. Independent validationwas achieved by comparing with experimental values availablein the literature and by values generated by this study.
The first extension was devoted to improve the accuracy ofthe estimate of the size of cavity required to insert a large solutein F. In our previous work, the volume for the insertion ofalkanes was guessed to be close to their hardcore volumeswhereas it was envisioned close to or greater than their molarvolumes for large hindered molecules. Isobaric MD simulationsconfirmed previous allegations by showing that differentscenarios should be applied for flexible and stiff molecules. Inaddition, the volumes were found to be larger in water than inalcohols. To maintain the calculations tractable for a wide rangeof substances, a reliable estimate was proposed as the volumeenclosed within the surface accessible to hydrogen atoms. Sucha volume was shown to be almost independent of the consideredconformational space (conformation in a gas phase or in acondensed phase) for most of tested solutes. In addition, pairdistribution functions extracted from MD snapshots demon-strated that the local structure of liquid F molecules around largeand flexible solutes were significantly modified so that anequivalent cell of liquid could be occupied by both solute atomsand F atoms. Our mean field approximation of the translationalentropy was modified accordingly to account for the fractionalnumber of F molecules overlapping the solute cavity. Thecorrection was highly nonlinear: significant in methanol and/orfor large alkyls chains involving more than 16 carbons.
The second extension was less natural as it involved anintrinsic limitation of the Flory-Huggins approximation evenwhen interactions were sampled at atomistic scale. Cooperativehydrogen bonding observed between more than two molecules
of water could not be sampled by pair interactions. Indeed, onthe contrary to alcohols, the number of neighbors around onewater molecule and related contact energies were correlatedquantities. The ensemble average operator was modified ac-cordingly to include the expected long lifetime tetrahedralcoordination of liquid water at room temperature. This formalextension opened the way to the prediction of partitioning inwater and in ethanol-water mixtures. In particular, it was foundthat a highly non linear variation of ln Ki,F/Pshould be expectedwith the fraction of ethanol. Such a behavior was related to thehighly nonideal behavior of water-ethanol mixtures. To preventadditional artifacts, measured enthalpies of mixing of binarywater-ethanol mixtures were introduced. A similar treatmentcould be envisioned for other mixtures used as food simulants,such as ethyl acetate - isopropanol proposed as a substitute ofolive oil.
As this work was initially motivated by the development ofpredictive methodologies to assess the contamination of foodproducts by substances originating from plastic materials incontact, several technical recommendations were suggested tohelp the development of rapid screening methods in theperspective of sanitary surveys or regulatory issues. Futureworks will be focused on the validation of the current approachto other polymers (glassy polymers, copolymers, adhesives...)and to generate the first database of calculated activity coef-ficients and corresponding activity energies for plastic additivesand residues.
Acknowledgment
We thank ACTIA and ANRT for their financial support. Wealso thank CTCPA for their technical help in assessing newexperimental partition coefficients and Herve Perrier-Cambyfrom the Institut National des Sciences Appliquees in Lyon forprocessing the films.
List of Symbols
Roman symbolsA,any molecule with a seed roleB,any molecule with a contact roleC(r),criterion defined in eq 11Ci,k|eq,macroscopic concentration at equilibrium of solute i in k )
F,P as experimentally assessed (kg ·m-3)Ci,F|eq,concentration of solute i in liquid F at equilibrium (kg ·m-3)Ci,P|eq
a ,concentration of solute i in the amorphous phase of polymerP at equilibrium (kg ·m-3)
Ci,P|t)0,initial concentration of solute i in polymer P (i.e., beforecontact with L) (kg ·m-3)
Ki,F/P,partition coefficient of solute i between F and the amorphousregion of P
Ki,F/Papp ,apparent partition coefficient of solute i between F and P
F,liquid (food simulant)Fk,component k ) 1,2 of mixture F. F1 and F2 were respectively
chosen to be related to water and ethanolLP/F,volume ratio between P and FP,polymerPMFF neighboring i,excess equivalent potential mean force to insert a
F molecule close to iR,universal gas constant (8.31 m2 ·kg · s-2 ·K-1 ·mol-1)T,absolute temperature (K)Ubias|ε,weighting function of sampled pair contact energies εVF+i,volume of equilibrated cells containing F and i molecules (m3)Vi,partial specific volume solute i (m3)Vi
VdW,van der Waals volume of solute i (m3)
P Ind. Eng. Chem. Res., Vol. xxx, No. xx, XXXX
1022
1023
1024
1025
1026
1027
1028
1029
1030
1031
1032
1033
1034
1035
1036
1037
1038
1039
1040
1041
1042
1043
1044
1045
1046
1047
1048
1049
1050
1051
1052
1053
1054
1055
1056
1057
1058
1059
1060
1061
1062
1063
1064
1065
1066
1067
1068
1069
1070
1071
1072
1073
1074
1075
1076
1077
1078
1079
1080
1081
1082
1083
1084
1085
1086
1087
1088
1089
1090
1091
1092
1093
1094
1095
1096
1097
1098
1099
1100
1101
1102
1103
1104
1105
1106
1107
1108
1109
1110
1111
1112
1113
1114
1115
1116
1117
1118
1119
1120
1121
1122
1123
1124
1125
1126
1127
1128
1129
1130
1131
1132
1133
1134
1135
1136
1137
1138
1139
1140
1141
1142
1143
1144
1145
1146
ohio2/yie-yie/yie-yie/yie99907/yie6548d07z xppws 23:ver.3 6/12/10 5:47 Msc: ie-2009-010595 TEID: men00 BATID: 00000
VkM,molar volume of k ) i,F (m3)
Vi,kP ,partial molar volume of i in k ) F,F1,F2 (m3)
VkP,partial molar volume of k ) F1,F2 (m3)
ViH,volume of solute i accessible to protons (m3)
ai,extraction yield of solute i from polymer P (-).bi,relative amount of solute i, which is not “well-dispersed” in
polymer P (-)c,polymer crystallinity (volume fraction of crystalline phase).fc,fat content expressed in volume fraction of F (-)gF,k(r),density in F molecules around k molecules (molecules ·m3)hk,fraction of volume fraction of solute i and simulant F2 defined
as hk ) φk/(φi + φF2)kB,Boltzmann’s constant (1.38 × 10⁻²³ J ·K-1)i,solute index.nF neighboring i
overlap ,fractional number of F molecules overlapping ink,number of molecules of k ) i,Fp,pressure (Pa).pA+B(ε),distribution of contact energies between A and Bri,k-1,number of k ) F,F1,F2 molecules to be rearranged when the
solute i was displacedxethanol,molar fraction of ethanolzj+k,coordination number of the arrangement when j ) A,F,F1,F2,P,i
is surrounded by molecules k ) B,F,F1,F2,P,I (J ·mol-1)
Greek symbolsγi,kV ,activity coefficient of solute i in k ) F, F1+F2,P
∆Hwater+ethanolm ,molar heat of mixing of water and ethanol
εj+k,contact energy associated to the contact(s) between a moleculej ) A,F,F1,F2,P,i and a molecule k ) B,F,F1,F2,P,i (J ·mol-1)
φk,volume fraction of k ) i,F1,F2
�k,j,Flory-Huggins parameter between k ) i,F1 and j )F,F1,F2,F1+F2,P
�i,F1,F2,ternary Flory-Huggins parameter between i, F1 and F2
Mathematical Operators⟨⟩,averaging on the sampled configurational space⟨⟩T,Boltzmann-weighted ensemble averaging on the sampled con-
figurational space.
Literature Cited
(1) European Community. Regulation (EC) No. 1935/2004 of theEuropean Parliament and of the Council of 27 October 2004 on materialsand articles intended to come into contact with food and repealing Directives80/590/EEC and 89/109/EEC. Off. J. Eur. Union 2004, L338, 4-17.
(2) European Community. Commission Directive 2002/72/EC of 6August 2002 relating to plastic materials and articles intended to come intocontact with foodstuffs. Off. J. Eur. Communities 2002, L220, 18-58.
(3) European Commission. Substances listed in EU directives on plasticsin contact with food. http://ec.europa.eu/food/food/chemicalsafety/foodcontact/eu_substances_en.pdf; 2008.
(4) European Community. Regulation (EC) No. 1907/2006 of theEuropean Parliament and of the Council of 18 December 2006 concerningthe Registration, Evaluation, Authorization and Restriction of Chemicals(REACH), establishing a European Chemicals Agency, amending Directive1999/45/EC and repealing Council Regulation (EEC) No. 793/93 andCommission Regulation (EC) No. 1488/94 as well as Council Directive76/769/EEC and Commission Directives 91/155/EEC, 93/67/EEC, 93/105/EC, and 2000/21/EC. Off. J. Eur. Union 2006, L396, 1-849.
(5) Vitrac, O.; Hayert, M. Design of Safe Packaging Materials UnderUncertainty. In New Trends Chemical Engineering Research; Berton, L. P.,Ed.; Nova Science: New York, 2007; pp 251-292.
(6) Vitrac, O.; Hayert, M. Risk Assessment of Migration from PackagingMaterials into Foodstuffs. AIChE J. 2005, 51, 1080–1095.
(7) Vitrac, O.; Challe, B.; Leblanc, J.-C; Feigenbaum, A. Contaminationof Packaged Food by Substances Migrating from a Direct-Contact PlasticLayer: Assessment Using a Generic Quantitative Household Scale Meth-odology. Food Addit. Contam. 2007, 24, 75–94.
(8) Vitrac, O.; Leblanc, J.-C. Exposure of Consumers to PlasticPackaging Materials: Assessment of the Contribution of Styrene fromYoghurt Pots. Food Addit. Contam. 2007, 24, 194–215.
(9) Begley, T.; Castle, L.; Feigenbaum, A.; Franz, R.; Hirinchs, K.;Lickly, T.; Mercea, P.; Milana, M.; O’Brien, A.; Rebre, S.; Rijk, R.; Piringer,O. Evaluation of Migration Models that Might be Used in Support ofRegulation for Food-Contact Plastics. Food Addit. Contam. 2005, 22, 73–90.
(10) Reynier, A.; Dole, P.; Feigenbaum, A.; Humbel, S. DiffusionCoefficients of Additives in Polymers. I. Correlation with GeometricParameters. J. Appl. Polym. Sci. 2001, 82, 2422–2433.
(11) Reynier, A.; Dole, P.; Feigenbaum, A.; Humbel, S. DiffusionCoefficients of Additives in Polyolefins. II. Effect of Swelling andTemperature on the D ) f(M) Correlation. J. Appl. Polym. Sci. 2001, 82,2434–2443.
(12) Vitrac, O.; Lezervant, J.; Feigenbaum, A. Application of DecisionTrees to the Robust Estimation of Diffusion Coefficients in Polyolefines.J. Appl. Polym. Sci. 2006, 101, 2167–2186.
(13) Vitrac, O.; Hayert, M. Effect of the Distribution of Sorption Siteson Transport Diffusivities: a Contribution to the Transport of Medium-Weight-Molecules in Polymeric Materials. Chem. Eng. Sci. 2007, 62, 2503–2521, 9.
(14) European Commission. Food contact materials. A practical guidefor users of European directives. http://ec.europa.eu/food/food/chemicalsafety/foodcontact/practical_guide_en.pdf (accessed September 2008).
(15) Burman, L.; Albertsson, A.-C.; Hoglund, A. Solid-phase Microex-traction for Qualitative and Quantitative Determination of MigratedDegradation Products of Antioxydants in an Organic Aqueous Solution.J. Chromatogr., A 2005, 1080, 107–116.
(16) Piringer, O. G.; Baner, A. L. Partition Coefficients. In PlasticPackaging. Interactions with Food and Pharmaceuticals, 2nd ed.; Wiley-VCH: Weinheim, 2008; pp 89-121.
(17) Baner, A. L.; Piringer, O. G. Prediction of Solute PartitionCoefficients between Polyolefins and Alcohols using the Regular SolutionTheory and Group Contribution Methods. Ind. Eng. Chem. Res. 1991, 30,1506–1515.
(18) Letcher, T. M. DeVelopments and Applications in Solubility; RoyalSociety of Chemistry: London, 2007.
(19) Panagiotopoulos, A. Z. Direct Simulation of Fluid Phase Equilibriaby Simulation in the Gibbs Ensemble: A Review. Mol. Simul. 1992, 9, 1–23.
(20) Van der Vegt, F. F. A.; Briels, W. J. Efficient Sampling of SolventFree Energies in Polymers. J. Chem. Phys. 1998, 109, 7578–7582.
(21) Widom, B. Some Topics in the Theory of Fluids. J. Chem. Phys.1963, 39, 2808–2812.
(22) Boulougouris, G. C.; Economou, I. G.; Theodorou, D. N. Calcula-tion of the Chemical Potential of Chain Molecules Using the Staged ParticleDeletion Scheme. J. Chem. Phys. 2001, 115, 8231–8237.
(23) Hess, B.; Peter, C.; Ozal, T.; van der Vegt, N. F. A. Fast-GrowthThermodynamic Integration: Calculating Excess Chemical Potentials ofAdditive Molecules in Polymer Structures Macromolecules. 2008, 41, 2283–2289.
(24) Ozal, T.; Peter, C.; Hess, B.; van der Vegt, N. F. A. ModelingSolubilities of Additives in Polymer Microstructures: Single-Step Perturba-tion Method Based on a Soft-Cavity Reference State. Macromolecules 2008,41, 5055–5061.
(25) Gillet, G.; Vitrac, O.; Desobry, S. Prediction of Solute PartitionCoefficients between Polyolefins and Alcohols using a Generalized Flory-Huggins Approach. Ind. Eng. Chem. Res. 2009, 48, 5285–5301.
(26) European Community. Commission directive 2007/19/EC amendingDirective 2002/72/EC relating to plastic materials and articles intended tocome into contact with food and Council Directive 85/572/EEC laying downthe list of simulants to be used for testing migration of constituents of plasticmaterials and articles intended to come into contact with foodstuffs. Off. J.Eur. Union. 2007; Vol. L97, pp 50-69.
(27) Bagnati, R.; Blanchi, G.; Marangin, E.; Zuccato, E.; Fanelli, R.;Davoli, E. Direct Analysis of Isopropylthioxanthone (ITX) in Milk by High-Performance Liquid Chromatography/Tandem Mass Spectrometry. RapidCommun. Mass Spectrom. 2007, 21, 1998–2002.
(28) Sun, C.; Chan, S. H.; Lu, D.; Lee, H. M. W.; Bloodworth, B. C.Determination of isopropyl-9H-thioxanthen-9-one in Packaged Beveragesby Solid-Phase Extraction Clean-Up and Liquid Chromatography withTandem Mass Spectrometry Detection. J. Chromatogr., A. 2007, 1143, 162–167.
(29) Saiz, L.; Padro, J. A.; Guardia, E. Dynamics and Hydrogen Bondingin Liquid Ethanol. Mol. Phys. 1999, 97, 897–905.
(30) Jorgensed, W. L. Transferable Intermolecular Potential Functionsfor Water, Alcohols, and Ethers. Application to Liquid Water. J. Am. Chem.Soc. 1981, 103, 335–340.
(31) Mahoney, M. W.; Jorgensen, W. L. A Five-Site Model for LiquidWater and the Reproduction of the Density Anomaly by Rigid, Nonpolar-izable Potential Functions. J. Chem. Phys. 2000, 112, 8910–8922.
Ind. Eng. Chem. Res., Vol. xxx, No. xx, XXXX Q
1147
1148
1149
1150
1151
1152
1153
1154
1155
1156
1157
1158
1159
1160
1161
1162
1163
1164
1165
1166
1167
1168
1169
1170
1171
1172
1173
1174
1175
1176
1177
1178
1179
1180
1181
1182
1183
118411851186118711881189119011911192119311941195119611971198119912001201120212031204120512061207120812091210121112121213
1214121512161217121812191220122112221223122412251226122712281229123012311232123312341235123612371238123912401241124212431244124512461247124812491250125112521253125412551256125712581259126012611262126312641265126612671268126912701271127212731274127512761277127812791280128112821283128412851286128712881289129012911292
ohio2/yie-yie/yie-yie/yie99907/yie6548d07z xppws 23:ver.3 6/12/10 5:47 Msc: ie-2009-010595 TEID: men00 BATID: 00000
(32) Mahoney, M. W.; Jorgensen, W. L. Diffusion Constant of the TIP5PModel of Liquid Water. J. Chem. Phys. 2001, 114, 363–366.
(33) Vitrac, O.; Mougharbel, A.; Feigenbaum, A. Interfacial MassTransport Properties Which Control the Migration of Packaging Constituentsinto Foodstuffs. J. Food Eng. 2007, 79, 1048–1064.
(34) Gandek, T. P.; Alan Hatton, T.; Reaid, R. C. Batch Extraction withReaction: Phenolic Antioxidant Migration from Polyolefins to Water. 2.Experimental Results and Discussion. Ind. Eng. Chem. Res. 1989, 28, 1036–1045.
(35) Vitrac, O.; Lezervant, J.; Feigenbaum, A. Application of DecisionTrees to the Robust Estimation of Diffusion Coefficients in Polyolefins.J. Appl. Polym. Sci. 2006, 101, 2167–2186.
(36) Flory, P. J. Thermodynamics of high polymer solutions. J. Chem.Phys. 1941, 9, 660–661.
(37) Huggins, M. L. Theory of Solutions of High Polymers. J. Am. Chem.Soc. 1942, 64, 1712–1719.
(38) Flory, P. J. Thermodynamics of High Polymer Solutions. J. Chem.Phys. 1942, 10, 51–61.
(39) Huggins, M. L. Derivation of Molecular Relaxation Parameters ofan Isomeric Relaxation. J. Chem. Phys. 1942, 46, 151–153.
(40) Neyertz, S. Tutorial: Molecular Dynamics Simulations of Micro-structure and Transport Phenomena in Glassy Polymers. Soft Mater. 2006,4, 15–83.
(41) Vitrac, O; Gillet, G. An Off-Lattice Flory-Huggins Approach ofthe Partitioning of Bulky Solutes between Polymers and Interacting Liquids.Int. J. Chem. Reactor Eng. 2010, A6, 1–32.
(42) Flory, P. J. Principles of Polymer Chemistry; Cornell University:Ithaca, 1953.
(43) Pouchly, J.; Zivny, A.; Solc, K. Thermodynamics Equilibrium inthe System Macromolecular Coil-Binary Solvent. J. Polym. Sci., Part C:Polym. Lett. Polym. Symp. 1968, 23, 245–256.
(44) Young, T.-H.; Chuang, W.-Y. Thermodynamic Analysis on theCononsolvency of Poly(vinyl alcohol) in Water-DMSO Mixtures throughthe Ternary Interaction Parameter. J. Membr. Sci. 2002, 210, 349–359.
(45) Boyne, J. A.; Williamson, A. G. Enthalpies of Mixing of Ethanoland Water at 25°C. J. Chem. Eng. Data 1967, 12, 318.
(46) Lide, D. R., Ed. CRC Handbook of Chemistry and Physics; CRC:Boca Raton, 2005; pp15-41.
(47) Cruzan, J. D.; Braly, L. B.; Liu, K; Brown, M. G.; Loeser, J. G.;Saykally, R. J. Quantifying Hydrogen Bond Cooperativity in Water: VRTSpectroscopy of the Water Tetramer. Science 1996, 271, 59–62.
(48) Keutsch, F. N.; Saykally, R. J. Water clusters: Untangling theMysteries of the Liquid, one Molecule at a Time. Proc. Natl. Acad. Sci.U.S.A. 2001, 98, 10533–10540.
(49) Yang, J.; Peng, C.; Liu, H.; Hu, Y.; Jiang, J. A Generic MolecularThermodynamic Model for Linear and Branched Polymer Solutions in aLattice. Fluid Phase Equilib. 2006, 244, 188–192.
(50) Coulier, L.; Kaal, E. R.; Tienstra, M.; Hankemeier, Th. Identificationand Quantification of (Polymeric) Hindered-Amine Light Stabilizers inPolymers using Pyrolysis-Gas Chromatography-Mass Spectrometry andLiquid Chromatography-Ultraviolet Absorbance Detection-Evaporative LightScattering Detection. J. Chromatogr., A 2005, 1062, 227–238.
(51) Garrido-Lopez, A.; Tena, M. T. Experimental Design Approachfor the Optimisation of Pressurised Fluid Extraction of Additives fromPolyethylene Films. J. Chromatogr., A 2005, 1099, 75–83.
(52) Fried, J. R. Computational Parameters. In Physical Properties ofPolymers Handbook, 2nd ed.; Mark, J. E., Ed.; Springer: Berlin, 2006; pp59-82.
(53) Rigby, D. Fluid Density Predictions using the COMPASS ForceField. Fluid Phase Equilib. 2004, 217, 77–87.
ReceiVed for reView July 6, 2009ReVised manuscript receiVed May 3, 2010
Accepted June 4, 2010
IE9010595
R Ind. Eng. Chem. Res., Vol. xxx, No. xx, XXXX
1293129412951296129712981299130013011302130313041305130613071308130913101311131213131314131513161317131813191320132113221323132413251326
1327132813291330
133113321333
133413351336
133713381339
13401341134213431344
134513461347134813491350
13511352
135313541355
1356
PAGE EST: 17.4
ohio2/yie-yie/yie-yie/yie99907/yie6548d07z xppws 23:ver.3 6/12/10 5:47 Msc: ie-2009-010595 TEID: men00 BATID: 00000