Embed Size (px)
Citation preview

1
Prediction of metabolic pathways to produce naringenin from the
organisms involved in the fermentation of cocoa and synthesis of value-
added compounds
Lina Suárez Medina1, Andrés González Barrios2
Master's Degree in Chemical Engineering, Chemical Engineering Department, Universidad de los Andes [email protected], [email protected]
2019-05-30
___________________________________________________________________________________________________________
Abstract
Due to the growing interest in beneficial health products, such as functional foods, dietary supplements, and nutraceuticals, various
techniques and methods have been developed to obtain products with nutritional and pharmaceutical components that contribute to
consumer health. It is known that cocoa beans contain high levels of polyphenols, which are mostly present in the form of flavonoids,
recognized for their antioxidant capacity and health benefits. The fermentation of cocoa is a critical process in the synthesis of the
organoleptic and nutritional characteristics of chocolate, being derived from polyphenols such as flavonoids. Based on this, the interest
in knowing the metabolic pathways for the generation of flavonoids and added value novel products from fermentation, aiming to give
an added value to the derivatives of chocolate and why not, to the design of new products with high health benefits. In order to predict
a set of alternative metabolic pathways to produce the flavonoid precursor naringenin from the amino acids L-tyrosine and L-
phenylalanine, the OptStoic algorithm was performed. Two metabolic pathways were obtained for naringenin flavonoid production,
one per amino acid, encoded by the genes PAL / TAL, 4CL, CHI, CHS from L-tyrosine and the C4H gene additional to the previous
ones from L-phenylalanine. The FBA was performed to analyze the metabolic capacities of E. coli to produce naringenin by
incorporating the non-native path predicted using the strain E. coli ATCC 8739, obtaining a growth of 0.8616 mmol/gDW-1*h-1 and flux
of naringenin production of 0.1231 mmol/gDW-1*h-1 Finally, an OptKnock analysis was carried out with which the set of knockout
reactions was obtained to improve flavonoid production composed of CITL and MALS, generating a biomass growth of 0.887
mmol/gDW-1*h-1 and a naringenin production coupled to the growth of 0.1267 mmol/gDW-1*h-1. Since naringenin is a commercially
available compound, the chemical synthesis of its apiforol derivative was carried out and its antioxidant activity was checked through
the FRAP method.
Keywords: Metabolic pathways, nutraceutical, cocoa fermentation, algorithm, naringenin, apiforol. _________________________________________________________________________________________________________________________
Introduction Theobroma cacao is a plant native from South
America1 From this plant, the raw material for the
production of chocolate is obtained, which is composed
of the seeds inside the cocoa fruits2. A crucial process for
the correct formation of the precursors of cocoa flavor,
amino acids, and the short-chain peptides, which favor
the biochemical changes within the grains, is
fermentation2–4. The overall result of this process has a
profound impact on the color and flavor potential of the
beans5, being key in the determines final cocoa quality6.
Currently, the offer of added valued products
focuses on improving human health, has encouraged the
food industry to research and generate beneficial foods,
exalting their properties nutritional and pharmaceutical,
as is the case of functional foods, dietetic supplements,
and nutraceutical7. Among the nutraceuticals are
antioxidants such as vitamins C and E, phenolic
compounds such as flavonoids, saponins, fatty acids,
phospholipids in others8. From this point of view, cocoa
is very important, due to its high content of polyphenols,
which are related to the organoleptic characteristics and
the nutritional value of the final product. Previously,
high amounts of flavonoids have been found in cocoa,
mainly (−)-epicatechin (EC), (+)–catechin (C), and their
dimers procyanidin B2 (PB2) and B1 (PB1), which have
been reported effects on many important biological
functions in vitro and in vivo, due to their antioxidant,
anti-free radical and antiplatelet impacts. Furthermore,
they are able to modulate the immune response, anti-
inflammatory, anti-diabetic and anti-carcinogenic
properties9.
An interesting compound found in the
Theobroma cacao genome reported in the KEGG
database is the naringenin flavonoid. Naringenin has
been reported as a natural compound that has many
effects on human health, as agent normolipidemic,
inhibitor and activator of important enzymes in the
oxidation and synthesis fatty acids (Goldwasser, Cohen,
Yang, Balaguer, Yarmush, 2010). It also has been
shown effects in decreasing Hepatitis C virus (HCV) in
sick rats11. This has antioxidant, anti-inflammatory,
antiproliferative and antimutagenic properties, and it is
suggested as an active chemoprotector12, it fights liver,
coronary and obesity diseases and serves as a treatment
for the dengue virus 13. Naringenin is commercially
available in several forms, as a nutritional supplement,
however, the compound derived from this, flavan-4-ol
2
apiforol, obtained by the action of the enzyme flavanone
4-reductase, is a compound that is currently not
commercialized and which, in turn, it has been reported
as beneficial for health. This compound can be obtained
through a reduction reaction with sodium borohydride,
where the ketone group from naringenin is reduced to
alcohol group forming apiforol. Also, apiforol showed a
significant α-glucosidase inhibitory activity so that it can
be considered as a potent antidiabetic agent as it
exhibited a reduction in the postprandial hyperglycemia,
by inhibiting the digestive enzymes and enhancing the
uptake of glucose by the cells14. For this reason, apiforol
is a promising and high impact compound.
With advances in DNA sequencing and
recombinant DNA technology, many biosynthetic
pathways responsible to produce valuable compounds
have been elucidated, offering the opportunity for
functional integration of biosynthetic pathways into
suitable microorganisms, such as Escherichia coli or
Saccharomyces cerevisiae. Through metabolic
engineering, we can modify the metabolic profiles
according to the purposes of individual production and
heterologous expression of the complete pathways of
plants to confer the ability to synthesize natural products
derived from plants, as is the case of naringenin and the
apiforol15. The central structure of the flavonoids was
derived directly from the amino acids L-phenylalanine
and L-tyrosine, through the elimination of a non-
oxidative amino group by a phenylalanine amino-lyase
(PAL) or a tyrosine-amino-lyase (TAL) respectively,
generating access to various flavonoid precursors15. This
is the case of the flavonoid precursor, naringenin.
Recently, an economic process has been
developed without the use of precursor amino acids for
the microbial production of naringenin from glucose16.
This was achieved through the introduction of a
heterologous pathway, consisting of chalcone synthase
(CHS), tyrosine-amino-lyase (TAL) maximized by
codons, 4-coumaroyl-coa (4CL) and chalcone
isomerase (CHI), in E. Coli strains designed to produce
L-tyrosine. These strains were able to produce 29 mg/L
of naringenin from glucose and 84 mg/l of naringenin
from glucose when the enzymes involved in fatty acid
biosynthesis were further suppressed.
Based on technological advances and the need to
predict and design new metabolic pathways, in order to
obtain new useful products for industry and human
development, several studies of design and development
of bioinformatics tools have been developed with the
help of the systems biology, with the aim of creating
algorithms capable of predicting metabolic pathways
based on their topology (length analysis), the metabolic
efficiency of the host organism, energy costs, genetic
loads17, COnstraint-Based Reconstruction and Analysis
(COBRA)18, making it possible to approach the design
of pathways from the quantitative and functional point
of view, obtaining results of cellular metabolisms that
have successfully predicted the production of several
compounds18. In addition, the use of synthetic tools from
systems biology allowed the regulation of genes, the
assembly of heterologous pathways and the temporal
control of gene expression.
At present, several in silico mathematical
methods have been constructed to design and predict
synthetic metabolic pathways, such as GEN-Path
(Genome-Scale-Model Predictor Pathway)18 and
FindPath17. These use Flux Balance Analysis (FBA),
steady-state, databases with information on compounds,
objective functions of biomass growth and
thermodynamic restrictions. On the other hand, OptStoic
is a conversion algorithm for overall stoichiometry and
intermediate metabolic reactions, which is based on two
steps: 1, identification of optimal general stoichiometry
of a general reaction formulated for prediction, 2,
identification of the reaction pathways that conform to
the overall stoichiometry identified in the first step19.
In this work we want to obtain de novo metabolic
pathways, enzymes and associated genes, in the process
of fermentation of cocoa seeds, for the production of the
naringenin flavonoid precursor from the amino acids L-
phenylalanine and L-tyrosine and synthesize the apiforol
compound from the naringenin.
1. Methods and materials
Obtaining metabolic pathways for naringenin
production. OptStioc was used to identify optimal
overall stoichiometry and MinFlux was used to predict
metabolic pathways adjusted to overall stoichiometry
identified by Optstoic. OptSotic formulation is a MILP
(Mixed Integer Linear Programming) or IP (Integer
Programming Problem) problem, depending on whether
the stoichiometric coefficients are declared as real or
integer variables, respectively. This formulation allows
identifies the overall stoichiometry of conversion from a
reagent A (in this case L-tyrosine and L-phenylalanine)
to a product B (naringenin), maximizing a desired yield
objective subject to overall constraints of elemental and
charge balance and thermodynamic feasibility, allowing
combinations between cofactors (co-reactive D and co-
product C), from a metabolite database and their
respective stoichiometric coefficients in the general
conversion (b, c, d).
Overall conversion equation:
𝒂𝑨 + 𝒄𝑪 → 𝒃𝑩 + 𝒅𝑫 (1)
3
Where A, B, C, and D, are the metabolites of the
reaction and a, b, c, and d, are the stoichiometric
coefficients of the metabolites, which must be positive
and not null.
The overall optimization formulation is:
𝑴𝒂𝒙𝒊𝒎𝒊𝒛𝒆 𝒁𝒑 = ∑𝑪𝒊
−𝑪𝑨𝒊∈𝑷𝑫𝑻
(2)
Subject to:
𝒏𝑩𝒒𝒃 + 𝒏𝑫𝒒𝒅 − 𝒏𝑨𝒒𝒂 − 𝒏𝑪𝒒𝒄 = 𝟎, ∀ 𝐪 ∈ 𝐐 (3)
𝒆𝑩𝒃 + 𝒆𝑫𝒅 + 𝒆𝑪𝒅 + 𝒆𝑪𝒄 = 𝟎, (4)
∆𝑮𝑩𝒇
𝒃 + ∆𝑮𝑫𝒇
𝒅 − ∆𝑮𝑪𝒇
𝒄 − ∆𝑮𝑨𝒇
𝒂 ≤ −∆𝑮𝒎𝒊𝒏 (5)
𝒉(𝒂, 𝒃, 𝒄, 𝒅) = 𝟏 (6)
𝒂, 𝒃, 𝒄, 𝒅 ∈ 𝑹+/𝒁 (7)
Where i = 1... N in the set I of metabolites present
in the database and q ϵ Q is the set of elements
found in the metabolites, 𝑛𝑖𝑞 is the number of atoms of
element q in metabolite i, 𝑒𝑖 is the charge of metabolite
i, ∆𝐺𝑖𝑓
is the transformed free energy of formation (at 25
°C and 0.1 M ionic strength) of metabolite i, ∆𝐺𝑔𝑒𝑛𝑒𝑟𝑎𝑙
must be less to zero and y ∆𝐺𝑚𝑖𝑛 is the extra energy
change amount available for the stoichiometry and h is
stoichiometry of the base metabolite, which is set at a
value of 1. 𝑍𝑝 is the yield with respect to the reagent,
𝑃𝐷𝑇 is a subset of target products and 𝐶𝑖 is the
stoichiometric coefficient of metabolite i.
To run OptStoic, two metabolites databases were
constructed, one with the metabolites related with
metabolic reactions of the organisms of cocoa seeds
fermentation and other with the metabolites belong to
KEGG database, which includes net charges and
reversibility (∆𝐺𝑖𝑓) for each metabolite from Pactric20
and Metacyc21, CheBi22 and PubChem23 databases. Once
the stoichiometry and the cofactors involved in the
overall reaction have been obtained, the metabolic
pathways to contain these metabolites are identified by
minimizing the total metabolic flux through minFlux19
formulation.
Set of minimum reactions that can match the
desired overall stoichiometry is formulated with the
following linear programming problem (LP), which
minimizes the total metabolic flux of the chosen
reactions. The objective of this optimization problem is
to minimize the reaction flux, which approximates the
total enzyme load imposed on the organism. This
problem can be described mathematically as:
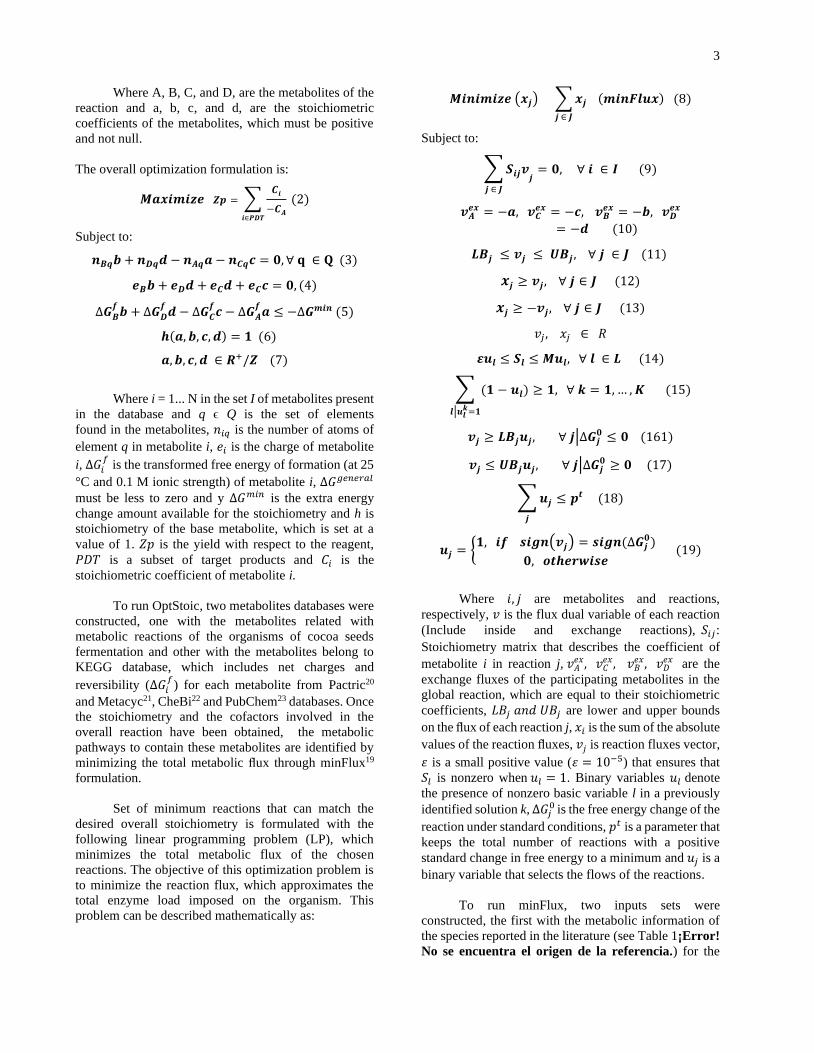
𝑴𝒊𝒏𝒊𝒎𝒊𝒛𝒆 (𝒙𝒋) ∑ 𝒙𝒋
𝒋 ∈ 𝑱
(𝒎𝒊𝒏𝑭𝒍𝒖𝒙) (8)
Subject to:
∑ 𝑺𝒊𝒋𝒗𝒋
𝒋 ∈ 𝑱
= 𝟎, ∀ 𝒊 ∈ 𝑰 (9)
𝒗𝑨𝒆𝒙 = −𝒂, 𝒗𝑪
𝒆𝒙 = −𝒄, 𝒗𝑩𝒆𝒙 = −𝒃, 𝒗𝑫
𝒆𝒙
= −𝒅 (10)
𝑳𝑩𝒋 ≤ 𝒗𝒋 ≤ 𝑼𝑩𝒋 , ∀ 𝒋 ∈ 𝑱 (11)
𝒙𝒋 ≥ 𝒗𝒋, ∀ 𝒋 ∈ 𝑱 (12)
𝒙𝒋 ≥ −𝒗𝒋, ∀ 𝒋 ∈ 𝑱 (13)
𝑣𝑗 , 𝑥𝑗 ∈ 𝑅
𝜺𝒖𝒍 ≤ 𝑺𝒍 ≤ 𝑴𝒖𝒍, ∀ 𝒍 ∈ 𝑳 (14)
∑ (𝟏 − 𝒖𝒍)
𝒍|𝒖𝒍𝒌=𝟏
≥ 𝟏, ∀ 𝒌 = 𝟏, … , 𝑲 (15)
𝒗𝒋 ≥ 𝑳𝑩𝒋𝒖𝒋, ∀ 𝒋|∆𝑮𝒋𝟎 ≤ 𝟎 (161)
𝒗𝒋 ≤ 𝑼𝑩𝒋𝒖𝒋, ∀ 𝒋|∆𝑮𝒋𝟎 ≥ 𝟎 (17)
∑ 𝒖𝒋
𝒋
≤ 𝒑𝒕 (18)
𝒖𝒋 = {𝟏, 𝒊𝒇 𝒔𝒊𝒈𝒏(𝒗𝒋) = 𝒔𝒊𝒈𝒏(∆𝑮𝒋
𝟎)
𝟎, 𝒐𝒕𝒉𝒆𝒓𝒘𝒊𝒔𝒆 (19)
Where 𝑖, 𝑗 are metabolites and reactions,
respectively, 𝑣 is the flux dual variable of each reaction
(Include inside and exchange reactions), 𝑆𝑖𝑗:
Stoichiometry matrix that describes the coefficient of
metabolite i in reaction j, 𝑣𝐴𝑒𝑥, 𝑣𝐶
𝑒𝑥, 𝑣𝐵𝑒𝑥, 𝑣𝐷
𝑒𝑥 are the
exchange fluxes of the participating metabolites in the
global reaction, which are equal to their stoichiometric
coefficients, 𝐿𝐵𝑗 𝑎𝑛𝑑 𝑈𝐵𝑗 are lower and upper bounds
on the flux of each reaction j, 𝑥𝑖 is the sum of the absolute
values of the reaction fluxes, 𝑣𝑗 is reaction fluxes vector,
𝜀 is a small positive value (𝜀 = 10−5) that ensures that
𝑆𝑙 is nonzero when 𝑢𝑙 = 1. Binary variables 𝑢𝑙 denote
the presence of nonzero basic variable l in a previously
identified solution k, ∆𝐺𝑗0
is the free energy change of the
reaction under standard conditions, 𝑝𝑡 is a parameter that
keeps the total number of reactions with a positive
standard change in free energy to a minimum and 𝑢𝑗 is a
binary variable that selects the flows of the reactions.
To run minFlux, two inputs sets were
constructed, the first with the metabolic information of
the species reported in the literature (see Table 1¡Error!
No se encuentra el origen de la referencia.) for the

4
fermentation process of cocoa seeds, including the
information Theobroma cacao plant. In these inputs,
species without a metabolic model were not used.
Additionally, the reactions involved in glycolysis, the
pentose phosphate pathway, the phenylalanine, tyrosine,
and tryptophan biosynthesis and the secondary
metabolism of the Theobroma cacao plant were
considered. Moreover, the second inputs all the
metabolic information of the KEGG database (Kyoto
Encyclopedia of Genes and Genomes)24–26 were
included.
Integration of metabolic pathways predicted
on an E. coli in silico model. Once the predicted
pathways were obtained, these were mapped using the
Escher web tool27 and a Flux Balance Analysis (FBA)
was carried out. FBA was performed to analyze the
metabolic capabilities of E. coli to produce naringenin
by incorporation of nonnative pathways predicting
through OptStoic. This algorithm was used following the
mathematical formulation reported by Savinell and
Palsson 199228. The most attractive feature of this tool is
its ability to make quantitative predictions in a network,
without the need for detailed kinetic information for its
development, only the stoichiometry of the reactions, a
defined objective biological function (production of
biomass, synthesis of metabolites, redox potential, etc.)
and growth conditions (availability of substrates)29. For
FBA, the model of the organism E. coli ATCC 8739 was
used and the execution was performed under aerobic
conditions and with a glucose uptake of -10 mmol*gDW-
1*h-1 as a carbon source. FBA can be described as follow:
𝒎𝒂𝒙𝒊𝒎𝒊𝒛𝒆 𝒁 = 𝑪𝑻𝒗𝒋 (20)
Subject to:
𝒅𝑪
𝒅𝒕= 𝑺𝒊,𝒋 ∙ 𝒗𝒋 = 𝟎 (21)
𝑳𝑩𝒋 ≤ 𝒗𝒋 ≤ 𝑼𝑩𝒋 (22)
Where 𝐶𝑇is transposed vector of the
concentrations for each species.
Improving the naringenin production in E.
coli through OptKnock analysis. Due the fact that
cellular metabolism is prepared, through natural
selection, for the maximum responsiveness to the
history of selective pressures rather than for the
overproduction of specific chemical compounds, so that
the yield of these products on several organisms are
often far below their theoretical maximums, as is the
case of production of plants products in bacterial, for
example, naringenin production. With the aim of
improving the reaction flux for naringenin production in
E. coli, an OptKnock30 analysis was carried out in
COBRA toolbox. OptKnock suggests gene knockout
strategies for biochemical overproduction while
recognizing that metabolic flux distributions are
governed by internal cellular objectives30. This tool
identifies and eliminates metabolic reactions that are
capable of decoupling cell growth from chemical
production. Involving optimization at two levels, which
considers two optimal strategists competing with each
other (i.e. the cell target and chemical production) by
identifying multiple combinations of gene deletion. In
this case, biomass formation was used as a cell target and
naringenin production as chemical production.
OptKnock can be described as:
𝒎𝒂𝒙𝒊𝒎𝒊𝒛𝒆(𝒚𝒊) 𝒗𝒄𝒉𝒆𝒎𝒊𝒄𝒂𝒍 (23)
Subject to:
𝒗𝒃𝒊𝒐𝒎𝒂𝒔𝒔 = 𝒗𝒂𝒕𝒑−𝒎𝒂𝒊𝒏 . 𝝁𝒂𝒕𝒑 + 𝒗𝒃𝒊𝒐𝒎𝒂𝒔𝒔𝒐𝒃𝒋
. 𝝁𝒃𝒊𝒐𝒎𝒂𝒔𝒔
+ 𝒗𝒈𝒍𝒄−𝒖𝒑𝒕𝒂𝒌𝒆. 𝒈𝒍𝒄 (24)
Subject to:
∑ 𝑺𝒊𝒋𝒗𝒋 = 𝟎
𝑴
𝒋=𝟏
∀𝒊 ∈ 𝑵 (25)
𝒗𝒑𝒕𝒔 + 𝒗𝒈𝒍𝒌 = 𝒗𝒈𝒍𝒄−𝒖𝒑𝒕𝒂𝒌𝒆 (26)
𝒗𝒂𝒕𝒑 ≥ 𝒗𝒂𝒕𝒑−𝒎𝒂𝒊𝒏 (27)
∑ 𝜸𝒊𝒔𝒕𝒐𝒊𝑺𝒊,𝒈𝒍𝒌
𝑵
𝒊=𝟏
+ 𝒖𝒈𝒍𝒌 + 𝒈𝒍𝒄 = 𝟎 (28)
∑ 𝜸𝒊𝒔𝒕𝒐𝒊𝑺𝒊,𝒑𝒕𝒔
𝑵
𝒊=𝟏
+ 𝒖𝒑𝒕𝒔 + 𝒈𝒍𝒄 = 𝟎 (29)
∑ 𝜸𝒊𝒔𝒕𝒐𝒊𝑺𝒊,𝒃𝒊𝒐𝒎𝒂𝒔𝒔
𝑵
𝒊=𝟏
+ 𝒖𝒃𝒊𝒐𝒎𝒂𝒔𝒔 = 𝟏 (30)
∑ 𝜸𝒊𝒔𝒕𝒐𝒊𝑺𝒊,𝒋
𝑵
𝒊=𝟏
+ 𝒖𝒋 = 𝟎, ∀𝒋 ∈ 𝝁, 𝒋 ≠ 𝒈𝒌𝒍, 𝒑𝒕𝒔, 𝒃𝒊𝒐𝒎𝒂𝒔𝒔 (31)
∑(𝟏 − 𝒚𝒋)
𝒋∈𝑴
≤ 𝑲 (32)
𝒗𝒃𝒊𝒐𝒎𝒂𝒔𝒔 ≥ 𝒗𝒃𝒊𝒐𝒎𝒂𝒔𝒔𝒐𝒃𝒋
(33)
𝒖𝒋𝒎𝒊𝒏. (𝟏 − 𝒚𝒋) ≤ 𝒖𝒋 ≤ 𝒖𝒋
𝒎𝒂𝒙. (𝟏 − 𝒚𝒋), ∀𝒋 ∈ 𝝁𝒓𝒆𝒗 𝒚 𝒋
∉ 𝝁𝒔𝒆𝒄𝒓 (34)
𝒖𝒋𝒎𝒊𝒏. (𝟏 − 𝒚𝒋) ≤ 𝒖𝒋, ∀𝒋 ∈ 𝝁𝒓𝒆𝒗 𝒚 𝝁𝒔𝒆𝒄𝒓 (35)
𝒖𝒋 ≤ 𝒖𝒋𝒎𝒂𝒙. (𝟏 − 𝒚𝒋), ∀𝒋 ∈ 𝝁𝒊𝒓𝒓𝒆𝒗 𝒚 𝒋 ∉ 𝝁𝒔𝒆𝒄𝒓 (36)
𝒖𝒋 ∈ 𝑹, ∀𝒋 ∈ 𝝁𝒊𝒓𝒓𝒆𝒗 𝒚 𝝁𝒔𝒆𝒄𝒓 (37)
𝒗𝒋𝒎𝒊𝒏. 𝒚𝒋 ≤ 𝒗𝒋 ≤ 𝒗𝒋
𝒎𝒂𝒙. 𝒚𝒋, ∀ 𝒋 ∈ 𝝁 (38)
5
𝒚𝒋 = {𝟎, 𝟏}, ∀ 𝒋 ∈ 𝝁 (39)
𝜸𝒋 = {𝟎, 𝟏}, ∀𝒋 ∈ 𝑵 (40)
Where 𝑣𝑔𝑙𝑐−𝑢𝑝𝑡𝑎𝑘𝑒 is glucose basic uptake,
𝑣𝑎𝑡𝑝−𝑚𝑎𝑖𝑛 is the maintenance requirement of ATP not
associated with growth, 𝑣𝑏𝑖𝑜𝑚𝑎𝑠𝑠𝑜𝑏𝑗
is a minimal level of
biomass production, 𝑣𝑝𝑡𝑠 is glucose uptake through the
phosphotransferase system, 𝑣𝑔𝑙𝑘 is glucose uptake
through the glucokinase system, 𝑦 is a binary variable (1
if the flux of the reaction is active or 0 otherwise), 𝜇 is
the transport reaction set (reversible (𝑣𝑟𝑒𝑣) and
irreversible (𝑣𝑖𝑟𝑟𝑒𝑣) of metabolites only secreted (𝑣𝑠𝑒𝑐𝑟),
𝑁 is the metabolites set, 𝐾 is the number of knockouts
allowed, 𝛾 is a dual variable associated with the
stoichiometric constraints, 𝑔𝑙𝑐 is a dual variable dual
associate with the glucose uptake, 𝑢 is a dual variable
associated with any other constraints in its
corresponding flux.
Possibles added-value compounds from
naringenin. Because naringenin is a product with
several commercial presentations as a nutritional
supplement, it is necessary to investigate novel products
for the pharmaceutical and food industry. Based on this,
two criteria were used to select those products derived
from naringenin 1. The chemical compound must be
beneficial for human health and 2. This, in turn, may not
have commercial products available.
Obtaining apiforol as a novel product and
measuring its antioxidant capacity. Apiforol is a
derivative of naringenin, which has been reported with
antidiabetic properties14. In order to obtain apiforol from
naringenin, a chemical synthesis was performed.
Naringenin (20 mg) was dissolved in 400 µl of 100%
ethanol and reduced with sodium borohydride (10 mg).
After 45 minutes, the reduction product was acidified
with 10% (v/v) acetic acid (200 µl) in ethanol (1800 µl)
to turn off the borohydride and reduce the pH of the
solution. Later, this was evaporated at a temperature of
35 ° C and the residue containing apiforol was stored at
room temperature in the dark. The presence of flavan-4-
ol was confirmed by the formation of a red pigment in
the presence of 30% (v/v) hydrochloric acid in ethanol31.
With the aim to check if indeed apiforol had health
benefices an antioxidant capacity assay was carried out.
Antioxidant capacity of apiforol was measured through
FRAP (ferric reducing/antioxidant power) method,
which is based on an increase in the absorbance at 593
nm due to formation of TPTZ-Fe(II)32. This method
evaluates the antioxidant capacity of a sample according
to its ability to reduce ferric iron Fe(III) present in a
complex with 2,4,6-tri (2-pyridyl) -s-triazine (TPTZ) up
to the ferrous form Fe(II)32. The reaction mixture FRAP
was prepared by mixing 25 mL of 0.3 mol/L sodium
acetate buffer solution (pH 3.6), 2.5 mL of 10 mmol/L
TPTZ and 2.5 mL of 20 mmol/L FeCl3. Reaction mixture
was incubated at 37°C for 30 min. Different
concentrations of apiforol (0.1, 0.2, 0.3 mg/mL) were
mixed with reaction mixture, as follows: 3 ml prepared
FRAP reagent, 100 µL of sample was then added, along
with 300 µl H2O. Absorbance readings were taken after
0.5 s and every 15 s thereafter during the monitoring
period at 593 nm. This assay was carried out in the T75
UV-VIS Spectrophotometer
2. Results
On the consulted literature, 71 species of
organisms were found (See Table 1¡Error! No se
encuentra el origen de la referencia.), 15 (21.1%)
yeasts (Y), 6 (8.5%) acidic acid bacteria (AAB), 22
(30.9%) lactic acid bacteria (LAB) and 28 (39.5%)
organisms not classified in the three previous categories
and in which the Enterobacteriaceae are found, such as
Erwinia and Klebsiella2. Also, families of infectious
viruses for the bacteria Myoviridae and Siphoviridae are
reported33. From these organisms, only 44 organisms
were found with metabolic models in specialized
databases such as Metacyc and Patric (information
associated with EC Number see Table 1. On average, the
species have about 1066 reactions and 1164 metabolites.
OptStoic formulation of the overall reaction.
OptStoic was run with the information from the KEGG
database, a total of 10,195 reactions and 18,120
metabolites were obtained. The Gibbs free energy
change (ΔGf) and the net charge of each metabolite were
extracted from the Metacyc and chEBI databases.
Because OptStoic generates the stoichiometric
coefficients that satisfy the optimum stoichiometry for
the general reaction, two global reactions were proposed
from two flavonoid precursors, with the aim of finding
which of these reactions satisfies the thermodynamic
constraints while this is feasible for production of the
target product. To produce the naringenin flavonoid
precursor, two reactants were chosen, the amino acids L-
phenylalanine and L-tyrosine.
Naringenin production from L-phenylalanine.
𝑳_𝒑𝒉𝒆𝒏𝒚𝒍𝒂𝒍𝒂𝒏𝒊𝒏𝒆 → 𝑵𝒂𝒓𝒊𝒏𝒈𝒆𝒏𝒊𝒏 (41)
Naringenin production from L-tyrosine.
𝑳_𝒕𝒚𝒓𝒐𝒔𝒊𝒏𝒆 → 𝑵𝒂𝒓𝒊𝒏𝒈𝒆𝒏𝒊𝒏 (42)
To make these reactions chemically viable, the
compounds that make up the LB growth medium were
added to the algorithm (See Table 2).

6
Table 1. Microorganisms reported in the literature for the fermentation of cocoa seeds in samples from Cameroon, Ghana, Cote d'Ivoire, Brazil, Malaysia, India, Mexico, and Cuba.
Organisms Metabolic model Source Ref. Organisms Metabolic model Source Ref.
Yeasts (Y) Pediococcus acidilactici Pediococcus acidilactici MA18/5M Metacyc 40
Hanseniaspora uvarum --- 35, 36, 34, 37 Lactobacillus pentosus Lactobacillus pentosus KCA1 Metacyc 38
Hanseniaspora opuntiae --- 34, 38, 39 Leuconostoc
pseudomesenteroides Leuconostoc pseudomesenteroides 4882 Metacyc 38
Hanseniaspora guilliermondii --- 35, 36 Leuconostoc mesenteroides Leuconostoc mesenteroides cremoris ATCC
8293 Metacyc 34
Saccharomyces cerevisiae Saccharomyces cerevisiae S288c Metacyc 40, 38, 41, 36, 37, 34, 42, 39 Lactococcus lactis Lactococcus lactis lactis IL1403 Metacyc 34
Saccharomycodes ludwigii --- 43 Enterococcus camelliae --- 2
Candida magnolia --- 40 Weissella paramesenteroides Weissella paramesenteroides ATCC 33313 Metacyc 38, 2, 46, 47, 48
Candida carpophila --- 39 Enterococcus casseliflavus Enterococcus casseliflavus ATCC 12755 Metacyc 2, 47 Candida orthopsilosis --- 39 Others
kudriavzevii (Issatchenkia orientalis) --- 39, 36 Zymomonas mobilis Zymomonas mobilis mobilis ATCC 10988 Metacyc 34
Pichia manshurica --- 39 Staphylococcus saprophyticus Staphylococcus saprophyticus saprophyticus
ATCC 15305 Metacyc 37, 2, 42
Meyerozyma caribbica --- 39 Paenibacillus lautus --- 40
Yamadazyma mexicana --- 39 Paenibacillus illinoisensis --- 40
Pichia kluyveri --- 36, 37 Paenibacillus chibensis --- 40
Kodamaea ohmeri --- 39 Oenococcus oeni Oenococcus oeni ATCC BAA-1163 Metacyc 34
Lachancea thermotolerans --- 34, 43 Lysinobacillus boronitolerans --- 2
Acetic acid bacteria (AAB) Lysinibacillus sphaericus Lysinibacillus sphaericus C3-41 Metacyc 40
Acetobacter pasteurianus Acetobacter pasteurianus 386B Metacyc 34, 35, 38, 2, 40, 44 Lysinibacillus fusiformis Lysinibacillus fusiformis Metacyc 40
Acetobacter syzygii --- 2 Klebsiella pneumoniae Klebsiella pneumoniae KCTC 2242 Metacyc 2, 49
Acetobacter senegalensis Acetobacter senegalensis 108B Metacyc 38, 2, 44 Erwinia tasmaniensis Erwinia tasmaniensis Et1/99 Metacyc 34
Acetobacter sicerae --- 2 Corynebacterium variabile Corynebacterium variabile DSM 44702 Metacyc 2
Acetobacter tropicalis Acetobacter tropicalis NBRC 101654 Metacyc 37, 2, 44, 42 Bacillus subtilis Bacillus subtilis168 Metacyc 37, 34, 42, 50, 51
Gluconobacter Oxidans --- 40 Bacillus safensis --- 2
Lactic acid bacteria (LAB) Bacillus altitudinis --- 40
Lactobacillus fermentum Lactobacillus fermentum ATCC 14931 Metacyc 34, 36, 37, 38, 2, 40, 45 Arthrobacter solii --- 2
Lactobacillus brevis Lactobacillus brevis ATCC 367 Metacyc 34 Acinetobacter radioresistens Acinetobacter radioresistens SK82 Metacyc 2
Lactobacillus rhamnosus Lactobacillus rhamnosus ATCC 21052 Metacyc 36, 34, 35 Acinetobacter guillouiae Acinetobacter guillouiae CIP 63.46 Patric 2
Lactobacillus plantarum
Lactobacillus plantarum plantarum
ATCC 14917 = JCM 1149 = CGMCC
1.2437
Metacyc 34, 35, 37, 38, 2, 40, 42, 45, 41 Fructobacillus pseudoficulneus Fructobacillus pseudoficulneus DSM 15468 Metacyc 34
Lactobacillus plantarum /
paraplantarum Lactobacillus paraplantarum L-ZS9 Metacyc 2 Bacillus pumilus18 Bacillus pumilus ATCC 7061 Metacyc 34, 52
Lactobacillus casei Lactobacillus casei LOCK919 Metacyc 36, 34, 35 Bacillus pseudomycoides Bacillus pseudomycoides DSM 12442 Patric 40
Lactobacillus nagelii Lactobacillus nagelii DSM 13675 Metacyc 2 Bacillus patagoniensis --- 40
Lactobacillus vaginalis Lactobacillus vaginalis DSM 5837 =
ATCC 49540 Metacyc 2 Bacillus mojavensis Bacillus mojavensis RO-H-1 = KCTC 3706 Metacyc 40
Lactobacillus ghanensis Lactobacillus ghanensis DSM 18630 Metacyc 2 Bacillus megaterium Bacillus megaterium QM B1551 Patric 37, 34, 42, 51
Lactobacillus coryniformis Lactobacillus coryniformis coryniformis
KCTC 3167 = DSM 20001 Metacyc 40 Bacillus circulans Bacillus circulans NBRC 13626 Patric 2
Lactobacillus curvatus --- 40 Bacillus cereus Bacillus cereus ATCC 10876 Metacyc 34, 50
Lactobacillus mali Lactobacillus mali KCTC 3596 = DSM
20444 Metacyc 40 Bacillus clausii Bacillus clausii KSM-K16 Metacyc 2
Lactobacillus sakei Lactobacillus sakei sakei 23K Metacyc 40 Bacillus amyloliquefaciens Bacillus amyloliquefaciens DSM 7 Metacyc 51
Lactobacillus hilgardii Lactobacillus hilgardii DSM 20176 =
ATCC 8290 Metacyc 40

7
Identify optimal overall stoichiometry. The stoichiometric coefficients obtained for the reactions are the
following:
Naringenin production from L-tyrosine:
𝟏𝟐 𝒕𝒚𝒓𝒐𝒔𝒊𝒏𝒆 + 𝟏𝟒 𝑶𝟐 → 𝟓 𝒏𝒂𝒓𝒊𝒏𝒈𝒆𝒏𝒊𝒏𝒆 + 𝟑 𝒂𝒄𝒆𝒕𝒂𝒕𝒆 + 𝟑 𝒂𝒓𝒈𝒊𝒏𝒊𝒏𝒆 + 𝟗 𝑯𝟐𝑶 + 𝟗 𝑪𝑶𝟐 (43)
𝟏𝟐 𝑪𝟗𝑯𝟏𝟏𝑯𝑶𝟑 + 𝟏𝟒 𝑶𝟐 → 𝟓 𝑪𝟏𝟓𝑯𝟏𝟐𝑶𝟓 + 𝟑 𝑪𝟐𝑯𝟒𝑶𝟐 + 𝟑 𝑪𝟔𝑯𝟏𝟒𝑵𝟒𝑶𝟐 + 𝟗 𝑯𝟐𝑶 + 𝟗 𝑪𝑶𝟐 (44)
Naringenin production from L-phenylalanine:
𝟏𝟐 𝒑𝒉𝒆𝒏𝒚𝒍𝒂𝒍𝒂𝒏𝒊𝒏𝒆 + 𝟗 𝑶𝟐 + 𝟔 𝑪𝑶𝟐 → 𝟔 𝒏𝒂𝒓𝒊𝒏𝒈𝒆𝒏𝒊𝒏𝒆 + 𝟏𝟐 𝒈𝒍𝒚𝒄𝒊𝒏𝒆 (45)
𝟏𝟐 𝑪𝟗𝑯𝟏𝟏𝑵𝑶𝟐 + 𝟗 𝑶𝟐 + 𝟔 𝑪𝑶𝟐 → 𝟔 𝑪𝟏𝟓𝑯𝟏𝟐𝑶𝟓 + 𝟏𝟐 𝑪𝟐𝑯𝟓𝑵𝑶𝟐 (46)
These results were obtained for the input with
total KEGG information, while for the input with
information from organisms of the fermentation process
only the production of naringenin from tyrosine was
obtained. From the above equations, it can be observed
that in the production of naringenin from phenylalanine
and tyrosine, is necessary the participation of arginine
and glycine, respectively. Allowing the stoichiometric
balance of these reactions. Also, the production of
naringenin from tyrosine had an in silico yield of 41%,
which means that to produce 1 molecule of naringenin
2.4 molecules of tyrosine are necessary, and a ∆𝑟𝐺 of -
113.69 kcal. The production of naringenin from
phenylalanine had an in silico yield of 50%, which
means that to produce 1 molecule of naringenin 2
molecules of phenylalanine are necessary, and a ∆𝑟𝐺 of
-50.4 kcal.
Two pathways to naringenin produce from
phenylalanine and tyrosine were predicted. In this
step, the metabolites glycans, polysaccharides composed
of monosaccharides of a single type34, were not taken
into account, so the number of reactions was reduced to
10,195 from 10,668 for the KEGG database and for the
organisms database the reduction was 47,959 reactions
to 39,990. Figure 1 and Figure 2 shows the metabolic
pathways for the production of naringenin from
phenylalanine and tyrosine obtained based on the
stoichiometry predicted before, which have been
reported in previous studies35,36.
A solution for the overall reaction phenylalanine-
naringenin was found in the input with information from
organisms of the fermentation process, where the
OstStoic algorithm generated a five-step path (reactions:
R00697, R02255, R08815, R01613, and R02446, see
Table 3), completely complying with the stoichiometry
of the reaction.
Table 2. LB metabolites composition
Chemical formula22
Name22,25 ΔGf (kcal/mol)22 Charge23
O2 Oxygen 3.9197 0 CO2 Carbon dioxide -92.26 0 H2O Water -56.687 0 NH3 Ammonium -18.97 1 C9H11NO2 L-phenylalanine -51.05 0 C9H11NO3 L-tyrosine -90.53 0 C15H12O5 Naringenin -113.81 0 C2H3O2 Acetate -88.29 -1 C3H7NO2 L-alanine -87.92 0 C6H12N2O4S2 Cystine -159.61 0 C6H9N3O2 Histidine -45.63 0 C6H15N2O2 Lysine -84.04 1 C5H8NO2 L-Proline -62.54 -1 C11H12N2O2 L-Tryptophan -25 0 C6H15N4O2 Arginine -73.77 1 C5H8NO4 L-Glutamate -164.13 -1 C6H13NO2 L-Isoleucine -84.87 0 C5H11NSO2 L-Methionine -75.91 0 C3H7NO3 L-Serine -124.15 0 C4H6NO4 L-Aspartate -165.75 -1 C2H5NO2 Glycine -87.73 0 C3H7NO2 L-Leucine -84.87 0 C4H9NO3 L-Threonine -124.34 0 C5H11NO2 L-Valine -86.49 0 C3H7NSO2 Thiamine 52.18 1 C17H20N4O6 Riboflavin -110.72 0 C9H16NO5 Pantothenate -188.54 -1 C8H11NO3 Pyridoxine -67.43 0 C10H15N2SO3 Biotin -109.02 -1 C19H21N7O6 Tetrahydrofolate -113.97 -2 C6H4NO2 Niacin -36.89 -1

8
For the overall reaction of tyrosine-naringenin,
no solution was obtained from this input, because no
fermentation organism has a reaction capable of turning
tyrosine into p-coumaric acid. From the input of
information of the KEGG database, a solution was found
for each overall reaction. For the phenylalanine-
naringenin reaction, the same five-step pathway was
generated as for the fermentation database, while for the
tyrosine-naringenin reaction, a four-step path composed
of the reactions was generated (R00737, R01616,
R01613, and R02446, see Table 3).
Associated genes and enzymes to the pathways
predicted. In the Table 3 eight reactions belong to the
two predicted pathways are observed. Enzymes and
genes associated are also showed. For the selection of
genes associated with the catalytic enzymes of reactions
belonging to the predicted pathways, the following
criteria were used:
• The gene has been expressed in E. coli.
• The reported Michaelis Menten km constant
must be small, with an order of
magnitude 𝑥10−2.
• Gene must have mutations that can contribute
to the production of naringenin.
Figure 1. Metabolic pathway L-phenylalanine to naringenin. This pathway is composed of reactions PHETA1
(Phenylalanine transaminase), PAL/TAL1 (phenylalanine ammonia-lyase), CNL (p-coumaroyl CoA ligase), CINCOA
(cinnamic acid 4-hydroxylase), CHS (naringenin chalcone synthase) and CHI (chalcone isomerase). The circles and arrows
represent metabolites and reactions respectively. The names associated with the abbreviations used in this figure can be
found in supplementary material 3.
Figure 2. Metabolic pathway L-tyrosine to naringenin. This pathway is composed of reactions TYRTA (Tyrosine
transaminase), PAL/TAL2 (phenylalanine/tyrosine ammonia-lyase), 4CL (4-coumarate—CoA ligase), CHS (naringenin
chalcone synthase) and CHI (chalcone isomerase). The circles and arrows represent metabolites and reactions respectively.
The names associated with the abbreviations used in this figure can be found in supplementary material 3.
The first parameter is the most important because
it guarantees that the chosen gene can be expressed in E.
coli. The second one is related to the reaction rate and
indicates the affinity that the enzyme has for the
substrate and the last parameter is relevant when genes
with mutations that can have a positive impact on
naringenin biosynthesis are included (See Table 3).
Once the genes associated to the enzymes of each
reaction were found, the tyrosine-naringenin pathway
was chosen, this being the shortest, four steps to produce
the flavonoid, which facilitates the heterologous
expression of the genes in a bio-factory such as E. coli
(Table 4).
FBA and OptKnock. After the selection of
genes and enzymes, an FBA was carried out for the
pathway tyrosine-naringenin, using a model for E. coli
ATCC 8739 to verify the viability of the pathways in this
organism. FBA was performed under aerobic conditions
and with a glucose uptake of -10 mmol*gDW-1 *h-1. The
objective function "biomass" of the model obtained an
optimum value of 0.8935 mmol*gDW-1 *h-1 when there
is no production of naringenin (without the introduction
of the pathway).

9
Table 3. Reactions, enzymes, and genes belonging to the predicted pathways.
ID-RXN EC Number Enzyme Name Gene Organism Km Present in the fermentation
R00697 4.3.1.24 4.3.1.25
phenylalanine ammonia-lyase (PAL) phenylalanine/tyrosine ammonia-lyase (PAL/TAL)
BoPAL4 Bambusa oldhammi
0.09737 No
R02255 6.2.1.12 4-coumarate---CoA ligase (4CL)
Os4CL1 Oryza sativa 0.009438 No
R08815 1.14.14.91 cinnamate 4-hydroxylase39 ------------ ------------- ------------- No
R01616 6.2.1.12 4-coumarate---CoA ligase (4CL)
Q274H-F269L Solanum
lycopersicum 0.03640 No
R01613 2.3.1.74 naringenin-chalcona sintase CHS Hypericum
androsaemum 0.004941
Lysinibacillus sphaericus
C3- 41, Bacillus
subtilis168, Bacillus
pumilus ATCC 7061 and
Bacillus clausii KSM-K16.
R02446 5.5.1.6 chalcona isomerase CHI Pueraria
montana var. Lobata42
N/A No
R00737 4.3.1.23 4.3.1.25
tyrosine ammonia-lyase (TYR) phenylalanine/tyrosine ammonia-lyase (PAL/TAL)
TAL, BoPAL4
Rhodobacter capsulatus, Bambusa oldhammi
0.01643, 0.09737
No
The four reactions that form the pathway (Figure
2) were added and a new FBA was executed (R00697,
R01616, R01613, and R02446, see Table 3). In this new
analysis, the biomass growth obtained an optimum value
of 0.893 mmol*gDW-1*h-1 and a naringenin flux of
0.00026 mmol*gDW-1*h-1, which represents around
0.029% with respect to biomass growth. As seen in
Figure 3 as the biomass varies, the naringenin
production also varies, showing a production inversely
proportional to the biomass, directly affecting the growth
of the organism.
In order to carry out the production of naringenin,
it is necessary to take into account its precursor
metabolites. These metabolites are E4P: Erythrose 4-
phosphate associated with the pentose phosphate
pathway, PEP: phosphoenolpyruvate associated with
glycolysis and gluconeogenesis and the production of
acetyl coa. Malonyl coa is derived from acetyl coa. E4P
and PEP are precursors for the generation of the
shikimate pathway, essential for the formation of p-
Coumaroyl-CoA that joined with three molecules of
malonyl coa to react and produce naringenin chalcone,
four molecules of CoA and three molecules of CO2, a
reaction catalyzed by the enzyme chalcone synthase
(CHS). Naringenin chalcone is the direct precursor of
naringenin, which is transformed through the enzyme
chalcone isomerase (CHI)15. The pathways involved in
the production of naringenin are very important because
these are the ones that redirect their fluxes in order to
make this production feasible, decreasing or increasing
the flux in other pathways and reactions of the organism,
thus changing its phenotype.
To optimize the production of naringenin it was
necessary to force the strain to adapt the yield of this
product to a cellular objective such as the biomass,
establishing a relationship between the reactions
EX_naringenin (hypothetical exchange reaction) and
biomass44.
Once the production of naringenin was obtained
in the model, an optKnock analysis was carried out, with
the objective of maximizing this production while
maximizing the biomass of the model. The secretion of
a product can be coupled to the growth of biomass if its
precursor provides an essential component of the
biomass (as is the case of tyrosine) and if pathways that
metabolize the desired product are eliminated. Optknock
finds genes that can be knockout, thus forcing the strain
to secrete the product in optimal growth.
For coupling the following equation was used:
𝒗𝒃𝒊𝒐𝒎𝒂𝒔𝒔 = 𝑿 𝒗𝑬𝑿_𝒏𝒂𝒓[𝒆] (47)
Where 𝑣𝐸𝑋_𝑛𝑎𝑟[𝑒] is the flow of the
naringenin exchange reaction, 𝑣𝑏𝑖𝑜𝑚𝑎𝑠𝑠 is the flow of
the biomass reaction and 𝑋 is a proportional constant.
This equation means that the flux of the
naringenin exchange reaction is X times the biomass

10
flux. For the run of optKnock, a group of 96 candidate
reactions to be eliminated, participants in the central
metabolism, the shikimate pathway and the synthesis
and degradation of tyrosine were chosen.
Table 4. Genes selected to produce naringenin from
tyrosine
Gene Name Gene Organism Mutation Ref.
PAL/TAL BoPAL4 Bambusa oldhammi F133H 37
4CL Q274H-F269L
Solanum lycopersicum
Q274H 40
CHS CHS Hypericum
androsaemum L263M-F265Y
41
CHI CHI Pueraria montana
var. Lobata C119A 42
Just after performing the coupling and in where
the value of X was found through OptKnock iterations
where the value that obtained the highest fluxes for
biomass and naringenin production was chosen. Which
was X=1/7. With this result, a new FBA was carried out,
where a flux of 0.1231 mmol*gDW-1*h-1 of naringenin
was obtained by optimizing the biomass flux (0.8616
mmol*gDW-1*h-1).Increasing the flux of naringenin,
but decreasing the flux of biomass compared to the
previous results. In consequence, the pathways involved
in the naringenin production increase their fluxes in the
same way that Ex_nar[e] reaction flux. Also, 61
reactions were affected after performing the coupling in
the FBA, which mostly are transport reactions (37%) and
others belong to tyrosine, tryptophan and phenylalanine
metabolism (15%), glycerophospholipid metabolism
(15%), exchange reactions (15%), prosthetic group and
alternative carbon (12%) and cofactors metabolism
(10%).
Other effects related to coupling were the
generation of extreme fluxes due to possible
Thermodynamically Infeasible Cycles (TIC) and
activation and deactivation of the reaction. ICTs lead to
non-zero cycles without communication with the system
and the external environment, generating errors in
solving the optimization problem involved in the FBA45.
As such, there cannot be a net flow around a closed cycle
in a steady-state network46. The extreme fluxes are
directly related mainly to transport reactions, while the
functions performed by the reactions that were
deactivated are carried out by means of alternative
reactions or pathways with the aim of seeking balance
within the cell, thus manifesting a different phenotype
than that obtained before coupling. The reactions
involved in the exchange and transport of h+, Fe3 +, in
oxidative phosphorylation in the periplasm and in the
citric acid cycle were activated or deactivated due to
coupling. In addition, other reactions such as the
exchange and transport of Fe2 +, CO2 and H2O and the
formation of fumarate from succinate were affected by
the coupling.
Once the proportion between biomass and
naringenin production fluxes was fixed in the model, the
Optknock analysis was executed. This analysis
generated three sets of reactions which, when knocked
out, can increase the biomass while increasing the
production of naringenin. Supplementary material 2.
The first set consists of the reactions CITL (Citrate lyase
EC-4.1.3.6), MALS (Malate synthase EC-2.3.3.9) and
PPS (Phosphoenolpyruvate synthase EC-2.7.9.2), the
first reaction belongs to the citric acid cycle, the second
is an anaplerotic reaction, and the latter is part of
glycolysis and glycogenesis, this set obtained a flux of
0.1267 mmol*gDW-1*h-1 of naringenin and biomass flux
of 0.887 mmol*gDW-1*h-1. The second set is composed
of the PFK reactions (Phosphofructokinase EC-2.7.1.11)
that are part of the glycolysis and glycogenesis, MALS
and PPS, this set obtained a flux of 0.1258 mmol*gDW-
1*h-of naringenin and biomass flux of 0.8809
mmol*gDW-1*h-. The last set contains the CITL and
MALS reactions, this set obtained a flux of 0.1267
mmol*gDW-1*h-1 of naringenin and biomass flux of
0.887 mmol*gDW-1*h-1. Supplementary material 1. The
fluxes for the production of biomass and naringenin
increased in comparison to the fluxes of these before
optimization for the three sets of reactions given by
Optknock.
Figure 3. Naringenin flux versus biomass
growth. This graph was obtained using an iterative FBA,
varying the stoichiometric coefficients of biomass
growth (variations of 0.05 mmol*gDW-1*h-1) to observe
the behavior of the naringenin flux.
Chemical production of apiforol and
antioxidant capacity assay. From naringenin
compound, a search was made for products that had a
beneficial effect on human health and, in turn, did not

11
have a commercial form. Due to this and after reviewing
the reactions downstream from naringenin in the
metabolism of the flavonoids, 16 EC numbers, 40
reactions and 31 metabolites associated with these were
found. From the review of scientific literature and
specialized databases, two metabolites were found that
met the first criteria, see methods, the first was the
metabolite 8-C-Glucosylnaringenin (C16492) and the
second was Apiforol (C12124).
Apiforol was selected to perform the chemical
synthesis since it met both parameters since currently no
commercial products have been reported from this, in
addition, its antidiabetic properties have been reported
16, while for 8-C-glucosylnaringenin it has not been
reported. They found health benefits. An additional
advantage of apiforol is that it is a direct derivative of
naringenin, through the action of the enzyme Flavanone
4-reductase EC: 1.1.1.234. Apiforol is a 3-
deoxyflavonoids just like luteophorol, known as flavan-
4oles47,48. Flavan-4oles are derived from alcohols and a
family of flavonoids and these compounds are colorless
that polymerize to form red flavophens49. The latter is
red substances soluble in alcohols and insoluble in water,
which can be extracted from the plant or result from the
treatment of tannin extracts with mineral acids such as
hydrochloric acid 50.
The reduction of naringenin was carried out using
the compound sodium borohydride and a metabolic
solution of naringenin. 10 mg of apiforol were obtained
from the reaction, this being a yellow compound.
Subsequently, apiforol were diluted in 5 ml of reagent
grade ethanol and stored at -80°C in dark conditions.
From this solution an aliquot of 50 µl was taken and
mixed with 300 µl of hydrochloric acid and 1 ml of
ethanol, immediately passing from a light-yellow color
to a strong red. Thus, confirming the presence of flavan-
4-ol apiforol.
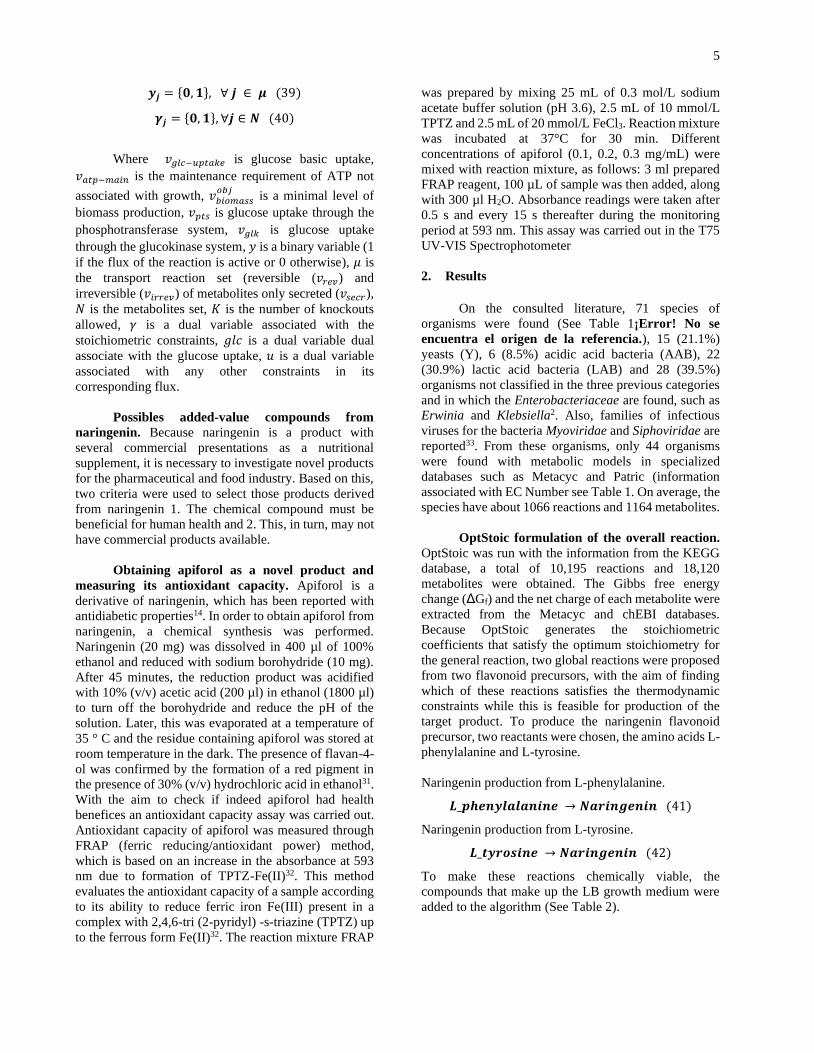
After obtaining the apiforol, its antioxidant capacity
was measured by the FRAP method. The dose–
response characteristics of apiforol showing that
antioxidant activity is concentration-dependent in the
three concentrations. However, the measurements of
the 0.1 mg / ml curve show very high standard
deviations, which may be due to errors in these.
Figure 4 shows the rate of increase in absorbance
at 593 nm for 100 mmol/L solutions of apiforol. This
reaction does not reach a final point within the
monitoring period and a constant increase in absorbance
is observed throughout the time interval from the
sample/reagent mixture. To observe the variation of the
absorbance for each concentration with respect to the
calibration curves (FeSO4). Supplementary material 2.
The FRAP value for the time interval t was
obtained by the following equation51:
𝑭𝑹𝑨𝑷𝒕(𝑴) = (∆𝒂𝒕𝑭𝑰
∆𝒂𝒕𝑭𝒆𝟐+) ∗ 𝟏𝟎−𝟓 (48)
Figure 4. FRAP reaction kinetics. Rate of increase in absorbance at 593 nm for 100 mmol/L solutions of apiforol
compound.
12
Where:
∆𝑎𝑡𝐹𝐼: Change in absorbance after the time interval t, in
relation to the apiforol tested at a defined concentration.
∆𝑎𝑡𝐹𝑒2+: Change of absorbance in the same time
interval, for ferrous sulfate at the same concentration.
Figure 5. Total antioxidant capacity of apiforol by FRAP
method for concentrations 0.1, 0.2 and 0.3 mg/ml to 8
min.
The FRAP values for apiforol in this study were
4x10⁻⁵ M (40 μmol/L), 8x10⁻⁵ M (80 μmol/L) and
4.5x10⁻⁴ M (450 μmol/L) for concentrations of 401
μmol/L, 693 μmol/L and 981 μmol/L of apiforol and
FeSO4 respectively. These results were for the time
interval of the first four-minutes. For the total study time
(8 minutes), the FRAP values obtained were 8x10⁻⁵ M
(80 μmol/L), 1.2x1045 M (120 μmol / L) and 6x10⁻⁴ M
(600 μmol/L) for the concentrations of 401 μmol/L, 693
μmol/L and 981 μmol/L of apiforol (see Figure 5).
3. Discussion
Table 3 shows that the only enzyme found in the
organisms of the process of fermentation of cocoa seeds
is the naringenin-chalcone synthase EC: 2.3.1.74,
present in the organisms Lysinibacillus sphaericus C3-
41, Bacillus subtilis168, Bacillus pumilus ATCC 7061
and Bacillus clausii KSM-K16. These organisms are not
classified in the three groups of organisms most relevant
to the process (Y, ALB, and AAB), however, several
Bacillus strains are important in the first days of
fermentation since they have been related to the
degradation of the pectin present in the mucilage of
cocoa seeds52.
Also, could be observed that almost all the
enzymes (Table 3) are found in the genomes of plants
Theobroma cacao and Arabidopsis thaliana, except the
enzymes related to the EC numbers: EC: 4.3.1.25
(PAL/TAL) and 4.3.1.23 (TAL). TAL is found in the
genomes of bacteria such as Ectothiorhodospira
halophila, Actinosynnema mirum, Rhodobacter
sphaeroides, Salinibacter ruber and Cupriavidus
metallidurans, and in yeast as Rhodotorula glutinis.
While, PAL/TAL is present in the genome of plants
Oryza sativa japónica, Oryza brachyantha, and
Brachypodium distachyon among others.
Because the PAL/TAL enzyme has been
previously reported with the particularity of
transforming both tyrosine and phenylalanine, previous
research has shown that the BoPAL4 gene, associated
with this enzyme, could have a double activity for this
enzyme. For this reason, this gene was chosen to be
expressed in E. coli. The rest of the genes were chosen
because of a small km, which means that the enzyme-
substrate complex is stable and the tendency to form
predominates, meaning that there is a high affinity of the
enzyme for the substrate, considering the mutations as
shown in Table 4.
When introducing the chosen metabolic pathway
and carrying out the FBA and optKnock analyzes and
comparing the two phenotypes, with and without
coupling, changes were evidenced in 61 reactions of the
model (of a total of 2875 reactions), which were
activated, deactivated or there was an increase or
decrease in their activity. The sub-systems with the
greatest number of affected reactions are the transport
ones (inside the membrane and through porins), the
alternate metabolism of the carbon, the metabolism of
the glycerophospholipids, and the biosynthesis of the
groups of cofactors and prosthetics, the exchange
reactions and of the metabolism of tyrosine, tryptophan,
and phenylalanine.
From the transport subsystem, the reaction
GLUt4pp (Na+/glutamate symport (periplasm))
transporting Na+ from the periplasm to the cytosol was
deactivated. Several proton transport reactions were also
activated, in which abrupt activity was observed,
probably linked to non-feasible thermodynamic cycles,
in which reactions were observed with fluxes that
oscillated the values of the lower and upper limits of the
reactions (LB = -1000 and UB = 1000) both symport and
antiport pathways. Another reaction that presented
extreme flows was the transport of carnitine between the
cytosol and the periplasm, as well as the consumption of
water and the production of CO2 from and to the
environment, respectively within the network. In
addition, the transport of Fe2 + and Fe3 + ions were
activated through the diffusion pathway with
considerable reaction flows.
In the subsystem of alternative carbon
metabolism, six reactions were deactivated, of which
ACCOAL (Acetate-CoA ligase (ADP-forming)) and
PPCSCT (Propanoyl-CoA: succinate CoA-transferase),

13
involved in the formation of ADP and succinyl-CoA,
had an abrupt drop in their flows. For the
glycerophospholipid metabolism subsystem, three
ACPPAT160 (Acyl-(acyl carrier protein):phosphate
acyltransferase (C16:0)), ACPPAT161 (Acyl-(acyl
carrier protein):phosphate acyltransferase (C16:1)) and
G3PAT181 (Glycerol-3-phosphate acyltransferase (C18
1)) reactions were turn off and three other ACPPAT181
(Acyl-(acyl carrier protein):phosphate acyltransferase
(C18:1)), G3PAT160 (Glycerol-3-phosphate
acyltransferase (C16:0)), and G3PAT161 (Glycerol-3-
phosphate acyltransferase (C16:1)) were activated,
involved with palmitoyl-ACP (n-C16: 0ACP), cis-
hexadeca-9enoyl- [acyl-carrier-protein] (n-C16: 1), cis-
octadeca-11-enoyl- [acyl-carrier protein] (n-C18: 1) in
phosphate transport and h+, activation, and deactivation
indicates that alternate reactions were activated to
transport the metabolites involved.
In the biosynthesis subsystem of the cofactor and
prosthetic groups, the LIPOCT (Lipoyl(octanoyl)
transferase), MECDPDH2 (2C-methyl-D-erythritol 2,4
cyclodiphosphate dehydratase), and NPHS (Naphthoate
synthase) reactions were turned off and the MECDPDH5
(2C-methyl-D-erythritol 2,4 cyclodiphosphate
dehydratase) and OCTNLL (Octanoate non-lipoylated
apo domain ligase) reactions were activated, the
activation and deactivation indicate that alternate
reactions were activated for the production of Octanoate
(protein-bound) and 1-hydroxy-2-methyl-2- (E) -butenyl
4-diphosphate.
The subsystem of exchange reactions involves
the aforementioned, in the case of proton flux, the proton
exchange reaction EX_h_e, was turned off showing that
the need for protons for the metabolism of the organism
is so overwhelmed that there is no export to the outside
of the cell of this cofactor. In the case of the exchange
reactions related to Fe2+ and Fe3+, it is observed that
the consumption of Fe2+ from the medium increased
about seven times and the production of Fe3+ in the
medium increased equally around 7 times. In the
metabolism subsystem of tyrosine, tryptophan and
phenylalanine, it was observed that the fluxes that make
up the shikimate path increased its production flux from
0.3325 to 0.4435 mmol*gDW-1*h-1, which caused an
increase in the flux of the TYRTA reaction, from -0.12
to -0.24 mmol*gDW-1*h-1, which is the direct couple
reaction to the predicted heterologous pathway. The flux
of naringenin production went from 0.00026 to 0.1267
mmol*gDW-1*h-1 when performing the coupling.
From the tests carried out in the optKnock
analysis, we observed that from the ratio 1: 7 (1 mmol-
naringenin*gDW-1*h-1 per 7 mmol*gDW-1*h-1 of
biomass), the relation is satisfactorily coupled, meaning
that the production of naringenin is connected to the
growth of biomass. Of the results thrown by OptKnock,
both the set 1 and the set 2 show a naringenin production
and an equal growth rate, which are greater than those
shown for the set 2. However, the set 1 has seven genes
involved, four for CITL (citE, citD, citX and citF), two
for MALS (aceB, glcB) and one for PPS (ppsA), while
the set 3 has six genes. Also, the set 2 has five genes, two
for PFK (pfkA, pfkB), and two for MALS (aceB, glcB)
and one for PPS (ppsA).
By performing an FBA for each reaction set
thrown by the OptKnock analysis, the following results
were obtained: Set 1. PPS, MALS, and CITL were
knocked out; the knockout of the PPS reaction prevented
the formation of PEP from pyruvate, directing the
pyruvate flow to the formation of actetyl coa. By
knocking out the MALS and CITL reactions, the
additional expense of acetyl coa in the TCA is avoided,
so the flows are concentrated in the production of acetyl
coa, a direct precursor of the malonyl coa molecules
necessary for the formation of the naringenin chalcone.
Set 2. PFK, MALS, and PPS were knocked out; the
knockout of the PFK reaction led to the knockout of the
FBA reaction, redirecting the flow through the F6PA
reaction (Fructose 6-phosphate aldolase) and thus
allowing the formation of the PEP and 4EP
concentrating the fluxes of these metabolites towards the
shikimate pathway, directing them towards the
formation of p-coumaroyl coa, also necessary in the
formation of naringenin chalcone. Set 3. CITL and
MALS were knocked out. From the above it can be
concluded that the three sets sought to improve the
formation of malonyl coa and p-coumaroyl coa, direct
precursors of naringenin, thus improving the formation
of this metabolite. From the above and with the objective
of generating the least number of disturbances within the
network, the most appropriate set to improve naringenin
production was set 3 formed by the MALS and CITL
reactions.
OptKnock results show that naringenin
production increases as the growth rate increases
(Supplementary material 1), since the direct precursor in
this case, of the flavonoid naringenin is the amino acid
tyrosine, which is part of the biomass objective function.
Therefore, by optimizing the growth rate, tyrosine
production will be optimized together, forcing the strain
to improve the secretion of the product of interest30. It
should be considered that the relationship used for the
coupling was estimated through several iterations in
OptKnock since no information was available on the
relationship between the growth rate and the production
of naringenin of any organism, neither modified nor
wild. For this reason, they must carry out studies that
give this information and adjust the model to these
results.
14
From the chemical synthesis of naringenin to
produce apiforol, a yellow substance was generated, as
confirmed by Khalil et al., 201250. In the confirmation of
the presence of apiforol in the product generated from
the synthesis, a substance was obtained between rose and
red, which confirms that flavan 4-ol was obtained.
The FRAP values for apiforol in this study were
4x10⁻⁵ M (40 μmol/L), 8x10⁻⁵ M (80 μmol/L) and
4.5x10⁻⁴ M (450 μmol/L) for concentrations of 401
μmol/L, 693 μmol/L and 981 μmol/L of apiforol and
FeSO4 respectively. These results were for the time
interval of the first four minutes. Previously, it was
reported that for naringenin under similar conditions,
except for the concentration (10 μmol/L), the FRAP
value was 0 umol/L for the 4 minute time interval and
activity was observed at 60 minutes, with a FRAP value
of 0.5 μmol/L, showing a very low activity, reflected in
a very low absorbance change at a wavelength of 595
nm51. The comparison of our results and those shown in
the previous study for naringenin show considerable
variations, since it is observed that apiforol has a higher
antioxidant capacity than naringenin in a shorter time
interval; however, it is suggested to perform the FRAP
test for two compounds under the same conditions and
to reinforce the results of antioxidant capacity with other
methods such as ABTS+, DHHP, among others.
4. Conclusions
It was possible to predict optimal metabolic
pathways to produce naringenin from the metabolic
information of the organisms involved in cocoa seed
fermentation and the KEGG database, using the
OptStoic algorithm, which had already been previously
reported by the researchers 35,36.
One of the cases in which artificial pathways or
de novo synthetic pathways are used is when the product
of interest is generated by a higher organism such as
plants and whose production is not profitable; such is the
case discussed in this document (naringenin production).
Taking this approach, it is formulated to insert the
pathways predicted by the algorithm proposed by the
researchers A. Chowdhury and C. Maranas19, in the
microorganism model E. coli, specifically the pathway
from L-tyrosine, using the proposed heterologous genes
(BoPAL4, Q274H-F269L, CHS, and CHI) (Table 4).
From the FBA, it was found that the model alone
produced a very low naringenin flow, less than 0.1%
when introducing the heterologous pathway, so it was
necessary to make an adjustment to the model, in which
the production was coupled flavonoid the rate of growth
(biomass target function), generating a phenotype able to
produce naringenin with a ratio of 1: 7, forcing the strain
by this coupling. It is suggested that this coupling be
adjusted according to the results by heterologous
expressing the pathway in E. coli, looking for a
relationship between the production of naringenin and
the production of biomass of the organism.
The abrupt variations in the protonation,
phosphate and ferric compounds flow must be
considered since these are fundamental in the catalytic
and stoichiometric processes of the organism.
From the analysis of the results obtained by
optKnock, the best set of reactions to knock out,
depending on the production of naringenin and the
number of genes to be eliminated is the set 3 composed
of the CILT and MALS reactions, which increases the
production flux of naringenin in almost 3%.
It was possible to synthesize the apiforol
compound from naringenin and it was demonstrated by
the FRAP assay, that it has antioxidant activity, which
must be validated by other methods and it is suggested
to perform this same assay under the same conditions for
the naringenin compound.
5. Bibliography
1. Valenzuela, J. F., Fernández, J. A., Restrepo, A.
P. & Aristizábal, R. M. El cultivo de cacao. 12
(2012).
2. Bortolini, C., Patrone, V., Puglisi, E. & Morelli,
L. Detailed analyses of the bacterial
populations in processed cocoa beans of
different geographic origin, subject to varied
fermentation conditions. Int. J. Food Microbiol.
236, 98–106 (2016).
3. Lima, L. J. R. et al. Theobroma cacao L ., “
The Food of the Gods ”: Quality Determinants
of Commercial Cocoa Beans , with Particular
Reference to the Impact of Fermentation
Theobroma cacao L ., “ The Food of the Gods
”: Quality Determinants of Commercial Cocoa
Beans , with Pa. 8398, (2011).
4. Guehi, T. S. et al. Performance of different
fermentation methods and the effect of their
duration on the quality of raw cocoa beans. Int.
J. Food Sci. Technol. 45, 2508–2514 (2010).
5. Kongor, J. E. et al. Factors influencing quality
variation in cocoa (Theobroma cacao) bean
flavour profile - A review. Food Res. Int. 82,
44–52 (2016).
6. Mayorga-Gross, A. L., Quirós-Guerrero, L. M.,
15
Fourny, G. & Vaillant, F. An untargeted
metabolomic assessment of cocoa beans during
fermentation. Food Res. Int. 89, 901–909
(2016).
7. Kalra, E. K. Nutraceutical-definition and
introduction. AAPS PharmSci 5, 27–28 (2003).
8. Biruete, A., Juárez, E., Sieiro, E., Romero, R. &
Silencio, J. Los nutracéuticos. Lo que es
conveniente saber. Rev. Mex. Pediatría 76,
136–145 (2009).
9. Giacometti, J., Muhvić, D., Pavletić, A. &
Dudarić, L. Cocoa polyphenols exhibit
antioxidant, anti-inflammatory,
anticancerogenic, and anti-necrotic activity in
carbon tetrachloride-intoxicated mice. J. Funct.
Foods 23, 177–187 (2016).
10. Goldwasser, J., Cohen, P. Y., Yang, E.,
Balaguer, P. & Yarmush, M. L. Transcriptional
Regulation of Human and Rat Hepatic Lipid
Metabolism by the Grapefruit Flavonoid
Naringenin : Role of PPAR a , PPAR c and
LXR a. 5, 1–9 (2010).
11. Nahmias, Y. et al. Apolipoprotein B-dependent
hepatitis C virus secretion is inhibited by the
grapefruit flavonoid naringenin. Hepatology 47,
1437–1445 (2008).
12. Cavia-saiz, M. et al. Antioxidant properties ,
radical scavenging activity and biomolecule
protection capacity of flavonoid naringenin and
its glycoside naringin : a comparative study.
1238–1244 (2010). doi:10.1002/jsfa.3959
13. Frabasile, S. et al. The citrus flavanone
naringenin impairs dengue virus replication in
human cells. 1–10 (2017).
doi:10.1038/srep41864
14. Gopalan, G. et al. Screening of Musa balbisiana
Colla. seeds for antidiabetic properties and
isolation of apiforol, a potential lead, with
antidiabetic activity. (2018).
15. Marienhagen, J. & Bott, M. Metabolic
engineering of microorganisms for the
synthesis of plant natural products. J.
Biotechnol. 163, 166–178 (2013).
16. Santos, C. N. S., Koffas, M. & Stephanopoulos,
G. Optimization of a heterologous pathway for
the production of flavonoids from glucose.
Metab. Eng. 13, 392–400 (2011).
17. Vieira, G., Carnicer, M., Portais, J. C. & Heux,
S. FindPath: a Matlab solution for in silico
design of synthetic metabolic pathways.
Bioinformatics 30, 2986–2988 (2014).
18. Campodonico, M. A., Andrews, B. A., Asenjo,
J. A., Palsson, B. O. & Feist, A. M. Generation
of an atlas for commodity chemical production
in Escherichia coli and a novel pathway
prediction algorithm, GEM-Path. Metab. Eng.
25, 140–158 (2014).
19. Chowdhury, A. & Maranas, C. D. Designing
overall stoichiometric conversions and
intervening metabolic reactions. Sci. Rep. 5,
16009 (2015).
20. Wattam, A. R. et al. PATRIC, the bacterial
bioinformatics database and analysis resource.
Nucleic Acids Res. 42, D581–D591 (2014).
21. Caspi, R. et al. The MetaCyc database of
metabolic pathways and enzymes and the
BioCyc collection of pathway/genome
databases. Nucleic Acids Res. 44, D471–D480
(2016).
22. Hastings, J. et al. The ChEBI reference
database and ontology for biologically relevant
chemistry: enhancements for 2013. Nucleic
Acids Res. 41, D456 – D463 (2013).
23. Kim, S. et al. PubChem Substance and
Compound databases. Nucleic Acids Res. 44,
D1202-13 (2016).
24. Kanehisa, M. & Goto, S. KEGG: Kyoto
Encyclopedia of Genes and Genomes. Nucleic
Acids Res. 28, 27–30 (2000).
25. Kanehisa, M., Furumichi, M., Tanabe, M.,
Sato, Y. & Morishima, K. KEGG: new
perspectives on genomes, pathways, diseases
and drugs. Nucleic Acids Res. 45, 27899662
(2017).
26. Kanehisa, M., Sato, Y., Kawashima, M.,
Furumichi, M. & Tanabe, M. KEGG as a
reference resource for gene and protein
annotation. Nucleic Acids Res. 44, D457–D462
(2016).
27. King, Z. A. et al. ESCHER. Escher: A web
application for building, sharing, and

16
embedding data-rich visualizations of
biological pathways 11, 1004321 (2015).
28. Savinell, J. M. & Palsson, B. O. Network
analysis of intermediary metabolism using
linear optimization. I. Development of
mathematical formalism. J. Theor. Biol. 154,
421–454 (1992).
29. Zomorrodi, A. R., Suthers, P. F., Ranganathan,
S. & Maranas, C. D. Mathematical optimization
applications in metabolic networks. Metab.
Eng. 14, 672–686 (2012).
30. Burgard, A. P., Pharkya, P. & Maranas, C. D.
OptKnock: A Bilevel Programming Framework
for Identifying Gene Knockout Strategies for
Microbial Strain Optimization. Biotechnol.
Bioeng. 84, 647–657 (2003).
31. Schutt, C. & Netzly, D. Effect of apiforol and
apigeninidin on growth of selected fungi. J.
Chem. Ecol. 17, 2261–2266 (1991).
32. Benzie, I. & Strain, J. the ferric reducing ability
of plasma(FRAP)as a measure of ‘Antioxidan
power’:the FRAP assay analytical
biochemistry. Anal. Biochem. 239, 70–76
(1996).
33. Illeghems, K., de Vuyst, L., Papalexandratou,
Z. & Weckx, S. Phylogenetic analysis of a
spontaneous cocoa bean fermentation
metagenome reveals new insights into its
bacterial and fungal community diversity. PLoS
One 7, (2012).
34. Jirat, B. & Jenkins, A. IUPAC. Compendium of
Chemical Terminology. Blackwell Scientific
Publications (1997).
35. Hwang, E. Il et al. Production of Plant-Speci c
Flavanones by. Appl. Environ. Microbiol. 69,
2699–2706 (2003).
36. Wu, J., Du, G., Zhou, J. & Chen, J. Systems
metabolic engineering of microorganisms to
achieve large-scale production of flavonoid
scaffolds. J. Biotechnol. 188, 72–80 (2014).
37. Hsieh, L. S., Ma, G. J., Yang, C. C. & Lee, P.
D. Cloning, expression, site-directed
mutagenesis and immunolocalization of
phenylalanine ammonia-lyase in Bambusa
oldhamii. Phytochemistry 71, 1999–2009
(2010).
38. Gui, J., Shen, J. & Li, L. Functional
Characterization of Evolutionarily Divergent 4-
Coumarate:Coenzyme A Ligases in Rice. Plant
Physiol. 157, 574–586 (2011).
39. Laboratories, K. KEGG: Kyoto Encyclopedia
of Genes and Genomes. 27, 29–34 (1998).
40. Alberstein, M., Eisenstein, M. & Abeliovich, H.
Removing allosteric feedback inhibition of
tomato 4-coumarate:CoA ligase by directed
evolution. Plant J. 69, 57–69 (2012).
41. Liu, B., Falkenstein-Paul, H., Schmidt, W. &
Beerhues, L. Benzophenone synthase and
chalcone synthase from Hypericum
androsaemum cell cultures: cDNA cloning,
functional expression, and site-directed
mutagenesis of two polyketide synthases. Plant
J. 34, 847–855 (2003).
42. Katsuyama, Y., Funa, N., Miyahisa, I. &
Horinouchi, S. Synthesis of Unnatural
Flavonoids and Stilbenes by Exploiting the
Plant Biosynthetic Pathway in Escherichia coli.
Chem. Biol. 14, 613–621 (2007).
43. Kyndt, J. A., Meyer, T. E., Cusanovich, M. A.
& Van Beeumen, J. J. Characterization of a
bacterial tyrosine ammonia lyase, a
biosynthetic enzyme for the photoactive yellow
protein. FEBS Lett. 512, 240–244 (2002).
44. Vlasov, V. & Pfau, T. Model manipulation.
(2017). doi:10.1016/B978-0-12-409548-
9.10134-4
45. Murabito, E., Simeonidis, E., Smallbone, K. &
Swinton, J. Capturing the essence of a
metabolic network: A flux balance analysis
approach. J. Theor. Biol. 260, 445–452 (2009).
46. Schellenberger, J., Lewis, N. E. & Palsson, B.
Elimination of thermodynamically infeasible
loops in steady-state metabolic models.
Biophys. J. 100, 544–553 (2011).
47. Persson, I. A. L. Tea Flavanols: An Overview.
Tea in Health and Disease Prevention
(Elsevier, 2013). doi:10.1016/B978-0-12-
384937-3.00006-9
48. Quattrocchio, F., Baudry, A., Lepiniec, L. &
Grotewold, E. The regulation of flavonoid
biosynthesis. in The Science of Flavonoids 97–
122 (Springer New York, 2006).
17
doi:10.1007/978-0-387-28822-2_4
49. Styles, E. D. & Ceska, O. Flavonoid pigments
in genetic strains of maize. Phytochemistry 11,
3019–3021 (1972).
50. Khalil, A., Baltenweck-Guyot, R., Ocampo-
Torres, R. & Albrecht, P.
Retrodihydrochalcones in Sorghum species:
Key intermediates in the biosynthesis of 3-
deoxyanthocyanidins? Phytochem. Lett. 5, 174–
176 (2012).
51. Firuzi, O., Lacanna, A., Petrucci, R., Marrosu,
G. & Saso, L. Evaluation of the antioxidant
activity of flavonoids by ‘ferric reducing
antioxidant power’ assay and cyclic
voltammetry. Biochim. Biophys. Acta - Gen.
Subj. 1721, 174–184 (2005).
52. Ouattara, H. G., Reverchon, S., Niamke, S. L.
& Nasser, W. Regulation of the synthesis of
pulp degrading enzymes in Bacillus isolated
from cocoa fermentation. Food Microbiol. 63,
255–262 (2017).

18
Supplementary 1. Reaction sets found with
OptKnock.
Supplementary 2. Antioxidant capacity by apiforol
concentrations compared to the FeSO4 calibration
curve

19
Supplementary 3. Abbreviations used in predicted metabolic pathways
abbreviation Name
akg 2-Oxoglutarate
glu__L L-Glutamate
phe__L L-Phenylalanine
phpyr Phenylpyruvate
nh3 Ammonia
cinnm Trans-Cinnamate
coa Coenzyme A
atp ATP
cinnmcoa Cinnamoyl-CoA
ppi Diphosphate
amp AMP
nadph Nicotinamide adenine dinucleotide phosphate - reduced
o2 O2
h H+
nadph Nicotinamide adenine dinucleotide phosphate - reduced
h2o H2O
coucoa 4-Coumaroyl-CoA
malcoa Malonyl-CoA
narcha naringenin chalcone
co2 CO2
nar naringenin
34hpp 3-(4-Hydroxyphenyl)pyruvate
tyr__L L-Tyrosine
nh4 Ammonium
Th4cinnm Trans 4 Hydroxycinnamate


![Engineering of Metabolic Pathways Using Synthetic Enzyme Complexes1… · Engineering of Metabolic Pathways Using Synthetic Enzyme Complexes1[OPEN] Nicholas Smirnoff2,3 Biosciences,](https://img.pdfslide.us/doc/110x75/5eba4b9504ad29098d67bc72/engineering-of-metabolic-pathways-using-synthetic-enzyme-engineering-of-metabolic.jpg)