Embed Size (px)
Citation preview
PREDICTION OF MECHANICAL PROPERTY OF
CARBONATE ROCKS FROM PHYSICAL, PETROGRAPHIC
AND CMEMICAL PROPERTIES
Samerhkea Promma
A Thesis Submitted in Partial Fulfillment of the Requirements for the
Degree of Master of Engineering in Geotechnology
Suranaree University of Technology
Academic Year 2014
การประเมนคณสมบตเชงกลศาสตรของหนคารบอเนตจากคณสมบตทางกายภาพ ศลาวทยาและเคม
นางสาวเสมอแข พรมมา
วทยานพนธนเปนสวนหนงของการศกษาตามหลกสตรปรญญาวศวกรรมศาสตรมหาบณฑต
สาขาวชาเทคโนโลยธรณ มหาวทยาลยเทคโนโลยสรนาร
ปการศกษา 2557
PREDICTION OF MECHANICAL PROPERTY OF CARBONATE
ROCKS FROM PHYSICAL, PETROGRAPHIC AND
CHEMICAL PROPERTIES
Suranaree University of Technology has approved this thesis submitted in
partial fulfillment of the requirements for a Master’s Degree.
Thesis Examining Committee
(Prof. Dr. Kittitep Fuenkajorn)
Chairperson
(Dr. Anisong Chitnarin)
Member (Thesis Advisor)
(Dr. Decho Phueakphum)
Member
(Prof. Dr. Sukit Limpijumnong) (Assoc. Prof. Flt. Lt. Dr. Kontorn Chamniprasart)
Vice Rector for Academic Affairs Dean of Institute of Engineering
and Innovation
เสมอแข พรมมา : การประเมนคณสมบตเชงกลศาสตรของหนคารบอเนตจากคณสมบตทางกายภาพ ศลาวทยาและเคม (PREDICTION OF MECHANICAL PROPERTY OF CARBONATE ROCKS FROM PHYSICAL, PETROGRAPHIC AND CHEMICAL PROPERTIES) อาจารยทปรกษา : อาจารย ดร.อานสงส จตนารนทร, 89 หนา.
การศกษาครงนมวตถประสงคเพอประเมนคณสมบตทางกลศาสตรของหนคารบอเนตจากคณสมบตทางกายภาพ (คาความหนาแนน ความพรนและความเรวคลน)ลกษณะทางศลาวทยา และองคประกอบทางเคมของหนโดยท าการทดสอบหนเพอหาคณสมบตก าลงรบแรงกดสงสดในแกนเดยว ก าลงรบแรงดงสงสด คาดชนความคงทน และคาความตานทานตอการสกรอนของมวลหนหยาบ ลกษณะเนอหนคารบอเนตศกษาโดยใชกลองจลทรรศนแสงโพลาไรซ การจ าแนกหนปนท าตามแบบของ Folk (1962) ปรมาณองคประกอบของหนปนไดแกมวลรวมคารบอเนต (allochem)เนอพน (mud matrix) และวตถประสานเนอแคลไซต (calcite cement)หาไดจากการเปรยบเทยบแผนภาพและวธการนบจด โดยสามารถแยกหนปนไดสองชนดหลก คอ หนปน มกไครท (Micrite limestone) และหนปนสปารไรท (Sparitic limestone)และไดค านวณอตราสวนของมกไครท และสปารไรท ในการวเคราะหองคประกอบทางเคมของตวอยางหน ไดใชเทคนคการเลยวเบนของรงสเอกซ ซงพบวาตวอยางหนททดสอบมแรแคลไซตเปนองคประกอบหลก ( รอยละ67.82ถง รอยละ100) และในบางตวอยางมแรอน อาท ควอ ตซ (รอยละ0.10ถงรอยละ11.01) แรดนเหนยว (รอยละ0.59ถงรอยละ1.62)โดโลไมต (รอยละ0.14ถงรอยละ0.57) และแรเหลกทมปรมาณนอยกวารอยละ 1.00 ผลการทดสอบและวเคราะหระบวา คณสมบตทางกายภาย ไดแก ความหนาแนนและความเรวคลนปฐมภม มอทธพลตอคณสมบตเชงกลศาสตรบางชนด โดยคาก าลงรบแรงกดสงสดในแกนเดยว คาสมประสทธความยดหยน และคาก าลงรบแรงดงสงสด มแนวโนมขนอยกบความหนาแนนและความเรวคลนปฐมภม แตคาสมประสทธความยดหยนไมมความสมพนธทชดเจนกบความเรวคลนปฐมภม สวนคาดชนความคงทนและคาความตานทานตอการสกรอนของมวลหนหยาบไมขนอยกบความหนาแนนและความเรวคลนปฐมภม ความสมพนธระหวางคณสมบตเชงกลศาสตรและอตราสวนของ มกไครท ตอสปารไรท แสดงใหเหนวาในหนตวอยางทมอตราสวน มกไครท ตอสปารไรท สง จะมคาก าลงรบแรงกดสงสดในแกนเดยว คาสมประสทธความยดหยน และคาก าลงรบแรงดงสงสดลดลง อยางไรกตามความสมพนธนไมมความชดเจนเชงสถต เมอพจารณาผลกระทบของแรองคประกอบตอคณสมบตเชงกลศาสตร พบวาแรควอตซทมปรมาณนอยกวา รอยละ 1.00 จะไมมผลตอคณสมบตทางกล ศาสตรของตวอยางหน
II
ททดสอบ แตในตวอยางหนปนทมควอตซรอยละ 11.01พบวาคาก าลงรบแรงกดสงสดในแกนเดยว คาสมประสทธความยดหยน และคาก าลงรบแรงดงสงสดมคาสงขน การเพมขนของปรมาณแรดนเหนยวในหนปนมแนวโนมทจะท าใหคาก าลงรบแรงกดสงสดในแกนเดยว คาสมประสทธความยดหยน และคาก าลงรบแรงดงสงสดเพมขน ส าหรบหนทราเวอทนซงมความพรนมาก และปรมาณ แรควอตซและแรดนเหนยวนอย พบวามความแขง มากกวาหนปนสปารไรท หนออนซงประกอบดวยผลกแคลไซตเปนองคประกอบหลก จะมความหนาแนนปานกลางและมคณสมบตทางกลศาสตรในระดบปานกลางของกลมตวอยาง
สาขาวชาเทคโนโลยธรณ ลายมอชอนกศกษา
ปการศกษา2557 ลายมอชออาจารยทปรกษา
SAMERHKEA PROMMA: PREDICTION OF MECHANICAL PROPERTY
OF CARBONATE ROCKS FROM PHYSICAL, PETROGRAPHIC AND
CHEMICAL PROPERTIES.THESIS ADVISOR:ANISONG CHITNARIN,
Ph.D.,89 PP.
CARBONATE ROCKS/ MECHANICAL PROPERTY/ PHYSICAL PROPERTY/
PETROGARPHY/MINERAL COMPOSITION
The objective of this study is to estimate the mechanical properties of
carbonate rocks by using their physical properties (density, porosity and wave
velocity) petrography and chemical composition. The mechanical tests of rocks are
performed to determine uniaxial compressive strength, Brazillian tensile strength,
slake durability index and Los Angeles abrasion and impaction. The limestone
classification is based on Folk’s scheme (Folk, 1962). Texture of the limestones is
studied under a polarized light microscope. The quantification of limestone
components such as allochem, mud matrix and calcite cement is based on comparison
charts and point counting method. The limestone samples can be classified to two
board types: Micritic limestone and Sparitic limestone. The sparite-to-micrite ratio of
each sample is also calculated. The chemical composition of the rock samples is
analyzed by X-ray diffraction technique. All specimens are composed of mainly
calcite (about 67.82-100%). Some specimens contain quartz (about 0.10 to 11.01%),
clay mineral (about 0.59 to 1.62%), dolomite (about 0.14 to 0.57%) and Fe-bearing
minerals are detected in less than 1%.The results indicate that density and P-
wavevelocity have some effects on the mechanical properties that is the
uniaxialcompressive strength, elastic modulus and Brazilian tensile strength tend to
depend on
IV
density and P-wave velocity. The elastic modulus also shows inconclusive tend with
P-wave velocity. The slake durability index and Los Angeles abrasion and impaction
test of the tested carbonate rocks tend to be independent of their density and P-wave
velocity. The relationship between the mechanical properties and the sparite-to-
micrite ratio indicates that the uniaxial compressive strength, elastic modulus, and
tensile strength values decrease with increasing sparite-to-micrite ratio. However, this
relationship is statistically unclear. For the mineral composition, quartz content of
less than 1% has no significant effect on the mechanical properties of the tested rock
specimens. However, the higher amount of quartz (in a sample contenting11.01%)
results in the higher uniaxial compressive strength, elastic modulus and Brazilian
tensile strength. The increase of clay mineral content of limestone tends to increase
the uniaxial compressive strength, elastic modulus and Brazilian tensile strength. The
tested travertine which has high porosity and small amounts of quartz and clay
mineral content has the higher strength than the sparitic limestone. The marbles
which consist of mainly calcite crystals have moderate density and their mechanical
properties are in middle range of the tested carbonate rock specimens.
School of Geotechnology . Student’s Signature
Academic Year 2014 Advisor’s Signature
ACKNOWLEDGMENTS
I wish to acknowledge the funding supported by Suranaree University of
Technology (SUT).
I would like to express my sincere thanks to Dr. Anisong Chitnarin for her
valuable guidance and efficient supervision. I appreciate her strong support,
encouragement, suggestions and comments during the research period. My heartiness
thanks to Prof. Dr. Kittitep Fuenkajorn and Dr. Decho Phueakphum for their
constructive advice, valuable suggestions and comments on my research works as
thesis committee members. Grateful thanks are given to all staffs of Geomechanics
Research Unit, Institute of Engineering who supported my work.
Finally, I would like to thank beloved parents for their love, support and
encouragement.
Samerhkea Promma
V
TABLE OF CONTENTS
Page
ABSTRACT (THAI) ..................................................................................................... I
ABSTRACT (ENGLISH) ............................................................................................III
ACKNOWLEDGEMENTS .......................................................................................... V
TABLE OF CONTENTS ............................................................................................ VI
LIST OF TABLES ...................................................................................................... IX
LIST OF FIGURES ...................................................................................................... X
SYMBOLS AND ABBREVIATIONS ..................................................................... XIII
CHAPTER
I INTRODUCTION ............................................................................1
1.1 Background and rationale ..........................................................1
1.2 Research objectives ....................................................................2
1.3 Scope and limitations .................................................................2
1.4 Research methodology ...............................................................3
1.4.1 Literature review .............................................................3
1.4.2 Sample preparation .........................................................3
1.4.3 Laboratory testing ...........................................................5
1.4.4 Relationships between mechanical properties and
physical, petrographical and chemical properties. ..........5
1.4.5 Discussions, conclusions and thesis writing ...................6
VII
TABLE OF CONTENTS (Continued)
Page
1.5 Thesis contents ...........................................................................6
II LITERATURE REVIEW ................................................................7
2.1 Classification of carbonate rocks ...............................................7
2.2 Physical, chemical and mechanicla properties of carbonate
rocks ......................................................................................12
2.3 Petrographical and mechanical properties of carbonate rocks .18
III SAMPLE PREPARATION ...........................................................27
3.1 Sample collection .....................................................................27
3.2 Sample preparation ..................................................................27
IV LABORATORY EXPERIMENT .................................................37
4.1 Physical properties testing .......................................................37
4.1.1 Density and porosity measurement ...............................37
4.1.2 Wave velocity measurement .........................................38
4.2 Mechanical properties testing ..................................................42
4.2.1 Uniaxial compressive strength test ...............................42
4.2.2 Brazilian Tensile strength test ......................................46
4.2.3 Slake durability index test ............................................50
4.2.4 Los Angeles abrasion and impaction test .....................52
4.3 Petrographic analysis ...............................................................55
4.4 Chemical analysis ....................................................................65
VIII
TABLE OF CONTENTS (Continued)
Page
V RELATIONSHIPS BETWEEN MECHANICAL, PHYSICAL,
PETROGRAPHIC AND CHEMICAL PROPERTIES .......................71
5.1 Relationship between mechanical and physical properties ......71
5.2 Relationship between mechanical properties and petrographic
property ....................................................................................75
5.3 Relationship between mechanical properties and mineral
composition ..............................................................................75
VI DISCUSSIONS AND CONCLUSIONS .......................................80
6.1 Discussions and conclusions ....................................................80
6.2 Recommendations for future studies .......................................82
REFERENCES ............................................................................................................83
BIOGRAPHY ..............................................................................................................89
LIST OF TABLES
Table Page
2.1 Classification of different types of building limestone 38
2.2 Summary of mechanical properties, physical properties and mineralogical
composition of carbonate rocks 25
3.1 Initial classification of the carbonate rocks in this study. 53
3.2 Specimen code used in this study. 29
4.1 Physical properties of the specimens. 40
4.2 Test results from the uniaxial compressive strength testing 44
4.3 Test results from the Brazilian tensile strength testing 48
4.4 Test results from the slake durability index testing andLos Angeles abrasion and
impact testing 54
4.5 Petrographic characteristic as properties of the carbonate rocks samples 56
4.6 XRD analysis of the studied carbonate rocks 66
LIST OF FIGURES
Figure Page
1.1 Research methodology 4
2.1 Dunham’s classification of carbonate rocks 10
2.2 Folk’s classification of carbonate rocks 11
2.3 Correlation of sound velocity and rock properties 15
2.4 Photomicrographs of the micritelimestone: (a)Biomicrite and (b)
Fossiliferousmicrite with globotruncana in the middle 21
2.5 Photomicrographs of the allochemicallimestone: (a) Fine-grained
intrabiosparite and (b) Coarse-grainedbiosparite 21
2.6 The obtained microfaciestypes :(a)Packstone, (b) Wackstoneand (c)
Grainstone 24
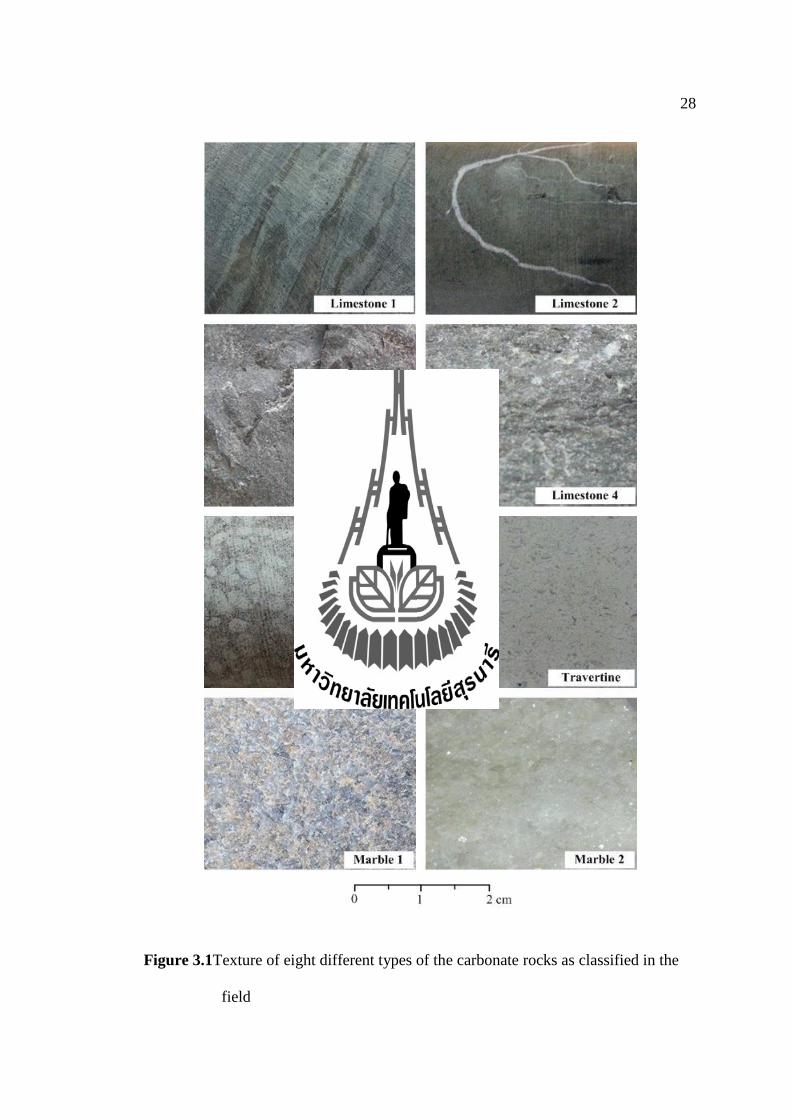
3.1 Texture of eight different types of the carbonate rocks as classified
in the field 28
3.2 Examples for measurement of density, porosity, wave velocity and uniaxial
compressive strength test 32
3.3 Examples of Brazillian tensile strength 32
3.4 Examples of Slake durability index test and Los Angeles abrasion and
impaction test 33
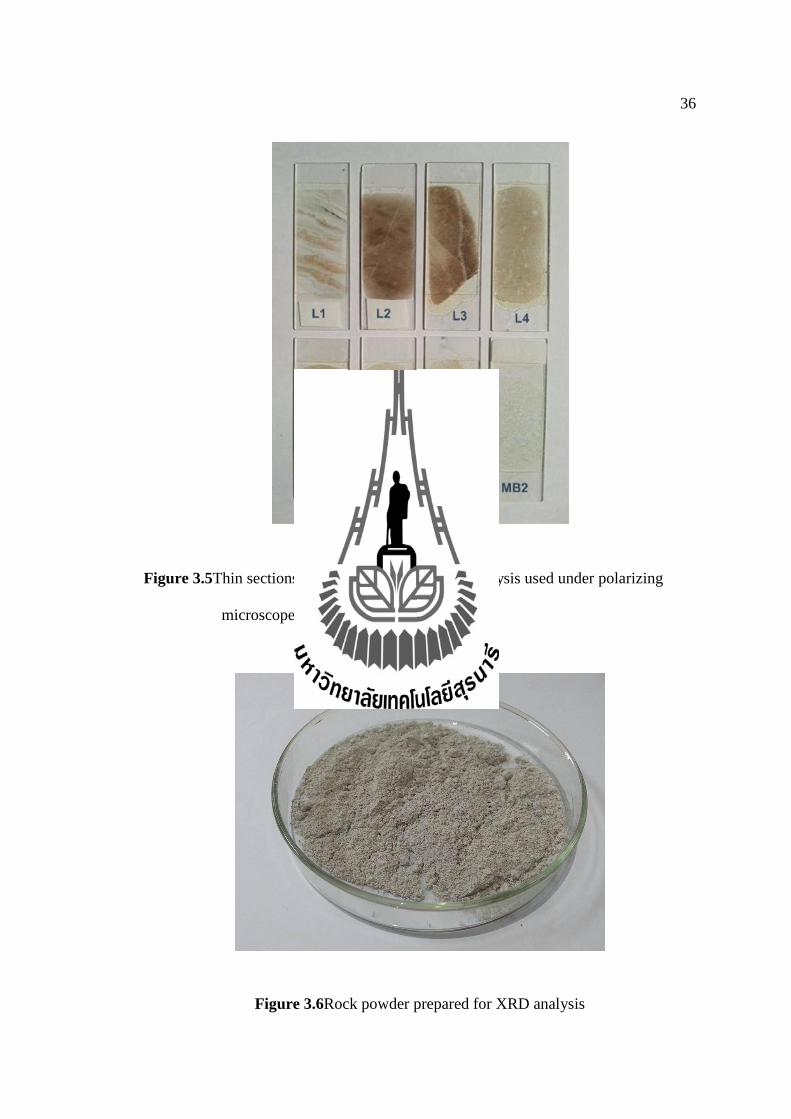
3.5 Thin sections prepared for petrographic analysis used under polarizing
microscope 36
XI
LIST OF FIGURES (Continued)
Figure Page
3.6 Rock powder prepared for XRD analysis 36
4.1 Porosity measurement device 39
4.2 Wave velocity measurements device 39
4.3 Uniaxial compressive strength test device 43
4.4 Example of the rock samples with failed under loading from uniaxial
compressive strength testing 43
4.5 Brazilian tensile strength test. The specimen is loaded diametrically with
compression load frame 47
4.6 Examples of the specimens after from Brazilian tensile strength test 47
4.7 Slake durability index testing apparatus 51
4.8 Examples of the specimens after testing of slake durability index test 51
4.9 Los Angeles abrasion and impaction testing machine 53
4.10 Examples of the specimens after testing of Los Angeles abrasion and
impaction test 53
4.11 Representative photomicrographs of limestone 1:Micrite 57
4.12 Representative photomicrographs of limestone 2: Sparse biomicrite 58
4.13 Representative photomicrographs of limestone 3: Sparse biomicrite 59
4.14 Representative thin section micrographs of limestone 4: Rounded pelsparite 60
4.15 Representative photomicrographs of limestone 5: Packed biomicrite 61
4.16 Representative photomicrographs of travertine: Sparse biomicrite 62
XII
LIST OF FIGURES (Continued)
Figure Page
4.17 Representative photomicrographs of marble 1: Brownish gray marble 63
4.18 Representative photomicrographs of marble 2: White marble 64
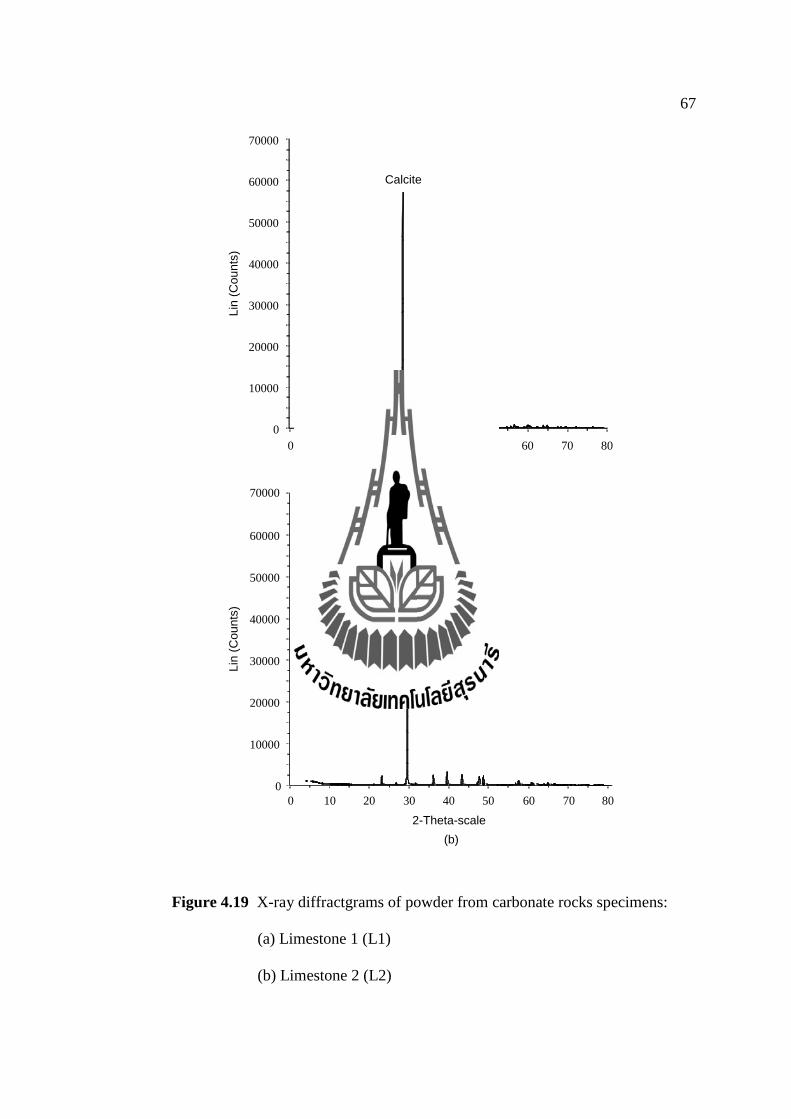
4.19 X-ray diffractgrams of powder from carbonate rocks specimens:
(a) Limestone 1 (L1)
(b) Limestone 2 (L2) 67
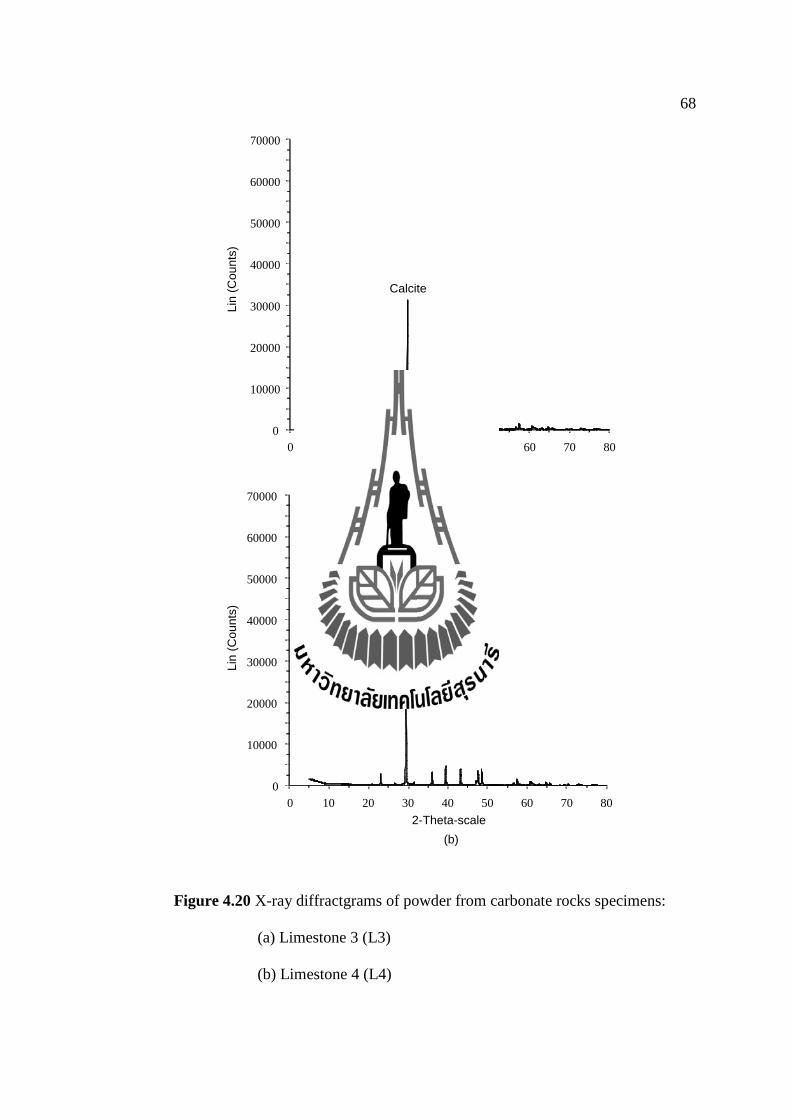
4.20 X-ray diffractgrams of powder from carbonate rocks specimens:
(a) Limestone 3 (L3)
(b) Limestone 4 (L4) 68
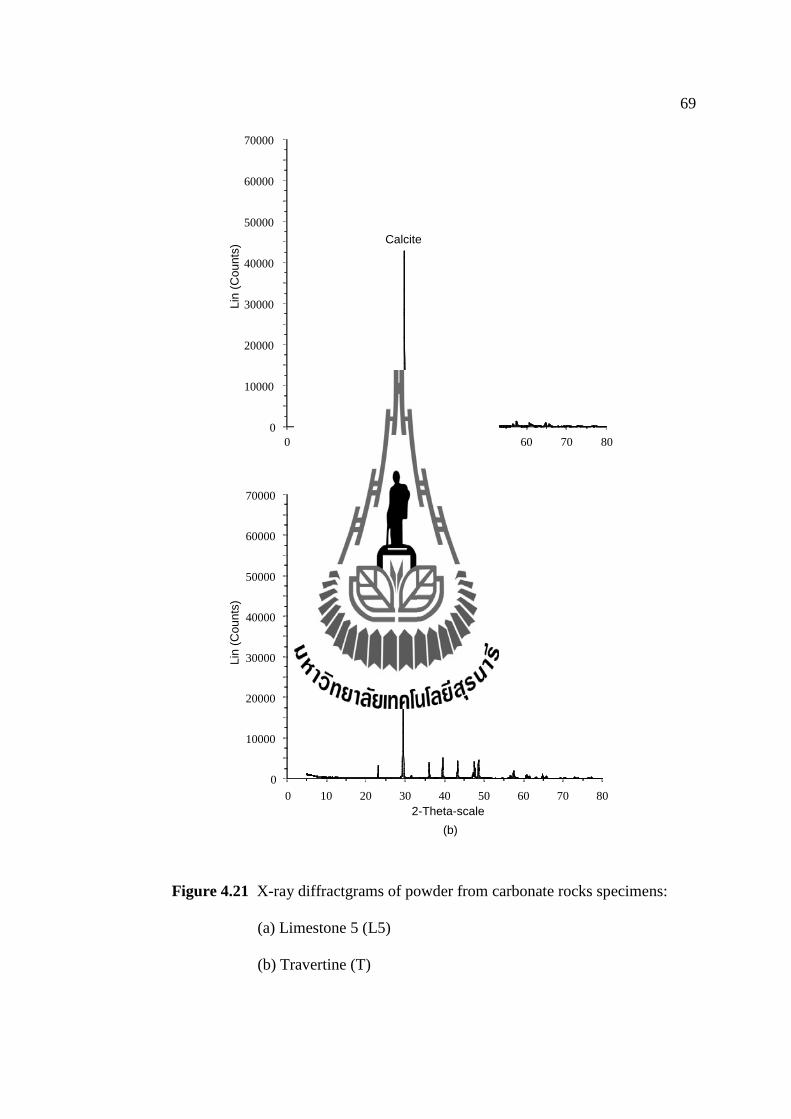
4.21 X-ray diffractgrams of powder from carbonate rocks specimens:
(a) Limestone 5 (L5)
(b) Travertine (T) 69
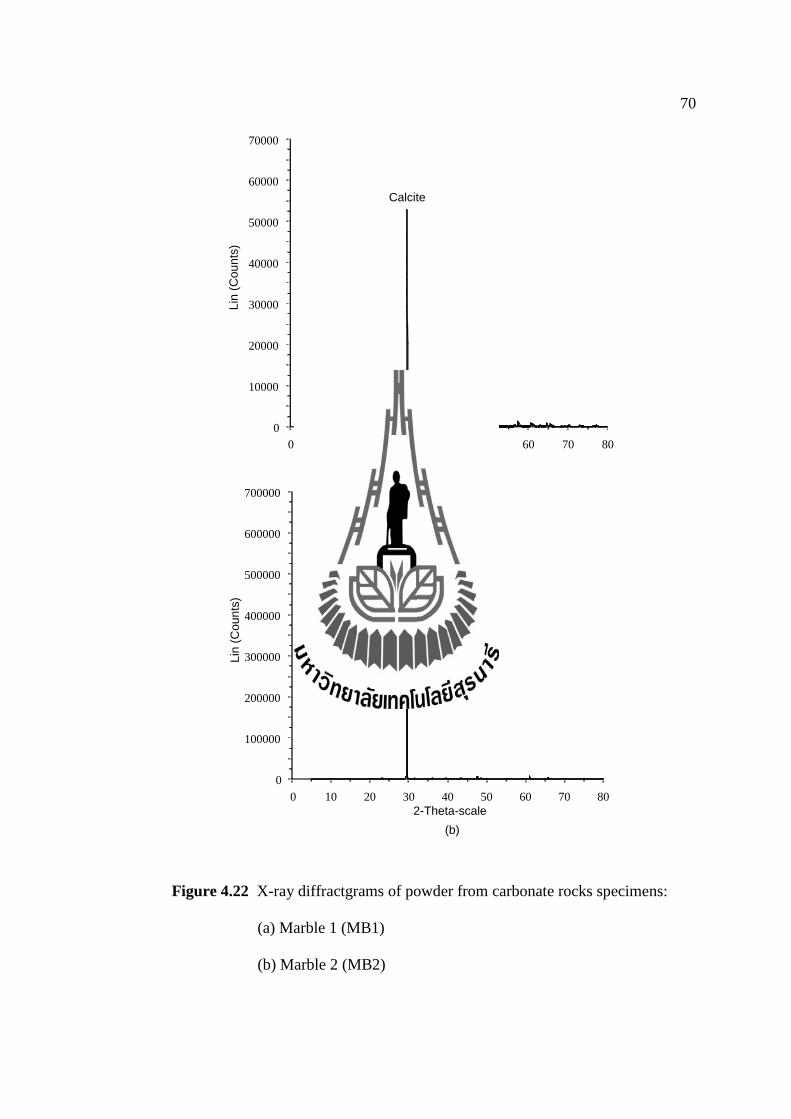
4.22 X-ray diffractgrams of powder from carbonate rocks specimens:
(a) Marble 1 (MB1)
(b) Marble 2 (MB2) 70
5.1 Relationship between the mechanical properties and density 73
5.2 Relationship between the mechanical properties and P-wave velocity 74
5.3 Relationship between the mechanical properties and sparite to micrite ratio 76
5.4 Relationship between the mechanical properties and quartz content 78
5.5 Relationship between the mechanical properties and clay mineral content 79
SYMBOLS ANDABBREVIATIONS
c = Uniaxial Compressive Strengths
P = Failure Load
A = Initial Cross-Sectional Area
E = Elastic Modulus
L = Thickness of Specimen
B = Tensile Strengths
Pf = Applied Load at Failure
D = Diameter of Specimen
Id = Slake Durability Index
CHAPTER I
INTRODUCTION
1.1 Background and rationale
Carbonate rocksare exposed in central Thailand. They are predominantly
limestone with locally marble and are economically important as sources of raw
materialsfor Portland cement and construction industries.The quality of carbonate
rocksare determined by mineralogical characteristics and physic-mechanical
properties. However, the significant geotechnical properties such as strength,
durability, elasticity of limestone can be determined by sets of laboratory testing
which are costly and time consuming.
Carbonate rockscompose mainly of calcium carbonate; howeverlimestone and
marble are formed in different origins.Limestone can originate from skeletons and
fragments of marine organisms, and usually compose of argillaceous
sediments.Marble is formed by contact metamorphic process and composed of nearly
100 % calcite.Such various compositions result in different textures and chemical
compositionswhich affect the mechanical properties of the rocks. Therefore study
petrographic including texture and composition under microscope along with
chemical analysis may reveal the effects of them on the mechanical properties of the
carbonate rocks. Howeverknowledge of the relationship between physical, chemical
and mechanical properties of carbonate rocks in Thailand is rare.
2
1.2 Research objective
The objective of this study is to estimate the mechanical properties of
limestones,travertine and marbles by using physical, petrographical properties and
chemical composition. The rock samples were prepared for slab thin sections and
studied under polarized microscope. The mechanical tests such as uniaxial
compressive strength, Brazillian tensile strength, Los Angeles abrasion, slake
durability index were conducted. The physical properties such as density, porosity and
wave velocity were conducted. Crushed samples were analyzed by XRD technique for
chemical composition.
1.3 Scope and limitations
The scope and limitations of the research include as follows.
1. Carbonate rocks of the Saraburi Group exposed in Phetchabun,
NakhonSawan, Lopburi, Saraburiprovinces are collected for this research.
2. Rock thin sections are prepared for petrographic study.
3. Chemical compositions of the carbonate rocks are obtained by X-ray
Diffraction technique (XRD).
4. The rock specimens for mechanical tests are prepared following ASTM
standard practices.
5. Mechanical tests in their study include uniaxial compressive strength test,
Brazillian tensile strength test, slake durability index test, Los Angeles
abrasion and impaction test.
6. The tests for physical properties includedensity, porosity and wave
velocity.
3
1.4 Research methodology
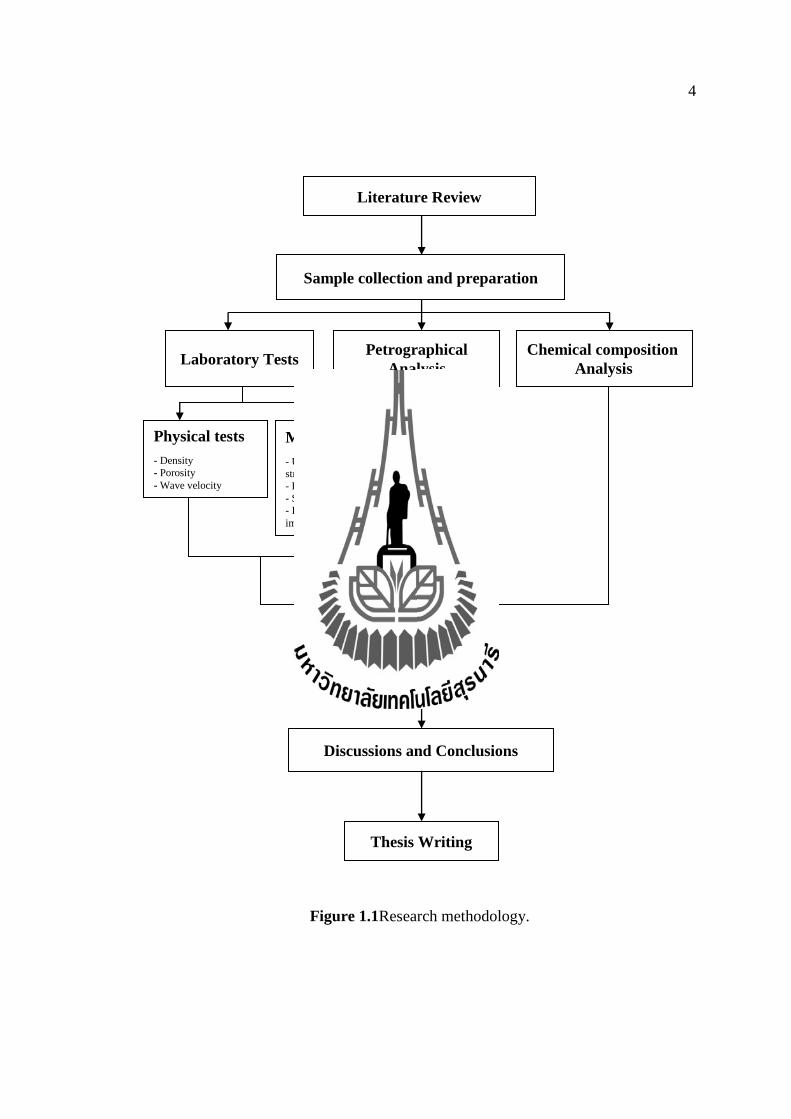
The research methodology comprises of 6 steps including 1) literature review,
2) sample collection and preparation, 3) laboratory testing, chemical composition analysis
and petrographic analysis, 4) data analysis, 5) discussions and conclusions and 6) thesis
writing and presentation (Figure 1.1).
1.4.1 Literature review
Literature review is carried out in order to understandphysical and
mechanical properties of sedimentary rocks especially, the carbonate type.These
include the petrographical properties and chemical composition of sedimentary rocks
and theeffects of mineralogical and textural characteristics on the mechanical
properties of the carbonate rocks. Sources of information are text books, journals,
technical reports and conference papers.
1.4.2 Sample preparation
Rock samples used in this research are the carbonate rocks of the
Saraburi group collected from Phetchabun, NakhonSawan, Lopburi andSaraburi
areas. The samples were prepared at the Geomechanics laboratory, Suranaree
University of Technology for the physical and the mechanical tests, the petrographic
study and the chemical analysis.
4
Figure 1.1Research methodology.
Thesis Writing
Discussions and Conclusions
Mechanical tests
- Uniaxial compressive strgngth
- Brazilliantensilestrength
- Slake durability index - Los Angeles abrasionand
impaction
Literature Review
Laboratory Tests
Physical tests
- Density
- Porosity
- Wave velocity
Petrographical
Analysis
Chemical composition
Analysis
Sample collection and preparation
Data analysis
5
1.4.3 Laboratory experiment
1) Physical testing
The physical testing included density and porosity (ASTM C97),
wave velocity (ASTM D2845)of the carbonate rocks.
2) Mechanical testing
The mechanical testing include the uniaxial compressive strength
(ASTM D7012), Brazilian tensile strength tests(ASTM D3967), the slake durability
index (ASTM D4644) and Los Angeles abrasionand impaction test (ASTM C-131).
3) Chemical composition Analysis
Chemical analyses of the carbonate rocks are carried out by means
of X-ray diffraction (XRD).
4) Petrographical Analysis
Petrographical study iscarried out by thin section analysis.Polished
thin sections are prepared and examined undera polarized lightmicroscope.Petrologic
parameters includedetermination of texture and classification of rock types.
1.4.4 Relationships between mechanical properties and physical,
petrographical and chemical properties.
The results from laboratory areused to establish relationship between
mechanical properties and physical,petrogarphical and chemicalproperties.
6
1.4.5 Discussions, conclusions and thesis writing.
All aspects of the studies mentioned are documented and incorporated
into the thesis. The discussions on validity and potential applications of the results are
also mentioned in this thesis. The research or findings are published in the conference
proceedings or journals.
1.5 Thesis contents
This thesis is divided into seven chapters; the first chapter includes
background and rationale, research objectives, scope and limitations and research
methodology,Chapter II presents the literature reviews, Chapter III describes the
sample preparations,Chapter IVexplains the laboratory experiment, Chapter Vpresents
the relationships between physic-mechanical properties and petrogarphic and
chemical composition and Chapter VIpresentsthe discussions, the conclusions and
recommendations for future studies.
CHAPTER II
LITERATURE REVIEW
Literatures related to the physical, chemical, petrographic and mechanical
properties of the carbonate rocks have been reviewed in this research.
2.1 Classification of carbonate rocks
Perhaps, the most widely used classifications of limestone are those of Folk
(1959, 1962) and Dunham (1962). Dunham’s schemehas advantage over Folk’s
during a field investigation. Folk’s scheme is much useful for polarizing microscopy.
Both classifications subdivide limestones primarily on the basis of matrix content.
Calcite mud (micrite) is microcrystalline calcite and grain size generally less than 4
m. Micrites are susceptible to digenetic alteration and may be replaced by coarser
mosaics of microsper (5-15 m). Spary calcite is invariably precipitated after the
fibrous calcite described earlier which is mostly a main cement. Carbonate particles
can be divided allochemical. However, details of compositional and textural
constituents of the carbonates that reflect the depositional and digenetic history of the
carbonate rocks can be found in Flügel(1982), Moore (1989), Tucker (1991),
Microfacies analysis according to Flügel which has different classification is aimed
for specific objectives such as paleoenvironment and basin analysis. Dunham's
classification and its modification by Embry and Klovan (1971) and James (1984)
8
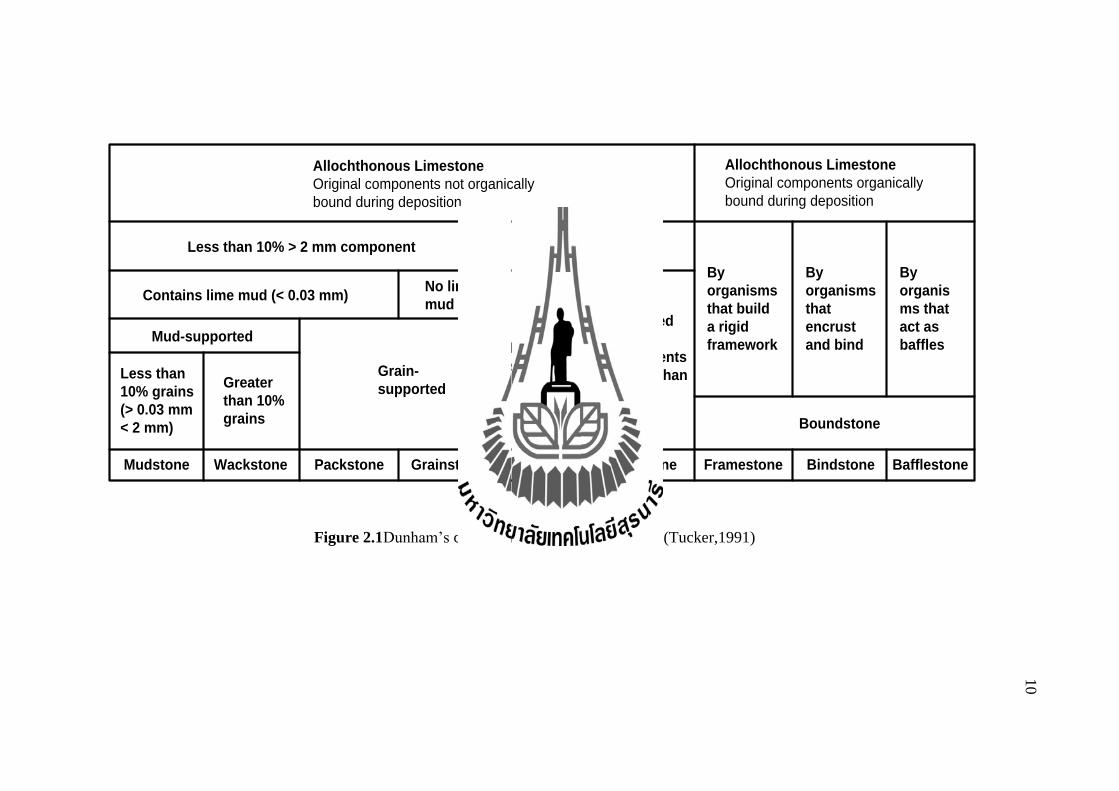
deal with depositional texture (Figure 2.1). For this reason, scheme may be better
suited for rock descriptions that employ a hand specimen or thin section under
thebinocular microscope.This subdivision is based on the particle fabic and on the
kind of particle binding during sedimentation. In the former a distinction is made
between mud-supported and grain-supported fabic. Dunham used names that combine
the name of fabic types with the name of the grain type: mudstone (mud supported,
<10% grain), wackestone (mud supported, > 10% grain), packstone (grain support),
grainstone (lacks mud and grain support).
The system of classification suggested by Folk (Figure 2.1) is based upon the
fact that, in principle, carbonate rocks are comparable to sandstone and shales, in
regard to sedimentation. Based on the percentage of interstitial material, the rocks
may be further subdivided into two groups: sparryallochemicallimestones(containing
a sparry calcite cement of clear coarsely crystalline mosaic calcite crystals)and
microcrystalline allochemical limestone(containing microcrystallincalcite mud,
micrite, which is subtranslucent grayish or brownish particles less than about 5
microns in size).The names are formed by combining terms for matrix (micrite),
cement (sparite) and particles (allchemical) (Figure 2.2).
Marble is metamorphic rock which composes of recrystallized carbonate
minerals. It is generally refer to metamorphosed limestone.Metamorphism causes
variable recrystallization of the original carbonate mineral grains. The resulting
marble rock is typically composed of an interlocking of carbonate crystals. Primary
sedimentary textures and structures of the original carbonate rock have typically been
modified or destroyed.It comes in a vast range of colors from white, green, red to
black and its veining generally contrasts with the base stone color (Chan,
9
1994).Marble texture is described based on number of grain components. A
graincomponent is a primitive unit of morphology (Suresh et al., 2008).White and
homogenous marble is the result of metamorphism of very pure limestone. When
other material is involved in the marble formation process, the homogenous structure
disappears and veins, spots show up as textures on marble (Ar and Akgul, 2008).
Allochthonous Limestone
Original components organically
bound during deposition
Allochthonous Limestone
Original components not organically
bound during deposition
Less than 10% > 2 mm component
Contains lime mud (< 0.03 mm)
Mud-supported
No lime
mud
Grain-
supportedLess than
10% grains
(> 0.03 mm
< 2 mm)
Greater
than 10%
grains
By
organisms
that build
a rigid
framework
By
organisms
that
encrust
and bind
By
organis
ms that
act as
baffles
Greater than 10%
> 2 mm components
Mud-
supported
Supported
by grain
components
coarser than
2 mm
Mudstone Wackstone Packstone Grainstone Floatstone Rudstone
Boundstone
Framestone Bindstone Bafflestone
Figure 2.1Dunham’s classification of carbonate rocks (Tucker,1991)
10
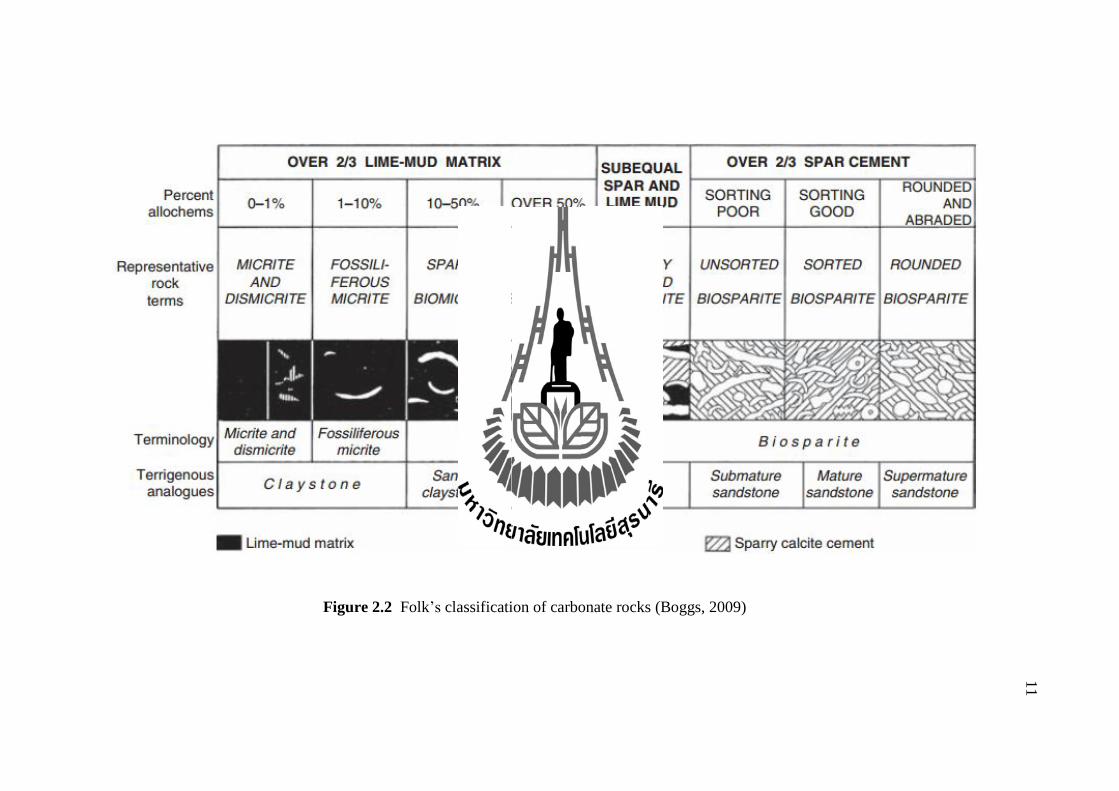
Figure 2.2 Folk’s classification of carbonate rocks (Boggs, 2009)
11
12
2.2 Physical, chemical and mechanical properties of carbonate
rocks
Several researchers have studied and gathered the relevant information on
physical, mechanical and chemical properties of the carbonate rocks. The common
physical properties are density; porosity and wave velocity. The mechanical
properties include uniaxial compressive strength; tensile strength; slake durability
index test and Los Angles abrasion and impaction. The chemical properties
involvemineral composition of the limestones and marbles.
Tourenq and Archimbaud (1976) found that mineralogy, structure, and
porosity were fundamental parameters for characterization of carbonate rocks. The
porosity was considered to be the paramount important. The clay mineral content was
stressed as a relevant component of the mineralogy. They presented correlation
between physical and mechanical properties to enable characterization of pure
carbonate (without clay mineral) by three parameters: (1) porosity, ultrasonic velocity
and Young’s modulus(2) ultimate compression strength, tensile strength and hardness
and(3) drillability, abrasion loss and dynamic fragmentation.
Rodrigues (1988) proposed that the carbonate rocks were composed
predominantly of calcite (CaCO3) with variable amounts of accessory minerals,
among which quartz and clay minerals were the most relevant from the geotechnical
point of view. A smaller proportion was composed predominantly of dolomite
considerably their geotechnical properties.
The most probable quartz and clay minerals occurred in large range of percent
composition. The differences in geotechnical behavior produced by the access
minerals when coupled with their variation influence strikingly the geotechnical
13
properties of carbonate rocks. The influence of quartz and clay mineral on the
properties of carbonate rocks was clearly dissimilar. Quartz was chemically and
mechanically more resistant than calcite. Its occurrence in carbonate rocks might be
beneficial for some geotechnical properties. Clay mineral, on the other hand, due to
their peculiar crystal structure and properties always contributed to the degradation of
the geotechnical behavior of the carbonate rocks.
Hatzor and Palchik (1998) investigated the influence of physical properties
such as porosity, mean grain size on compressive strength of heterogeneous
dolomites. Theyconcluded that previous workers who had reported exceptionally
good correlation between mean grain size and compressive strength must had tested
extremely homogeneous samples, in which the only textural variable was the mean
grain size. In heterogeneous rock, however, voids, which might function as stress
concentrators and as nucleation sites, must be considered. They developed a new
model for the compressive strength of the brittle, heterogeneous Aminadav dolomites,
based upon porosity, mean grain size, and elastic modulus. In their model, peak axial
stress is inversely related to the square root of mean grain size, and to porosity, and
was directly related to the elastic modulus and confining pressure.
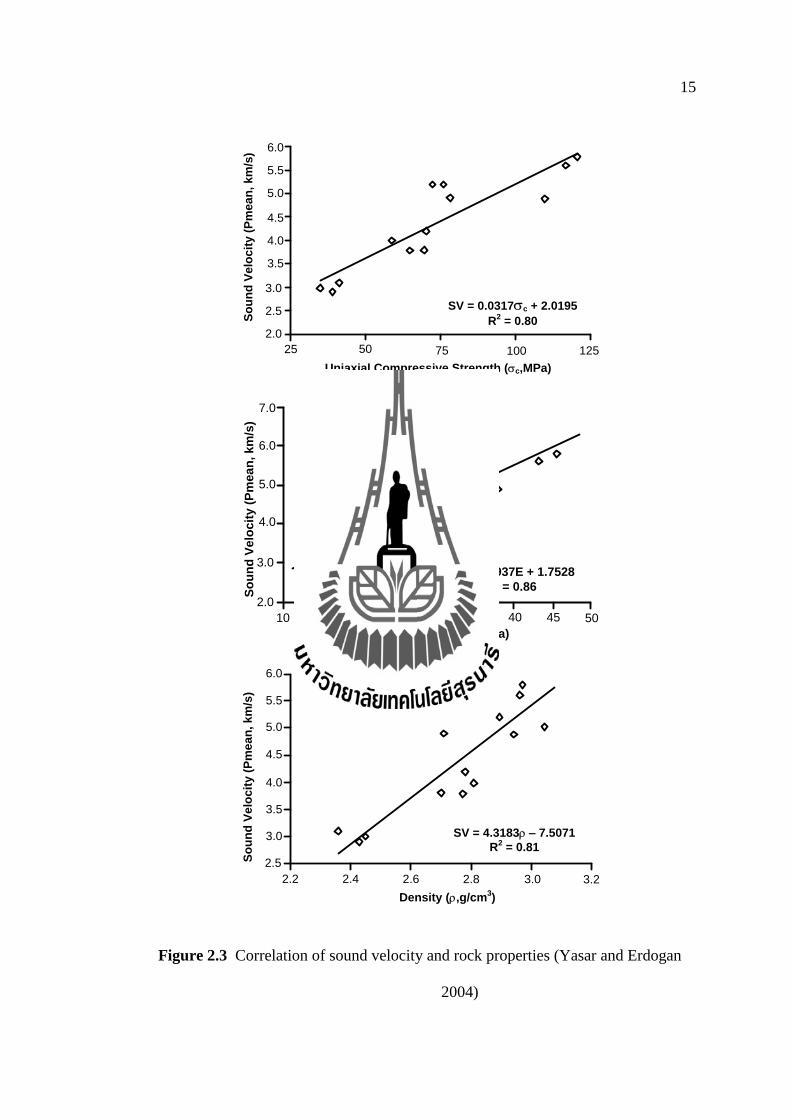
Yasar and Erdogan (2004) determined the mechanical and physical properties
of carbonate rocks using P-wave velocity.Ultrasonic techniques are known as non-
destructive and easy to apply, both for site and laboratory conditions. In rock
engineering, sound velocity (SV) techniques have increasingly been used to determine
the dynamic properties of rocks. The SV of a rock mass is closely related to the intact
rock properties and measuring the velocity in rock masses interrogates the rock
structure and texture. In their experiment,the important influencing factors were rock
14
type, mineralogical composition, rock texture and structure, grain size and shape,
density, porosity, anisotropy, porewater, confining pressure, temperature, weathering
and alteration zones, bedding planes, and joint properties.The samples of rocks were
tested in the Mining Engineering laboratory of Cukurova University for determination
of statistical relations with the mechanical and physical properties. The three different
rock types of the carbonate rocks were texted. The SV values of the rocks were
correlated with the uniaxial compressive strength (σc); Young’s modulus (E)
anddensity (ρ) for each rock type.The results of regression equations and the
correlation coefficients were given in graphs of the mean values of the test results
between SV index and uniaxial compressive strength; Young’s modulus and density
were shown in Figure 2.3
In conduction, results indicated that the uniaxial compressive strength (c);
Young’s modulus (E) and density () of various carbonate rock types could be
estimated from their SV values by using simple linear mathematical relations.
Ugur et al. (2009) established empirical relations between the Los Angeles
abrasion and impact resistance (LAAI) for 100 and 500 revolutions and physical
properties of rock samples collected from many locations in Turkey. The Los Angeles
and impact test is a measurement of degradation of mineral aggregates of standard
grading resulting from a combination of actions including abrasion or attrition,
impact, and grinding in a rotating steel drum containing a specified number of steel
spheres.
15
Figure 2.3 Correlation of sound velocity and rock properties (Yasar and Erdogan
2004)
So
un
d V
elo
cit
y (
Pm
ea
n, k
m/s
)
25 50 75 100 125
2.0
2.5
3.0
3.5
4.0
5.0
4.5
5.5
6.0
Uniaxial Compressive Strength (c,MPa)
SV = 0.0317c + 2.0195
R2 = 0.80
7.0
So
un
d V
elo
cit
y (
Pm
ea
n, k
m/s
)
10 20 30 40 50
2.0
3.0
4.0
5.0
6.0
Young’s Modulus (E,GPa)
15 25 35 45
SV = 0.0937E + 1.7528
R2 = 0.86
So
un
d V
elo
cit
y (
Pm
ea
n, k
m/s
)
2.2 2.4 2.6 2.8 3.2
2.5
3.0
3.5
4.0
5.0
4.5
5.5
6.0
Density (,g/cm3)
3.0
SV = 4.3183 – 7.5071
R2 = 0.81
16
The LAAI test is widely used as an indicator of the relative quality or
competence of mineral aggregates and is one of mechanical properties of a aggregate
The samples tested included ignous rock of volcanic origin as well as both
metamorphic and sedimentary rocks. The volcanic igneous rock was andesite while
the metamorphic rocks were mainly marbles and the sedimentary samples were
limestones and travertines of different grain sizes. The samples were initially tested
for their physical and mechanical properties such as bulk density, P-wave velocity,
Schmidt and shore hardness, uniaxial compressive strength, indirect tensile strength
and point load index and then the fresh rock samples were crushed and tested for
LAAI value.
In an attempt to establish a more meaningful relationship, LAAI values were
divided by P-wave velocity (Vp) values since it was strongly dependent on the
porosity, density, mineral composition, size and frequency of fractures in the rock
structure and indicated weakness of rocks to abrasion. The LAAI value was inversely
related to measured properties and decreases with an increase in each different rock
property. Among the large number of functions, the following logarithmic function
found to be providing the best correlation to data. Among the tested rocks, andesite
and limestones were more resistant to abrasion than marbles and travertines. Rock
properties had certain influence on the abrasion of rocks and could be used to predict
LAAI value of rocks. Dependence of abrasion characteristics on each rock property
investigated by regression analysis showed that high correlations exist.
Yagiz (2009) investigated the relationship between the physical properties and
modulus of elasticity, uniaxial compressive strength and index properties of nine
types of rock including travertine, limestone, dolomitic limestone and schist. The
17
samples of four types of travertines, two types of limestone, dolomitic limestone and
two types of schist were collected from different quarries around the cities of Denizli
and Antalya in western Turkey.The results of the study indicated the physical
properties rebound values had a reliable relationship with the uniaxial compressive
strength of rock. The study suggests that, as the Schmidt hammer test was easy to use
and non-destructive, the proposed equations to estimate rock parameters from the
Schmidt hammer rebound number might be valuable at the preliminary stage of
design. However, comparison with previous research indicated they should be used
with caution and for the specified rock types only.
Rajabzadeh et al. (2012) determined the physical of rock classes and porosity
on the relationship between uniaxial compressive strength c) and some other
properties of carbonate rocks with different genesis (sedimentary, diagenetic, and
metamorphic). Studied properties included density (γ), Young’s modulus (E), and
tensile strength (t). The samples were collected in different parts of Iran. The
samples were taken of sedimentary limestones,dolomitic limestones and marbles.
They used statistical analysis and regression modeling to investigate the role of
porosity on the mechanical properties.Dry uniaxlai compressive strength cd) and
saturated uniaxlai compressive strength cs) were considered as dependent. The
ratios of different properties to porosity (γ/n; E/n; and t/n) were regarded as
independentvariables insedimentary limestones and marbles. It was found that, in
diagenetic dolomitic limestones utilizing porosity did not yield any significant
improvement of correlation coefficients between different variables and uniaxial
compressive strength.
18
2.3 Petrographic and mechanical properties of carbonate rocks
Tarawneh et al. (2007) characterized the limestone rocks in Ma’an area, south
Jordan and studieddetailed geological, petrographic and physico-mechanical tests of
limestone. The limestones understudy was purity and quite homogenous in internal
texture and structure. The results of petrographic studies indicated that fossils formed
50-80 % of the limestone. The representative sample were tested and used to
investigate the physical and mechanical properties of the limestone such as uniaxial
unconfined compressive stress values (CS), water absorption percentage (WA),
surface abrasion (SA), seismic velocity (SV) and specific gravity (SG). Different tests
in this study indicated almost similar results for different limestone types except the
uniaxial unconfined test.The results revealed that the controlling factor in the
classification process was the uniaxial unconfined compressive stress test which was
an expression of the ultimate compression stress that could be sustained by the given
specimen before failure under unconfined condition.Limestone could be classified
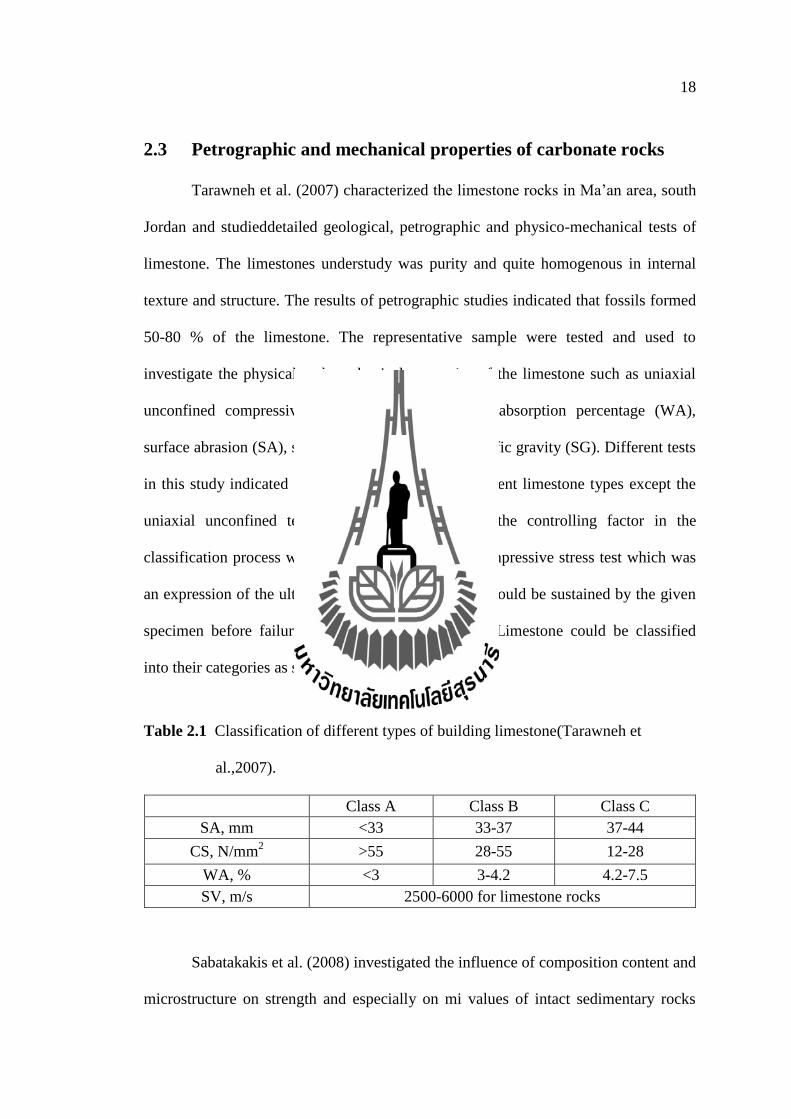
into their categories as show in Table 2.1.
Table 2.1 Classification of different types of building limestone(Tarawneh et
al.,2007).
Class A Class B Class C
SA, mm <33 33-37 37-44
CS, N/mm2 >55 28-55 12-28
WA, % <3 3-4.2 4.2-7.5
SV, m/s 2500-6000 for limestone rocks
Sabatakakis et al. (2008) investigated the influence of composition content and
microstructure on strength and especially on mi values of intact sedimentary rocks
19
(marlstone, sandstone and limestone). Physical properties petrography and the
strength under uniaxial and triaxial compression were determined. The material
constant (mi) which constitutes an input parameter for Hoek and Brown failure
criterion, was estimated by analyzing the results from triaxial compression tests. From
the statistical analysis of the data, regression equations were established among rock
material parameters, while conversion factors relating index properties and strength
were also determined. The sampling locations were widely distributed around Greek.
In this study limestone samples were generally dark grey colored. Calcite content was
generally more than 95% and other constituents were opaque minerals. According to
Folk's (1962) classification scheme, the limestone samples were mainly sparse
biomicrite, poorly-washed biosparite and unsorted biosparite.The mi value of
limestones was strongly related to the ratio of sparitic to micritic material percentage
and it decreased according to a power expression with the increase of composition
percentage of sparitic material. The mean value of mi for biosparite is about 15 and
for biomicrite 22. The textural characteristics appeared to be more important than
mineral composition to the mechanical properties variation of limestones. The sparitic
textures grain sizes were typically large and the packing was not very dense resulted
in lower strength as it was expressed via the mi values.
Gajic et al. (2010) determined lithologocal, structure, texture properties and
depositional processes and their link with physical and mechanical properties in order
to examine the quality of the Struganik limestone in Vardar zone, western Serbia. The
Struganik limestone was qualified by its petrological and physical and mechanical
properties coupled with statistical analysis.According to the observed petrographic of
the limestone sample were classified by Folk (1959) to two types, micrite limestone
20
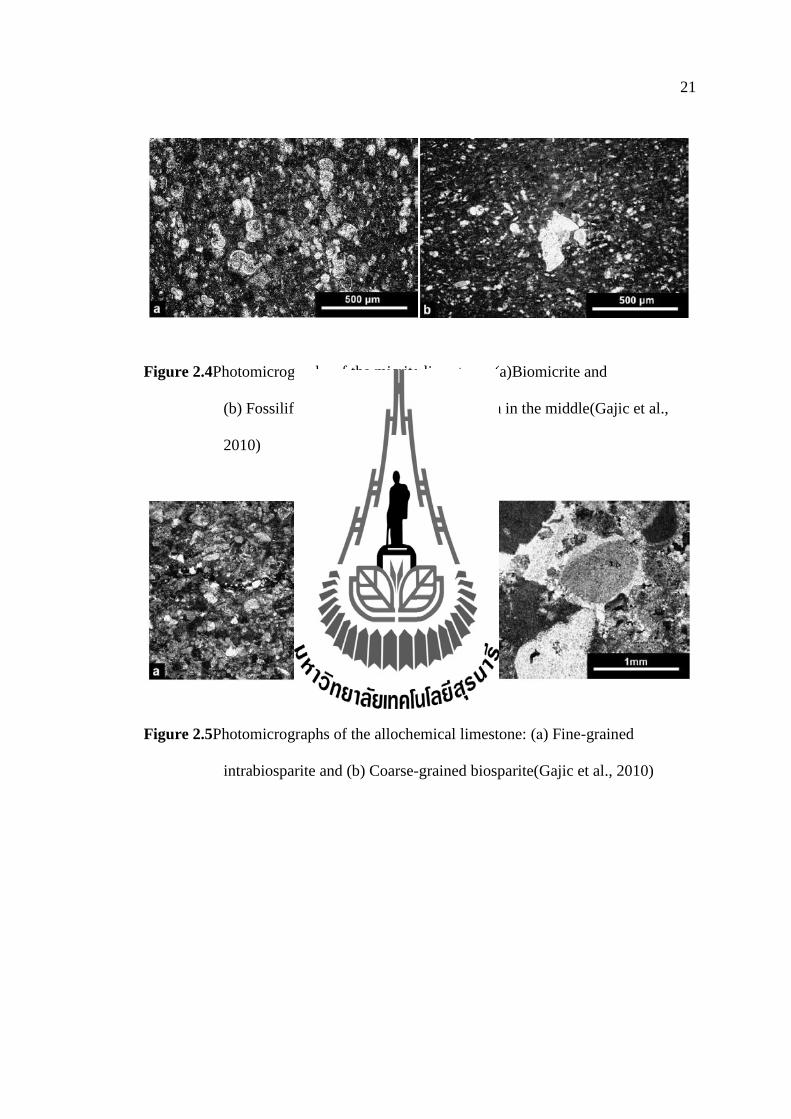
and allochemical limestone.The micrite limestone was mainly composed of
microcrystalline calcite-micrite. Non-carbonaceous compounds were clay minerals,
organic matter and subordinated silty material. According to the calcite content,
micrite limestone referred to pure limestone, clayey limestone and marlstone. The
micritelimestones were defined by the amount of biogenic component, either as
micrite and fossiliferousmicrite or as biomicrite (Figure 2.4). The allochemical and
orthochemical types, the bio-intraspar varieties were the commonest. Among the
sparry varieties, intrasparrudite, biosparrudite, intrabiosparrudite, biosparite and
intrabiosparite may be distinguished(Figure 2.5).
The values of physic-mechanical properties, such as density, porosity, water
absorption and strength, were statistically analyzed and the obtained data were used to
assess the rock quality in the quarry. The relationship among the quantified properties
was described by regression analyses and the equations of the best-fit
line.Themechanical properties of the limestone pointed to variable quality, which was
in accordance with the petrogarphical heterogeneity of the rocks. The samples of
rocks were strong to moderately strong regarding the unconfined compressive
strength. The micritelimestones had highest values of strength but the allochemical
(biointar-spar) have lower strength values. The reasons for variable technical
properties might be during variable layer thickness, lamination, stylolite and other
texture forms.
21
Figure 2.4Photomicrographs of the micrite limestone: (a)Biomicrite and
(b) Fossiliferousmicrite with globotruncana in the middle(Gajic et al.,
2010)
Figure 2.5Photomicrographs of the allochemical limestone: (а) Fine-grained
intrabiosparite and (b) Coarse-grained biosparite(Gajic et al., 2010)
22
Ozcelik et al. (2013) analyzed selected limestones and marbles and to
determine the relationship between petrographical characteristics, engineering index
properties and mechanical properties. Data belonging to limestone and marble rock
samples were also subjected to regression analyses to obtain best curve fits. The
empirical equationsemploying microscopic data including mineralogical and
petrographical properties, which were statistically significant and correlated with
mechanical properties to provide estimators of engineering properties involved in
correlation. In their case the rock fabric and compositional properties of rock samples
were correlated with five engineering properties using regression analysis.The
engineering propertiesinclude uniaxial compressive strength, tensile strength, elastic
modulus, unit volume weight and apparent porosity. The empirical equations were
developed to predict physical and mechanical properties of limestone and marble rock
samples from microscopic data. The physical and mechanical properties of limestone
and marble rock samples from microscopic data could be more easily predicted by
using a simple linear regression. The equationswere developed for the prediction of
strength of the limestone by using a stepwise linear multiple regression. They found
out that smaller grain size was a primary reasonfor the higher uniaxial compressive
strength of limestone and marble type rocks. Quartz content was positively correlated
with uniaxial compressive strength ofthe limestone, calcite content in limestone and
marble rock types was negatively correlated with uniaxial compressive strength.
Arman et al. (2014) studied on the petrographical aspects and relationship
between geomechanical properties, uniaxial compressive strength, point load index,
indirect tensile strength, Schmidt hardness value, P-wave velocity and unit weight, of
the limestonesof the Lower Oligocene Asmari Formation in Al Ain city area. They
23
described the effects of the rock properties on their geomechanical behavior as local
bedrock. The core samples for the required rock mechanical tests were obtained from
each of these blocks. Fragments from the samples used for coring were set aside for
sectioning for petrographic and textural analysis. The mineral composition of the
examined limestone rock samples are composed mainly of calcite, in addition to
minor percentages of dolomite and quartz. The rocks samples had three microfacies
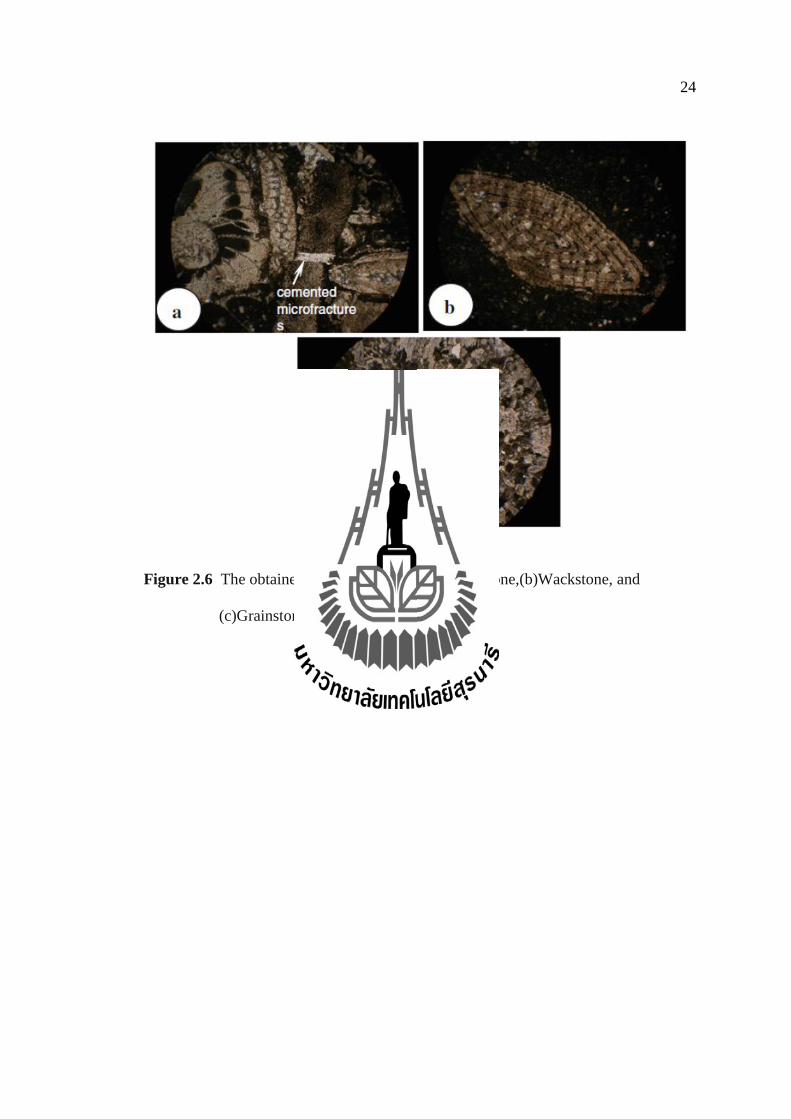
types (Figure 2.6). Packstonemade up of skeletal and non-skeletal grains embedded in
a partially recrystallized micritic groundmass. Wackestone contained a smaller
percent of skeletal grains embedded in micritic groundmass. Grainstone had a low
content of skeletal grains embedded in a sparry groundmass. The most common of
these processes were dissolution and dolomitization resulting in vuggy and moldic
porosity within the skeletal grains and groundmass.They found that the fossils and
cavities had heterogonous distribution may affected the geomechanical properties. In
case studied, the result illustrated very weak correlation and highly scattered data.
This result might be due to the present of inconspicuous microfracture and their
cementing material.
24
Figure 2.6 The obtained microfacies types: (a) Packstone,(b)Wackstone, and
(c)Grainstone.(Arman et al., 2014)
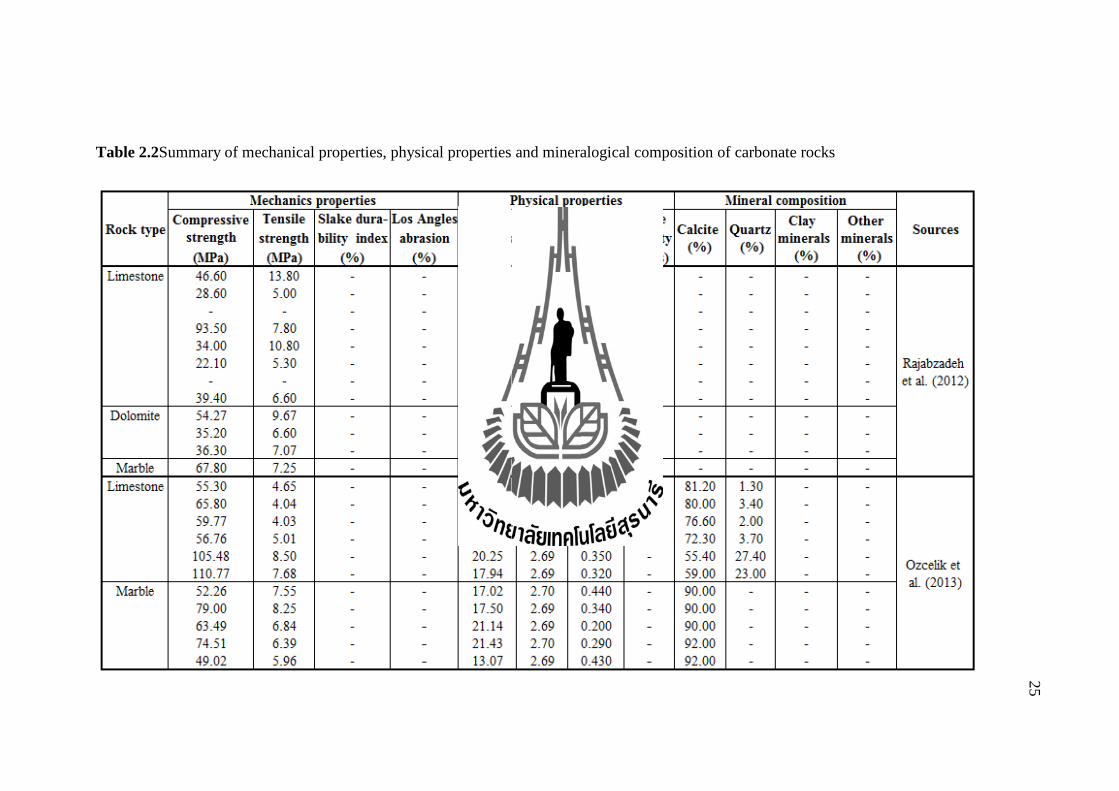
Table 2.2Summary of mechanical properties, physical properties and mineralogical composition of carbonate rocks
25
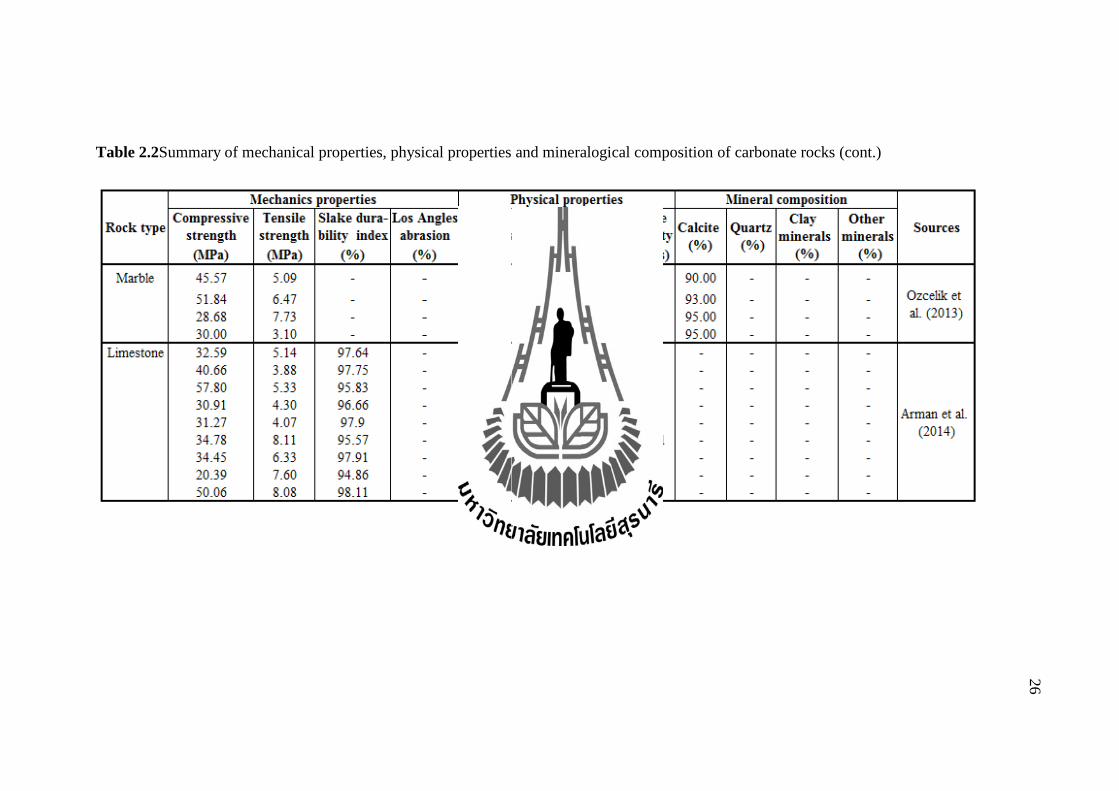
Table 2.2Summary of mechanical properties, physical properties and mineralogical composition of carbonate rocks (cont.)
26
CHAPTER III
SAMPLES PREPARATION
3.1 Sample collection
Rock samples used in this research are the carbonate rocks of the Saraburi
Group which exposed in Phetchabun, NakhonSawan, Lopburi, Saraburi areas. Blocks
of eight types of the carbonate rocks were collected includinga travertine, two marbles
and five limestones. Classification of limestones in the field followed Dunham’s
scheme (Dunham, 1992) are shown on Figure 3.1 and description of the limestones
are summarized in Table 3.1. Marble are classified by their color and texture.
3.2 Sample preparation
Specimens were prepared for four different laboratory tests: physical
andmechanical properties, petrogarphic analysis and chemical analysis.
3.2.1 Physical and mechanical tests
The physical and mechanical properties of the carbonate rocks were
determined by a variety of laboratory tests. The specimens were prepared and tested
generally in accordance with the procedures suggested by ISRM (1981). The
specimens were drilled from the blocks of each rock type.The blocks were cored to
give cylindrical specimens.The ends of specimens were trimmed as required and
further smoothen by a saw cut machine in order to avoid end effects.
28
Figure 3.1Texture of eight different types of the carbonate rocks as classified in the
field
29
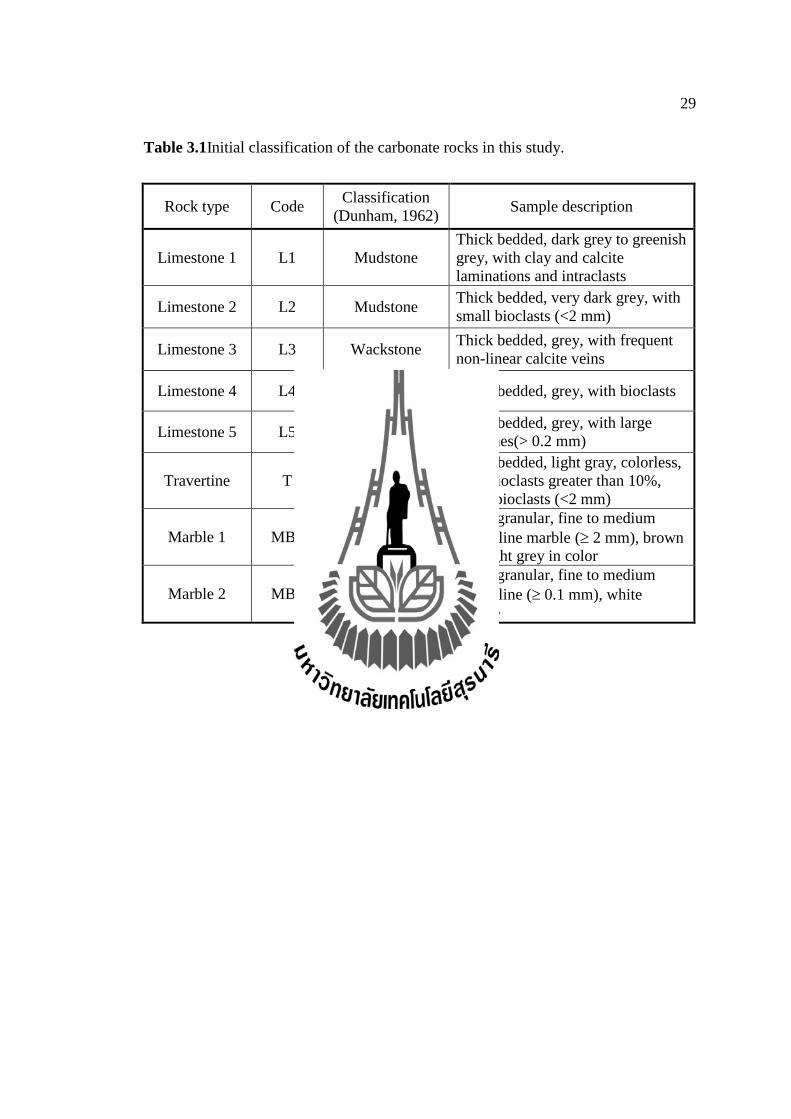
Table 3.1Initial classification of the carbonate rocks in this study.
Rock type Code Classification
(Dunham, 1962) Sample description
Limestone 1 L1 Mudstone
Thick bedded, dark grey to greenish
grey, with clay and calcite
laminations and intraclasts
Limestone 2 L2 Mudstone Thick bedded, very dark grey, with
small bioclasts (<2 mm)
Limestone 3 L3 Wackstone Thick bedded, grey, with frequent
non-linear calcite veins
Limestone 4 L4 Wackstone Thick bedded, grey, with bioclasts
Limestone 5 L5 Packstone Thick bedded, grey, with large
fusulines(> 0.2 mm)
Travertine T Packstone
Thick bedded, light gray, colorless,
with bioclasts greater than 10%,
small bioclasts (<2 mm)
Marble 1 MB1 Brownish grey
marble
Inequigranular, fine to medium
crystalline marble ( 2 mm), brown
and light grey in color
Marble 2 MB2 White marble
Inequigranular, fine to medium
crystalline ( 0.1 mm), white
marble
30
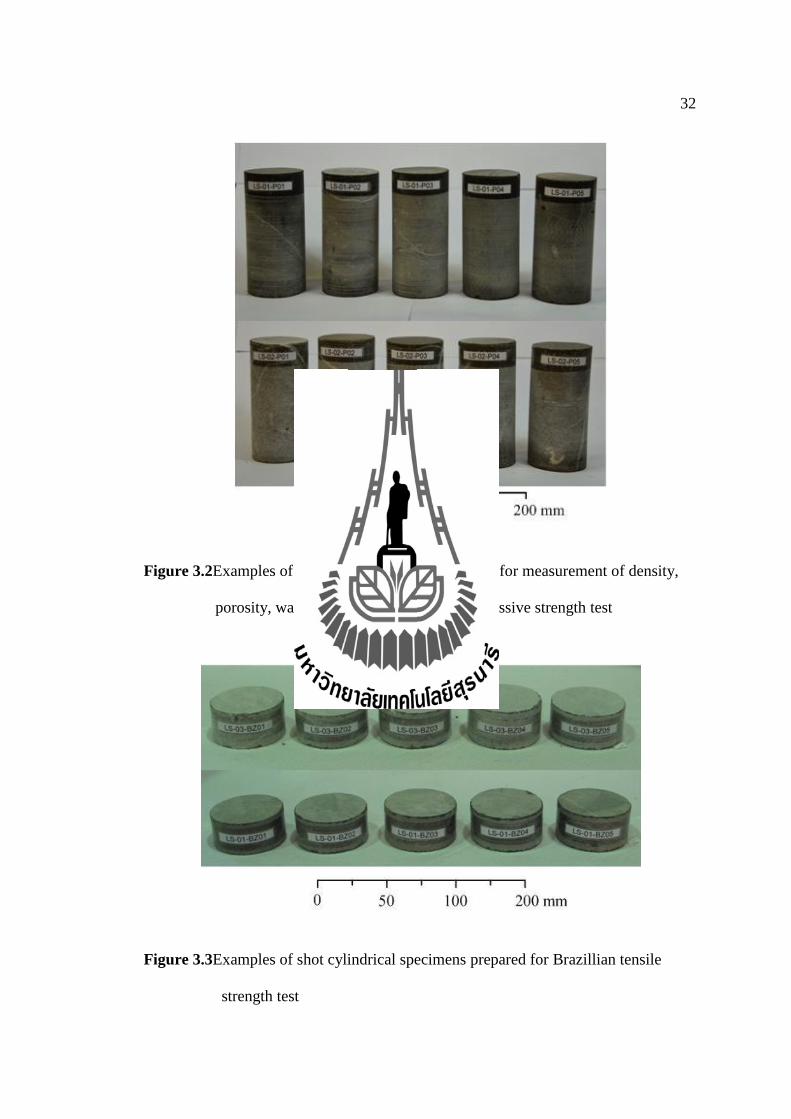
The specimens prepared for physical and mechanical properties such as density,
porosity, wave velocity and uniaxial compressive strength tests are of cylindrical
shape with 54 mm in diameter and 108 mm in length (L/D=2)(Figure 3.2).Brazilian
tensile strength was determined on the cylindrical shape samples with 54 mm in
diameter and 27 mm in length (L/D=0.5)(Figure 3.3).
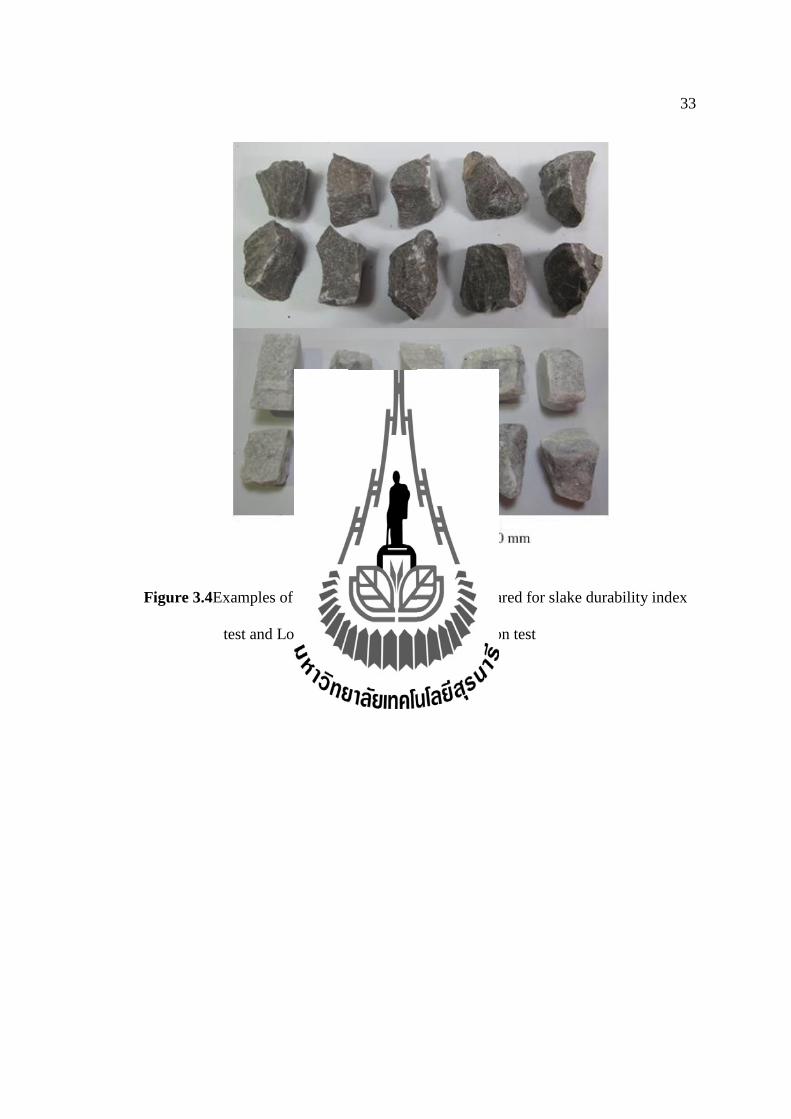
The cylindrical specimens were tested, and after failure they becomerock
fragment. There rocks fragments were broken into the properties for slake durability
index and Los Angeles abrasion and impaction test. Rock fragments of more than
5,000 g and 500 g of each type were prepared for Los Angeles abrasion and impaction
test and slake durability index test, respectively(Figure 3.4). Specimen coding and
number of tested specimens are shown in Table 3.2.
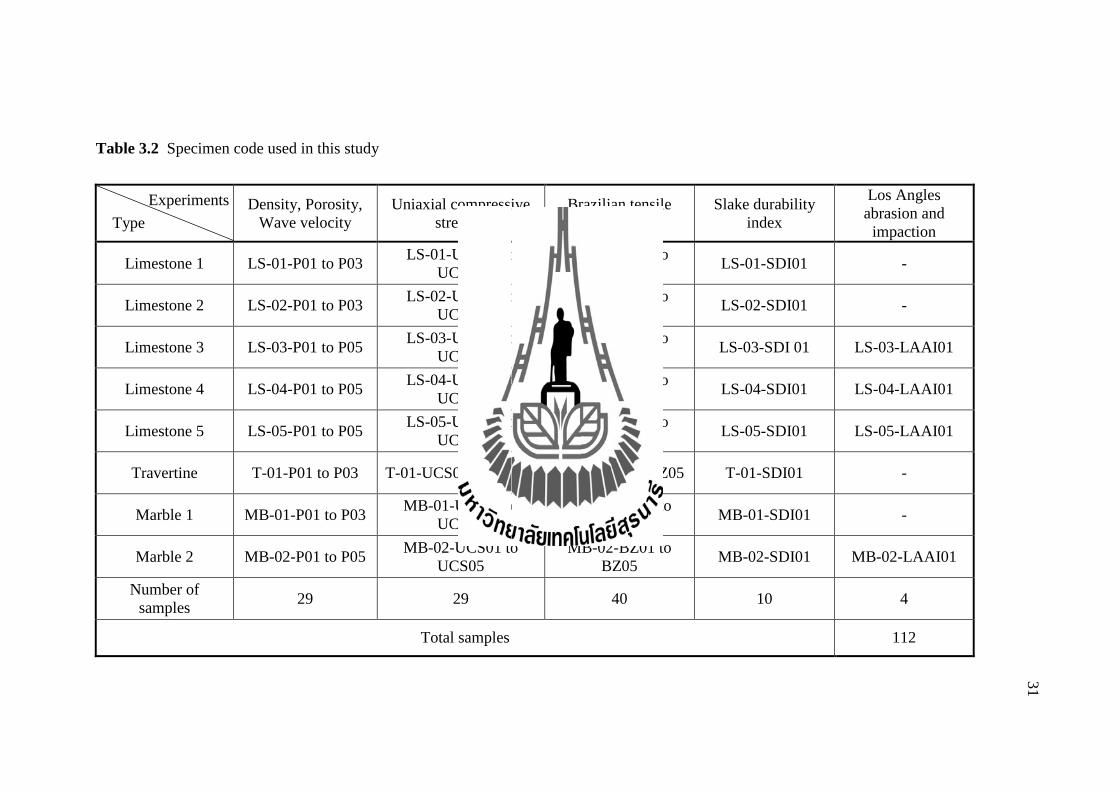
Table 3.2 Specimen code used in this study
Density, Porosity,
Wave velocity
Uniaxial compressive
strength
Brazilian tensile
strength
Slake durability
index
Los Angles
abrasion and
impaction
Limestone 1 LS-01-P01 to P03 LS-01-UCS01 to
UCS03
LS-01-BZ01 to
BZ03 LS-01-SDI01 -
Limestone 2 LS-02-P01 to P03 LS-02-UCS01 to
UCS03
LS-02-BZ01 to
BZ05 LS-02-SDI01 -
Limestone 3 LS-03-P01 to P05 LS-03-UCS01 to
UCS05
LS-03-BZ01 to
BZ05 LS-03-SDI 01 LS-03-LAAI01
Limestone 4 LS-04-P01 to P05 LS-04-UCS01 to
UCS05
LS-04-BZ01 to
BZ05 LS-04-SDI01 LS-04-LAAI01
Limestone 5 LS-05-P01 to P05 LS-05-UCS01 to
UCS05
LS-05-BZ01 to
BZ05 LS-05-SDI01 LS-05-LAAI01
Travertine T-01-P01 to P03 T-01-UCS01 to UCS03 T-01-BZ01 to BZ05 T-01-SDI01 -
Marble 1 MB-01-P01 to P03 MB-01-UCS01 to
UCS03
MB-01-BZ01 to
BZ05 MB-01-SDI01 -
Marble 2 MB-02-P01 to P05 MB-02-UCS01 to
UCS05
MB-02-BZ01 to
BZ05 MB-02-SDI01 MB-02-LAAI01
Number of
samples 29 29 40 10 4
Total samples 112
Type
Experiments
31
32
Figure 3.2Examples of cylindrical specimens prepared for measurement of density,
porosity, wave velocity and uniaxial compressive strength test
Figure 3.3Examples of shot cylindrical specimens prepared for Brazillian tensile
strength test
33
Figure 3.4Examples of irregular shape specimens prepared for slake durability index
test and Los Angeles abrasion and impaction test
34
3.2.2 Petrographic analysis
Three slaps of each rock type were prepared to have a size of about
80×30 mm which can be trimmed to fit a size of glass (Figure 3.5). The specimen was
cut by a diamond saw to obtain a flat surface and the required size. A flat surface was
polished to eliminate the traces of cutting and to obtain a smooth flat surface.The
polished surface was stuck onto a glass slide with a colorless and isotropic cementing
agent. After the slap was stuck to the slide, it was cut to obtain the thinnest slice
possible, until if reached a final thickness of about 0.03 mm.The slide was cleaned
and covered with a slide cover, which was attached with a similar cement to the one
used to stick the sample to the slide.The thin section were studied under the polarizing
microscope is also called the petrographic microscope because it is used in the study
of rocks. In examine thin section of rocks, the texture is brought out and mineral
composition be determined.Point counting is a statistical technique. Point counting is
a means of describing rock in an unbiased and quantitative way.It involves looking at
a large number of points on the photomicrographs, recording exactly what is seen at
each point and then assembling a description from all the photomicrographs recorded.
In order to be a statistically valid representation, the number of points described is
typically 100.
3.2.3 Chemical analysis
Representatives of each carbonate rocks type are grinded into rock
powder (Figure 3.7) (with less than 2 µm in size) for the XRD analysis which powder
is then spread uniformly over the surface of a glass slid, using a small amount of
adhesive binder. The instrument is so constricted that this slide, when clamped in
place, rotates in the path of collimated X-ray beam while a counting tube, mounted on
35
an arm, rotates about is to pick up the reflected X-ray beam. The samples were
analyzed at The Center of Scientific and Technological Equipment, Suranaree
University of Technology.
36
Figure 3.5Thin sections prepared for petrographic analysis used under polarizing
microscope
Figure 3.6Rock powder prepared for XRD analysis
CHAPTER IV
LABORATORY EXPERIMENT
The laboratory experiment preformed can be divided into four main types:
physical and mechanical property determinations, petrography analysis and chemical
composition. All experiments are conducted under the scope and limitations of the
study proposed in the first chapter and sample preparation in the third chapter. This
chapter describes the test methods and results.
4.1 Physical property testing
4.1.1 Density and porosity measurement
Saturation buoyancy is a common method for measuring the porosity
and density (ASTM-C 97-88). The measurement of porosity was conducted under
dry and fully saturated conditions. Under the dry condition, the specimens were oven
dried for 48 hours before the test, under the saturated condition the specimens were
submerged under water in a pressure vacuum chamber for 48 hours before the
measurement (Figure 4.1). Weights were measured using a digital balance (with ±0.1
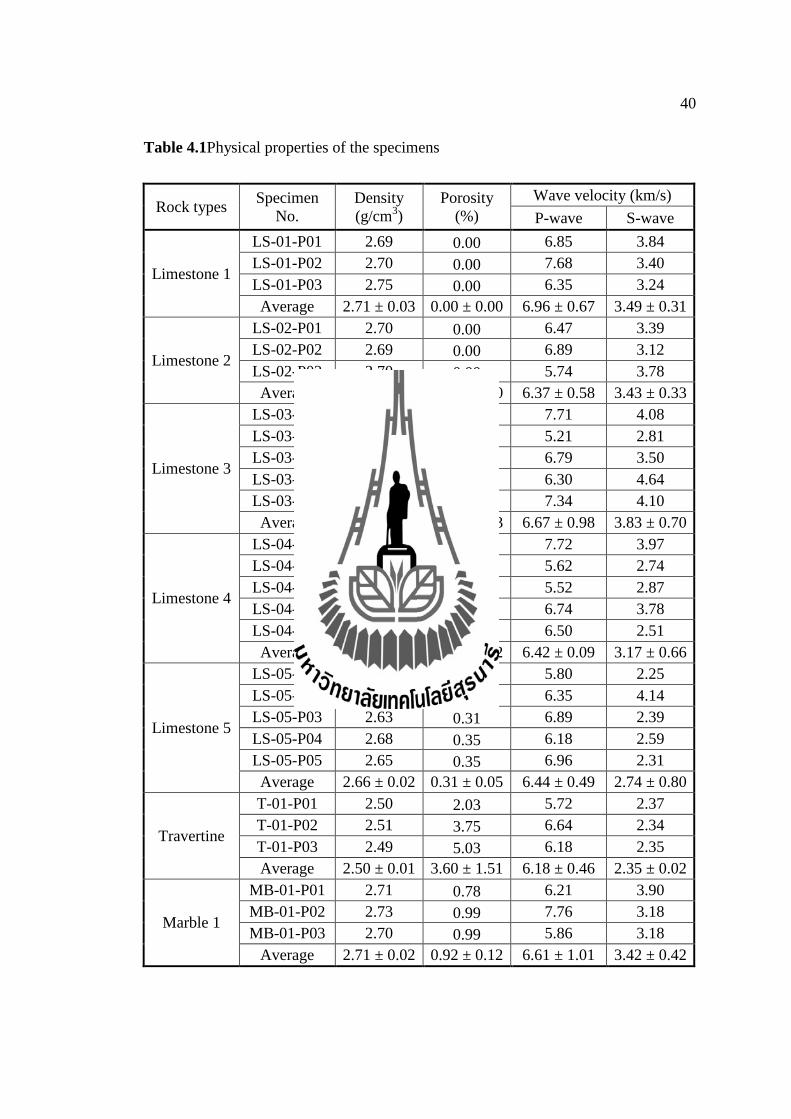
g accuracy).As a result, the porosity ranges between 0.00 to 3.60% and the mean
density changes from 2.50 to 2.72% (Table 4.1).
38
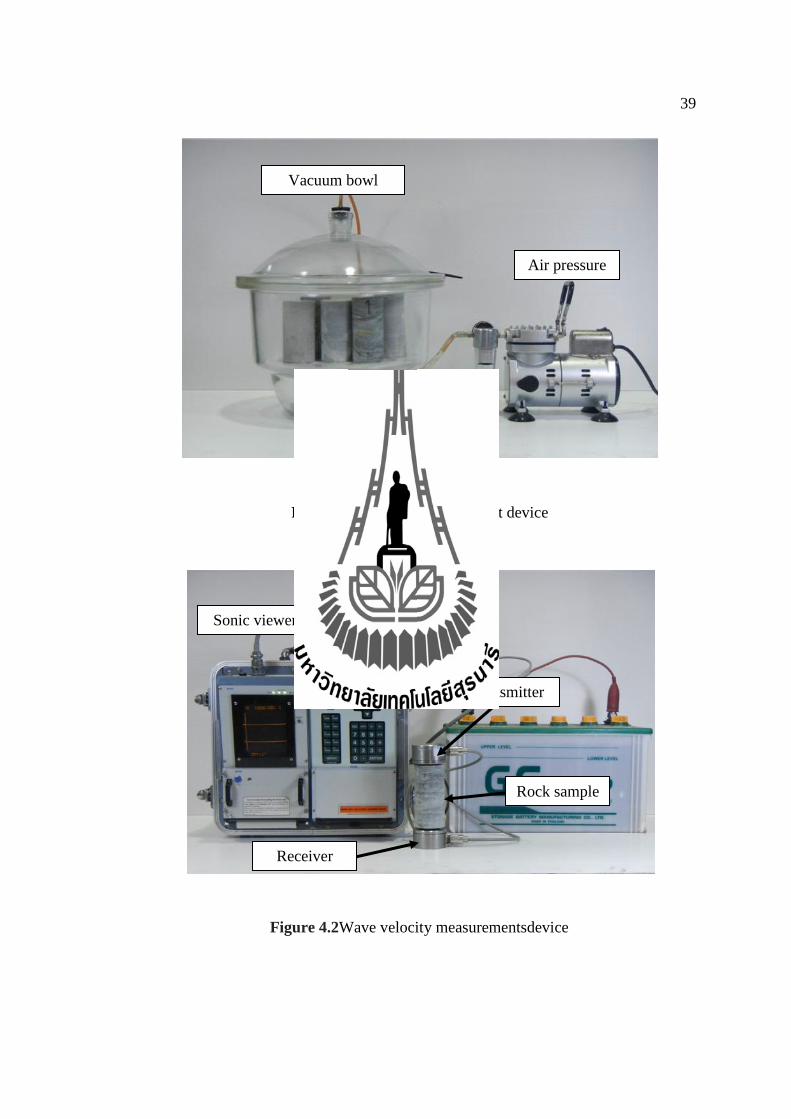
4.1.2 Wave velocity measurement
Wave velocity measurement was performed on the cylindrical shaped
specimens with L/D=2.0 (see Chapter 3). Sonic viewer 170 (Model 5338) was
used(Figure 4.2). The direct transmission method was conducted for measuring of P-
wave, S-wave velocities of sample. The faces of the specimens wereflattenedand
smooth to provide tight contacts of transducers with the faces of each specimen. The
application of ultrasonic compression wave pulses to the sample was carried out in
accordance with American Society of Testing Materials (ASTM D2845) test
designation.Wave velocity through the specimen was calculated from the travel time
from the generator to the receiver at the opposite end.The results are showninTable
4.1. The P-wave velocity of the carbonate rocks ranges from 6.37 to 6.96 km/s and
S-wave velocity ranges from 2.35 to 3.83 km/s. The wave velocities of the carbonate
rocks are similar to the ranges of other for example studies Siegesmund and
Dürrast(2011).
39
Figure 4.1Porosity measurement device
Figure 4.2Wave velocity measurementsdevice
Air pressure
Vacuum bowl
Transmitter
Receiver
Sonic viewer testing machine
Rock sample
40
Table 4.1Physical properties of the specimens
Rock types Specimen
No.
Density
(g/cm3)
Porosity
(%)
Wave velocity (km/s)
P-wave S-wave
Limestone 1
LS-01-P01 2.69 0.00 6.85 3.84
LS-01-P02 2.70 0.00 7.68 3.40
LS-01-P03 2.75 0.00 6.35 3.24
Average 2.71 ± 0.03 0.00 ± 0.00 6.96 ± 0.67 3.49 ± 0.31
Limestone 2
LS-02-P01 2.70 0.00 6.47 3.39
LS-02-P02 2.69 0.00 6.89 3.12
LS-02-P03 2.70 0.00 5.74 3.78
Average 2.70 ± 0.01 0.00 ± 0.00 6.37 ± 0.58 3.43 ± 0.33
Limestone 3
LS-03-P01 2.68 0.22 7.71 4.08
LS-03-P02 2.67 0.22 5.21 2.81
LS-03-P03 2.68 0.28 6.79 3.50
LS-03-P04 2.70 0.24 6.30 4.64
LS-03-P05 2.68 0.19 7.34 4.10
Average 2.68 ± 0.01 0.23 ± 0.03 6.67 ± 0.98 3.83 ± 0.70
Limestone 4
LS-04-P01 2.69 0.32 7.72 3.97
LS-04-P02 2.69 0.31 5.62 2.74
LS-04-P03 2.69 0.34 5.52 2.87
LS-04-P04 2.67 0.35 6.74 3.78
LS-04-P05 2.69 0.32 6.50 2.51
Average 2.69 ± 0.01 0.33 ± 0.02 6.42 ± 0.09 3.17 ± 0.66
Limestone 5
LS-05-P01 2.67 0.23 5.80 2.25
LS-05-P02 2.69 0.31 6.35 4.14
LS-05-P03 2.63 0.31 6.89 2.39
LS-05-P04 2.68 0.35 6.18 2.59
LS-05-P05 2.65 0.35 6.96 2.31
Average 2.66 ± 0.02 0.31 ± 0.05 6.44 ± 0.49 2.74 ± 0.80
Travertine
T-01-P01 2.50 2.03 5.72 2.37
T-01-P02 2.51 3.75 6.64 2.34
T-01-P03 2.49 5.03 6.18 2.35
Average 2.50 ± 0.01 3.60 ± 1.51 6.18 ± 0.46 2.35 ± 0.02
Marble 1
MB-01-P01 2.71 0.78 6.21 3.90
MB-01-P02 2.73 0.99 7.76 3.18
MB-01-P03 2.70 0.99 5.86 3.18
Average 2.71 ± 0.02 0.92 ± 0.12 6.61 ± 1.01 3.42 ± 0.42
41
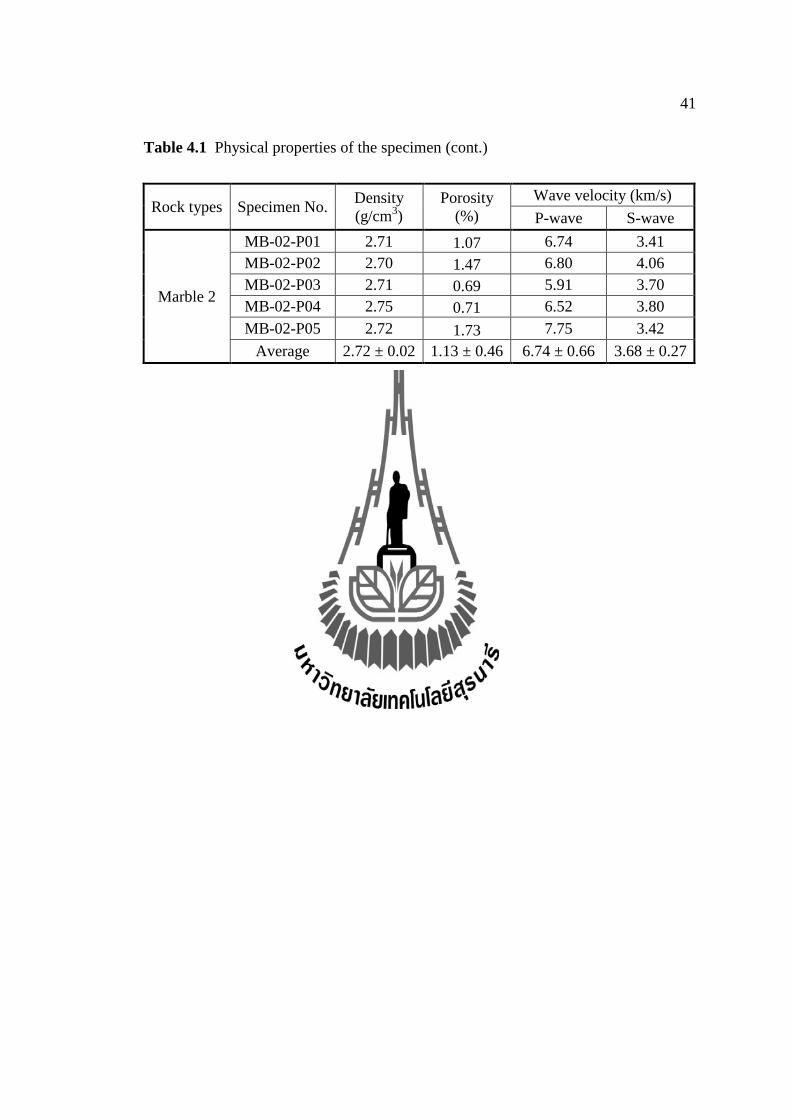
Table 4.1 Physical properties of the specimen (cont.)
Rock types Specimen No. Density
(g/cm3)
Porosity
(%)
Wave velocity (km/s)
P-wave S-wave
Marble 2
MB-02-P01 2.71 1.07 6.74 3.41
MB-02-P02 2.70 1.47 6.80 4.06
MB-02-P03 2.71 0.69 5.91 3.70
MB-02-P04 2.75 0.71 6.52 3.80
MB-02-P05 2.72 1.73 7.75 3.42
Average 2.72 ± 0.02 1.13 ± 0.46 6.74 ± 0.66 3.68 ± 0.27
42
4.2 Mechanical property testing
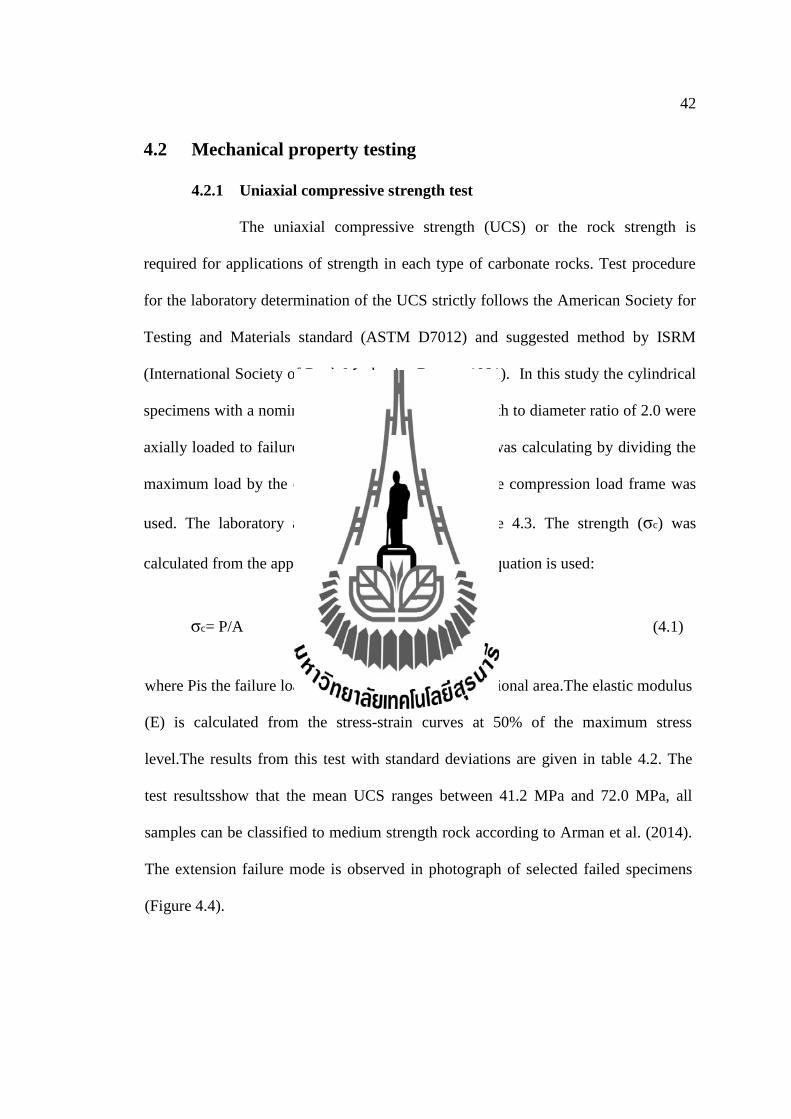
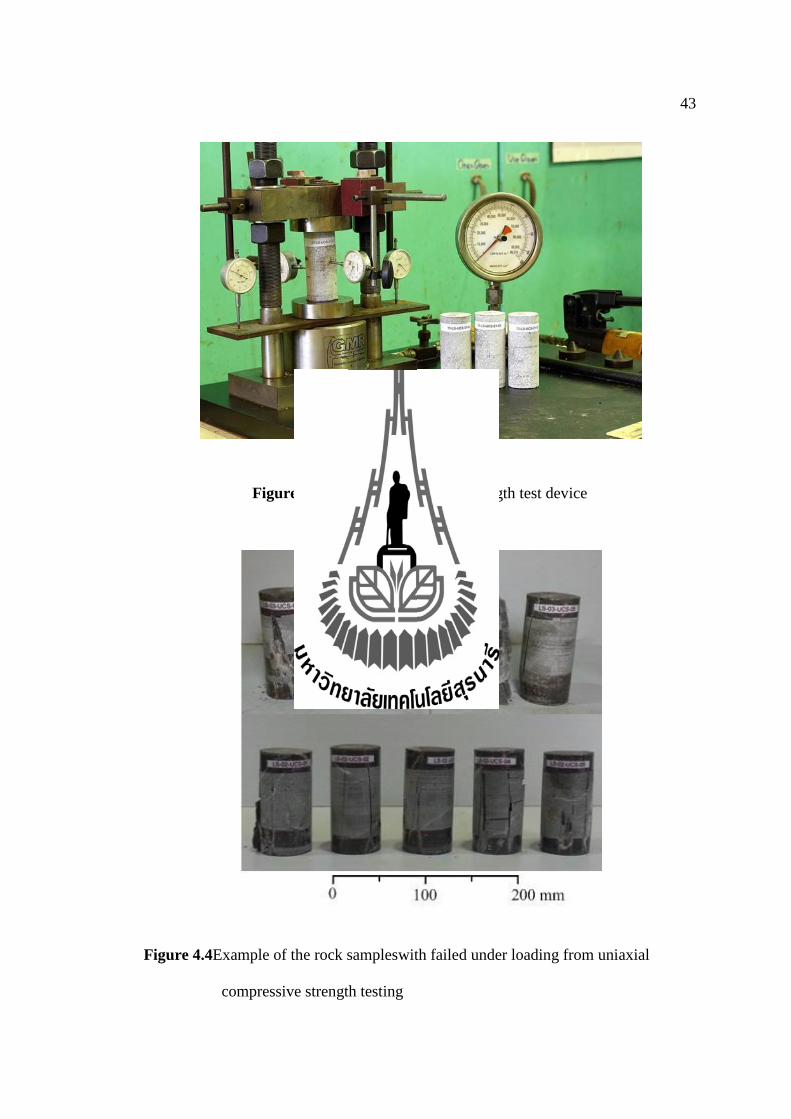
4.2.1 Uniaxial compressive strength test
The uniaxial compressive strength (UCS) or the rock strength is
required for applications of strength in each type of carbonate rocks. Test procedure
for the laboratory determination of the UCS strictly follows the American Society for
Testing and Materials standard (ASTM D7012) and suggested method by ISRM
(International Society of Rock Mechanics Brown, 1981). In this study the cylindrical
specimens with a nominal diameter of 54 mm and length to diameter ratio of 2.0 were
axially loaded to failure. The UCS of eachspecimen was calculating by dividing the
maximum load by the original cross sectional area.The compression load frame was
used. The laboratory arrangement is shown inFigure 4.3. The strength (σc) was
calculated from the applied axial load. The following equation is used:
σc= P/A (4.1)
where Pis the failure load and A is the initial cross-sectional area.The elastic modulus
(E) is calculated from the stress-strain curves at 50% of the maximum stress
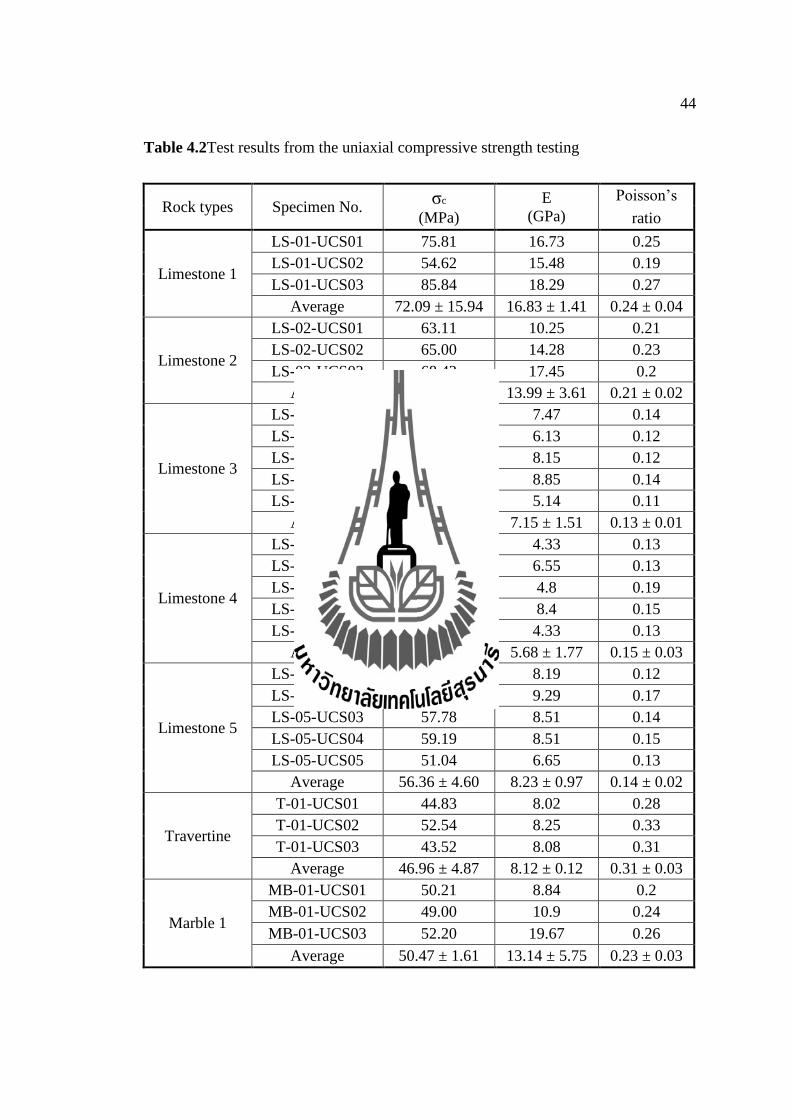
level.The results from this test with standard deviations are given in table 4.2. The
test resultsshow that the mean UCS ranges between 41.2 MPa and 72.0 MPa, all
samples can be classified to medium strength rock according to Arman et al. (2014).
The extension failure mode is observed in photograph of selected failed specimens
(Figure 4.4).
43
Figure 4.3Uniaxial compressive strength test device
Figure 4.4Example of the rock sampleswith failed under loading from uniaxial
compressive strength testing
44
Table 4.2Test results from the uniaxial compressive strength testing
Rock types Specimen No. σc
(MPa)
E
(GPa)
Poisson’s
ratio
Limestone 1
LS-01-UCS01 75.81 16.73 0.25
LS-01-UCS02 54.62 15.48 0.19
LS-01-UCS03 85.84 18.29 0.27
Average 72.09 ± 15.94 16.83 ± 1.41 0.24 ± 0.04
Limestone 2
LS-02-UCS01 63.11 10.25 0.21
LS-02-UCS02 65.00 14.28 0.23
LS-02-UCS03 68.42 17.45 0.2
Average 65.51 ± 2.69 13.99 ± 3.61 0.21 ± 0.02
Limestone 3
LS-03-UCS01 58.54 7.47 0.14
LS-03-UCS02 49.96 6.13 0.12
LS-03-UCS03 73.99 8.15 0.12
LS-03-UCS04 66.49 8.85 0.14
LS-03-UCS05 44.53 5.14 0.11
Average 58.70 ± 11.95 7.15 ± 1.51 0.13 ± 0.01
Limestone 4
LS-04-UCS01 45.90 4.33 0.13
LS-04-UCS02 50.05 6.55 0.13
LS-04-UCS03 34.50 4.8 0.19
LS-04-UCS04 54.31 8.4 0.15
LS-04-UCS05 41.21 4.33 0.13
Average 45.19 ± 7.70 5.68 ± 1.77 0.15 ± 0.03
Limestone 5
LS-05-UCS01 61.68 8.19 0.12
LS-05-UCS02 52.13 9.29 0.17
LS-05-UCS03 57.78 8.51 0.14
LS-05-UCS04 59.19 8.51 0.15
LS-05-UCS05 51.04 6.65 0.13
Average 56.36 ± 4.60 8.23 ± 0.97 0.14 ± 0.02
Travertine
T-01-UCS01 44.83 8.02 0.28
T-01-UCS02 52.54 8.25 0.33
T-01-UCS03 43.52 8.08 0.31
Average 46.96 ± 4.87 8.12 ± 0.12 0.31 ± 0.03
Marble 1
MB-01-UCS01 50.21 8.84 0.2
MB-01-UCS02 49.00 10.9 0.24
MB-01-UCS03 52.20 19.67 0.26
Average 50.47 ± 1.61 13.14 ± 5.75 0.23 ± 0.03
45
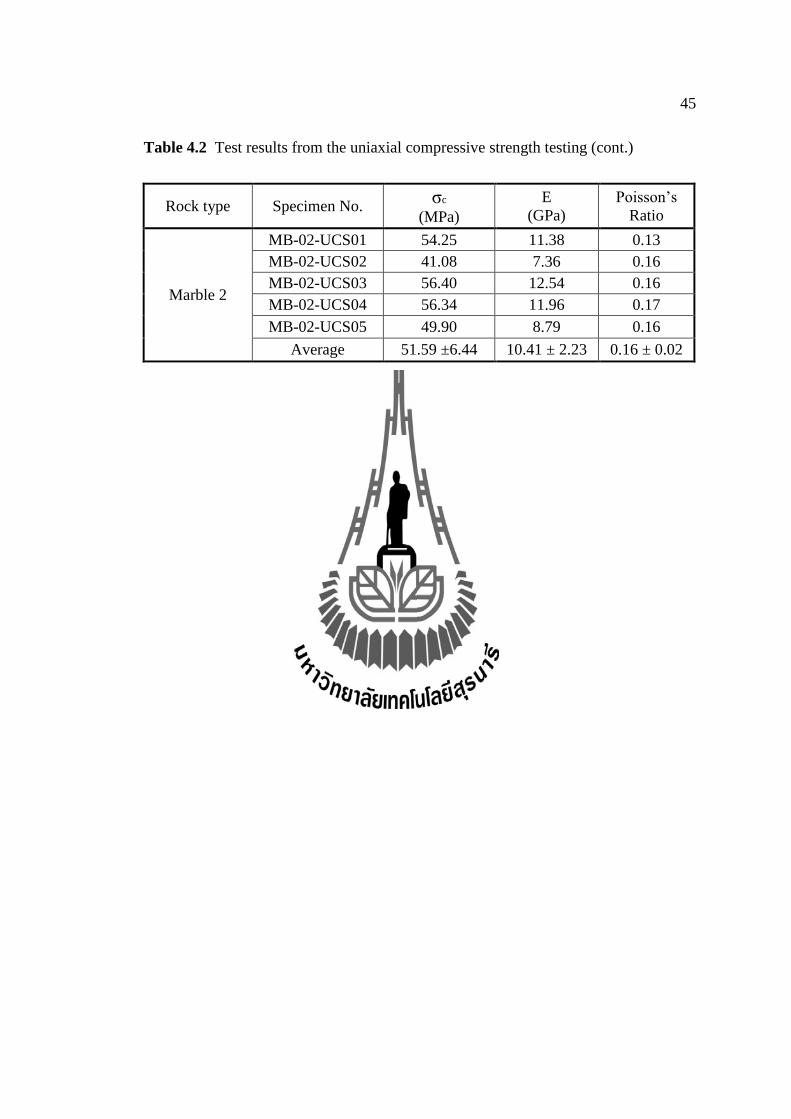
Table 4.2 Test results from the uniaxial compressive strength testing (cont.)
Rock type Specimen No. σc
(MPa)
E
(GPa)
Poisson’s
Ratio
Marble 2
MB-02-UCS01 54.25 11.38 0.13
MB-02-UCS02 41.08 7.36 0.16
MB-02-UCS03 56.40 12.54 0.16
MB-02-UCS04 56.34 11.96 0.17
MB-02-UCS05 49.90 8.79 0.16
Average 51.59 ±6.44 10.41 ± 2.23 0.16 ± 0.02
46
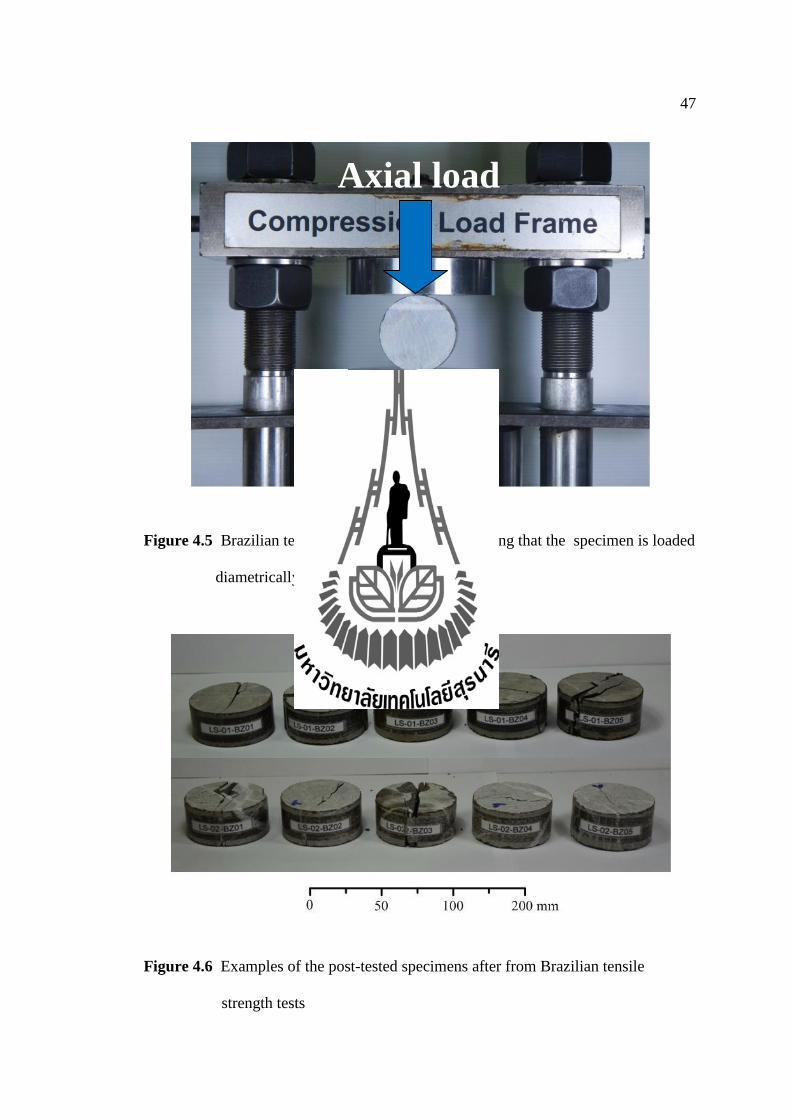
4.2.2 Brazilian Tensile strength test
The Brazilian tensile strength test (BZ) was conducted to determine the
indirect tensile strength of the specimens. The test was performed in accordance with
the ASTM standard (ASTM D3967) and the ISRM suggested methods (Bieniawski
and Hawkes, 1978). Five specimens type of the carbonate rocks were tested. The
compression load frame is used (Figure 4.5). The diametrical load was applied to the
specimen. The cylindrical surfaces were free from obvious tool marks and any
irregularities across the thickness of the specimen. The constant stress rate was
maintained about 0.1 MPa/second. The load was applied until failure which normally
occurs under 2 minutes. The Brazilian tensile strength (σB) was calculated from the
applied axial load. The following equation is used:
σB= 2Pf/πLD (4.2)
where Pf is the applied load at failure indicated by the testing machine, L is the
thickness of specimen, and Dis the diameter of specimen.The results from this test are
given in Table 4.3.Photograph of selected failed specimens is given in Figure 4.6.
47
Figure 4.5 Brazilian tensile strength test, device showing that the specimen is loaded
diametrically with compression load frame
Figure 4.6 Examples of the post-tested specimens after from Brazilian tensile
strength tests
Axial load
48
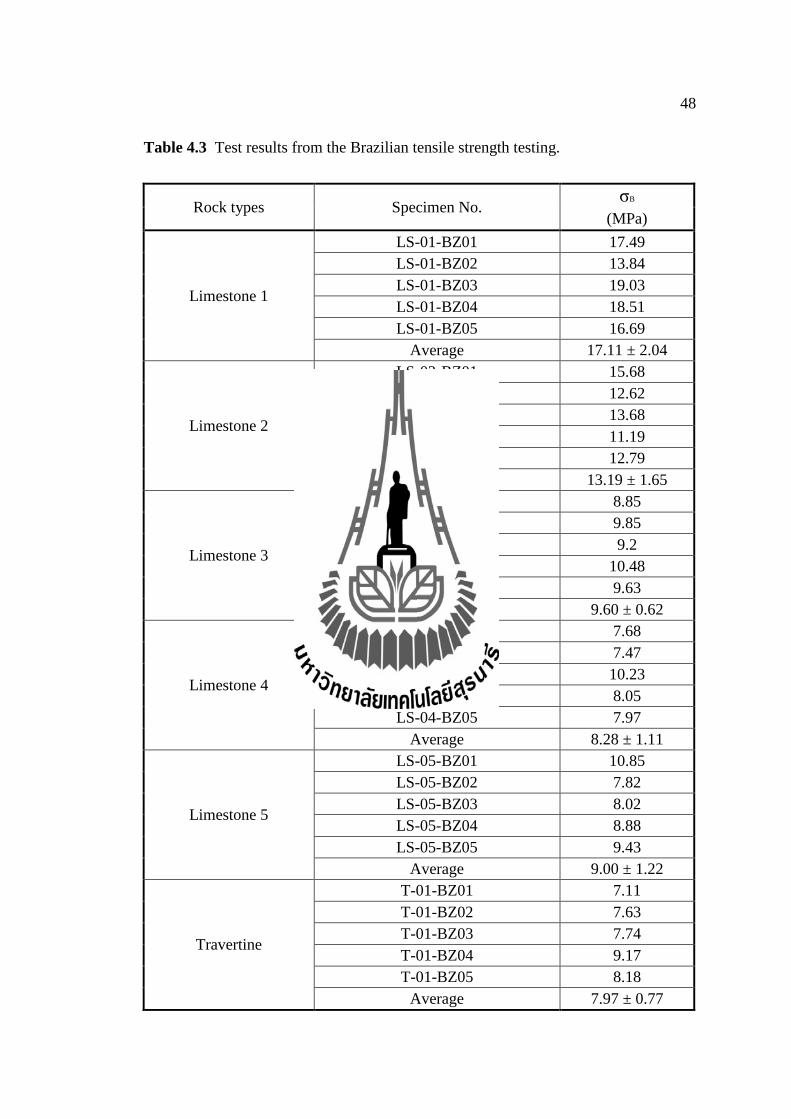
Table 4.3 Test results from the Brazilian tensile strength testing.
Rock types Specimen No. σB
(MPa)
Limestone 1
LS-01-BZ01 17.49
LS-01-BZ02 13.84
LS-01-BZ03 19.03
LS-01-BZ04 18.51
LS-01-BZ05 16.69
Average 17.11 ± 2.04
Limestone 2
LS-02-BZ01 15.68
LS-02-BZ02 12.62
LS-02-BZ03 13.68
LS-02-BZ04 11.19
LS-02-BZ05 12.79
Average 13.19 ± 1.65
Limestone 3
LS-03-BZ01 8.85
LS-03-BZ02 9.85
LS-03-BZ03 9.2
LS-03-BZ04 10.48
LS-03-BZ05 9.63
Average 9.60 ± 0.62
Limestone 4
LS-04-BZ01 7.68
LS-04-BZ02 7.47
LS-04-BZ03 10.23
LS-04-BZ04 8.05
LS-04-BZ05 7.97
Average 8.28 ± 1.11
Limestone 5
LS-05-BZ01 10.85
LS-05-BZ02 7.82
LS-05-BZ03 8.02
LS-05-BZ04 8.88
LS-05-BZ05 9.43
Average 9.00 ± 1.22
Travertine
T-01-BZ01 7.11
T-01-BZ02 7.63
T-01-BZ03 7.74
T-01-BZ04 9.17
T-01-BZ05 8.18
Average 7.97 ± 0.77
49
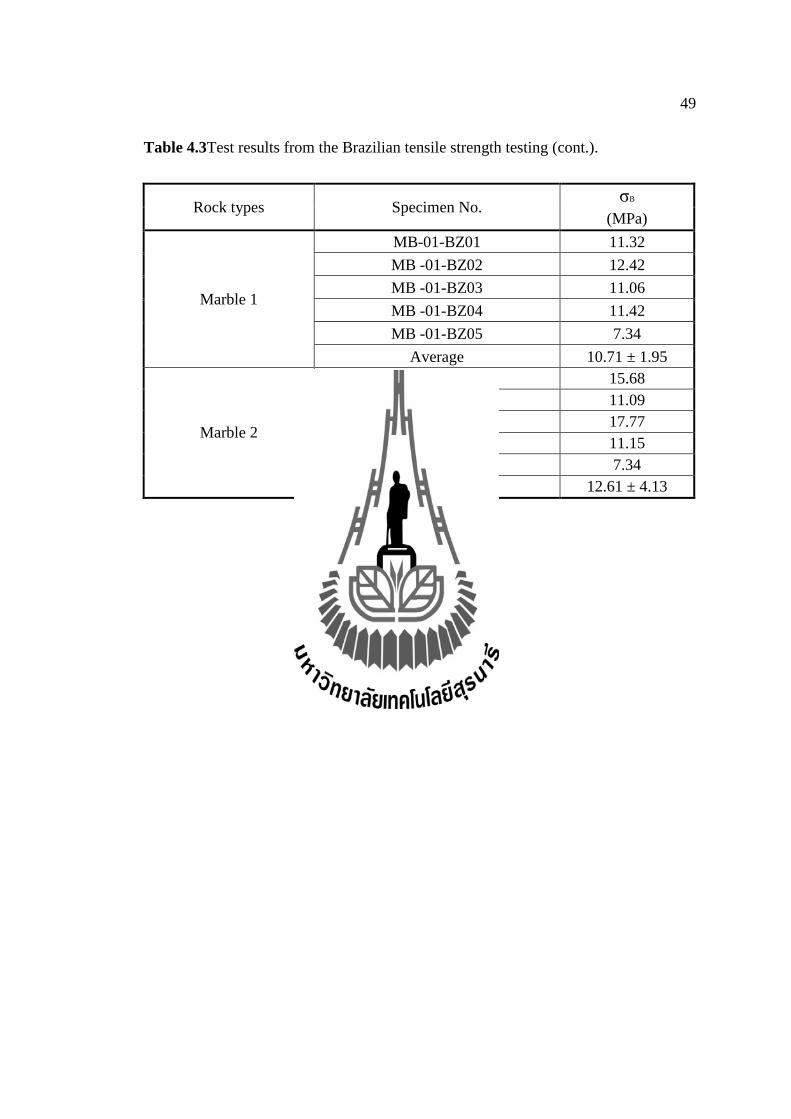
Table 4.3Test results from the Brazilian tensile strength testing (cont.).
Rock types Specimen No. σB
(MPa)
Marble 1
MB-01-BZ01 11.32
MB -01-BZ02 12.42
MB -01-BZ03 11.06
MB -01-BZ04 11.42
MB -01-BZ05 7.34
Average 10.71 ± 1.95
Marble 2
MB-02-BZ01 15.68
MB-02-BZ02 11.09
MB-02-BZ03 17.77
MB-02-BZ04 11.15
MB-02-BZ05 7.34
Average 12.61 ± 4.13
50
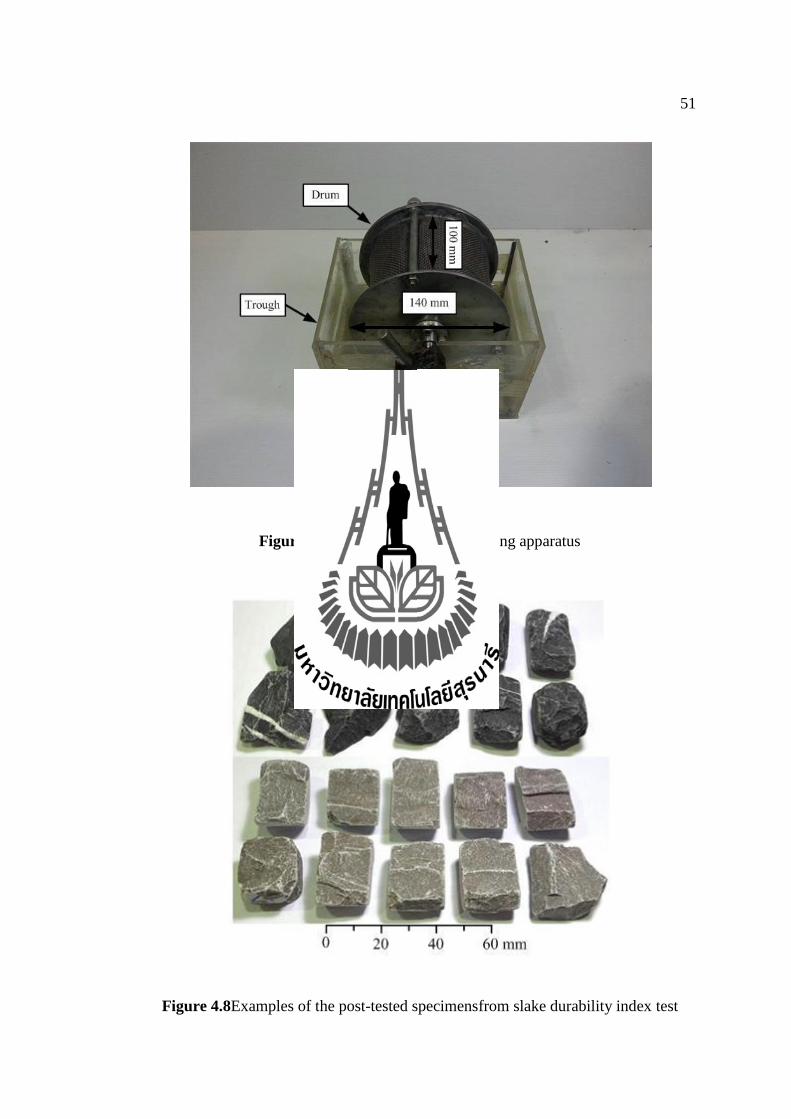
4.2.3 Slake durability index test
The test of the slake durability index (SDI) was aimed to determine
durability of the rock specimens. The specimens had same in size and weight of 50 g.
Ten specimens for eachtype of carbonate rock were prepared. A sample was placed
into a drum and was rotated for a specified of speed of 20 rpm for 10 min. The
sample was dried at 110˚C for 12 hours. Figure 4.7 shows apparatus and data
reduction was similar to that of the standard practice (ASTM D4644) standard.The
slake durability index was calculated as the percentage ratio of final to initial dry
weights of rock in the drum after the drying and wetting cycles.The results of slake
durability index (Id) isgiven in Table 4.4.
51
Figure 4.7Slake durability index testing apparatus
Figure 4.8Examples of the post-tested specimensfrom slake durability index test
52
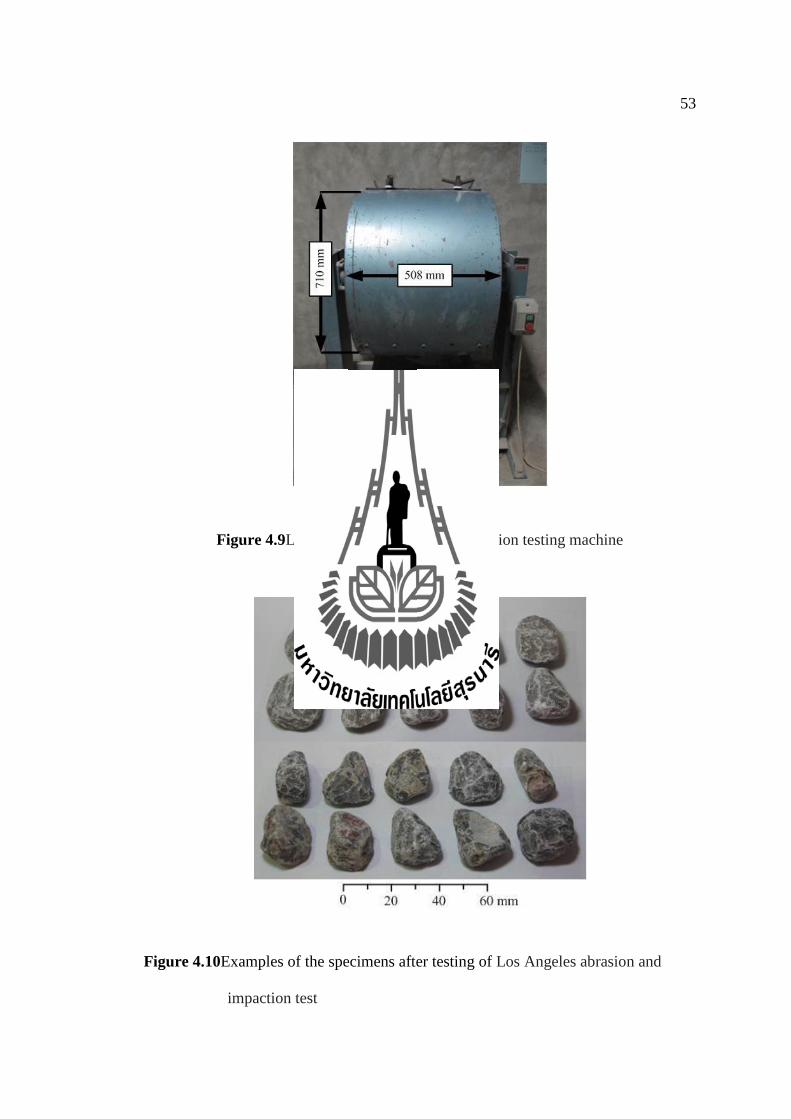
4.2.4 Los Angeles abrasion and impaction test
The Los Angeles abrasionand impaction test (LAAI) is a measure of
degradation of mineral aggregates of standard grinding resulting from a combination
of actions including abrasion or attrition, impact, and grinding in a rotating steel drum
contain a specified number of steel spheres.Los Angeles abrasion testwas performed
following the ASTM (C-131:Resistance to Degradation of Small-Size Coarse).The
Los Angeles and impact testing machine consists of a hollow steel cylinder, closed at
both ends,having an inside diameter of 710±5mm and an inside length of 508±5 mm
(Figure 4.9). A rock fragments specimenswere placed into this cylinder with a charge
consisting of steel spheres and was rotated for a specified number of revolutions from
100 to 500. The interior of the cylinder had a shelf that picks up the sample and
charge during each rotation and drops them on the opposite side of the cylinder,
subjecting the sample to abrasion or attrition. The cylinder rotated at 30 to 33 rpm and
after the prescribed number of revolutions, the machine was automatically be stopped
by a counter switch. The test consisted of placingrock fragments specimens in a steel
drum along with 6–12 steel spheres weighing approximately 420 g each and having a
diameter of 47 mm.The tests were carried out on 8 different rock types of the
carbonate rocks. The abrasion values are given in Table 4.3.
53
Figure 4.9Los Angeles abrasion and impaction testing machine
Figure 4.10Examples of the specimens after testing of Los Angeles abrasion and
impaction test
54
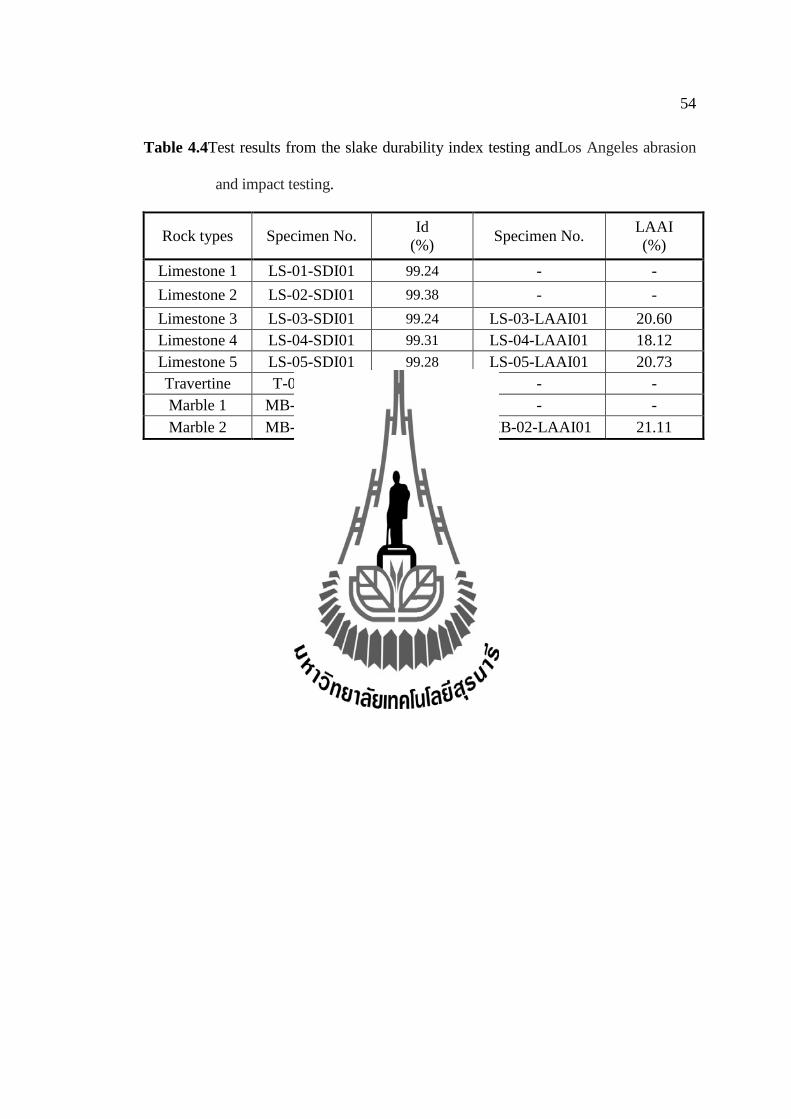
Table 4.4Test results from the slake durability index testing andLos Angeles abrasion
and impact testing.
Rock types Specimen No. Id
(%) Specimen No.
LAAI
(%)
Limestone 1 LS-01-SDI01 99.24 - -
Limestone 2 LS-02-SDI01 99.38 - -
Limestone 3 LS-03-SDI01 99.24 LS-03-LAAI01 20.60
Limestone 4 LS-04-SDI01 99.31 LS-04-LAAI01 18.12
Limestone 5 LS-05-SDI01 99.28 LS-05-LAAI01 20.73
Travertine T-01-SDI01 99.33 - -
Marble 1 MB-01-SDI01 99.58 - -
Marble 2 MB-01-SDI01 99.58 MB-02-LAAI01 21.11
55
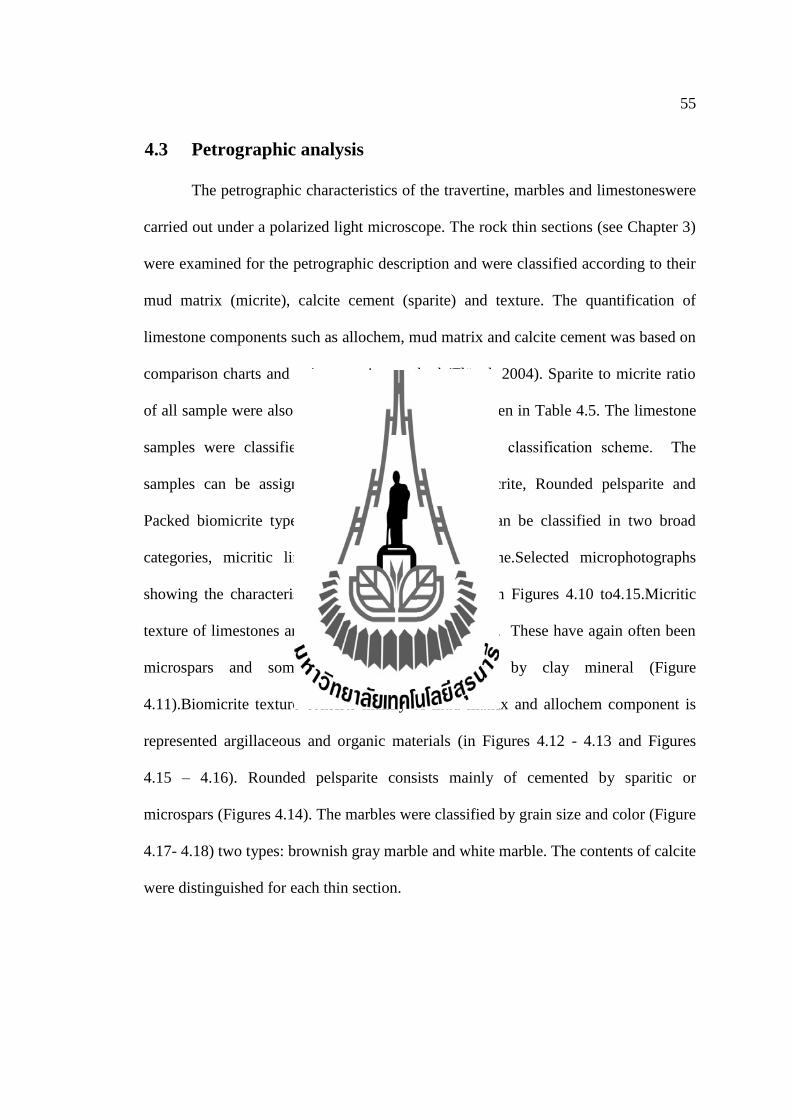
4.3 Petrographic analysis
The petrographic characteristics of the travertine, marbles and limestoneswere
carried out under a polarized light microscope. The rock thin sections (see Chapter 3)
were examined for the petrographic description and were classified according to their
mud matrix (micrite), calcite cement (sparite) and texture. The quantification of
limestone components such as allochem, mud matrix and calcite cement was based on
comparison charts and point counting method (Flügel, 2004). Sparite to micrite ratio
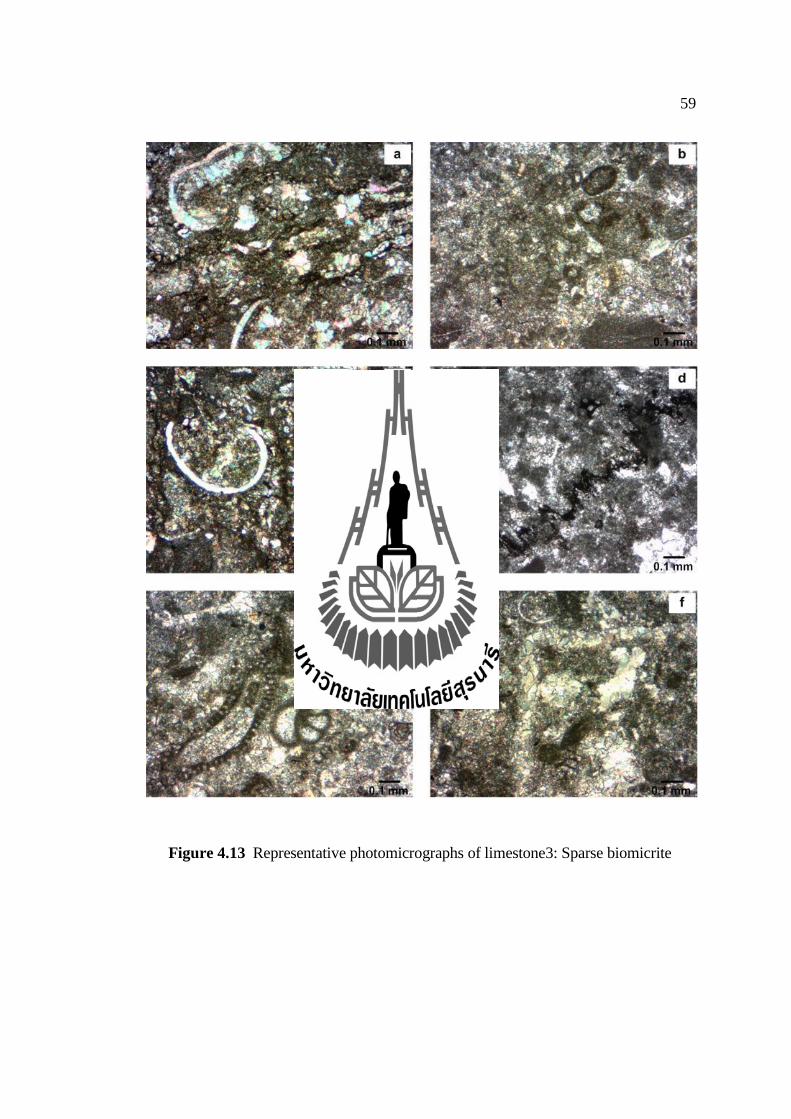
of all sample were also determined. The results are given in Table 4.5. The limestone
samples were classified according to Folk’s (1962) classification scheme. The
samples can be assigned as Micrite, Sparse biomicrite, Rounded pelsparite and
Packed biomicrite types. The texture of limestone can be classified in two broad
categories, micritic limestone and sparitic limestone.Selected microphotographs
showing the characteristics of each type are shown in Figures 4.10 to4.15.Micritic
texture of limestones are the fine grained calcite muds. These have again often been
microspars and sometimes have been affected by clay mineral (Figure
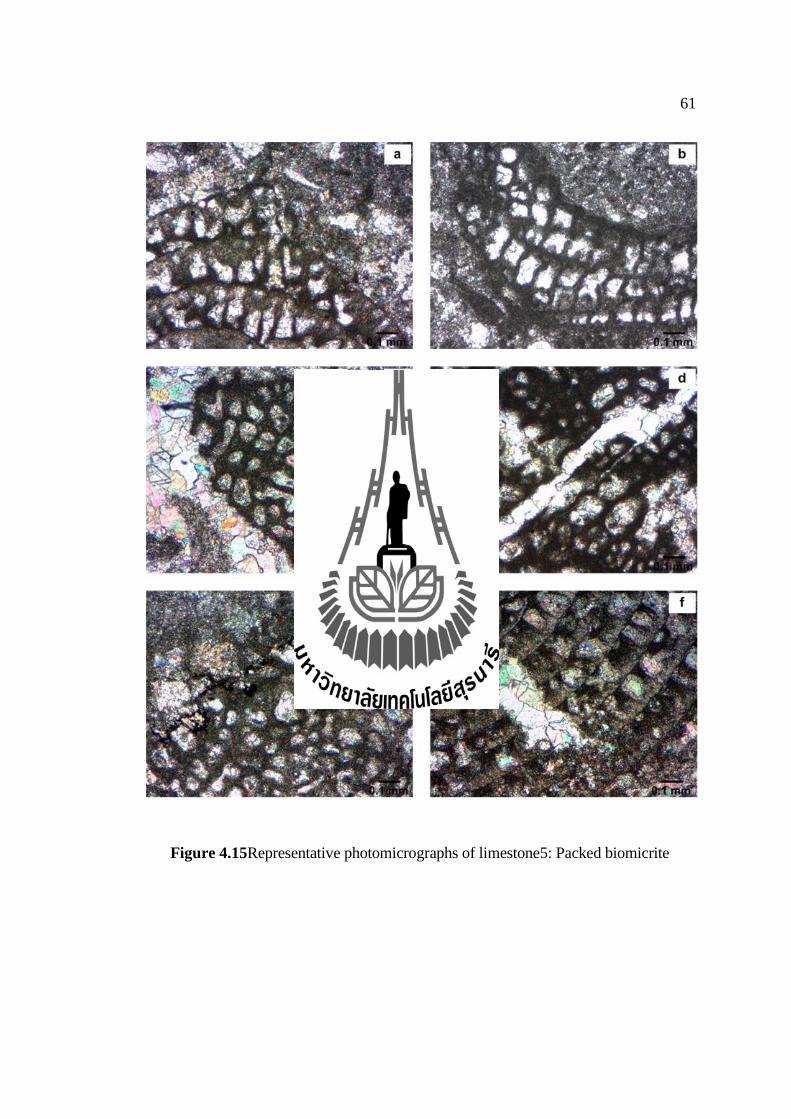
4.11).Biomicrite texture consists mainly of mud matrix and allochem component is
represented argillaceous and organic materials (in Figures 4.12 - 4.13 and Figures
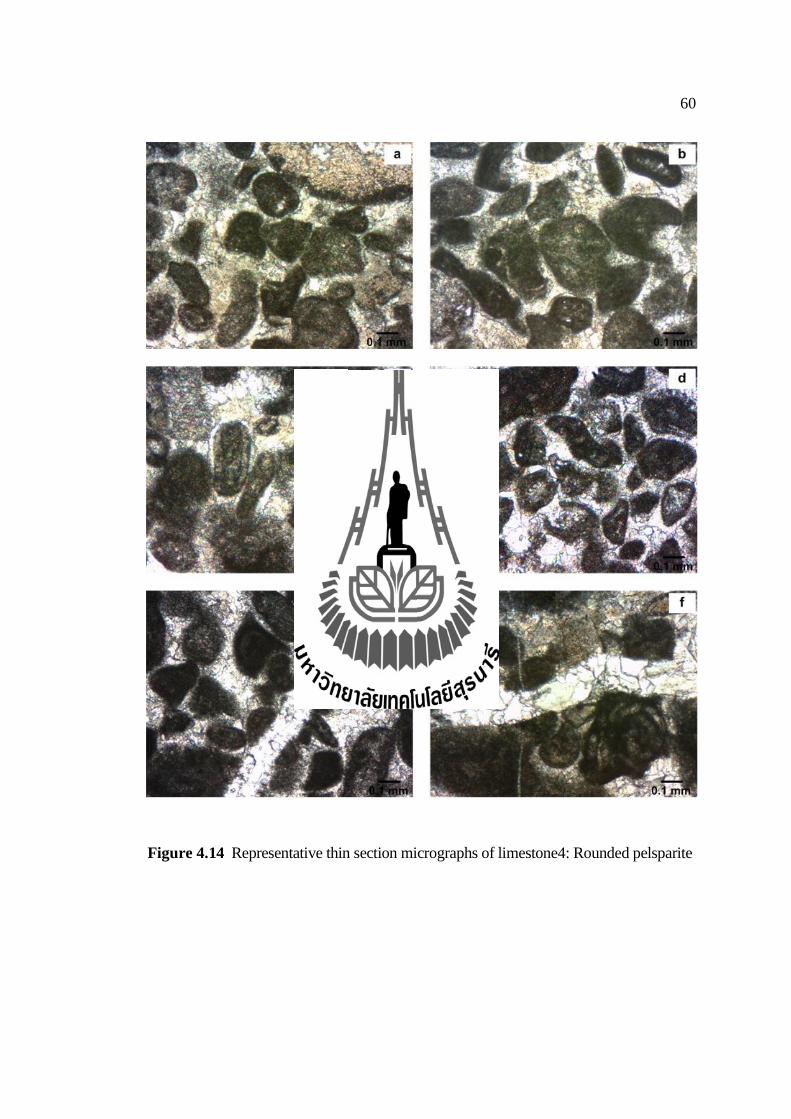
4.15 – 4.16). Rounded pelsparite consists mainly of cemented by sparitic or
microspars (Figures 4.14). The marbles were classified by grain size and color (Figure
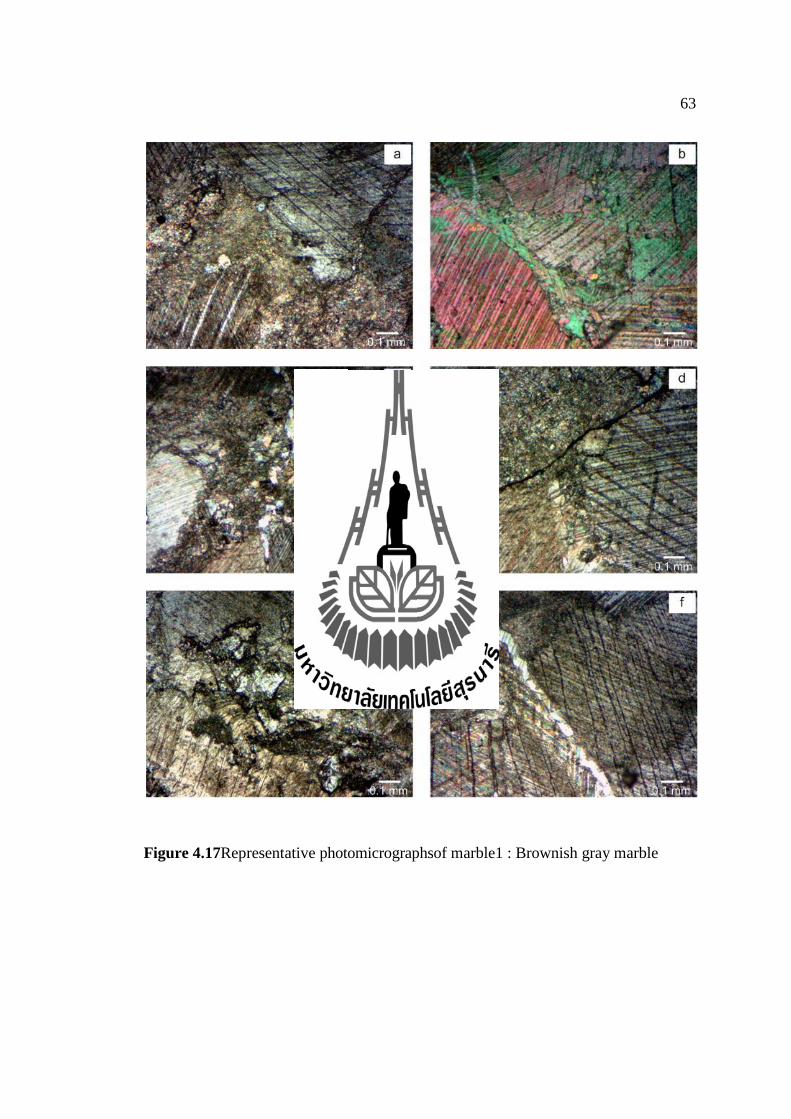
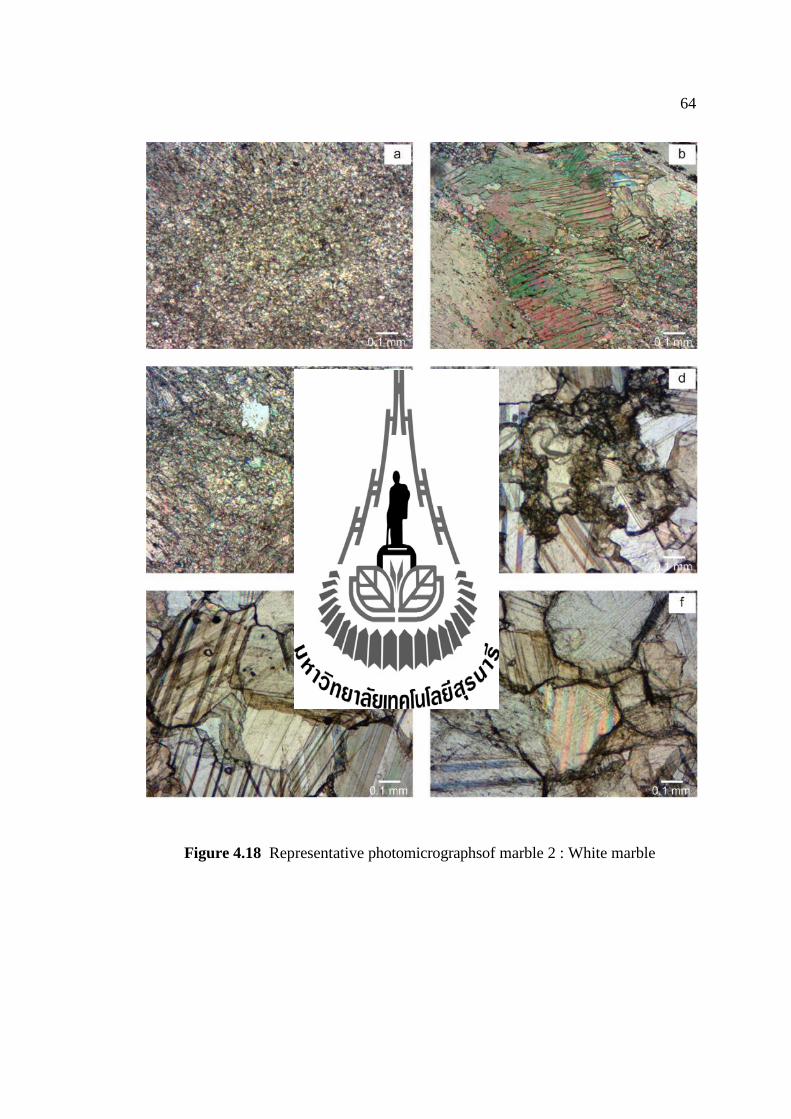
4.17- 4.18) two types: brownish gray marble and white marble. The contents of calcite
were distinguished for each thin section.
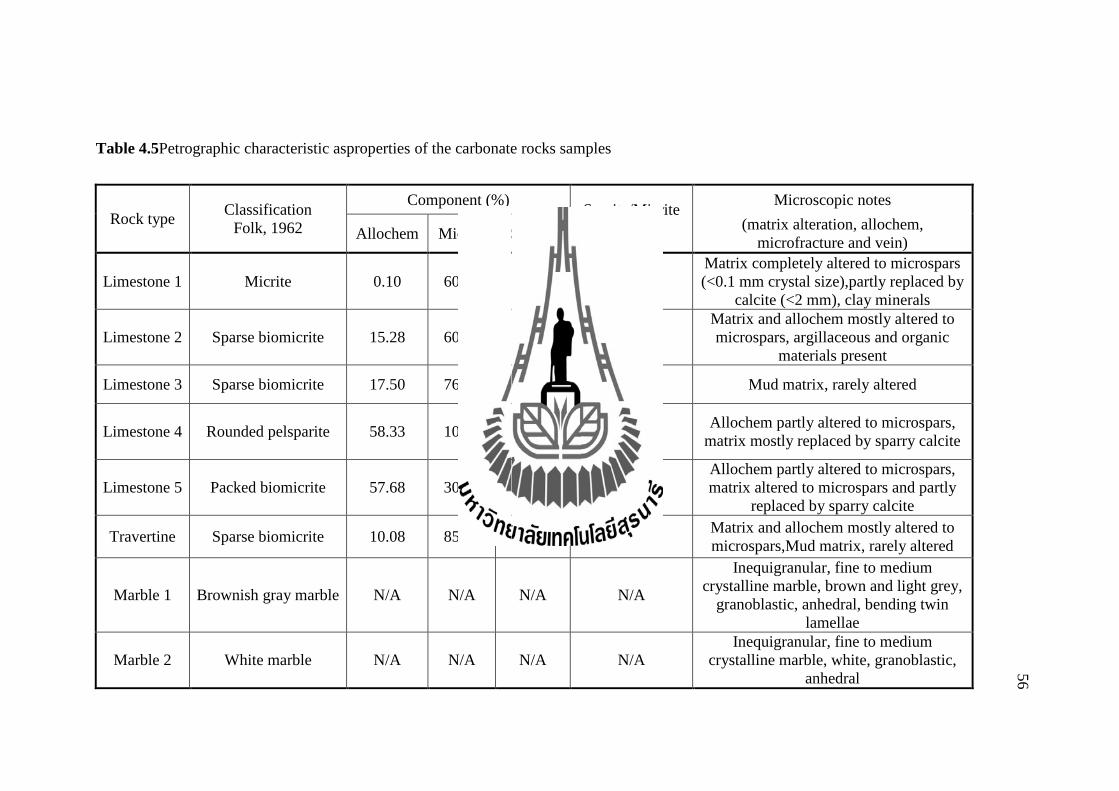
Table 4.5Petrographic characteristic asproperties of the carbonate rocks samples
Rock type Classification
Folk, 1962
Component (%) Sparite/Micrite
ratio
Microscopic notes
Allochem Micrite Sparite (matrix alteration, allochem,
microfracture and vein)
Limestone 1 Micrite 0.10 60.03 39.87 0.66
Matrix completely altered to microspars
(<0.1 mm crystal size),partly replaced by
calcite (<2 mm), clay minerals
Limestone 2 Sparse biomicrite 15.28 60.25 24.47 0.41
Matrix and allochem mostly altered to
microspars, argillaceous and organic
materials present
Limestone 3 Sparse biomicrite 17.50 76.36 6.14 0.35 Mud matrix, rarely altered
Limestone 4 Rounded pelsparite 58.33 10.72 30.95 2.89 Allochem partly altered to microspars,
matrix mostly replaced by sparry calcite
Limestone 5 Packed biomicrite 57.68 30.56 11.76 0.38
Allochem partly altered to microspars,
matrix altered to microspars and partly
replaced by sparry calcite
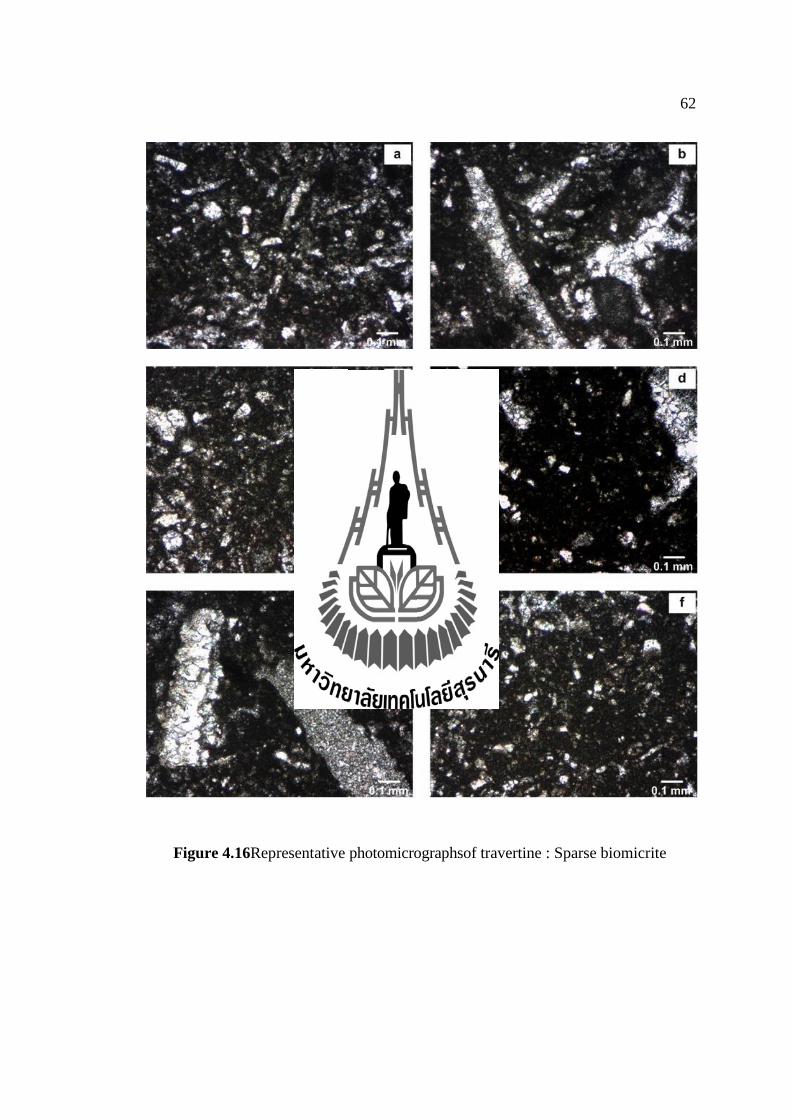
Travertine Sparse biomicrite 10.08 85.12 4.80 0.06 Matrix and allochem mostly altered to
microspars,Mud matrix, rarely altered
Marble 1 Brownish gray marble N/A N/A N/A N/A
Inequigranular, fine to medium
crystalline marble, brown and light grey,
granoblastic, anhedral, bending twin
lamellae
Marble 2 White marble N/A N/A N/A N/A
Inequigranular, fine to medium
crystalline marble, white, granoblastic,
anhedral
56
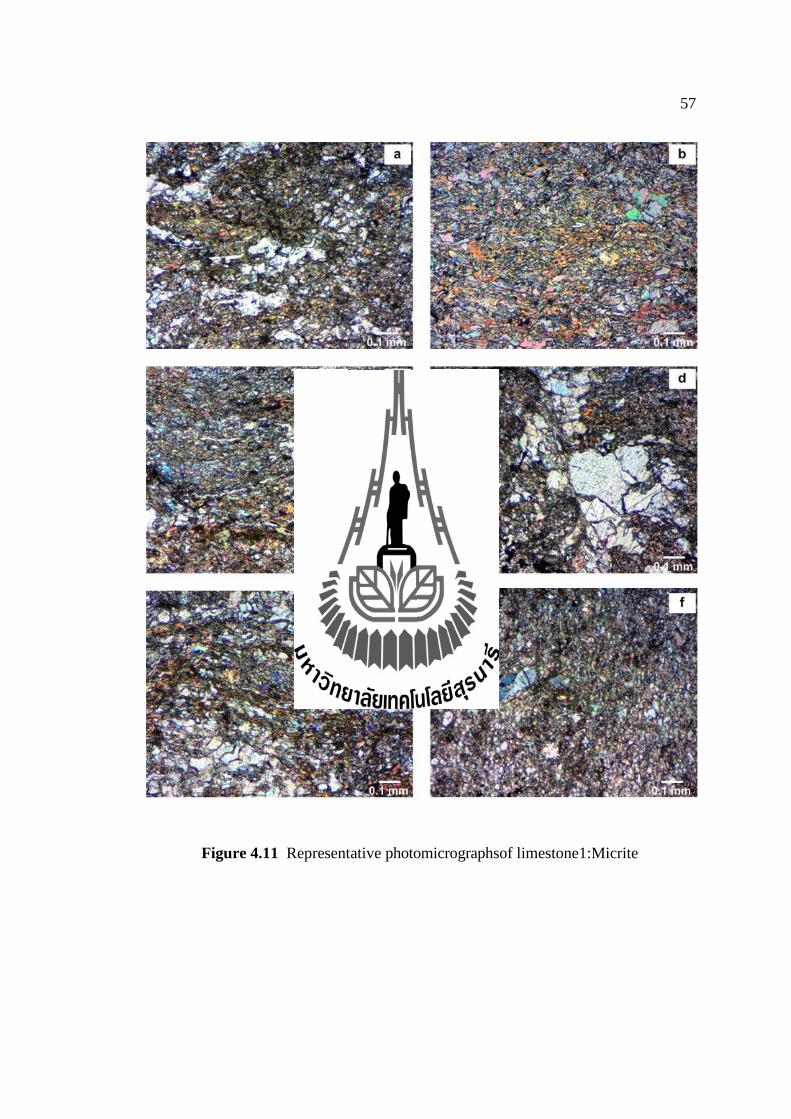
57
Figure 4.11 Representative photomicrographsof limestone1:Micrite
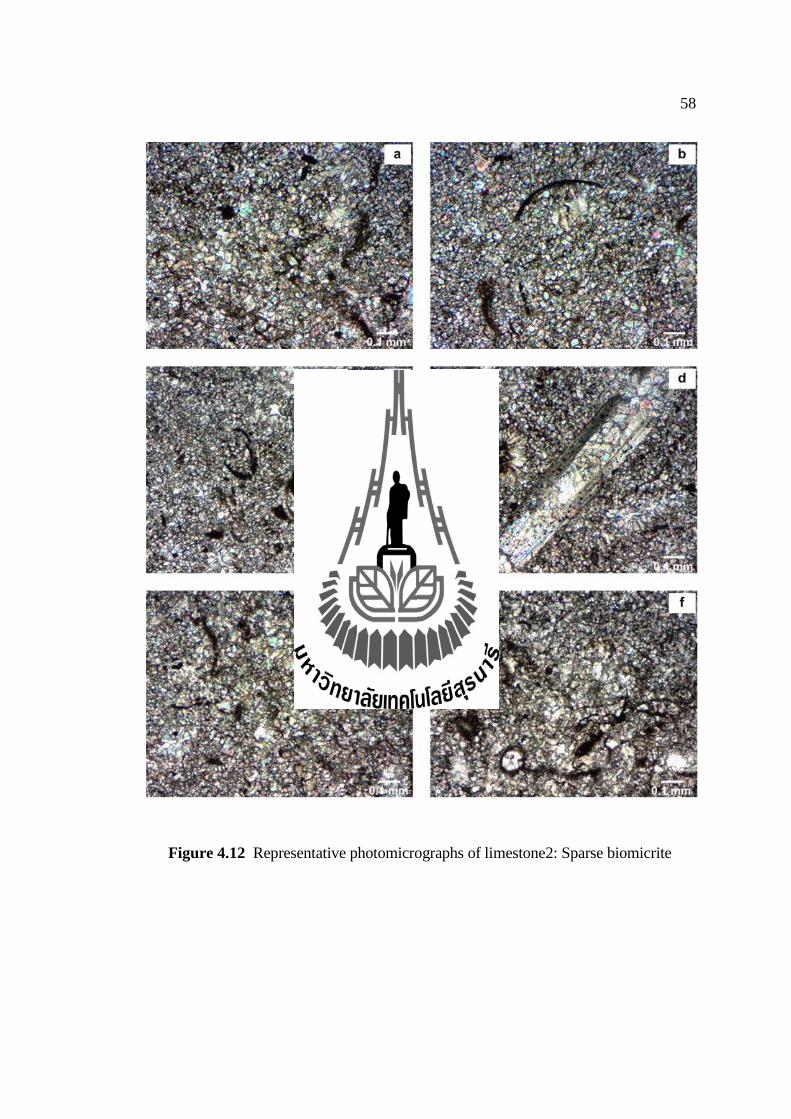
58
Figure 4.12 Representative photomicrographs of limestone2: Sparse biomicrite
59
Figure 4.13 Representative photomicrographs of limestone3: Sparse biomicrite
60
Figure 4.14 Representative thin section micrographs of limestone4: Rounded pelsparite
61
Figure 4.15Representative photomicrographs of limestone5: Packed biomicrite
62
Figure 4.16Representative photomicrographsof travertine : Sparse biomicrite
63
Figure 4.17Representative photomicrographsof marble1 : Brownish gray marble
64
Figure 4.18 Representative photomicrographsof marble 2 : White marble
65
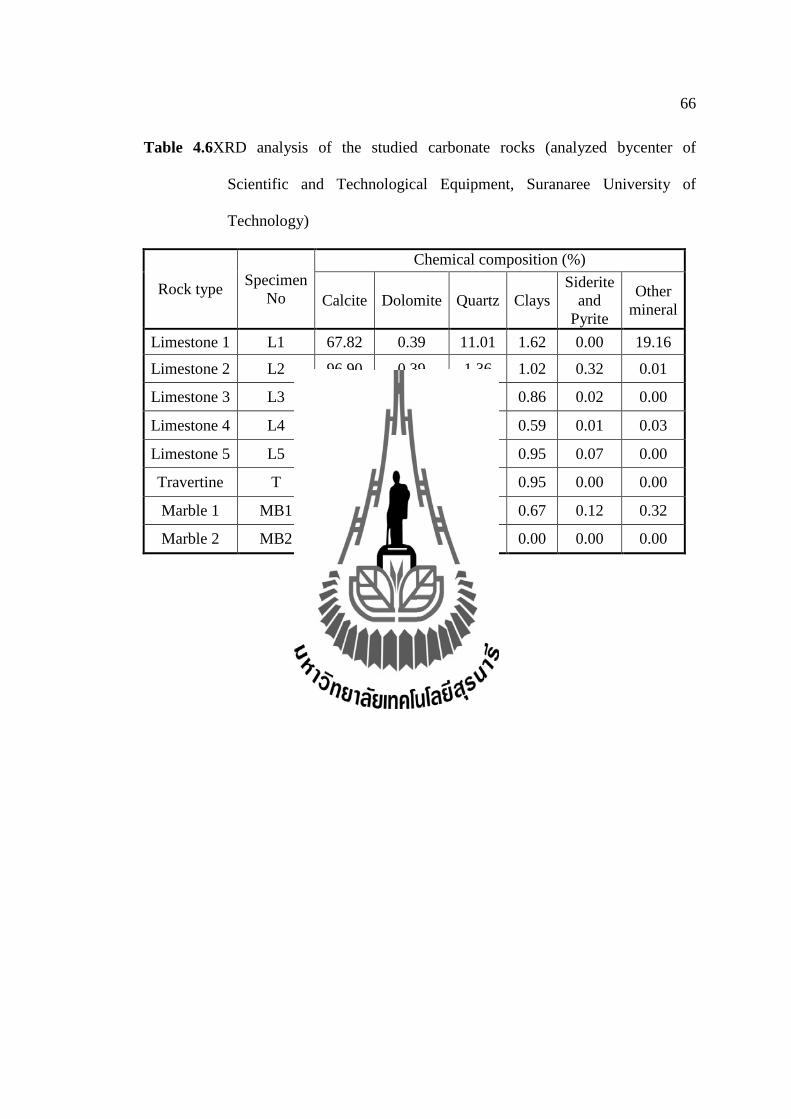
4.4 Chemical analysis
Chemical composition of the carbonate rocks were analyzed by X-ray
diffraction technique (XRD). The results show that the mineralogical compositions
are consisted mainly of calcite and secondly dominated by quartz. Calcite content
ranges from 67.82 to 100 %. The samples containing quartz content ranges from 0.00
to 11.01 %Quartz content is generally less than 1% except for L1 (11.01%) and L2
(1.36). The dolomite content less than 1% and clay mineral content less than 1%,
except for L1 and L2 had content more than 1%. Rock samples studied; there are also
other minerals such as Orthoclase, Actinolite, Fe-bearing minerals. The results are
shown in Table 4.7and the diffraction pattern of the carbonate rock specimens is
shown in Figures 4.19 -4.22.
66
Table 4.6XRD analysis of the studied carbonate rocks (analyzed bycenter of
Scientific and Technological Equipment, Suranaree University of
Technology)
Rock type Specimen
No
Chemical composition (%)
Calcite Dolomite Quartz Clays
Siderite
and
Pyrite
Other
mineral
Limestone 1 L1 67.82 0.39 11.01 1.62 0.00 19.16
Limestone 2 L2 96.90 0.39 1.36 1.02 0.32 0.01
Limestone 3 L3 98.08 0.31 0.73 0.86 0.02 0.00
Limestone 4 L4 97.86 0.57 0.94 0.59 0.01 0.03
Limestone 5 L5 98.38 0.33 0.27 0.95 0.07 0.00
Travertine T 98.70 0.14 0.21 0.95 0.00 0.00
Marble 1 MB1 98.48 0.31 0.10 0.67 0.12 0.32
Marble 2 MB2 100.00 0.00 0.00 0.00 0.00 0.00
67
Figure 4.19 X-ray diffractgrams of powder from carbonate rocks specimens:
(a) Limestone 1 (L1)
(b) Limestone 2 (L2)
70000
Lin
(C
ou
nts
)
2-Theta-scale
0
10000
20000
30000
40000
50000
60000
70000
0 10 20 30 40 50 60 70 80
Calcite
(a)
0
10000
20000
30000
40000
50000
60000
0 10 20 30 40 50 60 70 80
2-Theta-scale
Lin
(C
ou
nts
)
Calcite
(b)
68
Figure 4.20 X-ray diffractgrams of powder from carbonate rocks specimens:
(a) Limestone 3 (L3)
(b) Limestone 4 (L4)
0
10000
20000
30000
40000
50000
60000
70000
0 10 20 30 40 50 60 70 80
Lin
(C
ou
nts
)
2-Theta-scale
(a)
Calcite
0
10000
20000
30000
40000
50000
60000
70000
0 10 20 30 40 50 60 70 80
2-Theta-scale
Lin
(C
ou
nts
)
(b)
Calcite
69
Figure 4.21 X-ray diffractgrams of powder from carbonate rocks specimens:
(a) Limestone 5 (L5)
(b) Travertine (T)
0
10000
20000
30000
40000
50000
60000
70000
0 10 20 30 40 50 60 70 80
Lin
(C
ou
nts
)
2-Theta-scale
(a)
Calcite
0
10000
20000
30000
40000
50000
60000
70000
0 10 20 30 40 50 60 70 80
2-Theta-scale
Lin
(C
ou
nts
)
(b)
Calcite
70
Figure 4.22 X-ray diffractgrams of powder from carbonate rocks specimens:
(a) Marble 1 (MB1)
(b) Marble 2 (MB2)
0
10000
20000
30000
40000
50000
60000
70000
0 10 20 30 40 50 60 70 80
Lin
(C
ou
nts
)
2-Theta-scale
(a)
Calcite
0
100000
200000
300000
400000
500000
600000
700000
0 10 20 30 40 50 60 70 80
2-Theta-scale
Lin
(C
ou
nts
)
(b)
Calcite
CHAPTER V
RELATIONSHIPS BETWEEN MECHANICAL, PHYSICAL,
PETROGRAPHIC AND CHEMICAL PROPERTIES
The objective of this chapter is to estimate the relationships between the
mechanical properties and physical, petrographic, and chemical properties of the
studied rock specimens. Physical properties include density, porosity and wave
velocity. The petrographic properties were considered here as sparite to micrite ratio.
The mineral compositions are considered here involved percentage of quartz and clay
mineral contents.
5.1 Relationship between mechanicalandphysical properties
The effects of physical properties such as density and P-wave velocity on the
mechanical properties (uniaxial compressive strength, elastic modulus and Brazilian
tensile strength, slake durability index and Los Angles abrasion and impaction) are
determined. The uniaxial compressive strength of the carbonate rocks ranges from
45.19 to 72.09 MPa. The marble strengths are in the middle range of the carbonate
rocks samples in test results (50.47 to 51.59 MPa). The elastic modulus of the rocks
can be determined from the stress and strainrelations (Jaeger et al., 2007). The
elasticmodulus varies from 5.68 to 16.83GPa. The slake durability index values are
higher than 99% (ranges from 99.24 to 99.58%).The Los Angles abrasion and
impactionvalues ranges from 18.12 to 21.11 %.
72
The results indicate that the uniaxial compressive strength, elastic modulus
and Brazilian tensile strength tend to increase with increasing density, while the
change of slake durability index are not significant (Figure 5.1). The results obtained
from uniaxial compressive strength and Brazilian tensile strength test agree with the
conclusion drawn by Arman et al. (2014).
The change of the uniaxial compressive strength and Brazilian tensile strength
as a function of P-wave velocityare shown in Figures 5.2a and 5.2c. Increasing of P-
wave velocity increases the uniaxial compressive and Brazilian tensile strengths.
Figure 5.2b presents the change of the elastic modulus as a function of P-wave
velocity. It is noted that the results are scatted. The elastic modulus shows
inconclusive trend with increasing P-wave velocity. The durability index of the tested
carbonate rocks tends to be independent of their density and P-wave velocity. This
may be due to that all limestone tested here are highly durability based on the
characteristic by Rintrawilai et al.(2011) and cannot be distinguish by the two cycles
of the slake durability index testing.
The results obtained were suggested that the density is closely related to the
mechanical properties of the test rocks which agree with theconclusiondrawn by
Rajabzadeh et al.( 2012).
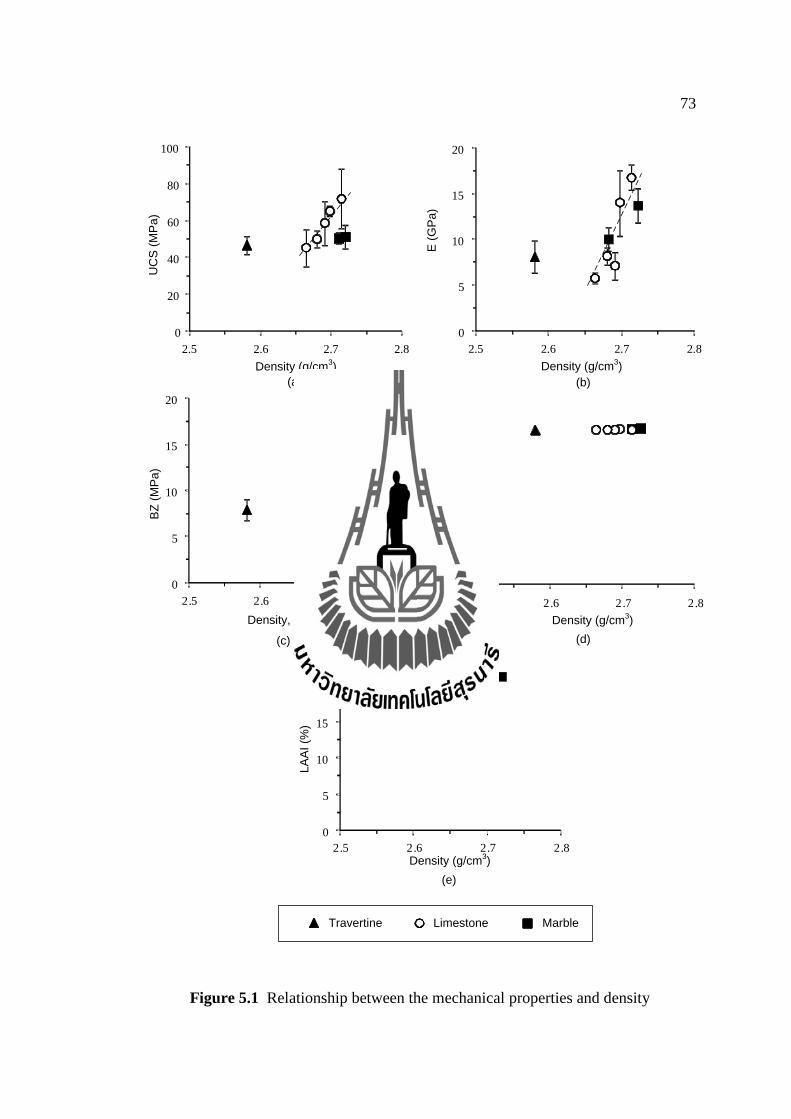
73
Figure 5.1 Relationship between the mechanical properties and density
Travertine Limestone Marble
BZ
(M
Pa
)
Density, d (g/cm3)
0
5
10
15
20
2.5 2.6 2.7 2.8
(c)
SD
I (%
)
Density (g/cm3)
0
20
40
60
80
100
120
2.5 2.6 2.7 2.8
(d)
UC
S (
MP
a)
Density (g/cm3)
0
20
40
60
80
100
2.5 2.6 2.7 2.8
(a)
E (
GP
a)
Density (g/cm3)
0
5
10
15
20
2.5 2.6 2.7 2.8
(b)
0
5
10
15
20
25
2.5 2.6 2.7 2.8Density (g/cm
3)
LA
AI (%
)
(e)
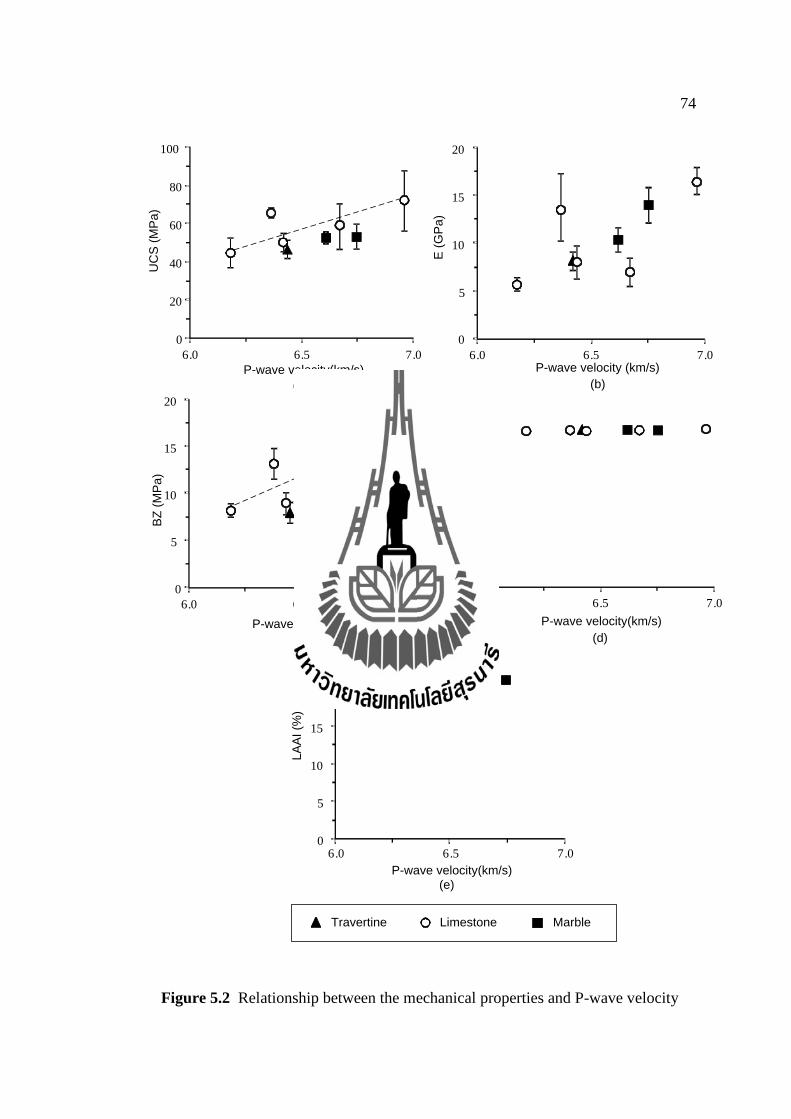
74
Figure 5.2 Relationship between the mechanical properties and P-wave velocity
Travertine Limestone Marble
0
5
10
15
20
25
6.0 6.5 7.0
P-wave velocity(km/s)
LA
AI (%
)
(e)
SD
I (%
)
0
20
40
60
80
100
120
6.0 6.5 7.0
P-wave velocity(km/s)
(d)
5
10
15
20
BZ
(M
Pa)
P-wave velocity(km/s)
0
6.0 6.5 7.0
(c)
P-wave velocity(km/s)
UC
S (
MP
a)
20
40
60
80
100
0
6.0 6.5 7.0
(a)
5
10
15
20
E (
GP
a)
P-wave velocity (km/s)
0
6.0 6.5 7.0
(b)
75
5.2 Relationship between mechanical properties and petrographic
property
The relationship between the mechanical properties and the sparite-to- micrite
ratio of the limestone is shown in Figure 5.3.The results indicate that the uniaxial
compressive strength, elastic modulus, and tensile strength values decrease with
increasing the sparite-to-micrite ratio. These results can be found in the limestone 4
(L4). However, this relationship is statistically unclear. The strength of the tested
limestones may not be controlled only by the sparite-to-micrite ratio. Similar
conclusions are drawn by Tugrul and Zarif (2000). The limestone strength is probably
controlled by depositional fabric, post depositional processes (Andriani and Walsh,
2002; Gajić et al., 2011) and grain size of texture (Hatzor and Plachik, 1997,
1998).The slake durability index and Los Angles abrasion and impaction test plotted
against sparite-to-micrite ratio is shown in Figure 5.3d and Figure 5.3e which
indicated that durability of the carbonate rocks seem to be independence of the
limestone texture.
5.3 Relationship between mechanical properties and mineral
composition
Figure 5.4 plots the mechanical properties (uniaxial compressive strength,
elastic modulus and Brazilian tensile strength) againstthe quartz content from 0% to
11.01%. The resultsreveal that quartz of less than 1% has no significant effect on the
mechanical properties of the carbonate rocks specimens. However, a higher amount of
quartz contenting11.01% results in a higher uniaxial compressive strength, elastic
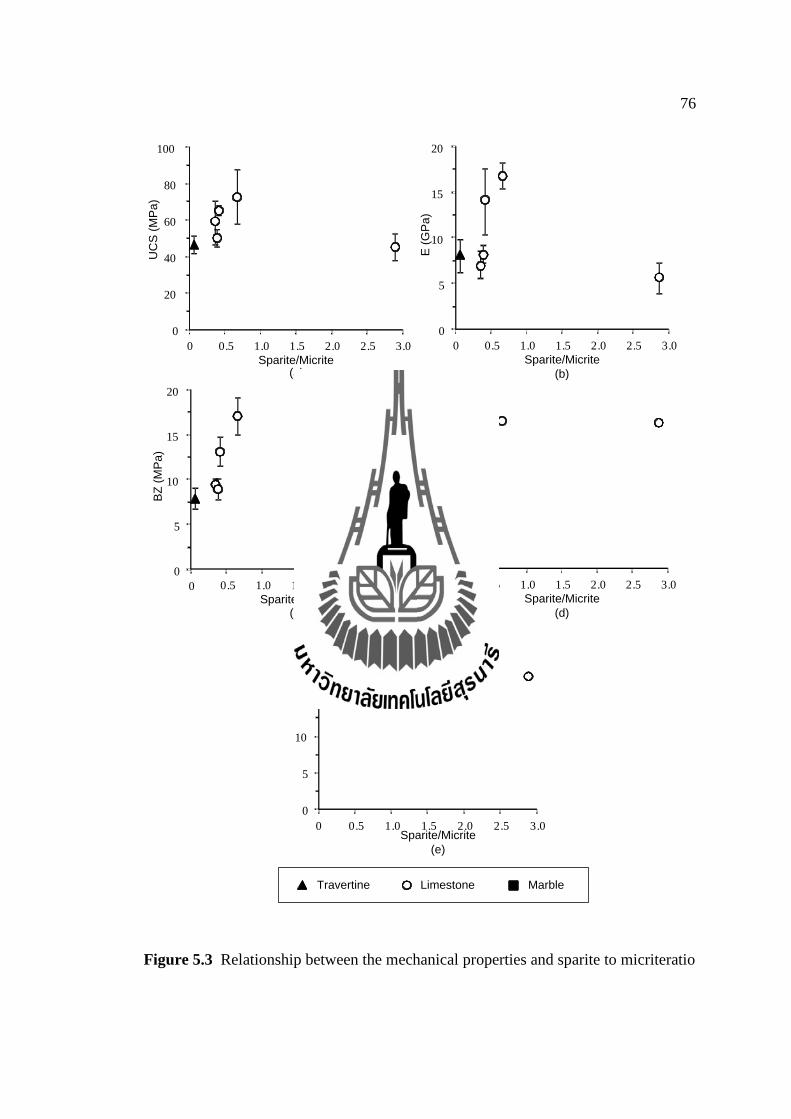
76
Figure 5.3 Relationship between the mechanical properties and sparite to micriteratio
Travertine Limestone Marble
0
5
10
15
20
BZ
(M
Pa
)
0 0.5 1.0 1.5 2.0 2.5 3.0
Sparite/Micrite(c)
0 0.5 1.0 1.5 2.0 2.5 3.0
Sparite/Micrite
SD
I (%
)
0
20
40
60
80
100
120
(d)
0
20
40
60
80
100
0 0.5 1.0 1.5 2.0 2.5 3.0
UC
S (
MP
a)
Sparite/Micrite(a)
E (
GP
a)
0
5
10
15
20
0 0.5 1.0 1.5 2.0 2.5 3.0
Sparite/Micrite
(b)
0
5
10
15
20
25
0 0.5 1.0 1.5 2.0 2.5 3.0Sparite/Micrite
(e)
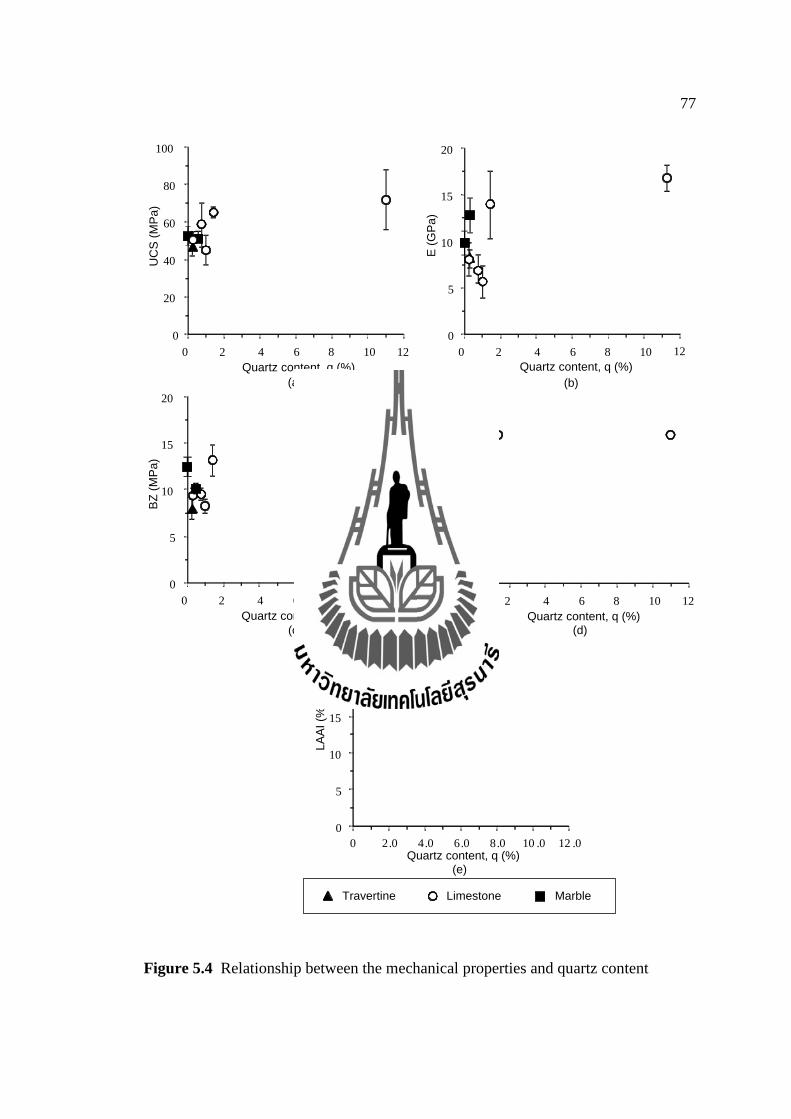
77
Figure 5.4 Relationship between the mechanical properties and quartz content
0
5
10
15
20
BZ
(M
Pa)
0 2 4 6 8 10 12
Quartz content, q (%)
(c)
0 2 4 6 8 10 12
Quartz content, q (%)
SD
I (%
)
0
20
40
60
80
100
120
(d)
E (
GP
a)
Quartz content, q (%)
0
5
10
15
20
0 2 4 6 8 10 12
(b)
0
20
40
60
80
100
0 2 4 6 8 10 12
UC
S (
MP
a)
Quartz content, q (%)
(a)
Travertine Limestone Marble
0
5
10
15
20
25
0 2.0 4.0 6.0 8.0 10 .0 12 .0Quartz content, q (%)
LA
AI (%
)
(e)
78
modulus and Brazilian tensile strength. This is supported by the conclusion drawn by
Ozcelik et al. (2013) that the limestone strength increases with increasing percentage
of quartz content. The slake durability index and Los Angles abrasion and impaction
test plotted against quartz content of carbonate rocks are shown in Figure 5.4d and
Figure 5.4e indicating the values durability index seems to be independent of quartz
content. This is different from the conclusions drawn by Dhakal et al. (2002), who
found that the slake durability index of rocks is closely related to mineralogical
composition. This may be due to the fact that the mineral compositions of all
carbonate rock specimens tested here are very similar. The calcite content for all rock
types are from 67.82% to 100.00 % by weight. This suggests that the mineral of rocks
tested has an insignificant effect on the slake durability index.
Figure 5.5 shows the mechanical properties of carbonate rocks as a function of
clay mineral content, from 0 % to 1.62 %. It shows that the clay mineral content of the
limestone may increase on the mechanical properties. The increase of clay mineral
content tends to be increase the uniaxial compressive strength, elastic modulus and
Brazilian tensile strength. For travertine and marbles, the small amounts of clay
mineral content seem to have no effect on the mechanical properties of carbonate
specimens. In Figure 5.5d the slake durability indexand Los Angles abrasion and
impaction test is plotted against the clay mineral content. The diagram indicates that
the clay mineral content has no effect on the slake durability indexand Los Angles
abrasion and impaction test.
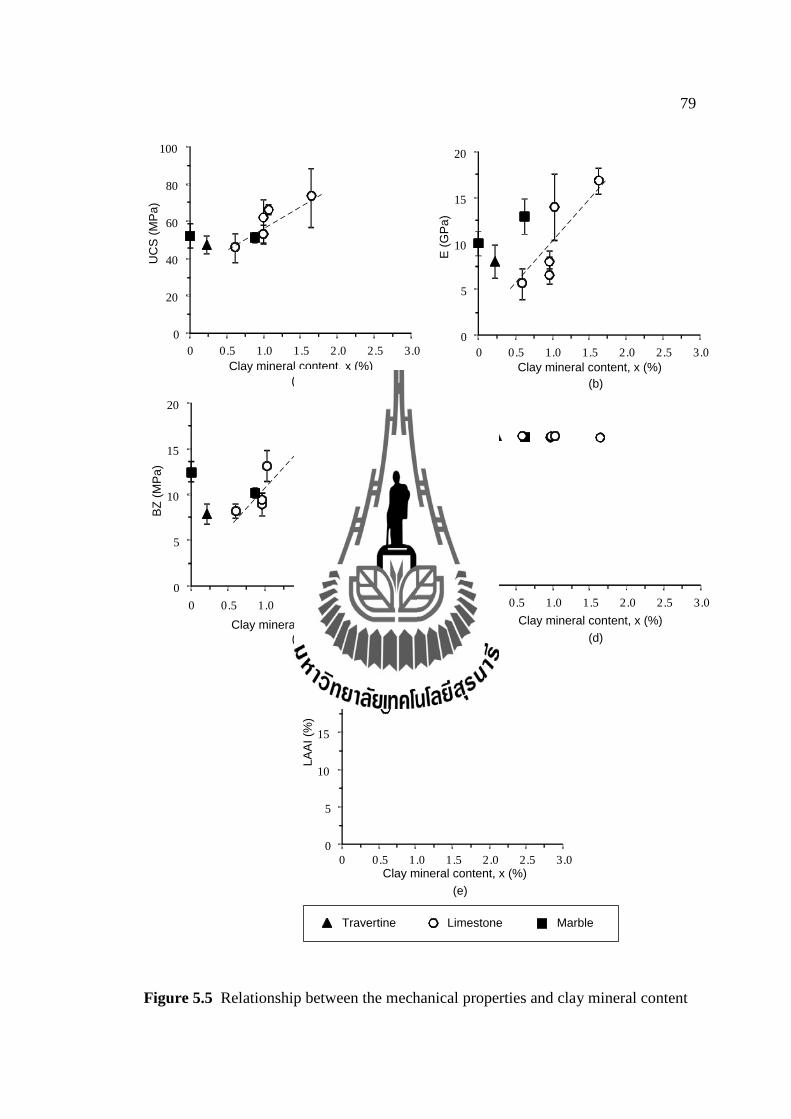
79
Figure 5.5 Relationship between the mechanical properties and clay mineral content
Travertine Limestone Marble
0
20
40
60
80
100U
CS
(M
Pa)
0 0.5 1.0 1.5 2.0 2.5 3.0
Clay mineral content, x (%)
(a)
0
5
10
15
20
0 0.5 1.0 1.5 2.0 2.5 3.0
E (
GP
a)
Clay mineral content, x (%)
(b)
(c)
0
5
10
15
20
0 0.5 1.0 1.5 2.0 2.5 3.0
BZ
(M
Pa)
Clay mineral content, x (%)
SD
I (%
)
0
20
40
60
80
100
120
0 0.5 1.0 1.5 2.0 2.5 3.0
Clay mineral content, x (%)
(d)
0
5
10
15
20
25
0 0.5 1.0 1.5 2.0 2.5 3.0
LA
AI (%
)
Clay mineral content, x (%)
(e)
CHAPTER VI
DISCUSSIONS AND CONCLUSIONS
6.1 Discussions and conclusions
The study presented has mainly been focused on the influence of the physical
properties, petrographic characteristics and mineral compositions of the investigated
basic carbonate rocks on the mechanical properties. The mechanical properties
testing in this study are divided into four groups: uniaxial compression strength test,
Brazillian tensile strength test, slake durability index test and Los Angeles abrasion
and impaction test. The physical properties considered here include the density,
porosity and wave velocity. The point count method is used to estimate the
petrographic characteristics. Additionally, textural description is carried out by using
polarizing microscope. X-ray diffraction (XRD) is used to determine the mineral
compositions of the carbonate rocks.
The results of this study indicate that the uniaxial compressive strength, elastic
modulus and Brazilian tensile strength tend to depending on density and P-wave
velocity. The elastic modulus also shows inconclusive trend with increasing P-wave
velocity. The slake durability index and Los Angeles abrasion and impaction testof
the tested carbonate rocks tend to be independent of their density and P-wave
velocity, this may be due to the high durability of the tested limestone which cannot
be distinguish by the two cycles of the slake durability index testing.
81
The relationship between the mechanical properties and the sparite-to-micrite
ratio indicates that the uniaxial compressive strength, elastic modulus, and tensile
strength values decrease with increasing the sparite-to-micrite ratio. However, the
number of specimen with sparite used here are few. The strength of the tested
limestones may not be controlled by the sparite content only but it may be controlled
by other factors such as type of fabric, size of grains (fabrics), and post depositional
processes. The slake durability index and Los Angeles abrasion and impaction test of
the carbonate rocks seem to be independence of the texture.
The effects of mineral composition on mechanical properties reveal that quartz
of less than 1% has no significant effect on the mechanical properties of the tested
carbonate rock specimens. The limestone strength increases with increasing
percentage of quartz content. The increase of clay mineral content of limestone tends
to increase the uniaxial compressive strength, elastic modulus and Brazilian tensile
strength. For travertine and marbles, the small amounts of clay mineral content have
no effect on the mechanical properties. The values of slake durability index and Los
Angeles abrasion and impaction test do not show relationship with quartz and clay
mineral content. However, the mineral compositions of all tested carbonate rock
specimens are very similar so that they do not significantly affect the durability index.
The porosity value are obtained from the proposed method in this study cannot
indicate the invalid porosity because the pore space in the carbonate rocks are formed
by the inter-crystalline boundaries.
The results from this study suggest a good trend to estimate the
relationshipbetween the mechanical and physical, chemical and petrographic
propertiesof carbonate rocks. Nevertheless, in order to further confirm the results
82
obtained from this study, more testing should be performed with the higher number of
specimens. It is quite clear the there are several profound factors which influence the
mechanical properties of the carbonate rocks, therefore; a large group of rock samples
should be adequate for mathematical analysis.
6.2 Recommendations for future studies
The uncertainties of the studied investigation and results discussed above lead
to the recommendations for further studies.The numbers of the testedrock samples
are insufficient to develop the mathematical relationship between the mechanical and
physical, and petrographic propertiesof rocks. More testing is also desirable to
confirm or verity that the petrography can predict the mechanical properties of rocks.
This also suggests thatthe variety of rocks with different mineral compositions should
be obtained.
83
REFERENCES
Andriani, G.F., and Walsh, N. (2002). Physical properties and textural parameters of
calcarenitic rocks: qualitative and quantitative evaluation. Engineering
Geology. 67: 5–15.
Ar, I., and Akgul, Y.S. (2008). A generic system for the classification of marble tiles
using gabor filters. In the Twenty-third International Symposiums on
Computer and Information Sciences.(pp. 1-6) October27-29, Istanbul,
Turkey.
Arman, H., Hashem, W., El Tokhi, M., Abdelghany, O. and El Saiy, A. (2014)
Petrographical and Geomechanical Properties of the Lower Oligocene
Limestones from Al Ain City, United Arab Emirates.Arabian Journal for
Science and Engineering. 39:261–271
ASTM C131-06. Standard Test Method for Resistance to Degradation of Small-Size
Coarse Aggregate by Abrasion and Impact in the Los Angeles Machine. In
Annual Book of ASTM Standards, (Vol. 04.02). West Conshohocken:
American Society for Testing and Materials.
ASTM C97 Standard Test Methods for Absorption and Bulk Specific Gravity of
Dimension Stone. In Annual Book of ASTM Standards, (Vol. 04.02).West
Conshohocken: American Society for Testing and Materials.
ASTM D 3967-05. Standard Test Method for Splitting Tensile Strength of Intact
Rock Core Specimens InAnnual Book of ASTM Standards, (Vol. 04.02).
West Conshohocken: American Society for Testing and Materials.
84
ASTM D 7012. Standard Test Method for Compressive Strength and Elastic Moduli
of Intact Rock Core Specimens under Varying States of Stress and
Temperatures. In Annual Book of ASTM Standards, (Vol. 04.02). West
Conshohocken: American Society for Testing and Materials.
ASTM D2845-08. Standard test method for laboratory determination of pulse
velocities and ultrasonic elastic constants of rock. In Annual Book of ASTM
Standards (Vol.04.08). West Conshohocken: American Society for Testing and
Materials.
ASTM D4543. Standard test method for preparing rock core specimens and
determining dimensional and shape tolerances. In Annual Book of ASTM
Standards, (Vol. 04.02). Philadelphia: American Society for Testing and
Materials
ASTM D4644. Standard Test Method for Slake Durability of Shales and Similar
Weak Rocks InAnnual Book of ASTM Standards, (Vol. 04.02). West
Conshohocken: American Society for Testing and Materials.
Boggs, S. (2009). Petrology of Sedimentary Rocks.2nd ed. United States of America
by Cambridge University Press, New York
Chan, Y.C. (1994) Classification and zoning of marble sites. Geotechnical
Engineering Office Civil Engineering Department by University of Hong Kong,
Hong Kong.
Dhakal, G., Yoneda, T., Kata, Y., and Kaneko, K. (2002). Slake durability and
mineralogical properties of some pyroclastic and sedimentary rocks.
Engineering Geology. 65(1): 31-45.
85
Dunham, R.J. (1962).Classification ofcarbonaterocks according to depositional
texture. In Classification ofcarbonaterocks: American Association of
Petroleum Geologists Memoir. pp. 108-121.
Flügel, E. (2004). Microfacies of carbonate rocks. New York: Springer-Verlag
Folk, R.L. (1959). Practical petrographical classification of limestones. American
Association of Petroleun Geologist Bulletin. 43: 1-38.
Folk, R.L. (1962). Spectral subdivision of limestone types. In Classification of
carbonate Rocks-A Symposium: American Association of Petroleum
Geologists Memoir. 1: 62-84.
Gajic, V., Matovic, V., Vasic, N., and S-B, D. (2011). Petrophysical and mechanical
properties of the Struganik limestone, Vardar Zone, West Serbia.
AnnalesGeologiques de la Peninsular Balkanique. 72: 80-100.
Goodman, R. E. (1989). Introduction to Rock Mechanics. New York: John Wiley &
Sons.
Hatzor, Y. H. and V. Palchik, 1997. The influence of grain size and porosity on crack
initiation stress and critical flaw length in dolomites. International Journal of
Rock Mechanics and Mining Sciences. 34(5): 805-816.
Hatzor, Y. H. and V. Palchik, 1998. A microstructure-based failure criterion for
Aminadav dolomites -Technical Note. International Journal of Rock
Mechanics and Mining Sciences. 35(6): 797-805.
ISRM. (1981). Suggested Method for Rock Characterization, Testing and
Monitoring. Oxford. Pergamon.
Jaeger, J. C., and Cook, N. G. W. (1979). Fundamentals of Rock Mechanics.
London: Chapman and Hall.
86
Kahraman, S.andYeken, T., 2008. Determination of physical properties of carbonate
rocks from P-wave velocity. Bulletin of Engineering Geology and the
Environment. 67: 277-281
Ling, P., Shaopeng, W., Jiging, Z. and Lu, W. (2010) Relationship between
Retrographical and Physical Properties of Aggregates. Journal of Wuhan
University of Technology Mater (Vol.25).4:678-681
Olsson, W.A. (1974). Grain size dependence of yield stress in marble. Journal of
Geophysical Research. 79: 4859–4862.
Ozcelik, Y., Bayram, F., and YasitliN. E. (2013). Prediction of engineering properties
of rocks from microscopic data. Arabian Journal of Geosciences. 6:3651–
3668
Prikryl, R. (2001). Some Microstructural Aspects of Strength Variation in Rock.
International Journal of Rock Mechanics and Mining Sciences. 38: 671-
682.
Rajabzadeh, M. A., Moosavinasab Z., and Rakhshandehroo G. (2012) Effects of rock
classes and porosity on the relation between uniaxial sompressive strength and
some rock properties for Carbonate rocks. Rock Engineering and Rock
Mechanics.45:113–122
Rintrawilai, S., Walsri, C., and Fuenkajorn, K. (2011) Large-scaled slake durability
ondex testing. In Proceedings of the Third Thailand Symposium on Rock
Mechanics (pp. 239-245). March 10-11, Sea Resort and Spa, Petchaburi,
Thailand.
87
Sabatakakis, N., Koukis, G., Tsiambaos, G. andPapanakli, S. (2008). Index properties
and strength variation controlled by microstructure for sedimentary rocks.
Engineering Geology. 97:80-90.
Sadeghi, H. and Khosravi, F. (2003) A study of the effect of wave velocity on
solubility of limestone and chalk. DefromationCharacterics of Geomaterials.
pp 409-413
Suresh, A., Raju, U.S.N., Nagaraja Rao, A., and Vijaya Kumar, V. (2008) An
innovative technique of marble texture description based on grain components.
International Journal of Computer Science and Network. 8(2): 122-126.
Tarawneh, K., Al-Thyabat, S., and Al-Harahsheh, M. (2007). Mineralogical, physical
and mechanical properties of limestone rocks in Ma’an area, South Jordan.
Geology and Geophysics. 50 (1): 123-128.
Torok, A., and Vasarhelyi, B. (2010). The influence of fabric and water content on
selected rock mechanical parameters of travertine, examples from Hungary.
Engineering Geology. 115: 237–245
Toservski, A., Pollak, D., Zenko, T., Aljinovic, D., and Tadej, N. (2011). Some
engineering properties of limestone: Tunnel Strazina case study (Croatia).
Tunnelling and underground Space Technology. 26 (1): 242-251.
Tucker, Maurice. E. (1991). Sedimentary Petrology: an introduction to the origin
of sedimentary rocks.2nd ed.Backwell Scientific, Oxford, London. 260 p.
Tuğrul, A. andZarif, I.H.(2000). Engineering aspects of limestone weathering in
Istanbul, Turkey.Bulletin of Engineering Geology and the Environment. 58:
191–206.
88
Wong, R.H.C., Chau, K.T., and Wang, P. (1996). Microcracking and grain size effect
in Yeun Long marbles. International Journal of Rock Mechanics and
MiningScience &Geomechanics Abstracts. 33(5): 479–485.
Yagiz, S. (2009) Predicting uniaxial compressive strength, modulus of elasticityand
index properties of rocks using the Schmidt hammer.Bulletin of Engineering
Geology and the Environment. 68:55–63
Yasar, E., and Erdogan Y. (2004) Correlating sound velocity with the density,
compressive strength and Young’s modulus of carbonate rocks. International
Journal of Rock Mechanics and MiningScience. 41: 871–875
BIOGRAPHY
Miss. Samerhkea Promma was born on March16, 1990 in Chiang Rai
province, Thailand. She received her Bachelor’s Degree in Engineering
(Geotechnology) from Suranaree University of Technology in 2012. For her post-
graduate, she continued to study with a Master’s degree in the Geological Engineering
Program, Institute of Engineering, Suranaree university of Technology. During
graduation, 2013-2014, she was a part time worker in position of research assistant at
the Geomechanics Research Unit, Institute of Engineering, Suranaree University of
Technology.