Embed Size (px)
Citation preview
PREDICTION OF LONG-TERM COGNITIVE DECLINE FOLLOWING
POSTOPERATIVE DELIRIUM IN OLDER ADULTS
Elizabeth E. Devore1, Tamara G. Fong2,3, Edward R. Marcantonio2,4, Eva M. Schmitt2, Thomas
G. Travison2,4, Richard N. Jones2,5*, Sharon K. Inouye2,4*
*Co-senior authors
1 Channing Division of Network Medicine, Brigham and Women’s Hospital and Harvard
Medical School, Boston, Massachusetts
2 Aging Brain Center, Institute of Aging Research, Hebrew SeniorLife, Boston, Massachusetts
3 Department of Neurology, Beth Israel Deaconess Medical Center and Harvard Medical School,
Boston, Massachusetts
4 Department of Medicine, Beth Israel Deaconess Medical Center and Harvard Medical School,
Boston, Massachusetts
5 Departments of Psychiatry and Human Behavior and Neurology, Brown University Warren
Alpert Medical School, Providence, Rhode Island
Corresponding author: Elizabeth E. Devore, 181 Longwood Avenue, Room 448, Boston,
Massachusetts 02115; phone: 617-525-2042; fax: 617-525-2008; email:
Word count: Abstract (248), Text (4,630)
This is the author’s manuscript which was subsequently submitted to and accepted for publication. J Gerontol A Biol Sci Med Sci. 2017; 72(12):1697-1702.
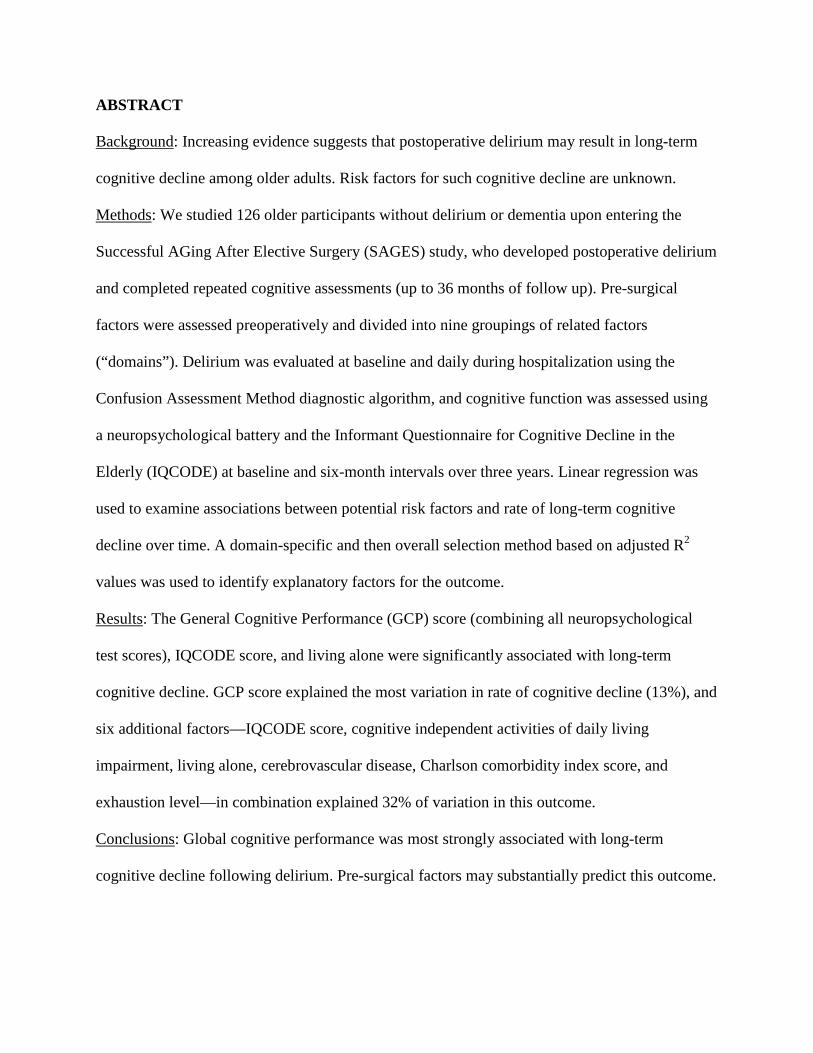
ABSTRACT Background: Increasing evidence suggests that postoperative delirium may result in long-term
cognitive decline among older adults. Risk factors for such cognitive decline are unknown.
Methods: We studied 126 older participants without delirium or dementia upon entering the
Successful AGing After Elective Surgery (SAGES) study, who developed postoperative delirium
and completed repeated cognitive assessments (up to 36 months of follow up). Pre-surgical
factors were assessed preoperatively and divided into nine groupings of related factors
(“domains”). Delirium was evaluated at baseline and daily during hospitalization using the
Confusion Assessment Method diagnostic algorithm, and cognitive function was assessed using
a neuropsychological battery and the Informant Questionnaire for Cognitive Decline in the
Elderly (IQCODE) at baseline and six-month intervals over three years. Linear regression was
used to examine associations between potential risk factors and rate of long-term cognitive
decline over time. A domain-specific and then overall selection method based on adjusted R2
values was used to identify explanatory factors for the outcome.
Results: The General Cognitive Performance (GCP) score (combining all neuropsychological
test scores), IQCODE score, and living alone were significantly associated with long-term
cognitive decline. GCP score explained the most variation in rate of cognitive decline (13%), and
six additional factors—IQCODE score, cognitive independent activities of daily living
impairment, living alone, cerebrovascular disease, Charlson comorbidity index score, and
exhaustion level—in combination explained 32% of variation in this outcome.
Conclusions: Global cognitive performance was most strongly associated with long-term
cognitive decline following delirium. Pre-surgical factors may substantially predict this outcome.

Keywords: Risk factors, cognition, elective surgery
INTRODUCTION
Delirium, an acute confusional state, is a common condition affecting up to 50% of older
adults in the hospital, with serious potential consequences including cognitive and functional
impairment, institutionalization, and mortality(1). Previous studies have indicated that
individuals with delirium following surgery often experience cognitive impairment, although few
studies have assessed cognitive function beyond six to twelve months postoperatively(2); still,
emerging evidence suggests that some individuals never return to their previous cognitive
level(2), and instead exhibit accelerated cognitive decline over the longer term(3). In the SAGES
study, we previously reported that individuals had linear trajectories of cognitive decline over
postoperative months two to 36, and these trajectories were significantly steeper among
participants who developed delirium compared to those who did not(3).
The etiology of delirium associated with long-term cognitive sequelae is unclear.
Multiple risk factors have been identified for delirium(4), and validated prediction models have
been developed to target high-risk individuals for intervention(5-8). Moreover, intervention
programs such as the Hospital Elder Life Program and proactive geriatric consultation have
successfully targeted modifiable risk factors (e.g., sleep and mobilization), with 30-40%
reductions in delirium among older hospitalized patients(9, 10). In the absence of delirium, there
are several established risk factors for cognitive decline in older adults (e.g., age and education),
although most of these factors are not modifiable(11). However, risk factors specific for delirium
associated with cognitive decline have not yet been identified. Exploring such factors is a
necessary first step toward understanding the etiology of delirium associated with long-term
cognitive decline, and identifying potential therapeutic targets for intervention. This paper
specifically examines whether pre-surgical factors predict the rate of long-term cognitive decline
among older persons without dementia who developed postoperative delirium. Identifying such
factors could be useful in selecting high-risk individuals for targeted prevention or randomized
trials aimed at stalling cognitive decline following delirium.
METHODS
Study sample
The SAGES study is an ongoing prospective cohort study of older adults undergoing
elective major non-cardiac surgery. The study design and methods have been described
previously(12). Briefly, eligible participants were age 70 years and older, English speaking,
scheduled to undergo elective surgery at one of two Harvard-affiliated academic medical centers
and with an anticipated length of stay of at least three days. Eligible surgical procedures were:
total hip or knee replacement, lumbar, cervical, or sacral laminectomy, lower extremity arterial
bypass surgery, open abdominal aortic aneurysm repair, and colectomy. Exclusion criteria
included evidence of dementia, delirium, hospitalization within three months, terminal condition,
legal blindness, severe deafness, history of schizophrenia or psychosis, and history of alcohol
abuse. A total of 566 patients were enrolled between June 18, 2010 and August 8, 2013, and six
individuals with possible dementia were excluded after a detailed adjudication process described
previously(12), leaving 560 cohort participants. Written informed consent was obtained from all
participants according to procedures approved by the institutional review boards of Beth Israel
Deaconess Medical Center and Brigham and Women’s Hospital, the two study hospitals, and
Hebrew SeniorLife, the study coordinating center, all located in Boston, Massachusetts.
In this paper, we focused on 134 participants who developed postoperative delirium and
had cognitive data during follow up.
Assessment of pre-surgical factors
An initial home interview was conducted to gather detailed information on health and
functioning an average of two weeks prior to hospitalization for scheduled surgery. Basic
demographic, medical, and lifestyle information was obtained, and well-validated assessments of
cognitive, physical, and mental function were administered (see Supplement A for details). The
five components of the Fried frailty index (unintentional weight loss, exhaustion, low physical
activity, low grip strength, and slow timed walk) were assessed(13), and a blood sample was
collected from which apolipoprotein (APOE) 4 genotype and C-reactive protein (CRP) levels
were analyzed. A trained physician conducted medical record reviews after participants were
discharged from the hospital, which provided additional information on pre-surgical factors.
Assessment of delirium
Beginning with the first postoperative day, delirium symptoms were assessed daily
during hospitalization using brief cognitive tests(12, 14), the Delirium Symptom Interview(15),
and acute changes in mental status reported by family and nurses. Delirium diagnosis was based
on the Confusion Assessment Method (CAM) diagnostic algorithm(16), a widely used and well-
validated assessment tool with very high sensitivity, specificity, and inter-rater reliability(17,
18). Delirium symptoms were also obtained from medical records using a validated delirium
assessment(19, 20) with adjudication of cases by an expert delirium panel. For this study, a
combined approach based on either CAM or medical record assessment of delirium (and used in
prior studies) was utilized to identify incident delirium(20).
Assessment of cognitive function
Cognitive function was assessed at the home interview, and repeated at one, two, and six
months after hospital discharge, and at six-month intervals thereafter up to 36 months following
discharge. The neuropsychological battery evaluated cognitive domains putatively most affected
by delirium(12, 21) (see Supplement B for details). We combined all test scores into a weighted
composite summary measure, the General Cognitive Performance (GCP) score, using previously
published methods(22); this score was calibrated to a nationally representative sample of older
adults(23), where the mean for persons aged ≥70 years is expected to be 50, with a standard
deviation of 10(21). The GCP score is sensitive to change with minimal floor and ceiling
effects(21, 22), and has been applied in previous studies(3, 24-26). For longitudinal GCP values,
we applied a previously described method of correction to these scores to account for learning
effects over time(27-29).
As previously reported in this cohort, the pattern of GCP scores over time indicated
cognitive decline at postoperative month one, recovery of cognitive function above baseline at
month two, and gradual cognitive decline beginning at month two and dropping below baseline
over months twelve to 36; this pattern was more pronounced among participants who developed
postoperative delirium compared to those who did not(3). Loss to follow up was minimal due to
death (7%) and withdrawal from the study (5%), and non-differential with respect to delirium
status; therefore, 89% of eligible participants had complete data on the GCP score over time(3).
Statistical analysis
We divided pre-surgical factors into nine related groupings or domains: demographics
(age, sex, race, education, and living arrangement), lifestyle factors (smoking status, alcohol
intake, and socioeconomic status), cognitive function (baseline GCP score and IQCODE score),
physical function (ADL and IADL impairments), mental health/quality of life (GDS scale and
SF-12 composite and subscale scores), sensory function (hearing and vision impairment), frailty
(Fried frailty index components), medical factors (surgery type, CCI score, cardiovascular
disease, peripheral vascular disease, diabetes, and cerebrovascular disease), and biomarkers
(APOE 4 genotype and CRP level). Our outcome of interest was the rate of cognitive decline
over three years of follow up, which was estimated previously for each participant based on
mixed effects regression models with random effects for baseline and change over time; this
slope was estimated beginning at postoperative month two because, on average, participants
started a linear trajectory of gradual cognitive decline at that time(3).
We used simple linear regression to estimate mean differences in rates of cognitive
decline (and 95% confidence intervals [CIs]) for each unit increase in continuous predictors and
for each level of a categorical predictor compared to a chosen reference level. We divided mean
differences associated with continuous predictors by twice the standard deviation of the predictor
to make the scaling similar to that of binary predictors(30). Next, for each domain of pre-surgical
factors, we used an adjusted R2-based selection method to determine an order of variable
selection into successive linear regression models (with rate of cognitive decline as the outcome).
We selected variables into the model by maximizing the adjusted R2 value (i.e., total proportion
of variation explained in the outcome corrected for the number of variables in the model), and
we obtained total R2 values (i.e., total proportion of outcome variation explained by all variables
in the model) for each successive model as well. For each domain, we retained variables if they
increased the adjusted R2 value of the model, or if they entered the model first when no factors
met this threshold, and these variables were considered for our final model. Finally, we evaluated
all variables retained from domain-specific models (with age and sex forced into the model)
using the selection procedure described above and obtained adjusted and total R2 values. The
subset of variables that increased the adjusted R2 value of this model constituted our final model.
We evaluated the normality of studentized residuals in our final linear regression model using the
Shapiro-Wilk test)(31), and identified potential outliers based on graphical methods and the
absolute values of these residuals (threshold of two)(ref); we also detected influential
observations based on the Cook’s Distance (threshold of four divided by the square root of the
sample size)(ref). The entire selection process was repeated if outliers or influential points were
identified and these participants were excluded.
For each model, participants with complete information on contributing variables were
included; as previously reported, there is little missing data in this sample(32). All statistical
analyses were conducted in SAS version 9.3.
RESULTS
Of the 134 participants with postoperative delirium, we initially identified five
individuals who were potential outliers and three individuals with influential data in our final
model, and subsequently excluded these participants from further analyses. In Table 1, selected
pre-surgical characteristics are described among 552 participants in the overall SAGES cohort
and separately for 126 participants who developed postoperative delirium. Overall, the cohort
had an average age of 76.8 years at baseline; it was 60% female and 8% non-white. Participants
with postoperative delirium were slightly older, had lower GCP scores, and more often had
multiple comorbidities (as indicated by the Charlson comorbidity index score) compared to the
overall cohort. Other differences were relatively small comparing participants with delirium to
the whole cohort.
In univariate models, worse cognitive function prior to surgery (Domain 3) was
significantly associated with faster cognitive decline over follow up; specifically, participants
with lower GCP scores and higher IQCODE scores at baseline had greater slopes of cognitive
decline (mean differences: 0.47 points/year [95% CI: 0.24, 0.71] per half-standard deviation
higher GCP score at pre-operative assessment, and -0.34 points/year [95% CI: -0.61, -0.08] per
half-standard deviation higher IQCODE score) (Supplemental Table 1). Living alone (a
component of Domain 1) was related to significantly faster cognitive decline (mean difference: -
0.32 points/year, 95% CI: -0.59, -0.05), and other variables (i.e., any cognitive independent
activities of daily living [IADL], hearing impairment, vision impairment, weight loss, and
cerebrovascular disease) appeared to be related to faster cognitive decline, but these associations
did not reach statistical significance.
When we examined the domain-specific contribution of pre-surgical factors to rates of
cognitive decline (Supplemental Table 2), baseline cognitive performance (Domain 3) explained
the most variation in rates of cognitive decline: GCP scores accounted for 11.1% and IQCODE
scores contributed another 3.7%, and both variables improved the explanatory power of the
model based on increased adjusted R2 values upon entry of these variables to the model. Medical
factors (Domain 8) explained 7.8% of variation in cognitive decline, with the Charlson
comorbidity index score, diabetes, cerebrovascular disease, and cardiovascular disease
explaining 3.1%, 1.8%, 1.3%, and 0.9% of variation in cognitive decline, respectively; these
variables improved the model based on their adjusted R2 values. Demographic variables
(Domain 1) explained 5.8% of variation, with the majority of this variation explained by living
alone (4.4%); this variable was the only one to increase the adjusted R2 value of this domain-
specific model. Frailty variables (Domain 7) explained 4.5% of variation in cognitive decline,
with slow timed walk explaining 1.5% of variation and less exhaustion explaining 1.8%; both of
these variables improved the model based on their adjusted R2 values. Other domains contributed
less to explaining variation in the outcome, and only had one variable that improved the
explanatory power of the respective models.
In our final step, baseline GCP score was found to explain the most variation in rate of
cognitive decline (13.0%) when factors retained from each of the domain-specific models were
considered for inclusion (in addition to age and sex, which were forced into the model and
contributed 3.0% to explained variation) (Table 2). Living alone, less exhaustion, Charlson
comorbidity index score, IQCODE score, cerebrovascular disease, and any cognitive IADL
impairment contributed another 6.4%, 3.2%, 2.1%, 2.0%, 1.3%, and 1.0% to explaining variation
in the outcome, respectively. Beyond age and sex, these seven factors—GCP score, living alone,
exhaustion level, Charlson comorbidity index score, IQCODE score, cerebrovascular disease,
and cognitive IADL impairment—improved the amount of explained variation in the outcome
based on an increase in the adjusted R2 value with variable entry into the model. The total
amount of variation in rates of cognitive decline explained by these variables (i.e., total model R2
value) was 31.8%. The residuals from this final model did not violate the assumption of
normality for linear regression models (Shapiro-Wilk statistic, W=0.99, p=0.5).
DISCUSSION
We found that worse cognitive performance (GCP and IQCODE scores) and living alone
prior to surgery were significantly associated with long-term cognitive decline in older
participants with postoperative delirium in SAGES. Baseline GCP score contributed most
substantially to explained variation in rates of cognitive decline, and a total of seven factors—
GCP score, IQCODE score, cognitive IADL impairment, living alone, cerebrovascular disease,
Charlson comorbidity index, and exhaustion level—accounted for 32% of the variation in this
outcome. These results suggest that pre-surgical factors may have important influences on long-
term cognitive decline following postoperative delirium in older adults.
Our findings serve to confirm and extend prior work. Baseline cognitive function has
been previously demonstrated to be a strong risk factor for cognitive decline in older adults(11),
and was also shown to be the dominant predictor of cognitive decline over time in a small study
of community-dwelling older individuals (R2=37%)(33). This result is consistent with our
finding that baseline GCP score is the main factor predicting long-term cognitive decline among
older individuals with postoperative delirium, and additional baseline cognitive measures (i.e.,
impaired IQCODE score and cognitive IADL impairment) contribute to prediction as well. In
addition, previous work in SAGES found that lower GCP score at baseline was linearly
associated with greater risk of delirium (relative risk=2.0 for each half standard deviation
decrease in GCP score)(34), and furthermore delirium was associated with steeper rates of
cognitive decline over the three-year follow up(3). The present study provides additional insight
by suggesting that lower baseline GCP scores predict greater rates of long-term cognitive decline
among those who develop postoperative delirium, in a graded fashion that holds across the full
range of baseline GCP scores in this sample.
Prior epidemiologic studies have also demonstrated that cerebrovascular disease(35, 36)
and living alone(37, 38) are important risk factors for cognitive decline in older individuals, and
we identified these variables as significant predictors of cognitive decline in our sample of older
participants with delirium. Cerebrovascular disease has been recognized as increasing the risk of
delirium as well(1), and brain injury from both types of events might cause worse deterioration
in cognitive function over time. In contrast, living alone may result in less physical, social, and
cognitive stimulation at home prior to surgery, leading to reduced cognitive reserve and greater
vulnerability to decline following postoperative delirium.
Other predictors that were identified in our analyses included the Charlson comorbidity
index and exhaustion, although these variables appeared to be associated with cognitive decline
in a counterintuitive direction (i.e., multiple comorbidities and more exhaustion were associated
with less decline) in our sample of participants with delirium. These results are likely due to
inherent limitations of our multivariable modeling approach in disentangling interrelated chronic
disease factors when entered into our models simultaneously. Although this approach can
generally identify true predictors, it can incorporate extraneous predictors into a final model(39);
therefore, our findings should be interpreted with caution and need replication in future studies.
Without replication, our individual predictors cannot be considered suitable for clinical
applications. Clearly, additional studies are needed to evaluate pre-surgical factors that
contribute to long-term cognitive decline following postoperative delirium, as well as the
potential interplay of perioperative and postoperative factors in the prediction of this outcome.
In recent studies, common neuropathologic factors associated with Alzheimer’s disease,
cerebrovascular disease, and Lewy-body disease predicted 41% of variation in rates of cognitive
decline among older adults(40), and postmortem factors (e.g., indicators of neuronal density and
neural tissue integrity) explained additional variation in this outcome(41, 42). In our study, the
total percentage of explained variation was 32% based on a variety of clinical characteristics, but
similar neuropathologic factors could potentially account for remaining variation in cognitive
decline. More studies are needed to explore the combination of clinical and neuropathologic
factors that explain this variation.
Major strengths of this study include: rigorous data collection, standardized delirium
assessments, careful characterization of baseline cognition, repeated neuropsychological
assessments, relatively long follow up, and careful optimization of the GCP score for analyses of
cognitive decline. We also had a wide range of data available to explore potential risk factors at
baseline of this study. However, our study has several limitations that should be considered.
First, we have evaluated a subset of 126 participants who developed postoperative delirium in
the SAGES cohort, and this modest sample size limits the power of our analyses. We may have
missed important associations of interest, and the certainty of our estimates related to observed
associations and model building is decreased; low power also increases the risk of identifying
false positive results, which may have occurred in this study(43). Hence, these results will need
to be replicated in future, larger studies. Second, we cannot rule out the possibility that some
participants had preclinical dementia at baseline, despite our extensive efforts to exclude
individuals with dementia from this cohort. For example, if some individuals had mild cognitive
impairment at baseline, we may have overestimated the association between lower GCP score
and faster cognitive decline in our sample; however, this is less likely to be driving the observed
association because we found the association held across the full range of baseline cognitive
scores—even among those with the highest scores. Finally, our sample included participants who
were aged ≥70 years, highly educated, and mostly white race, and therefore these results may be
limited in their generalizability to younger or more diverse samples.
In summary, we found pre-surgical factors that were associated with, and contributed to
explained variation in, long-term cognitive decline among older participants who experienced
postoperative delirium. Baseline cognitive function contributed most substantially to explaining
variation in the rate of cognitive decline, and a set of seven identified factors explained over one-
quarter of the variation in the outcome. Further research should evaluate the relative contribution
of pre- and post-surgical factors to long-term cognitive decline following delirium, as well as the
extent to which these factors predict such cognitive decline in older adults with and without
postoperative delirium.
FUNDING
This work was supported by the National Institute on Aging (P01AG031720 and
K07AG041835 to S.K.I.; R01AG044518 to S.K.I./ R.N.J.; and R01AG030618, K24AG035075,
and R01AG051658 to E.R.M.). S.K.I. holds the Milton and Shirley F. Levy Family Chair.
REFERENCES
1. Inouye SK, Westendorp RG, Saczynski JS. Delirium in elderly people. Lancet.
2014;383:911-922.
2. Saczynski JS, Marcantonio ER, Quach L, et al. Cognitive trajectories after postoperative
delirium. The New England journal of medicine. 2012;367:30-39.
3. Inouye SK, Marcantonio ER, Kosar CM, et al. The short-term and long-term relationship
between delirium and cognitive trajectory in older surgical patients. Alzheimer's & dementia :
the journal of the Alzheimer's Association. 2016;12:766-775.
4. Ahmed S, Leurent B, Sampson EL. Risk factors for incident delirium among older people
in acute hospital medical units: a systematic review and meta-analysis. Age and ageing.
2014;43:326-333.
5. Inouye SK, Viscoli CM, Horwitz RI, Hurst LD, Tinetti ME. A predictive model for
delirium in hospitalized elderly medical patients based on admission characteristics. Annals of
internal medicine. 1993;119:474-481.
6. Inouye SK, Zhang Y, Jones RN, Kiely DK, Yang F, Marcantonio ER. Risk factors for
delirium at discharge: development and validation of a predictive model. Archives of internal
medicine. 2007;167:1406-1413.
7. Marcantonio ER, Goldman L, Mangione CM, et al. A clinical prediction rule for delirium
after elective noncardiac surgery. Jama. 1994;271:134-139.
8. Rudolph JL, Jones RN, Levkoff SE, et al. Derivation and validation of a preoperative
prediction rule for delirium after cardiac surgery. Circulation. 2009;119:229-236.
9. Inouye SK, Bogardus ST, Jr., Charpentier PA, et al. A multicomponent intervention to
prevent delirium in hospitalized older patients. The New England journal of medicine.
1999;340:669-676.
10. Marcantonio ER, Flacker JM, Wright RJ, Resnick NM. Reducing delirium after hip
fracture: a randomized trial. Journal of the American Geriatrics Society. 2001;49:516-522.
11. Plassman BL, Williams JW, Jr., Burke JR, Holsinger T, Benjamin S. Systematic review:
factors associated with risk for and possible prevention of cognitive decline in later life. Annals
of internal medicine. 2010;153:182-193.
12. Schmitt EM, Marcantonio ER, Alsop DC, et al. Novel risk markers and long-term
outcomes of delirium: the successful aging after elective surgery (SAGES) study design and
methods. Journal of the American Medical Directors Association. 2012;13:818 e811-810.
13. Fried LP, Tangen CM, Walston J, et al. Frailty in older adults: evidence for a phenotype.
The journals of gerontology Series A, Biological sciences and medical sciences. 2001;56:M146-
156.
14. Simon SE, Bergmann MA, Jones RN, Murphy KM, Orav EJ, Marcantonio ER.
Reliability of a structured assessment for nonclinicians to detect delirium among new admissions
to postacute care. Journal of the American Medical Directors Association. 2006;7:412-415.
15. Albert MS, Levkoff SE, Reilly C, et al. The delirium symptom interview: an interview
for the detection of delirium symptoms in hospitalized patients. Journal of geriatric psychiatry
and neurology. 1992;5:14-21.
16. Inouye SK, van Dyck CH, Alessi CA, Balkin S, Siegal AP, Horwitz RI. Clarifying
confusion: the confusion assessment method. A new method for detection of delirium. Annals of
internal medicine. 1990;113:941-948.
17. Wei LA, Fearing MA, Sternberg EJ, Inouye SK. The Confusion Assessment Method: a
systematic review of current usage. Journal of the American Geriatrics Society. 2008;56:823-
830.
18. Wong CL, Holroyd-Leduc J, Simel DL, Straus SE. Does this patient have delirium?:
value of bedside instruments. Jama. 2010;304:779-786.
19. Inouye SK, Leo-Summers L, Zhang Y, Bogardus ST, Jr., Leslie DL, Agostini JV. A
chart-based method for identification of delirium: validation compared with interviewer ratings
using the confusion assessment method. Journal of the American Geriatrics Society.
2005;53:312-318.
20. Saczynski JS, Kosar CM, Xu G, et al. A tale of two methods: chart and interview
methods for identifying delirium. Journal of the American Geriatrics Society. 2014;62:518-524.
21. Gross AL, Jones RN, Fong TG, Tommet D, Inouye SK. Calibration and validation of an
innovative approach for estimating general cognitive performance. Neuroepidemiology.
2014;42:144-153.
22. Jones RN, Rudolph JL, Inouye SK, et al. Development of a unidimensional composite
measure of neuropsychological functioning in older cardiac surgery patients with good
measurement precision. Journal of clinical and experimental neuropsychology. 2010;32:1041-
1049.
23. Langa KM, Plassman BL, Wallace RB, et al. The Aging, Demographics, and Memory
Study: study design and methods. Neuroepidemiology. 2005;25:181-191.
24. Saczynski JS, Inouye SK, Kosar CM, et al. Cognitive and brain reserve and the risk of
postoperative delirium in older patients: analysis of data from a prospective observational study.
The lancet Psychiatry. 2014;1:437-443.
25. Cavallari M, Hshieh TT, Guttmann CR, et al. Brain atrophy and white-matter
hyperintensities are not significantly associated with incidence and severity of postoperative
delirium in older persons without dementia. Neurobiology of aging. 2015;36:2122-2129.
26. Gross AL, Sherva R, Mukherjee S, et al. Calibrating longitudinal cognition in
Alzheimer's disease across diverse test batteries and datasets. Neuroepidemiology. 2014;43:194-
205.
27. Lewis M, Maruff P, Silbert B. Statistical and conceptual issues in defining post-operative
cognitive dysfunction. Neuroscience and biobehavioral reviews. 2004;28:433-440.
28. Evered L, Scott DA, Silbert B, Maruff P. Postoperative cognitive dysfunction is
independent of type of surgery and anesthetic. Anesthesia and analgesia. 2011;112:1179-1185.
29. Soinne L, Helenius J, Tikkala I, et al. The effect of severe carotid occlusive disease and
its surgical treatment on cognitive functions of the brain. Brain and cognition. 2009;69:353-359.
30. Gelman A. Scaling regression inputs by dividing by two standard deviations. Statistics in
medicine. 2008;27:2865-2873.
31. Belle v. Statistical Rules of Thumb. 2nd ed. New York: Wiley-Interscience; 2008.
32. Schmitt EM, Saczynski JS, Kosar CM, et al. The Successful Aging After Elective
Surgery Study: Cohort Description and Data Quality Procedures. Journal of the American
Geriatrics Society. 2015;63:2463-2471.
33. Bolandzadeh N, Kording K, Salowitz N, et al. Predicting cognitive function from clinical
measures of physical function and health status in older adults. PLoS One. 2015;10:e0119075.
34. Jones RN, Marcantonio ER, Saczynski JS, et al. Preoperative Cognitive Performance
Dominates Risk for Delirium Among Older Adults. Journal of geriatric psychiatry and
neurology. 2016.
35. Dik MG, Deeg DJ, Bouter LM, Corder EH, Kok A, Jonker C. Stroke and apolipoprotein
E epsilon4 are independent risk factors for cognitive decline: A population-based study. Stroke.
2000;31:2431-2436.
36. Viswanathan A, Macklin EA, Betensky R, Hyman B, Smith EE, Blacker D. The
Influence of Vascular Risk Factors and Stroke on Cognition in Late Life: Analysis of the NACC
Cohort. Alzheimer Dis Assoc Disord. 2015;29:287-293.
37. Josefsson M, de Luna X, Pudas S, Nilsson LG, Nyberg L. Genetic and lifestyle predictors
of 15-year longitudinal change in episodic memory. Journal of the American Geriatrics Society.
2012;60:2308-2312.
38. van Gelder BM, Tijhuis M, Kalmijn S, Giampaoli S, Nissinen A, Kromhout D. Marital
status and living situation during a 5-year period are associated with a subsequent 10-year
cognitive decline in older men: the FINE Study. The journals of gerontology Series B,
Psychological sciences and social sciences. 2006;61:P213-219.
39. Olejnik S, Keselman H. Using Wherry's Adjusted R2 and Mallow's Cp for Model
Selection From All Possible Regressions. The Journal of Experimental Education. 2000;68:365-
380.
40. Boyle PA, Wilson RS, Yu L, et al. Much of late life cognitive decline is not due to
common neurodegenerative pathologies. Annals of neurology. 2013;74:478-489.
41. Dawe RJ, Yu L, Leurgans SE, et al. Postmortem MRI: a novel window into the
neurobiology of late life cognitive decline. Neurobiology of aging. 2016;45:169-177.
42. Wilson RS, Nag S, Boyle PA, et al. Neural reserve, neuronal density in the locus
ceruleus, and cognitive decline. Neurology. 2013;80:1202-1208.

43. Christley RM. Power and error: increased risk of false positive results in underpowered
studies. The Open Epidemiology Journal. 2010;3:16-19.
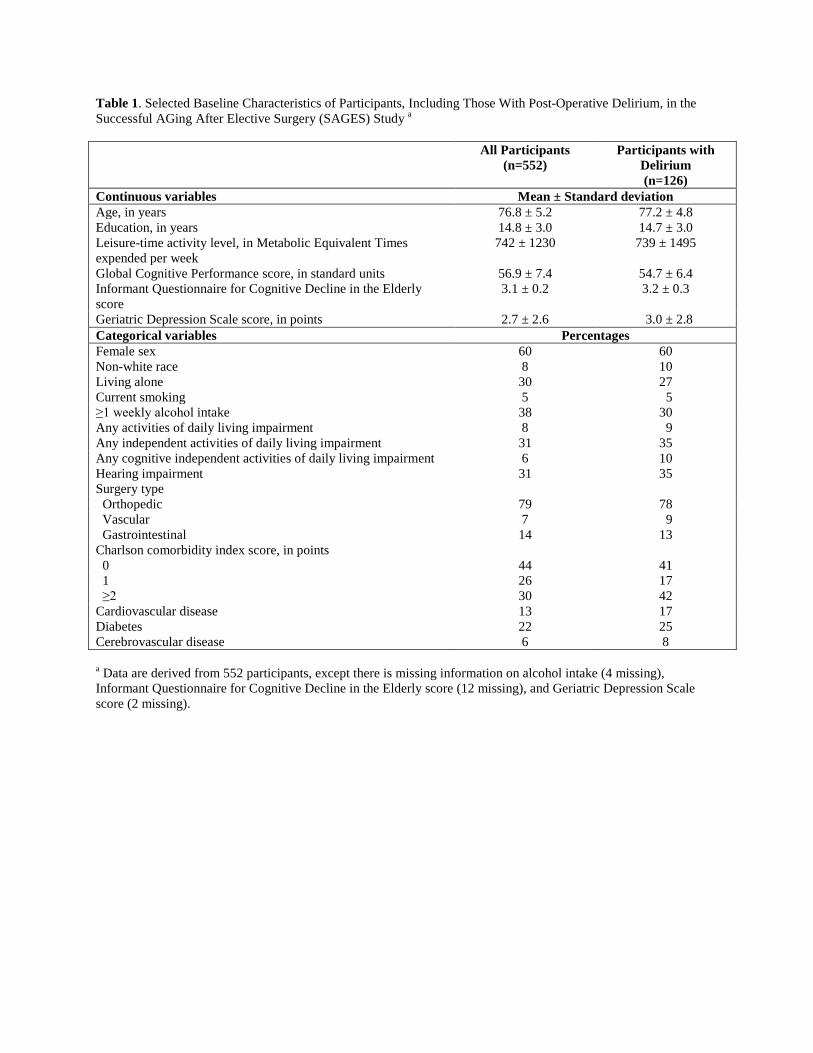
Table 1. Selected Baseline Characteristics of Participants, Including Those With Post-Operative Delirium, in the Successful AGing After Elective Surgery (SAGES) Study a
All Participants
(n=552) Participants with
Delirium (n=126)
Continuous variables Mean ± Standard deviation Age, in years 76.8 ± 5.2 77.2 ± 4.8 Education, in years 14.8 ± 3.0 14.7 ± 3.0 Leisure-time activity level, in Metabolic Equivalent Times expended per week
742 ± 1230 739 ± 1495
Global Cognitive Performance score, in standard units 56.9 ± 7.4 54.7 ± 6.4 Informant Questionnaire for Cognitive Decline in the Elderly score
3.1 ± 0.2 3.2 ± 0.3
Geriatric Depression Scale score, in points 2.7 ± 2.6 3.0 ± 2.8 Categorical variables Percentages Female sex 60 60 Non-white race 8 10 Living alone 30 27 Current smoking 5 5 ≥1 weekly alcohol intake 38 30 Any activities of daily living impairment 8 9 Any independent activities of daily living impairment 31 35 Any cognitive independent activities of daily living impairment 6 10 Hearing impairment 31 35 Surgery type Orthopedic 79 78 Vascular 7 9 Gastrointestinal 14 13 Charlson comorbidity index score, in points 0 44 41 1 26 17 ≥2 30 42 Cardiovascular disease 13 17 Diabetes 22 25 Cerebrovascular disease 6 8 a Data are derived from 552 participants, except there is missing information on alcohol intake (4 missing), Informant Questionnaire for Cognitive Decline in the Elderly score (12 missing), and Geriatric Depression Scale score (2 missing).
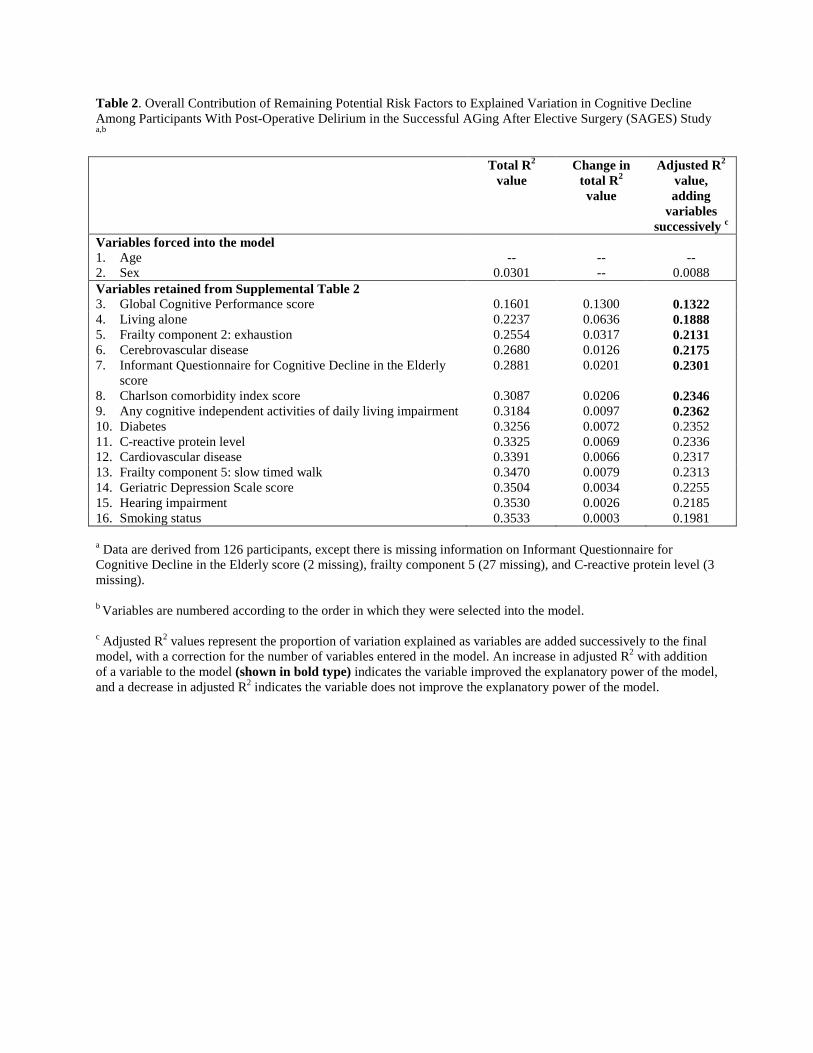
Table 2. Overall Contribution of Remaining Potential Risk Factors to Explained Variation in Cognitive Decline Among Participants With Post-Operative Delirium in the Successful AGing After Elective Surgery (SAGES) Study a,b
Total R2
value
Change in total R2 value
Adjusted R2 value, adding
variables successively c
Variables forced into the model 1. Age -- -- -- 2. Sex 0.0301 -- 0.0088 Variables retained from Supplemental Table 2 3. Global Cognitive Performance score 0.1601 0.1300 0.1322 4. Living alone 0.2237 0.0636 0.1888 5. Frailty component 2: exhaustion 0.2554 0.0317 0.2131 6. Cerebrovascular disease 0.2680 0.0126 0.2175 7. Informant Questionnaire for Cognitive Decline in the Elderly
score 0.2881 0.0201 0.2301
8. Charlson comorbidity index score 0.3087 0.0206 0.2346 9. Any cognitive independent activities of daily living impairment 0.3184 0.0097 0.2362 10. Diabetes 0.3256 0.0072 0.2352 11. C-reactive protein level 0.3325 0.0069 0.2336 12. Cardiovascular disease 0.3391 0.0066 0.2317 13. Frailty component 5: slow timed walk 0.3470 0.0079 0.2313 14. Geriatric Depression Scale score 0.3504 0.0034 0.2255 15. Hearing impairment 0.3530 0.0026 0.2185 16. Smoking status 0.3533 0.0003 0.1981 a Data are derived from 126 participants, except there is missing information on Informant Questionnaire for Cognitive Decline in the Elderly score (2 missing), frailty component 5 (27 missing), and C-reactive protein level (3 missing). b Variables are numbered according to the order in which they were selected into the model. c Adjusted R2 values represent the proportion of variation explained as variables are added successively to the final model, with a correction for the number of variables entered in the model. An increase in adjusted R2 with addition of a variable to the model (shown in bold type) indicates the variable improved the explanatory power of the model, and a decrease in adjusted R2 indicates the variable does not improve the explanatory power of the model.