Embed Size (px)
Citation preview
Research Article
Prediction of colorectal cancer diagnosis basedon circulating plasma proteinsSilvia Surinova1,†, Meena Choi2, Sha Tao3,‡, Peter J Schüffler4, Ching-Yun Chang2, Timothy Clough2,
Kamil Vyslou�zil5, Marta Khoylou6, Josef Srovnal6, Yansheng Liu1, Mariette Matondo1,
Ruth Hüttenhain1, Hendrik Weisser1, Joachim M Buhmann4, Marián Hajdúch6, Hermann Brenner3,7,
Olga Vitek2,8,9,* & Ruedi Aebersold1,10,**
Abstract
Non-invasive detection of colorectal cancer with blood-basedmarkers is a critical clinical need. Here we describe a phased massspectrometry-based approach for the discovery, screening, andvalidation of circulating protein biomarkers with diagnostic value.Initially, we profiled human primary tumor tissue epithelia andcharacterized about 300 secreted and cell surface candidate glyco-proteins. These candidates were then screened in patient systemiccirculation to identify detectable candidates in blood plasma. An88-plex targeting method was established to systematically moni-tor these proteins in two large and independent cohorts of plasmasamples, which generated quantitative clinical datasets at anunprecedented scale. The data were deployed to develop and eval-uate a five-protein biomarker signature for colorectal cancerdetection.
Keywords colorectal cancer; diagnostic protein biomarker; discovery-driven
and targeted proteomics
Subject Categories Biomarkers & Diagnostic Imaging; Cancer; Systems
Medicine
DOI 10.15252/emmm.201404873 | Received 18 November 2014 | Revised 1 July
2015 | Accepted 7 July 2015 | Published online 7 August 2015
EMBO Mol Med (2015) 7: 1166–1178
See also: S Surinova et al (September 2015)
Introduction
Sporadic colorectal cancer (CRC) can be effectively cured by surgical
resection if detected at localized disease stages (Booth, 2007). The
current CRC detection procedure typically employs the fecal occult
blood test (FOBT) as a pre-selection test for further colonoscopic
evaluation. FOBT, however, presents a limited accuracy for tumor
detection because it is a nonspecific test for gastrointestinal bleed-
ing. As a result, FOBT does not adequately detect subjects with CRC
and suffers from a limited sensitivity (Bretthauer, 2011). It is desir-
able to develop novel diagnostic tests that can replace or comple-
ment FOBT and lead to more accurate disease detection rates.
Preferably, diagnostic tests should be non-invasive, measurable
in commonly sampled clinical specimens such as blood plasma, and
better separate true from false CRC instances than the FOBT.
Blood plasma and the proteins it contains are an ideal source of
biomarkers, since it represents the snapshot of a subject’s patho-
physiological state at a given time (Anderson & Anderson, 2002).
We hypothesize that the pathological processes of CRC lead to
characteristic changes in the proteins released from the tumor into
the bloodstream, representing a CRC-derived molecular signature
in plasma (see also Surinova et al, 2015).
We have set off to characterize proteins associated with CRC that
are detectable in patient’s systemic circulation and to develop a
protein biomarker signature able to classify CRC and control cases
at risk. We employed a phased mass spectrometry-based approach
for the discovery, screening, and validation of circulating protein
biomarkers with diagnostic value. Initially, we profiled human
1 Department of Biology, Institute of Molecular Systems Biology, ETH Zurich, Zurich, Switzerland2 Department of Statistics, Purdue University, West Lafayette, IN, USA3 Division of Clinical Epidemiology and Aging Research, German Cancer Research Center (DKFZ), Heidelberg, Germany4 Department of Computer Science, Institute for Machine Learning, ETH Zurich, Zurich, Switzerland5 Department of Surgery, University Hospital in Olomouc, Olomouc, Czech Republic6 Institute of Molecular and Translational Medicine, Faculty of Medicine and Dentistry, Palacký University, Olomouc, Czech Republic7 German Cancer Consortium (DKTK), German Cancer Research Center (DKFZ), Heidelberg, Germany8 Department of Computer Science, Purdue University, West Lafayette, IN, USA9 College of Science and College of Computer and Information Science, Northeastern University, Boston, MA, USA10 Faculty of Science, University of Zurich, Zurich, Switzerland
*Corresponding author. Tel: +1 617 373 21 94; E-mail: [email protected]**Corresponding author. Tel: +41 44 633 31 70; E-mail: [email protected]†Current address: UCL Cancer Institute, University College London, London, UK‡Current address: Department of Preventive Medicine, Center for Genomic Translational Medicine and Prevention, School of Public Health, Fudan University, Shanghai,China
EMBO Molecular Medicine Vol 7 | No 9 | 2015 ª 2015 The Authors. Published under the terms of the CC BY 4.0 license1166
Published online: August 7, 2015
primary tumor tissues and characterized about 300 secreted and cell
surface candidate glycoproteins. These candidates were then
screened in patient’s systemic circulation to identify a refined set of
candidates detectable in blood plasma. An 88-plex targeting method
was established to systematically monitor these proteins in two
large and independent cohorts of plasma samples, which generated
quantitative clinical datasets at an unprecedented scale. The data
were used to develop and evaluate a five-protein biomarker signa-
ture that predicted colorectal cancer with high accuracy.
Results
Phase 1: biomarker candidate discovery in tumor epithelia
To maximize likelihood of identifying colorectal cancer (CRC)
biomarkers in the circulation, a phased biomarker development
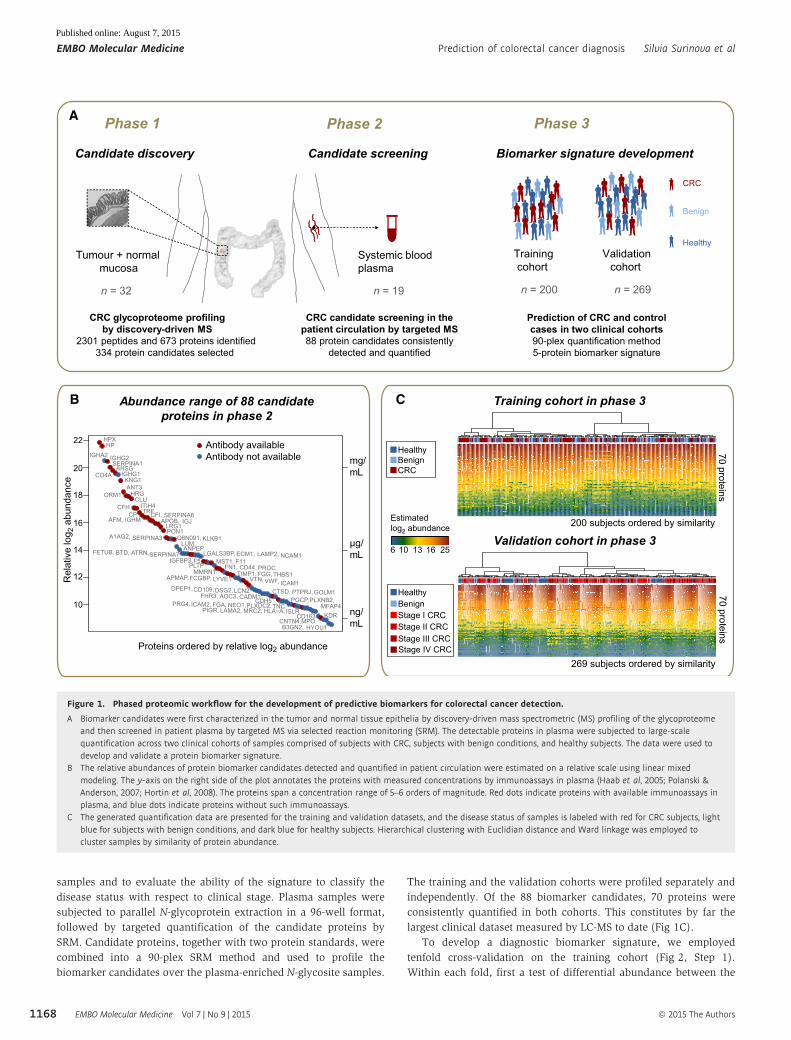
pipeline was established (Fig 1A). Human primary tumors together
with adjacent normal mucosa were sampled from 16 subjects with
CRC (Appendix Table S1) as the best suitable source of biomarkers.
Tissue epithelia were manually dissected to enrich for cells of cancer
origin and to obtain samples with maximally homogenous protein
composition (Appendix Fig S1). To further enhance the capture of
circulating proteins and to gain access to the lower abundant frac-
tion of the plasma proteome, we selectively focused on glycopro-
teins which are typically cell surface and extracellular proteins
prone to secretion or shedding and are representative of the vast
majority of currently approved biomarkers (Zhang et al, 2007;
Schiess et al, 2009).
Epithelial lysates derived from 32 paired tumor and normal
samples were therefore subjected to proteolysis, followed by solid-
phase extraction of N-linked glycopeptides (Zhang et al, 2003). Puri-
fied N-glycosite peptides (de-glycosylated forms of peptides that are
glycosylated in the native protein) were analyzed as duplicates or
triplicates (as described in Materials and Methods) by high-resolu-
tion liquid chromatography tandem mass spectrometry (LC-MS/
MS). In total, 74 LC-MS runs were acquired and led to the identifica-
tion of 2,301 glycopeptides and 673 inferred glycoproteins (https://
db.systemsbiology.net/sbeams/cgi/PeptideAtlas/buildDetails?atlas_
build_id=374, or Table EV1). Prediction analysis of secondary
protein structures annotated 73% of these proteins as prone to
secretion, and 53% as containing at least one transmembrane
domain. This is indicative of a strong enrichment for proteins of the
circulatory system (Roth, 2002).
Peptide MS1-level features were quantified across all LC-MS runs
to characterize proteins that were consistently changing in their
abundance between tumor samples and their paired normal coun-
terparts and to assess differential protein abundance across cancer
progression. In total, 303 differentially abundant glycoproteins
(adjusted P < 0.05, log2 FC cutoff � 1.5) showed robust protein
changes in CRC, irrespective of the individual clinical stages,
distinct changes across disease progression, or specific differences
between localized and metastatic CRC (Table EV2).
Phase 2: screening of biomarker candidates in patient plasma
The hypothesis that secreted and cell surface glycoprotein candi-
dates of CRC are destined to reach the circulation was tested in
the screening phase (Fig 1A) of the study. In this phase, the 303
glycoproteins identified as differentially abundant in CRC tissue
were supplemented with 23 additional proteins identified in the
tumor glycoproteome and being associated with cancer in the litera-
ture, as well as five biomarker candidates identified in other ongo-
ing cancer biomarker studies (Table EV2) to test their detection in
plasma.
Targeted mass spectrometry based on selected reaction monitoring
(SRM) was employed to screen for tissue-derived candidates in
N-glycosite samples enriched from plasma from 19 subjects with
CRC. Subjects used in the screening phase partially overlapped with
subjects employed in the discovery phase (Phase 1), as described in
Appendix Table S1. Using the targeted approach, we detected 88
candidate proteins consistently in all plasma samples (Table EV3).
While the dynamic range of the plasma proteome spreads over more
than 10 orders of magnitude and poses major challenges to its
comprehensive analysis (Anderson & Anderson, 2002), this study
succeeded in detecting and quantifying candidate proteins covering 6
orders of magnitude in dynamic range. To our knowledge, this
is currently the largest abundance range quantifiable in a single
LC-MS analysis of plasma (Fig 1B). When relating protein concentra-
tions measured by immunoassays in plasma (Haab et al, 2005;
Polanski & Anderson, 2007; Hortin et al, 2008) to plasma protein
abundances determined in this study, it can be seen that the
quantifications based on the two technologies are in a reasonable
agreement. This is supported by the observation that the protein
order sorted by immunoassay concentrations or mass spectrometry
relative abundances was rather constant (Fig 1B). Next, we exam-
ined the coverage of our biomarker candidates by immunoassays in
plasma. From the literature, we know that immunoassays are only
available for a very small portion of the proteome and this is also the
case for the cell surface proteome (Bock et al, 2012). In our study, as
many as half of the protein candidates were previously assayed by
antibody-based technologies in plasma (red dots, Fig 1B). Interest-
ingly, it can be noted that, especially for the lower protein abundance
range, immunoassays are nearly completely absent, and therefore,
targeted mass spectrometry provides the means to quantify those
candidates that could not be previously measured.
Phase 3: development of a diagnostic biomarker signature
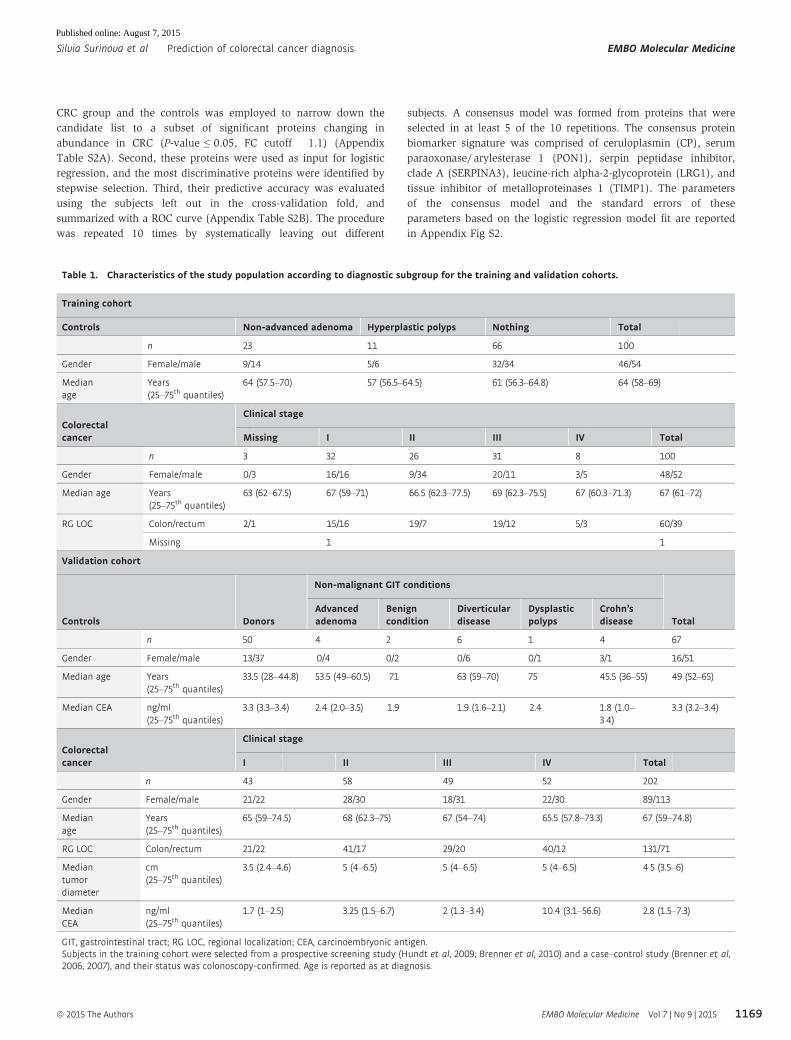
The biomarker candidates detected in plasma were then subjected
to clinical evaluation in two independent cohorts of samples
(n = 469) to ascertain biomarker candidates with diagnostic value
(Table 1). In both cohorts, the disease group was comprised of
subjects with CRC and the control group included both subjects with
benign lesions and healthy subjects. The first cohort—the training
cohort—was designed to reflect an underlying population with CRC
or at risk for CRC and was used for the discovery of a biomarker
signature with diagnostic potential. It included healthy subjects
(n = 66) and subjects with benign lesions (n = 34), and subjects
with CRC (n = 100). The disease status of all subjects was
confirmed by colonoscopy. The second cohort—the validation
cohort—was comprised of healthy subjects (n = 50) and subjects
with benign lesions (n = 17), and subjects with CRC (n = 202) at
distinct clinical stages (stage I: n = 43, stage II: n = 58, stage III:
n = 49, stage IV: n = 52). The validation cohort was conceived to
test the discovered protein biomarker signature on independent
ª 2015 The Authors EMBO Molecular Medicine Vol 7 | No 9 | 2015
Silvia Surinova et al Prediction of colorectal cancer diagnosis EMBO Molecular Medicine
1167
Published online: August 7, 2015
samples and to evaluate the ability of the signature to classify the
disease status with respect to clinical stage. Plasma samples were
subjected to parallel N-glycoprotein extraction in a 96-well format,
followed by targeted quantification of the candidate proteins by
SRM. Candidate proteins, together with two protein standards, were
combined into a 90-plex SRM method and used to profile the
biomarker candidates over the plasma-enriched N-glycosite samples.
The training and the validation cohorts were profiled separately and
independently. Of the 88 biomarker candidates, 70 proteins were
consistently quantified in both cohorts. This constitutes by far the
largest clinical dataset measured by LC-MS to date (Fig 1C).
To develop a diagnostic biomarker signature, we employed
tenfold cross-validation on the training cohort (Fig 2, Step 1).
Within each fold, first a test of differential abundance between the
Phase 1 Phase 3Phase 2 A
profiling -
n = 32 n = 19
Tumour + normal mucosa
Systemic blood plasma
CRC glycoproteomeby discovery driven MS
2301 peptides and 673 proteins identified334 protein candidates selected
CRC candidate screening in thepatient circulation by targeted MS88 protein candidates consistently
detected and quantified
Benign
CRC
HealthyTraining cohort
Validation cohort
n = 200 n = 269
Prediction of CRC and control cases in two clinical cohorts90-plex quantification method5-protein biomarker signature
B C Training cohort in phase 3Abundance range of 88 candidateproteins in phase 2
Validation cohort in phase 3
70 proteins
200 subjects ordered by similarity
Rel
ativ
e lo
g 2 a
bund
ance
Proteins ordered by relative log2 abundance
µg/mL
Estimated log2 abundance
6 10 13 16 25
70 proteins
269 subjects ordered by similarity
HealthyBenignStage I CRCStage II CRCStage III CRCStage IV CRC
HealthyBenignCRC
Candidate discovery Candidate screening Biomarker signature development
ng/mL
mg/mL
HPXHP
IGHA2 IGHG2SERPINA1
AHSGCO4A IGHG1
KNG1ANT3
ORM1 HRGCLU
CFH ITIH4TRFCP CFI, SERPINA6
AFM, IGHM APOB, IGJLRG1PON1
A1AG2, SERPINA3 Q6N091, KLKB1LUMANPEPFETUB, BTD, ATRN,SERPINA7 LGALS3BP, ECM1, LAMP2, NCAM1
IGFBP3,F5 MST1, F11PLTP FN1, CD44, PROCMMRN1 TIMP1,FGG, THBS1APMAP,FCGBP, LYVE1 VTN, VWF, ICAM1
DPEP1,CD109,DSG2,LCN2 CTSD, PTPRJ, GOLM1FHR3, AOC3, CADM1CDH5 PGCP,PLXNB2,
MFAP4PRG4,ICAM2, FGA, NEO1,PLXDC2,TNCPIGR, LAMA2, MRC2, HLA−A, ISLRCD163 KDR
CNTN4,MPOB3GN2, HYOU1
10
12
14
16
18
20
22 Antibody availableAntibody not available
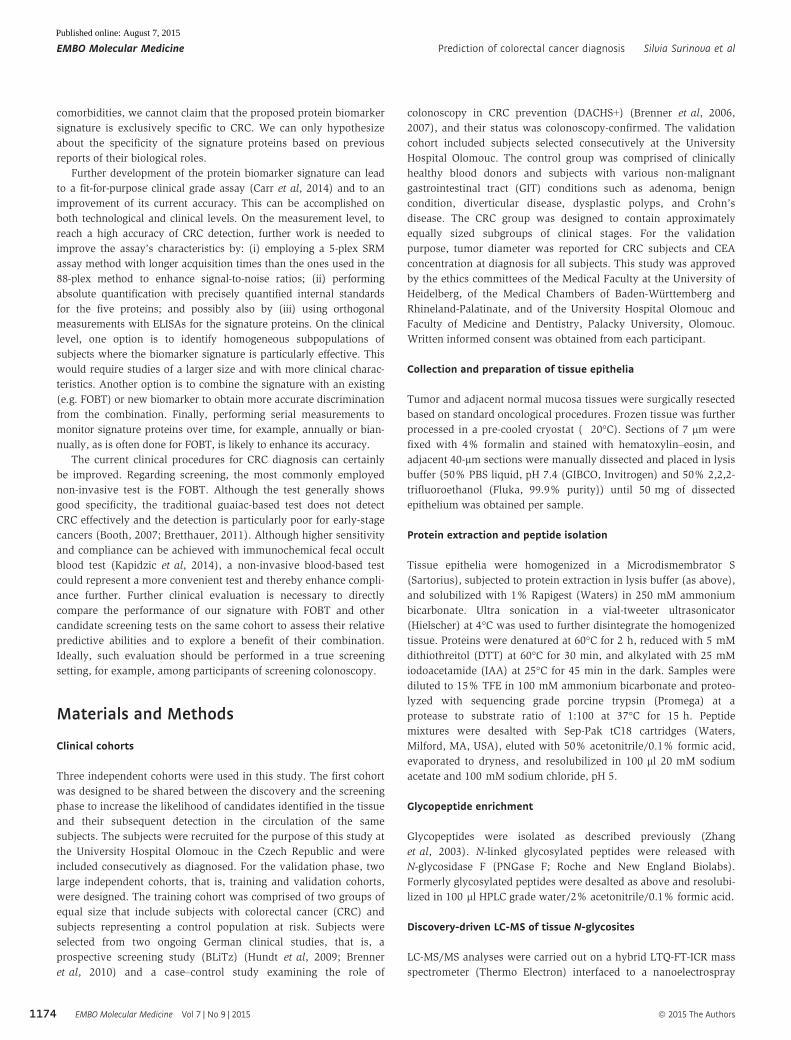
Figure 1. Phased proteomic workflow for the development of predictive biomarkers for colorectal cancer detection.
A Biomarker candidates were first characterized in the tumor and normal tissue epithelia by discovery-driven mass spectrometric (MS) profiling of the glycoproteomeand then screened in patient plasma by targeted MS via selected reaction monitoring (SRM). The detectable proteins in plasma were subjected to large-scalequantification across two clinical cohorts of samples comprised of subjects with CRC, subjects with benign conditions, and healthy subjects. The data were used todevelop and validate a protein biomarker signature.
B The relative abundances of protein biomarker candidates detected and quantified in patient circulation were estimated on a relative scale using linear mixedmodeling. The y-axis on the right side of the plot annotates the proteins with measured concentrations by immunoassays in plasma (Haab et al, 2005; Polanski &Anderson, 2007; Hortin et al, 2008). The proteins span a concentration range of 5–6 orders of magnitude. Red dots indicate proteins with available immunoassays inplasma, and blue dots indicate proteins without such immunoassays.
C The generated quantification data are presented for the training and validation datasets, and the disease status of samples is labeled with red for CRC subjects, lightblue for subjects with benign conditions, and dark blue for healthy subjects. Hierarchical clustering with Euclidian distance and Ward linkage was employed tocluster samples by similarity of protein abundance.
EMBO Molecular Medicine Vol 7 | No 9 | 2015 ª 2015 The Authors
EMBO Molecular Medicine Prediction of colorectal cancer diagnosis Silvia Surinova et al
1168
Published online: August 7, 2015
CRC group and the controls was employed to narrow down the
candidate list to a subset of significant proteins changing in
abundance in CRC (P-value ≤ 0.05, FC cutoff � 1.1) (Appendix
Table S2A). Second, these proteins were used as input for logistic
regression, and the most discriminative proteins were identified by
stepwise selection. Third, their predictive accuracy was evaluated
using the subjects left out in the cross-validation fold, and
summarized with a ROC curve (Appendix Table S2B). The procedure
was repeated 10 times by systematically leaving out different
subjects. A consensus model was formed from proteins that were
selected in at least 5 of the 10 repetitions. The consensus protein
biomarker signature was comprised of ceruloplasmin (CP), serum
paraoxonase/ arylesterase 1 (PON1), serpin peptidase inhibitor,
clade A (SERPINA3), leucine-rich alpha-2-glycoprotein (LRG1), and
tissue inhibitor of metalloproteinases 1 (TIMP1). The parameters
of the consensus model and the standard errors of these
parameters based on the logistic regression model fit are reported
in Appendix Fig S2.
Table 1. Characteristics of the study population according to diagnostic subgroup for the training and validation cohorts.
ª 2015 The Authors EMBO Molecular Medicine Vol 7 | No 9 | 2015
Silvia Surinova et al Prediction of colorectal cancer diagnosis EMBO Molecular Medicine
1169
Published online: August 7, 2015
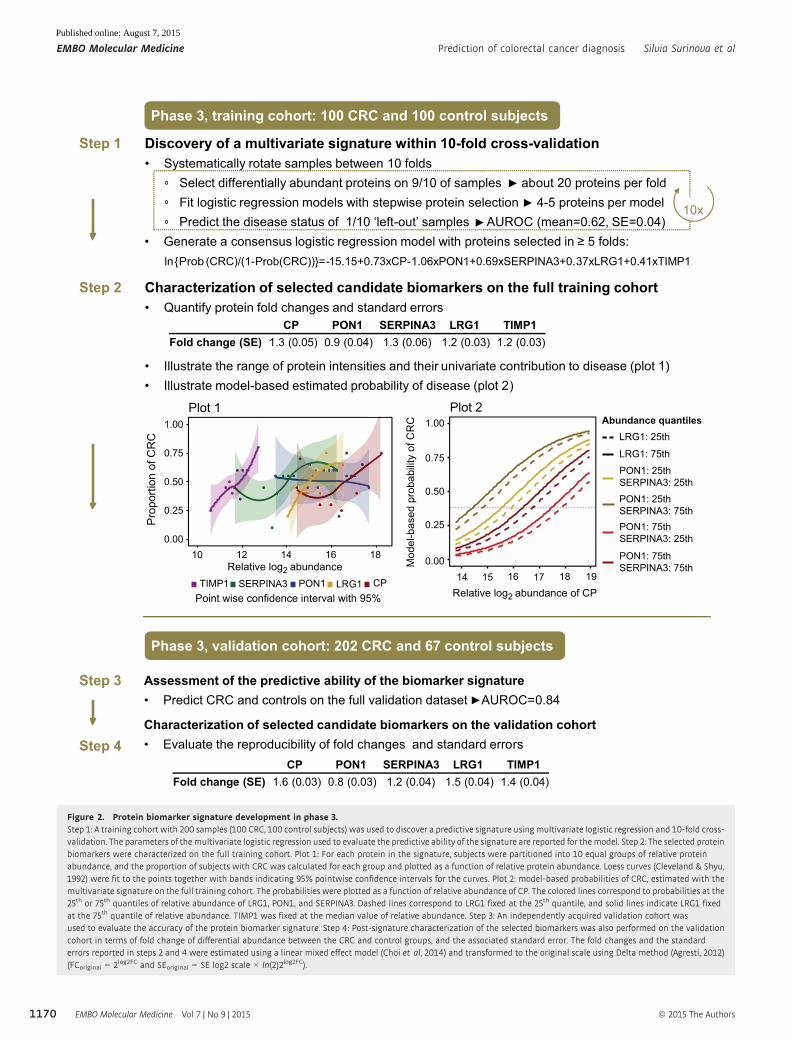
Phase 3, training cohort: 100 CRC and 100 control subjects
Discovery of a multivariate signature within 10-fold cross-validationSystematically rotate samples between 10 folds
Select differentially abundant proteins on 9/10 of samples about 20 proteins per foldFit logistic regression models with stepwise protein selection 4-5 proteins per modelPredict the disease status of 1/10 ‘left-out’ samples AUROC (mean=0.62, SE=0.04)
Generate a consensus logistic regression model with proteins selected in 5 folds: ln{Prob (CRC)/(1-Prob(CRC))}= -15.15+0.73xCP-1.06xPON1+0.69xSERPINA3+0.37xLRG1+0.41xTIMP1
Step 1
10x
Step 2 Characterization of selected candidate biomarkers on the full training cohortQuantify protein fold changes and standard errors
Illustrate the range of protein intensities and their univariate contribution to disease (plot 1) Illustrate model-based estimated probability of disease (plot 2)
CP PON1 SERPINA3 LRG1 TIMP1Fold change (SE) 1.3 (0.05) 0.9 (0.04) 1.3 (0.06) 1.2 (0.03) 1.2 (0.03)
Step 3
Step 4
Assessment of the predictive ability of the biomarker signaturePredict CRC and controls on the full validation dataset AUROC=0.84
Characterization of selected candidate biomarkers on the validation cohortEvaluate the reproducibility of fold changes and standard errors
Phase 3, validation cohort: 202 CRC and 67 control subjects
CP PON1 SERPINA3 LRG1 TIMP1Fold change (SE) 1.6 (0.03) 0.8 (0.03) 1.2 (0.04) 1.5 (0.04) 1.4 (0.04)
Plot 2
0.00
0.25
0.50
0.75
1.00
14 15 16 17 18 19
Mod
el-b
ased
pro
babi
lity
of C
RC
Relative log2 abundance of CP
PON1: 25thSERPINA3: 25th
LRG1: 25th
LRG1: 75th
Abundance quantilesPlot 1
0.00
0.25
0.50
0.75
1.00
10 12 14 16 18Relative log2 abundance
Pro
porti
on o
f CR
C
PON1SERPINA3TIMP1 CPLRG1
PON1: 25thSERPINA3: 75thPON1: 75thSERPINA3: 25th
PON1: 75thSERPINA3: 75th
Point wise confidence interval with 95%
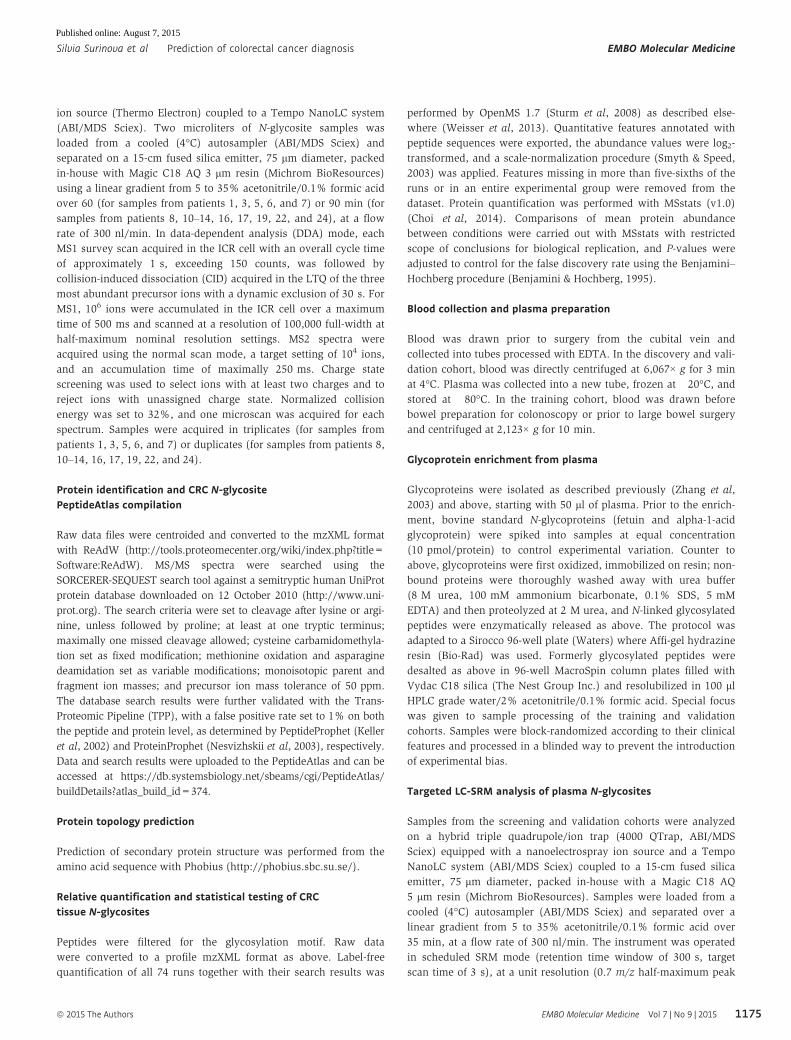
Figure 2. Protein biomarker signature development in phase 3.Step 1: A training cohort with 200 samples (100 CRC, 100 control subjects) was used to discover a predictive signature using multivariate logistic regression and 10-fold cross-validation. The parameters of themultivariate logistic regression used to evaluate the predictive ability of the signature are reported for themodel. Step 2: The selected proteinbiomarkers were characterized on the full training cohort. Plot 1: For each protein in the signature, subjects were partitioned into 10 equal groups of relative proteinabundance, and the proportion of subjects with CRC was calculated for each group and plotted as a function of relative protein abundance. Loess curves (Cleveland & Shyu,1992) were fit to the points together with bands indicating 95% pointwise confidence intervals for the curves. Plot 2: model-based probabilities of CRC, estimated with themultivariate signature on the full training cohort. The probabilities were plotted as a function of relative abundance of CP. The colored lines correspond to probabilities at the25th or 75th quantiles of relative abundance of LRG1, PON1, and SERPINA3. Dashed lines correspond to LRG1 fixed at the 25th quantile, and solid lines indicate LRG1 fixedat the 75th quantile of relative abundance. TIMP1 was fixed at the median value of relative abundance. Step 3: An independently acquired validation cohort wasused to evaluate the accuracy of the protein biomarker signature. Step 4: Post-signature characterization of the selected biomarkers was also performed on the validationcohort in terms of fold change of differential abundance between the CRC and control groups, and the associated standard error. The fold changes and the standarderrors reported in steps 2 and 4 were estimated using a linear mixed effect model (Choi et al, 2014) and transformed to the original scale using Delta method (Agresti, 2012)(FCoriginal = 2log2FC and SEoriginal = SE log2 scale × ln(2)2log2FC).
EMBO Molecular Medicine Vol 7 | No 9 | 2015 ª 2015 The Authors
EMBO Molecular Medicine Prediction of colorectal cancer diagnosis Silvia Surinova et al
1170
Published online: August 7, 2015
To confirm the reproducibility of the protein biomarker signa-
ture, we repeated the procedure described above anew three times
with different random partitions of the subjects into 10-folds and
three more times with different random partitions of the subjects
into eight-folds. In these repetitions, the proteins selected most
frequently into the consensus models were highly overlapping with
the proteins found above, and the prediction accuracy was also
highly comparable (Appendix Table S3). Moreover, to compare the
results with the optimum predictor on the training dataset, we
enumerated all the protein combinations of up to five proteins in
the training dataset by exhaustive search and evaluated the corre-
sponding logistic regression models by their area under the ROC
curve in 100-fold bootstrapped cross-validation (Efron & Tibshirani,
1993). The best models had a similar cross-validation performance.
The proteins present were ranked by their frequency of occurrence
among these models (Appendix Fig S3), and the top selections
included the proteins in the protein biomarker signature above.
Overall, these results confirm that the markers selected by the origi-
nal procedure are robust to the specific choice of the parameters
and of the folds.
Next, to fully take advantage of this large-scale dataset, we char-
acterized the proteins in the selected biomarker signature above on
the full training cohort. In the univariate analysis, an increase in
protein abundance was associated with CRC for four out of the five
proteins (Fig 2, Step 2, Plot 1, for boxplots, see Appendix Fig S4A).
PON1 showed the opposite trend. To illustrate the multivariate
pattern of the protein biomarker signature, we plotted the predicted
probability of CRC as a function of estimated log-abundance of CP,
while fixing the estimated abundances of the other proteins to their
quantiles (Fig 2, Step 2, Plot 2). The highest probability of disease
can be indeed achieved at the lower abundance quantile of PON1
and at the higher cutoffs of the other four proteins.
Given that the control group included healthy subjects with no
lesions and subjects with benign lesions, the specificity of classifica-
tion was evaluated separately for these two groups. In this analysis,
the subjects were split into five-folds (instead of the original
10-folds) due to smaller-sized subgroups and the pseudomedian
cross-validated performance of the respective subgroups was
assessed. Sixty-two percent of subjects with no lesions and 57% of
subjects with pre-lesions were accurately classified (Appendix Fig
S5A). This shows that both groups were predicted with similar accu-
racy, which is in line with the 60% specificity of the complete
control group. To investigate this important point of control group
specificity further, a new set of advanced adenoma samples
(n = 50) was included in the study at this stage. These samples were
collected and measured as part of the training cohort, appropriately
randomized and normalized to avoid bias. These new samples were
not part of the protein biomarker signature development stage, as
they represent intermediate lesions, and therefore can be viewed as
a separate evaluation cohort. At this point, they were classified with
the protein biomarker signature. Fifty-four percent of the subjects
with advanced pre-lesions were correctly predicted (Appendix Fig
S5B), which is similar but slightly inferior to the specificity seen for
the complete control group. The observed drop in specificity high-
lights that these subjects represent an intermediate state of colorec-
tal transformation.
Finally, the protein biomarker signature was evaluated on the
independent validation cohort. Each signature protein was first
A B
C
AUC = 0.84
0.0
0.2
0.4
0.6
0.8
1.0
0.0 0.2 0.4 0.6 0.8 1.0 0.0 0.2 0.4 0.6 0.8 1.0
0.0
0.2
0.4
0.6
0.8
1.0
0.0 0.2 0.4 0.6 0.8 1.0
0.0
0.2
0.4
0.6
0.8
1.0
≥
AUC comparisons
Stage All
% C
0.4 0.8 0. 0. 4 0.0. 0. 1 0.68 0.
0.88 0.8 0.1.00 0.
Size . ≥ All
< . 0.62 0.04 0.44 0.. 0.0 0. 0.≥6 0.1 0.8
Summary statistics
% CAUC 0.84 0. 0. 2
0. 0.64 0.0. 0 0. 0.
A a 0. 2 0.6 0.
AUC comparisons
1: tumor < 3.5 cm2: tumor 3.5–6 cm3: tumor ≥ 6 cm
LRG1 PON1
D
1 2
1816
142
1 2
1816
142
*******
% C
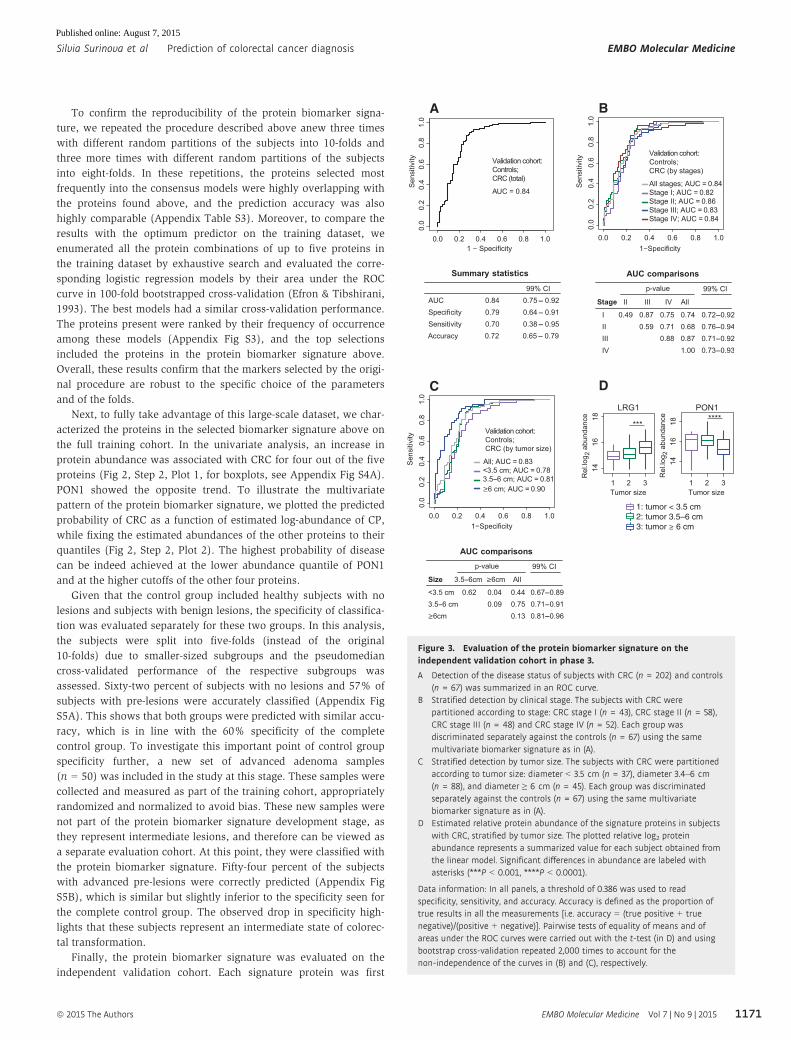
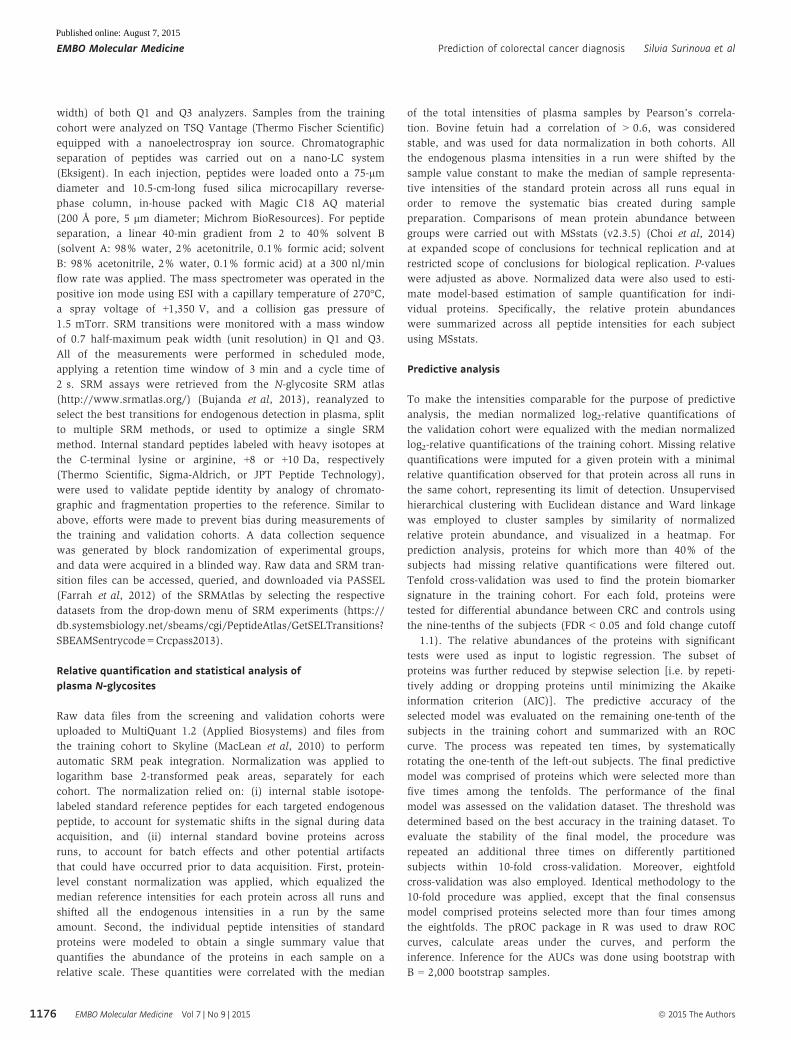
Figure 3. Evaluation of the protein biomarker signature on theindependent validation cohort in phase 3.
A Detection of the disease status of subjects with CRC (n = 202) and controls(n = 67) was summarized in an ROC curve.
B Stratified detection by clinical stage. The subjects with CRC werepartitioned according to stage: CRC stage I (n = 43), CRC stage II (n = 58),CRC stage III (n = 48) and CRC stage IV (n = 52). Each group wasdiscriminated separately against the controls (n = 67) using the samemultivariate biomarker signature as in (A).
C Stratified detection by tumor size. The subjects with CRC were partitionedaccording to tumor size: diameter < 3.5 cm (n = 37), diameter 3.4–6 cm(n = 88), and diameter ≥ 6 cm (n = 45). Each group was discriminatedseparately against the controls (n = 67) using the same multivariatebiomarker signature as in (A).
D Estimated relative protein abundance of the signature proteins in subjectswith CRC, stratified by tumor size. The plotted relative log2 proteinabundance represents a summarized value for each subject obtained fromthe linear model. Significant differences in abundance are labeled withasterisks (***P < 0.001, ****P < 0.0001).
Data information: In all panels, a threshold of 0.386 was used to readspecificity, sensitivity, and accuracy. Accuracy is defined as the proportion oftrue results in all the measurements [i.e. accuracy = (true positive + truenegative)/(positive + negative)]. Pairwise tests of equality of means and ofareas under the ROC curves were carried out with the t-test (in D) and usingbootstrap cross-validation repeated 2,000 times to account for thenon-independence of the curves in (B) and (C), respectively.
ª 2015 The Authors EMBO Molecular Medicine Vol 7 | No 9 | 2015
Silvia Surinova et al Prediction of colorectal cancer diagnosis EMBO Molecular Medicine
1171
Published online: August 7, 2015
examined separately. For the five selected proteins, the fold changes
of abundance between the CRC and the control groups, and the
corresponding standard errors, were very well reproduced on the
validation cohort (Fig 2, Step 4, for boxplots, see Appendix Fig
S4B). Of the five proteins, CP, TIMP1, and LRG1 demonstrated
the highest areas under the ROC curves (Appendix Fig S6).
The prediction of CRC and control subjects with the protein
biomarker signature achieved an accuracy of 72% (Fig 3A).
At this point, we examined whether age, a potential confounder,
had any impact on the predictive ability of the protein biomarker
signature. In the training cohort, the protein selection performed
within 10-fold cross-validation with or without age adjustment of
disease probability found that very similar proteins were selected in
both cases. The difference between the respective AUCs was 2.9%
(bootstrap-based P-value = 0.15). In the validation cohort, the
difference between the model with or without age consideration
was 5.2% (bootstrap-based P-value = 0.004). Although the differ-
ence in AUCs is statistically significant, in both cases similar AUC
values were obtained (Appendix Fig S7).
In addition to the detection of CRC as one disease, we examined
the ability of the protein biomarker signature to distinguish subjects
with distinct stages of CRC from controls. The CRC subjects in the
validation cohort were stratified according to the TNM system
(Sobin, 2003), which represents the invasiveness in terms of tumor
spread across the mucosal membrane. The results did not indicate a
superior predictive ability of the protein biomarker signature for any
particular disease stage (Fig 3B). This showed that the protein
biomarker signature can predict early and advanced CRC equally
well.
Since the TNM-based staging of CRC does not account for the
tumor extent, a smaller but more invasive tumor may be assigned to
a more advanced stage than a larger but less invasive tumor. At the
same time, larger tumors may secrete into circulation larger
amounts of the protein biomarker and may therefore be easier to
diagnose. To investigate the effect of the tumor size on the predic-
tive ability of the protein biomarker signature, we assigned 170 CRC
subjects in the validation cohort with recorded tumor size into three
groups. Group 1 consisted of patients with tumor diameters smaller
than < 3.5 cm (n = 37). Group 2 consisted of patients with tumors
of a diameter between 3.5 and 6 cm (n = 88). Group 3 consisted of
patients with large tumors of diameters equal to or larger than 6 cm
(n = 45). As expected, the protein biomarker signature had a better
predictive ability for subjects with large tumors than for subjects
with smaller tumors (Fig 3C). Univariate analysis showed higher
levels of LRG1 in the circulation of subjects with larger tumors,
pointing toward a specific protein secretion from the tumor (small
versus medium tumors: P = 5.7e-2; medium versus large tumors:
P = 7.7e-4, Fig 3D). At the same time, and as expected from the
differential abundance between disease and control groups (Fig 2),
smaller amounts of PON1 were detected in patients with larger tumors
(small versus medium tumors: P = 1.6e-1; medium versus large
tumors: P = 6.7e-5). In both cases, the trends were especially
pronounced and highly significant when comparing tumors larger
than 6 cm to smaller ones.
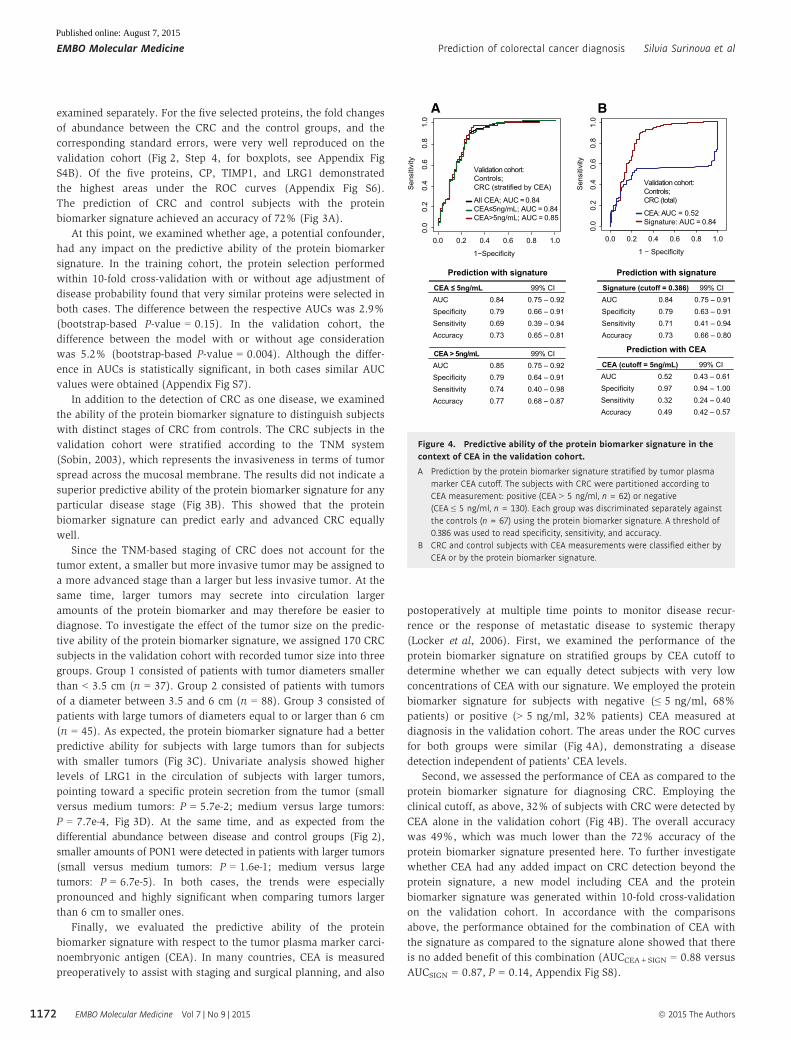
Finally, we evaluated the predictive ability of the protein
biomarker signature with respect to the tumor plasma marker carci-
noembryonic antigen (CEA). In many countries, CEA is measured
preoperatively to assist with staging and surgical planning, and also
postoperatively at multiple time points to monitor disease recur-
rence or the response of metastatic disease to systemic therapy
(Locker et al, 2006). First, we examined the performance of the
protein biomarker signature on stratified groups by CEA cutoff to
determine whether we can equally detect subjects with very low
concentrations of CEA with our signature. We employed the protein
biomarker signature for subjects with negative (≤ 5 ng/ml, 68%
patients) or positive (> 5 ng/ml, 32% patients) CEA measured at
diagnosis in the validation cohort. The areas under the ROC curves
for both groups were similar (Fig 4A), demonstrating a disease
detection independent of patients’ CEA levels.
Second, we assessed the performance of CEA as compared to the
protein biomarker signature for diagnosing CRC. Employing the
clinical cutoff, as above, 32% of subjects with CRC were detected by
CEA alone in the validation cohort (Fig 4B). The overall accuracy
was 49%, which was much lower than the 72% accuracy of the
protein biomarker signature presented here. To further investigate
whether CEA had any added impact on CRC detection beyond the
protein signature, a new model including CEA and the protein
biomarker signature was generated within 10-fold cross-validation
on the validation cohort. In accordance with the comparisons
above, the performance obtained for the combination of CEA with
the signature as compared to the signature alone showed that there
is no added benefit of this combination (AUCCEA+SIGN = 0.88 versus
AUCSIGN = 0.87, P = 0.14, Appendix Fig S8).
A B
UC = 0.52
0.0
0.2
0.4
0.6
0.8
1.0
0.0 0.2 0.4 0.6 0.8 1.0
0.0
0.2
0.4
0.6
0.8
1.0
0.0 0.2 0.4 0.6 0.8 1.0
CEA
Prediction with signature
99% CIAUC 0.84 0.75 – 0.92
0.79 0.66 – 0.910.69 0.39 – 0.94
A a 0.73 0.65 – 0.81
CEA 5ng/mL
99% CIAUC 0.85 0.75 – 0.92
0.79 0.64 – 0.910.74 0.40 – 0.98
A a 0.77 0.68 – 0.87
CEA > 5ng/mL
Prediction with signature
99% CIAUC 0.84 0.75 – 0.91
0.79 0.63 – 0.910.71 0.41 – 0.94
A a 0.73 0.66 – 0.80
Signature (cutoff = 0.386)
Prediction with CEA
99% CIAUC 0.52 0.43 – 0.61
0.97 0.94 – 1.000.32 0.24 – 0.40
A a 0.49 0.42 – 0.57
CEA (cutoff = 5ng/mL)
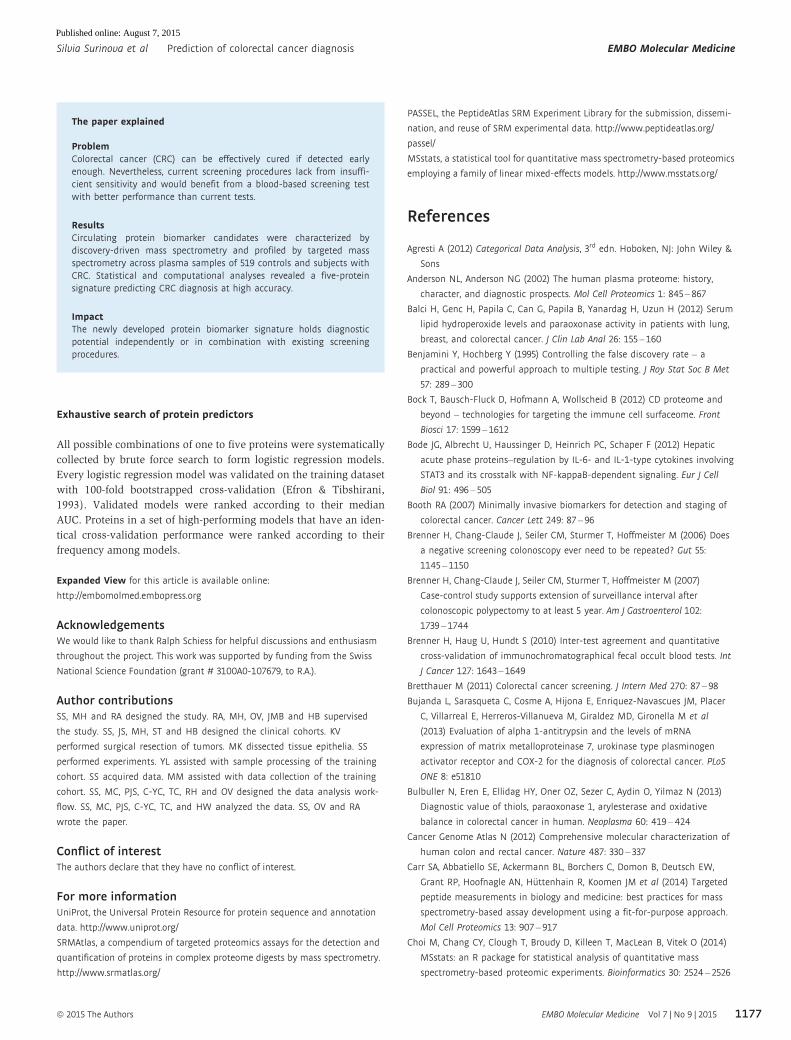
Figure 4. Predictive ability of the protein biomarker signature in thecontext of CEA in the validation cohort.
A Prediction by the protein biomarker signature stratified by tumor plasmamarker CEA cutoff. The subjects with CRC were partitioned according toCEA measurement: positive (CEA > 5 ng/ml, n = 62) or negative(CEA ≤ 5 ng/ml, n = 130). Each group was discriminated separately againstthe controls (n = 67) using the protein biomarker signature. A threshold of0.386 was used to read specificity, sensitivity, and accuracy.
B CRC and control subjects with CEA measurements were classified either byCEA or by the protein biomarker signature.
EMBO Molecular Medicine Vol 7 | No 9 | 2015 ª 2015 The Authors
EMBO Molecular Medicine Prediction of colorectal cancer diagnosis Silvia Surinova et al
1172
Published online: August 7, 2015
Discussion
The present study proposes a multi-protein biomarker signature for
CRC diagnosis. We used an innovative strategy to characterize
proteins that play a role in or are regulated as a result of CRC,
screen for them in the circulation, and select a subset of proteins
with a high predictive ability. To identify disease-associated proteins,
we profiled CRC-driven perturbations reflected in the proteome of
the tumor epithelia. We acknowledged that tumor-derived proteins
in the bloodstream preferentially belong to the class of proteins that
are secreted, transported, or enzymatically released into the circula-
tion. We therefore selectively focused on the subproteome of
N-glycosylated proteins that are destined to reach the extracellular
environment. This approach proved successful at detecting
biomarker candidates in the systemic circulation and offered a
non-invasive readout of patient CRC alterations. The diagnostic
potential of the proteins quantified in plasma was assessed in two
independent clinical cohorts and led to the prioritization of five
proteins, which as a panel proved more predictive than any single
protein in isolation.
CRC is a heterogeneous solid malignancy that exhibits genomic
differences between patients (Cancer Genome Atlas, 2012) and
where multiple cancer modalities (Hanahan & Weinberg, 2011)
contribute to its systemic demonstration that can be monitored in the
blood circulation (Surinova et al, 2015). Given the complex charac-
teristics of CRC, it is unlikely that a single protein marker would be
powerful enough to capture this disease across a large set of patients.
The most discriminating protein predictors that capture the different
aspects of CRC as compared to healthy and benign controls in the
circulation were therefore selected into a multivariate signature.
The proteins comprising the diagnostic signature have been
previously linked to cancer and play different functional roles. CP
and SERPINA3 both belong to the acute-phase reactant proteins and
have been associated with systemic inflammation (Bode et al,
2012). TIMP1 is involved in the extracellular matrix remodeling as it
is the natural inhibitor of the matrix metalloproteinases (MMPs), a
group of peptidases involved in degradation of the extracellular
matrix (Hadler-Olsen et al, 2013). In addition, it has also been
proposed that TIMP1 promotes cell proliferation and possesses anti-
apoptotic effects (Li et al, 1999). PON1 is a known free radical scav-
enger belonging to the family of serum paraoxonases, possesses
antioxidant activities, and was proposed to play a role in carcino-
genesis and metastasis status in CRC (Balci et al, 2012). The func-
tion of LRG1 has been unknown until recently when Wang et al
reported that it promotes angiogenesis (Wang et al, 2013).
All five proteins have been further associated with CRC, and their
abundance trends in the plasma of CRC patients and controls are in
accordance with the previous reports (Walker & Gray, 1983; Holten-
Andersen et al, 2002; Balci et al, 2012; Ladd et al, 2012; Bujanda
et al, 2013). Regarding predictive ability for CRC diagnosis, LRG1,
PON1, and TIMP1 were previously assessed independently. LRG1
was assayed by ELISA and reported to have an increased fold
change and predictive ability for CRC detection in a cohort of 58
subjects with CRC and 58 control subjects, and also in a pre-
diagnosis cohort of 32 female subjects with CRC and 32 female
control subjects (Ladd et al, 2012). The extent of differential abun-
dance of a protein between the groups and its predictive ability were
in strong accordance with our results. PON1 was examined in the
context of the serum oxidative imbalance association with an
increased risk of CRC in a cohort of 40 subjects with CRC and 39
controls. Similar to our results, lower serum PON1 levels were
found in CRC patients (Bulbuller et al, 2013). TIMP1 was assayed
by ELISA in blood samples of 179 CRC patients and 225 neoplasm-
free participants and was found to have elevated levels in CRC. Its
predictive ability to discriminate between these groups was slightly
lower to the one found in our cohort (Tao et al, 2012). Interestingly,
on top of the five proteins in the signature, the exhaustive search
procedure highlighted additional proteins as highly ranked
(Appendix Fig S3). These proteins can be regarded as “back-up”
proteins in case a future assay for a protein within the diagnostic
signature will not fulfill the required analytical criteria.
The reported protein biomarker signature accurately predicts
subjects with CRC. We have shown that it can detect disease in a
stage-independent manner. Tumor size, on the other hand, proved
to play an important role in the accuracy of detection, where
subjects with larger tumors were detected more readily. This is in
agreement with our hypothesis that larger tumors secrete more
biomarker into the circulation. In particular, LRG1 and PON1
showed stronger abundance differences in larger tumors.
In the present study, sensitivity of the protein biomarker signa-
ture was addressed extensively on two independent cohorts of CRC
and control subjects. The second main characteristic of a protein
signature is its specificity for the disease in question. The cancer-
associated proteins within our signature contain both tumor-derived
and systemic response proteins. SERPINA3 and CP can be upregu-
lated in cancerous or non-cancerous inflammatory conditions. It can
only be speculated that the tumor-derived inflammation captured
with these two proteins may represent a stable upregulation across
CRC patients, and this is why SERPINA3 and CP were prioritized
into the signature. The differences in inflammation between CRC
and non-cancerous conditions such as inflammatory bowel disease
(IBD) are not well understood, and a direct assessment of these and
other proteins across large enough respective groups is required to
gain further insight into the differences between diseases sharing
common modalities. The specificity of the signature for CRC is
significantly mediated by TIMP1, PON1, and LRG1—the three
proteins previously associated with CRC more directly and based on
our observation that the abundance of PON1 and LRG1 in the circu-
lation correlated with the tumor size in these patients, pointing
toward tumor-specific markers. TIMP1 was previously reported to
yield diagnostic value for CRC detection in large cohorts (Holten-
Andersen et al, 2002). In this study, TIMP1 levels were also moni-
tored for subjects with IBD and no significant differences in plasma
TIMP1 levels between healthy and IBD subjects were detected.
Here we report a multivariate signature capturing the most signif-
icant CRC demonstrations in the circulation of a large set of cohorts.
The claim that a biomarker is specific for the detection of CRC
requires an extensive study of the predictive ability of the signature
against various types of disease. The study should be performed on
samples where clinical data clearly define each homogeneous
patient subgroup. The study should employ statistical analysis of
the acquired data that is different from the present work, in that it
would not only differentiate between CRC and controls, but also
show the absence of the signal in other disease subgroups. Since
this work utilized a control group that represents the general
population of the subjects at risk, and without any additional
ª 2015 The Authors EMBO Molecular Medicine Vol 7 | No 9 | 2015
Silvia Surinova et al Prediction of colorectal cancer diagnosis EMBO Molecular Medicine
1173
Published online: August 7, 2015
comorbidities, we cannot claim that the proposed protein biomarker
signature is exclusively specific to CRC. We can only hypothesize
about the specificity of the signature proteins based on previous
reports of their biological roles.
Further development of the protein biomarker signature can lead
to a fit-for-purpose clinical grade assay (Carr et al, 2014) and to an
improvement of its current accuracy. This can be accomplished on
both technological and clinical levels. On the measurement level, to
reach a high accuracy of CRC detection, further work is needed to
improve the assay’s characteristics by: (i) employing a 5-plex SRM
assay method with longer acquisition times than the ones used in the
88-plex method to enhance signal-to-noise ratios; (ii) performing
absolute quantification with precisely quantified internal standards
for the five proteins; and possibly also by (iii) using orthogonal
measurements with ELISAs for the signature proteins. On the clinical
level, one option is to identify homogeneous subpopulations of
subjects where the biomarker signature is particularly effective. This
would require studies of a larger size and with more clinical charac-
teristics. Another option is to combine the signature with an existing
(e.g. FOBT) or new biomarker to obtain more accurate discrimination
from the combination. Finally, performing serial measurements to
monitor signature proteins over time, for example, annually or bian-
nually, as is often done for FOBT, is likely to enhance its accuracy.
The current clinical procedures for CRC diagnosis can certainly
be improved. Regarding screening, the most commonly employed
non-invasive test is the FOBT. Although the test generally shows
good specificity, the traditional guaiac-based test does not detect
CRC effectively and the detection is particularly poor for early-stage
cancers (Booth, 2007; Bretthauer, 2011). Although higher sensitivity
and compliance can be achieved with immunochemical fecal occult
blood test (Kapidzic et al, 2014), a non-invasive blood-based test
could represent a more convenient test and thereby enhance compli-
ance further. Further clinical evaluation is necessary to directly
compare the performance of our signature with FOBT and other
candidate screening tests on the same cohort to assess their relative
predictive abilities and to explore a benefit of their combination.
Ideally, such evaluation should be performed in a true screening
setting, for example, among participants of screening colonoscopy.
Materials and Methods
Clinical cohorts
Three independent cohorts were used in this study. The first cohort
was designed to be shared between the discovery and the screening
phase to increase the likelihood of candidates identified in the tissue
and their subsequent detection in the circulation of the same
subjects. The subjects were recruited for the purpose of this study at
the University Hospital Olomouc in the Czech Republic and were
included consecutively as diagnosed. For the validation phase, two
large independent cohorts, that is, training and validation cohorts,
were designed. The training cohort was comprised of two groups of
equal size that include subjects with colorectal cancer (CRC) and
subjects representing a control population at risk. Subjects were
selected from two ongoing German clinical studies, that is, a
prospective screening study (BLiTz) (Hundt et al, 2009; Brenner
et al, 2010) and a case–control study examining the role of
colonoscopy in CRC prevention (DACHS+) (Brenner et al, 2006,
2007), and their status was colonoscopy-confirmed. The validation
cohort included subjects selected consecutively at the University
Hospital Olomouc. The control group was comprised of clinically
healthy blood donors and subjects with various non-malignant
gastrointestinal tract (GIT) conditions such as adenoma, benign
condition, diverticular disease, dysplastic polyps, and Crohn’s
disease. The CRC group was designed to contain approximately
equally sized subgroups of clinical stages. For the validation
purpose, tumor diameter was reported for CRC subjects and CEA
concentration at diagnosis for all subjects. This study was approved
by the ethics committees of the Medical Faculty at the University of
Heidelberg, of the Medical Chambers of Baden-Wurttemberg and
Rhineland-Palatinate, and of the University Hospital Olomouc and
Faculty of Medicine and Dentistry, Palacky University, Olomouc.
Written informed consent was obtained from each participant.
Collection and preparation of tissue epithelia
Tumor and adjacent normal mucosa tissues were surgically resected
based on standard oncological procedures. Frozen tissue was further
processed in a pre-cooled cryostat (�20°C). Sections of 7 lm were
fixed with 4% formalin and stained with hematoxylin–eosin, and
adjacent 40-lm sections were manually dissected and placed in lysis
buffer (50% PBS liquid, pH 7.4 (GIBCO, Invitrogen) and 50% 2,2,2-
trifluoroethanol (Fluka, 99.9% purity)) until 50 mg of dissected
epithelium was obtained per sample.
Protein extraction and peptide isolation
Tissue epithelia were homogenized in a Microdismembrator S
(Sartorius), subjected to protein extraction in lysis buffer (as above),
and solubilized with 1% Rapigest (Waters) in 250 mM ammonium
bicarbonate. Ultra sonication in a vial-tweeter ultrasonicator
(Hielscher) at 4°C was used to further disintegrate the homogenized
tissue. Proteins were denatured at 60°C for 2 h, reduced with 5 mM
dithiothreitol (DTT) at 60°C for 30 min, and alkylated with 25 mM
iodoacetamide (IAA) at 25°C for 45 min in the dark. Samples were
diluted to 15% TFE in 100 mM ammonium bicarbonate and proteo-
lyzed with sequencing grade porcine trypsin (Promega) at a
protease to substrate ratio of 1:100 at 37°C for 15 h. Peptide
mixtures were desalted with Sep-Pak tC18 cartridges (Waters,
Milford, MA, USA), eluted with 50% acetonitrile/0.1% formic acid,
evaporated to dryness, and resolubilized in 100 ll 20 mM sodium
acetate and 100 mM sodium chloride, pH 5.
Glycopeptide enrichment
Glycopeptides were isolated as described previously (Zhang
et al, 2003). N-linked glycosylated peptides were released with
N-glycosidase F (PNGase F; Roche and New England Biolabs).
Formerly glycosylated peptides were desalted as above and resolubi-
lized in 100 ll HPLC grade water/2% acetonitrile/0.1% formic acid.
Discovery-driven LC-MS of tissue N-glycosites
LC-MS/MS analyses were carried out on a hybrid LTQ-FT-ICR mass
spectrometer (Thermo Electron) interfaced to a nanoelectrospray
EMBO Molecular Medicine Vol 7 | No 9 | 2015 ª 2015 The Authors
EMBO Molecular Medicine Prediction of colorectal cancer diagnosis Silvia Surinova et al
1174
Published online: August 7, 2015
ion source (Thermo Electron) coupled to a Tempo NanoLC system
(ABI/MDS Sciex). Two microliters of N-glycosite samples was
loaded from a cooled (4°C) autosampler (ABI/MDS Sciex) and
separated on a 15-cm fused silica emitter, 75 lm diameter, packed
in-house with Magic C18 AQ 3 lm resin (Michrom BioResources)
using a linear gradient from 5 to 35% acetonitrile/0.1% formic acid
over 60 (for samples from patients 1, 3, 5, 6, and 7) or 90 min (for
samples from patients 8, 10–14, 16, 17, 19, 22, and 24), at a flow
rate of 300 nl/min. In data-dependent analysis (DDA) mode, each
MS1 survey scan acquired in the ICR cell with an overall cycle time
of approximately 1 s, exceeding 150 counts, was followed by
collision-induced dissociation (CID) acquired in the LTQ of the three
most abundant precursor ions with a dynamic exclusion of 30 s. For
MS1, 106 ions were accumulated in the ICR cell over a maximum
time of 500 ms and scanned at a resolution of 100,000 full-width at
half-maximum nominal resolution settings. MS2 spectra were
acquired using the normal scan mode, a target setting of 104 ions,
and an accumulation time of maximally 250 ms. Charge state
screening was used to select ions with at least two charges and to
reject ions with unassigned charge state. Normalized collision
energy was set to 32%, and one microscan was acquired for each
spectrum. Samples were acquired in triplicates (for samples from
patients 1, 3, 5, 6, and 7) or duplicates (for samples from patients 8,
10–14, 16, 17, 19, 22, and 24).
Protein identification and CRC N-glycositePeptideAtlas compilation
Raw data files were centroided and converted to the mzXML format
with ReAdW (http://tools.proteomecenter.org/wiki/index.php?title=
Software:ReAdW). MS/MS spectra were searched using the
SORCERER-SEQUEST search tool against a semitryptic human UniProt
protein database downloaded on 12 October 2010 (http://www.uni-
prot.org). The search criteria were set to cleavage after lysine or argi-
nine, unless followed by proline; at least at one tryptic terminus;
maximally one missed cleavage allowed; cysteine carbamidomethyla-
tion set as fixed modification; methionine oxidation and asparagine
deamidation set as variable modifications; monoisotopic parent and
fragment ion masses; and precursor ion mass tolerance of 50 ppm.
The database search results were further validated with the Trans-
Proteomic Pipeline (TPP), with a false positive rate set to 1% on both
the peptide and protein level, as determined by PeptideProphet (Keller
et al, 2002) and ProteinProphet (Nesvizhskii et al, 2003), respectively.
Data and search results were uploaded to the PeptideAtlas and can be
accessed at https://db.systemsbiology.net/sbeams/cgi/PeptideAtlas/
buildDetails?atlas_build_id=374.
Protein topology prediction
Prediction of secondary protein structure was performed from the
amino acid sequence with Phobius (http://phobius.sbc.su.se/).
Relative quantification and statistical testing of CRCtissue N-glycosites
Peptides were filtered for the glycosylation motif. Raw data
were converted to a profile mzXML format as above. Label-free
quantification of all 74 runs together with their search results was
performed by OpenMS 1.7 (Sturm et al, 2008) as described else-
where (Weisser et al, 2013). Quantitative features annotated with
peptide sequences were exported, the abundance values were log2-
transformed, and a scale-normalization procedure (Smyth & Speed,
2003) was applied. Features missing in more than five-sixths of the
runs or in an entire experimental group were removed from the
dataset. Protein quantification was performed with MSstats (v1.0)
(Choi et al, 2014). Comparisons of mean protein abundance
between conditions were carried out with MSstats with restricted
scope of conclusions for biological replication, and P-values were
adjusted to control for the false discovery rate using the Benjamini–
Hochberg procedure (Benjamini & Hochberg, 1995).
Blood collection and plasma preparation
Blood was drawn prior to surgery from the cubital vein and
collected into tubes processed with EDTA. In the discovery and vali-
dation cohort, blood was directly centrifuged at 6,067× g for 3 min
at 4°C. Plasma was collected into a new tube, frozen at �20°C, and
stored at �80°C. In the training cohort, blood was drawn before
bowel preparation for colonoscopy or prior to large bowel surgery
and centrifuged at 2,123× g for 10 min.
Glycoprotein enrichment from plasma
Glycoproteins were isolated as described previously (Zhang et al,
2003) and above, starting with 50 ll of plasma. Prior to the enrich-
ment, bovine standard N-glycoproteins (fetuin and alpha-1-acid
glycoprotein) were spiked into samples at equal concentration
(10 pmol/protein) to control experimental variation. Counter to
above, glycoproteins were first oxidized, immobilized on resin; non-
bound proteins were thoroughly washed away with urea buffer
(8 M urea, 100 mM ammonium bicarbonate, 0.1% SDS, 5 mM
EDTA) and then proteolyzed at 2 M urea, and N-linked glycosylated
peptides were enzymatically released as above. The protocol was
adapted to a Sirocco 96-well plate (Waters) where Affi-gel hydrazine
resin (Bio-Rad) was used. Formerly glycosylated peptides were
desalted as above in 96-well MacroSpin column plates filled with
Vydac C18 silica (The Nest Group Inc.) and resolubilized in 100 llHPLC grade water/2% acetonitrile/0.1% formic acid. Special focus
was given to sample processing of the training and validation
cohorts. Samples were block-randomized according to their clinical
features and processed in a blinded way to prevent the introduction
of experimental bias.
Targeted LC-SRM analysis of plasma N-glycosites
Samples from the screening and validation cohorts were analyzed
on a hybrid triple quadrupole/ion trap (4000 QTrap, ABI/MDS
Sciex) equipped with a nanoelectrospray ion source and a Tempo
NanoLC system (ABI/MDS Sciex) coupled to a 15-cm fused silica
emitter, 75 lm diameter, packed in-house with a Magic C18 AQ
5 lm resin (Michrom BioResources). Samples were loaded from a
cooled (4°C) autosampler (ABI/MDS Sciex) and separated over a
linear gradient from 5 to 35% acetonitrile/0.1% formic acid over
35 min, at a flow rate of 300 nl/min. The instrument was operated
in scheduled SRM mode (retention time window of 300 s, target
scan time of 3 s), at a unit resolution (0.7 m/z half-maximum peak
ª 2015 The Authors EMBO Molecular Medicine Vol 7 | No 9 | 2015
Silvia Surinova et al Prediction of colorectal cancer diagnosis EMBO Molecular Medicine
1175
Published online: August 7, 2015
width) of both Q1 and Q3 analyzers. Samples from the training
cohort were analyzed on TSQ Vantage (Thermo Fischer Scientific)
equipped with a nanoelectrospray ion source. Chromatographic
separation of peptides was carried out on a nano-LC system
(Eksigent). In each injection, peptides were loaded onto a 75-lmdiameter and 10.5-cm-long fused silica microcapillary reverse-
phase column, in-house packed with Magic C18 AQ material
(200 Å pore, 5 lm diameter; Michrom BioResources). For peptide
separation, a linear 40-min gradient from 2 to 40% solvent B
(solvent A: 98% water, 2% acetonitrile, 0.1% formic acid; solvent
B: 98% acetonitrile, 2% water, 0.1% formic acid) at a 300 nl/min
flow rate was applied. The mass spectrometer was operated in the
positive ion mode using ESI with a capillary temperature of 270°C,
a spray voltage of +1,350 V, and a collision gas pressure of
1.5 mTorr. SRM transitions were monitored with a mass window
of 0.7 half-maximum peak width (unit resolution) in Q1 and Q3.
All of the measurements were performed in scheduled mode,
applying a retention time window of 3 min and a cycle time of
2 s. SRM assays were retrieved from the N-glycosite SRM atlas
(http://www.srmatlas.org/) (Bujanda et al, 2013), reanalyzed to
select the best transitions for endogenous detection in plasma, split
to multiple SRM methods, or used to optimize a single SRM
method. Internal standard peptides labeled with heavy isotopes at
the C-terminal lysine or arginine, +8 or +10 Da, respectively
(Thermo Scientific, Sigma-Aldrich, or JPT Peptide Technology),
were used to validate peptide identity by analogy of chromato-
graphic and fragmentation properties to the reference. Similar to
above, efforts were made to prevent bias during measurements of
the training and validation cohorts. A data collection sequence
was generated by block randomization of experimental groups,
and data were acquired in a blinded way. Raw data and SRM tran-
sition files can be accessed, queried, and downloaded via PASSEL
(Farrah et al, 2012) of the SRMAtlas by selecting the respective
datasets from the drop-down menu of SRM experiments (https://
db.systemsbiology.net/sbeams/cgi/PeptideAtlas/GetSELTransitions?
SBEAMSentrycode=Crcpass2013).
Relative quantification and statistical analysis ofplasma N-glycosites
Raw data files from the screening and validation cohorts were
uploaded to MultiQuant 1.2 (Applied Biosystems) and files from
the training cohort to Skyline (MacLean et al, 2010) to perform
automatic SRM peak integration. Normalization was applied to
logarithm base 2-transformed peak areas, separately for each
cohort. The normalization relied on: (i) internal stable isotope-
labeled standard reference peptides for each targeted endogenous
peptide, to account for systematic shifts in the signal during data
acquisition, and (ii) internal standard bovine proteins across
runs, to account for batch effects and other potential artifacts
that could have occurred prior to data acquisition. First, protein-
level constant normalization was applied, which equalized the
median reference intensities for each protein across all runs and
shifted all the endogenous intensities in a run by the same
amount. Second, the individual peptide intensities of standard
proteins were modeled to obtain a single summary value that
quantifies the abundance of the proteins in each sample on a
relative scale. These quantities were correlated with the median
of the total intensities of plasma samples by Pearson’s correla-
tion. Bovine fetuin had a correlation of > 0.6, was considered
stable, and was used for data normalization in both cohorts. All
the endogenous plasma intensities in a run were shifted by the
sample value constant to make the median of sample representa-
tive intensities of the standard protein across all runs equal in
order to remove the systematic bias created during sample
preparation. Comparisons of mean protein abundance between
groups were carried out with MSstats (v2.3.5) (Choi et al, 2014)
at expanded scope of conclusions for technical replication and at
restricted scope of conclusions for biological replication. P-values
were adjusted as above. Normalized data were also used to esti-
mate model-based estimation of sample quantification for indi-
vidual proteins. Specifically, the relative protein abundances
were summarized across all peptide intensities for each subject
using MSstats.
Predictive analysis
To make the intensities comparable for the purpose of predictive
analysis, the median normalized log2-relative quantifications of
the validation cohort were equalized with the median normalized
log2-relative quantifications of the training cohort. Missing relative
quantifications were imputed for a given protein with a minimal
relative quantification observed for that protein across all runs in
the same cohort, representing its limit of detection. Unsupervised
hierarchical clustering with Euclidean distance and Ward linkage
was employed to cluster samples by similarity of normalized
relative protein abundance, and visualized in a heatmap. For
prediction analysis, proteins for which more than 40% of the
subjects had missing relative quantifications were filtered out.
Tenfold cross-validation was used to find the protein biomarker
signature in the training cohort. For each fold, proteins were
tested for differential abundance between CRC and controls using
the nine-tenths of the subjects (FDR < 0.05 and fold change cutoff
� 1.1). The relative abundances of the proteins with significant
tests were used as input to logistic regression. The subset of
proteins was further reduced by stepwise selection [i.e. by repeti-
tively adding or dropping proteins until minimizing the Akaike
information criterion (AIC)]. The predictive accuracy of the
selected model was evaluated on the remaining one-tenth of the
subjects in the training cohort and summarized with an ROC
curve. The process was repeated ten times, by systematically
rotating the one-tenth of the left-out subjects. The final predictive
model was comprised of proteins which were selected more than
five times among the tenfolds. The performance of the final
model was assessed on the validation dataset. The threshold was
determined based on the best accuracy in the training dataset. To
evaluate the stability of the final model, the procedure was
repeated an additional three times on differently partitioned
subjects within 10-fold cross-validation. Moreover, eightfold
cross-validation was also employed. Identical methodology to the
10-fold procedure was applied, except that the final consensus
model comprised proteins selected more than four times among
the eightfolds. The pROC package in R was used to draw ROC
curves, calculate areas under the curves, and perform the
inference. Inference for the AUCs was done using bootstrap with
B = 2,000 bootstrap samples.
EMBO Molecular Medicine Vol 7 | No 9 | 2015 ª 2015 The Authors
EMBO Molecular Medicine Prediction of colorectal cancer diagnosis Silvia Surinova et al
1176
Published online: August 7, 2015
Exhaustive search of protein predictors
All possible combinations of one to five proteins were systematically
collected by brute force search to form logistic regression models.
Every logistic regression model was validated on the training dataset
with 100-fold bootstrapped cross-validation (Efron & Tibshirani,
1993). Validated models were ranked according to their median
AUC. Proteins in a set of high-performing models that have an iden-
tical cross-validation performance were ranked according to their
frequency among models.
Expanded View for this article is available online:
http://embomolmed.embopress.org
AcknowledgementsWe would like to thank Ralph Schiess for helpful discussions and enthusiasm
throughout the project. This work was supported by funding from the Swiss
National Science Foundation (grant # 3100A0-107679, to R.A.).
Author contributionsSS, MH and RA designed the study. RA, MH, OV, JMB and HB supervised
the study. SS, JS, MH, ST and HB designed the clinical cohorts. KV
performed surgical resection of tumors. MK dissected tissue epithelia. SS
performed experiments. YL assisted with sample processing of the training
cohort. SS acquired data. MM assisted with data collection of the training
cohort. SS, MC, PJS, C-YC, TC, RH and OV designed the data analysis work-
flow. SS, MC, PJS, C-YC, TC, and HW analyzed the data. SS, OV and RA
wrote the paper.
Conflict of interestThe authors declare that they have no conflict of interest.
For more informationUniProt, the Universal Protein Resource for protein sequence and annotation
data. http://www.uniprot.org/
SRMAtlas, a compendium of targeted proteomics assays for the detection and
quantification of proteins in complex proteome digests by mass spectrometry.
http://www.srmatlas.org/
PASSEL, the PeptideAtlas SRM Experiment Library for the submission, dissemi-
nation, and reuse of SRM experimental data. http://www.peptideatlas.org/
passel/
MSstats, a statistical tool for quantitative mass spectrometry-based proteomics
employing a family of linear mixed-effects models. http://www.msstats.org/
References
Agresti A (2012) Categorical Data Analysis, 3rd edn. Hoboken, NJ: John Wiley &
Sons
Anderson NL, Anderson NG (2002) The human plasma proteome: history,
character, and diagnostic prospects. Mol Cell Proteomics 1: 845 – 867
Balci H, Genc H, Papila C, Can G, Papila B, Yanardag H, Uzun H (2012) Serum
lipid hydroperoxide levels and paraoxonase activity in patients with lung,
breast, and colorectal cancer. J Clin Lab Anal 26: 155 – 160
Benjamini Y, Hochberg Y (1995) Controlling the false discovery rate – a
practical and powerful approach to multiple testing. J Roy Stat Soc B Met
57: 289 – 300
Bock T, Bausch-Fluck D, Hofmann A, Wollscheid B (2012) CD proteome and
beyond – technologies for targeting the immune cell surfaceome. Front
Biosci 17: 1599 – 1612
Bode JG, Albrecht U, Haussinger D, Heinrich PC, Schaper F (2012) Hepatic
acute phase proteins–regulation by IL-6- and IL-1-type cytokines involving
STAT3 and its crosstalk with NF-kappaB-dependent signaling. Eur J Cell
Biol 91: 496 – 505
Booth RA (2007) Minimally invasive biomarkers for detection and staging of
colorectal cancer. Cancer Lett 249: 87 – 96
Brenner H, Chang-Claude J, Seiler CM, Sturmer T, Hoffmeister M (2006) Does
a negative screening colonoscopy ever need to be repeated? Gut 55:
1145 – 1150
Brenner H, Chang-Claude J, Seiler CM, Sturmer T, Hoffmeister M (2007)
Case-control study supports extension of surveillance interval after
colonoscopic polypectomy to at least 5 year. Am J Gastroenterol 102:
1739 – 1744
Brenner H, Haug U, Hundt S (2010) Inter-test agreement and quantitative
cross-validation of immunochromatographical fecal occult blood tests. Int
J Cancer 127: 1643 – 1649
Bretthauer M (2011) Colorectal cancer screening. J Intern Med 270: 87 – 98
Bujanda L, Sarasqueta C, Cosme A, Hijona E, Enriquez-Navascues JM, Placer
C, Villarreal E, Herreros-Villanueva M, Giraldez MD, Gironella M et al
(2013) Evaluation of alpha 1-antitrypsin and the levels of mRNA
expression of matrix metalloproteinase 7, urokinase type plasminogen
activator receptor and COX-2 for the diagnosis of colorectal cancer. PLoS
ONE 8: e51810
Bulbuller N, Eren E, Ellidag HY, Oner OZ, Sezer C, Aydin O, Yilmaz N (2013)
Diagnostic value of thiols, paraoxonase 1, arylesterase and oxidative
balance in colorectal cancer in human. Neoplasma 60: 419 – 424
Cancer Genome Atlas N (2012) Comprehensive molecular characterization of
human colon and rectal cancer. Nature 487: 330 – 337
Carr SA, Abbatiello SE, Ackermann BL, Borchers C, Domon B, Deutsch EW,
Grant RP, Hoofnagle AN, Hüttenhain R, Koomen JM et al (2014) Targeted
peptide measurements in biology and medicine: best practices for mass
spectrometry-based assay development using a fit-for-purpose approach.
Mol Cell Proteomics 13: 907 – 917
Choi M, Chang CY, Clough T, Broudy D, Killeen T, MacLean B, Vitek O (2014)
MSstats: an R package for statistical analysis of quantitative mass
spectrometry-based proteomic experiments. Bioinformatics 30: 2524 – 2526
The paper explained
ProblemColorectal cancer (CRC) can be effectively cured if detected earlyenough. Nevertheless, current screening procedures lack from insuffi-cient sensitivity and would benefit from a blood-based screening testwith better performance than current tests.
ResultsCirculating protein biomarker candidates were characterized bydiscovery-driven mass spectrometry and profiled by targeted massspectrometry across plasma samples of 519 controls and subjects withCRC. Statistical and computational analyses revealed a five-proteinsignature predicting CRC diagnosis at high accuracy.
ImpactThe newly developed protein biomarker signature holds diagnosticpotential independently or in combination with existing screeningprocedures.
ª 2015 The Authors EMBO Molecular Medicine Vol 7 | No 9 | 2015
Silvia Surinova et al Prediction of colorectal cancer diagnosis EMBO Molecular Medicine
1177
Published online: August 7, 2015
Cleveland WS, Grosse E, Shyu MJ (1992) Local Regression Models. In
Statistical Models in S, Chambers JM, Hastie T (eds), pp 309 – 376.
New York: Chapman and Hall
Efron B, Tibshirani R (1993) An Introduction to the Bootstrap. New York:
Chapman and Hall
Farrah T, Deutsch EW, Kreisberg R, Sun Z, Campbell DS, Mendoza L,
Kusebauch U, Brusniak MY, Hüttenhain R, Schiess R et al (2012) PASSEL:
the peptideAtlas SRMexperiment library. Proteomics 12: 1170 – 1175
Haab BB, Geierstanger BH, Michailidis G, Vitzthum F, Forrester S, Okon R,
Saviranta P, Brinker A, Sorette M, Perlee L et al (2005) Immunoassay and
antibody microarray analysis of the HUPO Plasma Proteome Project
reference specimens: systematic variation between sample types and
calibration of mass spectrometry data. Proteomics 5: 3278 – 3291
Hadler-Olsen E, Winberg JO, Uhlin-Hansen L (2013) Matrix metalloproteinases
in cancer: their value as diagnostic and prognostic markers and
therapeutic targets. Tumour Biol 34: 2041 – 2051
Hanahan D, Weinberg RA (2011) Hallmarks of cancer: the next generation.
Cell 144: 646 – 674
Holten-Andersen MN, Christensen IJ, Nielsen HJ, Stephens RW, Jensen V,
Nielsen OH, Sorensen S, Overgaard J, Lilja H, Harris A et al (2002) Total
levels of tissue inhibitor of metalloproteinases 1 in plasma yield high
diagnostic sensitivity and specificity in patients with colon cancer. Clin
Cancer Res 8: 156 – 164
Hortin GL, Sviridov D, Anderson NL (2008) High-abundance polypeptides of
the human plasma proteome comprising the top 4 logs of polypeptide
abundance. Clin Chem 54: 1608 – 1616
Hundt S, Haug U, Brenner H (2009) Comparative evaluation of
immunochemical fecal occult blood tests for colorectal adenoma
detection. Ann Intern Med 150: 162 – 169
Kapidzic A, Grobbee EJ, Hol L, van Roon AH, van Vuuren AJ, Spijker W, Izelaar
K, van Ballegooijen M, Kuipers EJ, van Leerdam ME (2014) Attendance and
yield over three rounds of population-based fecal immunochemical test
screening. Am J Gastroenterol 109: 1257 – 1264
Keller A, Nesvizhskii AI, Kolker E, Aebersold R (2002) Empirical statistical
model to estimate the accuracy of peptide identifications made by MS/MS
and database search. Anal Chem 74: 5383 – 5392
Ladd JJ, Busald T, Johnson MM, Zhang Q, Pitteri SJ, Wang H, Brenner DE, Lampe
PD, Kucherlapati R, Feng Z et al (2012) Increased plasma levels of the
APC-interacting protein MAPRE1, LRG1, and IGFBP2 preceding a diagnosis of
colorectal cancer in women. Cancer Prev Res 5: 655 – 664
Li G, Fridman R, Kim HR (1999) Tissue inhibitor of metalloproteinase-1 inhibits
apoptosis of human breast epithelial cells. Cancer Res 59: 6267 – 6275
Locker GY, Hamilton S, Harris J, Jessup JM, Kemeny N, Macdonald JS,
Somerfield MR, Hayes DF, Bast RC (2006) ASCO 2006 update of
recommendations for the use of tumor markers in gastrointestinal cancer.
J Clin Oncol 24: 5313 – 5327
MacLean B, Tomazela DM, Shulman N, Chambers M, Finney GL, Frewen B,
Kern R, Tabb DL, Liebler DC, MacCoss MJ (2010) Skyline: an open source
document editor for creating and analyzing targeted proteomics
experiments. Bioinformatics 26: 966 – 968
Nesvizhskii AI, Keller A, Kolker E, Aebersold R (2003) A statistical model for
identifying proteins by tandem mass spectrometry. Anal Chem 75:
4646 – 4658
Polanski M, Anderson NL (2007) A list of candidate cancer biomarkers for
targeted proteomics. Biomark Insights 1: 1 – 48
Roth J (2002) Protein N-glycosylation along the secretory pathway:
relationship to organelle topography and function, protein quality control,
and cell interactions. Chem Rev 102: 285 – 303
Schiess R, Wollscheid B, Aebersold R (2009) Targeted proteomic strategy for
clinical biomarker discovery. Mol Oncol 3: 33 –44
Smyth GK, Speed T (2003) Normalization of cDNA microarray data. Methods
31: 265 – 273
Sobin LH (2003) TNM: evolution and relation to other prognostic factors.
Semin Surg Oncol 21: 3 – 7
Sturm M, Bertsch A, Gropl C, Hildebrandt A, Hussong R, Lange E, Pfeifer N,
Schulz-Trieglaff O, Zerck A, Reinert K et al (2008) OpenMS – an open-source
software framework for mass spectrometry. BMC Bioinformatics 9: 163
Surinova S, Radová L, Choi M, Srovnal J, Brenner H, Vitek O, Hajdúch M,
Aebersold R (2015) Non-invasive prognostic protein biomarker
signatures associated with colorectal cancer. EMBO Mol Med 7:
1153 – 1165
Tao S, Haug U, Kuhn K, Brenner H (2012) Comparison and combination of
blood-based inflammatory markers with faecal occult blood tests for non-
invasive colorectal cancer screening. Br J Cancer 106: 1424 – 1430
Walker C, Gray BN (1983) Acute-phase reactant proteins and
carcinoembryonic antigen in cancer of the colon and rectum. Cancer 52:
150 – 154
Wang X, Abraham S, McKenzie JA, Jeffs N, Swire M, Tripathi VB, Luhmann UF,
Lange CA, Zhai Z, Arthur HM et al (2013) LRG1 promotes angiogenesis by
modulating endothelial TGF-beta signalling. Nature 499: 306 – 311
Weisser H, Nahnsen S, Grossmann J, Nilse L, Quandt A, Brauer H, Sturm M,
Kenar E, Kohlbacher O, Aebersold R et al (2013) An automated pipeline for
high-throughput label-free quantitative proteomics. J Proteome Res 12:
1628 – 1644
Zhang H, Li XJ, Martin DB, Aebersold R (2003) Identification and
quantification of N-linked glycoproteins using hydrazide chemistry, stable
isotope labeling and mass spectrometry. Nat Biotechnol 21: 660 – 666
Zhang H, Liu AY, Loriaux P, Wollscheid B, Zhou Y, Watts JD, Aebersold R
(2007) Mass spectrometric detection of tissue proteins in plasma. Mol Cell
Proteomics 6: 64 – 71
License: This is an open access article under the
terms of the Creative Commons Attribution 4.0
License, which permits use, distribution and reproduc-
tion in any medium, provided the original work is
properly cited.
EMBO Molecular Medicine Vol 7 | No 9 | 2015 ª 2015 The Authors
EMBO Molecular Medicine Prediction of colorectal cancer diagnosis Silvia Surinova et al
1178
Published online: August 7, 2015


![Welcome! [] · 2020. 1. 23. · Pathological diagnosis –Macroscopic assessment and grossing Colorectal surgical specimen Colorectal tissue slices The specimen is cut serially into](https://img.pdfslide.us/doc/110x75/61383f2e0ad5d206764923ab/welcome-2020-1-23-pathological-diagnosis-amacroscopic-assessment-and.jpg)


![DIGEST DIAGNOSIS THROUGH INVESTIGATION OF GASTROESOPHAGEAL SYMPTOMS COLORECTAL CANCER LEARNING PROGRAM [COPY] Colorectal Cancer [LOGO] RXD Takeda](https://img.pdfslide.us/doc/110x75/5a4d1bad7f8b9ab0599cb502/digest-diagnosis-through-investigation-of-gastroesophageal-symptoms-colorectal-cancer.jpg)