Embed Size (px)
Citation preview
This is the Accepted Manuscript of an article published by Elsevier in JOURNAL OF MANUFACTURING PROCESSES on Vol. 33, June 2018, 228-237
available at https://doi.org/10.1016/j.jmapro.2018.05.019 © 2018. This manuscript version is made available under the CC-BY-NC-ND 4.0 license
http://creativecommons.org/licenses/by-nc-nd/4.0/
Prediction and validation of shape distortions in the simulation of high pressure die casting
Eva Anglada a, *, Antton Meléndez a, Iban Vicario a, Jon Kepa Idoiaga b, Aitz Mugarza b, Ernesto Arratibel c
a TECNALIA. Industry and Transport Division. Mikeletegi Pasealekua, 2. Donostia – San Sebastián E-20009, Spain b Lebario Precision Moulds. Arbisola auzoa, 4, Izurza E-48213, Spain c Fundiciones Inyectadas Alavesas. La Haya, 12, Nanclares de la Oca E-01230, Spain
ABSTRACT
The use of the thermomechanical simulation is very infrequent in the metal casting industry although the associated results are really useful for the manufacturing process. The main reasons are the complexity, the long calculation times and the difficulties to interpret the results.
The parts manufactured by metal casting processes cool from its filling temperature to ambient, which causes a certain stress-strain state. Although the stress levels might be significant, the main worry of the foundrymen is usually the shape distortion. That is, the mismatches between the desired dimensions and the real ones. The problem is that the results obtained from numerical simulation are not directly useful to cover this industrial necessity.
This work presents the prediction obtained using the thermomechanical simulation for the final dimensions of a component manufactured in aluminium alloy by high pressure die casting (HPDC) and its validation with the final dimensions of the manufactured component. The methodology established to forecast the mismatches with the reference geometry is also detailed, as it may be useful to encourage the use of this type of simulation in the metal casting industry.
Keywords: Numerical simulation; finite elements; thermal stress; shape distortion; HPDC; aluminum alloy
* Corresponding author: Eva Anglada Phone number: +34 667119553 Email address: [email protected]
2
1. INTRODUCTION
The numerical simulation is a technology quite extended at the metal casting industry, although the typical use is restricted to the thermal-flow problem. That is, the coupled analysis of the laws of fluid dynamics which governs the cavity filling, see reference [1], combined with the heat transfer analysis that directs the solidification and the cooling process, see reference [2].
The inclusion of the thermomechanical analysis in the numerical simulation is very infrequent in the metal casting industry, although the associated results are really useful for the manufacturing process. The main reasons are the drastic increment in calculation times, the complexity of the correct set-up of the simulation and the difficulty of the results interpretation.
The components manufactured by the different metal casting processes experience a cooling process from its filling temperature to ambient temperature. This cooling causes the component contraction. This contraction does not occur uniformly along the whole component due to the existent thermal gradient in it, the mould presence, etc. causing a certain distribution of stresses and strains along the component, see references [3,4]. Although these stress levels might be significant and may cause problems as hot tearing, see reference [5], one of the main worry of the foundrymen is usually the shape distortion. That is, the differences between the desired dimensions and the real ones of the manufactured part. In cases where the differences are notable, it may cause the rejection of the component.
The mould is also subjected to thermal gradients and as consequence to thermal stresses and strains. The moulds manufactured in relatively weak materials usually suffers cracks and breaks during the cooling process of the part, as it is the case of the sand casting and the investment casting. In cases where the mould material is strong, as for example in high pressure die casting (HPDC), some strains and displacements may happen but they are less significant than those that take place in the component. The main reason is the combination of higher strength and lower thermal gradients compared with the component.
To obtain trustworthy simulations of the metal casting processes is not a trivial task. The origin of the thermal stresses and strains is the thermal history suffered by the component and/or the mould. So, in order to achieve a reliable prediction of the thermomechanical behaviour is essential to obtain an accurate thermal prediction. The use of the appropriate values for the model parameters is required. These parameters, when the analysis is limited to the thermal behaviour, are the material properties, the heat transfer coefficients and the boundary conditions. The determination of these values is always difficult, especially in cases as the HPDC, where the high process temperatures are combined with fast fillings and the continuous manufacturing process based on consecutive cycles. These difficulties are increased when the thermomechanical analysis is included in the simulation. In this case, it is also needed assign the appropriate material model, the correct mechanical boundary conditions and of course the suitable material properties relative to the mechanical behaviour.
Nevertheless, the difficulty does not end with the obtaining of an accurate thermomechanical simulation. The results analysis is another aspect that must be considered. The results obtained from numerical simulation are traditionally the corresponding to the stresses, strains and displacements. But these results do not cover directly the necessity of the foundrymen of predicting the mismatches with the reference geometry.
In order to facilitate the application of the thermomechanical simulation in the metal casting industry, it is interesting to study alternatives to avoid some of these difficulties. In the work presented hereafter. The validation of the thermomechanical simulation to predict the final shape of a component manufactured by HPDC has been tackled together with the development of a methodology that makes results interpretation easier according to the foundrymen necessities.
3
2. METHODOLOGY
2.1. Thermal simulation
Thermal stresses are caused by the thermal gradient suffered by the parts, so the accurate thermal simulation is essential to achieve a reliable thermomechanical simulation.
The reliable thermal simulation of the HPDC process is a tricky problem. The moulds are usually complex, formed by fixed and movable plates, cores, tempering channels, cooling channels, etc. The manufacturing process is continuous, based on consecutive cycles, which must be taken into account in the simulation due to they are very related with the thermal stabilization of the mould. At the beginning of the HPDC process the mould is usually too cold, this causes the alloy freezing during the injection preventing the cavity filling. The successive cycles go heating the mould but while it is not heat enough the part quality will not be assured. Porosity or surface defects may happen. Notice that mould thermal stabilization does not mean uniform or constant temperature, a thermal gradient exists along the mould which also varies during the cycle phases. Moreover, different machine parameters must be taken into account as the furnace temperature, the pouring process into the container, the piston velocities, etc. The alloy fills the cavity at very high velocities and is subjected to very fast cooling rates. The part geometries usually are complex with very thin sections. All of these difficulties make patent the challenge associated with this type of numerical simulation.
Obviously, the appropriate assignment of all these values is a requirement to obtain reliable results. Some of them are easily obtained as the cycle times or the furnace temperature but others as the materials properties or the heat transfer coefficients are much difficult to obtain experimentally. The traditional solution for these unknown values is to employ bibliography data but their availability is limited and moreover they usually correspond to standard average values. One alternative that makes possible to adjust the simulation models avoiding these difficulties is the use of inverse methods.
The application of inverse methods to metal casting simulation consist of an iterative procedure that modifies several model parameters until reaching results close enough to the reference measurements. In metal casting processes, the reference measurements correspond to the temperature evolution measured at several controlled points of the mould and/or the cast part. The model parameters subjected to modification are usually those whose value assigned is more uncertain. Inverse methods have been successfully applied to metal casting modelling by different authors, see references [6–11]. This is the methodology which has been followed in this case to adjust the thermal simulation model of the HPDC process. The numerical simulation software used, called ProCAST, is based on the finite element method and is specially focused on metal casting simulation.
2.1.1 Thermal model adjustment
The procedure followed in this case to adjust the model has been made public in reference [12]. For this reason, only a general vision of this process is described here to explain the basis of the adjustment performed. The interested reader may consult the mentioned reference for a more in deep explanation of the adjustment procedure followed.
The model fitting has included the adjustment of the material properties and the boundary conditions, including the heat transfer coefficients. The iterative nature of the adjustment methodology makes very advisable to base the adjustment in simple cases to reduce calculation times. For this reason, the adjustment has been performed in two different phases: the first one is based on one gravity prototype and the second phase is based on one HPDC prototype. The iterative process of adjustment has been executed mostly by means of manual procedures.
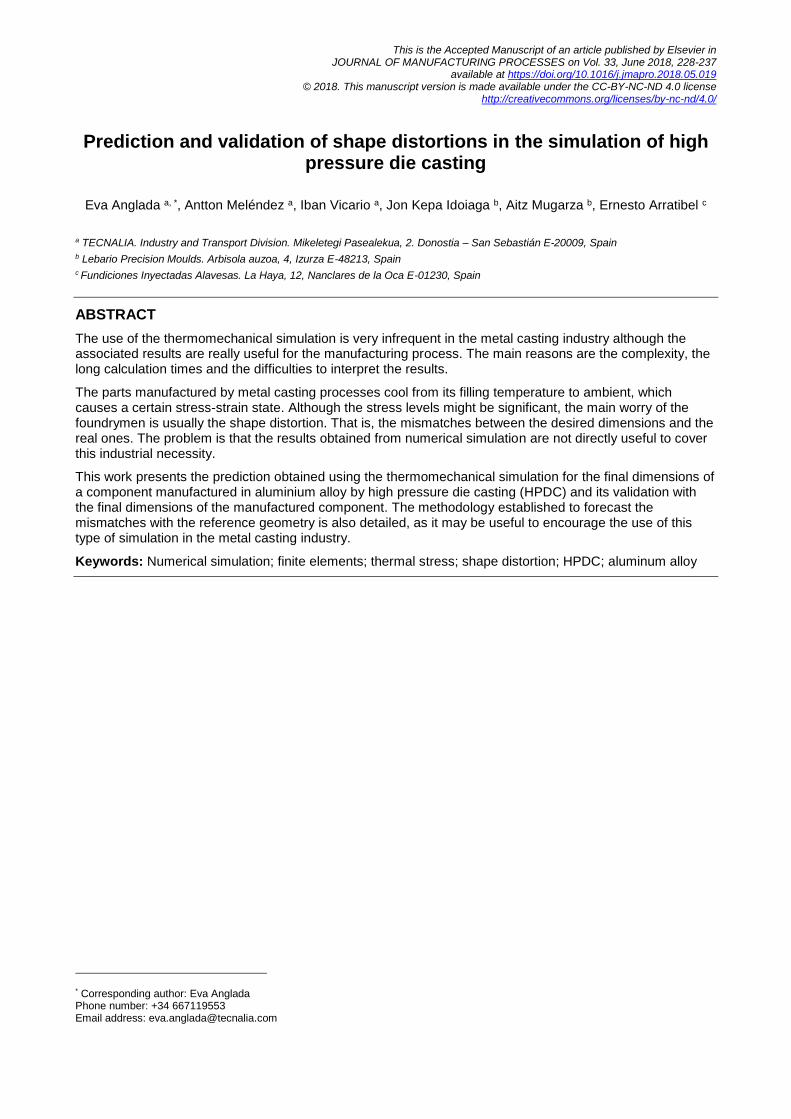
The gravity prototype corresponds to a simple cylindrical geometry (part ∅40 mm 200 mm length and 30 mm mould wall), see Fig. 1 left. The mould has been instrumented with two thermocouples type K. These thermocouples make possible to register the temperature into the part and into the mould wall.
In the case of the HPDC prototype the geometry of the mould cavity, which forms the injected part, corresponds also to a cylindrical shape (∅50 mm and 250 mm length). This shape has been completed with a simple die gating system composed by the runner, several gates and a couple of overflows (see Fig. 1 right). The alloy temperature has been measured by means of a thermocouple type K inserted into it. In the
4
case of the mould, a thermography camera has been used to record the temperature distribution along the internal mould face (the interface between the fixed and movable plates of the mould).
Fig. 1. Instrumented gravity mould prototype (left). Plate of the HPDC mould prototype (right)
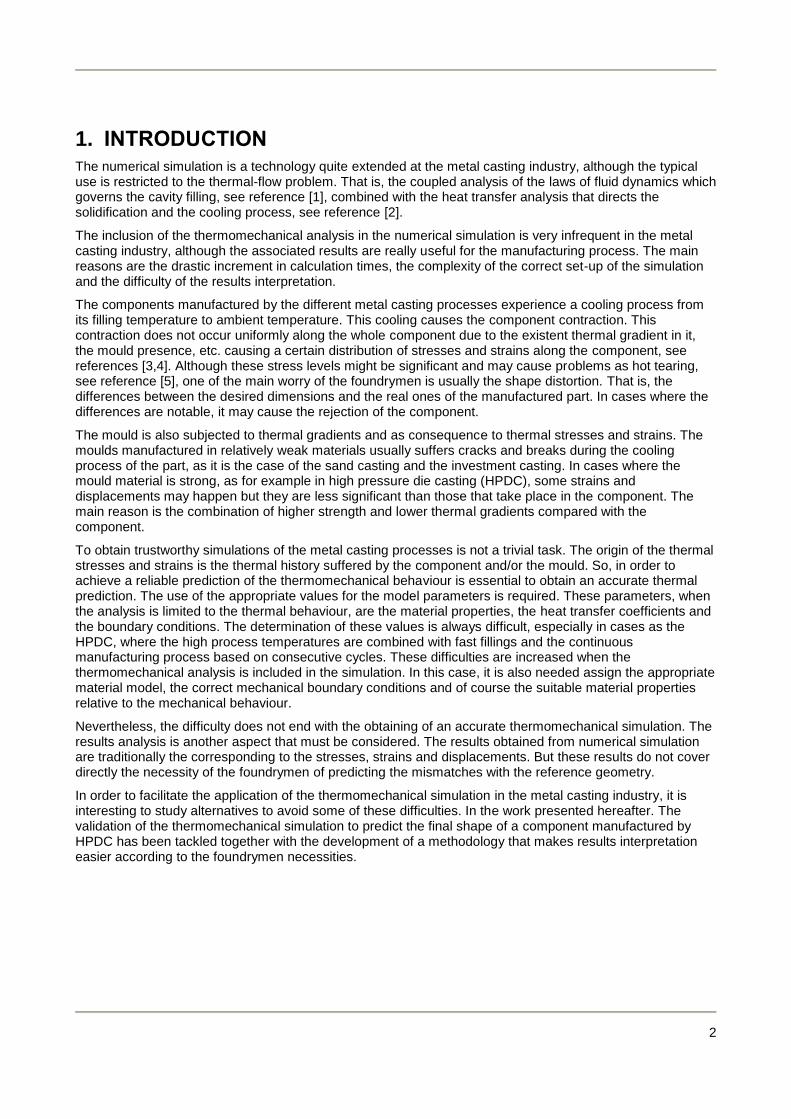
The objective of the first phase of the adjustment, based on the gravity prototype case, has been to adjust the properties of the alloy and mould materials, AlSi9Cu3 and H13 respectively. The variables subjected to modification during the adjustment has been the material properties of the alloy and the mold (thermal conductivity, specific heat, density and in the alloy case the solid fraction curve), the heat transfer coefficient between them, and the convection coefficient with the ambient.
The material properties used for the alloy and for the mould are temperature dependant. The initial properties used for the alloy have been extracted from the thermodynamic database provided by ProCAST assuming the Scheil micro-segregation model and the typical composition of the alloy AlSi9Cu3. The material properties initially used for the steel H13 were also extracted from the ProCAST database. The range of variation for the value of the heat transfer coefficient between the alloy and the mould has been estimated between 100 W/m2K and 2000 W/m2K. The cooling of the mould has been caused mainly by convection to the environment. The convection coefficient was defined between 0 W/m2K and 30 W/m2K, the typical values for free air convection following reference [13].
Fig. 2 shows the comparison between simulation results (dotted lines) and the average curves calculated from experimental measurements (continuous lines). As can be observed the results obtained after the adjustment fit well with experimental curves improving drastically the results obtained prior the adjustment.
Fig. 2. Experimental measurements vs simulation results. Prior the adjustment (left) and once adjusted (right)
The objective of the second phase of the adjustment has been to find the final adjustment of the HPDC model, including the adjusted material properties and boundary conditions. The material properties previously obtained in the adjustment of the gravity prototype have been directly included in the HPDC
5
simulation model and maintained fixed. So, in this model, the adjustment is restricted to the boundary conditions and heat transfer coefficients. The range of variation for the value of the heat transfer coefficient between the alloy and the mould has been estimated between 400 W/m2K and 50000 W/m2K.
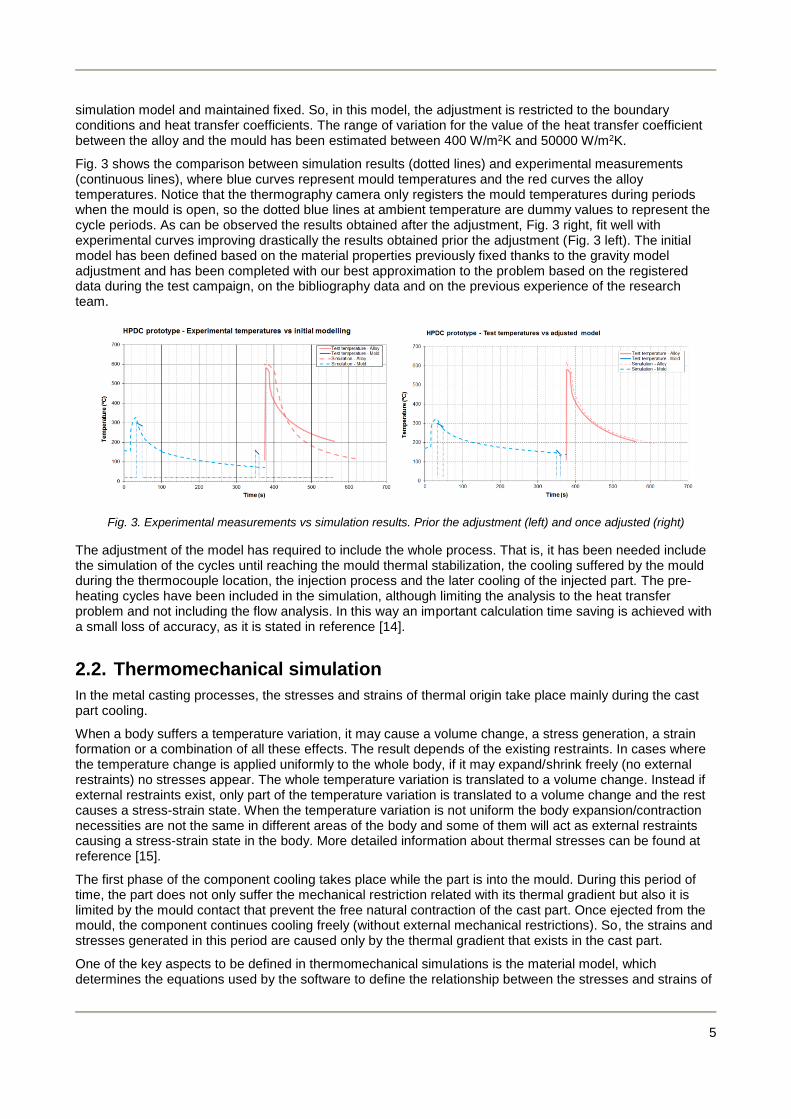
Fig. 3 shows the comparison between simulation results (dotted lines) and experimental measurements (continuous lines), where blue curves represent mould temperatures and the red curves the alloy temperatures. Notice that the thermography camera only registers the mould temperatures during periods when the mould is open, so the dotted blue lines at ambient temperature are dummy values to represent the cycle periods. As can be observed the results obtained after the adjustment, Fig. 3 right, fit well with experimental curves improving drastically the results obtained prior the adjustment (Fig. 3 left). The initial model has been defined based on the material properties previously fixed thanks to the gravity model adjustment and has been completed with our best approximation to the problem based on the registered data during the test campaign, on the bibliography data and on the previous experience of the research team.
Fig. 3. Experimental measurements vs simulation results. Prior the adjustment (left) and once adjusted (right)
The adjustment of the model has required to include the whole process. That is, it has been needed include the simulation of the cycles until reaching the mould thermal stabilization, the cooling suffered by the mould during the thermocouple location, the injection process and the later cooling of the injected part. The pre-heating cycles have been included in the simulation, although limiting the analysis to the heat transfer problem and not including the flow analysis. In this way an important calculation time saving is achieved with a small loss of accuracy, as it is stated in reference [14].
2.2. Thermomechanical simulation
In the metal casting processes, the stresses and strains of thermal origin take place mainly during the cast part cooling.
When a body suffers a temperature variation, it may cause a volume change, a stress generation, a strain formation or a combination of all these effects. The result depends of the existing restraints. In cases where the temperature change is applied uniformly to the whole body, if it may expand/shrink freely (no external restraints) no stresses appear. The whole temperature variation is translated to a volume change. Instead if external restraints exist, only part of the temperature variation is translated to a volume change and the rest causes a stress-strain state. When the temperature variation is not uniform the body expansion/contraction necessities are not the same in different areas of the body and some of them will act as external restraints causing a stress-strain state in the body. More detailed information about thermal stresses can be found at reference [15].
The first phase of the component cooling takes place while the part is into the mould. During this period of time, the part does not only suffer the mechanical restriction related with its thermal gradient but also it is limited by the mould contact that prevent the free natural contraction of the cast part. Once ejected from the mould, the component continues cooling freely (without external mechanical restrictions). So, the strains and stresses generated in this period are caused only by the thermal gradient that exists in the cast part.
One of the key aspects to be defined in thermomechanical simulations is the material model, which determines the equations used by the software to define the relationship between the stresses and strains of
6
the material. Different material models exists, see reference [16]. As more complex is the material model, more realistic is usually the representation of the material behaviour but the complexity of the calculation is clearly increased together with the calculation times. The four material models most used in metal casting simulation are the rigid, the vacant, the linear elastic and the elastoplastic.
The rigid and vacant are material models very simplified that do not permit the calculation of the stresses and strains distribution, but may be very useful to reduce calculation times. The rigid model assumes a purely rigid material, so it is not subjected to stresses or strains but may be used as a restraint for other bodies. In the same way the vacant model, assumes a material behaviour weak enough to not block the displacement of the neighbouring bodies.
In those cases where the focus of the thermomechanical analysis is the cast part, and the resistance of the mould is much lower than the component resistance, for example sand casting or investment casting, the mould may be assumed as vacant. On the other side, when the mould resistance is much higher than the cast part, for example in HPDC, the mould may be considered as rigid.
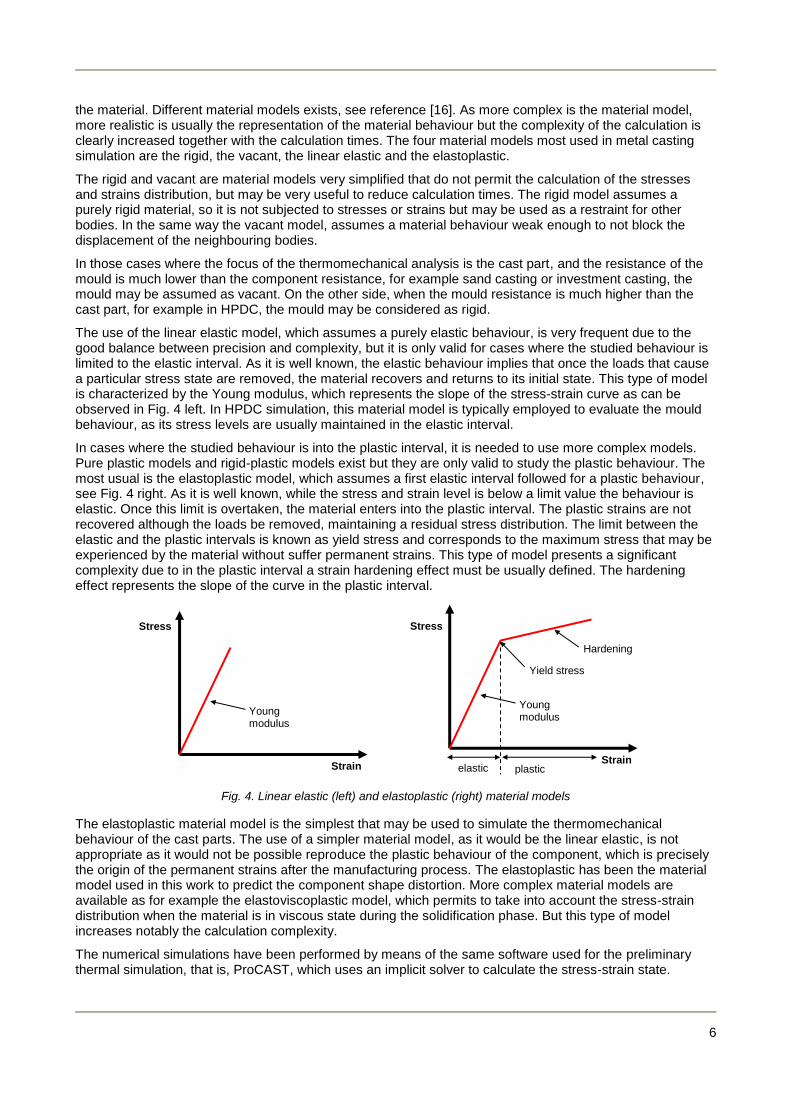
The use of the linear elastic model, which assumes a purely elastic behaviour, is very frequent due to the good balance between precision and complexity, but it is only valid for cases where the studied behaviour is limited to the elastic interval. As it is well known, the elastic behaviour implies that once the loads that cause a particular stress state are removed, the material recovers and returns to its initial state. This type of model is characterized by the Young modulus, which represents the slope of the stress-strain curve as can be observed in Fig. 4 left. In HPDC simulation, this material model is typically employed to evaluate the mould behaviour, as its stress levels are usually maintained in the elastic interval.
In cases where the studied behaviour is into the plastic interval, it is needed to use more complex models. Pure plastic models and rigid-plastic models exist but they are only valid to study the plastic behaviour. The most usual is the elastoplastic model, which assumes a first elastic interval followed for a plastic behaviour, see Fig. 4 right. As it is well known, while the stress and strain level is below a limit value the behaviour is elastic. Once this limit is overtaken, the material enters into the plastic interval. The plastic strains are not recovered although the loads be removed, maintaining a residual stress distribution. The limit between the elastic and the plastic intervals is known as yield stress and corresponds to the maximum stress that may be experienced by the material without suffer permanent strains. This type of model presents a significant complexity due to in the plastic interval a strain hardening effect must be usually defined. The hardening effect represents the slope of the curve in the plastic interval.
Fig. 4. Linear elastic (left) and elastoplastic (right) material models
The elastoplastic material model is the simplest that may be used to simulate the thermomechanical behaviour of the cast parts. The use of a simpler material model, as it would be the linear elastic, is not appropriate as it would not be possible reproduce the plastic behaviour of the component, which is precisely the origin of the permanent strains after the manufacturing process. The elastoplastic has been the material model used in this work to predict the component shape distortion. More complex material models are available as for example the elastoviscoplastic model, which permits to take into account the stress-strain distribution when the material is in viscous state during the solidification phase. But this type of model increases notably the calculation complexity.
The numerical simulations have been performed by means of the same software used for the preliminary thermal simulation, that is, ProCAST, which uses an implicit solver to calculate the stress-strain state.
Strain
Stress
Young modulus
Strain
Stress
Young modulus
Yield stress
Hardening
elastic plastic
7
2.3. Results analysis
The methodology used at advanced metal casting industries for the dimensional validation of the manufactured parts consists in the calculation of the mismatches (distance expressed in length units) between the manufactured part and the geometry of reference. This dimensional analysis is usually performed by means of 3D scanners.
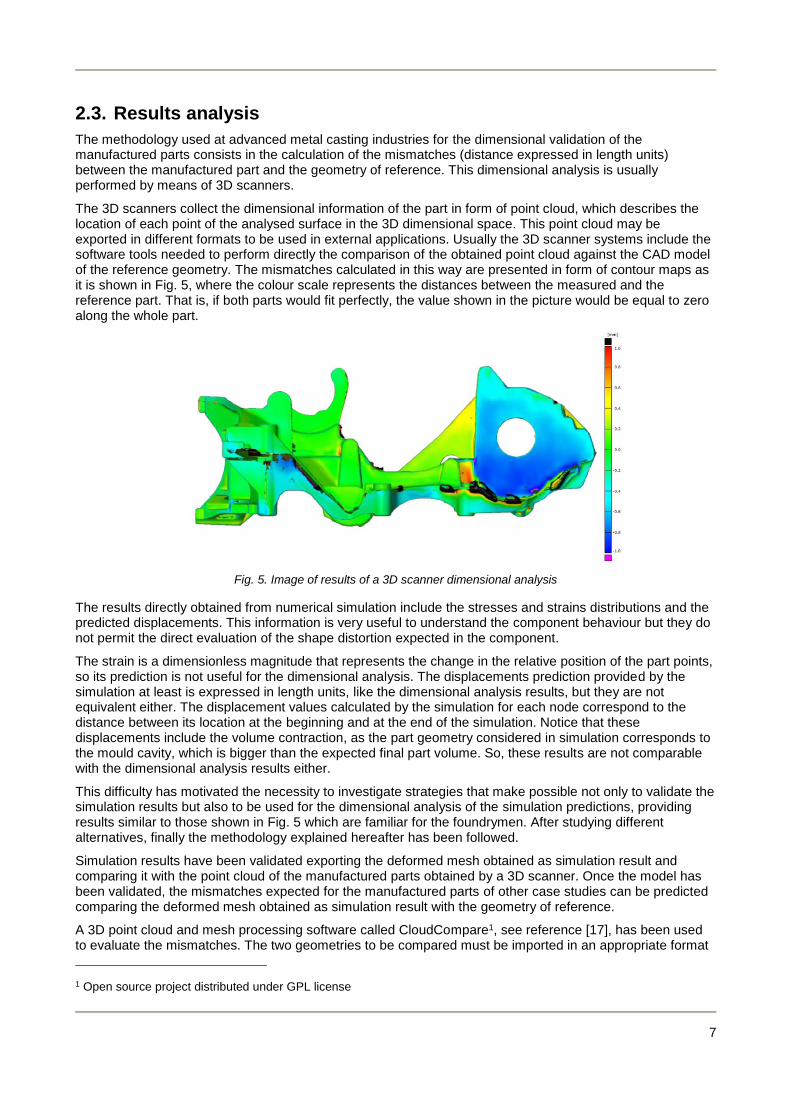
The 3D scanners collect the dimensional information of the part in form of point cloud, which describes the location of each point of the analysed surface in the 3D dimensional space. This point cloud may be exported in different formats to be used in external applications. Usually the 3D scanner systems include the software tools needed to perform directly the comparison of the obtained point cloud against the CAD model of the reference geometry. The mismatches calculated in this way are presented in form of contour maps as it is shown in Fig. 5, where the colour scale represents the distances between the measured and the reference part. That is, if both parts would fit perfectly, the value shown in the picture would be equal to zero along the whole part.
Fig. 5. Image of results of a 3D scanner dimensional analysis
The results directly obtained from numerical simulation include the stresses and strains distributions and the predicted displacements. This information is very useful to understand the component behaviour but they do not permit the direct evaluation of the shape distortion expected in the component.
The strain is a dimensionless magnitude that represents the change in the relative position of the part points, so its prediction is not useful for the dimensional analysis. The displacements prediction provided by the simulation at least is expressed in length units, like the dimensional analysis results, but they are not equivalent either. The displacement values calculated by the simulation for each node correspond to the distance between its location at the beginning and at the end of the simulation. Notice that these displacements include the volume contraction, as the part geometry considered in simulation corresponds to the mould cavity, which is bigger than the expected final part volume. So, these results are not comparable with the dimensional analysis results either.
This difficulty has motivated the necessity to investigate strategies that make possible not only to validate the simulation results but also to be used for the dimensional analysis of the simulation predictions, providing results similar to those shown in Fig. 5 which are familiar for the foundrymen. After studying different alternatives, finally the methodology explained hereafter has been followed.
Simulation results have been validated exporting the deformed mesh obtained as simulation result and comparing it with the point cloud of the manufactured parts obtained by a 3D scanner. Once the model has been validated, the mismatches expected for the manufactured parts of other case studies can be predicted comparing the deformed mesh obtained as simulation result with the geometry of reference.
A 3D point cloud and mesh processing software called CloudCompare1, see reference [17], has been used to evaluate the mismatches. The two geometries to be compared must be imported in an appropriate format
1 Open source project distributed under GPL license
8
(for example, StereoLithography meshes, STL) and converted to a point cloud. In case that the mesh is not enough refined, a new point cloud may be generated over the mesh to increase the discretization level. A preliminary manual alignment of the meshes must be performed before to apply the automatic fine alignment tool available. The software calculates the distances between both point clouds and represents them by means of a colour mapping.
Sometimes the mesh includes not only the component but also the runner system and the overflows. In order to calculate the mismatches, only the mesh of the part is needed, so the rest must be removed. This is for example the case of the deformed mesh obtained as simulation result in this case. This task has been performed by means of an open source and extensible system for the processing and editing of unstructured 3D triangular meshes, similar to, for example the STL meshes used in additive manufacturing, called MeshLab2, see reference [18].
3. DESIGN OF TESTS AND IMPLEMENTATION
Once selected the part to be studied, several samples have been manufactured under controlled conditions and they have been measured by means of a 3D scanner. The thermal simulation followed by the thermomechanical simulation has been performed. Finally, the simulation results have been compared with the experimental measurements.
3.1. Selection and manufacturing of the studied part
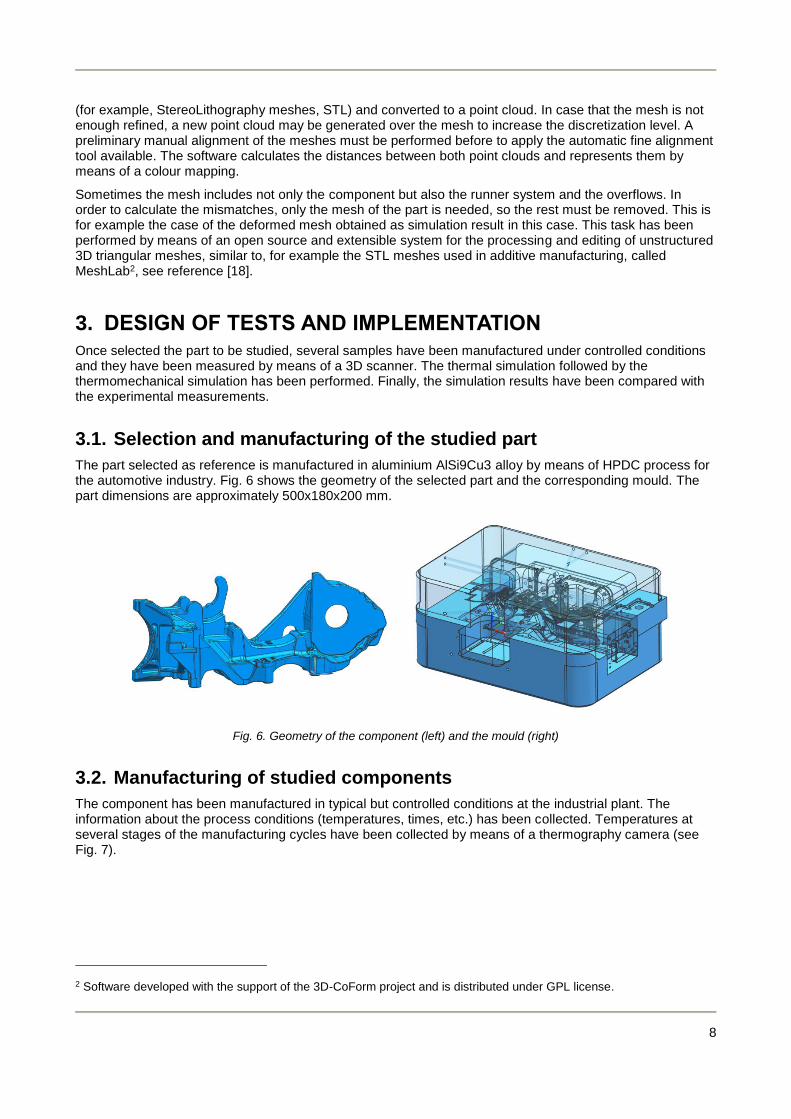
The part selected as reference is manufactured in aluminium AlSi9Cu3 alloy by means of HPDC process for the automotive industry. Fig. 6 shows the geometry of the selected part and the corresponding mould. The part dimensions are approximately 500x180x200 mm.
Fig. 6. Geometry of the component (left) and the mould (right)
3.2. Manufacturing of studied components
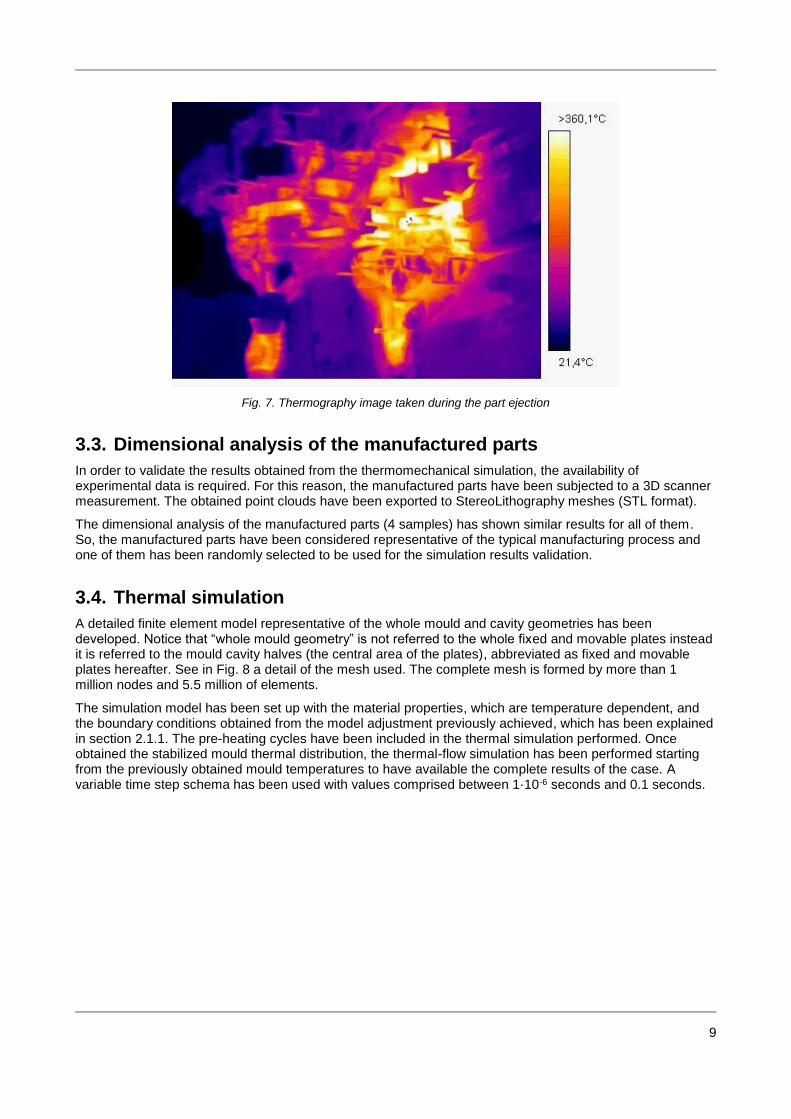
The component has been manufactured in typical but controlled conditions at the industrial plant. The information about the process conditions (temperatures, times, etc.) has been collected. Temperatures at several stages of the manufacturing cycles have been collected by means of a thermography camera (see Fig. 7).
2 Software developed with the support of the 3D-CoForm project and is distributed under GPL license.
9
Fig. 7. Thermography image taken during the part ejection
3.3. Dimensional analysis of the manufactured parts
In order to validate the results obtained from the thermomechanical simulation, the availability of experimental data is required. For this reason, the manufactured parts have been subjected to a 3D scanner measurement. The obtained point clouds have been exported to StereoLithography meshes (STL format).
The dimensional analysis of the manufactured parts (4 samples) has shown similar results for all of them. So, the manufactured parts have been considered representative of the typical manufacturing process and one of them has been randomly selected to be used for the simulation results validation.
3.4. Thermal simulation
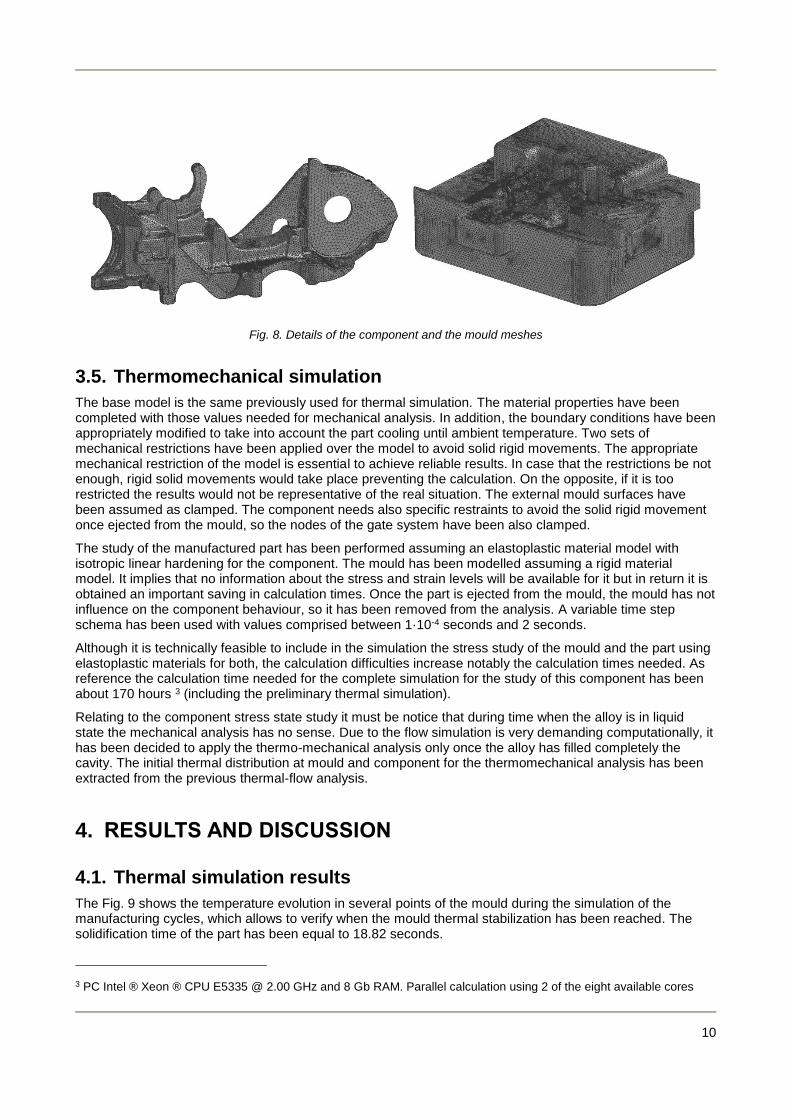
A detailed finite element model representative of the whole mould and cavity geometries has been developed. Notice that “whole mould geometry” is not referred to the whole fixed and movable plates instead it is referred to the mould cavity halves (the central area of the plates), abbreviated as fixed and movable plates hereafter. See in Fig. 8 a detail of the mesh used. The complete mesh is formed by more than 1 million nodes and 5.5 million of elements.
The simulation model has been set up with the material properties, which are temperature dependent, and the boundary conditions obtained from the model adjustment previously achieved, which has been explained in section 2.1.1. The pre-heating cycles have been included in the thermal simulation performed. Once obtained the stabilized mould thermal distribution, the thermal-flow simulation has been performed starting from the previously obtained mould temperatures to have available the complete results of the case. A variable time step schema has been used with values comprised between 1·10-6 seconds and 0.1 seconds.
10
Fig. 8. Details of the component and the mould meshes
3.5. Thermomechanical simulation
The base model is the same previously used for thermal simulation. The material properties have been completed with those values needed for mechanical analysis. In addition, the boundary conditions have been appropriately modified to take into account the part cooling until ambient temperature. Two sets of mechanical restrictions have been applied over the model to avoid solid rigid movements. The appropriate mechanical restriction of the model is essential to achieve reliable results. In case that the restrictions be not enough, rigid solid movements would take place preventing the calculation. On the opposite, if it is too restricted the results would not be representative of the real situation. The external mould surfaces have been assumed as clamped. The component needs also specific restraints to avoid the solid rigid movement once ejected from the mould, so the nodes of the gate system have been also clamped.
The study of the manufactured part has been performed assuming an elastoplastic material model with isotropic linear hardening for the component. The mould has been modelled assuming a rigid material model. It implies that no information about the stress and strain levels will be available for it but in return it is obtained an important saving in calculation times. Once the part is ejected from the mould, the mould has not influence on the component behaviour, so it has been removed from the analysis. A variable time step schema has been used with values comprised between 1·10-4 seconds and 2 seconds.
Although it is technically feasible to include in the simulation the stress study of the mould and the part using elastoplastic materials for both, the calculation difficulties increase notably the calculation times needed. As reference the calculation time needed for the complete simulation for the study of this component has been about 170 hours 3 (including the preliminary thermal simulation).
Relating to the component stress state study it must be notice that during time when the alloy is in liquid state the mechanical analysis has no sense. Due to the flow simulation is very demanding computationally, it has been decided to apply the thermo-mechanical analysis only once the alloy has filled completely the cavity. The initial thermal distribution at mould and component for the thermomechanical analysis has been extracted from the previous thermal-flow analysis.
4. RESULTS AND DISCUSSION
4.1. Thermal simulation results
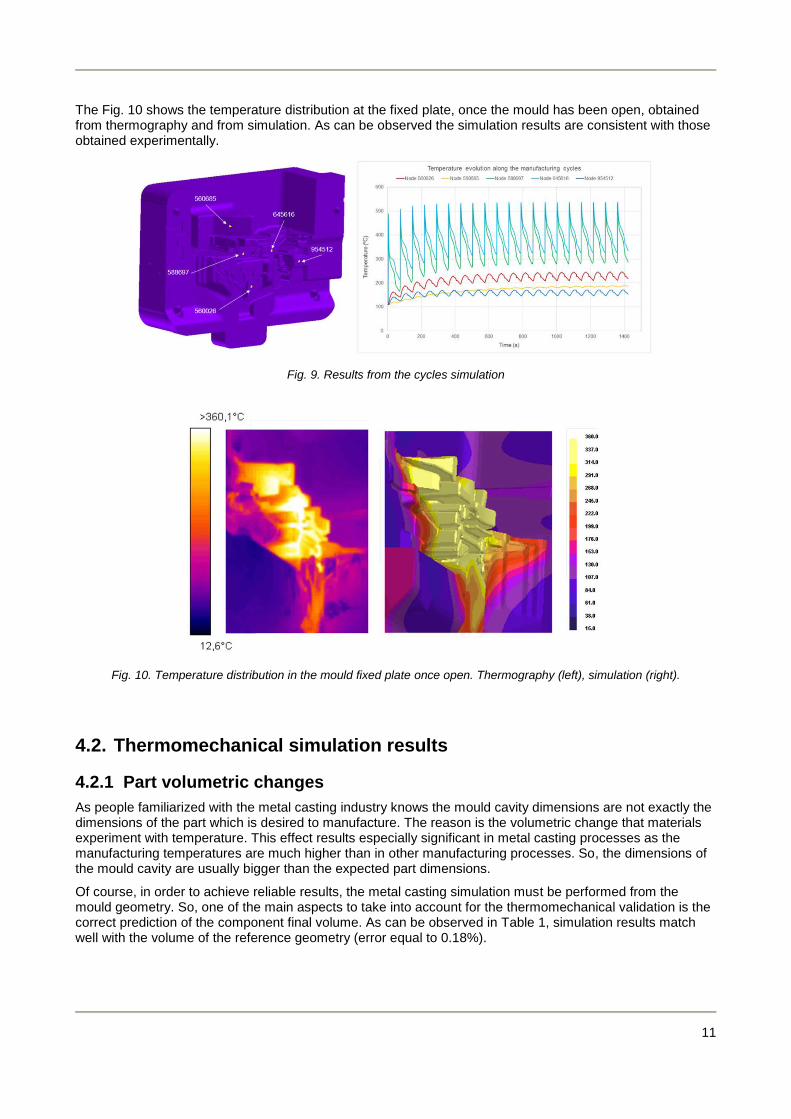
The Fig. 9 shows the temperature evolution in several points of the mould during the simulation of the manufacturing cycles, which allows to verify when the mould thermal stabilization has been reached. The solidification time of the part has been equal to 18.82 seconds.
3 PC Intel ® Xeon ® CPU E5335 @ 2.00 GHz and 8 Gb RAM. Parallel calculation using 2 of the eight available cores
11
The Fig. 10 shows the temperature distribution at the fixed plate, once the mould has been open, obtained from thermography and from simulation. As can be observed the simulation results are consistent with those obtained experimentally.
Fig. 9. Results from the cycles simulation
Fig. 10. Temperature distribution in the mould fixed plate once open. Thermography (left), simulation (right).
4.2. Thermomechanical simulation results
4.2.1 Part volumetric changes
As people familiarized with the metal casting industry knows the mould cavity dimensions are not exactly the dimensions of the part which is desired to manufacture. The reason is the volumetric change that materials experiment with temperature. This effect results especially significant in metal casting processes as the manufacturing temperatures are much higher than in other manufacturing processes. So, the dimensions of the mould cavity are usually bigger than the expected part dimensions.
Of course, in order to achieve reliable results, the metal casting simulation must be performed from the mould geometry. So, one of the main aspects to take into account for the thermomechanical validation is the correct prediction of the component final volume. As can be observed in Table 1, simulation results match well with the volume of the reference geometry (error equal to 0.18%).
12
Table 1. Volumes of the geometries
Model Volume (cm3) Difference relating to
reference geometry (%)
Mould cavity 1.715,00 3,90 %
Final shape (simulation) 1.647,00 -0,18 %
Reference geometry 1.650,00
4.2.2 Dimensional prediction
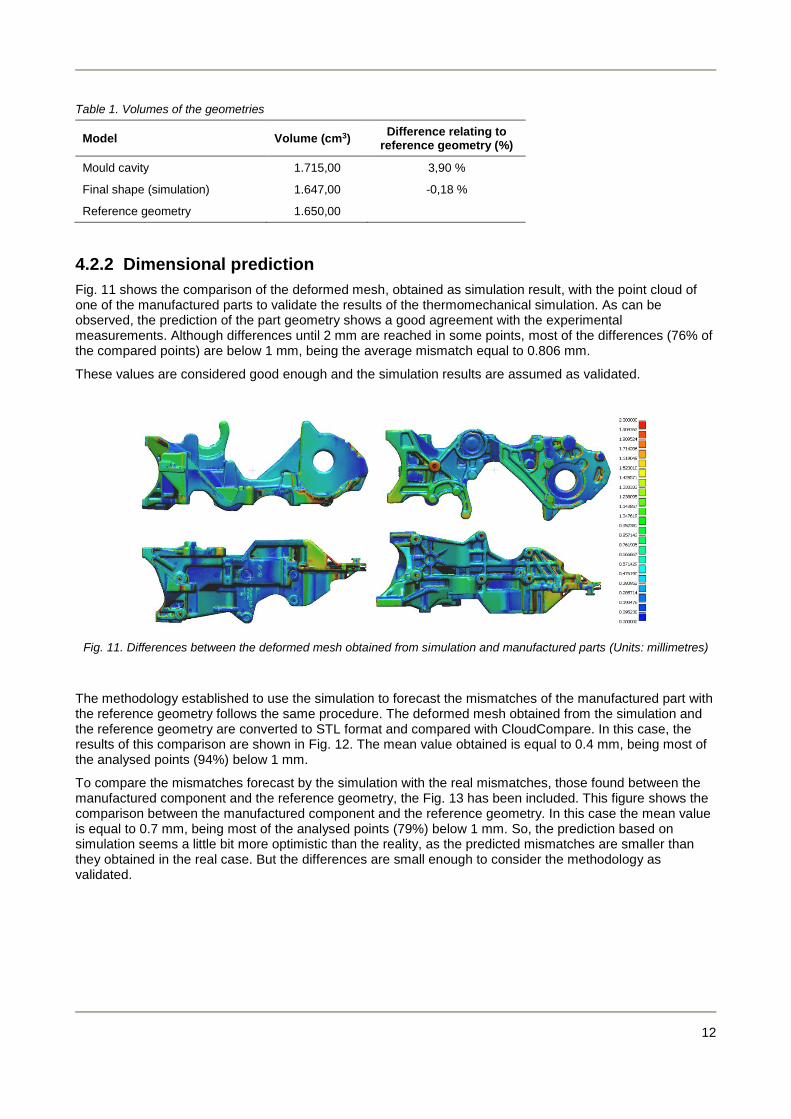
Fig. 11 shows the comparison of the deformed mesh, obtained as simulation result, with the point cloud of one of the manufactured parts to validate the results of the thermomechanical simulation. As can be observed, the prediction of the part geometry shows a good agreement with the experimental measurements. Although differences until 2 mm are reached in some points, most of the differences (76% of the compared points) are below 1 mm, being the average mismatch equal to 0.806 mm.
These values are considered good enough and the simulation results are assumed as validated.
Fig. 11. Differences between the deformed mesh obtained from simulation and manufactured parts (Units: millimetres)
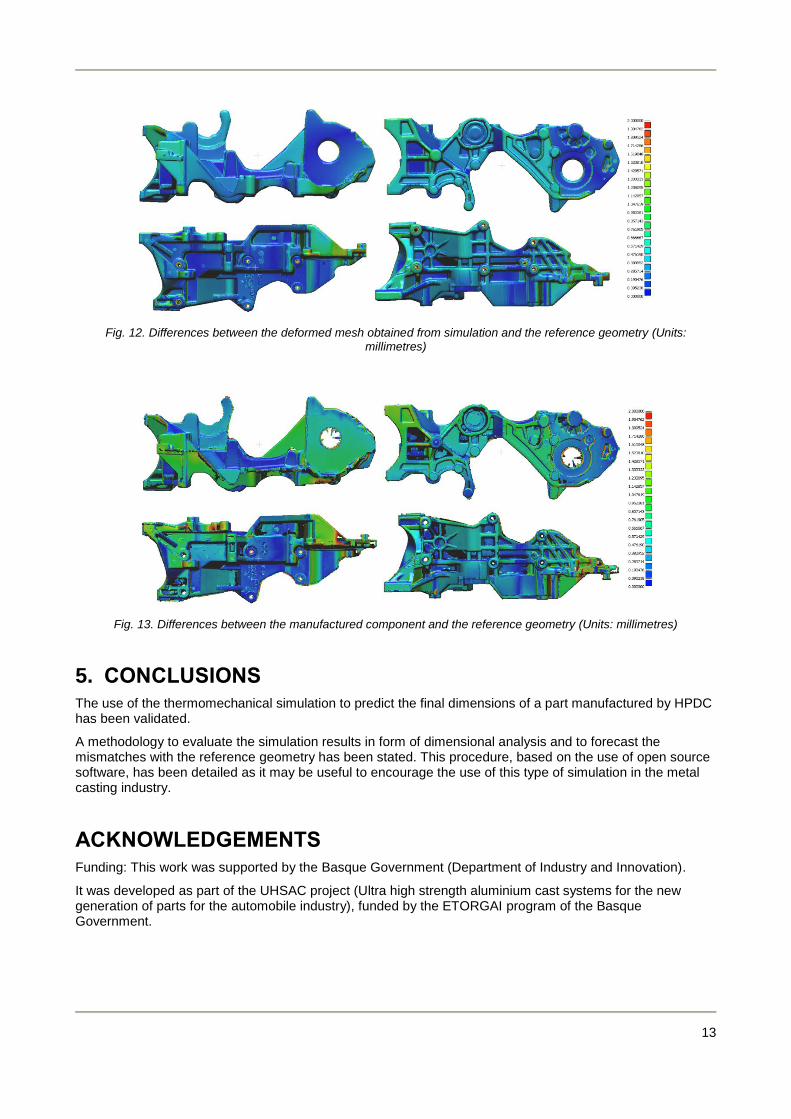
The methodology established to use the simulation to forecast the mismatches of the manufactured part with the reference geometry follows the same procedure. The deformed mesh obtained from the simulation and the reference geometry are converted to STL format and compared with CloudCompare. In this case, the results of this comparison are shown in Fig. 12. The mean value obtained is equal to 0.4 mm, being most of the analysed points (94%) below 1 mm.
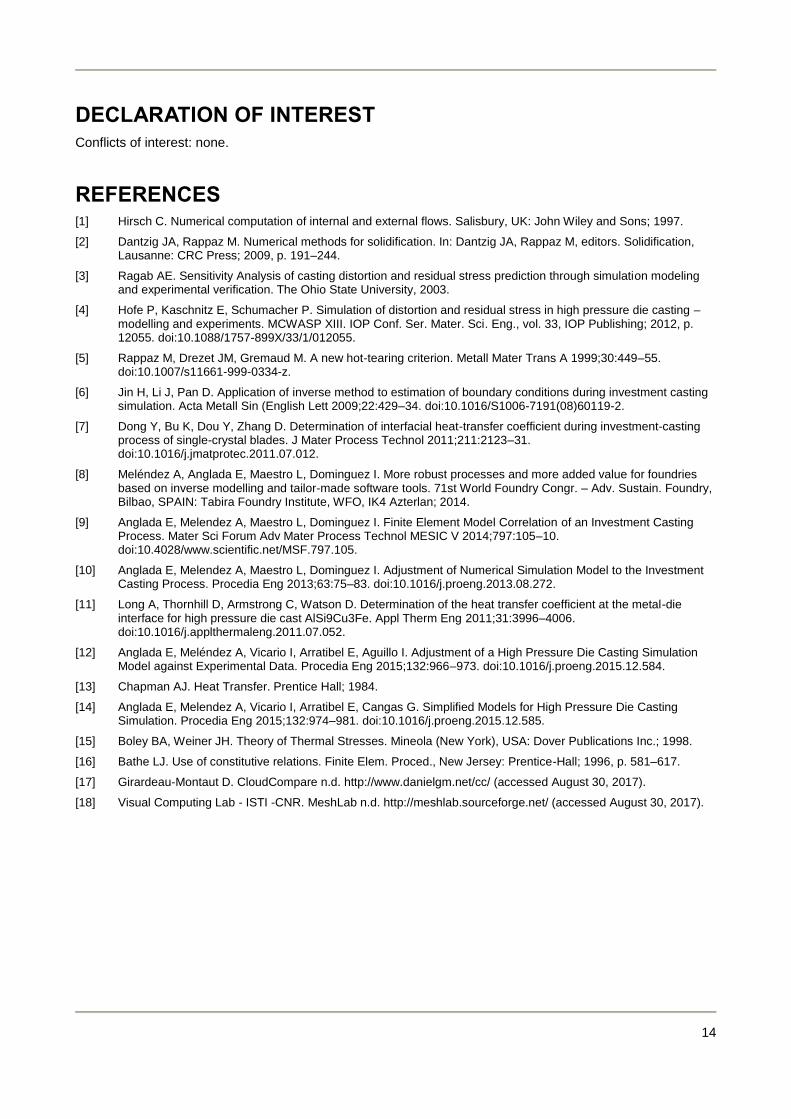
To compare the mismatches forecast by the simulation with the real mismatches, those found between the manufactured component and the reference geometry, the Fig. 13 has been included. This figure shows the comparison between the manufactured component and the reference geometry. In this case the mean value is equal to 0.7 mm, being most of the analysed points (79%) below 1 mm. So, the prediction based on simulation seems a little bit more optimistic than the reality, as the predicted mismatches are smaller than they obtained in the real case. But the differences are small enough to consider the methodology as validated.
13
Fig. 12. Differences between the deformed mesh obtained from simulation and the reference geometry (Units: millimetres)
Fig. 13. Differences between the manufactured component and the reference geometry (Units: millimetres)
5. CONCLUSIONS
The use of the thermomechanical simulation to predict the final dimensions of a part manufactured by HPDC has been validated.
A methodology to evaluate the simulation results in form of dimensional analysis and to forecast the mismatches with the reference geometry has been stated. This procedure, based on the use of open source software, has been detailed as it may be useful to encourage the use of this type of simulation in the metal casting industry.
ACKNOWLEDGEMENTS
Funding: This work was supported by the Basque Government (Department of Industry and Innovation).
It was developed as part of the UHSAC project (Ultra high strength aluminium cast systems for the new generation of parts for the automobile industry), funded by the ETORGAI program of the Basque Government.
14
DECLARATION OF INTEREST
Conflicts of interest: none.
REFERENCES [1] Hirsch C. Numerical computation of internal and external flows. Salisbury, UK: John Wiley and Sons; 1997.
[2] Dantzig JA, Rappaz M. Numerical methods for solidification. In: Dantzig JA, Rappaz M, editors. Solidification, Lausanne: CRC Press; 2009, p. 191–244.
[3] Ragab AE. Sensitivity Analysis of casting distortion and residual stress prediction through simulation modeling and experimental verification. The Ohio State University, 2003.
[4] Hofe P, Kaschnitz E, Schumacher P. Simulation of distortion and residual stress in high pressure die casting – modelling and experiments. MCWASP XIII. IOP Conf. Ser. Mater. Sci. Eng., vol. 33, IOP Publishing; 2012, p. 12055. doi:10.1088/1757-899X/33/1/012055.
[5] Rappaz M, Drezet JM, Gremaud M. A new hot-tearing criterion. Metall Mater Trans A 1999;30:449–55. doi:10.1007/s11661-999-0334-z.
[6] Jin H, Li J, Pan D. Application of inverse method to estimation of boundary conditions during investment casting simulation. Acta Metall Sin (English Lett 2009;22:429–34. doi:10.1016/S1006-7191(08)60119-2.
[7] Dong Y, Bu K, Dou Y, Zhang D. Determination of interfacial heat-transfer coefficient during investment-casting process of single-crystal blades. J Mater Process Technol 2011;211:2123–31. doi:10.1016/j.jmatprotec.2011.07.012.
[8] Meléndez A, Anglada E, Maestro L, Dominguez I. More robust processes and more added value for foundries based on inverse modelling and tailor-made software tools. 71st World Foundry Congr. – Adv. Sustain. Foundry, Bilbao, SPAIN: Tabira Foundry Institute, WFO, IK4 Azterlan; 2014.
[9] Anglada E, Melendez A, Maestro L, Dominguez I. Finite Element Model Correlation of an Investment Casting Process. Mater Sci Forum Adv Mater Process Technol MESIC V 2014;797:105–10. doi:10.4028/www.scientific.net/MSF.797.105.
[10] Anglada E, Melendez A, Maestro L, Dominguez I. Adjustment of Numerical Simulation Model to the Investment Casting Process. Procedia Eng 2013;63:75–83. doi:10.1016/j.proeng.2013.08.272.
[11] Long A, Thornhill D, Armstrong C, Watson D. Determination of the heat transfer coefficient at the metal-die interface for high pressure die cast AlSi9Cu3Fe. Appl Therm Eng 2011;31:3996–4006. doi:10.1016/j.applthermaleng.2011.07.052.
[12] Anglada E, Meléndez A, Vicario I, Arratibel E, Aguillo I. Adjustment of a High Pressure Die Casting Simulation Model against Experimental Data. Procedia Eng 2015;132:966–973. doi:10.1016/j.proeng.2015.12.584.
[13] Chapman AJ. Heat Transfer. Prentice Hall; 1984.
[14] Anglada E, Melendez A, Vicario I, Arratibel E, Cangas G. Simplified Models for High Pressure Die Casting Simulation. Procedia Eng 2015;132:974–981. doi:10.1016/j.proeng.2015.12.585.
[15] Boley BA, Weiner JH. Theory of Thermal Stresses. Mineola (New York), USA: Dover Publications Inc.; 1998.
[16] Bathe LJ. Use of constitutive relations. Finite Elem. Proced., New Jersey: Prentice-Hall; 1996, p. 581–617.
[17] Girardeau-Montaut D. CloudCompare n.d. http://www.danielgm.net/cc/ (accessed August 30, 2017).
[18] Visual Computing Lab - ISTI -CNR. MeshLab n.d. http://meshlab.sourceforge.net/ (accessed August 30, 2017).