Embed Size (px)
Citation preview

J Am Acad Audiol 10 : 355-370 (1999)
Prediction and Statistical Evaluation of Speech Recognition Test Scores Gerald A. Studebaker* Ginger A. Gray* William E . Branch*
Abstract
A speech test evaluation and presentation system is described . The test presentation sub-system has the flexibility and speed of live-voice testing while using recorded test materials . The speech test evaluation subsystem compares an individual subject's test performance on a monosyllabic word test with that of an average person with the same hearing loss . The elements needed to make such evaluations are discussed . Also, a trial of the procedure is described . The primary purpose of the trial was to obtain data that would provide a basis for statistical probability statements about individual monosyllabic word test results obtained in clinical settings . Data were collected from three audiology clinics in three different types of settings . Except for a few cases with highly asymmetric speech scores, all nonconductive hearing losses were included . Subject ages ranged from 8 to 92 years . Importance-weighted average pure-tone hearing losses ranged from 0.4 to 97.6 dB HL. Fifty-word recognition scores and audiograms for 2609 ears were included in the main analysis . Twenty-five-word recognition scores and audiograms for another 932 ears from one clinic were used in a sub-sidiary analysis . Results indicated that distributions of absolute speech recognition scores in hearing-impaired samples are highly skewed . However, after transformation of the scores into rationalized arcsine units (rau), the differences between individual subject scores and scores predicted from the audiogram were reasonably well described by the normal distrib-ution . The standard deviation of this distribution of differences, for the data combined across the three audiology clinics, was approximately 13 rau .
Key Words: Articulation index, audibility index, frequency importance function, intensity importance function, speech intelligibility index, speech intelligibility tests, speech recogni-tion tests, statistical evaluation of speech intelligibility test scores rationalized arcsine units
Abbreviations : AI = articulation index, CD = compact disc, FIF = frequency importance function, HLD = hearing loss desensitization, IIF = intensity importance function, IWHL = importance-weighted hearing loss, MSHC = Memphis Speech and Hearing Center, MVAH = Memphis Veterans Administration Hospital, NU-6 = Northwestern University Auditory Test No . 6, PL = presentation level, rau = rationalized arcsine units, SII = speech intelligibility index, SL = sensation level, SLD = speech level desensitization, STEPS = Speech Test Evaluation and Presentation System, SRT = speech recognition threshold, STI = speech transmission index, TF = transfer function, UMMS = University of Maryland Medical System, WAI = weighted audibility index
S peech "discrimination" tests, or speech recognition tests, have been a routine part of audiologic evaluations for nearly 50
years (Newby, 1958 ; Harris, 1965). In spite of this long history and the large number of papers devoted to their development, assessment, and
*School of Audiology and Speech-Language Pathology, The University of Memphis, Memphis, Tennessee
Reprint requests : Gerald A. Studebaker, Memphis Speech and Hearing Center, 807 Jefferson Ave., Memphis, TN 38105
utilization, these tests are still frequently applied and evaluated in ways that have changed little since the 1950s (Newby,1958; Martin et al, 1998). The test items are often presented via live voice and/or with shortened test lists (Martin et al, 1998), whereas the assessment of results is usu-ally based on little more than the clinical impres-sions of the audiologist. At present, the most commonly used speech recognition test is the CID W-22, developed in the 1950s (Hirsh et al, 1952), although recent trends suggest that the North-western University Auditory Test No . 6 (NU-6)
355

Journal of the American Academy of Audiology/Volume 10, Number 7, July/August 1999
(Tillman and Carhart, 1966), developed in the 1960s, will soon overtake it (Martin et al, 1998). Clearly, there is substantial inertia in this area. An analysis of the reasons for this may be instructive .
The widespread clinical use of live-voice presentations and/or testing with an abbreviated list has continued in spite of the plethora of evi-dence that these practices produce results with low reliability (Jerger, 1998). The roles of test speed and presentation rate adaptability in pro-moting this course of action seem obvious. That is, live-voice testing is both faster and more adaptable to the response rates of different sub-jects than recorded test materials, and shortened lists save valuable time .
But, there is another, less obvious factor that encourages these shortcuts. Many clinicians feel that the expenditure of the additional time to produce a more reliable speech recognition score is not worthwhile because, in any case, speech score values are interpretable only in a vague manner. That is, in the absence of better tools, clin-icians can have only a general impression of what the score should be, given the hearing loss, or whether the obtained score differs enough from expectations to have diagnostic significance. Given the fuzzy nature of the interpretation aspect of the procedure, a clinician quite logically may feel that there is little justification for spending extra time obtaining a more reliable score.
If the above analysis is correct, then it is obvious what needs to be done in order to improve clinical practice . First, clinicians need a test presentation system that uses recorded materials and is as fast and adaptable as live-voice testing. Second, they need a system that permits abbreviated test lengths that are invoked automatically under particular circumstances defined in advance. With computers and compact disc(CD)players, meeting these first two require-ments is relatively simple, and these elements are included in the speech test system that is described in this paper.
But there is a third thing needed. It is per-haps the most important and it is the most dif-ficult to achieve. This is the need of the clinician for an easy-to-use, objective, and quantitative evaluation of the results they obtain . This aspect of the problem is the primary focus of this paper.
To determine what might be done to help clin-icians obtain greater meaning from their speech recognition test results, we considered how an ideal experienced clinician would evaluate these results. First, we concluded, the clinician would decide what score was expected, considering the
subject's pure-tone hearing loss and the conditions of test presentation (test material, presentation level, etc.). Then, the clinician would note whether the subject scored higher or lower than expected and whether the difference was large enough to have clinical significance .
There are two principal reasons why prac-ticing clinicians have difficulty implementing this scenario well . First, they do not have an adequate basis for knowing what score to expect, given the particular hearing loss and listening conditions . Second, clinicians do not have available an ade-quate basis for assessing the likelihood that the observed departure from expectations could have occurred by chance . Some clinicians, undoubtedly, are better than others at making such judgments, and skills can be developed through experience, but the number of free vari-ables, and the sensitivity of the results to these variables, makes these assessments a daunt-ing challenge for anyone.
Overall, our goals for this project were to develop and evaluate a procedure designed for clinical use that would statistically evaluate indi-vidual speech recognition test results in relation to expected results. This procedure would also pro-vide the speed and adaptability of live-voice pre-sentations yet offer the reliability of recorded speech presentations. To achieve these goals, an integrated system was developed consisting of an audiometer, computer, CD player, and supporting software . The software calculated an expected score based on the conditions of the test and the subject's audiogram, compared the observed and expected values, and provided a graphic interface for test administration control and display of the results. Together, these components were referred to as STEPS (Speech Test Evaluation and Pre-sentation System).
The first part of this paper describes the ele-ments and rationale of the STEPS system while the second part reports on a data collection pro-ject using the system that was carried out in three different clinical settings. The purposes of this project were (1) to test the STEPS system under real clinical conditions and (2) to provide data on the statistical distributions of the dif-ferences between predicted and observed speech scores for a large number and broad range of audiology clinic clients.
RATIONALE
Why Predict Speech Recognition Scores?
A major goal of STEPS is to predict and evaluate absolute speech recognition scores, not
356

Prediction and Evaluation of Speech Scores/Studebaker et al
just articulation index (AI) values or relative speech scores . Prediction of absolute score val-ues is a substantially more demanding goal than predictions of relative scores but one that, if
achieved, offers very considerable advantages . Absolute score predictions enable descriptive and probabilistic statistical comparisons of an individual's speech test results either with the average of other persons under the same con-ditions of audibility or with the expected aver-age score of persons with the same pure-tone hearing loss . Such comparisons may increase the
diagnostic value of the tests and perhaps be useful in planning individual rehabilitation pro-grams for hearing-impaired persons . These appli-cations are not fundamentally different from what clinicians have done on a subjective basis
for many years . A second type of application for STEPS
results is to use a subject's performance on a speech test-in relation to an expected score for the average person with the same hearing loss under like listening conditions-to make quan-titative predictions about the likely performance of that individual under other listening condi-tions or with other types of speech . An example of this would be to predict the degree of listen-ing success for an individual in real-world lis-tening conditions based, in part, on his or her relative performance on a standardized clinical speech test .
A third kind of application for predictions of speech recognition scores is the rapid estimation of optimal amplification characteristics for a particular person for each of a range of listen-ing conditions (Hou and Thornton, 1994). Although such estimations can be made based simply on an index value, predicted speech scores provide a better basis for assessing the practi-cal importance of the factors being considered .
A fourth type of application is one more nor-mally used in research settings . This application is to use speech score predictions to estimate the effect of audibility on performance so the inves-tigator can focus more clearly on factors other than audibility that might affect speech recognition test performance across individuals .
What Is Needed?
Assuming, then, that predictions of absolute speech recognition scores have potential value, what is needed in order to make and use such predictions in the evaluation process? Following are some of the more important aspects .
Theoretical Structure
The first requirement is a theoretical struc-ture that provides the basis for calculating a pre-diction. Such a structure may be provided by articulation theory (Beranek, 1947 ; French and Steinberg, 1947 ; Fletcher and Galt, 1950) and its progeny, including the AI (ANSI, 1969), the speech transmission index (STI) (Steeneken and Houtgast, 1980), the speech intelligibility index (SII) (ANSI, 1997), and the weighted audibility index (WAD (Studebaker, 1991).
The theoretical structure used to predict speech recognition scores in this project is a modification and extension of the articulation theory of French and Steinberg (1947) called audibility theory (Studebaker, 1991). Its index is referred to as the WAI to distinguish it from the classical AI . The WAI has been described only briefly in published form (Studebaker, 1991) but is described in detail in several unpublished papers (Studebaker et al, 1991 ; Studebaker and Sherbecoe, 1994 ; Studebaker, 1992, 1994) avail-able from the first author.
Modifications of the classical AI included in the WAI primarily consist of how the effects of masking spread are calculated and in the fre-quency importance-weighting function and speech peak values that are used (Studebaker et al, 1993). The extensions consist mainly of cor-rections for the effects of speech level and thresh-old elevation (see below) .
More significant than these modifications and extensions, however, is incorporation of the WAI into a larger scheme that takes into con-sideration the effects of specific listening con-ditions (e .g ., earphone type) and test materials (e.g ., NU-6) on score. These modifications in both the form and the concept of the classical AI make possible comparisons on an absolute score basis between score predictions and actual per-formance.
Speech Test with Known Characteristics
The second thing needed to make absolute speech recognition score predictions possible is a speech recognition test with well-known char-acteristics under conditions of reduced audibil-ity. Specifically, it is necessary to know the test's frequency importance function (FIF), its inten-sity importance function (11F), and its transfer function (TF) .
Frequency Importance Function . The FIF (also called the band importance function) is a weighting function that reflects the fact that
357

Journal of the American Academy of Audiology/Volume 10, Number 7, July/August 1999
some frequency regions in the speech spectrum are more important than others. The litera-ture suggests that the FIF varies with speech type (Pavlovic, 1994). However, the more impor-tant question is whether such variations have practical consequence.
An analysis by Studebaker and Sherbecoe (1993) suggested that under many ordinary lis-tening conditions, with ordinary types of speech, the FIF used in the calculation has little effect on predictions . Nevertheless, significant effects are likely under those listening conditions in which audibility varies substantially with fre-quency, such as with hearing losses and/or hear-ing aids, or when sharply filtered conditions are used in the experimental laboratory. As these are representative of the conditions frequently encountered by audiologists, it is important that the method used to predict absolute speech scores should include a FIF specific to the speech materials used to test the subjects . The FIF used in this study was the one found appropri-ate for the Auditec recordings of the NU-6 by Studebaker et al, (1993) .
Intensity Importance Function. The IIF consists of three components : dynamic range, speech peaks, and importance weighting. The AI, STI, speech intelligibility index (SII), and the WAI assume that the dynamic range of speech is 30 dB . French and Steinberg (1947) assumed it to be 36 dB and Fletcher and Galt (1950) assumed it to be 68 dB . Speech peaks values (i .e ., the root-mean-square levels exceeded by the speech 1% of the time) are normally taken to be either 12 (Beranek, 1947 ; Kryter, 1962 ; ANSI, 1969) or 15 dB (Steeneken and Houtgast, 1980; ANSI, 1997). Most assume that every decibel within the dynamic range contributes equally to the index value and that decibels of signal-to-noise ratio outside that range contribute noth-ing. There are exceptions . French and Steinberg (1947) assumed that the upper 12 dB of the dynamic range counted less per decibel than the lower level parts, whereas Fletcher and Galt (1950) assumed a complex function that assigned the greatest importance to levels near the mid-dle of the dynamic range .
Each of these issues is currently under investigation and alternative assumptions may be suggested in the future . However, in this study, STEPS was set to use 15-dB speech peaks, 30-dB dynamic range, and a rectangular IIF (i .e ., one where all levels within the dynamic range have equal value) . This was done on the grounds that these are the assumptions most
widely used at the present time . Also, they are the same assumptions as used in the new SII (ANSI, 1997) and in the STI (Steeneken and Houtgast, 1980).
Transfer Function. The TF (the function that relates an index value to an actual score) is perhaps the single most important influence on absolute score predictions. It has long been widely recognized that this function is different for each type of speech (ANSI, 1969) or for each particular version (e.g., recording, talker) of the same type of speech (Studebaker and Sherbecoe, 1991 ; Studebaker et al, 1993). Thus, the require-ment for a TF that is valid for the specific test material employed cannot be overemphasized. The TF used in this study was one found by Studebaker et al (1993) to be appropriate for the NU-6 test used in this study.
Other Factors
A third requirement for making absolute score predictions is knowledge of the effect of any factors, other than simple audibility loss, that may significantly influence a person's recogni-tion performance. Examples include things such as speech level, extent of hearing loss effects beyond audibility loss, and subject age .
Speech Level Desensitization (SLD). When speech audibility is held constant, higher than normal speech levels have a negative effect on speech recognition (French and Steinberg, 1947 ; Fletcher and Galt, 1950). The detrimental effects of higher than normal speech levels may be greater when speech is heard in the presence of a noise than in quiet (Studebaker et al, 1999). However, in the case of the present investigation, the speech test materials were always presented in quiet. Therefore, in this instance, a table of correction values' based on the data of French and Steinberg (1947) was applied. This table produced correction values very similar to those of the "level distortion factor" included in the SII standard (ANSI, 1997) calculation .
Hearing Loss Desensitization (HLD). To better predict the speech recognition perfor-mance of hearing-impaired subjects, it is
'For speech sound pressure levels above 65 dB, the WAI was reduced by 0.00425 per dB from 66 to 84 dB, 0.00605 per dB from 85 to 104 dB, and 0.0062 per dB above 105 dB .
358

Prediction and Evaluation of Speech Scores/Studebaker et al
necessary to include an estimate of HLD . The
HLD is intended to correct speech score pre-
dictions for the fact that, given the same audi-bility, persons with more hearing loss will, on
average, understand speech less well than per-sons with less hearing loss . Pavlovic et al
(1986) labeled this the "desensitization" factor .
Since then, to distinguish it from the SLD,
just described, we call this factor hearing loss
desensitization . The HLD, like the SLD, was created as a
multiplier of the WAI. It originally ranged from
1 .0, in the case of thresholds of 15 dB HL or less, to zero for thresholds above 94 dB HL. In the
absence of data, Pavlovic et al (1986) drew a
straight line between those two points . Later, to obtain a better estimate of this function, we
used results from the files of about 100 adult
clients of the Memphis Speech and Hearing
Center (MSHC) as follows . First, each observed
speech score was converted into a WAI using
equation 1 :
Whether to use an age correction in a pre-diction scheme involves a philosophical question
of the "Who do you compare to?" type. This issue is discussed in more general terms in the next
section . In the case of age, the specific question is whether it is more meaningful to compare a
subject's performance to that of an average sub-ject of the same age and/or hearing loss or to that of younger subjects with the same hearing loss
or normal hearing (see below) . Studebaker et al (1997) studied the effect of
age on monosyllabic word test scores in an inves-
tigation in which all of the subjects had normal hearing within the frequency passband of the speech test material . The present study offered
an opportunity to estimate the effects of age independent of audibility differences in a larger and more diverse subject sample . Therefore, we
did not include an age correction in our predic-tions for this project. Results concerning this issue are presented later.
Statistical Issues
IA =-Q log (1-S") (1)
where S is the score as a proportion, Q and N are fitting constants from the transfer function, and
IA is the apparent WAI, that is, the index value
needed by the average subject to produce the observed score . Each apparent WAI was turned
into a ratio (i .e ., a proficiency factor) by divid-
ing it by the WAI calculated from the physical descriptions of the presentation conditions and
hearing loss for each case . These ratios were plot-
ted as a function of the average pure-tone hear-ing loss at 500, 1000, and 2000 Hz and fit with
a line using a variety of mathematical functions
using TableCurve 2D (Jandel Scientific, 1994) .
Avery good fit was obtained with equation 2 with
X set at 104.13793 :
HLD = 1- (PTA IX)3 (2)
This equation and constant were used to calculate the HLD function for this project.
Age. Another factor to consider in a speech
recognition prediction scheme is the age of the subject. Be aware that the question posed here
is not whether older subjects have more hear-ing loss, and thereby poorer speech recognition scores, than younger subjects . Rather, it is whether older subjects do more poorly on speech tests when speech audibility and the extent of hearing loss are the same as for younger subjects .
Who To Compare To? To compare obtained and predicted scores meaningfully, it is neces-sary to evaluate the implications of each plau-sible decision about who the comparison group should be . The decision depends primarily on the purpose of the comparison being made . For example, an obtained score could be compared to either an average normal-hearing subject or
an average subject with the same pure-tone hearing loss as the subject.
Both comparisons are defensible, depending on the question being answered . The former seems better suited to assessments of hearing impairment, whereas the latter may be better for the purposes of diagnosis and prognosis. These latter types of applications are more numerous and, in most clinical applications, would seem more useful because comparisons with hearing-impaired persons having the same hearing loss serve to identify the hearing-impaired subject as unusual among those with the same hearing loss, not simply that the sub-ject does not have normal hearing. Comparisons with the speech scores of normal hearers are advocated by Halpin et al (1994) and Hou and Thornton (1994) but seem redundant in most clinical applications as it is already known whether the subject has normal hearing from the pure-tone audiogram . Thus, in the present pro-ject, all comparisons were between the subject's actual performance and the performance pre-dicted for an average person with the same
359

Journal of the American Academy of Audiology/Volume 10, Number 7, July/August 1999
pure-tone hearing loss as the subject. Inclusion of the HLD factor in STEPS is consistent with this approach.
Statistical Evaluation of Performance Differ-ences. A major problem in making statistical comparisons of speech recognition scores arises from the fact that the scores are percentages. Per-centages have the unfortunate statistical char-acteristic that the standard deviations of groups of such scores are strongly correlated with their mean value (Studebaker et al, 1995). This rela-tionship violates one of the most important assumptions underlying the use of parametric statistics : the homogeneity of variance .
The arcsine transform has been used for many years to overcome this problem (Bartlett, 1947 ; Shore et al, 1960). The advantage of the arcsine transform is that the standard deviations of groups of such scores change little with their mean value. It is, therefore, better suited for com-parisons between performance scores than per-centages . Unfortunately, the arcsine transform has the problem that its numeric values bear no apparent relation to conventional performance scores . This makes them difficult to interpret. The rationalized arcsine transform (Studebaker, 1985) was devised to overcome this problem. The units of this transform are referred to as rationalized arcsine units (rau). Rau have the look and feel of percentage scores and are nearly numerically equal to percentages between 15 per-cent and 85 percent. Therefore, they can be nor-mally interpreted like percentages. Because they are linear transforms of the arcsine trans-form, they retain the statistical characteristic of homogeneity of variance and are thus more suit-able for evaluating relative speech recognition scores than percentage scores . For a more exten-sive discussion of these issues, see Studebaker et al (1995) .
CLINICAL DATA COLLECTION
Purpose
Essential information for the application of predicted word scores is knowledge of the location,
'The term "intersubject variability" is used in this paper to mean the variability of test results obtained from differ-ent subjects on particular single occasions . It should be recognized that the variability of such scores is greater than the true intersubject variability due to the effects of other sources of variability such as intrasubject and intertest list variability.
size, and shape of the intersubject2 distribution of obtained scores around individually predicted scores . This information was not available in the literature . To obtain an estimate of the distribu-tion, the following study was undertaken .
The major goals of this study were to obtain and statistically describe the intersubject dis-tribution of differences between rau transformed observed and predicted speech recognition scores (the rau difference score) for a large and diverse group of regular clinical subjects . Subgoals were to refine our procedures for data acquisition, transmission, and analysis, as it was assumed that these procedures would continue in use after the conclusion of this project.
Method
Data
Our starting data set consisted of 4064 hear-ing test results (ears) from 1997 individuals. This number included some persons who were tested more than once and a few who had results for only one ear. From this data set, 410 ears were excluded from the evaluation for the fol-lowing reasons.
Our goal was to evaluate the distribution of rau difference scores among subjects with sen-sorineural hearing loss, excluding those with possible retrocochlear pathology. Thus, ears with conductive hearing losses and the poorer ear of persons with asymmetric rau difference scores (defined as a rau difference score in one ear more than 30 rau worse than that in the better ear) would be excluded . These rules resulted in the exclusion of 215 ears with conductive losses and 17 ears with asymmetric rau difference scores .
Also excluded were results that were likely clinical or clerical errors and those where there was a suspicion of subject exaggeration . Thus, two ears were excluded for apparent masking problems and 11 ears were excluded because of "strange or missing data." Most of these 11 exclu-sions were the result of a missing or an obviously incorrectly recorded speech test presentation level. Nineteen ears were deleted because the results appeared "questionable." In most of these cases, this meant that there was poor agree-ment between the SRT and the pure-tone aver-age. Finally, 146 tests were excluded because they were earlier tests on the same ear. Thereby, only the single latest result for each ear of each subject was used for this analysis .
360

Prediction and Evaluation of Speech Scores/Studebaker et al
After these exclusions, the data set included results for 3654 ears . Of these, 2609 results were based on 50-word tests and 1045 were based on 25-word tests . All but one of the analy-ses carried out for this project were based solely on the 50-word test results .
Procedures
Data were collected in three different audi-ology clinics : a community speech and hearing center (Memphis Speech and Hearing Center [MSHC] ), a veterans hospital audiology clinic (Memphis Veterans Administration Hospital [MVAH] ), and a medical center clinic (Univer-sity of Maryland Medical System-Baltimore [UMMS] ). All speech tests were administered using the CD version of the Auditec NU-6 mono-syllabic word test . The CD players were under computer control. The outputs of the CD play-ers were delivered to the subjects via standard audiometers, in quiet, using supra-aural audio-metric earphones (TDH-49 or TDH-50). Certified audiologists who were regular employees of the clinics carried out most tests . Students under supervision carried out some tests . All tests were conducted as part of the standard audio-logic evaluation of each subject.
In all clinics, the STEPS presentation and evaluation system was used in conjunction with an audiogram data retrieval program . STEPS reads each subject's speech recognition thresh-
old (SRT) from the data file produced by these programs .
The clinician was required only to enter either the sensation level (SL) or the presenta-tion level (PL) in dB HTL into STEPS via the computer keyboard . If SL was entered, the PL was calculated or vice versa. We were not involved in any way in determining the PLs used by the clinicians . STEPS took this infor-mation into account in determining audibility and, thereby, predicted score.
The STEPS software is a subset of routines derived from a larger, more general-purpose speech score prediction program that had been stripped of those components not needed for this trial (e .g ., masking spread, reverberation) . To this subset were added modules to (1) auto-matically read the subject's pure-tone audio-gram and SRT from a computer data file, (2) control word presentation from a CD player, and (3) provide the examiner with summary information and graphic results via a computer monitor.
The subject's verbal responses were assessed by the examiner listening to the subject through
the audiometer's talk-back system . The exam-iner scored the responses by pushing the left (cor-rect) or right (incorrect) mouse button . The program tallied each button click and triggered the next word to be presented immediately. Thus, the test proceeded as fast as the subject's responses allowed, and the interitem presenta-tion interval could be adjusted to subject needs for each item, as with live-voice testing.
After a speech test was completed, STEPS automatically calculated the subject's score, read the subject's audiogram file, and calcu-lated predicted scores for the subject for all speech test presentation levels from 0 to 105 dB HL in 1-dB or larger steps, depending on com-puter speed. Based on these results, and on information read from the subject's audiogram file, STEPS generated a computer screen like that shown in Figure 1 . Included were the patient's identifying information, the hearing test results, results of the statistical evaluation, and a list of relevant test conditions .
Using preliminary estimates of variability, the program provided numeric and verbal descriptions of the statistical likelihood that the obtained result came from the target population (i .e ., the population of persons with pure-tone audiograms like that of the subject) . As shown in Figure 1, two graphs were also provided to the audiologist. The graph on the left depicts the pre-dicted performance-intensity (PI) function for the subject. The subject's obtained score was plotted as a diamond at the PL used and a vertical 95 percent confidence interval bar around the pre-dicted score was plotted at that same level. If pre-vious results are available in the record for this ear, they, and the associated error bars, are shown also in a subdued color.
The second graph shown was on the right side of the screen, as depicted in Figure 1. It showed the subject's audiogram for the test ear plotted in HL and the auditory area occupied by the speech signal, also in HL, at the presenta-tion level used in testing the subject. The speech area was depicted as divided by the audiogram into audible and inaudible parts. Also reported on the screen were the WAI and the predicted and observed scores expressed in both rau and percentages .
The graphs shown in Figure 1 are similar to some that have been used for a number of years at the Massachusetts Eye and Ear Infir-mary (MEEI) . Examples of portions of those graphs may be found in papers by Halpin et al (1994, 1996). In spite of this similarity, it should be noted that significant differences exist
361

Journal of the American Academy of Audiology/Volume 10, Number 7, July/August 1999
Subject : 2662d Age: 9 Sex: m Right Ear 3!2511997 Auditec NU6 PTA: 45 SRT: 30 dBHL Presentation Level : 70 dBHL 50 Word List WAI: 0.5658 The chance that this score came from the reference group is 1 in 1 .6. This result is very likely .
120
110
100
90
80
S 70
60
02 50 0 ~40
30
20
10
0
-10
-20 10 20 30 40 50 60 70 80 90 100
HEARING LEVEL (d8)
Observed Score 84 .0 RAU (84 %) Predicted Score 82 .8 RAU (83 %) Difference 1 .3 RAU ( 1 %) Confidence Interval I Previous PI-Observed Score" Previous Score A WMI
' Inaudible = Audible AC Q- () - BC < < Extrapolated
-10 0 10 20 30 g40 ,° 50 J _60
70 80 90
100 110
125 250 500 1 K 2K FREQUENCY (Hz)
4K 8K
Figure 1 The computer screen shown to the audiologist at the completion of a speech recognition test . See the text for a description of its major elements .
between the methods used at the MEEI and those described here . Most notable are those that relate to the nature of the person with whom the subject is compared (normal vs hear-ing impaired), how the results are reported (rau vs percentage), and the statistical assessment of the results (likelihood statements). Other rela-tively minor differences include the speech test used (W-22 vs NU-6), the FIF used, the IIF used, etc. (For an overview of the methods used at the MEEI, see Halpin et al, 1996.)
As noted, the probability values shown to the examiner at the time of the test were based on preliminary estimates . Those results were not used in the analyses reported in this paper. Because the exact predicted scores reported to the audiologists depended to a degree on some options that can be changed in a set-up screen, the data were all reprocessed for this report using a single set of prediction constants and set-up . This ruled out the possibility that some of the differences between the subjects, and/or the clinics, might reflect variations in these settings .
In this connection, it should be noted that while it would be possible to adjust these optional settings to obtain the best possible results, this was not done . All of the procedures and con-stants used in predicting the scores of the sub-jects included in this analysis were determined prior to this project, as discussed earlier in this paper.
The results from the batch-processed data were transferred into a Paradox database file for sorting and preliminary evaluation . Additional analyses were then carried out using Lotus-123 (Lotus Development Corporation, 1994) and TableCurve 2D . Except where noted otherwise, all analyses used only the 50-word test scores .
Results
Subject Characteristics
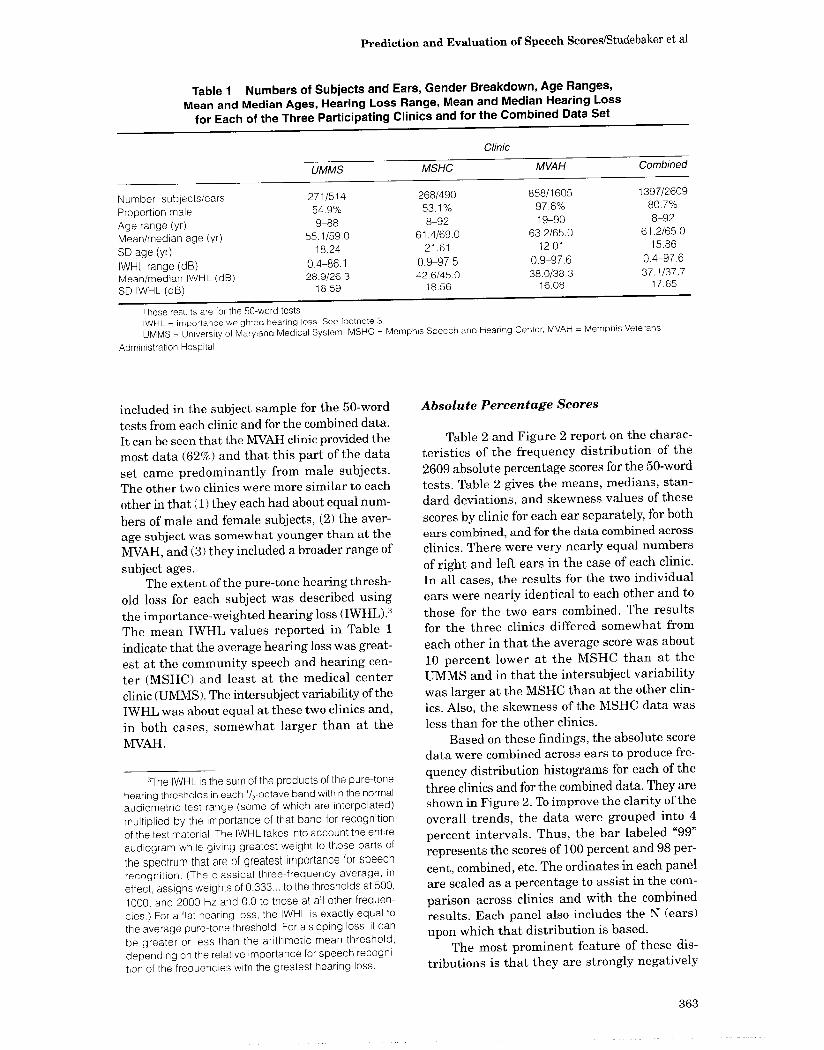
Table 1 reports the numbers of subjects and ears, mean age, age range, gender, range of hearing losses, mean, median, range, and stan-dard deviation of the pure-tone hearing losses
362
Prediction and Evaluation of Speech Scores/Studebaker et al
Table 1 Numbers of Subjects and Ears, Gender Breakdown, Age Ranges,
Mean and Median Ages, Hearing Loss Range, Mean and Median Hearing Loss
for Each of the Three Participating Clinics and for the Combined Data Set
UMMS MSHC
Clinic
MVAH Combined
Number : subjects/ears 271/514 268/490 858/1605 1397/2609
Proportion male 54.9% 53 .1% 97.6% 80 .7%
Age range (yr) 9-88 8-92 19-90 8-92
Mean/median age (yr) 55.1/59 .0 61 .4/69.0 63.2/65 .0 61 .2/65.0
SD age (yr) 18 .24 21 .61 12 .01 15.86
IWHL range (dB) 0.4-86 .1 0.9-97 .5 0.9-97 .6 0 .4-97.6
Mean/median IWHL (dB) 28.9/26.3 42.6/45 .0 38.0/38.3 37 .1/37 .7
SD IWHL (dB) 18.59 18.56 16.08 17.65
These results are for the 50-word tests IWHL = importance weighted hearing loss . See footnote 3 .
UMMS = University of Maryland Medical System, MSHC = Memphis Speech and Hearing Center, MVAH = Memphis Veterans
Administration Hospital .
included in the subject sample for the 50-word
tests from each clinic and for the combined data .
It can be seen that the MVAH clinic provided the
most data (62%) and that this part of the data
set came predominantly from male subjects .
The other two clinics were more similar to each
other in that (1) they each had about equal num-
bers of male and female subjects, (2) the aver-
age subject was somewhat younger than at the
MVAH, and (3) they included a broader range of
subject ages . The extent of the pure-tone hearing thresh-
old loss for each subject was described using
the importance-weighted hearing loss (IWHL).'
The mean IWHL values reported in Table 1
indicate that the average hearing loss was great-
est at the community speech and hearing cen-
ter (MSHC) and least at the medical center
clinic (UMMS). The intersubject variability of the
IWHL was about equal at these two clinics and,
in both cases, somewhat larger than at the
MVAH .
'The IWHL Is the sum of the products of the pure-tone
hearing thresholds in each'/3 octave band within the normal audiometric test range (some of which are interpolated)
multiplied by the importance of that band for recognition
of the test material . The IWHL takes into account the entire
audiogram while giving greatest weight to those parts of
the spectrum that are of greatest importance for speech
recognition . (The classical three-frequency average, in
effect, assigns weights of 0.333 . . . to the thresholds at 500,
1000, and 2000 Hz and 0.0 to those at all other frequen-
cies .) For a flat hearing loss, the IWHL is exactly equal to
the average pure-tone threshold. For a sloping loss, it can
be greater or less than the arithmetic mean threshold,
depending on the relative importance for speech recogni-
tion of the frequencies with the greatest hearing loss .
Absolute Percentage Scores
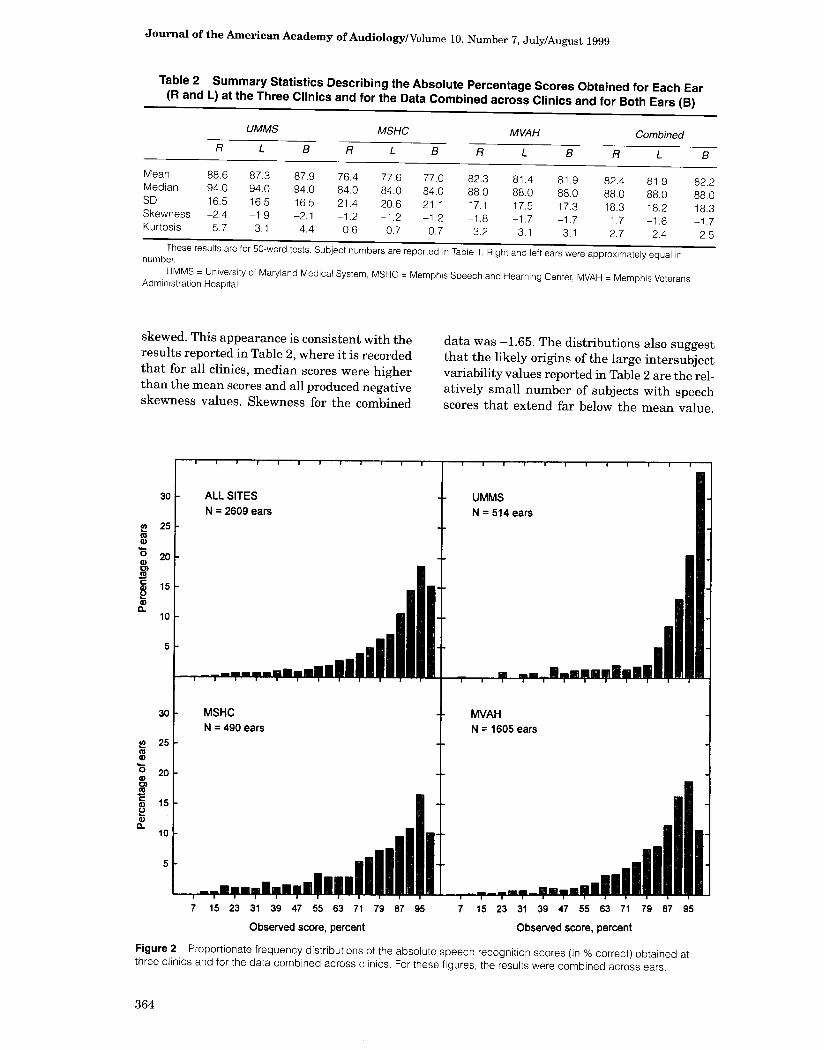
Table 2 and Figure 2 report on the charac-
teristics of the frequency distribution of the
2609 absolute percentage scores for the 50-word
tests . Table 2 gives the means, medians, stan-
dard deviations, and skewness values of these
scores by clinic for each ear separately, for both
ears combined, and for the data combined across
clinics . There were very nearly equal numbers
of right and left ears in the case of each clinic .
In all cases, the results for the two individual
ears were nearly identical to each other and to
those for the two ears combined . The results
for the three clinics differed somewhat from
each other in that the average score was about
10 percent lower at the MSHC than at the
UMMS and in that the intersubject variability
was larger at the MSHC than at the other clin-
ics . Also, the skewness of the MSHC data was
less than for the other clinics . Based on these findings, the absolute score
data were combined across ears to produce fre-
quency distribution histograms for each of the
three clinics and for the combined data . They are shown in Figure 2. To improve the clarity of the overall trends, the data were grouped into 4 percent intervals . Thus, the bar labeled "99" represents the scores of 100 percent and 98 per-
cent, combined, etc. The ordinates in each panel are scaled as a percentage to assist in the com-
parison across clinics and with the combined results. Each panel also includes the N (ears) upon which that distribution is based.
The most prominent feature of these dis-tributions is that they are strongly negatively
363
Journal of the American Academy of Audiology/Volume 10, Number 7, July/August 1999
Table 2 Summary Statistics Describing the Absolute Percentage Scores Obtained for Each Ear (R and L) at the Three Clinics and for the Data Combined across Clinics and for Both Ears (B)
R
UMMS
L B R
MSHC
L 8 R
MVAH
L B R
Combined
L B
Mean 88.6 87 .3 87 .9 76 .4 77 .6 77 .0 82 .3 81 .4 81 .9 82 .4 81 9 82 2 Median 94 .0 94 .0 94.0 84.0 84.0 84.0 88 .0 88 .0 88 .0 88.0 .
88 .0 .
88 0 SD 16 .5 16 .5 16 .5 21 .4 20 .6 21 .1 17 .1 17 .5 17 .3 18 .3 18 .2 .
18 3 Skewness -2 .4 -1 .9 -2 .1 -1 .2 -1 .2 -1 .2 -1 .8 -1 .7 -1 .7 -1 .7 -1 .6 .
-1 7 Kurtosis 5.7 3.1 4.4 0.6 0.7 0 .7 3.2 3 .1 3 .1 2 .7 2 .4 .
2.5 These results are for 50-word tests . Subject numbers are reported in Table 1 . Right and left ears were approximately equal in number. UMMS = University of Maryland Medical System, MSHC = Memphis Speech and Hearning Center, MVAH = Memphis Veterans Administration Hospital .
skewed . This appearance is consistent with the results reported in Table 2, where it is recorded that for all clinics, median scores were higher than the mean scores and all produced negative skewness values . Skewness for the combined
I I --,
30 ALL SITES LIMMS N = 2609 ears N=514 ears
25 m d w 0 20 a> m c 15 a. a
10
5 ~dl l __. . ll l ® ~® -i--r-T-r-
30 MSHC MVAH N = 490 ears N = 1605 ears
25 as w 0 20 m m c 15 d a 10
5
data was -1.65. The distributions also suggest that the likely origins of the large intersubject variability values reported in Table 2 are the rel-atively small number of subjects with speech scores that extend far below the mean value.
7 15 23 31 39 47 55 63 71 79 87 95
Observed score, percent
_®®®"""®"®~' r
7 15 23 31 39 47 55 63 71 79 87 95
Observed score, percent
Figure 2 Proportionate frequency distributions of the absolute speech recognition scores (in % correct) obtained at three clinics and for the data combined across clinics . For these figures, the results were combined across ears .
364

Prediction and Evaluation of Speech Scores/Studebaker et al
2
18
16
LA ca d 0 GN m c
m a
14
12
10
8
6
4
2
ALL SITES UMMS N = 2609 ears N = 514 ears
Jon. MSHC MVAH
N = 490 ears
r
013C] n Kr, r,
N = 1605 ears
-60 -52 -44 -36 -28 -20 -12 -4 4 12 20 28 36 44 52
RAU difference
-60 -52 -44 -36 -28 -20 -12 -4 4 12 20 28 36 44 52
RAU difference
Figure 3 Proportionate frequency distributions of rau difference values based on the same data as in Figure 1 for
each of the three clinics and for the data combined across clinics . For these figures, the results were combined across
ears . Normal distribution curves are also shown that have the same means, standard deviations, and areas under the
curve as the respective data sets .
Also, it is noted that there is a substantial pos-itive kurtosis in the data of two clinics but lit-tle or none in the data of the third .4
Rau Difference Scores
The frequency distributions shown in Fig-ure 3 are based on the same data as in Figure
2 . However, in this case, the scores were processed to optimize the comparison between predicted and observed scores, as discussed in this paper . First, each observed speech test score
was transformed into a rau value . Then, an
expected score (in rau) for that subject was cal-
4 Due to the large N, all but one of the skewness and kurtosis values reported in Tables 2 and 3 are statistically significant at the 1 per cent level of confidence
culated, taking into consideration the test mate-rial, subject's audiogram, PL, and earphone employed. The expected score was then sub-tracted from the observed score to produce the rau difference value. The frequency distribu-
tions of the rau. difference scores for each clinic and for the combined clinics are reported in Fig-ure 3. To facilitate evaluation, each figure also includes a normal distribution function with the same means, standard deviations, and area under the curve as the data functions. As for Fig-ure 2, the ordinates are scaled in percentage and the N (ears) values are reported in each panel.
Table 3 reports the descriptive statistics for the distributions in Figure 3. As for the per-centage scores in Table 2, values are reported individually for the two ears and the combined ears for each of the three clinics, as well as for the data combined across clinics . Again, the two
365

Journal of the American Academy of Audiology/Volume 10, Number 7, July/August 1999
Table 3 Summary Statistics DescriY ng the Rau Difference Data Obtained for Each Ear (R and L) at the Three Clinics and for th Data Combined across Clinics and for Both Ears (B)
R
UMMS
L B R
MSHC
L B R
MVAH
L B R
Combined
L B
Mean -2 .4 -2.0 -2.2 -5 .7 -4.7 -5.2 -4 .1 -4 .2 -4 .1 -4 .1 -3 .9 -4 .0 Median -1 .3 -1 .3 -1 .3 -4 .3 -3.6 -3.9 -3 .6 -3 .7 -3.6 -3.2 -3.0 -3 .1 SD 12 .2 13 .6 12 .9 15 .6 15 .7 15 .7 12 .1 12 .7 12 .4 12 .9 13 .5 13 .2 Skewness -0 .84 -0.95 -0.90 -0 .41 -0.46 -0.44 -0.09 -0.42 -0.26 -0.36 -0.54 -0.46 Kurtosis 2 .4 2 .3 2 .4 0 .9 1 .2 1 .1 2 .2 1 .9 2 .0 1 .9 1 .8 1 .9
These results are for 50-word tests . Subject numbers are reported in Table 1 . Right and left ears were approximately equal in number . UMMS = University of Maryland Medical System, MSHC = Memphis Speech and Hearing Center, MVAH = Memphis Veterans
Administration Hospital .
ears produced results nearly identical to each other and to those for the ears combined . Thus, only the data for the combined ears are shown graphically in Figure 3 .
The distributions of the rau differences for two of the clinics (UMMS and MSHC) contain a prominent artifact . This artifact is the relative excess of rau difference values in the +8 inter-val and an associated dearth of values in the +4 interval . When evaluating this observation, it was noted that the size of this effect was related to the number of 100 percent scores in the sub-ject data set. The reason for this pattern then became clear. It occurred, in part, because scores between 98 percent and 100 percent are not possible with a 50-item test and, in part, because, under the conditions assumed in this trial, STEPS did not predict performance higher than 98.7 percent. With predicted scores in this region and an observed score of 98 percent, the rau difference fell into the zero-difference bin. How-ever, when a subject produced the next possible higher score (100%), the rau difference fell within the +8 bin. Thus, under this particular set of con-ditions, a rau difference value in the +4 bin (in the range +2 to +6) was not possible . This arti-fact quickly disappears as the number of test items contributing to a score is increased above 50. Further, the effect on results is unlikely to be significant in individual cases because it occurs only when excellent performance is pre-dicted (about 98%) and the subject scores 100% . For these reasons, it is not considered a signif-icant practical problem.
Table 3 reveals that the rau differences across the three clinics differed less than the absolute percentage scores . Also, the skewness values are smaller and more consistent across clinics. Finally, the intersubject standard devi-ations of the rau difference scores are smaller than those of the absolute percentage scores, although, obviously, they are still not small.
Age Effects
Recall that the prediction scheme used in this project did not include a correction for sub-ject age. Therefore, the rau difference values provide a basis for assessing the effects of sub-ject age on speech recognition while controlling for the effects of audibility loss . Figure 4 shows the mean rau difference scores for the combined clinics data obtained in this study plotted as a function of age (filled circles). To produce this plot, the subject data were first grouped into decade ranges of age. The mean rau difference and mean age of the subjects in each group were then calculated . In addition to the mean values, Figure 4 reports the N (ears) contributing to each plotted point. Results for subjects under 10 years and over 90 years of age were not included because subject numbers in these decades were very small and all available ages were near the edge of the age interval . (The data represented by the open circles are from a different study that
10
5
0
-5
-10
-15
10 20 30 40 50 60 70 e0 90 Age, years
Figure 4 Rau difference values plotted as a function of age for the hearing-impaired subjects of this study (filled circles) and those obtained for normal-hearing subjects by Studebaker et al (1997) (open circles) .
366

Prediction and Evaluation of Speech Scores/Studebaker et al
will be compared to the present results in the dis-cussion section.)
Effects of Test Length
During approximately the second half of the trial period, one clinic (MVAH) tested essen-tially all of its clients using 25-word tests . Selec-
tion criteria and all other procedural aspects
appeared to be the same during the two periods . Table 4 descriptively compares the characteris-
tics of the absolute percentage and rau difference
distributions obtained with 25-word and 50-
word test lengths in this one clinic . The results
in Table 4 are based on 1605 50-word tests and
932 25-word tests on different subjects . (A few
25-word tests were carried out in the other clin-
ics, but too few for analysis .) Table 4 reveals that the mean and median
values were nearly equal across trial periods, suggesting that the average characteristics of the subjects during the two test periods were essen-tially the same . Of interest is that the standard deviations associated with the 25-word tests are only slightly larger than for the 50-word tests . This will be discussed in the next section.
Discussion
Score Distributions
There are a number of difficulties in using the distributions of absolute percentage scores, such as those shown in Figure 2, for evaluating speech recognition scores . The commonly used normal distribution function would be unsuited as a basis for probability statements because the actual distribution is highly asymmetric . Also, as noted earlier, percentage score variability is highly correlated with mean score (Thornton and Raffin, 1978; Studebaker et al, 1995). This
Table 4 Comparison of the Characteristics of the Distributions of 932 25-Word
Test Results and 1605 50-Word Test Results Obtained at the MVAH
Percent Rau Difference
25 Word 50 Word 25 Word 50 Word
Mean 81 .0 81 .9 -2 .0 -4 .1 Median 88 .0 88 .0 -2 .6 -3 .6 SD 17 .5 17 .3 13 .2 12 .4 Skewness -1 .31 -1 .73 0 .25 -0.26 Kurtosis 1 .45 3 .1 0 .74 2 .0
MVAH = Memphis Veterans Administration Hospital .
is a particularly important problem when many
scores are at or above 90 percent, as is clearly
the case with the usual run of clinical subjects .
It might be possible to develop a reason-ably valid speech score probability function,
based on curves like those in Figure 2, and/or a similar one for normal-hearing subjects, but sig-nificant difficulties would remain . One of the
most important would be that it would not be
possible even then to compare a subject's per-formance with that of an average hearing-impaired subject with the same hearing loss .
The frequency distributions of rau difference scores, as shown in Figure 3, are substantially more symmetric and normal in appearance than those for the percentage scores . It can be seen more clearly by comparisons with the normal curves superimposed on the data in Figure 3 that the distributions are somewhat negatively skewed and that they are somewhat leptokur-tic as well . Both observations are consistent with the kurtosis and skewness values reported in Tables 3 and 4. These observations are con-sistent with those of Schum et al (1991) for their subjects listening in quiet, as here .
Figure 3 indicates that the skewness values are likely the result of the larger than normal number of scores appearing in the far left-hand
tail of the distribution . In general, this seems an expected outcome for such samples. In fact, the figure indicates a degree of negative skewness that is less than we expected . When evaluating this result, it should be recalled that no data were eliminated simply because the score was low, with the exception of the 17 ears that were elim-inated from the sample because the rau differ-ence score for each of those ears was more than 30 raus below that of the subject's opposite ear. Inclusion of these few cases might have increased the negative skewness, but probably only slightly.
Although positive kurtosis is a feature of the
rau difference data, it is not quite so large or so
variable across clinics as it was for the per-centage data . The MVAH data suggest that kur-
tosis was somewhat more positive with 50-word
tests . Inspection indicates that the positive kur-tosis is the result of a relative abundance of
results in the region between -12 .5 and 2.5 rau
difference and a relative dearth of results both
just above and just below these intervals . In comparing the data with the normal
curve, we concluded that the normal distribution provides a reasonable basis for evaluating rau difference scores for the following reasons. First, the modest excess of score differences in the negative tail likely represents the effects of
367

Journal of the American Academy of Audiology/Volume 10, Number 7, July/August 1999
unusual pathology. Using a symmetric distrib-ution assumption in the calculation of the sta-tistical likelihood makes these results stand out, as they should . Second, the observed posi-tive kurtosis normally reflects a relatively reduced number of scores about one standard deviation from the mean and a relative abun-dance of scores nearer the mean, as in this case . However, because the effect is no more than moderate (see Fig. 3) and the distribution of scores relatively near to the mean usually is of little interest, it is unlikely that the observed leptokurtosis would have significant practical consequences .
Average Performance
As reported in Table 3, average scores were about 3 (median) or 4 (mean) rau below predic-tions. Recall that no age correction was applied in making the predictions . Figure 4 shows the relationship between age and average rau dif-ference scores in this sample . Note that the average difference scores for the younger sub-jects are near zero and that the rau difference scores became gradually more negative with increasing age. This result suggests that the average prediction provided by STEPS is very close to the correct value for young hearing-impaired subjects, as intended, and that a neg-ative difference for the group as a whole is expected in the absence of an age correction .
Age Effects
Inclusion of an age correction would reduce the downward tilt of the rau difference func-tion over age, move the negative mean rau dif-ference for the group as a whole closer to zero, and reduce the intersubject variability. How-ever, because the relationship of word recogni-tion scores to age is small, these effects would also be small .5 In any case, such a correction should be made optional to allow the clinician
SA post hoc analysis of the data revealed that the mean of the age-corrected rau differences was essentially zero . This means little, of course, as the correction was based on the same data . However, it is noteworthy that the inter-subject variability values were decreased only very slightly (-0.2 rau) by this correction or the one reported by Studebaker et al (1997) . This suggests that the intersub-ject variability introduced by a range of ages is small compared to other factors that cause subjects to differ from each other and that the distributions and variability values reported in Figures 2 and 3 and Tables 2 and 3 would not have been noticeably different if an age correction had been used .
to compare a subject's result with that of a young hearing-impaired person (no age correction) or with a hearing-impaired person of the same age (with age correction), whichever the clinician deems appropriate for a particular application.
It should be noted that the age effect seen in this study, although not large, is nonethe-less larger than that observed earlier by Stude-baker et al (1997) (open circles, Fig. 4) . In the earlier study, the subjects were confined to those with pure-tone thresholds of 25 dB or less over the frequency region of the speech signal used in the tests. The results from that study are compared to those of the present study in Fig-ure 4. The difference between the two studies may reflect an interaction between hearing loss status, speech recognition loss, and the effects of age. However, it is apparent from Figure 4 that downward trend over age is similar in the two studies and that the differences are not large in absolute terms. The present results support the conclusion of the earlier study that the effects of age on monosyllabic word recognition scores are small (<5 rau), after audibility effects are taken into account, at least into the sixth decade of life .
Intersubject Variability
It is evident that the intersubject standard deviations of the rau differences observed in this sample are large .6 In some cases, they were only modestly smaller than those of the original absolute percentage score values . There are sev-eral factors that should be borne in mind about this . First, except for the exclusion of conductive hearing losses, 17 highly asymmetric losses, and a few probably invalid results, the data rep-resent a nearly unrestricted sample of persons with sensorineural hearing loss who present themselves at audiology clinics. Thus, smaller values would be anticipated for most subgroups, including, for example, groups categorized by age and/or etiology.
Second, the larger than normal number of very negative rau difference scores contributed substantially to the obtained rau difference stan-dard deviation values. This last point is demon-strated by the fact that if the distribution of the combined rau difference data to the left of the
'We estimated an even larger standard deviation value (-17 rau) for a comparable distribution (Fig . 7 "In Quiet") reported by Schum et al (1991) . However, due to the rela-tively small subject numbers (101), this result was dramatically influenced by a few, very negative rau differ-ence values .
368

Prediction and Evaluation of Speech Scores/Studebaker et al
mean were the mirror image of that actually observed to the right of the mean, the resulting standard deviation of the distribution would be 9.4 rau. Thus, it can be argued that the inter-subject standard deviation of hearing-impaired subjects is in the region of 9 to 10 rau, except for that added variability created by the occurrence of a relatively small number of very negative rau difference scores . Values in this range are still somewhat larger than comparable values observed for normal-hearing subjects (Stude-baker et al, 1997).
Table 4 reveals that the intersubject stan-dard deviations were only slightly larger when 25-word tests were used . This observation might be taken as evidence favoring the use of 25-word tests . This, however, would be an incorrect conclusion . The major effect of increasing test length is to increase the stability of the individual test score . It does not decrease true intersubject differences, the differences that are likely the major factor controlling the standard deviation values reported here . When multiple sources of variability are combined, the largest source of variability dominates the overall result . There-fore, the small list length effect on the standard deviation observed in this study is an expected outcome . It does not contradict the findings of Thornton and Raffin (1978) and Dillon (1982), for example, which indicate that shortened test lengths can have substantial negative conse-quences for reliability.'
Choosing a Standard Deviation
Also, if the intersubject standard deviation for normal-hearing subjects was used, the result-ing probability values associated with clinical results would indicate that relatively large pro-portions of hearing-impaired subjects are very unusual . It would soon become evident to the clinician that such results were actually not that unusual and so would soon be ignored . Thus, the use of a standard deviation that iden-tifies a subject as unusual, when indeed the subject's speech score is unusual among those with similar hearing losses, would seem to be a more useful approach .
Another defensible conclusion is to use a standard deviation value around 9 or 10 rau on the grounds that this value represents the inter-subject variability of the hearing-impaired sub-jects, excluding only those with conditions that produce particularly negative rau difference
scores . As these are the very subjects we often want to identify for further study, the smaller standard deviation value and the use of the symmetric normal curve would help ensure that these low scoring individuals would be identified
as unusual . But, whatever value is used in the calculation of the probability value, clinicians would soon learn which values are actually wor-thy of further attention . For this reason, the exact standard deviation value used is less important than a system that provides clini-cians with a consistent and objective framework within which to better evaluate their speech recognition test results . It is concluded that a sys-tem similar to that demonstrated in this project can meet that goal .
The question of what standard deviation to use when making a statistical evaluation of a particular clinical result is an important one, but one for which there is no definitive answer. The question is a variation on the more general "Who do you compare to?" question discussed earlier. Some theoretical arguments would seem to favor using the standard deviation value for young nor-mal-hearing subjects, that is, about 7 rau. How-ever, practical considerations favor using values based on the variability of hearing-impaired subjects . This is because most clinicians are concerned with whether a patient is unusual in his or her category. As noted earlier, the audio-gram already tells them that the subject does not have normal hearing.
'The fact that test length had any effect at all on the standard deviations calculated here is evidence that they are not based solely on intersubject differences . However, the results suggest that this is the predominant factor.
Acknowledgment. This work was supported in part by research grant R01 DC00154 from the National Institute on Deafness and Other Communication Disorders and by the Center for Research Initiatives and Strategies for the Communicatively Impaired . Portions of this paper were presented at the 1997 meeting of the American Academy of Audiology. The authors want to thank Craig C . Formby, Sarah Ferguson, LaGuinn P. Sherlock, Kay M. Pusakulich, Izel M. Rivera, Allison W. Lane, Karen C. Brown, and Virginia A. Hull for their help in the data collection ; Robert L. Sherbecoe and Catherine A. Gwaltney for their help in preparation of the manu-script ; and Joseph Matesich and Edward Brainerd for their help in writing the computer programs .
REFERENCES
American National Standards Institute. (1969) . American National Standards Methods for the Calculation of the Articulation Index. (ANSI S3.5-1969) . New York : ANSI .
American National Standards Institute. (1997) . American National Standards Methods for the Calculation of the
369

Journal of the American Academy of Audiology/Volume 10, Number 7, July/August 1999
Speech Intelligibility Index. (ANSI S3.5-1997.) New York: ANSI.
Studebaker GA. (1985) . A rationalized arcsine transform. J Speech Hear Res 28:455-462 .
Bartlett MS. (1947) . The use of transformations . Biometrics 3:39-52 .
Beranek L. (1947) . The design of speech communication system . Proceedings of the Institute of Radio Engineers. 35:880-890 .
Dillon H. (1982) . A quantitative examination of the sources of speech discrimination test score variability. Ear Hear 3:51-58 .
Fletcher H, Galt RH. (1950) . The perception of speech and its relation to telephony. JAcoust Soc Am 22:89-151 .
French NR, Steinberg JC . (1947) . Factors governing the intelligibility of speech sounds . JAcoust Soc Am 19:90-119.
Halpin C, Thornton A, Hasso M. (1994) . Low-frequency sensorineural loss : clinical evaluation and implications for hearing aid fitting. Ear Hear 15:71-81 .
Halpin C, Thornton A, Hou Z. (1996) The articulation index in clinical diagnosis and hearing aid fitting . Curr Opin Otolaryngol Head Neck Surg 4:325-334 .
Harris JD . (1965). Speech audiometry. In : GlorigA, ed . Audiometry Principles and Practice . Baltimore: Williams and Wilkins: 151-169.
Hirsh IJ, Davis H, Silverman SR, Reynolds E, Eldert E, Benson RW (1952) . Development of materials for speech audiometry. J Speech Hear Disord 17:321-337 .
Hou Z, Thornton AR . (1994) . A model to evaluate and maximize hearing aid performance by integrating the articulation index across listening conditions . Ear Hear 15:105-112 .
Jandel Scientific . (1994) . TableCurve 2D Windows V2.0. San Rafael, CA: Jandel Scientific .
Jerger J. (1998). Audiometric practices [editorial]. J Am Acad Audiol 9:85-86 .
Kryter KD . (1962) . Methods for the calculation and use of the articulation index. JAcoust Soc Am 34:1689-1697 .
Lotus Development Corporation . (1994). Lotus-123 Release 5. Cambridge, MA: Lotus Development Corp .
Martin FN, Champlin CA, Chambers JA . (1998) . Seventh Survey of Audiometric Practices in the United States . J Am Acad Audiol 9:95-104 .
Newby HA . (1958) . Audiology, Principles and Practice . New York : Appleton-Century-Crofts.
Pavlovic CV (1994). Band importance functions for audi-ological applications . Ear Hear 15:100-104 .
Pavlovic CV, Studebaker GA, Sherbecoe RL . (1986) . An articulation index based procedure for predicting the speech recognition performance of hearing-impaired sub-jects. JAcoust Soc Am 80:50-57 .
Schum DJ, Matthews LJ, Lee F. (1991) . Actual and pre-dicted word-recognition performance of elderly hearing-impaired listeners . J Speech Hear Res 34:636-642 .
Shore I, Bilger RC, Hirsh IJ . (1960) . Hearing aid evalu-ation: reliability of repeated measurements . J Speech Hear Disord 25:152-170 .
Steeneken HJM, Houtgast T. (1980) . A physical method for measuring speech-transmission quality. JAcoust Soc Am 67:318-326 .
Studebaker GA . (1991) . Measures of intelligibility and quality. In : Studebaker GA, Bess FH, and Beck L, eds. The Vanderbilt/Hearing-Aid-Report IL Parkton, MD: York Press: 185-199.
Studebaker GA . (1992, May) . Steps toward a General Predictive Model of Average Speech Recognition Performance. Paper presented at the Arrowhead Conference on Issues inAdvanced HearingAid Research II, Arrowhead, CA.
Studebaker GA, ed . (1995) . User Instruction Manual for UMAPS. Unpublished instruction manual for the University of Memphis Audiometric Programs . Memphis, TN: School ofAudiology and Speech Language Pathology, University of Memphis.
Studebaker GA, McDaniel MD, Sherbecoe RL . (1995) . Evaluating relative speech recognition performance using the proficiency factor and rationalized arcsine differences. J Am Acad Audiol 6:173-182 .
Studebaker GA, Sherbecoe RL. (1991) . Frequency-impor-tance and transfer functions for recorded CID W-22 word lists. J Speech Hear Res 34:427-438 .
Studebaker GA, Sherbecoe RL . (1992) . A Model for the Prediction of Average Speech Recognition Performance of Normal-hearing and Hearing-impaired Persons. Unpublished laboratory report 92-03. Memphis, TN : Hearing Science Laboratory, University of Memphis.
Studebaker GA, Sherbecoe RL. (1993) . Frequency-impor-tance functions for speech recognition . In: Studebaker GA, Hochberg I, eds. Acoustical Factors Affecting Hearing Aid Performance. (2nd ed .) Needham Heights, MA: Allyn and Bacon, 185-204.
Studebaker GA, Sherbecoe RL . (1994, May-June). Evaluating the Speech Recognition Performance of Hearing-impaired Listeners. Paper presented at the Lake Arrowhead Conference on Issues in Advanced Hearing Aid Research, Lake Arrowhead, CA.
Studebaker GA, Sherbecoe RL, Gilmore C . (1991, November). Model PredictingAverage Speech Recognition Performance under Circumscribed Conditions . Poster paper presented at the annual meeting of the American Speech Language Hearing Association, Atlanta, GA .
Studebaker GA, Sherbecoe RL, Gilmore C. (1993) . Frequency-importance and transfer functions for the Auditec of St . Louis recordings of the NU-6 word test . J Speech Hear Res 36:799-807 .
Studebaker GA, Sherbecoe RL, McDaniel DM, Gray GA. (1997) . Age-related changes in monosyllabic word recog-nition performance when audibility is held constant . J Am Acad Audiol 8:150-162 .
Studebaker GA, Sherbecoe RL, McDaniel DM, Gwaltney CA. (1999) . Monosyllabic word recognition at higher than normal speech and noise levels . J Acoust Soc Am 105:2431-2444 .
Thornton AR, Raffin MJ. (1978) . Speech discrimination scores modeled as a binomial variable . J Speech Hear Res 21:507-518 .
Tillman TW Carhart R. (1966) . An Expanded Test for Speech Discrimination Utilizing CNC Monosyllabic Words. (Northwestern University Auditory Test No . 6) . Technical report SAM-TR66-55. Brooks Air Force Base, TX: USAF School ofAerospace Medicine, Aerospace Medical Division .
370