Embed Size (px)
Citation preview

RESEARCH ARTICLE
Predicting the end of lava flow-forming eruptions from space
Estelle Bonny1,2 & Robert Wright1
Received: 21 September 2016 /Accepted: 23 May 2017# Springer-Verlag Berlin Heidelberg 2017
Abstract Although the volcanological community placesgreat emphasis on forecasting the onset of volcanic eruptions,knowing when an effusive eruption will end is just as impor-tant in terms of mitigating hazards. Wadge (J VolcanolGeotherm Res 11:139–168, 1981) postulated that the onsetof an episodic, lava flow-forming basaltic eruption is charac-terized by a rapid increase in effusion rate to a maximum,before decaying over a longer period of time until the eruptionends. We used thermal infrared remote-sensing data acquiredbyNASA’sMODerate Resolution Imaging Spectroradiometer(MODIS) to derive time-averaged discharge rate (TADR) timeseries using the method of Harris et al. (J Geophys Res102(B4):7985–8003, 1997) for 104 eruptions at 34 volcanoesover the last 15 years.We found that 32 eruptions followed thepattern described by Wadge (J Volcanol Geotherm Res11:139–168, 1981). Based on the MODIS-derived maximumlava discharge rate and a decay constant that best fits theexponential waning phase (updated as each new MODISTADR observation is added to the time series), the time atwhich the discharge equals zero, and thus the point at whicheffusion ends, can be predicted. The accuracy of the predictionimproves with the number of data points so that, in the idealcase, the end of effusion can be retro-casted before half of theeruption duration has passed. This work demonstrates the pos-sibility of predicting when an eruption will end using satellite-
derived TADR time series acquired in near real time duringthat eruption. This prediction can be made after an eruptionhas reached its maximum lava discharge rate and the waningphase of the Wadge trend has begun. This approach thereforeonly applies to the case of eruption from a chamber undergo-ing an elastic release of energy during lava flow emplacement,and we provide examples of eruptions where it would not beapplicable.
Keywords Prediction . End-of-eruption . Effusive eruption .
Discharge rate . MODIS
Introduction
The volcanological community has focused much attention onpredicting when an eruption will begin (Linde et al. 1993;Sparks 2003; Marzocchi and Woo 2007; Marzocchi andBebbington 2012; Pallister et al. 2013), mainly taking cuesfrom seismicity (Harlow et al. 1996; Brenguier et al. 2008),ground deformation (Voight et al. 1998; Segall 2013), thermalemissions (Pieri and Abrams 2005; van Manen et al. 2013), orgas emissions (Baubron et al. 1991; Aiuppa et al. 2007).However, accurately forecasting when an eruption will endis similarly important in terms of hazard mitigation. This isespecially true for lava flow-forming eruptions that can threat-en population centers built down slope of vents. For example,accurate forecasting could help in terms of evacuation man-agement allowing decisions to be made as when it is likelygoing to be safe for people to move back to their homes.Although, much more research has been conducted on fore-casting eruption onset than eruption cessation, the recent workof Hooper et al. (2015) is a notable example of effort to fore-cast the end of an eruption (Bárðarbunga 2014–2015) usingdeformation measurements. Attempts to use satellite data to
Editorial responsibility: A. Harris
* Estelle [email protected]
1 Hawaii Institute of Geophysics and Planetology, University ofHawaii, Honolulu, USA
2 Department of Geology and Geophysics, University of Hawaii,Honolulu, USA
Bull Volcanol (2017) 79:52 DOI 10.1007/s00445-017-1134-8
define (but not predict) the end of an effusive eruption havealso been carried out, such as Aries et al. (2001) who showedthat advanced very high-resolution radiometer (AVHRR)3.9 μm radiance undergoes a sharp decline at the cessationof effusion. This can be used as a proxy for eruption termina-tion and is due to the fact that exposure of the highly radiantflow interior through cracks in the flow surface ends when theflow is no longer moving.
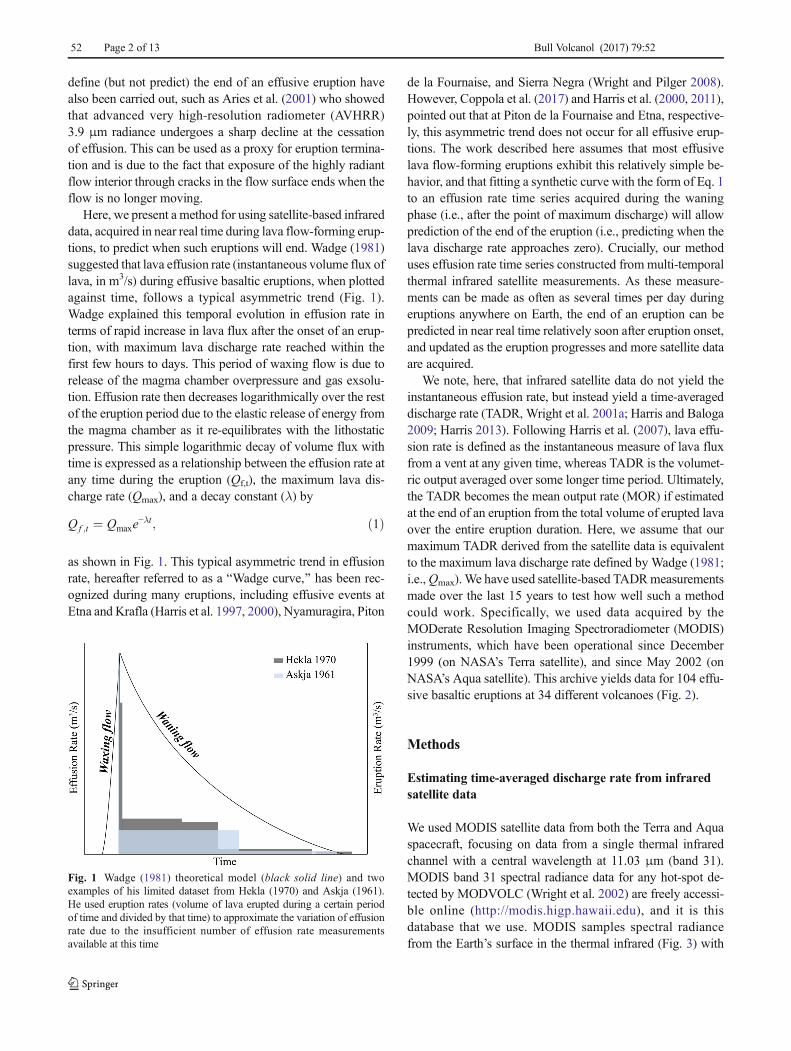
Here, we present a method for using satellite-based infrareddata, acquired in near real time during lava flow-forming erup-tions, to predict when such eruptions will end. Wadge (1981)suggested that lava effusion rate (instantaneous volume flux oflava, in m3/s) during effusive basaltic eruptions, when plottedagainst time, follows a typical asymmetric trend (Fig. 1).Wadge explained this temporal evolution in effusion rate interms of rapid increase in lava flux after the onset of an erup-tion, with maximum lava discharge rate reached within thefirst few hours to days. This period of waxing flow is due torelease of the magma chamber overpressure and gas exsolu-tion. Effusion rate then decreases logarithmically over the restof the eruption period due to the elastic release of energy fromthe magma chamber as it re-equilibrates with the lithostaticpressure. This simple logarithmic decay of volume flux withtime is expressed as a relationship between the effusion rate atany time during the eruption (Qf,t), the maximum lava dis-charge rate (Qmax), and a decay constant (λ) by
Qf ;t ¼ Qmaxe−λt; ð1Þ
as shown in Fig. 1. This typical asymmetric trend in effusionrate, hereafter referred to as a BWadge curve,^ has been rec-ognized during many eruptions, including effusive events atEtna and Krafla (Harris et al. 1997, 2000), Nyamuragira, Piton
de la Fournaise, and Sierra Negra (Wright and Pilger 2008).However, Coppola et al. (2017) and Harris et al. (2000, 2011),pointed out that at Piton de la Fournaise and Etna, respective-ly, this asymmetric trend does not occur for all effusive erup-tions. The work described here assumes that most effusivelava flow-forming eruptions exhibit this relatively simple be-havior, and that fitting a synthetic curve with the form of Eq. 1to an effusion rate time series acquired during the waningphase (i.e., after the point of maximum discharge) will allowprediction of the end of the eruption (i.e., predicting when thelava discharge rate approaches zero). Crucially, our methoduses effusion rate time series constructed from multi-temporalthermal infrared satellite measurements. As these measure-ments can be made as often as several times per day duringeruptions anywhere on Earth, the end of an eruption can bepredicted in near real time relatively soon after eruption onset,and updated as the eruption progresses and more satellite dataare acquired.
We note, here, that infrared satellite data do not yield theinstantaneous effusion rate, but instead yield a time-averageddischarge rate (TADR, Wright et al. 2001a; Harris and Baloga2009; Harris 2013). Following Harris et al. (2007), lava effu-sion rate is defined as the instantaneous measure of lava fluxfrom a vent at any given time, whereas TADR is the volumet-ric output averaged over some longer time period. Ultimately,the TADR becomes the mean output rate (MOR) if estimatedat the end of an eruption from the total volume of erupted lavaover the entire eruption duration. Here, we assume that ourmaximum TADR derived from the satellite data is equivalentto the maximum lava discharge rate defined by Wadge (1981;i.e.,Qmax).We have used satellite-based TADRmeasurementsmade over the last 15 years to test how well such a methodcould work. Specifically, we used data acquired by theMODerate Resolution Imaging Spectroradiometer (MODIS)instruments, which have been operational since December1999 (on NASA’s Terra satellite), and since May 2002 (onNASA’s Aqua satellite). This archive yields data for 104 effu-sive basaltic eruptions at 34 different volcanoes (Fig. 2).
Methods
Estimating time-averaged discharge rate from infraredsatellite data
We used MODIS satellite data from both the Terra and Aquaspacecraft, focusing on data from a single thermal infraredchannel with a central wavelength at 11.03 μm (band 31).MODIS band 31 spectral radiance data for any hot-spot de-tected by MODVOLC (Wright et al. 2002) are freely accessi-ble online (http://modis.higp.hawaii.edu), and it is thisdatabase that we use. MODIS samples spectral radiancefrom the Earth’s surface in the thermal infrared (Fig. 3) with
Fig. 1 Wadge (1981) theoretical model (black solid line) and twoexamples of his limited dataset from Hekla (1970) and Askja (1961).He used eruption rates (volume of lava erupted during a certain periodof time and divided by that time) to approximate the variation of effusionrate due to the insufficient number of effusion rate measurementsavailable at this time
52 Page 2 of 13 Bull Volcanol (2017) 79:52
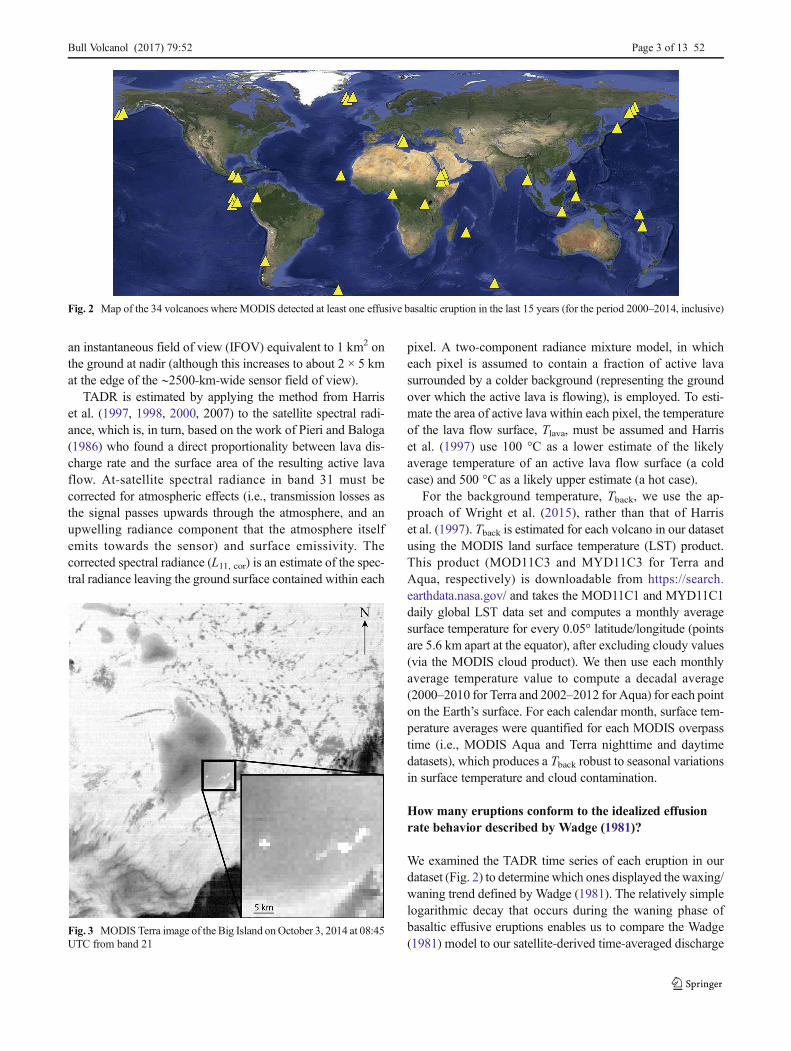
an instantaneous field of view (IFOV) equivalent to 1 km2 onthe ground at nadir (although this increases to about 2 × 5 kmat the edge of the ∼2500-km-wide sensor field of view).
TADR is estimated by applying the method from Harriset al. (1997, 1998, 2000, 2007) to the satellite spectral radi-ance, which is, in turn, based on the work of Pieri and Baloga(1986) who found a direct proportionality between lava dis-charge rate and the surface area of the resulting active lavaflow. At-satellite spectral radiance in band 31 must becorrected for atmospheric effects (i.e., transmission losses asthe signal passes upwards through the atmosphere, and anupwelling radiance component that the atmosphere itselfemits towards the sensor) and surface emissivity. Thecorrected spectral radiance (L11, cor) is an estimate of the spec-tral radiance leaving the ground surface contained within each
pixel. A two-component radiance mixture model, in whicheach pixel is assumed to contain a fraction of active lavasurrounded by a colder background (representing the groundover which the active lava is flowing), is employed. To esti-mate the area of active lava within each pixel, the temperatureof the lava flow surface, Tlava, must be assumed and Harriset al. (1997) use 100 °C as a lower estimate of the likelyaverage temperature of an active lava flow surface (a coldcase) and 500 °C as a likely upper estimate (a hot case).
For the background temperature, Tback, we use the ap-proach of Wright et al. (2015), rather than that of Harriset al. (1997). Tback is estimated for each volcano in our datasetusing the MODIS land surface temperature (LST) product.This product (MOD11C3 and MYD11C3 for Terra andAqua, respectively) is downloadable from https://search.earthdata.nasa.gov/ and takes the MOD11C1 and MYD11C1daily global LST data set and computes a monthly averagesurface temperature for every 0.05° latitude/longitude (pointsare 5.6 km apart at the equator), after excluding cloudy values(via the MODIS cloud product). We then use each monthlyaverage temperature value to compute a decadal average(2000–2010 for Terra and 2002–2012 for Aqua) for each pointon the Earth’s surface. For each calendar month, surface tem-perature averages were quantified for each MODIS overpasstime (i.e., MODIS Aqua and Terra nighttime and daytimedatasets), which produces a Tback robust to seasonal variationsin surface temperature and cloud contamination.
How many eruptions conform to the idealized effusionrate behavior described by Wadge (1981)?
We examined the TADR time series of each eruption in ourdataset (Fig. 2) to determine which ones displayed the waxing/waning trend defined by Wadge (1981). The relatively simplelogarithmic decay that occurs during the waning phase ofbasaltic effusive eruptions enables us to compare the Wadge(1981) model to our satellite-derived time-averaged discharge
Fig. 3 MODIS Terra image of the Big Island onOctober 3, 2014 at 08:45UTC from band 21
Fig. 2 Map of the 34 volcanoes where MODIS detected at least one effusive basaltic eruption in the last 15 years (for the period 2000–2014, inclusive)
Bull Volcanol (2017) 79:52 Page 3 of 13 52

rates. More than simply visualizing each time series, wemodeled a Wadge curve to compare the model with ourspace-based observations. We rearrange Eq. 1 to derive thetime decay constant λ and to estimate a Wadge curve follow-ing
λ ¼ ln0:1%Qmax
Qmax
� �=tend: ð2Þ
In this case, the only required values are the maximum lavadischarge rate Qmax and the time of the end of eruption (tend)taken as the last TADR measurement calculated from ourthermal infrared satellite data (Fig. 4). This approach is onlypossible when tend is known, i.e., when the effusion has al-ready ended, which does not enable the creation of a predic-tive tool. A technique for prediction will be described in theBHow soon after the maximum lava discharge rate is attainedcan we predict the end of an effusive eruption?^ section. Dueto the asymptotic behavior of logarithmic decay, defining theend of the eruption is challenging. For consistency through-out, we considered the eruption to have ended when the time-averaged discharge rate reached a critical value (Qend), select-ed to be 0.1% of the maximum lava discharge rate Qmax. Thiscutoff was found to be representative of the time at whicheruptions in our data set ended (i.e., the TADR after whichradiance from the flow surface was insufficient to generate adetectable thermal anomaly). Choosing this value normalizeseach eruption threshold to its maximum lava discharge rateand therefore varies for different eruptions and volcanoes.Thermal infrared TADR data can be calculated using the hotcase (Tlava = 500 °C) or the cold case (Tlava = 100 °C). Sincethe critical limit is a percentage of Qmax, the estimated decayconstant is equal in both cases, and only the hot case is used inthis study.
If the modeled Wadge curve (as calculated from Eq. 2)followed the satellite data in a given eruption, it was called aWadge-type eruption (Fig. 5a). If the modeled curve washigher than the MODIS-derived discharge rate during the en-tire eruption and also exhibited a plateau of low TADR afterabout half of the eruption duration, it was classified as a half-Wadge-type eruption (Fig. 5b). We distinguished anothergroup of eruptions having more than one maximum lava dis-charge rate (usually two), but still showing a logarithmic de-cay behavior that we called Bdouble-pulse^ type (Fig. 5c). Allother eruptions were classified as undefined because no trendwas visible and/or the TADR actually increased towards theend of the eruption (Fig. 5d). This increase was previouslynoticed byWadge (1981) for some episodes at Kīlauea, whichcan be explained for this open-vent system by the backflowingof lava freezing the conduit resulting in lava pouring out for alonger period. All 104 eruptions in our dataset were placed inone of these four groups (Figs. 5 and 6), and only a third of thetotal conformed to the idealized Wadge-type eruption.
How soon after the maximum lava discharge rate isattained can we predict the end of an effusive eruption?
For Wadge-type eruptions, the simple decay trend of the wan-ing phase can be exploited to predict the end of an eruption.We predict when our end-of-eruption criterion is met (i.e.,Qend = 0.1% of Qmax) by fitting an exponential function(following Eq. 1) to our TADR time series. We estimate thedecay constant that best fits the waning phase of the eruptionbased only on our MODIS-derived satellite data with no Bapriori^ knowledge of the time at which the eruption ended(tend). Once the maximum lava discharge rate had beenreached (i.e., the eruption has entered its waning phase) thetime at which TADR falls below the cessation criteria is pre-dicted using only the MODIS data available at that time andcompared to the known end date of the eruption. Clearly, fewdata are available at first. As the eruption progresses, and newsatellite data become available, we update the best-fit decayconstant as new MODIS TADR observations are added to thetime series (i.e., the amount of data available to constrain theprediction increases with time). By re-computing each time anew TADR is added to the time series, we are able to simulatehow the method would work in near real time during aneruption.
Our results are expressed in two ways. First, we determinehow the prediction of effusion cessation evolves as the amountof TADR data used to compute the prediction increases.Specifically, once Qmax was observed, we progressively addroughly 10% of the total TADR data to the time series, and fita new exponential curve to our satellite measurements eachtime (e.g., 10% of the data, 20, 30, up to 100%). For eachBdata step,^ the predicted end (tend, pred) is then defined asthe time at which the TADR reaches the critical value (Qend)
Fig. 4 Example of satellite-derived TADR time-series fromNyamuragira eruption in 2006 that displays a Wadge-type curve,illustrating the maximum lava discharge rate Qmax and the last MODISmeasurement that defines the end of the eruption (tend)
52 Page 4 of 13 Bull Volcanol (2017) 79:52

and compared (in terms of days) with the observed eruptionend (tend) corresponding with the last TADR data point detect-ed byMODIS. Second, we express our predictions in terms ofpercent of eruption duration, which allows for a simpler com-parison between eruptions since the TADR measurements arenot acquired at regular intervals, or equally spaced in time(e.g., 50% of the total TADR observations after Qmax doesnot always equal 50% of the eruption duration). The best fitof our data was found in a least-square sense (difference
squared between the exponential curve and the satellite data).The difference between the predicted end and the observedend is expressed in terms of Δt (in days or % eruption dura-tion) for each time at which a new TADR estimate is added tothe time series:
Δt ¼ tend;pred−tend ð3Þ
Δt is positive when the predicted cessation is after theobserved end of effusion and negative when it predates theobserved end. Figure 7 provides an illustration of the methodwhere Δt20 is a schematic representation for the Δt that ispredicted using 20% of the TADR data.
After the initial TADR calculation, we account for possiblecloud contamination. Sub-pixel clouds are hard to identify andcan cause low at-satellite spectral radiance, which produces anartificially low TADR estimate. For the eruptions in ourdataset that have a well-defined TADR time series (i.e., a largeamount of data available), we attempt to exclude some cloud-contaminated values by only selecting the peak TADR mea-surements, or local maxima in discharge rate, that are onestandard deviation above the median of all such local maxima(one-nsig criterion). In some cases, this greatly reduces thenumber of data points available for prediction (sometimes toas few as two TADR observations), and in this case, we use all
Fig. 5 Examples of different TADR time-series with the Wadge model curve drawn for comparison. a Wadge type, b half-Wadge, c double pulse, dundefined
Fig. 6 Schematic of different lava discharge rate time-series types
Bull Volcanol (2017) 79:52 Page 5 of 13 52

TADR estimates classified as Bpeaks.^ For other eruptions,mainly those of short duration, the amount of TADR availablecan be so limited that no cloud-screening is feasible and allTADR estimates are used.
Results
Of the 104 eruptions studied, 32 eruptions strictly followed thetypical Wadge curve, eight exhibited a double pulse in TADR,13 corresponded to a half-Wadge type, and 51 were undefinedand did not show any trend at all (Fig. 5). Of the 32 eruptions,only half could be used (the remainder comprised of fewer thanfive TADR data points) and our predictions are summarized inTable 1. The table shows the evolution of the prediction foreach eruption, as we increased the amount of TADR estimatesavailable and updated the best-fit exponential curve. Although,we have divided the time series into percentiles of data used tocompute the curves, far more relevant is how soon after theeruption began can the end-of-eruption prediction be made,and how good is that prediction. For this reason, Table 1 givesboth measures: Δt, both in terms of days and percent of erup-tion duration; and the time since the onset of eruption at whichthe prediction could be made (also in terms of days and percentof eruption duration). For example, to illustrate how the data inthe table are to be interpreted, in the case of the Piton de laFournaise eruption of December 2005, our best prediction(bold in the table) was that the eruption would last 9 days (itlasted 10 days, for a Δt of −1). This prediction would have
been possible on day 3 of the eruption (or after 30%of eruptionduration had elapsed) at which time 30% of the MODIS datathat would ultimately define the total TADR curve for theeruption had been acquired. For the Kizimen eruption of2011, a good prediction (Δt within 7%) is possible on day 47(or after 22% of the eruption had passed, at which time 70% ofthe MODIS data had been acquired) that the eruption wouldlast 198 days (it lasted 212 days, for aΔt of −14 days). And ifwe hadwaited until 48% of the eruption had elapsed (day 102),our best prediction was that the eruption would last 211 dayswhich is within 1% of the actual eruption duration. At thistime, 90% of the MODIS data that would ultimately definethe TADR curve for the eruption had been acquired.
To illustrate the viability of our predictive tool, we concen-trate on three case studies: one eruption of short duration fromPiton de la Fournaise in December 2005, one of medium du-ration from Nyamuragira in 2000, and one of long durationfrom Kizimen in 2011. For each graph shown (Figs. 8, 9, and10), the green horizontal line represents the critical limit, Qend
that defines the end of the eruption. Figs. 8, 9, and 10 allinclude an inset figure, which summarizes how the end-of-eruption prediction changes (i.e., improves as we move upand closer to a Δt of zero along the y-axis) as we use moresatellite data to constrain the prediction (i.e., as the eruptionprogresses, moving right along the x-axis). The more rapidlythe curve in this figure approach a Δt of zero, the better.
Piton de la Fournaise 2005
Piton de la Fournaise is a stratovolcano located in La ReunionIsland, in the Indian Ocean. MODIS detected a lava-producing eruption that started on December 26, 2005 andended on January 4, 2006, for a total duration of 10 days.The maximum lava discharge rate was reached on December27 at 20:49 UTC about a day after the eruption started with aTADR of 8 m3/s (Fig. 8). Since we only have 15 satelliteTADR measurements during the waning phase, we decidedto keep every data point to apply our predictive tool.
Once two measurements after Qmax were obtained, in thiscase 1.5 days after the onset of the eruption (here 15% of theeruption duration), we began fitting an exponential curve to ourdata, which predicted that the eruption would last only 3 daysinstead of the observed 10 days (Δt of −7 days, dark bluediamond in Fig. 8f inset). After adding three more TADR esti-mates 3 days past the onset of the eruption, our method predict-ed that the eruption would last 9 days, which is accurate towithin 1 day of the observed end of eruption (Δt = −1 day, lightblue in Fig. 8f inset). This new prediction was 6 days closer tothe observed end than the prediction made with two data pointsand happened to be the most accurate prediction after 30% ofthe eruption duration had elapsed. Using data from 4 days afterthe eruption onset, we predicted that the eruption would last8 days; in fact, it lasted 10 days (Δt = −2 days, purple diamond
Fig. 7 Cartoon of the method used for predicting the end of the eruptionin this paper. The colors of each exponential curve represent a different fitof a given amount of data (in percent) and give a different predicted end,with the associatedΔt (Δt20 represents theΔt that is predicted using 20%of the TADR data). The red crosses represent three important points: thefirst is the onset of the eruption, the second is the maximum lavadischarge rate, and the last is the last TADR data point or the observederuption end tend. All of the data above are thermal infrared remote-sensing data fromMODIS. Notice that the fit with 40% of the data (greenline) after Qmax is equal to 40% of the eruption duration but this is notalways the case
52 Page 6 of 13 Bull Volcanol (2017) 79:52

in Fig. 8f inset). A few hours later, with one more TADR ob-servations, we reached the best fit curve (same prediction with100% data) which yielded an eruption that would end after8.5 days (Δt of −1.5 days). As we increase the amount ofTADR used and the eruption progresses, the prediction doesnot necessarily get better, but our best end-of-eruption predic-tion (within a day) could be estimated only 3 days after theeruption started (equivalent to 30% of the observed eruptionduration). This result is significant in terms of hazard mitigationfor this type of episodic basaltic eruption with a prediction ofthe eruption cessation 7 days in advance.
Nyamuragira 2000
Nyamuragira is a shield volcano in DR Congo, the most activevolcano in Africa (Smets et al. 2010). An eruption was recordedby MODIS on February 25, 2000 that lasted until April 23,2000, totaling 58 days. The eruption produced a lava flow,bombs, cinder, and ash (Global Volcanism Program 2000).The maximum lava discharge rate was detected on February26 at 20:50 UTC only 1 day after the beginning of the eruptionwith a TADR of 17 m3/s (Fig. 9). In this case, we used all theidentified peaks to increase the amount of data available
Fig. 8 The December 2005 eruption of the Piton de la Fournaise asobserved by MODIS (eruption duration is 10 days). All axes have thesame scale and legend.Δt10 represents theΔt that is predicted using 10%of the TADR data. f Inset shows the evolution of the prediction as we
increased the amount of data used to fit Eq. 1 (a–f; 15% eruption durationto 100%), and the colors of the TADR data points (crosses) and curvesmatch to show which data were used to generate each prediction
Bull Volcanol (2017) 79:52 Page 7 of 13 52
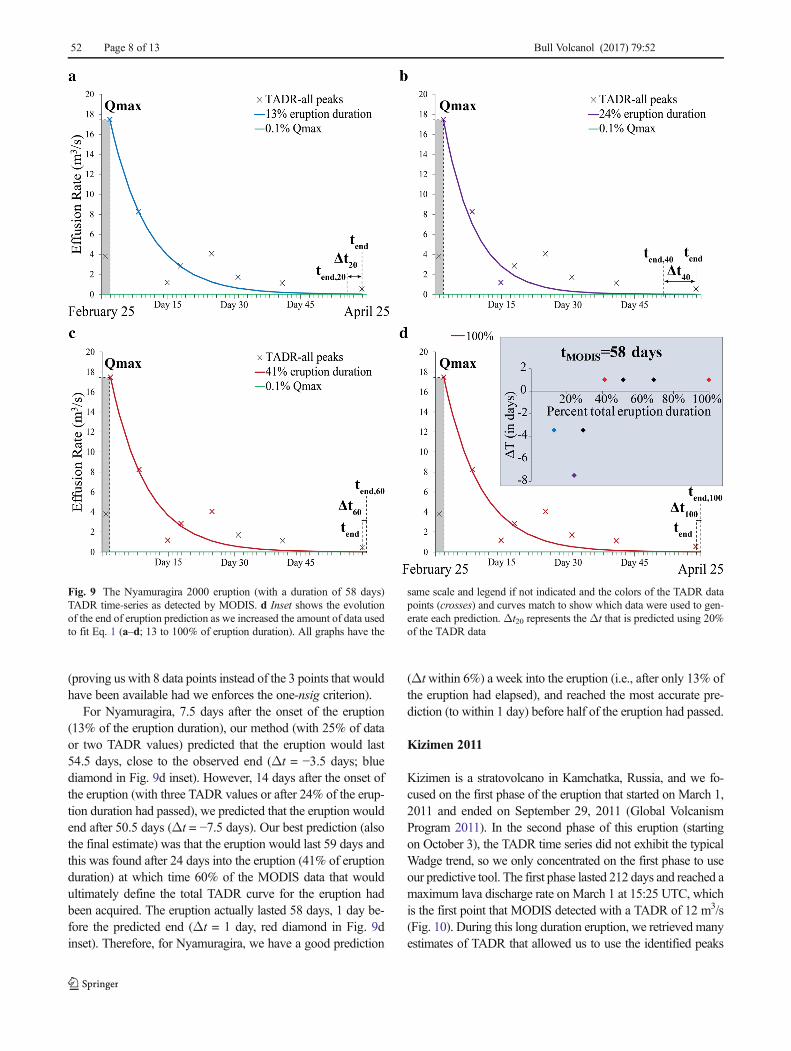
(proving us with 8 data points instead of the 3 points that wouldhave been available had we enforces the one-nsig criterion).
For Nyamuragira, 7.5 days after the onset of the eruption(13% of the eruption duration), our method (with 25% of dataor two TADR values) predicted that the eruption would last54.5 days, close to the observed end (Δt = −3.5 days; bluediamond in Fig. 9d inset). However, 14 days after the onset ofthe eruption (with three TADR values or after 24% of the erup-tion duration had passed), we predicted that the eruption wouldend after 50.5 days (Δt = −7.5 days). Our best prediction (alsothe final estimate) was that the eruption would last 59 days andthis was found after 24 days into the eruption (41% of eruptionduration) at which time 60% of the MODIS data that wouldultimately define the total TADR curve for the eruption hadbeen acquired. The eruption actually lasted 58 days, 1 day be-fore the predicted end (Δt = 1 day, red diamond in Fig. 9dinset). Therefore, for Nyamuragira, we have a good prediction
(Δtwithin 6%) a week into the eruption (i.e., after only 13% ofthe eruption had elapsed), and reached the most accurate pre-diction (to within 1 day) before half of the eruption had passed.
Kizimen 2011
Kizimen is a stratovolcano in Kamchatka, Russia, and we fo-cused on the first phase of the eruption that started on March 1,2011 and ended on September 29, 2011 (Global VolcanismProgram 2011). In the second phase of this eruption (startingon October 3), the TADR time series did not exhibit the typicalWadge trend, so we only concentrated on the first phase to useour predictive tool. The first phase lasted 212 days and reached amaximum lava discharge rate on March 1 at 15:25 UTC, whichis the first point that MODIS detected with a TADR of 12 m3/s(Fig. 10). During this long duration eruption, we retrieved manyestimates of TADR that allowed us to use the identified peaks
Fig. 9 The Nyamuragira 2000 eruption (with a duration of 58 days)TADR time-series as detected by MODIS. d Inset shows the evolutionof the end of eruption prediction as we increased the amount of data usedto fit Eq. 1 (a–d; 13 to 100% of eruption duration). All graphs have the
same scale and legend if not indicated and the colors of the TADR datapoints (crosses) and curves match to show which data were used to gen-erate each prediction. Δt20 represents the Δt that is predicted using 20%of the TADR data
52 Page 8 of 13 Bull Volcanol (2017) 79:52
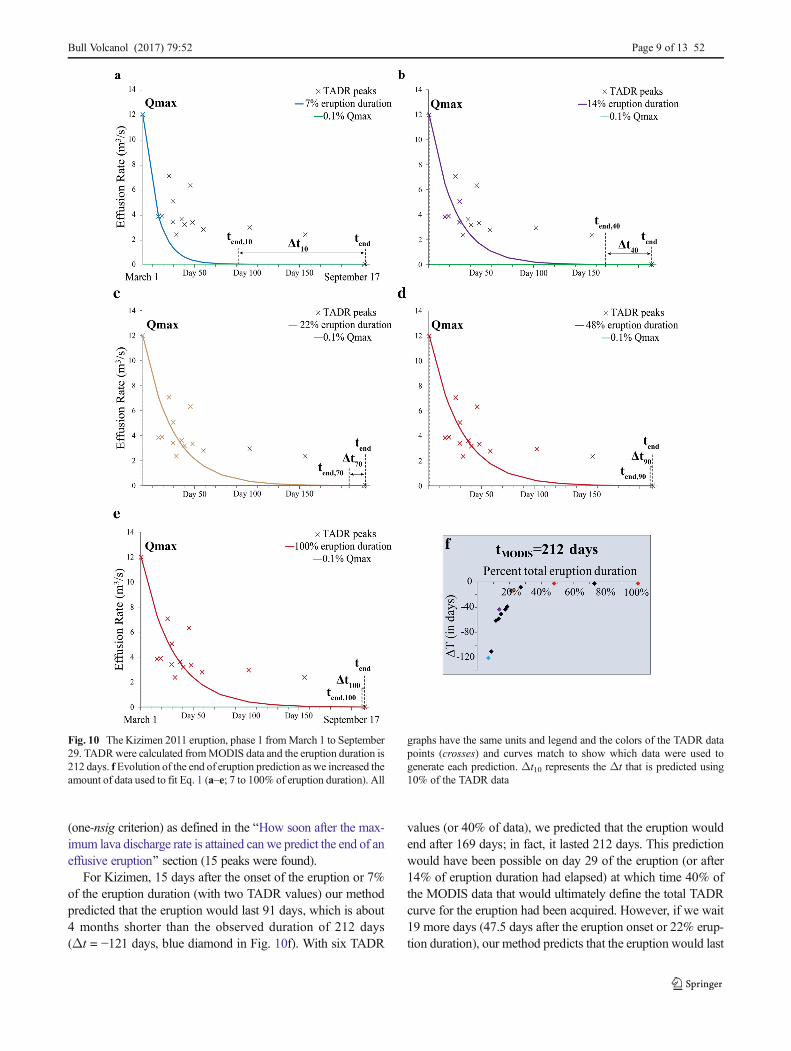
(one-nsig criterion) as defined in the BHow soon after the max-imum lava discharge rate is attained can we predict the end of aneffusive eruption^ section (15 peaks were found).
For Kizimen, 15 days after the onset of the eruption or 7%of the eruption duration (with two TADR values) our methodpredicted that the eruption would last 91 days, which is about4 months shorter than the observed duration of 212 days(Δt = −121 days, blue diamond in Fig. 10f). With six TADR
values (or 40% of data), we predicted that the eruption wouldend after 169 days; in fact, it lasted 212 days. This predictionwould have been possible on day 29 of the eruption (or after14% of eruption duration had elapsed) at which time 40% ofthe MODIS data that would ultimately define the total TADRcurve for the eruption had been acquired. However, if we wait19 more days (47.5 days after the eruption onset or 22% erup-tion duration), our method predicts that the eruption would last
Fig. 10 The Kizimen 2011 eruption, phase 1 fromMarch 1 to September29. TADRwere calculated fromMODIS data and the eruption duration is212 days. fEvolution of the end of eruption prediction aswe increased theamount of data used to fit Eq. 1 (a–e; 7 to 100% of eruption duration). All
graphs have the same units and legend and the colors of the TADR datapoints (crosses) and curves match to show which data were used togenerate each prediction. Δt10 represents the Δt that is predicted using10% of the TADR data
Bull Volcanol (2017) 79:52 Page 9 of 13 52

Tab
le1
Summaryof
the16
Wadge
eruptio
npredictio
ns
P.Fo
urnaiseDecem
ber2005
10days
(a)
Nyamuragira2000
58days
(p)
Kizim
en2011
212days
(n)
Cam
eroon2000
48.5
days
(a)
Δt
Tim
esinceeruptio
nonset
Δt
Tim
esinceeruptio
nonset
Δt
Tim
esinceeruptio
nonset
Δt
Tim
esinceeruptio
nonset
%data
days
%days
%days
%days
%days
%days
%days
%days
%10
−7−7
01.5
15−1
21−5
715
720
−7−7
02
19−3.5
−6
7.5
13−1
10−5
218.5
9−3
3−6
816.5
3430
−1−1
03
30−5
8−2
729
14−3
3−6
818.5
3840
−1.5
−15
331
−7.5
−13
1424
−43
−20
2914
−33
−68
20.5
4250
−2−2
04
39−3
.5−6
1729
−43
−20
3717
−33
−68
2143
60−1
.5−1
54
401
224
41−3
9−1
840
19−3
3−6
822.5
4670
−1.5
−15
770
12
3052
−14
−747.5
22−1
2.5
−26
2347
80−1
.5−1
58.5
85−8
−458
27−1
2−2
532
6690
−1.5
−15
990
12
4069
−2−1
102
48−1
2−2
539
80100
−1.5
−15
10100
12
58100
−2−1
212
100
−12
−25
48.5
100
EtnaJuly
2001
21.5
days
(a)
EtnaNov
2007
1day(a)
Reventador2007
62days
(a)
Stromboli2007
34days
(p)
Δt
Tim
esinceeruptio
nonset
Δt
Tim
esinceeruptio
nonset
Δt
Tim
esinceeruptio
nonset
Δt
Tim
esinceeruptio
nonset
%data
days
%days
%days
%days
%days
%days
%days
%days
%10
−11.5
−53
628
−26.5
−78
26
20−1
0−4
77.5
3530
−7−3
39
42−2
3.5
−69
618
40−6
−28
10.5
491
00.4
40−7
.5−1
212
19−1
4.5
−42
1235
50−6
−28
11.5
53−1
1.5
−33
1647
60−4
−19
1360
10
0.5
50−1
1−1
815
24−1
0−2
919
5670
−3.5
−16
14.5
67−9
−26
2882
80−3
.5−1
616.5
761
00.9
90−1
1−1
815
2490
−3.5
−16
1988
−8−2
332
94100
−3.5
−16
21.5
100
10
1100
−11
−18
62100
−8−2
334
100
Hekla2000
4days
(a)
Klyuchevskoy2008–2009
67.5
days
(n)
Llaim
aApril2009
10days
(a)
Nyamuragira2006
16days
(a)
Δt
Tim
esinceeruptio
nonset
Δt
Tim
esinceeruptio
nonset
Δt
Tim
esinceeruptio
nonset
Δt
Tim
esinceeruptio
nonset
%data
days
%days
%days
%days
%days
%days
%days
%days
%10
−5.5
−55
1.8
1820
10250
0.4
10−5
.5−8
3044
−5−5
02
20−6
−38
850
301
250.5
13−1
8.5
−27
3044
−4.5
−45
2.5
25−1.5
−9
8.4
5340
0.5
131
25−1
9.5
−29
30.5
45−3
−30
2.9
29−1
.5−9
8.9
5650
125
125
00
330
00
956
601
251.4
35−2
0.5
−30
3146
0.5
53.5
351.5
910.9
6870
125
1.4
35−1
7.5
−26
31.5
471.5
154
401.5
911
6980
125
3.4
85−1
2.5
−19
32.5
482
204.9
491.5
914
8890
125
3.4
85−5
.5−8
3349
2.5
256.9
691.5
915.9
99100
125
4100
−5.5
−867.5
100
2.5
2510
100
1.5
916
100
52 Page 10 of 13 Bull Volcanol (2017) 79:52

198 days, which is accurate to within 14 days (Δt = −14 daysor 7% the eruption duration, brown diamond in Fig. 10f) of theobserved end. At 102 days after the eruption onset (about halfthe eruption duration), our method predicted that the eruptionwould end after 210 days which is 2 days from the observedend. The prediction does not change once we add more data toour method. This case study shows that after only 14% of theeruption had elapsed (day 29), the end of the effusion could bepredicted with a 20% accuracy (Δt = −20% eruption duration,which represents 43 days before the observed end). However,if we wait until 22% of the eruption has passed, a highly accu-rate end-of-eruption prediction can be made with aΔt of −7%.And this could be improved to a 2-day offset in the predictionwith half of the eruption duration.
Discussion and conclusions
Our initial goal was to determine a decay constant that bestdescribed all 104 eruptions in our dataset that would beBglobally applicable^ and then to use this global value toretro-cast the end of basaltic effusive eruptions. However,we observe too wide a range of decay constant values andthus a single average decay constant would not be valid forall eruptions. Focusing on a single volcano, the same issuearises: each eruption from a specific volcano has a uniqueTADR time-series trend that we cannot generalize (Harriset al. 2011; Coppola et al. 2017).
Using the ideal case defined by Wadge (1981), it ispossible to predict in advance when effusion will ceaseif the waxing/waning behavior of the TADR time seriesfollows this trend. One limitation of this technique is thatit may not be obvious initially whether the eruption willexhibit the Wadge-type TADR behavior, although the sat-ellite data themselves could be used to make this deter-mination as the TADR curve is compiled. The method wepresent is also potentially useful for other types of erup-tion, like the double pulse. In this case, the predictionswould simply be reset after the secondary TADR peak.The detection of the maximum lava discharge rate Qmax
is of great importance, and missing it would prevent areliable forecast, especially when there is inadequate dataand no observations close to the true time of Qmax tocompensate. How many of our time series were not clas-sified as BWadge-type^ eruptions simply because MODISdid not sample the key maximum lava discharge rate? Weexperimented with what would happen when removingQmax from our TADR time series for some eruptions inour dataset and observed three different outcomes: (i) theWadge curve could not be defined anymore, (ii) theWadge curve was still visible but the prediction was de-graded, or lastly, and perversely, (iii) the prediction ame-liorated. Improved temporal resolution of the satellite dataT
able1
(contin
ued)
P.Fo
urnaiseAugust2
004
61.5days
(p)
P.Fo
urnaiseJuly
2006
21.5
days
(a)
P.Fo
urnaiseApril2007
29days
(p)
P.Fo
urnaiseOctober
2010
21days
(p)
Δt
Tim
esinceeruptio
nonset
Δt
Tim
esinceeruptio
nonset
Δt
Tim
esinceeruptio
nonset
Δt
Tim
esinceeruptio
nonset
%data
days
%days
%days
%days
%days
%days
%days
%days
%10
−28.5
−46
2033
−20.5
−95
29
−2−7.5
10.5
3720
−3−14
4.5
21−7
−25
1346
−12.5
−60
210
30−2
7−4
425
417
335.5
26−7
−25
14.5
51−2
−10
419
40−11.5
−19
27.5
455
236
29−6
−21
16.5
581
−55
2450
733
10.5
49−5
−18
20.5
720
05.5
2660
−11.5
−19
43.5
718
3714.5
67−5
−18
21.5
751.5
78.5
4070
−11.5
−19
47.5
778
3715.5
73−4
.5−1
623.5
822.5
1212
5780
10.5
4916.5
77−4
.5−1
627
943.5
1715.5
7490
−11.5
−19
54.5
8912
5620
93−4
.5−1
628.5
993.5
1716
76100
−11.5
−19
61.5
100
1256
21.5
100
11
29100
3.5
1721
100
InboldistheBbest^predictio
n(the
smallestΔt)andinitalic
isareasonablygood
predictio
n(the
earliestpredictio
nwith
aΔtatorlessthan
25%
oftheeruptio
nduratio
n),and
inbolditalic
iswhenboththe
good
andbestpredictio
narehappeningatthesametim
e.Δtisindays
andinpercentoftheeruptio
nduratio
n.The
sameisgivenforthetim
esinceeruptio
nonsetatw
hich
thepredictio
ncouldhave
been
made(indays
andinpercentoftheeruptio
nduratio
n).T
heem
ptycells
arefornon-availabledata.E
acheruptio
nuses
differentamountof
TADRdatatomakeourpredictio
nandastands
forusingallthe
TADRavailablewith
outscreening
forlowvalues,p
isforallthe
availableBpeaks^TA
DR,and
nisfortheplus
one-nsig
criterion
Bull Volcanol (2017) 79:52 Page 11 of 13 52
acquisitions (perhaps by merging data from multiple plat-forms) would help ameliorate this.
Another limitation arises from the thermal cooling be-havior of a lava flow. Some lava flows can continue toradiate heat for a long period even after the flow hasstopped advancing and can still be Bhot^ enough to bedetectable by space-based sensors. The end of an eruptionis therefore hard to define and often there is a discrepancybetween the start and end date recorded depending on thetechniques used, e.g., satellite measurements, the GlobalVolcanism Program database and literature on specificeruptions. For consistency throughout this work, we de-cided to use only our thermal infrared remote-sensing datafor reference in our predictive tool. However, the work ofAries et al. (2001) and Wright et al. (2001b) shows thatprecipitous decreases in emitted short-wave and mid-waveinfrared (SWIR and MWIR, respectively) radiance accom-pany the time at which an active lava flow stops moving.In short, when the flow stops moving fresh cracks on theflow surface (which expose the hotter flow interior thatcontribute greatly to the observed SWIR and MWIR radi-ance) are not created to replace cooling lava in oldercracks. As such, defining the end of an eruption usingthermal infrared satellite data should be somewhat robustprovided the detection method using the SWIR or MWIRspectral intervals.
The TADR that marks the end of eruption has been as-sumed arbitrarily as 0.1% of the maximum lava dischargerate since it works best for most of the Wadge type erup-tions. But one can argue that a fixed value should be used atall time, such as the 2–3 m3/s that Wadge mentioned in his1981 paper. But with technologic advancements, it is nowpossible to resolve much lower values of discharge rates so
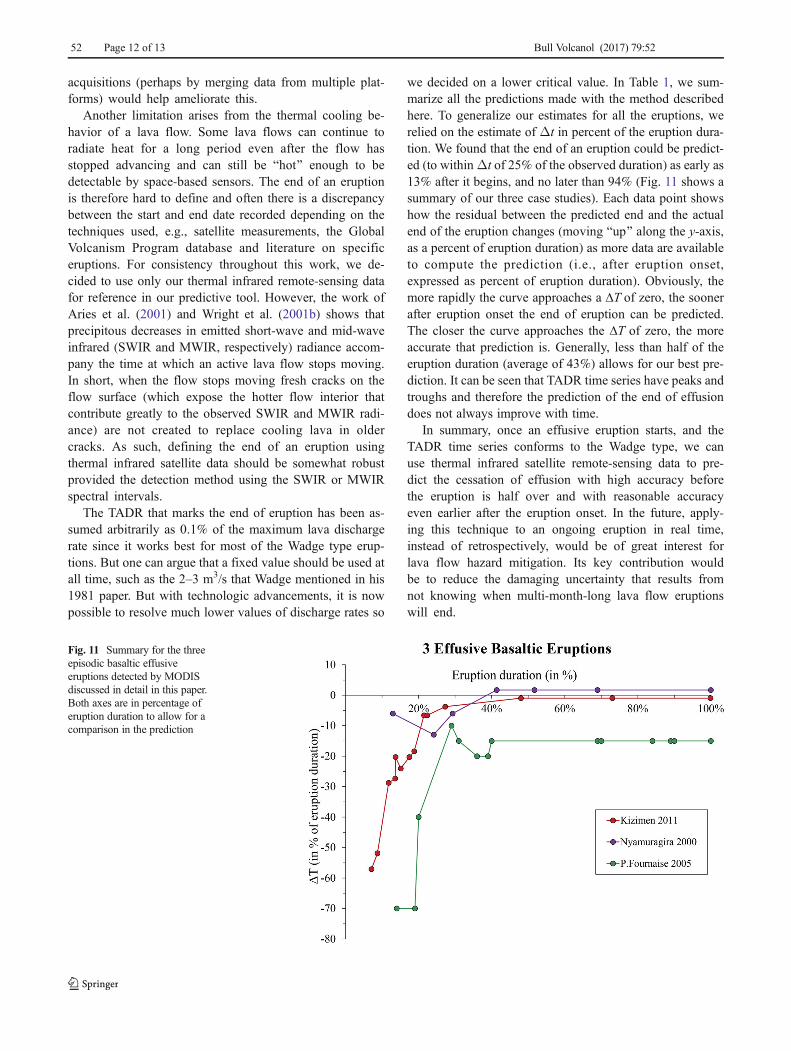
we decided on a lower critical value. In Table 1, we sum-marize all the predictions made with the method describedhere. To generalize our estimates for all the eruptions, werelied on the estimate of Δt in percent of the eruption dura-tion. We found that the end of an eruption could be predict-ed (to withinΔt of 25% of the observed duration) as early as13% after it begins, and no later than 94% (Fig. 11 shows asummary of our three case studies). Each data point showshow the residual between the predicted end and the actualend of the eruption changes (moving Bup^ along the y-axis,as a percent of eruption duration) as more data are availableto compute the prediction (i.e., after eruption onset,expressed as percent of eruption duration). Obviously, themore rapidly the curve approaches a ΔT of zero, the soonerafter eruption onset the end of eruption can be predicted.The closer the curve approaches the ΔT of zero, the moreaccurate that prediction is. Generally, less than half of theeruption duration (average of 43%) allows for our best pre-diction. It can be seen that TADR time series have peaks andtroughs and therefore the prediction of the end of effusiondoes not always improve with time.
In summary, once an effusive eruption starts, and theTADR time series conforms to the Wadge type, we canuse thermal infrared satellite remote-sensing data to pre-dict the cessation of effusion with high accuracy beforethe eruption is half over and with reasonable accuracyeven earlier after the eruption onset. In the future, apply-ing this technique to an ongoing eruption in real time,instead of retrospectively, would be of great interest forlava flow hazard mitigation. Its key contribution wouldbe to reduce the damaging uncertainty that results fromnot knowing when multi-month-long lava flow eruptionswill end.
Fig. 11 Summary for the threeepisodic basaltic effusiveeruptions detected by MODISdiscussed in detail in this paper.Both axes are in percentage oferuption duration to allow for acomparison in the prediction
52 Page 12 of 13 Bull Volcanol (2017) 79:52

Acknowledgements EB and RW were funded by NASA(NNX14AP34G and NNX14AP37G). Harold Garbeil and Eric Pilger(HIGP) provided programming support and Pete Mouginis-Mark(HIGP) provided some helpful insights. The manuscipt benefited fromreviews by Andy Harris and an anonymous reviewer. This is HIGP pub-lication 2252 and SOEST publication 9909.
References
Aiuppa A, Moretti R, Federico C, Giudice G, Gurrieri S, Liuzzo M,Papale P, Shinohara H, Valenza M (2007) Forecasting Etna erup-tions by real-time observation of volcanic gas composition. Geology35(12):1115–1118. doi:10.1130/G24149A.1
Aries SE, Harris AJL, Rothery DA (2001) Remote infrared detection of thecessation of volcanic eruptions. Geophys res Lett 28(9):1803–1806
Baubron JC, Allard P, Sabroux JC, Tedesco D, Toutain JP (1991) Soil gasemanations as precursory indicators of volcanic eruptions. J GeolSoc Lond 148:571–576
Brenguier F, Shapiro NM, Campillo M, Ferrazzini V, Duputel Z, CoutantO, Nercessian A (2008) Towards forecasting volcanic eruptionsusing seismic noise. Nat Geosci 1:126–130. doi:10.1038/ngeo104
Coppola D, Di Muro A, Peltier A, Villeneuve N, Ferrazzini V, Favalli M,Bachèlery P, Gurioli L, Harris AJL, Moune S, Vlastélic I, Galle B,Arellano S, Aiuppa A (2017) Shallow system rejuvenation andmag-ma discharge trends at Piton de la Fournaise volcano (la RéunionIsland). Earth Planet Sci Lett 463:13–24
Global Volcanism Program (2011) Report on Kizimen (Russia). In:Wunderman R (ed) Bull Glob Volcanism Netw 36:10.Smithsonian Institution. doi:10.5479/si.GVP.BGVN201110-300230
Global Volcanism Program (2000) Report on Nyamuragira (DR Congo).In: Wunderman R (ed) Bull Glob Volcanism Netw 25:1.Smithsonian Institution. doi:10.5479/si.GVP.BGVN200001-223020
Harlow DH, Power JA, Laguerta EP, Ambubuyog G, White RA, HoblittRP (1996) Precursory seismicity and forecasting of the June 15,1991, eruption of Mount Pinatubo. Fire and Mud: eruptions andlahars of Mount Pinatubo, Philippines, pp 223–247
Harris AJL, Baloga S (2009) Lava discharge rates from satellite-measuredheat flux. Geophys Res Lett 36:L19302. doi:10.1029/2009GL039717
Harris AJL, Blake S, Rothery DA, Stevens NF (1997) A chronology ofthe 1991 to 1993 Mount Etna eruption using advanced very highresolution radiometer data: implications for real-time thermal volca-no monitoring. J Geophys Res 102(B4):7985–8003
Harris AJL, Flynn LP, Keszthelyi L, Mouginis-Mark PJ, Rowland SK,Resing JA (1998) Calculation of lava effusion rates from LandsatTM data. Bull Volcanol 60:52–71
Harris AJL, Murray JB, Aries SE, Davies MA, Flynn LP, Wooster MJ,Wright R, Rothery DA (2000) Effusion rate trends at Etna andKrafla and their implications for eruptive mechanisms. J VolcanolGeotherm Res 102:237–270
Harris AJL, Dehn J, Calvari S (2007) Lava effusion rate definition andmeasurement: a review. Bull Volcanol 70:1–22. doi:10.1007/s00445-007-0120-y
Harris AJL, Steffke A, Calvari S, Spampinato L (2011) Thirty years ofsatellite-derived lava discharge rates at Etna: implications for steadyvolumetric output. J Geophys Res 116:B08204. doi:10.1029/2011JB008237
Harris AJL (2013) Thermal remote sensing of active volcanoes: a user’smanual. Cambridge University Press
Hooper AJ, Gudmundsson MT, Bagnardi M, Jarosch AH, Spaans K,Magnússon E, Parks M, Dumont S, Ofeigsson B, Sigmundsson F,Hreinsdottir S, Dahm T, Jonsdottir, K (2015) Forecasting of floodbasalt eruptions: lessons from Bárðarbunga. AGU Fall MeetingAbstracts
Linde AT, Agustsson K, Sacks IS, Stefansson R (1993)Mechanism of the1991 eruption of Hekla from continuous borehole strain monitoring.Nature 365(6448):737–740
Marzocchi W, Bebbington MS (2012) Probabilistic eruption forecastingat short and long time scales. Bull Volcanol 74:1777–1805. doi:10.1007/s00445-012-0633-x
Marzocchi W, Woo G (2007) Probabilistic eruption forecasting and thecall for an evacuation. Geophys Res Lett 34:L22310. doi:10.1029/2007GL031922
Pallister JS, Schneider DJ, Griswold JP, Keeler RH, Burton WC,Noyles C, Newhall CJ, Ratdomopurbo A (2013) Merapi 2010eruption—chronology and extrusion rates monitored with satelliteradar and used in eruption forecasting. J Volcanol Geotherm Res261:144–152
Pieri D, Abrams M (2005) ASTER observations of thermal anomaliespreceding the April 2003 eruption of Chikurachki volcano, KurileIslands, Russia. Remote Sens Environ 99(1):84–94
Pieri DC, Baloga SM (1986) Eruption rate, area, and length relation-ships for some Hawaiian lava flows. J Volcanol Geotherm res 30:29–45
Segall P (2013) Volcano deformation and eruption forecasting. In:Pyle DM, Mather TA, Biggs J (eds) Remote sensing of volca-noes and volcanic processes: integrating observation and model-ling. Geol Soc London Spec Pub 380:85–106. doi:10.1144/SP380.4
Smets B,Wauthier C, d’Oreye N (2010) A newmap of the lava flow fieldof Nyamulagira (D.R. Congo) from satellite imagery. J Afr Earth Sci58:778–786. doi:10.1016/j.jafrearsci.2010.07.005
Sparks RSJ (2003) Forecasting volcanic eruptions. Earth Planet Sci Lett210:1–15. doi:10.1016/S0012-821X(03)00124-9
van Manen SM, Blake S, Dehn J, Valcic L (2013) Forecasting largeexplosions at Bezymianny Volcano using thermal satellite data.Geol Soc Lond Spec Publ 380(1):187–201
Voight B, Hoblitt RP, Clarke AB, Lockhart AB, Miller AD, Lynch L,McMahon J (1998) Remarkable cyclic ground deformation moni-tored in real-time on Montserrat, and its use in eruption forecasting.Geophys Res Lett 25(18):3405–3408
Wadge G (1981) The variation of magma discharge during basaltic erup-tions. J Volcanol Geotherm Res 11:139–168
Wright R, Blake S, Harris AJL, Rothery DA (2001a) A simple explana-tion for the space-based calculation of lava eruption rates. EarthPlanet Sci Lett 192:223–233
Wright R, Flynn LP, Harris AJL (2001b) Evolution of lava flow-fields atMount Etna, 27-28 October 1999, observed by Landsat 7 ETM+.Bull Volcanol 63:1–7. doi:10.1007/s004450100124
Wright R, Flynn L, Garbeil H, Harris AJL, Pilger E (2002) Automatedvolcanic eruption detection using MODIS. Remote Sens Environ82:135–155
Wright R, Pilger E (2008) Radiant flux from Earth’s subaerially eruptingvolcanoes. Int J Remote Sens 29(22):6443–6466. doi:10.1080/01431160802168210
Wright R, Blackett M, Hill-Butler C (2015) Some observations regardingthe thermal flux from Earth’s erupting volcanoes for the period of2000 to 2014. Geophys Res Lett 42. doi:10.1002/2014GL061997
Bull Volcanol (2017) 79:52 Page 13 of 13 52