Embed Size (px)
Citation preview
PREDICTING TBM PENETRATION RATES
IN SELECTED ROCK TYPES
By
Peter J. Tarkoy Department of Civil Engineering
University of Illinois at Urbana-Champaign
Presented at the
Ninth Canadian Symposium on Rock Mechanics, Montreal, Canada, December 13-15, 1973
Reference: Tarkoy, P.J. (1974). Predicting Tunnel Boring Machine (TBM) Penetration Rates and Cutter Costs in Selected Rock Types. Proceedings of the 9th Canadian Rock Mechanics Symposium, Montreal, December 13-15, 1973. Mines Branch, Department of Energy, Mines and Resources, Ottawa. pp. 263-274.

3
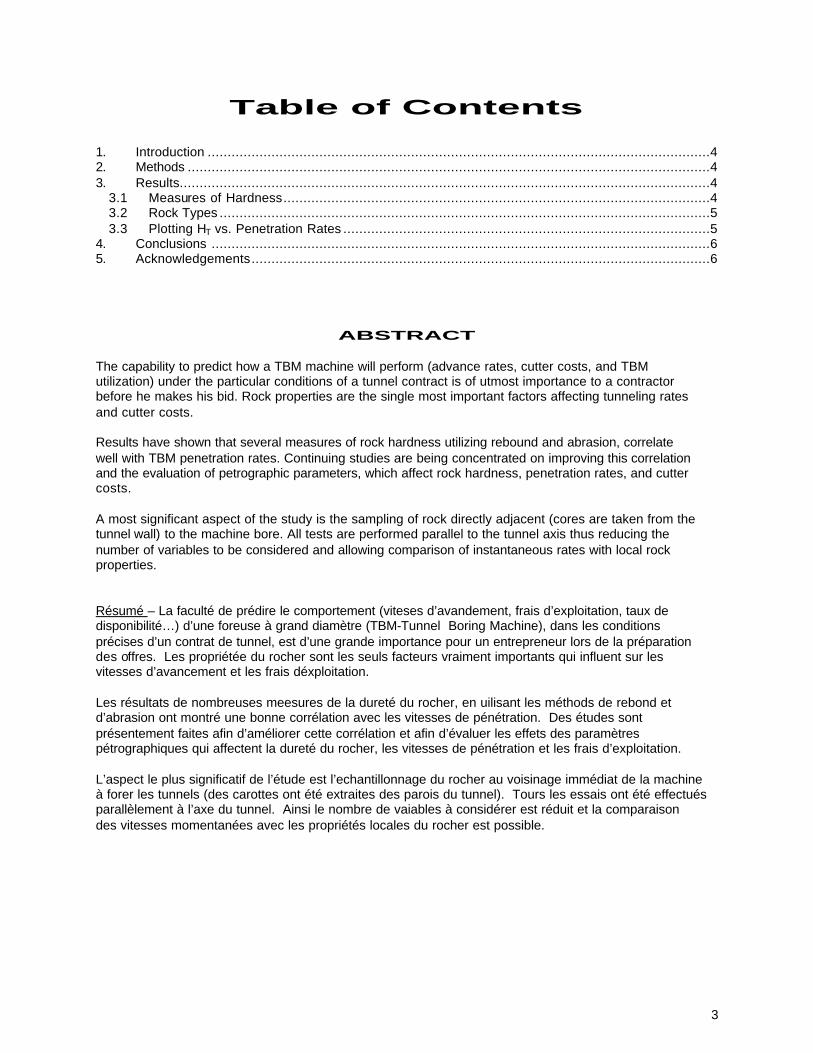
Table of Contents
1. Introduction ..............................................................................................................................4 2. Methods ...................................................................................................................................4 3. Results.....................................................................................................................................4
3.1 Measures of Hardness...........................................................................................................4 3.2 Rock Types ...........................................................................................................................5 3.3 Plotting HT vs. Penetration Rates ............................................................................................5
4. Conclusions .............................................................................................................................6 5. Acknowledgements...................................................................................................................6
ABSTRACT The capability to predict how a TBM machine will perform (advance rates, cutter costs, and TBM utilization) under the particular conditions of a tunnel contract is of utmost importance to a contractor before he makes his bid. Rock properties are the single most important factors affecting tunneling rates and cutter costs. Results have shown that several measures of rock hardness utilizing rebound and abrasion, correlate well with TBM penetration rates. Continuing studies are being concentrated on improving this correlation and the evaluation of petrographic parameters, which affect rock hardness, penetration rates, and cutter costs. A most significant aspect of the study is the sampling of rock directly adjacent (cores are taken from the tunnel wall) to the machine bore. All tests are performed parallel to the tunnel axis thus reducing the number of variables to be considered and allowing comparison of instantaneous rates with local rock properties. Résumé – La faculté de prédire le comportement (viteses d’avandement, frais d’exploitation, taux de disponibilité…) d’une foreuse à grand diamètre (TBM-Tunnel Boring Machine), dans les conditions précises d’un contrat de tunnel, est d’une grande importance pour un entrepreneur lors de la préparation des offres. Les propriétée du rocher sont les seuls facteurs vraiment importants qui influent sur les vitesses d’avancement et les frais déxploitation. Les résultats de nombreuses meesures de la dureté du rocher, en uilisant les méthods de rebond et d’abrasion ont montré une bonne corrélation avec les vitesses de pénétration. Des études sont présentement faites afin d’améliorer cette corrélation et afin d’évaluer les effets des paramètres pétrographiques qui affectent la dureté du rocher, les vitesses de pénétration et les frais d’exploitation. L’aspect le plus significatif de l’étude est l’echantillonnage du rocher au voisinage immédiat de la machine à forer les tunnels (des carottes ont été extraites des parois du tunnel). Tours les essais ont été effectués parallèlement à l’axe du tunnel. Ainsi le nombre de vaiables à considérer est réduit et la comparaison des vitesses momentanées avec les propriétés locales du rocher est possible.
4
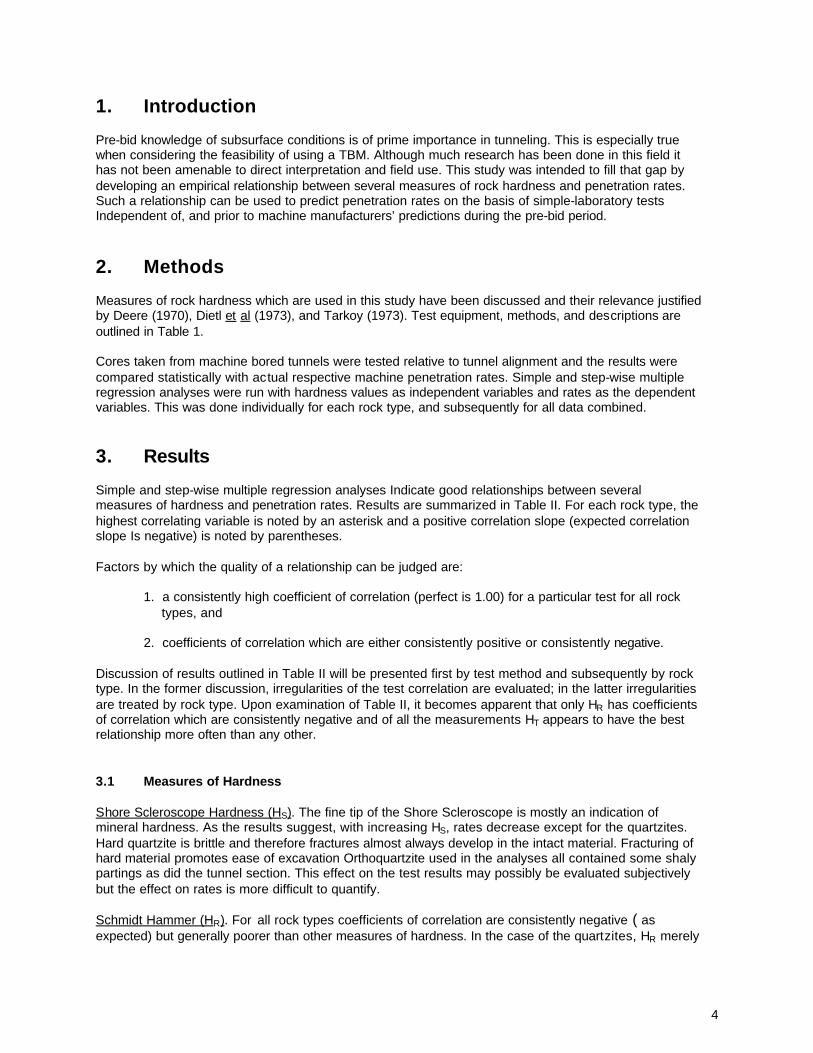
1. Introduction Pre-bid knowledge of subsurface conditions is of prime importance in tunneling. This is especially true when considering the feasibility of using a TBM. Although much research has been done in this field it has not been amenable to direct interpretation and field use. This study was intended to fill that gap by developing an empirical relationship between several measures of rock hardness and penetration rates. Such a relationship can be used to predict penetration rates on the basis of simple-laboratory tests Independent of, and prior to machine manufacturers’ predictions during the pre-bid period.
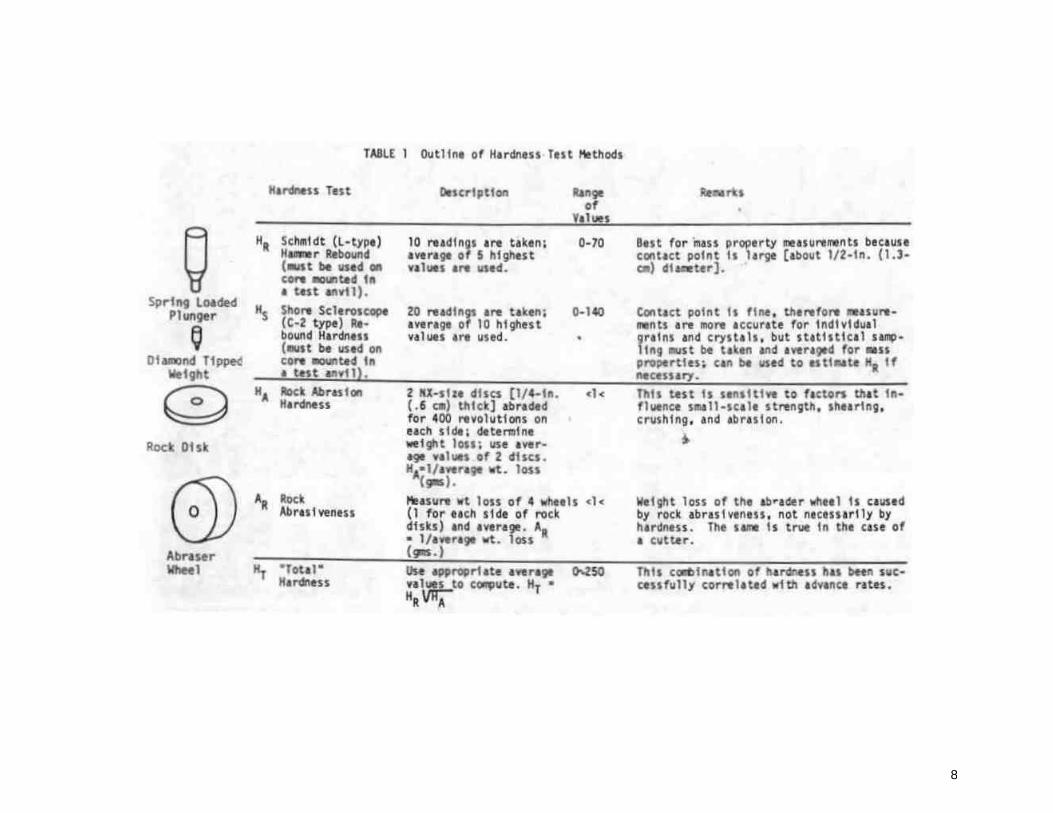
2. Methods Measures of rock hardness which are used in this study have been discussed and their relevance justified by Deere (1970), Dietl et al (1973), and Tarkoy (1973). Test equipment, methods, and descriptions are outlined in Table 1. Cores taken from machine bored tunnels were tested relative to tunnel alignment and the results were compared statistically with actual respective machine penetration rates. Simple and step-wise multiple regression analyses were run with hardness values as independent variables and rates as the dependent variables. This was done individually for each rock type, and subsequently for all data combined.
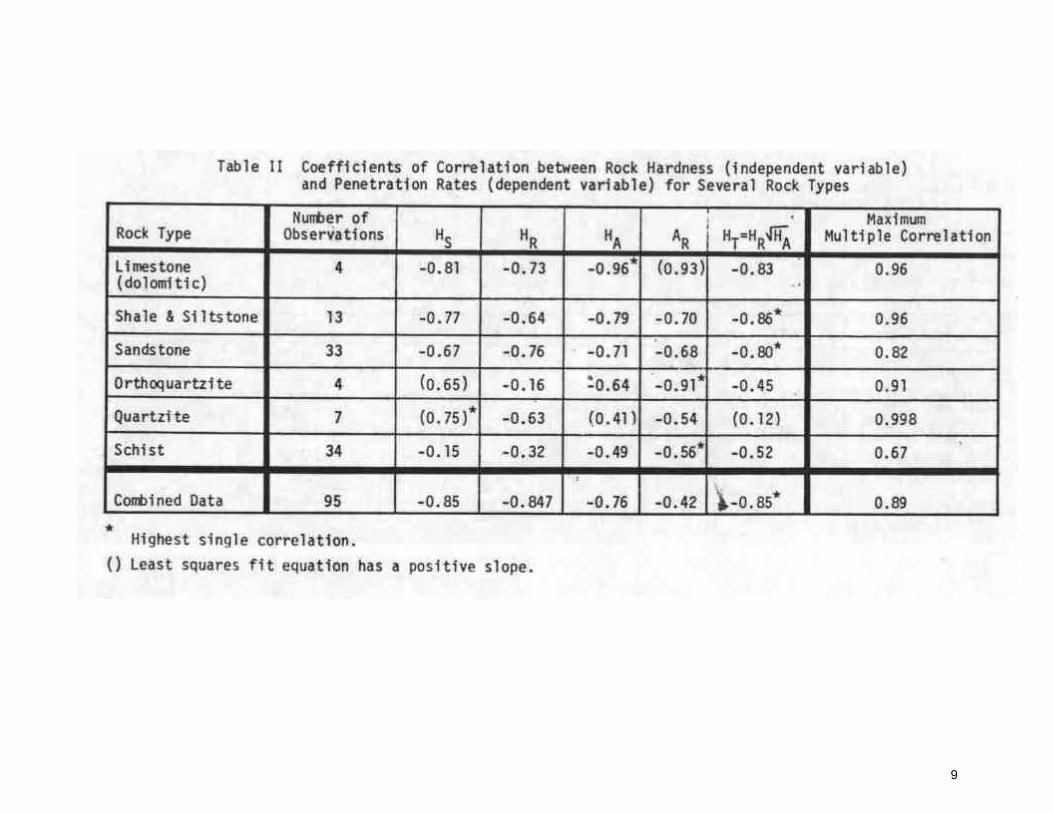
3. Results Simple and step-wise multiple regression analyses Indicate good relationships between several measures of hardness and penetration rates. Results are summarized in Table II. For each rock type, the highest correlating variable is noted by an asterisk and a positive correlation slope (expected correlation slope Is negative) is noted by parentheses. Factors by which the quality of a relationship can be judged are:
1. a consistently high coefficient of correlation (perfect is 1.00) for a particular test for all rock types, and
2. coefficients of correlation which are either consistently positive or consistently negative.
Discussion of results outlined in Table II will be presented first by test method and subsequently by rock type. In the former discussion, irregularities of the test correlation are evaluated; in the latter irregularities are treated by rock type. Upon examination of Table II, it becomes apparent that only HR has coefficients of correlation which are consistently negative and of all the measurements HT appears to have the best relationship more often than any other. 3.1 Measures of Hardness Shore Scleroscope Hardness (H S). The fine tip of the Shore Scleroscope is mostly an indication of mineral hardness. As the results suggest, with increasing HS, rates decrease except for the quartzites. Hard quartzite is brittle and therefore fractures almost always develop in the intact material. Fracturing of hard material promotes ease of excavation Orthoquartzite used in the analyses all contained some shaly partings as did the tunnel section. This effect on the test results may possibly be evaluated subjectively but the effect on rates is more difficult to quantify. Schmidt Hammer (H R). For all rock types coefficients of correlation are consistently negative ( as expected) but generally poorer than other measures of hardness. In the case of the quartzites, HR merely

5
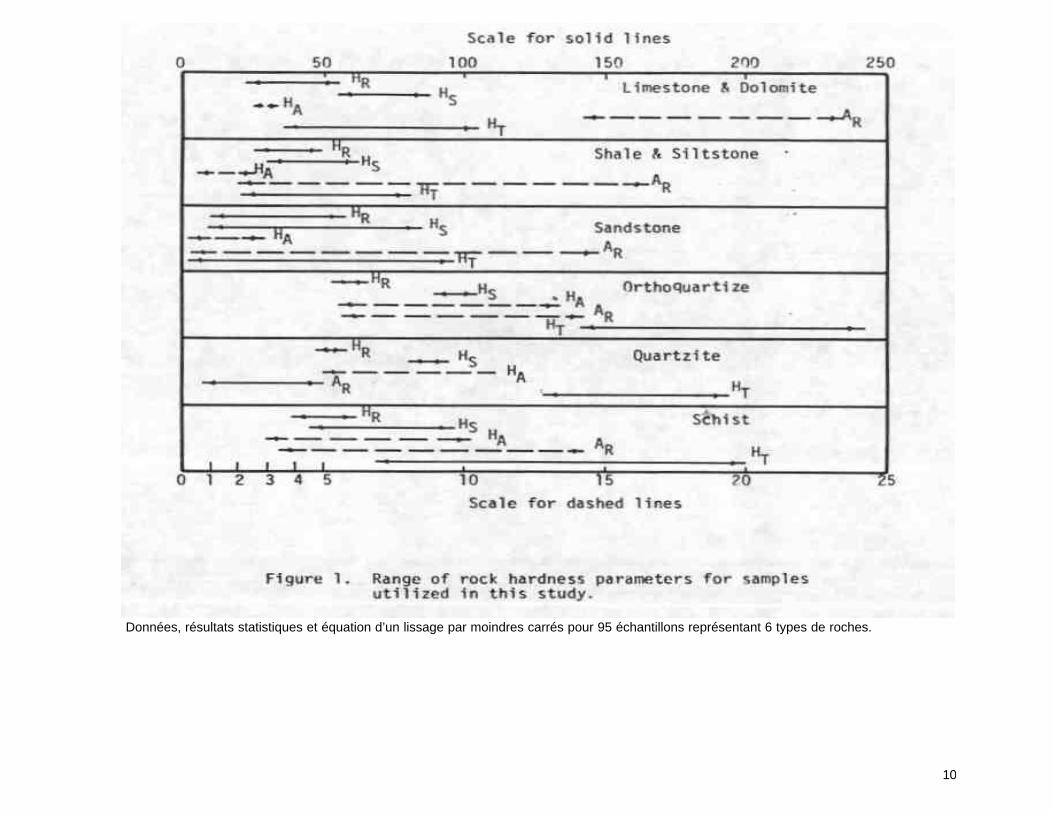
has a poorer relationship whereas, H5 develops an inverse relationship. It appears that this may be explained by the fact that the Schmidt Hammer uses more energy, therefore it affects a larger portion of the test sample, and fractures are thus exercised and consequently affects rebound energy. Abrasion Hardness (H A). Relatively good correlation (0.41 to 0.96) was found between HA and penetration rates. Nevertheless correlation is positive for quartzite. Again, the positive slope in the curve may indicate hard but brittle rock, which is fractured on a scale larger than measurable by the abrasion test. Consequently, it appears that abrasion resistant rock is bored at a faster rate because of intense fracturing. Rock Abrasiveness (A R). Rock Abrasiveness was originally intended for correlation with cutter costs but was included in the regression analysis with penetration rates. Surprisingly enough, correlation with penetration rates is good and the only positive slope occurs with limestone. Apparently, increasing AR (decreasing weight loss of the abrader wheel) is representative of more compact, dense limestone which characteristically breaks into large size muck (chips), thus, promoting higher advance rates. Total Hardness (H T). Consistently high degrees of correlation are evident for HT except in the case of quartzite, which has a positive slope. Throughout the previous discussion it has become apparent that the quartzites exhibit significant correlative irregularity. Apparently, the positive slopes of the HA-RATE relationship for quartzite have affected the HT-RATE correlation as well. 3.2 Rock Types Limestone, shale, siltstone, and sandstone appear to have good correlation between all measures of hardness and penetration rates except that AR has a positive slope for limestone (as discussed for the Shore Scleroscope). Schist has moderate correlation for all but HR and HS. Of these two parameters, the Shore Scleroscope (HS) appears to be least useful because of the small test surface (diamond tip) and the inherent irreg-ularity and inhomogeneity of schist. Impact energy, test surface, and consequently correlation is higher for the Schmidt Hammer. Nevertheless, poorer correlation was evident for all hardness parameters in the case of schist. Field observations showed Manhattan (mica) Schist to be extremely variable, not only as a result of foliation but also because of the highly variable degree of foliation relative to crystal size. Relative percentages of hard (quartz, feldspar, garnet, staurolite, pyrite) and soft (mica, chlorite, sericite) minerals, determined from thin sections, also indicate relatively high anisotropism. Orthoquartzites were sampled from a single location (Rochester, New York) and all but one sample (and tunnel section) contained shaly partings about 1/2 inch (1-1/2 cm) thick. Even though these partings are too small to sample they nevertheless affect penetration rates. Quartzites were collected from pegmatites in the Manhattan Schist (2 samples), New York City and from Hecla Mining Company’s Star Mine in Wallace, Idaho (5 samples). By themselves, the samples from New York would yield a negatively sloping least squares fit curve with a high coefficient of correlation, but in combination with data from the Star Mine the slope becomes positive with a lower coefficient for HS, HA, and HR. Mineralogy and micro-fabric of quartzite dictates that it be hard and therefore brittle. Consequently, it is likely to be fractured, especially at depths of 7300 ft. In the faulted and mineralized area of the Coeur d'Alene Mining district, and as a result of high stress concentrations imposed by mining. In reality, during machine boring, large blocks fell out of the face, thus hampering progress. Test samples were actually pried loose from the tunnel walls along joints. 3.3 Plotting HT vs. Penetration Rates Although “Total” hardness (HT) did not always show the best correlation in each case, it did appear to have the highest correlation throughout the entire range of hardness. Figure 1 shows the range of
6
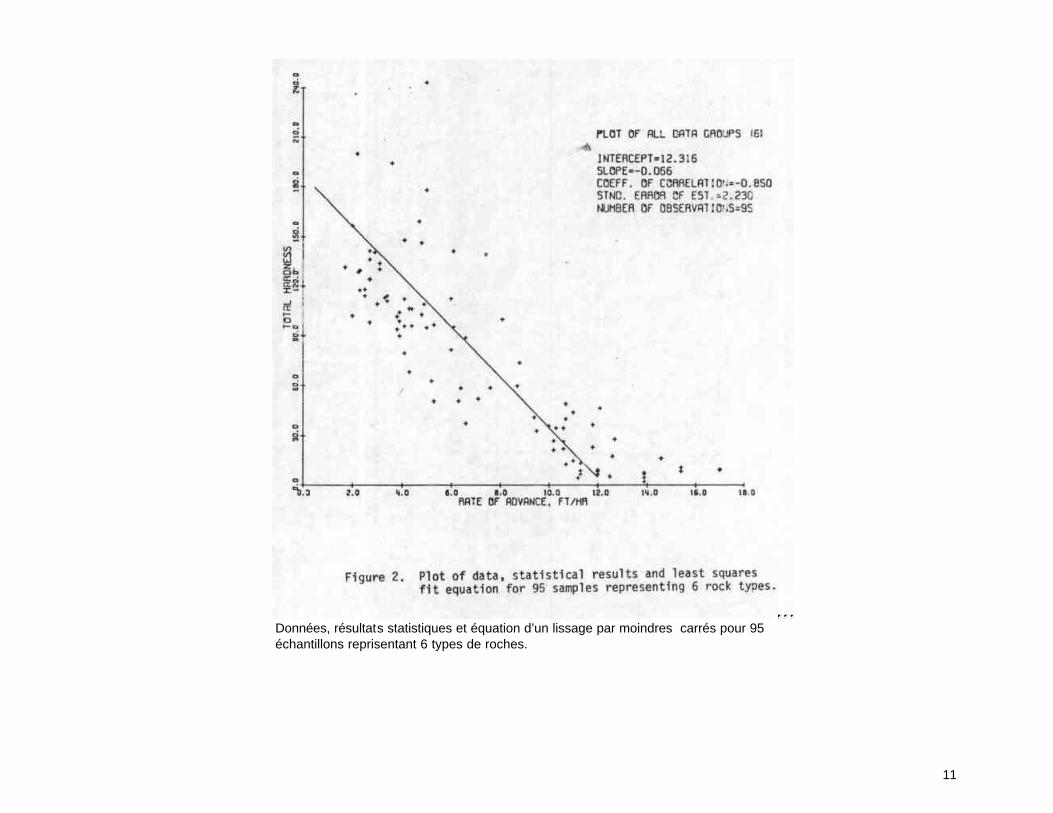
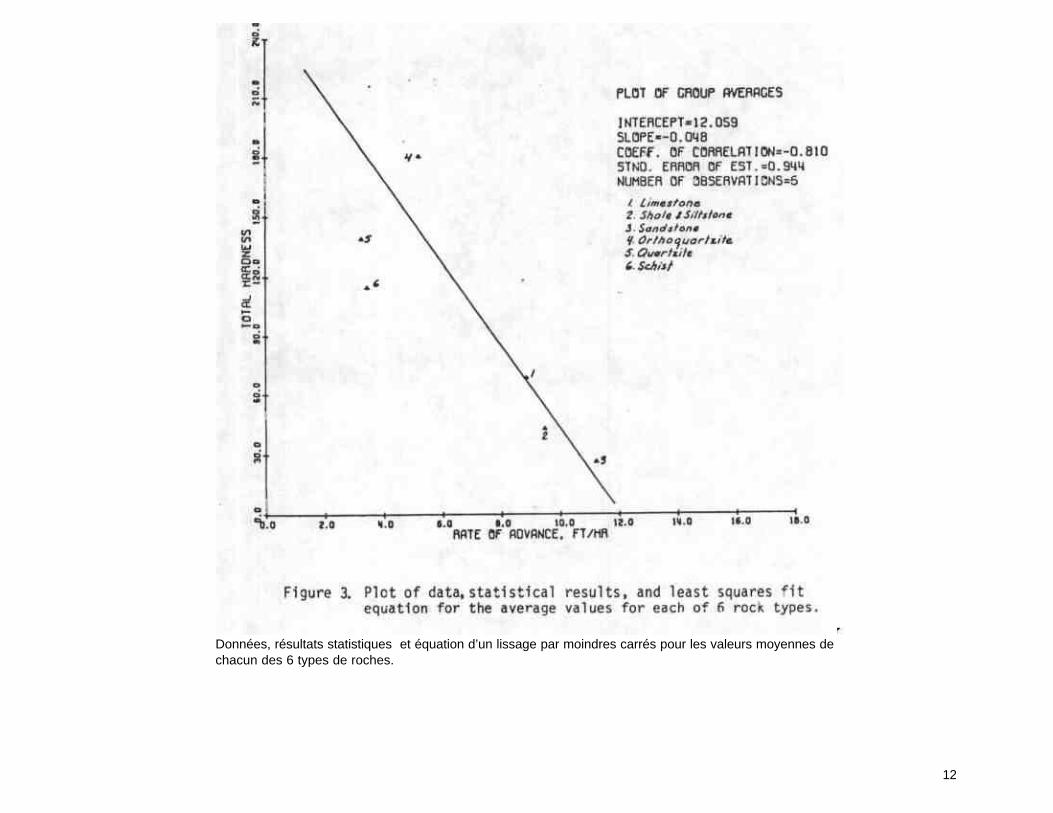
hardnesses for rock used in this study. Total Hardness, HT has been used to predict advance rates and respective data are plotted in Figures 2 and 3. Figure 2 is a plot of all data used in the foregoing statistical analyses. Although an asymptotic curve may seem more appropriate, a straight line must be used for general analyses before the exact range of rock hardness is known for a specific site. Actually, the most appropriate equation for predicting reliable penetration rates would be one derived from experience most similar (in terms of machine variables and rock type) to the job to be bid. The mean HT and rate for each rock type was calculated and plotted In Figure 3. The plot indicates a somewhat better relationship for low values of hardness. Orthoquartzite and quartzite seem to account for the greatest deviation as a result of the unique properties discussed in the previous section. Shaly partings (in orthoquartzite) promote faster rates apparently without lower test results. Similarly, the extreme fracturing of the quartzite in the Star Mine was known to cause large blocks to fall from the face and require regrinding by the machine. No doubt penetration rates were affected as evidenced by rates as low as 0.4 ft/hour in material which was no harder than rock mined at 4 ft/hour. Figure 3 should be used with caution, however, because the slope is to a larger extent a function of the softer materials and may not be valid for machines designed for HT>~120.
4. Conclusions Simple laboratory tests for NX core (2.125 inches, 5.4 cm in diameter) have been developed to predict TBM penetration rates. Regression analyses indicate certain tests to be most useful for particular rock types. Although at present Total Hardness (HT) is being used for pre-bid studies, with added experience, and a wider range of data and rock types, other variables or combinations of variables may be used for more reliable predictions. Therefore, all four of the basic measurements (HS, HR, HA, and AR) are recommended for use in rock mechanics testing of exploratory core obtained for tunnel exploration.
5. Acknowledgements This study is being supported by the National Science Foundation’s RANN Program. I am grateful to many individuals and organizations who supplied the most crucial ingredients: data, cooperation, access to files, machines, and tunnel sites.
Selected-References Ceci l , 0. S., An Abrasion Hardness Test for Rock, Unpublished manuscript, Special Project Report, Rock Mechanics Laboratory, University of Illinois, 60 pp., June 1966. Deere, D. U., Indexing Rock for Machine Tunneling, Society of Mining, Engineers of the American Institute of Mining, Metallurgical, and Petroleum Engineers, Inc., Rapid Excavation--Problems and Progress, Proc. of the Tunnel and Shaft Conf., Minneapolis, Minn., 5/15-17/68, pp. 32-38, 1970. Deere, 0. U. and R. P. Miller, Engineering Classification and Index Properties for Intact Rock, AFWL, Kirtland AFB, N. Mexico, Technical Report No. AFWL-TR-65-116, 308 pp., December 1966. Dietl, B. and P. J. Tarkoy, A Study of Rock Hardness and Tunnel-Boring Machine Advance Rates in Manhattan Schist, Tunneling Technology Newsletter, Number 3, September 1973. Gray, K. E., Professor and Chairman of the Department of Petroleum Engineering, The University of Texas at Austin. Personal Communication, January 1973.
7
Schuberth, C. J., The Geology of New York City and Environs, Natural History Press, Published for the American Museum of Natural History, 304 pp., 1968. Smallwood. A.R.H., An Abrasion Hardness Classification for Sandstone, Unpublished Master's Thesis, University of Illinois, 127 pp., September 1970. Tarkoy, P. J., A Study of Rock Properties and Tunnel Boring Machine Advance Rates in Two Mica Schist Formations, presented at the 15th Symposium on Rock Mechanics, Custer State Park, South Dakota, September 1973.
8
9
10
Données, résultats statistiques et équation d’un lissage par moindres carrés pour 95 échantillons représentant 6 types de roches.
11
Données, résultats statistiques et équation d’un lissage par moindres carrés pour 95 échantillons reprisentant 6 types de roches.
12
Données, résultats statistiques et équation d’un lissage par moindres carrés pour les valeurs moyennes de chacun des 6 types de roches.