Embed Size (px)
Citation preview
Predicting Subscriber Dissatisfactionand Improving Retention in the
Wireless Telecommunications IndustryMichael C. Mozer+*
Richard Wolniewicz*Robert Dodier*
Lian Yan*David B. Grimes+*
Eric Johnson*Howard Kaushansky*
+Department of Computer ScienceUniversity of Colorado, Boulder
*Athene SoftwareBoulder, Colorado
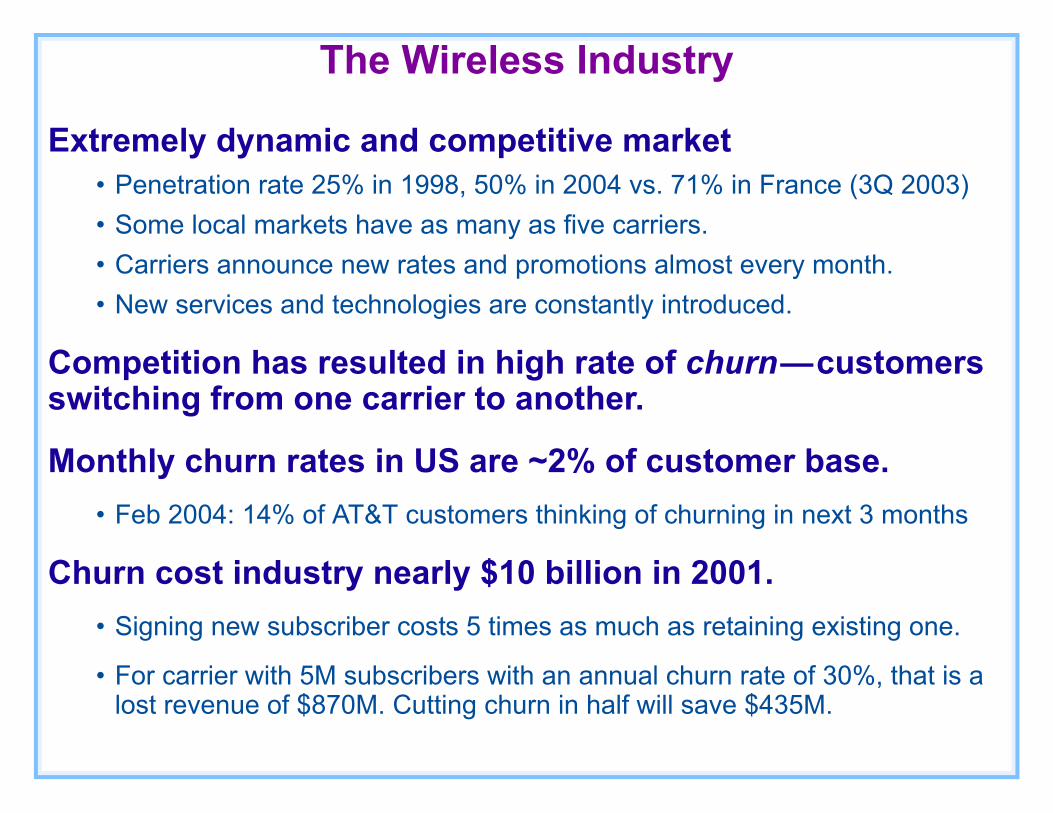
The Wireless Industry
Extremely dynamic and competitive market• Penetration rate 25% in 1998, 50% in 2004 vs. 71% in France (3Q 2003)• Some local markets have as many as five carriers.• Carriers announce new rates and promotions almost every month.• New services and technologies are constantly introduced.
Competition has resulted in high rate of churn — customers switching from one carrier to another.
Monthly churn rates in US are ~2% of customer base.• Feb 2004: 14% of AT&T customers thinking of churning in next 3 months
Churn cost industry nearly $10 billion in 2001.• Signing new subscriber costs 5 times as much as retaining existing one.
• For carrier with 5M subscribers with an annual churn rate of 30%, that is a lost revenue of $870M. Cutting churn in half will save $435M.
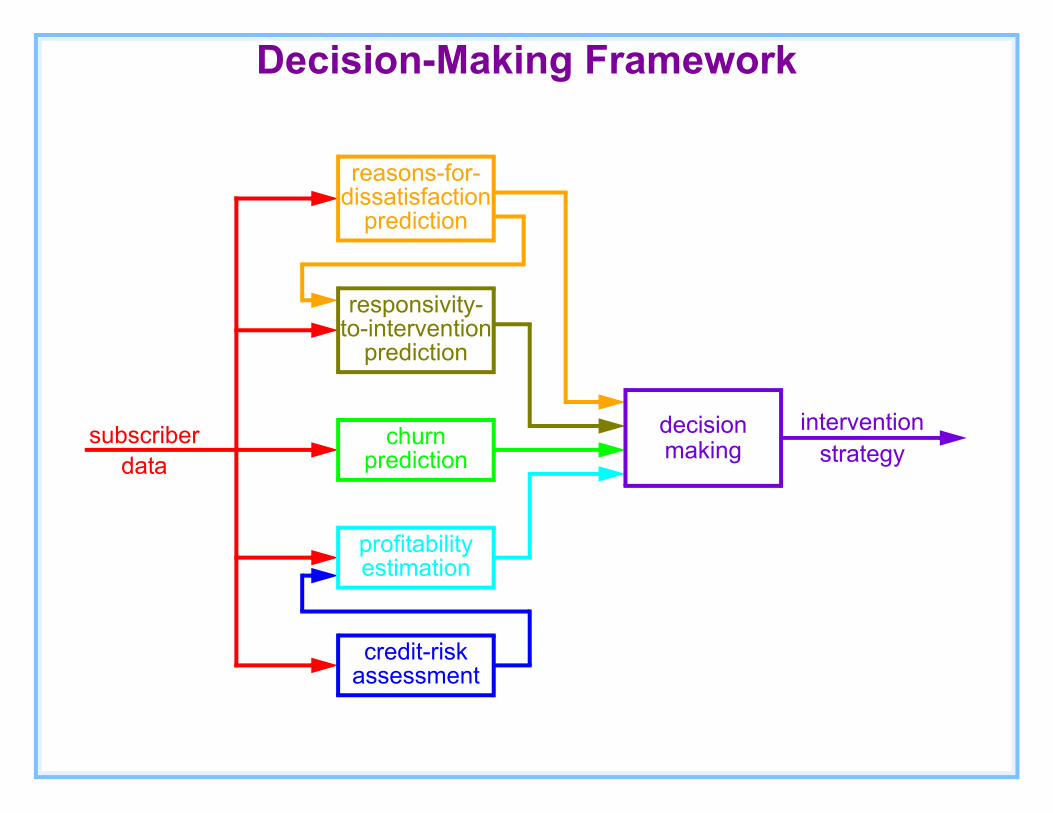
Decision-Making Framework
subscriberdata
interventionstrategy
reasons-for-dissatisfaction
prediction
responsivity-to-intervention
prediction
churnprediction
profitabilityestimation
credit-riskassessment
decisiondecisionmaking
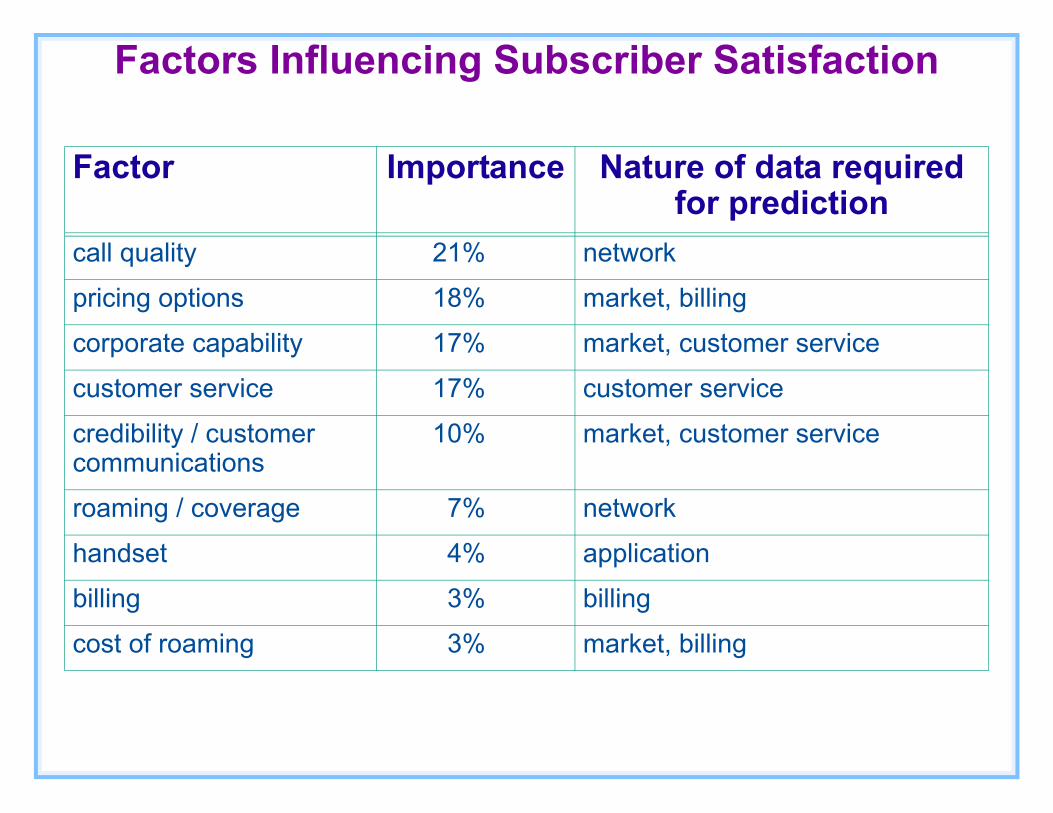
Factors Influencing Subscriber Satisfaction
Factor Importance Nature of data required for prediction
call quality 21% network
pricing options 18% market, billing
corporate capability 17% market, customer service
customer service 17% customer service
credibility / customer communications
10% market, customer service
roaming / coverage 7% network
handset 4% application
billing 3% billing
cost of roaming 3% market, billing
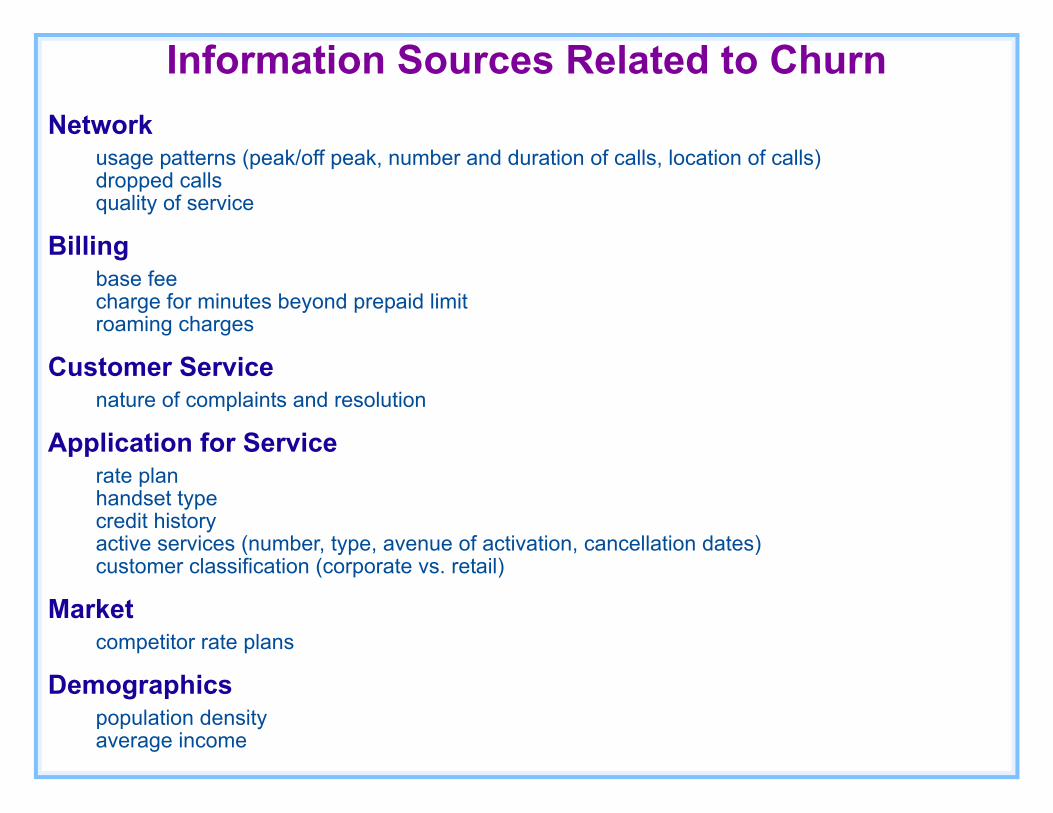
Information Sources Related to ChurnNetwork
usage patterns (peak/off peak, number and duration of calls, location of calls)dropped callsquality of service
Billingbase feecharge for minutes beyond prepaid limitroaming charges
Customer Servicenature of complaints and resolution
Application for Servicerate planhandset typecredit historyactive services (number, type, avenue of activation, cancellation dates)customer classification (corporate vs. retail)
Marketcompetitor rate plans
Demographicspopulation densityaverage income
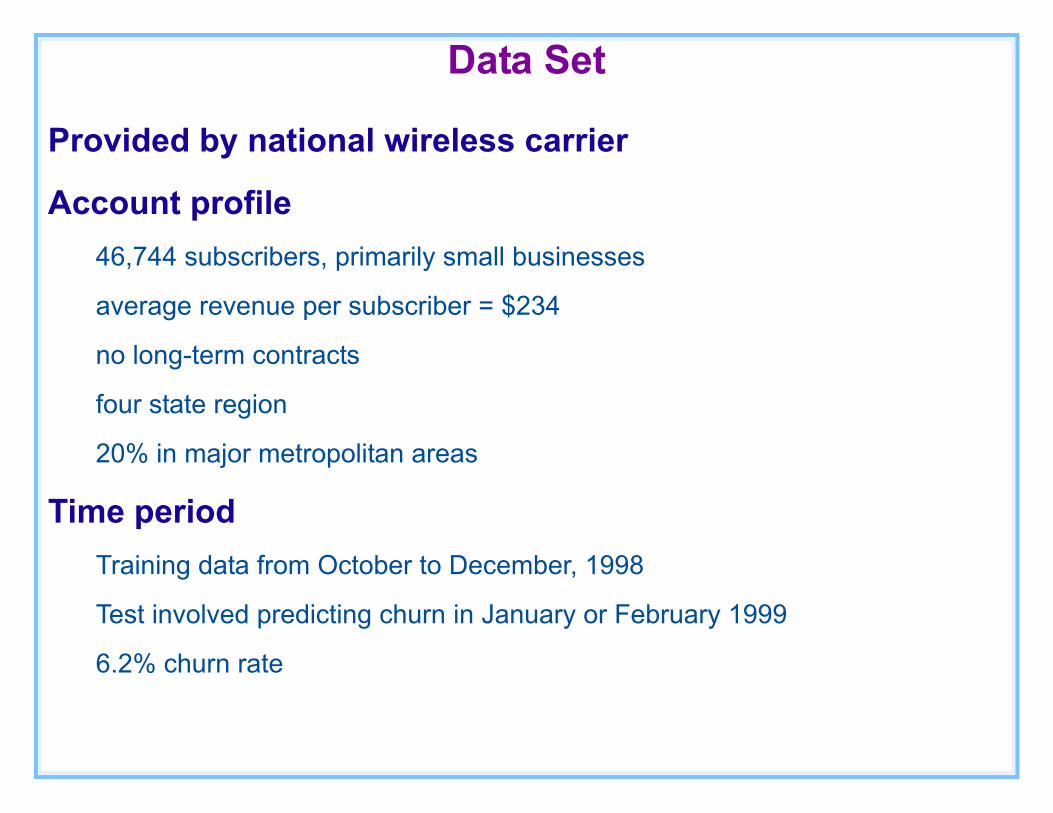
Data Set
Provided by national wireless carrier
Account profile46,744 subscribers, primarily small businesses
average revenue per subscriber = $234
no long-term contracts
four state region
20% in major metropolitan areas
Time periodTraining data from October to December, 1998
Test involved predicting churn in January or February 1999
6.2% churn rate
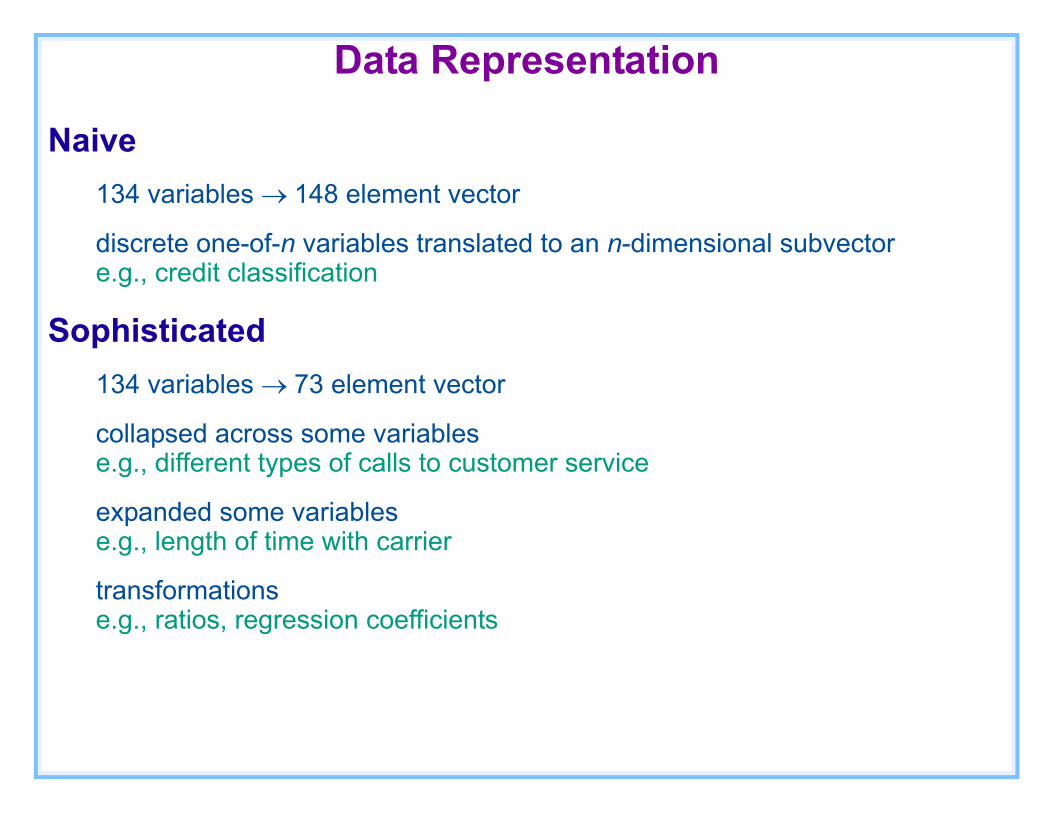
Data Representation
Naive134 variables → 148 element vector
discrete one-of-n variables translated to an n-dimensional subvector e.g., credit classification
Sophisticated134 variables → 73 element vector
collapsed across some variables e.g., different types of calls to customer service
expanded some variables e.g., length of time with carrier
transformations e.g., ratios, regression coefficients

Methodology
Ten-fold cross validation
Model classeslogit regression
neural network
decision tree
Representationsnaive
sophisticated
Model combination techniquessingle model
majority vote
Adaboost
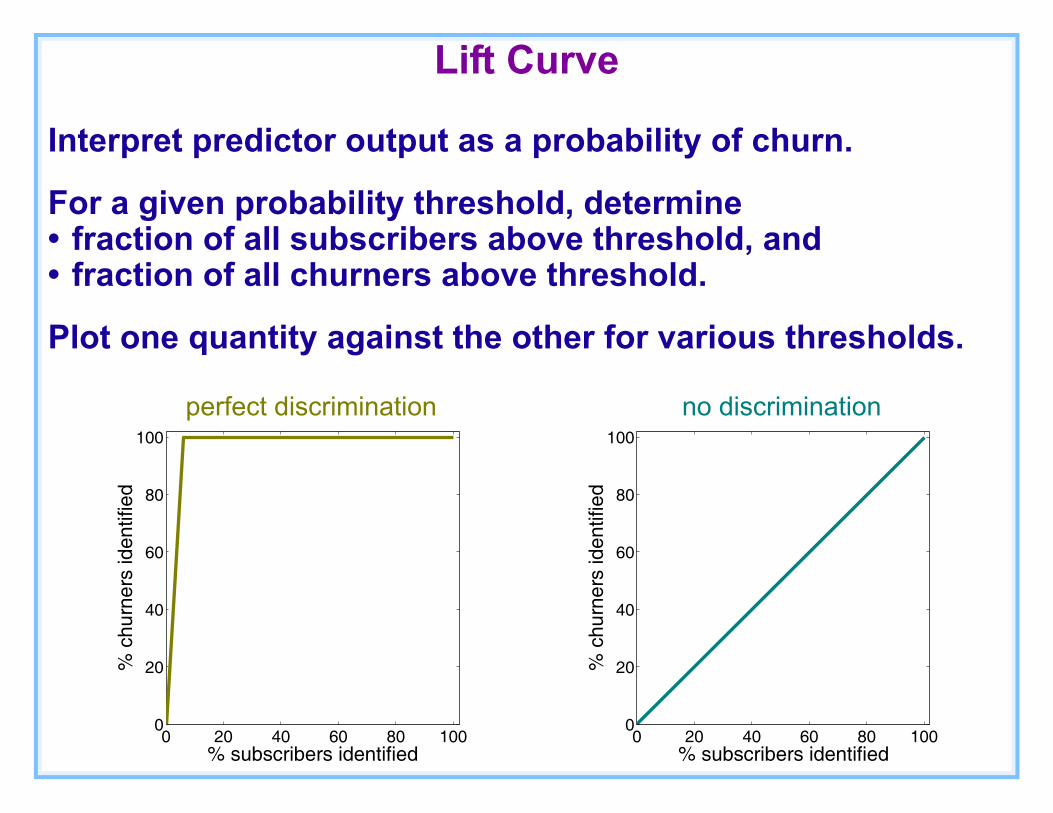
Lift Curve
Interpret predictor output as a probability of churn.
For a given probability threshold, determine• fraction of all subscribers above threshold, and • fraction of all churners above threshold.
Plot one quantity against the other for various thresholds.
0 20 40 60 80 1000
20
40
60
80
100
% subscribers identified
% c
hurn
ers
iden
tifie
d
0 20 40 60 80 1000
20
40
60
80
100
% subscribers identified
% c
hurn
ers
iden
tifie
d
perfect discrimination no discrimination
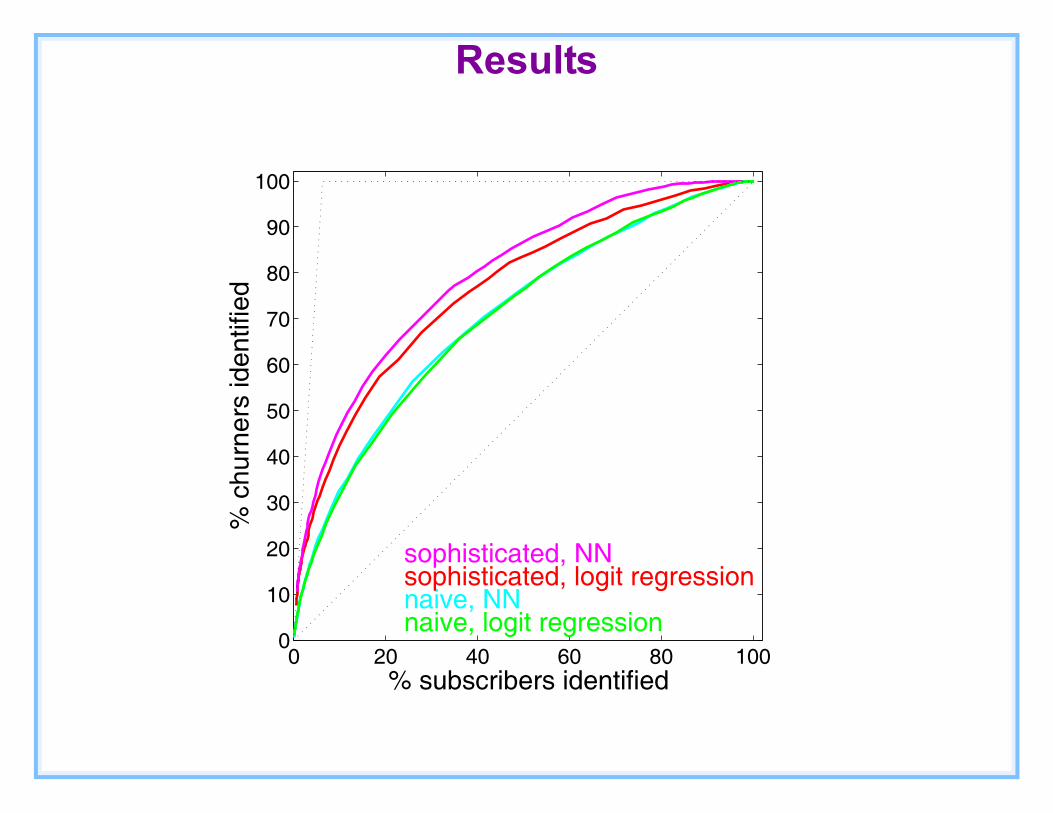
Results
0 20 40 60 80 1000
10
20
30
40
50
60
70
80
90
100
% subscribers identified
% c
hurn
ers
iden
tifie
d
naive, logit regressionnaive, NNsophisticated, logit regressionsophisticated, NN

Results
0 20 40 60 80 1000
10
20
30
40
50
60
70
80
90
100
% subscribers identified
% c
hurn
ers
iden
tifie
d
decision treedecision tree, boostingNNNN, boosting

Decision Making
Should a given subscriber be contacted and offered some incentive to remain with the carrier?
Offer incentive to all subscribers with churn probability > θ
Select θ to maximize expected cost savings to carrier
Expected savings depends onCI cost to carrier of providing incentive
H time horizon over which incentive affects subscriber’s behavior (assume 6 months)
PI reduction in probability that subscriber will leave within time horizon as a result of incentive
CL lost revenue that results from churn (assume $500 acquisition cost + income over H months)
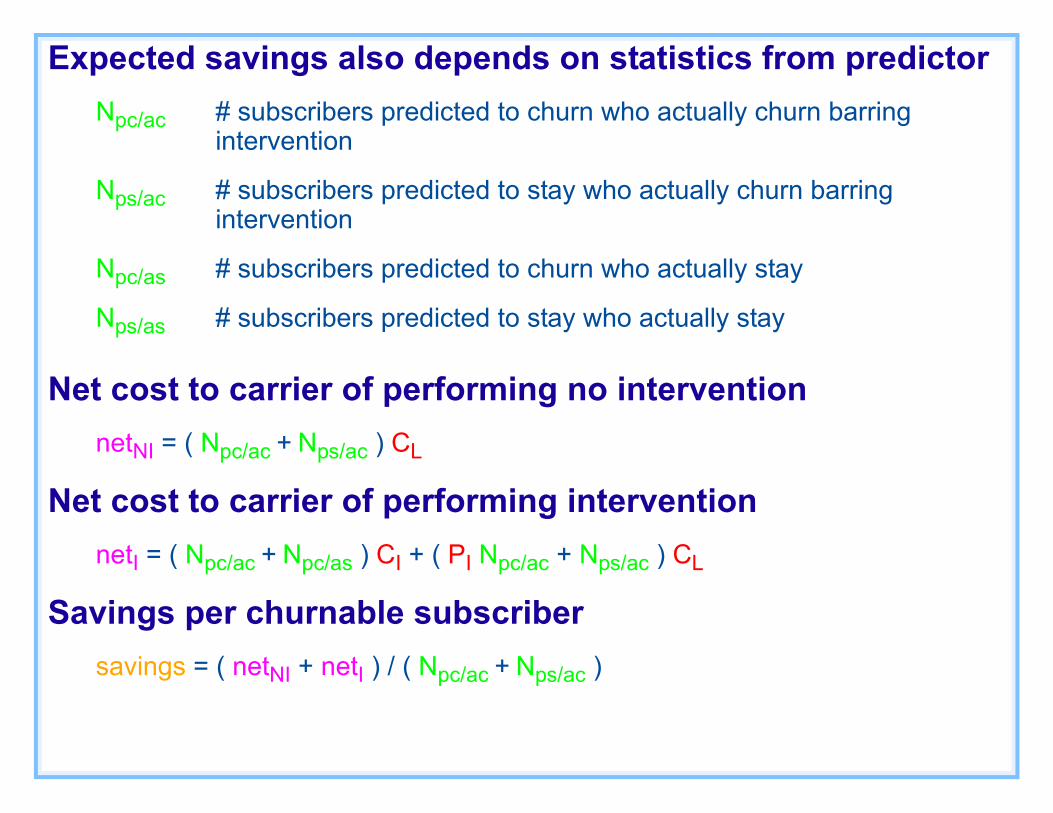
Expected savings also depends on statistics from predictorNpc/ac # subscribers predicted to churn who actually churn barring
intervention
Nps/ac # subscribers predicted to stay who actually churn barring intervention
Npc/as # subscribers predicted to churn who actually stay
Nps/as # subscribers predicted to stay who actually stay
Net cost to carrier of performing no interventionnetNI = ( Npc/ac + Nps/ac ) CL
Net cost to carrier of performing interventionnetI = ( Npc/ac + Npc/as ) CI + ( PI Npc/ac + Nps/ac ) CL
Savings per churnable subscribersavings = ( netNI + netI ) / ( Npc/ac + Nps/ac )
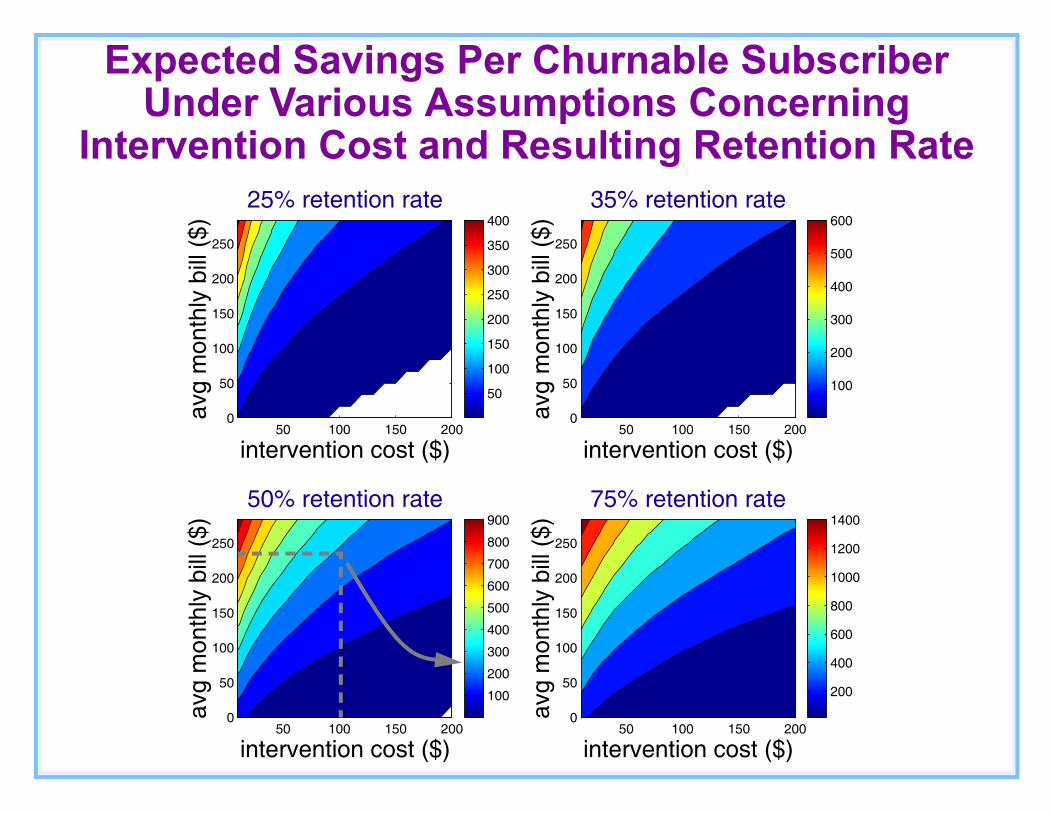
Expected Savings Per Churnable SubscriberUnder Various Assumptions Concerning
Intervention Cost and Resulting Retention Rate
50
100
150
200
250
300
350
400
50 100 150 2000
50
100
150
200
250
25% retention rate
intervention cost ($)
avg
mon
thly
bill
($)
100
200
300
400
500
600
50 100 150 2000
50
100
150
200
250
35% retention rate
intervention cost ($)
avg
mon
thly
bill
($)
100
200
300
400
500
600
700
800
900
50 100 150 2000
50
100
150
200
250
50% retention rate
intervention cost ($)
avg
mon
thly
bill
($)
200
400
600
800
1000
1200
1400
50 100 150 2000
50
100
150
200
250
75% retention rate
intervention cost ($)
avg
mon
thly
bill
($)
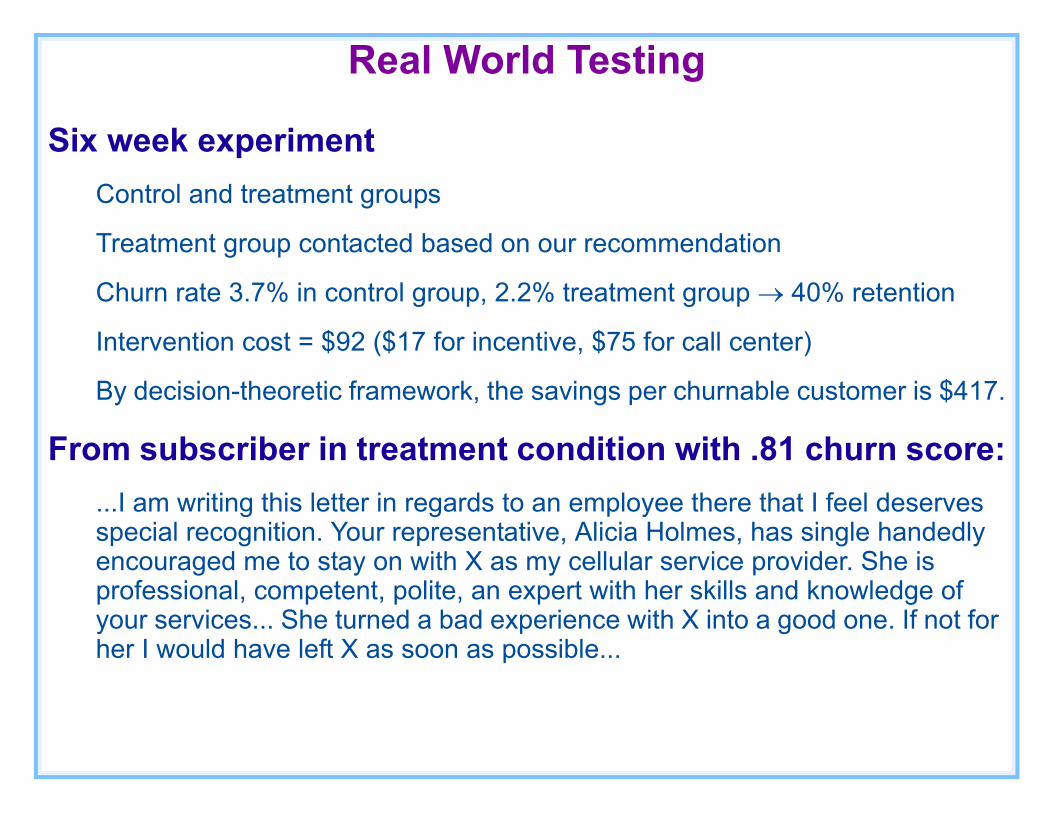
Real World Testing
Six week experimentControl and treatment groups
Treatment group contacted based on our recommendation
Churn rate 3.7% in control group, 2.2% treatment group → 40% retention
Intervention cost = $92 ($17 for incentive, $75 for call center)
By decision-theoretic framework, the savings per churnable customer is $417.
From subscriber in treatment condition with .81 churn score:...I am writing this letter in regards to an employee there that I feel deserves special recognition. Your representative, Alicia Holmes, has single handedly encouraged me to stay on with X as my cellular service provider. She is professional, competent, polite, an expert with her skills and knowledge of your services... She turned a bad experience with X into a good one. If not for her I would have left X as soon as possible...

ObservationsPositive correlation with churn
• average monthly bill• total number of calls• credit class of customer• ratio of recent to earlier monthly bills
Negative correlation with churn• number of active dispatch and messaging services• time with carrier• average number of billed minutes per month
Mutual information between each variable and churn is extremely low (<< .01 bit).Domain intuitions almost always supported by mutual information scores and prediction accuracy.In many data sets, few higher-order regularities (given appropriate representation).Because of redundancy and low information content, input pruning is feasible with no loss in accuracy.

Further Experiments
Test window shifted in time
Replicability of results over time
Comparison of various ensemble techniques

Comparison of Wireless and ISP Data Sets

Test Window Experiment
1 2 3 4 5 6 7 8
two month test window
one month test windowoverlapping training windows
one month test windownonoverlapping training windows
train inputtrain predictiontest inputtest prediction

Test Window Experiment

Optimizing Performance on Lift Curve
% subscribersps
pc
% churnersidentified
identified ps
pc
tstc
churnscore
0 1
n ncc

Decision Network for Subscriber Profitability
Recurring costs and revenues
Known expiration
Expected useof product
Long termfixed charge
Still usingproduct?
Use of serviceover month
No. servicessubscribed to
Churn?Seasonal factorsAccessibility & availability
of coverage
Future monthlyservice revenue
????
Monthlyrate plan
Nominalnet revenue
Long termservice costs
Supportcontact cost
Bad credit &collection cost
Credit ratingCost of
support by emailCost of
support by phone
One-time costs
Acquisitioncost
cost tomake offer
Offeracceptance
Cost if offeraccepted
Fixedservice cost
Raw cost ifoffer accepted
Channelcost
Productinteroperability
Usersophistication
Uses sophisticatedproducts
Calls CSR forsophisticated reasons
Fashionabilityof product
Fashion consciousnessof user
Frequency ofupgrade
Productsophistication


![Experience Dissatisfaction[1]](https://img.pdfslide.us/doc/110x75/577ce6361a28abf1039261dd/experience-dissatisfaction1.jpg)